UNITED STATES
SECURITIES AND EXCHANGE COMMISSION
Washington, D.C. 20549
FORM N-CSR
CERTIFIED SHAREHOLDER REPORT OF REGISTERED
MANAGEMENT INVESTMENT COMPANIES
Investment Company Act file number 811-1352
Fidelity Devonshire Trust
(Exact name of registrant as specified in charter)
82 Devonshire St., Boston, Massachusetts 02109
(Address of principal executive offices) (Zip code)
Scott C. Goebel, Secretary
82 Devonshire St.
Boston, Massachusetts 02109
(Name and address of agent for service)
Registrant's telephone number, including area code: 617-563-7000
Date of fiscal year end: | January 31 |
|
|
Date of reporting period: | January 31, 2012 |
Item 1. Reports to Stockholders
Fidelity®
Equity-Income
Fund
Annual Report
January 31, 2012
(Fidelity Cover Art)
Contents
Chairman's Message | The Chairman's message to shareholders. | |
Performance | How the fund has done over time. | |
Management's Discussion of Fund Performance | The Portfolio Manager's review of fund performance and strategy. | |
Shareholder Expense Example | An example of shareholder expenses. | |
Investment Changes | A summary of major shifts in the fund's investments over the past six months. | |
Investments | A complete list of the fund's investments with their market values. | |
Financial Statements | Statements of assets and liabilities, operations, and changes in net assets, as well as financial highlights. | |
Notes | Notes to the financial statements. | |
Report of Independent Registered Public Accounting Firm |
| |
Trustees and Officers |
| |
Distributions |
|
To view a fund's proxy voting guidelines and proxy voting record for the 12-month period ended June 30, visit http://www.fidelity.com/proxyvotingresults or visit the Securities and Exchange Commission's (SEC) web site at http://www.sec.gov. You may also call 1-800-544-8544 to request a free copy of the proxy voting guidelines.
Standard & Poor's, S&P and S&P 500 are registered service marks of The McGraw-Hill Companies, Inc. and have been licensed for use by Fidelity Distributors Corporation.
Other third party marks appearing herein are the property of their respective owners.
All other marks appearing herein are registered or unregistered trademarks or service marks of FMR LLC or an affiliated company.
Annual Report
This report and the financial statements contained herein are submitted for the general information of the shareholders of the fund. This report is not authorized for distribution to prospective investors in the fund unless preceded or accompanied by an effective prospectus.
A fund files its complete schedule of portfolio holdings with the SEC for the first and third quarters of each fiscal year on Form N-Q. Forms N-Q are available on the SEC's web site at http://www.sec.gov. A fund's Forms N-Q may be reviewed and copied at the SEC's Public Reference Room in Washington, DC. Information regarding the operation of the SEC's Public Reference Room may be obtained by calling 1-800-SEC-0330. For a complete list of a fund's portfolio holdings, view the most recent holdings listing, semiannual report, or annual report on Fidelity's web site at http://www.fidelity.com, http://www.advisor.fidelity.com, or http://www.401k.com, as applicable.
NOT FDIC INSURED • MAY LOSE VALUE • NO BANK GUARANTEE
Neither the fund nor Fidelity Distributors Corporation is a bank.
Annual Report
Chairman's Message
(photo_of_James_C_Curvey)
Dear Shareholder:
Following a year marked by unusually high volatility, 2012 began with most major asset classes advancing steadily in January. For U.S. equities, it was the strongest start to a new year since 1997. International stocks fared even better, despite continued uncertainty related to the sovereign debt crisis in Europe. Investors have been acutely sensitive to the latest news, for better or worse, coming out of the eurozone and its impact on financial markets. As we look ahead, the unresolved debt crisis in Europe remains at the center of a series of risk factors, summarized below, that we believe have the greatest potential to influence the global investment landscape.
Deleveraging and the economy
In the euro-currency area, fiscal austerity among nations and debt deleveraging among financial companies loaded with sovereign debt are deflationary measures and serve to hinder economic growth in the short term. Such an economic and financial-market scenario has not been historically supportive of strong performance among riskier assets, and emerges at a time when many nations need a resurgent economy to assist them in closing their budget deficits and in building confidence among bond buyers to help them refinance their existing debt obligations.
Slowdown in China and Europe
China's economy is the second-largest in the world, and it has been the biggest contributor to global growth since the end of the last recession. Thus, the slower pace of domestic growth in China has led to lower demand for imports of commodities and other construction materials from the rest of the world. In addition, economic weakness in Europe and the broad-based global economic slowdown are putting pressure on China's export growth, which has been largely responsible for its breakneck pace of annual gross domestic product (GDP) growth during the past three decades.
Credit deterioration and contagion
The heightened macroeconomic risk and elevated credit risk swirling around certain European nations and financial institutions have caused many market participants to avoid purchases of or reduce exposure to short-term debt offerings by these issuers. With increased credit risk, there are growing concerns about the potential credit contraction and contagion from European issuers spreading to other financial markets.
We invite you to learn more by visiting us on the Internet or calling us by phone. It is our privilege to provide the resources you need to choose investments that are right for you.
Sincerely,
(The acting chairman's signature appears here.)
James C. Curvey
Acting Chairman
Annual Report
Performance: The Bottom Line
Average annual total return reflects the change in the value of an investment, assuming reinvestment of the class' distributions from dividend income and capital gains (the profits earned upon the sale of securities that have grown in value, if any) and assuming a constant rate of performance each year. The $10,000 table and the fund's returns do not reflect the deduction of taxes that a shareholder would pay on fund distributions or the redemption of fund shares. During periods of reimbursement by Fidelity, a fund's total return will be greater than it would be had the reimbursement not occurred. How a fund did yesterday is no guarantee of how it will do tomorrow.
Average Annual Total Returns
Periods ended January 31, 2012 | Past 1 | Past 5 | Past 10 |
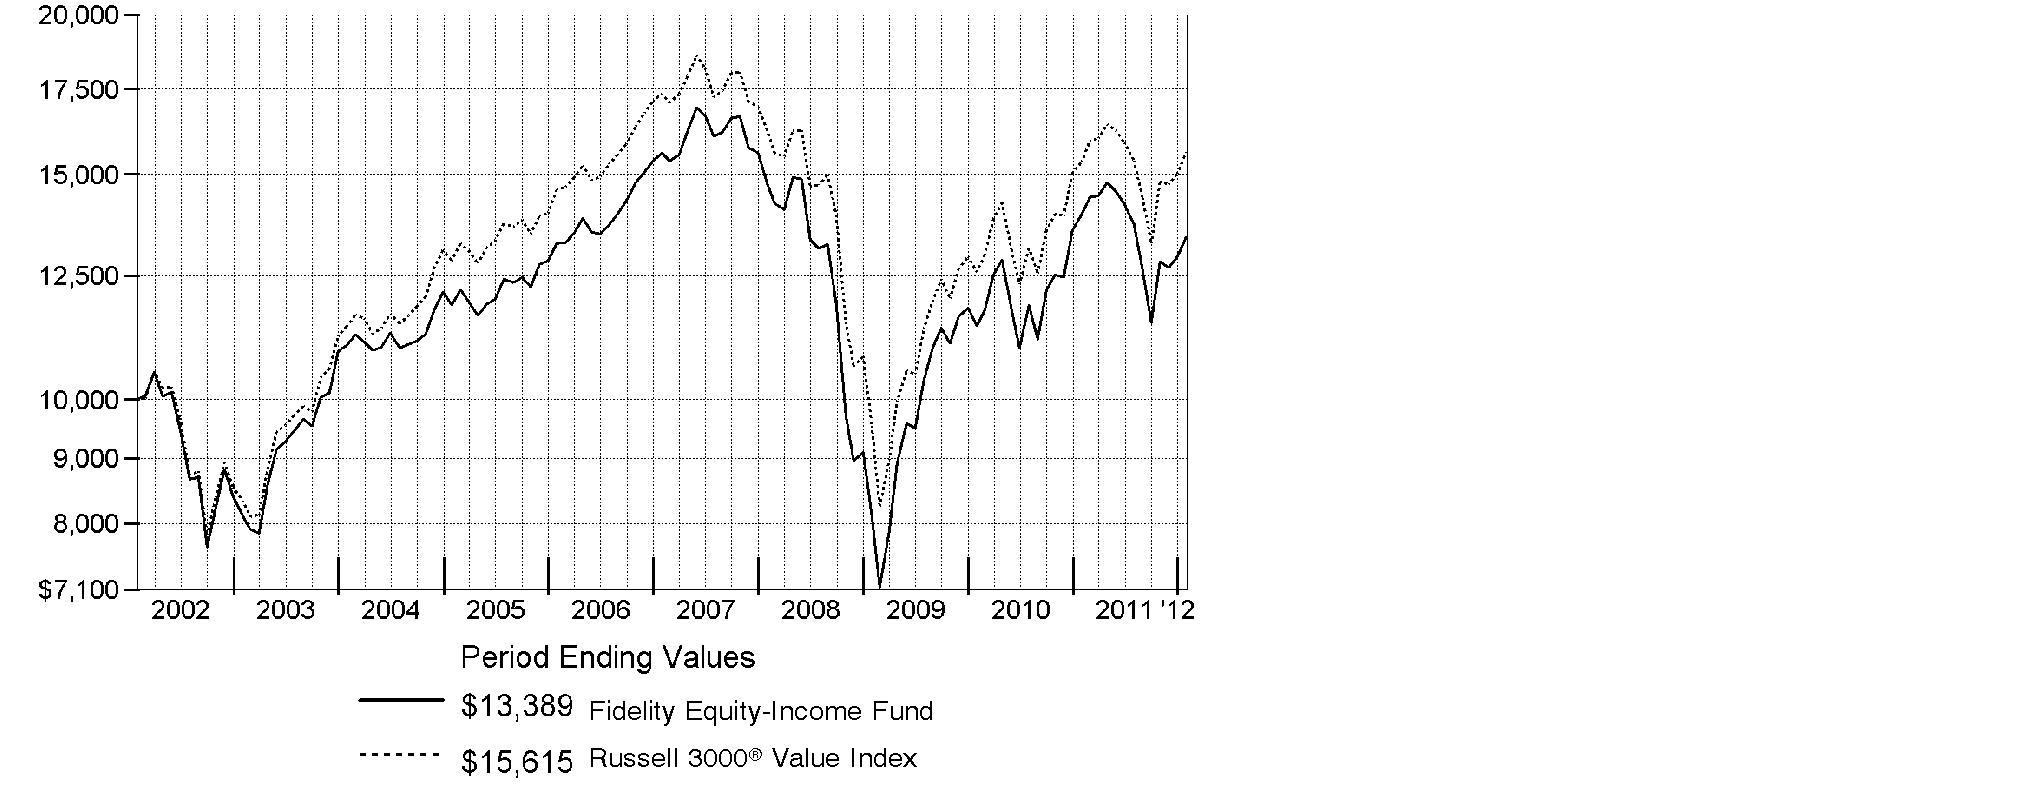
Fidelity® Equity-Income Fund | -4.15% | -2.98% | 2.96% |
$10,000 Over 10 Years
Let's say hypothetically that $10,000 was invested in Fidelity® Equity-Income Fund, a class of the fund, on January 31, 2002. The chart shows how the value of your investment would have changed, and also shows how the Russell 3000® Value Index performed over the same period.
Annual Report
Management's Discussion of Fund Performance
Market Recap: After enduring one of the most volatile trading periods on record, U.S. stocks posted a gain for the 12 months ending January 31, 2012, sparked by a January rally. Strong corporate earnings reports and hints of economic recovery sent stocks mostly upward through April, when sovereign debt woes in Europe sparked fear of a global slowdown. In the summer, equities plummeted on eurozone instability, debate over the U.S. debt ceiling and a historic downgrade of the nation's sovereign debt rating. After falling as much as 13% by early August, the broad-based S&P 500® Index seesawed back to end the period on an optimistic note. For the full 12 months, the S&P 500® rose 4.22%, while the technology-laden Nasdaq Composite® Index added 5.26%. Investors began to shed perceived riskier smaller-cap stocks in favor of larger, more-established and dividend-paying names, helping to drive the Dow Jones® Industrial Average up 9.12% for the year, while the Russell 2000® - a proxy for small-caps - and Russell Midcap® indexes added 2.86% and 2.25%, respectively. Within the S&P 500®, defensive sectors such as health care (+16%) and utilities (+14%) fared best, while financials (-12%) struggled. Foreign developed-markets stocks were stung by Europe's turmoil, and the MSCI® EAFE® (Europe, Australasia, Far East) Index fell 9.49%.
Comments from James Morrow, who became Lead Portfolio Manager of Fidelity® Equity-Income Fund on October 26, 2011: For the year ending January 31, 2012, the fund's Retail Class shares lost 4.15%, significantly lagging the 1.78% gain of the Russell 3000® Value Index. The biggest sources of underperformance came from a few economically sensitive sectors, especially financials. Diversified financials stocks Morgan Stanley, JPMorgan Chase and Bank of America (no longer held) did especially poorly. Positioning in industrials and consumer discretionary also notably detracted, as did the fund's stance in traditionally defensive groups, such as health care and consumer staples. In technology, the fund's average underweighting in Intel was unfortunate, given that stock's sharp gain during the year, while holdings in network-communications equipment maker Cisco Systems also hurt. At period end, the fund no longer held Intel's common stock but did own a convertible securities position. The fund's top individual contributors included National Semiconductor, which was acquired, and tobacco manufacturer Philip Morris International. Underweightings in software giant Microsoft and energy producer Devon Energy - sold before period end - also helped results.
Note to shareholders: On October 26, 2011, Adam Kramer and Ramona Persaud were named Co-Portfolio Managers of the fund.
The views expressed above reflect those of the portfolio manager(s) only through the end of the period as stated on the cover of this report and do not necessarily represent the views of Fidelity or any other person in the Fidelity organization. Any such views are subject to change at any time based upon market or other conditions and Fidelity disclaims any responsibility to update such views. These views may not be relied on as investment advice and, because investment decisions for a Fidelity fund are based on numerous factors, may not be relied on as an indication of trading intent on behalf of any Fidelity fund.
Annual Report
Shareholder Expense Example
As a shareholder of the Fund, you incur two types of costs: (1) transaction costs, and (2) ongoing costs, including management fees and other Fund expenses. This Example is intended to help you understand your ongoing costs (in dollars) of investing in the Fund and to compare these costs with the ongoing costs of investing in other mutual funds.
The Example is based on an investment of $1,000 invested at the beginning of the period and held for the entire period (August 1, 2011 to January 31, 2012).
Actual Expenses
The first line of the accompanying table for each class of the Fund provides information about actual account values and actual expenses. You may use the information in this line, together with the amount you invested, to estimate the expenses that you paid over the period. Simply divide your account value by $1,000.00 (for example, an $8,600 account value divided by $1,000.00 = 8.6), then multiply the result by the number in the first line for a class of the Fund under the heading entitled "Expenses Paid During Period" to estimate the expenses you paid on your account during this period. A small balance maintenance fee of $12.00 that is charged once a year may apply for certain accounts with a value of less than $2,000. This fee is not included in the table below. If it was, the estimate of expenses you paid during the period would be higher, and your ending account value lower, by this amount. In addition, the Fund, as a shareholder in the underlying Fidelity Central Funds, will indirectly bear its pro-rata share of the fees and expenses incurred by the underlying Fidelity Central Funds. These fees and expenses are not included in the Fund's annualized expense ratio used to calculate the expense estimate in the table below.
Hypothetical Example for Comparison Purposes
The second line of the accompanying table for each class of the Fund provides information about hypothetical account values and hypothetical expenses based on a Class' actual expense ratio and an assumed rate of return of 5% per year before expenses, which is not the Class' actual return. The hypothetical account values and expenses may not be used to estimate the actual ending account balance or expenses you paid for the period. You may use this information to compare the ongoing costs of investing in the Fund and other funds. To do so, compare this 5% hypothetical example with the 5% hypothetical examples that appear in the shareholder reports of the other funds. A small balance maintenance fee of $12.00 that is charged once a year may apply for certain accounts with a value of less than $2,000. This fee is not included in the table below. If it was, the estimate of expenses you paid during the period would be higher, and your ending account value lower, by this amount. In addition, the Fund, as a shareholder in the underlying Fidelity Central Funds, will indirectly bear its pro-rata share of the fees and expenses incurred by the underlying Fidelity Central Funds. These fees and expenses are not included in the Fund's annualized expense ratio used to calculate the expense estimate in the table below.
Please note that the expenses shown in the table are meant to highlight your ongoing costs only and do not reflect any transaction costs. Therefore, the second line of the table is useful in comparing ongoing costs only, and will not help you determine the relative total costs of owning different funds.
Annual Report
Shareholder Expense Example - continued
| Annualized | Beginning | Ending | Expenses Paid |
Equity-Income | .69% |
|
|
|
Actual |
| $ 1,000.00 | $ 976.80 | $ 3.44 |
Hypothetical A |
| $ 1,000.00 | $ 1,021.73 | $ 3.52 |
Class K | .53% |
|
|
|
Actual |
| $ 1,000.00 | $ 977.60 | $ 2.64 |
Hypothetical A |
| $ 1,000.00 | $ 1,022.53 | $ 2.70 |
A 5% return per year before expenses
* Expenses are equal to each Class' annualized expense ratio, multiplied by the average account value over the period, multiplied by 184/365 (to reflect the one-half year period).
Annual Report
Investment Changes (Unaudited)
Top Ten Stocks as of January 31, 2012 | ||
| % of fund's | % of fund's net assets |
Chevron Corp. | 3.9 | 2.7 |
JPMorgan Chase & Co. | 3.7 | 3.5 |
Pfizer, Inc. | 3.2 | 2.2 |
Wells Fargo & Co. | 3.1 | 2.7 |
Procter & Gamble Co. | 2.4 | 1.7 |
Merck & Co., Inc. | 2.4 | 1.3 |
General Electric Co. | 2.3 | 2.1 |
Comcast Corp. Class A | 2.1 | 0.8 |
Paychex, Inc. | 1.8 | 0.0 |
Royal Dutch Shell PLC Class A | 1.7 | 2.7 |
| 26.6 | |
Top Five Market Sectors as of January 31, 2012 | ||
| % of fund's | % of fund's net assets |
Financials | 20.4 | 28.3 |
Health Care | 13.5 | 9.7 |
Energy | 12.5 | 14.4 |
Consumer Staples | 11.2 | 7.0 |
Information Technology | 10.5 | 5.1 |
Asset Allocation (% of fund's net assets) | |||||||
As of January 31, 2012* | As of July 31, 2011** | ||||||
 | Stocks and |
| | Stocks and |
| ||
 | Bonds 0.7% |
|  | Bonds 0.0% |
| ||
 | Convertible |
| | Convertible |
| ||
 | Other Investments 0.1% |
| | Other Investments 0.0% |
| ||
 | Short-Term |
| | Short-Term |
| ||
* Foreign investments | 19.1% |
| ** Foreign investments | 16.5% |
| ||

Annual Report
Investments January 31, 2012
Showing Percentage of Net Assets
Common Stocks - 90.0% | |||
Shares | Value (000s) | ||
CONSUMER DISCRETIONARY - 7.6% | |||
Distributors - 0.2% | |||
Li & Fung Ltd. | 9,694,000 | $ 21,200 | |
Hotels, Restaurants & Leisure - 0.5% | |||
Carnival Corp. unit | 416,098 | 12,566 | |
Cedar Fair LP (depository unit) | 47,600 | 1,233 | |
Einstein Noah Restaurant Group, Inc. | 327,500 | 4,876 | |
McDonald's Corp. | 260,867 | 25,839 | |
| 44,514 | ||
Household Durables - 0.9% | |||
Jarden Corp. | 485,391 | 16,353 | |
KB Home (d) | 767,600 | 6,924 | |
Lennar Corp. Class A | 1,216,434 | 26,141 | |
PulteGroup, Inc. (a) | 2,609,634 | 19,442 | |
Tupperware Brands Corp. | 39,800 | 2,501 | |
Whirlpool Corp. | 158,711 | 8,621 | |
| 79,982 | ||
Leisure Equipment & Products - 0.3% | |||
Hasbro, Inc. | 717,800 | 25,058 | |
Media - 3.9% | |||
British Sky Broadcasting Group PLC | 114,100 | 1,241 | |
Comcast Corp. Class A | 7,112,735 | 189,128 | |
Informa PLC | 535,040 | 3,297 | |
Interpublic Group of Companies, Inc. | 1,505,400 | 15,551 | |
Ipsos SA | 45,600 | 1,456 | |
The Walt Disney Co. | 625,520 | 24,333 | |
Time Warner, Inc. | 3,090,353 | 114,528 | |
Virgin Media, Inc. | 64,700 | 1,542 | |
| 351,076 | ||
Multiline Retail - 1.1% | |||
PPR SA | 21,400 | 3,367 | |
Target Corp. | 1,776,249 | 90,251 | |
| 93,618 | ||
Specialty Retail - 0.7% | |||
Best Buy Co., Inc. | 721,011 | 17,268 | |
Carphone Warehouse Group PLC | 293,100 | 767 | |
Destination Maternity Corp. | 218,520 | 3,647 | |
Foschini Ltd. | 317,200 | 4,408 | |
Limited Brands, Inc. | 52,100 | 2,181 | |
Lowe's Companies, Inc. | 992,122 | 26,619 | |
Common Stocks - continued | |||
Shares | Value (000s) | ||
CONSUMER DISCRETIONARY - continued | |||
Specialty Retail - continued | |||
OfficeMax, Inc. (a) | 770,727 | $ 4,262 | |
USS Co. Ltd. | 24,090 | 2,301 | |
| 61,453 | ||
Textiles, Apparel & Luxury Goods - 0.0% | |||
VF Corp. | 23,500 | 3,090 | |
TOTAL CONSUMER DISCRETIONARY | 679,991 | ||
CONSUMER STAPLES - 11.1% | |||
Beverages - 2.2% | |||
Anadolu Efes Biracilik ve Malt Sanayii A/S | 98,000 | 1,371 | |
Anheuser-Busch InBev SA NV | 689,492 | 41,919 | |
Beam, Inc. | 258,000 | 13,496 | |
Dr Pepper Snapple Group, Inc. | 90,200 | 3,502 | |
PepsiCo, Inc. | 1,558,312 | 102,334 | |
The Coca-Cola Co. | 466,324 | 31,491 | |
| 194,113 | ||
Food & Staples Retailing - 1.7% | |||
Drogasil SA | 193,100 | 1,603 | |
Safeway, Inc. | 1,141,000 | 25,079 | |
Sysco Corp. | 780,100 | 23,489 | |
Wal-Mart Stores, Inc. | 1,226,355 | 75,249 | |
Walgreen Co. | 896,139 | 29,895 | |
| 155,315 | ||
Food Products - 0.8% | |||
Danone | 816,280 | 50,377 | |
Green Mountain Coffee Roasters, Inc. (a) | 265,878 | 14,182 | |
Kraft Foods, Inc. Class A | 130,471 | 4,997 | |
Shenguan Holdings Group Ltd. | 2,106,000 | 1,198 | |
| 70,754 | ||
Household Products - 3.4% | |||
Colgate-Palmolive Co. | 17,500 | 1,588 | |
Kimberly-Clark Corp. | 969,197 | 69,356 | |
Procter & Gamble Co. | 3,400,095 | 214,342 | |
Reckitt Benckiser Group PLC | 311,600 | 16,579 | |
| 301,865 | ||
Tobacco - 3.0% | |||
Altria Group, Inc. | 2,393,300 | 67,970 | |
Common Stocks - continued | |||
Shares | Value (000s) | ||
CONSUMER STAPLES - continued | |||
Tobacco - continued | |||
British American Tobacco PLC: | |||
(United Kingdom) | 135,000 | $ 6,217 | |
sponsored ADR | 1,112,200 | 102,556 | |
Imperial Tobacco Group PLC | 108,443 | 3,880 | |
Japan Tobacco, Inc. | 1,404 | 6,907 | |
Lorillard, Inc. | 223,200 | 23,969 | |
Philip Morris International, Inc. | 819,595 | 61,281 | |
| 272,780 | ||
TOTAL CONSUMER STAPLES | 994,827 | ||
ENERGY - 12.1% | |||
Energy Equipment & Services - 1.1% | |||
Aker Solutions ASA | 205,300 | 2,518 | |
BW Offshore Ltd. | 4,755,644 | 7,181 | |
Exterran Partners LP | 498,350 | 11,641 | |
Halliburton Co. | 1,028,270 | 37,820 | |
Noble Corp. | 824,802 | 28,736 | |
Saipem SpA | 62,287 | 2,915 | |
Trinidad Drilling Ltd. | 1,146,000 | 7,669 | |
| 98,480 | ||
Oil, Gas & Consumable Fuels - 11.0% | |||
Apache Corp. | 402,352 | 39,785 | |
ARC Resources Ltd. | 332,100 | 8,051 | |
Atlas Pipeline Partners, LP | 108,500 | 4,070 | |
BP PLC | 587,600 | 4,421 | |
BP PLC sponsored ADR | 1,582,665 | 72,660 | |
Buckeye Partners LP | 130,900 | 8,154 | |
Canadian Natural Resources Ltd. | 459,100 | 18,185 | |
Chevron Corp. | 3,407,395 | 351,227 | |
EXCO Resources, Inc. | 1,616,823 | 12,708 | |
Exxon Mobil Corp. | 1,432,284 | 119,939 | |
Holly Energy Partners LP | 38,960 | 2,153 | |
Inergy Midstream LP | 344,200 | 7,015 | |
Legacy Reserves LP | 564,400 | 16,001 | |
Origin Energy Ltd. | 178,752 | 2,611 | |
Penn West Petroleum Ltd. | 1,706,100 | 37,176 | |
Pioneer Southwest Energy Partners LP | 208,900 | 5,678 | |
Royal Dutch Shell PLC: | |||
Class A (United Kingdom) | 113,600 | 4,031 | |
Common Stocks - continued | |||
Shares | Value (000s) | ||
ENERGY - continued | |||
Oil, Gas & Consumable Fuels - continued | |||
Royal Dutch Shell PLC: - continued | |||
Class A sponsored ADR | 2,094,700 | $ 149,478 | |
Suncor Energy, Inc. | 661,900 | 22,799 | |
Total SA sponsored ADR | 1,241,400 | 65,757 | |
Williams Companies, Inc. | 898,200 | 25,886 | |
WPX Energy, Inc. | 256,466 | 4,227 | |
| 982,012 | ||
TOTAL ENERGY | 1,080,492 | ||
FINANCIALS - 19.4% | |||
Capital Markets - 3.0% | |||
Apollo Global Management LLC Class A | 557,200 | 8,291 | |
Ashmore Group PLC | 7,116,200 | 41,653 | |
Goldman Sachs Group, Inc. | 566,868 | 63,189 | |
ICAP PLC | 438,000 | 2,319 | |
KKR & Co. LP | 2,496,600 | 34,902 | |
Manning & Napier, Inc. | 501,290 | 6,642 | |
Morgan Stanley | 3,900,073 | 72,736 | |
The Blackstone Group LP | 2,305,600 | 36,452 | |
UBS AG (a) | 321,317 | 4,385 | |
| 270,569 | ||
Commercial Banks - 5.9% | |||
Aozora Bank Ltd. | 611,000 | 1,699 | |
Barclays PLC | 628,749 | 2,108 | |
BB&T Corp. | 2,502,985 | 68,056 | |
Comerica, Inc. | 678,400 | 18,771 | |
First Niagara Financial Group, Inc. | 1,382,207 | 13,228 | |
HSBC Holdings PLC (United Kingdom) | 6,932 | 58 | |
KB Financial Group, Inc. | 35,110 | 1,331 | |
M&T Bank Corp. | 418,400 | 33,363 | |
Standard Chartered PLC (United Kingdom) | 562,747 | 13,605 | |
SunTrust Banks, Inc. | 1,450,900 | 29,845 | |
Swedbank AB (A Shares) | 126,100 | 1,811 | |
U.S. Bancorp | 2,481,102 | 70,017 | |
Wells Fargo & Co. | 9,408,285 | 274,816 | |
| 528,708 | ||
Consumer Finance - 0.0% | |||
International Personal Finance PLC | 289,600 | 869 | |
Common Stocks - continued | |||
Shares | Value (000s) | ||
FINANCIALS - continued | |||
Diversified Financial Services - 4.0% | |||
BM&F Bovespa SA | 307,600 | $ 1,935 | |
Citigroup, Inc. | 686,320 | 21,084 | |
CME Group, Inc. | 4,174 | 1,000 | |
JPMorgan Chase & Co. | 8,918,525 | 332,661 | |
| 356,680 | ||
Insurance - 4.3% | |||
ACE Ltd. | 835,600 | 58,158 | |
AFLAC, Inc. | 388,000 | 18,713 | |
Aviva PLC | 464,900 | 2,564 | |
Berkshire Hathaway, Inc. Class B (a) | 620,044 | 48,593 | |
Everest Re Group Ltd. | 338,300 | 28,891 | |
Fairfax Financial Holdings Ltd. (sub. vtg.) | 100 | 41 | |
Fidelity National Financial, Inc. Class A | 1,369,500 | 24,911 | |
Hanover Insurance Group, Inc. | 550,700 | 20,023 | |
MetLife, Inc. | 2,296,309 | 81,129 | |
MetLife, Inc. unit | 344,600 | 23,557 | |
Old Republic International Corp. | 1,181,900 | 11,677 | |
Resolution Ltd. | 615,900 | 2,651 | |
The Chubb Corp. | 447,941 | 30,196 | |
Validus Holdings Ltd. | 954,959 | 30,626 | |
| 381,730 | ||
Real Estate Investment Trusts - 2.1% | |||
American Capital Agency Corp. | 901,400 | 26,429 | |
American Tower Corp. | 40,300 | 2,559 | |
Annaly Capital Management, Inc. | 1,523,200 | 25,651 | |
Brandywine Realty Trust (SBI) | 901,500 | 9,592 | |
Chimera Investment Corp. | 5,535,150 | 16,827 | |
Digital Realty Trust, Inc. (d) | 184,700 | 13,088 | |
Highwoods Properties, Inc. (SBI) | 242,500 | 8,024 | |
Japan Retail Fund Investment Corp. | 1,404 | 2,035 | |
Omega Healthcare Investors, Inc. | 756,900 | 15,774 | |
Rayonier, Inc. | 356,009 | 16,280 | |
Two Harbors Investment Corp. | 1,707,000 | 16,951 | |
Ventas, Inc. | 540,752 | 31,531 | |
| 184,741 | ||
Real Estate Management & Development - 0.0% | |||
Relo Holdings Corp. | 80,300 | 2,181 | |
Common Stocks - continued | |||
Shares | Value (000s) | ||
FINANCIALS - continued | |||
Thrifts & Mortgage Finance - 0.1% | |||
New York Community Bancorp, Inc. | 883,913 | $ 11,217 | |
TOTAL FINANCIALS | 1,736,695 | ||
HEALTH CARE - 13.1% | |||
Biotechnology - 1.2% | |||
Amgen, Inc. | 1,214,525 | 82,478 | |
PDL BioPharma, Inc. | 3,335,500 | 21,314 | |
| 103,792 | ||
Health Care Equipment & Supplies - 0.7% | |||
Covidien PLC | 753,800 | 38,821 | |
Meridian Bioscience, Inc. | 404,582 | 7,056 | |
St. Jude Medical, Inc. | 474,300 | 19,783 | |
| 65,660 | ||
Health Care Providers & Services - 1.4% | |||
Brookdale Senior Living, Inc. (a) | 583,800 | 10,275 | |
WellPoint, Inc. | 1,768,246 | 113,734 | |
| 124,009 | ||
Pharmaceuticals - 9.8% | |||
Abbott Laboratories | 1,312,200 | 71,056 | |
AstraZeneca PLC sponsored ADR | 426,100 | 20,517 | |
GlaxoSmithKline PLC | 2,357,881 | 52,455 | |
Johnson & Johnson | 1,916,301 | 126,303 | |
Merck & Co., Inc. | 5,487,132 | 209,938 | |
Pfizer, Inc. | 13,381,319 | 286,360 | |
Roche Holding AG (participation certificate) | 260,184 | 44,050 | |
Sanofi-aventis | 764,031 | 56,643 | |
Teva Pharmaceutical Industries Ltd. sponsored ADR | 206,800 | 9,333 | |
| 876,655 | ||
TOTAL HEALTH CARE | 1,170,116 | ||
INDUSTRIALS - 9.2% | |||
Aerospace & Defense - 2.2% | |||
Lockheed Martin Corp. | 727,000 | 59,847 | |
Raytheon Co. | 905,246 | 43,443 | |
The Boeing Co. | 278,916 | 20,690 | |
United Technologies Corp. | 919,715 | 72,060 | |
| 196,040 | ||
Common Stocks - continued | |||
Shares | Value (000s) | ||
INDUSTRIALS - continued | |||
Air Freight & Logistics - 1.3% | |||
C.H. Robinson Worldwide, Inc. | 358,500 | $ 24,679 | |
United Parcel Service, Inc. Class B | 1,160,606 | 87,800 | |
| 112,479 | ||
Building Products - 0.0% | |||
Lennox International, Inc. | 121,400 | 4,395 | |
Commercial Services & Supplies - 1.1% | |||
Intrum Justitia AB | 1,103,800 | 17,404 | |
Multiplus SA | 88,200 | 1,551 | |
Republic Services, Inc. | 2,596,974 | 76,039 | |
Steelcase, Inc. Class A | 553,595 | 4,822 | |
US Ecology, Inc. | 96,700 | 1,810 | |
| 101,626 | ||
Construction & Engineering - 0.0% | |||
Aveng Ltd. | 392,500 | 1,746 | |
VINCI SA | 54,900 | 2,546 | |
| 4,292 | ||
Electrical Equipment - 0.1% | |||
Alstom SA | 73,477 | 2,800 | |
Emerson Electric Co. | 43,328 | 2,226 | |
Hubbell, Inc. Class B | 24,900 | 1,792 | |
Rockwell Automation, Inc. | 15,200 | 1,184 | |
| 8,002 | ||
Industrial Conglomerates - 2.6% | |||
General Electric Co. | 10,998,537 | 205,783 | |
Koninklijke Philips Electronics NV | 78,100 | 1,582 | |
Koninklijke Philips Electronics NV (depositary receipt) (NY Reg.) | 1,216,213 | 24,640 | |
Orkla ASA (A Shares) | 397,700 | 3,223 | |
Siemens AG (d) | 22,559 | 2,130 | |
| 237,358 | ||
Machinery - 0.9% | |||
Briggs & Stratton Corp. | 1,121,785 | 17,511 | |
Douglas Dynamics, Inc. | 675,024 | 9,187 | |
Dover Corp. | 30,400 | 1,928 | |
Harsco Corp. | 188,700 | 4,195 | |
Illinois Tool Works, Inc. | 266,013 | 14,107 | |
Ingersoll-Rand PLC | 752,442 | 26,290 | |
Common Stocks - continued | |||
Shares | Value (000s) | ||
INDUSTRIALS - continued | |||
Machinery - continued | |||
Schindler Holding AG (Reg.) | 14,040 | $ 1,636 | |
Stanley Black & Decker, Inc. | 49,649 | 3,484 | |
| 78,338 | ||
Professional Services - 0.3% | |||
Michael Page International PLC | 3,768,800 | 23,111 | |
Road & Rail - 0.6% | |||
Union Pacific Corp. | 453,200 | 51,805 | |
Trading Companies & Distributors - 0.1% | |||
Mills Estruturas e Servicos de Engenharia SA | 184,100 | 2,284 | |
W.W. Grainger, Inc. | 5,900 | 1,125 | |
Wolseley PLC | 129,000 | 4,467 | |
| 7,876 | ||
TOTAL INDUSTRIALS | 825,322 | ||
INFORMATION TECHNOLOGY - 9.6% | |||
Communications Equipment - 1.4% | |||
Cisco Systems, Inc. | 6,185,416 | 121,420 | |
Computers & Peripherals - 1.3% | |||
Apple, Inc. (a) | 66,872 | 30,526 | |
Hewlett-Packard Co. | 3,025,615 | 84,657 | |
| 115,183 | ||
Electronic Equipment & Components - 0.5% | |||
Arrow Electronics, Inc. (a) | 409,895 | 16,925 | |
Avnet, Inc. (a) | 301,300 | 10,506 | |
TE Connectivity Ltd. | 642,690 | 21,916 | |
| 49,347 | ||
Internet Software & Services - 0.6% | |||
Google, Inc. Class A (a) | 61,200 | 35,503 | |
VeriSign, Inc. | 465,900 | 17,266 | |
| 52,769 | ||
IT Services - 3.4% | |||
Accenture PLC Class A | 878,633 | 50,381 | |
Cognizant Technology Solutions Corp. Class A (a) | 620,498 | 44,521 | |
Fidelity National Information Services, Inc. | 157,932 | 4,511 | |
Paychex, Inc. | 4,976,646 | 156,764 | |
Visa, Inc. Class A | 462,000 | 46,496 | |
| 302,673 | ||
Common Stocks - continued | |||
Shares | Value (000s) | ||
INFORMATION TECHNOLOGY - continued | |||
Office Electronics - 0.0% | |||
Canon, Inc. | 41,000 | $ 1,760 | |
Xerox Corp. | 209,302 | 1,622 | |
| 3,382 | ||
Semiconductors & Semiconductor Equipment - 1.7% | |||
Analog Devices, Inc. | 46,000 | 1,800 | |
Applied Materials, Inc. | 2,163,600 | 26,569 | |
ASM Pacific Technology Ltd. | 1,901,700 | 24,472 | |
KLA-Tencor Corp. | 399,403 | 20,421 | |
Siliconware Precision Industries Co. Ltd. sponsored ADR | 3,933,500 | 22,224 | |
Taiwan Semiconductor Manufacturing Co. Ltd. | 1,911,000 | 5,068 | |
Taiwan Semiconductor Manufacturing Co. Ltd. sponsored ADR | 3,811,815 | 53,670 | |
| 154,224 | ||
Software - 0.7% | |||
BMC Software, Inc. (a) | 348,600 | 12,633 | |
CA, Inc. | 796,300 | 20,529 | |
CompuGROUP Holding AG | 308,300 | 3,341 | |
Microsoft Corp. | 859,574 | 25,383 | |
| 61,886 | ||
TOTAL INFORMATION TECHNOLOGY | 860,884 | ||
MATERIALS - 0.5% | |||
Chemicals - 0.4% | |||
Arkema SA | 47,800 | 3,862 | |
BASF AG | 35,360 | 2,719 | |
Clariant AG (Reg.) (a) | 128,136 | 1,557 | |
Israel Chemicals Ltd. | 137,700 | 1,442 | |
LyondellBasell Industries NV Class A | 72,000 | 3,103 | |
PPG Industries, Inc. | 274,900 | 24,626 | |
Tokyo Ohka Kogyo Co. Ltd. | 52,700 | 1,152 | |
| 38,461 | ||
Metals & Mining - 0.1% | |||
Commercial Metals Co. | 703,200 | 10,084 | |
TOTAL MATERIALS | 48,545 | ||
TELECOMMUNICATION SERVICES - 3.6% | |||
Diversified Telecommunication Services - 3.5% | |||
AT&T, Inc. | 5,136,049 | 151,051 | |
CenturyLink, Inc. | 1,191,429 | 44,119 | |
Common Stocks - continued | |||
Shares | Value (000s) | ||
TELECOMMUNICATION SERVICES - continued | |||
Diversified Telecommunication Services - continued | |||
HKT Trust / HKT Ltd. unit | 2,690,000 | $ 1,724 | |
Koninklijke KPN NV | 2,045,342 | 22,418 | |
PT XL Axiata Tbk | 1,079,500 | 537 | |
Telstra Corp. Ltd. | 678,751 | 2,399 | |
Verizon Communications, Inc. | 2,374,167 | 89,411 | |
| 311,659 | ||
Wireless Telecommunication Services - 0.1% | |||
Far EasTone Telecommunications Co. Ltd. | 1,111,000 | 2,140 | |
TIM Participacoes SA sponsored ADR | 108,200 | 3,122 | |
Vodafone Group PLC | 2,086,000 | 5,627 | |
| 10,889 | ||
TOTAL TELECOMMUNICATION SERVICES | 322,548 | ||
UTILITIES - 3.8% | |||
Electric Utilities - 2.6% | |||
Cheung Kong Infrastructure Holdings Ltd. | 250,000 | 1,423 | |
Duke Energy Corp. | 2,855,848 | 60,858 | |
FirstEnergy Corp. | 907,812 | 38,328 | |
NextEra Energy, Inc. | 832,028 | 49,797 | |
PPL Corp. | 2,249,841 | 62,523 | |
Southern Co. | 470,691 | 21,445 | |
| 234,374 | ||
Gas Utilities - 0.1% | |||
ONEOK, Inc. | 50,100 | 4,166 | |
YESCO Co. Ltd. | 44,540 | 993 | |
| 5,159 | ||
Independent Power Producers & Energy Traders - 0.1% | |||
International Power PLC | 400,355 | 2,116 | |
Tractebel Energia SA | 107,100 | 1,860 | |
| 3,976 | ||
Multi-Utilities - 1.0% | |||
Alliant Energy Corp. | 192,619 | 8,165 | |
National Grid PLC | 4,474,529 | 44,562 | |
Common Stocks - continued | |||
Shares | Value (000s) | ||
UTILITIES - continued | |||
Multi-Utilities - continued | |||
PG&E Corp. | 407,523 | $ 16,570 | |
TECO Energy, Inc. | 1,321,363 | 23,851 | |
| 93,148 | ||
TOTAL UTILITIES | 336,657 | ||
TOTAL COMMON STOCKS (Cost $7,346,064) |
| ||
Preferred Stocks - 3.5% | |||
|
|
|
|
Convertible Preferred Stocks - 1.6% | |||
CONSUMER DISCRETIONARY - 0.3% | |||
Automobiles - 0.2% | |||
General Motors Co. 4.75% | 426,516 | 17,086 | |
Media - 0.1% | |||
Interpublic Group of Companies, Inc. 5.25% | 10,700 | 10,504 | |
TOTAL CONSUMER DISCRETIONARY | 27,590 | ||
ENERGY - 0.0% | |||
Oil, Gas & Consumable Fuels - 0.0% | |||
ATP Oil & Gas Corp. Series B, 8.00% | 66,200 | 2,367 | |
FINANCIALS - 0.5% | |||
Commercial Banks - 0.2% | |||
Huntington Bancshares, Inc. 8.50% | 14,900 | 16,539 | |
Diversified Financial Services - 0.1% | |||
Citigroup, Inc. 7.50% | 115,300 | 10,684 | |
Insurance - 0.1% | |||
Hartford Financial Services Group, Inc. Series F 7.25% | 389,200 | 8,025 | |
Real Estate Investment Trusts - 0.1% | |||
Health Care REIT, Inc. Series I, 6.50% | 149,000 | 7,990 | |
TOTAL FINANCIALS | 43,238 | ||
HEALTH CARE - 0.3% | |||
Health Care Equipment & Supplies - 0.2% | |||
Alere, Inc. 3.00% | 67,100 | 14,868 | |
Preferred Stocks - continued | |||
Shares | Value (000s) | ||
Convertible Preferred Stocks - continued | |||
HEALTH CARE - continued | |||
Health Care Providers & Services - 0.1% | |||
HealthSouth Corp. Series A 6.50% | 12,600 | $ 11,852 | |
TOTAL HEALTH CARE | 26,720 | ||
INDUSTRIALS - 0.1% | |||
Professional Services - 0.1% | |||
Nielsen Holdings B.V. 6.25% | 168,700 | 9,479 | |
MATERIALS - 0.2% | |||
Metals & Mining - 0.2% | |||
AngloGold Ashanti Holdings Finance PLC 6.00% | 262,500 | 13,256 | |
UTILITIES - 0.2% | |||
Electric Utilities - 0.2% | |||
PPL Corp. 8.75% | 372,200 | 19,529 | |
TOTAL CONVERTIBLE PREFERRED STOCKS | 142,179 | ||
Nonconvertible Preferred Stocks - 1.9% | |||
CONSUMER DISCRETIONARY - 1.7% | |||
Automobiles - 1.7% | |||
Porsche Automobil Holding SE (Germany) | 657,594 | 40,313 | |
Volkswagen AG | 650,306 | 115,124 | |
| 155,437 | ||
FINANCIALS - 0.2% | |||
Consumer Finance - 0.2% | |||
Ally Financial, Inc. 7.00% (e) | 17,264 | 13,725 | |
TOTAL NONCONVERTIBLE PREFERRED STOCKS | 169,162 | ||
TOTAL PREFERRED STOCKS (Cost $301,123) |
| ||
Investment Companies - 0.1% | |||
|
|
|
|
2010 Swift Mandatory Common Exchange Security Trust (e) | 714,700 |
| |
Corporate Bonds - 2.9% | ||||
| Principal Amount (000s) | Value (000s) | ||
Convertible Bonds - 2.2% | ||||
CONSUMER DISCRETIONARY - 0.3% | ||||
Diversified Consumer Services - 0.2% | ||||
Ingersoll-Rand Global Holding Co. Ltd. 4.5% 4/15/12 | $ 6,235 | $ 12,252 | ||
Hotels, Restaurants & Leisure - 0.1% | ||||
Gaylord Entertainment Co. 3.75% 10/1/14 (e) | 4,670 | 5,682 | ||
MGM Mirage, Inc. 4.25% 4/15/15 | 4,130 | 4,347 | ||
| 10,029 | |||
TOTAL CONSUMER DISCRETIONARY | 22,281 | |||
ENERGY - 0.3% | ||||
Oil, Gas & Consumable Fuels - 0.3% | ||||
Chesapeake Energy Corp. 2.5% 5/15/37 | 10,470 | 9,156 | ||
Peabody Energy Corp. 4.75% 12/15/66 | 3,960 | 4,054 | ||
Western Refining, Inc. 5.75% 6/15/14 | 8,080 | 13,756 | ||
| 26,966 | |||
FINANCIALS - 0.1% | ||||
Thrifts & Mortgage Finance - 0.1% | ||||
MGIC Investment Corp. 9% 4/1/63 (e) | 17,382 | 8,604 | ||
HEALTH CARE - 0.1% | ||||
Health Care Equipment & Supplies - 0.1% | ||||
Teleflex, Inc. 3.875% 8/1/17 | 7,890 | 9,514 | ||
INDUSTRIALS - 0.2% | ||||
Commercial Services & Supplies - 0.2% | ||||
Covanta Holding Corp. 3.25% 6/1/14 | 16,940 | 18,268 | ||
Construction & Engineering - 0.0% | ||||
MasTec, Inc.: | ||||
4% 6/15/14 | 780 | 987 | ||
4.25% 12/15/14 | 1,490 | 1,930 | ||
| 2,917 | |||
TOTAL INDUSTRIALS | 21,185 | |||
INFORMATION TECHNOLOGY - 0.9% | ||||
Communications Equipment - 0.1% | ||||
InterDigital, Inc. 2.5% 3/15/16 (e) | 7,190 | 7,415 | ||
Computers & Peripherals - 0.1% | ||||
SanDisk Corp. 1.5% 8/15/17 | 5,040 | 5,796 | ||
Corporate Bonds - continued | ||||
| Principal Amount (000s) | Value (000s) | ||
Convertible Bonds - continued | ||||
INFORMATION TECHNOLOGY - continued | ||||
Internet Software & Services - 0.3% | ||||
Equinix, Inc.: | ||||
3% 10/15/14 | $ 7,830 | $ 9,634 | ||
4.75% 6/15/16 | 6,100 | 9,752 | ||
VeriSign, Inc. 3.25% 8/15/37 | 6,990 | 8,659 | ||
| 28,045 | |||
IT Services - 0.1% | ||||
CACI International, Inc. 2.125% 5/1/14 | 9,700 | 11,664 | ||
Semiconductors & Semiconductor Equipment - 0.1% | ||||
Intel Corp. 3.25% 8/1/39 | 3,060 | 4,093 | ||
Micron Technology, Inc. 1.875% 8/1/31 (e) | 3,890 | 3,895 | ||
| 7,988 | |||
Software - 0.2% | ||||
Nuance Communications, Inc. 2.75% 11/1/31 (e) | 19,080 | 22,339 | ||
TOTAL INFORMATION TECHNOLOGY | 83,247 | |||
MATERIALS - 0.2% | ||||
Metals & Mining - 0.2% | ||||
Newmont Mining Corp.: | ||||
1.25% 7/15/14 | 7,880 | 11,209 | ||
1.625% 7/15/17 | 2,980 | 4,451 | ||
| 15,660 | |||
TELECOMMUNICATION SERVICES - 0.1% | ||||
Diversified Telecommunication Services - 0.1% | ||||
Clearwire Communications LLC/Clearwire Finance, Inc. 8.25% 12/1/40 (e) | 17,820 | 11,115 | ||
TOTAL CONVERTIBLE BONDS | 198,572 | |||
Nonconvertible Bonds - 0.7% | ||||
CONSUMER DISCRETIONARY - 0.1% | ||||
Diversified Consumer Services - 0.1% | ||||
ServiceMaster Co. 10.75% 7/15/15 pay-in-kind (e)(f) | 5,295 | 5,560 | ||
Corporate Bonds - continued | ||||
| Principal Amount (000s) | Value (000s) | ||
Nonconvertible Bonds - continued | ||||
CONSUMER STAPLES - 0.1% | ||||
Food & Staples Retailing - 0.1% | ||||
Rite Aid Corp.: | ||||
9.375% 12/15/15 | $ 2,510 | $ 2,523 | ||
9.5% 6/15/17 | 3,905 | 3,876 | ||
Tops Markets LLC 10.125% 10/15/15 | 7,150 | 7,668 | ||
| 14,067 | |||
ENERGY - 0.1% | ||||
Oil, Gas & Consumable Fuels - 0.1% | ||||
Western Refining, Inc. 11.25% 6/15/17 (e) | 5,000 | 5,650 | ||
FINANCIALS - 0.2% | ||||
Diversified Financial Services - 0.1% | ||||
Transportation Union LLC/Transportation Union Financing Corp. 11.375% 6/15/18 | 7,400 | 8,714 | ||
Thrifts & Mortgage Finance - 0.1% | ||||
Radian Group, Inc. 5.625% 2/15/13 | 9,330 | 6,858 | ||
TOTAL FINANCIALS | 15,572 | |||
MATERIALS - 0.1% | ||||
Paper & Forest Products - 0.1% | ||||
ABI Escrow Corp. 10.25% 10/15/18 (e) | 10,450 | 11,756 | ||
TELECOMMUNICATION SERVICES - 0.1% | ||||
Diversified Telecommunication Services - 0.1% | ||||
Clearwire Communications LLC/Clearwire Finance, Inc. 12% 12/1/15 (e) | 10,050 | 9,472 | ||
TOTAL NONCONVERTIBLE BONDS | 62,077 | |||
TOTAL CORPORATE BONDS (Cost $259,338) |
| |||
Floating Rate Loans - 0.1% | ||||
| Principal Amount (000s) | Value (000s) | ||
TELECOMMUNICATION SERVICES - 0.1% | ||||
Wireless Telecommunication Services - 0.1% | ||||
Asurion LLC term loan 9% 5/24/19 (f) (Cost $9,721) | $ 9,845 | $ 9,882 | ||
Money Market Funds - 3.4% | |||
Shares |
| ||
Fidelity Cash Central Fund, 0.12% (b) | 298,700,419 | 298,700 | |
Fidelity Securities Lending Cash Central Fund, 0.12% (b)(c) | 1,782,450 | 1,782 | |
TOTAL MONEY MARKET FUNDS (Cost $300,482) |
| ||
TOTAL INVESTMENT PORTFOLIO - 100.0% (Cost $8,223,405) | 8,946,823 | ||
NET OTHER ASSETS (LIABILITIES) - 0.0% | 3,322 | ||
NET ASSETS - 100% | $ 8,950,145 | ||
Legend |
(a) Non-income producing |
(b) Affiliated fund that is available only to investment companies and other accounts managed by Fidelity Investments. The rate quoted is the annualized seven-day yield of the fund at period end. A complete unaudited listing of the fund's holdings as of its most recent quarter end is available upon request. In addition, each Fidelity Central Fund's financial statements, which are not covered by the Fund's Report of Independent Registered Public Accounting Firm, are available on the SEC's website or upon request. |
(c) Investment made with cash collateral received from securities on loan. |
(d) Security or a portion of the security is on loan at period end. |
(e) Security exempt from registration under Rule 144A of the Securities Act of 1933. These securities may be resold in transactions exempt from registration, normally to qualified institutional buyers. At the end of the period, the value of these securities amounted to $113,605,000 or 1.3% of net assets. |
(f) Coupon rates for floating and adjustable rate securities reflect the rates in effect at period end. |
Affiliated Central Funds |
Information regarding fiscal year to date income earned by the Fund from investments in Fidelity Central Funds is as follows: |
Fund | Income earned |
Fidelity Cash Central Fund | $ 136 |
Fidelity Securities Lending Cash Central Fund | 2,544 |
Total | $ 2,680 |
Other Affiliated Issuers |
An affiliated company is a company in which the Fund has ownership of at least 5% of the voting securities. Fiscal year to date transactions with companies which are or were affiliates are as follows: |
Affiliate | Value, beginning of period | Purchases | Sales Proceeds | Dividend Income | Value, |
Briggs & Stratton Corp. | $ 56,123 | $ - | $ 25,105 | $ 1,030 | $ - |
Total | $ 56,123 | $ - | $ 25,105 | $ 1,030 | $ - |
Other Information |
The following is a summary of the inputs used, as of January 31, 2012, involving the Fund's assets and liabilities carried at fair value. The inputs or methodology used for valuing securities may not be an indication of the risk associated with investing in those securities. For more information on valuation inputs, and their aggregation into the levels used in the table below, please refer to the Security Valuation section in the accompanying Notes to Financial Statements. |
Valuation Inputs at Reporting Date: | ||||
Description | Total | Level 1 | Level 2 | Level 3 |
Investments in Securities: | ||||
Equities: | ||||
Consumer Discretionary | $ 863,018 | $ 852,514 | $ 10,504 | $ - |
Consumer Staples | 994,827 | 946,691 | 48,136 | - |
Energy | 1,082,859 | 1,072,040 | 10,819 | - |
Financials | 1,793,658 | 1,737,940 | 55,718 | - |
Health Care | 1,196,836 | 1,075,886 | 120,950 | - |
Industrials | 834,801 | 821,610 | 13,191 | - |
Information Technology | 860,884 | 854,056 | 6,828 | - |
Materials | 61,801 | 61,801 | - | - |
Telecommunication Services | 322,548 | 316,921 | 5,627 | - |
Utilities | 356,186 | 292,095 | 64,091 | - |
Investment Companies | 8,392 | - | 8,392 | - |
Valuation Inputs at Reporting Date: | ||||
Description | Total | Level 1 | Level 2 | Level 3 |
Investments in Securities: | ||||
Corporate Bonds | $ 260,649 | $ - | $ 260,649 | $ - |
Floating Rate Loans | 9,882 | - | 9,882 | - |
Money Market Funds | 300,482 | 300,482 | - | - |
Total Investments in Securities: | $ 8,946,823 | $ 8,332,036 | $ 614,787 | $ - |
Distribution of investments by country of issue, as a percentage of total net assets, is as follows: (Unaudited) |
United States of America | 80.9% |
United Kingdom | 6.5% |
France | 2.2% |
Germany | 1.7% |
Switzerland | 1.7% |
Ireland | 1.3% |
Bermuda | 1.2% |
Canada | 1.1% |
Others (Individually Less Than 1%) | 3.4% |
| 100.0% |
See accompanying notes which are an integral part of the financial statements.
Annual Report
Financial Statements
Statement of Assets and Liabilities
Amounts in thousands (except per-share amounts) | January 31, 2012 | |
|
|
|
Assets | ||
Investment in securities, at value (including securities loaned of $1,720) - See accompanying schedule: Unaffiliated issuers (cost $7,922,923) | $ 8,646,341 |
|
Fidelity Central Funds (cost $300,482) | 300,482 |
|
Total Investments (cost $8,223,405) |
| $ 8,946,823 |
Cash |
| 1,681 |
Foreign currency held at value (cost $691) | 691 | |
Receivable for investments sold | 26,908 | |
Receivable for fund shares sold | 5,399 | |
Dividends receivable | 13,597 | |
Interest receivable | 3,246 | |
Distributions receivable from Fidelity Central Funds | 33 | |
Prepaid expenses | 21 | |
Other receivables | 1,259 | |
Total assets | 8,999,658 | |
|
|
|
Liabilities | ||
Payable for investments purchased | $ 32,249 | |
Payable for fund shares redeemed | 9,888 | |
Accrued management fee | 3,430 | |
Other affiliated payables | 1,366 | |
Other payables and accrued expenses | 798 | |
Collateral on securities loaned, at value | 1,782 | |
Total liabilities | 49,513 | |
|
|
|
Net Assets | $ 8,950,145 | |
Net Assets consist of: |
| |
Paid in capital | $ 10,085,957 | |
Undistributed net investment income | 8,394 | |
Accumulated undistributed net realized gain (loss) on investments and foreign currency transactions | (1,867,708) | |
Net unrealized appreciation (depreciation) on investments and assets and liabilities in foreign currencies | 723,502 | |
Net Assets | $ 8,950,145 | |
See accompanying notes which are an integral part of the financial statements.
Annual Report
Statement of Assets and Liabilities - continued
Amounts in thousands (except per-share amounts) | January 31, 2012 | |
|
|
|
Equity-Income: | $ 42.77 | |
|
|
|
Class K: | $ 42.76 | |
See accompanying notes which are an integral part of the financial statements.
Annual Report
Statement of Operations
Amounts in thousands | Year ended January 31, 2012 | |
|
|
|
Investment Income |
|
|
Dividends (including $1,030 earned from other affiliated issuers) |
| $ 274,053 |
Interest |
| 16,550 |
Income from Fidelity Central Funds |
| 2,680 |
Total income |
| 293,283 |
|
|
|
Expenses | ||
Management fee | $ 49,496 | |
Transfer agent fees | 18,105 | |
Accounting and security lending fees | 1,338 | |
Custodian fees and expenses | 266 | |
Independent trustees' compensation | 65 | |
Registration fees | 153 | |
Audit | 196 | |
Legal | 45 | |
Interest | 15 | |
Miscellaneous | 141 | |
Total expenses before reductions | 69,820 | |
Expense reductions | (832) | 68,988 |
Net investment income (loss) | 224,295 | |
Realized and Unrealized Gain (Loss) Net realized gain (loss) on: | ||
Investment securities: |
|
|
Unaffiliated issuers | 1,667,907 | |
Other affiliated issuers | (12,496) |
|
Foreign currency transactions | (174) | |
Futures contracts | 15,704 | |
Total net realized gain (loss) |
| 1,670,941 |
Change in net unrealized appreciation (depreciation) on: Investment securities | (2,535,997) | |
Assets and liabilities in foreign currencies | (100) | |
Total change in net unrealized appreciation (depreciation) |
| (2,536,097) |
Net gain (loss) | (865,156) | |
Net increase (decrease) in net assets resulting from operations | $ (640,861) | |
See accompanying notes which are an integral part of the financial statements.
Annual Report
Statement of Changes in Net Assets
Amounts in thousands | Year ended | Year ended |
Increase (Decrease) in Net Assets |
|
|
Operations |
|
|
Net investment income (loss) | $ 224,295 | $ 237,832 |
Net realized gain (loss) | 1,670,941 | 395,328 |
Change in net unrealized appreciation (depreciation) | (2,536,097) | 2,115,275 |
Net increase (decrease) in net assets resulting | (640,861) | 2,748,435 |
Distributions to shareholders from net investment income | (215,914) | (254,643) |
Share transactions - net increase (decrease) | (2,800,870) | (7,281,724) |
Total increase (decrease) in net assets | (3,657,645) | (4,787,932) |
|
|
|
Net Assets | ||
Beginning of period | 12,607,790 | 17,395,722 |
End of period (including undistributed net investment income of $8,394 and undistributed net investment income of $6,093, respectively) | $ 8,950,145 | $ 12,607,790 |
See accompanying notes which are an integral part of the financial statements.
Annual Report
Financial Highlights - Equity-Income
Years ended January 31, | 2012 | 2011 | 2010 | 2009 | 2008 |
Selected Per-Share Data |
|
|
|
|
|
Net asset value, beginning of period | $ 45.57 | $ 37.93 | $ 27.48 | $ 52.25 | $ 59.33 |
Income from Investment Operations |
|
|
|
|
|
Net investment income (loss) B | .89 | .66 | .63 | 1.00 | 1.00 |
Net realized and unrealized gain (loss) | (2.80) | 7.72 | 10.51 | (23.96) | (3.86) |
Total from investment operations | (1.91) | 8.38 | 11.14 | (22.96) | (2.86) |
Distributions from net investment income | (.89) | (.74) | (.69) | (.96) | (1.02) |
Distributions from net realized gain | - | - | - | (.85) | (3.20) |
Total distributions | (.89) | (.74) | (.69) | (1.81) | (4.22) |
Net asset value, end of period | $ 42.77 | $ 45.57 | $ 37.93 | $ 27.48 | $ 52.25 |
Total Return A | (4.15)% | 22.32% | 41.02% | (45.16)% | (5.21)% |
Ratios to Average Net Assets C,E |
|
|
|
|
|
Expenses before reductions | .68% | .69% | .74% | .71% | .66% |
Expenses net of fee waivers, if any | .68% | .69% | .74% | .71% | .66% |
Expenses net of all reductions | .67% | .68% | .74% | .71% | .66% |
Net investment income (loss) | 2.04% | 1.62% | 1.87% | 2.38% | 1.68% |
Supplemental Data |
|
|
|
|
|
Net assets, end of period (in millions) | $ 6,844 | $ 10,049 | $ 15,061 | $ 15,070 | $ 28,115 |
Portfolio turnover rate D | 80% | 28% | 30% | 33% | 23% |
A Total returns would have been lower if certain expenses had not been reduced during the applicable periods shown.
B Calculated based on average shares outstanding during the period.
C Fees and expenses of any underlying Fidelity Central Funds are not included in the Fund's expense ratio. The Fund indirectly bears its proportionate share of the expenses of any underlying Fidelity Central Funds.
D Amount does not include the portfolio activity of any underlying Fidelity Central Funds.
E Expense ratios reflect operating expenses of the class. Expenses before reductions do not reflect amounts reimbursed by the investment adviser or reductions from brokerage service arrangements or reductions from other expense offset arrangements and do not represent the amount paid by the class during periods when reimbursements or reductions occur. Expenses net of fee waivers reflect expenses after reimbursement by the investment adviser but prior to reductions from brokerage service arrangements or other expense offset arrangements. Expenses net of all reductions represent the net expenses paid by the class.
See accompanying notes which are an integral part of the financial statements.
Annual Report
Financial Highlights - Class K
Years ended January 31, | 2012 | 2011 | 2010 | 2009 G |
Selected Per-Share Data |
|
|
|
|
Net asset value, beginning of period | $ 45.56 | $ 37.93 | $ 27.48 | $ 51.47 |
Income from Investment Operations |
|
|
|
|
Net investment income (loss) D | .95 | .72 | .72 | .61 |
Net realized and unrealized gain (loss) | (2.79) | 7.72 | 10.48 | (23.80) |
Total from investment operations | (1.84) | 8.44 | 11.20 | (23.19) |
Distributions from net investment income | (.96) | (.81) | (.75) | (.80) |
Net asset value, end of period | $ 42.76 | $ 45.56 | $ 37.93 | $ 27.48 |
Total Return B,C | (4.00)% | 22.50% | 41.30% | (45.45)% |
Ratios to Average Net Assets E,H |
|
|
|
|
Expenses before reductions | .53% | .53% | .54% | .53% A |
Expenses net of fee waivers, if any | .53% | .53% | .54% | .53% A |
Expenses net of all reductions | .52% | .53% | .54% | .53% A |
Net investment income (loss) | 2.19% | 1.78% | 2.07% | 2.89% A |
Supplemental Data |
|
|
|
|
Net assets, end of period (in millions) | $ 2,106 | $ 2,559 | $ 2,017 | $ 711 |
Portfolio turnover rate F | 80% | 28% | 30% | 33% |
A Annualized
B Total returns for periods of less than one year are not annualized.
C Total returns would have been lower if certain expenses had not been reduced during the applicable periods shown.
D Calculated based on average shares outstanding during the period.
E Fees and expenses of any underlying Fidelity Central Funds are not included in the Fund's expense ratio. The Fund indirectly bears its proportionate share of the expenses of any underlying Fidelity Central Funds.
F Amount does not include the portfolio activity of any underlying Fidelity Central Funds.
G For the period May 9, 2008 (commencement of sale of shares) to January 31, 2009.
H Expense ratios reflect operating expenses of the class. Expenses before reductions do not reflect amounts reimbursed by the investment adviser or reductions from brokerage service arrangements or reductions from other expense offset arrangements and do not represent the amount paid by the class during periods when reimbursements or reductions occur. Expense ratios before reductions for start-up periods may not be representative of longer-term operating periods. Expenses net of fee waivers reflect expenses after reimbursement by the investment adviser but prior to reductions from brokerage service arrangements or other expense offset arrangements. Expenses net of all reductions represent the net expenses paid by the class.
See accompanying notes which are an integral part of the financial statements.
Annual Report
Notes to Financial Statements
For the period ended January 31, 2012
(Amounts in thousands except percentages)
1. Organization.
Fidelity Equity-Income Fund (the Fund) is a fund of Fidelity Devonshire Trust (the Trust) and is authorized to issue an unlimited number of shares. The Trust is registered under the Investment Company Act of 1940, as amended (the 1940 Act), as an open-end management investment company organized as a Massachusetts business trust. The Fund offers Equity-Income shares and Class K shares, each of which has equal rights as to assets and voting privileges. Each class has exclusive voting rights with respect to matters that affect that class. Investment income, realized and unrealized capital gains and losses, the common expenses of the Fund, and certain fund-level expense reductions, if any, are allocated on a pro-rata basis to each class based on the relative net assets of each class to the total net assets of the Fund. Each class differs with respect to transfer agent fees incurred. Certain expense reductions may also differ by class. The Fund offered Class F shares during the period February 1, 2010 through December 15, 2010 and all outstanding shares were redeemed by December 15, 2010.
2. Investments in Fidelity Central Funds.
The Fund invests in Fidelity Central Funds, which are open-end investment companies available only to other investment companies and accounts managed by Fidelity Management & Research Company (FMR) and its affiliates. The Fund's Schedule of Investments lists each of the Fidelity Central Funds held as of period end, if any, as an investment of the Fund, but does not include the underlying holdings of each Fidelity Central Fund. As an Investing Fund, the Fund indirectly bears its proportionate share of the expenses of the underlying Fidelity Central Funds.
The Money Market Central Funds seek preservation of capital and current income and are managed by Fidelity Investments Money Management, Inc. (FIMM), an affiliate of FMR.
A complete unaudited list of holdings for each Fidelity Central Fund is available upon request or at the Securities and Exchange Commission (the SEC) web site at www.sec.gov. In addition, the financial statements of the Fidelity Central Funds, which are not covered by the Fund's Report of Independent Registered Public Accounting Firm, are available on the SEC web site or upon request.
3. Significant Accounting Policies.
The financial statements have been prepared in conformity with accounting principles generally accepted in the United States of America (GAAP), which require management to make certain estimates and assumptions at the date of the financial statements. Actual results could differ from those estimates. Subsequent events, if any, through the date that the financial statements were issued have been evaluated in the preparation of
Annual Report
3. Significant Accounting Policies - continued
the financial statements. The following summarizes the significant accounting policies of the Fund:
Security Valuation. Investments are valued as of 4:00 p.m. Eastern time on the last calendar day of the period. The Fund uses independent pricing services approved by the Board of Trustees to value its investments. When current market prices or quotations are not readily available or reliable, valuations may be determined in good faith in accordance with procedures adopted by the Board of Trustees. Factors used in determining value may include market or security specific events, changes in interest rates and credit quality. The frequency with which these procedures are used cannot be predicted and they may be utilized to a significant extent. The value used for net asset value (NAV) calculation under these procedures may differ from published prices for the same securities.
The Fund categorizes the inputs to valuation techniques used to value its investments into a disclosure hierarchy consisting of three levels as shown below:
Level 1 - quoted prices in active markets for identical investments
Level 2 - other significant observable inputs (including quoted prices for similar investments, interest rates, prepayment speeds, etc.)
Level 3 - unobservable inputs (including the Fund's own assumptions based on the best information available)
Changes in valuation techniques may result in transfers in or out of an assigned level within the disclosure hierarchy. The aggregate value of investments by input level, as of January 31, 2012, is included at the end of the Fund's Schedule of Investments. Valuation techniques used to value the Fund's investments by major category are as follows:
Equity securities, including restricted securities, for which market quotations are readily available, are valued at the last reported sale price or official closing price as reported by an independent pricing service on the primary market or exchange on which they are traded and are categorized as Level 1 in the hierarchy. In the event there were no sales during the day or closing prices are not available, securities are valued at the last quoted bid price or may be valued using the last available price and are generally categorized as Level 2 in the hierarchy. For foreign equity securities, when significant market or security specific events arise, comparisons to the valuation of American Depositary Receipts (ADRs), futures contracts, Exchange-traded funds (ETFs) and certain indexes as well as quoted prices for similar securities are used and are categorized as Level 2 in the hierarchy in these circumstances. Utilizing these techniques may result in transfers between Level 1 and Level 2. For restricted equity securities and private placements where
Annual Report
Notes to Financial Statements - continued
(Amounts in thousands except percentages)
3. Significant Accounting Policies - continued
Security Valuation - continued
observable inputs are limited, assumptions about market activity and risk are used and are categorized as Level 3 in the hierarchy.
Debt securities, including restricted securities, are valued based on evaluated prices received from independent pricing services or from dealers who make markets in such securities. For corporate bonds and floating rate loans, pricing services utilize matrix pricing which considers yield or price of bonds of comparable quality, coupon, maturity and type as well as dealer supplied prices and are generally categorized as Level 2 in the hierarchy. When independent prices are unavailable or unreliable, debt securities may be valued utilizing pricing matrices which consider similar factors that would be used by independent pricing services. These are generally categorized as Level 2 in the hierarchy but may be Level 3 depending on the circumstances.
Investments in open-end mutual funds, including the Fidelity Central Funds, are valued at their closing net asset value each business day and are categorized as Level 1 in the hierarchy.
New Accounting Pronouncements. In May 2011, the Financial Accounting Standards Board issued Accounting Standard Update No. 2011-04, Fair Value Measurement (Topic 820) - Amendments to Achieve Common Fair Value Measurement and Disclosure Requirements in U.S. GAAP and IFRSs. The update is effective during interim and annual periods beginning after December 15, 2011 and will result in additional disclosure for transfers between levels as well as expanded disclosure for securities categorized as Level 3 under the fair value hierarchy.
In December 2011, the Financial Accounting Standards Board issued Accounting Standard Update No. 2011-11, Disclosures about Offsetting Assets and Liabilities. The update creates new disclosure requirements requiring entities to disclose both gross and net information for derivatives and other financial instruments that are either offset in the Statement of Assets and Liabilities or subject to an enforceable master netting arrangement or similar agreement. The disclosure requirements are effective for interim and annual reporting periods beginning on or after January 1, 2013. Management is currently evaluating the impact of the update's adoption on the Fund's financial statement disclosures.
Foreign Currency. The Fund may use foreign currency contracts to facilitate transactions in foreign-denominated securities. Gains and losses from these transactions may arise from changes in the value of the foreign currency or if the counterparties do not perform under the contracts' terms.
Annual Report
3. Significant Accounting Policies - continued
Foreign Currency - continued
Foreign-denominated assets, including investment securities, and liabilities are translated into U.S. dollars at the exchange rate at period end. Purchases and sales of investment securities, income and dividends received and expenses denominated in foreign currencies are translated into U.S. dollars at the exchange rate in effect on the transaction date.
The effects of exchange rate fluctuations on investments are included with the net realized and unrealized gain (loss) on investment securities. Other foreign currency transactions resulting in realized and unrealized gain (loss) are disclosed separately.
Investment Transactions and Income. For financial reporting purposes, the Fund's investment holdings and NAV include trades executed through the end of the last business day of the period. The NAV per share for processing shareholder transactions is calculated as of the close of business of the New York Stock Exchange (NYSE), normally 4:00 p.m. Eastern time and includes trades executed through the end of the prior business day. Gains and losses on securities sold are determined on the basis of identified cost and may include proceeds received from litigation. Dividend income is recorded on the ex-dividend date, except for certain dividends from foreign securities where the ex-dividend date may have passed, which are recorded as soon as the Fund is informed of the ex-dividend date. Non-cash dividends included in dividend income, if any, are recorded at the fair market value of the securities received. Distributions received on securities that represent a return of capital or capital gain are recorded as a reduction of cost of investments and/or as a realized gain. The Fund estimates the components of distributions received that may be considered return of capital distributions or capital gain distributions. Interest income and distributions from the Fidelity Central Funds are accrued as earned. Interest income includes coupon interest and amortization of premium and accretion of discount on debt securities. Investment income is recorded net of foreign taxes withheld where recovery of such taxes is uncertain.
Expenses. Expenses directly attributable to a fund are charged to that fund. Expenses attributable to more than one fund are allocated among the respective funds on the basis of relative net assets or other appropriate methods. Expense estimates are accrued in the period to which they relate and adjustments are made when actual amounts are known.
Deferred Trustee Compensation. Under a Deferred Compensation Plan (the Plan), independent Trustees may elect to defer receipt of a portion of their annual compensation. Deferred amounts are invested in a cross-section of Fidelity funds, are marked-to-market and remain in the Fund until distributed in accordance with the Plan. The investment of deferred amounts and the offsetting payable to the Trustees are included in the accompanying Statement of Assets and Liabilities.
Annual Report
Notes to Financial Statements - continued
(Amounts in thousands except percentages)
3. Significant Accounting Policies - continued
Income Tax Information and Distributions to Shareholders. Each year, the Fund intends to qualify as a regulated investment company, including distributing substantially all of its taxable income and realized gains under Subchapter M of the Internal Revenue Code. As a result, no provision for income taxes is required. As of January 31, 2012, the Fund did not have any unrecognized tax benefits in the financial statements; nor is the Fund aware of any tax positions for which it is reasonably possible that the total amounts of unrecognized tax benefits will significantly change in the next twelve months. The Fund files a U.S. federal tax return, in addition to state and local tax returns as required. A fund's tax returns are subject to examination by the Internal Revenue Service (IRS) for a period of three fiscal years. State and local tax returns may be subject to examination for an additional fiscal year depending on the jurisdiction. Foreign taxes are provided for based on the Fund's understanding of the tax rules and rates that exist in the foreign markets in which it invests.
Distributions are declared and recorded on the ex-dividend date. Income dividends and capital gain distributions are declared separately for each class. Income and capital gain distributions are determined in accordance with income tax regulations, which may differ from GAAP.
Capital accounts within the financial statements are adjusted for permanent book-tax differences. These adjustments have no impact on net assets or the results of operations. Temporary book-tax differences will reverse in a subsequent period.
Book-tax differences are primarily due to futures transactions, foreign currency transactions, market discount, partnerships, equity-debt classifications, deferred trustees compensation, capital loss carryforwards and losses deferred due to wash sales and excise tax regulations.
The federal tax cost of investment securities and unrealized appreciation (depreciation) as of period end were as follows:
Gross unrealized appreciation | $ 1,072,962 |
Gross unrealized depreciation | (386,347) |
Net unrealized appreciation (depreciation) on securities and other investments | $ 686,615 |
|
|
Tax Cost | $ 8,260,208 |
The tax-based components of distributable earnings as of period end were as follows:
Undistributed ordinary income | $ 9,125 |
Capital loss carryforward | $ (1,768,083) |
Net unrealized appreciation (depreciation) | $ 686,699 |
Annual Report
3. Significant Accounting Policies - continued
Income Tax Information and Distributions to Shareholders - continued
Capital loss carryforwards are only available to offset future capital gains of the Fund to the extent provided by regulations and may be limited. Under the Regulated Investment Company Modernization Act of 2010 (the Act), the Fund is permitted to carry forward capital losses incurred in taxable years beginning after December 22, 2010 for an unlimited period and such capital losses are required to be used prior to any losses that expire. Capital loss carryforwards were as follows:
Fiscal year of expiration |
|
2018 | $ (1,768,083) |
The tax character of distributions paid was as follows:
| January 31, 2012 | January 31, 2011 |
Ordinary Income | $ 215,914 | $ 254,643 |
4. Operating Policies.
Restricted Securities. The Fund may invest in securities that are subject to legal or contractual restrictions on resale. These securities generally may be resold in transactions exempt from registration or to the public if the securities are registered. Disposal of these securities may involve time-consuming negotiations and expense, and prompt sale at an acceptable price may be difficult. Information regarding restricted securities is included at the end of the Fund's Schedule of Investments.
Loans and Other Direct Debt Instruments. The Fund may invest in loans and loan participations, trade claims or other receivables. These investments may include standby financing commitments, including revolving credit facilities, that obligate the Fund to supply additional cash to the borrower on demand. Loan participations involve a risk of insolvency of the lending bank or other financial intermediary. The Fund may be contractually obligated to receive approval from the agent bank and/or borrower prior to the sale of these investments.
5. Derivative Instruments.
Risk Exposures and the Use of Derivative Instruments. The Fund used derivative instruments (derivatives), including futures contracts, in order to meet its investment objectives. The strategy is to use derivatives to increase returns and to manage exposure to certain risks as defined below. The success of any strategy involving derivatives depends on analysis of numerous economic factors, and if the strategies for investment do not work as intended, the Fund may not achieve its objectives.
Annual Report
Notes to Financial Statements - continued
(Amounts in thousands except percentages)
5. Derivative Instruments - continued
Risk Exposures and the Use of Derivative Instruments - continued
The Fund's use of derivatives increased or decreased its exposure to the following risk:
Equity Risk | Equity risk relates to the fluctuations in the value of financial instruments as a result of changes in market prices (other than those arising from interest rate risk or foreign exchange risk), whether caused by factors specific to an individual investment, its issuer, or all factors affecting all instruments traded in a market or market segment. |
The Fund is also exposed to additional risks from investing in derivatives, such as liquidity risk and counterparty credit risk. Liquidity risk is the risk that the Fund will be unable to close out the derivative in the open market in a timely manner. Counterparty credit risk is the risk that the counterparty will not be able to fulfill its obligation to the Fund. Counterparty credit risk related to exchange-traded futures contracts is minimal because of the protection provided by the exchange on which they trade. Derivatives involve, to varying degrees, risk of loss in excess of the amounts recognized in the Statement of Assets and Liabilities.
Futures Contracts. A futures contract is an agreement between two parties to buy or sell a specified underlying instrument for a fixed price at a specified future date. The Fund used futures contracts to manage its exposure to the stock market.
Upon entering into a futures contract, a fund is required to deposit either cash or securities (initial margin) with a clearing broker in an amount equal to a certain percentage of the face value of the contract. Futures contracts are marked-to-market daily and subsequent payments (variation margin) are made or received by a fund depending on the daily fluctuations in the value of the futures contracts and are recorded as unrealized appreciation or (depreciation). This receivable and/or payable is included in daily variation margin on futures contracts in the Statement of Assets and Liabilities. Realized gain or (loss) is recorded upon the expiration or closing of a futures contract.
The underlying face amount at value of open futures contracts at period end, if any, is shown in the Schedule of Investments under the caption "Futures Contracts." This amount reflects each contract's exposure to the underlying instrument at period end.
During the period the Fund recognized net realized gain (loss) of $15,704 related to its investment in futures contracts. This amount is included in the Statement of Operations.
6. Purchases and Sales of Investments.
Purchases and sales of securities, other than short-term securities, aggregated $8,594,207 and $11,516,078, respectively.
Annual Report
7. Fees and Other Transactions with Affiliates.
Management Fee. FMR and its affiliates provide the Fund with investment management related services for which the Fund pays a monthly management fee. The management fee is the sum of an individual fund fee rate that is based on an annual rate of .20% of the Fund's average net assets and an annualized group fee rate that averaged .26% during the period. The group fee rate is based upon the average net assets of all the mutual funds advised by FMR. The group fee rate decreases as assets under management increase and increases as assets under management decrease. For the period, the total annual management fee rate was .46% of the Fund's average net assets.
Transfer Agent Fees. Fidelity Investments Institutional Operations Company, Inc. (FIIOC), an affiliate of FMR, is the transfer, dividend disbursing and shareholder servicing agent for each class of the Fund. FIIOC receives account fees and asset-based fees that vary according to the account size and type of account of the shareholders of Equity-Income. FIIOC receives an asset-based fee of Class K's average net assets. FIIOC pays for typesetting, printing and mailing of shareholder reports, except proxy statements. For the period, transfer agent fees for each class were as follows:
| Amount | % of |
Equity-Income | $ 16,928 | .20 |
Class K | 1,177 | .05 |
| $ 18,105 |
|
Accounting and Security Lending Fees. Fidelity Service Company, Inc. (FSC), an affiliate of FMR, maintains the Fund's accounting records. The accounting fee is based on the level of average net assets for each month. Under a separate contract, FSC administers the security lending program. The security lending fee is based on the number and duration of lending transactions.
Brokerage Commissions. The Fund placed a portion of its portfolio transactions with brokerage firms which are affiliates of the investment adviser. The commissions paid to these affiliated firms were $280 for the period.
Interfund Lending Program. Pursuant to an Exemptive Order issued by the SEC, the Fund, along with other registered investment companies having management contracts with FMR, may participate in an interfund lending program. This program provides an alternative credit facility allowing the funds to borrow from, or lend money to, other participating affiliated funds. At period end, there were no interfund loans outstanding. The Fund's activity in this program during the period for which loans were outstanding
Annual Report
Notes to Financial Statements - continued
(Amounts in thousands except percentages)
7. Fees and Other Transactions with Affiliates - continued
Interfund Lending Program - continued
was as follows:
Borrower or Lender | Average Loan | Weighted Average Interest Rate | Interest |
Borrower | $ 41,105 | .32% | $ 15 |
8. Committed Line of Credit.
The Fund participates with other funds managed by FMR or an affiliate in a $4.0 billion credit facility (the "line of credit") to be utilized for temporary or emergency purposes to fund shareholder redemptions or for other short-term liquidity purposes. The Fund has agreed to pay commitment fees on its pro-rata portion of the line of credit, which amounted to $33 and is reflected in Miscellaneous expenses on the Statement of Operations. During the period, there were no borrowings on this line of credit.
9. Security Lending.
The Fund lends portfolio securities through a lending agent from time to time in order to earn additional income. For equity securities, a lending agent is used and may loan securities to certain qualified borrowers, including Fidelity Capital Markets (FCM), a broker-dealer affiliated with the Fund. On the settlement date of the loan, the Fund receives collateral (in the form of U.S. Treasury obligations, letters of credit and/or cash) against the loaned securities and maintains collateral in an amount not less than 100% of the market value of the loaned securities during the period of the loan. The market value of the loaned securities is determined at the close of business of the Fund and any additional required collateral is delivered to the Fund on the next business day. If the borrower defaults on its obligation to return the securities loaned because of insolvency or other reasons, a fund could experience delays and costs in recovering the securities loaned or in gaining access to the collateral. Any cash collateral received is invested in the Fidelity Securities Lending Cash Central Fund. The value of loaned securities and cash collateral at period end are disclosed on the Fund's Statement of Assets and Liabilities. Security lending income represents the income earned on investing cash collateral, less rebates paid to borrowers and any lending agent fees associated with the loan, plus any premium payments received for lending certain types of securities. Security lending income is presented in the Statement of Operations as a component of income from Fidelity Central Funds. Total security lending income during the period amounted to $2,544. During the period, there were no securities loaned to FCM.
Annual Report
10. Expense Reductions.
Many of the brokers with whom FMR places trades on behalf of the Fund provided services to the Fund in addition to trade execution. These services included payments of certain expenses on behalf of the Fund totaling $831 for the period. In addition, through arrangements with the Fund's custodian, credits realized as a result of uninvested cash balances were used to reduce the Fund's expenses. During the period, these credits reduced the Fund's custody expenses by $1.
11. Distributions to Shareholders.
Distributions to shareholders of each class were as follows:
Years ended January 31, | 2012 | 2011 A |
From net investment income |
|
|
Equity-Income | $ 168,293 | $ 208,206 |
Class K | 47,621 | 42,109 |
Class F | - | 4,328 |
Total | $ 215,914 | $ 254,643 |
A All Class F shares were redeemed on December 15, 2010.
12. Share Transactions.
Transactions for each class of shares were as follows:
| Shares | Dollars | ||
Years ended January 31, | 2012 | 2011 A | 2012 | 2011 A |
Equity-Income |
|
|
|
|
Shares sold | 17,424 | 31,836 | $ 768,861 | $ 1,308,081 |
Reinvestment of distributions | 3,805 | 4,916 | 161,431 | 201,463 |
Shares redeemed | (81,714) | (213,346) | (3,452,168) | (8,575,845) |
Net increase (decrease) | (60,485) | (176,594) | $ (2,521,876) | $ (7,066,301) |
Class K |
|
|
|
|
Shares sold | 20,736 | 18,004 | $ 882,621 | $ 725,433 |
Reinvestment of distributions | 1,117 | 1,025 | 47,621 | 42,109 |
Shares redeemed | (28,765) | (16,045) | (1,209,236) | (642,451) |
Net increase (decrease) | (6,912) | 2,984 | $ (278,994) | $ 125,091 |
Class F |
|
|
|
|
Shares sold | - | 8,722 | $ - | $ 346,459 |
Reinvestment of distributions | - | 107 | - | 4,328 |
Shares redeemed | - | (17,202) | - | (691,301) |
Net increase (decrease) | - | (8,373) | $ - | $ (340,514) |
A All Class F shares were redeemed on December 15, 2010.
Annual Report
Notes to Financial Statements - continued
(Amounts in thousands except percentages)
13. Other.
The Fund's organizational documents provide former and current trustees and officers with a limited indemnification against liabilities arising in connection with the performance of their duties to the Fund. In the normal course of business, the Fund may also enter into contracts that provide general indemnifications. The Fund's maximum exposure under these arrangements is unknown as this would be dependent on future claims that may be made against the Fund. The risk of material loss from such claims is considered remote.
Annual Report
Report of Independent Registered Public Accounting Firm
To the Trustees of Fidelity Devonshire Trust and the Shareholders of Fidelity Equity-Income Fund:
In our opinion, the accompanying statement of assets and liabilities, including the schedule of investments, and the related statements of operations and of changes in net assets and the financial highlights present fairly, in all material respects, the financial position of Fidelity Equity-Income Fund (a fund of Fidelity Devonshire Trust) at January 31, 2012, the results of its operations for the year then ended, the changes in its net assets for each of the two years in the period then ended and the financial highlights for each of the periods indicated, in conformity with accounting principles generally accepted in the United States of America. These financial statements and financial highlights (hereafter referred to as "financial statements") are the responsibility of the Fidelity Equity-Income Fund's management. Our responsibility is to express an opinion on these financial statements based on our audits. We conducted our audits of these financial statements in accordance with the standards of the Public Company Accounting Oversight Board (United States). Those standards require that we plan and perform the audit to obtain reasonable assurance about whether the financial statements are free of material misstatement. An audit includes examining, on a test basis, evidence supporting the amounts and disclosures in the financial statements, assessing the accounting principles used and significant estimates made by management, and evaluating the overall financial statement presentation. We believe that our audits, which included confirmation of securities at January 31, 2012 by correspondence with the custodian, agent banks and brokers, provide a reasonable basis for our opinion.
/s/ PricewaterhouseCoopers LLP
PricewaterhouseCoopers LLP
Boston, Massachusetts
March 13, 2012
Annual Report
Trustees and Officers
The Trustees, Members of the Advisory Board, and executive officers of the trust and fund, as applicable, are listed below. The Board of Trustees governs the fund and is responsible for protecting the interests of shareholders. The Trustees are experienced executives who meet periodically throughout the year to oversee the fund's activities, review contractual arrangements with companies that provide services to the fund, oversee management of the risks associated with such activities and contractual arrangements, and review the fund's performance. Except for James C. Curvey, each of the Trustees oversees 226 funds advised by FMR or an affiliate. Mr. Curvey oversees 430 funds advised by FMR or an affiliate.
The Trustees hold office without limit in time except that (a) any Trustee may resign; (b) any Trustee may be removed by written instrument, signed by at least two-thirds of the number of Trustees prior to such removal; (c) any Trustee who requests to be retired or who has become incapacitated by illness or injury may be retired by written instrument signed by a majority of the other Trustees; and (d) any Trustee may be removed at any special meeting of shareholders by a two-thirds vote of the outstanding voting securities of the trust. Each Trustee who is not an interested person (as defined in the 1940 Act) (Independent Trustee), shall retire not later than the last day of the calendar year in which his or her 75th birthday occurs. The Independent Trustees may waive this mandatory retirement age policy with respect to individual Trustees. The executive officers and Advisory Board Members hold office without limit in time, except that any officer and Advisory Board Member may resign or may be removed by a vote of a majority of the Trustees at any regular meeting or any special meeting of the Trustees. Except as indicated, each individual has held the office shown or other offices in the same company for the past five years.
Experience, Skills, Attributes, and Qualifications of the Fund's Trustees. The Governance and Nominating Committee has adopted a statement of policy that describes the experience, qualifications, attributes, and skills that are necessary and desirable for potential Independent Trustee candidates (Statement of Policy). The Board believes that each Trustee satisfied at the time he or she was initially elected or appointed a Trustee, and continues to satisfy, the standards contemplated by the Statement of Policy. The Governance and Nominating Committee also engages professional search firms to help identify potential Independent Trustee candidates who have the experience, qualifications, attributes, and skills consistent with the Statement of Policy. From time to time, additional criteria based on the composition and skills of the current Independent Trustees, as well as experience or skills that may be appropriate in light of future changes to board composition, business conditions, and regulatory or other developments, have also been considered by the professional search firms and the Governance and Nominating Committee. In addition, the Board takes into account the Trustees' commitment and participation in Board and committee meetings, as well as their leadership of standing and ad hoc committees throughout their tenure.
In determining that a particular Trustee was and continues to be qualified to serve as a Trustee, the Board has considered a variety of criteria, none of which, in isolation, was controlling. The Board believes that, collectively, the Trustees have balanced and diverse experience, qualifications, attributes, and skills, which allow the Board to operate effectively in governing the fund and protecting the interests of shareholders. Information about the specific experience, skills, attributes, and qualifications of each Trustee, which in each case led to the Board's conclusion that the Trustee should serve (or continue to serve) as a trustee of the fund, is provided below.
Annual Report
Board Structure and Oversight Function. James C. Curvey is an interested person (as defined in the 1940 Act) and currently serves as Acting Chairman. The Trustees have determined that an interested Chairman is appropriate and benefits shareholders because an interested Chairman has a personal and professional stake in the quality and continuity of services provided to the fund. Independent Trustees exercise their informed business judgment to appoint an individual of their choosing to serve as Chairman, regardless of whether the Trustee happens to be independent or a member of management. The Independent Trustees have determined that they can act independently and effectively without having an Independent Trustee serve as Chairman and that a key structural component for assuring that they are in a position to do so is for the Independent Trustees to constitute a substantial majority for the Board. The Independent Trustees also regularly meet in executive session. Ned C. Lautenbach serves as Chairman of the Independent Trustees and as such (i) acts as a liaison between the Independent Trustees and management with respect to matters important to the Independent Trustees and (ii) with management prepares agendas for Board meetings.
Fidelity funds are overseen by different Boards of Trustees. The fund's Board oversees Fidelity's equity and high income funds and another Board oversees Fidelity's investment-grade bond, money market, and asset allocation funds. The asset allocation funds may invest in Fidelity funds overseen by the fund's Board. The use of separate Boards, each with its own committee structure, allows the Trustees of each group of Fidelity funds to focus on the unique issues of the funds they oversee, including common research, investment, and operational issues. On occasion, the separate Boards establish joint committees to address issues of overlapping consequences for the Fidelity funds overseen by each Board.
The Trustees operate using a system of committees to facilitate the timely and efficient consideration of all matters of importance to the Trustees, the fund, and fund shareholders and to facilitate compliance with legal and regulatory requirements and oversight of the fund's activities and associated risks. The Board, acting through its committees, has charged FMR and its affiliates with (i) identifying events or circumstances the occurrence of which could have demonstrably adverse effects on the fund's business and/or reputation; (ii) implementing processes and controls to lessen the possibility that such events or circumstances occur or to mitigate the effects of such events or circumstances if they do occur; and (iii) creating and maintaining a system designed to evaluate continuously business and market conditions in order to facilitate the identification and implementation processes described in (i) and (ii) above. Because the day-to-day operations and activities of the fund are carried out by or through FMR, its affiliates and other service providers, the fund's exposure to risks is mitigated but not eliminated by the processes overseen by the Trustees. While each of the Board's committees has responsibility for overseeing different aspects of the fund's activities, oversight is exercised primarily through the Operations, Audit, and Compliance Committees. In addition, the Independent Trustees have worked with FMR to enhance the Board's oversight of investment and financial risks, legal and regulatory risks, technology risks, and operational risks, including the development of additional risk reporting to the Board. For example, a working group comprised of Independent Trustees and FMR has worked and continues to work to review the Fidelity funds' valuation-related activities, reporting and risk management. Appropriate personnel, including but not limited to the fund's Chief Compliance Officer (CCO), FMR's internal auditor, the independent accountants, the fund's Treasurer and portfolio management personnel, make periodic reports to the Board's committees, as appropriate, including an annual review of FMR's risk management program for the Fidelity funds. The responsibilities of each standing committee, including their oversight responsibilities, are described further under "Standing Committees of the Fund's Trustees."
Annual Report
Trustees and Officers - continued
The fund's Statement of Additional Information (SAI) includes more information about the Trustees. To request a free copy, call Fidelity at 1-800-544-8544.
Interested Trustees*:
Correspondence intended for each Trustee who is an interested person may be sent to Fidelity Investments, 82 Devonshire Street, Boston, Massachusetts 02109.
Name, Age; Principal Occupations and Other Relevant Experience+ | |
James C. Curvey (76) | |
| Year of Election or Appointment: 2007 Mr. Curvey is Trustee and Acting Chairman of the Board of Trustees of certain Trusts. Mr. Curvey also serves as Trustee (2007-present) of other investment companies advised by FMR. Mr. Curvey is a Director of Fidelity Investments Money Management, Inc. (2009-present), Director of Fidelity Research & Analysis Co. (2009-present) and Director of FMR and FMR Co., Inc. (2007-present). Mr. Curvey is also Vice Chairman (2007-present) and Director of FMR LLC. In addition, Mr. Curvey serves as an Overseer for the Boston Symphony Orchestra and a member of the Trustees of Villanova University. Previously, Mr. Curvey was the Vice Chairman (2006-2007) and Director (2000-2007) of FMR Corp. |
Ronald P. O'Hanley (54) | |
| Year of Election or Appointment: 2011 Mr. O'Hanley is Director of FMR Co., Inc. (2010-present), Director of Fidelity Investments Money Management, Inc. (2010-present), Director of Fidelity Research & Analysis Company (2010-present), President of Fidelity Asset Management and Corporate Services and a member of Fidelity's Executive Committee (2010-present). Previously, Mr. O'Hanley served as President and Chief Executive Officer of BNY Mellon Asset Management (2007-2010). Mr. O'Hanley also served as Vice Chairman of Bank New York Mellon Corp. and a member of that firm's Executive Committee. Prior to the 2007 merger of The Bank of New York and Mellon Financial Corporation, he was Vice Chairman of Mellon Financial Corporation and President and Chief Executive Officer of Mellon Asset Management. He joined Mellon in February 1997. Mr. O'Hanley currently serves as Chairman of the Boston Public Library Foundation Board of Directors and sits on the Board of Directors of Beth Israel Deaconess Medical Center, the Board of Trustees of the Marine Biological Laboratory and the Advisory Board of the Maxwell School of Citizenship and Public Administration at Syracuse University. Mr. O'Hanley also chairs the Council on Asset Management for the Financial Services Roundtable and is a member of the Board of Directors of Institutional Investor's U.S. Institute. |
* Trustees have been determined to be an "Interested Trustees" by virtue of, among other things, their affiliation with the trust or various entities under common control with FMR.
+ The information above includes each Trustee's principal occupation during the last five years and other information relating to the experience, attributes, and skills relevant to each Trustee's qualifications to serve as a Trustee, which led to the conclusion that each Trustee should serve as a Trustee for the fund.
Annual Report
Trustees and Officers - continued
Independent Trustees:
Correspondence intended for each Independent Trustee (that is, the Trustees other than the Interested Trustees) may be sent to Fidelity Investments, P.O. Box 55235, Boston, Massachusetts 02205-5235.
Name, Age; Principal Occupations and Other Relevant Experience+ | |
Dennis J. Dirks (63) | |
| Year of Election or Appointment: 2005 Prior to his retirement in May 2003, Mr. Dirks was Chief Operating Officer and a member of the Board of The Depository Trust & Clearing Corporation (DTCC). He also served as President, Chief Operating Officer, and Board member of The Depository Trust Company (DTC) and President and Board member of the National Securities Clearing Corporation (NSCC). In addition, Mr. Dirks served as Chief Executive Officer and Board member of the Government Securities Clearing Corporation, Chief Executive Officer and Board member of the Mortgage-Backed Securities Clearing Corporation, as a Trustee and a member of the Finance Committee of Manhattan College (2005-2008), and as a Trustee and a member of the Finance Committee of AHRC of Nassau County (2006-2008). Mr. Dirks is a member of the Independent Directors Council (IDC) Governing Council (2010-present) and Board of Directors for The Brookville Center for Children's Services, Inc. (2009-present). |
Alan J. Lacy (58) | |
| Year of Election or Appointment: 2008 Mr. Lacy serves as Senior Adviser (2007-present) of Oak Hill Capital Partners, L.P. (private equity). Mr. Lacy also served as Chief Executive Officer (2000-2005) and Vice Chairman (2005-2006) of Sears Holdings Corporation and Sears, Roebuck and Co. (retail). In addition, Mr. Lacy serves as a member of the Board of Directors of Dave & Buster's, Inc. (restaurant and entertainment complexes, 2010-present), The Hillman Companies, Inc. (hardware wholesalers, 2010-present), and Bristol-Myers Squibb Company (global pharmaceuticals, 2007-present). Mr. Lacy is a member of the Board of Trustees of The National Parks Conservation Association (2006-present). Previously, Mr. Lacy served as Chairman of the Board of Trustees of the National Parks Conservation Association (2008-2011) and as a member of the Board of Directors for the Western Union Company (global money transfer, 2006-2011). |
Ned C. Lautenbach (67) | |
| Year of Election or Appointment: 2000 Mr. Lautenbach is Chairman of the Independent Trustees of the Equity and High Income Funds (2006-present). Mr. Lautenbach currently serves as the Lead Director of the Eaton Corporation Board of Directors (diversified industrial, 1997-present). Mr. Lautenbach is also a member of the Board of Directors of the Philharmonic Center for the Arts in Naples, Florida (1999-present); a member of the Board of Trustees of Fairfield University (2005-present); and a member of the Council on Foreign Relations (1994-present). Previously, Mr. Lautenbach was a Partner/Advisory Partner at Clayton, Dubilier & Rice, LLC (private equity investment, 1998-2010), as well as a Director of Sony Corporation (2006-2007). |
Joseph Mauriello (67) | |
| Year of Election or Appointment: 2008 Prior to his retirement in January 2006, Mr. Mauriello served in numerous senior management positions including Deputy Chairman and Chief Operating Officer (2004-2005), and Vice Chairman of Financial Services (2002-2004) of KPMG LLP US (professional services, 1965-2005). Mr. Mauriello currently serves as a member of the Board of Directors of XL Group plc. (global insurance and re-insurance, 2006-present) and of Arcadia Resources Inc. (health care services and products, 2007-present). Previously, Mr. Mauriello served as a Director of the Hamilton Funds of the Bank of New York (2006-2007). |
Robert W. Selander (61) | |
| Year of Election or Appointment: 2011 Previously, Mr. Selander served as a Member of the Advisory Board of Fidelity's Equity and High Income Funds (2011), Executive Vice Chairman (2010), Chief Executive Officer (2009-2010), and President and Chief Executive Officer (1997-2009) of Mastercard, Inc. |
Cornelia M. Small (67) | |
| Year of Election or Appointment: 2005 Ms. Small is a member of the Board of Directors of the Teagle Foundation (2009-present). Ms. Small is also a member of the Investment Committee, and Chair (2008-present) and a member of the Board of Trustees of Smith College. In addition, Ms. Small serves on the Investment Committee of the Berkshire Taconic Community Foundation (2008-present). Previously, Ms. Small served as Chairperson of the Investment Committee (2002-2008) of Smith College. In addition, Ms. Small served as Chief Investment Officer, Director of Global Equity Investments, and a member of the Board of Directors of Scudder, Stevens & Clark and Scudder Kemper Investments. |
William S. Stavropoulos (72) | |
| Year of Election or Appointment: 2002 Mr. Stavropoulos is Vice Chairman of the Independent Trustees of the Equity and High Income Funds (2006-present). Mr. Stavropoulos serves as President and Founder of the Michigan Baseball Foundation, the Great Lakes Loons (2007-present). Mr. Stavropoulos is Chairman Emeritus of the Board of Directors of The Dow Chemical Company, where he previously served in numerous senior management positions, including President, CEO (1995-2000; 2002-2004), Chairman of the Executive Committee (2000-2006), and as a member of the Board of Directors (1990-2006). Currently, Mr. Stavropoulos is Chairman of Univar (global distributor of commodity and specialty chemicals, 2010-present), a Director of Teradata Corporation (data warehousing and technology solutions, 2008-present), Chemical Financial Corporation, Maersk Inc. (industrial conglomerate), Tyco International, Inc. (multinational manufacturing and services, 2007-present), and a member of the Advisory Board for Metalmark Capital (private equity investment, 2005-present). Mr. Stavropoulos is a special advisor to Clayton, Dubilier & Rice, LLC (private equity investment). In addition, Mr. Stavropoulos is a member of the University of Notre Dame Advisory Council for the College of Science. |
David M. Thomas (62) | |
| Year of Election or Appointment: 2008 Previously, Mr. Thomas served as Executive Chairman (2005-2006) and Chairman and Chief Executive Officer (2000-2005) of IMS Health, Inc. (pharmaceutical and healthcare information solutions). In addition, Mr. Thomas serves as a member of the Board of Directors of Fortune Brands, Inc. (consumer products), and Interpublic Group of Companies, Inc. (marketing communication, 2004-present). |
Michael E. Wiley (61) | |
| Year of Election or Appointment: 2008 Mr. Wiley also serves as a Director of Asia Pacific Exploration Consolidated (international oil and gas exploration and production, 2008-present). Mr. Wiley serves as a Director of Tesoro Corporation (independent oil refiner and marketer, 2005-present), and a Director of Bill Barrett Corporation (exploration and production, 2005-present). In addition, Mr. Wiley also serves as a Director of Post Oak Bank (privately-held bank, 2004-present). Previously, Mr. Wiley served as a member of the Board of Trustees of the University of Tulsa (2000-2006; 2007-2010), as a Senior Energy Advisor of Katzenbach Partners, LLC (consulting, 2006-2007), as an Advisory Director of Riverstone Holdings (private investment), Chairman, President, and CEO of Baker Hughes, Inc. (oilfield services, 2000-2004), and as Director of Spinnaker Exploration Company (exploration and production, 2001-2005). |
Annual Report
+ The information above includes each Trustee's principal occupation during the last five years and other information relating to the experience, attributes, and skills relevant to each Trustee's qualifications to serve as a Trustee, which led to the conclusion that each Trustee should serve as a Trustee for the fund.
Advisory Board Members and Executive Officers:
Correspondence intended for each executive officer, Edward C. Johnson 3d, and Peter S. Lynch may be sent to Fidelity Investments, 82 Devonshire Street, Boston, Massachusetts 02109.
Name, Age; Principal Occupation | |
Edward C. Johnson 3d (81) | |
| Year of Election or Appointment: 2011 Member of the Advisory Board of Fidelity's Equity and High Income Funds. Mr. Johnson serves as Chief Executive Officer, Chairman, and a Director of FMR LLC, and also serves as Chairman and Director of FIL Limited. Previously, Mr. Johnson served as a Trustee and Chairman of the Board of certain Fidelity Trusts, Chairman and a Director of FMR, Chairman and a Director of FMR Co., Inc., and President of FMR LLC (2006-2007). |
Peter S. Lynch (68) | |
| Year of Election or Appointment: 2003 Member of the Advisory Board of Fidelity's Equity and High Income Funds. Mr. Lynch is Vice Chairman and a Director of FMR and FMR Co., Inc. In addition, Mr. Lynch serves as a Trustee of Boston College and as the Chairman of the Inner-City Scholarship Fund. Previously, Mr. Lynch served on the Special Olympics International Board of Directors (1997-2006). |
Kenneth B. Robins (42) | |
| Year of Election or Appointment: 2008 President and Treasurer of Fidelity's Equity and High Income Funds. Mr. Robins also serves as President and Treasurer (2010-present) and Assistant Treasurer (2009-present) of other Fidelity funds and is an employee of Fidelity Investments (2004-present). Previously, Mr. Robins served as Deputy Treasurer of the Fidelity funds (2005-2008) and Treasurer and Chief Financial Officer of The North Carolina Capital Management Trust: Cash and Term Portfolios (2006-2008). |
Bruce T. Herring (46) | |
| Year of Election or Appointment: 2006 Vice President of certain Equity Funds. Mr. Herring also serves as President of Fidelity Research & Analysis Company (2010-present), Chief Investment Officer and Director of Fidelity Management & Research (U.K.) Inc. (2010-present) and Group Chief Investment Officer of FMR. Previously, Mr. Herring served as Vice President (2005-2006) and Senior Vice President (2006-2007) of Fidelity Management & Research Company, Vice President of FMR Co., Inc. (2001-2007) and as a portfolio manager for Fidelity U.S. Equity Funds. |
Brian B. Hogan (47) | |
| Year of Election or Appointment: 2009 Vice President of Equity and High Income Funds. Mr. Hogan also serves as President of FMR's Equity Division (2009-present). Previously, Mr. Hogan served as Senior Vice President, Equity Research of FMR (2006-2009) and as a portfolio manager. |
Scott C. Goebel (44) | |
| Year of Election or Appointment: 2008 Secretary and Chief Legal Officer (CLO) of the Fidelity funds. Mr. Goebel also serves as Secretary of Fidelity Investments Money Management, Inc. (FIMM) (2010-present) and Fidelity Research and Analysis Company (FRAC) (2010-present); Secretary and CLO of The North Carolina Capital Management Trust: Cash and Term Portfolios (2008-present); General Counsel, Secretary, and Senior Vice President of FMR (2008-present) and FMR Co., Inc. (2008-present); employed by FMR LLC or an affiliate (2001-present); Chief Legal Officer of Fidelity Management & Research (Hong Kong) Limited (2008-present) and Assistant Secretary of Fidelity Management & Research (Japan) Inc. (2008-present), and Fidelity Management & Research (U.K.) Inc. (2008-present). Previously, Mr. Goebel served as Assistant Secretary of FIMM (2008-2010), FRAC (2008-2010), and the Funds (2007-2008) and as Vice President and Secretary of Fidelity Distributors Corporation (FDC) (2005-2007). |
William C. Coffey (42) | |
| Year of Election or Appointment: 2009 Assistant Secretary of Fidelity's Equity and High Income Funds. Mr. Coffey also serves as Senior Vice President and Deputy General Counsel of FMR LLC (2010-present), and is an employee of Fidelity Investments. Previously, Mr. Coffey served as Vice President and Associate General Counsel of FMR LLC (2005-2009). |
Holly C. Laurent (57) | |
| Year of Election or Appointment: 2008 Anti-Money Laundering (AML) Officer of the Fidelity funds. Ms. Laurent also serves as AML Officer of The North Carolina Capital Management Trust: Cash and Term Portfolios (2008-present) and is an employee of Fidelity Investments. Previously, Ms. Laurent was Senior Vice President and Head of Legal for Fidelity Business Services India Pvt. Ltd. (2006-2008), and Senior Vice President, Deputy General Counsel and Group Head for FMR LLC (2005-2006). |
Christine Reynolds (53) | |
| Year of Election or Appointment: 2008 Chief Financial Officer of the Fidelity funds. Ms. Reynolds became President of Fidelity Pricing and Cash Management Services (FPCMS) in August 2008. Ms. Reynolds served as Chief Operating Officer of FPCMS (2007-2008). Previously, Ms. Reynolds served as President, Treasurer, and Anti-Money Laundering officer of the Fidelity funds (2004-2007). |
Kenneth A. Rathgeber (64) | |
| Year of Election or Appointment: 2004 Chief Compliance Officer of Fidelity's Equity and High Income Funds. Mr. Rathgeber is Chief Compliance Officer of Fidelity Management & Research (Hong Kong) Limited (2008-present), Fidelity Management & Research (Japan) Inc. (2008-present), FMR (2005-present), FMR Co., Inc. (2005-present), Fidelity Management & Research (U.K.) Inc. (2005-present), Fidelity Research & Analysis Company (2005-present), Fidelity Investments Money Management, Inc. (2005-present), Pyramis Global Advisors, LLC (2005-present), and Strategic Advisers, Inc. (2005-present). |
Joseph F. Zambello (54) | |
| Year of Election or Appointment: 2011 Deputy Treasurer of the Fidelity funds. Mr. Zambello is an employee of Fidelity Investments. Previously, Mr. Zambello served as Vice President of FMR's Program Management Group (2009-2011) and Vice President of the Transfer Agent Oversight Group (2005-2009). |
Adrien E. Deberghes (44) | |
| Year of Election or Appointment: 2008 Deputy Treasurer of Fidelity's Equity and High Income Funds. Mr. Deberghes also serves as Vice President and Assistant Treasurer of Fidelity Rutland Square Trust II and Fidelity Commonwealth Trust II (2011-present), Assistant Treasurer of other Fidelity funds (2010-present), and is an employee of Fidelity Investments (2008-present). Previously, Mr. Deberghes served as Senior Vice President of Mutual Fund Administration at State Street Corporation (2007-2008), Senior Director of Mutual Fund Administration at Investors Bank & Trust (2005-2007), and Director of Finance for Dunkin' Brands (2000-2005). |
Stephanie J. Dorsey (42) | |
| Year of Election or Appointment: 2010 Assistant Treasurer of Fidelity's Equity and High Income Funds. Ms. Dorsey also serves as Deputy Treasurer of other Fidelity funds (2008-present) and is an employee of Fidelity Investments (2008-present). Previously, Ms. Dorsey served as Treasurer (2004-2008) of the JPMorgan Mutual Funds and Vice President (2004-2008) of JPMorgan Chase Bank. |
John R. Hebble (53) | |
| Year of Election or Appointment: 2009 Assistant Treasurer of Fidelity's Equity and High Income Funds. Mr. Hebble also serves as President (2011-present), Treasurer, and Chief Financial Officer of The North Carolina Capital Management Trust: Cash and Term Portfolios (2008-present), President and Treasurer of other Fidelity funds (2008-present) and is an employee of Fidelity Investments. |
Gary W. Ryan (53) | |
| Year of Election or Appointment: 2005 Assistant Treasurer of the Fidelity funds. Mr. Ryan is an employee of Fidelity Investments. Previously, Mr. Ryan served as Vice President of Fund Reporting in Fidelity Pricing and Cash Management Services (FPCMS) (1999-2005). |
Jonathan Davis (43) | |
| Year of Election or Appointment: 2010 Assistant Treasurer of the Fidelity funds. Mr. Davis is also Assistant Treasurer of Fidelity Rutland Square Trust II and Fidelity Commonwealth Trust II. Mr. Davis is an employee of Fidelity Investments. Previously, Mr. Davis served as Vice President and Associate General Counsel of FMR LLC (2003-2010). |
Annual Report
Distributions (Unaudited)
A total of 0.02% of the dividends distributed during the fiscal year was derived from interest on U.S. Government securities which is generally exempt from state income tax.
Equity-Income designates 92%, 91%, 91% and 91% of the dividends distributed in April, July, October and December 2011, respectively during the fiscal year as qualifying for the dividends-received deduction for corporate shareholders.
Equity-Income designates 100% of the dividends distributed during the fiscal year as amounts which may be taken into account as a dividend for the purposes of the maximum rate under section 1(h)(11) of the Internal Revenue Code.
The fund will notify shareholders in January 2013 of amounts for use in preparing 2012 income tax returns.
Annual Report
Managing Your Investments
Fidelity offers several ways to conveniently manage your personal investments via your telephone or PC. You can access your account information, conduct trades and research your investments 24 hours a day.
By Phone
Fidelity Automated Service Telephone provides a single toll-free number to access account balances, positions, quotes and trading. It's easy to navigate the service, and on your first call, the system will help you create a personal identification number (PIN) for security.
(phone graphic)Fidelity Automated
Service Telephone (FAST®)
1-800-544-5555
Press
1 For mutual fund and brokerage trading.
2 For quotes.*
3 For account balances and holdings.
4 To review orders and mutual
fund activity.
5 To change your PIN.
*0 To speak to a Fidelity representative.
By PC
Fidelity's web site on the Internet provides a wide range of information, including daily financial news, fund performance, interactive planning tools and news about Fidelity products and services.
(computer graphic)Fidelity's Web Site
www.fidelity.com
* When you call the quotes line, please remember that a fund's yield and return will vary and, except for money market funds, share price will also vary. This means that you may have a gain or loss when you sell your shares. There is no assurance that money market funds will be able to maintain a stable $1 share price; an investment in a money market fund is not insured or guaranteed by the U.S. government. Total returns are historical and include changes in share price, reinvestment of dividends and capital gains distributions, and the effects of any sales charges.
Annual Report
To Write Fidelity
We'll give your correspondence immediate attention and send you written confirmation upon completion of your request.
(envelope graphic)Making Changes
To Your Account
(such as changing name, address, bank, etc.)
Fidelity Investments
P.O. Box 770001
Cincinnati, OH 45277-0002
(envelope graphic)For Non-Retirement
Accounts
Buying shares
Fidelity Investments
P.O. Box 770001
Cincinnati, OH 45277-0003
Overnight Express
Fidelity Investments
Attn: Distribution Services
100 Crosby Parkway - KC1H
Covington, KY 41015
Selling shares
Fidelity Investments
P.O. Box 770001
Cincinnati, OH 45277-0035
Overnight Express
Fidelity Investments
Attn: Distribution Services
100 Crosby Parkway - KC1H
Covington, KY 41015
General Correspondence
Fidelity Investments
P.O. Box 500
Merrimack, NH 03054-0500
(envelope graphic)For Retirement
Accounts
Buying shares
Fidelity Investments
P.O. Box 770001
Cincinnati, OH 45277-0003
Selling shares
Fidelity Investments
P.O. Box 770001
Cincinnati, OH 45277-0035
Overnight Express
Fidelity Investments
Attn: Distribution Services
100 Crosby Parkway - KC1H
Covington, KY 41015
General Correspondence
Fidelity Investments
P.O. Box 500
Merrimack, NH 03054-0500
Annual Report
To Visit Fidelity
For directions and hours,
please call 1-800-544-9797.
Arizona
7001 West Ray Road
Chandler, AZ
15445 N. Scottsdale Road
Scottsdale, AZ
17550 North 75th Avenue
Glendale, AZ
5330 E. Broadway Blvd
Tucson, AZ
California
815 East Birch Street
Brea, CA
1411 Chapin Avenue
Burlingame, CA
851 East Hamilton Avenue
Campbell, CA
601 Larkspur Landing Circle
Larkspur, CA
2000 Avenue of the Stars
Los Angeles, CA
27101 Puerta Real
Mission Viejo, CA
73575 El Paseo
Palm Desert, CA
251 University Avenue
Palo Alto, CA
123 South Lake Avenue
Pasadena, CA
16656 Bernardo Ctr. Drive
Rancho Bernardo, CA
1220 Roseville Parkway
Roseville, CA
1740 Arden Way
Sacramento, CA
7676 Hazard Center Drive
San Diego, CA
11943 El Camino Real
San Diego, CA
8 Montgomery Street
San Francisco, CA
3793 State Street
Santa Barbara, CA
1200 Wilshire Boulevard
Santa Monica, CA
398 West El Camino Real
Sunnyvale, CA
111 South Westlake Blvd
Thousand Oaks, CA
21701 Hawthorne Boulevard
Torrance, CA
2001 North Main Street
Walnut Creek, CA
6326 Canoga Avenue
Woodland Hills, CA
2211 Michelson Drive
Irvine, CA
Colorado
281 East Flatiron Circle
Broomfield, CO
1625 Broadway
Denver, CO
9185 Westview Road
Lone Tree, CO
Connecticut
48 West Putnam Avenue
Greenwich, CT
265 Church Street
New Haven, CT
300 Atlantic Street
Stamford, CT
29 South Main Street
West Hartford, CT
1261 Post Road
Fairfield, CT
Delaware
400 Delaware Avenue
Wilmington, DE
Florida
175 East Altamonte Drive
Altamonte Springs, FL
1400 Glades Road
Boca Raton, FL
121 Alhambra Plaza
Coral Gables, FL
2948 N. Federal Highway
Ft. Lauderdale, FL
4671 Town Center Parkway
Jacksonville, FL
8880 Tamiami Trail, North
Naples, FL
230 Royal Palm Way
Palm Beach, FL
3501 PGA Boulevard
Palm Beach Gardens, FL
3550 Tamiami Trail, South
Sarasota, FL
1502 N. Westshore Blvd.
Tampa, FL
2465 State Road 7
Wellington, FL
Georgia
3242 Peachtree Road
Atlanta, GA
1000 Abernathy Road
Atlanta, GA
Illinois
One North LaSalle Street
Chicago, IL
401 North Michigan Avenue
Chicago, IL
One Skokie Valley Road
Highland Park, IL
1415 West 22nd Street
Oak Brook, IL
15105 S LaGrange Road
Orland Park, IL
1572 East Golf Road
Schaumburg, IL
1823 Freedom Drive
Naperville, IL
Indiana
8480 Keystone Crossing
Indianapolis, IN
Kansas
5400 College Boulevard
Overland Park, KS
Maine
Three Canal Plaza
Portland, ME
Maryland
7315 Wisconsin Avenue
Bethesda, MD
610 York Road
Towson, MD
Massachusetts
801 Boylston Street
Boston, MA
155 Congress Street
Boston, MA
300 Granite Street
Braintree, MA
44 Mall Road
Burlington, MA
238 Main Street
Cambridge, MA
200 Endicott Street
Danvers, MA
Annual Report
405 Cochituate Road
Framingham, MA
551 Boston Turnpike
Shrewsbury, MA
Michigan
500 E. Eisenhower Pkwy.
Ann Arbor, MI
280 N. Old Woodward Ave.
Birmingham, MI
30200 Northwestern Hwy.
Farmington Hills, MI
43420 Grand River Avenue
Novi, MI
3480 28th Street
Grand Rapids, MI
2425 S. Linden Road STE E
Flint, MI
Minnesota
7740 France Avenue South
Edina, MN
8342 3rd Street North
Oakdale, MN
Missouri
1524 South Lindbergh Blvd.
St. Louis, MO
Nevada
2225 Village Walk Drive
Henderson, NV
New Jersey
501 Route 73 South
Marlton, NJ
150 Essex Street
Millburn, NJ
35 Morris Street
Morristown, NJ
396 Route 17, North
Paramus, NJ
3518 Route 1 North
Princeton, NJ
530 Broad Street
Shrewsbury, NJ
New Mexico
2261 Q Street NE
Albuquerque, NM
New York
1130 Franklin Avenue
Garden City, NY
37 West Jericho Turnpike
Huntington Station, NY
1271 Avenue of the Americas
New York, NY
980 Madison Avenue
New York, NY
61 Broadway
New York, NY
350 Park Avenue
New York, NY
200 Fifth Avenue
New York, NY
733 Third Avenue
New York, NY
2070 Broadway
New York, NY
1075 Northern Blvd.
Roslyn, NY
799 Central Park Avenue
Scarsdale, NY
3349 Monroe Avenue
Rochester, NY
North Carolina
4611 Sharon Road
Charlotte, NC
7011 Fayetteville Road
Durham, NC
Ohio
3805 Edwards Road
Cincinnati, OH
1324 Polaris Parkway
Columbus, OH
1800 Crocker Road
Westlake, OH
28699 Chagrin Boulevard
Woodmere Village, OH
Oregon
7493 SW Bridgeport Road
Tigard, OR
Pennsylvania
600 West DeKalb Pike
King of Prussia, PA
1735 Market Street
Philadelphia, PA
12001 Perry Highway
Wexford, PA
Rhode Island
10 Memorial Boulevard
Providence, RI
Tennessee
3018 Peoples Street
Johnson City, TN
7628 West Farmington Blvd.
Germantown, TN
2035 Mallory Lane
Franklin, TN
Texas
10000 Research Boulevard
Austin, TX
4001 Northwest Parkway
Dallas, TX
12532 Memorial Drive
Houston, TX
2701 Drexel Drive
Houston, TX
6560 Fannin Street
Houston, TX
1701 Lake Robbins Drive
The Woodlands, TX
6500 N. MacArthur Blvd.
Irving, TX
6005 West Park Boulevard
Plano, TX
1576 East Southlake Blvd.
Southlake, TX
15600 Southwest Freeway
Sugar Land, TX
139 N. Loop 1604 East
San Antonio, TX
Utah
279 West South Temple
Salt Lake City, UT
Virginia
1861 International Drive
McLean, VA
11957 Democracy Drive
Reston, VA
Washington
10500 NE 8th Street
Bellevue, WA
1518 6th Avenue
Seattle, WA
304 Strander Blvd
Tukwila, WA
Washington, DC
1900 K Street, N.W.
Washington, DC
Wisconsin
16020 West Bluemound Road
Brookfield, WI
Fidelity Brokerage Services, Inc., 100 Summer St., Boston, MA 02110 Member NYSE/SIPC
Annual Report
Investment Adviser
Fidelity Management & Research Company
Boston, MA
Investment Sub-Advisers
FMR Co., Inc.
Fidelity Management & Research
(U.K.) Inc.
Fidelity Management & Research
(Japan) Inc.
Fidelity Management & Research
(Hong Kong) Limited
General Distributor
Fidelity Distributors Corporation
Boston, MA
Transfer and Service Agents
Fidelity Investments Institutional
Operations Company, Inc.
Boston, MA
Fidelity Service Company, Inc.
Boston, MA
Custodian
The Northern Trust Company
Chicago, IL
The Fidelity Telephone Connection
Mutual Fund 24-Hour Service
Exchanges/Redemptions
and Account Assistance 1-800-544-6666
Product Information 1-800-544-6666
Retirement Accounts 1-800-544-4774
(8 a.m. - 9 p.m.)
TDD Service 1-800-544-0118
for the deaf and hearing impaired
(9 a.m. - 9 p.m. Eastern time)
Fidelity Automated Service
Telephone (FAST®)
1-800-544-5555
Automated line for quickest service
EQU-UANN-0312
1.789253.110
(Fidelity Investment logo)(registered trademark)
Corporate Headquarters
82 Devonshire St., Boston, MA 02109
www.fidelity.com
Fidelity®
Equity-Income
Fund -
Class K
Annual Report
January 31, 2012
(Fidelity Cover Art)
Contents
Chairman's Message | The Chairman's message to shareholders. | |
Performance | How the fund has done over time. | |
Management's Discussion of Fund Performance | The Portfolio Manager's review of fund performance and strategy. | |
Shareholder Expense Example | An example of shareholder expenses. | |
Investment Changes | A summary of major shifts in the fund's investments over the past six months. | |
Investments | A complete list of the fund's investments with their market values. | |
Financial Statements | Statements of assets and liabilities, operations, and changes in net assets, as well as financial highlights. | |
Notes | Notes to the financial statements. | |
Report of Independent Registered Public Accounting Firm |
| |
Trustees and Officers |
| |
Distributions |
|
To view a fund's proxy voting guidelines and proxy voting record for the 12-month period ended June 30, visit http://www.fidelity.com/proxyvotingresults or visit the Securities and Exchange Commission's (SEC) web site at http://www.sec.gov. You may also call 1-800-835-5092 to request a free copy of the proxy voting guidelines.
Standard & Poor's, S&P and S&P 500 are registered service marks of The McGraw-Hill Companies, Inc. and have been licensed for use by Fidelity Distributors Corporation.
Other third party marks appearing herein are the property of their respective owners.
All other marks appearing herein are registered or unregistered trademarks or service marks of FMR LLC or an affiliated company.
Annual Report
This report and the financial statements contained herein are submitted for the general information of the shareholders of the fund. This report is not authorized for distribution to prospective investors in the fund unless preceded or accompanied by an effective prospectus.
A fund files its complete schedule of portfolio holdings with the SEC for the first and third quarters of each fiscal year on Form N-Q. Forms N-Q are available on the SEC's web site at http://www.sec.gov. A fund's Forms N-Q may be reviewed and copied at the SEC's Public Reference Room in Washington, DC. Information regarding the operation of the SEC's Public Reference Room may be obtained by calling 1-800-SEC-0330. For a complete list of a fund's portfolio holdings, view the most recent holdings listing, semiannual report, or annual report on Fidelity's web site at http://www.fidelity.com, http://www.advisor.fidelity.com, or http://www.401k.com, as applicable.
NOT FDIC INSURED • MAY LOSE VALUE • NO BANK GUARANTEE
Neither the fund nor Fidelity Distributors Corporation is a bank.
Annual Report
Chairman's Message
(photo_of_James_C_Curvey)
Dear Shareholder:
Following a year marked by unusually high volatility, 2012 began with most major asset classes advancing steadily in January. For U.S. equities, it was the strongest start to a new year since 1997. International stocks fared even better, despite continued uncertainty related to the sovereign debt crisis in Europe. Investors have been acutely sensitive to the latest news, for better or worse, coming out of the eurozone and its impact on financial markets. As we look ahead, the unresolved debt crisis in Europe remains at the center of a series of risk factors, summarized below, that we believe have the greatest potential to influence the global investment landscape.
Deleveraging and the economy
In the euro-currency area, fiscal austerity among nations and debt deleveraging among financial companies loaded with sovereign debt are deflationary measures and serve to hinder economic growth in the short term. Such an economic and financial-market scenario has not been historically supportive of strong performance among riskier assets, and emerges at a time when many nations need a resurgent economy to assist them in closing their budget deficits and in building confidence among bond buyers to help them refinance their existing debt obligations.
Slowdown in China and Europe
China's economy is the second-largest in the world, and it has been the biggest contributor to global growth since the end of the last recession. Thus, the slower pace of domestic growth in China has led to lower demand for imports of commodities and other construction materials from the rest of the world. In addition, economic weakness in Europe and the broad-based global economic slowdown are putting pressure on China's export growth, which has been largely responsible for its breakneck pace of annual gross domestic product (GDP) growth during the past three decades.
Credit deterioration and contagion
The heightened macroeconomic risk and elevated credit risk swirling around certain European nations and financial institutions have caused many market participants to avoid purchases of or reduce exposure to short-term debt offerings by these issuers. With increased credit risk, there are growing concerns about the potential credit contraction and contagion from European issuers spreading to other financial markets.
We invite you to learn more by visiting us on the Internet or calling us by phone. It is our privilege to provide the resources you need to choose investments that are right for you.
Sincerely,
(The acting chairman's signature appears here.)
James C. Curvey
Acting Chairman
Annual Report
Performance: The Bottom Line
Average annual total return reflects the change in the value of an investment, assuming reinvestment of the class' distributions from dividend income and capital gains (the profits earned upon the sale of securities that have grown in value, if any) and assuming a constant rate of performance each year. The $10,000 table and the fund's returns do not reflect the deduction of taxes that a shareholder would pay on fund distributions or the redemption of fund shares. During periods of reimbursement by Fidelity, a fund's total return will be greater than it would be had the reimbursement not occurred. How a fund did yesterday is no guarantee of how it will do tomorrow.
Average Annual Total Returns
Periods ended January 31, 2012 | Past 1 | Past 5 | Past 10 |
Class KA | -4.00% | -2.86% | 3.03% |
A The initial offering of Class K shares took place on May 9, 2008. Returns prior to May 9, 2008 are those of Fidelity® Equity-Income Fund, the original class of the fund.
$10,000 Over 10 Years
Let's say hypothetically that $10,000 was invested in Fidelity® Equity-Income Fund - Class K on January 31, 2002. The chart shows how the value of your investment would have changed, and also shows how the Russell 3000® Value Index performed over the same period. The initial offering of Class K took place on May 9, 2008. See above for additional information regarding the performance of Class K.

Annual Report
Management's Discussion of Fund Performance
Market Recap: After enduring one of the most volatile trading periods on record, U.S. stocks posted a gain for the 12 months ending January 31, 2012, sparked by a January rally. Strong corporate earnings reports and hints of economic recovery sent stocks mostly upward through April, when sovereign debt woes in Europe sparked fear of a global slowdown. In the summer, equities plummeted on eurozone instability, debate over the U.S. debt ceiling and a historic downgrade of the nation's sovereign debt rating. After falling as much as 13% by early August, the broad-based S&P 500® Index seesawed back to end the period on an optimistic note. For the full 12 months, the S&P 500® rose 4.22%, while the technology-laden Nasdaq Composite® Index added 5.26%. Investors began to shed perceived riskier smaller-cap stocks in favor of larger, more-established and dividend-paying names, helping to drive the Dow Jones® Industrial Average up 9.12% for the year, while the Russell 2000® - a proxy for small-caps - and Russell Midcap® indexes added 2.86% and 2.25%, respectively. Within the S&P 500®, defensive sectors such as health care (+16%) and utilities (+14%) fared best, while financials (-12%) struggled. Foreign developed-markets stocks were stung by Europe's turmoil, and the MSCI® EAFE® (Europe, Australasia, Far East) Index fell 9.49%.
Comments from James Morrow, who became Lead Portfolio Manager of Fidelity® Equity-Income Fund on October 26, 2011: For the year ending January 31, 2012, the fund's Class K shares lost 4.00%, significantly lagging the 1.78% gain of the Russell 3000® Value Index. The biggest sources of underperformance came from a few economically sensitive sectors, especially financials. Diversified financials stocks Morgan Stanley, JPMorgan Chase and Bank of America (no longer held) did especially poorly. Positioning in industrials and consumer discretionary also notably detracted, as did the fund's stance in traditionally defensive groups, such as health care and consumer staples. In technology, the fund's average underweighting in Intel was unfortunate, given that stock's sharp gain during the year, while holdings in network-communications equipment maker Cisco Systems also hurt. At period end, the fund no longer held Intel's common stock but did own a convertible securities position. The fund's top individual contributors included National Semiconductor, which was acquired, and tobacco manufacturer Philip Morris International. Underweightings in software giant Microsoft and energy producer Devon Energy - sold before period end - also helped results.
Note to shareholders: On October 26, 2011, Adam Kramer and Ramona Persaud were named Co-Portfolio Managers of the fund.
The views expressed above reflect those of the portfolio manager(s) only through the end of the period as stated on the cover of this report and do not necessarily represent the views of Fidelity or any other person in the Fidelity organization. Any such views are subject to change at any time based upon market or other conditions and Fidelity disclaims any responsibility to update such views. These views may not be relied on as investment advice and, because investment decisions for a Fidelity fund are based on numerous factors, may not be relied on as an indication of trading intent on behalf of any Fidelity fund.
Annual Report
Shareholder Expense Example
As a shareholder of the Fund, you incur two types of costs: (1) transaction costs, and (2) ongoing costs, including management fees and other Fund expenses. This Example is intended to help you understand your ongoing costs (in dollars) of investing in the Fund and to compare these costs with the ongoing costs of investing in other mutual funds.
The Example is based on an investment of $1,000 invested at the beginning of the period and held for the entire period (August 1, 2011 to January 31, 2012).
Actual Expenses
The first line of the accompanying table for each class of the Fund provides information about actual account values and actual expenses. You may use the information in this line, together with the amount you invested, to estimate the expenses that you paid over the period. Simply divide your account value by $1,000.00 (for example, an $8,600 account value divided by $1,000.00 = 8.6), then multiply the result by the number in the first line for a class of the Fund under the heading entitled "Expenses Paid During Period" to estimate the expenses you paid on your account during this period. A small balance maintenance fee of $12.00 that is charged once a year may apply for certain accounts with a value of less than $2,000. This fee is not included in the table below. If it was, the estimate of expenses you paid during the period would be higher, and your ending account value lower, by this amount. In addition, the Fund, as a shareholder in the underlying Fidelity Central Funds, will indirectly bear its pro-rata share of the fees and expenses incurred by the underlying Fidelity Central Funds. These fees and expenses are not included in the Fund's annualized expense ratio used to calculate the expense estimate in the table below.
Hypothetical Example for Comparison Purposes
The second line of the accompanying table for each class of the Fund provides information about hypothetical account values and hypothetical expenses based on a Class' actual expense ratio and an assumed rate of return of 5% per year before expenses, which is not the Class' actual return. The hypothetical account values and expenses may not be used to estimate the actual ending account balance or expenses you paid for the period. You may use this information to compare the ongoing costs of investing in the Fund and other funds. To do so, compare this 5% hypothetical example with the 5% hypothetical examples that appear in the shareholder reports of the other funds. A small balance maintenance fee of $12.00 that is charged once a year may apply for certain accounts with a value of less than $2,000. This fee is not included in the table below. If it was, the estimate of expenses you paid during the period would be higher, and your ending account value lower, by this amount. In addition, the Fund, as a shareholder in the underlying Fidelity Central Funds, will indirectly bear its pro-rata share of the fees and expenses incurred by the underlying Fidelity Central Funds. These fees and expenses are not included in the Fund's annualized expense ratio used to calculate the expense estimate in the table below.
Please note that the expenses shown in the table are meant to highlight your ongoing costs only and do not reflect any transaction costs. Therefore, the second line of the table is useful in comparing ongoing costs only, and will not help you determine the relative total costs of owning different funds.
Annual Report
| Annualized | Beginning | Ending | Expenses Paid |
Equity-Income | .69% |
|
|
|
Actual |
| $ 1,000.00 | $ 976.80 | $ 3.44 |
Hypothetical A |
| $ 1,000.00 | $ 1,021.73 | $ 3.52 |
Class K | .53% |
|
|
|
Actual |
| $ 1,000.00 | $ 977.60 | $ 2.64 |
Hypothetical A |
| $ 1,000.00 | $ 1,022.53 | $ 2.70 |
A 5% return per year before expenses
* Expenses are equal to each Class' annualized expense ratio, multiplied by the average account value over the period, multiplied by 184/365 (to reflect the one-half year period).
Annual Report
Investment Changes (Unaudited)
Top Ten Stocks as of January 31, 2012 | ||
| % of fund's | % of fund's net assets |
Chevron Corp. | 3.9 | 2.7 |
JPMorgan Chase & Co. | 3.7 | 3.5 |
Pfizer, Inc. | 3.2 | 2.2 |
Wells Fargo & Co. | 3.1 | 2.7 |
Procter & Gamble Co. | 2.4 | 1.7 |
Merck & Co., Inc. | 2.4 | 1.3 |
General Electric Co. | 2.3 | 2.1 |
Comcast Corp. Class A | 2.1 | 0.8 |
Paychex, Inc. | 1.8 | 0.0 |
Royal Dutch Shell PLC Class A | 1.7 | 2.7 |
| 26.6 | |
Top Five Market Sectors as of January 31, 2012 | ||
| % of fund's | % of fund's net assets |
Financials | 20.4 | 28.3 |
Health Care | 13.5 | 9.7 |
Energy | 12.5 | 14.4 |
Consumer Staples | 11.2 | 7.0 |
Information Technology | 10.5 | 5.1 |
Asset Allocation (% of fund's net assets) | |||||||
As of January 31, 2012* | As of July 31, 2011** | ||||||
| Stocks and |
| | Stocks and |
| ||
| Bonds 0.7% |
| | Bonds 0.0% |
| ||
| Convertible |
| | Convertible |
| ||
| Other Investments 0.1% |
| | Other Investments 0.0% |
| ||
| Short-Term |
| | Short-Term |
| ||
* Foreign investments | 19.1% |
| ** Foreign investments | 16.5% |
| ||

Annual Report
Investments January 31, 2012
Showing Percentage of Net Assets
Common Stocks - 90.0% | |||
Shares | Value (000s) | ||
CONSUMER DISCRETIONARY - 7.6% | |||
Distributors - 0.2% | |||
Li & Fung Ltd. | 9,694,000 | $ 21,200 | |
Hotels, Restaurants & Leisure - 0.5% | |||
Carnival Corp. unit | 416,098 | 12,566 | |
Cedar Fair LP (depository unit) | 47,600 | 1,233 | |
Einstein Noah Restaurant Group, Inc. | 327,500 | 4,876 | |
McDonald's Corp. | 260,867 | 25,839 | |
| 44,514 | ||
Household Durables - 0.9% | |||
Jarden Corp. | 485,391 | 16,353 | |
KB Home (d) | 767,600 | 6,924 | |
Lennar Corp. Class A | 1,216,434 | 26,141 | |
PulteGroup, Inc. (a) | 2,609,634 | 19,442 | |
Tupperware Brands Corp. | 39,800 | 2,501 | |
Whirlpool Corp. | 158,711 | 8,621 | |
| 79,982 | ||
Leisure Equipment & Products - 0.3% | |||
Hasbro, Inc. | 717,800 | 25,058 | |
Media - 3.9% | |||
British Sky Broadcasting Group PLC | 114,100 | 1,241 | |
Comcast Corp. Class A | 7,112,735 | 189,128 | |
Informa PLC | 535,040 | 3,297 | |
Interpublic Group of Companies, Inc. | 1,505,400 | 15,551 | |
Ipsos SA | 45,600 | 1,456 | |
The Walt Disney Co. | 625,520 | 24,333 | |
Time Warner, Inc. | 3,090,353 | 114,528 | |
Virgin Media, Inc. | 64,700 | 1,542 | |
| 351,076 | ||
Multiline Retail - 1.1% | |||
PPR SA | 21,400 | 3,367 | |
Target Corp. | 1,776,249 | 90,251 | |
| 93,618 | ||
Specialty Retail - 0.7% | |||
Best Buy Co., Inc. | 721,011 | 17,268 | |
Carphone Warehouse Group PLC | 293,100 | 767 | |
Destination Maternity Corp. | 218,520 | 3,647 | |
Foschini Ltd. | 317,200 | 4,408 | |
Limited Brands, Inc. | 52,100 | 2,181 | |
Lowe's Companies, Inc. | 992,122 | 26,619 | |
Common Stocks - continued | |||
Shares | Value (000s) | ||
CONSUMER DISCRETIONARY - continued | |||
Specialty Retail - continued | |||
OfficeMax, Inc. (a) | 770,727 | $ 4,262 | |
USS Co. Ltd. | 24,090 | 2,301 | |
| 61,453 | ||
Textiles, Apparel & Luxury Goods - 0.0% | |||
VF Corp. | 23,500 | 3,090 | |
TOTAL CONSUMER DISCRETIONARY | 679,991 | ||
CONSUMER STAPLES - 11.1% | |||
Beverages - 2.2% | |||
Anadolu Efes Biracilik ve Malt Sanayii A/S | 98,000 | 1,371 | |
Anheuser-Busch InBev SA NV | 689,492 | 41,919 | |
Beam, Inc. | 258,000 | 13,496 | |
Dr Pepper Snapple Group, Inc. | 90,200 | 3,502 | |
PepsiCo, Inc. | 1,558,312 | 102,334 | |
The Coca-Cola Co. | 466,324 | 31,491 | |
| 194,113 | ||
Food & Staples Retailing - 1.7% | |||
Drogasil SA | 193,100 | 1,603 | |
Safeway, Inc. | 1,141,000 | 25,079 | |
Sysco Corp. | 780,100 | 23,489 | |
Wal-Mart Stores, Inc. | 1,226,355 | 75,249 | |
Walgreen Co. | 896,139 | 29,895 | |
| 155,315 | ||
Food Products - 0.8% | |||
Danone | 816,280 | 50,377 | |
Green Mountain Coffee Roasters, Inc. (a) | 265,878 | 14,182 | |
Kraft Foods, Inc. Class A | 130,471 | 4,997 | |
Shenguan Holdings Group Ltd. | 2,106,000 | 1,198 | |
| 70,754 | ||
Household Products - 3.4% | |||
Colgate-Palmolive Co. | 17,500 | 1,588 | |
Kimberly-Clark Corp. | 969,197 | 69,356 | |
Procter & Gamble Co. | 3,400,095 | 214,342 | |
Reckitt Benckiser Group PLC | 311,600 | 16,579 | |
| 301,865 | ||
Tobacco - 3.0% | |||
Altria Group, Inc. | 2,393,300 | 67,970 | |
Common Stocks - continued | |||
Shares | Value (000s) | ||
CONSUMER STAPLES - continued | |||
Tobacco - continued | |||
British American Tobacco PLC: | |||
(United Kingdom) | 135,000 | $ 6,217 | |
sponsored ADR | 1,112,200 | 102,556 | |
Imperial Tobacco Group PLC | 108,443 | 3,880 | |
Japan Tobacco, Inc. | 1,404 | 6,907 | |
Lorillard, Inc. | 223,200 | 23,969 | |
Philip Morris International, Inc. | 819,595 | 61,281 | |
| 272,780 | ||
TOTAL CONSUMER STAPLES | 994,827 | ||
ENERGY - 12.1% | |||
Energy Equipment & Services - 1.1% | |||
Aker Solutions ASA | 205,300 | 2,518 | |
BW Offshore Ltd. | 4,755,644 | 7,181 | |
Exterran Partners LP | 498,350 | 11,641 | |
Halliburton Co. | 1,028,270 | 37,820 | |
Noble Corp. | 824,802 | 28,736 | |
Saipem SpA | 62,287 | 2,915 | |
Trinidad Drilling Ltd. | 1,146,000 | 7,669 | |
| 98,480 | ||
Oil, Gas & Consumable Fuels - 11.0% | |||
Apache Corp. | 402,352 | 39,785 | |
ARC Resources Ltd. | 332,100 | 8,051 | |
Atlas Pipeline Partners, LP | 108,500 | 4,070 | |
BP PLC | 587,600 | 4,421 | |
BP PLC sponsored ADR | 1,582,665 | 72,660 | |
Buckeye Partners LP | 130,900 | 8,154 | |
Canadian Natural Resources Ltd. | 459,100 | 18,185 | |
Chevron Corp. | 3,407,395 | 351,227 | |
EXCO Resources, Inc. | 1,616,823 | 12,708 | |
Exxon Mobil Corp. | 1,432,284 | 119,939 | |
Holly Energy Partners LP | 38,960 | 2,153 | |
Inergy Midstream LP | 344,200 | 7,015 | |
Legacy Reserves LP | 564,400 | 16,001 | |
Origin Energy Ltd. | 178,752 | 2,611 | |
Penn West Petroleum Ltd. | 1,706,100 | 37,176 | |
Pioneer Southwest Energy Partners LP | 208,900 | 5,678 | |
Royal Dutch Shell PLC: | |||
Class A (United Kingdom) | 113,600 | 4,031 | |
Common Stocks - continued | |||
Shares | Value (000s) | ||
ENERGY - continued | |||
Oil, Gas & Consumable Fuels - continued | |||
Royal Dutch Shell PLC: - continued | |||
Class A sponsored ADR | 2,094,700 | $ 149,478 | |
Suncor Energy, Inc. | 661,900 | 22,799 | |
Total SA sponsored ADR | 1,241,400 | 65,757 | |
Williams Companies, Inc. | 898,200 | 25,886 | |
WPX Energy, Inc. | 256,466 | 4,227 | |
| 982,012 | ||
TOTAL ENERGY | 1,080,492 | ||
FINANCIALS - 19.4% | |||
Capital Markets - 3.0% | |||
Apollo Global Management LLC Class A | 557,200 | 8,291 | |
Ashmore Group PLC | 7,116,200 | 41,653 | |
Goldman Sachs Group, Inc. | 566,868 | 63,189 | |
ICAP PLC | 438,000 | 2,319 | |
KKR & Co. LP | 2,496,600 | 34,902 | |
Manning & Napier, Inc. | 501,290 | 6,642 | |
Morgan Stanley | 3,900,073 | 72,736 | |
The Blackstone Group LP | 2,305,600 | 36,452 | |
UBS AG (a) | 321,317 | 4,385 | |
| 270,569 | ||
Commercial Banks - 5.9% | |||
Aozora Bank Ltd. | 611,000 | 1,699 | |
Barclays PLC | 628,749 | 2,108 | |
BB&T Corp. | 2,502,985 | 68,056 | |
Comerica, Inc. | 678,400 | 18,771 | |
First Niagara Financial Group, Inc. | 1,382,207 | 13,228 | |
HSBC Holdings PLC (United Kingdom) | 6,932 | 58 | |
KB Financial Group, Inc. | 35,110 | 1,331 | |
M&T Bank Corp. | 418,400 | 33,363 | |
Standard Chartered PLC (United Kingdom) | 562,747 | 13,605 | |
SunTrust Banks, Inc. | 1,450,900 | 29,845 | |
Swedbank AB (A Shares) | 126,100 | 1,811 | |
U.S. Bancorp | 2,481,102 | 70,017 | |
Wells Fargo & Co. | 9,408,285 | 274,816 | |
| 528,708 | ||
Consumer Finance - 0.0% | |||
International Personal Finance PLC | 289,600 | 869 | |
Common Stocks - continued | |||
Shares | Value (000s) | ||
FINANCIALS - continued | |||
Diversified Financial Services - 4.0% | |||
BM&F Bovespa SA | 307,600 | $ 1,935 | |
Citigroup, Inc. | 686,320 | 21,084 | |
CME Group, Inc. | 4,174 | 1,000 | |
JPMorgan Chase & Co. | 8,918,525 | 332,661 | |
| 356,680 | ||
Insurance - 4.3% | |||
ACE Ltd. | 835,600 | 58,158 | |
AFLAC, Inc. | 388,000 | 18,713 | |
Aviva PLC | 464,900 | 2,564 | |
Berkshire Hathaway, Inc. Class B (a) | 620,044 | 48,593 | |
Everest Re Group Ltd. | 338,300 | 28,891 | |
Fairfax Financial Holdings Ltd. (sub. vtg.) | 100 | 41 | |
Fidelity National Financial, Inc. Class A | 1,369,500 | 24,911 | |
Hanover Insurance Group, Inc. | 550,700 | 20,023 | |
MetLife, Inc. | 2,296,309 | 81,129 | |
MetLife, Inc. unit | 344,600 | 23,557 | |
Old Republic International Corp. | 1,181,900 | 11,677 | |
Resolution Ltd. | 615,900 | 2,651 | |
The Chubb Corp. | 447,941 | 30,196 | |
Validus Holdings Ltd. | 954,959 | 30,626 | |
| 381,730 | ||
Real Estate Investment Trusts - 2.1% | |||
American Capital Agency Corp. | 901,400 | 26,429 | |
American Tower Corp. | 40,300 | 2,559 | |
Annaly Capital Management, Inc. | 1,523,200 | 25,651 | |
Brandywine Realty Trust (SBI) | 901,500 | 9,592 | |
Chimera Investment Corp. | 5,535,150 | 16,827 | |
Digital Realty Trust, Inc. (d) | 184,700 | 13,088 | |
Highwoods Properties, Inc. (SBI) | 242,500 | 8,024 | |
Japan Retail Fund Investment Corp. | 1,404 | 2,035 | |
Omega Healthcare Investors, Inc. | 756,900 | 15,774 | |
Rayonier, Inc. | 356,009 | 16,280 | |
Two Harbors Investment Corp. | 1,707,000 | 16,951 | |
Ventas, Inc. | 540,752 | 31,531 | |
| 184,741 | ||
Real Estate Management & Development - 0.0% | |||
Relo Holdings Corp. | 80,300 | 2,181 | |
Common Stocks - continued | |||
Shares | Value (000s) | ||
FINANCIALS - continued | |||
Thrifts & Mortgage Finance - 0.1% | |||
New York Community Bancorp, Inc. | 883,913 | $ 11,217 | |
TOTAL FINANCIALS | 1,736,695 | ||
HEALTH CARE - 13.1% | |||
Biotechnology - 1.2% | |||
Amgen, Inc. | 1,214,525 | 82,478 | |
PDL BioPharma, Inc. | 3,335,500 | 21,314 | |
| 103,792 | ||
Health Care Equipment & Supplies - 0.7% | |||
Covidien PLC | 753,800 | 38,821 | |
Meridian Bioscience, Inc. | 404,582 | 7,056 | |
St. Jude Medical, Inc. | 474,300 | 19,783 | |
| 65,660 | ||
Health Care Providers & Services - 1.4% | |||
Brookdale Senior Living, Inc. (a) | 583,800 | 10,275 | |
WellPoint, Inc. | 1,768,246 | 113,734 | |
| 124,009 | ||
Pharmaceuticals - 9.8% | |||
Abbott Laboratories | 1,312,200 | 71,056 | |
AstraZeneca PLC sponsored ADR | 426,100 | 20,517 | |
GlaxoSmithKline PLC | 2,357,881 | 52,455 | |
Johnson & Johnson | 1,916,301 | 126,303 | |
Merck & Co., Inc. | 5,487,132 | 209,938 | |
Pfizer, Inc. | 13,381,319 | 286,360 | |
Roche Holding AG (participation certificate) | 260,184 | 44,050 | |
Sanofi-aventis | 764,031 | 56,643 | |
Teva Pharmaceutical Industries Ltd. sponsored ADR | 206,800 | 9,333 | |
| 876,655 | ||
TOTAL HEALTH CARE | 1,170,116 | ||
INDUSTRIALS - 9.2% | |||
Aerospace & Defense - 2.2% | |||
Lockheed Martin Corp. | 727,000 | 59,847 | |
Raytheon Co. | 905,246 | 43,443 | |
The Boeing Co. | 278,916 | 20,690 | |
United Technologies Corp. | 919,715 | 72,060 | |
| 196,040 | ||
Common Stocks - continued | |||
Shares | Value (000s) | ||
INDUSTRIALS - continued | |||
Air Freight & Logistics - 1.3% | |||
C.H. Robinson Worldwide, Inc. | 358,500 | $ 24,679 | |
United Parcel Service, Inc. Class B | 1,160,606 | 87,800 | |
| 112,479 | ||
Building Products - 0.0% | |||
Lennox International, Inc. | 121,400 | 4,395 | |
Commercial Services & Supplies - 1.1% | |||
Intrum Justitia AB | 1,103,800 | 17,404 | |
Multiplus SA | 88,200 | 1,551 | |
Republic Services, Inc. | 2,596,974 | 76,039 | |
Steelcase, Inc. Class A | 553,595 | 4,822 | |
US Ecology, Inc. | 96,700 | 1,810 | |
| 101,626 | ||
Construction & Engineering - 0.0% | |||
Aveng Ltd. | 392,500 | 1,746 | |
VINCI SA | 54,900 | 2,546 | |
| 4,292 | ||
Electrical Equipment - 0.1% | |||
Alstom SA | 73,477 | 2,800 | |
Emerson Electric Co. | 43,328 | 2,226 | |
Hubbell, Inc. Class B | 24,900 | 1,792 | |
Rockwell Automation, Inc. | 15,200 | 1,184 | |
| 8,002 | ||
Industrial Conglomerates - 2.6% | |||
General Electric Co. | 10,998,537 | 205,783 | |
Koninklijke Philips Electronics NV | 78,100 | 1,582 | |
Koninklijke Philips Electronics NV (depositary receipt) (NY Reg.) | 1,216,213 | 24,640 | |
Orkla ASA (A Shares) | 397,700 | 3,223 | |
Siemens AG (d) | 22,559 | 2,130 | |
| 237,358 | ||
Machinery - 0.9% | |||
Briggs & Stratton Corp. | 1,121,785 | 17,511 | |
Douglas Dynamics, Inc. | 675,024 | 9,187 | |
Dover Corp. | 30,400 | 1,928 | |
Harsco Corp. | 188,700 | 4,195 | |
Illinois Tool Works, Inc. | 266,013 | 14,107 | |
Ingersoll-Rand PLC | 752,442 | 26,290 | |
Common Stocks - continued | |||
Shares | Value (000s) | ||
INDUSTRIALS - continued | |||
Machinery - continued | |||
Schindler Holding AG (Reg.) | 14,040 | $ 1,636 | |
Stanley Black & Decker, Inc. | 49,649 | 3,484 | |
| 78,338 | ||
Professional Services - 0.3% | |||
Michael Page International PLC | 3,768,800 | 23,111 | |
Road & Rail - 0.6% | |||
Union Pacific Corp. | 453,200 | 51,805 | |
Trading Companies & Distributors - 0.1% | |||
Mills Estruturas e Servicos de Engenharia SA | 184,100 | 2,284 | |
W.W. Grainger, Inc. | 5,900 | 1,125 | |
Wolseley PLC | 129,000 | 4,467 | |
| 7,876 | ||
TOTAL INDUSTRIALS | 825,322 | ||
INFORMATION TECHNOLOGY - 9.6% | |||
Communications Equipment - 1.4% | |||
Cisco Systems, Inc. | 6,185,416 | 121,420 | |
Computers & Peripherals - 1.3% | |||
Apple, Inc. (a) | 66,872 | 30,526 | |
Hewlett-Packard Co. | 3,025,615 | 84,657 | |
| 115,183 | ||
Electronic Equipment & Components - 0.5% | |||
Arrow Electronics, Inc. (a) | 409,895 | 16,925 | |
Avnet, Inc. (a) | 301,300 | 10,506 | |
TE Connectivity Ltd. | 642,690 | 21,916 | |
| 49,347 | ||
Internet Software & Services - 0.6% | |||
Google, Inc. Class A (a) | 61,200 | 35,503 | |
VeriSign, Inc. | 465,900 | 17,266 | |
| 52,769 | ||
IT Services - 3.4% | |||
Accenture PLC Class A | 878,633 | 50,381 | |
Cognizant Technology Solutions Corp. Class A (a) | 620,498 | 44,521 | |
Fidelity National Information Services, Inc. | 157,932 | 4,511 | |
Paychex, Inc. | 4,976,646 | 156,764 | |
Visa, Inc. Class A | 462,000 | 46,496 | |
| 302,673 | ||
Common Stocks - continued | |||
Shares | Value (000s) | ||
INFORMATION TECHNOLOGY - continued | |||
Office Electronics - 0.0% | |||
Canon, Inc. | 41,000 | $ 1,760 | |
Xerox Corp. | 209,302 | 1,622 | |
| 3,382 | ||
Semiconductors & Semiconductor Equipment - 1.7% | |||
Analog Devices, Inc. | 46,000 | 1,800 | |
Applied Materials, Inc. | 2,163,600 | 26,569 | |
ASM Pacific Technology Ltd. | 1,901,700 | 24,472 | |
KLA-Tencor Corp. | 399,403 | 20,421 | |
Siliconware Precision Industries Co. Ltd. sponsored ADR | 3,933,500 | 22,224 | |
Taiwan Semiconductor Manufacturing Co. Ltd. | 1,911,000 | 5,068 | |
Taiwan Semiconductor Manufacturing Co. Ltd. sponsored ADR | 3,811,815 | 53,670 | |
| 154,224 | ||
Software - 0.7% | |||
BMC Software, Inc. (a) | 348,600 | 12,633 | |
CA, Inc. | 796,300 | 20,529 | |
CompuGROUP Holding AG | 308,300 | 3,341 | |
Microsoft Corp. | 859,574 | 25,383 | |
| 61,886 | ||
TOTAL INFORMATION TECHNOLOGY | 860,884 | ||
MATERIALS - 0.5% | |||
Chemicals - 0.4% | |||
Arkema SA | 47,800 | 3,862 | |
BASF AG | 35,360 | 2,719 | |
Clariant AG (Reg.) (a) | 128,136 | 1,557 | |
Israel Chemicals Ltd. | 137,700 | 1,442 | |
LyondellBasell Industries NV Class A | 72,000 | 3,103 | |
PPG Industries, Inc. | 274,900 | 24,626 | |
Tokyo Ohka Kogyo Co. Ltd. | 52,700 | 1,152 | |
| 38,461 | ||
Metals & Mining - 0.1% | |||
Commercial Metals Co. | 703,200 | 10,084 | |
TOTAL MATERIALS | 48,545 | ||
TELECOMMUNICATION SERVICES - 3.6% | |||
Diversified Telecommunication Services - 3.5% | |||
AT&T, Inc. | 5,136,049 | 151,051 | |
CenturyLink, Inc. | 1,191,429 | 44,119 | |
Common Stocks - continued | |||
Shares | Value (000s) | ||
TELECOMMUNICATION SERVICES - continued | |||
Diversified Telecommunication Services - continued | |||
HKT Trust / HKT Ltd. unit | 2,690,000 | $ 1,724 | |
Koninklijke KPN NV | 2,045,342 | 22,418 | |
PT XL Axiata Tbk | 1,079,500 | 537 | |
Telstra Corp. Ltd. | 678,751 | 2,399 | |
Verizon Communications, Inc. | 2,374,167 | 89,411 | |
| 311,659 | ||
Wireless Telecommunication Services - 0.1% | |||
Far EasTone Telecommunications Co. Ltd. | 1,111,000 | 2,140 | |
TIM Participacoes SA sponsored ADR | 108,200 | 3,122 | |
Vodafone Group PLC | 2,086,000 | 5,627 | |
| 10,889 | ||
TOTAL TELECOMMUNICATION SERVICES | 322,548 | ||
UTILITIES - 3.8% | |||
Electric Utilities - 2.6% | |||
Cheung Kong Infrastructure Holdings Ltd. | 250,000 | 1,423 | |
Duke Energy Corp. | 2,855,848 | 60,858 | |
FirstEnergy Corp. | 907,812 | 38,328 | |
NextEra Energy, Inc. | 832,028 | 49,797 | |
PPL Corp. | 2,249,841 | 62,523 | |
Southern Co. | 470,691 | 21,445 | |
| 234,374 | ||
Gas Utilities - 0.1% | |||
ONEOK, Inc. | 50,100 | 4,166 | |
YESCO Co. Ltd. | 44,540 | 993 | |
| 5,159 | ||
Independent Power Producers & Energy Traders - 0.1% | |||
International Power PLC | 400,355 | 2,116 | |
Tractebel Energia SA | 107,100 | 1,860 | |
| 3,976 | ||
Multi-Utilities - 1.0% | |||
Alliant Energy Corp. | 192,619 | 8,165 | |
National Grid PLC | 4,474,529 | 44,562 | |
Common Stocks - continued | |||
Shares | Value (000s) | ||
UTILITIES - continued | |||
Multi-Utilities - continued | |||
PG&E Corp. | 407,523 | $ 16,570 | |
TECO Energy, Inc. | 1,321,363 | 23,851 | |
| 93,148 | ||
TOTAL UTILITIES | 336,657 | ||
TOTAL COMMON STOCKS (Cost $7,346,064) |
| ||
Preferred Stocks - 3.5% | |||
|
|
|
|
Convertible Preferred Stocks - 1.6% | |||
CONSUMER DISCRETIONARY - 0.3% | |||
Automobiles - 0.2% | |||
General Motors Co. 4.75% | 426,516 | 17,086 | |
Media - 0.1% | |||
Interpublic Group of Companies, Inc. 5.25% | 10,700 | 10,504 | |
TOTAL CONSUMER DISCRETIONARY | 27,590 | ||
ENERGY - 0.0% | |||
Oil, Gas & Consumable Fuels - 0.0% | |||
ATP Oil & Gas Corp. Series B, 8.00% | 66,200 | 2,367 | |
FINANCIALS - 0.5% | |||
Commercial Banks - 0.2% | |||
Huntington Bancshares, Inc. 8.50% | 14,900 | 16,539 | |
Diversified Financial Services - 0.1% | |||
Citigroup, Inc. 7.50% | 115,300 | 10,684 | |
Insurance - 0.1% | |||
Hartford Financial Services Group, Inc. Series F 7.25% | 389,200 | 8,025 | |
Real Estate Investment Trusts - 0.1% | |||
Health Care REIT, Inc. Series I, 6.50% | 149,000 | 7,990 | |
TOTAL FINANCIALS | 43,238 | ||
HEALTH CARE - 0.3% | |||
Health Care Equipment & Supplies - 0.2% | |||
Alere, Inc. 3.00% | 67,100 | 14,868 | |
Preferred Stocks - continued | |||
Shares | Value (000s) | ||
Convertible Preferred Stocks - continued | |||
HEALTH CARE - continued | |||
Health Care Providers & Services - 0.1% | |||
HealthSouth Corp. Series A 6.50% | 12,600 | $ 11,852 | |
TOTAL HEALTH CARE | 26,720 | ||
INDUSTRIALS - 0.1% | |||
Professional Services - 0.1% | |||
Nielsen Holdings B.V. 6.25% | 168,700 | 9,479 | |
MATERIALS - 0.2% | |||
Metals & Mining - 0.2% | |||
AngloGold Ashanti Holdings Finance PLC 6.00% | 262,500 | 13,256 | |
UTILITIES - 0.2% | |||
Electric Utilities - 0.2% | |||
PPL Corp. 8.75% | 372,200 | 19,529 | |
TOTAL CONVERTIBLE PREFERRED STOCKS | 142,179 | ||
Nonconvertible Preferred Stocks - 1.9% | |||
CONSUMER DISCRETIONARY - 1.7% | |||
Automobiles - 1.7% | |||
Porsche Automobil Holding SE (Germany) | 657,594 | 40,313 | |
Volkswagen AG | 650,306 | 115,124 | |
| 155,437 | ||
FINANCIALS - 0.2% | |||
Consumer Finance - 0.2% | |||
Ally Financial, Inc. 7.00% (e) | 17,264 | 13,725 | |
TOTAL NONCONVERTIBLE PREFERRED STOCKS | 169,162 | ||
TOTAL PREFERRED STOCKS (Cost $301,123) |
| ||
Investment Companies - 0.1% | |||
|
|
|
|
2010 Swift Mandatory Common Exchange Security Trust (e) | 714,700 |
| |
Corporate Bonds - 2.9% | ||||
| Principal Amount (000s) | Value (000s) | ||
Convertible Bonds - 2.2% | ||||
CONSUMER DISCRETIONARY - 0.3% | ||||
Diversified Consumer Services - 0.2% | ||||
Ingersoll-Rand Global Holding Co. Ltd. 4.5% 4/15/12 | $ 6,235 | $ 12,252 | ||
Hotels, Restaurants & Leisure - 0.1% | ||||
Gaylord Entertainment Co. 3.75% 10/1/14 (e) | 4,670 | 5,682 | ||
MGM Mirage, Inc. 4.25% 4/15/15 | 4,130 | 4,347 | ||
| 10,029 | |||
TOTAL CONSUMER DISCRETIONARY | 22,281 | |||
ENERGY - 0.3% | ||||
Oil, Gas & Consumable Fuels - 0.3% | ||||
Chesapeake Energy Corp. 2.5% 5/15/37 | 10,470 | 9,156 | ||
Peabody Energy Corp. 4.75% 12/15/66 | 3,960 | 4,054 | ||
Western Refining, Inc. 5.75% 6/15/14 | 8,080 | 13,756 | ||
| 26,966 | |||
FINANCIALS - 0.1% | ||||
Thrifts & Mortgage Finance - 0.1% | ||||
MGIC Investment Corp. 9% 4/1/63 (e) | 17,382 | 8,604 | ||
HEALTH CARE - 0.1% | ||||
Health Care Equipment & Supplies - 0.1% | ||||
Teleflex, Inc. 3.875% 8/1/17 | 7,890 | 9,514 | ||
INDUSTRIALS - 0.2% | ||||
Commercial Services & Supplies - 0.2% | ||||
Covanta Holding Corp. 3.25% 6/1/14 | 16,940 | 18,268 | ||
Construction & Engineering - 0.0% | ||||
MasTec, Inc.: | ||||
4% 6/15/14 | 780 | 987 | ||
4.25% 12/15/14 | 1,490 | 1,930 | ||
| 2,917 | |||
TOTAL INDUSTRIALS | 21,185 | |||
INFORMATION TECHNOLOGY - 0.9% | ||||
Communications Equipment - 0.1% | ||||
InterDigital, Inc. 2.5% 3/15/16 (e) | 7,190 | 7,415 | ||
Computers & Peripherals - 0.1% | ||||
SanDisk Corp. 1.5% 8/15/17 | 5,040 | 5,796 | ||
Corporate Bonds - continued | ||||
| Principal Amount (000s) | Value (000s) | ||
Convertible Bonds - continued | ||||
INFORMATION TECHNOLOGY - continued | ||||
Internet Software & Services - 0.3% | ||||
Equinix, Inc.: | ||||
3% 10/15/14 | $ 7,830 | $ 9,634 | ||
4.75% 6/15/16 | 6,100 | 9,752 | ||
VeriSign, Inc. 3.25% 8/15/37 | 6,990 | 8,659 | ||
| 28,045 | |||
IT Services - 0.1% | ||||
CACI International, Inc. 2.125% 5/1/14 | 9,700 | 11,664 | ||
Semiconductors & Semiconductor Equipment - 0.1% | ||||
Intel Corp. 3.25% 8/1/39 | 3,060 | 4,093 | ||
Micron Technology, Inc. 1.875% 8/1/31 (e) | 3,890 | 3,895 | ||
| 7,988 | |||
Software - 0.2% | ||||
Nuance Communications, Inc. 2.75% 11/1/31 (e) | 19,080 | 22,339 | ||
TOTAL INFORMATION TECHNOLOGY | 83,247 | |||
MATERIALS - 0.2% | ||||
Metals & Mining - 0.2% | ||||
Newmont Mining Corp.: | ||||
1.25% 7/15/14 | 7,880 | 11,209 | ||
1.625% 7/15/17 | 2,980 | 4,451 | ||
| 15,660 | |||
TELECOMMUNICATION SERVICES - 0.1% | ||||
Diversified Telecommunication Services - 0.1% | ||||
Clearwire Communications LLC/Clearwire Finance, Inc. 8.25% 12/1/40 (e) | 17,820 | 11,115 | ||
TOTAL CONVERTIBLE BONDS | 198,572 | |||
Nonconvertible Bonds - 0.7% | ||||
CONSUMER DISCRETIONARY - 0.1% | ||||
Diversified Consumer Services - 0.1% | ||||
ServiceMaster Co. 10.75% 7/15/15 pay-in-kind (e)(f) | 5,295 | 5,560 | ||
Corporate Bonds - continued | ||||
| Principal Amount (000s) | Value (000s) | ||
Nonconvertible Bonds - continued | ||||
CONSUMER STAPLES - 0.1% | ||||
Food & Staples Retailing - 0.1% | ||||
Rite Aid Corp.: | ||||
9.375% 12/15/15 | $ 2,510 | $ 2,523 | ||
9.5% 6/15/17 | 3,905 | 3,876 | ||
Tops Markets LLC 10.125% 10/15/15 | 7,150 | 7,668 | ||
| 14,067 | |||
ENERGY - 0.1% | ||||
Oil, Gas & Consumable Fuels - 0.1% | ||||
Western Refining, Inc. 11.25% 6/15/17 (e) | 5,000 | 5,650 | ||
FINANCIALS - 0.2% | ||||
Diversified Financial Services - 0.1% | ||||
Transportation Union LLC/Transportation Union Financing Corp. 11.375% 6/15/18 | 7,400 | 8,714 | ||
Thrifts & Mortgage Finance - 0.1% | ||||
Radian Group, Inc. 5.625% 2/15/13 | 9,330 | 6,858 | ||
TOTAL FINANCIALS | 15,572 | |||
MATERIALS - 0.1% | ||||
Paper & Forest Products - 0.1% | ||||
ABI Escrow Corp. 10.25% 10/15/18 (e) | 10,450 | 11,756 | ||
TELECOMMUNICATION SERVICES - 0.1% | ||||
Diversified Telecommunication Services - 0.1% | ||||
Clearwire Communications LLC/Clearwire Finance, Inc. 12% 12/1/15 (e) | 10,050 | 9,472 | ||
TOTAL NONCONVERTIBLE BONDS | 62,077 | |||
TOTAL CORPORATE BONDS (Cost $259,338) |
| |||
Floating Rate Loans - 0.1% | ||||
| Principal Amount (000s) | Value (000s) | ||
TELECOMMUNICATION SERVICES - 0.1% | ||||
Wireless Telecommunication Services - 0.1% | ||||
Asurion LLC term loan 9% 5/24/19 (f) (Cost $9,721) | $ 9,845 | $ 9,882 | ||
Money Market Funds - 3.4% | |||
Shares |
| ||
Fidelity Cash Central Fund, 0.12% (b) | 298,700,419 | 298,700 | |
Fidelity Securities Lending Cash Central Fund, 0.12% (b)(c) | 1,782,450 | 1,782 | |
TOTAL MONEY MARKET FUNDS (Cost $300,482) |
| ||
TOTAL INVESTMENT PORTFOLIO - 100.0% (Cost $8,223,405) | 8,946,823 | ||
NET OTHER ASSETS (LIABILITIES) - 0.0% | 3,322 | ||
NET ASSETS - 100% | $ 8,950,145 | ||
Legend |
(a) Non-income producing |
(b) Affiliated fund that is available only to investment companies and other accounts managed by Fidelity Investments. The rate quoted is the annualized seven-day yield of the fund at period end. A complete unaudited listing of the fund's holdings as of its most recent quarter end is available upon request. In addition, each Fidelity Central Fund's financial statements, which are not covered by the Fund's Report of Independent Registered Public Accounting Firm, are available on the SEC's website or upon request. |
(c) Investment made with cash collateral received from securities on loan. |
(d) Security or a portion of the security is on loan at period end. |
(e) Security exempt from registration under Rule 144A of the Securities Act of 1933. These securities may be resold in transactions exempt from registration, normally to qualified institutional buyers. At the end of the period, the value of these securities amounted to $113,605,000 or 1.3% of net assets. |
(f) Coupon rates for floating and adjustable rate securities reflect the rates in effect at period end. |
Affiliated Central Funds |
Information regarding fiscal year to date income earned by the Fund from investments in Fidelity Central Funds is as follows: |
Fund | Income earned |
Fidelity Cash Central Fund | $ 136 |
Fidelity Securities Lending Cash Central Fund | 2,544 |
Total | $ 2,680 |
Other Affiliated Issuers |
An affiliated company is a company in which the Fund has ownership of at least 5% of the voting securities. Fiscal year to date transactions with companies which are or were affiliates are as follows: |
Affiliate | Value, beginning of period | Purchases | Sales Proceeds | Dividend Income | Value, |
Briggs & Stratton Corp. | $ 56,123 | $ - | $ 25,105 | $ 1,030 | $ - |
Total | $ 56,123 | $ - | $ 25,105 | $ 1,030 | $ - |
Other Information |
The following is a summary of the inputs used, as of January 31, 2012, involving the Fund's assets and liabilities carried at fair value. The inputs or methodology used for valuing securities may not be an indication of the risk associated with investing in those securities. For more information on valuation inputs, and their aggregation into the levels used in the table below, please refer to the Security Valuation section in the accompanying Notes to Financial Statements. |
Valuation Inputs at Reporting Date: | ||||
Description | Total | Level 1 | Level 2 | Level 3 |
Investments in Securities: | ||||
Equities: | ||||
Consumer Discretionary | $ 863,018 | $ 852,514 | $ 10,504 | $ - |
Consumer Staples | 994,827 | 946,691 | 48,136 | - |
Energy | 1,082,859 | 1,072,040 | 10,819 | - |
Financials | 1,793,658 | 1,737,940 | 55,718 | - |
Health Care | 1,196,836 | 1,075,886 | 120,950 | - |
Industrials | 834,801 | 821,610 | 13,191 | - |
Information Technology | 860,884 | 854,056 | 6,828 | - |
Materials | 61,801 | 61,801 | - | - |
Telecommunication Services | 322,548 | 316,921 | 5,627 | - |
Utilities | 356,186 | 292,095 | 64,091 | - |
Investment Companies | 8,392 | - | 8,392 | - |
Valuation Inputs at Reporting Date: | ||||
Description | Total | Level 1 | Level 2 | Level 3 |
Investments in Securities: | ||||
Corporate Bonds | $ 260,649 | $ - | $ 260,649 | $ - |
Floating Rate Loans | 9,882 | - | 9,882 | - |
Money Market Funds | 300,482 | 300,482 | - | - |
Total Investments in Securities: | $ 8,946,823 | $ 8,332,036 | $ 614,787 | $ - |
Distribution of investments by country of issue, as a percentage of total net assets, is as follows: (Unaudited) |
United States of America | 80.9% |
United Kingdom | 6.5% |
France | 2.2% |
Germany | 1.7% |
Switzerland | 1.7% |
Ireland | 1.3% |
Bermuda | 1.2% |
Canada | 1.1% |
Others (Individually Less Than 1%) | 3.4% |
| 100.0% |
See accompanying notes which are an integral part of the financial statements.
Annual Report
Financial Statements
Statement of Assets and Liabilities
Amounts in thousands (except per-share amounts) | January 31, 2012 | |
|
|
|
Assets | ||
Investment in securities, at value (including securities loaned of $1,720) - See accompanying schedule: Unaffiliated issuers (cost $7,922,923) | $ 8,646,341 |
|
Fidelity Central Funds (cost $300,482) | 300,482 |
|
Total Investments (cost $8,223,405) |
| $ 8,946,823 |
Cash |
| 1,681 |
Foreign currency held at value (cost $691) | 691 | |
Receivable for investments sold | 26,908 | |
Receivable for fund shares sold | 5,399 | |
Dividends receivable | 13,597 | |
Interest receivable | 3,246 | |
Distributions receivable from Fidelity Central Funds | 33 | |
Prepaid expenses | 21 | |
Other receivables | 1,259 | |
Total assets | 8,999,658 | |
|
|
|
Liabilities | ||
Payable for investments purchased | $ 32,249 | |
Payable for fund shares redeemed | 9,888 | |
Accrued management fee | 3,430 | |
Other affiliated payables | 1,366 | |
Other payables and accrued expenses | 798 | |
Collateral on securities loaned, at value | 1,782 | |
Total liabilities | 49,513 | |
|
|
|
Net Assets | $ 8,950,145 | |
Net Assets consist of: |
| |
Paid in capital | $ 10,085,957 | |
Undistributed net investment income | 8,394 | |
Accumulated undistributed net realized gain (loss) on investments and foreign currency transactions | (1,867,708) | |
Net unrealized appreciation (depreciation) on investments and assets and liabilities in foreign currencies | 723,502 | |
Net Assets | $ 8,950,145 | |
See accompanying notes which are an integral part of the financial statements.
Annual Report
Financial Statements - continued
Statement of Assets and Liabilities - continued
Amounts in thousands (except per-share amounts) | January 31, 2012 | |
|
|
|
Equity-Income: | $ 42.77 | |
|
|
|
Class K: | $ 42.76 | |
See accompanying notes which are an integral part of the financial statements.
Annual Report
Statement of Operations
Amounts in thousands | Year ended January 31, 2012 | |
|
|
|
Investment Income |
|
|
Dividends (including $1,030 earned from other affiliated issuers) |
| $ 274,053 |
Interest |
| 16,550 |
Income from Fidelity Central Funds |
| 2,680 |
Total income |
| 293,283 |
|
|
|
Expenses | ||
Management fee | $ 49,496 | |
Transfer agent fees | 18,105 | |
Accounting and security lending fees | 1,338 | |
Custodian fees and expenses | 266 | |
Independent trustees' compensation | 65 | |
Registration fees | 153 | |
Audit | 196 | |
Legal | 45 | |
Interest | 15 | |
Miscellaneous | 141 | |
Total expenses before reductions | 69,820 | |
Expense reductions | (832) | 68,988 |
Net investment income (loss) | 224,295 | |
Realized and Unrealized Gain (Loss) Net realized gain (loss) on: | ||
Investment securities: |
|
|
Unaffiliated issuers | 1,667,907 | |
Other affiliated issuers | (12,496) |
|
Foreign currency transactions | (174) | |
Futures contracts | 15,704 | |
Total net realized gain (loss) |
| 1,670,941 |
Change in net unrealized appreciation (depreciation) on: Investment securities | (2,535,997) | |
Assets and liabilities in foreign currencies | (100) | |
Total change in net unrealized appreciation (depreciation) |
| (2,536,097) |
Net gain (loss) | (865,156) | |
Net increase (decrease) in net assets resulting from operations | $ (640,861) | |
See accompanying notes which are an integral part of the financial statements.
Annual Report
Financial Statements - continued
Statement of Changes in Net Assets
Amounts in thousands | Year ended | Year ended |
Increase (Decrease) in Net Assets |
|
|
Operations |
|
|
Net investment income (loss) | $ 224,295 | $ 237,832 |
Net realized gain (loss) | 1,670,941 | 395,328 |
Change in net unrealized appreciation (depreciation) | (2,536,097) | 2,115,275 |
Net increase (decrease) in net assets resulting | (640,861) | 2,748,435 |
Distributions to shareholders from net investment income | (215,914) | (254,643) |
Share transactions - net increase (decrease) | (2,800,870) | (7,281,724) |
Total increase (decrease) in net assets | (3,657,645) | (4,787,932) |
|
|
|
Net Assets | ||
Beginning of period | 12,607,790 | 17,395,722 |
End of period (including undistributed net investment income of $8,394 and undistributed net investment income of $6,093, respectively) | $ 8,950,145 | $ 12,607,790 |
See accompanying notes which are an integral part of the financial statements.
Annual Report
Financial Highlights - Equity-Income
Years ended January 31, | 2012 | 2011 | 2010 | 2009 | 2008 |
Selected Per-Share Data |
|
|
|
|
|
Net asset value, beginning of period | $ 45.57 | $ 37.93 | $ 27.48 | $ 52.25 | $ 59.33 |
Income from Investment Operations |
|
|
|
|
|
Net investment income (loss) B | .89 | .66 | .63 | 1.00 | 1.00 |
Net realized and unrealized gain (loss) | (2.80) | 7.72 | 10.51 | (23.96) | (3.86) |
Total from investment operations | (1.91) | 8.38 | 11.14 | (22.96) | (2.86) |
Distributions from net investment income | (.89) | (.74) | (.69) | (.96) | (1.02) |
Distributions from net realized gain | - | - | - | (.85) | (3.20) |
Total distributions | (.89) | (.74) | (.69) | (1.81) | (4.22) |
Net asset value, end of period | $ 42.77 | $ 45.57 | $ 37.93 | $ 27.48 | $ 52.25 |
Total Return A | (4.15)% | 22.32% | 41.02% | (45.16)% | (5.21)% |
Ratios to Average Net Assets C,E |
|
|
|
|
|
Expenses before reductions | .68% | .69% | .74% | .71% | .66% |
Expenses net of fee waivers, if any | .68% | .69% | .74% | .71% | .66% |
Expenses net of all reductions | .67% | .68% | .74% | .71% | .66% |
Net investment income (loss) | 2.04% | 1.62% | 1.87% | 2.38% | 1.68% |
Supplemental Data |
|
|
|
|
|
Net assets, end of period (in millions) | $ 6,844 | $ 10,049 | $ 15,061 | $ 15,070 | $ 28,115 |
Portfolio turnover rate D | 80% | 28% | 30% | 33% | 23% |
A Total returns would have been lower if certain expenses had not been reduced during the applicable periods shown.
B Calculated based on average shares outstanding during the period.
C Fees and expenses of any underlying Fidelity Central Funds are not included in the Fund's expense ratio. The Fund indirectly bears its proportionate share of the expenses of any underlying Fidelity Central Funds.
D Amount does not include the portfolio activity of any underlying Fidelity Central Funds.
E Expense ratios reflect operating expenses of the class. Expenses before reductions do not reflect amounts reimbursed by the investment adviser or reductions from brokerage service arrangements or reductions from other expense offset arrangements and do not represent the amount paid by the class during periods when reimbursements or reductions occur. Expenses net of fee waivers reflect expenses after reimbursement by the investment adviser but prior to reductions from brokerage service arrangements or other expense offset arrangements. Expenses net of all reductions represent the net expenses paid by the class.
See accompanying notes which are an integral part of the financial statements.
Annual Report
Financial Highlights - Class K
Years ended January 31, | 2012 | 2011 | 2010 | 2009 G |
Selected Per-Share Data |
|
|
|
|
Net asset value, beginning of period | $ 45.56 | $ 37.93 | $ 27.48 | $ 51.47 |
Income from Investment Operations |
|
|
|
|
Net investment income (loss) D | .95 | .72 | .72 | .61 |
Net realized and unrealized gain (loss) | (2.79) | 7.72 | 10.48 | (23.80) |
Total from investment operations | (1.84) | 8.44 | 11.20 | (23.19) |
Distributions from net investment income | (.96) | (.81) | (.75) | (.80) |
Net asset value, end of period | $ 42.76 | $ 45.56 | $ 37.93 | $ 27.48 |
Total Return B,C | (4.00)% | 22.50% | 41.30% | (45.45)% |
Ratios to Average Net Assets E,H |
|
|
|
|
Expenses before reductions | .53% | .53% | .54% | .53% A |
Expenses net of fee waivers, if any | .53% | .53% | .54% | .53% A |
Expenses net of all reductions | .52% | .53% | .54% | .53% A |
Net investment income (loss) | 2.19% | 1.78% | 2.07% | 2.89% A |
Supplemental Data |
|
|
|
|
Net assets, end of period (in millions) | $ 2,106 | $ 2,559 | $ 2,017 | $ 711 |
Portfolio turnover rate F | 80% | 28% | 30% | 33% |
A Annualized
B Total returns for periods of less than one year are not annualized.
C Total returns would have been lower if certain expenses had not been reduced during the applicable periods shown.
D Calculated based on average shares outstanding during the period.
E Fees and expenses of any underlying Fidelity Central Funds are not included in the Fund's expense ratio. The Fund indirectly bears its proportionate share of the expenses of any underlying Fidelity Central Funds.
F Amount does not include the portfolio activity of any underlying Fidelity Central Funds.
G For the period May 9, 2008 (commencement of sale of shares) to January 31, 2009.
H Expense ratios reflect operating expenses of the class. Expenses before reductions do not reflect amounts reimbursed by the investment adviser or reductions from brokerage service arrangements or reductions from other expense offset arrangements and do not represent the amount paid by the class during periods when reimbursements or reductions occur. Expense ratios before reductions for start-up periods may not be representative of longer-term operating periods. Expenses net of fee waivers reflect expenses after reimbursement by the investment adviser but prior to reductions from brokerage service arrangements or other expense offset arrangements. Expenses net of all reductions represent the net expenses paid by the class.
See accompanying notes which are an integral part of the financial statements.
Annual Report
Notes to Financial Statements
For the period ended January 31, 2012
(Amounts in thousands except percentages)
1. Organization.
Fidelity Equity-Income Fund (the Fund) is a fund of Fidelity Devonshire Trust (the Trust) and is authorized to issue an unlimited number of shares. The Trust is registered under the Investment Company Act of 1940, as amended (the 1940 Act), as an open-end management investment company organized as a Massachusetts business trust. The Fund offers Equity-Income shares and Class K shares, each of which has equal rights as to assets and voting privileges. Each class has exclusive voting rights with respect to matters that affect that class. Investment income, realized and unrealized capital gains and losses, the common expenses of the Fund, and certain fund-level expense reductions, if any, are allocated on a pro-rata basis to each class based on the relative net assets of each class to the total net assets of the Fund. Each class differs with respect to transfer agent fees incurred. Certain expense reductions may also differ by class. The Fund offered Class F shares during the period February 1, 2010 through December 15, 2010 and all outstanding shares were redeemed by December 15, 2010.
2. Investments in Fidelity Central Funds.
The Fund invests in Fidelity Central Funds, which are open-end investment companies available only to other investment companies and accounts managed by Fidelity Management & Research Company (FMR) and its affiliates. The Fund's Schedule of Investments lists each of the Fidelity Central Funds held as of period end, if any, as an investment of the Fund, but does not include the underlying holdings of each Fidelity Central Fund. As an Investing Fund, the Fund indirectly bears its proportionate share of the expenses of the underlying Fidelity Central Funds.
The Money Market Central Funds seek preservation of capital and current income and are managed by Fidelity Investments Money Management, Inc. (FIMM), an affiliate of FMR.
A complete unaudited list of holdings for each Fidelity Central Fund is available upon request or at the Securities and Exchange Commission (the SEC) web site at www.sec.gov. In addition, the financial statements of the Fidelity Central Funds, which are not covered by the Fund's Report of Independent Registered Public Accounting Firm, are available on the SEC web site or upon request.
3. Significant Accounting Policies.
The financial statements have been prepared in conformity with accounting principles generally accepted in the United States of America (GAAP), which require management to make certain estimates and assumptions at the date of the financial statements. Actual results could differ from those estimates. Subsequent events, if any, through the date that the financial statements were issued have been evaluated in the preparation of
Annual Report
Notes to Financial Statements - continued
(Amounts in thousands except percentages)
3. Significant Accounting Policies - continued
the financial statements. The following summarizes the significant accounting policies of the Fund:
Security Valuation. Investments are valued as of 4:00 p.m. Eastern time on the last calendar day of the period. The Fund uses independent pricing services approved by the Board of Trustees to value its investments. When current market prices or quotations are not readily available or reliable, valuations may be determined in good faith in accordance with procedures adopted by the Board of Trustees. Factors used in determining value may include market or security specific events, changes in interest rates and credit quality. The frequency with which these procedures are used cannot be predicted and they may be utilized to a significant extent. The value used for net asset value (NAV) calculation under these procedures may differ from published prices for the same securities.
The Fund categorizes the inputs to valuation techniques used to value its investments into a disclosure hierarchy consisting of three levels as shown below:
Level 1 - quoted prices in active markets for identical investments
Level 2 - other significant observable inputs (including quoted prices for similar investments, interest rates, prepayment speeds, etc.)
Level 3 - unobservable inputs (including the Fund's own assumptions based on the best information available)
Changes in valuation techniques may result in transfers in or out of an assigned level within the disclosure hierarchy. The aggregate value of investments by input level, as of January 31, 2012, is included at the end of the Fund's Schedule of Investments. Valuation techniques used to value the Fund's investments by major category are as follows:
Equity securities, including restricted securities, for which market quotations are readily available, are valued at the last reported sale price or official closing price as reported by an independent pricing service on the primary market or exchange on which they are traded and are categorized as Level 1 in the hierarchy. In the event there were no sales during the day or closing prices are not available, securities are valued at the last quoted bid price or may be valued using the last available price and are generally categorized as Level 2 in the hierarchy. For foreign equity securities, when significant market or security specific events arise, comparisons to the valuation of American Depositary Receipts (ADRs), futures contracts, Exchange-traded funds (ETFs) and certain indexes as well as quoted prices for similar securities are used and are categorized as Level 2 in the hierarchy in these circumstances. Utilizing these techniques may result in transfers between Level 1 and Level 2. For restricted equity securities and private placements where
Annual Report
3. Significant Accounting Policies - continued
Security Valuation - continued
observable inputs are limited, assumptions about market activity and risk are used and are categorized as Level 3 in the hierarchy.
Debt securities, including restricted securities, are valued based on evaluated prices received from independent pricing services or from dealers who make markets in such securities. For corporate bonds and floating rate loans, pricing services utilize matrix pricing which considers yield or price of bonds of comparable quality, coupon, maturity and type as well as dealer supplied prices and are generally categorized as Level 2 in the hierarchy. When independent prices are unavailable or unreliable, debt securities may be valued utilizing pricing matrices which consider similar factors that would be used by independent pricing services. These are generally categorized as Level 2 in the hierarchy but may be Level 3 depending on the circumstances.
Investments in open-end mutual funds, including the Fidelity Central Funds, are valued at their closing net asset value each business day and are categorized as Level 1 in the hierarchy.
New Accounting Pronouncements. In May 2011, the Financial Accounting Standards Board issued Accounting Standard Update No. 2011-04, Fair Value Measurement (Topic 820) - Amendments to Achieve Common Fair Value Measurement and Disclosure Requirements in U.S. GAAP and IFRSs. The update is effective during interim and annual periods beginning after December 15, 2011 and will result in additional disclosure for transfers between levels as well as expanded disclosure for securities categorized as Level 3 under the fair value hierarchy.
In December 2011, the Financial Accounting Standards Board issued Accounting Standard Update No. 2011-11, Disclosures about Offsetting Assets and Liabilities. The update creates new disclosure requirements requiring entities to disclose both gross and net information for derivatives and other financial instruments that are either offset in the Statement of Assets and Liabilities or subject to an enforceable master netting arrangement or similar agreement. The disclosure requirements are effective for interim and annual reporting periods beginning on or after January 1, 2013. Management is currently evaluating the impact of the update's adoption on the Fund's financial statement disclosures.
Foreign Currency. The Fund may use foreign currency contracts to facilitate transactions in foreign-denominated securities. Gains and losses from these transactions may arise from changes in the value of the foreign currency or if the counterparties do not perform under the contracts' terms.
Annual Report
Notes to Financial Statements - continued
(Amounts in thousands except percentages)
3. Significant Accounting Policies - continued
Foreign Currency - continued
Foreign-denominated assets, including investment securities, and liabilities are translated into U.S. dollars at the exchange rate at period end. Purchases and sales of investment securities, income and dividends received and expenses denominated in foreign currencies are translated into U.S. dollars at the exchange rate in effect on the transaction date.
The effects of exchange rate fluctuations on investments are included with the net realized and unrealized gain (loss) on investment securities. Other foreign currency transactions resulting in realized and unrealized gain (loss) are disclosed separately.
Investment Transactions and Income. For financial reporting purposes, the Fund's investment holdings and NAV include trades executed through the end of the last business day of the period. The NAV per share for processing shareholder transactions is calculated as of the close of business of the New York Stock Exchange (NYSE), normally 4:00 p.m. Eastern time and includes trades executed through the end of the prior business day. Gains and losses on securities sold are determined on the basis of identified cost and may include proceeds received from litigation. Dividend income is recorded on the ex-dividend date, except for certain dividends from foreign securities where the ex-dividend date may have passed, which are recorded as soon as the Fund is informed of the ex-dividend date. Non-cash dividends included in dividend income, if any, are recorded at the fair market value of the securities received. Distributions received on securities that represent a return of capital or capital gain are recorded as a reduction of cost of investments and/or as a realized gain. The Fund estimates the components of distributions received that may be considered return of capital distributions or capital gain distributions. Interest income and distributions from the Fidelity Central Funds are accrued as earned. Interest income includes coupon interest and amortization of premium and accretion of discount on debt securities. Investment income is recorded net of foreign taxes withheld where recovery of such taxes is uncertain.
Expenses. Expenses directly attributable to a fund are charged to that fund. Expenses attributable to more than one fund are allocated among the respective funds on the basis of relative net assets or other appropriate methods. Expense estimates are accrued in the period to which they relate and adjustments are made when actual amounts are known.
Deferred Trustee Compensation. Under a Deferred Compensation Plan (the Plan), independent Trustees may elect to defer receipt of a portion of their annual compensation. Deferred amounts are invested in a cross-section of Fidelity funds, are marked-to-market and remain in the Fund until distributed in accordance with the Plan. The investment of deferred amounts and the offsetting payable to the Trustees are included in the accompanying Statement of Assets and Liabilities.
Annual Report
3. Significant Accounting Policies - continued
Income Tax Information and Distributions to Shareholders. Each year, the Fund intends to qualify as a regulated investment company, including distributing substantially all of its taxable income and realized gains under Subchapter M of the Internal Revenue Code. As a result, no provision for income taxes is required. As of January 31, 2012, the Fund did not have any unrecognized tax benefits in the financial statements; nor is the Fund aware of any tax positions for which it is reasonably possible that the total amounts of unrecognized tax benefits will significantly change in the next twelve months. The Fund files a U.S. federal tax return, in addition to state and local tax returns as required. A fund's tax returns are subject to examination by the Internal Revenue Service (IRS) for a period of three fiscal years. State and local tax returns may be subject to examination for an additional fiscal year depending on the jurisdiction. Foreign taxes are provided for based on the Fund's understanding of the tax rules and rates that exist in the foreign markets in which it invests.
Distributions are declared and recorded on the ex-dividend date. Income dividends and capital gain distributions are declared separately for each class. Income and capital gain distributions are determined in accordance with income tax regulations, which may differ from GAAP.
Capital accounts within the financial statements are adjusted for permanent book-tax differences. These adjustments have no impact on net assets or the results of operations. Temporary book-tax differences will reverse in a subsequent period.
Book-tax differences are primarily due to futures transactions, foreign currency transactions, market discount, partnerships, equity-debt classifications, deferred trustees compensation, capital loss carryforwards and losses deferred due to wash sales and excise tax regulations.
The federal tax cost of investment securities and unrealized appreciation (depreciation) as of period end were as follows:
Gross unrealized appreciation | $ 1,072,962 |
Gross unrealized depreciation | (386,347) |
Net unrealized appreciation (depreciation) on securities and other investments | $ 686,615 |
|
|
Tax Cost | $ 8,260,208 |
The tax-based components of distributable earnings as of period end were as follows:
Undistributed ordinary income | $ 9,125 |
Capital loss carryforward | $ (1,768,083) |
Net unrealized appreciation (depreciation) | $ 686,699 |
Annual Report
Notes to Financial Statements - continued
(Amounts in thousands except percentages)
3. Significant Accounting Policies - continued
Income Tax Information and Distributions to Shareholders - continued
Capital loss carryforwards are only available to offset future capital gains of the Fund to the extent provided by regulations and may be limited. Under the Regulated Investment Company Modernization Act of 2010 (the Act), the Fund is permitted to carry forward capital losses incurred in taxable years beginning after December 22, 2010 for an unlimited period and such capital losses are required to be used prior to any losses that expire. Capital loss carryforwards were as follows:
Fiscal year of expiration |
|
2018 | $ (1,768,083) |
The tax character of distributions paid was as follows:
| January 31, 2012 | January 31, 2011 |
Ordinary Income | $ 215,914 | $ 254,643 |
4. Operating Policies.
Restricted Securities. The Fund may invest in securities that are subject to legal or contractual restrictions on resale. These securities generally may be resold in transactions exempt from registration or to the public if the securities are registered. Disposal of these securities may involve time-consuming negotiations and expense, and prompt sale at an acceptable price may be difficult. Information regarding restricted securities is included at the end of the Fund's Schedule of Investments.
Loans and Other Direct Debt Instruments. The Fund may invest in loans and loan participations, trade claims or other receivables. These investments may include standby financing commitments, including revolving credit facilities, that obligate the Fund to supply additional cash to the borrower on demand. Loan participations involve a risk of insolvency of the lending bank or other financial intermediary. The Fund may be contractually obligated to receive approval from the agent bank and/or borrower prior to the sale of these investments.
5. Derivative Instruments.
Risk Exposures and the Use of Derivative Instruments. The Fund used derivative instruments (derivatives), including futures contracts, in order to meet its investment objectives. The strategy is to use derivatives to increase returns and to manage exposure to certain risks as defined below. The success of any strategy involving derivatives depends on analysis of numerous economic factors, and if the strategies for investment do not work as intended, the Fund may not achieve its objectives.
Annual Report
5. Derivative Instruments - continued
Risk Exposures and the Use of Derivative Instruments - continued
The Fund's use of derivatives increased or decreased its exposure to the following risk:
Equity Risk | Equity risk relates to the fluctuations in the value of financial instruments as a result of changes in market prices (other than those arising from interest rate risk or foreign exchange risk), whether caused by factors specific to an individual investment, its issuer, or all factors affecting all instruments traded in a market or market segment. |
The Fund is also exposed to additional risks from investing in derivatives, such as liquidity risk and counterparty credit risk. Liquidity risk is the risk that the Fund will be unable to close out the derivative in the open market in a timely manner. Counterparty credit risk is the risk that the counterparty will not be able to fulfill its obligation to the Fund. Counterparty credit risk related to exchange-traded futures contracts is minimal because of the protection provided by the exchange on which they trade. Derivatives involve, to varying degrees, risk of loss in excess of the amounts recognized in the Statement of Assets and Liabilities.
Futures Contracts. A futures contract is an agreement between two parties to buy or sell a specified underlying instrument for a fixed price at a specified future date. The Fund used futures contracts to manage its exposure to the stock market.
Upon entering into a futures contract, a fund is required to deposit either cash or securities (initial margin) with a clearing broker in an amount equal to a certain percentage of the face value of the contract. Futures contracts are marked-to-market daily and subsequent payments (variation margin) are made or received by a fund depending on the daily fluctuations in the value of the futures contracts and are recorded as unrealized appreciation or (depreciation). This receivable and/or payable is included in daily variation margin on futures contracts in the Statement of Assets and Liabilities. Realized gain or (loss) is recorded upon the expiration or closing of a futures contract.
The underlying face amount at value of open futures contracts at period end, if any, is shown in the Schedule of Investments under the caption "Futures Contracts." This amount reflects each contract's exposure to the underlying instrument at period end.
During the period the Fund recognized net realized gain (loss) of $15,704 related to its investment in futures contracts. This amount is included in the Statement of Operations.
6. Purchases and Sales of Investments.
Purchases and sales of securities, other than short-term securities, aggregated $8,594,207 and $11,516,078, respectively.
Annual Report
Notes to Financial Statements - continued
(Amounts in thousands except percentages)
7. Fees and Other Transactions with Affiliates.
Management Fee. FMR and its affiliates provide the Fund with investment management related services for which the Fund pays a monthly management fee. The management fee is the sum of an individual fund fee rate that is based on an annual rate of .20% of the Fund's average net assets and an annualized group fee rate that averaged .26% during the period. The group fee rate is based upon the average net assets of all the mutual funds advised by FMR. The group fee rate decreases as assets under management increase and increases as assets under management decrease. For the period, the total annual management fee rate was .46% of the Fund's average net assets.
Transfer Agent Fees. Fidelity Investments Institutional Operations Company, Inc. (FIIOC), an affiliate of FMR, is the transfer, dividend disbursing and shareholder servicing agent for each class of the Fund. FIIOC receives account fees and asset-based fees that vary according to the account size and type of account of the shareholders of Equity-Income. FIIOC receives an asset-based fee of Class K's average net assets. FIIOC pays for typesetting, printing and mailing of shareholder reports, except proxy statements. For the period, transfer agent fees for each class were as follows:
| Amount | % of |
Equity-Income | $ 16,928 | .20 |
Class K | 1,177 | .05 |
| $ 18,105 |
|
Accounting and Security Lending Fees. Fidelity Service Company, Inc. (FSC), an affiliate of FMR, maintains the Fund's accounting records. The accounting fee is based on the level of average net assets for each month. Under a separate contract, FSC administers the security lending program. The security lending fee is based on the number and duration of lending transactions.
Brokerage Commissions. The Fund placed a portion of its portfolio transactions with brokerage firms which are affiliates of the investment adviser. The commissions paid to these affiliated firms were $280 for the period.
Interfund Lending Program. Pursuant to an Exemptive Order issued by the SEC, the Fund, along with other registered investment companies having management contracts with FMR, may participate in an interfund lending program. This program provides an alternative credit facility allowing the funds to borrow from, or lend money to, other participating affiliated funds. At period end, there were no interfund loans outstanding. The Fund's activity in this program during the period for which loans were outstanding
Annual Report
7. Fees and Other Transactions with Affiliates - continued
Interfund Lending Program - continued
was as follows:
Borrower or Lender | Average Loan | Weighted Average Interest Rate | Interest |
Borrower | $ 41,105 | .32% | $ 15 |
8. Committed Line of Credit.
The Fund participates with other funds managed by FMR or an affiliate in a $4.0 billion credit facility (the "line of credit") to be utilized for temporary or emergency purposes to fund shareholder redemptions or for other short-term liquidity purposes. The Fund has agreed to pay commitment fees on its pro-rata portion of the line of credit, which amounted to $33 and is reflected in Miscellaneous expenses on the Statement of Operations. During the period, there were no borrowings on this line of credit.
9. Security Lending.
The Fund lends portfolio securities through a lending agent from time to time in order to earn additional income. For equity securities, a lending agent is used and may loan securities to certain qualified borrowers, including Fidelity Capital Markets (FCM), a broker-dealer affiliated with the Fund. On the settlement date of the loan, the Fund receives collateral (in the form of U.S. Treasury obligations, letters of credit and/or cash) against the loaned securities and maintains collateral in an amount not less than 100% of the market value of the loaned securities during the period of the loan. The market value of the loaned securities is determined at the close of business of the Fund and any additional required collateral is delivered to the Fund on the next business day. If the borrower defaults on its obligation to return the securities loaned because of insolvency or other reasons, a fund could experience delays and costs in recovering the securities loaned or in gaining access to the collateral. Any cash collateral received is invested in the Fidelity Securities Lending Cash Central Fund. The value of loaned securities and cash collateral at period end are disclosed on the Fund's Statement of Assets and Liabilities. Security lending income represents the income earned on investing cash collateral, less rebates paid to borrowers and any lending agent fees associated with the loan, plus any premium payments received for lending certain types of securities. Security lending income is presented in the Statement of Operations as a component of income from Fidelity Central Funds. Total security lending income during the period amounted to $2,544. During the period, there were no securities loaned to FCM.
Annual Report
Notes to Financial Statements - continued
(Amounts in thousands except percentages)
10. Expense Reductions.
Many of the brokers with whom FMR places trades on behalf of the Fund provided services to the Fund in addition to trade execution. These services included payments of certain expenses on behalf of the Fund totaling $831 for the period. In addition, through arrangements with the Fund's custodian, credits realized as a result of uninvested cash balances were used to reduce the Fund's expenses. During the period, these credits reduced the Fund's custody expenses by $1.
11. Distributions to Shareholders.
Distributions to shareholders of each class were as follows:
Years ended January 31, | 2012 | 2011 A |
From net investment income |
|
|
Equity-Income | $ 168,293 | $ 208,206 |
Class K | 47,621 | 42,109 |
Class F | - | 4,328 |
Total | $ 215,914 | $ 254,643 |
A All Class F shares were redeemed on December 15, 2010.
12. Share Transactions.
Transactions for each class of shares were as follows:
| Shares | Dollars | ||
Years ended January 31, | 2012 | 2011 A | 2012 | 2011 A |
Equity-Income |
|
|
|
|
Shares sold | 17,424 | 31,836 | $ 768,861 | $ 1,308,081 |
Reinvestment of distributions | 3,805 | 4,916 | 161,431 | 201,463 |
Shares redeemed | (81,714) | (213,346) | (3,452,168) | (8,575,845) |
Net increase (decrease) | (60,485) | (176,594) | $ (2,521,876) | $ (7,066,301) |
Class K |
|
|
|
|
Shares sold | 20,736 | 18,004 | $ 882,621 | $ 725,433 |
Reinvestment of distributions | 1,117 | 1,025 | 47,621 | 42,109 |
Shares redeemed | (28,765) | (16,045) | (1,209,236) | (642,451) |
Net increase (decrease) | (6,912) | 2,984 | $ (278,994) | $ 125,091 |
Class F |
|
|
|
|
Shares sold | - | 8,722 | $ - | $ 346,459 |
Reinvestment of distributions | - | 107 | - | 4,328 |
Shares redeemed | - | (17,202) | - | (691,301) |
Net increase (decrease) | - | (8,373) | $ - | $ (340,514) |
A All Class F shares were redeemed on December 15, 2010.
Annual Report
13. Other.
The Fund's organizational documents provide former and current trustees and officers with a limited indemnification against liabilities arising in connection with the performance of their duties to the Fund. In the normal course of business, the Fund may also enter into contracts that provide general indemnifications. The Fund's maximum exposure under these arrangements is unknown as this would be dependent on future claims that may be made against the Fund. The risk of material loss from such claims is considered remote.
Annual Report
Report of Independent Registered Public Accounting Firm
To the Trustees of Fidelity Devonshire Trust and the Shareholders of Fidelity Equity-Income Fund:
In our opinion, the accompanying statement of assets and liabilities, including the schedule of investments, and the related statements of operations and of changes in net assets and the financial highlights present fairly, in all material respects, the financial position of Fidelity Equity-Income Fund (a fund of Fidelity Devonshire Trust) at January 31, 2012, the results of its operations for the year then ended, the changes in its net assets for each of the two years in the period then ended and the financial highlights for each of the periods indicated, in conformity with accounting principles generally accepted in the United States of America. These financial statements and financial highlights (hereafter referred to as "financial statements") are the responsibility of the Fidelity Equity-Income Fund's management. Our responsibility is to express an opinion on these financial statements based on our audits. We conducted our audits of these financial statements in accordance with the standards of the Public Company Accounting Oversight Board (United States). Those standards require that we plan and perform the audit to obtain reasonable assurance about whether the financial statements are free of material misstatement. An audit includes examining, on a test basis, evidence supporting the amounts and disclosures in the financial statements, assessing the accounting principles used and significant estimates made by management, and evaluating the overall financial statement presentation. We believe that our audits, which included confirmation of securities at January 31, 2012 by correspondence with the custodian, agent banks and brokers, provide a reasonable basis for our opinion.
/s/ PricewaterhouseCoopers LLP
PricewaterhouseCoopers LLP
Boston, Massachusetts
March 13, 2012
Annual Report
Trustees and Officers
The Trustees, Members of the Advisory Board, and executive officers of the trust and fund, as applicable, are listed below. The Board of Trustees governs the fund and is responsible for protecting the interests of shareholders. The Trustees are experienced executives who meet periodically throughout the year to oversee the fund's activities, review contractual arrangements with companies that provide services to the fund, oversee management of the risks associated with such activities and contractual arrangements, and review the fund's performance. Except for James C. Curvey, each of the Trustees oversees 226 funds advised by FMR or an affiliate. Mr. Curvey oversees 430 funds advised by FMR or an affiliate.
The Trustees hold office without limit in time except that (a) any Trustee may resign; (b) any Trustee may be removed by written instrument, signed by at least two-thirds of the number of Trustees prior to such removal; (c) any Trustee who requests to be retired or who has become incapacitated by illness or injury may be retired by written instrument signed by a majority of the other Trustees; and (d) any Trustee may be removed at any special meeting of shareholders by a two-thirds vote of the outstanding voting securities of the trust. Each Trustee who is not an interested person (as defined in the 1940 Act) (Independent Trustee), shall retire not later than the last day of the calendar year in which his or her 75th birthday occurs. The Independent Trustees may waive this mandatory retirement age policy with respect to individual Trustees. The executive officers and Advisory Board Members hold office without limit in time, except that any officer and Advisory Board Member may resign or may be removed by a vote of a majority of the Trustees at any regular meeting or any special meeting of the Trustees. Except as indicated, each individual has held the office shown or other offices in the same company for the past five years.
Experience, Skills, Attributes, and Qualifications of the Fund's Trustees. The Governance and Nominating Committee has adopted a statement of policy that describes the experience, qualifications, attributes, and skills that are necessary and desirable for potential Independent Trustee candidates (Statement of Policy). The Board believes that each Trustee satisfied at the time he or she was initially elected or appointed a Trustee, and continues to satisfy, the standards contemplated by the Statement of Policy. The Governance and Nominating Committee also engages professional search firms to help identify potential Independent Trustee candidates who have the experience, qualifications, attributes, and skills consistent with the Statement of Policy. From time to time, additional criteria based on the composition and skills of the current Independent Trustees, as well as experience or skills that may be appropriate in light of future changes to board composition, business conditions, and regulatory or other developments, have also been considered by the professional search firms and the Governance and Nominating Committee. In addition, the Board takes into account the Trustees' commitment and participation in Board and committee meetings, as well as their leadership of standing and ad hoc committees throughout their tenure.
In determining that a particular Trustee was and continues to be qualified to serve as a Trustee, the Board has considered a variety of criteria, none of which, in isolation, was controlling. The Board believes that, collectively, the Trustees have balanced and diverse experience, qualifications, attributes, and skills, which allow the Board to operate effectively in governing the fund and protecting the interests of shareholders. Information about the specific experience, skills, attributes, and qualifications of each Trustee, which in each case led to the Board's conclusion that the Trustee should serve (or continue to serve) as a trustee of the fund, is provided below.
Annual Report
Trustees and Officers - continued
Board Structure and Oversight Function. James C. Curvey is an interested person (as defined in the 1940 Act) and currently serves as Acting Chairman. The Trustees have determined that an interested Chairman is appropriate and benefits shareholders because an interested Chairman has a personal and professional stake in the quality and continuity of services provided to the fund. Independent Trustees exercise their informed business judgment to appoint an individual of their choosing to serve as Chairman, regardless of whether the Trustee happens to be independent or a member of management. The Independent Trustees have determined that they can act independently and effectively without having an Independent Trustee serve as Chairman and that a key structural component for assuring that they are in a position to do so is for the Independent Trustees to constitute a substantial majority for the Board. The Independent Trustees also regularly meet in executive session. Ned C. Lautenbach serves as Chairman of the Independent Trustees and as such (i) acts as a liaison between the Independent Trustees and management with respect to matters important to the Independent Trustees and (ii) with management prepares agendas for Board meetings.
Fidelity funds are overseen by different Boards of Trustees. The fund's Board oversees Fidelity's equity and high income funds and another Board oversees Fidelity's investment-grade bond, money market, and asset allocation funds. The asset allocation funds may invest in Fidelity funds overseen by the fund's Board. The use of separate Boards, each with its own committee structure, allows the Trustees of each group of Fidelity funds to focus on the unique issues of the funds they oversee, including common research, investment, and operational issues. On occasion, the separate Boards establish joint committees to address issues of overlapping consequences for the Fidelity funds overseen by each Board.
The Trustees operate using a system of committees to facilitate the timely and efficient consideration of all matters of importance to the Trustees, the fund, and fund shareholders and to facilitate compliance with legal and regulatory requirements and oversight of the fund's activities and associated risks. The Board, acting through its committees, has charged FMR and its affiliates with (i) identifying events or circumstances the occurrence of which could have demonstrably adverse effects on the fund's business and/or reputation; (ii) implementing processes and controls to lessen the possibility that such events or circumstances occur or to mitigate the effects of such events or circumstances if they do occur; and (iii) creating and maintaining a system designed to evaluate continuously business and market conditions in order to facilitate the identification and implementation processes described in (i) and (ii) above. Because the day-to-day operations and activities of the fund are carried out by or through FMR, its affiliates and other service providers, the fund's exposure to risks is mitigated but not eliminated by the processes overseen by the Trustees. While each of the Board's committees has responsibility for overseeing different aspects of the fund's activities, oversight is exercised primarily through the Operations, Audit, and Compliance Committees. In addition, the Independent Trustees have worked with FMR to enhance the Board's oversight of investment and financial risks, legal and regulatory risks, technology risks, and operational risks, including the development of additional risk reporting to the Board. For example, a working group comprised of Independent Trustees and FMR has worked and continues to work to review the Fidelity funds' valuation-related activities, reporting and risk management. Appropriate personnel, including but not limited to the fund's Chief Compliance Officer (CCO), FMR's internal auditor, the independent accountants, the fund's Treasurer and portfolio management personnel, make periodic reports to the Board's committees, as appropriate, including an annual review of FMR's risk management program for the Fidelity funds. The responsibilities of each standing committee, including their oversight responsibilities, are described further under "Standing Committees of the Fund's Trustees."
Annual Report
The fund's Statement of Additional Information (SAI) includes more information about the Trustees. To request a free copy, call Fidelity at 1-800-835-5092.
Interested Trustees*:
Correspondence intended for each Trustee who is an interested person may be sent to Fidelity Investments, 82 Devonshire Street, Boston, Massachusetts 02109.
Name, Age; Principal Occupations and Other Relevant Experience+ | |
James C. Curvey (76) | |
| Year of Election or Appointment: 2007 Mr. Curvey is Trustee and Acting Chairman of the Board of Trustees of certain Trusts. Mr. Curvey also serves as Trustee (2007-present) of other investment companies advised by FMR. Mr. Curvey is a Director of Fidelity Investments Money Management, Inc. (2009-present), Director of Fidelity Research & Analysis Co. (2009-present) and Director of FMR and FMR Co., Inc. (2007-present). Mr. Curvey is also Vice Chairman (2007-present) and Director of FMR LLC. In addition, Mr. Curvey serves as an Overseer for the Boston Symphony Orchestra and a member of the Trustees of Villanova University. Previously, Mr. Curvey was the Vice Chairman (2006-2007) and Director (2000-2007) of FMR Corp. |
Ronald P. O'Hanley (54) | |
| Year of Election or Appointment: 2011 Mr. O'Hanley is Director of FMR Co., Inc. (2010-present), Director of Fidelity Investments Money Management, Inc. (2010-present), Director of Fidelity Research & Analysis Company (2010-present), President of Fidelity Asset Management and Corporate Services and a member of Fidelity's Executive Committee (2010-present). Previously, Mr. O'Hanley served as President and Chief Executive Officer of BNY Mellon Asset Management (2007-2010). Mr. O'Hanley also served as Vice Chairman of Bank New York Mellon Corp. and a member of that firm's Executive Committee. Prior to the 2007 merger of The Bank of New York and Mellon Financial Corporation, he was Vice Chairman of Mellon Financial Corporation and President and Chief Executive Officer of Mellon Asset Management. He joined Mellon in February 1997. Mr. O'Hanley currently serves as Chairman of the Boston Public Library Foundation Board of Directors and sits on the Board of Directors of Beth Israel Deaconess Medical Center, the Board of Trustees of the Marine Biological Laboratory and the Advisory Board of the Maxwell School of Citizenship and Public Administration at Syracuse University. Mr. O'Hanley also chairs the Council on Asset Management for the Financial Services Roundtable and is a member of the Board of Directors of Institutional Investor's U.S. Institute. |
* Trustees have been determined to be "Interested Trustees" by virtue of, among other things, their affiliation with the trust or various entities under common control with FMR.
+ The information above includes each Trustee's principal occupation during the last five years and other information relating to the experience, attributes, and skills relevant to each Trustee's qualifications to serve as a Trustee, which led to the conclusion that each Trustee should serve as a Trustee for the fund.
Annual Report
Independent Trustees:
Correspondence intended for each Independent Trustee (that is, the Trustees other than the Interested Trustees) may be sent to Fidelity Investments, P.O. Box 55235, Boston, Massachusetts 02205-5235.
Name, Age; Principal Occupations and Other Relevant Experience+ | |
Dennis J. Dirks (63) | |
| Year of Election or Appointment: 2005 Prior to his retirement in May 2003, Mr. Dirks was Chief Operating Officer and a member of the Board of The Depository Trust & Clearing Corporation (DTCC). He also served as President, Chief Operating Officer, and Board member of The Depository Trust Company (DTC) and President and Board member of the National Securities Clearing Corporation (NSCC). In addition, Mr. Dirks served as Chief Executive Officer and Board member of the Government Securities Clearing Corporation, Chief Executive Officer and Board member of the Mortgage-Backed Securities Clearing Corporation, as a Trustee and a member of the Finance Committee of Manhattan College (2005-2008), and as a Trustee and a member of the Finance Committee of AHRC of Nassau County (2006-2008). Mr. Dirks is a member of the Independent Directors Council (IDC) Governing Council (2010-present) and Board of Directors for The Brookville Center for Children's Services, Inc. (2009-present). |
Alan J. Lacy (58) | |
| Year of Election or Appointment: 2008 Mr. Lacy serves as Senior Adviser (2007-present) of Oak Hill Capital Partners, L.P. (private equity). Mr. Lacy also served as Chief Executive Officer (2000-2005) and Vice Chairman (2005-2006) of Sears Holdings Corporation and Sears, Roebuck and Co. (retail). In addition, Mr. Lacy serves as a member of the Board of Directors of Dave & Buster's, Inc. (restaurant and entertainment complexes, 2010-present), The Hillman Companies, Inc. (hardware wholesalers, 2010-present), and Bristol-Myers Squibb Company (global pharmaceuticals, 2007-present). Mr. Lacy is a member of the Board of Trustees of The National Parks Conservation Association (2006-present). Previously, Mr. Lacy served as Chairman of the Board of Trustees of the National Parks Conservation Association (2008-2011) and as a member of the Board of Directors for the Western Union Company (global money transfer, 2006-2011). |
Ned C. Lautenbach (67) | |
| Year of Election or Appointment: 2000 Mr. Lautenbach is Chairman of the Independent Trustees of the Equity and High Income Funds (2006-present). Mr. Lautenbach currently serves as the Lead Director of the Eaton Corporation Board of Directors (diversified industrial, 1997-present). Mr. Lautenbach is also a member of the Board of Directors of the Philharmonic Center for the Arts in Naples, Florida (1999-present); a member of the Board of Trustees of Fairfield University (2005-present); and a member of the Council on Foreign Relations (1994-present). Previously, Mr. Lautenbach was a Partner/Advisory Partner at Clayton, Dubilier & Rice, LLC (private equity investment, 1998-2010), as well as a Director of Sony Corporation (2006-2007). |
Joseph Mauriello (67) | |
| Year of Election or Appointment: 2008 Prior to his retirement in January 2006, Mr. Mauriello served in numerous senior management positions including Deputy Chairman and Chief Operating Officer (2004-2005), and Vice Chairman of Financial Services (2002-2004) of KPMG LLP US (professional services, 1965-2005). Mr. Mauriello currently serves as a member of the Board of Directors of XL Group plc. (global insurance and re-insurance, 2006-present) and of Arcadia Resources Inc. (health care services and products, 2007-present). Previously, Mr. Mauriello served as a Director of the Hamilton Funds of the Bank of New York (2006-2007). |
Robert W. Selander (61) | |
| Year of Election or Appointment: 2011 Previously, Mr. Selander served as a Member of the Advisory Board of Fidelity's Equity and High Income Funds (2011), Executive Vice Chairman (2010), Chief Executive Officer (2009-2010), and President and Chief Executive Officer (1997-2009) of Mastercard, Inc. |
Cornelia M. Small (67) | |
| Year of Election or Appointment: 2005 Ms. Small is a member of the Board of Directors of the Teagle Foundation (2009-present). Ms. Small is also a member of the Investment Committee, and Chair (2008-present) and a member of the Board of Trustees of Smith College. In addition, Ms. Small serves on the Investment Committee of the Berkshire Taconic Community Foundation (2008-present). Previously, Ms. Small served as Chairperson of the Investment Committee (2002-2008) of Smith College. In addition, Ms. Small served as Chief Investment Officer, Director of Global Equity Investments, and a member of the Board of Directors of Scudder, Stevens & Clark and Scudder Kemper Investments. |
William S. Stavropoulos (72) | |
| Year of Election or Appointment: 2002 Mr. Stavropoulos is Vice Chairman of the Independent Trustees of the Equity and High Income Funds (2006-present). Mr. Stavropoulos serves as President and Founder of the Michigan Baseball Foundation, the Great Lakes Loons (2007-present). Mr. Stavropoulos is Chairman Emeritus of the Board of Directors of The Dow Chemical Company, where he previously served in numerous senior management positions, including President, CEO (1995-2000; 2002-2004), Chairman of the Executive Committee (2000-2006), and as a member of the Board of Directors (1990-2006). Currently, Mr. Stavropoulos is Chairman of Univar (global distributor of commodity and specialty chemicals, 2010-present), a Director of Teradata Corporation (data warehousing and technology solutions, 2008-present), Chemical Financial Corporation, Maersk Inc. (industrial conglomerate), Tyco International, Inc. (multinational manufacturing and services, 2007-present), and a member of the Advisory Board for Metalmark Capital (private equity investment, 2005-present). Mr. Stavropoulos is a special advisor to Clayton, Dubilier & Rice, LLC (private equity investment). In addition, Mr. Stavropoulos is a member of the University of Notre Dame Advisory Council for the College of Science. |
David M. Thomas (62) | |
| Year of Election or Appointment: 2008 Previously, Mr. Thomas served as Executive Chairman (2005-2006) and Chairman and Chief Executive Officer (2000-2005) of IMS Health, Inc. (pharmaceutical and healthcare information solutions). In addition, Mr. Thomas serves as a member of the Board of Directors of Fortune Brands, Inc. (consumer products), and Interpublic Group of Companies, Inc. (marketing communication, 2004-present). |
Michael E. Wiley (61) | |
| Year of Election or Appointment: 2008 Mr. Wiley also serves as a Director of Asia Pacific Exploration Consolidated (international oil and gas exploration and production, 2008-present). Mr. Wiley serves as a Director of Tesoro Corporation (independent oil refiner and marketer, 2005-present), and a Director of Bill Barrett Corporation (exploration and production, 2005-present). In addition, Mr. Wiley also serves as a Director of Post Oak Bank (privately-held bank, 2004-present). Previously, Mr. Wiley served as a member of the Board of Trustees of the University of Tulsa (2000-2006; 2007-2010), as a Senior Energy Advisor of Katzenbach Partners, LLC (consulting, 2006-2007), as an Advisory Director of Riverstone Holdings (private investment), Chairman, President, and CEO of Baker Hughes, Inc. (oilfield services, 2000-2004), and as Director of Spinnaker Exploration Company (exploration and production, 2001-2005). |
Annual Report
Trustees and Officers - continued
+ The information above includes each Trustee's principal occupation during the last five years and other information relating to the experience, attributes, and skills relevant to each Trustee's qualifications to serve as a Trustee, which led to the conclusion that each Trustee should serve as a Trustee for the fund.
Advisory Board Members and Executive Officers:
Correspondence intended for each executive officer, Edward C. Johnson 3d, and Peter S. Lynch may be sent to Fidelity Investments, 82 Devonshire Street, Boston, Massachusetts 02109.
Name, Age; Principal Occupation | |
Edward C. Johnson 3d (81) | |
| Year of Election or Appointment: 2011 Member of the Advisory Board of Fidelity's Equity and High Income Funds. Mr. Johnson serves as Chief Executive Officer, Chairman, and a Director of FMR LLC, and also serves as Chairman and Director of FIL Limited. Previously, Mr. Johnson served as a Trustee and Chairman of the Board of certain Fidelity Trusts, Chairman and a Director of FMR, Chairman and a Director of FMR Co., Inc., and President of FMR LLC (2006-2007). |
Peter S. Lynch (68) | |
| Year of Election or Appointment: 2003 Member of the Advisory Board of Fidelity's Equity and High Income Funds. Mr. Lynch is Vice Chairman and a Director of FMR and FMR Co., Inc. In addition, Mr. Lynch serves as a Trustee of Boston College and as the Chairman of the Inner-City Scholarship Fund. Previously, Mr. Lynch served on the Special Olympics International Board of Directors (1997-2006). |
Kenneth B. Robins (42) | |
| Year of Election or Appointment: 2008 President and Treasurer of Fidelity's Equity and High Income Funds. Mr. Robins also serves as President and Treasurer (2010-present) and Assistant Treasurer (2009-present) of other Fidelity funds and is an employee of Fidelity Investments (2004-present). Previously, Mr. Robins served as Deputy Treasurer of the Fidelity funds (2005-2008) and Treasurer and Chief Financial Officer of The North Carolina Capital Management Trust: Cash and Term Portfolios (2006-2008). |
Bruce T. Herring (46) | |
| Year of Election or Appointment: 2006 Vice President of certain Equity Funds. Mr. Herring also serves as President of Fidelity Research & Analysis Company (2010-present), Chief Investment Officer and Director of Fidelity Management & Research (U.K.) Inc. (2010-present) and Group Chief Investment Officer of FMR. Previously, Mr. Herring served as Vice President (2005-2006) and Senior Vice President (2006-2007) of Fidelity Management & Research Company, Vice President of FMR Co., Inc. (2001-2007) and as a portfolio manager for Fidelity U.S. Equity Funds. |
Brian B. Hogan (47) | |
| Year of Election or Appointment: 2009 Vice President of Equity and High Income Funds. Mr. Hogan also serves as President of FMR's Equity Division (2009-present). Previously, Mr. Hogan served as Senior Vice President, Equity Research of FMR (2006-2009) and as a portfolio manager. |
Scott C. Goebel (44) | |
| Year of Election or Appointment: 2008 Secretary and Chief Legal Officer (CLO) of the Fidelity funds. Mr. Goebel also serves as Secretary of Fidelity Investments Money Management, Inc. (FIMM) (2010-present) and Fidelity Research and Analysis Company (FRAC) (2010-present); Secretary and CLO of The North Carolina Capital Management Trust: Cash and Term Portfolios (2008-present); General Counsel, Secretary, and Senior Vice President of FMR (2008-present) and FMR Co., Inc. (2008-present); employed by FMR LLC or an affiliate (2001-present); Chief Legal Officer of Fidelity Management & Research (Hong Kong) Limited (2008-present) and Assistant Secretary of Fidelity Management & Research (Japan) Inc. (2008-present), and Fidelity Management & Research (U.K.) Inc. (2008-present). Previously, Mr. Goebel served as Assistant Secretary of FIMM (2008-2010), FRAC (2008-2010), and the Funds (2007-2008) and as Vice President and Secretary of Fidelity Distributors Corporation (FDC) (2005-2007). |
William C. Coffey (42) | |
| Year of Election or Appointment: 2009 Assistant Secretary of Fidelity's Equity and High Income Funds. Mr. Coffey also serves as Senior Vice President and Deputy General Counsel of FMR LLC (2010-present), and is an employee of Fidelity Investments. Previously, Mr. Coffey served as Vice President and Associate General Counsel of FMR LLC (2005-2009). |
Holly C. Laurent (57) | |
| Year of Election or Appointment: 2008 Anti-Money Laundering (AML) Officer of the Fidelity funds. Ms. Laurent also serves as AML Officer of The North Carolina Capital Management Trust: Cash and Term Portfolios (2008-present) and is an employee of Fidelity Investments. Previously, Ms. Laurent was Senior Vice President and Head of Legal for Fidelity Business Services India Pvt. Ltd. (2006-2008), and Senior Vice President, Deputy General Counsel and Group Head for FMR LLC (2005-2006). |
Christine Reynolds (53) | |
| Year of Election or Appointment: 2008 Chief Financial Officer of the Fidelity funds. Ms. Reynolds became President of Fidelity Pricing and Cash Management Services (FPCMS) in August 2008. Ms. Reynolds served as Chief Operating Officer of FPCMS (2007-2008). Previously, Ms. Reynolds served as President, Treasurer, and Anti-Money Laundering officer of the Fidelity funds (2004-2007). |
Kenneth A. Rathgeber (64) | |
| Year of Election or Appointment: 2004 Chief Compliance Officer of Fidelity's Equity and High Income Funds. Mr. Rathgeber is Chief Compliance Officer of Fidelity Management & Research (Hong Kong) Limited (2008-present), Fidelity Management & Research (Japan) Inc. (2008-present), FMR (2005-present), FMR Co., Inc. (2005-present), Fidelity Management & Research (U.K.) Inc. (2005-present), Fidelity Research & Analysis Company (2005-present), Fidelity Investments Money Management, Inc. (2005-present), Pyramis Global Advisors, LLC (2005-present), and Strategic Advisers, Inc. (2005-present). |
Joseph F. Zambello (54) | |
| Year of Election or Appointment: 2011 Deputy Treasurer of the Fidelity funds. Mr. Zambello is an employee of Fidelity Investments. Previously, Mr. Zambello served as Vice President of FMR's Program Management Group (2009-2011) and Vice President of the Transfer Agent Oversight Group (2005-2009). |
Adrien E. Deberghes (44) | |
| Year of Election or Appointment: 2008 Deputy Treasurer of Fidelity's Equity and High Income Funds. Mr. Deberghes also serves as Vice President and Assistant Treasurer of Fidelity Rutland Square Trust II and Fidelity Commonwealth Trust II (2011-present), Assistant Treasurer of other Fidelity funds (2010-present), and is an employee of Fidelity Investments (2008-present). Previously, Mr. Deberghes served as Senior Vice President of Mutual Fund Administration at State Street Corporation (2007-2008), Senior Director of Mutual Fund Administration at Investors Bank & Trust (2005-2007), and Director of Finance for Dunkin' Brands (2000-2005). |
Stephanie J. Dorsey (42) | |
| Year of Election or Appointment: 2010 Assistant Treasurer of Fidelity's Equity and High Income Funds. Ms. Dorsey also serves as Deputy Treasurer of other Fidelity funds (2008-present) and is an employee of Fidelity Investments (2008-present). Previously, Ms. Dorsey served as Treasurer (2004-2008) of the JPMorgan Mutual Funds and Vice President (2004-2008) of JPMorgan Chase Bank. |
John R. Hebble (53) | |
| Year of Election or Appointment: 2009 Assistant Treasurer of Fidelity's Equity and High Income Funds. Mr. Hebble also serves as President (2011-present), Treasurer, and Chief Financial Officer of The North Carolina Capital Management Trust: Cash and Term Portfolios (2008-present), President and Treasurer of other Fidelity funds (2008-present) and is an employee of Fidelity Investments. |
Gary W. Ryan (53) | |
| Year of Election or Appointment: 2005 Assistant Treasurer of the Fidelity funds. Mr. Ryan is an employee of Fidelity Investments. Previously, Mr. Ryan served as Vice President of Fund Reporting in Fidelity Pricing and Cash Management Services (FPCMS) (1999-2005). |
Jonathan Davis (43) | |
| Year of Election or Appointment: 2010 Assistant Treasurer of the Fidelity funds. Mr. Davis is also Assistant Treasurer of Fidelity Rutland Square Trust II and Fidelity Commonwealth Trust II. Mr. Davis is an employee of Fidelity Investments. Previously, Mr. Davis served as Vice President and Associate General Counsel of FMR LLC (2003-2010). |
Annual Report
Distributions (Unaudited)
A total of 0.02% of the dividends distributed during the fiscal year was derived from interest on U.S. Government securities which is generally exempt from state income tax.
Class K designates 83%, 85%, 85% and 86% of the dividends distributed in April, July, October and December 2011, respectively during the fiscal year as qualifying for the dividends-received deduction for corporate shareholders.
Class K designates 100% of the dividends distributed during the fiscal year as amounts which may be taken into account as a dividend for the purposes of the maximum rate under section 1(h)(11) of the Internal Revenue Code.
The fund will notify shareholders in January 2013 of amounts for use in preparing 2012 income tax returns.
Annual Report
Managing Your Investments
Fidelity offers several ways to conveniently manage your workplace benefits (including your workplace savings plan, investments, and additional services) via your telephone or PC. You can access your plan and account information and research your investments 24 hours a day.
By Phone
Fidelity provides a single toll-free number to access plan information, account balances, positions, and quotes*. It's easy to navigate the service, and on your first call, the system will help you create a personal identification number (PIN) for security.
(phone graphic)Fidelity Workplace
Investing
1-800-835-5092
By PC
Fidelity's web site on the Internet provides a wide range of information, including plan information, daily financial news, fund performance, interactive planning tools, and news about Fidelity products and services.
(computer graphic)Fidelity's Web Site
www.401k.com
* When you call the quotes line, please remember that a fund's yield and return will vary and, except for money market funds, share price will also vary. This means that you may have a gain or loss when you sell your shares. There is no assurance that money market funds will be able to maintain a stable $1 share price; an investment in a money market fund is not insured or guaranteed by the U.S. government. Total returns are historical and include changes in share price, reinvestment of dividends and capital gains distributions, and the effects of any sales charges.
Annual Report
To Write Fidelity
We'll give your correspondence immediate attention and send you written confirmation upon completion of your request.
(envelope graphic)For Non-Retirement
Accounts
Buying shares
Fidelity Investments
P.O. Box 770001
Cincinnati, OH 45277-0003
Overnight Express
Fidelity Investments
Attn: Distribution Services
100 Crosby Parkway - KC1H
Covington, KY 41015
Selling shares
Fidelity Investments
P.O. Box 770001
Cincinnati, OH 45277-0035
Overnight Express
Fidelity Investments
Attn: Distribution Services
100 Crosby Parkway - KC1H
Covington, KY 41015
General Correspondence
Fidelity Investments
P.O. Box 500
Merrimack, NH 03054-0500
(envelope graphic)For Retirement
Accounts
Buying shares
Fidelity Investments
P.O. Box 770001
Cincinnati, OH 45277-0003
Selling shares
Fidelity Investments
P.O. Box 770001
Cincinnati, OH 45277-0035
Overnight Express
Fidelity Investments
Attn: Distribution Services
100 Crosby Parkway - KC1H
Covington, KY 41015
General Correspondence
Fidelity Investments
P.O. Box 500
Merrimack, NH 03054-0500
Annual Report
Investment Adviser
Fidelity Management & Research Company
Boston, MA
Investment Sub-Advisers
FMR Co., Inc.
Fidelity Management & Research
(U.K.) Inc.
Fidelity Management & Research
(Hong Kong) Limited
Fidelity Management & Research
(Japan) Inc.
General Distributor
Fidelity Distributors Corporation
Boston, MA
Transfer and Service Agents
Fidelity Investments Institutional
Operations Company, Inc.
Boston, MA
Fidelity Service Company, Inc.
Boston, MA
Custodian
The Northern Trust Company
Chicago, IL
EQU-K-UANN-0312
1.863281.103
(Fidelity Investment logo)(registered trademark)
Corporate Headquarters
82 Devonshire St., Boston, MA 02109
www.fidelity.com
Fidelity®
Large Cap Growth
Fund
Annual Report
January 31, 2012
(Fidelity Cover Art)
Contents
Chairman's Message | The Chairman's message to shareholders. | |
Performance | How the fund has done over time. | |
Management's Discussion of Fund Performance | The Portfolio Manager's review of fund performance and strategy. | |
Shareholder Expense Example | An example of shareholder expenses. | |
Investment Changes | A summary of major shifts in the fund's investments over the past six months. | |
Investments | A complete list of the fund's investments with their market values. | |
Financial Statements | Statements of assets and liabilities, operations, and changes in net assets, as well as financial highlights. | |
Notes | Notes to the financial statements. | |
Report of Independent Registered Public Accounting Firm |
| |
Trustees and Officers |
|
To view a fund's proxy voting guidelines and proxy voting record for the 12-month period ended June 30, visit http://www.fidelity.com/proxyvotingresults or visit the Securities and Exchange Commission's (SEC) web site at http://www.sec.gov. You may also call 1-800-544-8544 to request a free copy of the proxy voting guidelines.
Standard & Poor's, S&P and S&P 500 are registered service marks of The McGraw-Hill Companies, Inc. and have been licensed for use by Fidelity Distributors Corporation.
Other third party marks appearing herein are the property of their respective owners.
All other marks appearing herein are registered or unregistered trademarks or service marks of FMR LLC or an affiliated company.
Annual Report
This report and the financial statements contained herein are submitted for the general information of the shareholders of the fund. This report is not authorized for distribution to prospective investors in the fund unless preceded or accompanied by an effective prospectus.
A fund files its complete schedule of portfolio holdings with the SEC for the first and third quarters of each fiscal year on Form N-Q. Forms N-Q are available on the SEC's web site at http://www.sec.gov. A fund's Forms N-Q may be reviewed and copied at the SEC's Public Reference Room in Washington, DC. Information regarding the operation of the SEC's Public Reference Room may be obtained by calling 1-800-SEC-0330. For a complete list of a fund's portfolio holdings, view the most recent holdings listing, semiannual report, or annual report on Fidelity's web site at http://www.fidelity.com, http://www.advisor.fidelity.com, or http://www.401k.com, as applicable.
NOT FDIC INSURED • MAY LOSE VALUE • NO BANK GUARANTEE
Neither the fund nor Fidelity Distributors Corporation is a bank.
Annual Report
Chairman's Message
(photo_of_James_C_Curvey)
Dear Shareholder:
Following a year marked by unusually high volatility, 2012 began with most major asset classes advancing steadily in January. For U.S. equities, it was the strongest start to a new year since 1997. International stocks fared even better, despite continued uncertainty related to the sovereign debt crisis in Europe. Investors have been acutely sensitive to the latest news, for better or worse, coming out of the eurozone and its impact on financial markets. As we look ahead, the unresolved debt crisis in Europe remains at the center of a series of risk factors, summarized below, that we believe have the greatest potential to influence the global investment landscape.
Deleveraging and the economy
In the euro-currency area, fiscal austerity among nations and debt deleveraging among financial companies loaded with sovereign debt are deflationary measures and serve to hinder economic growth in the short term. Such an economic and financial-market scenario has not been historically supportive of strong performance among riskier assets, and emerges at a time when many nations need a resurgent economy to assist them in closing their budget deficits and in building confidence among bond buyers to help them refinance their existing debt obligations.
Slowdown in China and Europe
China's economy is the second-largest in the world, and it has been the biggest contributor to global growth since the end of the last recession. Thus, the slower pace of domestic growth in China has led to lower demand for imports of commodities and other construction materials from the rest of the world. In addition, economic weakness in Europe and the broad-based global economic slowdown are putting pressure on China's export growth, which has been largely responsible for its breakneck pace of annual gross domestic product (GDP) growth during the past three decades.
Credit deterioration and contagion
The heightened macroeconomic risk and elevated credit risk swirling around certain European nations and financial institutions have caused many market participants to avoid purchases of or reduce exposure to short-term debt offerings by these issuers. With increased credit risk, there are growing concerns about the potential credit contraction and contagion from European issuers spreading to other financial markets.
We invite you to learn more by visiting us on the Internet or calling us by phone. It is our privilege to provide the resources you need to choose investments that are right for you.
Sincerely,
(The acting chairman's signature appears here.)
James C. Curvey
Acting Chairman
Annual Report
Performance: The Bottom Line
Average annual total return reflects the change in the value of an investment, assuming reinvestment of the class' distributions from dividend income and capital gains (the profits earned upon the sale of securities that have grown in value, if any) and assuming a constant rate of performance each year. The $10,000 table and the fund's returns do not reflect the deduction of taxes that a shareholder would pay on fund distributions or the redemption of fund shares. During periods of reimbursement by Fidelity, a fund's total return will be greater than it would be had the reimbursement not occurred. How a fund did yesterday is no guarantee of how it will do tomorrow.
Average Annual Total Returns
Periods ended January 31, 2012 | Past 1 | Past 5 | Past 10 |
Fidelity® Large Cap Growth Fund | 4.33% | -0.36% | 2.21% |
$10,000 Over 10 Years
Let's say hypothetically that $10,000 was invested in Fidelity® Large Cap Growth Fund, a class of the fund, on January 31, 2002. The chart shows how the value of your investment would have changed, and also shows how the Russell 1000® Growth Index performed over the same period.
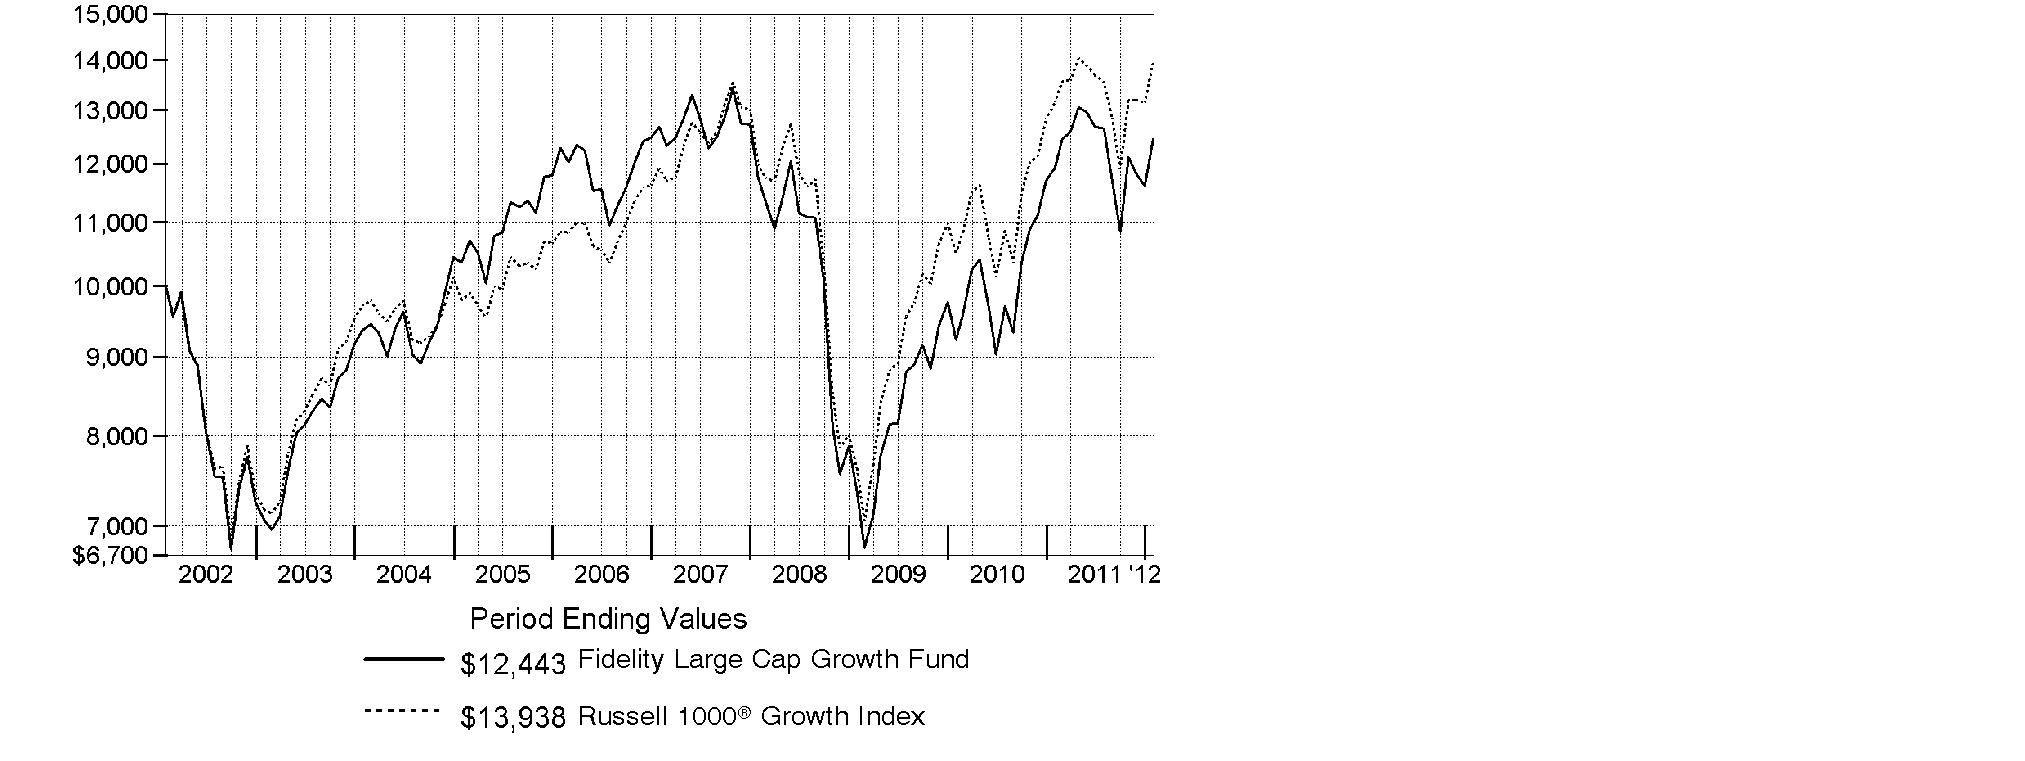
Annual Report
Management's Discussion of Fund Performance
Market Recap: After enduring one of the most volatile trading periods on record, U.S. stocks posted a gain for the 12 months ending January 31, 2012, sparked by a January rally. Strong corporate earnings reports and hints of economic recovery sent stocks mostly upward through April, when sovereign debt woes in Europe sparked fear of a global slowdown. In the summer, equities plummeted on eurozone instability, debate over the U.S. debt ceiling and a historic downgrade of the nation's sovereign debt rating. After falling as much as 13% by early August, the broad-based S&P 500® Index seesawed back to end the period on an optimistic note. For the full 12 months, the S&P 500® rose 4.22%, while the technology-laden Nasdaq Composite® Index added 5.26%. Investors began to shed perceived riskier smaller-cap stocks in favor of larger, more-established and dividend-paying names, helping to drive the Dow Jones® Industrial Average up 9.12% for the year, while the Russell 2000® - a proxy for small-caps - and Russell Midcap® indexes added 2.86% and 2.25%, respectively. Within the S&P 500®, defensive sectors such as health care (+16%) and utilities (+14%) fared best, while financials (-12%) struggled. Foreign developed-markets stocks were stung by Europe's turmoil, and the MSCI® EAFE® (Europe, Australasia, Far East) Index fell 9.49%.
Comments from Jeffrey Feingold, Portfolio Manager of Fidelity® Large Cap Growth Fund for most of the period covered by this update: For the year, the fund's Retail Class shares returned 4.33%, versus the 6.07% gain of its benchmark, the Russell 1000® Growth Index. Security selection was disappointing relative to the index, particularly in the information technology, industrials, financials and energy sectors. In terms of individual detractors, not owning tobacco company and index component Philip Morris International hurt, as safer-haven, dividend-paying stocks rallied nicely. Within tech, NVIDIA, which makes graphics processors for computers and mobile devices, saw its share price decline due to end market weakness and softer demand for some newer products. Underweightings in two strong performing index constituents - fast-food chain McDonald's and IT leader International Business Machines - further detracted. Conversely, investments in consumer discretionary and consumer staples aided relative results. Top individual contributors included Tempur-Pedic International, a manufacturer of premium bedding, and Herbalife, which makes weight-management products and nutritional supplements. Herbalife was no longer owned by the fund at period end.
Note to shareholders: Daniel Kelley became Portfolio Manager on January 12, 2012.
The views expressed above reflect those of the portfolio manager(s) only through the end of the period as stated on the cover of this report and do not necessarily represent the views of Fidelity or any other person in the Fidelity organization. Any such views are subject to change at any time based upon market or other conditions and Fidelity disclaims any responsibility to update such views. These views may not be relied on as investment advice and, because investment decisions for a Fidelity fund are based on numerous factors, may not be relied on as an indication of trading intent on behalf of any Fidelity fund.
Annual Report
Shareholder Expense Example
As a shareholder of the Fund, you incur two types of costs: (1) transaction costs, including sales charges (loads) on purchase payments or redemption proceeds, and (2) ongoing costs, including management fees, distribution and/or service (12b-1) fees and other Fund expenses. This Example is intended to help you understand your ongoing costs (in dollars) of investing in the Fund and to compare these costs with the ongoing costs of investing in other mutual funds.
The Example is based on an investment of $1,000 invested at the beginning of the period and held for the entire period (August 1, 2011 to January 31, 2012).
Actual Expenses
The first line of the accompanying table for each class of the Fund provides information about actual account values and actual expenses. You may use the information in this line, together with the amount you invested, to estimate the expenses that you paid over the period. Simply divide your account value by $1,000.00 (for example, an $8,600 account value divided by $1,000.00 = 8.6), then multiply the result by the number in the first line for a class of the Fund under the heading entitled "Expenses Paid During Period" to estimate the expenses you paid on your account during this period. A small balance maintenance fee of $12.00 that is charged once a year may apply for certain accounts with a value of less than $2,000. This fee is not included in the table below. If it was, the estimate of expenses you paid during the period would be higher, and your ending account value lower, by this amount. In addition, the Fund, as a shareholder in the underlying Fidelity Central Funds, will indirectly bear its pro-rata share of the fees and expenses incurred by the underlying Fidelity Central Funds. These fees and expenses are not included in the Fund's annualized expense ratio used to calculate the expense estimate in the table below.
Hypothetical Example for Comparison Purposes
The second line of the accompanying table for each class of the Fund provides information about hypothetical account values and hypothetical expenses based on a Class' actual expense ratio and an assumed rate of return of 5% per year before expenses, which is not the Class' actual return. The hypothetical account values and expenses may not be used to estimate the actual ending account balance or expenses you paid for the period. You may use this information to compare the ongoing costs of investing in the Fund and other funds. To do so, compare this 5% hypothetical example with the 5% hypothetical examples that appear in the shareholder reports of the other funds. A small balance maintenance fee of $12.00 that is charged once a year may apply for certain accounts with a value of less than $2,000. This fee is not included in the table below. If it was, the estimate of expenses you paid during the period would be higher, and your ending account value lower, by this amount. In addition, the Fund, as a shareholder in the underlying Fidelity Central Funds, will indirectly bear its pro-rata share of the fees and expenses incurred by the underlying Fidelity Central Funds. These fees and expenses are not included in the Fund's annualized expense ratio used to calculate the expense estimate in the table below.
Please note that the expenses shown in the table are meant to highlight your ongoing costs only and do not reflect any transaction costs. Therefore, the second line of the table is useful in comparing ongoing costs only, and will not help you determine the relative total costs of owning different funds. In addition, if these transactional costs were included, your costs would have been higher.
Annual Report
Shareholder Expense Example - continued
| Annualized | Beginning | Ending | Expenses Paid |
Class A | 1.12% |
|
|
|
Actual |
| $ 1,000.00 | $ 982.70 | $ 5.60 |
HypotheticalA |
| $ 1,000.00 | $ 1,019.56 | $ 5.70 |
Class T | 1.38% |
|
|
|
Actual |
| $ 1,000.00 | $ 981.60 | $ 6.89 |
HypotheticalA |
| $ 1,000.00 | $ 1,018.25 | $ 7.02 |
Class B | 1.85% |
|
|
|
Actual |
| $ 1,000.00 | $ 978.50 | $ 9.23 |
HypotheticalA |
| $ 1,000.00 | $ 1,015.88 | $ 9.40 |
Class C | 1.86% |
|
|
|
Actual |
| $ 1,000.00 | $ 978.30 | $ 9.27 |
HypotheticalA |
| $ 1,000.00 | $ 1,015.83 | $ 9.45 |
Large Cap Growth | .82% |
|
|
|
Actual |
| $ 1,000.00 | $ 983.90 | $ 4.10 |
HypotheticalA |
| $ 1,000.00 | $ 1,021.07 | $ 4.18 |
Institutional Class | .76% |
|
|
|
Actual |
| $ 1,000.00 | $ 983.90 | $ 3.80 |
HypotheticalA |
| $ 1,000.00 | $ 1,021.37 | $ 3.87 |
A 5% return per year before expenses
* Expenses are equal to each Class' annualized expense ratio, multiplied by the average account value over the period, multiplied by 184/365 (to reflect the one-half year period).
Annual Report
Investment Changes (Unaudited)
Top Ten Stocks as of January 31, 2012 | ||
| % of fund's | % of fund's net assets |
Apple, Inc. | 7.6 | 7.4 |
Exxon Mobil Corp. | 3.0 | 3.8 |
Google, Inc. Class A | 2.7 | 3.8 |
Oracle Corp. | 2.1 | 1.9 |
Microsoft Corp. | 2.0 | 0.1 |
QUALCOMM, Inc. | 1.9 | 2.0 |
United Technologies Corp. | 1.6 | 1.5 |
Amazon.com, Inc. | 1.6 | 2.5 |
Cognizant Technology Solutions Corp. Class A | 1.5 | 2.1 |
Motorola Solutions, Inc. | 1.4 | 0.0 |
| 25.4 | |
Top Five Market Sectors as of January 31, 2012 | ||
| % of fund's | % of fund's net assets 6 months ago |
Information Technology | 30.4 | 29.3 |
Consumer Discretionary | 15.7 | 13.9 |
Industrials | 10.9 | 12.0 |
Health Care | 10.8 | 10.4 |
Consumer Staples | 10.0 | 11.0 |
Asset Allocation (% of fund's net assets) | |||||||
As of January 31, 2012* | As of July 31, 2011** | ||||||
| Stocks 98.5% |
| | Stocks 100.1% |
| ||
| Short-Term |
|  | Short-Term |
| ||
* Foreign investments | 10.2% |
| ** Foreign investments | 13.5% |
| ||

† Short-Term Investments and Net Other Assets are not included in the pie chart |
Annual Report
Investments January 31, 2012
Showing Percentage of Net Assets
Common Stocks - 98.5% | |||
Shares | Value | ||
CONSUMER DISCRETIONARY - 15.7% | |||
Auto Components - 0.1% | |||
Gentex Corp. | 7,700 | $ 206,899 | |
Automobiles - 0.9% | |||
Bayerische Motoren Werke AG (BMW) | 6,566 | 561,569 | |
Ford Motor Co. | 62,263 | 773,306 | |
Tesla Motors, Inc. (a) | 900 | 26,163 | |
| 1,361,038 | ||
Diversified Consumer Services - 0.5% | |||
Weight Watchers International, Inc. | 10,300 | 784,139 | |
Hotels, Restaurants & Leisure - 2.5% | |||
Brinker International, Inc. | 46,500 | 1,202,025 | |
Chipotle Mexican Grill, Inc. (a) | 1,500 | 550,935 | |
Dunkin' Brands Group, Inc. (a) | 12,100 | 334,565 | |
Las Vegas Sands Corp. | 24,500 | 1,203,195 | |
McDonald's Corp. | 7,600 | 752,780 | |
| 4,043,500 | ||
Household Durables - 2.1% | |||
D.R. Horton, Inc. | 82,900 | 1,153,968 | |
Lennar Corp. Class A | 4,700 | 101,003 | |
PulteGroup, Inc. (a) | 31,800 | 236,910 | |
Ryland Group, Inc. | 23,300 | 424,060 | |
Tempur-Pedic International, Inc. (a) | 19,800 | 1,320,858 | |
Toll Brothers, Inc. (a) | 4,400 | 95,964 | |
| 3,332,763 | ||
Internet & Catalog Retail - 1.6% | |||
Amazon.com, Inc. (a) | 13,000 | 2,527,720 | |
Multiline Retail - 1.2% | |||
Dollar General Corp. (a) | 23,500 | 1,001,335 | |
Dollar Tree, Inc. (a) | 10,700 | 907,467 | |
| 1,908,802 | ||
Specialty Retail - 4.2% | |||
American Eagle Outfitters, Inc. | 34,600 | 487,514 | |
AutoZone, Inc. (a) | 1,500 | 521,820 | |
Bed Bath & Beyond, Inc. (a) | 13,400 | 813,380 | |
Limited Brands, Inc. | 18,000 | 753,480 | |
Lowe's Companies, Inc. | 54,800 | 1,470,284 | |
Sally Beauty Holdings, Inc. (a) | 33,700 | 694,894 | |
TJX Companies, Inc. | 20,300 | 1,383,242 | |
Common Stocks - continued | |||
Shares | Value | ||
CONSUMER DISCRETIONARY - continued | |||
Specialty Retail - continued | |||
Tractor Supply Co. | 4,200 | $ 339,234 | |
Williams-Sonoma, Inc. | 8,000 | 286,880 | |
| 6,750,728 | ||
Textiles, Apparel & Luxury Goods - 2.6% | |||
Deckers Outdoor Corp. (a) | 18,200 | 1,471,470 | |
Pandora A/S | 10,200 | 133,706 | |
PVH Corp. | 14,800 | 1,142,412 | |
Ralph Lauren Corp. | 4,300 | 653,600 | |
Under Armour, Inc. Class A (sub. vtg.) (a) | 8,200 | 652,884 | |
| 4,054,072 | ||
TOTAL CONSUMER DISCRETIONARY | 24,969,661 | ||
CONSUMER STAPLES - 10.0% | |||
Beverages - 2.6% | |||
Anheuser-Busch InBev SA NV | 10,300 | 626,204 | |
Diageo PLC sponsored ADR | 9,100 | 806,169 | |
Dr Pepper Snapple Group, Inc. | 34,500 | 1,339,290 | |
The Coca-Cola Co. | 21,800 | 1,472,154 | |
| 4,243,817 | ||
Food & Staples Retailing - 2.1% | |||
CVS Caremark Corp. | 16,100 | 672,175 | |
Drogasil SA | 55,700 | 462,254 | |
Wal-Mart Stores, Inc. | 18,068 | 1,108,652 | |
Walgreen Co. | 7,600 | 253,536 | |
Whole Foods Market, Inc. | 11,300 | 836,539 | |
| 3,333,156 | ||
Food Products - 1.0% | |||
Corn Products International, Inc. | 8,400 | 466,116 | |
Green Mountain Coffee Roasters, Inc. (a)(d) | 21,100 | 1,125,474 | |
| 1,591,590 | ||
Household Products - 2.4% | |||
Colgate-Palmolive Co. | 21,700 | 1,968,624 | |
Kimberly-Clark Corp. | 11,200 | 801,472 | |
Procter & Gamble Co. | 15,800 | 996,032 | |
| 3,766,128 | ||
Personal Products - 0.6% | |||
Schiff Nutrition International, Inc. (a) | 92,386 | 985,759 | |
Common Stocks - continued | |||
Shares | Value | ||
CONSUMER STAPLES - continued | |||
Tobacco - 1.3% | |||
Altria Group, Inc. | 61,600 | $ 1,749,440 | |
Japan Tobacco, Inc. | 62 | 304,998 | |
| 2,054,438 | ||
TOTAL CONSUMER STAPLES | 15,974,888 | ||
ENERGY - 9.9% | |||
Energy Equipment & Services - 3.0% | |||
Cameron International Corp. (a) | 14,700 | 782,040 | |
Dresser-Rand Group, Inc. (a) | 12,800 | 655,744 | |
Halliburton Co. | 38,800 | 1,427,064 | |
McDermott International, Inc. (a) | 11,200 | 136,192 | |
Noble Corp. | 13,800 | 480,792 | |
Oceaneering International, Inc. | 13,900 | 675,401 | |
Rowan Companies, Inc. (a) | 2,200 | 74,822 | |
Schlumberger Ltd. | 7,700 | 578,809 | |
| 4,810,864 | ||
Oil, Gas & Consumable Fuels - 6.9% | |||
Alpha Natural Resources, Inc. (a) | 7,370 | 148,284 | |
Amyris, Inc. (a) | 23,400 | 209,898 | |
Apache Corp. | 9,000 | 889,920 | |
Atlas Pipeline Partners, LP | 9,500 | 356,345 | |
BP PLC sponsored ADR | 3,829 | 175,789 | |
Chevron Corp. | 9,800 | 1,010,184 | |
Exxon Mobil Corp. | 57,600 | 4,823,424 | |
Hess Corp. | 8,200 | 461,660 | |
Marathon Petroleum Corp. | 14,750 | 563,745 | |
Occidental Petroleum Corp. | 11,300 | 1,127,401 | |
SM Energy Co. | 5,000 | 362,900 | |
Southwestern Energy Co. (a) | 15,500 | 482,670 | |
Ultra Petroleum Corp. (a) | 12,000 | 288,360 | |
| 10,900,580 | ||
TOTAL ENERGY | 15,711,444 | ||
FINANCIALS - 5.3% | |||
Capital Markets - 1.0% | |||
Charles Schwab Corp. | 46,200 | 538,230 | |
Common Stocks - continued | |||
Shares | Value | ||
FINANCIALS - continued | |||
Capital Markets - continued | |||
HFF, Inc. (a) | 10,500 | $ 148,155 | |
Morgan Stanley | 51,600 | 962,340 | |
| 1,648,725 | ||
Commercial Banks - 0.6% | |||
SunTrust Banks, Inc. | 7,200 | 148,104 | |
Wells Fargo & Co. | 28,400 | 829,564 | |
| 977,668 | ||
Consumer Finance - 0.2% | |||
SLM Corp. | 20,464 | 305,937 | |
Diversified Financial Services - 1.1% | |||
Bank of America Corp. | 51,600 | 367,908 | |
Citigroup, Inc. | 20,780 | 638,362 | |
JPMorgan Chase & Co. | 20,400 | 760,920 | |
| 1,767,190 | ||
Real Estate Investment Trusts - 2.1% | |||
American Tower Corp. | 22,400 | 1,422,624 | |
Big Yellow Group PLC | 73,100 | 322,345 | |
Camden Property Trust (SBI) | 3,800 | 245,100 | |
Corporate Office Properties Trust (SBI) | 2,600 | 62,998 | |
Digital Realty Trust, Inc. | 4,500 | 318,870 | |
Equity Residential (SBI) | 6,000 | 357,300 | |
Extra Space Storage, Inc. | 15,800 | 415,856 | |
Pennsylvania Real Estate Investment Trust (SBI) | 18,800 | 230,864 | |
| 3,375,957 | ||
Real Estate Management & Development - 0.3% | |||
CBRE Group, Inc. (a) | 21,300 | 411,090 | |
TOTAL FINANCIALS | 8,486,567 | ||
HEALTH CARE - 10.8% | |||
Biotechnology - 3.6% | |||
Achillion Pharmaceuticals, Inc. (a) | 56,600 | 627,694 | |
ADVENTRX Pharmaceuticals, Inc. (a)(d) | 116,174 | 79,986 | |
ADVENTRX Pharmaceuticals, Inc. warrants 11/16/16 (a) | 39,587 | 3,365 | |
Alexion Pharmaceuticals, Inc. (a) | 7,600 | 583,376 | |
Alkermes PLC (a) | 6,200 | 116,622 | |
Amgen, Inc. | 9,100 | 617,981 | |
Ardea Biosciences, Inc. (a) | 11,500 | 209,185 | |
ARIAD Pharmaceuticals, Inc. (a) | 22,700 | 334,825 | |
Common Stocks - continued | |||
Shares | Value | ||
HEALTH CARE - continued | |||
Biotechnology - continued | |||
Biogen Idec, Inc. (a) | 8,200 | $ 966,944 | |
BioMarin Pharmaceutical, Inc. (a) | 13,700 | 488,679 | |
Dynavax Technologies Corp. (a) | 68,200 | 237,336 | |
Gilead Sciences, Inc. (a) | 26,600 | 1,299,144 | |
Theravance, Inc. (a) | 12,200 | 216,428 | |
| 5,781,565 | ||
Health Care Equipment & Supplies - 1.4% | |||
Covidien PLC | 28,700 | 1,478,050 | |
The Cooper Companies, Inc. | 9,200 | 663,688 | |
| 2,141,738 | ||
Health Care Providers & Services - 3.0% | |||
Aetna, Inc. | 8,100 | 353,970 | |
Catalyst Health Solutions, Inc. (a) | 5,600 | 306,656 | |
Express Scripts, Inc. (a) | 3,024 | 154,708 | |
Health Net, Inc. (a) | 12,900 | 486,846 | |
Laboratory Corp. of America Holdings (a) | 6,450 | 589,466 | |
McKesson Corp. | 10,100 | 825,372 | |
Medco Health Solutions, Inc. (a) | 18,400 | 1,141,168 | |
UnitedHealth Group, Inc. | 3,800 | 196,802 | |
WellPoint, Inc. | 12,000 | 771,840 | |
| 4,826,828 | ||
Life Sciences Tools & Services - 0.4% | |||
Illumina, Inc. (a) | 12,400 | 641,824 | |
Pharmaceuticals - 2.4% | |||
AVANIR Pharmaceuticals Class A (a)(d) | 27,400 | 80,556 | |
Elan Corp. PLC sponsored ADR (a) | 17,300 | 235,453 | |
Eli Lilly & Co. | 24,200 | 961,708 | |
GlaxoSmithKline PLC sponsored ADR | 17,100 | 761,634 | |
Merck & Co., Inc. | 4,200 | 160,692 | |
Sanofi-aventis sponsored ADR | 21,300 | 790,869 | |
Shire PLC sponsored ADR | 4,000 | 398,080 | |
Valeant Pharmaceuticals International, Inc. (Canada) (a) | 7,600 | 368,044 | |
| 3,757,036 | ||
TOTAL HEALTH CARE | 17,148,991 | ||
INDUSTRIALS - 10.9% | |||
Aerospace & Defense - 2.5% | |||
Raytheon Co. | 5,400 | 259,146 | |
Common Stocks - continued | |||
Shares | Value | ||
INDUSTRIALS - continued | |||
Aerospace & Defense - continued | |||
Rockwell Collins, Inc. | 9,100 | $ 526,799 | |
Textron, Inc. | 25,000 | 637,000 | |
United Technologies Corp. | 32,600 | 2,554,210 | |
| 3,977,155 | ||
Airlines - 0.3% | |||
Copa Holdings SA Class A | 6,400 | 436,096 | |
Building Products - 0.1% | |||
Armstrong World Industries, Inc. (a) | 5,000 | 233,500 | |
Construction & Engineering - 3.0% | |||
AECOM Technology Corp. (a) | 40,800 | 933,912 | |
Dycom Industries, Inc. (a) | 18,600 | 397,482 | |
Fluor Corp. | 29,600 | 1,664,704 | |
Jacobs Engineering Group, Inc. (a) | 17,200 | 769,872 | |
MasTec, Inc. (a) | 23,300 | 379,557 | |
Quanta Services, Inc. (a) | 33,160 | 716,256 | |
| 4,861,783 | ||
Electrical Equipment - 0.9% | |||
GrafTech International Ltd. (a) | 14,800 | 243,016 | |
Regal-Beloit Corp. | 14,100 | 800,457 | |
Schneider Electric SA | 5,200 | 322,928 | |
| 1,366,401 | ||
Industrial Conglomerates - 0.9% | |||
Danaher Corp. | 28,100 | 1,475,531 | |
Machinery - 2.3% | |||
Cummins, Inc. | 18,200 | 1,892,800 | |
Ingersoll-Rand PLC | 29,800 | 1,041,212 | |
Joy Global, Inc. | 5,041 | 457,168 | |
Manitowoc Co., Inc. | 26,600 | 357,504 | |
| 3,748,684 | ||
Road & Rail - 0.6% | |||
Union Pacific Corp. | 8,100 | 925,911 | |
Trading Companies & Distributors - 0.3% | |||
WESCO International, Inc. (a) | 6,700 | 421,296 | |
TOTAL INDUSTRIALS | 17,446,357 | ||
INFORMATION TECHNOLOGY - 30.4% | |||
Communications Equipment - 4.1% | |||
Acme Packet, Inc. (a) | 1,500 | 43,845 | |
Common Stocks - continued | |||
Shares | Value | ||
INFORMATION TECHNOLOGY - continued | |||
Communications Equipment - continued | |||
Motorola Solutions, Inc. | 48,300 | $ 2,241,603 | |
Polycom, Inc. (a) | 62,013 | 1,237,159 | |
QUALCOMM, Inc. | 52,800 | 3,105,696 | |
| 6,628,303 | ||
Computers & Peripherals - 7.9% | |||
Apple, Inc. (a) | 26,600 | 12,142,369 | |
SanDisk Corp. (a) | 8,600 | 394,568 | |
| 12,536,937 | ||
Electronic Equipment & Components - 0.6% | |||
Arrow Electronics, Inc. (a) | 9,300 | 383,997 | |
TE Connectivity Ltd. | 14,900 | 508,090 | |
| 892,087 | ||
Internet Software & Services - 4.5% | |||
Akamai Technologies, Inc. (a) | 3,400 | 109,650 | |
Baidu.com, Inc. sponsored ADR (a) | 4,100 | 522,832 | |
eBay, Inc. (a) | 29,000 | 916,400 | |
Facebook, Inc. Class B (e) | 6,574 | 164,350 | |
Google, Inc. Class A (a) | 7,600 | 4,408,836 | |
Rackspace Hosting, Inc. (a)(d) | 26,404 | 1,146,198 | |
| 7,268,266 | ||
IT Services - 3.2% | |||
Accenture PLC Class A | 9,500 | 544,730 | |
Cognizant Technology Solutions Corp. Class A (a) | 33,100 | 2,374,925 | |
International Business Machines Corp. | 5,400 | 1,040,040 | |
Virtusa Corp. (a) | 20,300 | 324,597 | |
Visa, Inc. Class A | 8,600 | 865,504 | |
| 5,149,796 | ||
Semiconductors & Semiconductor Equipment - 2.7% | |||
Analog Devices, Inc. | 11,700 | 457,821 | |
ASML Holding NV | 13,600 | 584,664 | |
Atmel Corp. (a) | 35,800 | 347,618 | |
Avago Technologies Ltd. | 11,400 | 386,916 | |
Broadcom Corp. Class A | 29,200 | 1,002,728 | |
Cymer, Inc. (a) | 3,800 | 189,202 | |
Freescale Semiconductor Holdings I Ltd. | 25,500 | 407,235 | |
NVIDIA Corp. (a) | 37,700 | 556,829 | |
NXP Semiconductors NV (a) | 18,800 | 399,124 | |
| 4,332,137 | ||
Common Stocks - continued | |||
Shares | Value | ||
INFORMATION TECHNOLOGY - continued | |||
Software - 7.4% | |||
Aspen Technology, Inc. (a) | 8,700 | $ 156,687 | |
Citrix Systems, Inc. (a) | 13,600 | 886,856 | |
Informatica Corp. (a) | 11,600 | 490,680 | |
Intuit, Inc. | 7,100 | 400,724 | |
Microsoft Corp. | 106,400 | 3,141,992 | |
Oracle Corp. | 117,800 | 3,321,960 | |
Red Hat, Inc. (a) | 14,100 | 653,817 | |
salesforce.com, Inc. (a) | 13,150 | 1,535,920 | |
Solera Holdings, Inc. | 13,400 | 640,118 | |
VMware, Inc. Class A (a) | 5,700 | 520,239 | |
| 11,748,993 | ||
TOTAL INFORMATION TECHNOLOGY | 48,556,519 | ||
MATERIALS - 5.5% | |||
Chemicals - 2.9% | |||
Air Products & Chemicals, Inc. | 7,900 | 695,437 | |
Ashland, Inc. | 9,900 | 624,294 | |
LyondellBasell Industries NV Class A | 15,600 | 672,360 | |
Monsanto Co. | 20,800 | 1,706,640 | |
Sigma Aldrich Corp. | 5,000 | 340,200 | |
The Mosaic Co. | 11,200 | 626,864 | |
| 4,665,795 | ||
Construction Materials - 0.5% | |||
Eagle Materials, Inc. | 13,300 | 391,153 | |
Martin Marietta Materials, Inc. (d) | 4,300 | 354,793 | |
| 745,946 | ||
Metals & Mining - 2.1% | |||
Commercial Metals Co. | 42,100 | 603,714 | |
Freeport-McMoRan Copper & Gold, Inc. | 14,000 | 646,940 | |
Goldcorp, Inc. | 8,500 | 411,119 | |
Ivanhoe Mines Ltd. (a) | 21,600 | 348,314 | |
Kinross Gold Corp. | 28,800 | 325,409 | |
Common Stocks - continued | |||
Shares | Value | ||
MATERIALS - continued | |||
Metals & Mining - continued | |||
Newmont Mining Corp. | 10,400 | $ 639,392 | |
Nucor Corp. | 9,000 | 400,410 | |
| 3,375,298 | ||
TOTAL MATERIALS | 8,787,039 | ||
TOTAL COMMON STOCKS (Cost $145,129,252) |
| ||
Money Market Funds - 2.5% | |||
|
|
|
|
Fidelity Cash Central Fund, 0.12% (b) | 2,950,174 | 2,950,174 | |
Fidelity Securities Lending Cash Central Fund, 0.12% (b)(c) | 1,108,700 | 1,108,700 | |
TOTAL MONEY MARKET FUNDS (Cost $4,058,874) |
| ||
TOTAL INVESTMENT PORTFOLIO - 101.0% (Cost $149,188,126) | 161,140,340 | ||
NET OTHER ASSETS (LIABILITIES) - (1.0)% | (1,609,392) | ||
NET ASSETS - 100% | $ 159,530,948 | ||
Legend |
(a) Non-income producing |
(b) Affiliated fund that is available only to investment companies and other accounts managed by Fidelity Investments. The rate quoted is the annualized seven-day yield of the fund at period end. A complete unaudited listing of the fund's holdings as of its most recent quarter end is available upon request. In addition, each Fidelity Central Fund's financial statements, which are not covered by the Fund's Report of Independent Registered Public Accounting Firm, are available on the SEC's website or upon request. |
(c) Investment made with cash collateral received from securities on loan. |
(d) Security or a portion of the security is on loan at period end. |
(e) Restricted securities - Investment in securities not registered under the Securities Act of 1933 (excluding 144A issues). At the end of the period, the value of restricted securities (excluding 144A issues) amounted to $164,350 or 0.1% of net assets. |
Additional information on each restricted holding is as follows: |
Security | Acquisition Date | Acquisition Cost |
Facebook, Inc. Class B | 3/31/11 - 5/19/11 | $ 164,398 |
Affiliated Central Funds |
Information regarding fiscal year to date income earned by the Fund from investments in Fidelity Central Funds is as follows: |
Fund | Income earned |
Fidelity Cash Central Fund | $ 2,819 |
Fidelity Securities Lending Cash Central Fund | 117,589 |
Total | $ 120,408 |
Other Information |
The following is a summary of the inputs used, as of January 31, 2012, involving the Fund's assets and liabilities carried at fair value. The inputs or methodology used for valuing securities may not be an indication of the risk associated with investing in those securities. For more information on valuation inputs, and their aggregation into the levels used in the tables below, please refer to the Security Valuation section in the accompanying Notes to Financial Statements. |
Valuation Inputs at Reporting Date: | ||||
Description | Total | Level 1 | Level 2 | Level 3 |
Investments in Securities: | ||||
Equities: | ||||
Consumer Discretionary | $ 24,969,661 | $ 24,969,661 | $ - | $ - |
Consumer Staples | 15,974,888 | 15,348,684 | 626,204 | - |
Energy | 15,711,444 | 15,711,444 | - | - |
Financials | 8,486,567 | 8,486,567 | - | - |
Health Care | 17,148,991 | 17,145,626 | 3,365 | - |
Industrials | 17,446,357 | 17,446,357 | - | - |
Information Technology | 48,556,519 | 48,392,169 | - | 164,350 |
Materials | 8,787,039 | 8,787,039 | - | - |
Money Market Funds | 4,058,874 | 4,058,874 | - | - |
Total Investments in Securities: | $ 161,140,340 | $ 160,346,421 | $ 629,569 | $ 164,350 |
The following is a reconciliation of Investments in Securities for which Level 3 inputs were used in determining value: |
Investments in Securities: | |
Beginning Balance | $ - |
Total Realized Gain (Loss) | - |
Total Unrealized Gain (Loss) | (48) |
Cost of Purchases | 164,398 |
Proceeds of Sales | - |
Amortization/Accretion | - |
Transfers in to Level 3 | - |
Transfers out of Level 3 | - |
Ending Balance | $ 164,350 |
The change in unrealized gain (loss) for the period attributable to Level 3 securities held at January 31, 2012 | $ (48) |
The information used in the above reconciliation represents fiscal year to date activity for any Investments in Securities identified as using Level 3 inputs at either the beginning or the end of the current fiscal period. Transfers in or out of Level 3 represent the beginning value of any Security or Instrument where a change in the pricing level occurred from the beginning to the end of the period. The cost of purchases and the proceeds of sales may include securities received or delivered through corporate actions or exchanges. Realized and unrealized gains (losses) disclosed in the reconciliation are included in Net Gain (Loss) on the Fund's Statement of Operations. |
Distribution of investments by country of issue, as a percentage of total net assets, is as follows: (Unaudited) |
United States of America | 89.8% |
Ireland | 2.1% |
United Kingdom | 1.3% |
Canada | 1.1% |
Netherlands | 1.1% |
Others (Individually Less Than 1%) | 4.6% |
| 100.0% |
See accompanying notes which are an integral part of the financial statements.
Annual Report
Financial Statements
Statement of Assets and Liabilities
| January 31, 2012 | |
Assets | ||
Investment in securities, at value (including securities loaned of $1,094,516) - See accompanying schedule: Unaffiliated issuers (cost $145,129,252) | $ 157,081,466 |
|
Fidelity Central Funds (cost $4,058,874) | 4,058,874 |
|
Total Investments (cost $149,188,126) |
| $ 161,140,340 |
Receivable for investments sold | 5,278,512 | |
Receivable for fund shares sold | 271,984 | |
Dividends receivable | 235,536 | |
Distributions receivable from Fidelity Central Funds | 10,276 | |
Prepaid expenses | 405 | |
Other receivables | 2,460 | |
Total assets | 166,939,513 | |
|
|
|
Liabilities | ||
Payable to custodian bank | $ 671 | |
Payable for investments purchased | 5,975,137 | |
Payable for fund shares redeemed | 175,059 | |
Accrued management fee | 51,732 | |
Distribution and service plan fees payable | 11,091 | |
Other affiliated payables | 37,996 | |
Other payables and accrued expenses | 48,179 | |
Collateral on securities loaned, at value | 1,108,700 | |
Total liabilities | 7,408,565 | |
|
|
|
Net Assets | $ 159,530,948 | |
Net Assets consist of: |
| |
Paid in capital | $ 165,601,509 | |
Accumulated net investment loss | (77,636) | |
Accumulated undistributed net realized gain (loss) on investments and foreign currency transactions | (17,944,865) | |
Net unrealized appreciation (depreciation) on investments and assets and liabilities in foreign currencies | 11,951,940 | |
Net Assets | $ 159,530,948 | |
See accompanying notes which are an integral part of the financial statements.
Annual Report
Statement of Assets and Liabilities - continued
| January 31, 2012 | |
Calculation of Maximum Offering Price Class A: | $ 10.24 | |
|
|
|
Maximum offering price per share (100/94.25 of $10.24) | $ 10.86 | |
Class T: | $ 10.15 | |
|
|
|
Maximum offering price per share (100/96.50 of $10.15) | $ 10.52 | |
Class B: | $ 9.99 | |
|
|
|
Class C: | $ 9.93 | |
|
|
|
|
|
|
Large Cap Growth: | $ 10.36 | |
|
|
|
Institutional Class: | $ 10.41 | |
A Redemption price per share is equal to net asset value less any applicable contingent deferred sales charge.
See accompanying notes which are an integral part of the financial statements.
Annual Report
Financial Statements - continued
Statement of Operations
| Year ended January 31, 2012 | |
Investment Income |
|
|
Dividends |
| $ 1,259,704 |
Income from Fidelity Central Funds (including $117,589 from security lending) |
| 120,408 |
Total income |
| 1,380,112 |
|
|
|
Expenses | ||
Management fee | $ 848,727 | |
Performance adjustment | (120,450) | |
Transfer agent fees | 402,876 | |
Distribution and service plan fees | 128,629 | |
Accounting and security lending fees | 59,836 | |
Custodian fees and expenses | 24,423 | |
Independent trustees' compensation | 879 | |
Registration fees | 69,466 | |
Audit | 54,122 | |
Legal | 479 | |
Miscellaneous | 1,272 | |
Total expenses before reductions | 1,470,259 | |
Expense reductions | (8,950) | 1,461,309 |
Net investment income (loss) | (81,197) | |
Realized and Unrealized Gain (Loss) Net realized gain (loss) on: | ||
Investment securities: |
|
|
Unaffiliated issuers | 18,082,876 | |
Foreign currency transactions | (20,849) | |
Total net realized gain (loss) |
| 18,062,027 |
Change in net unrealized appreciation (depreciation) on: Investment securities | (12,509,979) | |
Assets and liabilities in foreign currencies | (339) | |
Total change in net unrealized appreciation (depreciation) |
| (12,510,318) |
Net gain (loss) | 5,551,709 | |
Net increase (decrease) in net assets resulting from operations | $ 5,470,512 | |
See accompanying notes which are an integral part of the financial statements.
Annual Report
| Year ended | Year ended |
Increase (Decrease) in Net Assets |
|
|
Operations |
|
|
Net investment income (loss) | $ (81,197) | $ (93,801) |
Net realized gain (loss) | 18,062,027 | 9,819,924 |
Change in net unrealized appreciation (depreciation) | (12,510,318) | 19,527,853 |
Net increase (decrease) in net assets resulting | 5,470,512 | 29,253,976 |
Share transactions - net increase (decrease) | 17,565,380 | 1,733,380 |
Total increase (decrease) in net assets | 23,035,892 | 30,987,356 |
|
|
|
Net Assets | ||
Beginning of period | 136,495,056 | 105,507,700 |
End of period (including accumulated net investment loss of $77,636 and accumulated net investment loss of $5,902, respectively) | $ 159,530,948 | $ 136,495,056 |
See accompanying notes which are an integral part of the financial statements.
Annual Report
Financial Highlights - Class A
Years ended January 31, | 2012 | 2011 | 2010 | 2009 | 2008 H |
Selected Per-Share Data |
|
|
|
|
|
Net asset value, beginning of period | $ 9.84 | $ 7.64 | $ 6.12 | $ 9.85 | $ 11.85 |
Income from Investment Operations |
|
|
|
|
|
Net investment income (loss) E | (.03) | (.02) | .01 | .02 | (.03) |
Net realized and unrealized gain (loss) | .43 | 2.22 | 1.53 | (3.71) | (.72) |
Total from investment operations | .40 | 2.20 | 1.54 | (3.69) | (.75) |
Distributions from net investment income | - | - | (.02) | (.04) | - |
Distributions from net realized gain | - | - | - | - | (1.25) |
Total distributions | - | - | (.02) | (.04) | (1.25) |
Net asset value, end of period | $ 10.24 | $ 9.84 | $ 7.64 | $ 6.12 | $ 9.85 |
Total Return B,C,D | 4.07% | 28.80% | 25.14% | (37.49)% | (6.99)% |
Ratios to Average Net Assets F,I |
|
|
|
|
|
Expenses before reductions | 1.17% | 1.12% | 1.07% | 1.01% | 1.20% A |
Expenses net of fee waivers, if any | 1.17% | 1.12% | 1.07% | 1.01% | 1.20% A |
Expenses net of all reductions | 1.16% | 1.12% | 1.06% | 1.01% | 1.20% A |
Net investment income (loss) | (.26)% | (.28)% | .08% | .20% | (.29)% A |
Supplemental Data |
|
|
|
|
|
Net assets, end of period | $ 12,727 | $ 6,669 | $ 3,805 | $ 2,159 | $ 1,302 |
Portfolio turnover rate G | 108% | 126% | 342% | 355% | 428% |
A Annualized
B Total returns for periods of less than one year are not annualized.
C Total returns would have been lower if certain expenses had not been reduced during the applicable periods shown.
D Total returns do not include the effect of the sales charges.
E Calculated based on average shares outstanding during the period.
F Fees and expenses of any underlying Fidelity Central Funds are not included in the Fund's expense ratio. The Fund indirectly bears its proportionate share of the expenses of any underlying Fidelity Central Funds.
G Amount does not include the portfolio activity of any underlying Fidelity Central Funds.
H For the period February 13, 2007 (commencement of sale of shares) to January 31, 2008.
I Expense ratios reflect operating expenses of the class. Expenses before reductions do not reflect amounts reimbursed by the investment adviser or reductions from brokerage service arrangements or reductions from other expense offset arrangements and do not represent the amount paid by the class during periods when reimbursements or reductions occur. Expense ratios before reductions for start-up periods may not be representative of longer-term operating periods. Expenses net of fee waivers reflect expenses after reimbursement by the investment adviser but prior to reductions from brokerage service arrangements or other expense offset arrangements. Expenses net of all reductions represent the net expenses paid by the class.
See accompanying notes which are an integral part of the financial statements.
Annual Report
Financial Highlights - Class T
Years ended January 31, | 2012 | 2011 | 2010 | 2009 | 2008 H |
Selected Per-Share Data |
|
|
|
|
|
Net asset value, beginning of period | $ 9.78 | $ 7.61 | $ 6.11 | $ 9.85 | $ 11.85 |
Income from Investment Operations |
|
|
|
|
|
Net investment income (loss) E | (.05) | (.05) | (.02) | (.01) | (.06) |
Net realized and unrealized gain (loss) | .42 | 2.22 | 1.52 | (3.70) | (.69) |
Total from investment operations | .37 | 2.17 | 1.50 | (3.71) | (.75) |
Distributions from net investment income | - | - | - J | (.03) | - |
Distributions from net realized gain | - | - | - | - | (1.25) |
Total distributions | - | - | - J | (.03) | (1.25) |
Net asset value, end of period | $ 10.15 | $ 9.78 | $ 7.61 | $ 6.11 | $ 9.85 |
Total Return B,C,D | 3.78% | 28.52% | 24.60% | (37.71)% | (7.05)% |
Ratios to Average Net Assets F,I |
|
|
|
|
|
Expenses before reductions | 1.44% | 1.42% | 1.38% | 1.31% | 1.47% A |
Expenses net of fee waivers, if any | 1.44% | 1.42% | 1.38% | 1.31% | 1.47% A |
Expenses net of all reductions | 1.44% | 1.42% | 1.36% | 1.31% | 1.47% A |
Net investment income (loss) | (.53)% | (.58)% | (.23)% | (.10)% | (.56)% A |
Supplemental Data |
|
|
|
|
|
Net assets, end of period | $ 5,876 | $ 2,900 | $ 1,548 | $ 820 | $ 1,097 |
Portfolio turnover rate G | 108% | 126% | 342% | 355% | 428% |
A Annualized
B Total returns for periods of less than one year are not annualized.
C Total returns would have been lower if certain expenses had not been reduced during the applicable periods shown.
D Total returns do not include the effect of the sales charges.
E Calculated based on average shares outstanding during the period.
F Fees and expenses of any underlying Fidelity Central Funds are not included in the Fund's expense ratio. The Fund indirectly bears its proportionate share of the expenses of any underlying Fidelity Central Funds.
G Amount does not include the portfolio activity of any underlying Fidelity Central Funds.
H For the period February 13, 2007 (commencement of sale of shares) to January 31, 2008.
I Expense ratios reflect operating expenses of the class. Expenses before reductions do not reflect amounts reimbursed by the investment adviser or reductions from brokerage service arrangements or reductions from other expense offset arrangements and do not represent the amount paid by the class during periods when reimbursements or reductions occur. Expense ratios before reductions for start-up periods may not be representative of longer-term operating periods. Expenses net of fee waivers reflect expenses after reimbursement by the investment adviser but prior to reductions from brokerage service arrangements or other expense offset arrangements. Expenses net of all reductions represent the net expenses paid by the class.
J Amount represents less than $.01 per share.
See accompanying notes which are an integral part of the financial statements.
Annual Report
Financial Highlights - Class B
Years ended January 31, | 2012 | 2011 | 2010 | 2009 | 2008 H |
Selected Per-Share Data |
|
|
|
|
|
Net asset value, beginning of period | $ 9.68 | $ 7.57 | $ 6.09 | $ 9.83 | $ 11.85 |
Income from Investment Operations |
|
|
|
|
|
Net investment income (loss) E | (.10) | (.09) | (.05) | (.05) | (.12) |
Net realized and unrealized gain (loss) | .41 | 2.20 | 1.53 | (3.69) | (.70) |
Total from investment operations | .31 | 2.11 | 1.48 | (3.74) | (.82) |
Distributions from net realized gain | - | - | - | - J | (1.20) |
Total distributions | - | - | - | - J | (1.20) |
Net asset value, end of period | $ 9.99 | $ 9.68 | $ 7.57 | $ 6.09 | $ 9.83 |
Total Return B,C,D | 3.20% | 27.87% | 24.30% | (38.01)% | (7.62)% |
Ratios to Average Net Assets F,I |
|
|
|
|
|
Expenses before reductions | 1.92% | 1.87% | 1.82% | 1.76% | 1.99% A |
Expenses net of fee waivers, if any | 1.92% | 1.87% | 1.82% | 1.76% | 1.99% A |
Expenses net of all reductions | 1.92% | 1.87% | 1.80% | 1.76% | 1.99% A |
Net investment income (loss) | (1.01)% | (1.03)% | (.67)% | (.56)% | (1.07)% A |
Supplemental Data |
|
|
|
|
|
Net assets, end of period | $ 1,610 | $ 2,143 | $ 1,466 | $ 815 | $ 543 |
Portfolio turnover rate G | 108% | 126% | 342% | 355% | 428% |
A Annualized
B Total returns for periods of less than one year are not annualized.
C Total returns would have been lower if certain expenses had not been reduced during the applicable periods shown.
D Total returns do not include the effect of the contingent deferred sales charge.
E Calculated based on average shares outstanding during the period.
F Fees and expenses of any underlying Fidelity Central Funds are not included in the Fund's expense ratio. The Fund indirectly bears its proportionate share of the expenses of any underlying Fidelity Central Funds.
G Amount does not include the portfolio activity of any underlying Fidelity Central Funds.
H For the period February 13, 2007 (commencement of sale of shares) to January 31, 2008.
I Expense ratios reflect operating expenses of the class. Expenses before reductions do not reflect amounts reimbursed by the investment adviser or reductions from brokerage service arrangements or reductions from other expense offset arrangements and do not represent the amount paid by the class during periods when reimbursements or reductions occur. Expense ratios before reductions for start-up periods may not be representative of longer-term operating periods. Expenses net of fee waivers reflect expenses after reimbursement by the investment adviser but prior to reductions from brokerage service arrangements or other expense offset arrangements. Expenses net of all reductions represent the net expenses paid by the class.
J Amount represents less than $.01 per share.
See accompanying notes which are an integral part of the financial statements.
Annual Report
Financial Highlights - Class C
Years ended January 31, | 2012 | 2011 | 2010 | 2009 | 2008 H |
Selected Per-Share Data |
|
|
|
|
|
Net asset value, beginning of period | $ 9.62 | $ 7.52 | $ 6.06 | $ 9.82 | $ 11.85 |
Income from Investment Operations |
|
|
|
|
|
Net investment income (loss) E | (.10) | (.09) | (.05) | (.04) | (.11) |
Net realized and unrealized gain (loss) | .41 | 2.19 | 1.51 | (3.69) | (.70) |
Total from investment operations | .31 | 2.10 | 1.46 | (3.73) | (.81) |
Distributions from net investment income | - | - | - | (.03) | - |
Distributions from net realized gain | - | - | - | - | (1.22) |
Total distributions | - | - | - | (.03) | (1.22) |
Net asset value, end of period | $ 9.93 | $ 9.62 | $ 7.52 | $ 6.06 | $ 9.82 |
Total Return B,C,D | 3.22% | 27.93% | 24.09% | (37.98)% | (7.54)% |
Ratios to Average Net Assets F,I |
|
|
|
|
|
Expenses before reductions | 1.92% | 1.87% | 1.82% | 1.77% | 1.96% A |
Expenses net of fee waivers, if any | 1.92% | 1.87% | 1.82% | 1.77% | 1.96% A |
Expenses net of all reductions | 1.91% | 1.87% | 1.80% | 1.77% | 1.96% A |
Net investment income (loss) | (1.00)% | (1.03)% | (.67)% | (.57)% | (1.05)% A |
Supplemental Data |
|
|
|
|
|
Net assets, end of period | $ 6,061 | $ 3,623 | $ 1,917 | $ 1,441 | $ 945 |
Portfolio turnover rate G | 108% | 126% | 342% | 355% | 428% |
A Annualized
B Total returns for periods of less than one year are not annualized.
C Total returns would have been lower if certain expenses had not been reduced during the applicable periods shown.
D Total returns do not include the effect of the contingent deferred sales charge.
E Calculated based on average shares outstanding during the period.
F Fees and expenses of any underlying Fidelity Central Funds are not included in the Fund's expense ratio. The Fund indirectly bears its proportionate share of the expenses of any underlying Fidelity Central Funds.
G Amount does not include the portfolio activity of any underlying Fidelity Central Funds.
H For the period February 13, 2007 (commencement of sale of shares) to January 31, 2008.
I Expense ratios reflect operating expenses of the class. Expenses before reductions do not reflect amounts reimbursed by the investment adviser or reductions from brokerage service arrangements or reductions from other expense offset arrangements and do not represent the amount paid by the class during periods when reimbursements or reductions occur. Expense ratios before reductions for start-up periods may not be representative of longer-term operating periods. Expenses net of fee waivers reflect expenses after reimbursement by the investment adviser but prior to reductions from brokerage service arrangements or other expense offset arrangements. Expenses net of all reductions represent the net expenses paid by the class.
See accompanying notes which are an integral part of the financial statements.
Annual Report
Financial Highlights - Large Cap Growth
Years ended January 31, | 2012 | 2011 | 2010 | 2009 | 2008 |
Selected Per-Share Data |
|
|
|
|
|
Net asset value, beginning of period | $ 9.93 | $ 7.69 | $ 6.15 | $ 9.89 | $ 11.92 |
Income from Investment Operations |
|
|
|
|
|
Net investment income (loss) B | - F | - F | .02 | .04 | (.01) |
Net realized and unrealized gain (loss) | .43 | 2.24 | 1.55 | (3.73) | (.77) |
Total from investment operations | .43 | 2.24 | 1.57 | (3.69) | (.78) |
Distributions from net investment income | - | - | (.03) | (.05) | - |
Distributions from net realized gain | - | - | - | - | (1.25) |
Total distributions | - | - | (.03) | (.05) | (1.25) |
Net asset value, end of period | $ 10.36 | $ 9.93 | $ 7.69 | $ 6.15 | $ 9.89 |
Total Return A | 4.33% | 29.13% | 25.50% | (37.36)% | (7.26)% |
Ratios to Average Net Assets C,E |
|
|
|
|
|
Expenses before reductions | .88% | .87% | .81% | .75% | 1.03% |
Expenses net of fee waivers, if any | .88% | .87% | .81% | .74% | .99% |
Expenses net of all reductions | .87% | .86% | .80% | .74% | .98% |
Net investment income (loss) | .04% | (.02)% | .34% | .47% | (.07)% |
Supplemental Data |
|
|
|
|
|
Net assets, end of period | $ 132,123 | $ 120,671 | $ 96,661 | $ 85,332 | $ 147,864 |
Portfolio turnover rate D | 108% | 126% | 342% | 355% | 428% |
A Total returns would have been lower if certain expenses had not been reduced during the applicable periods shown.
B Calculated based on average shares outstanding during the period.
C Fees and expenses of any underlying Fidelity Central Funds are not included in the Fund's expense ratio. The Fund indirectly bears its proportionate share of the expenses of any underlying Fidelity Central Funds.
D Amount does not include the portfolio activity of any underlying Fidelity Central Funds.
E Expense ratios reflect operating expenses of the class. Expenses before reductions do not reflect amounts reimbursed by the investment adviser or reductions from brokerage service arrangements or reductions from other expense offset arrangements and do not represent the amount paid by the class during periods when reimbursements or reductions occur. Expenses net of fee waivers reflect expenses after reimbursement by the investment adviser but prior to reductions from brokerage service arrangements or other expense offset arrangements. Expenses net of all reductions represent the net expenses paid by the class.
F Amount represents less than $.01 per share.
See accompanying notes which are an integral part of the financial statements.
Annual Report
Financial Highlights - Institutional Class
Years ended January 31, | 2012 | 2011 | 2010 | 2009 | 2008 G |
Selected Per-Share Data |
|
|
|
|
|
Net asset value, beginning of period | $ 9.97 | $ 7.72 | $ 6.18 | $ 9.88 | $ 11.85 |
Income from Investment Operations |
|
|
|
|
|
Net investment income (loss) D | .01 | - I | .03 | .04 | - I |
Net realized and unrealized gain (loss) | .43 | 2.25 | 1.54 | (3.72) | (.70) |
Total from investment operations | .44 | 2.25 | 1.57 | (3.68) | (.70) |
Distributions from net investment income | - | - | (.03) | (.02) | - |
Distributions from net realized gain | - | - | - | - | (1.27) |
Total distributions | - | - | (.03) | (.02) | (1.27) |
Net asset value, end of period | $ 10.41 | $ 9.97 | $ 7.72 | $ 6.18 | $ 9.88 |
Total Return B,C | 4.41% | 29.15% | 25.42% | (37.29)% | (6.64)% |
Ratios to Average Net Assets E,H |
|
|
|
|
|
Expenses before reductions | .83% | .86% | .76% | .68% | .88% A |
Expenses net of fee waivers, if any | .83% | .86% | .76% | .68% | .88% A |
Expenses net of all reductions | .82% | .86% | .74% | .68% | .88% A |
Net investment income (loss) | .08% | (.02)% | .39% | .52% | .03% A |
Supplemental Data |
|
|
|
|
|
Net assets, end of period | $ 1,134 | $ 488 | $ 111 | $ 277 | $ 386 |
Portfolio turnover rate F | 108% | 126% | 342% | 355% | 428% |
A Annualized
B Total returns for periods of less than one year are not annualized.
C Total returns would have been lower if certain expenses had not been reduced during the applicable periods shown.
D Calculated based on average shares outstanding during the period.
E Fees and expenses of any underlying Fidelity Central Funds are not included in the Fund's expense ratio. The Fund indirectly bears its proportionate share of the expenses of any underlying Fidelity Central Funds.
F Amount does not include the portfolio activity of any underlying Fidelity Central Funds.
G For the period February 13, 2007 (commencement of sale of shares) to January 31, 2008.
H Expense ratios reflect operating expenses of the class. Expenses before reductions do not reflect amounts reimbursed by the investment adviser or reductions from brokerage service arrangements or reductions from other expense offset arrangements and do not represent the amount paid by the class during periods when reimbursements or reductions occur. Expense ratios before reductions for start-up periods may not be representative of longer-term operating periods. Expenses net of fee waivers reflect expenses after reimbursement by the investment adviser but prior to reductions from brokerage service arrangements or other expense offset arrangements. Expenses net of all reductions represent the net expenses paid by the class.
I Amount represents less than $.01 per share.
See accompanying notes which are an integral part of the financial statements.
Annual Report
Notes to Financial Statements
For the period ended January 31, 2012
1. Organization.
Fidelity Large Cap Growth Fund (the Fund) is a fund of Fidelity Devonshire Trust (the Trust) and is authorized to issue an unlimited number of shares. The Trust is registered under the Investment Company Act of 1940, as amended (the 1940 Act), as an open-end management investment company organized as a Massachusetts business trust. The Fund offers Class A, Class T, Class C, Large Cap Growth and Institutional Class shares, each of which, along with Class B shares, has equal rights as to assets and voting privileges. Effective after the close of business on September 1, 2010, Class B shares were closed to new accounts and additional purchases, except for exchanges and reinvestments. Each class has exclusive voting rights with respect to matters that affect that class. Class B shares will automatically convert to Class A shares after a holding period of seven years from the initial date of purchase. Investment income, realized and unrealized capital gains and losses, the common expenses of the Fund, and certain fund-level expense reductions, if any, are allocated on a pro-rata basis to each class based on the relative net assets of each class to the total net assets of the Fund. Each class differs with respect to transfer agent and distribution and service plan fees incurred. Certain expense reductions may also differ by class.
2. Investments in Fidelity Central Funds.
The Fund invests in Fidelity Central Funds, which are open-end investment companies available only to other investment companies and accounts managed by Fidelity Management & Research Company (FMR) and its affiliates. The Fund's Schedule of Investments lists each of the Fidelity Central Funds held as of period end, if any, as an investment of the Fund, but does not include the underlying holdings of each Fidelity Central Fund. As an Investing Fund, the Fund indirectly bears its proportionate share of the expenses of the underlying Fidelity Central Funds.
The Money Market Central Funds seek preservation of capital and current income and are managed by Fidelity Investments Money Management, Inc. (FIMM), an affiliate of FMR.
A complete unaudited list of holdings for each Fidelity Central Fund is available upon request or at the Securities and Exchange Commission (the SEC) web site at www.sec.gov. In addition, the financial statements of the Fidelity Central Funds, which are not covered by the Fund's Report of Independent Registered Public Accounting Firm, are available on the SEC web site or upon request.
3. Significant Accounting Policies.
The financial statements have been prepared in conformity with accounting principles generally accepted in the United States of America (GAAP), which require management to make certain estimates and assumptions at the date of the financial statements. Actual results could differ from those estimates. Subsequent events, if any, through the
Annual Report
Notes to Financial Statements - continued
3. Significant Accounting Policies - continued
date that the financial statements were issued have been evaluated in the preparation of the financial statements. The following summarizes the significant accounting policies of the Fund:
Security Valuation. Investments are valued as of 4:00 p.m. Eastern time on the last calendar day of the period. The Fund uses independent pricing services approved by the Board of Trustees to value its investments. When current market prices or quotations are not readily available or reliable, valuations may be determined in good faith in accordance with procedures adopted by the Board of Trustees. Factors used in determining value may include market or security specific events. The frequency with which these procedures are used cannot be predicted and they may be utilized to a significant extent. The value used for net asset value (NAV) calculation under these procedures may differ from published prices for the same securities.
The Fund categorizes the inputs to valuation techniques used to value its investments into a disclosure hierarchy consisting of three levels as shown below:
Level 1 - quoted prices in active markets for identical investments
Level 2 - other significant observable inputs (including quoted prices for similar investments, interest rates, prepayment speeds, etc.)
Level 3 - unobservable inputs (including the Fund's own assumptions based on the best information available)
Changes in valuation techniques may result in transfers in or out of an assigned level within the disclosure hierarchy. The aggregate value of investments by input level, as of January 31, 2012, as well as a roll forward of Level 3 securities, is included at the end of the Fund's Schedule of Investments. Valuation techniques used to value the Fund's investments by major category are as follows:
Equity securities, including restricted securities, for which market quotations are readily available, are valued at the last reported sale price or official closing price as reported by an independent pricing service on the primary market or exchange on which they are traded and are categorized as Level 1 in the hierarchy. In the event there were no sales during the day or closing prices are not available, securities are valued at the last quoted bid price or may be valued using the last available price and are generally categorized as Level 2 in the hierarchy. For foreign equity securities, when significant market or security specific events arise, comparisons to the valuation of American Depositary Receipts (ADRs), futures contracts, Exchange-traded funds (ETFs) and certain indexes as well as quoted prices for similar securities are used and are categorized as Level 2 in the hierarchy in these circumstances. Utilizing these techniques may result in transfers between Level 1 and Level 2. For restricted equity securities and private placements where
Annual Report
3. Significant Accounting Policies - continued
Security Valuation - continued
observable inputs are limited, assumptions about market activity and risk are used and are categorized as Level 3 in the hierarchy.
Investments in open-end mutual funds, including the Fidelity Central Funds, are valued at their closing net asset value each business day and are categorized as Level 1 in the hierarchy.
New Accounting Pronouncements. In May 2011, the Financial Accounting Standards Board issued Accounting Standard Update No. 2011-04, Fair Value Measurement (Topic 820) - Amendments to Achieve Common Fair Value Measurement and Disclosure Requirements in U.S. GAAP and IFRSs. The update is effective during interim and annual periods beginning after December 15, 2011 and will result in additional disclosure for transfers between levels as well as expanded disclosure for securities categorized as Level 3 under the fair value hierarchy.
In December 2011, the Financial Accounting Standards Board issued Accounting Standard Update No. 2011-11, Disclosures about Offsetting Assets and Liabilities. The update creates new disclosure requirements requiring entities to disclose both gross and net information for derivatives and other financial instruments that are either offset in the Statement of Assets and Liabilities or subject to an enforceable master netting arrangement or similar agreement. The disclosure requirements are effective for interim and annual reporting periods beginning on or after January 1, 2013. Management is currently evaluating the impact of the update's adoption on the Fund's financial statement disclosures.
Foreign Currency. The Fund may use foreign currency contracts to facilitate transactions in foreign-denominated securities. Gains and losses from these transactions may arise from changes in the value of the foreign currency or if the counterparties do not perform under the contracts' terms.
Foreign-denominated assets, including investment securities, and liabilities are translated into U.S. dollars at the exchange rate at period end. Purchases and sales of investment securities, income and dividends received and expenses denominated in foreign currencies are translated into U.S. dollars at the exchange rate in effect on the transaction date.
The effects of exchange rate fluctuations on investments are included with the net realized and unrealized gain (loss) on investment securities. Other foreign currency transactions resulting in realized and unrealized gain (loss) are disclosed separately.
Annual Report
Notes to Financial Statements - continued
3. Significant Accounting Policies - continued
Investment Transactions and Income. For financial reporting purposes, the Fund's investment holdings and NAV include trades executed through the end of the last business day of the period. The NAV per share for processing shareholder transactions is calculated as of the close of business of the New York Stock Exchange (NYSE), normally 4:00 p.m. Eastern time and includes trades executed through the end of the prior business day. Gains and losses on securities sold are determined on the basis of identified cost and may include proceeds received from litigation. Dividend income is recorded on the ex-dividend date, except for certain dividends from foreign securities where the ex-dividend date may have passed, which are recorded as soon as the Fund is informed of the ex-dividend date. Non-cash dividends included in dividend income, if any, are recorded at the fair market value of the securities received. Distributions received on securities that represent a return of capital or capital gain are recorded as a reduction of cost of investments and/or as a realized gain. The Fund estimates the components of distributions received that may be considered return of capital distributions or capital gain distributions. Interest income and distributions from the Fidelity Central Funds are accrued as earned. Interest income includes coupon interest and amortization of premium and accretion of discount on debt securities. Investment income is recorded net of foreign taxes withheld where recovery of such taxes is uncertain.
Expenses. Expenses directly attributable to a fund are charged to that fund. Expenses attributable to more than one fund are allocated among the respective funds on the basis of relative net assets or other appropriate methods. Expense estimates are accrued in the period to which they relate and adjustments are made when actual amounts are known.
Income Tax Information and Distributions to Shareholders. Each year, the Fund intends to qualify as a regulated investment company, including distributing substantially all of its taxable income and realized gains under Subchapter M of the Internal Revenue Code. As a result, no provision for income taxes is required. As of January 31, 2012, the Fund did not have any unrecognized tax benefits in the financial statements; nor is the Fund aware of any tax positions for which it is reasonably possible that the total amounts of unrecognized tax benefits will significantly change in the next twelve months. The Fund files a U.S. federal tax return, in addition to state and local tax returns as required. A fund's tax returns are subject to examination by the Internal Revenue Service (IRS) for a period of three fiscal years. State and local tax returns may be subject to examination for an additional fiscal year depending on the jurisdiction. Foreign taxes are provided for based on the Fund's understanding of the tax rules and rates that exist in the foreign markets in which it invests.
Distributions are declared and recorded on the ex-dividend date. Income dividends and capital gain distributions are declared separately for each class. Income and capital gain distributions are determined in accordance with income tax regulations, which may differ from GAAP.
Annual Report
3. Significant Accounting Policies - continued
Income Tax Information and Distributions to Shareholders - continued
Capital accounts within the financial statements are adjusted for permanent book-tax differences. These adjustments have no impact on net assets or the results of operations. Temporary book-tax differences will reverse in a subsequent period.
Book-tax differences are primarily due to foreign currency transactions, passive foreign investment companies (PFIC), partnerships, net operating losses, capital loss carryforwards and losses due to wash sales and excise tax regulations.
The federal tax cost of investment securities and unrealized appreciation (depreciation) as of period end were as follows:
Gross unrealized appreciation | $ 16,492,743 |
Gross unrealized depreciation | (4,791,500) |
Net unrealized appreciation (depreciation) on securities and other investments | $ 11,701,243 |
|
|
Tax Cost | $ 149,439,097 |
The tax-based components of distributable earnings as of period end were as follows:
Capital loss carryforward | $ (17,693,894) |
Net unrealized appreciation (depreciation) | $ 11,700,969 |
Capital loss carryforwards are only available to offset future capital gains of the Fund to the extent provided by regulations and may be limited. Under the Regulated Investment Company Modernization Act of 2010 (the Act), the Fund is permitted to carry forward capital losses incurred in taxable years beginning after December 22, 2010 for an unlimited period and such capital losses are required to be used prior to any losses that expire. Capital loss carryforwards were as follows:
Fiscal year of expiration |
|
2017 | $ (9,033,793) |
2018 | (8,660,101) |
Total with expiration | $ (17,693,894) |
4. Operating Policies.
Restricted Securities. The Fund may invest in securities that are subject to legal or contractual restrictions on resale. These securities generally may be resold in transactions exempt from registration or to the public if the securities are registered. Disposal of these securities may involve time-consuming negotiations and expense, and prompt sale at an acceptable price may be difficult. Information regarding restricted securities is included at the end of the Fund's Schedule of Investments.
Annual Report
Notes to Financial Statements - continued
5. Purchases and Sales of Investments.
Purchases and sales of securities, other than short-term securities, aggregated $180,252,655 and $164,331,765, respectively.
6. Fees and Other Transactions with Affiliates.
Management Fee. FMR and its affiliates provide the Fund with investment management related services for which the Fund pays a monthly management fee. The management fee is the sum of an individual fund fee rate that is based on an annual rate of .30% of the Fund's average net assets and an annualized group fee rate that averaged .26% during the period. The group fee rate is based upon the average net assets of all the mutual funds advised by FMR. The group fee rate decreases as assets under management increase and increases as assets under management decrease. In addition, the management fee is subject to a performance adjustment (up to a maximum of ± .20% of the Fund's average net assets over a 36 month performance period). The upward or downward adjustment to the management fee is based on the relative investment performance of Large Cap Growth as compared to an appropriate benchmark index. For the period, the total annual management fee rate, including the performance adjustment, was .48% of the Fund's average net assets.
Distribution and Service Plan Fees. In accordance with Rule 12b-1 of the 1940 Act, the Fund has adopted separate Distribution and Service Plans for each class of shares. Certain classes pay Fidelity Distributors Corporation (FDC), an affiliate of FMR, separate Distribution and Service Fees, each of which is based on an annual percentage of each class' average net assets. In addition, FDC may pay financial intermediaries for selling shares of the Fund and providing shareholder support services. For the period, the Distribution and Service Fee rates, total fees and amounts retained by FDC were as follows:
| Distribution | Service | Total Fees | Retained |
Class A | -% | .25% | $ 23,137 | $ 1,159 |
Class T | .25% | .25% | 32,142 | 74 |
Class B | .75% | .25% | 18,858 | 14,160 |
Class C | .75% | .25% | 54,492 | 18,363 |
|
|
| $ 128,629 | $ 33,756 |
Sales Load. FDC may receive a front-end sales charge of up to 5.75% for selling Class A shares and 3.50% for selling Class T shares, some of which is paid to financial intermediaries for selling shares of the Fund. Depending on the holding period, FDC may receive contingent deferred sales charges levied on Class A, Class T, Class B, and Class C redemptions. The deferred sales charges range from 5.00% to 1.00% for Class B, 1.00% for Class C, 1.00% for certain purchases of Class A shares and .25% for certain purchases of Class T shares.
Annual Report
6. Fees and Other Transactions with Affiliates - continued
Sales Load - continued
For the period, sales charge amounts retained by FDC were as follows:
| Retained |
Class A | $ 18,472 |
Class T | 4,858 |
Class B* | 4,504 |
Class C* | 1,771 |
| $ 29,605 |
* When Class B and Class C shares are initially sold, FDC pays commissions from its own resources to financial intermediaries through which the sales are made.
Transfer Agent Fees. Fidelity Investments Institutional Operations Company, Inc. (FIIOC), an affiliate of FMR, is the transfer, dividend disbursing and shareholder servicing agent for each class of the Fund. FIIOC receives account fees and asset-based fees that vary according to the account size and type of account of the shareholders of the respective classes of the Fund. FIIOC pays for typesetting, printing and mailing of shareholder reports, except proxy statements. For the period, transfer agent fees for each class were as follows:
| Amount | % of |
Class A | $ 27,845 | .30 |
Class T | 21,166 | .33 |
Class B | 5,704 | .30 |
Class C | 16,244 | .30 |
Large Cap Growth | 329,390 | .26 |
Institutional Class | 2,527 | .21 |
| $ 402,876 |
|
Accounting and Security Lending Fees. Fidelity Service Company, Inc. (FSC), an affiliate of FMR, maintains the Fund's accounting records. The accounting fee is based on the level of average net assets for each month. Under a separate contract, FSC administers the security lending program. The security lending fee is based on the number and duration of lending transactions.
Brokerage Commissions. The Fund placed a portion of its portfolio transactions with brokerage firms which are affiliates of the investment adviser. The commissions paid to these affiliated firms were $3,944 for the period.
Annual Report
Notes to Financial Statements - continued
7. Committed Line of Credit.
The Fund participates with other funds managed by FMR or an affiliate in a $4.0 billion credit facility (the "line of credit") to be utilized for temporary or emergency purposes to fund shareholder redemptions or for other short-term liquidity purposes. The Fund has agreed to pay commitment fees on its pro-rata portion of the line of credit, which amounted to $441 and is reflected in Miscellaneous expenses on the Statement of Operations. During the period, there were no borrowings on this line of credit.
8. Security Lending.
The Fund lends portfolio securities through a lending agent from time to time in order to earn additional income. For equity securities, a lending agent is used and may loan securities to certain qualified borrowers, including Fidelity Capital Markets (FCM), a broker-dealer affiliated with the Fund. On the settlement date of the loan, the Fund receives collateral (in the form of U.S. Treasury obligations, letters of credit and/or cash) against the loaned securities and maintains collateral in an amount not less than 100% of the market value of the loaned securities during the period of the loan. The market value of the loaned securities is determined at the close of business of the Fund and any additional required collateral is delivered to the Fund on the next business day. If the borrower defaults on its obligation to return the securities loaned because of insolvency or other reasons, a fund could experience delays and costs in recovering the securities loaned or in gaining access to the collateral. Any cash collateral received is invested in the Fidelity Securities Lending Cash Central Fund. The value of loaned securities and cash collateral at period end are disclosed on the Fund's Statement of Assets and Liabilities. Security lending income represents the income earned on investing cash collateral, less rebates paid to borrowers and any lending agent fees associated with the loan, plus any premium payments received for lending certain types of securities. Security lending income is presented in the Statement of Operations as a component of income from Fidelity Central Funds. During the period, there were no securities loaned to FCM.
9. Expense Reductions.
Many of the brokers with whom FMR places trades on behalf of the Fund provided services to the Fund in addition to trade execution. These services included payments of certain expenses on behalf of the Fund totaling $8,950 for the period.
Annual Report
10. Share Transactions.
Transactions for each class of shares were as follows:
| Shares | Dollars | ||
Years ended January 31, | 2012 | 2011 | 2012 | 2011 |
Class A |
|
|
|
|
Shares sold | 943,999 | 361,056 | $ 9,391,213 | $ 3,185,180 |
Shares redeemed | (378,889) | (181,389) | (3,682,555) | (1,535,053) |
Net increase (decrease) | 565,110 | 179,667 | $ 5,708,658 | $ 1,650,127 |
Class T |
|
|
|
|
Shares sold | 899,142 | 140,930 | $ 9,125,430 | $ 1,207,937 |
Shares redeemed | (616,824) | (47,579) | (6,053,114) | (408,587) |
Net increase (decrease) | 282,318 | 93,351 | $ 3,072,316 | $ 799,350 |
Class B |
|
|
|
|
Shares sold | 19,634 | 79,473 | $ 195,465 | $ 702,050 |
Shares redeemed | (80,066) | (51,655) | (776,888) | (431,055) |
Net increase (decrease) | (60,432) | 27,818 | $ (581,423) | $ 270,995 |
Class C |
|
|
|
|
Shares sold | 689,847 | 213,157 | $ 6,821,638 | $ 1,855,577 |
Shares redeemed | (456,431) | (91,191) | (4,462,829) | (750,591) |
Net increase (decrease) | 233,416 | 121,966 | $ 2,358,809 | $ 1,104,986 |
Large Cap Growth |
|
|
|
|
Shares sold | 6,389,996 | 4,390,498 | $ 64,463,259 | $ 38,539,310 |
Shares redeemed | (5,795,048) | (4,808,945) | (58,191,405) | (40,933,269) |
Net increase (decrease) | 594,948 | (418,447) | $ 6,271,854 | $ (2,393,959) |
Institutional Class |
|
|
|
|
Shares sold | 185,823 | 46,417 | $ 1,915,796 | $ 398,963 |
Shares redeemed | (125,753) | (11,923) | (1,180,630) | (97,082) |
Net increase (decrease) | 60,070 | 34,494 | $ 735,166 | $ 301,881 |
11. Other.
The Fund's organizational documents provide former and current trustees and officers with a limited indemnification against liabilities arising in connection with the performance of their duties to the Fund. In the normal course of business, the Fund may also enter into contracts that provide general indemnifications. The Fund's maximum exposure under these arrangements is unknown as this would be dependent on future claims that may be made against the Fund. The risk of material loss from such claims is considered remote.
Annual Report
Report of Independent Registered Public Accounting Firm
To the Trustees of Fidelity Devonshire Trust and the Shareholders of Fidelity Large Cap Growth Fund:
In our opinion, the accompanying statement of assets and liabilities, including the schedule of investments, and the related statements of operations and of changes in net assets and the financial highlights present fairly, in all material respects, the financial position of Fidelity Large Cap Growth Fund (a fund of Fidelity Devonshire Trust) at January 31, 2012, the results of its operations for the year then ended, the changes in its net assets for each of the two years in the period then ended and the financial highlights for each of the periods indicated, in conformity with accounting principles generally accepted in the United States of America. These financial statements and financial highlights (hereafter referred to as "financial statements") are the responsibility of the Fidelity Large Cap Growth Fund's management. Our responsibility is to express an opinion on these financial statements based on our audits. We conducted our audits of these financial statements in accordance with the standards of the Public Company Accounting Oversight Board (United States). Those standards require that we plan and perform the audit to obtain reasonable assurance about whether the financial statements are free of material misstatement. An audit includes examining, on a test basis, evidence supporting the amounts and disclosures in the financial statements, assessing the accounting principles used and significant estimates made by management, and evaluating the overall financial statement presentation. We believe that our audits, which included confirmation of securities at January 31, 2012 by correspondence with the custodian and brokers, provide a reasonable basis for our opinion.
/s/ PricewaterhouseCoopers LLP
PricewaterhouseCoopers LLP
Boston, Massachusetts
March 13, 2012
Annual Report
Trustees and Officers
The Trustees, Members of the Advisory Board, and executive officers of the trust and fund, as applicable, are listed below. The Board of Trustees governs the fund and is responsible for protecting the interests of shareholders. The Trustees are experienced executives who meet periodically throughout the year to oversee the fund's activities, review contractual arrangements with companies that provide services to the fund, oversee management of the risks associated with such activities and contractual arrangements, and review the fund's performance. Except for James C. Curvey, each of the Trustees oversees 226 funds advised by FMR or an affiliate. Mr. Curvey oversees 430 funds advised by FMR or an affiliate.
The Trustees hold office without limit in time except that (a) any Trustee may resign; (b) any Trustee may be removed by written instrument, signed by at least two-thirds of the number of Trustees prior to such removal; (c) any Trustee who requests to be retired or who has become incapacitated by illness or injury may be retired by written instrument signed by a majority of the other Trustees; and (d) any Trustee may be removed at any special meeting of shareholders by a two-thirds vote of the outstanding voting securities of the trust. Each Trustee who is not an interested person (as defined in the 1940 Act) (Independent Trustee), shall retire not later than the last day of the calendar year in which his or her 75th birthday occurs. The Independent Trustees may waive this mandatory retirement age policy with respect to individual Trustees. The executive officers and Advisory Board Members hold office without limit in time, except that any officer and Advisory Board Member may resign or may be removed by a vote of a majority of the Trustees at any regular meeting or any special meeting of the Trustees. Except as indicated, each individual has held the office shown or other offices in the same company for the past five years.
Experience, Skills, Attributes, and Qualifications of the Fund's Trustees. The Governance and Nominating Committee has adopted a statement of policy that describes the experience, qualifications, attributes, and skills that are necessary and desirable for potential Independent Trustee candidates (Statement of Policy). The Board believes that each Trustee satisfied at the time he or she was initially elected or appointed a Trustee, and continues to satisfy, the standards contemplated by the Statement of Policy. The Governance and Nominating Committee also engages professional search firms to help identify potential Independent Trustee candidates who have the experience, qualifications, attributes, and skills consistent with the Statement of Policy. From time to time, additional criteria based on the composition and skills of the current Independent Trustees, as well as experience or skills that may be appropriate in light of future changes to board composition, business conditions, and regulatory or other developments, have also been considered by the professional search firms and the Governance and Nominating Committee. In addition, the Board takes into account the Trustees' commitment and participation in Board and committee meetings, as well as their leadership of standing and ad hoc committees throughout their tenure.
In determining that a particular Trustee was and continues to be qualified to serve as a Trustee, the Board has considered a variety of criteria, none of which, in isolation, was controlling. The Board believes that, collectively, the Trustees have balanced and diverse experience, qualifications, attributes, and skills, which allow the Board to operate effectively in governing the fund and protecting the interests of shareholders. Information about the specific experience, skills, attributes, and qualifications of each Trustee, which in each case led to the Board's conclusion that the Trustee should serve (or continue to serve) as a trustee of the fund, is provided below.
Annual Report
Board Structure and Oversight Function. James C. Curvey is an interested person (as defined in the 1940 Act) and currently serves as Acting Chairman. The Trustees have determined that an interested Chairman is appropriate and benefits shareholders because an interested Chairman has a personal and professional stake in the quality and continuity of services provided to the fund. Independent Trustees exercise their informed business judgment to appoint an individual of their choosing to serve as Chairman, regardless of whether the Trustee happens to be independent or a member of management. The Independent Trustees have determined that they can act independently and effectively without having an Independent Trustee serve as Chairman and that a key structural component for assuring that they are in a position to do so is for the Independent Trustees to constitute a substantial majority for the Board. The Independent Trustees also regularly meet in executive session. Ned C. Lautenbach serves as Chairman of the Independent Trustees and as such (i) acts as a liaison between the Independent Trustees and management with respect to matters important to the Independent Trustees and (ii) with management prepares agendas for Board meetings.
Fidelity funds are overseen by different Boards of Trustees. The fund's Board oversees Fidelity's equity and high income funds and another Board oversees Fidelity's investment-grade bond, money market, and asset allocation funds. The asset allocation funds may invest in Fidelity funds overseen by the fund's Board. The use of separate Boards, each with its own committee structure, allows the Trustees of each group of Fidelity funds to focus on the unique issues of the funds they oversee, including common research, investment, and operational issues. On occasion, the separate Boards establish joint committees to address issues of overlapping consequences for the Fidelity funds overseen by each Board.
The Trustees operate using a system of committees to facilitate the timely and efficient consideration of all matters of importance to the Trustees, the fund, and fund shareholders and to facilitate compliance with legal and regulatory requirements and oversight of the fund's activities and associated risks. The Board, acting through its committees, has charged FMR and its affiliates with (i) identifying events or circumstances the occurrence of which could have demonstrably adverse effects on the fund's business and/or reputation; (ii) implementing processes and controls to lessen the possibility that such events or circumstances occur or to mitigate the effects of such events or circumstances if they do occur; and (iii) creating and maintaining a system designed to evaluate continuously business and market conditions in order to facilitate the identification and implementation processes described in (i) and (ii) above. Because the day-to-day operations and activities of the fund are carried out by or through FMR, its affiliates and other service providers, the fund's exposure to risks is mitigated but not eliminated by the processes overseen by the Trustees. While each of the Board's committees has responsibility for overseeing different aspects of the fund's activities, oversight is exercised primarily through the Operations, Audit, and Compliance Committees. In addition, the Independent Trustees have worked with FMR to enhance the Board's oversight of investment and financial risks, legal and regulatory risks, technology risks, and operational risks, including the development of additional risk reporting to the Board. For example, a working group comprised of Independent Trustees and FMR has worked and continues to work to review the Fidelity funds' valuation-related activities, reporting and risk management. Appropriate personnel, including but not limited to the fund's Chief Compliance Officer (CCO), FMR's internal auditor, the independent accountants, the fund's Treasurer and portfolio management personnel, make periodic reports to the Board's committees, as appropriate, including an annual review of FMR's risk management program for the Fidelity funds. The responsibilities of each standing committee, including their oversight responsibilities, are described further under "Standing Committees of the Fund's Trustees."
Annual Report
Trustees and Officers - continued
The fund's Statement of Additional Information (SAI) includes more information about the Trustees. To request a free copy, call Fidelity at 1-800-544-8544.
Interested Trustees*:
Correspondence intended for each Trustee who is an interested person may be sent to Fidelity Investments, 82 Devonshire Street, Boston, Massachusetts 02109.
Name, Age; Principal Occupations and Other Relevant Experience+ | |
James C. Curvey (76) | |
| Year of Election or Appointment: 2007 Mr. Curvey is Trustee and Acting Chairman of the Board of Trustees of certain Trusts. Mr. Curvey also serves as Trustee (2007-present) of other investment companies advised by FMR. Mr. Curvey is a Director of Fidelity Investments Money Management, Inc. (2009-present), Director of Fidelity Research & Analysis Co. (2009-present) and Director of FMR and FMR Co., Inc. (2007-present). Mr. Curvey is also Vice Chairman (2007-present) and Director of FMR LLC. In addition, Mr. Curvey serves as an Overseer for the Boston Symphony Orchestra and a member of the Trustees of Villanova University. Previously, Mr. Curvey was the Vice Chairman (2006-2007) and Director (2000-2007) of FMR Corp. |
Ronald P. O'Hanley (54) | |
| Year of Election or Appointment: 2011 Mr. O'Hanley is Director of FMR Co., Inc. (2010-present), Director of Fidelity Investments Money Management, Inc. (2010-present), Director of Fidelity Research & Analysis Company (2010-present), President of Fidelity Asset Management and Corporate Services and a member of Fidelity's Executive Committee (2010-present). Previously, Mr. O'Hanley served as President and Chief Executive Officer of BNY Mellon Asset Management (2007-2010). Mr. O'Hanley also served as Vice Chairman of Bank New York Mellon Corp. and a member of that firm's Executive Committee. Prior to the 2007 merger of The Bank of New York and Mellon Financial Corporation, he was Vice Chairman of Mellon Financial Corporation and President and Chief Executive Officer of Mellon Asset Management. He joined Mellon in February 1997. Mr. O'Hanley currently serves as Chairman of the Boston Public Library Foundation Board of Directors and sits on the Board of Directors of Beth Israel Deaconess Medical Center, the Board of Trustees of the Marine Biological Laboratory and the Advisory Board of the Maxwell School of Citizenship and Public Administration at Syracuse University. Mr. O'Hanley also chairs the Council on Asset Management for the Financial Services Roundtable and is a member of the Board of Directors of Institutional Investor's U.S. Institute. |
* Trustees have been determined to be "Interested Trustees" by virtue of, among other things, their affiliation with the trust or various entities under common control with FMR.
+ The information above includes each Trustee's principal occupation during the last five years and other information relating to the experience, attributes, and skills relevant to each Trustee's qualifications to serve as a Trustee, which led to the conclusion that each Trustee should serve as a Trustee for the fund.
Annual Report
Trustees and Officers - continued
Independent Trustees:
Correspondence intended for each Independent Trustee (that is, the Trustees other than the Interested Trustees) may be sent to Fidelity Investments, P.O. Box 55235, Boston, Massachusetts 02205-5235.
Name, Age; Principal Occupations and Other Relevant Experience+ | |
Dennis J. Dirks (63) | |
| Year of Election or Appointment: 2005 Prior to his retirement in May 2003, Mr. Dirks was Chief Operating Officer and a member of the Board of The Depository Trust & Clearing Corporation (DTCC). He also served as President, Chief Operating Officer, and Board member of The Depository Trust Company (DTC) and President and Board member of the National Securities Clearing Corporation (NSCC). In addition, Mr. Dirks served as Chief Executive Officer and Board member of the Government Securities Clearing Corporation, Chief Executive Officer and Board member of the Mortgage-Backed Securities Clearing Corporation, as a Trustee and a member of the Finance Committee of Manhattan College (2005-2008), and as a Trustee and a member of the Finance Committee of AHRC of Nassau County (2006-2008). Mr. Dirks is a member of the Independent Directors Council (IDC) Governing Council (2010-present) and Board of Directors for The Brookville Center for Children's Services, Inc. (2009-present). |
Alan J. Lacy (58) | |
| Year of Election or Appointment: 2008 Mr. Lacy serves as a Senior Adviser (2007-present) of Oak Hill Capital Partners, L.P. (private equity). Mr. Lacy also served as Chief Executive Officer (2000-2005) and Vice Chairman (2005-2006) of Sears Holdings Corporation and Sears, Roebuck and Co. (retail). In addition, Mr. Lacy serves as a member of the Board of Directors of Dave & Buster's, Inc. (restaurant and entertainment complexes, 2010-present), The Hillman Companies, Inc. (hardware wholesalers, 2010-present), and Bristol-Myers Squibb Company (global pharmaceuticals, 2007-present). Mr. Lacy is a member of the Board of Trustees of The National Parks Conservation Association (2006-present). Previously, Mr. Lacy served as Chairman of the Board of Trustees of the National Parks Conservation Association (2008-2011) and as a member of the Board of Directors for the Western Union Company (global money transfer, 2006-2011). |
Ned C. Lautenbach (67) | |
| Year of Election or Appointment: 2000 Mr. Lautenbach is Chairman of the Independent Trustees of the Equity and High Income Funds (2006-present). Mr. Lautenbach currently serves as the Lead Director of the Eaton Corporation Board of Directors (diversified industrial, 1997-present). Mr. Lautenbach is also a member of the Board of Directors of the Philharmonic Center for the Arts in Naples, Florida (1999-present); a member of the Board of Trustees of Fairfield University (2005-present); and a member of the Council on Foreign Relations (1994-present). Previously, Mr. Lautenbach was a Partner/Advisory Partner at Clayton, Dubilier & Rice, LLC (private equity investment, 1998-2010), as well as a Director of Sony Corporation (2006-2007). |
Joseph Mauriello (67) | |
| Year of Election or Appointment: 2008 Prior to his retirement in January 2006, Mr. Mauriello served in numerous senior management positions including Deputy Chairman and Chief Operating Officer (2004-2005), and Vice Chairman of Financial Services (2002-2004) of KPMG LLP US (professional services, 1965-2005). Mr. Mauriello currently serves as a member of the Board of Directors of XL Group plc. (global insurance and re-insurance, 2006-present) and of Arcadia Resources Inc. (health care services and products, 2007-present). Previously, Mr. Mauriello served as a Director of the Hamilton Funds of the Bank of New York (2006-2007). |
Robert W. Selander (61) | |
| Year of Election or Appointment: 2011 Previously, Mr. Selander served as a Member of the Advisory Board of Fidelity's Equity and High Income Funds (2011), Executive Vice Chairman (2010), Chief Executive Officer (2009-2010), and President and Chief Executive Officer (1997-2009) of Mastercard, Inc. |
Cornelia M. Small (67) | |
| Year of Election or Appointment: 2005 Ms. Small is a member of the Board of Directors of the Teagle Foundation (2009-present). Ms. Small is also a member of the Investment Committee, and Chair (2008-present) and a member of the Board of Trustees of Smith College. In addition, Ms. Small serves on the Investment Committee of the Berkshire Taconic Community Foundation (2008-present). Previously, Ms. Small served as Chairperson of the Investment Committee (2002-2008) of Smith College. In addition, Ms. Small served as Chief Investment Officer, Director of Global Equity Investments, and a member of the Board of Directors of Scudder, Stevens & Clark and Scudder Kemper Investments. |
William S. Stavropoulos (72) | |
| Year of Election or Appointment: 2002 Mr. Stavropoulos is Vice Chairman of the Independent Trustees of the Equity and High Income Funds (2006-present). Mr. Stavropoulos serves as President and Founder of the Michigan Baseball Foundation, the Great Lakes Loons (2007-present). Mr. Stavropoulos is Chairman Emeritus of the Board of Directors of The Dow Chemical Company, where he previously served in numerous senior management positions, including President, CEO (1995-2000; 2002-2004), Chairman of the Executive Committee (2000-2006), and as a member of the Board of Directors (1990-2006). Currently, Mr. Stavropoulos is Chairman of Univar (global distributor of commodity and specialty chemicals, 2010-present), a Director of Teradata Corporation (data warehousing and technology solutions, 2008-present), Chemical Financial Corporation, Maersk Inc. (industrial conglomerate), Tyco International, Inc. (multinational manufacturing and services, 2007-present), and a member of the Advisory Board for Metalmark Capital (private equity investment, 2005-present). Mr. Stavropoulos is a special advisor to Clayton, Dubilier & Rice, LLC (private equity investment). In addition, Mr. Stavropoulos is a member of the University of Notre Dame Advisory Council for the College of Science. |
David M. Thomas (62) | |
| Year of Election or Appointment: 2008 Previously, Mr. Thomas served as Executive Chairman (2005-2006) and Chairman and Chief Executive Officer (2000-2005) of IMS Health, Inc. (pharmaceutical and healthcare information solutions). In addition, Mr. Thomas serves as a member of the Board of Directors of Fortune Brands, Inc. (consumer products), and Interpublic Group of Companies, Inc. (marketing communication, 2004-present). |
Michael E. Wiley (61) | |
| Year of Election or Appointment: 2008 Mr. Wiley also serves as a Director of Asia Pacific Exploration Consolidated (international oil and gas exploration and production, 2008-present). Mr. Wiley serves as a Director of Tesoro Corporation (independent oil refiner and marketer, 2005-present), and a Director of Bill Barrett Corporation (exploration and production, 2005-present). In addition, Mr. Wiley also serves as a Director of Post Oak Bank (privately-held bank, 2004-present). Previously, Mr. Wiley served as a member of the Board of Trustees of the University of Tulsa (2000-2006; 2007-2010), as a Senior Energy Advisor of Katzenbach Partners, LLC (consulting, 2006-2007), as an Advisory Director of Riverstone Holdings (private investment), Chairman, President, and CEO of Baker Hughes, Inc. (oilfield services, 2000-2004), and as Director of Spinnaker Exploration Company (exploration and production, 2001-2005). |
Annual Report
+ The information above includes each Trustee's principal occupation during the last five years and other information relating to the experience, attributes, and skills relevant to each Trustee's qualifications to serve as a Trustee, which led to the conclusion that each Trustee should serve as a Trustee for the fund.
Advisory Board Members and Executive Officers:
Correspondence intended for each executive officer, Edward C. Johnson 3d, and Peter S. Lynch may be sent to Fidelity Investments, 82 Devonshire Street, Boston, Massachusetts 02109.
Name, Age; Principal Occupation | |
Edward C. Johnson 3d (81) | |
| Year of Election or Appointment: 2011 Member of the Advisory Board of Fidelity's Equity and High Income Funds. Mr. Johnson serves as Chief Executive Officer, Chairman, and a Director of FMR LLC, and also serves as Chairman and Director of FIL Limited. Previously, Mr. Johnson served as a Trustee and Chairman of the Board of certain Fidelity Trusts, Chairman and a Director of FMR, Chairman and a Director of FMR Co., Inc., and President of FMR LLC (2006-2007). |
Peter S. Lynch (68) | |
| Year of Election or Appointment: 2003 Member of the Advisory Board of Fidelity's Equity and High Income Funds. Mr. Lynch is Vice Chairman and a Director of FMR and FMR Co., Inc. In addition, Mr. Lynch serves as a Trustee of Boston College and as the Chairman of the Inner-City Scholarship Fund. Previously, Mr. Lynch served on the Special Olympics International Board of Directors (1997-2006). |
Kenneth B. Robins (42) | |
| Year of Election or Appointment: 2008 President and Treasurer of Fidelity's Equity and High Income Funds. Mr. Robins also serves as President and Treasurer (2010-present) and Assistant Treasurer (2009-present) of other Fidelity funds and is an employee of Fidelity Investments (2004-present). Previously, Mr. Robins served as Deputy Treasurer of the Fidelity funds (2005-2008) and Treasurer and Chief Financial Officer of The North Carolina Capital Management Trust: Cash and Term Portfolios (2006-2008). |
Bruce T. Herring (46) | |
| Year of Election or Appointment: 2006 Vice President of certain Equity Funds. Mr. Herring also serves as President of Fidelity Research & Analysis Company (2010-present), Chief Investment Officer and Director of Fidelity Management & Research (U.K.) Inc. (2010-present) and Group Chief Investment Officer of FMR. Previously, Mr. Herring served as Vice President (2005-2006) and Senior Vice President (2006-2007) of Fidelity Management & Research Company, Vice President of FMR Co., Inc. (2001-2007) and as a portfolio manager for Fidelity U.S. Equity Funds. |
Brian B. Hogan (47) | |
| Year of Election or Appointment: 2009 Vice President of Equity and High Income Funds. Mr. Hogan also serves as President of FMR's Equity Division (2009-present). Previously, Mr. Hogan served as Senior Vice President, Equity Research of FMR (2006-2009) and as a portfolio manager. |
Scott C. Goebel (44) | |
| Year of Election or Appointment: 2008 Secretary and Chief Legal Officer (CLO) of the Fidelity funds. Mr. Goebel also serves as Secretary of Fidelity Investments Money Management, Inc. (FIMM) (2010-present) and Fidelity Research and Analysis Company (FRAC) (2010-present); Secretary and CLO of The North Carolina Capital Management Trust: Cash and Term Portfolios (2008-present); General Counsel, Secretary, and Senior Vice President of FMR (2008-present) and FMR Co., Inc. (2008-present); employed by FMR LLC or an affiliate (2001-present); Chief Legal Officer of Fidelity Management & Research (Hong Kong) Limited (2008-present) and Assistant Secretary of Fidelity Management & Research (Japan) Inc. (2008-present), and Fidelity Management & Research (U.K.) Inc. (2008-present). Previously, Mr. Goebel served as Assistant Secretary of FIMM (2008-2010), FRAC (2008-2010), and the Funds (2007-2008) and as Vice President and Secretary of Fidelity Distributors Corporation (FDC) (2005-2007). |
William C. Coffey (42) | |
| Year of Election or Appointment: 2009 Assistant Secretary of Fidelity's Equity and High Income Funds. Mr. Coffey also serves as Senior Vice President and Deputy General Counsel of FMR LLC (2010-present), and is an employee of Fidelity Investments. Previously, Mr. Coffey served as Vice President and Associate General Counsel of FMR LLC (2005-2009). |
Holly C. Laurent (57) | |
| Year of Election or Appointment: 2008 Anti-Money Laundering (AML) Officer of the Fidelity funds. Ms. Laurent also serves as AML Officer of The North Carolina Capital Management Trust: Cash and Term Portfolios (2008-present) and is an employee of Fidelity Investments. Previously, Ms. Laurent was Senior Vice President and Head of Legal for Fidelity Business Services India Pvt. Ltd. (2006-2008), and Senior Vice President, Deputy General Counsel and Group Head for FMR LLC (2005-2006). |
Christine Reynolds (53) | |
| Year of Election or Appointment: 2008 Chief Financial Officer of the Fidelity funds. Ms. Reynolds became President of Fidelity Pricing and Cash Management Services (FPCMS) in August 2008. Ms. Reynolds served as Chief Operating Officer of FPCMS (2007-2008). Previously, Ms. Reynolds served as President, Treasurer, and Anti-Money Laundering officer of the Fidelity funds (2004-2007). |
Kenneth A. Rathgeber (64) | |
| Year of Election or Appointment: 2004 Chief Compliance Officer of Fidelity's Equity and High Income Funds. Mr. Rathgeber is Chief Compliance Officer of Fidelity Management & Research (Hong Kong) Limited (2008-present), Fidelity Management & Research (Japan) Inc. (2008-present), FMR (2005-present), FMR Co., Inc. (2005-present), Fidelity Management & Research (U.K.) Inc. (2005-present), Fidelity Research & Analysis Company (2005-present), Fidelity Investments Money Management, Inc. (2005-present), Pyramis Global Advisors, LLC (2005-present), and Strategic Advisers, Inc. (2005-present). |
Joseph F. Zambello (54) | |
| Year of Election or Appointment: 2011 Deputy Treasurer of the Fidelity funds. Mr. Zambello is an employee of Fidelity Investments. Previously, Mr. Zambello served as Vice President of FMR's Program Management Group (2009-2011) and Vice President of the Transfer Agent Oversight Group (2005-2009). |
Adrien E. Deberghes (44) | |
| Year of Election or Appointment: 2008 Deputy Treasurer of Fidelity's Equity and High Income Funds. Mr. Deberghes also serves as Vice President and Assistant Treasurer of Fidelity Rutland Square Trust II and Fidelity Commonwealth Trust II (2011-present), Assistant Treasurer of other Fidelity funds (2010-present), and is an employee of Fidelity Investments (2008-present). Previously, Mr. Deberghes served as Senior Vice President of Mutual Fund Administration at State Street Corporation (2007-2008), Senior Director of Mutual Fund Administration at Investors Bank & Trust (2005-2007), and Director of Finance for Dunkin' Brands (2000-2005). |
Stephanie J. Dorsey (42) | |
| Year of Election or Appointment: 2010 Assistant Treasurer of Fidelity's Equity and High Income Funds. Ms. Dorsey also serves as Deputy Treasurer of other Fidelity funds (2008-present) and is an employee of Fidelity Investments (2008-present). Previously, Ms. Dorsey served as Treasurer (2004-2008) of the JPMorgan Mutual Funds and Vice President (2004-2008) of JPMorgan Chase Bank. |
John R. Hebble (53) | |
| Year of Election or Appointment: 2009 Assistant Treasurer of Fidelity's Equity and High Income Funds. Mr. Hebble also serves as President (2011-present), Treasurer, and Chief Financial Officer of The North Carolina Capital Management Trust: Cash and Term Portfolios (2008-present), President and Treasurer of other Fidelity funds (2008-present) and is an employee of Fidelity Investments. |
Gary W. Ryan (53) | |
| Year of Election or Appointment: 2005 Assistant Treasurer of the Fidelity funds. Mr. Ryan is an employee of Fidelity Investments. Previously, Mr. Ryan served as Vice President of Fund Reporting in Fidelity Pricing and Cash Management Services (FPCMS) (1999-2005). |
Jonathan Davis (43) | |
| Year of Election or Appointment: 2010 Assistant Treasurer of the Fidelity funds. Mr. Davis is also Assistant Treasurer of Fidelity Rutland Square Trust II and Fidelity Commonwealth Trust II. Mr. Davis is an employee of Fidelity Investments. Previously, Mr. Davis served as Vice President and Associate General Counsel of FMR LLC (2003-2010). |
Annual Report
Managing Your Investments
Fidelity offers several ways to conveniently manage your personal investments via your telephone or PC. You can access your account information, conduct trades and research your investments 24 hours a day.
By Phone
Fidelity Automated Service Telephone provides a single toll-free number to access account balances, positions, quotes and trading. It's easy to navigate the service, and on your first call, the system will help you create a personal identification number (PIN) for security.
(phone graphic)Fidelity Automated
Service Telephone (FAST®)
1-800-544-5555
Press
1 For mutual fund and brokerage trading.
2 For quotes.*
3 For account balances and holdings.
4 To review orders and mutual
fund activity.
5 To change your PIN.
*0 To speak to a Fidelity representative.
By PC
Fidelity's web site on the Internet provides a wide range of information, including daily financial news, fund performance, interactive planning tools and news about Fidelity products and services.
(computer graphic)Fidelity's Web Site
www.fidelity.com
* When you call the quotes line, please remember that a fund's yield and return will vary and, except for money market funds, share price will also vary. This means that you may have a gain or loss when you sell your shares. There is no assurance that money market funds will be able to maintain a stable $1 share price; an investment in a money market fund is not insured or guaranteed by the U.S. government. Total returns are historical and include changes in share price, reinvestment of dividends and capital gains distributions, and the effects of any sales charges.
Annual Report
To Visit Fidelity
For directions and hours,
please call 1-800-544-9797.
Arizona
7001 West Ray Road
Chandler, AZ
15445 N. Scottsdale Road
Scottsdale, AZ
17550 North 75th Avenue
Glendale, AZ
5330 E. Broadway Blvd
Tucson, AZ
California
815 East Birch Street
Brea, CA
1411 Chapin Avenue
Burlingame, CA
851 East Hamilton Avenue
Campbell, CA
601 Larkspur Landing Circle
Larkspur, CA
2000 Avenue of the Stars
Los Angeles, CA
27101 Puerta Real
Mission Viejo, CA
73575 El Paseo
Palm Desert, CA
251 University Avenue
Palo Alto, CA
123 South Lake Avenue
Pasadena, CA
16656 Bernardo Ctr. Drive
Rancho Bernardo, CA
1220 Roseville Parkway
Roseville, CA
1740 Arden Way
Sacramento, CA
7676 Hazard Center Drive
San Diego, CA
11943 El Camino Real
San Diego, CA
8 Montgomery Street
San Francisco, CA
3793 State Street
Santa Barbara, CA
1200 Wilshire Boulevard
Santa Monica, CA
398 West El Camino Real
Sunnyvale, CA
111 South Westlake Blvd
Thousand Oaks, CA
21701 Hawthorne Boulevard
Torrance, CA
2001 North Main Street
Walnut Creek, CA
6326 Canoga Avenue
Woodland Hills, CA
2211 Michelson Drive
Irvine, CA
Colorado
281 East Flatiron Circle
Broomfield, CO
1625 Broadway
Denver, CO
9185 Westview Road
Lone Tree, CO
Connecticut
48 West Putnam Avenue
Greenwich, CT
265 Church Street
New Haven, CT
300 Atlantic Street
Stamford, CT
29 South Main Street
West Hartford, CT
1261 Post Road
Fairfield, CT
Delaware
400 Delaware Avenue
Wilmington, DE
Florida
175 East Altamonte Drive
Altamonte Springs, FL
1400 Glades Road
Boca Raton, FL
121 Alhambra Plaza
Coral Gables, FL
2948 N. Federal Highway
Ft. Lauderdale, FL
4671 Town Center Parkway
Jacksonville, FL
8880 Tamiami Trail, North
Naples, FL
230 Royal Palm Way
Palm Beach, FL
3501 PGA Boulevard
Palm Beach Gardens, FL
3550 Tamiami Trail, South
Sarasota, FL
1502 N. Westshore Blvd.
Tampa, FL
2465 State Road 7
Wellington, FL
Georgia
3242 Peachtree Road
Atlanta, GA
1000 Abernathy Road
Atlanta, GA
Illinois
One North LaSalle Street
Chicago, IL
401 North Michigan Avenue
Chicago, IL
One Skokie Valley Road
Highland Park, IL
1415 West 22nd Street
Oak Brook, IL
15105 S LaGrange Road
Orland Park, IL
1572 East Golf Road
Schaumburg, IL
1823 Freedom Drive
Naperville, IL
Indiana
8480 Keystone Crossing
Indianapolis, IN
Kansas
5400 College Boulevard
Overland Park, KS
Maine
Three Canal Plaza
Portland, ME
Maryland
7315 Wisconsin Avenue
Bethesda, MD
610 York Road
Towson, MD
Massachusetts
801 Boylston Street
Boston, MA
155 Congress Street
Boston, MA
300 Granite Street
Braintree, MA
44 Mall Road
Burlington, MA
238 Main Street
Cambridge, MA
200 Endicott Street
Danvers, MA
Annual Report
405 Cochituate Road
Framingham, MA
551 Boston Turnpike
Shrewsbury, MA
Michigan
500 E. Eisenhower Pkwy.
Ann Arbor, MI
280 N. Old Woodward Ave.
Birmingham, MI
30200 Northwestern Hwy.
Farmington Hills, MI
43420 Grand River Avenue
Novi, MI
3480 28th Street
Grand Rapids, MI
2425 S. Linden Road STE E
Flint, MI
Minnesota
7740 France Avenue South
Edina, MN
8342 3rd Street North
Oakdale, MN
Missouri
1524 South Lindbergh Blvd.
St. Louis, MO
Nevada
2225 Village Walk Drive
Henderson, NV
New Jersey
501 Route 73 South
Marlton, NJ
150 Essex Street
Millburn, NJ
35 Morris Street
Morristown, NJ
396 Route 17, North
Paramus, NJ
3518 Route 1 North
Princeton, NJ
530 Broad Street
Shrewsbury, NJ
New Mexico
2261 Q Street NE
Albuquerque, NM
New York
1130 Franklin Avenue
Garden City, NY
37 West Jericho Turnpike
Huntington Station, NY
1271 Avenue of the Americas
New York, NY
980 Madison Avenue
New York, NY
61 Broadway
New York, NY
350 Park Avenue
New York, NY
200 Fifth Avenue
New York, NY
733 Third Avenue
New York, NY
2070 Broadway
New York, NY
1075 Northern Blvd.
Roslyn, NY
799 Central Park Avenue
Scarsdale, NY
3349 Monroe Avenue
Rochester, NY
North Carolina
4611 Sharon Road
Charlotte, NC
7011 Fayetteville Road
Durham, NC
Ohio
3805 Edwards Road
Cincinnati, OH
1324 Polaris Parkway
Columbus, OH
1800 Crocker Road
Westlake, OH
28699 Chagrin Boulevard
Woodmere Village, OH
Oregon
7493 SW Bridgeport Road
Tigard, OR
Pennsylvania
600 West DeKalb Pike
King of Prussia, PA
1735 Market Street
Philadelphia, PA
12001 Perry Highway
Wexford, PA
Rhode Island
10 Memorial Boulevard
Providence, RI
Tennessee
3018 Peoples Street
Johnson City, TN
7628 West Farmington Blvd.
Germantown, TN
2035 Mallory Lane
Franklin, TN
Texas
10000 Research Boulevard
Austin, TX
4001 Northwest Parkway
Dallas, TX
12532 Memorial Drive
Houston, TX
2701 Drexel Drive
Houston, TX
6560 Fannin Street
Houston, TX
1701 Lake Robbins Drive
The Woodlands, TX
6500 N. MacArthur Blvd.
Irving, TX
6005 West Park Boulevard
Plano, TX
1576 East Southlake Blvd.
Southlake, TX
15600 Southwest Freeway
Sugar Land, TX
139 N. Loop 1604 East
San Antonio, TX
Utah
279 West South Temple
Salt Lake City, UT
Virginia
1861 International Drive
McLean, VA
11957 Democracy Drive
Reston, VA
Washington
10500 NE 8th Street
Bellevue, WA
1518 6th Avenue
Seattle, WA
304 Strander Blvd
Tukwila, WA
Washington, DC
1900 K Street, N.W.
Washington, DC
Wisconsin
16020 West Bluemound Road
Brookfield, WI
Fidelity Brokerage Services, Inc., 100 Summer St., Boston, MA 02110 Member NYSE/SIPC
Annual Report
Investment Adviser
Fidelity Management & Research Company
Boston, MA
Investment Sub-Advisers
FMR Co., Inc.
Fidelity Management & Research
(U.K.) Inc.
Fidelity Management & Research
(Hong Kong) Limited
Fidelity Management & Research
(Japan) Inc.
General Distributor
Fidelity Distributors Corporation
Boston, MA
Transfer and Service Agents
Fidelity Investments Institutional
Operations Company, Inc.
Boston, MA
Fidelity Service Company, Inc.
Boston, MA
Custodian
Citibank, N.A.
New York, NY
The Fidelity Telephone Connection
Mutual Fund 24-Hour Service
Exchanges/Redemptions
and Account Assistance 1-800-544-6666
Product Information 1-800-544-6666
Retirement Accounts 1-800-544-4774
(8 a.m. - 9 p.m.)
TDD Service 1-800-544-0118
for the deaf and hearing impaired
(9 a.m. - 9 p.m. Eastern time)
Fidelity Automated Service
Telephone (FAST®)
1-800-544-5555
Automated line for quickest service
LCG-UANN-0312
1.900187.102
(Fidelity Investment logo)(registered trademark)
Corporate Headquarters
82 Devonshire St., Boston, MA 02109
www.fidelity.com
(Fidelity Investment logo)(registered trademark)
Fidelity Advisor®
Large Cap Growth
Fund - Class A, Class T, Class B
and Class C
Annual Report
January 31, 2012
(Fidelity Cover Art)
Class A, Class T, Class B, and Class C are classes of Fidelity® Large Cap Growth Fund
Contents
Chairman's Message | The Chairman's message to shareholders. | |
Performance | How the fund has done over time. | |
Management's Discussion of Fund Performance | The Portfolio Manager's review of fund performance and strategy. | |
Shareholder Expense Example | An example of shareholder expenses. | |
Investment Changes | A summary of major shifts in the fund's investments over the past six months. | |
Investments | A complete list of the fund's investments with their market values. | |
Financial Statements | Statements of assets and liabilities, operations, and changes in net assets, as well as financial highlights. | |
Notes | Notes to the financial statements. | |
Report of Independent Registered Public Accounting Firm |
| |
Trustees and Officers |
|
To view a fund's proxy voting guidelines and proxy voting record for the 12-month period ended June 30, visit http://www.fidelity.com/proxyvotingresults or visit the Securities and Exchange Commission's (SEC) web site at http://www.sec.gov. You may also call 1-877-208-0098 to request a free copy of the proxy voting guidelines.
Standard & Poor's, S&P and S&P 500 are registered service marks of The McGraw-Hill Companies, Inc. and have been licensed for use by Fidelity Distributors Corporation.
Other third party marks appearing herein are the property of their respective owners.
All other marks appearing herein are registered or unregistered trademarks or service marks of FMR LLC or an affiliated company.
Annual Report
This report and the financial statements contained herein are submitted for the general information of the shareholders of the fund. This report is not authorized for distribution to prospective investors in the fund unless preceded or accompanied by an effective prospectus.
A fund files its complete schedule of portfolio holdings with the SEC for the first and third quarters of each fiscal year on Form N-Q. Forms N-Q are available on the SEC's web site at http://www.sec.gov. A fund's Forms N-Q may be reviewed and copied at the SEC's Public Reference Room in Washington, DC. Information regarding the operation of the SEC's Public Reference Room may be obtained by calling 1-800-SEC-0330. For a complete list of a fund's portfolio holdings, view the most recent holdings listing, semiannual report, or annual report on Fidelity's web site at http://www.fidelity.com, http://www.advisor.fidelity.com, or http://www.401k.com, as applicable.
NOT FDIC INSURED • MAY LOSE VALUE • NO BANK GUARANTEE
Neither the fund nor Fidelity Distributors Corporation is a bank.
Annual Report
Chairman's Message
(photo_of_James_C_Curvey)
Dear Shareholder:
Following a year marked by unusually high volatility, 2012 began with most major asset classes advancing steadily in January. For U.S. equities, it was the strongest start to a new year since 1997. International stocks fared even better, despite continued uncertainty related to the sovereign debt crisis in Europe. Investors have been acutely sensitive to the latest news, for better or worse, coming out of the eurozone and its impact on financial markets. As we look ahead, the unresolved debt crisis in Europe remains at the center of a series of risk factors, summarized below, that we believe have the greatest potential to influence the global investment landscape.
Deleveraging and the economy
In the euro-currency area, fiscal austerity among nations and debt deleveraging among financial companies loaded with sovereign debt are deflationary measures and serve to hinder economic growth in the short term. Such an economic and financial-market scenario has not been historically supportive of strong performance among riskier assets, and emerges at a time when many nations need a resurgent economy to assist them in closing their budget deficits and in building confidence among bond buyers to help them refinance their existing debt obligations.
Slowdown in China and Europe
China's economy is the second-largest in the world, and it has been the biggest contributor to global growth since the end of the last recession. Thus, the slower pace of domestic growth in China has led to lower demand for imports of commodities and other construction materials from the rest of the world. In addition, economic weakness in Europe and the broad-based global economic slowdown are putting pressure on China's export growth, which has been largely responsible for its breakneck pace of annual gross domestic product (GDP) growth during the past three decades.
Credit deterioration and contagion
The heightened macroeconomic risk and elevated credit risk swirling around certain European nations and financial institutions have caused many market participants to avoid purchases of or reduce exposure to short-term debt offerings by these issuers. With increased credit risk, there are growing concerns about the potential credit contraction and contagion from European issuers spreading to other financial markets.
We invite you to learn more by visiting us on the Internet or calling us by phone. It is our privilege to provide the resources you need to choose investments that are right for you.
Sincerely,
(The acting chairman's signature appears here.)
James C. Curvey
Acting Chairman
Annual Report
Performance: The Bottom Line
Average annual total return reflects the change in the value of an investment, assuming reinvestment of the class' distributions from dividend income and capital gains (the profits earned upon the sale of securities that have grown in value, if any) and assuming a constant rate of performance each year. The $10,000 table and the fund's returns do not reflect the deduction of taxes that a shareholder would pay on fund distributions or the redemption of fund shares. During periods of reimbursement by Fidelity, a fund's total return will be greater than it would be had the reimbursement not occurred. How a fund did yesterday is no guarantee of how it will do tomorrow.
Average Annual Total Returns
Periods ended January 31, 2012 | Past 1 | Past 5 | Past 10 |
Class A (incl. 5.75% sales charge) A | -1.92% | -1.79% | 1.47% |
Class T (incl. 3.50% sales charge) B | 0.15% | -1.59% | 1.58% |
Class B (incl. contingent deferred sales charge) C | -1.80% | -1.72% | 1.70% |
Class C (incl. contingent deferred sales charge) D | 2.22% | -1.35% | 1.70% |
A Class A shares bear a 0.25% 12b-1 fee. The initial offering of Class A shares took place on February 13, 2007. Returns prior to February 13, 2007 are those of Fidelity® Large Cap Growth Fund, the original class of the fund, which has no 12b-1 fee. Had Class A shares' 12b-1 fee been reflected, returns prior to February 13, 2007 would have been lower.
B Class T shares bear a 0.50% 12b-1 fee. The initial offering of Class T shares took place on February 13, 2007. Returns prior to February 13, 2007 are those of Fidelity Large Cap Growth Fund, the original class of the fund, which has no 12b-1 fee. Had Class T shares' 12b-1 fee been reflected, returns prior to February 13, 2007 would have been lower.
C Class B shares bear a 1.00% 12b-1 fee. The initial offering of Class B shares took place on February 13, 2007. Returns prior to February 13, 2007 are those of Fidelity Large Cap Growth Fund, the original class of the fund, which has no 12b-1 fee. Had Class B shares' 12b-1 fee been reflected, returns prior to February 13, 2007 would have been lower. Class B shares' contingent deferred sales charge included in the past one year, past five years, and past ten years total return figures are 5%, 2%, and 0%, respectively.
D Class C shares bear a 1.00% 12b-1 fee. The initial offering of Class C shares took place on February 13, 2007. Returns prior to February 13, 2007 are those of Fidelity Large Cap Growth Fund, the original class of the fund, which has no 12b-1 fee. Had Class C shares' 12b-1 fee been reflected, returns prior to February 13, 2007 would have been lower. Class C shares' contingent deferred sales charge included in the past one year, past five years, and past ten years total return figures are 1%, 0%, and 0%, respectively.
Annual Report
$10,000 Over 10 Years
Let's say hypothetically that $10,000 was invested in Fidelity Advisor® Large Cap Growth Fund - Class A on January 31, 2002, and the current 5.75% sales charge was paid. The chart shows how the value of your investment would have changed, and also shows how the Russell 1000® Growth Index performed over the same period. The initial offering of Class A took place on February 13, 2007. See the previous page for additional information regarding performance of Class A.
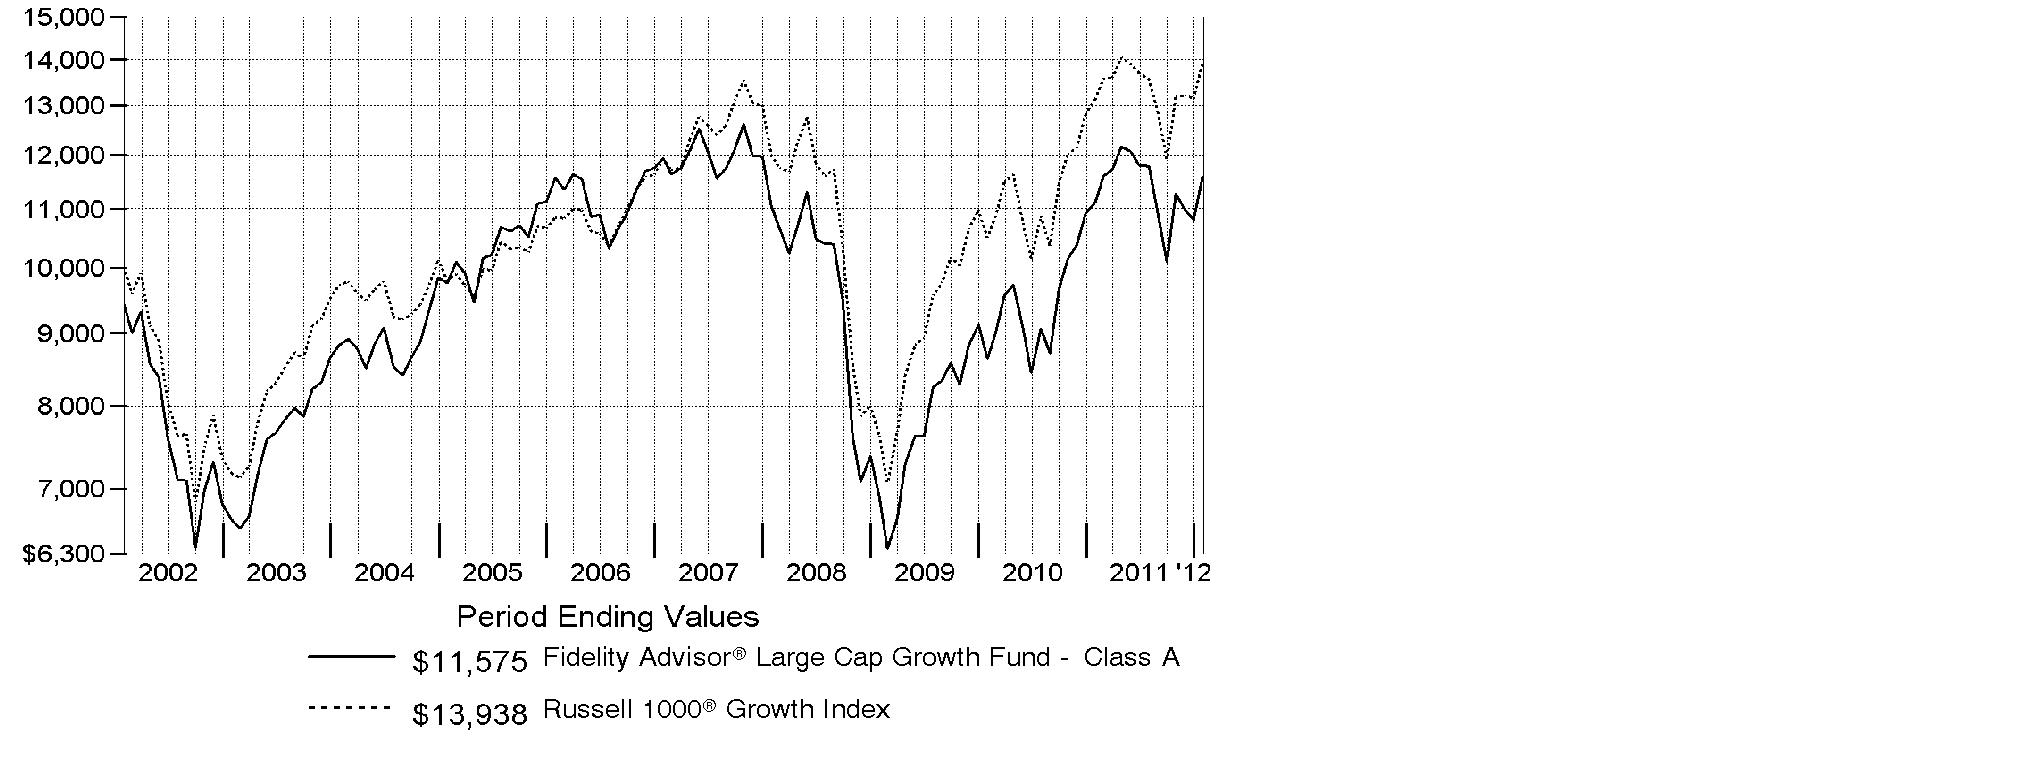
Annual Report
Management's Discussion of Fund Performance
Market Recap: After enduring one of the most volatile trading periods on record, U.S. stocks posted a gain for the 12 months ending January 31, 2012, sparked by a January rally. Strong corporate earnings reports and hints of economic recovery sent stocks mostly upward through April, when sovereign debt woes in Europe sparked fear of a global slowdown. In the summer, equities plummeted on eurozone instability, debate over the U.S. debt ceiling and a historic downgrade of the nation's sovereign debt rating. After falling as much as 13% by early August, the broad-based S&P 500® Index seesawed back to end the period on an optimistic note. For the full 12 months, the S&P 500® rose 4.22%, while the technology-laden Nasdaq Composite® Index added 5.26%. Investors began to shed perceived riskier smaller-cap stocks in favor of larger, more-established and dividend-paying names, helping to drive the Dow Jones® Industrial Average up 9.12% for the year, while the Russell 2000® - a proxy for small-caps - and Russell Midcap® indexes added 2.86% and 2.25%, respectively. Within the S&P 500®, defensive sectors such as health care (+16%) and utilities (+14%) fared best, while financials (-12%) struggled. Foreign developed-markets stocks were stung by Europe's turmoil, and the MSCI® EAFE® (Europe, Australasia, Far East) Index fell 9.49%.
Comments from Jeffrey Feingold, Portfolio Manager of Fidelity Advisor® Large Cap Growth Fund for most of the period covered by this update: For the year, the fund's Class A, Class T, Class B and Class C shares returned 4.07%, 3.78%, 3.20% and 3.22%, respectively (excluding sales charges), versus the 6.07% gain of its benchmark, the Russell 1000® Growth Index. Security selection was disappointing relative to the index, particularly in the information technology, industrials, financials and energy sectors. In terms of individual detractors, not owning tobacco company and index component Philip Morris International hurt, as safer-haven, dividend-paying stocks rallied nicely. Within tech, NVIDIA, which makes graphics processors for computers and mobile devices, saw its share price decline due to end market weakness and softer demand for some newer products. Underweightings in two strong performing index constituents - fast-food chain McDonald's and IT leader International Business Machines - further detracted. Conversely, investments in consumer discretionary and consumer staples aided relative results. Top individual contributors included Tempur-Pedic International, a manufacturer of premium bedding, and Herbalife, which makes weight-management products and nutritional supplements. Herbalife was no longer owned by the fund at period end.
Annual Report
Note to shareholders: Daniel Kelley became Portfolio Manager on January 12, 2012.
The views expressed above reflect those of the portfolio manager(s) only through the end of the period as stated on the cover of this report and do not necessarily represent the views of Fidelity or any other person in the Fidelity organization. Any such views are subject to change at any time based upon market or other conditions and Fidelity disclaims any responsibility to update such views. These views may not be relied on as investment advice and, because investment decisions for a Fidelity fund are based on numerous factors, may not be relied on as an indication of trading intent on behalf of any Fidelity fund.
Annual Report
Shareholder Expense Example
As a shareholder of the Fund, you incur two types of costs: (1) transaction costs, including sales charges (loads) on purchase payments or redemption proceeds, and (2) ongoing costs, including management fees, distribution and/or service (12b-1) fees and other Fund expenses. This Example is intended to help you understand your ongoing costs (in dollars) of investing in the Fund and to compare these costs with the ongoing costs of investing in other mutual funds.
The Example is based on an investment of $1,000 invested at the beginning of the period and held for the entire period (August 1, 2011 to January 31, 2012).
Actual Expenses
The first line of the accompanying table for each class of the Fund provides information about actual account values and actual expenses. You may use the information in this line, together with the amount you invested, to estimate the expenses that you paid over the period. Simply divide your account value by $1,000.00 (for example, an $8,600 account value divided by $1,000.00 = 8.6), then multiply the result by the number in the first line for a class of the Fund under the heading entitled "Expenses Paid During Period" to estimate the expenses you paid on your account during this period. A small balance maintenance fee of $12.00 that is charged once a year may apply for certain accounts with a value of less than $2,000. This fee is not included in the table below. If it was, the estimate of expenses you paid during the period would be higher, and your ending account value lower, by this amount. In addition, the Fund, as a shareholder in the underlying Fidelity Central Funds, will indirectly bear its pro-rata share of the fees and expenses incurred by the underlying Fidelity Central Funds. These fees and expenses are not included in the Fund's annualized expense ratio used to calculate the expense estimate in the table below.
Hypothetical Example for Comparison Purposes
The second line of the accompanying table for each class of the Fund provides information about hypothetical account values and hypothetical expenses based on a Class' actual expense ratio and an assumed rate of return of 5% per year before expenses, which is not the Class' actual return. The hypothetical account values and expenses may not be used to estimate the actual ending account balance or expenses you paid for the period. You may use this information to compare the ongoing costs of investing in the Fund and other funds. To do so, compare this 5% hypothetical example with the 5% hypothetical examples that appear in the shareholder reports of the other funds. A small balance maintenance fee of $12.00 that is charged once a year may apply for certain accounts with a value of less than $2,000. This fee is not included in the table below. If it was, the estimate of expenses you paid during the period would be higher, and your ending account value lower, by this amount. In addition, the Fund, as a shareholder in the underlying Fidelity Central Funds, will indirectly bear its pro-rata share of the fees and expenses incurred by the underlying Fidelity Central Funds. These fees and expenses are not included in the Fund's annualized expense ratio used to calculate the expense estimate in the table below.
Please note that the expenses shown in the table are meant to highlight your ongoing costs only and do not reflect any transaction costs. Therefore, the second line of the table is useful in comparing ongoing costs only, and will not help you determine the relative total costs of owning different funds. In addition, if these transactional costs were included, your costs would have been higher.
Annual Report
| Annualized | Beginning | Ending | Expenses Paid |
Class A | 1.12% |
|
|
|
Actual |
| $ 1,000.00 | $ 982.70 | $ 5.60 |
HypotheticalA |
| $ 1,000.00 | $ 1,019.56 | $ 5.70 |
Class T | 1.38% |
|
|
|
Actual |
| $ 1,000.00 | $ 981.60 | $ 6.89 |
HypotheticalA |
| $ 1,000.00 | $ 1,018.25 | $ 7.02 |
Class B | 1.85% |
|
|
|
Actual |
| $ 1,000.00 | $ 978.50 | $ 9.23 |
HypotheticalA |
| $ 1,000.00 | $ 1,015.88 | $ 9.40 |
Class C | 1.86% |
|
|
|
Actual |
| $ 1,000.00 | $ 978.30 | $ 9.27 |
HypotheticalA |
| $ 1,000.00 | $ 1,015.83 | $ 9.45 |
Large Cap Growth | .82% |
|
|
|
Actual |
| $ 1,000.00 | $ 983.90 | $ 4.10 |
HypotheticalA |
| $ 1,000.00 | $ 1,021.07 | $ 4.18 |
Institutional Class | .76% |
|
|
|
Actual |
| $ 1,000.00 | $ 983.90 | $ 3.80 |
HypotheticalA |
| $ 1,000.00 | $ 1,021.37 | $ 3.87 |
A 5% return per year before expenses
* Expenses are equal to each Class' annualized expense ratio, multiplied by the average account value over the period, multiplied by 184/365 (to reflect the one-half year period).
Annual Report
Investment Changes (Unaudited)
Top Ten Stocks as of January 31, 2012 | ||
| % of fund's | % of fund's net assets |
Apple, Inc. | 7.6 | 7.4 |
Exxon Mobil Corp. | 3.0 | 3.8 |
Google, Inc. Class A | 2.7 | 3.8 |
Oracle Corp. | 2.1 | 1.9 |
Microsoft Corp. | 2.0 | 0.1 |
QUALCOMM, Inc. | 1.9 | 2.0 |
United Technologies Corp. | 1.6 | 1.5 |
Amazon.com, Inc. | 1.6 | 2.5 |
Cognizant Technology Solutions Corp. Class A | 1.5 | 2.1 |
Motorola Solutions, Inc. | 1.4 | 0.0 |
| 25.4 | |
Top Five Market Sectors as of January 31, 2012 | ||
| % of fund's | % of fund's net assets 6 months ago |
Information Technology | 30.4 | 29.3 |
Consumer Discretionary | 15.7 | 13.9 |
Industrials | 10.9 | 12.0 |
Health Care | 10.8 | 10.4 |
Consumer Staples | 10.0 | 11.0 |
Asset Allocation (% of fund's net assets) | |||||||
As of January 31, 2012* | As of July 31, 2011** | ||||||
| Stocks 98.5% |
| | Stocks 100.1% |
| ||
| Short-Term |
| | Short-Term |
| ||
* Foreign investments | 10.2% |
| ** Foreign investments | 13.5% |
| ||

† Short-Term Investments and Net Other Assets are not included in the pie chart |
Annual Report
Investments January 31, 2012
Showing Percentage of Net Assets
Common Stocks - 98.5% | |||
Shares | Value | ||
CONSUMER DISCRETIONARY - 15.7% | |||
Auto Components - 0.1% | |||
Gentex Corp. | 7,700 | $ 206,899 | |
Automobiles - 0.9% | |||
Bayerische Motoren Werke AG (BMW) | 6,566 | 561,569 | |
Ford Motor Co. | 62,263 | 773,306 | |
Tesla Motors, Inc. (a) | 900 | 26,163 | |
| 1,361,038 | ||
Diversified Consumer Services - 0.5% | |||
Weight Watchers International, Inc. | 10,300 | 784,139 | |
Hotels, Restaurants & Leisure - 2.5% | |||
Brinker International, Inc. | 46,500 | 1,202,025 | |
Chipotle Mexican Grill, Inc. (a) | 1,500 | 550,935 | |
Dunkin' Brands Group, Inc. (a) | 12,100 | 334,565 | |
Las Vegas Sands Corp. | 24,500 | 1,203,195 | |
McDonald's Corp. | 7,600 | 752,780 | |
| 4,043,500 | ||
Household Durables - 2.1% | |||
D.R. Horton, Inc. | 82,900 | 1,153,968 | |
Lennar Corp. Class A | 4,700 | 101,003 | |
PulteGroup, Inc. (a) | 31,800 | 236,910 | |
Ryland Group, Inc. | 23,300 | 424,060 | |
Tempur-Pedic International, Inc. (a) | 19,800 | 1,320,858 | |
Toll Brothers, Inc. (a) | 4,400 | 95,964 | |
| 3,332,763 | ||
Internet & Catalog Retail - 1.6% | |||
Amazon.com, Inc. (a) | 13,000 | 2,527,720 | |
Multiline Retail - 1.2% | |||
Dollar General Corp. (a) | 23,500 | 1,001,335 | |
Dollar Tree, Inc. (a) | 10,700 | 907,467 | |
| 1,908,802 | ||
Specialty Retail - 4.2% | |||
American Eagle Outfitters, Inc. | 34,600 | 487,514 | |
AutoZone, Inc. (a) | 1,500 | 521,820 | |
Bed Bath & Beyond, Inc. (a) | 13,400 | 813,380 | |
Limited Brands, Inc. | 18,000 | 753,480 | |
Lowe's Companies, Inc. | 54,800 | 1,470,284 | |
Sally Beauty Holdings, Inc. (a) | 33,700 | 694,894 | |
TJX Companies, Inc. | 20,300 | 1,383,242 | |
Common Stocks - continued | |||
Shares | Value | ||
CONSUMER DISCRETIONARY - continued | |||
Specialty Retail - continued | |||
Tractor Supply Co. | 4,200 | $ 339,234 | |
Williams-Sonoma, Inc. | 8,000 | 286,880 | |
| 6,750,728 | ||
Textiles, Apparel & Luxury Goods - 2.6% | |||
Deckers Outdoor Corp. (a) | 18,200 | 1,471,470 | |
Pandora A/S | 10,200 | 133,706 | |
PVH Corp. | 14,800 | 1,142,412 | |
Ralph Lauren Corp. | 4,300 | 653,600 | |
Under Armour, Inc. Class A (sub. vtg.) (a) | 8,200 | 652,884 | |
| 4,054,072 | ||
TOTAL CONSUMER DISCRETIONARY | 24,969,661 | ||
CONSUMER STAPLES - 10.0% | |||
Beverages - 2.6% | |||
Anheuser-Busch InBev SA NV | 10,300 | 626,204 | |
Diageo PLC sponsored ADR | 9,100 | 806,169 | |
Dr Pepper Snapple Group, Inc. | 34,500 | 1,339,290 | |
The Coca-Cola Co. | 21,800 | 1,472,154 | |
| 4,243,817 | ||
Food & Staples Retailing - 2.1% | |||
CVS Caremark Corp. | 16,100 | 672,175 | |
Drogasil SA | 55,700 | 462,254 | |
Wal-Mart Stores, Inc. | 18,068 | 1,108,652 | |
Walgreen Co. | 7,600 | 253,536 | |
Whole Foods Market, Inc. | 11,300 | 836,539 | |
| 3,333,156 | ||
Food Products - 1.0% | |||
Corn Products International, Inc. | 8,400 | 466,116 | |
Green Mountain Coffee Roasters, Inc. (a)(d) | 21,100 | 1,125,474 | |
| 1,591,590 | ||
Household Products - 2.4% | |||
Colgate-Palmolive Co. | 21,700 | 1,968,624 | |
Kimberly-Clark Corp. | 11,200 | 801,472 | |
Procter & Gamble Co. | 15,800 | 996,032 | |
| 3,766,128 | ||
Personal Products - 0.6% | |||
Schiff Nutrition International, Inc. (a) | 92,386 | 985,759 | |
Common Stocks - continued | |||
Shares | Value | ||
CONSUMER STAPLES - continued | |||
Tobacco - 1.3% | |||
Altria Group, Inc. | 61,600 | $ 1,749,440 | |
Japan Tobacco, Inc. | 62 | 304,998 | |
| 2,054,438 | ||
TOTAL CONSUMER STAPLES | 15,974,888 | ||
ENERGY - 9.9% | |||
Energy Equipment & Services - 3.0% | |||
Cameron International Corp. (a) | 14,700 | 782,040 | |
Dresser-Rand Group, Inc. (a) | 12,800 | 655,744 | |
Halliburton Co. | 38,800 | 1,427,064 | |
McDermott International, Inc. (a) | 11,200 | 136,192 | |
Noble Corp. | 13,800 | 480,792 | |
Oceaneering International, Inc. | 13,900 | 675,401 | |
Rowan Companies, Inc. (a) | 2,200 | 74,822 | |
Schlumberger Ltd. | 7,700 | 578,809 | |
| 4,810,864 | ||
Oil, Gas & Consumable Fuels - 6.9% | |||
Alpha Natural Resources, Inc. (a) | 7,370 | 148,284 | |
Amyris, Inc. (a) | 23,400 | 209,898 | |
Apache Corp. | 9,000 | 889,920 | |
Atlas Pipeline Partners, LP | 9,500 | 356,345 | |
BP PLC sponsored ADR | 3,829 | 175,789 | |
Chevron Corp. | 9,800 | 1,010,184 | |
Exxon Mobil Corp. | 57,600 | 4,823,424 | |
Hess Corp. | 8,200 | 461,660 | |
Marathon Petroleum Corp. | 14,750 | 563,745 | |
Occidental Petroleum Corp. | 11,300 | 1,127,401 | |
SM Energy Co. | 5,000 | 362,900 | |
Southwestern Energy Co. (a) | 15,500 | 482,670 | |
Ultra Petroleum Corp. (a) | 12,000 | 288,360 | |
| 10,900,580 | ||
TOTAL ENERGY | 15,711,444 | ||
FINANCIALS - 5.3% | |||
Capital Markets - 1.0% | |||
Charles Schwab Corp. | 46,200 | 538,230 | |
Common Stocks - continued | |||
Shares | Value | ||
FINANCIALS - continued | |||
Capital Markets - continued | |||
HFF, Inc. (a) | 10,500 | $ 148,155 | |
Morgan Stanley | 51,600 | 962,340 | |
| 1,648,725 | ||
Commercial Banks - 0.6% | |||
SunTrust Banks, Inc. | 7,200 | 148,104 | |
Wells Fargo & Co. | 28,400 | 829,564 | |
| 977,668 | ||
Consumer Finance - 0.2% | |||
SLM Corp. | 20,464 | 305,937 | |
Diversified Financial Services - 1.1% | |||
Bank of America Corp. | 51,600 | 367,908 | |
Citigroup, Inc. | 20,780 | 638,362 | |
JPMorgan Chase & Co. | 20,400 | 760,920 | |
| 1,767,190 | ||
Real Estate Investment Trusts - 2.1% | |||
American Tower Corp. | 22,400 | 1,422,624 | |
Big Yellow Group PLC | 73,100 | 322,345 | |
Camden Property Trust (SBI) | 3,800 | 245,100 | |
Corporate Office Properties Trust (SBI) | 2,600 | 62,998 | |
Digital Realty Trust, Inc. | 4,500 | 318,870 | |
Equity Residential (SBI) | 6,000 | 357,300 | |
Extra Space Storage, Inc. | 15,800 | 415,856 | |
Pennsylvania Real Estate Investment Trust (SBI) | 18,800 | 230,864 | |
| 3,375,957 | ||
Real Estate Management & Development - 0.3% | |||
CBRE Group, Inc. (a) | 21,300 | 411,090 | |
TOTAL FINANCIALS | 8,486,567 | ||
HEALTH CARE - 10.8% | |||
Biotechnology - 3.6% | |||
Achillion Pharmaceuticals, Inc. (a) | 56,600 | 627,694 | |
ADVENTRX Pharmaceuticals, Inc. (a)(d) | 116,174 | 79,986 | |
ADVENTRX Pharmaceuticals, Inc. warrants 11/16/16 (a) | 39,587 | 3,365 | |
Alexion Pharmaceuticals, Inc. (a) | 7,600 | 583,376 | |
Alkermes PLC (a) | 6,200 | 116,622 | |
Amgen, Inc. | 9,100 | 617,981 | |
Ardea Biosciences, Inc. (a) | 11,500 | 209,185 | |
ARIAD Pharmaceuticals, Inc. (a) | 22,700 | 334,825 | |
Common Stocks - continued | |||
Shares | Value | ||
HEALTH CARE - continued | |||
Biotechnology - continued | |||
Biogen Idec, Inc. (a) | 8,200 | $ 966,944 | |
BioMarin Pharmaceutical, Inc. (a) | 13,700 | 488,679 | |
Dynavax Technologies Corp. (a) | 68,200 | 237,336 | |
Gilead Sciences, Inc. (a) | 26,600 | 1,299,144 | |
Theravance, Inc. (a) | 12,200 | 216,428 | |
| 5,781,565 | ||
Health Care Equipment & Supplies - 1.4% | |||
Covidien PLC | 28,700 | 1,478,050 | |
The Cooper Companies, Inc. | 9,200 | 663,688 | |
| 2,141,738 | ||
Health Care Providers & Services - 3.0% | |||
Aetna, Inc. | 8,100 | 353,970 | |
Catalyst Health Solutions, Inc. (a) | 5,600 | 306,656 | |
Express Scripts, Inc. (a) | 3,024 | 154,708 | |
Health Net, Inc. (a) | 12,900 | 486,846 | |
Laboratory Corp. of America Holdings (a) | 6,450 | 589,466 | |
McKesson Corp. | 10,100 | 825,372 | |
Medco Health Solutions, Inc. (a) | 18,400 | 1,141,168 | |
UnitedHealth Group, Inc. | 3,800 | 196,802 | |
WellPoint, Inc. | 12,000 | 771,840 | |
| 4,826,828 | ||
Life Sciences Tools & Services - 0.4% | |||
Illumina, Inc. (a) | 12,400 | 641,824 | |
Pharmaceuticals - 2.4% | |||
AVANIR Pharmaceuticals Class A (a)(d) | 27,400 | 80,556 | |
Elan Corp. PLC sponsored ADR (a) | 17,300 | 235,453 | |
Eli Lilly & Co. | 24,200 | 961,708 | |
GlaxoSmithKline PLC sponsored ADR | 17,100 | 761,634 | |
Merck & Co., Inc. | 4,200 | 160,692 | |
Sanofi-aventis sponsored ADR | 21,300 | 790,869 | |
Shire PLC sponsored ADR | 4,000 | 398,080 | |
Valeant Pharmaceuticals International, Inc. (Canada) (a) | 7,600 | 368,044 | |
| 3,757,036 | ||
TOTAL HEALTH CARE | 17,148,991 | ||
INDUSTRIALS - 10.9% | |||
Aerospace & Defense - 2.5% | |||
Raytheon Co. | 5,400 | 259,146 | |
Common Stocks - continued | |||
Shares | Value | ||
INDUSTRIALS - continued | |||
Aerospace & Defense - continued | |||
Rockwell Collins, Inc. | 9,100 | $ 526,799 | |
Textron, Inc. | 25,000 | 637,000 | |
United Technologies Corp. | 32,600 | 2,554,210 | |
| 3,977,155 | ||
Airlines - 0.3% | |||
Copa Holdings SA Class A | 6,400 | 436,096 | |
Building Products - 0.1% | |||
Armstrong World Industries, Inc. (a) | 5,000 | 233,500 | |
Construction & Engineering - 3.0% | |||
AECOM Technology Corp. (a) | 40,800 | 933,912 | |
Dycom Industries, Inc. (a) | 18,600 | 397,482 | |
Fluor Corp. | 29,600 | 1,664,704 | |
Jacobs Engineering Group, Inc. (a) | 17,200 | 769,872 | |
MasTec, Inc. (a) | 23,300 | 379,557 | |
Quanta Services, Inc. (a) | 33,160 | 716,256 | |
| 4,861,783 | ||
Electrical Equipment - 0.9% | |||
GrafTech International Ltd. (a) | 14,800 | 243,016 | |
Regal-Beloit Corp. | 14,100 | 800,457 | |
Schneider Electric SA | 5,200 | 322,928 | |
| 1,366,401 | ||
Industrial Conglomerates - 0.9% | |||
Danaher Corp. | 28,100 | 1,475,531 | |
Machinery - 2.3% | |||
Cummins, Inc. | 18,200 | 1,892,800 | |
Ingersoll-Rand PLC | 29,800 | 1,041,212 | |
Joy Global, Inc. | 5,041 | 457,168 | |
Manitowoc Co., Inc. | 26,600 | 357,504 | |
| 3,748,684 | ||
Road & Rail - 0.6% | |||
Union Pacific Corp. | 8,100 | 925,911 | |
Trading Companies & Distributors - 0.3% | |||
WESCO International, Inc. (a) | 6,700 | 421,296 | |
TOTAL INDUSTRIALS | 17,446,357 | ||
INFORMATION TECHNOLOGY - 30.4% | |||
Communications Equipment - 4.1% | |||
Acme Packet, Inc. (a) | 1,500 | 43,845 | |
Common Stocks - continued | |||
Shares | Value | ||
INFORMATION TECHNOLOGY - continued | |||
Communications Equipment - continued | |||
Motorola Solutions, Inc. | 48,300 | $ 2,241,603 | |
Polycom, Inc. (a) | 62,013 | 1,237,159 | |
QUALCOMM, Inc. | 52,800 | 3,105,696 | |
| 6,628,303 | ||
Computers & Peripherals - 7.9% | |||
Apple, Inc. (a) | 26,600 | 12,142,369 | |
SanDisk Corp. (a) | 8,600 | 394,568 | |
| 12,536,937 | ||
Electronic Equipment & Components - 0.6% | |||
Arrow Electronics, Inc. (a) | 9,300 | 383,997 | |
TE Connectivity Ltd. | 14,900 | 508,090 | |
| 892,087 | ||
Internet Software & Services - 4.5% | |||
Akamai Technologies, Inc. (a) | 3,400 | 109,650 | |
Baidu.com, Inc. sponsored ADR (a) | 4,100 | 522,832 | |
eBay, Inc. (a) | 29,000 | 916,400 | |
Facebook, Inc. Class B (e) | 6,574 | 164,350 | |
Google, Inc. Class A (a) | 7,600 | 4,408,836 | |
Rackspace Hosting, Inc. (a)(d) | 26,404 | 1,146,198 | |
| 7,268,266 | ||
IT Services - 3.2% | |||
Accenture PLC Class A | 9,500 | 544,730 | |
Cognizant Technology Solutions Corp. Class A (a) | 33,100 | 2,374,925 | |
International Business Machines Corp. | 5,400 | 1,040,040 | |
Virtusa Corp. (a) | 20,300 | 324,597 | |
Visa, Inc. Class A | 8,600 | 865,504 | |
| 5,149,796 | ||
Semiconductors & Semiconductor Equipment - 2.7% | |||
Analog Devices, Inc. | 11,700 | 457,821 | |
ASML Holding NV | 13,600 | 584,664 | |
Atmel Corp. (a) | 35,800 | 347,618 | |
Avago Technologies Ltd. | 11,400 | 386,916 | |
Broadcom Corp. Class A | 29,200 | 1,002,728 | |
Cymer, Inc. (a) | 3,800 | 189,202 | |
Freescale Semiconductor Holdings I Ltd. | 25,500 | 407,235 | |
NVIDIA Corp. (a) | 37,700 | 556,829 | |
NXP Semiconductors NV (a) | 18,800 | 399,124 | |
| 4,332,137 | ||
Common Stocks - continued | |||
Shares | Value | ||
INFORMATION TECHNOLOGY - continued | |||
Software - 7.4% | |||
Aspen Technology, Inc. (a) | 8,700 | $ 156,687 | |
Citrix Systems, Inc. (a) | 13,600 | 886,856 | |
Informatica Corp. (a) | 11,600 | 490,680 | |
Intuit, Inc. | 7,100 | 400,724 | |
Microsoft Corp. | 106,400 | 3,141,992 | |
Oracle Corp. | 117,800 | 3,321,960 | |
Red Hat, Inc. (a) | 14,100 | 653,817 | |
salesforce.com, Inc. (a) | 13,150 | 1,535,920 | |
Solera Holdings, Inc. | 13,400 | 640,118 | |
VMware, Inc. Class A (a) | 5,700 | 520,239 | |
| 11,748,993 | ||
TOTAL INFORMATION TECHNOLOGY | 48,556,519 | ||
MATERIALS - 5.5% | |||
Chemicals - 2.9% | |||
Air Products & Chemicals, Inc. | 7,900 | 695,437 | |
Ashland, Inc. | 9,900 | 624,294 | |
LyondellBasell Industries NV Class A | 15,600 | 672,360 | |
Monsanto Co. | 20,800 | 1,706,640 | |
Sigma Aldrich Corp. | 5,000 | 340,200 | |
The Mosaic Co. | 11,200 | 626,864 | |
| 4,665,795 | ||
Construction Materials - 0.5% | |||
Eagle Materials, Inc. | 13,300 | 391,153 | |
Martin Marietta Materials, Inc. (d) | 4,300 | 354,793 | |
| 745,946 | ||
Metals & Mining - 2.1% | |||
Commercial Metals Co. | 42,100 | 603,714 | |
Freeport-McMoRan Copper & Gold, Inc. | 14,000 | 646,940 | |
Goldcorp, Inc. | 8,500 | 411,119 | |
Ivanhoe Mines Ltd. (a) | 21,600 | 348,314 | |
Kinross Gold Corp. | 28,800 | 325,409 | |
Common Stocks - continued | |||
Shares | Value | ||
MATERIALS - continued | |||
Metals & Mining - continued | |||
Newmont Mining Corp. | 10,400 | $ 639,392 | |
Nucor Corp. | 9,000 | 400,410 | |
| 3,375,298 | ||
TOTAL MATERIALS | 8,787,039 | ||
TOTAL COMMON STOCKS (Cost $145,129,252) |
| ||
Money Market Funds - 2.5% | |||
|
|
|
|
Fidelity Cash Central Fund, 0.12% (b) | 2,950,174 | 2,950,174 | |
Fidelity Securities Lending Cash Central Fund, 0.12% (b)(c) | 1,108,700 | 1,108,700 | |
TOTAL MONEY MARKET FUNDS (Cost $4,058,874) |
| ||
TOTAL INVESTMENT PORTFOLIO - 101.0% (Cost $149,188,126) | 161,140,340 | ||
NET OTHER ASSETS (LIABILITIES) - (1.0)% | (1,609,392) | ||
NET ASSETS - 100% | $ 159,530,948 | ||
Legend |
(a) Non-income producing |
(b) Affiliated fund that is available only to investment companies and other accounts managed by Fidelity Investments. The rate quoted is the annualized seven-day yield of the fund at period end. A complete unaudited listing of the fund's holdings as of its most recent quarter end is available upon request. In addition, each Fidelity Central Fund's financial statements, which are not covered by the Fund's Report of Independent Registered Public Accounting Firm, are available on the SEC's website or upon request. |
(c) Investment made with cash collateral received from securities on loan. |
(d) Security or a portion of the security is on loan at period end. |
(e) Restricted securities - Investment in securities not registered under the Securities Act of 1933 (excluding 144A issues). At the end of the period, the value of restricted securities (excluding 144A issues) amounted to $164,350 or 0.1% of net assets. |
Additional information on each restricted holding is as follows: |
Security | Acquisition Date | Acquisition Cost |
Facebook, Inc. Class B | 3/31/11 - 5/19/11 | $ 164,398 |
Affiliated Central Funds |
Information regarding fiscal year to date income earned by the Fund from investments in Fidelity Central Funds is as follows: |
Fund | Income earned |
Fidelity Cash Central Fund | $ 2,819 |
Fidelity Securities Lending Cash Central Fund | 117,589 |
Total | $ 120,408 |
Other Information |
The following is a summary of the inputs used, as of January 31, 2012, involving the Fund's assets and liabilities carried at fair value. The inputs or methodology used for valuing securities may not be an indication of the risk associated with investing in those securities. For more information on valuation inputs, and their aggregation into the levels used in the tables below, please refer to the Security Valuation section in the accompanying Notes to Financial Statements. |
Valuation Inputs at Reporting Date: | ||||
Description | Total | Level 1 | Level 2 | Level 3 |
Investments in Securities: | ||||
Equities: | ||||
Consumer Discretionary | $ 24,969,661 | $ 24,969,661 | $ - | $ - |
Consumer Staples | 15,974,888 | 15,348,684 | 626,204 | - |
Energy | 15,711,444 | 15,711,444 | - | - |
Financials | 8,486,567 | 8,486,567 | - | - |
Health Care | 17,148,991 | 17,145,626 | 3,365 | - |
Industrials | 17,446,357 | 17,446,357 | - | - |
Information Technology | 48,556,519 | 48,392,169 | - | 164,350 |
Materials | 8,787,039 | 8,787,039 | - | - |
Money Market Funds | 4,058,874 | 4,058,874 | - | - |
Total Investments in Securities: | $ 161,140,340 | $ 160,346,421 | $ 629,569 | $ 164,350 |
The following is a reconciliation of Investments in Securities for which Level 3 inputs were used in determining value: |
Investments in Securities: | |
Beginning Balance | $ - |
Total Realized Gain (Loss) | - |
Total Unrealized Gain (Loss) | (48) |
Cost of Purchases | 164,398 |
Proceeds of Sales | - |
Amortization/Accretion | - |
Transfers in to Level 3 | - |
Transfers out of Level 3 | - |
Ending Balance | $ 164,350 |
The change in unrealized gain (loss) for the period attributable to Level 3 securities held at January 31, 2012 | $ (48) |
The information used in the above reconciliation represents fiscal year to date activity for any Investments in Securities identified as using Level 3 inputs at either the beginning or the end of the current fiscal period. Transfers in or out of Level 3 represent the beginning value of any Security or Instrument where a change in the pricing level occurred from the beginning to the end of the period. The cost of purchases and the proceeds of sales may include securities received or delivered through corporate actions or exchanges. Realized and unrealized gains (losses) disclosed in the reconciliation are included in Net Gain (Loss) on the Fund's Statement of Operations. |
Distribution of investments by country of issue, as a percentage of total net assets, is as follows: (Unaudited) |
United States of America | 89.8% |
Ireland | 2.1% |
United Kingdom | 1.3% |
Canada | 1.1% |
Netherlands | 1.1% |
Others (Individually Less Than 1%) | 4.6% |
| 100.0% |
See accompanying notes which are an integral part of the financial statements.
Annual Report
Financial Statements
Statement of Assets and Liabilities
| January 31, 2012 | |
Assets | ||
Investment in securities, at value (including securities loaned of $1,094,516) - See accompanying schedule: Unaffiliated issuers (cost $145,129,252) | $ 157,081,466 |
|
Fidelity Central Funds (cost $4,058,874) | 4,058,874 |
|
Total Investments (cost $149,188,126) |
| $ 161,140,340 |
Receivable for investments sold | 5,278,512 | |
Receivable for fund shares sold | 271,984 | |
Dividends receivable | 235,536 | |
Distributions receivable from Fidelity Central Funds | 10,276 | |
Prepaid expenses | 405 | |
Other receivables | 2,460 | |
Total assets | 166,939,513 | |
|
|
|
Liabilities | ||
Payable to custodian bank | $ 671 | |
Payable for investments purchased | 5,975,137 | |
Payable for fund shares redeemed | 175,059 | |
Accrued management fee | 51,732 | |
Distribution and service plan fees payable | 11,091 | |
Other affiliated payables | 37,996 | |
Other payables and accrued expenses | 48,179 | |
Collateral on securities loaned, at value | 1,108,700 | |
Total liabilities | 7,408,565 | |
|
|
|
Net Assets | $ 159,530,948 | |
Net Assets consist of: |
| |
Paid in capital | $ 165,601,509 | |
Accumulated net investment loss | (77,636) | |
Accumulated undistributed net realized gain (loss) on investments and foreign currency transactions | (17,944,865) | |
Net unrealized appreciation (depreciation) on investments and assets and liabilities in foreign currencies | 11,951,940 | |
Net Assets | $ 159,530,948 | |
See accompanying notes which are an integral part of the financial statements.
Annual Report
Financial Statements - continued
Statement of Assets and Liabilities - continued
| January 31, 2012 | |
Calculation of Maximum Offering Price Class A: | $ 10.24 | |
|
|
|
Maximum offering price per share (100/94.25 of $10.24) | $ 10.86 | |
Class T: | $ 10.15 | |
|
|
|
Maximum offering price per share (100/96.50 of $10.15) | $ 10.52 | |
Class B: | $ 9.99 | |
|
|
|
Class C: | $ 9.93 | |
|
|
|
|
|
|
Large Cap Growth: | $ 10.36 | |
|
|
|
Institutional Class: | $ 10.41 | |
A Redemption price per share is equal to net asset value less any applicable contingent deferred sales charge.
See accompanying notes which are an integral part of the financial statements.
Annual Report
Statement of Operations
| Year ended January 31, 2012 | |
Investment Income |
|
|
Dividends |
| $ 1,259,704 |
Income from Fidelity Central Funds (including $117,589 from security lending) |
| 120,408 |
Total income |
| 1,380,112 |
|
|
|
Expenses | ||
Management fee | $ 848,727 | |
Performance adjustment | (120,450) | |
Transfer agent fees | 402,876 | |
Distribution and service plan fees | 128,629 | |
Accounting and security lending fees | 59,836 | |
Custodian fees and expenses | 24,423 | |
Independent trustees' compensation | 879 | |
Registration fees | 69,466 | |
Audit | 54,122 | |
Legal | 479 | |
Miscellaneous | 1,272 | |
Total expenses before reductions | 1,470,259 | |
Expense reductions | (8,950) | 1,461,309 |
Net investment income (loss) | (81,197) | |
Realized and Unrealized Gain (Loss) Net realized gain (loss) on: | ||
Investment securities: |
|
|
Unaffiliated issuers | 18,082,876 | |
Foreign currency transactions | (20,849) | |
Total net realized gain (loss) |
| 18,062,027 |
Change in net unrealized appreciation (depreciation) on: Investment securities | (12,509,979) | |
Assets and liabilities in foreign currencies | (339) | |
Total change in net unrealized appreciation (depreciation) |
| (12,510,318) |
Net gain (loss) | 5,551,709 | |
Net increase (decrease) in net assets resulting from operations | $ 5,470,512 | |
See accompanying notes which are an integral part of the financial statements.
Annual Report
Financial Statements - continued
| Year ended | Year ended |
Increase (Decrease) in Net Assets |
|
|
Operations |
|
|
Net investment income (loss) | $ (81,197) | $ (93,801) |
Net realized gain (loss) | 18,062,027 | 9,819,924 |
Change in net unrealized appreciation (depreciation) | (12,510,318) | 19,527,853 |
Net increase (decrease) in net assets resulting | 5,470,512 | 29,253,976 |
Share transactions - net increase (decrease) | 17,565,380 | 1,733,380 |
Total increase (decrease) in net assets | 23,035,892 | 30,987,356 |
|
|
|
Net Assets | ||
Beginning of period | 136,495,056 | 105,507,700 |
End of period (including accumulated net investment loss of $77,636 and accumulated net investment loss of $5,902, respectively) | $ 159,530,948 | $ 136,495,056 |
See accompanying notes which are an integral part of the financial statements.
Annual Report
Financial Highlights - Class A
Years ended January 31, | 2012 | 2011 | 2010 | 2009 | 2008 H |
Selected Per-Share Data |
|
|
|
|
|
Net asset value, beginning of period | $ 9.84 | $ 7.64 | $ 6.12 | $ 9.85 | $ 11.85 |
Income from Investment Operations |
|
|
|
|
|
Net investment income (loss) E | (.03) | (.02) | .01 | .02 | (.03) |
Net realized and unrealized gain (loss) | .43 | 2.22 | 1.53 | (3.71) | (.72) |
Total from investment operations | .40 | 2.20 | 1.54 | (3.69) | (.75) |
Distributions from net investment income | - | - | (.02) | (.04) | - |
Distributions from net realized gain | - | - | - | - | (1.25) |
Total distributions | - | - | (.02) | (.04) | (1.25) |
Net asset value, end of period | $ 10.24 | $ 9.84 | $ 7.64 | $ 6.12 | $ 9.85 |
Total Return B,C,D | 4.07% | 28.80% | 25.14% | (37.49)% | (6.99)% |
Ratios to Average Net Assets F,I |
|
|
|
|
|
Expenses before reductions | 1.17% | 1.12% | 1.07% | 1.01% | 1.20% A |
Expenses net of fee waivers, if any | 1.17% | 1.12% | 1.07% | 1.01% | 1.20% A |
Expenses net of all reductions | 1.16% | 1.12% | 1.06% | 1.01% | 1.20% A |
Net investment income (loss) | (.26)% | (.28)% | .08% | .20% | (.29)% A |
Supplemental Data |
|
|
|
|
|
Net assets, end of period | $ 12,727 | $ 6,669 | $ 3,805 | $ 2,159 | $ 1,302 |
Portfolio turnover rate G | 108% | 126% | 342% | 355% | 428% |
A Annualized
B Total returns for periods of less than one year are not annualized.
C Total returns would have been lower if certain expenses had not been reduced during the applicable periods shown.
D Total returns do not include the effect of the sales charges.
E Calculated based on average shares outstanding during the period.
F Fees and expenses of any underlying Fidelity Central Funds are not included in the Fund's expense ratio. The Fund indirectly bears its proportionate share of the expenses of any underlying Fidelity Central Funds.
G Amount does not include the portfolio activity of any underlying Fidelity Central Funds.
H For the period February 13, 2007 (commencement of sale of shares) to January 31, 2008.
I Expense ratios reflect operating expenses of the class. Expenses before reductions do not reflect amounts reimbursed by the investment adviser or reductions from brokerage service arrangements or reductions from other expense offset arrangements and do not represent the amount paid by the class during periods when reimbursements or reductions occur. Expense ratios before reductions for start-up periods may not be representative of longer-term operating periods. Expenses net of fee waivers reflect expenses after reimbursement by the investment adviser but prior to reductions from brokerage service arrangements or other expense offset arrangements. Expenses net of all reductions represent the net expenses paid by the class.
See accompanying notes which are an integral part of the financial statements.
Annual Report
Financial Highlights - Class T
Years ended January 31, | 2012 | 2011 | 2010 | 2009 | 2008 H |
Selected Per-Share Data |
|
|
|
|
|
Net asset value, beginning of period | $ 9.78 | $ 7.61 | $ 6.11 | $ 9.85 | $ 11.85 |
Income from Investment Operations |
|
|
|
|
|
Net investment income (loss) E | (.05) | (.05) | (.02) | (.01) | (.06) |
Net realized and unrealized gain (loss) | .42 | 2.22 | 1.52 | (3.70) | (.69) |
Total from investment operations | .37 | 2.17 | 1.50 | (3.71) | (.75) |
Distributions from net investment income | - | - | - J | (.03) | - |
Distributions from net realized gain | - | - | - | - | (1.25) |
Total distributions | - | - | - J | (.03) | (1.25) |
Net asset value, end of period | $ 10.15 | $ 9.78 | $ 7.61 | $ 6.11 | $ 9.85 |
Total Return B,C,D | 3.78% | 28.52% | 24.60% | (37.71)% | (7.05)% |
Ratios to Average Net Assets F,I |
|
|
|
|
|
Expenses before reductions | 1.44% | 1.42% | 1.38% | 1.31% | 1.47% A |
Expenses net of fee waivers, if any | 1.44% | 1.42% | 1.38% | 1.31% | 1.47% A |
Expenses net of all reductions | 1.44% | 1.42% | 1.36% | 1.31% | 1.47% A |
Net investment income (loss) | (.53)% | (.58)% | (.23)% | (.10)% | (.56)% A |
Supplemental Data |
|
|
|
|
|
Net assets, end of period | $ 5,876 | $ 2,900 | $ 1,548 | $ 820 | $ 1,097 |
Portfolio turnover rate G | 108% | 126% | 342% | 355% | 428% |
A Annualized
B Total returns for periods of less than one year are not annualized.
C Total returns would have been lower if certain expenses had not been reduced during the applicable periods shown.
D Total returns do not include the effect of the sales charges.
E Calculated based on average shares outstanding during the period.
F Fees and expenses of any underlying Fidelity Central Funds are not included in the Fund's expense ratio. The Fund indirectly bears its proportionate share of the expenses of any underlying Fidelity Central Funds.
G Amount does not include the portfolio activity of any underlying Fidelity Central Funds.
H For the period February 13, 2007 (commencement of sale of shares) to January 31, 2008.
I Expense ratios reflect operating expenses of the class. Expenses before reductions do not reflect amounts reimbursed by the investment adviser or reductions from brokerage service arrangements or reductions from other expense offset arrangements and do not represent the amount paid by the class during periods when reimbursements or reductions occur. Expense ratios before reductions for start-up periods may not be representative of longer-term operating periods. Expenses net of fee waivers reflect expenses after reimbursement by the investment adviser but prior to reductions from brokerage service arrangements or other expense offset arrangements. Expenses net of all reductions represent the net expenses paid by the class.
J Amount represents less than $.01 per share.
See accompanying notes which are an integral part of the financial statements.
Annual Report
Financial Highlights - Class B
Years ended January 31, | 2012 | 2011 | 2010 | 2009 | 2008 H |
Selected Per-Share Data |
|
|
|
|
|
Net asset value, beginning of period | $ 9.68 | $ 7.57 | $ 6.09 | $ 9.83 | $ 11.85 |
Income from Investment Operations |
|
|
|
|
|
Net investment income (loss) E | (.10) | (.09) | (.05) | (.05) | (.12) |
Net realized and unrealized gain (loss) | .41 | 2.20 | 1.53 | (3.69) | (.70) |
Total from investment operations | .31 | 2.11 | 1.48 | (3.74) | (.82) |
Distributions from net realized gain | - | - | - | - J | (1.20) |
Total distributions | - | - | - | - J | (1.20) |
Net asset value, end of period | $ 9.99 | $ 9.68 | $ 7.57 | $ 6.09 | $ 9.83 |
Total Return B,C,D | 3.20% | 27.87% | 24.30% | (38.01)% | (7.62)% |
Ratios to Average Net Assets F,I |
|
|
|
|
|
Expenses before reductions | 1.92% | 1.87% | 1.82% | 1.76% | 1.99% A |
Expenses net of fee waivers, if any | 1.92% | 1.87% | 1.82% | 1.76% | 1.99% A |
Expenses net of all reductions | 1.92% | 1.87% | 1.80% | 1.76% | 1.99% A |
Net investment income (loss) | (1.01)% | (1.03)% | (.67)% | (.56)% | (1.07)% A |
Supplemental Data |
|
|
|
|
|
Net assets, end of period | $ 1,610 | $ 2,143 | $ 1,466 | $ 815 | $ 543 |
Portfolio turnover rate G | 108% | 126% | 342% | 355% | 428% |
A Annualized
B Total returns for periods of less than one year are not annualized.
C Total returns would have been lower if certain expenses had not been reduced during the applicable periods shown.
D Total returns do not include the effect of the contingent deferred sales charge.
E Calculated based on average shares outstanding during the period.
F Fees and expenses of any underlying Fidelity Central Funds are not included in the Fund's expense ratio. The Fund indirectly bears its proportionate share of the expenses of any underlying Fidelity Central Funds.
G Amount does not include the portfolio activity of any underlying Fidelity Central Funds.
H For the period February 13, 2007 (commencement of sale of shares) to January 31, 2008.
I Expense ratios reflect operating expenses of the class. Expenses before reductions do not reflect amounts reimbursed by the investment adviser or reductions from brokerage service arrangements or reductions from other expense offset arrangements and do not represent the amount paid by the class during periods when reimbursements or reductions occur. Expense ratios before reductions for start-up periods may not be representative of longer-term operating periods. Expenses net of fee waivers reflect expenses after reimbursement by the investment adviser but prior to reductions from brokerage service arrangements or other expense offset arrangements. Expenses net of all reductions represent the net expenses paid by the class.
J Amount represents less than $.01 per share.
See accompanying notes which are an integral part of the financial statements.
Annual Report
Financial Highlights - Class C
Years ended January 31, | 2012 | 2011 | 2010 | 2009 | 2008 H |
Selected Per-Share Data |
|
|
|
|
|
Net asset value, beginning of period | $ 9.62 | $ 7.52 | $ 6.06 | $ 9.82 | $ 11.85 |
Income from Investment Operations |
|
|
|
|
|
Net investment income (loss) E | (.10) | (.09) | (.05) | (.04) | (.11) |
Net realized and unrealized gain (loss) | .41 | 2.19 | 1.51 | (3.69) | (.70) |
Total from investment operations | .31 | 2.10 | 1.46 | (3.73) | (.81) |
Distributions from net investment income | - | - | - | (.03) | - |
Distributions from net realized gain | - | - | - | - | (1.22) |
Total distributions | - | - | - | (.03) | (1.22) |
Net asset value, end of period | $ 9.93 | $ 9.62 | $ 7.52 | $ 6.06 | $ 9.82 |
Total Return B,C,D | 3.22% | 27.93% | 24.09% | (37.98)% | (7.54)% |
Ratios to Average Net Assets F,I |
|
|
|
|
|
Expenses before reductions | 1.92% | 1.87% | 1.82% | 1.77% | 1.96% A |
Expenses net of fee waivers, if any | 1.92% | 1.87% | 1.82% | 1.77% | 1.96% A |
Expenses net of all reductions | 1.91% | 1.87% | 1.80% | 1.77% | 1.96% A |
Net investment income (loss) | (1.00)% | (1.03)% | (.67)% | (.57)% | (1.05)% A |
Supplemental Data |
|
|
|
|
|
Net assets, end of period | $ 6,061 | $ 3,623 | $ 1,917 | $ 1,441 | $ 945 |
Portfolio turnover rate G | 108% | 126% | 342% | 355% | 428% |
A Annualized
B Total returns for periods of less than one year are not annualized.
C Total returns would have been lower if certain expenses had not been reduced during the applicable periods shown.
D Total returns do not include the effect of the contingent deferred sales charge.
E Calculated based on average shares outstanding during the period.
F Fees and expenses of any underlying Fidelity Central Funds are not included in the Fund's expense ratio. The Fund indirectly bears its proportionate share of the expenses of any underlying Fidelity Central Funds.
G Amount does not include the portfolio activity of any underlying Fidelity Central Funds.
H For the period February 13, 2007 (commencement of sale of shares) to January 31, 2008.
I Expense ratios reflect operating expenses of the class. Expenses before reductions do not reflect amounts reimbursed by the investment adviser or reductions from brokerage service arrangements or reductions from other expense offset arrangements and do not represent the amount paid by the class during periods when reimbursements or reductions occur. Expense ratios before reductions for start-up periods may not be representative of longer-term operating periods. Expenses net of fee waivers reflect expenses after reimbursement by the investment adviser but prior to reductions from brokerage service arrangements or other expense offset arrangements. Expenses net of all reductions represent the net expenses paid by the class.
See accompanying notes which are an integral part of the financial statements.
Annual Report
Financial Highlights - Large Cap Growth
Years ended January 31, | 2012 | 2011 | 2010 | 2009 | 2008 |
Selected Per-Share Data |
|
|
|
|
|
Net asset value, beginning of period | $ 9.93 | $ 7.69 | $ 6.15 | $ 9.89 | $ 11.92 |
Income from Investment Operations |
|
|
|
|
|
Net investment income (loss) B | - F | - F | .02 | .04 | (.01) |
Net realized and unrealized gain (loss) | .43 | 2.24 | 1.55 | (3.73) | (.77) |
Total from investment operations | .43 | 2.24 | 1.57 | (3.69) | (.78) |
Distributions from net investment income | - | - | (.03) | (.05) | - |
Distributions from net realized gain | - | - | - | - | (1.25) |
Total distributions | - | - | (.03) | (.05) | (1.25) |
Net asset value, end of period | $ 10.36 | $ 9.93 | $ 7.69 | $ 6.15 | $ 9.89 |
Total Return A | 4.33% | 29.13% | 25.50% | (37.36)% | (7.26)% |
Ratios to Average Net Assets C,E |
|
|
|
|
|
Expenses before reductions | .88% | .87% | .81% | .75% | 1.03% |
Expenses net of fee waivers, if any | .88% | .87% | .81% | .74% | .99% |
Expenses net of all reductions | .87% | .86% | .80% | .74% | .98% |
Net investment income (loss) | .04% | (.02)% | .34% | .47% | (.07)% |
Supplemental Data |
|
|
|
|
|
Net assets, end of period | $ 132,123 | $ 120,671 | $ 96,661 | $ 85,332 | $ 147,864 |
Portfolio turnover rate D | 108% | 126% | 342% | 355% | 428% |
A Total returns would have been lower if certain expenses had not been reduced during the applicable periods shown.
B Calculated based on average shares outstanding during the period.
C Fees and expenses of any underlying Fidelity Central Funds are not included in the Fund's expense ratio. The Fund indirectly bears its proportionate share of the expenses of any underlying Fidelity Central Funds.
D Amount does not include the portfolio activity of any underlying Fidelity Central Funds.
E Expense ratios reflect operating expenses of the class. Expenses before reductions do not reflect amounts reimbursed by the investment adviser or reductions from brokerage service arrangements or reductions from other expense offset arrangements and do not represent the amount paid by the class during periods when reimbursements or reductions occur. Expenses net of fee waivers reflect expenses after reimbursement by the investment adviser but prior to reductions from brokerage service arrangements or other expense offset arrangements. Expenses net of all reductions represent the net expenses paid by the class.
F Amount represents less than $.01 per share.
See accompanying notes which are an integral part of the financial statements.
Annual Report
Financial Highlights - Institutional Class
Years ended January 31, | 2012 | 2011 | 2010 | 2009 | 2008 G |
Selected Per-Share Data |
|
|
|
|
|
Net asset value, beginning of period | $ 9.97 | $ 7.72 | $ 6.18 | $ 9.88 | $ 11.85 |
Income from Investment Operations |
|
|
|
|
|
Net investment income (loss) D | .01 | - I | .03 | .04 | - I |
Net realized and unrealized gain (loss) | .43 | 2.25 | 1.54 | (3.72) | (.70) |
Total from investment operations | .44 | 2.25 | 1.57 | (3.68) | (.70) |
Distributions from net investment income | - | - | (.03) | (.02) | - |
Distributions from net realized gain | - | - | - | - | (1.27) |
Total distributions | - | - | (.03) | (.02) | (1.27) |
Net asset value, end of period | $ 10.41 | $ 9.97 | $ 7.72 | $ 6.18 | $ 9.88 |
Total Return B,C | 4.41% | 29.15% | 25.42% | (37.29)% | (6.64)% |
Ratios to Average Net Assets E,H |
|
|
|
|
|
Expenses before reductions | .83% | .86% | .76% | .68% | .88% A |
Expenses net of fee waivers, if any | .83% | .86% | .76% | .68% | .88% A |
Expenses net of all reductions | .82% | .86% | .74% | .68% | .88% A |
Net investment income (loss) | .08% | (.02)% | .39% | .52% | .03% A |
Supplemental Data |
|
|
|
|
|
Net assets, end of period | $ 1,134 | $ 488 | $ 111 | $ 277 | $ 386 |
Portfolio turnover rate F | 108% | 126% | 342% | 355% | 428% |
A Annualized
B Total returns for periods of less than one year are not annualized.
C Total returns would have been lower if certain expenses had not been reduced during the applicable periods shown.
D Calculated based on average shares outstanding during the period.
E Fees and expenses of any underlying Fidelity Central Funds are not included in the Fund's expense ratio. The Fund indirectly bears its proportionate share of the expenses of any underlying Fidelity Central Funds.
F Amount does not include the portfolio activity of any underlying Fidelity Central Funds.
G For the period February 13, 2007 (commencement of sale of shares) to January 31, 2008.
H Expense ratios reflect operating expenses of the class. Expenses before reductions do not reflect amounts reimbursed by the investment adviser or reductions from brokerage service arrangements or reductions from other expense offset arrangements and do not represent the amount paid by the class during periods when reimbursements or reductions occur. Expense ratios before reductions for start-up periods may not be representative of longer-term operating periods. Expenses net of fee waivers reflect expenses after reimbursement by the investment adviser but prior to reductions from brokerage service arrangements or other expense offset arrangements. Expenses net of all reductions represent the net expenses paid by the class.
I Amount represents less than $.01 per share.
See accompanying notes which are an integral part of the financial statements.
Annual Report
Notes to Financial Statements
For the period ended January 31, 2012
1. Organization.
Fidelity Large Cap Growth Fund (the Fund) is a fund of Fidelity Devonshire Trust (the Trust) and is authorized to issue an unlimited number of shares. The Trust is registered under the Investment Company Act of 1940, as amended (the 1940 Act), as an open-end management investment company organized as a Massachusetts business trust. The Fund offers Class A, Class T, Class C, Large Cap Growth and Institutional Class shares, each of which, along with Class B shares, has equal rights as to assets and voting privileges. Effective after the close of business on September 1, 2010, Class B shares were closed to new accounts and additional purchases, except for exchanges and reinvestments. Each class has exclusive voting rights with respect to matters that affect that class. Class B shares will automatically convert to Class A shares after a holding period of seven years from the initial date of purchase. Investment income, realized and unrealized capital gains and losses, the common expenses of the Fund, and certain fund-level expense reductions, if any, are allocated on a pro-rata basis to each class based on the relative net assets of each class to the total net assets of the Fund. Each class differs with respect to transfer agent and distribution and service plan fees incurred. Certain expense reductions may also differ by class.
2. Investments in Fidelity Central Funds.
The Fund invests in Fidelity Central Funds, which are open-end investment companies available only to other investment companies and accounts managed by Fidelity Management & Research Company (FMR) and its affiliates. The Fund's Schedule of Investments lists each of the Fidelity Central Funds held as of period end, if any, as an investment of the Fund, but does not include the underlying holdings of each Fidelity Central Fund. As an Investing Fund, the Fund indirectly bears its proportionate share of the expenses of the underlying Fidelity Central Funds.
The Money Market Central Funds seek preservation of capital and current income and are managed by Fidelity Investments Money Management, Inc. (FIMM), an affiliate of FMR.
A complete unaudited list of holdings for each Fidelity Central Fund is available upon request or at the Securities and Exchange Commission (the SEC) web site at www.sec.gov. In addition, the financial statements of the Fidelity Central Funds, which are not covered by the Fund's Report of Independent Registered Public Accounting Firm, are available on the SEC web site or upon request.
3. Significant Accounting Policies.
The financial statements have been prepared in conformity with accounting principles generally accepted in the United States of America (GAAP), which require management to make certain estimates and assumptions at the date of the financial statements. Actual results could differ from those estimates. Subsequent events, if any, through the
Annual Report
3. Significant Accounting Policies - continued
date that the financial statements were issued have been evaluated in the preparation of the financial statements. The following summarizes the significant accounting policies of the Fund:
Security Valuation. Investments are valued as of 4:00 p.m. Eastern time on the last calendar day of the period. The Fund uses independent pricing services approved by the Board of Trustees to value its investments. When current market prices or quotations are not readily available or reliable, valuations may be determined in good faith in accordance with procedures adopted by the Board of Trustees. Factors used in determining value may include market or security specific events. The frequency with which these procedures are used cannot be predicted and they may be utilized to a significant extent. The value used for net asset value (NAV) calculation under these procedures may differ from published prices for the same securities.
The Fund categorizes the inputs to valuation techniques used to value its investments into a disclosure hierarchy consisting of three levels as shown below:
Level 1 - quoted prices in active markets for identical investments
Level 2 - other significant observable inputs (including quoted prices for similar investments, interest rates, prepayment speeds, etc.)
Level 3 - unobservable inputs (including the Fund's own assumptions based on the best information available)
Changes in valuation techniques may result in transfers in or out of an assigned level within the disclosure hierarchy. The aggregate value of investments by input level, as of January 31, 2012, as well as a roll forward of Level 3 securities, is included at the end of the Fund's Schedule of Investments. Valuation techniques used to value the Fund's investments by major category are as follows:
Equity securities, including restricted securities, for which market quotations are readily available, are valued at the last reported sale price or official closing price as reported by an independent pricing service on the primary market or exchange on which they are traded and are categorized as Level 1 in the hierarchy. In the event there were no sales during the day or closing prices are not available, securities are valued at the last quoted bid price or may be valued using the last available price and are generally categorized as Level 2 in the hierarchy. For foreign equity securities, when significant market or security specific events arise, comparisons to the valuation of American Depositary Receipts (ADRs), futures contracts, Exchange-traded funds (ETFs) and certain indexes as well as quoted prices for similar securities are used and are categorized as Level 2 in the hierarchy in these circumstances. Utilizing these techniques may result in transfers between Level 1 and Level 2. For restricted equity securities and private placements where
Annual Report
Notes to Financial Statements - continued
3. Significant Accounting Policies - continued
Security Valuation - continued
observable inputs are limited, assumptions about market activity and risk are used and are categorized as Level 3 in the hierarchy.
Investments in open-end mutual funds, including the Fidelity Central Funds, are valued at their closing net asset value each business day and are categorized as Level 1 in the hierarchy.
New Accounting Pronouncements. In May 2011, the Financial Accounting Standards Board issued Accounting Standard Update No. 2011-04, Fair Value Measurement (Topic 820) - Amendments to Achieve Common Fair Value Measurement and Disclosure Requirements in U.S. GAAP and IFRSs. The update is effective during interim and annual periods beginning after December 15, 2011 and will result in additional disclosure for transfers between levels as well as expanded disclosure for securities categorized as Level 3 under the fair value hierarchy.
In December 2011, the Financial Accounting Standards Board issued Accounting Standard Update No. 2011-11, Disclosures about Offsetting Assets and Liabilities. The update creates new disclosure requirements requiring entities to disclose both gross and net information for derivatives and other financial instruments that are either offset in the Statement of Assets and Liabilities or subject to an enforceable master netting arrangement or similar agreement. The disclosure requirements are effective for interim and annual reporting periods beginning on or after January 1, 2013. Management is currently evaluating the impact of the update's adoption on the Fund's financial statement disclosures.
Foreign Currency. The Fund may use foreign currency contracts to facilitate transactions in foreign-denominated securities. Gains and losses from these transactions may arise from changes in the value of the foreign currency or if the counterparties do not perform under the contracts' terms.
Foreign-denominated assets, including investment securities, and liabilities are translated into U.S. dollars at the exchange rate at period end. Purchases and sales of investment securities, income and dividends received and expenses denominated in foreign currencies are translated into U.S. dollars at the exchange rate in effect on the transaction date.
The effects of exchange rate fluctuations on investments are included with the net realized and unrealized gain (loss) on investment securities. Other foreign currency transactions resulting in realized and unrealized gain (loss) are disclosed separately.
Annual Report
3. Significant Accounting Policies - continued
Investment Transactions and Income. For financial reporting purposes, the Fund's investment holdings and NAV include trades executed through the end of the last business day of the period. The NAV per share for processing shareholder transactions is calculated as of the close of business of the New York Stock Exchange (NYSE), normally 4:00 p.m. Eastern time and includes trades executed through the end of the prior business day. Gains and losses on securities sold are determined on the basis of identified cost and may include proceeds received from litigation. Dividend income is recorded on the ex-dividend date, except for certain dividends from foreign securities where the ex-dividend date may have passed, which are recorded as soon as the Fund is informed of the ex-dividend date. Non-cash dividends included in dividend income, if any, are recorded at the fair market value of the securities received. Distributions received on securities that represent a return of capital or capital gain are recorded as a reduction of cost of investments and/or as a realized gain. The Fund estimates the components of distributions received that may be considered return of capital distributions or capital gain distributions. Interest income and distributions from the Fidelity Central Funds are accrued as earned. Interest income includes coupon interest and amortization of premium and accretion of discount on debt securities. Investment income is recorded net of foreign taxes withheld where recovery of such taxes is uncertain.
Expenses. Expenses directly attributable to a fund are charged to that fund. Expenses attributable to more than one fund are allocated among the respective funds on the basis of relative net assets or other appropriate methods. Expense estimates are accrued in the period to which they relate and adjustments are made when actual amounts are known.
Income Tax Information and Distributions to Shareholders. Each year, the Fund intends to qualify as a regulated investment company, including distributing substantially all of its taxable income and realized gains under Subchapter M of the Internal Revenue Code. As a result, no provision for income taxes is required. As of January 31, 2012, the Fund did not have any unrecognized tax benefits in the financial statements; nor is the Fund aware of any tax positions for which it is reasonably possible that the total amounts of unrecognized tax benefits will significantly change in the next twelve months. The Fund files a U.S. federal tax return, in addition to state and local tax returns as required. A fund's tax returns are subject to examination by the Internal Revenue Service (IRS) for a period of three fiscal years. State and local tax returns may be subject to examination for an additional fiscal year depending on the jurisdiction. Foreign taxes are provided for based on the Fund's understanding of the tax rules and rates that exist in the foreign markets in which it invests.
Distributions are declared and recorded on the ex-dividend date. Income dividends and capital gain distributions are declared separately for each class. Income and capital gain distributions are determined in accordance with income tax regulations, which may differ from GAAP.
Annual Report
Notes to Financial Statements - continued
3. Significant Accounting Policies - continued
Income Tax Information and Distributions to Shareholders - continued
Capital accounts within the financial statements are adjusted for permanent book-tax differences. These adjustments have no impact on net assets or the results of operations. Temporary book-tax differences will reverse in a subsequent period.
Book-tax differences are primarily due to foreign currency transactions, passive foreign investment companies (PFIC), partnerships, net operating losses, capital loss carryforwards and losses due to wash sales and excise tax regulations.
The federal tax cost of investment securities and unrealized appreciation (depreciation) as of period end were as follows:
Gross unrealized appreciation | $ 16,492,743 |
Gross unrealized depreciation | (4,791,500) |
Net unrealized appreciation (depreciation) on securities and other investments | $ 11,701,243 |
|
|
Tax Cost | $ 149,439,097 |
The tax-based components of distributable earnings as of period end were as follows:
Capital loss carryforward | $ (17,693,894) |
Net unrealized appreciation (depreciation) | $ 11,700,969 |
Capital loss carryforwards are only available to offset future capital gains of the Fund to the extent provided by regulations and may be limited. Under the Regulated Investment Company Modernization Act of 2010 (the Act), the Fund is permitted to carry forward capital losses incurred in taxable years beginning after December 22, 2010 for an unlimited period and such capital losses are required to be used prior to any losses that expire. Capital loss carryforwards were as follows:
Fiscal year of expiration |
|
2017 | $ (9,033,793) |
2018 | (8,660,101) |
Total with expiration | $ (17,693,894) |
4. Operating Policies.
Restricted Securities. The Fund may invest in securities that are subject to legal or contractual restrictions on resale. These securities generally may be resold in transactions exempt from registration or to the public if the securities are registered. Disposal of these securities may involve time-consuming negotiations and expense, and prompt sale at an acceptable price may be difficult. Information regarding restricted securities is included at the end of the Fund's Schedule of Investments.
Annual Report
5. Purchases and Sales of Investments.
Purchases and sales of securities, other than short-term securities, aggregated $180,252,655 and $164,331,765, respectively.
6. Fees and Other Transactions with Affiliates.
Management Fee. FMR and its affiliates provide the Fund with investment management related services for which the Fund pays a monthly management fee. The management fee is the sum of an individual fund fee rate that is based on an annual rate of .30% of the Fund's average net assets and an annualized group fee rate that averaged .26% during the period. The group fee rate is based upon the average net assets of all the mutual funds advised by FMR. The group fee rate decreases as assets under management increase and increases as assets under management decrease. In addition, the management fee is subject to a performance adjustment (up to a maximum of ± .20% of the Fund's average net assets over a 36 month performance period). The upward or downward adjustment to the management fee is based on the relative investment performance of Large Cap Growth as compared to an appropriate benchmark index. For the period, the total annual management fee rate, including the performance adjustment, was .48% of the Fund's average net assets.
Distribution and Service Plan Fees. In accordance with Rule 12b-1 of the 1940 Act, the Fund has adopted separate Distribution and Service Plans for each class of shares. Certain classes pay Fidelity Distributors Corporation (FDC), an affiliate of FMR, separate Distribution and Service Fees, each of which is based on an annual percentage of each class' average net assets. In addition, FDC may pay financial intermediaries for selling shares of the Fund and providing shareholder support services. For the period, the Distribution and Service Fee rates, total fees and amounts retained by FDC were as follows:
| Distribution | Service | Total Fees | Retained |
Class A | -% | .25% | $ 23,137 | $ 1,159 |
Class T | .25% | .25% | 32,142 | 74 |
Class B | .75% | .25% | 18,858 | 14,160 |
Class C | .75% | .25% | 54,492 | 18,363 |
|
|
| $ 128,629 | $ 33,756 |
Sales Load. FDC may receive a front-end sales charge of up to 5.75% for selling Class A shares and 3.50% for selling Class T shares, some of which is paid to financial intermediaries for selling shares of the Fund. Depending on the holding period, FDC may receive contingent deferred sales charges levied on Class A, Class T, Class B, and Class C redemptions. The deferred sales charges range from 5.00% to 1.00% for Class B, 1.00% for Class C, 1.00% for certain purchases of Class A shares and .25% for certain purchases of Class T shares.
Annual Report
Notes to Financial Statements - continued
6. Fees and Other Transactions with Affiliates - continued
Sales Load - continued
For the period, sales charge amounts retained by FDC were as follows:
| Retained |
Class A | $ 18,472 |
Class T | 4,858 |
Class B* | 4,504 |
Class C* | 1,771 |
| $ 29,605 |
* When Class B and Class C shares are initially sold, FDC pays commissions from its own resources to financial intermediaries through which the sales are made.
Transfer Agent Fees. Fidelity Investments Institutional Operations Company, Inc. (FIIOC), an affiliate of FMR, is the transfer, dividend disbursing and shareholder servicing agent for each class of the Fund. FIIOC receives account fees and asset-based fees that vary according to the account size and type of account of the shareholders of the respective classes of the Fund. FIIOC pays for typesetting, printing and mailing of shareholder reports, except proxy statements. For the period, transfer agent fees for each class were as follows:
| Amount | % of |
Class A | $ 27,845 | .30 |
Class T | 21,166 | .33 |
Class B | 5,704 | .30 |
Class C | 16,244 | .30 |
Large Cap Growth | 329,390 | .26 |
Institutional Class | 2,527 | .21 |
| $ 402,876 |
|
Accounting and Security Lending Fees. Fidelity Service Company, Inc. (FSC), an affiliate of FMR, maintains the Fund's accounting records. The accounting fee is based on the level of average net assets for each month. Under a separate contract, FSC administers the security lending program. The security lending fee is based on the number and duration of lending transactions.
Brokerage Commissions. The Fund placed a portion of its portfolio transactions with brokerage firms which are affiliates of the investment adviser. The commissions paid to these affiliated firms were $3,944 for the period.
Annual Report
7. Committed Line of Credit.
The Fund participates with other funds managed by FMR or an affiliate in a $4.0 billion credit facility (the "line of credit") to be utilized for temporary or emergency purposes to fund shareholder redemptions or for other short-term liquidity purposes. The Fund has agreed to pay commitment fees on its pro-rata portion of the line of credit, which amounted to $441 and is reflected in Miscellaneous expenses on the Statement of Operations. During the period, there were no borrowings on this line of credit.
8. Security Lending.
The Fund lends portfolio securities through a lending agent from time to time in order to earn additional income. For equity securities, a lending agent is used and may loan securities to certain qualified borrowers, including Fidelity Capital Markets (FCM), a broker-dealer affiliated with the Fund. On the settlement date of the loan, the Fund receives collateral (in the form of U.S. Treasury obligations, letters of credit and/or cash) against the loaned securities and maintains collateral in an amount not less than 100% of the market value of the loaned securities during the period of the loan. The market value of the loaned securities is determined at the close of business of the Fund and any additional required collateral is delivered to the Fund on the next business day. If the borrower defaults on its obligation to return the securities loaned because of insolvency or other reasons, a fund could experience delays and costs in recovering the securities loaned or in gaining access to the collateral. Any cash collateral received is invested in the Fidelity Securities Lending Cash Central Fund. The value of loaned securities and cash collateral at period end are disclosed on the Fund's Statement of Assets and Liabilities. Security lending income represents the income earned on investing cash collateral, less rebates paid to borrowers and any lending agent fees associated with the loan, plus any premium payments received for lending certain types of securities. Security lending income is presented in the Statement of Operations as a component of income from Fidelity Central Funds. During the period, there were no securities loaned to FCM.
9. Expense Reductions.
Many of the brokers with whom FMR places trades on behalf of the Fund provided services to the Fund in addition to trade execution. These services included payments of certain expenses on behalf of the Fund totaling $8,950 for the period.
Annual Report
Notes to Financial Statements - continued
10. Share Transactions.
Transactions for each class of shares were as follows:
| Shares | Dollars | ||
Years ended January 31, | 2012 | 2011 | 2012 | 2011 |
Class A |
|
|
|
|
Shares sold | 943,999 | 361,056 | $ 9,391,213 | $ 3,185,180 |
Shares redeemed | (378,889) | (181,389) | (3,682,555) | (1,535,053) |
Net increase (decrease) | 565,110 | 179,667 | $ 5,708,658 | $ 1,650,127 |
Class T |
|
|
|
|
Shares sold | 899,142 | 140,930 | $ 9,125,430 | $ 1,207,937 |
Shares redeemed | (616,824) | (47,579) | (6,053,114) | (408,587) |
Net increase (decrease) | 282,318 | 93,351 | $ 3,072,316 | $ 799,350 |
Class B |
|
|
|
|
Shares sold | 19,634 | 79,473 | $ 195,465 | $ 702,050 |
Shares redeemed | (80,066) | (51,655) | (776,888) | (431,055) |
Net increase (decrease) | (60,432) | 27,818 | $ (581,423) | $ 270,995 |
Class C |
|
|
|
|
Shares sold | 689,847 | 213,157 | $ 6,821,638 | $ 1,855,577 |
Shares redeemed | (456,431) | (91,191) | (4,462,829) | (750,591) |
Net increase (decrease) | 233,416 | 121,966 | $ 2,358,809 | $ 1,104,986 |
Large Cap Growth |
|
|
|
|
Shares sold | 6,389,996 | 4,390,498 | $ 64,463,259 | $ 38,539,310 |
Shares redeemed | (5,795,048) | (4,808,945) | (58,191,405) | (40,933,269) |
Net increase (decrease) | 594,948 | (418,447) | $ 6,271,854 | $ (2,393,959) |
Institutional Class |
|
|
|
|
Shares sold | 185,823 | 46,417 | $ 1,915,796 | $ 398,963 |
Shares redeemed | (125,753) | (11,923) | (1,180,630) | (97,082) |
Net increase (decrease) | 60,070 | 34,494 | $ 735,166 | $ 301,881 |
11. Other.
The Fund's organizational documents provide former and current trustees and officers with a limited indemnification against liabilities arising in connection with the performance of their duties to the Fund. In the normal course of business, the Fund may also enter into contracts that provide general indemnifications. The Fund's maximum exposure under these arrangements is unknown as this would be dependent on future claims that may be made against the Fund. The risk of material loss from such claims is considered remote.
Annual Report
Report of Independent Registered Public Accounting Firm
To the Trustees of Fidelity Devonshire Trust and the Shareholders of Fidelity Large Cap Growth Fund:
In our opinion, the accompanying statement of assets and liabilities, including the schedule of investments, and the related statements of operations and of changes in net assets and the financial highlights present fairly, in all material respects, the financial position of Fidelity Large Cap Growth Fund (a fund of Fidelity Devonshire Trust) at January 31, 2012, the results of its operations for the year then ended, the changes in its net assets for each of the two years in the period then ended and the financial highlights for each of the periods indicated, in conformity with accounting principles generally accepted in the United States of America. These financial statements and financial highlights (hereafter referred to as "financial statements") are the responsibility of the Fidelity Large Cap Growth Fund's management. Our responsibility is to express an opinion on these financial statements based on our audits. We conducted our audits of these financial statements in accordance with the standards of the Public Company Accounting Oversight Board (United States). Those standards require that we plan and perform the audit to obtain reasonable assurance about whether the financial statements are free of material misstatement. An audit includes examining, on a test basis, evidence supporting the amounts and disclosures in the financial statements, assessing the accounting principles used and significant estimates made by management, and evaluating the overall financial statement presentation. We believe that our audits, which included confirmation of securities at January 31, 2012 by correspondence with the custodian and brokers, provide a reasonable basis for our opinion.
/s/ PricewaterhouseCoopers LLP
PricewaterhouseCoopers LLP
Boston, Massachusetts
March 13, 2012
Annual Report
Trustees and Officers
The Trustees, Members of the Advisory Board, and executive officers of the trust and fund, as applicable, are listed below. The Board of Trustees governs the fund and is responsible for protecting the interests of shareholders. The Trustees are experienced executives who meet periodically throughout the year to oversee the fund's activities, review contractual arrangements with companies that provide services to the fund, oversee management of the risks associated with such activities and contractual arrangements, and review the fund's performance. Except for James C. Curvey, each of the Trustees oversees 226 funds advised by FMR or an affiliate. Mr. Curvey oversees 430 funds advised by FMR or an affiliate.
The Trustees hold office without limit in time except that (a) any Trustee may resign; (b) any Trustee may be removed by written instrument, signed by at least two-thirds of the number of Trustees prior to such removal; (c) any Trustee who requests to be retired or who has become incapacitated by illness or injury may be retired by written instrument signed by a majority of the other Trustees; and (d) any Trustee may be removed at any special meeting of shareholders by a two-thirds vote of the outstanding voting securities of the trust. Each Trustee who is not an interested person (as defined in the 1940 Act) (Independent Trustee), shall retire not later than the last day of the calendar year in which his or her 75th birthday occurs. The Independent Trustees may waive this mandatory retirement age policy with respect to individual Trustees. The executive officers and Advisory Board Members hold office without limit in time, except that any officer and Advisory Board Member may resign or may be removed by a vote of a majority of the Trustees at any regular meeting or any special meeting of the Trustees. Except as indicated, each individual has held the office shown or other offices in the same company for the past five years.
Experience, Skills, Attributes, and Qualifications of the Fund's Trustees. The Governance and Nominating Committee has adopted a statement of policy that describes the experience, qualifications, attributes, and skills that are necessary and desirable for potential Independent Trustee candidates (Statement of Policy). The Board believes that each Trustee satisfied at the time he or she was initially elected or appointed a Trustee, and continues to satisfy, the standards contemplated by the Statement of Policy. The Governance and Nominating Committee also engages professional search firms to help identify potential Independent Trustee candidates who have the experience, qualifications, attributes, and skills consistent with the Statement of Policy. From time to time, additional criteria based on the composition and skills of the current Independent Trustees, as well as experience or skills that may be appropriate in light of future changes to board composition, business conditions, and regulatory or other developments, have also been considered by the professional search firms and the Governance and Nominating Committee. In addition, the Board takes into account the Trustees' commitment and participation in Board and committee meetings, as well as their leadership of standing and ad hoc committees throughout their tenure.
In determining that a particular Trustee was and continues to be qualified to serve as a Trustee, the Board has considered a variety of criteria, none of which, in isolation, was controlling. The Board believes that, collectively, the Trustees have balanced and diverse experience, qualifications, attributes, and skills, which allow the Board to operate effectively in governing the fund and protecting the interests of shareholders. Information about the specific experience, skills, attributes, and qualifications of each Trustee, which in each case led to the Board's conclusion that the Trustee should serve (or continue to serve) as a trustee of the fund, is provided below.
Annual Report
Trustees and Officers - continued
Board Structure and Oversight Function. James C. Curvey is an interested person (as defined in the 1940 Act) and currently serves as Acting Chairman. The Trustees have determined that an interested Chairman is appropriate and benefits shareholders because an interested Chairman has a personal and professional stake in the quality and continuity of services provided to the fund. Independent Trustees exercise their informed business judgment to appoint an individual of their choosing to serve as Chairman, regardless of whether the Trustee happens to be independent or a member of management. The Independent Trustees have determined that they can act independently and effectively without having an Independent Trustee serve as Chairman and that a key structural component for assuring that they are in a position to do so is for the Independent Trustees to constitute a substantial majority for the Board. The Independent Trustees also regularly meet in executive session. Ned C. Lautenbach serves as Chairman of the Independent Trustees and as such (i) acts as a liaison between the Independent Trustees and management with respect to matters important to the Independent Trustees and (ii) with management prepares agendas for Board meetings.
Fidelity funds are overseen by different Boards of Trustees. The fund's Board oversees Fidelity's equity and high income funds and another Board oversees Fidelity's investment-grade bond, money market, and asset allocation funds. The asset allocation funds may invest in Fidelity funds overseen by the fund's Board. The use of separate Boards, each with its own committee structure, allows the Trustees of each group of Fidelity funds to focus on the unique issues of the funds they oversee, including common research, investment, and operational issues. On occasion, the separate Boards establish joint committees to address issues of overlapping consequences for the Fidelity funds overseen by each Board.
The Trustees operate using a system of committees to facilitate the timely and efficient consideration of all matters of importance to the Trustees, the fund, and fund shareholders and to facilitate compliance with legal and regulatory requirements and oversight of the fund's activities and associated risks. The Board, acting through its committees, has charged FMR and its affiliates with (i) identifying events or circumstances the occurrence of which could have demonstrably adverse effects on the fund's business and/or reputation; (ii) implementing processes and controls to lessen the possibility that such events or circumstances occur or to mitigate the effects of such events or circumstances if they do occur; and (iii) creating and maintaining a system designed to evaluate continuously business and market conditions in order to facilitate the identification and implementation processes described in (i) and (ii) above. Because the day-to-day operations and activities of the fund are carried out by or through FMR, its affiliates and other service providers, the fund's exposure to risks is mitigated but not eliminated by the processes overseen by the Trustees. While each of the Board's committees has responsibility for overseeing different aspects of the fund's activities, oversight is exercised primarily through the Operations, Audit, and Compliance Committees. In addition, the Independent Trustees have worked with FMR to enhance the Board's oversight of investment and financial risks, legal and regulatory risks, technology risks, and operational risks, including the development of additional risk reporting to the Board. For example, a working group comprised of Independent Trustees and FMR has worked and continues to work to review the Fidelity funds' valuation-related activities, reporting and risk management. Appropriate personnel, including but not limited to the fund's Chief Compliance Officer (CCO), FMR's internal auditor, the independent accountants, the fund's Treasurer and portfolio management personnel, make periodic reports to the Board's committees, as appropriate, including an annual review of FMR's risk management program for the Fidelity funds. The responsibilities of each standing committee, including their oversight responsibilities, are described further under "Standing Committees of the Fund's Trustees."
Annual Report
The fund's Statement of Additional Information (SAI) includes more information about the Trustees. To request a free copy, call Fidelity at 1-877-208-0098.
Interested Trustees*:
Correspondence intended for each Trustee who is an interested person may be sent to Fidelity Investments, 82 Devonshire Street, Boston, Massachusetts 02109.
Name, Age; Principal Occupations and Other Relevant Experience+ | |
James C. Curvey (76) | |
| Year of Election or Appointment: 2007 Mr. Curvey is Trustee and Acting Chairman of the Board of Trustees of certain Trusts. Mr. Curvey also serves as Trustee (2007-present) of other investment companies advised by FMR. Mr. Curvey is a Director of Fidelity Investments Money Management, Inc. (2009-present), Director of Fidelity Research & Analysis Co. (2009-present) and Director of FMR and FMR Co., Inc. (2007-present). Mr. Curvey is also Vice Chairman (2007-present) and Director of FMR LLC. In addition, Mr. Curvey serves as an Overseer for the Boston Symphony Orchestra and a member of the Trustees of Villanova University. Previously, Mr. Curvey was the Vice Chairman (2006-2007) and Director (2000-2007) of FMR Corp. |
Ronald P. O'Hanley (54) | |
| Year of Election or Appointment: 2011 Mr. O'Hanley is Director of FMR Co., Inc. (2010-present), Director of Fidelity Investments Money Management, Inc. (2010-present), Director of Fidelity Research & Analysis Company (2010-present), President of Fidelity Asset Management and Corporate Services and a member of Fidelity's Executive Committee (2010-present). Previously, Mr. O'Hanley served as President and Chief Executive Officer of BNY Mellon Asset Management (2007-2010). Mr. O'Hanley also served as Vice Chairman of Bank New York Mellon Corp. and a member of that firm's Executive Committee. Prior to the 2007 merger of The Bank of New York and Mellon Financial Corporation, he was Vice Chairman of Mellon Financial Corporation and President and Chief Executive Officer of Mellon Asset Management. He joined Mellon in February 1997. Mr. O'Hanley currently serves as Chairman of the Boston Public Library Foundation Board of Directors and sits on the Board of Directors of Beth Israel Deaconess Medical Center, the Board of Trustees of the Marine Biological Laboratory and the Advisory Board of the Maxwell School of Citizenship and Public Administration at Syracuse University. Mr. O'Hanley also chairs the Council on Asset Management for the Financial Services Roundtable and is a member of the Board of Directors of Institutional Investor's U.S. Institute. |
* Trustees have been determined to be "Interested Trustees" by virtue of, among other things, their affiliation with the trust or various entities under common control with FMR.
+ The information above includes each Trustee's principal occupation during the last five years and other information relating to the experience, attributes, and skills relevant to each Trustee's qualifications to serve as a Trustee, which led to the conclusion that each Trustee should serve as a Trustee for the fund.
Annual Report
Independent Trustees:
Correspondence intended for each Independent Trustee (that is, the Trustees other than the Interested Trustees) may be sent to Fidelity Investments, P.O. Box 55235, Boston, Massachusetts 02205-5235.
Name, Age; Principal Occupations and Other Relevant Experience+ | |
Dennis J. Dirks (63) | |
| Year of Election or Appointment: 2005 Prior to his retirement in May 2003, Mr. Dirks was Chief Operating Officer and a member of the Board of The Depository Trust & Clearing Corporation (DTCC). He also served as President, Chief Operating Officer, and Board member of The Depository Trust Company (DTC) and President and Board member of the National Securities Clearing Corporation (NSCC). In addition, Mr. Dirks served as Chief Executive Officer and Board member of the Government Securities Clearing Corporation, Chief Executive Officer and Board member of the Mortgage-Backed Securities Clearing Corporation, as a Trustee and a member of the Finance Committee of Manhattan College (2005-2008), and as a Trustee and a member of the Finance Committee of AHRC of Nassau County (2006-2008). Mr. Dirks is a member of the Independent Directors Council (IDC) Governing Council (2010-present) and Board of Directors for The Brookville Center for Children's Services, Inc. (2009-present). |
Alan J. Lacy (58) | |
| Year of Election or Appointment: 2008 Mr. Lacy serves as a Senior Adviser (2007-present) of Oak Hill Capital Partners, L.P. (private equity). Mr. Lacy also served as Chief Executive Officer (2000-2005) and Vice Chairman (2005-2006) of Sears Holdings Corporation and Sears, Roebuck and Co. (retail). In addition, Mr. Lacy serves as a member of the Board of Directors of Dave & Buster's, Inc. (restaurant and entertainment complexes, 2010-present), The Hillman Companies, Inc. (hardware wholesalers, 2010-present), and Bristol-Myers Squibb Company (global pharmaceuticals, 2007-present). Mr. Lacy is a member of the Board of Trustees of The National Parks Conservation Association (2006-present). Previously, Mr. Lacy served as Chairman of the Board of Trustees of the National Parks Conservation Association (2008-2011) and as a member of the Board of Directors for the Western Union Company (global money transfer, 2006-2011). |
Ned C. Lautenbach (67) | |
| Year of Election or Appointment: 2000 Mr. Lautenbach is Chairman of the Independent Trustees of the Equity and High Income Funds (2006-present). Mr. Lautenbach currently serves as the Lead Director of the Eaton Corporation Board of Directors (diversified industrial, 1997-present). Mr. Lautenbach is also a member of the Board of Directors of the Philharmonic Center for the Arts in Naples, Florida (1999-present); a member of the Board of Trustees of Fairfield University (2005-present); and a member of the Council on Foreign Relations (1994-present). Previously, Mr. Lautenbach was a Partner/Advisory Partner at Clayton, Dubilier & Rice, LLC (private equity investment, 1998-2010), as well as a Director of Sony Corporation (2006-2007). |
Joseph Mauriello (67) | |
| Year of Election or Appointment: 2008 Prior to his retirement in January 2006, Mr. Mauriello served in numerous senior management positions including Deputy Chairman and Chief Operating Officer (2004-2005), and Vice Chairman of Financial Services (2002-2004) of KPMG LLP US (professional services, 1965-2005). Mr. Mauriello currently serves as a member of the Board of Directors of XL Group plc. (global insurance and re-insurance, 2006-present) and of Arcadia Resources Inc. (health care services and products, 2007-present). Previously, Mr. Mauriello served as a Director of the Hamilton Funds of the Bank of New York (2006-2007). |
Robert W. Selander (61) | |
| Year of Election or Appointment: 2011 Previously, Mr. Selander served as a Member of the Advisory Board of Fidelity's Equity and High Income Funds (2011), Executive Vice Chairman (2010), Chief Executive Officer (2009-2010), and President and Chief Executive Officer (1997-2009) of Mastercard, Inc. |
Cornelia M. Small (67) | |
| Year of Election or Appointment: 2005 Ms. Small is a member of the Board of Directors of the Teagle Foundation (2009-present). Ms. Small is also a member of the Investment Committee, and Chair (2008-present) and a member of the Board of Trustees of Smith College. In addition, Ms. Small serves on the Investment Committee of the Berkshire Taconic Community Foundation (2008-present). Previously, Ms. Small served as Chairperson of the Investment Committee (2002-2008) of Smith College. In addition, Ms. Small served as Chief Investment Officer, Director of Global Equity Investments, and a member of the Board of Directors of Scudder, Stevens & Clark and Scudder Kemper Investments. |
William S. Stavropoulos (72) | |
| Year of Election or Appointment: 2002 Mr. Stavropoulos is Vice Chairman of the Independent Trustees of the Equity and High Income Funds (2006-present). Mr. Stavropoulos serves as President and Founder of the Michigan Baseball Foundation, the Great Lakes Loons (2007-present). Mr. Stavropoulos is Chairman Emeritus of the Board of Directors of The Dow Chemical Company, where he previously served in numerous senior management positions, including President, CEO (1995-2000; 2002-2004), Chairman of the Executive Committee (2000-2006), and as a member of the Board of Directors (1990-2006). Currently, Mr. Stavropoulos is Chairman of Univar (global distributor of commodity and specialty chemicals, 2010-present), a Director of Teradata Corporation (data warehousing and technology solutions, 2008-present), Chemical Financial Corporation, Maersk Inc. (industrial conglomerate), Tyco International, Inc. (multinational manufacturing and services, 2007-present), and a member of the Advisory Board for Metalmark Capital (private equity investment, 2005-present). Mr. Stavropoulos is a special advisor to Clayton, Dubilier & Rice, LLC (private equity investment). In addition, Mr. Stavropoulos is a member of the University of Notre Dame Advisory Council for the College of Science. |
David M. Thomas (62) | |
| Year of Election or Appointment: 2008 Previously, Mr. Thomas served as Executive Chairman (2005-2006) and Chairman and Chief Executive Officer (2000-2005) of IMS Health, Inc. (pharmaceutical and healthcare information solutions). In addition, Mr. Thomas serves as a member of the Board of Directors of Fortune Brands, Inc. (consumer products), and Interpublic Group of Companies, Inc. (marketing communication, 2004-present). |
Michael E. Wiley (61) | |
| Year of Election or Appointment: 2008 Mr. Wiley also serves as a Director of Asia Pacific Exploration Consolidated (international oil and gas exploration and production, 2008-present). Mr. Wiley serves as a Director of Tesoro Corporation (independent oil refiner and marketer, 2005-present), and a Director of Bill Barrett Corporation (exploration and production, 2005-present). In addition, Mr. Wiley also serves as a Director of Post Oak Bank (privately-held bank, 2004-present). Previously, Mr. Wiley served as a member of the Board of Trustees of the University of Tulsa (2000-2006; 2007-2010), as a Senior Energy Advisor of Katzenbach Partners, LLC (consulting, 2006-2007), as an Advisory Director of Riverstone Holdings (private investment), Chairman, President, and CEO of Baker Hughes, Inc. (oilfield services, 2000-2004), and as Director of Spinnaker Exploration Company (exploration and production, 2001-2005). |
Annual Report
Trustees and Officers - continued
+ The information above includes each Trustee's principal occupation during the last five years and other information relating to the experience, attributes, and skills relevant to each Trustee's qualifications to serve as a Trustee, which led to the conclusion that each Trustee should serve as a Trustee for the fund.
Advisory Board Members and Executive Officers:
Correspondence intended for each executive officer, Edward C. Johnson 3d, and Peter S. Lynch may be sent to Fidelity Investments, 82 Devonshire Street, Boston, Massachusetts 02109.
Name, Age; Principal Occupation | |
Edward C. Johnson 3d (81) | |
| Year of Election or Appointment: 2011 Member of the Advisory Board of Fidelity's Equity and High Income Funds. Mr. Johnson serves as Chief Executive Officer, Chairman, and a Director of FMR LLC, and also serves as Chairman and Director of FIL Limited. Previously, Mr. Johnson served as a Trustee and Chairman of the Board of certain Fidelity Trusts, Chairman and a Director of FMR, Chairman and a Director of FMR Co., Inc., and President of FMR LLC (2006-2007). |
Peter S. Lynch (68) | |
| Year of Election or Appointment: 2003 Member of the Advisory Board of Fidelity's Equity and High Income Funds. Mr. Lynch is Vice Chairman and a Director of FMR and FMR Co., Inc. In addition, Mr. Lynch serves as a Trustee of Boston College and as the Chairman of the Inner-City Scholarship Fund. Previously, Mr. Lynch served on the Special Olympics International Board of Directors (1997-2006). |
Kenneth B. Robins (42) | |
| Year of Election or Appointment: 2008 President and Treasurer of Fidelity's Equity and High Income Funds. Mr. Robins also serves as President and Treasurer (2010-present) and Assistant Treasurer (2009-present) of other Fidelity funds and is an employee of Fidelity Investments (2004-present). Previously, Mr. Robins served as Deputy Treasurer of the Fidelity funds (2005-2008) and Treasurer and Chief Financial Officer of The North Carolina Capital Management Trust: Cash and Term Portfolios (2006-2008). |
Bruce T. Herring (46) | |
| Year of Election or Appointment: 2006 Vice President of certain Equity Funds. Mr. Herring also serves as President of Fidelity Research & Analysis Company (2010-present), Chief Investment Officer and Director of Fidelity Management & Research (U.K.) Inc. (2010-present) and Group Chief Investment Officer of FMR. Previously, Mr. Herring served as Vice President (2005-2006) and Senior Vice President (2006-2007) of Fidelity Management & Research Company, Vice President of FMR Co., Inc. (2001-2007) and as a portfolio manager for Fidelity U.S. Equity Funds. |
Brian B. Hogan (47) | |
| Year of Election or Appointment: 2009 Vice President of Equity and High Income Funds. Mr. Hogan also serves as President of FMR's Equity Division (2009-present). Previously, Mr. Hogan served as Senior Vice President, Equity Research of FMR (2006-2009) and as a portfolio manager. |
Scott C. Goebel (44) | |
| Year of Election or Appointment: 2008 Secretary and Chief Legal Officer (CLO) of the Fidelity funds. Mr. Goebel also serves as Secretary of Fidelity Investments Money Management, Inc. (FIMM) (2010-present) and Fidelity Research and Analysis Company (FRAC) (2010-present); Secretary and CLO of The North Carolina Capital Management Trust: Cash and Term Portfolios (2008-present); General Counsel, Secretary, and Senior Vice President of FMR (2008-present) and FMR Co., Inc. (2008-present); employed by FMR LLC or an affiliate (2001-present); Chief Legal Officer of Fidelity Management & Research (Hong Kong) Limited (2008-present) and Assistant Secretary of Fidelity Management & Research (Japan) Inc. (2008-present), and Fidelity Management & Research (U.K.) Inc. (2008-present). Previously, Mr. Goebel served as Assistant Secretary of FIMM (2008-2010), FRAC (2008-2010), and the Funds (2007-2008) and as Vice President and Secretary of Fidelity Distributors Corporation (FDC) (2005-2007). |
William C. Coffey (42) | |
| Year of Election or Appointment: 2009 Assistant Secretary of Fidelity's Equity and High Income Funds. Mr. Coffey also serves as Senior Vice President and Deputy General Counsel of FMR LLC (2010-present), and is an employee of Fidelity Investments. Previously, Mr. Coffey served as Vice President and Associate General Counsel of FMR LLC (2005-2009). |
Holly C. Laurent (57) | |
| Year of Election or Appointment: 2008 Anti-Money Laundering (AML) Officer of the Fidelity funds. Ms. Laurent also serves as AML Officer of The North Carolina Capital Management Trust: Cash and Term Portfolios (2008-present) and is an employee of Fidelity Investments. Previously, Ms. Laurent was Senior Vice President and Head of Legal for Fidelity Business Services India Pvt. Ltd. (2006-2008), and Senior Vice President, Deputy General Counsel and Group Head for FMR LLC (2005-2006). |
Christine Reynolds (53) | |
| Year of Election or Appointment: 2008 Chief Financial Officer of the Fidelity funds. Ms. Reynolds became President of Fidelity Pricing and Cash Management Services (FPCMS) in August 2008. Ms. Reynolds served as Chief Operating Officer of FPCMS (2007-2008). Previously, Ms. Reynolds served as President, Treasurer, and Anti-Money Laundering officer of the Fidelity funds (2004-2007). |
Kenneth A. Rathgeber (64) | |
| Year of Election or Appointment: 2004 Chief Compliance Officer of Fidelity's Equity and High Income Funds. Mr. Rathgeber is Chief Compliance Officer of Fidelity Management & Research (Hong Kong) Limited (2008-present), Fidelity Management & Research (Japan) Inc. (2008-present), FMR (2005-present), FMR Co., Inc. (2005-present), Fidelity Management & Research (U.K.) Inc. (2005-present), Fidelity Research & Analysis Company (2005-present), Fidelity Investments Money Management, Inc. (2005-present), Pyramis Global Advisors, LLC (2005-present), and Strategic Advisers, Inc. (2005-present). |
Joseph F. Zambello (54) | |
| Year of Election or Appointment: 2011 Deputy Treasurer of the Fidelity funds. Mr. Zambello is an employee of Fidelity Investments. Previously, Mr. Zambello served as Vice President of FMR's Program Management Group (2009-2011) and Vice President of the Transfer Agent Oversight Group (2005-2009). |
Adrien E. Deberghes (44) | |
| Year of Election or Appointment: 2008 Deputy Treasurer of Fidelity's Equity and High Income Funds. Mr. Deberghes also serves as Vice President and Assistant Treasurer of Fidelity Rutland Square Trust II and Fidelity Commonwealth Trust II (2011-present), Assistant Treasurer of other Fidelity funds (2010-present), and is an employee of Fidelity Investments (2008-present). Previously, Mr. Deberghes served as Senior Vice President of Mutual Fund Administration at State Street Corporation (2007-2008), Senior Director of Mutual Fund Administration at Investors Bank & Trust (2005-2007), and Director of Finance for Dunkin' Brands (2000-2005). |
Stephanie J. Dorsey (42) | |
| Year of Election or Appointment: 2010 Assistant Treasurer of Fidelity's Equity and High Income Funds. Ms. Dorsey also serves as Deputy Treasurer of other Fidelity funds (2008-present) and is an employee of Fidelity Investments (2008-present). Previously, Ms. Dorsey served as Treasurer (2004-2008) of the JPMorgan Mutual Funds and Vice President (2004-2008) of JPMorgan Chase Bank. |
John R. Hebble (53) | |
| Year of Election or Appointment: 2009 Assistant Treasurer of Fidelity's Equity and High Income Funds. Mr. Hebble also serves as President (2011-present), Treasurer, and Chief Financial Officer of The North Carolina Capital Management Trust: Cash and Term Portfolios (2008-present), President and Treasurer of other Fidelity funds (2008-present) and is an employee of Fidelity Investments. |
Gary W. Ryan (53) | |
| Year of Election or Appointment: 2005 Assistant Treasurer of the Fidelity funds. Mr. Ryan is an employee of Fidelity Investments. Previously, Mr. Ryan served as Vice President of Fund Reporting in Fidelity Pricing and Cash Management Services (FPCMS) (1999-2005). |
Jonathan Davis (43) | |
| Year of Election or Appointment: 2010 Assistant Treasurer of the Fidelity funds. Mr. Davis is also Assistant Treasurer of Fidelity Rutland Square Trust II and Fidelity Commonwealth Trust II. Mr. Davis is an employee of Fidelity Investments. Previously, Mr. Davis served as Vice President and Associate General Counsel of FMR LLC (2003-2010). |
Annual Report
Investment Adviser
Fidelity Management & Research Company
Boston, MA
Investment Sub-Advisers
FMR Co., Inc.
Fidelity Management & Research
(U.K.) Inc.
Fidelity Management & Research
(Hong Kong) Limited
Fidelity Management & Research
(Japan) Inc.
General Distributor
Fidelity Distributors Corporation
Boston, MA
Transfer and Service Agents
Fidelity Investments Institutional Operations Company, Inc.
Boston, MA
Fidelity Service Company, Inc.
Boston, MA
Custodian
Citibank, N.A.
New York, NY
ALCG-UANN-0312
1.900740.102
(Fidelity Investment logo)(registered trademark)
(Fidelity Investment logo)(registered trademark)
Fidelity Advisor®
Large Cap Growth
Fund - Institutional Class
Annual Report
January 31, 2012
(Fidelity Cover Art)
Institutional Class is a class of
Fidelity® Large Cap Growth Fund
Contents
Chairman's Message | The Chairman's message to shareholders. | |
Performance | How the fund has done over time. | |
Management's Discussion of Fund Performance | The Portfolio Manager's review of fund performance and strategy. | |
Shareholder Expense Example | An example of shareholder expenses. | |
Investment Changes | A summary of major shifts in the fund's investments over the past six months. | |
Investments | A complete list of the fund's investments with their market values. | |
Financial Statements | Statements of assets and liabilities, operations, and changes in net assets, as well as financial highlights. | |
Notes | Notes to the financial statements. | |
Report of Independent Registered Public Accounting Firm |
| |
Trustees and Officers |
|
To view a fund's proxy voting guidelines and proxy voting record for the 12-month period ended June 30, visit http://www.fidelity.com/proxyvotingresults or visit the Securities and Exchange Commission's (SEC) web site at http://www.sec.gov. You may also call 1-877-208-0098 to request a free copy of the proxy voting guidelines.
Standard & Poor's, S&P and S&P 500 are registered service marks of The McGraw-Hill Companies, Inc. and have been licensed for use by Fidelity Distributors Corporation.
Other third party marks appearing herein are the property of their respective owners.
All other marks appearing herein are registered or unregistered trademarks or service marks of FMR LLC or an affiliated company.
Annual Report
This report and the financial statements contained herein are submitted for the general information of the shareholders of the fund. This report is not authorized for distribution to prospective investors in the fund unless preceded or accompanied by an effective prospectus.
A fund files its complete schedule of portfolio holdings with the SEC for the first and third quarters of each fiscal year on Form N-Q. Forms N-Q are available on the SEC's web site at http://www.sec.gov. A fund's Forms N-Q may be reviewed and copied at the SEC's Public Reference Room in Washington, DC. Information regarding the operation of the SEC's Public Reference Room may be obtained by calling 1-800-SEC-0330. For a complete list of a fund's portfolio holdings, view the most recent holdings listing, semiannual report, or annual report on Fidelity's web site at http://www.fidelity.com, http://www.advisor.fidelity.com, or http://www.401k.com, as applicable.
NOT FDIC INSURED • MAY LOSE VALUE • NO BANK GUARANTEE
Neither the fund nor Fidelity Distributors Corporation is a bank.
Annual Report
Chairman's Message
(photo_of_James_C_Curvey)
Dear Shareholder:
Following a year marked by unusually high volatility, 2012 began with most major asset classes advancing steadily in January. For U.S. equities, it was the strongest start to a new year since 1997. International stocks fared even better, despite continued uncertainty related to the sovereign debt crisis in Europe. Investors have been acutely sensitive to the latest news, for better or worse, coming out of the eurozone and its impact on financial markets. As we look ahead, the unresolved debt crisis in Europe remains at the center of a series of risk factors, summarized below, that we believe have the greatest potential to influence the global investment landscape.
Deleveraging and the economy
In the euro-currency area, fiscal austerity among nations and debt deleveraging among financial companies loaded with sovereign debt are deflationary measures and serve to hinder economic growth in the short term. Such an economic and financial-market scenario has not been historically supportive of strong performance among riskier assets, and emerges at a time when many nations need a resurgent economy to assist them in closing their budget deficits and in building confidence among bond buyers to help them refinance their existing debt obligations.
Slowdown in China and Europe
China's economy is the second-largest in the world, and it has been the biggest contributor to global growth since the end of the last recession. Thus, the slower pace of domestic growth in China has led to lower demand for imports of commodities and other construction materials from the rest of the world. In addition, economic weakness in Europe and the broad-based global economic slowdown are putting pressure on China's export growth, which has been largely responsible for its breakneck pace of annual gross domestic product (GDP) growth during the past three decades.
Credit deterioration and contagion
The heightened macroeconomic risk and elevated credit risk swirling around certain European nations and financial institutions have caused many market participants to avoid purchases of or reduce exposure to short-term debt offerings by these issuers. With increased credit risk, there are growing concerns about the potential credit contraction and contagion from European issuers spreading to other financial markets.
We invite you to learn more by visiting us on the Internet or calling us by phone. It is our privilege to provide the resources you need to choose investments that are right for you.
Sincerely,
(The acting chairman's signature appears here.)
James C. Curvey
Acting Chairman
Annual Report
Performance: The Bottom Line
Average annual total return reflects the change in the value of an investment, assuming reinvestment of the class' distributions from dividend income and capital gains (the profits earned upon the sale of securities that have grown in value, if any) and assuming a constant rate of performance each year. The $10,000 table and the fund's returns do not reflect the deduction of taxes that a shareholder would pay on fund distributions or the redemption of fund shares. During periods of reimbursement by Fidelity, a fund's total return will be greater than it would be had the reimbursement not occurred. How a fund did yesterday is no guarantee of how it will do tomorrow.
Average Annual Total Returns
Periods ended January 31, 2012 | Past 1 | Past 5 | Past 10 |
Institutional Class A | 4.41% | -0.31% | 2.23% |
A The initial offering of Institutional Class shares took place on February 13, 2007. Returns prior to February 13, 2007 are those of Fidelity® Large Cap Growth Fund, the original class of the fund.
$10,000 Over 10 Years
Let's say hypothetically that $10,000 was invested in Fidelity Advisor® Large Cap Growth Fund - Institutional Class on January 31, 2002. The chart shows how the value of your investment would have changed, and also shows how the Russell 1000® Growth Index performed over the same period. The initial offering of Institutional Class took place on February 13, 2007. See above for additional information regarding the performance of Institutional Class.
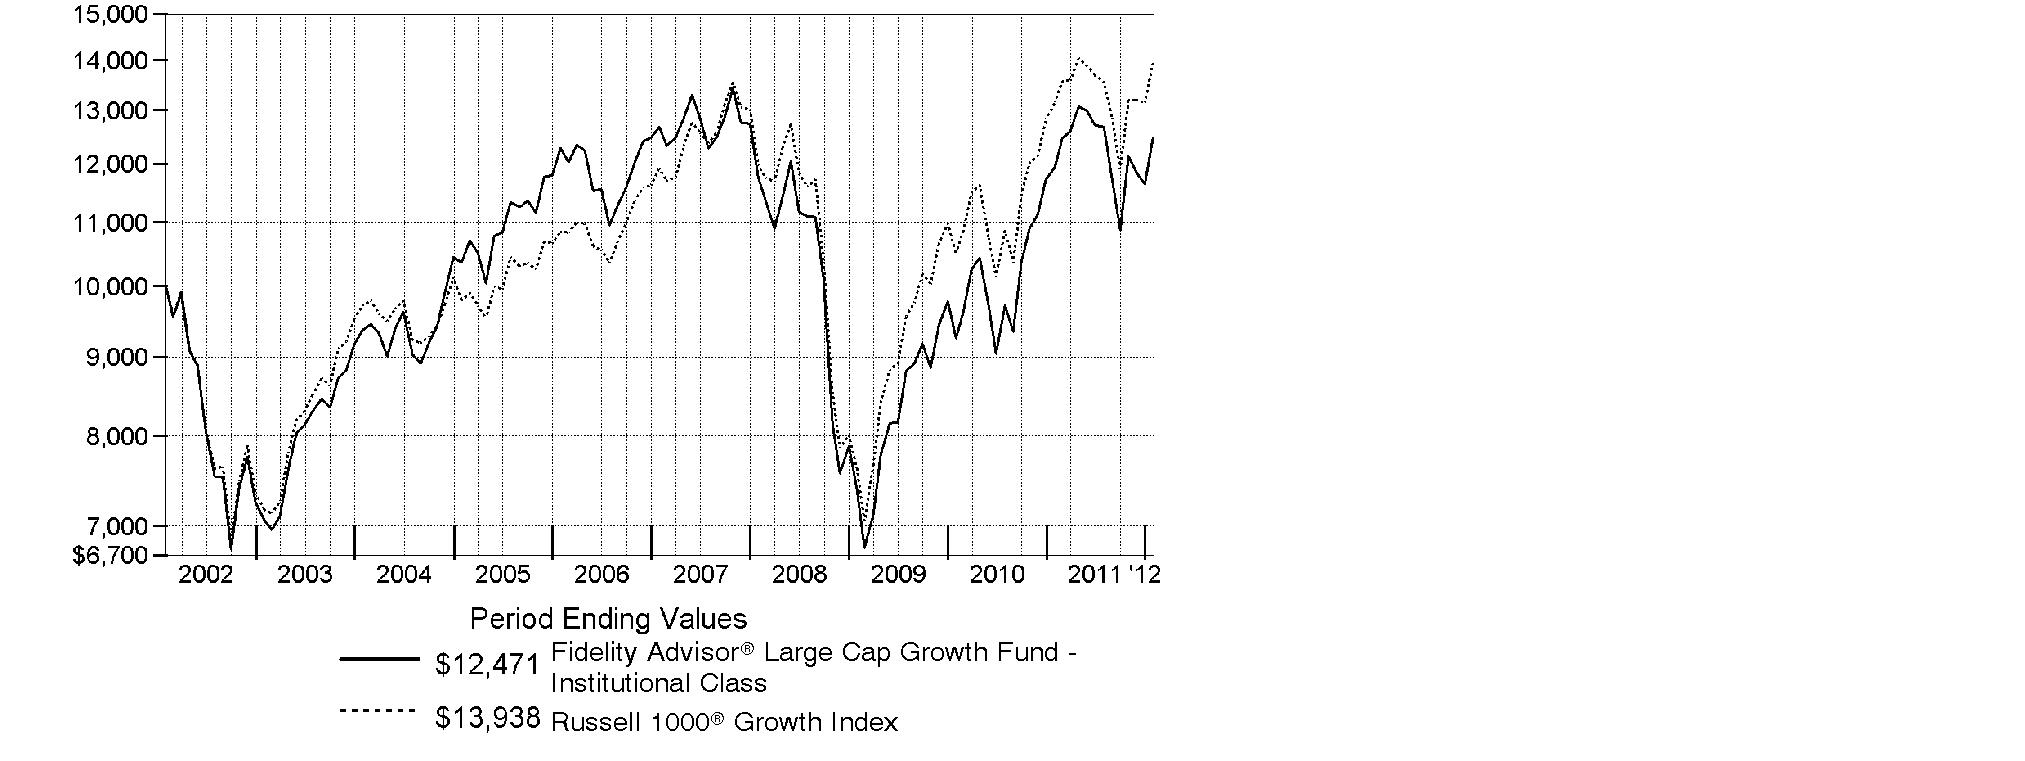
Annual Report
Management's Discussion of Fund Performance
Market Recap: After enduring one of the most volatile trading periods on record, U.S. stocks posted a gain for the 12 months ending January 31, 2012, sparked by a January rally. Strong corporate earnings reports and hints of economic recovery sent stocks mostly upward through April, when sovereign debt woes in Europe sparked fear of a global slowdown. In the summer, equities plummeted on eurozone instability, debate over the U.S. debt ceiling and a historic downgrade of the nation's sovereign debt rating. After falling as much as 13% by early August, the broad-based S&P 500® Index seesawed back to end the period on an optimistic note. For the full 12 months, the S&P 500® rose 4.22%, while the technology-laden Nasdaq Composite® Index added 5.26%. Investors began to shed perceived riskier smaller-cap stocks in favor of larger, more-established and dividend-paying names, helping to drive the Dow Jones® Industrial Average up 9.12% for the year, while the Russell 2000® - a proxy for small-caps - and Russell Midcap® indexes added 2.86% and 2.25%, respectively. Within the S&P 500®, defensive sectors such as health care (+16%) and utilities (+14%) fared best, while financials (-12%) struggled. Foreign developed-markets stocks were stung by Europe's turmoil, and the MSCI® EAFE® (Europe, Australasia, Far East) Index fell 9.49%.
Comments from Jeffrey Feingold, Portfolio Manager of Fidelity Advisor® Large Cap Growth Fund for most of the period covered by this update: For the year, the fund's Institutional Class shares returned 4.41%, versus the 6.07% gain of its benchmark, the Russell 1000® Growth Index. Security selection was disappointing relative to the index, particularly in the information technology, industrials, financials and energy sectors. In terms of individual detractors, not owning tobacco company and index component Philip Morris International hurt, as safer-haven, dividend-paying stocks rallied nicely. Within tech, NVIDIA, which makes graphics processors for computers and mobile devices, saw its share price decline due to end market weakness and softer demand for some newer products. Underweightings in two strong performing index constituents - fast-food chain McDonald's and IT leader International Business Machines - further detracted. Conversely, investments in consumer discretionary and consumer staples aided relative results. Top individual contributors included Tempur-Pedic International, a manufacturer of premium bedding, and Herbalife, which makes weight-management products and nutritional supplements. Herbalife was no longer owned by the fund at period end.
Annual Report
Note to shareholders: Daniel Kelley became Portfolio Manager on January 12, 2012.
The views expressed above reflect those of the portfolio manager(s) only through the end of the period as stated on the cover of this report and do not necessarily represent the views of Fidelity or any other person in the Fidelity organization. Any such views are subject to change at any time based upon market or other conditions and Fidelity disclaims any responsibility to update such views. These views may not be relied on as investment advice and, because investment decisions for a Fidelity fund are based on numerous factors, may not be relied on as an indication of trading intent on behalf of any Fidelity fund.
Annual Report
Shareholder Expense Example
As a shareholder of the Fund, you incur two types of costs: (1) transaction costs, including sales charges (loads) on purchase payments or redemption proceeds, and (2) ongoing costs, including management fees, distribution and/or service (12b-1) fees and other Fund expenses. This Example is intended to help you understand your ongoing costs (in dollars) of investing in the Fund and to compare these costs with the ongoing costs of investing in other mutual funds.
The Example is based on an investment of $1,000 invested at the beginning of the period and held for the entire period (August 1, 2011 to January 31, 2012).
Actual Expenses
The first line of the accompanying table for each class of the Fund provides information about actual account values and actual expenses. You may use the information in this line, together with the amount you invested, to estimate the expenses that you paid over the period. Simply divide your account value by $1,000.00 (for example, an $8,600 account value divided by $1,000.00 = 8.6), then multiply the result by the number in the first line for a class of the Fund under the heading entitled "Expenses Paid During Period" to estimate the expenses you paid on your account during this period. A small balance maintenance fee of $12.00 that is charged once a year may apply for certain accounts with a value of less than $2,000. This fee is not included in the table below. If it was, the estimate of expenses you paid during the period would be higher, and your ending account value lower, by this amount. In addition, the Fund, as a shareholder in the underlying Fidelity Central Funds, will indirectly bear its pro-rata share of the fees and expenses incurred by the underlying Fidelity Central Funds. These fees and expenses are not included in the Fund's annualized expense ratio used to calculate the expense estimate in the table below.
Hypothetical Example for Comparison Purposes
The second line of the accompanying table for each class of the Fund provides information about hypothetical account values and hypothetical expenses based on a Class' actual expense ratio and an assumed rate of return of 5% per year before expenses, which is not the Class' actual return. The hypothetical account values and expenses may not be used to estimate the actual ending account balance or expenses you paid for the period. You may use this information to compare the ongoing costs of investing in the Fund and other funds. To do so, compare this 5% hypothetical example with the 5% hypothetical examples that appear in the shareholder reports of the other funds. A small balance maintenance fee of $12.00 that is charged once a year may apply for certain accounts with a value of less than $2,000. This fee is not included in the table below. If it was, the estimate of expenses you paid during the period would be higher, and your ending account value lower, by this amount. In addition, the Fund, as a shareholder in the underlying Fidelity Central Funds, will indirectly bear its pro-rata share of the fees and expenses incurred by the underlying Fidelity Central Funds. These fees and expenses are not included in the Fund's annualized expense ratio used to calculate the expense estimate in the table below.
Please note that the expenses shown in the table are meant to highlight your ongoing costs only and do not reflect any transaction costs. Therefore, the second line of the table is useful in comparing ongoing costs only, and will not help you determine the relative total costs of owning different funds. In addition, if these transactional costs were included, your costs would have been higher.
Annual Report
| Annualized | Beginning | Ending | Expenses Paid |
Class A | 1.12% |
|
|
|
Actual |
| $ 1,000.00 | $ 982.70 | $ 5.60 |
HypotheticalA |
| $ 1,000.00 | $ 1,019.56 | $ 5.70 |
Class T | 1.38% |
|
|
|
Actual |
| $ 1,000.00 | $ 981.60 | $ 6.89 |
HypotheticalA |
| $ 1,000.00 | $ 1,018.25 | $ 7.02 |
Class B | 1.85% |
|
|
|
Actual |
| $ 1,000.00 | $ 978.50 | $ 9.23 |
HypotheticalA |
| $ 1,000.00 | $ 1,015.88 | $ 9.40 |
Class C | 1.86% |
|
|
|
Actual |
| $ 1,000.00 | $ 978.30 | $ 9.27 |
HypotheticalA |
| $ 1,000.00 | $ 1,015.83 | $ 9.45 |
Large Cap Growth | .82% |
|
|
|
Actual |
| $ 1,000.00 | $ 983.90 | $ 4.10 |
HypotheticalA |
| $ 1,000.00 | $ 1,021.07 | $ 4.18 |
Institutional Class | .76% |
|
|
|
Actual |
| $ 1,000.00 | $ 983.90 | $ 3.80 |
HypotheticalA |
| $ 1,000.00 | $ 1,021.37 | $ 3.87 |
A 5% return per year before expenses
* Expenses are equal to each Class' annualized expense ratio, multiplied by the average account value over the period, multiplied by 184/365 (to reflect the one-half year period).
Annual Report
Investment Changes (Unaudited)
Top Ten Stocks as of January 31, 2012 | ||
| % of fund's | % of fund's net assets |
Apple, Inc. | 7.6 | 7.4 |
Exxon Mobil Corp. | 3.0 | 3.8 |
Google, Inc. Class A | 2.7 | 3.8 |
Oracle Corp. | 2.1 | 1.9 |
Microsoft Corp. | 2.0 | 0.1 |
QUALCOMM, Inc. | 1.9 | 2.0 |
United Technologies Corp. | 1.6 | 1.5 |
Amazon.com, Inc. | 1.6 | 2.5 |
Cognizant Technology Solutions Corp. Class A | 1.5 | 2.1 |
Motorola Solutions, Inc. | 1.4 | 0.0 |
| 25.4 | |
Top Five Market Sectors as of January 31, 2012 | ||
| % of fund's | % of fund's net assets 6 months ago |
Information Technology | 30.4 | 29.3 |
Consumer Discretionary | 15.7 | 13.9 |
Industrials | 10.9 | 12.0 |
Health Care | 10.8 | 10.4 |
Consumer Staples | 10.0 | 11.0 |
Asset Allocation (% of fund's net assets) | |||||||
As of January 31, 2012* | As of July 31, 2011** | ||||||
| Stocks 98.5% |
| | Stocks 100.1% |
| ||
| Short-Term |
| | Short-Term |
| ||
* Foreign investments | 10.2% |
| ** Foreign investments | 13.5% |
| ||

† Short-Term Investments and Net Other Assets are not included in the pie chart |
Annual Report
Investments January 31, 2012
Showing Percentage of Net Assets
Common Stocks - 98.5% | |||
Shares | Value | ||
CONSUMER DISCRETIONARY - 15.7% | |||
Auto Components - 0.1% | |||
Gentex Corp. | 7,700 | $ 206,899 | |
Automobiles - 0.9% | |||
Bayerische Motoren Werke AG (BMW) | 6,566 | 561,569 | |
Ford Motor Co. | 62,263 | 773,306 | |
Tesla Motors, Inc. (a) | 900 | 26,163 | |
| 1,361,038 | ||
Diversified Consumer Services - 0.5% | |||
Weight Watchers International, Inc. | 10,300 | 784,139 | |
Hotels, Restaurants & Leisure - 2.5% | |||
Brinker International, Inc. | 46,500 | 1,202,025 | |
Chipotle Mexican Grill, Inc. (a) | 1,500 | 550,935 | |
Dunkin' Brands Group, Inc. (a) | 12,100 | 334,565 | |
Las Vegas Sands Corp. | 24,500 | 1,203,195 | |
McDonald's Corp. | 7,600 | 752,780 | |
| 4,043,500 | ||
Household Durables - 2.1% | |||
D.R. Horton, Inc. | 82,900 | 1,153,968 | |
Lennar Corp. Class A | 4,700 | 101,003 | |
PulteGroup, Inc. (a) | 31,800 | 236,910 | |
Ryland Group, Inc. | 23,300 | 424,060 | |
Tempur-Pedic International, Inc. (a) | 19,800 | 1,320,858 | |
Toll Brothers, Inc. (a) | 4,400 | 95,964 | |
| 3,332,763 | ||
Internet & Catalog Retail - 1.6% | |||
Amazon.com, Inc. (a) | 13,000 | 2,527,720 | |
Multiline Retail - 1.2% | |||
Dollar General Corp. (a) | 23,500 | 1,001,335 | |
Dollar Tree, Inc. (a) | 10,700 | 907,467 | |
| 1,908,802 | ||
Specialty Retail - 4.2% | |||
American Eagle Outfitters, Inc. | 34,600 | 487,514 | |
AutoZone, Inc. (a) | 1,500 | 521,820 | |
Bed Bath & Beyond, Inc. (a) | 13,400 | 813,380 | |
Limited Brands, Inc. | 18,000 | 753,480 | |
Lowe's Companies, Inc. | 54,800 | 1,470,284 | |
Sally Beauty Holdings, Inc. (a) | 33,700 | 694,894 | |
TJX Companies, Inc. | 20,300 | 1,383,242 | |
Common Stocks - continued | |||
Shares | Value | ||
CONSUMER DISCRETIONARY - continued | |||
Specialty Retail - continued | |||
Tractor Supply Co. | 4,200 | $ 339,234 | |
Williams-Sonoma, Inc. | 8,000 | 286,880 | |
| 6,750,728 | ||
Textiles, Apparel & Luxury Goods - 2.6% | |||
Deckers Outdoor Corp. (a) | 18,200 | 1,471,470 | |
Pandora A/S | 10,200 | 133,706 | |
PVH Corp. | 14,800 | 1,142,412 | |
Ralph Lauren Corp. | 4,300 | 653,600 | |
Under Armour, Inc. Class A (sub. vtg.) (a) | 8,200 | 652,884 | |
| 4,054,072 | ||
TOTAL CONSUMER DISCRETIONARY | 24,969,661 | ||
CONSUMER STAPLES - 10.0% | |||
Beverages - 2.6% | |||
Anheuser-Busch InBev SA NV | 10,300 | 626,204 | |
Diageo PLC sponsored ADR | 9,100 | 806,169 | |
Dr Pepper Snapple Group, Inc. | 34,500 | 1,339,290 | |
The Coca-Cola Co. | 21,800 | 1,472,154 | |
| 4,243,817 | ||
Food & Staples Retailing - 2.1% | |||
CVS Caremark Corp. | 16,100 | 672,175 | |
Drogasil SA | 55,700 | 462,254 | |
Wal-Mart Stores, Inc. | 18,068 | 1,108,652 | |
Walgreen Co. | 7,600 | 253,536 | |
Whole Foods Market, Inc. | 11,300 | 836,539 | |
| 3,333,156 | ||
Food Products - 1.0% | |||
Corn Products International, Inc. | 8,400 | 466,116 | |
Green Mountain Coffee Roasters, Inc. (a)(d) | 21,100 | 1,125,474 | |
| 1,591,590 | ||
Household Products - 2.4% | |||
Colgate-Palmolive Co. | 21,700 | 1,968,624 | |
Kimberly-Clark Corp. | 11,200 | 801,472 | |
Procter & Gamble Co. | 15,800 | 996,032 | |
| 3,766,128 | ||
Personal Products - 0.6% | |||
Schiff Nutrition International, Inc. (a) | 92,386 | 985,759 | |
Common Stocks - continued | |||
Shares | Value | ||
CONSUMER STAPLES - continued | |||
Tobacco - 1.3% | |||
Altria Group, Inc. | 61,600 | $ 1,749,440 | |
Japan Tobacco, Inc. | 62 | 304,998 | |
| 2,054,438 | ||
TOTAL CONSUMER STAPLES | 15,974,888 | ||
ENERGY - 9.9% | |||
Energy Equipment & Services - 3.0% | |||
Cameron International Corp. (a) | 14,700 | 782,040 | |
Dresser-Rand Group, Inc. (a) | 12,800 | 655,744 | |
Halliburton Co. | 38,800 | 1,427,064 | |
McDermott International, Inc. (a) | 11,200 | 136,192 | |
Noble Corp. | 13,800 | 480,792 | |
Oceaneering International, Inc. | 13,900 | 675,401 | |
Rowan Companies, Inc. (a) | 2,200 | 74,822 | |
Schlumberger Ltd. | 7,700 | 578,809 | |
| 4,810,864 | ||
Oil, Gas & Consumable Fuels - 6.9% | |||
Alpha Natural Resources, Inc. (a) | 7,370 | 148,284 | |
Amyris, Inc. (a) | 23,400 | 209,898 | |
Apache Corp. | 9,000 | 889,920 | |
Atlas Pipeline Partners, LP | 9,500 | 356,345 | |
BP PLC sponsored ADR | 3,829 | 175,789 | |
Chevron Corp. | 9,800 | 1,010,184 | |
Exxon Mobil Corp. | 57,600 | 4,823,424 | |
Hess Corp. | 8,200 | 461,660 | |
Marathon Petroleum Corp. | 14,750 | 563,745 | |
Occidental Petroleum Corp. | 11,300 | 1,127,401 | |
SM Energy Co. | 5,000 | 362,900 | |
Southwestern Energy Co. (a) | 15,500 | 482,670 | |
Ultra Petroleum Corp. (a) | 12,000 | 288,360 | |
| 10,900,580 | ||
TOTAL ENERGY | 15,711,444 | ||
FINANCIALS - 5.3% | |||
Capital Markets - 1.0% | |||
Charles Schwab Corp. | 46,200 | 538,230 | |
Common Stocks - continued | |||
Shares | Value | ||
FINANCIALS - continued | |||
Capital Markets - continued | |||
HFF, Inc. (a) | 10,500 | $ 148,155 | |
Morgan Stanley | 51,600 | 962,340 | |
| 1,648,725 | ||
Commercial Banks - 0.6% | |||
SunTrust Banks, Inc. | 7,200 | 148,104 | |
Wells Fargo & Co. | 28,400 | 829,564 | |
| 977,668 | ||
Consumer Finance - 0.2% | |||
SLM Corp. | 20,464 | 305,937 | |
Diversified Financial Services - 1.1% | |||
Bank of America Corp. | 51,600 | 367,908 | |
Citigroup, Inc. | 20,780 | 638,362 | |
JPMorgan Chase & Co. | 20,400 | 760,920 | |
| 1,767,190 | ||
Real Estate Investment Trusts - 2.1% | |||
American Tower Corp. | 22,400 | 1,422,624 | |
Big Yellow Group PLC | 73,100 | 322,345 | |
Camden Property Trust (SBI) | 3,800 | 245,100 | |
Corporate Office Properties Trust (SBI) | 2,600 | 62,998 | |
Digital Realty Trust, Inc. | 4,500 | 318,870 | |
Equity Residential (SBI) | 6,000 | 357,300 | |
Extra Space Storage, Inc. | 15,800 | 415,856 | |
Pennsylvania Real Estate Investment Trust (SBI) | 18,800 | 230,864 | |
| 3,375,957 | ||
Real Estate Management & Development - 0.3% | |||
CBRE Group, Inc. (a) | 21,300 | 411,090 | |
TOTAL FINANCIALS | 8,486,567 | ||
HEALTH CARE - 10.8% | |||
Biotechnology - 3.6% | |||
Achillion Pharmaceuticals, Inc. (a) | 56,600 | 627,694 | |
ADVENTRX Pharmaceuticals, Inc. (a)(d) | 116,174 | 79,986 | |
ADVENTRX Pharmaceuticals, Inc. warrants 11/16/16 (a) | 39,587 | 3,365 | |
Alexion Pharmaceuticals, Inc. (a) | 7,600 | 583,376 | |
Alkermes PLC (a) | 6,200 | 116,622 | |
Amgen, Inc. | 9,100 | 617,981 | |
Ardea Biosciences, Inc. (a) | 11,500 | 209,185 | |
ARIAD Pharmaceuticals, Inc. (a) | 22,700 | 334,825 | |
Common Stocks - continued | |||
Shares | Value | ||
HEALTH CARE - continued | |||
Biotechnology - continued | |||
Biogen Idec, Inc. (a) | 8,200 | $ 966,944 | |
BioMarin Pharmaceutical, Inc. (a) | 13,700 | 488,679 | |
Dynavax Technologies Corp. (a) | 68,200 | 237,336 | |
Gilead Sciences, Inc. (a) | 26,600 | 1,299,144 | |
Theravance, Inc. (a) | 12,200 | 216,428 | |
| 5,781,565 | ||
Health Care Equipment & Supplies - 1.4% | |||
Covidien PLC | 28,700 | 1,478,050 | |
The Cooper Companies, Inc. | 9,200 | 663,688 | |
| 2,141,738 | ||
Health Care Providers & Services - 3.0% | |||
Aetna, Inc. | 8,100 | 353,970 | |
Catalyst Health Solutions, Inc. (a) | 5,600 | 306,656 | |
Express Scripts, Inc. (a) | 3,024 | 154,708 | |
Health Net, Inc. (a) | 12,900 | 486,846 | |
Laboratory Corp. of America Holdings (a) | 6,450 | 589,466 | |
McKesson Corp. | 10,100 | 825,372 | |
Medco Health Solutions, Inc. (a) | 18,400 | 1,141,168 | |
UnitedHealth Group, Inc. | 3,800 | 196,802 | |
WellPoint, Inc. | 12,000 | 771,840 | |
| 4,826,828 | ||
Life Sciences Tools & Services - 0.4% | |||
Illumina, Inc. (a) | 12,400 | 641,824 | |
Pharmaceuticals - 2.4% | |||
AVANIR Pharmaceuticals Class A (a)(d) | 27,400 | 80,556 | |
Elan Corp. PLC sponsored ADR (a) | 17,300 | 235,453 | |
Eli Lilly & Co. | 24,200 | 961,708 | |
GlaxoSmithKline PLC sponsored ADR | 17,100 | 761,634 | |
Merck & Co., Inc. | 4,200 | 160,692 | |
Sanofi-aventis sponsored ADR | 21,300 | 790,869 | |
Shire PLC sponsored ADR | 4,000 | 398,080 | |
Valeant Pharmaceuticals International, Inc. (Canada) (a) | 7,600 | 368,044 | |
| 3,757,036 | ||
TOTAL HEALTH CARE | 17,148,991 | ||
INDUSTRIALS - 10.9% | |||
Aerospace & Defense - 2.5% | |||
Raytheon Co. | 5,400 | 259,146 | |
Common Stocks - continued | |||
Shares | Value | ||
INDUSTRIALS - continued | |||
Aerospace & Defense - continued | |||
Rockwell Collins, Inc. | 9,100 | $ 526,799 | |
Textron, Inc. | 25,000 | 637,000 | |
United Technologies Corp. | 32,600 | 2,554,210 | |
| 3,977,155 | ||
Airlines - 0.3% | |||
Copa Holdings SA Class A | 6,400 | 436,096 | |
Building Products - 0.1% | |||
Armstrong World Industries, Inc. (a) | 5,000 | 233,500 | |
Construction & Engineering - 3.0% | |||
AECOM Technology Corp. (a) | 40,800 | 933,912 | |
Dycom Industries, Inc. (a) | 18,600 | 397,482 | |
Fluor Corp. | 29,600 | 1,664,704 | |
Jacobs Engineering Group, Inc. (a) | 17,200 | 769,872 | |
MasTec, Inc. (a) | 23,300 | 379,557 | |
Quanta Services, Inc. (a) | 33,160 | 716,256 | |
| 4,861,783 | ||
Electrical Equipment - 0.9% | |||
GrafTech International Ltd. (a) | 14,800 | 243,016 | |
Regal-Beloit Corp. | 14,100 | 800,457 | |
Schneider Electric SA | 5,200 | 322,928 | |
| 1,366,401 | ||
Industrial Conglomerates - 0.9% | |||
Danaher Corp. | 28,100 | 1,475,531 | |
Machinery - 2.3% | |||
Cummins, Inc. | 18,200 | 1,892,800 | |
Ingersoll-Rand PLC | 29,800 | 1,041,212 | |
Joy Global, Inc. | 5,041 | 457,168 | |
Manitowoc Co., Inc. | 26,600 | 357,504 | |
| 3,748,684 | ||
Road & Rail - 0.6% | |||
Union Pacific Corp. | 8,100 | 925,911 | |
Trading Companies & Distributors - 0.3% | |||
WESCO International, Inc. (a) | 6,700 | 421,296 | |
TOTAL INDUSTRIALS | 17,446,357 | ||
INFORMATION TECHNOLOGY - 30.4% | |||
Communications Equipment - 4.1% | |||
Acme Packet, Inc. (a) | 1,500 | 43,845 | |
Common Stocks - continued | |||
Shares | Value | ||
INFORMATION TECHNOLOGY - continued | |||
Communications Equipment - continued | |||
Motorola Solutions, Inc. | 48,300 | $ 2,241,603 | |
Polycom, Inc. (a) | 62,013 | 1,237,159 | |
QUALCOMM, Inc. | 52,800 | 3,105,696 | |
| 6,628,303 | ||
Computers & Peripherals - 7.9% | |||
Apple, Inc. (a) | 26,600 | 12,142,369 | |
SanDisk Corp. (a) | 8,600 | 394,568 | |
| 12,536,937 | ||
Electronic Equipment & Components - 0.6% | |||
Arrow Electronics, Inc. (a) | 9,300 | 383,997 | |
TE Connectivity Ltd. | 14,900 | 508,090 | |
| 892,087 | ||
Internet Software & Services - 4.5% | |||
Akamai Technologies, Inc. (a) | 3,400 | 109,650 | |
Baidu.com, Inc. sponsored ADR (a) | 4,100 | 522,832 | |
eBay, Inc. (a) | 29,000 | 916,400 | |
Facebook, Inc. Class B (e) | 6,574 | 164,350 | |
Google, Inc. Class A (a) | 7,600 | 4,408,836 | |
Rackspace Hosting, Inc. (a)(d) | 26,404 | 1,146,198 | |
| 7,268,266 | ||
IT Services - 3.2% | |||
Accenture PLC Class A | 9,500 | 544,730 | |
Cognizant Technology Solutions Corp. Class A (a) | 33,100 | 2,374,925 | |
International Business Machines Corp. | 5,400 | 1,040,040 | |
Virtusa Corp. (a) | 20,300 | 324,597 | |
Visa, Inc. Class A | 8,600 | 865,504 | |
| 5,149,796 | ||
Semiconductors & Semiconductor Equipment - 2.7% | |||
Analog Devices, Inc. | 11,700 | 457,821 | |
ASML Holding NV | 13,600 | 584,664 | |
Atmel Corp. (a) | 35,800 | 347,618 | |
Avago Technologies Ltd. | 11,400 | 386,916 | |
Broadcom Corp. Class A | 29,200 | 1,002,728 | |
Cymer, Inc. (a) | 3,800 | 189,202 | |
Freescale Semiconductor Holdings I Ltd. | 25,500 | 407,235 | |
NVIDIA Corp. (a) | 37,700 | 556,829 | |
NXP Semiconductors NV (a) | 18,800 | 399,124 | |
| 4,332,137 | ||
Common Stocks - continued | |||
Shares | Value | ||
INFORMATION TECHNOLOGY - continued | |||
Software - 7.4% | |||
Aspen Technology, Inc. (a) | 8,700 | $ 156,687 | |
Citrix Systems, Inc. (a) | 13,600 | 886,856 | |
Informatica Corp. (a) | 11,600 | 490,680 | |
Intuit, Inc. | 7,100 | 400,724 | |
Microsoft Corp. | 106,400 | 3,141,992 | |
Oracle Corp. | 117,800 | 3,321,960 | |
Red Hat, Inc. (a) | 14,100 | 653,817 | |
salesforce.com, Inc. (a) | 13,150 | 1,535,920 | |
Solera Holdings, Inc. | 13,400 | 640,118 | |
VMware, Inc. Class A (a) | 5,700 | 520,239 | |
| 11,748,993 | ||
TOTAL INFORMATION TECHNOLOGY | 48,556,519 | ||
MATERIALS - 5.5% | |||
Chemicals - 2.9% | |||
Air Products & Chemicals, Inc. | 7,900 | 695,437 | |
Ashland, Inc. | 9,900 | 624,294 | |
LyondellBasell Industries NV Class A | 15,600 | 672,360 | |
Monsanto Co. | 20,800 | 1,706,640 | |
Sigma Aldrich Corp. | 5,000 | 340,200 | |
The Mosaic Co. | 11,200 | 626,864 | |
| 4,665,795 | ||
Construction Materials - 0.5% | |||
Eagle Materials, Inc. | 13,300 | 391,153 | |
Martin Marietta Materials, Inc. (d) | 4,300 | 354,793 | |
| 745,946 | ||
Metals & Mining - 2.1% | |||
Commercial Metals Co. | 42,100 | 603,714 | |
Freeport-McMoRan Copper & Gold, Inc. | 14,000 | 646,940 | |
Goldcorp, Inc. | 8,500 | 411,119 | |
Ivanhoe Mines Ltd. (a) | 21,600 | 348,314 | |
Kinross Gold Corp. | 28,800 | 325,409 | |
Common Stocks - continued | |||
Shares | Value | ||
MATERIALS - continued | |||
Metals & Mining - continued | |||
Newmont Mining Corp. | 10,400 | $ 639,392 | |
Nucor Corp. | 9,000 | 400,410 | |
| 3,375,298 | ||
TOTAL MATERIALS | 8,787,039 | ||
TOTAL COMMON STOCKS (Cost $145,129,252) |
| ||
Money Market Funds - 2.5% | |||
|
|
|
|
Fidelity Cash Central Fund, 0.12% (b) | 2,950,174 | 2,950,174 | |
Fidelity Securities Lending Cash Central Fund, 0.12% (b)(c) | 1,108,700 | 1,108,700 | |
TOTAL MONEY MARKET FUNDS (Cost $4,058,874) |
| ||
TOTAL INVESTMENT PORTFOLIO - 101.0% (Cost $149,188,126) | 161,140,340 | ||
NET OTHER ASSETS (LIABILITIES) - (1.0)% | (1,609,392) | ||
NET ASSETS - 100% | $ 159,530,948 | ||
Legend |
(a) Non-income producing |
(b) Affiliated fund that is available only to investment companies and other accounts managed by Fidelity Investments. The rate quoted is the annualized seven-day yield of the fund at period end. A complete unaudited listing of the fund's holdings as of its most recent quarter end is available upon request. In addition, each Fidelity Central Fund's financial statements, which are not covered by the Fund's Report of Independent Registered Public Accounting Firm, are available on the SEC's website or upon request. |
(c) Investment made with cash collateral received from securities on loan. |
(d) Security or a portion of the security is on loan at period end. |
(e) Restricted securities - Investment in securities not registered under the Securities Act of 1933 (excluding 144A issues). At the end of the period, the value of restricted securities (excluding 144A issues) amounted to $164,350 or 0.1% of net assets. |
Additional information on each restricted holding is as follows: |
Security | Acquisition Date | Acquisition Cost |
Facebook, Inc. Class B | 3/31/11 - 5/19/11 | $ 164,398 |
Affiliated Central Funds |
Information regarding fiscal year to date income earned by the Fund from investments in Fidelity Central Funds is as follows: |
Fund | Income earned |
Fidelity Cash Central Fund | $ 2,819 |
Fidelity Securities Lending Cash Central Fund | 117,589 |
Total | $ 120,408 |
Other Information |
The following is a summary of the inputs used, as of January 31, 2012, involving the Fund's assets and liabilities carried at fair value. The inputs or methodology used for valuing securities may not be an indication of the risk associated with investing in those securities. For more information on valuation inputs, and their aggregation into the levels used in the tables below, please refer to the Security Valuation section in the accompanying Notes to Financial Statements. |
Valuation Inputs at Reporting Date: | ||||
Description | Total | Level 1 | Level 2 | Level 3 |
Investments in Securities: | ||||
Equities: | ||||
Consumer Discretionary | $ 24,969,661 | $ 24,969,661 | $ - | $ - |
Consumer Staples | 15,974,888 | 15,348,684 | 626,204 | - |
Energy | 15,711,444 | 15,711,444 | - | - |
Financials | 8,486,567 | 8,486,567 | - | - |
Health Care | 17,148,991 | 17,145,626 | 3,365 | - |
Industrials | 17,446,357 | 17,446,357 | - | - |
Information Technology | 48,556,519 | 48,392,169 | - | 164,350 |
Materials | 8,787,039 | 8,787,039 | - | - |
Money Market Funds | 4,058,874 | 4,058,874 | - | - |
Total Investments in Securities: | $ 161,140,340 | $ 160,346,421 | $ 629,569 | $ 164,350 |
The following is a reconciliation of Investments in Securities for which Level 3 inputs were used in determining value: |
Investments in Securities: | |
Beginning Balance | $ - |
Total Realized Gain (Loss) | - |
Total Unrealized Gain (Loss) | (48) |
Cost of Purchases | 164,398 |
Proceeds of Sales | - |
Amortization/Accretion | - |
Transfers in to Level 3 | - |
Transfers out of Level 3 | - |
Ending Balance | $ 164,350 |
The change in unrealized gain (loss) for the period attributable to Level 3 securities held at January 31, 2012 | $ (48) |
The information used in the above reconciliation represents fiscal year to date activity for any Investments in Securities identified as using Level 3 inputs at either the beginning or the end of the current fiscal period. Transfers in or out of Level 3 represent the beginning value of any Security or Instrument where a change in the pricing level occurred from the beginning to the end of the period. The cost of purchases and the proceeds of sales may include securities received or delivered through corporate actions or exchanges. Realized and unrealized gains (losses) disclosed in the reconciliation are included in Net Gain (Loss) on the Fund's Statement of Operations. |
Distribution of investments by country of issue, as a percentage of total net assets, is as follows: (Unaudited) |
United States of America | 89.8% |
Ireland | 2.1% |
United Kingdom | 1.3% |
Canada | 1.1% |
Netherlands | 1.1% |
Others (Individually Less Than 1%) | 4.6% |
| 100.0% |
See accompanying notes which are an integral part of the financial statements.
Annual Report
Financial Statements
Statement of Assets and Liabilities
| January 31, 2012 | |
Assets | ||
Investment in securities, at value (including securities loaned of $1,094,516) - See accompanying schedule: Unaffiliated issuers (cost $145,129,252) | $ 157,081,466 |
|
Fidelity Central Funds (cost $4,058,874) | 4,058,874 |
|
Total Investments (cost $149,188,126) |
| $ 161,140,340 |
Receivable for investments sold | 5,278,512 | |
Receivable for fund shares sold | 271,984 | |
Dividends receivable | 235,536 | |
Distributions receivable from Fidelity Central Funds | 10,276 | |
Prepaid expenses | 405 | |
Other receivables | 2,460 | |
Total assets | 166,939,513 | |
|
|
|
Liabilities | ||
Payable to custodian bank | $ 671 | |
Payable for investments purchased | 5,975,137 | |
Payable for fund shares redeemed | 175,059 | |
Accrued management fee | 51,732 | |
Distribution and service plan fees payable | 11,091 | |
Other affiliated payables | 37,996 | |
Other payables and accrued expenses | 48,179 | |
Collateral on securities loaned, at value | 1,108,700 | |
Total liabilities | 7,408,565 | |
|
|
|
Net Assets | $ 159,530,948 | |
Net Assets consist of: |
| |
Paid in capital | $ 165,601,509 | |
Accumulated net investment loss | (77,636) | |
Accumulated undistributed net realized gain (loss) on investments and foreign currency transactions | (17,944,865) | |
Net unrealized appreciation (depreciation) on investments and assets and liabilities in foreign currencies | 11,951,940 | |
Net Assets | $ 159,530,948 | |
See accompanying notes which are an integral part of the financial statements.
Annual Report
Financial Statements - continued
Statement of Assets and Liabilities - continued
| January 31, 2012 | |
Calculation of Maximum Offering Price Class A: | $ 10.24 | |
|
|
|
Maximum offering price per share (100/94.25 of $10.24) | $ 10.86 | |
Class T: | $ 10.15 | |
|
|
|
Maximum offering price per share (100/96.50 of $10.15) | $ 10.52 | |
Class B: | $ 9.99 | |
|
|
|
Class C: | $ 9.93 | |
|
|
|
|
|
|
Large Cap Growth: | $ 10.36 | |
|
|
|
Institutional Class: | $ 10.41 | |
A Redemption price per share is equal to net asset value less any applicable contingent deferred sales charge.
See accompanying notes which are an integral part of the financial statements.
Annual Report
Statement of Operations
| Year ended January 31, 2012 | |
Investment Income |
|
|
Dividends |
| $ 1,259,704 |
Income from Fidelity Central Funds (including $117,589 from security lending) |
| 120,408 |
Total income |
| 1,380,112 |
|
|
|
Expenses | ||
Management fee | $ 848,727 | |
Performance adjustment | (120,450) | |
Transfer agent fees | 402,876 | |
Distribution and service plan fees | 128,629 | |
Accounting and security lending fees | 59,836 | |
Custodian fees and expenses | 24,423 | |
Independent trustees' compensation | 879 | |
Registration fees | 69,466 | |
Audit | 54,122 | |
Legal | 479 | |
Miscellaneous | 1,272 | |
Total expenses before reductions | 1,470,259 | |
Expense reductions | (8,950) | 1,461,309 |
Net investment income (loss) | (81,197) | |
Realized and Unrealized Gain (Loss) Net realized gain (loss) on: | ||
Investment securities: |
|
|
Unaffiliated issuers | 18,082,876 | |
Foreign currency transactions | (20,849) | |
Total net realized gain (loss) |
| 18,062,027 |
Change in net unrealized appreciation (depreciation) on: Investment securities | (12,509,979) | |
Assets and liabilities in foreign currencies | (339) | |
Total change in net unrealized appreciation (depreciation) |
| (12,510,318) |
Net gain (loss) | 5,551,709 | |
Net increase (decrease) in net assets resulting from operations | $ 5,470,512 | |
See accompanying notes which are an integral part of the financial statements.
Annual Report
Financial Statements - continued
| Year ended | Year ended |
Increase (Decrease) in Net Assets |
|
|
Operations |
|
|
Net investment income (loss) | $ (81,197) | $ (93,801) |
Net realized gain (loss) | 18,062,027 | 9,819,924 |
Change in net unrealized appreciation (depreciation) | (12,510,318) | 19,527,853 |
Net increase (decrease) in net assets resulting | 5,470,512 | 29,253,976 |
Share transactions - net increase (decrease) | 17,565,380 | 1,733,380 |
Total increase (decrease) in net assets | 23,035,892 | 30,987,356 |
|
|
|
Net Assets | ||
Beginning of period | 136,495,056 | 105,507,700 |
End of period (including accumulated net investment loss of $77,636 and accumulated net investment loss of $5,902, respectively) | $ 159,530,948 | $ 136,495,056 |
See accompanying notes which are an integral part of the financial statements.
Annual Report
Financial Highlights - Class A
Years ended January 31, | 2012 | 2011 | 2010 | 2009 | 2008 H |
Selected Per-Share Data |
|
|
|
|
|
Net asset value, beginning of period | $ 9.84 | $ 7.64 | $ 6.12 | $ 9.85 | $ 11.85 |
Income from Investment Operations |
|
|
|
|
|
Net investment income (loss) E | (.03) | (.02) | .01 | .02 | (.03) |
Net realized and unrealized gain (loss) | .43 | 2.22 | 1.53 | (3.71) | (.72) |
Total from investment operations | .40 | 2.20 | 1.54 | (3.69) | (.75) |
Distributions from net investment income | - | - | (.02) | (.04) | - |
Distributions from net realized gain | - | - | - | - | (1.25) |
Total distributions | - | - | (.02) | (.04) | (1.25) |
Net asset value, end of period | $ 10.24 | $ 9.84 | $ 7.64 | $ 6.12 | $ 9.85 |
Total Return B,C,D | 4.07% | 28.80% | 25.14% | (37.49)% | (6.99)% |
Ratios to Average Net Assets F,I |
|
|
|
|
|
Expenses before reductions | 1.17% | 1.12% | 1.07% | 1.01% | 1.20% A |
Expenses net of fee waivers, if any | 1.17% | 1.12% | 1.07% | 1.01% | 1.20% A |
Expenses net of all reductions | 1.16% | 1.12% | 1.06% | 1.01% | 1.20% A |
Net investment income (loss) | (.26)% | (.28)% | .08% | .20% | (.29)% A |
Supplemental Data |
|
|
|
|
|
Net assets, end of period | $ 12,727 | $ 6,669 | $ 3,805 | $ 2,159 | $ 1,302 |
Portfolio turnover rate G | 108% | 126% | 342% | 355% | 428% |
A Annualized
B Total returns for periods of less than one year are not annualized.
C Total returns would have been lower if certain expenses had not been reduced during the applicable periods shown.
D Total returns do not include the effect of the sales charges.
E Calculated based on average shares outstanding during the period.
F Fees and expenses of any underlying Fidelity Central Funds are not included in the Fund's expense ratio. The Fund indirectly bears its proportionate share of the expenses of any underlying Fidelity Central Funds.
G Amount does not include the portfolio activity of any underlying Fidelity Central Funds.
H For the period February 13, 2007 (commencement of sale of shares) to January 31, 2008.
I Expense ratios reflect operating expenses of the class. Expenses before reductions do not reflect amounts reimbursed by the investment adviser or reductions from brokerage service arrangements or reductions from other expense offset arrangements and do not represent the amount paid by the class during periods when reimbursements or reductions occur. Expense ratios before reductions for start-up periods may not be representative of longer-term operating periods. Expenses net of fee waivers reflect expenses after reimbursement by the investment adviser but prior to reductions from brokerage service arrangements or other expense offset arrangements. Expenses net of all reductions represent the net expenses paid by the class.
See accompanying notes which are an integral part of the financial statements.
Annual Report
Financial Highlights - Class T
Years ended January 31, | 2012 | 2011 | 2010 | 2009 | 2008 H |
Selected Per-Share Data |
|
|
|
|
|
Net asset value, beginning of period | $ 9.78 | $ 7.61 | $ 6.11 | $ 9.85 | $ 11.85 |
Income from Investment Operations |
|
|
|
|
|
Net investment income (loss) E | (.05) | (.05) | (.02) | (.01) | (.06) |
Net realized and unrealized gain (loss) | .42 | 2.22 | 1.52 | (3.70) | (.69) |
Total from investment operations | .37 | 2.17 | 1.50 | (3.71) | (.75) |
Distributions from net investment income | - | - | - J | (.03) | - |
Distributions from net realized gain | - | - | - | - | (1.25) |
Total distributions | - | - | - J | (.03) | (1.25) |
Net asset value, end of period | $ 10.15 | $ 9.78 | $ 7.61 | $ 6.11 | $ 9.85 |
Total Return B,C,D | 3.78% | 28.52% | 24.60% | (37.71)% | (7.05)% |
Ratios to Average Net Assets F,I |
|
|
|
|
|
Expenses before reductions | 1.44% | 1.42% | 1.38% | 1.31% | 1.47% A |
Expenses net of fee waivers, if any | 1.44% | 1.42% | 1.38% | 1.31% | 1.47% A |
Expenses net of all reductions | 1.44% | 1.42% | 1.36% | 1.31% | 1.47% A |
Net investment income (loss) | (.53)% | (.58)% | (.23)% | (.10)% | (.56)% A |
Supplemental Data |
|
|
|
|
|
Net assets, end of period | $ 5,876 | $ 2,900 | $ 1,548 | $ 820 | $ 1,097 |
Portfolio turnover rate G | 108% | 126% | 342% | 355% | 428% |
A Annualized
B Total returns for periods of less than one year are not annualized.
C Total returns would have been lower if certain expenses had not been reduced during the applicable periods shown.
D Total returns do not include the effect of the sales charges.
E Calculated based on average shares outstanding during the period.
F Fees and expenses of any underlying Fidelity Central Funds are not included in the Fund's expense ratio. The Fund indirectly bears its proportionate share of the expenses of any underlying Fidelity Central Funds.
G Amount does not include the portfolio activity of any underlying Fidelity Central Funds.
H For the period February 13, 2007 (commencement of sale of shares) to January 31, 2008.
I Expense ratios reflect operating expenses of the class. Expenses before reductions do not reflect amounts reimbursed by the investment adviser or reductions from brokerage service arrangements or reductions from other expense offset arrangements and do not represent the amount paid by the class during periods when reimbursements or reductions occur. Expense ratios before reductions for start-up periods may not be representative of longer-term operating periods. Expenses net of fee waivers reflect expenses after reimbursement by the investment adviser but prior to reductions from brokerage service arrangements or other expense offset arrangements. Expenses net of all reductions represent the net expenses paid by the class.
J Amount represents less than $.01 per share.
See accompanying notes which are an integral part of the financial statements.
Annual Report
Financial Highlights - Class B
Years ended January 31, | 2012 | 2011 | 2010 | 2009 | 2008 H |
Selected Per-Share Data |
|
|
|
|
|
Net asset value, beginning of period | $ 9.68 | $ 7.57 | $ 6.09 | $ 9.83 | $ 11.85 |
Income from Investment Operations |
|
|
|
|
|
Net investment income (loss) E | (.10) | (.09) | (.05) | (.05) | (.12) |
Net realized and unrealized gain (loss) | .41 | 2.20 | 1.53 | (3.69) | (.70) |
Total from investment operations | .31 | 2.11 | 1.48 | (3.74) | (.82) |
Distributions from net realized gain | - | - | - | - J | (1.20) |
Total distributions | - | - | - | - J | (1.20) |
Net asset value, end of period | $ 9.99 | $ 9.68 | $ 7.57 | $ 6.09 | $ 9.83 |
Total Return B,C,D | 3.20% | 27.87% | 24.30% | (38.01)% | (7.62)% |
Ratios to Average Net Assets F,I |
|
|
|
|
|
Expenses before reductions | 1.92% | 1.87% | 1.82% | 1.76% | 1.99% A |
Expenses net of fee waivers, if any | 1.92% | 1.87% | 1.82% | 1.76% | 1.99% A |
Expenses net of all reductions | 1.92% | 1.87% | 1.80% | 1.76% | 1.99% A |
Net investment income (loss) | (1.01)% | (1.03)% | (.67)% | (.56)% | (1.07)% A |
Supplemental Data |
|
|
|
|
|
Net assets, end of period | $ 1,610 | $ 2,143 | $ 1,466 | $ 815 | $ 543 |
Portfolio turnover rate G | 108% | 126% | 342% | 355% | 428% |
A Annualized
B Total returns for periods of less than one year are not annualized.
C Total returns would have been lower if certain expenses had not been reduced during the applicable periods shown.
D Total returns do not include the effect of the contingent deferred sales charge.
E Calculated based on average shares outstanding during the period.
F Fees and expenses of any underlying Fidelity Central Funds are not included in the Fund's expense ratio. The Fund indirectly bears its proportionate share of the expenses of any underlying Fidelity Central Funds.
G Amount does not include the portfolio activity of any underlying Fidelity Central Funds.
H For the period February 13, 2007 (commencement of sale of shares) to January 31, 2008.
I Expense ratios reflect operating expenses of the class. Expenses before reductions do not reflect amounts reimbursed by the investment adviser or reductions from brokerage service arrangements or reductions from other expense offset arrangements and do not represent the amount paid by the class during periods when reimbursements or reductions occur. Expense ratios before reductions for start-up periods may not be representative of longer-term operating periods. Expenses net of fee waivers reflect expenses after reimbursement by the investment adviser but prior to reductions from brokerage service arrangements or other expense offset arrangements. Expenses net of all reductions represent the net expenses paid by the class.
J Amount represents less than $.01 per share.
See accompanying notes which are an integral part of the financial statements.
Annual Report
Financial Highlights - Class C
Years ended January 31, | 2012 | 2011 | 2010 | 2009 | 2008 H |
Selected Per-Share Data |
|
|
|
|
|
Net asset value, beginning of period | $ 9.62 | $ 7.52 | $ 6.06 | $ 9.82 | $ 11.85 |
Income from Investment Operations |
|
|
|
|
|
Net investment income (loss) E | (.10) | (.09) | (.05) | (.04) | (.11) |
Net realized and unrealized gain (loss) | .41 | 2.19 | 1.51 | (3.69) | (.70) |
Total from investment operations | .31 | 2.10 | 1.46 | (3.73) | (.81) |
Distributions from net investment income | - | - | - | (.03) | - |
Distributions from net realized gain | - | - | - | - | (1.22) |
Total distributions | - | - | - | (.03) | (1.22) |
Net asset value, end of period | $ 9.93 | $ 9.62 | $ 7.52 | $ 6.06 | $ 9.82 |
Total Return B,C,D | 3.22% | 27.93% | 24.09% | (37.98)% | (7.54)% |
Ratios to Average Net Assets F,I |
|
|
|
|
|
Expenses before reductions | 1.92% | 1.87% | 1.82% | 1.77% | 1.96% A |
Expenses net of fee waivers, if any | 1.92% | 1.87% | 1.82% | 1.77% | 1.96% A |
Expenses net of all reductions | 1.91% | 1.87% | 1.80% | 1.77% | 1.96% A |
Net investment income (loss) | (1.00)% | (1.03)% | (.67)% | (.57)% | (1.05)% A |
Supplemental Data |
|
|
|
|
|
Net assets, end of period | $ 6,061 | $ 3,623 | $ 1,917 | $ 1,441 | $ 945 |
Portfolio turnover rate G | 108% | 126% | 342% | 355% | 428% |
A Annualized
B Total returns for periods of less than one year are not annualized.
C Total returns would have been lower if certain expenses had not been reduced during the applicable periods shown.
D Total returns do not include the effect of the contingent deferred sales charge.
E Calculated based on average shares outstanding during the period.
F Fees and expenses of any underlying Fidelity Central Funds are not included in the Fund's expense ratio. The Fund indirectly bears its proportionate share of the expenses of any underlying Fidelity Central Funds.
G Amount does not include the portfolio activity of any underlying Fidelity Central Funds.
H For the period February 13, 2007 (commencement of sale of shares) to January 31, 2008.
I Expense ratios reflect operating expenses of the class. Expenses before reductions do not reflect amounts reimbursed by the investment adviser or reductions from brokerage service arrangements or reductions from other expense offset arrangements and do not represent the amount paid by the class during periods when reimbursements or reductions occur. Expense ratios before reductions for start-up periods may not be representative of longer-term operating periods. Expenses net of fee waivers reflect expenses after reimbursement by the investment adviser but prior to reductions from brokerage service arrangements or other expense offset arrangements. Expenses net of all reductions represent the net expenses paid by the class.
See accompanying notes which are an integral part of the financial statements.
Annual Report
Financial Highlights - Large Cap Growth
Years ended January 31, | 2012 | 2011 | 2010 | 2009 | 2008 |
Selected Per-Share Data |
|
|
|
|
|
Net asset value, beginning of period | $ 9.93 | $ 7.69 | $ 6.15 | $ 9.89 | $ 11.92 |
Income from Investment Operations |
|
|
|
|
|
Net investment income (loss) B | - F | - F | .02 | .04 | (.01) |
Net realized and unrealized gain (loss) | .43 | 2.24 | 1.55 | (3.73) | (.77) |
Total from investment operations | .43 | 2.24 | 1.57 | (3.69) | (.78) |
Distributions from net investment income | - | - | (.03) | (.05) | - |
Distributions from net realized gain | - | - | - | - | (1.25) |
Total distributions | - | - | (.03) | (.05) | (1.25) |
Net asset value, end of period | $ 10.36 | $ 9.93 | $ 7.69 | $ 6.15 | $ 9.89 |
Total Return A | 4.33% | 29.13% | 25.50% | (37.36)% | (7.26)% |
Ratios to Average Net Assets C,E |
|
|
|
|
|
Expenses before reductions | .88% | .87% | .81% | .75% | 1.03% |
Expenses net of fee waivers, if any | .88% | .87% | .81% | .74% | .99% |
Expenses net of all reductions | .87% | .86% | .80% | .74% | .98% |
Net investment income (loss) | .04% | (.02)% | .34% | .47% | (.07)% |
Supplemental Data |
|
|
|
|
|
Net assets, end of period | $ 132,123 | $ 120,671 | $ 96,661 | $ 85,332 | $ 147,864 |
Portfolio turnover rate D | 108% | 126% | 342% | 355% | 428% |
A Total returns would have been lower if certain expenses had not been reduced during the applicable periods shown.
B Calculated based on average shares outstanding during the period.
C Fees and expenses of any underlying Fidelity Central Funds are not included in the Fund's expense ratio. The Fund indirectly bears its proportionate share of the expenses of any underlying Fidelity Central Funds.
D Amount does not include the portfolio activity of any underlying Fidelity Central Funds.
E Expense ratios reflect operating expenses of the class. Expenses before reductions do not reflect amounts reimbursed by the investment adviser or reductions from brokerage service arrangements or reductions from other expense offset arrangements and do not represent the amount paid by the class during periods when reimbursements or reductions occur. Expenses net of fee waivers reflect expenses after reimbursement by the investment adviser but prior to reductions from brokerage service arrangements or other expense offset arrangements. Expenses net of all reductions represent the net expenses paid by the class.
F Amount represents less than $.01 per share.
See accompanying notes which are an integral part of the financial statements.
Annual Report
Financial Highlights - Institutional Class
Years ended January 31, | 2012 | 2011 | 2010 | 2009 | 2008 G |
Selected Per-Share Data |
|
|
|
|
|
Net asset value, beginning of period | $ 9.97 | $ 7.72 | $ 6.18 | $ 9.88 | $ 11.85 |
Income from Investment Operations |
|
|
|
|
|
Net investment income (loss) D | .01 | - I | .03 | .04 | - I |
Net realized and unrealized gain (loss) | .43 | 2.25 | 1.54 | (3.72) | (.70) |
Total from investment operations | .44 | 2.25 | 1.57 | (3.68) | (.70) |
Distributions from net investment income | - | - | (.03) | (.02) | - |
Distributions from net realized gain | - | - | - | - | (1.27) |
Total distributions | - | - | (.03) | (.02) | (1.27) |
Net asset value, end of period | $ 10.41 | $ 9.97 | $ 7.72 | $ 6.18 | $ 9.88 |
Total Return B,C | 4.41% | 29.15% | 25.42% | (37.29)% | (6.64)% |
Ratios to Average Net Assets E,H |
|
|
|
|
|
Expenses before reductions | .83% | .86% | .76% | .68% | .88% A |
Expenses net of fee waivers, if any | .83% | .86% | .76% | .68% | .88% A |
Expenses net of all reductions | .82% | .86% | .74% | .68% | .88% A |
Net investment income (loss) | .08% | (.02)% | .39% | .52% | .03% A |
Supplemental Data |
|
|
|
|
|
Net assets, end of period | $ 1,134 | $ 488 | $ 111 | $ 277 | $ 386 |
Portfolio turnover rate F | 108% | 126% | 342% | 355% | 428% |
A Annualized
B Total returns for periods of less than one year are not annualized.
C Total returns would have been lower if certain expenses had not been reduced during the applicable periods shown.
D Calculated based on average shares outstanding during the period.
E Fees and expenses of any underlying Fidelity Central Funds are not included in the Fund's expense ratio. The Fund indirectly bears its proportionate share of the expenses of any underlying Fidelity Central Funds.
F Amount does not include the portfolio activity of any underlying Fidelity Central Funds.
G For the period February 13, 2007 (commencement of sale of shares) to January 31, 2008.
H Expense ratios reflect operating expenses of the class. Expenses before reductions do not reflect amounts reimbursed by the investment adviser or reductions from brokerage service arrangements or reductions from other expense offset arrangements and do not represent the amount paid by the class during periods when reimbursements or reductions occur. Expense ratios before reductions for start-up periods may not be representative of longer-term operating periods. Expenses net of fee waivers reflect expenses after reimbursement by the investment adviser but prior to reductions from brokerage service arrangements or other expense offset arrangements. Expenses net of all reductions represent the net expenses paid by the class.
I Amount represents less than $.01 per share.
See accompanying notes which are an integral part of the financial statements.
Annual Report
Notes to Financial Statements
For the period ended January 31, 2012
1. Organization.
Fidelity Large Cap Growth Fund (the Fund) is a fund of Fidelity Devonshire Trust (the Trust) and is authorized to issue an unlimited number of shares. The Trust is registered under the Investment Company Act of 1940, as amended (the 1940 Act), as an open-end management investment company organized as a Massachusetts business trust. The Fund offers Class A, Class T, Class C, Large Cap Growth and Institutional Class shares, each of which, along with Class B shares, has equal rights as to assets and voting privileges. Effective after the close of business on September 1, 2010, Class B shares were closed to new accounts and additional purchases, except for exchanges and reinvestments. Each class has exclusive voting rights with respect to matters that affect that class. Class B shares will automatically convert to Class A shares after a holding period of seven years from the initial date of purchase. Investment income, realized and unrealized capital gains and losses, the common expenses of the Fund, and certain fund-level expense reductions, if any, are allocated on a pro-rata basis to each class based on the relative net assets of each class to the total net assets of the Fund. Each class differs with respect to transfer agent and distribution and service plan fees incurred. Certain expense reductions may also differ by class.
2. Investments in Fidelity Central Funds.
The Fund invests in Fidelity Central Funds, which are open-end investment companies available only to other investment companies and accounts managed by Fidelity Management & Research Company (FMR) and its affiliates. The Fund's Schedule of Investments lists each of the Fidelity Central Funds held as of period end, if any, as an investment of the Fund, but does not include the underlying holdings of each Fidelity Central Fund. As an Investing Fund, the Fund indirectly bears its proportionate share of the expenses of the underlying Fidelity Central Funds.
The Money Market Central Funds seek preservation of capital and current income and are managed by Fidelity Investments Money Management, Inc. (FIMM), an affiliate of FMR.
A complete unaudited list of holdings for each Fidelity Central Fund is available upon request or at the Securities and Exchange Commission (the SEC) web site at www.sec.gov. In addition, the financial statements of the Fidelity Central Funds, which are not covered by the Fund's Report of Independent Registered Public Accounting Firm, are available on the SEC web site or upon request.
3. Significant Accounting Policies.
The financial statements have been prepared in conformity with accounting principles generally accepted in the United States of America (GAAP), which require management to make certain estimates and assumptions at the date of the financial statements. Actual results could differ from those estimates. Subsequent events, if any, through the
Annual Report
3. Significant Accounting Policies - continued
date that the financial statements were issued have been evaluated in the preparation of the financial statements. The following summarizes the significant accounting policies of the Fund:
Security Valuation. Investments are valued as of 4:00 p.m. Eastern time on the last calendar day of the period. The Fund uses independent pricing services approved by the Board of Trustees to value its investments. When current market prices or quotations are not readily available or reliable, valuations may be determined in good faith in accordance with procedures adopted by the Board of Trustees. Factors used in determining value may include market or security specific events. The frequency with which these procedures are used cannot be predicted and they may be utilized to a significant extent. The value used for net asset value (NAV) calculation under these procedures may differ from published prices for the same securities.
The Fund categorizes the inputs to valuation techniques used to value its investments into a disclosure hierarchy consisting of three levels as shown below:
Level 1 - quoted prices in active markets for identical investments
Level 2 - other significant observable inputs (including quoted prices for similar investments, interest rates, prepayment speeds, etc.)
Level 3 - unobservable inputs (including the Fund's own assumptions based on the best information available)
Changes in valuation techniques may result in transfers in or out of an assigned level within the disclosure hierarchy. The aggregate value of investments by input level, as of January 31, 2012, as well as a roll forward of Level 3 securities, is included at the end of the Fund's Schedule of Investments. Valuation techniques used to value the Fund's investments by major category are as follows:
Equity securities, including restricted securities, for which market quotations are readily available, are valued at the last reported sale price or official closing price as reported by an independent pricing service on the primary market or exchange on which they are traded and are categorized as Level 1 in the hierarchy. In the event there were no sales during the day or closing prices are not available, securities are valued at the last quoted bid price or may be valued using the last available price and are generally categorized as Level 2 in the hierarchy. For foreign equity securities, when significant market or security specific events arise, comparisons to the valuation of American Depositary Receipts (ADRs), futures contracts, Exchange-traded funds (ETFs) and certain indexes as well as quoted prices for similar securities are used and are categorized as Level 2 in the hierarchy in these circumstances. Utilizing these techniques may result in transfers between Level 1 and Level 2. For restricted equity securities and private placements where
Annual Report
Notes to Financial Statements - continued
3. Significant Accounting Policies - continued
Security Valuation - continued
observable inputs are limited, assumptions about market activity and risk are used and are categorized as Level 3 in the hierarchy.
Investments in open-end mutual funds, including the Fidelity Central Funds, are valued at their closing net asset value each business day and are categorized as Level 1 in the hierarchy.
New Accounting Pronouncements. In May 2011, the Financial Accounting Standards Board issued Accounting Standard Update No. 2011-04, Fair Value Measurement (Topic 820) - Amendments to Achieve Common Fair Value Measurement and Disclosure Requirements in U.S. GAAP and IFRSs. The update is effective during interim and annual periods beginning after December 15, 2011 and will result in additional disclosure for transfers between levels as well as expanded disclosure for securities categorized as Level 3 under the fair value hierarchy.
In December 2011, the Financial Accounting Standards Board issued Accounting Standard Update No. 2011-11, Disclosures about Offsetting Assets and Liabilities. The update creates new disclosure requirements requiring entities to disclose both gross and net information for derivatives and other financial instruments that are either offset in the Statement of Assets and Liabilities or subject to an enforceable master netting arrangement or similar agreement. The disclosure requirements are effective for interim and annual reporting periods beginning on or after January 1, 2013. Management is currently evaluating the impact of the update's adoption on the Fund's financial statement disclosures.
Foreign Currency. The Fund may use foreign currency contracts to facilitate transactions in foreign-denominated securities. Gains and losses from these transactions may arise from changes in the value of the foreign currency or if the counterparties do not perform under the contracts' terms.
Foreign-denominated assets, including investment securities, and liabilities are translated into U.S. dollars at the exchange rate at period end. Purchases and sales of investment securities, income and dividends received and expenses denominated in foreign currencies are translated into U.S. dollars at the exchange rate in effect on the transaction date.
The effects of exchange rate fluctuations on investments are included with the net realized and unrealized gain (loss) on investment securities. Other foreign currency transactions resulting in realized and unrealized gain (loss) are disclosed separately.
Annual Report
3. Significant Accounting Policies - continued
Investment Transactions and Income. For financial reporting purposes, the Fund's investment holdings and NAV include trades executed through the end of the last business day of the period. The NAV per share for processing shareholder transactions is calculated as of the close of business of the New York Stock Exchange (NYSE), normally 4:00 p.m. Eastern time and includes trades executed through the end of the prior business day. Gains and losses on securities sold are determined on the basis of identified cost and may include proceeds received from litigation. Dividend income is recorded on the ex-dividend date, except for certain dividends from foreign securities where the ex-dividend date may have passed, which are recorded as soon as the Fund is informed of the ex-dividend date. Non-cash dividends included in dividend income, if any, are recorded at the fair market value of the securities received. Distributions received on securities that represent a return of capital or capital gain are recorded as a reduction of cost of investments and/or as a realized gain. The Fund estimates the components of distributions received that may be considered return of capital distributions or capital gain distributions. Interest income and distributions from the Fidelity Central Funds are accrued as earned. Interest income includes coupon interest and amortization of premium and accretion of discount on debt securities. Investment income is recorded net of foreign taxes withheld where recovery of such taxes is uncertain.
Expenses. Expenses directly attributable to a fund are charged to that fund. Expenses attributable to more than one fund are allocated among the respective funds on the basis of relative net assets or other appropriate methods. Expense estimates are accrued in the period to which they relate and adjustments are made when actual amounts are known.
Income Tax Information and Distributions to Shareholders. Each year, the Fund intends to qualify as a regulated investment company, including distributing substantially all of its taxable income and realized gains under Subchapter M of the Internal Revenue Code. As a result, no provision for income taxes is required. As of January 31, 2012, the Fund did not have any unrecognized tax benefits in the financial statements; nor is the Fund aware of any tax positions for which it is reasonably possible that the total amounts of unrecognized tax benefits will significantly change in the next twelve months. The Fund files a U.S. federal tax return, in addition to state and local tax returns as required. A fund's tax returns are subject to examination by the Internal Revenue Service (IRS) for a period of three fiscal years. State and local tax returns may be subject to examination for an additional fiscal year depending on the jurisdiction. Foreign taxes are provided for based on the Fund's understanding of the tax rules and rates that exist in the foreign markets in which it invests.
Distributions are declared and recorded on the ex-dividend date. Income dividends and capital gain distributions are declared separately for each class. Income and capital gain distributions are determined in accordance with income tax regulations, which may differ from GAAP.
Annual Report
Notes to Financial Statements - continued
3. Significant Accounting Policies - continued
Income Tax Information and Distributions to Shareholders - continued
Capital accounts within the financial statements are adjusted for permanent book-tax differences. These adjustments have no impact on net assets or the results of operations. Temporary book-tax differences will reverse in a subsequent period.
Book-tax differences are primarily due to foreign currency transactions, passive foreign investment companies (PFIC), partnerships, net operating losses, capital loss carryforwards and losses due to wash sales and excise tax regulations.
The federal tax cost of investment securities and unrealized appreciation (depreciation) as of period end were as follows:
Gross unrealized appreciation | $ 16,492,743 |
Gross unrealized depreciation | (4,791,500) |
Net unrealized appreciation (depreciation) on securities and other investments | $ 11,701,243 |
|
|
Tax Cost | $ 149,439,097 |
The tax-based components of distributable earnings as of period end were as follows:
Capital loss carryforward | $ (17,693,894) |
Net unrealized appreciation (depreciation) | $ 11,700,969 |
Capital loss carryforwards are only available to offset future capital gains of the Fund to the extent provided by regulations and may be limited. Under the Regulated Investment Company Modernization Act of 2010 (the Act), the Fund is permitted to carry forward capital losses incurred in taxable years beginning after December 22, 2010 for an unlimited period and such capital losses are required to be used prior to any losses that expire. Capital loss carryforwards were as follows:
Fiscal year of expiration |
|
2017 | $ (9,033,793) |
2018 | (8,660,101) |
Total with expiration | $ (17,693,894) |
4. Operating Policies.
Restricted Securities. The Fund may invest in securities that are subject to legal or contractual restrictions on resale. These securities generally may be resold in transactions exempt from registration or to the public if the securities are registered. Disposal of these securities may involve time-consuming negotiations and expense, and prompt sale at an acceptable price may be difficult. Information regarding restricted securities is included at the end of the Fund's Schedule of Investments.
Annual Report
5. Purchases and Sales of Investments.
Purchases and sales of securities, other than short-term securities, aggregated $180,252,655 and $164,331,765, respectively.
6. Fees and Other Transactions with Affiliates.
Management Fee. FMR and its affiliates provide the Fund with investment management related services for which the Fund pays a monthly management fee. The management fee is the sum of an individual fund fee rate that is based on an annual rate of .30% of the Fund's average net assets and an annualized group fee rate that averaged .26% during the period. The group fee rate is based upon the average net assets of all the mutual funds advised by FMR. The group fee rate decreases as assets under management increase and increases as assets under management decrease. In addition, the management fee is subject to a performance adjustment (up to a maximum of ± .20% of the Fund's average net assets over a 36 month performance period). The upward or downward adjustment to the management fee is based on the relative investment performance of Large Cap Growth as compared to an appropriate benchmark index. For the period, the total annual management fee rate, including the performance adjustment, was .48% of the Fund's average net assets.
Distribution and Service Plan Fees. In accordance with Rule 12b-1 of the 1940 Act, the Fund has adopted separate Distribution and Service Plans for each class of shares. Certain classes pay Fidelity Distributors Corporation (FDC), an affiliate of FMR, separate Distribution and Service Fees, each of which is based on an annual percentage of each class' average net assets. In addition, FDC may pay financial intermediaries for selling shares of the Fund and providing shareholder support services. For the period, the Distribution and Service Fee rates, total fees and amounts retained by FDC were as follows:
| Distribution | Service | Total Fees | Retained |
Class A | -% | .25% | $ 23,137 | $ 1,159 |
Class T | .25% | .25% | 32,142 | 74 |
Class B | .75% | .25% | 18,858 | 14,160 |
Class C | .75% | .25% | 54,492 | 18,363 |
|
|
| $ 128,629 | $ 33,756 |
Sales Load. FDC may receive a front-end sales charge of up to 5.75% for selling Class A shares and 3.50% for selling Class T shares, some of which is paid to financial intermediaries for selling shares of the Fund. Depending on the holding period, FDC may receive contingent deferred sales charges levied on Class A, Class T, Class B, and Class C redemptions. The deferred sales charges range from 5.00% to 1.00% for Class B, 1.00% for Class C, 1.00% for certain purchases of Class A shares and .25% for certain purchases of Class T shares.
Annual Report
Notes to Financial Statements - continued
6. Fees and Other Transactions with Affiliates - continued
Sales Load - continued
For the period, sales charge amounts retained by FDC were as follows:
| Retained |
Class A | $ 18,472 |
Class T | 4,858 |
Class B* | 4,504 |
Class C* | 1,771 |
| $ 29,605 |
* When Class B and Class C shares are initially sold, FDC pays commissions from its own resources to financial intermediaries through which the sales are made.
Transfer Agent Fees. Fidelity Investments Institutional Operations Company, Inc. (FIIOC), an affiliate of FMR, is the transfer, dividend disbursing and shareholder servicing agent for each class of the Fund. FIIOC receives account fees and asset-based fees that vary according to the account size and type of account of the shareholders of the respective classes of the Fund. FIIOC pays for typesetting, printing and mailing of shareholder reports, except proxy statements. For the period, transfer agent fees for each class were as follows:
| Amount | % of |
Class A | $ 27,845 | .30 |
Class T | 21,166 | .33 |
Class B | 5,704 | .30 |
Class C | 16,244 | .30 |
Large Cap Growth | 329,390 | .26 |
Institutional Class | 2,527 | .21 |
| $ 402,876 |
|
Accounting and Security Lending Fees. Fidelity Service Company, Inc. (FSC), an affiliate of FMR, maintains the Fund's accounting records. The accounting fee is based on the level of average net assets for each month. Under a separate contract, FSC administers the security lending program. The security lending fee is based on the number and duration of lending transactions.
Brokerage Commissions. The Fund placed a portion of its portfolio transactions with brokerage firms which are affiliates of the investment adviser. The commissions paid to these affiliated firms were $3,944 for the period.
Annual Report
7. Committed Line of Credit.
The Fund participates with other funds managed by FMR or an affiliate in a $4.0 billion credit facility (the "line of credit") to be utilized for temporary or emergency purposes to fund shareholder redemptions or for other short-term liquidity purposes. The Fund has agreed to pay commitment fees on its pro-rata portion of the line of credit, which amounted to $441 and is reflected in Miscellaneous expenses on the Statement of Operations. During the period, there were no borrowings on this line of credit.
8. Security Lending.
The Fund lends portfolio securities through a lending agent from time to time in order to earn additional income. For equity securities, a lending agent is used and may loan securities to certain qualified borrowers, including Fidelity Capital Markets (FCM), a broker-dealer affiliated with the Fund. On the settlement date of the loan, the Fund receives collateral (in the form of U.S. Treasury obligations, letters of credit and/or cash) against the loaned securities and maintains collateral in an amount not less than 100% of the market value of the loaned securities during the period of the loan. The market value of the loaned securities is determined at the close of business of the Fund and any additional required collateral is delivered to the Fund on the next business day. If the borrower defaults on its obligation to return the securities loaned because of insolvency or other reasons, a fund could experience delays and costs in recovering the securities loaned or in gaining access to the collateral. Any cash collateral received is invested in the Fidelity Securities Lending Cash Central Fund. The value of loaned securities and cash collateral at period end are disclosed on the Fund's Statement of Assets and Liabilities. Security lending income represents the income earned on investing cash collateral, less rebates paid to borrowers and any lending agent fees associated with the loan, plus any premium payments received for lending certain types of securities. Security lending income is presented in the Statement of Operations as a component of income from Fidelity Central Funds. During the period, there were no securities loaned to FCM.
9. Expense Reductions.
Many of the brokers with whom FMR places trades on behalf of the Fund provided services to the Fund in addition to trade execution. These services included payments of certain expenses on behalf of the Fund totaling $8,950 for the period.
Annual Report
Notes to Financial Statements - continued
10. Share Transactions.
Transactions for each class of shares were as follows:
| Shares | Dollars | ||
Years ended January 31, | 2012 | 2011 | 2012 | 2011 |
Class A |
|
|
|
|
Shares sold | 943,999 | 361,056 | $ 9,391,213 | $ 3,185,180 |
Shares redeemed | (378,889) | (181,389) | (3,682,555) | (1,535,053) |
Net increase (decrease) | 565,110 | 179,667 | $ 5,708,658 | $ 1,650,127 |
Class T |
|
|
|
|
Shares sold | 899,142 | 140,930 | $ 9,125,430 | $ 1,207,937 |
Shares redeemed | (616,824) | (47,579) | (6,053,114) | (408,587) |
Net increase (decrease) | 282,318 | 93,351 | $ 3,072,316 | $ 799,350 |
Class B |
|
|
|
|
Shares sold | 19,634 | 79,473 | $ 195,465 | $ 702,050 |
Shares redeemed | (80,066) | (51,655) | (776,888) | (431,055) |
Net increase (decrease) | (60,432) | 27,818 | $ (581,423) | $ 270,995 |
Class C |
|
|
|
|
Shares sold | 689,847 | 213,157 | $ 6,821,638 | $ 1,855,577 |
Shares redeemed | (456,431) | (91,191) | (4,462,829) | (750,591) |
Net increase (decrease) | 233,416 | 121,966 | $ 2,358,809 | $ 1,104,986 |
Large Cap Growth |
|
|
|
|
Shares sold | 6,389,996 | 4,390,498 | $ 64,463,259 | $ 38,539,310 |
Shares redeemed | (5,795,048) | (4,808,945) | (58,191,405) | (40,933,269) |
Net increase (decrease) | 594,948 | (418,447) | $ 6,271,854 | $ (2,393,959) |
Institutional Class |
|
|
|
|
Shares sold | 185,823 | 46,417 | $ 1,915,796 | $ 398,963 |
Shares redeemed | (125,753) | (11,923) | (1,180,630) | (97,082) |
Net increase (decrease) | 60,070 | 34,494 | $ 735,166 | $ 301,881 |
11. Other.
The Fund's organizational documents provide former and current trustees and officers with a limited indemnification against liabilities arising in connection with the performance of their duties to the Fund. In the normal course of business, the Fund may also enter into contracts that provide general indemnifications. The Fund's maximum exposure under these arrangements is unknown as this would be dependent on future claims that may be made against the Fund. The risk of material loss from such claims is considered remote.
Annual Report
Report of Independent Registered Public Accounting Firm
To the Trustees of Fidelity Devonshire Trust and the Shareholders of Fidelity Large Cap Growth Fund:
In our opinion, the accompanying statement of assets and liabilities, including the schedule of investments, and the related statements of operations and of changes in net assets and the financial highlights present fairly, in all material respects, the financial position of Fidelity Large Cap Growth Fund (a fund of Fidelity Devonshire Trust) at January 31, 2012, the results of its operations for the year then ended, the changes in its net assets for each of the two years in the period then ended and the financial highlights for each of the periods indicated, in conformity with accounting principles generally accepted in the United States of America. These financial statements and financial highlights (hereafter referred to as "financial statements") are the responsibility of the Fidelity Large Cap Growth Fund's management. Our responsibility is to express an opinion on these financial statements based on our audits. We conducted our audits of these financial statements in accordance with the standards of the Public Company Accounting Oversight Board (United States). Those standards require that we plan and perform the audit to obtain reasonable assurance about whether the financial statements are free of material misstatement. An audit includes examining, on a test basis, evidence supporting the amounts and disclosures in the financial statements, assessing the accounting principles used and significant estimates made by management, and evaluating the overall financial statement presentation. We believe that our audits, which included confirmation of securities at January 31, 2012 by correspondence with the custodian and brokers, provide a reasonable basis for our opinion.
/s/ PricewaterhouseCoopers LLP
PricewaterhouseCoopers LLP
Boston, Massachusetts
March 13, 2012
Annual Report
Trustees and Officers
The Trustees, Members of the Advisory Board, and executive officers of the trust and fund, as applicable, are listed below. The Board of Trustees governs the fund and is responsible for protecting the interests of shareholders. The Trustees are experienced executives who meet periodically throughout the year to oversee the fund's activities, review contractual arrangements with companies that provide services to the fund, oversee management of the risks associated with such activities and contractual arrangements, and review the fund's performance. Except for James C. Curvey, each of the Trustees oversees 226 funds advised by FMR or an affiliate. Mr. Curvey oversees 430 funds advised by FMR or an affiliate.
The Trustees hold office without limit in time except that (a) any Trustee may resign; (b) any Trustee may be removed by written instrument, signed by at least two-thirds of the number of Trustees prior to such removal; (c) any Trustee who requests to be retired or who has become incapacitated by illness or injury may be retired by written instrument signed by a majority of the other Trustees; and (d) any Trustee may be removed at any special meeting of shareholders by a two-thirds vote of the outstanding voting securities of the trust. Each Trustee who is not an interested person (as defined in the 1940 Act) (Independent Trustee), shall retire not later than the last day of the calendar year in which his or her 75th birthday occurs. The Independent Trustees may waive this mandatory retirement age policy with respect to individual Trustees. The executive officers and Advisory Board Members hold office without limit in time, except that any officer and Advisory Board Member may resign or may be removed by a vote of a majority of the Trustees at any regular meeting or any special meeting of the Trustees. Except as indicated, each individual has held the office shown or other offices in the same company for the past five years.
Experience, Skills, Attributes, and Qualifications of the Fund's Trustees. The Governance and Nominating Committee has adopted a statement of policy that describes the experience, qualifications, attributes, and skills that are necessary and desirable for potential Independent Trustee candidates (Statement of Policy). The Board believes that each Trustee satisfied at the time he or she was initially elected or appointed a Trustee, and continues to satisfy, the standards contemplated by the Statement of Policy. The Governance and Nominating Committee also engages professional search firms to help identify potential Independent Trustee candidates who have the experience, qualifications, attributes, and skills consistent with the Statement of Policy. From time to time, additional criteria based on the composition and skills of the current Independent Trustees, as well as experience or skills that may be appropriate in light of future changes to board composition, business conditions, and regulatory or other developments, have also been considered by the professional search firms and the Governance and Nominating Committee. In addition, the Board takes into account the Trustees' commitment and participation in Board and committee meetings, as well as their leadership of standing and ad hoc committees throughout their tenure.
In determining that a particular Trustee was and continues to be qualified to serve as a Trustee, the Board has considered a variety of criteria, none of which, in isolation, was controlling. The Board believes that, collectively, the Trustees have balanced and diverse experience, qualifications, attributes, and skills, which allow the Board to operate effectively in governing the fund and protecting the interests of shareholders. Information about the specific experience, skills, attributes, and qualifications of each Trustee, which in each case led to the Board's conclusion that the Trustee should serve (or continue to serve) as a trustee of the fund, is provided below.
Annual Report
Trustees and Officers - continued
Board Structure and Oversight Function. James C. Curvey is an interested person (as defined in the 1940 Act) and currently serves as Acting Chairman. The Trustees have determined that an interested Chairman is appropriate and benefits shareholders because an interested Chairman has a personal and professional stake in the quality and continuity of services provided to the fund. Independent Trustees exercise their informed business judgment to appoint an individual of their choosing to serve as Chairman, regardless of whether the Trustee happens to be independent or a member of management. The Independent Trustees have determined that they can act independently and effectively without having an Independent Trustee serve as Chairman and that a key structural component for assuring that they are in a position to do so is for the Independent Trustees to constitute a substantial majority for the Board. The Independent Trustees also regularly meet in executive session. Ned C. Lautenbach serves as Chairman of the Independent Trustees and as such (i) acts as a liaison between the Independent Trustees and management with respect to matters important to the Independent Trustees and (ii) with management prepares agendas for Board meetings.
Fidelity funds are overseen by different Boards of Trustees. The fund's Board oversees Fidelity's equity and high income funds and another Board oversees Fidelity's investment-grade bond, money market, and asset allocation funds. The asset allocation funds may invest in Fidelity funds overseen by the fund's Board. The use of separate Boards, each with its own committee structure, allows the Trustees of each group of Fidelity funds to focus on the unique issues of the funds they oversee, including common research, investment, and operational issues. On occasion, the separate Boards establish joint committees to address issues of overlapping consequences for the Fidelity funds overseen by each Board.
The Trustees operate using a system of committees to facilitate the timely and efficient consideration of all matters of importance to the Trustees, the fund, and fund shareholders and to facilitate compliance with legal and regulatory requirements and oversight of the fund's activities and associated risks. The Board, acting through its committees, has charged FMR and its affiliates with (i) identifying events or circumstances the occurrence of which could have demonstrably adverse effects on the fund's business and/or reputation; (ii) implementing processes and controls to lessen the possibility that such events or circumstances occur or to mitigate the effects of such events or circumstances if they do occur; and (iii) creating and maintaining a system designed to evaluate continuously business and market conditions in order to facilitate the identification and implementation processes described in (i) and (ii) above. Because the day-to-day operations and activities of the fund are carried out by or through FMR, its affiliates and other service providers, the fund's exposure to risks is mitigated but not eliminated by the processes overseen by the Trustees. While each of the Board's committees has responsibility for overseeing different aspects of the fund's activities, oversight is exercised primarily through the Operations, Audit, and Compliance Committees. In addition, the Independent Trustees have worked with FMR to enhance the Board's oversight of investment and financial risks, legal and regulatory risks, technology risks, and operational risks, including the development of additional risk reporting to the Board. For example, a working group comprised of Independent Trustees and FMR has worked and continues to work to review the Fidelity funds' valuation-related activities, reporting and risk management. Appropriate personnel, including but not limited to the fund's Chief Compliance Officer (CCO), FMR's internal auditor, the independent accountants, the fund's Treasurer and portfolio management personnel, make periodic reports to the Board's committees, as appropriate, including an annual review of FMR's risk management program for the Fidelity funds. The responsibilities of each standing committee, including their oversight responsibilities, are described further under "Standing Committees of the Fund's Trustees."
Annual Report
The fund's Statement of Additional Information (SAI) includes more information about the Trustees. To request a free copy, call Fidelity at 1-877-208-0098.
Interested Trustees*:
Correspondence intended for each Trustee who is an interested person may be sent to Fidelity Investments, 82 Devonshire Street, Boston, Massachusetts 02109.
Name, Age; Principal Occupations and Other Relevant Experience+ | |
James C. Curvey (76) | |
| Year of Election or Appointment: 2007 Mr. Curvey is Trustee and Acting Chairman of the Board of Trustees of certain Trusts. Mr. Curvey also serves as Trustee (2007-present) of other investment companies advised by FMR. Mr. Curvey is a Director of Fidelity Investments Money Management, Inc. (2009-present), Director of Fidelity Research & Analysis Co. (2009-present) and Director of FMR and FMR Co., Inc. (2007-present). Mr. Curvey is also Vice Chairman (2007-present) and Director of FMR LLC. In addition, Mr. Curvey serves as an Overseer for the Boston Symphony Orchestra and a member of the Trustees of Villanova University. Previously, Mr. Curvey was the Vice Chairman (2006-2007) and Director (2000-2007) of FMR Corp. |
Ronald P. O'Hanley (54) | |
| Year of Election or Appointment: 2011 Mr. O'Hanley is Director of FMR Co., Inc. (2010-present), Director of Fidelity Investments Money Management, Inc. (2010-present), Director of Fidelity Research & Analysis Company (2010-present), President of Fidelity Asset Management and Corporate Services and a member of Fidelity's Executive Committee (2010-present). Previously, Mr. O'Hanley served as President and Chief Executive Officer of BNY Mellon Asset Management (2007-2010). Mr. O'Hanley also served as Vice Chairman of Bank New York Mellon Corp. and a member of that firm's Executive Committee. Prior to the 2007 merger of The Bank of New York and Mellon Financial Corporation, he was Vice Chairman of Mellon Financial Corporation and President and Chief Executive Officer of Mellon Asset Management. He joined Mellon in February 1997. Mr. O'Hanley currently serves as Chairman of the Boston Public Library Foundation Board of Directors and sits on the Board of Directors of Beth Israel Deaconess Medical Center, the Board of Trustees of the Marine Biological Laboratory and the Advisory Board of the Maxwell School of Citizenship and Public Administration at Syracuse University. Mr. O'Hanley also chairs the Council on Asset Management for the Financial Services Roundtable and is a member of the Board of Directors of Institutional Investor's U.S. Institute. |
* Trustees have been determined to be "Interested Trustees" by virtue of, among other things, their affiliation with the trust or various entities under common control with FMR.
+ The information above includes each Trustee's principal occupation during the last five years and other information relating to the experience, attributes, and skills relevant to each Trustee's qualifications to serve as a Trustee, which led to the conclusion that each Trustee should serve as a Trustee for the fund.
Annual Report
Independent Trustees:
Correspondence intended for each Independent Trustee (that is, the Trustees other than the Interested Trustees) may be sent to Fidelity Investments, P.O. Box 55235, Boston, Massachusetts 02205-5235.
Name, Age; Principal Occupations and Other Relevant Experience+ | |
Dennis J. Dirks (63) | |
| Year of Election or Appointment: 2005 Prior to his retirement in May 2003, Mr. Dirks was Chief Operating Officer and a member of the Board of The Depository Trust & Clearing Corporation (DTCC). He also served as President, Chief Operating Officer, and Board member of The Depository Trust Company (DTC) and President and Board member of the National Securities Clearing Corporation (NSCC). In addition, Mr. Dirks served as Chief Executive Officer and Board member of the Government Securities Clearing Corporation, Chief Executive Officer and Board member of the Mortgage-Backed Securities Clearing Corporation, as a Trustee and a member of the Finance Committee of Manhattan College (2005-2008), and as a Trustee and a member of the Finance Committee of AHRC of Nassau County (2006-2008). Mr. Dirks is a member of the Independent Directors Council (IDC) Governing Council (2010-present) and Board of Directors for The Brookville Center for Children's Services, Inc. (2009-present). |
Alan J. Lacy (58) | |
| Year of Election or Appointment: 2008 Mr. Lacy serves as a Senior Adviser (2007-present) of Oak Hill Capital Partners, L.P. (private equity). Mr. Lacy also served as Chief Executive Officer (2000-2005) and Vice Chairman (2005-2006) of Sears Holdings Corporation and Sears, Roebuck and Co. (retail). In addition, Mr. Lacy serves as a member of the Board of Directors of Dave & Buster's, Inc. (restaurant and entertainment complexes, 2010-present), The Hillman Companies, Inc. (hardware wholesalers, 2010-present), and Bristol-Myers Squibb Company (global pharmaceuticals, 2007-present). Mr. Lacy is a member of the Board of Trustees of The National Parks Conservation Association (2006-present). Previously, Mr. Lacy served as Chairman of the Board of Trustees of the National Parks Conservation Association (2008-2011) and as a member of the Board of Directors for the Western Union Company (global money transfer, 2006-2011). |
Ned C. Lautenbach (67) | |
| Year of Election or Appointment: 2000 Mr. Lautenbach is Chairman of the Independent Trustees of the Equity and High Income Funds (2006-present). Mr. Lautenbach currently serves as the Lead Director of the Eaton Corporation Board of Directors (diversified industrial, 1997-present). Mr. Lautenbach is also a member of the Board of Directors of the Philharmonic Center for the Arts in Naples, Florida (1999-present); a member of the Board of Trustees of Fairfield University (2005-present); and a member of the Council on Foreign Relations (1994-present). Previously, Mr. Lautenbach was a Partner/Advisory Partner at Clayton, Dubilier & Rice, LLC (private equity investment, 1998-2010), as well as a Director of Sony Corporation (2006-2007). |
Joseph Mauriello (67) | |
| Year of Election or Appointment: 2008 Prior to his retirement in January 2006, Mr. Mauriello served in numerous senior management positions including Deputy Chairman and Chief Operating Officer (2004-2005), and Vice Chairman of Financial Services (2002-2004) of KPMG LLP US (professional services, 1965-2005). Mr. Mauriello currently serves as a member of the Board of Directors of XL Group plc. (global insurance and re-insurance, 2006-present) and of Arcadia Resources Inc. (health care services and products, 2007-present). Previously, Mr. Mauriello served as a Director of the Hamilton Funds of the Bank of New York (2006-2007). |
Robert W. Selander (61) | |
| Year of Election or Appointment: 2011 Previously, Mr. Selander served as a Member of the Advisory Board of Fidelity's Equity and High Income Funds (2011), Executive Vice Chairman (2010), Chief Executive Officer (2009-2010), and President and Chief Executive Officer (1997-2009) of Mastercard, Inc. |
Cornelia M. Small (67) | |
| Year of Election or Appointment: 2005 Ms. Small is a member of the Board of Directors of the Teagle Foundation (2009-present). Ms. Small is also a member of the Investment Committee, and Chair (2008-present) and a member of the Board of Trustees of Smith College. In addition, Ms. Small serves on the Investment Committee of the Berkshire Taconic Community Foundation (2008-present). Previously, Ms. Small served as Chairperson of the Investment Committee (2002-2008) of Smith College. In addition, Ms. Small served as Chief Investment Officer, Director of Global Equity Investments, and a member of the Board of Directors of Scudder, Stevens & Clark and Scudder Kemper Investments. |
William S. Stavropoulos (72) | |
| Year of Election or Appointment: 2002 Mr. Stavropoulos is Vice Chairman of the Independent Trustees of the Equity and High Income Funds (2006-present). Mr. Stavropoulos serves as President and Founder of the Michigan Baseball Foundation, the Great Lakes Loons (2007-present). Mr. Stavropoulos is Chairman Emeritus of the Board of Directors of The Dow Chemical Company, where he previously served in numerous senior management positions, including President, CEO (1995-2000; 2002-2004), Chairman of the Executive Committee (2000-2006), and as a member of the Board of Directors (1990-2006). Currently, Mr. Stavropoulos is Chairman of Univar (global distributor of commodity and specialty chemicals, 2010-present), a Director of Teradata Corporation (data warehousing and technology solutions, 2008-present), Chemical Financial Corporation, Maersk Inc. (industrial conglomerate), Tyco International, Inc. (multinational manufacturing and services, 2007-present), and a member of the Advisory Board for Metalmark Capital (private equity investment, 2005-present). Mr. Stavropoulos is a special advisor to Clayton, Dubilier & Rice, LLC (private equity investment). In addition, Mr. Stavropoulos is a member of the University of Notre Dame Advisory Council for the College of Science. |
David M. Thomas (62) | |
| Year of Election or Appointment: 2008 Previously, Mr. Thomas served as Executive Chairman (2005-2006) and Chairman and Chief Executive Officer (2000-2005) of IMS Health, Inc. (pharmaceutical and healthcare information solutions). In addition, Mr. Thomas serves as a member of the Board of Directors of Fortune Brands, Inc. (consumer products), and Interpublic Group of Companies, Inc. (marketing communication, 2004-present). |
Michael E. Wiley (61) | |
| Year of Election or Appointment: 2008 Mr. Wiley also serves as a Director of Asia Pacific Exploration Consolidated (international oil and gas exploration and production, 2008-present). Mr. Wiley serves as a Director of Tesoro Corporation (independent oil refiner and marketer, 2005-present), and a Director of Bill Barrett Corporation (exploration and production, 2005-present). In addition, Mr. Wiley also serves as a Director of Post Oak Bank (privately-held bank, 2004-present). Previously, Mr. Wiley served as a member of the Board of Trustees of the University of Tulsa (2000-2006; 2007-2010), as a Senior Energy Advisor of Katzenbach Partners, LLC (consulting, 2006-2007), as an Advisory Director of Riverstone Holdings (private investment), Chairman, President, and CEO of Baker Hughes, Inc. (oilfield services, 2000-2004), and as Director of Spinnaker Exploration Company (exploration and production, 2001-2005). |
Annual Report
Trustees and Officers - continued
+ The information above includes each Trustee's principal occupation during the last five years and other information relating to the experience, attributes, and skills relevant to each Trustee's qualifications to serve as a Trustee, which led to the conclusion that each Trustee should serve as a Trustee for the fund.
Advisory Board Members and Executive Officers:
Correspondence intended for each executive officer, Edward C. Johnson 3d, and Peter S. Lynch may be sent to Fidelity Investments, 82 Devonshire Street, Boston, Massachusetts 02109.
Name, Age; Principal Occupation | |
Edward C. Johnson 3d (81) | |
| Year of Election or Appointment: 2011 Member of the Advisory Board of Fidelity's Equity and High Income Funds. Mr. Johnson serves as Chief Executive Officer, Chairman, and a Director of FMR LLC, and also serves as Chairman and Director of FIL Limited. Previously, Mr. Johnson served as a Trustee and Chairman of the Board of certain Fidelity Trusts, Chairman and a Director of FMR, Chairman and a Director of FMR Co., Inc., and President of FMR LLC (2006-2007). |
Peter S. Lynch (68) | |
| Year of Election or Appointment: 2003 Member of the Advisory Board of Fidelity's Equity and High Income Funds. Mr. Lynch is Vice Chairman and a Director of FMR and FMR Co., Inc. In addition, Mr. Lynch serves as a Trustee of Boston College and as the Chairman of the Inner-City Scholarship Fund. Previously, Mr. Lynch served on the Special Olympics International Board of Directors (1997-2006). |
Kenneth B. Robins (42) | |
| Year of Election or Appointment: 2008 President and Treasurer of Fidelity's Equity and High Income Funds. Mr. Robins also serves as President and Treasurer (2010-present) and Assistant Treasurer (2009-present) of other Fidelity funds and is an employee of Fidelity Investments (2004-present). Previously, Mr. Robins served as Deputy Treasurer of the Fidelity funds (2005-2008) and Treasurer and Chief Financial Officer of The North Carolina Capital Management Trust: Cash and Term Portfolios (2006-2008). |
Bruce T. Herring (46) | |
| Year of Election or Appointment: 2006 Vice President of certain Equity Funds. Mr. Herring also serves as President of Fidelity Research & Analysis Company (2010-present), Chief Investment Officer and Director of Fidelity Management & Research (U.K.) Inc. (2010-present) and Group Chief Investment Officer of FMR. Previously, Mr. Herring served as Vice President (2005-2006) and Senior Vice President (2006-2007) of Fidelity Management & Research Company, Vice President of FMR Co., Inc. (2001-2007) and as a portfolio manager for Fidelity U.S. Equity Funds. |
Brian B. Hogan (47) | |
| Year of Election or Appointment: 2009 Vice President of Equity and High Income Funds. Mr. Hogan also serves as President of FMR's Equity Division (2009-present). Previously, Mr. Hogan served as Senior Vice President, Equity Research of FMR (2006-2009) and as a portfolio manager. |
Scott C. Goebel (44) | |
| Year of Election or Appointment: 2008 Secretary and Chief Legal Officer (CLO) of the Fidelity funds. Mr. Goebel also serves as Secretary of Fidelity Investments Money Management, Inc. (FIMM) (2010-present) and Fidelity Research and Analysis Company (FRAC) (2010-present); Secretary and CLO of The North Carolina Capital Management Trust: Cash and Term Portfolios (2008-present); General Counsel, Secretary, and Senior Vice President of FMR (2008-present) and FMR Co., Inc. (2008-present); employed by FMR LLC or an affiliate (2001-present); Chief Legal Officer of Fidelity Management & Research (Hong Kong) Limited (2008-present) and Assistant Secretary of Fidelity Management & Research (Japan) Inc. (2008-present), and Fidelity Management & Research (U.K.) Inc. (2008-present). Previously, Mr. Goebel served as Assistant Secretary of FIMM (2008-2010), FRAC (2008-2010), and the Funds (2007-2008) and as Vice President and Secretary of Fidelity Distributors Corporation (FDC) (2005-2007). |
William C. Coffey (42) | |
| Year of Election or Appointment: 2009 Assistant Secretary of Fidelity's Equity and High Income Funds. Mr. Coffey also serves as Senior Vice President and Deputy General Counsel of FMR LLC (2010-present), and is an employee of Fidelity Investments. Previously, Mr. Coffey served as Vice President and Associate General Counsel of FMR LLC (2005-2009). |
Holly C. Laurent (57) | |
| Year of Election or Appointment: 2008 Anti-Money Laundering (AML) Officer of the Fidelity funds. Ms. Laurent also serves as AML Officer of The North Carolina Capital Management Trust: Cash and Term Portfolios (2008-present) and is an employee of Fidelity Investments. Previously, Ms. Laurent was Senior Vice President and Head of Legal for Fidelity Business Services India Pvt. Ltd. (2006-2008), and Senior Vice President, Deputy General Counsel and Group Head for FMR LLC (2005-2006). |
Christine Reynolds (53) | |
| Year of Election or Appointment: 2008 Chief Financial Officer of the Fidelity funds. Ms. Reynolds became President of Fidelity Pricing and Cash Management Services (FPCMS) in August 2008. Ms. Reynolds served as Chief Operating Officer of FPCMS (2007-2008). Previously, Ms. Reynolds served as President, Treasurer, and Anti-Money Laundering officer of the Fidelity funds (2004-2007). |
Kenneth A. Rathgeber (64) | |
| Year of Election or Appointment: 2004 Chief Compliance Officer of Fidelity's Equity and High Income Funds. Mr. Rathgeber is Chief Compliance Officer of Fidelity Management & Research (Hong Kong) Limited (2008-present), Fidelity Management & Research (Japan) Inc. (2008-present), FMR (2005-present), FMR Co., Inc. (2005-present), Fidelity Management & Research (U.K.) Inc. (2005-present), Fidelity Research & Analysis Company (2005-present), Fidelity Investments Money Management, Inc. (2005-present), Pyramis Global Advisors, LLC (2005-present), and Strategic Advisers, Inc. (2005-present). |
Joseph F. Zambello (54) | |
| Year of Election or Appointment: 2011 Deputy Treasurer of the Fidelity funds. Mr. Zambello is an employee of Fidelity Investments. Previously, Mr. Zambello served as Vice President of FMR's Program Management Group (2009-2011) and Vice President of the Transfer Agent Oversight Group (2005-2009). |
Adrien E. Deberghes (44) | |
| Year of Election or Appointment: 2008 Deputy Treasurer of Fidelity's Equity and High Income Funds. Mr. Deberghes also serves as Vice President and Assistant Treasurer of Fidelity Rutland Square Trust II and Fidelity Commonwealth Trust II (2011-present), Assistant Treasurer of other Fidelity funds (2010-present), and is an employee of Fidelity Investments (2008-present). Previously, Mr. Deberghes served as Senior Vice President of Mutual Fund Administration at State Street Corporation (2007-2008), Senior Director of Mutual Fund Administration at Investors Bank & Trust (2005-2007), and Director of Finance for Dunkin' Brands (2000-2005). |
Stephanie J. Dorsey (42) | |
| Year of Election or Appointment: 2010 Assistant Treasurer of Fidelity's Equity and High Income Funds. Ms. Dorsey also serves as Deputy Treasurer of other Fidelity funds (2008-present) and is an employee of Fidelity Investments (2008-present). Previously, Ms. Dorsey served as Treasurer (2004-2008) of the JPMorgan Mutual Funds and Vice President (2004-2008) of JPMorgan Chase Bank. |
John R. Hebble (53) | |
| Year of Election or Appointment: 2009 Assistant Treasurer of Fidelity's Equity and High Income Funds. Mr. Hebble also serves as President (2011-present), Treasurer, and Chief Financial Officer of The North Carolina Capital Management Trust: Cash and Term Portfolios (2008-present), President and Treasurer of other Fidelity funds (2008-present) and is an employee of Fidelity Investments. |
Gary W. Ryan (53) | |
| Year of Election or Appointment: 2005 Assistant Treasurer of the Fidelity funds. Mr. Ryan is an employee of Fidelity Investments. Previously, Mr. Ryan served as Vice President of Fund Reporting in Fidelity Pricing and Cash Management Services (FPCMS) (1999-2005). |
Jonathan Davis (43) | |
| Year of Election or Appointment: 2010 Assistant Treasurer of the Fidelity funds. Mr. Davis is also Assistant Treasurer of Fidelity Rutland Square Trust II and Fidelity Commonwealth Trust II. Mr. Davis is an employee of Fidelity Investments. Previously, Mr. Davis served as Vice President and Associate General Counsel of FMR LLC (2003-2010). |
Annual Report
Investment Adviser
Fidelity Management & Research Company
Boston, MA
Investment Sub-Advisers
FMR Co., Inc.
Fidelity Management & Research
(U.K.) Inc.
Fidelity Management & Research
(Hong Kong) Limited
Fidelity Management & Research
(Japan) Inc.
General Distributor
Fidelity Distributors Corporation
Boston, MA
Transfer and Service Agents
Fidelity Investments Institutional Operations Company, Inc.
Boston, MA
Fidelity Service Company, Inc.
Boston, MA
Custodian
Citibank, N.A.
New York, NY
ALCGI-UANN-0312
1.900735.102
(Fidelity Investment logo)(registered trademark)
Fidelity®
Mid Cap Growth
Fund
Annual Report
January 31, 2012
(Fidelity Cover Art)
Contents
Chairman's Message | The Chairman's message to shareholders. | |
Performance | How the fund has done over time. | |
Management's Discussion of Fund Performance | The Portfolio Manager's review of fund performance and strategy. | |
Shareholder Expense Example | An example of shareholder expenses. | |
Investment Changes | A summary of major shifts in the fund's investments over the past six months. | |
Investments | A complete list of the fund's investments with their market values. | |
Financial Statements | Statements of assets and liabilities, operations, and changes in net assets, as well as financial highlights. | |
Notes | Notes to the financial statements. | |
Report of Independent Registered Public Accounting Firm |
| |
Trustees and Officers |
|
To view a fund's proxy voting guidelines and proxy voting record for the 12-month period ended June 30, visit http://www.fidelity.com/proxyvotingresults or visit the Securities and Exchange Commission's (SEC) web site at http://www.sec.gov. You may also call 1-800-544-8544 to request a free copy of the proxy voting guidelines.
Standard & Poor's, S&P and S&P 500 are registered service marks of The McGraw-Hill Companies, Inc. and have been licensed for use by Fidelity Distributors Corporation.
Other third party marks appearing herein are the property of their respective owners.
All other marks appearing herein are registered or unregistered trademarks or service marks of FMR LLC or an affiliated company.
Annual Report
This report and the financial statements contained herein are submitted for the general information of the shareholders of the fund. This report is not authorized for distribution to prospective investors in the fund unless preceded or accompanied by an effective prospectus.
A fund files its complete schedule of portfolio holdings with the SEC for the first and third quarters of each fiscal year on Form N-Q. Forms N-Q are available on the SEC's web site at http://www.sec.gov. A fund's Forms N-Q may be reviewed and copied at the SEC's Public Reference Room in Washington, DC. Information regarding the operation of the SEC's Public Reference Room may be obtained by calling 1-800-SEC-0330. For a complete list of a fund's portfolio holdings, view the most recent holdings listing, semiannual report, or annual report on Fidelity's web site at http://www.fidelity.com, http://www.advisor.fidelity.com, or http://www.401k.com, as applicable.
NOT FDIC INSURED • MAY LOSE VALUE • NO BANK GUARANTEE
Neither the fund nor Fidelity Distributors Corporation is a bank.
Annual Report
Chairman's Message
(photo_of_James_C_Curvey)
Dear Shareholder:
Following a year marked by unusually high volatility, 2012 began with most major asset classes advancing steadily in January. For U.S. equities, it was the strongest start to a new year since 1997. International stocks fared even better, despite continued uncertainty related to the sovereign debt crisis in Europe. Investors have been acutely sensitive to the latest news, for better or worse, coming out of the eurozone and its impact on financial markets. As we look ahead, the unresolved debt crisis in Europe remains at the center of a series of risk factors, summarized below, that we believe have the greatest potential to influence the global investment landscape.
Deleveraging and the economy
In the euro-currency area, fiscal austerity among nations and debt deleveraging among financial companies loaded with sovereign debt are deflationary measures and serve to hinder economic growth in the short term. Such an economic and financial-market scenario has not been historically supportive of strong performance among riskier assets, and emerges at a time when many nations need a resurgent economy to assist them in closing their budget deficits and in building confidence among bond buyers to help them refinance their existing debt obligations.
Slowdown in China and Europe
China's economy is the second-largest in the world, and it has been the biggest contributor to global growth since the end of the last recession. Thus, the slower pace of domestic growth in China has led to lower demand for imports of commodities and other construction materials from the rest of the world. In addition, economic weakness in Europe and the broad-based global economic slowdown are putting pressure on China's export growth, which has been largely responsible for its breakneck pace of annual gross domestic product (GDP) growth during the past three decades.
Credit deterioration and contagion
The heightened macroeconomic risk and elevated credit risk swirling around certain European nations and financial institutions have caused many market participants to avoid purchases of or reduce exposure to short-term debt offerings by these issuers. With increased credit risk, there are growing concerns about the potential credit contraction and contagion from European issuers spreading to other financial markets.
We invite you to learn more by visiting us on the Internet or calling us by phone. It is our privilege to provide the resources you need to choose investments that are right for you.
Sincerely,
(The acting chairman's signature appears here.)
James C. Curvey
Acting Chairman
Annual Report
Performance: The Bottom Line
Average annual total return reflects the change in the value of an investment, assuming reinvestment of the class' distributions from dividend income and capital gains (the profits earned upon the sale of securities that have grown in value, if any) and assuming a constant rate of performance each year. The $10,000 table and the fund's returns do not reflect the deduction of taxes that a shareholder would pay on fund distributions or the redemption of fund shares. During periods of reimbursement by Fidelity, a fund's total return will be greater than it would be had the reimbursement not occurred. How a fund did yesterday is no guarantee of how it will do tomorrow.
Average Annual Total Returns
Periods ended January 31, 2012 | Past 1 | Past 5 | Past 10 |
Fidelity® Mid Cap Growth Fund | -1.82% | -1.52% | 3.18% |
$10,000 Over 10 Years
Let's say hypothetically that $10,000 was invested in Fidelity® Mid Cap Growth Fund, a class of the fund, on January 31, 2002. The chart shows how the value of your investment would have changed, and also shows how the Russell Midcap® Growth Index performed over the same period.
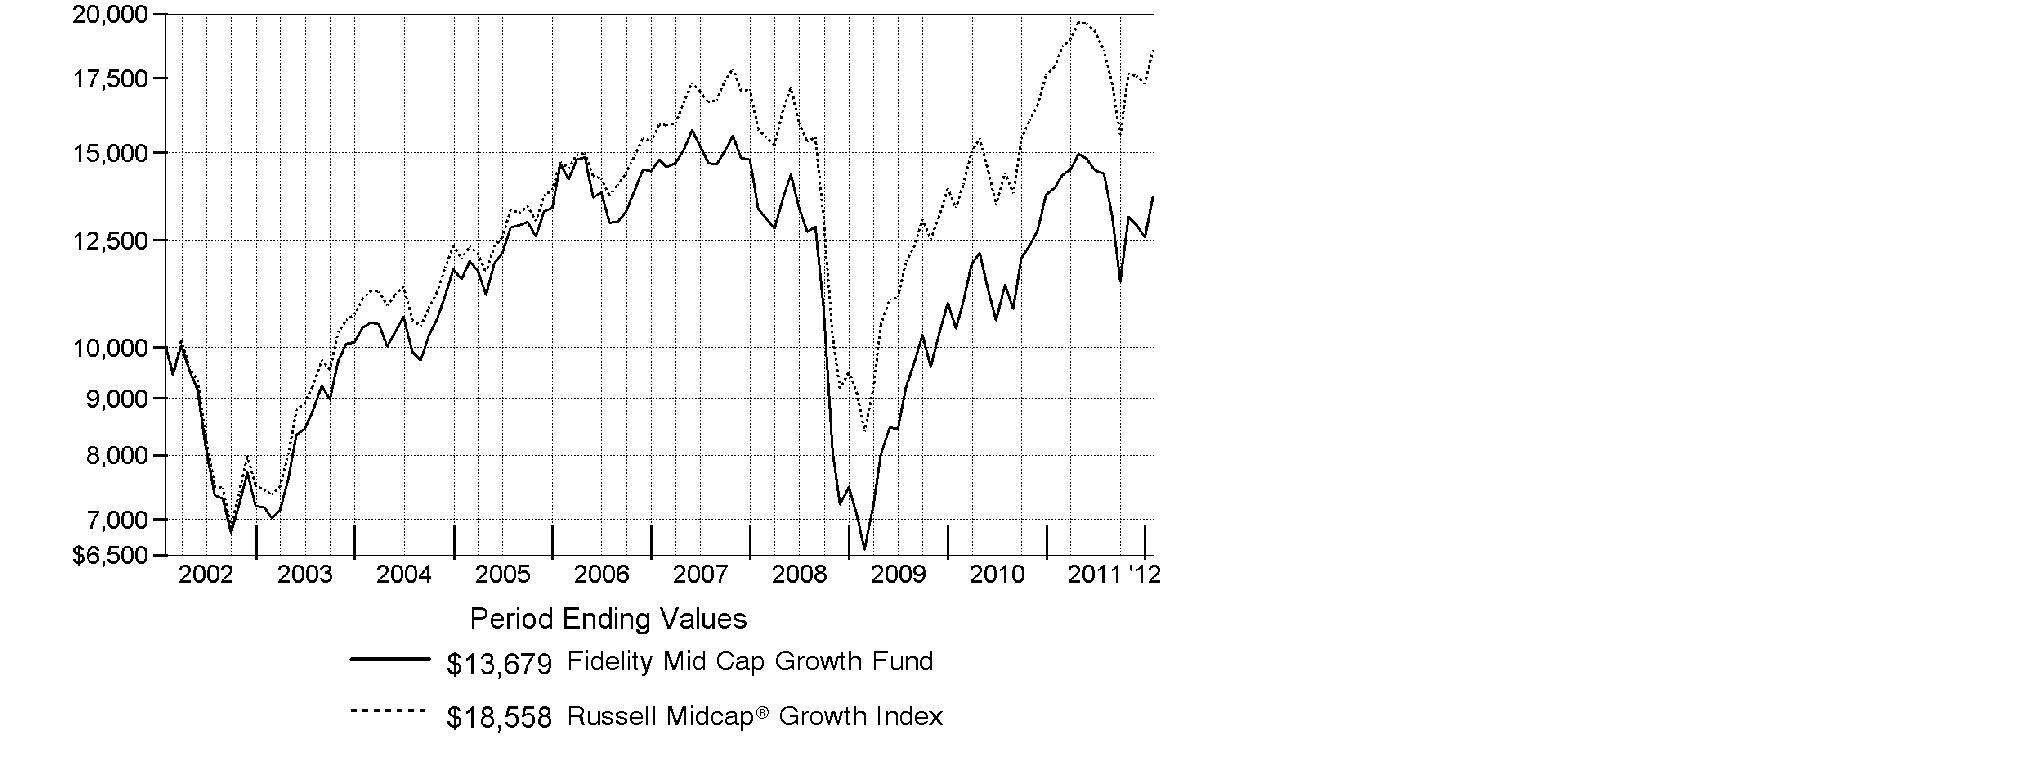
Annual Report
Management's Discussion of Fund Performance
Market Recap: After enduring one of the most volatile trading periods on record, U.S. stocks posted a gain for the 12 months ending January 31, 2012, sparked by a January rally. Strong corporate earnings reports and hints of economic recovery sent stocks mostly upward through April, when sovereign debt woes in Europe sparked fear of a global slowdown. In the summer, equities plummeted on eurozone instability, debate over the U.S. debt ceiling and a historic downgrade of the nation's sovereign debt rating. After falling as much as 13% by early August, the broad-based S&P 500® Index seesawed back to end the period on an optimistic note. For the full 12 months, the S&P 500® rose 4.22%, while the technology-laden Nasdaq Composite® Index added 5.26%. Investors began to shed perceived riskier smaller-cap stocks in favor of larger, more-established and dividend-paying names, helping to drive the Dow Jones® Industrial Average up 9.12% for the year, while the Russell 2000® - a proxy for small-caps - and Russell Midcap® indexes added 2.86% and 2.25%, respectively. Within the S&P 500®, defensive sectors such as health care (+16%) and utilities (+14%) fared best, while financials (-12%) struggled. Foreign developed-markets stocks were stung by Europe's turmoil, and the MSCI® EAFE® (Europe, Australasia, Far East) Index fell 9.49%.
Comments from Steven Calhoun, Portfolio Manager of Fidelity® Mid Cap Growth Fund: During the year, the fund's Retail Class shares returned -1.82%, well behind the 3.42% gain of the Russell Midcap® Growth Index. Versus the index, unrewarding stock selection and a sizable overweighting in the weak-performing energy sector materially hurt the fund's performance, as did stock picking and an underweighting in the strong-performing consumer discretionary sector. China-based seed supplier Origin Agritech, our largest individual detractor, declined against the backdrop of tighter credit and weak stock market conditions in China, among other factors. Two producers of metallurgical coal, Alpha Natural Resources and Walter Energy, also dampened performance. Conversely, stock picking in health care aided performance, while positioning in information technology also helped. The shares of biopharmaceutical firm Inhibitex, the fund's top contributor, benefited from favorable test results for one of its hepatitis C drugs and from a lucrative buyout offer received by the company in January. I sold Inhibitex during the period. Also aiding performance were Idenix Pharmaceuticals and nitrogen fertilizer producer CVR Partners. Most of the stocks I've mentioned in this report were out-of-index holdings.
The views expressed above reflect those of the portfolio manager(s) only through the end of the period as stated on the cover of this report and do not necessarily represent the views of Fidelity or any other person in the Fidelity organization. Any such views are subject to change at any time based upon market or other conditions and Fidelity disclaims any responsibility to update such views. These views may not be relied on as investment advice and, because investment decisions for a Fidelity fund are based on numerous factors, may not be relied on as an indication of trading intent on behalf of any Fidelity fund.
Annual Report
Shareholder Expense Example
As a shareholder of the Fund, you incur two types of costs: (1) transaction costs, including sales charges (loads) on purchase payments or redemption proceeds, redemption fees, and (2) ongoing costs, including management fees, distribution and/or service (12b-1) fees and other Fund expenses. This Example is intended to help you understand your ongoing costs (in dollars) of investing in the Fund and to compare these costs with the ongoing costs of investing in other mutual funds.
The Example is based on an investment of $1,000 invested at the beginning of the period and held for the entire period (August 1, 2011 to January 31, 2012).
Actual Expenses
The first line of the accompanying table for each class of the Fund provides information about actual account values and actual expenses. You may use the information in this line, together with the amount you invested, to estimate the expenses that you paid over the period. Simply divide your account value by $1,000.00 (for example, an $8,600 account value divided by $1,000.00 = 8.6), then multiply the result by the number in the first line for a class of the Fund under the heading entitled "Expenses Paid During Period" to estimate the expenses you paid on your account during this period. A small balance maintenance fee of $12.00 that is charged once a year may apply for certain accounts with a value of less than $2,000. This fee is not included in the table below. If it was, the estimate of expenses you paid during the period would be higher, and your ending account value lower, by this amount. In addition, the Fund, as a shareholder in the underlying Fidelity Central Funds, will indirectly bear its pro-rata share of the fees and expenses incurred by the underlying Fidelity Central Funds. These fees and expenses are not included in the Fund's annualized expense ratio used to calculate the expense estimate in the table below.
Hypothetical Example for Comparison Purposes
The second line of the accompanying table for each class of the Fund provides information about hypothetical account values and hypothetical expenses based on a Class' actual expense ratio and an assumed rate of return of 5% per year before expenses, which is not the Class' actual return. The hypothetical account values and expenses may not be used to estimate the actual ending account balance or expenses you paid for the period. You may use this information to compare the ongoing costs of investing in the Fund and other funds. To do so, compare this 5% hypothetical example with the 5% hypothetical examples that appear in the shareholder reports of the other funds. A small balance maintenance fee of $12.00 that is charged once a year may apply for certain accounts with a value of less than $2,000. This fee is not included in the table below. If it was, the estimate of expenses you paid during the period would be higher, and your ending account value lower, by this amount. In addition, the Fund, as a shareholder in the underlying Fidelity Central Funds, will indirectly bear its pro-rata share of the fees and expenses incurred by the underlying Fidelity Central Funds. These fees and expenses are not included in the Fund's annualized expense ratio used to calculate the expense estimate in the table below.
Please note that the expenses shown in the table are meant to highlight your ongoing costs only and do not reflect any transaction costs. Therefore, the second line of the table is useful in comparing ongoing costs only, and will not help you determine the relative total costs of owning different funds. In addition, if these transactional costs were included, your costs would have been higher.
Annual Report
Shareholder Expense Example - continued
| Annualized | Beginning | Ending | Expenses Paid |
Class A | 1.03% |
|
|
|
Actual |
| $ 1,000.00 | $ 951.20 | $ 5.07 |
HypotheticalA |
| $ 1,000.00 | $ 1,020.01 | $ 5.24 |
Class T | 1.33% |
|
|
|
Actual |
| $ 1,000.00 | $ 949.90 | $ 6.54 |
HypotheticalA |
| $ 1,000.00 | $ 1,018.50 | $ 6.77 |
Class B | 1.77% |
|
|
|
Actual |
| $ 1,000.00 | $ 948.20 | $ 8.69 |
HypotheticalA |
| $ 1,000.00 | $ 1,016.28 | $ 9.00 |
Class C | 1.78% |
|
|
|
Actual |
| $ 1,000.00 | $ 948.20 | $ 8.74 |
HypotheticalA |
| $ 1,000.00 | $ 1,016.23 | $ 9.05 |
Mid Cap Growth | .77% |
|
|
|
Actual |
| $ 1,000.00 | $ 953.10 | $ 3.79 |
HypotheticalA |
| $ 1,000.00 | $ 1,021.32 | $ 3.92 |
Institutional Class | .65% |
|
|
|
Actual |
| $ 1,000.00 | $ 954.00 | $ 3.20 |
HypotheticalA |
| $ 1,000.00 | $ 1,021.93 | $ 3.31 |
A 5% return per year before expenses
* Expenses are equal to each Class' annualized expense ratio, multiplied by the average account value over the period, multiplied by 184/365 (to reflect the one-half year period).
Annual Report
Investment Changes (Unaudited)
Top Ten Stocks as of January 31, 2012 | ||
| % of fund's | % of fund's net assets |
CF Industries Holdings, Inc. | 2.6 | 4.0 |
Cyberonics, Inc. | 2.2 | 1.5 |
Potash Corp. of Saskatchewan, Inc. | 2.1 | 0.0 |
The Mosaic Co. | 2.0 | 1.1 |
Idenix Pharmaceuticals, Inc. | 1.9 | 0.7 |
Heckmann Corp. | 1.9 | 1.2 |
ArthroCare Corp. | 1.9 | 1.4 |
CNH Global NV | 1.7 | 1.1 |
Citrix Systems, Inc. | 1.6 | 0.7 |
CVR Partners LP | 1.6 | 1.6 |
| 19.5 | |
Top Five Market Sectors as of January 31, 2012 | ||
| % of fund's | % of fund's net assets 6 months ago |
Information Technology | 21.1 | 18.6 |
Health Care | 16.5 | 15.4 |
Consumer Discretionary | 16.5 | 15.5 |
Energy | 14.1 | 17.7 |
Materials | 12.3 | 11.9 |
Asset Allocation (% of fund's net assets) | |||||||
As of January 31, 2012* | As of July 31, 2011** | ||||||
| Stocks 96.4% |
| | Stocks 99.7% |
| ||
| Short-Term |
| | Short-Term |
| ||
* Foreign investments | 14.3% |
| ** Foreign investments | 15.5% |
| ||

Annual Report
Investments January 31, 2012
Showing Percentage of Net Assets
Common Stocks - 96.4% | |||
Shares | Value | ||
CONSUMER DISCRETIONARY - 16.5% | |||
Automobiles - 0.8% | |||
Tesla Motors, Inc. (a)(d) | 71,900 | $ 2,090,133 | |
Diversified Consumer Services - 1.1% | |||
Weight Watchers International, Inc. (d) | 40,500 | 3,083,265 | |
Hotels, Restaurants & Leisure - 2.2% | |||
BJ's Restaurants, Inc. (a) | 26,900 | 1,345,807 | |
Buffalo Wild Wings, Inc. (a)(d) | 20,200 | 1,344,512 | |
Panera Bread Co. Class A (a) | 12,000 | 1,779,000 | |
Texas Roadhouse, Inc. Class A | 96,100 | 1,456,876 | |
| 5,926,195 | ||
Media - 1.0% | |||
Discovery Communications, Inc. (a) | 63,700 | 2,731,456 | |
Multiline Retail - 1.0% | |||
Dollar Tree, Inc. (a) | 32,600 | 2,764,806 | |
Specialty Retail - 4.0% | |||
Abercrombie & Fitch Co. Class A | 39,000 | 1,791,660 | |
Body Central Corp. (a) | 62,500 | 1,680,000 | |
Limited Brands, Inc. | 74,400 | 3,114,384 | |
Tractor Supply Co. | 33,700 | 2,721,949 | |
Ulta Salon, Cosmetics & Fragrance, Inc. (a) | 21,700 | 1,653,974 | |
| 10,961,967 | ||
Textiles, Apparel & Luxury Goods - 6.4% | |||
Liz Claiborne, Inc. (a)(d) | 341,000 | 3,171,300 | |
Michael Kors Holdings Ltd. | 51,300 | 1,587,735 | |
PVH Corp. | 41,300 | 3,187,947 | |
Ralph Lauren Corp. | 25,000 | 3,800,000 | |
Under Armour, Inc. Class A (sub. vtg.) (a)(d) | 35,500 | 2,826,510 | |
Warnaco Group, Inc. (a) | 49,400 | 2,877,550 | |
| 17,451,042 | ||
TOTAL CONSUMER DISCRETIONARY | 45,008,864 | ||
CONSUMER STAPLES - 3.4% | |||
Beverages - 0.6% | |||
Monster Beverage Corp. (a) | 15,500 | 1,619,905 | |
Food & Staples Retailing - 1.1% | |||
Whole Foods Market, Inc. | 39,700 | 2,938,991 | |
Common Stocks - continued | |||
Shares | Value | ||
CONSUMER STAPLES - continued | |||
Food Products - 1.3% | |||
Green Mountain Coffee Roasters, Inc. (a)(d) | 48,300 | $ 2,576,322 | |
Origin Agritech Ltd. (a)(d) | 375,069 | 888,914 | |
| 3,465,236 | ||
Tobacco - 0.4% | |||
Lorillard, Inc. | 11,600 | 1,245,724 | |
TOTAL CONSUMER STAPLES | 9,269,856 | ||
ENERGY - 14.1% | |||
Energy Equipment & Services - 5.5% | |||
Cameron International Corp. (a) | 82,300 | 4,378,360 | |
Dresser-Rand Group, Inc. (a) | 57,200 | 2,930,356 | |
Heckmann Corp. (a)(d) | 1,022,900 | 5,227,019 | |
Rowan Companies, Inc. (a) | 77,300 | 2,628,973 | |
| 15,164,708 | ||
Oil, Gas & Consumable Fuels - 8.6% | |||
Alpha Natural Resources, Inc. (a) | 213,500 | 4,295,620 | |
Amyris, Inc. (a)(d) | 85,100 | 763,347 | |
Bumi PLC | 173,710 | 2,381,773 | |
Cabot Oil & Gas Corp. | 85,200 | 2,717,880 | |
EV Energy Partners LP | 42,500 | 2,835,600 | |
EXCO Resources, Inc. | 150,200 | 1,180,572 | |
Genel Energy PLC | 46,900 | 629,012 | |
Oasis Petroleum, Inc. (a)(d) | 83,400 | 2,813,916 | |
QEP Resources, Inc. | 94,800 | 2,715,072 | |
Range Resources Corp. | 37,500 | 2,157,000 | |
Solazyme, Inc. (d) | 76,000 | 883,120 | |
| 23,372,912 | ||
TOTAL ENERGY | 38,537,620 | ||
FINANCIALS - 1.0% | |||
Real Estate Management & Development - 1.0% | |||
Altisource Portfolio Solutions SA (a) | 50,900 | 2,722,641 | |
HEALTH CARE - 16.5% | |||
Biotechnology - 7.5% | |||
Alexion Pharmaceuticals, Inc. (a) | 36,300 | 2,786,388 | |
Human Genome Sciences, Inc. (a)(d) | 304,500 | 2,996,280 | |
Idenix Pharmaceuticals, Inc. (a)(d) | 398,800 | 5,339,932 | |
Common Stocks - continued | |||
Shares | Value | ||
HEALTH CARE - continued | |||
Biotechnology - continued | |||
InterMune, Inc. (a) | 163,500 | $ 2,452,500 | |
Theravance, Inc. (a) | 85,900 | 1,523,866 | |
United Therapeutics Corp. (a) | 57,600 | 2,832,768 | |
Vertex Pharmaceuticals, Inc. (a) | 73,100 | 2,701,045 | |
| 20,632,779 | ||
Health Care Equipment & Supplies - 7.7% | |||
ArthroCare Corp. (a) | 164,479 | 5,084,046 | |
Cyberonics, Inc. (a) | 180,687 | 5,872,328 | |
Insulet Corp. (a) | 76,800 | 1,495,296 | |
NuVasive, Inc. (a) | 230,231 | 3,568,581 | |
Zeltiq Aesthetics, Inc. (d) | 43,000 | 516,000 | |
Zoll Medical Corp. (a) | 64,300 | 4,409,694 | |
| 20,945,945 | ||
Health Care Technology - 0.8% | |||
Merge Healthcare, Inc. (a) | 381,032 | 2,088,055 | |
Life Sciences Tools & Services - 0.5% | |||
Illumina, Inc. (a) | 28,000 | 1,449,280 | |
TOTAL HEALTH CARE | 45,116,059 | ||
INDUSTRIALS - 11.5% | |||
Aerospace & Defense - 1.1% | |||
BE Aerospace, Inc. (a) | 72,000 | 3,038,400 | |
Building Products - 2.4% | |||
Lennox International, Inc. | 77,700 | 2,812,740 | |
Owens Corning (a) | 112,500 | 3,796,875 | |
| 6,609,615 | ||
Electrical Equipment - 2.2% | |||
Cooper Industries PLC Class A | 55,900 | 3,304,808 | |
Roper Industries, Inc. | 28,300 | 2,642,937 | |
| 5,947,745 | ||
Machinery - 4.9% | |||
CNH Global NV (a) | 109,600 | 4,574,704 | |
IDEX Corp. | 45,100 | 1,827,452 | |
Ingersoll-Rand PLC | 115,700 | 4,042,558 | |
WABCO Holdings, Inc. (a) | 31,100 | 1,612,535 | |
Westport Innovations, Inc. (a)(d) | 32,000 | 1,331,200 | |
| 13,388,449 | ||
Common Stocks - continued | |||
Shares | Value | ||
INDUSTRIALS - continued | |||
Marine - 0.9% | |||
Kirby Corp. (a) | 39,000 | $ 2,604,030 | |
TOTAL INDUSTRIALS | 31,588,239 | ||
INFORMATION TECHNOLOGY - 21.1% | |||
Communications Equipment - 1.5% | |||
Polycom, Inc. (a) | 155,000 | 3,092,250 | |
Riverbed Technology, Inc. (a) | 46,000 | 1,101,240 | |
| 4,193,490 | ||
Computers & Peripherals - 1.0% | |||
SanDisk Corp. (a) | 58,300 | 2,674,804 | |
Electronic Equipment & Components - 1.6% | |||
Aeroflex Holding Corp. (a) | 98,400 | 1,246,728 | |
Maxwell Technologies, Inc. (a)(d) | 149,100 | 3,050,586 | |
| 4,297,314 | ||
Internet Software & Services - 2.6% | |||
Blinkx PLC (a) | 601,900 | 635,558 | |
Rackspace Hosting, Inc. (a) | 61,061 | 2,650,658 | |
Velti PLC (a) | 104,400 | 913,500 | |
VeriSign, Inc. | 82,600 | 3,061,156 | |
| 7,260,872 | ||
IT Services - 1.1% | |||
Cognizant Technology Solutions Corp. Class A (a) | 42,100 | 3,020,675 | |
Semiconductors & Semiconductor Equipment - 5.1% | |||
ASML Holding NV | 64,400 | 2,768,556 | |
Ceva, Inc. (a) | 74,690 | 2,017,377 | |
Freescale Semiconductor Holdings I Ltd. (d) | 100,120 | 1,598,916 | |
KLA-Tencor Corp. | 55,700 | 2,847,941 | |
NVIDIA Corp. (a) | 200,000 | 2,954,000 | |
NXP Semiconductors NV (a) | 82,400 | 1,749,352 | |
| 13,936,142 | ||
Software - 8.2% | |||
ANSYS, Inc. (a) | 54,200 | 3,278,558 | |
Ariba, Inc. (a) | 50,900 | 1,389,570 | |
Autodesk, Inc. (a) | 83,800 | 3,016,800 | |
Check Point Software Technologies Ltd. (a) | 48,500 | 2,730,065 | |
Citrix Systems, Inc. (a) | 69,800 | 4,551,658 | |
Informatica Corp. (a) | 57,700 | 2,440,710 | |
Common Stocks - continued | |||
Shares | Value | ||
INFORMATION TECHNOLOGY - continued | |||
Software - continued | |||
Intuit, Inc. | 62,300 | $ 3,516,212 | |
Nuance Communications, Inc. (a) | 54,300 | 1,548,636 | |
| 22,472,209 | ||
TOTAL INFORMATION TECHNOLOGY | 57,855,506 | ||
MATERIALS - 12.3% | |||
Chemicals - 10.0% | |||
CF Industries Holdings, Inc. | 40,200 | 7,130,676 | |
CVR Partners LP | 147,000 | 4,420,290 | |
Monsanto Co. | 36,000 | 2,953,800 | |
Potash Corp. of Saskatchewan, Inc. | 122,000 | 5,715,841 | |
Rentech Nitrogen Partners LP | 71,800 | 1,642,066 | |
The Mosaic Co. | 99,000 | 5,541,030 | |
| 27,403,703 | ||
Metals & Mining - 2.3% | |||
First Quantum Minerals Ltd. | 91,600 | 2,006,019 | |
Ivanhoe Mines Ltd. (a) | 80,000 | 1,290,052 | |
Walter Energy, Inc. | 42,800 | 2,958,764 | |
| 6,254,835 | ||
TOTAL MATERIALS | 33,658,538 | ||
TOTAL COMMON STOCKS (Cost $257,242,067) |
| ||
Money Market Funds - 13.2% | |||
Shares | Value | ||
Fidelity Cash Central Fund, 0.12% (b) | 9,582,886 | $ 9,582,886 | |
Fidelity Securities Lending Cash Central Fund, 0.12% (b)(c) | 26,509,425 | 26,509,425 | |
TOTAL MONEY MARKET FUNDS (Cost $36,092,311) |
| ||
TOTAL INVESTMENT PORTFOLIO - 109.6% (Cost $293,334,378) | 299,849,634 | ||
NET OTHER ASSETS (LIABILITIES) - (9.6)% | (26,344,418) | ||
NET ASSETS - 100% | $ 273,505,216 | ||
Legend |
(a) Non-income producing |
(b) Affiliated fund that is available only to investment companies and other accounts managed by Fidelity Investments. The rate quoted is the annualized seven-day yield of the fund at period end. A complete unaudited listing of the fund's holdings as of its most recent quarter end is available upon request. In addition, each Fidelity Central Fund's financial statements, which are not covered by the Fund's Report of Independent Registered Public Accounting Firm, are available on the SEC's website or upon request. |
(c) Investment made with cash collateral received from securities on loan. |
(d) Security or a portion of the security is on loan at period end. |
Affiliated Central Funds |
Information regarding fiscal year to date income earned by the Fund from investments in Fidelity Central Funds is as follows: |
Fund | Income earned |
Fidelity Cash Central Fund | $ 5,926 |
Fidelity Securities Lending Cash Central Fund | 63,571 |
Total | $ 69,497 |
Other Information |
All investments are categorized as Level 1 under the Fair Value Hierarchy. The inputs or methodology used for valuing securities may not be an indication of the risk associated with investing in those securities. For more information on valuation inputs, please refer to the Security Valuation section in the accompanying Notes to Financial Statements. |
Distribution of investments by country of issue, as a percentage of total net assets, is as follows: (Unaudited) |
United States of America | 85.7% |
Canada | 3.8% |
Netherlands | 3.3% |
Ireland | 2.7% |
United Kingdom | 1.3% |
Israel | 1.0% |
Luxembourg | 1.0% |
Others (Individually Less Than 1%) | 1.2% |
| 100.0% |
See accompanying notes which are an integral part of the financial statements.
Annual Report
Financial Statements
Statement of Assets and Liabilities
| January 31, 2012 | |
Assets | ||
Investment in securities, at value (including securities loaned of $25,637,049) - See accompanying schedule: Unaffiliated issuers (cost $257,242,067) | $ 263,757,323 |
|
Fidelity Central Funds (cost $36,092,311) | 36,092,311 |
|
Total Investments (cost $293,334,378) |
| $ 299,849,634 |
Cash |
| 14,594 |
Receivable for investments sold | 812,984 | |
Receivable for fund shares sold | 641,814 | |
Dividends receivable | 52,005 | |
Distributions receivable from Fidelity Central Funds | 13,374 | |
Prepaid expenses | 769 | |
Other receivables | 10,957 | |
Total assets | 301,396,131 | |
|
|
|
Liabilities | ||
Payable for investments purchased | $ 807,378 | |
Payable for fund shares redeemed | 361,905 | |
Accrued management fee | 83,493 | |
Distribution and service plan fees payable | 8,006 | |
Other affiliated payables | 72,265 | |
Other payables and accrued expenses | 48,443 | |
Collateral on securities loaned, at value | 26,509,425 | |
Total liabilities | 27,890,915 | |
|
|
|
Net Assets | $ 273,505,216 | |
Net Assets consist of: |
| |
Paid in capital | $ 288,221,632 | |
Accumulated net investment loss | (175,072) | |
Accumulated undistributed net realized gain (loss) on investments and foreign currency transactions | (21,056,187) | |
Net unrealized appreciation (depreciation) on investments and assets and liabilities in foreign currencies | 6,514,843 | |
Net Assets | $ 273,505,216 | |
See accompanying notes which are an integral part of the financial statements.
Annual Report
Statement of Assets and Liabilities - continued
| January 31, 2012 | |
Calculation of Maximum Offering Price Class A: | $ 12.27 | |
|
|
|
Maximum offering price per share (100/94.25 of $12.27) | $ 13.02 | |
Class T: | $ 12.14 | |
|
|
|
Maximum offering price per share (100/96.50 of $12.14) | $ 12.58 | |
Class B: | $ 11.91 | |
|
|
|
Class C: | $ 11.91 | |
|
|
|
|
|
|
Mid Cap Growth: | $ 12.40 | |
|
|
|
Institutional Class: | $ 12.43 | |
A Redemption price per share is equal to net asset value less any applicable contingent deferred sales charge.
See accompanying notes which are an integral part of the financial statements.
Annual Report
Financial Statements - continued
Statement of Operations
| Year ended January 31, 2012 | |
Investment Income |
|
|
Dividends |
| $ 1,698,443 |
Income from Fidelity Central Funds |
| 69,497 |
Total income |
| 1,767,940 |
|
|
|
Expenses | ||
Management fee | $ 1,652,976 | |
Performance adjustment | (464,170) | |
Transfer agent fees | 852,587 | |
Distribution and service plan fees | 99,382 | |
Accounting and security lending fees | 117,602 | |
Custodian fees and expenses | 26,283 | |
Independent trustees' compensation | 1,733 | |
Registration fees | 68,351 | |
Audit | 68,420 | |
Legal | 1,003 | |
Miscellaneous | 2,622 | |
Total expenses before reductions | 2,426,789 | |
Expense reductions | (42,474) | 2,384,315 |
Net investment income (loss) | (616,375) | |
Realized and Unrealized Gain (Loss) Net realized gain (loss) on: | ||
Investment securities: |
|
|
Unaffiliated issuers | 26,763,675 | |
Foreign currency transactions | 26,304 | |
Total net realized gain (loss) |
| 26,789,979 |
Change in net unrealized appreciation (depreciation) on: Investment securities | (34,576,049) | |
Assets and liabilities in foreign currencies | 121 | |
Total change in net unrealized appreciation (depreciation) |
| (34,575,928) |
Net gain (loss) | (7,785,949) | |
Net increase (decrease) in net assets resulting from operations | $ (8,402,324) | |
See accompanying notes which are an integral part of the financial statements.
Annual Report
Statement of Changes in Net Assets
| Year ended | Year ended |
Increase (Decrease) in Net Assets |
|
|
Operations |
|
|
Net investment income (loss) | $ (616,375) | $ (751,163) |
Net realized gain (loss) | 26,789,979 | 49,618,736 |
Change in net unrealized appreciation (depreciation) | (34,575,928) | 25,698,331 |
Net increase (decrease) in net assets resulting | (8,402,324) | 74,565,904 |
Distributions to shareholders from net realized gain | - | (88,063) |
Share transactions - net increase (decrease) | (44,807,582) | 29,630,097 |
Redemption fees | 17,787 | 11,919 |
Total increase (decrease) in net assets | (53,192,119) | 104,119,857 |
|
|
|
Net Assets | ||
Beginning of period | 326,697,335 | 222,577,478 |
End of period (including accumulated net investment loss of $175,072 and accumulated net investment loss of $0, respectively) | $ 273,505,216 | $ 326,697,335 |
See accompanying notes which are an integral part of the financial statements.
Annual Report
Financial Highlights - Class A
Years ended January 31, | 2012 | 2011 | 2010 | 2009 | 2008 H |
Selected Per-Share Data |
|
|
|
|
|
Net asset value, beginning of period | $ 12.53 | $ 9.38 | $ 6.38 | $ 12.19 | $ 14.33 |
Income from Investment | |||||
Net investment income (loss)E | (.05) | (.06) | (.03) | .03 | (.05) |
Net realized and unrealized gain (loss) | (.21) | 3.21 | 3.03 | (5.79) | (1.30) |
Total from investment operations | (.26) | 3.15 | 3.00 | (5.76) | (1.35) |
Distributions from net investment income | - | - | - | (.05) | - |
Distributions from net realized gain | - | - | - | - | (.79) |
Total distributions | - | - | - | (.05) | (.79) |
Redemption fees added to paid in capital E,J | - | - | - | - | - |
Net asset value, end of period | $ 12.27 | $ 12.53 | $ 9.38 | $ 6.38 | $ 12.19 |
Total ReturnB,C,D | (2.08)% | 33.58% | 47.02% | (47.25)% | (9.95)% |
Ratios to Average Net AssetsF,I |
|
|
|
|
|
Expenses before reductions | 1.04% | 1.04% | .95% | .95% | 1.10% A |
Expenses net of fee waivers, if any | 1.04% | 1.04% | .95% | .95% | 1.10% A |
Expenses net of all reductions | 1.03% | 1.03% | .93% | .94% | 1.10% A |
Net investment income (loss) | (.43)% | (.52)% | (.30)% | .29% | (.41)% A |
Supplemental Data |
|
|
|
|
|
Net assets, end of period (000 omitted) | $ 10,062 | $ 10,751 | $ 6,095 | $ 1,623 | $ 1,936 |
Portfolio turnover rate G | 160% | 143% | 249% | 220% | 245% |
A Annualized
B Total returns for periods of less than one year are not annualized.
C Total returns would have been lower if certain expenses had not been reduced during the applicable periods shown.
D Total returns do not include the effect of the sales charges.
E Calculated based on average shares outstanding during the period.
F Fees and expenses of any underlying Fidelity Central Funds are not included in the Fund's expense ratio. The Fund indirectly bears its proportionate share of the expenses of any underlying Fidelity Central Funds.
G Amount does not include the portfolio activity of any underlying Fidelity Central Funds.
H For the period February 13, 2007 (commencement of sale of shares) to January 31, 2008.
I Expense ratios reflect operating expenses of the class. Expenses before reductions do not reflect amounts reimbursed by the investment adviser or reductions from brokerage service arrangements or reductions from other expense offset arrangements and do not represent the amount paid by the class during periods when reimbursements or reductions occur. Expense ratios before reductions for start-up periods may not be representative of longer-term operating periods. Expenses net of fee waivers reflect expenses after reimbursement by the investment adviser but prior to reductions from brokerage service arrangements or other expense offset arrangements. Expenses net of all reductions represent the net expenses paid by the class.
J Amount represents less than $.01 per share.
See accompanying notes which are an integral part of the financial statements.
Annual Report
Financial Highlights - Class T
Years ended January 31, | 2012 | 2011 | 2010 | 2009 | 2008 I |
Selected Per-Share Data |
|
|
|
|
|
Net asset value, beginning of period | $ 12.43 | $ 9.33 | $ 6.37 | $ 12.14 | $ 14.33 |
Income from Investment | |||||
Net investment income (loss) E | (.09) | (.09) | (.05) | - K | (.09) |
Net realized and unrealized gain (loss) | (.20) | 3.19 | 3.01 | (5.75) | (1.31) |
Total from investment operations | (.29) | 3.10 | 2.96 | (5.75) | (1.40) |
Distributions from net investment income | - | - | - | (.02) | - |
Distributions from net realized gain | - | - | - | - | (.79) |
Total distributions | - | - | - | (.02) | (.79) |
Redemption fees added to paid in capital E,K | - | - | - | - | - |
Net asset value, end of period | $ 12.14 | $ 12.43 | $ 9.33 | $ 6.37 | $ 12.14 |
Total Return B,C,D | (2.33)% | 33.23% | 46.47% | (47.37)% | (10.30)% |
Ratios to Average Net Assets F,J |
|
|
|
|
|
Expenses before reductions | 1.34% | 1.34% | 1.26% | 1.23% | 1.36% A |
Expenses net of fee waivers, if any | 1.34% | 1.34% | 1.26% | 1.23% | 1.36% A |
Expenses net of all reductions | 1.33% | 1.33% | 1.23% | 1.22% | 1.36% A |
Net investment income (loss) | (.73)% | (.81)% | (.61)% | .00% H | (.68)% A |
Supplemental Data |
|
|
|
|
|
Net assets, end of period (000 omitted) | $ 4,026 | $ 3,205 | $ 2,100 | $ 790 | $ 591 |
Portfolio turnover rate G | 160% | 143% | 249% | 220% | 245% |
A Annualized
B Total returns for periods of less than one year are not annualized.
C Total returns would have been lower if certain expenses had not been reduced during the applicable periods shown.
D Total returns do not include the effect of the sales charges.
E Calculated based on average shares outstanding during the period.
F Fees and expenses of any underlying Fidelity Central Funds are not included in the Fund's expense ratio. The Fund indirectly bears its proportionate share of the expenses of any underlying Fidelity Central Funds.
G Amount does not include the portfolio activity of any underlying Fidelity Central Funds.
H Amount represents less than .01%.
I For the period February 13, 2007 (commencement of sale of shares) to January 31, 2008.
J Expense ratios reflect operating expenses of the class. Expenses before reductions do not reflect amounts reimbursed by the investment adviser or reductions from brokerage service arrangements or reductions from other expense offset arrangements and do not represent the amount paid by the class during periods when reimbursements or reductions occur. Expense ratios before reductions for start-up periods may not be representative of longer-term operating periods. Expenses net of fee waivers reflect expenses after reimbursement by the investment adviser but prior to reductions from brokerage service arrangements or other expense offset arrangements. Expenses net of all reductions represent the net expenses paid by the class.
K Amount represents less than $.01 per share.
See accompanying notes which are an integral part of the financial statements.
Annual Report
Financial Highlights - Class B
Years ended January 31, | 2012 | 2011 | 2010 | 2009 | 2008 H |
Selected Per-Share Data |
|
|
|
|
|
Net asset value, beginning of period | $ 12.25 | $ 9.23 | $ 6.33 | $ 12.09 | $ 14.33 |
Income from Investment | |||||
Net investment income (loss) E | (.14) | (.13) | (.09) | (.05) | (.16) |
Net realized and unrealized gain (loss) | (.20) | 3.15 | 2.99 | (5.71) | (1.29) |
Total from investment operations | (.34) | 3.02 | 2.90 | (5.76) | (1.45) |
Distributions from net realized gain | - | - | - | - | (.79) |
Redemption fees added to paid in capital E,J | - | - | - | - | - |
Net asset value, end of period | $ 11.91 | $ 12.25 | $ 9.23 | $ 6.33 | $ 12.09 |
Total Return B,C,D | (2.78)% | 32.72% | 45.81% | (47.64)% | (10.65)% |
Ratios to Average Net Assets F,I |
|
|
|
|
|
Expenses before reductions | 1.80% | 1.80% | 1.70% | 1.70% | 1.85% A |
Expenses net of fee waivers, if any | 1.80% | 1.80% | 1.70% | 1.70% | 1.85% A |
Expenses net of all reductions | 1.78% | 1.79% | 1.67% | 1.69% | 1.85% A |
Net investment income (loss) | (1.19)% | (1.27)% | (1.05)% | (.46)% | (1.16)% A |
Supplemental Data |
|
|
|
|
|
Net assets, end of period (000 omitted) | $ 673 | $ 812 | $ 1,059 | $ 245 | $ 414 |
Portfolio turnover rate G | 160% | 143% | 249% | 220% | 245% |
A Annualized
B Total returns for periods of less than one year are not annualized.
C Total returns would have been lower if certain expenses had not been reduced during the applicable periods shown.
D Total returns do not include the effect of the contingent deferred sales charge.
E Calculated based on average shares outstanding during the period.
F Fees and expenses of any underlying Fidelity Central Funds are not included in the Fund's expense ratio. The Fund indirectly bears its proportionate share of the expenses of any underlying Fidelity Central Funds.
G Amount does not include the portfolio activity of any underlying Fidelity Central Funds.
H For the period February 13, 2007 (commencement of sale of shares) to January 31, 2008.
I Expense ratios reflect operating expenses of the class. Expenses before reductions do not reflect amounts reimbursed by the investment adviser or reductions from brokerage service arrangements or reductions from other expense offset arrangements and do not represent the amount paid by the class during periods when reimbursements or reductions occur. Expense ratios before reductions for start-up periods may not be representative of longer-term operating periods. Expenses net of fee waivers reflect expenses after reimbursement by the investment adviser but prior to reductions from brokerage service arrangements or other expense offset arrangements. Expenses net of all reductions represent the net expenses paid by the class.
J Amount represents less than $.01 per share.
See accompanying notes which are an integral part of the financial statements.
Annual Report
Financial Highlights - Class C
Years ended January 31, | 2012 | 2011 | 2010 | 2009 | 2008 H |
Selected Per-Share Data |
|
|
|
|
|
Net asset value, beginning of period | $ 12.25 | $ 9.24 | $ 6.33 | $ 12.09 | $ 14.33 |
Income from Investment Operations |
|
|
|
|
|
Net investment income (loss)E | (.14) | (.13) | (.09) | (.04) | (.15) |
Net realized and unrealized gain (loss) | (.20) | 3.14 | 3.00 | (5.72) | (1.30) |
Total from investment operations | (.34) | 3.01 | 2.91 | (5.76) | (1.45) |
Distributions from net realized gain | - | - | - | - | (.79) |
Redemption fees added to paid in capital E,J | - | - | - | - | - |
Net asset value, end of period | $ 11.91 | $ 12.25 | $ 9.24 | $ 6.33 | $ 12.09 |
Total Return B,C,D | (2.78)% | 32.58% | 45.97% | (47.64)% | (10.65)% |
Ratios to Average Net Assets F,I |
|
|
|
|
|
Expenses before reductions | 1.80% | 1.79% | 1.70% | 1.69% | 1.85% A |
Expenses net of fee waivers, if any | 1.80% | 1.79% | 1.70% | 1.69% | 1.85% A |
Expenses net of all reductions | 1.79% | 1.78% | 1.68% | 1.68% | 1.85% A |
Net investment income (loss) | (1.19)% | (1.26)% | (1.05)% | (.46)% | (1.16)% A |
Supplemental Data |
|
|
|
|
|
Net assets, end of period (000 omitted) | $ 4,905 | $ 4,852 | $ 2,029 | $ 699 | $ 697 |
Portfolio turnover rate G | 160% | 143% | 249% | 220% | 245% |
A Annualized
B Total returns for periods of less than one year are not annualized.
C Total returns would have been lower if certain expenses had not been reduced during the applicable periods shown.
D Total returns do not include the effect of the contingent deferred sales charge.
E Calculated based on average shares outstanding during the period.
F Fees and expenses of any underlying Fidelity Central Funds are not included in the Fund's expense ratio. The Fund indirectly bears its proportionate share of the expenses of any underlying Fidelity Central Funds.
G Amount does not include the portfolio activity of any underlying Fidelity Central Funds.
H For the period February 13, 2007 (commencement of sale of shares) to January 31, 2008.
I Expense ratios reflect operating expenses of the class. Expenses before reductions do not reflect amounts reimbursed by the investment adviser or reductions from brokerage service arrangements or reductions from other expense offset arrangements and do not represent the amount paid by the class during periods when reimbursements or reductions occur. Expense ratios before reductions for start-up periods may not be representative of longer-term operating periods. Expenses net of fee waivers reflect expenses after reimbursement by the investment adviser but prior to reductions from brokerage service arrangements or other expense offset arrangements. Expenses net of all reductions represent the net expenses paid by the class.
J Amount represents less than $.01 per share.
See accompanying notes which are an integral part of the financial statements.
Annual Report
Financial Highlights - Mid Cap Growth
Years ended January 31, | 2012 | 2011 | 2010 | 2009 | 2008 |
Selected Per-Share Data |
|
|
|
|
|
Net asset value, beginning of period | $ 12.63 | $ 9.43 | $ 6.40 | $ 12.21 | $ 14.31 |
Income from Investment | |||||
Net investment income (loss) B | (.02) | (.03) | - F | .06 | (.02) |
Net realized and unrealized gain (loss) | (.21) | 3.23 | 3.03 | (5.81) | (1.29) |
Total from investment operations | (.23) | 3.20 | 3.03 | (5.75) | (1.31) |
Distributions from net investment income | - | - | - | (.06) | - |
Distributions from net realized gain | - | - F | - F | - | (.79) |
Total distributions | - | - F | - F | (.06) | (.79) |
Redemption fees added to paid in capital B,F | - | - | - | - | - |
Net asset value, end of period | $ 12.40 | $ 12.63 | $ 9.43 | $ 6.40 | $ 12.21 |
Total Return A | (1.82)% | 33.99% | 47.37% | (47.09)% | (9.68)% |
Ratios to Average Net Assets C,E | |||||
Expenses before reductions | .79% | .79% | .70% | .69% | .83% |
Expenses net of fee waivers, if any | .79% | .79% | .70% | .68% | .81% |
Expenses net of all reductions | .77% | .78% | .67% | .67% | .81% |
Net investment income (loss) | (.17)% | (.26)% | (.05)% | .55% | (.12)% |
Supplemental Data |
|
|
|
|
|
Net assets, end of period (000 omitted) | $ 252,124 | $ 306,238 | $ 211,006 | $ 137,633 | $ 301,225 |
Portfolio turnover rate D | 160% | 143% | 249% | 220% | 245% |
A Total returns would have been lower if certain expenses had not been reduced during the applicable periods shown.
B Calculated based on average shares outstanding during the period.
C Fees and expenses of any underlying Fidelity Central Funds are not included in the Fund's expense ratio. The Fund indirectly bears its proportionate share of the expenses of any underlying Fidelity Central Funds.
D Amount does not include the portfolio activity of any underlying Fidelity Central Funds.
E Expense ratios reflect operating expenses of the class. Expenses before reductions do not reflect amounts reimbursed by the investment adviser or reductions from brokerage service arrangements or reductions from other expense offset arrangements and do not represent the amount paid by the class during periods when reimbursements or reductions occur. Expenses net of fee waivers reflect expenses after reimbursement by the investment adviser but prior to reductions from brokerage service arrangements or other expense offset arrangements. Expenses net of all reductions represent the net expenses paid by the class.
F Amount represents less than $.01 per share.
See accompanying notes which are an integral part of the financial statements.
Annual Report
Financial Highlights - Institutional Class
Years ended January 31, | 2012 | 2011 | 2010 | 2009 | 2008 G |
Selected Per-Share Data |
|
|
|
|
|
Net asset value, beginning of period | $ 12.64 | $ 9.43 | $ 6.40 | $ 12.22 | $ 14.33 |
Income from Investment Operations |
|
|
|
|
|
Net investment income (loss) D | (.01) | (.02) | - I | .07 | - I |
Net realized and unrealized gain (loss) | (.20) | 3.24 | 3.04 | (5.82) | (1.32) |
Total from investment operations | (.21) | 3.22 | 3.04 | (5.75) | (1.32) |
Distributions from net investment income | - | - | - | (.07) | - |
Distributions from net realized gain | - | (.01) | (.01) | - | (.79) |
Total distributions | - | (.01) | (.01) | (.07) | (.79) |
Redemption fees added to paid in capital D,I | - | - | - | - | - |
Net asset value, end of period | $ 12.43 | $ 12.64 | $ 9.43 | $ 6.40 | $ 12.22 |
Total Return B,C | (1.66)% | 34.10% | 47.54% | (47.09)% | (9.74)% |
Ratios to Average Net Assets E,H |
|
|
|
|
|
Expenses before reductions | .68% | .70% | .61% | .59% | .72% A |
Expenses net of fee waivers, if any | .68% | .70% | .61% | .59% | .72% A |
Expenses net of all reductions | .67% | .69% | .59% | .59% | .72% A |
Net investment income (loss) | (.07)% | (.18)% | .03% | .64% | (.03)% A |
Supplemental Data |
|
|
|
|
|
Net assets, end of period (000 omitted) | $ 1,714 | $ 839 | $ 288 | $ 109 | $ 182 |
Portfolio turnover rate F | 160% | 143% | 249% | 220% | 245% |
A Annualized
B Total returns for periods of less than one year are not annualized.
C Total returns would have been lower if certain expenses had not been reduced during the applicable periods shown.
D Calculated based on average shares outstanding during the period.
E Fees and expenses of any underlying Fidelity Central Funds are not included in the Fund's expense ratio. The Fund indirectly bears its proportionate share of the expenses of any underlying Fidelity Central Funds.
F Amount does not include the portfolio activity of any underlying Fidelity Central Funds.
G For the period February 13, 2007 (commencement of sale of shares) to January 31, 2008.
H Expense ratios reflect operating expenses of the class. Expenses before reductions do not reflect amounts reimbursed by the investment adviser or reductions from brokerage service arrangements or reductions from other expense offset arrangements and do not represent the amount paid by the class during periods when reimbursements or reductions occur. Expense ratios before reductions for start-up periods may not be representative of longer-term operating periods. Expenses net of fee waivers reflect expenses after reimbursement by the investment adviser but prior to reductions from brokerage service arrangements or other expense offset arrangements. Expenses net of all reductions represent the net expenses paid by the class.
I Amount represents less than $.01 per share.
See accompanying notes which are an integral part of the financial statements.
Annual Report
Notes to Financial Statements
For the period ended January 31, 2012
1. Organization.
Fidelity Mid Cap Growth Fund (the Fund) is a fund of Fidelity Devonshire Trust (the Trust) and is authorized to issue an unlimited number of shares. The Trust is registered under the Investment Company Act of 1940, as amended (the 1940 Act), as an open-end management investment company organized as a Massachusetts business trust. The Fund offers Class A, Class T, Class C, Mid Cap Growth, and Institutional Class shares, each of which, along with Class B shares, has equal rights as to assets and voting privileges. Effective after the close of business on September 1, 2010, Class B shares were closed to new accounts and additional purchases, except for exchanges and reinvestments. Each class has exclusive voting rights with respect to matters that affect that class. Class B shares will automatically convert to Class A shares after a holding period of seven years from the initial date of purchase. Investment income, realized and unrealized capital gains and losses, the common expenses of the Fund, and certain fund-level expense reductions, if any, are allocated on a pro-rata basis to each class based on the relative net assets of each class to the total net assets of the Fund. Each class differs with respect to transfer agent and distribution and service plan fees incurred. Certain expense reductions may also differ by class.
2. Investments in Fidelity Central Funds.
The Fund invests in Fidelity Central Funds, which are open-end investment companies available only to other investment companies and accounts managed by Fidelity Management & Research Company (FMR) and its affiliates. The Fund's Schedule of Investments lists each of the Fidelity Central Funds held as of period end, if any, as an investment of the Fund, but does not include the underlying holdings of each Fidelity Central Fund. As an Investing Fund, the Fund indirectly bears its proportionate share of the expenses of the underlying Fidelity Central Funds.
The Money Market Central Funds seek preservation of capital and current income and are managed by Fidelity Investments Money Management, Inc. (FIMM), an affiliate of FMR.
A complete unaudited list of holdings for each Fidelity Central Fund is available upon request or at the Securities and Exchange Commission (the SEC) web site at www.sec.gov. In addition, the financial statements of the Fidelity Central Funds, which are not covered by the Fund's Report of Independent Registered Public Accounting Firm, are available on the SEC web site or upon request.
3. Significant Accounting Policies.
The financial statements have been prepared in conformity with accounting principles generally accepted in the United States of America (GAAP), which require management to make certain estimates and assumptions at the date of the financial statements. Actual results could differ from those estimates. Subsequent events, if any, through the
Annual Report
Notes to Financial Statements - continued
3. Significant Accounting Policies - continued
date that the financial statements were issued have been evaluated in the preparation of the financial statements. The following summarizes the significant accounting policies of the Fund:
Security Valuation. Investments are valued as of 4:00 p.m. Eastern time on the last calendar day of the period. The Fund uses independent pricing services approved by the Board of Trustees to value its investments. When current market prices or quotations are not readily available or reliable, valuations may be determined in good faith in accordance with procedures adopted by the Board of Trustees. Factors used in determining value may include market or security specific events. The frequency with which these procedures are used cannot be predicted and they may be utilized to a significant extent. The value used for net asset value (NAV) calculation under these procedures may differ from published prices for the same securities.
The Fund categorizes the inputs to valuation techniques used to value its investments into a disclosure hierarchy consisting of three levels as shown below:
Level 1 - quoted prices in active markets for identical investments
Level 2 - other significant observable inputs (including quoted prices for similar investments, interest rates, prepayment speeds, etc.)
Level 3 - unobservable inputs (including the Fund's own assumptions based on the best information available)
Changes in valuation techniques may result in transfers in or out of an assigned level within the disclosure hierarchy. Valuation techniques used to value the Fund's investments by major category are as follows:
Equity securities, including restricted securities, for which market quotations are readily available, are valued at the last reported sale price or official closing price as reported by an independent pricing service on the primary market or exchange on which they are traded and are categorized as Level 1 in the hierarchy. In the event there were no sales during the day or closing prices are not available, securities are valued at the last quoted bid price or may be valued using the last available price and are generally categorized as Level 2 in the hierarchy. For foreign equity securities, when significant market or security specific events arise, comparisons to the valuation of American Depositary Receipts (ADRs), futures contracts, Exchange-traded funds (ETFs) and certain indexes as well as quoted prices for similar securities are used and are categorized as Level 2 in the hierarchy in these circumstances. Utilizing these techniques may result in transfers between Level 1 and Level 2. For restricted equity securities and private placements where observable inputs are limited, assumptions about market activity and risk are used and are categorized as Level 3 in the hierarchy.
Annual Report
3. Significant Accounting Policies - continued
Security Valuation - continued
Investments in open-end mutual funds, including the Fidelity Central Funds, are valued at their closing net asset value each business day and are categorized as Level 1 in the hierarchy.
New Accounting Pronouncements. In May 2011, the Financial Accounting Standards Board issued Accounting Standard Update No. 2011-04, Fair Value Measurement (Topic 820) - Amendments to Achieve Common Fair Value Measurement and Disclosure Requirements in U.S. GAAP and IFRSs. The update is effective during interim and annual periods beginning after December 15, 2011 and will result in additional disclosure for transfers between levels as well as expanded disclosure for securities categorized as Level 3 under the fair value hierarchy.
In December 2011, the Financial Accounting Standards Board issued Accounting Standard Update No. 2011-11, Disclosures about Offsetting Assets and Liabilities. The update creates new disclosure requirements requiring entities to disclose both gross and net information for derivatives and other financial instruments that are either offset in the Statement of Assets and Liabilities or subject to an enforceable master netting arrangement or similar agreement. The disclosure requirements are effective for interim and annual reporting periods beginning on or after January 1, 2013. Management is currently evaluating the impact of the update's adoption on the Fund's financial statement disclosures.
Foreign Currency. The Fund may use foreign currency contracts to facilitate transactions in foreign-denominated securities. Gains and losses from these transactions may arise from changes in the value of the foreign currency or if the counterparties do not perform under the contracts' terms.
Foreign-denominated assets, including investment securities, and liabilities are translated into U.S. dollars at the exchange rate at period end. Purchases and sales of investment securities, income and dividends received and expenses denominated in foreign currencies are translated into U.S. dollars at the exchange rate in effect on the transaction date.
The effects of exchange rate fluctuations on investments are included with the net realized and unrealized gain (loss) on investment securities. Other foreign currency transactions resulting in realized and unrealized gain (loss) are disclosed separately.
Investment Transactions and Income. For financial reporting purposes, the Fund's investment holdings and NAV include trades executed through the end of the last business day of the period. The NAV per share for processing shareholder transactions is calculated as of the close of business of the New York Stock Exchange (NYSE), normally 4:00 p.m. Eastern time and includes trades executed through the end of the prior
Annual Report
Notes to Financial Statements - continued
3. Significant Accounting Policies - continued
Investment Transactions and Income - continued
business day. Gains and losses on securities sold are determined on the basis of identified cost and may include proceeds received from litigation. Dividend income is recorded on the ex-dividend date, except for certain dividends from foreign securities where the ex-dividend date may have passed, which are recorded as soon as the Fund is informed of the ex-dividend date. Non-cash dividends included in dividend income, if any, are recorded at the fair market value of the securities received. Distributions received on securities that represent a return of capital or capital gain are recorded as a reduction of cost of investments and/or as a realized gain. The Fund estimates the components of distributions received that may be considered return of capital distributions or capital gain distributions. Interest income and distributions from the Fidelity Central Funds are accrued as earned. Interest income includes coupon interest and amortization of premium and accretion of discount on debt securities. Investment income is recorded net of foreign taxes withheld where recovery of such taxes is uncertain.
Expenses. Expenses directly attributable to a fund are charged to that fund. Expenses attributable to more than one fund are allocated among the respective funds on the basis of relative net assets or other appropriate methods. Expense estimates are accrued in the period to which they relate and adjustments are made when actual amounts are known.
Income Tax Information and Distributions to Shareholders. Each year, the Fund intends to qualify as a regulated investment company, including distributing substantially all of its taxable income and realized gains under Subchapter M of the Internal Revenue Code. As a result, no provision for income taxes is required. As of January 31, 2012, the Fund did not have any unrecognized tax benefits in the financial statements; nor is the Fund aware of any tax positions for which it is reasonably possible that the total amounts of unrecognized tax benefits will significantly change in the next twelve months. The Fund files a U.S. federal tax return, in addition to state and local tax returns as required. A fund's tax returns are subject to examination by the Internal Revenue Service (IRS) for a period of three fiscal years. State and local tax returns may be subject to examination for an additional fiscal year depending on the jurisdiction. Foreign taxes are provided for based on the Fund's understanding of the tax rules and rates that exist in the foreign markets in which it invests.
Distributions are declared and recorded on the ex-dividend date. Income dividends and capital gain distributions are declared separately for each class. Income and capital gain distributions are determined in accordance with income tax regulations, which may differ from GAAP.
Annual Report
3. Significant Accounting Policies - continued
Income Tax Information and Distributions to Shareholders - continued
Capital accounts within the financial statements are adjusted for permanent book-tax differences. These adjustments have no impact on net assets or the results of operations. Temporary book-tax differences will reverse in a subsequent period.
Book-tax differences are primarily due to the short-term gain distributions from the Underlying Funds, foreign currency transactions, passive foreign investment companies (PFIC), partnerships, net operating losses, capital loss carryforwards and losses deferred due to wash sales and excise tax regulations.
The federal tax cost of investment securities and unrealized appreciation (depreciation) as of period end were as follows:
Gross unrealized appreciation | $ 30,768,647 |
Gross unrealized depreciation | (24,933,919) |
Net unrealized appreciation (depreciation) on securities and other investments | $ 5,834,728 |
|
|
Tax Cost | $ 294,014,906 |
The tax-based components of distributable earnings as of period end were as follows:
Capital loss carryforward | $ (19,613,163) |
Net unrealized appreciation (depreciation) | $ 5,834,315 |
Capital loss carryforwards are only available to offset future capital gains of the Fund to the extent provided by regulations and may be limited. Under the Regulated Investment Company Modernization Act of 2010 (the Act), the Fund is permitted to carry forward capital losses incurred in taxable years beginning after December 22, 2010 for an unlimited period and such capital losses are required to be used prior to any losses that expire. Capital loss carryforwards were as follows:
Fiscal year of expiration |
|
2018 | $ (19,613,163) |
The tax character of distributions paid was as follows:
| January 31, 2012 | January 31, 2011 |
Ordinary Income | $ - | $ 88,063 |
Short-Term Trading (Redemption) Fees. Shares held by investors in the Fund less than 30 days are subject to a redemption fee equal to .75% of the net asset value of shares redeemed. All redemption fees, which reduce the proceeds of the shareholder redemption, are retained by the Fund and accounted for as an addition to paid in capital.
Annual Report
Notes to Financial Statements - continued
4. Purchases and Sales of Investments.
Purchases and sales of securities, other than short-term securities, aggregated $471,825,166 and $512,877,562, respectively.
5. Fees and Other Transactions with Affiliates.
Management Fee. FMR and its affiliates provide the Fund with investment management related services for which the Fund pays a monthly management fee. The management fee is the sum of an individual fund fee rate that is based on an annual rate of .30% of the Fund's average net assets and an annualized group fee rate that averaged .26% during the period. The group fee rate is based upon the average net assets of all the mutual funds advised by FMR. The group fee rate decreases as assets under management increase and increases as assets under management decrease. In addition, the management fee is subject to a performance adjustment (up to a maximum of ±.20% of the Fund's average net assets over a 36 month performance period). The upward or downward adjustment to the management fee is based on the relative investment performance of Mid Cap Growth as compared to an appropriate benchmark index. For the period, the total annual management fee rate, including the performance adjustment, was .40% of the Fund's average net assets.
Distribution and Service Plan Fees. In accordance with Rule 12b-1 of the 1940 Act, the Fund has adopted separate Distribution and Service Plans for each class of shares. Certain classes pay Fidelity Distributors Corporation (FDC), an affiliate of FMR, separate Distribution and Service Fees, each of which is based on an annual percentage of each class' average net assets. In addition, FDC may pay financial intermediaries for selling shares of the Fund and providing shareholder support services. For the period, the Distribution and Service Fee rates, total fees and amounts retained by FDC were as follows:
| Service | Distribution | Total Fees | Retained |
Class A | .25% | -% | $ 26,117 | $ 2,070 |
Class T | .25% | .25% | 17,252 | 1 |
Class B | .25% | .75% | 7,364 | 5,527 |
Class C | .25% | .75% | 48,649 | 17,243 |
|
|
| $ 99,382 | $ 24,841 |
Sales Load. FDC may receive a front-end sales charge of up to 5.75% for selling Class A shares and 3.50% for selling Class T shares, some of which is paid to financial intermediaries for selling shares of the Fund. Depending on the holding period, FDC may receive contingent deferred sales charges levied on Class A, Class T, Class B, and Class C redemptions. The deferred sales charges range from 5.00% to 1.00% for Class B, 1.00% for Class C, 1.00% for certain purchases of Class A shares and .25% for certain purchases of Class T shares.
Annual Report
5. Fees and Other Transactions with Affiliates - continued
Sales Load - continued
For the period, sales charge amounts retained by FDC were as follows:
| Retained |
Class A | $ 9,512 |
Class T | 3,598 |
Class B* | 1,445 |
Class C* | 2,334 |
| $ 16,889 |
* When Class B and Class C shares are initially sold, FDC pays commissions from its own resources to financial intermediaries through which the sales are made.
Transfer Agent Fees. Fidelity Investments Institutional Operations Company, Inc. (FIIOC), an affiliate of FMR, is the transfer, dividend disbursing and shareholder servicing agent for each class of the Fund. FIIOC receives account fees and asset-based fees that vary according to the account size and type of account of the shareholders of the respective classes of the Fund. FIIOC pays for typesetting, printing and mailing of shareholder reports, except proxy statements. For the period, transfer agent fees for each class were as follows:
| Amount | % of |
Class A | $ 30,715 | .29 |
Class T | 11,926 | .35 |
Class B | 2,202 | .30 |
Class C | 14,756 | .30 |
Mid Cap Growth | 791,113 | .29 |
Institutional Class | 1,875 | .18 |
| $ 852,587 |
|
Accounting and Security Lending Fees. Fidelity Service Company, Inc. (FSC), an affiliate of FMR, maintains the Fund's accounting records. The accounting fee is based on the level of average net assets for each month. Under a separate contract, FSC administers the security lending program. The security lending fee is based on the number and duration of lending transactions.
Brokerage Commissions. The Fund placed a portion of its portfolio transactions with brokerage firms which are affiliates of the investment adviser. The commissions paid to these affiliated firms were $9,007 for the period.
Annual Report
Notes to Financial Statements - continued
6. Committed Line of Credit.
The Fund participates with other funds managed by FMR or an affiliate in a $4.0 billion credit facility (the "line of credit") to be utilized for temporary or emergency purposes to fund shareholder redemptions or for other short-term liquidity purposes. The Fund has agreed to pay commitment fees on its pro-rata portion of the line of credit, which amounted to $892 and is reflected in Miscellaneous expenses on the Statement of Operations. During the period, there were no borrowings on this line of credit.
7. Security Lending.
The Fund lends portfolio securities through a lending agent from time to time in order to earn additional income. For equity securities, a lending agent is used and may loan securities to certain qualified borrowers, including Fidelity Capital Markets (FCM), a broker-dealer affiliated with the Fund. On the settlement date of the loan, the Fund receives collateral (in the form of U.S. Treasury obligations, letters of credit and/or cash) against the loaned securities and maintains collateral in an amount not less than 100% of the market value of the loaned securities during the period of the loan. The market value of the loaned securities is determined at the close of business of the Fund and any additional required collateral is delivered to the Fund on the next business day. If the borrower defaults on its obligation to return the securities loaned because of insolvency or other reasons, a fund could experience delays and costs in recovering the securities loaned or in gaining access to the collateral. Any cash collateral received is invested in the Fidelity Securities Lending Cash Central Fund. The value of loaned securities and cash collateral at period end are disclosed on the Fund's Statement of Assets and Liabilities. Security lending income represents the income earned on investing cash collateral, less rebates paid to borrowers and any lending agent fees associated with the loan, plus any premium payments received for lending certain types of securities. Security lending income is presented in the Statement of Operations as a component of income from Fidelity Central Funds. Total security lending income during the period amounted to $63,571. During the period, there were no securities loaned to FCM.
8. Expense Reductions.
Many of the brokers with whom FMR places trades on behalf of the Fund provided services to the Fund in addition to trade execution. These services included payments of certain expenses on behalf of the Fund totaling $42,474 for the period.
Annual Report
9. Distributions to Shareholders.
Distributions to shareholders of each class were as follows:
Years ended January 31, | 2012 | 2011 |
From net realized gain |
|
|
Mid Cap Growth | $ - | $ 87,897 |
Institutional Class | - | 166 |
Total | $ - | $ 88,063 |
10. Share Transactions.
Transactions for each class of shares were as follows:
| Shares | Dollars | ||
Years ended January 31, | 2012 | 2011 | 2012 | 2011 |
Class A |
|
|
|
|
Shares sold | 352,250 | 583,869 | $ 4,351,299 | $ 6,535,650 |
Shares redeemed | (390,419) | (375,849) | (4,756,474) | (3,922,105) |
Net increase (decrease) | (38,169) | 208,020 | $ (405,175) | $ 2,613,545 |
Class T |
|
|
|
|
Shares sold | 133,161 | 104,201 | $ 1,615,612 | $ 1,140,251 |
Shares redeemed | (59,316) | (71,459) | (707,985) | (756,606) |
Net increase (decrease) | 73,845 | 32,742 | $ 907,627 | $ 383,645 |
Class B |
|
|
|
|
Shares sold | 10,854 | 37,374 | $ 133,326 | $ 382,359 |
Shares redeemed | (20,668) | (85,747) | (249,828) | (903,867) |
Net increase (decrease) | (9,814) | (48,373) | $ (116,502) | $ (521,508) |
Class C |
|
|
|
|
Shares sold | 167,010 | 255,067 | $ 2,017,388 | $ 2,772,131 |
Shares redeemed | (151,149) | (78,775) | (1,741,389) | (836,250) |
Net increase (decrease) | 15,861 | 176,292 | $ 275,999 | $ 1,935,881 |
Mid Cap Growth |
|
|
|
|
Shares sold | 6,967,439 | 9,630,254 | $ 85,935,348 | $ 108,629,221 |
Reinvestment of distributions | - | 8,231 | - | 86,426 |
Shares redeemed | (10,887,596) | (7,764,226) | (132,262,341) | (83,888,689) |
Net increase (decrease) | (3,920,157) | 1,874,259 | $ (46,326,993) | $ 24,826,958 |
Institutional Class |
|
|
|
|
Shares sold | 100,295 | 66,364 | $ 1,204,093 | $ 728,116 |
Reinvestment of distributions | - | 13 | - | 141 |
Shares redeemed | (28,686) | (30,561) | (346,631) | (336,681) |
Net increase (decrease) | 71,609 | 35,816 | $ 857,462 | $ 391,576 |
Annual Report
Notes to Financial Statements - continued
11. Other.
The Fund's organizational documents provide former and current trustees and officers with a limited indemnification against liabilities arising in connection with the performance of their duties to the Fund. In the normal course of business, the Fund may also enter into contracts that provide general indemnifications. The Fund's maximum exposure under these arrangements is unknown as this would be dependent on future claims that may be made against the Fund. The risk of material loss from such claims is considered remote.
Annual Report
Report of Independent Registered Public Accounting Firm
To the Trustees of Fidelity Devonshire Trust and the Shareholders of Fidelity Mid Cap Growth Fund:
In our opinion, the accompanying statement of assets and liabilities, including the schedule of investments, and the related statements of operations and of changes in net assets and the financial highlights present fairly, in all material respects, the financial position of Fidelity Mid Cap Growth Fund (a fund of Fidelity Devonshire Trust) at January 31, 2012, the results of its operations for the year then ended, the changes in its net assets for each of the two years in the period then ended and the financial highlights for each of the periods indicated, in conformity with accounting principles generally accepted in the United States of America. These financial statements and financial highlights (hereafter referred to as "financial statements") are the responsibility of the Fidelity Mid Cap Growth Fund's management. Our responsibility is to express an opinion on these financial statements based on our audits. We conducted our audits of these financial statements in accordance with the standards of the Public Company Accounting Oversight Board (United States). Those standards require that we plan and perform the audit to obtain reasonable assurance about whether the financial statements are free of material misstatement. An audit includes examining, on a test basis, evidence supporting the amounts and disclosures in the financial statements, assessing the accounting principles used and significant estimates made by management, and evaluating the overall financial statement presentation. We believe that our audits, which included confirmation of securities at January 31, 2012 by correspondence with the custodian and brokers, provide a reasonable basis for our opinion.
/s/ PricewaterhouseCoopers LLP
PricewaterhouseCoopers LLP
Boston, Massachusetts
March 13, 2012
Annual Report
Trustees and Officers
The Trustees, Members of the Advisory Board, and executive officers of the trust and fund, as applicable, are listed below. The Board of Trustees governs the fund and is responsible for protecting the interests of shareholders. The Trustees are experienced executives who meet periodically throughout the year to oversee the fund's activities, review contractual arrangements with companies that provide services to the fund, oversee management of the risks associated with such activities and contractual arrangements, and review the fund's performance. Except for James C. Curvey, each of the Trustees oversees 226 funds advised by FMR or an affiliate. Mr. Curvey oversees 430 funds advised by FMR or an affiliate.
The Trustees hold office without limit in time except that (a) any Trustee may resign; (b) any Trustee may be removed by written instrument, signed by at least two-thirds of the number of Trustees prior to such removal; (c) any Trustee who requests to be retired or who has become incapacitated by illness or injury may be retired by written instrument signed by a majority of the other Trustees; and (d) any Trustee may be removed at any special meeting of shareholders by a two-thirds vote of the outstanding voting securities of the trust. Each Trustee who is not an interested person (as defined in the 1940 Act) (Independent Trustee), shall retire not later than the last day of the calendar year in which his or her 75th birthday occurs. The Independent Trustees may waive this mandatory retirement age policy with respect to individual Trustees. The executive officers and Advisory Board Members hold office without limit in time, except that any officer and Advisory Board Member may resign or may be removed by a vote of a majority of the Trustees at any regular meeting or any special meeting of the Trustees. Except as indicated, each individual has held the office shown or other offices in the same company for the past five years.
Experience, Skills, Attributes, and Qualifications of the Fund's Trustees. The Governance and Nominating Committee has adopted a statement of policy that describes the experience, qualifications, attributes, and skills that are necessary and desirable for potential Independent Trustee candidates (Statement of Policy). The Board believes that each Trustee satisfied at the time he or she was initially elected or appointed a Trustee, and continues to satisfy, the standards contemplated by the Statement of Policy. The Governance and Nominating Committee also engages professional search firms to help identify potential Independent Trustee candidates who have the experience, qualifications, attributes, and skills consistent with the Statement of Policy. From time to time, additional criteria based on the composition and skills of the current Independent Trustees, as well as experience or skills that may be appropriate in light of future changes to board composition, business conditions, and regulatory or other developments, have also been considered by the professional search firms and the Governance and Nominating Committee. In addition, the Board takes into account the Trustees' commitment and participation in Board and committee meetings, as well as their leadership of standing and ad hoc committees throughout their tenure.
Annual Report
In determining that a particular Trustee was and continues to be qualified to serve as a Trustee, the Board has considered a variety of criteria, none of which, in isolation, was controlling. The Board believes that, collectively, the Trustees have balanced and diverse experience, qualifications, attributes, and skills, which allow the Board to operate effectively in governing the fund and protecting the interests of shareholders. Information about the specific experience, skills, attributes, and qualifications of each Trustee, which in each case led to the Board's conclusion that the Trustee should serve (or continue to serve) as a trustee of the fund, is provided below.
Board Structure and Oversight Function. James C. Curvey is an interested person (as defined in the 1940 Act) and currently serves as Acting Chairman. The Trustees have determined that an interested Chairman is appropriate and benefits shareholders because an interested Chairman has a personal and professional stake in the quality and continuity of services provided to the fund. Independent Trustees exercise their informed business judgment to appoint an individual of their choosing to serve as Chairman, regardless of whether the Trustee happens to be independent or a member of management. The Independent Trustees have determined that they can act independently and effectively without having an Independent Trustee serve as Chairman and that a key structural component for assuring that they are in a position to do so is for the Independent Trustees to constitute a substantial majority for the Board. The Independent Trustees also regularly meet in executive session. Ned C. Lautenbach serves as Chairman of the Independent Trustees and as such (i) acts as a liaison between the Independent Trustees and management with respect to matters important to the Independent Trustees and (ii) with management prepares agendas for Board meetings.
Fidelity funds are overseen by different Boards of Trustees. The fund's Board oversees Fidelity's equity and high income funds and another Board oversees Fidelity's investment-grade bond, money market, and asset allocation funds. The asset allocation funds may invest in Fidelity funds overseen by the fund's Board. The use of separate Boards, each with its own committee structure, allows the Trustees of each group of Fidelity funds to focus on the unique issues of the funds they oversee, including common research, investment, and operational issues. On occasion, the separate Boards establish joint committees to address issues of overlapping consequences for the Fidelity funds overseen by each Board.
The Trustees operate using a system of committees to facilitate the timely and efficient consideration of all matters of importance to the Trustees, the fund, and fund shareholders and to facilitate compliance with legal and regulatory requirements and oversight of the fund's activities and associated risks. The Board, acting through its committees, has charged FMR and its affiliates with (i) identifying events or circumstances the occurrence of which could have demonstrably adverse effects on the fund's business and/or reputation; (ii) implementing processes and controls to lessen the possibility that such events or circumstances occur or to mitigate the effects of such events or circumstances if they do occur; and (iii) creating and maintaining a system designed to evaluate continuously business and market conditions in order to facilitate the identification and implementation processes described in (i) and (ii) above. Because the day-to-day operations and activities of the fund's are carried out by or through FMR, its affiliates and other service providers, the fund's exposure to risks is mitigated but not eliminated by the processes overseen by the Trustees. While each of the Board's committees has responsibility for overseeing different aspects of the fund's activities, oversight is exercised primarily through the Operations, Audit, and Compliance Committees. In addition, the Independent Trustees have worked with FMR to enhance the Board's oversight of investment and financial risks, legal and regulatory risks, technology risks, and operational risks, including the development of additional risk reporting to the Board. For example, a working group comprised of Independent Trustees and FMR has worked and continues to work to review the Fidelity funds' valuation-related activities, reporting and risk management. Appropriate personnel, including but not limited to the fund's Chief Compliance Officer (CCO), FMR's internal auditor, the independent accountants, the fund's Treasurer and portfolio management personnel, make periodic reports to the Board's committees, as appropriate, including an annual review of FMR's risk management program for the Fidelity funds. The responsibilities of each standing committee, including their oversight responsibilities, are described further under "Standing Committees of the Fund's Trustees."
Annual Report
Trustees and Officers - continued
The fund's Statement of Additional Information (SAI) includes more information about the Trustees. To request a free copy, call Fidelity at 1-800-544-8544.
Interested Trustees*:
Correspondence intended for each Trustee who is an interested person may be sent to Fidelity Investments, 82 Devonshire Street, Boston, Massachusetts 02109.
Name, Age; Principal Occupations and Other Relevant Experience+ | |
James C. Curvey (76) | |
| Year of Election or Appointment: 2007 Mr. Curvey is Trustee and Acting Chairman of the Board of Trustees of certain Trusts. Mr. Curvey also serves as Trustee (2007-present) of other investment companies advised by FMR. Mr. Curvey is a Director of Fidelity Investments Money Management, Inc. (2009-present), Director of Fidelity Research & Analysis Co. (2009-present) and Director of FMR and FMR Co., Inc. (2007-present). Mr. Curvey is also Vice Chairman (2007-present) and Director of FMR LLC. In addition, Mr. Curvey serves as an Overseer for the Boston Symphony Orchestra and a member of the Trustees of Villanova University. Previously, Mr. Curvey was the Vice Chairman (2006-2007) and Director (2000-2007) of FMR Corp. |
Ronald P. O'Hanley (54) | |
| Year of Election or Appointment: 2011 Mr. O'Hanley is Director of FMR Co., Inc. (2010-present), Director of Fidelity Investments Money Management, Inc. (2010-present), Director of Fidelity Research & Analysis Company (2010-present), President of Fidelity Asset Management and Corporate Services and a member of Fidelity's Executive Committee (2010-present). Previously, Mr. O'Hanley served as President and Chief Executive Officer of BNY Mellon Asset Management (2007-2010). Mr. O'Hanley also served as Vice Chairman of Bank New York Mellon Corp. and a member of that firm's Executive Committee. Prior to the 2007 merger of The Bank of New York and Mellon Financial Corporation, he was Vice Chairman of Mellon Financial Corporation and President and Chief Executive Officer of Mellon Asset Management. He joined Mellon in February 1997. Mr. O'Hanley currently serves as Chairman of the Boston Public Library Foundation Board of Directors and sits on the Board of Directors of Beth Israel Deaconess Medical Center, the Board of Trustees of the Marine Biological Laboratory and the Advisory Board of the Maxwell School of Citizenship and Public Administration at Syracuse University. Mr. O'Hanley also chairs the Council on Asset Management for the Financial Services Roundtable and is a member of the Board of Directors of Institutional Investor's U.S. Institute. |
* Trustees have been determined to be "Interested Trustees" by virtue of, among other things, their affiliation with the trust or various entities under common control with FMR.
+ The information above includes each Trustee's principal occupation during the last five years and other information relating to the experience, attributes, and skills relevant to each Trustee's qualifications to serve as a Trustee, which led to the conclusion that each Trustee should serve as a Trustee for the fund.
Annual Report
Trustees and Officers - continued
Independent Trustees:
Correspondence intended for each Independent Trustee (that is, the Trustees other than the Interested Trustees) may be sent to Fidelity Investments, P.O. Box 55235, Boston, Massachusetts 02205-5235.
Name, Age; Principal Occupations and Other Relevant Experience+ | |
Dennis J. Dirks (63) | |
| Year of Election or Appointment: 2005 Prior to his retirement in May 2003, Mr. Dirks was Chief Operating Officer and a member of the Board of The Depository Trust & Clearing Corporation (DTCC). He also served as President, Chief Operating Officer, and Board member of The Depository Trust Company (DTC) and President and Board member of the National Securities Clearing Corporation (NSCC). In addition, Mr. Dirks served as Chief Executive Officer and Board member of the Government Securities Clearing Corporation, Chief Executive Officer and Board member of the Mortgage-Backed Securities Clearing Corporation, as a Trustee and a member of the Finance Committee of Manhattan College (2005-2008), and as a Trustee and a member of the Finance Committee of AHRC of Nassau County (2006-2008). Mr. Dirks is a member of the Independent Directors Council (IDC) Governing Council (2010-present) and Board of Directors for The Brookville Center for Children's Services, Inc. (2009-present). |
Alan J. Lacy (58) | |
| Year of Election or Appointment: 2008 Mr. Lacy serves as Senior Adviser (2007-present) of Oak Hill Capital Partners, L.P. (private equity). Mr. Lacy also served as Chief Executive Officer (2000-2005) and Vice Chairman (2005-2006) of Sears Holdings Corporation and Sears, Roebuck and Co. (retail). In addition, Mr. Lacy serves as a member of the Board of Directors of Dave & Buster's, Inc. (restaurant and entertainment complexes, 2010-present), The Hillman Companies, Inc. (hardware wholesalers, 2010-present), and Bristol-Myers Squibb Company (global pharmaceuticals, 2007-present). Mr. Lacy is a member of the Board of Trustees of The National Parks Conservation Association (2006-present). Previously, Mr. Lacy served as Chairman of the Board of Trustees of the National Parks Conservation Association (2008-2011) and as a member of the Board of Directors for the Western Union Company (global money transfer, 2006-2011). |
Ned C. Lautenbach (67) | |
| Year of Election or Appointment: 2000 Mr. Lautenbach is Chairman of the Independent Trustees of the Equity and High Income Funds (2006-present). Mr. Lautenbach currently serves as the Lead Director of the Eaton Corporation Board of Directors (diversified industrial, 1997-present). Mr. Lautenbach is also a member of the Board of Directors of the Philharmonic Center for the Arts in Naples, Florida (1999-present); a member of the Board of Trustees of Fairfield University (2005-present); and a member of the Council on Foreign Relations (1994-present). Previously, Mr. Lautenbach was a Partner/Advisory Partner at Clayton, Dubilier & Rice, LLC (private equity investment, 1998-2010), as well as a Director of Sony Corporation (2006-2007). |
Joseph Mauriello (67) | |
| Year of Election or Appointment: 2008 Prior to his retirement in January 2006, Mr. Mauriello served in numerous senior management positions including Deputy Chairman and Chief Operating Officer (2004-2005), and Vice Chairman of Financial Services (2002-2004) of KPMG LLP US (professional services, 1965-2005). Mr. Mauriello currently serves as a member of the Board of Directors of XL Group plc. (global insurance and re-insurance, 2006-present) and of Arcadia Resources Inc. (health care services and products, 2007-present). Previously, Mr. Mauriello served as a Director of the Hamilton Funds of the Bank of New York (2006-2007). |
Robert W. Selander (61) | |
| Year of Election or Appointment: 2011 Previously, Mr. Selander served as a Member of the Advisory Board of Fidelity's Equity and High Income Funds (2011), Executive Vice Chairman (2010), Chief Executive Officer (2009-2010), and President and Chief Executive Officer (1997-2009) of Mastercard, Inc. |
Cornelia M. Small (67) | |
| Year of Election or Appointment: 2005 Ms. Small is a member of the Board of Directors of the Teagle Foundation (2009-present). Ms. Small is also a member of the Investment Committee, and Chair (2008-present) and a member of the Board of Trustees of Smith College. In addition, Ms. Small serves on the Investment Committee of the Berkshire Taconic Community Foundation (2008-present). Previously, Ms. Small served as Chairperson of the Investment Committee (2002-2008) of Smith College. In addition, Ms. Small served as Chief Investment Officer, Director of Global Equity Investments, and a member of the Board of Directors of Scudder, Stevens & Clark and Scudder Kemper Investments. |
William S. Stavropoulos (72) | |
| Year of Election or Appointment: 2002 Mr. Stavropoulos is Vice Chairman of the Independent Trustees of the Equity and High Income Funds (2006-present). Mr. Stavropoulos serves as President and Founder of the Michigan Baseball Foundation, the Great Lakes Loons (2007-present). Mr. Stavropoulos is Chairman Emeritus of the Board of Directors of The Dow Chemical Company, where he previously served in numerous senior management positions, including President, CEO (1995-2000; 2002-2004), Chairman of the Executive Committee (2000-2006), and as a member of the Board of Directors (1990-2006). Currently, Mr. Stavropoulos is Chairman of Univar (global distributor of commodity and specialty chemicals, 2010-present), a Director of Teradata Corporation (data warehousing and technology solutions, 2008-present), Chemical Financial Corporation, Maersk Inc. (industrial conglomerate), Tyco International, Inc. (multinational manufacturing and services, 2007-present), and a member of the Advisory Board for Metalmark Capital (private equity investment, 2005-present). Mr. Stavropoulos is a special advisor to Clayton, Dubilier & Rice, LLC (private equity investment). In addition, Mr. Stavropoulos is a member of the University of Notre Dame Advisory Council for the College of Science. |
David M. Thomas (62) | |
| Year of Election or Appointment: 2008 Previously, Mr. Thomas served as Executive Chairman (2005-2006) and Chairman and Chief Executive Officer (2000-2005) of IMS Health, Inc. (pharmaceutical and healthcare information solutions). In addition, Mr. Thomas serves as a member of the Board of Directors of Fortune Brands, Inc. (consumer products), and Interpublic Group of Companies, Inc. (marketing communication, 2004-present). |
Michael E. Wiley (61) | |
| Year of Election or Appointment: 2008 Mr. Wiley also serves as a Director of Asia Pacific Exploration Consolidated (international oil and gas exploration and production, 2008-present). Mr. Wiley serves as a Director of Tesoro Corporation (independent oil refiner and marketer, 2005-present), and a Director of Bill Barrett Corporation (exploration and production, 2005-present). In addition, Mr. Wiley also serves as a Director of Post Oak Bank (privately-held bank, 2004-present). Previously, Mr. Wiley served as a member of the Board of Trustees of the University of Tulsa (2000-2006; 2007-2010), as a Senior Energy Advisor of Katzenbach Partners, LLC (consulting, 2006-2007), as an Advisory Director of Riverstone Holdings (private investment), Chairman, President, and CEO of Baker Hughes, Inc. (oilfield services, 2000-2004), and as Director of Spinnaker Exploration Company (exploration and production, 2001-2005). |
Annual Report
+ The information above includes each Trustee's principal occupation during the last five years and other information relating to the experience, attributes, and skills relevant to each Trustee's qualifications to serve as a Trustee, which led to the conclusion that each Trustee should serve as a Trustee for the fund.
Advisory Board Members and Executive Officers:
Correspondence intended for each executive officer may be sent to Fidelity Investments, 82 Devonshire Street, Boston, Massachusetts 02109.
Name, Age; Principal Occupation | |
Edward C. Johnson 3d (81) | |
| Year of Election or Appointment: 2011 Member of the Advisory Board of Fidelity's Equity and High Income Funds. Mr. Johnson serves as Chief Executive Officer, Chairman, and a Director of FMR LLC, and also serves as Chairman and Director of FIL Limited. Previously, Mr. Johnson served as a Trustee and Chairman of the Board of certain Fidelity Trusts, Chairman and a Director of FMR, Chairman and a Director of FMR Co., Inc., and President of FMR LLC (2006-2007). |
Peter S. Lynch (68) | |
| Year of Election or Appointment: 2003 Member of the Advisory Board of Fidelity's Equity and High Income Funds. Mr. Lynch is Vice Chairman and a Director of FMR and FMR Co., Inc. In addition, Mr. Lynch serves as a Trustee of Boston College and as the Chairman of the Inner-City Scholarship Fund. Previously, Mr. Lynch served on the Special Olympics International Board of Directors (1997-2006). |
Kenneth B. Robins (42) | |
| Year of Election or Appointment: 2008 President and Treasurer of Fidelity's Equity and High Income Funds. Mr. Robins also serves as President and Treasurer (2010-present) and Assistant Treasurer (2009-present) of other Fidelity funds and is an employee of Fidelity Investments (2004-present). Previously, Mr. Robins served as Deputy Treasurer of the Fidelity funds (2005-2008) and Treasurer and Chief Financial Officer of The North Carolina Capital Management Trust: Cash and Term Portfolios (2006-2008). |
Bruce T. Herring (46) | |
| Year of Election or Appointment: 2006 Vice President of certain Equity Funds. Mr. Herring also serves as President of Fidelity Research & Analysis Company (2010-present), Chief Investment Officer and Director of Fidelity Management & Research (U.K.) Inc. (2010-present) and Group Chief Investment Officer of FMR. Previously, Mr. Herring served as Vice President (2005-2006) and Senior Vice President (2006-2007) of Fidelity Management & Research Company, Vice President of FMR Co., Inc. (2001-2007) and as a portfolio manager for Fidelity U.S. Equity Funds. |
Brian B. Hogan (47) | |
| Year of Election or Appointment: 2009 Vice President of Equity and High Income Funds. Mr. Hogan also serves as President of FMR's Equity Division (2009-present). Previously, Mr. Hogan served as Senior Vice President, Equity Research of FMR (2006-2009) and as a portfolio manager. |
Scott C. Goebel (44) | |
| Year of Election or Appointment: 2008 Secretary and Chief Legal Officer (CLO) of the Fidelity funds. Mr. Goebel also serves as Secretary of Fidelity Investments Money Management, Inc. (FIMM) (2010-present) and Fidelity Research and Analysis Company (FRAC) (2010-present); Secretary and CLO of The North Carolina Capital Management Trust: Cash and Term Portfolios (2008-present); General Counsel, Secretary, and Senior Vice President of FMR (2008-present) and FMR Co., Inc. (2008-present); employed by FMR LLC or an affiliate (2001-present); Chief Legal Officer of Fidelity Management & Research (Hong Kong) Limited (2008-present) and Assistant Secretary of Fidelity Management & Research (Japan) Inc. (2008-present), and Fidelity Management & Research (U.K.) Inc. (2008-present). Previously, Mr. Goebel served as Assistant Secretary of FIMM (2008-2010), FRAC (2008-2010), and the Funds (2007-2008) and as Vice President and Secretary of Fidelity Distributors Corporation (FDC) (2005-2007). |
William C. Coffey (42) | |
| Year of Election or Appointment: 2009 Assistant Secretary of Fidelity's Equity and High Income Funds. Mr. Coffey also serves as Senior Vice President and Deputy General Counsel of FMR LLC (2010-present), and is an employee of Fidelity Investments. Previously, Mr. Coffey served as Vice President and Associate General Counsel of FMR LLC (2005-2009). |
Holly C. Laurent (57) | |
| Year of Election or Appointment: 2008 Anti-Money Laundering (AML) Officer of the Fidelity funds. Ms. Laurent also serves as AML Officer of The North Carolina Capital Management Trust: Cash and Term Portfolios (2008-present) and is an employee of Fidelity Investments. Previously, Ms. Laurent was Senior Vice President and Head of Legal for Fidelity Business Services India Pvt. Ltd. (2006-2008), and Senior Vice President, Deputy General Counsel and Group Head for FMR LLC (2005-2006). |
Christine Reynolds (53) | |
| Year of Election or Appointment: 2008 Chief Financial Officer of the Fidelity funds. Ms. Reynolds became President of Fidelity Pricing and Cash Management Services (FPCMS) in August 2008. Ms. Reynolds served as Chief Operating Officer of FPCMS (2007-2008). Previously, Ms. Reynolds served as President, Treasurer, and Anti-Money Laundering officer of the Fidelity funds (2004-2007). |
Kenneth A. Rathgeber (64) | |
| Year of Election or Appointment: 2004 Chief Compliance Officer of Fidelity's Equity and High Income Funds. Mr. Rathgeber is Chief Compliance Officer of Fidelity Management & Research (Hong Kong) Limited (2008-present), Fidelity Management & Research (Japan) Inc. (2008-present), FMR (2005-present), FMR Co., Inc. (2005-present), Fidelity Management & Research (U.K.) Inc. (2005-present), Fidelity Research & Analysis Company (2005-present), Fidelity Investments Money Management, Inc. (2005-present), Pyramis Global Advisors, LLC (2005-present), and Strategic Advisers, Inc. (2005-present). |
Joseph F. Zambello (54) | |
| Year of Election or Appointment: 2011 Deputy Treasurer of the Fidelity funds. Mr. Zambello is an employee of Fidelity Investments. Previously, Mr. Zambello served as Vice President of FMR's Program Management Group (2009-2011) and Vice President of the Transfer Agent Oversight Group (2005-2009). |
Adrien E. Deberghes (44) | |
| Year of Election or Appointment: 2008 Deputy Treasurer of Fidelity's Equity and High Income Funds. Mr. Deberghes also serves as Vice President and Assistant Treasurer of Fidelity Rutland Square Trust II and Fidelity Commonwealth Trust II (2011-present), Assistant Treasurer of other Fidelity funds (2010-present), and is an employee of Fidelity Investments (2008-present). Previously, Mr. Deberghes served as Senior Vice President of Mutual Fund Administration at State Street Corporation (2007-2008), Senior Director of Mutual Fund Administration at Investors Bank & Trust (2005-2007), and Director of Finance for Dunkin' Brands (2000-2005). |
Stephanie J. Dorsey (42) | |
| Year of Election or Appointment: 2010 Assistant Treasurer of Fidelity's Equity and High Income Funds. Ms. Dorsey also serves as Deputy Treasurer of other Fidelity funds (2008-present) and is an employee of Fidelity Investments (2008-present). Previously, Ms. Dorsey served as Treasurer (2004-2008) of the JPMorgan Mutual Funds and Vice President (2004-2008) of JPMorgan Chase Bank. |
John R. Hebble (53) | |
| Year of Election or Appointment: 2009 Assistant Treasurer of Fidelity's Equity and High Income Funds. Mr. Hebble also serves as President (2011-present), Treasurer, and Chief Financial Officer of The North Carolina Capital Management Trust: Cash and Term Portfolios (2008-present), President and Treasurer of other Fidelity funds (2008-present) and is an employee of Fidelity Investments. |
Gary W. Ryan (53) | |
| Year of Election or Appointment: 2005 Assistant Treasurer of the Fidelity funds. Mr. Ryan is an employee of Fidelity Investments. Previously, Mr. Ryan served as Vice President of Fund Reporting in Fidelity Pricing and Cash Management Services (FPCMS) (1999-2005). |
Jonathan Davis (43) | |
| Year of Election or Appointment: 2010 Assistant Treasurer of the Fidelity funds. Mr. Davis is also Assistant Treasurer of Fidelity Rutland Square Trust II and Fidelity Commonwealth Trust II. Mr. Davis is an employee of Fidelity Investments. Previously, Mr. Davis served as Vice President and Associate General Counsel of FMR LLC (2003-2010). |
Annual Report
Managing Your Investments
Fidelity offers several ways to conveniently manage your personal investments via your telephone or PC. You can access your account information, conduct trades and research your investments 24 hours a day.
By Phone
Fidelity Automated Service Telephone provides a single toll-free number to access account balances, positions, quotes and trading. It's easy to navigate the service, and on your first call, the system will help you create a personal identification number (PIN) for security.
(phone graphic)Fidelity Automated
Service Telephone (FAST®)
1-800-544-5555
Press
1 For mutual fund and brokerage trading.
2 For quotes.*
3 For account balances and holdings.
4 To review orders and mutual
fund activity.
5 To change your PIN.
*0 To speak to a Fidelity representative.
By PC
Fidelity's web site on the Internet provides a wide range of information, including daily financial news, fund performance, interactive planning tools and news about Fidelity products and services.
(computer graphic)Fidelity's Web Site
www.fidelity.com
* When you call the quotes line, please remember that a fund's yield and return will vary and, except for money market funds, share price will also vary. This means that you may have a gain or loss when you sell your shares. There is no assurance that money market funds will be able to maintain a stable $1 share price; an investment in a money market fund is not insured or guaranteed by the U.S. government. Total returns are historical and include changes in share price, reinvestment of dividends and capital gains distributions, and the effects of any sales charges.
Annual Report
To Visit Fidelity
For directions and hours,
please call 1-800-544-9797.
Arizona
7001 West Ray Road
Chandler, AZ
15445 N. Scottsdale Road
Scottsdale, AZ
17550 North 75th Avenue
Glendale, AZ
5330 E. Broadway Blvd
Tucson, AZ
California
815 East Birch Street
Brea, CA
1411 Chapin Avenue
Burlingame, CA
851 East Hamilton Avenue
Campbell, CA
601 Larkspur Landing Circle
Larkspur, CA
2000 Avenue of the Stars
Los Angeles, CA
27101 Puerta Real
Mission Viejo, CA
73575 El Paseo
Palm Desert, CA
251 University Avenue
Palo Alto, CA
123 South Lake Avenue
Pasadena, CA
16656 Bernardo Ctr. Drive
Rancho Bernardo, CA
1220 Roseville Parkway
Roseville, CA
1740 Arden Way
Sacramento, CA
7676 Hazard Center Drive
San Diego, CA
11943 El Camino Real
San Diego, CA
8 Montgomery Street
San Francisco, CA
3793 State Street
Santa Barbara, CA
1200 Wilshire Boulevard
Santa Monica, CA
398 West El Camino Real
Sunnyvale, CA
111 South Westlake Blvd
Thousand Oaks, CA
21701 Hawthorne Boulevard
Torrance, CA
2001 North Main Street
Walnut Creek, CA
6326 Canoga Avenue
Woodland Hills, CA
2211 Michelson Drive
Irvine, CA
Colorado
281 East Flatiron Circle
Broomfield, CO
1625 Broadway
Denver, CO
9185 Westview Road
Lone Tree, CO
Connecticut
48 West Putnam Avenue
Greenwich, CT
265 Church Street
New Haven, CT
300 Atlantic Street
Stamford, CT
29 South Main Street
West Hartford, CT
1261 Post Road
Fairfield, CT
Delaware
400 Delaware Avenue
Wilmington, DE
Florida
175 East Altamonte Drive
Altamonte Springs, FL
1400 Glades Road
Boca Raton, FL
121 Alhambra Plaza
Coral Gables, FL
2948 N. Federal Highway
Ft. Lauderdale, FL
4671 Town Center Parkway
Jacksonville, FL
8880 Tamiami Trail, North
Naples, FL
230 Royal Palm Way
Palm Beach, FL
3501 PGA Boulevard
Palm Beach Gardens, FL
3550 Tamiami Trail, South
Sarasota, FL
1502 N. Westshore Blvd.
Tampa, FL
2465 State Road 7
Wellington, FL
Georgia
3242 Peachtree Road
Atlanta, GA
1000 Abernathy Road
Atlanta, GA
Illinois
One North LaSalle Street
Chicago, IL
401 North Michigan Avenue
Chicago, IL
One Skokie Valley Road
Highland Park, IL
1415 West 22nd Street
Oak Brook, IL
15105 S LaGrange Road
Orland Park, IL
1572 East Golf Road
Schaumburg, IL
1823 Freedom Drive
Naperville, IL
Indiana
8480 Keystone Crossing
Indianapolis, IN
Kansas
5400 College Boulevard
Overland Park, KS
Maine
Three Canal Plaza
Portland, ME
Maryland
7315 Wisconsin Avenue
Bethesda, MD
610 York Road
Towson, MD
Massachusetts
801 Boylston Street
Boston, MA
155 Congress Street
Boston, MA
300 Granite Street
Braintree, MA
44 Mall Road
Burlington, MA
238 Main Street
Cambridge, MA
200 Endicott Street
Danvers, MA
Annual Report
405 Cochituate Road
Framingham, MA
551 Boston Turnpike
Shrewsbury, MA
Michigan
500 E. Eisenhower Pkwy.
Ann Arbor, MI
280 N. Old Woodward Ave.
Birmingham, MI
30200 Northwestern Hwy.
Farmington Hills, MI
43420 Grand River Avenue
Novi, MI
3480 28th Street
Grand Rapids, MI
2425 S. Linden Road STE E
Flint, MI
Minnesota
7740 France Avenue South
Edina, MN
8342 3rd Street North
Oakdale, MN
Missouri
1524 South Lindbergh Blvd.
St. Louis, MO
Nevada
2225 Village Walk Drive
Henderson, NV
New Jersey
501 Route 73 South
Marlton, NJ
150 Essex Street
Millburn, NJ
35 Morris Street
Morristown, NJ
396 Route 17, North
Paramus, NJ
3518 Route 1 North
Princeton, NJ
530 Broad Street
Shrewsbury, NJ
New Mexico
2261 Q Street NE
Albuquerque, NM
New York
1130 Franklin Avenue
Garden City, NY
37 West Jericho Turnpike
Huntington Station, NY
1271 Avenue of the Americas
New York, NY
980 Madison Avenue
New York, NY
61 Broadway
New York, NY
350 Park Avenue
New York, NY
200 Fifth Avenue
New York, NY
733 Third Avenue
New York, NY
2070 Broadway
New York, NY
1075 Northern Blvd.
Roslyn, NY
799 Central Park Avenue
Scarsdale, NY
3349 Monroe Avenue
Rochester, NY
North Carolina
4611 Sharon Road
Charlotte, NC
7011 Fayetteville Road
Durham, NC
Ohio
3805 Edwards Road
Cincinnati, OH
1324 Polaris Parkway
Columbus, OH
1800 Crocker Road
Westlake, OH
28699 Chagrin Boulevard
Woodmere Village, OH
Oregon
7493 SW Bridgeport Road
Tigard, OR
Pennsylvania
600 West DeKalb Pike
King of Prussia, PA
1735 Market Street
Philadelphia, PA
12001 Perry Highway
Wexford, PA
Rhode Island
10 Memorial Boulevard
Providence, RI
Tennessee
3018 Peoples Street
Johnson City, TN
7628 West Farmington Blvd.
Germantown, TN
2035 Mallory Lane
Franklin, TN
Texas
10000 Research Boulevard
Austin, TX
4001 Northwest Parkway
Dallas, TX
12532 Memorial Drive
Houston, TX
2701 Drexel Drive
Houston, TX
6560 Fannin Street
Houston, TX
1701 Lake Robbins Drive
The Woodlands, TX
6500 N. MacArthur Blvd.
Irving, TX
6005 West Park Boulevard
Plano, TX
1576 East Southlake Blvd.
Southlake, TX
15600 Southwest Freeway
Sugar Land, TX
139 N. Loop 1604 East
San Antonio, TX
Utah
279 West South Temple
Salt Lake City, UT
Virginia
1861 International Drive
McLean, VA
11957 Democracy Drive
Reston, VA
Washington
10500 NE 8th Street
Bellevue, WA
1518 6th Avenue
Seattle, WA
304 Strander Blvd
Tukwila, WA
Washington, DC
1900 K Street, N.W.
Washington, DC
Wisconsin
16020 West Bluemound Road
Brookfield, WI
Fidelity Brokerage Services, Inc., 100 Summer St., Boston, MA 02110 Member NYSE/SIPC
Annual Report
To Write Fidelity
We'll give your correspondence immediate attention and send you written confirmation upon completion of your request.
(envelope graphic)Making Changes
To Your Account
(such as changing name, address, bank, etc.)
Fidelity Investments
P.O. Box 770001
Cincinnati, OH 45277-0002
(envelope graphic)For Non-Retirement
Accounts
Buying shares
Fidelity Investments
P.O. Box 770001
Cincinnati, OH 45277-0003
Overnight Express
Fidelity Investments
Attn: Distribution Services
100 Crosby Parkway - KC1H
Covington, KY 41015
Selling shares
Fidelity Investments
P.O. Box 770001
Cincinnati, OH 45277-0035
Overnight Express
Fidelity Investments
Attn: Distribution Services
100 Crosby Parkway - KC1H
Covington, KY 41015
General Correspondence
Fidelity Investments
P.O. Box 500
Merrimack, NH 03054-0500
(envelope graphic)For Retirement
Accounts
Buying shares
Fidelity Investments
P.O. Box 770001
Cincinnati, OH 45277-0003
Selling shares
Fidelity Investments
P.O. Box 770001
Cincinnati, OH 45277-0035
Overnight Express
Fidelity Investments
Attn: Distribution Services
100 Crosby Parkway - KC1H
Covington, KY 41015
General Correspondence
Fidelity Investments
P.O. Box 500
Merrimack, NH 03054-0500
Annual Report
Investment Adviser
Fidelity Management & Research Company
Boston, MA
Investment Sub-Advisers
FMR Co., Inc.
Fidelity Management & Research
(U.K.) Inc.
Fidelity Management & Research
(Hong Kong) Limited
Fidelity Management & Research
(Japan) Inc.
General Distributor
Fidelity Distributors Corporation
Boston, MA
Transfer and Service Agents
Fidelity Investments Institutional
Operations Company, Inc.
Boston, MA
Fidelity Service Company, Inc.
Boston, MA
Custodian
Citibank, N.A.
New York, NY
The Fidelity Telephone Connection
Mutual Fund 24-Hour Service
Exchanges/Redemptions
and Account Assistance 1-800-544-6666
Product Information 1-800-544-6666
Retirement Accounts 1-800-544-4774
(8 a.m. - 9 p.m.)
TDD Service 1-800-544-0118
for the deaf and hearing impaired
(9 a.m. - 9 p.m. Eastern time)
Fidelity Automated Service
Telephone (FAST®)
1-800-544-5555
Automated line for quickest service
MCG-UANN-0312
1.900201.102
(Fidelity Investment logo)(registered trademark)
Corporate Headquarters
82 Devonshire St., Boston, MA 02109
www.fidelity.com
(Fidelity Investment logo)(registered trademark)
Fidelity Advisor®
Mid Cap Growth
Fund - Class A, Class T, Class B
and Class C
Annual Report
January 31, 2012
(Fidelity Cover Art)
Class A, Class T, Class B, and Class C are classes of Fidelity®
Mid Cap Growth Fund
Contents
Chairman's Message | The Chairman's message to shareholders. | |
Performance | How the fund has done over time. | |
Management's Discussion of Fund Performance | The Portfolio Manager's review of fund performance and strategy. | |
Shareholder Expense Example | An example of shareholder expenses. | |
Investment Changes | A summary of major shifts in the fund's investments over the past six months. | |
Investments | A complete list of the fund's investments with their market values. | |
Financial Statements | Statements of assets and liabilities, operations, and changes in net assets, as well as financial highlights. | |
Notes | Notes to the financial statements. | |
Report of Independent Registered Public Accounting Firm |
| |
Trustees and Officers |
|
To view a fund's proxy voting guidelines and proxy voting record for the 12-month period ended June 30, visit http://www.fidelity.com/proxyvotingresults or visit the Securities and Exchange Commission's (SEC) web site at http://www.sec.gov. You may also call 1-877-208-0098 to request a free copy of the proxy voting guidelines.
Standard & Poor's, S&P and S&P 500 are registered service marks of The McGraw-Hill Companies, Inc. and have been licensed for use by Fidelity Distributors Corporation.
Other third party marks appearing herein are the property of their respective owners.
All other marks appearing herein are registered or unregistered trademarks or service marks of FMR LLC or an affiliated company.
Annual Report
This report and the financial statements contained herein are submitted for the general information of the shareholders of the fund. This report is not authorized for distribution to prospective investors in the fund unless preceded or accompanied by an effective prospectus.
A fund files its complete schedule of portfolio holdings with the SEC for the first and third quarters of each fiscal year on Form N-Q. Forms N-Q are available on the SEC's web site at http://www.sec.gov. A fund's Forms N-Q may be reviewed and copied at the SEC's Public Reference Room in Washington, DC. Information regarding the operation of the SEC's Public Reference Room may be obtained by calling 1-800-SEC-0330. For a complete list of a fund's portfolio holdings, view the most recent holdings listing, semiannual report, or annual report on Fidelity's web site at http://www.fidelity.com, http://www.advisor.fidelity.com, or http://www.401k.com, as applicable.
NOT FDIC INSURED • MAY LOSE VALUE • NO BANK GUARANTEE
Neither the fund nor Fidelity Distributors Corporation is a bank.
Annual Report
Chairman's Message
(photo_of_James_C_Curvey)
Dear Shareholder:
Following a year marked by unusually high volatility, 2012 began with most major asset classes advancing steadily in January. For U.S. equities, it was the strongest start to a new year since 1997. International stocks fared even better, despite continued uncertainty related to the sovereign debt crisis in Europe. Investors have been acutely sensitive to the latest news, for better or worse, coming out of the eurozone and its impact on financial markets. As we look ahead, the unresolved debt crisis in Europe remains at the center of a series of risk factors, summarized below, that we believe have the greatest potential to influence the global investment landscape.
Deleveraging and the economy
In the euro-currency area, fiscal austerity among nations and debt deleveraging among financial companies loaded with sovereign debt are deflationary measures and serve to hinder economic growth in the short term. Such an economic and financial-market scenario has not been historically supportive of strong performance among riskier assets, and emerges at a time when many nations need a resurgent economy to assist them in closing their budget deficits and in building confidence among bond buyers to help them refinance their existing debt obligations.
Slowdown in China and Europe
China's economy is the second-largest in the world, and it has been the biggest contributor to global growth since the end of the last recession. Thus, the slower pace of domestic growth in China has led to lower demand for imports of commodities and other construction materials from the rest of the world. In addition, economic weakness in Europe and the broad-based global economic slowdown are putting pressure on China's export growth, which has been largely responsible for its breakneck pace of annual gross domestic product (GDP) growth during the past three decades.
Credit deterioration and contagion
The heightened macroeconomic risk and elevated credit risk swirling around certain European nations and financial institutions have caused many market participants to avoid purchases of or reduce exposure to short-term debt offerings by these issuers. With increased credit risk, there are growing concerns about the potential credit contraction and contagion from European issuers spreading to other financial markets.
We invite you to learn more by visiting us on the Internet or calling us by phone. It is our privilege to provide the resources you need to choose investments that are right for you.
Sincerely,
(The acting chairman's signature appears here.)
James C. Curvey
Acting Chairman
Annual Report
Performance: The Bottom Line
Average annual total return reflects the change in the value of an investment, assuming reinvestment of the class' distributions from dividend income and capital gains (the profits earned upon the sale of securities that have grown in value, if any) and assuming a constant rate of performance each year. The $10,000 table and the fund's returns do not reflect the deduction of taxes that a shareholder would pay on fund distributions or the redemption of fund shares. During periods of reimbursement by Fidelity, a fund's total return will be greater than it would be had the reimbursement not occurred. How a fund did yesterday is no guarantee of how it will do tomorrow.
Average Annual Total Returns
Periods ended January 31, 2012 | Past 1 | Past 5 | Past 10 |
Class A (incl. 5.75% sales charge) A | -7.71% | -2.92% | 2.44% |
Class T (incl. 3.50% sales charge) B | -5.75% | -2.76% | 2.53% |
Class B (incl. contingent deferred sales charge) C | -7.64% | -2.86% | 2.67% |
Class C (incl. contingent deferred sales charge) D | -3.75% | -2.49% | 2.67% |
A Class A shares bear a 0.25% 12b-1 fee. The initial offering of Class A shares took place on February 13, 2007. Returns prior to February 13, 2007 are those of Fidelity® Mid Cap Growth Fund, the original class of the fund, which has no 12b-1 fee. Had Class A's 12b-1 fee been reflected, returns prior to February 13, 2007 would have been lower.
B Class T shares bear a 0.50% 12b-1 fee. The initial offering of Class T shares took place on February 13, 2007. Returns prior to February 13, 2007 are those of Fidelity Mid Cap Growth Fund, the original class of the fund, which has no 12b-1 fee. Had Class T's 12b-1 fee been reflected, returns prior to February 13, 2007 would have been lower.
C Class B shares bear a 1.00% 12b-1 fee. The initial offering of Class B shares took place on February 13, 2007. Returns prior to February 13, 2007 are those of Fidelity Mid Cap Growth Fund, the original class of the fund, which has no 12b-1 fee. Had Class B's 12b-1 fee been reflected, returns prior to February 13, 2007 would have been lower. Class B shares' contingent deferred sales charge included in the past one year, past five years, and past ten years total return figures are 5%, 2%, and 0%, respectively.
D Class C shares bear a 1.00% 12b-1 fee. The initial offering of Class C shares took place on February 13, 2007. Returns prior to February 13, 2007 are those of Fidelity Mid Cap Growth Fund, the original class of the fund, which has no 12b-1 fee. Had Class C's 12b-1 fee been reflected, returns prior to February 13, 2007 would have been lower. Class C shares' contingent deferred sales charge included in the past one year, past five years, and past ten years total return figures are 1%, 0%, and 0%, respectively.
Annual Report
$10,000 Over 10 Years
Let's say hypothetically that $10,000 was invested in Fidelity Advisor® Mid Cap Growth Fund - Class A on January 31, 2002, and the current 5.75% sales charge was paid. The chart shows how the value of your investment would have changed, and also shows how the Russell Midcap® Growth Index performed over the same period. The initial offering of Class A took place on February 13, 2007. See the previous page for additional information regarding the performance of Class A.

Annual Report
Management's Discussion of Fund Performance
Market Recap: After enduring one of the most volatile trading periods on record, U.S. stocks posted a gain for the 12 months ending January 31, 2012, sparked by a January rally. Strong corporate earnings reports and hints of economic recovery sent stocks mostly upward through April, when sovereign debt woes in Europe sparked fear of a global slowdown. In the summer, equities plummeted on eurozone instability, debate over the U.S. debt ceiling and a historic downgrade of the nation's sovereign debt rating. After falling as much as 13% by early August, the broad-based S&P 500® Index seesawed back to end the period on an optimistic note. For the full 12 months, the S&P 500® rose 4.22%, while the technology-laden Nasdaq Compositer Index added 5.26%. Investors began to shed perceived riskier smaller-cap stocks in favor of larger, more-established and dividend-paying names, helping to drive the Dow Jones® Industrial Average up 9.12% for the year, while the Russell 2000® - a proxy for small-caps - and Russell Midcap® indexes added 2.86% and 2.25%, respectively. Within the S&P 500®, defensive sectors such as health care (+16%) and utilities (+14%) fared best, while financials (-12%) struggled. Foreign developed-markets stocks were stung by Europe's turmoil, and the MSCI® EAFE® (Europe, Australasia, Far East) Index fell 9.49%.
Comments from Steven Calhoun, Portfolio Manager of Fidelity Advisor® Mid Cap Growth Fund: During the year, the fund's Class A, Class T, Class B and Class C shares returned -2.08%, -2.33%, -2.78% and -2.78%, respectively (excluding sales charges), well behind the 3.42% gain of the Russell Midcap® Growth Index. Versus the index, unrewarding stock selection and a sizable overweighting in the weak-performing energy sector materially hurt the fund's performance, as did stock picking and an underweighting in the strong-performing consumer discretionary sector. China-based seed supplier Origin Agritech, our largest individual detractor, declined against the backdrop of tighter credit and weak stock market conditions in China, among other factors. Two producers of metallurgical coal, Alpha Natural Resources and Walter Energy, also dampened performance. Conversely, stock picking in health care aided performance, while positioning in information technology also helped. The shares of biopharmaceutical firm Inhibitex, the fund's top contributor, benefited from favorable test results for one of its hepatitis C drugs and from a lucrative buyout offer received by the company in January. I sold Inhibitex during the period. Also aiding performance were Idenix Pharmaceuticals and nitrogen fertilizer producer CVR Partners. Most of the stocks I've mentioned in this report were out-of-index holdings.
Annual Report
The views expressed above reflect those of the portfolio manager(s) only through the end of the period as stated on the cover of this report and do not necessarily represent the views of Fidelity or any other person in the Fidelity organization. Any such views are subject to change at any time based upon market or other conditions and Fidelity disclaims any responsibility to update such views. These views may not be relied on as investment advice and, because investment decisions for a Fidelity fund are based on numerous factors, may not be relied on as an indication of trading intent on behalf of any Fidelity fund.
Annual Report
Shareholder Expense Example
As a shareholder of the Fund, you incur two types of costs: (1) transaction costs, including sales charges (loads) on purchase payments or redemption proceeds, redemption fees, and (2) ongoing costs, including management fees, distribution and/or service (12b-1) fees and other Fund expenses. This Example is intended to help you understand your ongoing costs (in dollars) of investing in the Fund and to compare these costs with the ongoing costs of investing in other mutual funds.
The Example is based on an investment of $1,000 invested at the beginning of the period and held for the entire period (August 1, 2011 to January 31, 2012).
Actual Expenses
The first line of the accompanying table for each class of the Fund provides information about actual account values and actual expenses. You may use the information in this line, together with the amount you invested, to estimate the expenses that you paid over the period. Simply divide your account value by $1,000.00 (for example, an $8,600 account value divided by $1,000.00 = 8.6), then multiply the result by the number in the first line for a class of the Fund under the heading entitled "Expenses Paid During Period" to estimate the expenses you paid on your account during this period. A small balance maintenance fee of $12.00 that is charged once a year may apply for certain accounts with a value of less than $2,000. This fee is not included in the table below. If it was, the estimate of expenses you paid during the period would be higher, and your ending account value lower, by this amount. In addition, the Fund, as a shareholder in the underlying Fidelity Central Funds, will indirectly bear its pro-rata share of the fees and expenses incurred by the underlying Fidelity Central Funds. These fees and expenses are not included in the Fund's annualized expense ratio used to calculate the expense estimate in the table below.
Hypothetical Example for Comparison Purposes
The second line of the accompanying table for each class of the Fund provides information about hypothetical account values and hypothetical expenses based on a Class' actual expense ratio and an assumed rate of return of 5% per year before expenses, which is not the Class' actual return. The hypothetical account values and expenses may not be used to estimate the actual ending account balance or expenses you paid for the period. You may use this information to compare the ongoing costs of investing in the Fund and other funds. To do so, compare this 5% hypothetical example with the 5% hypothetical examples that appear in the shareholder reports of the other funds. A small balance maintenance fee of $12.00 that is charged once a year may apply for certain accounts with a value of less than $2,000. This fee is not included in the table below. If it was, the estimate of expenses you paid during the period would be higher, and your ending account value lower, by this amount. In addition, the Fund, as a shareholder in the underlying Fidelity Central Funds, will indirectly bear its pro-rata share of the fees and expenses incurred by the underlying Fidelity Central Funds. These fees and expenses are not included in the Fund's annualized expense ratio used to calculate the expense estimate in the table below.
Please note that the expenses shown in the table are meant to highlight your ongoing costs only and do not reflect any transaction costs. Therefore, the second line of the table is useful in comparing ongoing costs only, and will not help you determine the relative total costs of owning different funds. In addition, if these transactional costs were included, your costs would have been higher.
Annual Report
| Annualized | Beginning | Ending | Expenses Paid |
Class A | 1.03% |
|
|
|
Actual |
| $ 1,000.00 | $ 951.20 | $ 5.07 |
HypotheticalA |
| $ 1,000.00 | $ 1,020.01 | $ 5.24 |
Class T | 1.33% |
|
|
|
Actual |
| $ 1,000.00 | $ 949.90 | $ 6.54 |
HypotheticalA |
| $ 1,000.00 | $ 1,018.50 | $ 6.77 |
Class B | 1.77% |
|
|
|
Actual |
| $ 1,000.00 | $ 948.20 | $ 8.69 |
HypotheticalA |
| $ 1,000.00 | $ 1,016.28 | $ 9.00 |
Class C | 1.78% |
|
|
|
Actual |
| $ 1,000.00 | $ 948.20 | $ 8.74 |
HypotheticalA |
| $ 1,000.00 | $ 1,016.23 | $ 9.05 |
Mid Cap Growth | .77% |
|
|
|
Actual |
| $ 1,000.00 | $ 953.10 | $ 3.79 |
HypotheticalA |
| $ 1,000.00 | $ 1,021.32 | $ 3.92 |
Institutional Class | .65% |
|
|
|
Actual |
| $ 1,000.00 | $ 954.00 | $ 3.20 |
HypotheticalA |
| $ 1,000.00 | $ 1,021.93 | $ 3.31 |
A 5% return per year before expenses
* Expenses are equal to each Class' annualized expense ratio, multiplied by the average account value over the period, multiplied by 184/365 (to reflect the one-half year period).
Annual Report
Investment Changes (Unaudited)
Top Ten Stocks as of January 31, 2012 | ||
| % of fund's | % of fund's net assets |
CF Industries Holdings, Inc. | 2.6 | 4.0 |
Cyberonics, Inc. | 2.2 | 1.5 |
Potash Corp. of Saskatchewan, Inc. | 2.1 | 0.0 |
The Mosaic Co. | 2.0 | 1.1 |
Idenix Pharmaceuticals, Inc. | 1.9 | 0.7 |
Heckmann Corp. | 1.9 | 1.2 |
ArthroCare Corp. | 1.9 | 1.4 |
CNH Global NV | 1.7 | 1.1 |
Citrix Systems, Inc. | 1.6 | 0.7 |
CVR Partners LP | 1.6 | 1.6 |
| 19.5 | |
Top Five Market Sectors as of January 31, 2012 | ||
| % of fund's | % of fund's net assets 6 months ago |
Information Technology | 21.1 | 18.6 |
Health Care | 16.5 | 15.4 |
Consumer Discretionary | 16.5 | 15.5 |
Energy | 14.1 | 17.7 |
Materials | 12.3 | 11.9 |
Asset Allocation (% of fund's net assets) | |||||||
As of January 31, 2012* | As of July 31, 2011** | ||||||
| Stocks 96.4% |
| | Stocks 99.7% |
| ||
| Short-Term |
| | Short-Term |
| ||
* Foreign investments | 14.3% |
| ** Foreign investments | 15.5% |
| ||

Annual Report
Investments January 31, 2012
Showing Percentage of Net Assets
Common Stocks - 96.4% | |||
Shares | Value | ||
CONSUMER DISCRETIONARY - 16.5% | |||
Automobiles - 0.8% | |||
Tesla Motors, Inc. (a)(d) | 71,900 | $ 2,090,133 | |
Diversified Consumer Services - 1.1% | |||
Weight Watchers International, Inc. (d) | 40,500 | 3,083,265 | |
Hotels, Restaurants & Leisure - 2.2% | |||
BJ's Restaurants, Inc. (a) | 26,900 | 1,345,807 | |
Buffalo Wild Wings, Inc. (a)(d) | 20,200 | 1,344,512 | |
Panera Bread Co. Class A (a) | 12,000 | 1,779,000 | |
Texas Roadhouse, Inc. Class A | 96,100 | 1,456,876 | |
| 5,926,195 | ||
Media - 1.0% | |||
Discovery Communications, Inc. (a) | 63,700 | 2,731,456 | |
Multiline Retail - 1.0% | |||
Dollar Tree, Inc. (a) | 32,600 | 2,764,806 | |
Specialty Retail - 4.0% | |||
Abercrombie & Fitch Co. Class A | 39,000 | 1,791,660 | |
Body Central Corp. (a) | 62,500 | 1,680,000 | |
Limited Brands, Inc. | 74,400 | 3,114,384 | |
Tractor Supply Co. | 33,700 | 2,721,949 | |
Ulta Salon, Cosmetics & Fragrance, Inc. (a) | 21,700 | 1,653,974 | |
| 10,961,967 | ||
Textiles, Apparel & Luxury Goods - 6.4% | |||
Liz Claiborne, Inc. (a)(d) | 341,000 | 3,171,300 | |
Michael Kors Holdings Ltd. | 51,300 | 1,587,735 | |
PVH Corp. | 41,300 | 3,187,947 | |
Ralph Lauren Corp. | 25,000 | 3,800,000 | |
Under Armour, Inc. Class A (sub. vtg.) (a)(d) | 35,500 | 2,826,510 | |
Warnaco Group, Inc. (a) | 49,400 | 2,877,550 | |
| 17,451,042 | ||
TOTAL CONSUMER DISCRETIONARY | 45,008,864 | ||
CONSUMER STAPLES - 3.4% | |||
Beverages - 0.6% | |||
Monster Beverage Corp. (a) | 15,500 | 1,619,905 | |
Food & Staples Retailing - 1.1% | |||
Whole Foods Market, Inc. | 39,700 | 2,938,991 | |
Common Stocks - continued | |||
Shares | Value | ||
CONSUMER STAPLES - continued | |||
Food Products - 1.3% | |||
Green Mountain Coffee Roasters, Inc. (a)(d) | 48,300 | $ 2,576,322 | |
Origin Agritech Ltd. (a)(d) | 375,069 | 888,914 | |
| 3,465,236 | ||
Tobacco - 0.4% | |||
Lorillard, Inc. | 11,600 | 1,245,724 | |
TOTAL CONSUMER STAPLES | 9,269,856 | ||
ENERGY - 14.1% | |||
Energy Equipment & Services - 5.5% | |||
Cameron International Corp. (a) | 82,300 | 4,378,360 | |
Dresser-Rand Group, Inc. (a) | 57,200 | 2,930,356 | |
Heckmann Corp. (a)(d) | 1,022,900 | 5,227,019 | |
Rowan Companies, Inc. (a) | 77,300 | 2,628,973 | |
| 15,164,708 | ||
Oil, Gas & Consumable Fuels - 8.6% | |||
Alpha Natural Resources, Inc. (a) | 213,500 | 4,295,620 | |
Amyris, Inc. (a)(d) | 85,100 | 763,347 | |
Bumi PLC | 173,710 | 2,381,773 | |
Cabot Oil & Gas Corp. | 85,200 | 2,717,880 | |
EV Energy Partners LP | 42,500 | 2,835,600 | |
EXCO Resources, Inc. | 150,200 | 1,180,572 | |
Genel Energy PLC | 46,900 | 629,012 | |
Oasis Petroleum, Inc. (a)(d) | 83,400 | 2,813,916 | |
QEP Resources, Inc. | 94,800 | 2,715,072 | |
Range Resources Corp. | 37,500 | 2,157,000 | |
Solazyme, Inc. (d) | 76,000 | 883,120 | |
| 23,372,912 | ||
TOTAL ENERGY | 38,537,620 | ||
FINANCIALS - 1.0% | |||
Real Estate Management & Development - 1.0% | |||
Altisource Portfolio Solutions SA (a) | 50,900 | 2,722,641 | |
HEALTH CARE - 16.5% | |||
Biotechnology - 7.5% | |||
Alexion Pharmaceuticals, Inc. (a) | 36,300 | 2,786,388 | |
Human Genome Sciences, Inc. (a)(d) | 304,500 | 2,996,280 | |
Idenix Pharmaceuticals, Inc. (a)(d) | 398,800 | 5,339,932 | |
Common Stocks - continued | |||
Shares | Value | ||
HEALTH CARE - continued | |||
Biotechnology - continued | |||
InterMune, Inc. (a) | 163,500 | $ 2,452,500 | |
Theravance, Inc. (a) | 85,900 | 1,523,866 | |
United Therapeutics Corp. (a) | 57,600 | 2,832,768 | |
Vertex Pharmaceuticals, Inc. (a) | 73,100 | 2,701,045 | |
| 20,632,779 | ||
Health Care Equipment & Supplies - 7.7% | |||
ArthroCare Corp. (a) | 164,479 | 5,084,046 | |
Cyberonics, Inc. (a) | 180,687 | 5,872,328 | |
Insulet Corp. (a) | 76,800 | 1,495,296 | |
NuVasive, Inc. (a) | 230,231 | 3,568,581 | |
Zeltiq Aesthetics, Inc. (d) | 43,000 | 516,000 | |
Zoll Medical Corp. (a) | 64,300 | 4,409,694 | |
| 20,945,945 | ||
Health Care Technology - 0.8% | |||
Merge Healthcare, Inc. (a) | 381,032 | 2,088,055 | |
Life Sciences Tools & Services - 0.5% | |||
Illumina, Inc. (a) | 28,000 | 1,449,280 | |
TOTAL HEALTH CARE | 45,116,059 | ||
INDUSTRIALS - 11.5% | |||
Aerospace & Defense - 1.1% | |||
BE Aerospace, Inc. (a) | 72,000 | 3,038,400 | |
Building Products - 2.4% | |||
Lennox International, Inc. | 77,700 | 2,812,740 | |
Owens Corning (a) | 112,500 | 3,796,875 | |
| 6,609,615 | ||
Electrical Equipment - 2.2% | |||
Cooper Industries PLC Class A | 55,900 | 3,304,808 | |
Roper Industries, Inc. | 28,300 | 2,642,937 | |
| 5,947,745 | ||
Machinery - 4.9% | |||
CNH Global NV (a) | 109,600 | 4,574,704 | |
IDEX Corp. | 45,100 | 1,827,452 | |
Ingersoll-Rand PLC | 115,700 | 4,042,558 | |
WABCO Holdings, Inc. (a) | 31,100 | 1,612,535 | |
Westport Innovations, Inc. (a)(d) | 32,000 | 1,331,200 | |
| 13,388,449 | ||
Common Stocks - continued | |||
Shares | Value | ||
INDUSTRIALS - continued | |||
Marine - 0.9% | |||
Kirby Corp. (a) | 39,000 | $ 2,604,030 | |
TOTAL INDUSTRIALS | 31,588,239 | ||
INFORMATION TECHNOLOGY - 21.1% | |||
Communications Equipment - 1.5% | |||
Polycom, Inc. (a) | 155,000 | 3,092,250 | |
Riverbed Technology, Inc. (a) | 46,000 | 1,101,240 | |
| 4,193,490 | ||
Computers & Peripherals - 1.0% | |||
SanDisk Corp. (a) | 58,300 | 2,674,804 | |
Electronic Equipment & Components - 1.6% | |||
Aeroflex Holding Corp. (a) | 98,400 | 1,246,728 | |
Maxwell Technologies, Inc. (a)(d) | 149,100 | 3,050,586 | |
| 4,297,314 | ||
Internet Software & Services - 2.6% | |||
Blinkx PLC (a) | 601,900 | 635,558 | |
Rackspace Hosting, Inc. (a) | 61,061 | 2,650,658 | |
Velti PLC (a) | 104,400 | 913,500 | |
VeriSign, Inc. | 82,600 | 3,061,156 | |
| 7,260,872 | ||
IT Services - 1.1% | |||
Cognizant Technology Solutions Corp. Class A (a) | 42,100 | 3,020,675 | |
Semiconductors & Semiconductor Equipment - 5.1% | |||
ASML Holding NV | 64,400 | 2,768,556 | |
Ceva, Inc. (a) | 74,690 | 2,017,377 | |
Freescale Semiconductor Holdings I Ltd. (d) | 100,120 | 1,598,916 | |
KLA-Tencor Corp. | 55,700 | 2,847,941 | |
NVIDIA Corp. (a) | 200,000 | 2,954,000 | |
NXP Semiconductors NV (a) | 82,400 | 1,749,352 | |
| 13,936,142 | ||
Software - 8.2% | |||
ANSYS, Inc. (a) | 54,200 | 3,278,558 | |
Ariba, Inc. (a) | 50,900 | 1,389,570 | |
Autodesk, Inc. (a) | 83,800 | 3,016,800 | |
Check Point Software Technologies Ltd. (a) | 48,500 | 2,730,065 | |
Citrix Systems, Inc. (a) | 69,800 | 4,551,658 | |
Informatica Corp. (a) | 57,700 | 2,440,710 | |
Common Stocks - continued | |||
Shares | Value | ||
INFORMATION TECHNOLOGY - continued | |||
Software - continued | |||
Intuit, Inc. | 62,300 | $ 3,516,212 | |
Nuance Communications, Inc. (a) | 54,300 | 1,548,636 | |
| 22,472,209 | ||
TOTAL INFORMATION TECHNOLOGY | 57,855,506 | ||
MATERIALS - 12.3% | |||
Chemicals - 10.0% | |||
CF Industries Holdings, Inc. | 40,200 | 7,130,676 | |
CVR Partners LP | 147,000 | 4,420,290 | |
Monsanto Co. | 36,000 | 2,953,800 | |
Potash Corp. of Saskatchewan, Inc. | 122,000 | 5,715,841 | |
Rentech Nitrogen Partners LP | 71,800 | 1,642,066 | |
The Mosaic Co. | 99,000 | 5,541,030 | |
| 27,403,703 | ||
Metals & Mining - 2.3% | |||
First Quantum Minerals Ltd. | 91,600 | 2,006,019 | |
Ivanhoe Mines Ltd. (a) | 80,000 | 1,290,052 | |
Walter Energy, Inc. | 42,800 | 2,958,764 | |
| 6,254,835 | ||
TOTAL MATERIALS | 33,658,538 | ||
TOTAL COMMON STOCKS (Cost $257,242,067) |
| ||
Money Market Funds - 13.2% | |||
Shares | Value | ||
Fidelity Cash Central Fund, 0.12% (b) | 9,582,886 | $ 9,582,886 | |
Fidelity Securities Lending Cash Central Fund, 0.12% (b)(c) | 26,509,425 | 26,509,425 | |
TOTAL MONEY MARKET FUNDS (Cost $36,092,311) |
| ||
TOTAL INVESTMENT PORTFOLIO - 109.6% (Cost $293,334,378) | 299,849,634 | ||
NET OTHER ASSETS (LIABILITIES) - (9.6)% | (26,344,418) | ||
NET ASSETS - 100% | $ 273,505,216 | ||
Legend |
(a) Non-income producing |
(b) Affiliated fund that is available only to investment companies and other accounts managed by Fidelity Investments. The rate quoted is the annualized seven-day yield of the fund at period end. A complete unaudited listing of the fund's holdings as of its most recent quarter end is available upon request. In addition, each Fidelity Central Fund's financial statements, which are not covered by the Fund's Report of Independent Registered Public Accounting Firm, are available on the SEC's website or upon request. |
(c) Investment made with cash collateral received from securities on loan. |
(d) Security or a portion of the security is on loan at period end. |
Affiliated Central Funds |
Information regarding fiscal year to date income earned by the Fund from investments in Fidelity Central Funds is as follows: |
Fund | Income earned |
Fidelity Cash Central Fund | $ 5,926 |
Fidelity Securities Lending Cash Central Fund | 63,571 |
Total | $ 69,497 |
Other Information |
All investments are categorized as Level 1 under the Fair Value Hierarchy. The inputs or methodology used for valuing securities may not be an indication of the risk associated with investing in those securities. For more information on valuation inputs, please refer to the Security Valuation section in the accompanying Notes to Financial Statements. |
Distribution of investments by country of issue, as a percentage of total net assets, is as follows: (Unaudited) |
United States of America | 85.7% |
Canada | 3.8% |
Netherlands | 3.3% |
Ireland | 2.7% |
United Kingdom | 1.3% |
Israel | 1.0% |
Luxembourg | 1.0% |
Others (Individually Less Than 1%) | 1.2% |
| 100.0% |
See accompanying notes which are an integral part of the financial statements.
Annual Report
Financial Statements
Statement of Assets and Liabilities
| January 31, 2012 | |
Assets | ||
Investment in securities, at value (including securities loaned of $25,637,049) - See accompanying schedule: Unaffiliated issuers (cost $257,242,067) | $ 263,757,323 |
|
Fidelity Central Funds (cost $36,092,311) | 36,092,311 |
|
Total Investments (cost $293,334,378) |
| $ 299,849,634 |
Cash |
| 14,594 |
Receivable for investments sold | 812,984 | |
Receivable for fund shares sold | 641,814 | |
Dividends receivable | 52,005 | |
Distributions receivable from Fidelity Central Funds | 13,374 | |
Prepaid expenses | 769 | |
Other receivables | 10,957 | |
Total assets | 301,396,131 | |
|
|
|
Liabilities | ||
Payable for investments purchased | $ 807,378 | |
Payable for fund shares redeemed | 361,905 | |
Accrued management fee | 83,493 | |
Distribution and service plan fees payable | 8,006 | |
Other affiliated payables | 72,265 | |
Other payables and accrued expenses | 48,443 | |
Collateral on securities loaned, at value | 26,509,425 | |
Total liabilities | 27,890,915 | |
|
|
|
Net Assets | $ 273,505,216 | |
Net Assets consist of: |
| |
Paid in capital | $ 288,221,632 | |
Accumulated net investment loss | (175,072) | |
Accumulated undistributed net realized gain (loss) on investments and foreign currency transactions | (21,056,187) | |
Net unrealized appreciation (depreciation) on investments and assets and liabilities in foreign currencies | 6,514,843 | |
Net Assets | $ 273,505,216 | |
See accompanying notes which are an integral part of the financial statements.
Annual Report
Financial Statements - continued
Statement of Assets and Liabilities - continued
| January 31, 2012 | |
Calculation of Maximum Offering Price Class A: | $ 12.27 | |
|
|
|
Maximum offering price per share (100/94.25 of $12.27) | $ 13.02 | |
Class T: | $ 12.14 | |
|
|
|
Maximum offering price per share (100/96.50 of $12.14) | $ 12.58 | |
Class B: | $ 11.91 | |
|
|
|
Class C: | $ 11.91 | |
|
|
|
|
|
|
Mid Cap Growth: | $ 12.40 | |
|
|
|
Institutional Class: | $ 12.43 | |
A Redemption price per share is equal to net asset value less any applicable contingent deferred sales charge.
See accompanying notes which are an integral part of the financial statements.
Annual Report
Statement of Operations
| Year ended January 31, 2012 | |
Investment Income |
|
|
Dividends |
| $ 1,698,443 |
Income from Fidelity Central Funds |
| 69,497 |
Total income |
| 1,767,940 |
|
|
|
Expenses | ||
Management fee | $ 1,652,976 | |
Performance adjustment | (464,170) | |
Transfer agent fees | 852,587 | |
Distribution and service plan fees | 99,382 | |
Accounting and security lending fees | 117,602 | |
Custodian fees and expenses | 26,283 | |
Independent trustees' compensation | 1,733 | |
Registration fees | 68,351 | |
Audit | 68,420 | |
Legal | 1,003 | |
Miscellaneous | 2,622 | |
Total expenses before reductions | 2,426,789 | |
Expense reductions | (42,474) | 2,384,315 |
Net investment income (loss) | (616,375) | |
Realized and Unrealized Gain (Loss) Net realized gain (loss) on: | ||
Investment securities: |
|
|
Unaffiliated issuers | 26,763,675 | |
Foreign currency transactions | 26,304 | |
Total net realized gain (loss) |
| 26,789,979 |
Change in net unrealized appreciation (depreciation) on: Investment securities | (34,576,049) | |
Assets and liabilities in foreign currencies | 121 | |
Total change in net unrealized appreciation (depreciation) |
| (34,575,928) |
Net gain (loss) | (7,785,949) | |
Net increase (decrease) in net assets resulting from operations | $ (8,402,324) | |
See accompanying notes which are an integral part of the financial statements.
Annual Report
Financial Statements - continued
Statement of Changes in Net Assets
| Year ended | Year ended |
Increase (Decrease) in Net Assets |
|
|
Operations |
|
|
Net investment income (loss) | $ (616,375) | $ (751,163) |
Net realized gain (loss) | 26,789,979 | 49,618,736 |
Change in net unrealized appreciation (depreciation) | (34,575,928) | 25,698,331 |
Net increase (decrease) in net assets resulting | (8,402,324) | 74,565,904 |
Distributions to shareholders from net realized gain | - | (88,063) |
Share transactions - net increase (decrease) | (44,807,582) | 29,630,097 |
Redemption fees | 17,787 | 11,919 |
Total increase (decrease) in net assets | (53,192,119) | 104,119,857 |
|
|
|
Net Assets | ||
Beginning of period | 326,697,335 | 222,577,478 |
End of period (including accumulated net investment loss of $175,072 and accumulated net investment loss of $0, respectively) | $ 273,505,216 | $ 326,697,335 |
See accompanying notes which are an integral part of the financial statements.
Annual Report
Financial Highlights - Class A
Years ended January 31, | 2012 | 2011 | 2010 | 2009 | 2008 H |
Selected Per-Share Data |
|
|
|
|
|
Net asset value, beginning of period | $ 12.53 | $ 9.38 | $ 6.38 | $ 12.19 | $ 14.33 |
Income from Investment | |||||
Net investment income (loss)E | (.05) | (.06) | (.03) | .03 | (.05) |
Net realized and unrealized gain (loss) | (.21) | 3.21 | 3.03 | (5.79) | (1.30) |
Total from investment operations | (.26) | 3.15 | 3.00 | (5.76) | (1.35) |
Distributions from net investment income | - | - | - | (.05) | - |
Distributions from net realized gain | - | - | - | - | (.79) |
Total distributions | - | - | - | (.05) | (.79) |
Redemption fees added to paid in capital E,J | - | - | - | - | - |
Net asset value, end of period | $ 12.27 | $ 12.53 | $ 9.38 | $ 6.38 | $ 12.19 |
Total ReturnB,C,D | (2.08)% | 33.58% | 47.02% | (47.25)% | (9.95)% |
Ratios to Average Net AssetsF,I |
|
|
|
|
|
Expenses before reductions | 1.04% | 1.04% | .95% | .95% | 1.10% A |
Expenses net of fee waivers, if any | 1.04% | 1.04% | .95% | .95% | 1.10% A |
Expenses net of all reductions | 1.03% | 1.03% | .93% | .94% | 1.10% A |
Net investment income (loss) | (.43)% | (.52)% | (.30)% | .29% | (.41)% A |
Supplemental Data |
|
|
|
|
|
Net assets, end of period (000 omitted) | $ 10,062 | $ 10,751 | $ 6,095 | $ 1,623 | $ 1,936 |
Portfolio turnover rate G | 160% | 143% | 249% | 220% | 245% |
A Annualized
B Total returns for periods of less than one year are not annualized.
C Total returns would have been lower if certain expenses had not been reduced during the applicable periods shown.
D Total returns do not include the effect of the sales charges.
E Calculated based on average shares outstanding during the period.
F Fees and expenses of any underlying Fidelity Central Funds are not included in the Fund's expense ratio. The Fund indirectly bears its proportionate share of the expenses of any underlying Fidelity Central Funds.
G Amount does not include the portfolio activity of any underlying Fidelity Central Funds.
H For the period February 13, 2007 (commencement of sale of shares) to January 31, 2008.
I Expense ratios reflect operating expenses of the class. Expenses before reductions do not reflect amounts reimbursed by the investment adviser or reductions from brokerage service arrangements or reductions from other expense offset arrangements and do not represent the amount paid by the class during periods when reimbursements or reductions occur. Expense ratios before reductions for start-up periods may not be representative of longer-term operating periods. Expenses net of fee waivers reflect expenses after reimbursement by the investment adviser but prior to reductions from brokerage service arrangements or other expense offset arrangements. Expenses net of all reductions represent the net expenses paid by the class.
J Amount represents less than $.01 per share.
See accompanying notes which are an integral part of the financial statements.
Annual Report
Financial Highlights - Class T
Years ended January 31, | 2012 | 2011 | 2010 | 2009 | 2008 I |
Selected Per-Share Data |
|
|
|
|
|
Net asset value, beginning of period | $ 12.43 | $ 9.33 | $ 6.37 | $ 12.14 | $ 14.33 |
Income from Investment | |||||
Net investment income (loss) E | (.09) | (.09) | (.05) | - K | (.09) |
Net realized and unrealized gain (loss) | (.20) | 3.19 | 3.01 | (5.75) | (1.31) |
Total from investment operations | (.29) | 3.10 | 2.96 | (5.75) | (1.40) |
Distributions from net investment income | - | - | - | (.02) | - |
Distributions from net realized gain | - | - | - | - | (.79) |
Total distributions | - | - | - | (.02) | (.79) |
Redemption fees added to paid in capital E,K | - | - | - | - | - |
Net asset value, end of period | $ 12.14 | $ 12.43 | $ 9.33 | $ 6.37 | $ 12.14 |
Total Return B,C,D | (2.33)% | 33.23% | 46.47% | (47.37)% | (10.30)% |
Ratios to Average Net Assets F,J |
|
|
|
|
|
Expenses before reductions | 1.34% | 1.34% | 1.26% | 1.23% | 1.36% A |
Expenses net of fee waivers, if any | 1.34% | 1.34% | 1.26% | 1.23% | 1.36% A |
Expenses net of all reductions | 1.33% | 1.33% | 1.23% | 1.22% | 1.36% A |
Net investment income (loss) | (.73)% | (.81)% | (.61)% | .00% H | (.68)% A |
Supplemental Data |
|
|
|
|
|
Net assets, end of period (000 omitted) | $ 4,026 | $ 3,205 | $ 2,100 | $ 790 | $ 591 |
Portfolio turnover rate G | 160% | 143% | 249% | 220% | 245% |
A Annualized
B Total returns for periods of less than one year are not annualized.
C Total returns would have been lower if certain expenses had not been reduced during the applicable periods shown.
D Total returns do not include the effect of the sales charges.
E Calculated based on average shares outstanding during the period.
F Fees and expenses of any underlying Fidelity Central Funds are not included in the Fund's expense ratio. The Fund indirectly bears its proportionate share of the expenses of any underlying Fidelity Central Funds.
G Amount does not include the portfolio activity of any underlying Fidelity Central Funds.
H Amount represents less than .01%.
I For the period February 13, 2007 (commencement of sale of shares) to January 31, 2008.
J Expense ratios reflect operating expenses of the class. Expenses before reductions do not reflect amounts reimbursed by the investment adviser or reductions from brokerage service arrangements or reductions from other expense offset arrangements and do not represent the amount paid by the class during periods when reimbursements or reductions occur. Expense ratios before reductions for start-up periods may not be representative of longer-term operating periods. Expenses net of fee waivers reflect expenses after reimbursement by the investment adviser but prior to reductions from brokerage service arrangements or other expense offset arrangements. Expenses net of all reductions represent the net expenses paid by the class.
K Amount represents less than $.01 per share.
See accompanying notes which are an integral part of the financial statements.
Annual Report
Financial Highlights - Class B
Years ended January 31, | 2012 | 2011 | 2010 | 2009 | 2008 H |
Selected Per-Share Data |
|
|
|
|
|
Net asset value, beginning of period | $ 12.25 | $ 9.23 | $ 6.33 | $ 12.09 | $ 14.33 |
Income from Investment | |||||
Net investment income (loss) E | (.14) | (.13) | (.09) | (.05) | (.16) |
Net realized and unrealized gain (loss) | (.20) | 3.15 | 2.99 | (5.71) | (1.29) |
Total from investment operations | (.34) | 3.02 | 2.90 | (5.76) | (1.45) |
Distributions from net realized gain | - | - | - | - | (.79) |
Redemption fees added to paid in capital E,J | - | - | - | - | - |
Net asset value, end of period | $ 11.91 | $ 12.25 | $ 9.23 | $ 6.33 | $ 12.09 |
Total Return B,C,D | (2.78)% | 32.72% | 45.81% | (47.64)% | (10.65)% |
Ratios to Average Net Assets F,I |
|
|
|
|
|
Expenses before reductions | 1.80% | 1.80% | 1.70% | 1.70% | 1.85% A |
Expenses net of fee waivers, if any | 1.80% | 1.80% | 1.70% | 1.70% | 1.85% A |
Expenses net of all reductions | 1.78% | 1.79% | 1.67% | 1.69% | 1.85% A |
Net investment income (loss) | (1.19)% | (1.27)% | (1.05)% | (.46)% | (1.16)% A |
Supplemental Data |
|
|
|
|
|
Net assets, end of period (000 omitted) | $ 673 | $ 812 | $ 1,059 | $ 245 | $ 414 |
Portfolio turnover rate G | 160% | 143% | 249% | 220% | 245% |
A Annualized
B Total returns for periods of less than one year are not annualized.
C Total returns would have been lower if certain expenses had not been reduced during the applicable periods shown.
D Total returns do not include the effect of the contingent deferred sales charge.
E Calculated based on average shares outstanding during the period.
F Fees and expenses of any underlying Fidelity Central Funds are not included in the Fund's expense ratio. The Fund indirectly bears its proportionate share of the expenses of any underlying Fidelity Central Funds.
G Amount does not include the portfolio activity of any underlying Fidelity Central Funds.
H For the period February 13, 2007 (commencement of sale of shares) to January 31, 2008.
I Expense ratios reflect operating expenses of the class. Expenses before reductions do not reflect amounts reimbursed by the investment adviser or reductions from brokerage service arrangements or reductions from other expense offset arrangements and do not represent the amount paid by the class during periods when reimbursements or reductions occur. Expense ratios before reductions for start-up periods may not be representative of longer-term operating periods. Expenses net of fee waivers reflect expenses after reimbursement by the investment adviser but prior to reductions from brokerage service arrangements or other expense offset arrangements. Expenses net of all reductions represent the net expenses paid by the class.
J Amount represents less than $.01 per share.
See accompanying notes which are an integral part of the financial statements.
Annual Report
Financial Highlights - Class C
Years ended January 31, | 2012 | 2011 | 2010 | 2009 | 2008 H |
Selected Per-Share Data |
|
|
|
|
|
Net asset value, beginning of period | $ 12.25 | $ 9.24 | $ 6.33 | $ 12.09 | $ 14.33 |
Income from Investment Operations |
|
|
|
|
|
Net investment income (loss)E | (.14) | (.13) | (.09) | (.04) | (.15) |
Net realized and unrealized gain (loss) | (.20) | 3.14 | 3.00 | (5.72) | (1.30) |
Total from investment operations | (.34) | 3.01 | 2.91 | (5.76) | (1.45) |
Distributions from net realized gain | - | - | - | - | (.79) |
Redemption fees added to paid in capital E,J | - | - | - | - | - |
Net asset value, end of period | $ 11.91 | $ 12.25 | $ 9.24 | $ 6.33 | $ 12.09 |
Total Return B,C,D | (2.78)% | 32.58% | 45.97% | (47.64)% | (10.65)% |
Ratios to Average Net Assets F,I |
|
|
|
|
|
Expenses before reductions | 1.80% | 1.79% | 1.70% | 1.69% | 1.85% A |
Expenses net of fee waivers, if any | 1.80% | 1.79% | 1.70% | 1.69% | 1.85% A |
Expenses net of all reductions | 1.79% | 1.78% | 1.68% | 1.68% | 1.85% A |
Net investment income (loss) | (1.19)% | (1.26)% | (1.05)% | (.46)% | (1.16)% A |
Supplemental Data |
|
|
|
|
|
Net assets, end of period (000 omitted) | $ 4,905 | $ 4,852 | $ 2,029 | $ 699 | $ 697 |
Portfolio turnover rate G | 160% | 143% | 249% | 220% | 245% |
A Annualized
B Total returns for periods of less than one year are not annualized.
C Total returns would have been lower if certain expenses had not been reduced during the applicable periods shown.
D Total returns do not include the effect of the contingent deferred sales charge.
E Calculated based on average shares outstanding during the period.
F Fees and expenses of any underlying Fidelity Central Funds are not included in the Fund's expense ratio. The Fund indirectly bears its proportionate share of the expenses of any underlying Fidelity Central Funds.
G Amount does not include the portfolio activity of any underlying Fidelity Central Funds.
H For the period February 13, 2007 (commencement of sale of shares) to January 31, 2008.
I Expense ratios reflect operating expenses of the class. Expenses before reductions do not reflect amounts reimbursed by the investment adviser or reductions from brokerage service arrangements or reductions from other expense offset arrangements and do not represent the amount paid by the class during periods when reimbursements or reductions occur. Expense ratios before reductions for start-up periods may not be representative of longer-term operating periods. Expenses net of fee waivers reflect expenses after reimbursement by the investment adviser but prior to reductions from brokerage service arrangements or other expense offset arrangements. Expenses net of all reductions represent the net expenses paid by the class.
J Amount represents less than $.01 per share.
See accompanying notes which are an integral part of the financial statements.
Annual Report
Financial Highlights - Mid Cap Growth
Years ended January 31, | 2012 | 2011 | 2010 | 2009 | 2008 |
Selected Per-Share Data |
|
|
|
|
|
Net asset value, beginning of period | $ 12.63 | $ 9.43 | $ 6.40 | $ 12.21 | $ 14.31 |
Income from Investment | |||||
Net investment income (loss) B | (.02) | (.03) | - F | .06 | (.02) |
Net realized and unrealized gain (loss) | (.21) | 3.23 | 3.03 | (5.81) | (1.29) |
Total from investment operations | (.23) | 3.20 | 3.03 | (5.75) | (1.31) |
Distributions from net investment income | - | - | - | (.06) | - |
Distributions from net realized gain | - | - F | - F | - | (.79) |
Total distributions | - | - F | - F | (.06) | (.79) |
Redemption fees added to paid in capital B,F | - | - | - | - | - |
Net asset value, end of period | $ 12.40 | $ 12.63 | $ 9.43 | $ 6.40 | $ 12.21 |
Total Return A | (1.82)% | 33.99% | 47.37% | (47.09)% | (9.68)% |
Ratios to Average Net Assets C,E | |||||
Expenses before reductions | .79% | .79% | .70% | .69% | .83% |
Expenses net of fee waivers, if any | .79% | .79% | .70% | .68% | .81% |
Expenses net of all reductions | .77% | .78% | .67% | .67% | .81% |
Net investment income (loss) | (.17)% | (.26)% | (.05)% | .55% | (.12)% |
Supplemental Data |
|
|
|
|
|
Net assets, end of period (000 omitted) | $ 252,124 | $ 306,238 | $ 211,006 | $ 137,633 | $ 301,225 |
Portfolio turnover rate D | 160% | 143% | 249% | 220% | 245% |
A Total returns would have been lower if certain expenses had not been reduced during the applicable periods shown.
B Calculated based on average shares outstanding during the period.
C Fees and expenses of any underlying Fidelity Central Funds are not included in the Fund's expense ratio. The Fund indirectly bears its proportionate share of the expenses of any underlying Fidelity Central Funds.
D Amount does not include the portfolio activity of any underlying Fidelity Central Funds.
E Expense ratios reflect operating expenses of the class. Expenses before reductions do not reflect amounts reimbursed by the investment adviser or reductions from brokerage service arrangements or reductions from other expense offset arrangements and do not represent the amount paid by the class during periods when reimbursements or reductions occur. Expenses net of fee waivers reflect expenses after reimbursement by the investment adviser but prior to reductions from brokerage service arrangements or other expense offset arrangements. Expenses net of all reductions represent the net expenses paid by the class.
F Amount represents less than $.01 per share.
See accompanying notes which are an integral part of the financial statements.
Annual Report
Financial Highlights - Institutional Class
Years ended January 31, | 2012 | 2011 | 2010 | 2009 | 2008 G |
Selected Per-Share Data |
|
|
|
|
|
Net asset value, beginning of period | $ 12.64 | $ 9.43 | $ 6.40 | $ 12.22 | $ 14.33 |
Income from Investment Operations |
|
|
|
|
|
Net investment income (loss) D | (.01) | (.02) | - I | .07 | - I |
Net realized and unrealized gain (loss) | (.20) | 3.24 | 3.04 | (5.82) | (1.32) |
Total from investment operations | (.21) | 3.22 | 3.04 | (5.75) | (1.32) |
Distributions from net investment income | - | - | - | (.07) | - |
Distributions from net realized gain | - | (.01) | (.01) | - | (.79) |
Total distributions | - | (.01) | (.01) | (.07) | (.79) |
Redemption fees added to paid in capital D,I | - | - | - | - | - |
Net asset value, end of period | $ 12.43 | $ 12.64 | $ 9.43 | $ 6.40 | $ 12.22 |
Total Return B,C | (1.66)% | 34.10% | 47.54% | (47.09)% | (9.74)% |
Ratios to Average Net Assets E,H |
|
|
|
|
|
Expenses before reductions | .68% | .70% | .61% | .59% | .72% A |
Expenses net of fee waivers, if any | .68% | .70% | .61% | .59% | .72% A |
Expenses net of all reductions | .67% | .69% | .59% | .59% | .72% A |
Net investment income (loss) | (.07)% | (.18)% | .03% | .64% | (.03)% A |
Supplemental Data |
|
|
|
|
|
Net assets, end of period (000 omitted) | $ 1,714 | $ 839 | $ 288 | $ 109 | $ 182 |
Portfolio turnover rate F | 160% | 143% | 249% | 220% | 245% |
A Annualized
B Total returns for periods of less than one year are not annualized.
C Total returns would have been lower if certain expenses had not been reduced during the applicable periods shown.
D Calculated based on average shares outstanding during the period.
E Fees and expenses of any underlying Fidelity Central Funds are not included in the Fund's expense ratio. The Fund indirectly bears its proportionate share of the expenses of any underlying Fidelity Central Funds.
F Amount does not include the portfolio activity of any underlying Fidelity Central Funds.
G For the period February 13, 2007 (commencement of sale of shares) to January 31, 2008.
H Expense ratios reflect operating expenses of the class. Expenses before reductions do not reflect amounts reimbursed by the investment adviser or reductions from brokerage service arrangements or reductions from other expense offset arrangements and do not represent the amount paid by the class during periods when reimbursements or reductions occur. Expense ratios before reductions for start-up periods may not be representative of longer-term operating periods. Expenses net of fee waivers reflect expenses after reimbursement by the investment adviser but prior to reductions from brokerage service arrangements or other expense offset arrangements. Expenses net of all reductions represent the net expenses paid by the class.
I Amount represents less than $.01 per share.
See accompanying notes which are an integral part of the financial statements.
Annual Report
Notes to Financial Statements
For the period ended January 31, 2012
1. Organization.
Fidelity Mid Cap Growth Fund (the Fund) is a fund of Fidelity Devonshire Trust (the Trust) and is authorized to issue an unlimited number of shares. The Trust is registered under the Investment Company Act of 1940, as amended (the 1940 Act), as an open-end management investment company organized as a Massachusetts business trust. The Fund offers Class A, Class T, Class C, Mid Cap Growth, and Institutional Class shares, each of which, along with Class B shares, has equal rights as to assets and voting privileges. Effective after the close of business on September 1, 2010, Class B shares were closed to new accounts and additional purchases, except for exchanges and reinvestments. Each class has exclusive voting rights with respect to matters that affect that class. Class B shares will automatically convert to Class A shares after a holding period of seven years from the initial date of purchase. Investment income, realized and unrealized capital gains and losses, the common expenses of the Fund, and certain fund-level expense reductions, if any, are allocated on a pro-rata basis to each class based on the relative net assets of each class to the total net assets of the Fund. Each class differs with respect to transfer agent and distribution and service plan fees incurred. Certain expense reductions may also differ by class.
2. Investments in Fidelity Central Funds.
The Fund invests in Fidelity Central Funds, which are open-end investment companies available only to other investment companies and accounts managed by Fidelity Management & Research Company (FMR) and its affiliates. The Fund's Schedule of Investments lists each of the Fidelity Central Funds held as of period end, if any, as an investment of the Fund, but does not include the underlying holdings of each Fidelity Central Fund. As an Investing Fund, the Fund indirectly bears its proportionate share of the expenses of the underlying Fidelity Central Funds.
The Money Market Central Funds seek preservation of capital and current income and are managed by Fidelity Investments Money Management, Inc. (FIMM), an affiliate of FMR.
A complete unaudited list of holdings for each Fidelity Central Fund is available upon request or at the Securities and Exchange Commission (the SEC) web site at www.sec.gov. In addition, the financial statements of the Fidelity Central Funds, which are not covered by the Fund's Report of Independent Registered Public Accounting Firm, are available on the SEC web site or upon request.
3. Significant Accounting Policies.
The financial statements have been prepared in conformity with accounting principles generally accepted in the United States of America (GAAP), which require management to make certain estimates and assumptions at the date of the financial statements. Actual results could differ from those estimates. Subsequent events, if any, through the
Annual Report
Notes to Financial Statements - continued
3. Significant Accounting Policies - continued
date that the financial statements were issued have been evaluated in the preparation of the financial statements. The following summarizes the significant accounting policies of the Fund:
Security Valuation. Investments are valued as of 4:00 p.m. Eastern time on the last calendar day of the period. The Fund uses independent pricing services approved by the Board of Trustees to value its investments. When current market prices or quotations are not readily available or reliable, valuations may be determined in good faith in accordance with procedures adopted by the Board of Trustees. Factors used in determining value may include market or security specific events. The frequency with which these procedures are used cannot be predicted and they may be utilized to a significant extent. The value used for net asset value (NAV) calculation under these procedures may differ from published prices for the same securities.
The Fund categorizes the inputs to valuation techniques used to value its investments into a disclosure hierarchy consisting of three levels as shown below:
Level 1 - quoted prices in active markets for identical investments
Level 2 - other significant observable inputs (including quoted prices for similar investments, interest rates, prepayment speeds, etc.)
Level 3 - unobservable inputs (including the Fund's own assumptions based on the best information available)
Changes in valuation techniques may result in transfers in or out of an assigned level within the disclosure hierarchy. Valuation techniques used to value the Fund's investments by major category are as follows:
Equity securities, including restricted securities, for which market quotations are readily available, are valued at the last reported sale price or official closing price as reported by an independent pricing service on the primary market or exchange on which they are traded and are categorized as Level 1 in the hierarchy. In the event there were no sales during the day or closing prices are not available, securities are valued at the last quoted bid price or may be valued using the last available price and are generally categorized as Level 2 in the hierarchy. For foreign equity securities, when significant market or security specific events arise, comparisons to the valuation of American Depositary Receipts (ADRs), futures contracts, Exchange-traded funds (ETFs) and certain indexes as well as quoted prices for similar securities are used and are categorized as Level 2 in the hierarchy in these circumstances. Utilizing these techniques may result in transfers between Level 1 and Level 2. For restricted equity securities and private placements where observable inputs are limited, assumptions about market activity and risk are used and are categorized as Level 3 in the hierarchy.
Annual Report
3. Significant Accounting Policies - continued
Security Valuation - continued
Investments in open-end mutual funds, including the Fidelity Central Funds, are valued at their closing net asset value each business day and are categorized as Level 1 in the hierarchy.
New Accounting Pronouncements. In May 2011, the Financial Accounting Standards Board issued Accounting Standard Update No. 2011-04, Fair Value Measurement (Topic 820) - Amendments to Achieve Common Fair Value Measurement and Disclosure Requirements in U.S. GAAP and IFRSs. The update is effective during interim and annual periods beginning after December 15, 2011 and will result in additional disclosure for transfers between levels as well as expanded disclosure for securities categorized as Level 3 under the fair value hierarchy.
In December 2011, the Financial Accounting Standards Board issued Accounting Standard Update No. 2011-11, Disclosures about Offsetting Assets and Liabilities. The update creates new disclosure requirements requiring entities to disclose both gross and net information for derivatives and other financial instruments that are either offset in the Statement of Assets and Liabilities or subject to an enforceable master netting arrangement or similar agreement. The disclosure requirements are effective for interim and annual reporting periods beginning on or after January 1, 2013. Management is currently evaluating the impact of the update's adoption on the Fund's financial statement disclosures.
Foreign Currency. The Fund may use foreign currency contracts to facilitate transactions in foreign-denominated securities. Gains and losses from these transactions may arise from changes in the value of the foreign currency or if the counterparties do not perform under the contracts' terms.
Foreign-denominated assets, including investment securities, and liabilities are translated into U.S. dollars at the exchange rate at period end. Purchases and sales of investment securities, income and dividends received and expenses denominated in foreign currencies are translated into U.S. dollars at the exchange rate in effect on the transaction date.
The effects of exchange rate fluctuations on investments are included with the net realized and unrealized gain (loss) on investment securities. Other foreign currency transactions resulting in realized and unrealized gain (loss) are disclosed separately.
Investment Transactions and Income. For financial reporting purposes, the Fund's investment holdings and NAV include trades executed through the end of the last business day of the period. The NAV per share for processing shareholder transactions is calculated as of the close of business of the New York Stock Exchange (NYSE), normally 4:00 p.m. Eastern time and includes trades executed through the end of the prior
Annual Report
Notes to Financial Statements - continued
3. Significant Accounting Policies - continued
Investment Transactions and Income - continued
business day. Gains and losses on securities sold are determined on the basis of identified cost and may include proceeds received from litigation. Dividend income is recorded on the ex-dividend date, except for certain dividends from foreign securities where the ex-dividend date may have passed, which are recorded as soon as the Fund is informed of the ex-dividend date. Non-cash dividends included in dividend income, if any, are recorded at the fair market value of the securities received. Distributions received on securities that represent a return of capital or capital gain are recorded as a reduction of cost of investments and/or as a realized gain. The Fund estimates the components of distributions received that may be considered return of capital distributions or capital gain distributions. Interest income and distributions from the Fidelity Central Funds are accrued as earned. Interest income includes coupon interest and amortization of premium and accretion of discount on debt securities. Investment income is recorded net of foreign taxes withheld where recovery of such taxes is uncertain.
Expenses. Expenses directly attributable to a fund are charged to that fund. Expenses attributable to more than one fund are allocated among the respective funds on the basis of relative net assets or other appropriate methods. Expense estimates are accrued in the period to which they relate and adjustments are made when actual amounts are known.
Income Tax Information and Distributions to Shareholders. Each year, the Fund intends to qualify as a regulated investment company, including distributing substantially all of its taxable income and realized gains under Subchapter M of the Internal Revenue Code. As a result, no provision for income taxes is required. As of January 31, 2012, the Fund did not have any unrecognized tax benefits in the financial statements; nor is the Fund aware of any tax positions for which it is reasonably possible that the total amounts of unrecognized tax benefits will significantly change in the next twelve months. The Fund files a U.S. federal tax return, in addition to state and local tax returns as required. A fund's tax returns are subject to examination by the Internal Revenue Service (IRS) for a period of three fiscal years. State and local tax returns may be subject to examination for an additional fiscal year depending on the jurisdiction. Foreign taxes are provided for based on the Fund's understanding of the tax rules and rates that exist in the foreign markets in which it invests.
Distributions are declared and recorded on the ex-dividend date. Income dividends and capital gain distributions are declared separately for each class. Income and capital gain distributions are determined in accordance with income tax regulations, which may differ from GAAP.
Annual Report
3. Significant Accounting Policies - continued
Income Tax Information and Distributions to Shareholders - continued
Capital accounts within the financial statements are adjusted for permanent book-tax differences. These adjustments have no impact on net assets or the results of operations. Temporary book-tax differences will reverse in a subsequent period.
Book-tax differences are primarily due to the short-term gain distributions from the Underlying Funds, foreign currency transactions, passive foreign investment companies (PFIC), partnerships, net operating losses, capital loss carryforwards and losses deferred due to wash sales and excise tax regulations.
The federal tax cost of investment securities and unrealized appreciation (depreciation) as of period end were as follows:
Gross unrealized appreciation | $ 30,768,647 |
Gross unrealized depreciation | (24,933,919) |
Net unrealized appreciation (depreciation) on securities and other investments | $ 5,834,728 |
|
|
Tax Cost | $ 294,014,906 |
The tax-based components of distributable earnings as of period end were as follows:
Capital loss carryforward | $ (19,613,163) |
Net unrealized appreciation (depreciation) | $ 5,834,315 |
Capital loss carryforwards are only available to offset future capital gains of the Fund to the extent provided by regulations and may be limited. Under the Regulated Investment Company Modernization Act of 2010 (the Act), the Fund is permitted to carry forward capital losses incurred in taxable years beginning after December 22, 2010 for an unlimited period and such capital losses are required to be used prior to any losses that expire. Capital loss carryforwards were as follows:
Fiscal year of expiration |
|
2018 | $ (19,613,163) |
The tax character of distributions paid was as follows:
| January 31, 2012 | January 31, 2011 |
Ordinary Income | $ - | $ 88,063 |
Short-Term Trading (Redemption) Fees. Shares held by investors in the Fund less than 30 days are subject to a redemption fee equal to .75% of the net asset value of shares redeemed. All redemption fees, which reduce the proceeds of the shareholder redemption, are retained by the Fund and accounted for as an addition to paid in capital.
Annual Report
Notes to Financial Statements - continued
4. Purchases and Sales of Investments.
Purchases and sales of securities, other than short-term securities, aggregated $471,825,166 and $512,877,562, respectively.
5. Fees and Other Transactions with Affiliates.
Management Fee. FMR and its affiliates provide the Fund with investment management related services for which the Fund pays a monthly management fee. The management fee is the sum of an individual fund fee rate that is based on an annual rate of .30% of the Fund's average net assets and an annualized group fee rate that averaged .26% during the period. The group fee rate is based upon the average net assets of all the mutual funds advised by FMR. The group fee rate decreases as assets under management increase and increases as assets under management decrease. In addition, the management fee is subject to a performance adjustment (up to a maximum of ±.20% of the Fund's average net assets over a 36 month performance period). The upward or downward adjustment to the management fee is based on the relative investment performance of Mid Cap Growth as compared to an appropriate benchmark index. For the period, the total annual management fee rate, including the performance adjustment, was .40% of the Fund's average net assets.
Distribution and Service Plan Fees. In accordance with Rule 12b-1 of the 1940 Act, the Fund has adopted separate Distribution and Service Plans for each class of shares. Certain classes pay Fidelity Distributors Corporation (FDC), an affiliate of FMR, separate Distribution and Service Fees, each of which is based on an annual percentage of each class' average net assets. In addition, FDC may pay financial intermediaries for selling shares of the Fund and providing shareholder support services. For the period, the Distribution and Service Fee rates, total fees and amounts retained by FDC were as follows:
| Service | Distribution | Total Fees | Retained |
Class A | .25% | -% | $ 26,117 | $ 2,070 |
Class T | .25% | .25% | 17,252 | 1 |
Class B | .25% | .75% | 7,364 | 5,527 |
Class C | .25% | .75% | 48,649 | 17,243 |
|
|
| $ 99,382 | $ 24,841 |
Sales Load. FDC may receive a front-end sales charge of up to 5.75% for selling Class A shares and 3.50% for selling Class T shares, some of which is paid to financial intermediaries for selling shares of the Fund. Depending on the holding period, FDC may receive contingent deferred sales charges levied on Class A, Class T, Class B, and Class C redemptions. The deferred sales charges range from 5.00% to 1.00% for Class B, 1.00% for Class C, 1.00% for certain purchases of Class A shares and .25% for certain purchases of Class T shares.
Annual Report
5. Fees and Other Transactions with Affiliates - continued
Sales Load - continued
For the period, sales charge amounts retained by FDC were as follows:
| Retained |
Class A | $ 9,512 |
Class T | 3,598 |
Class B* | 1,445 |
Class C* | 2,334 |
| $ 16,889 |
* When Class B and Class C shares are initially sold, FDC pays commissions from its own resources to financial intermediaries through which the sales are made.
Transfer Agent Fees. Fidelity Investments Institutional Operations Company, Inc. (FIIOC), an affiliate of FMR, is the transfer, dividend disbursing and shareholder servicing agent for each class of the Fund. FIIOC receives account fees and asset-based fees that vary according to the account size and type of account of the shareholders of the respective classes of the Fund. FIIOC pays for typesetting, printing and mailing of shareholder reports, except proxy statements. For the period, transfer agent fees for each class were as follows:
| Amount | % of |
Class A | $ 30,715 | .29 |
Class T | 11,926 | .35 |
Class B | 2,202 | .30 |
Class C | 14,756 | .30 |
Mid Cap Growth | 791,113 | .29 |
Institutional Class | 1,875 | .18 |
| $ 852,587 |
|
Accounting and Security Lending Fees. Fidelity Service Company, Inc. (FSC), an affiliate of FMR, maintains the Fund's accounting records. The accounting fee is based on the level of average net assets for each month. Under a separate contract, FSC administers the security lending program. The security lending fee is based on the number and duration of lending transactions.
Brokerage Commissions. The Fund placed a portion of its portfolio transactions with brokerage firms which are affiliates of the investment adviser. The commissions paid to these affiliated firms were $9,007 for the period.
Annual Report
Notes to Financial Statements - continued
6. Committed Line of Credit.
The Fund participates with other funds managed by FMR or an affiliate in a $4.0 billion credit facility (the "line of credit") to be utilized for temporary or emergency purposes to fund shareholder redemptions or for other short-term liquidity purposes. The Fund has agreed to pay commitment fees on its pro-rata portion of the line of credit, which amounted to $892 and is reflected in Miscellaneous expenses on the Statement of Operations. During the period, there were no borrowings on this line of credit.
7. Security Lending.
The Fund lends portfolio securities through a lending agent from time to time in order to earn additional income. For equity securities, a lending agent is used and may loan securities to certain qualified borrowers, including Fidelity Capital Markets (FCM), a broker-dealer affiliated with the Fund. On the settlement date of the loan, the Fund receives collateral (in the form of U.S. Treasury obligations, letters of credit and/or cash) against the loaned securities and maintains collateral in an amount not less than 100% of the market value of the loaned securities during the period of the loan. The market value of the loaned securities is determined at the close of business of the Fund and any additional required collateral is delivered to the Fund on the next business day. If the borrower defaults on its obligation to return the securities loaned because of insolvency or other reasons, a fund could experience delays and costs in recovering the securities loaned or in gaining access to the collateral. Any cash collateral received is invested in the Fidelity Securities Lending Cash Central Fund. The value of loaned securities and cash collateral at period end are disclosed on the Fund's Statement of Assets and Liabilities. Security lending income represents the income earned on investing cash collateral, less rebates paid to borrowers and any lending agent fees associated with the loan, plus any premium payments received for lending certain types of securities. Security lending income is presented in the Statement of Operations as a component of income from Fidelity Central Funds. Total security lending income during the period amounted to $63,571. During the period, there were no securities loaned to FCM.
8. Expense Reductions.
Many of the brokers with whom FMR places trades on behalf of the Fund provided services to the Fund in addition to trade execution. These services included payments of certain expenses on behalf of the Fund totaling $42,474 for the period.
Annual Report
9. Distributions to Shareholders.
Distributions to shareholders of each class were as follows:
Years ended January 31, | 2012 | 2011 |
From net realized gain |
|
|
Mid Cap Growth | $ - | $ 87,897 |
Institutional Class | - | 166 |
Total | $ - | $ 88,063 |
10. Share Transactions.
Transactions for each class of shares were as follows:
| Shares | Dollars | ||
Years ended January 31, | 2012 | 2011 | 2012 | 2011 |
Class A |
|
|
|
|
Shares sold | 352,250 | 583,869 | $ 4,351,299 | $ 6,535,650 |
Shares redeemed | (390,419) | (375,849) | (4,756,474) | (3,922,105) |
Net increase (decrease) | (38,169) | 208,020 | $ (405,175) | $ 2,613,545 |
Class T |
|
|
|
|
Shares sold | 133,161 | 104,201 | $ 1,615,612 | $ 1,140,251 |
Shares redeemed | (59,316) | (71,459) | (707,985) | (756,606) |
Net increase (decrease) | 73,845 | 32,742 | $ 907,627 | $ 383,645 |
Class B |
|
|
|
|
Shares sold | 10,854 | 37,374 | $ 133,326 | $ 382,359 |
Shares redeemed | (20,668) | (85,747) | (249,828) | (903,867) |
Net increase (decrease) | (9,814) | (48,373) | $ (116,502) | $ (521,508) |
Class C |
|
|
|
|
Shares sold | 167,010 | 255,067 | $ 2,017,388 | $ 2,772,131 |
Shares redeemed | (151,149) | (78,775) | (1,741,389) | (836,250) |
Net increase (decrease) | 15,861 | 176,292 | $ 275,999 | $ 1,935,881 |
Mid Cap Growth |
|
|
|
|
Shares sold | 6,967,439 | 9,630,254 | $ 85,935,348 | $ 108,629,221 |
Reinvestment of distributions | - | 8,231 | - | 86,426 |
Shares redeemed | (10,887,596) | (7,764,226) | (132,262,341) | (83,888,689) |
Net increase (decrease) | (3,920,157) | 1,874,259 | $ (46,326,993) | $ 24,826,958 |
Institutional Class |
|
|
|
|
Shares sold | 100,295 | 66,364 | $ 1,204,093 | $ 728,116 |
Reinvestment of distributions | - | 13 | - | 141 |
Shares redeemed | (28,686) | (30,561) | (346,631) | (336,681) |
Net increase (decrease) | 71,609 | 35,816 | $ 857,462 | $ 391,576 |
Annual Report
Notes to Financial Statements - continued
11. Other.
The Fund's organizational documents provide former and current trustees and officers with a limited indemnification against liabilities arising in connection with the performance of their duties to the Fund. In the normal course of business, the Fund may also enter into contracts that provide general indemnifications. The Fund's maximum exposure under these arrangements is unknown as this would be dependent on future claims that may be made against the Fund. The risk of material loss from such claims is considered remote.
Annual Report
Report of Independent Registered Public Accounting Firm
To the Trustees of Fidelity Devonshire Trust and the Shareholders of Fidelity Mid Cap Growth Fund:
In our opinion, the accompanying statement of assets and liabilities, including the schedule of investments, and the related statements of operations and of changes in net assets and the financial highlights present fairly, in all material respects, the financial position of Fidelity Mid Cap Growth Fund (a fund of Fidelity Devonshire Trust) at January 31, 2012, the results of its operations for the year then ended, the changes in its net assets for each of the two years in the period then ended and the financial highlights for each of the periods indicated, in conformity with accounting principles generally accepted in the United States of America. These financial statements and financial highlights (hereafter referred to as "financial statements") are the responsibility of the Fidelity Mid Cap Growth Fund's management. Our responsibility is to express an opinion on these financial statements based on our audits. We conducted our audits of these financial statements in accordance with the standards of the Public Company Accounting Oversight Board (United States). Those standards require that we plan and perform the audit to obtain reasonable assurance about whether the financial statements are free of material misstatement. An audit includes examining, on a test basis, evidence supporting the amounts and disclosures in the financial statements, assessing the accounting principles used and significant estimates made by management, and evaluating the overall financial statement presentation. We believe that our audits, which included confirmation of securities at January 31, 2012 by correspondence with the custodian and brokers, provide a reasonable basis for our opinion.
/s/ PricewaterhouseCoopers LLP
PricewaterhouseCoopers LLP
Boston, Massachusetts
March 13, 2012
Annual Report
Trustees and Officers
The Trustees, Members of the Advisory Board, and executive officers of the trust and fund, as applicable, are listed below. The Board of Trustees governs the fund and is responsible for protecting the interests of shareholders. The Trustees are experienced executives who meet periodically throughout the year to oversee the fund's activities, review contractual arrangements with companies that provide services to the fund, oversee management of the risks associated with such activities and contractual arrangements, and review the fund's performance. Except for James C. Curvey, each of the Trustees oversees 226 funds advised by FMR or an affiliate. Mr. Curvey oversees 430 funds advised by FMR or an affiliate.
The Trustees hold office without limit in time except that (a) any Trustee may resign; (b) any Trustee may be removed by written instrument, signed by at least two-thirds of the number of Trustees prior to such removal; (c) any Trustee who requests to be retired or who has become incapacitated by illness or injury may be retired by written instrument signed by a majority of the other Trustees; and (d) any Trustee may be removed at any special meeting of shareholders by a two-thirds vote of the outstanding voting securities of the trust. Each Trustee who is not an interested person (as defined in the 1940 Act) (Independent Trustee), shall retire not later than the last day of the calendar year in which his or her 75th birthday occurs. The Independent Trustees may waive this mandatory retirement age policy with respect to individual Trustees. The executive officers and Advisory Board Members hold office without limit in time, except that any officer and Advisory Board Member may resign or may be removed by a vote of a majority of the Trustees at any regular meeting or any special meeting of the Trustees. Except as indicated, each individual has held the office shown or other offices in the same company for the past five years.
Experience, Skills, Attributes, and Qualifications of the Fund's Trustees. The Governance and Nominating Committee has adopted a statement of policy that describes the experience, qualifications, attributes, and skills that are necessary and desirable for potential Independent Trustee candidates (Statement of Policy). The Board believes that each Trustee satisfied at the time he or she was initially elected or appointed a Trustee, and continues to satisfy, the standards contemplated by the Statement of Policy. The Governance and Nominating Committee also engages professional search firms to help identify potential Independent Trustee candidates who have the experience, qualifications, attributes, and skills consistent with the Statement of Policy. From time to time, additional criteria based on the composition and skills of the current Independent Trustees, as well as experience or skills that may be appropriate in light of future changes to board composition, business conditions, and regulatory or other developments, have also been considered by the professional search firms and the Governance and Nominating Committee. In addition, the Board takes into account the Trustees' commitment and participation in Board and committee meetings, as well as their leadership of standing and ad hoc committees throughout their tenure.
In determining that a particular Trustee was and continues to be qualified to serve as a Trustee, the Board has considered a variety of criteria, none of which, in isolation, was controlling. The Board believes that, collectively, the Trustees have balanced and diverse experience, qualifications, attributes, and skills, which allow the Board to operate effectively in governing the fund and protecting the interests of shareholders. Information about the specific experience, skills, attributes, and qualifications of each Trustee, which in each case led to the Board's conclusion that the Trustee should serve (or continue to serve) as a trustee of the fund, is provided below.
Annual Report
Board Structure and Oversight Function. James C. Curvey is an interested person (as defined in the 1940 Act) and currently serves as Acting Chairman. The Trustees have determined that an interested Chairman is appropriate and benefits shareholders because an interested Chairman has a personal and professional stake in the quality and continuity of services provided to the fund. Independent Trustees exercise their informed business judgment to appoint an individual of their choosing to serve as Chairman, regardless of whether the Trustee happens to be independent or a member of management. The Independent Trustees have determined that they can act independently and effectively without having an Independent Trustee serve as Chairman and that a key structural component for assuring that they are in a position to do so is for the Independent Trustees to constitute a substantial majority for the Board. The Independent Trustees also regularly meet in executive session. Ned C. Lautenbach serves as Chairman of the Independent Trustees and as such (i) acts as a liaison between the Independent Trustees and management with respect to matters important to the Independent Trustees and (ii) with management prepares agendas for Board meetings.
Fidelity funds are overseen by different Boards of Trustees. The fund's Board oversees Fidelity's equity and high income funds and another Board oversees Fidelity's investment-grade bond, money market, and asset allocation funds. The asset allocation funds may invest in Fidelity funds overseen by the fund's Board. The use of separate Boards, each with its own committee structure, allows the Trustees of each group of Fidelity funds to focus on the unique issues of the funds they oversee, including common research, investment, and operational issues. On occasion, the separate Boards establish joint committees to address issues of overlapping consequences for the Fidelity funds overseen by each Board.
The Trustees operate using a system of committees to facilitate the timely and efficient consideration of all matters of importance to the Trustees, the fund, and fund shareholders and to facilitate compliance with legal and regulatory requirements and oversight of the fund's activities and associated risks. The Board, acting through its committees, has charged FMR and its affiliates with (i) identifying events or circumstances the occurrence of which could have demonstrably adverse effects on the fund's business and/or reputation; (ii) implementing processes and controls to lessen the possibility that such events or circumstances occur or to mitigate the effects of such events or circumstances if they do occur; and (iii) creating and maintaining a system designed to evaluate continuously business and market conditions in order to facilitate the identification and implementation processes described in (i) and (ii) above. Because the day-to-day operations and activities of the fund are carried out by or through FMR, its affiliates and other service providers, the fund's exposure to risks is mitigated but not eliminated by the processes overseen by the Trustees. While each of the Board's committees has responsibility for overseeing different aspects of the fund's activities, oversight is exercised primarily through the Operations, Audit, and Compliance Committees. In addition, the Independent Trustees have worked with FMR to enhance the Board's oversight of investment and financial risks, legal and regulatory risks, technology risks, and operational risks, including the development of additional risk reporting to the Board. For example, a working group comprised of Independent Trustees and FMR has worked and continues to work to review the Fidelity funds' valuation-related activities, reporting and risk management. Appropriate personnel, including but not limited to the fund's Chief Compliance Officer (CCO), FMR's internal auditor, the independent accountants, the fund's Treasurer and portfolio management personnel, make periodic reports to the Board's committees, as appropriate, including an annual review of FMR's risk management program for the Fidelity funds. The responsibilities of each standing committee, including their oversight responsibilities, are described further under "Standing Committees of the Fund's Trustees."
Annual Report
Trustees and Officers - continued
The fund's Statement of Additional Information (SAI) includes more information about the Trustees. To request a free copy, call Fidelity at 1-877-208-0098.
Interested Trustees*:
Correspondence intended for each Trustee who is an interested person may be sent to Fidelity Investments, 82 Devonshire Street, Boston, Massachusetts 02109.
Name, Age; Principal Occupations and Other Relevant Experience+ | |
James C. Curvey (76) | |
| Year of Election or Appointment: 2007 Mr. Curvey is Trustee and Acting Chairman of the Board of Trustees of certain Trusts. Mr. Curvey also serves as Trustee (2007-present) of other investment companies advised by FMR. Mr. Curvey is a Director of Fidelity Investments Money Management, Inc. (2009-present), Director of Fidelity Research & Analysis Co. (2009-present) and Director of FMR and FMR Co., Inc. (2007-present). Mr. Curvey is also Vice Chairman (2007-present) and Director of FMR LLC. In addition, Mr. Curvey serves as an Overseer for the Boston Symphony Orchestra and a member of the Trustees of Villanova University. Previously, Mr. Curvey was the Vice Chairman (2006-2007) and Director (2000-2007) of FMR Corp. |
Ronald P. O'Hanley (54) | |
| Year of Election or Appointment: 2011 Mr. O'Hanley is Director of FMR Co., Inc. (2010-present), Director of Fidelity Investments Money Management, Inc. (2010-present), Director of Fidelity Research & Analysis Company (2010-present), President of Fidelity Asset Management and Corporate Services and a member of Fidelity's Executive Committee (2010-present). Previously, Mr. O'Hanley served as President and Chief Executive Officer of BNY Mellon Asset Management (2007-2010). Mr. O'Hanley also served as Vice Chairman of Bank New York Mellon Corp. and a member of that firm's Executive Committee. Prior to the 2007 merger of The Bank of New York and Mellon Financial Corporation, he was Vice Chairman of Mellon Financial Corporation and President and Chief Executive Officer of Mellon Asset Management. He joined Mellon in February 1997. Mr. O'Hanley currently serves as Chairman of the Boston Public Library Foundation Board of Directors and sits on the Board of Directors of Beth Israel Deaconess Medical Center, the Board of Trustees of the Marine Biological Laboratory and the Advisory Board of the Maxwell School of Citizenship and Public Administration at Syracuse University. Mr. O'Hanley also chairs the Council on Asset Management for the Financial Services Roundtable and is a member of the Board of Directors of Institutional Investor's U.S. Institute. |
* Trustees have been determined to be "Interested Trustees" by virtue of, among other things, their affiliation with the trust or various entities under common control with FMR.
+ The information above includes each Trustee's principal occupation during the last five years and other information relating to the experience, attributes, and skills relevant to each Trustee's qualifications to serve as a Trustee, which led to the conclusion that each Trustee should serve as a Trustee for the fund.
Annual Report
Trustees and Officers - continued
Independent Trustees:
Correspondence intended for each Independent Trustee (that is, the Trustees other than the Interested Trustees) may be sent to Fidelity Investments, P.O. Box 55235, Boston, Massachusetts 02205-5235.
Name, Age; Principal Occupations and Other Relevant Experience+ | |
Dennis J. Dirks (63) | |
| Year of Election or Appointment: 2005 Prior to his retirement in May 2003, Mr. Dirks was Chief Operating Officer and a member of the Board of The Depository Trust & Clearing Corporation (DTCC). He also served as President, Chief Operating Officer, and Board member of The Depository Trust Company (DTC) and President and Board member of the National Securities Clearing Corporation (NSCC). In addition, Mr. Dirks served as Chief Executive Officer and Board member of the Government Securities Clearing Corporation, Chief Executive Officer and Board member of the Mortgage-Backed Securities Clearing Corporation, as a Trustee and a member of the Finance Committee of Manhattan College (2005-2008), and as a Trustee and a member of the Finance Committee of AHRC of Nassau County (2006-2008). Mr. Dirks is a member of the Independent Directors Council (IDC) Governing Council (2010-present) and Board of Directors for The Brookville Center for Children's Services, Inc. (2009-present). |
Alan J. Lacy (58) | |
| Year of Election or Appointment: 2008 Mr. Lacy serves as Senior Adviser (2007-present) of Oak Hill Capital Partners, L.P. (private equity). Mr. Lacy also served as Chief Executive Officer (2000-2005) and Vice Chairman (2005-2006) of Sears Holdings Corporation and Sears, Roebuck and Co. (retail). In addition, Mr. Lacy serves as a member of the Board of Directors of Dave & Buster's, Inc. (restaurant and entertainment complexes, 2010-present), The Hillman Companies, Inc. (hardware wholesalers, 2010-present), and Bristol-Myers Squibb Company (global pharmaceuticals, 2007-present). Mr. Lacy is a member of the Board of Trustees of The National Parks Conservation Association (2006-present). Previously, Mr. Lacy served as Chairman of the Board of Trustees of the National Parks Conservation Association (2008-2011) and as a member of the Board of Directors for the Western Union Company (global money transfer, 2006-2011). |
Ned C. Lautenbach (67) | |
| Year of Election or Appointment: 2000 Mr. Lautenbach is Chairman of the Independent Trustees of the Equity and High Income Funds (2006-present). Mr. Lautenbach currently serves as the Lead Director of the Eaton Corporation Board of Directors (diversified industrial, 1997-present). Mr. Lautenbach is also a member of the Board of Directors of the Philharmonic Center for the Arts in Naples, Florida (1999-present); a member of the Board of Trustees of Fairfield University (2005-present); and a member of the Council on Foreign Relations (1994-present). Previously, Mr. Lautenbach was a Partner/Advisory Partner at Clayton, Dubilier & Rice, LLC (private equity investment, 1998-2010), as well as a Director of Sony Corporation (2006-2007). |
Joseph Mauriello (67) | |
| Year of Election or Appointment: 2008 Prior to his retirement in January 2006, Mr. Mauriello served in numerous senior management positions including Deputy Chairman and Chief Operating Officer (2004-2005), and Vice Chairman of Financial Services (2002-2004) of KPMG LLP US (professional services, 1965-2005). Mr. Mauriello currently serves as a member of the Board of Directors of XL Group plc. (global insurance and re-insurance, 2006-present) and of Arcadia Resources Inc. (health care services and products, 2007-present). Previously, Mr. Mauriello served as a Director of the Hamilton Funds of the Bank of New York (2006-2007). |
Robert W. Selander (61) | |
| Year of Election or Appointment: 2011 Previously, Mr. Selander served as a Member of the Advisory Board of Fidelity's Equity and High Income Funds (2011), Executive Vice Chairman (2010), Chief Executive Officer (2009-2010), and President and Chief Executive Officer (1997-2009) of Mastercard, Inc. |
Cornelia M. Small (67) | |
| Year of Election or Appointment: 2005 Ms. Small is a member of the Board of Directors of the Teagle Foundation (2009-present). Ms. Small is also a member of the Investment Committee, and Chair (2008-present) and a member of the Board of Trustees of Smith College. In addition, Ms. Small serves on the Investment Committee of the Berkshire Taconic Community Foundation (2008-present). Previously, Ms. Small served as Chairperson of the Investment Committee (2002-2008) of Smith College. In addition, Ms. Small served as Chief Investment Officer, Director of Global Equity Investments, and a member of the Board of Directors of Scudder, Stevens & Clark and Scudder Kemper Investments. |
William S. Stavropoulos (72) | |
| Year of Election or Appointment: 2002 Mr. Stavropoulos is Vice Chairman of the Independent Trustees of the Equity and High Income Funds (2006-present). Mr. Stavropoulos serves as President and Founder of the Michigan Baseball Foundation, the Great Lakes Loons (2007-present). Mr. Stavropoulos is Chairman Emeritus of the Board of Directors of The Dow Chemical Company, where he previously served in numerous senior management positions, including President, CEO (1995-2000; 2002-2004), Chairman of the Executive Committee (2000-2006), and as a member of the Board of Directors (1990-2006). Currently, Mr. Stavropoulos is Chairman of Univar (global distributor of commodity and specialty chemicals, 2010-present), a Director of Teradata Corporation (data warehousing and technology solutions, 2008-present), Chemical Financial Corporation, Maersk Inc. (industrial conglomerate), Tyco International, Inc. (multinational manufacturing and services, 2007-present), and a member of the Advisory Board for Metalmark Capital (private equity investment, 2005-present). Mr. Stavropoulos is a special advisor to Clayton, Dubilier & Rice, LLC (private equity investment). In addition, Mr. Stavropoulos is a member of the University of Notre Dame Advisory Council for the College of Science. |
David M. Thomas (62) | |
| Year of Election or Appointment: 2008 Previously, Mr. Thomas served as Executive Chairman (2005-2006) and Chairman and Chief Executive Officer (2000-2005) of IMS Health, Inc. (pharmaceutical and healthcare information solutions). In addition, Mr. Thomas serves as a member of the Board of Directors of Fortune Brands, Inc. (consumer products), and Interpublic Group of Companies, Inc. (marketing communication, 2004-present). |
Michael E. Wiley (61) | |
| Year of Election or Appointment: 2008 Mr. Wiley also serves as a Director of Asia Pacific Exploration Consolidated (international oil and gas exploration and production, 2008-present). Mr. Wiley serves as a Director of Tesoro Corporation (independent oil refiner and marketer, 2005-present), and a Director of Bill Barrett Corporation (exploration and production, 2005-present). In addition, Mr. Wiley also serves as a Director of Post Oak Bank (privately-held bank, 2004-present). Previously, Mr. Wiley served as a member of the Board of Trustees of the University of Tulsa (2000-2006; 2007-2010), as a Senior Energy Advisor of Katzenbach Partners, LLC (consulting, 2006-2007), as an Advisory Director of Riverstone Holdings (private investment), Chairman, President, and CEO of Baker Hughes, Inc. (oilfield services, 2000-2004), and as Director of Spinnaker Exploration Company (exploration and production, 2001-2005). |
Annual Report
+ The information above includes each Trustee's principal occupation during the last five years and other information relating to the experience, attributes, and skills relevant to each Trustee's qualifications to serve as a Trustee, which led to the conclusion that each Trustee should serve as a Trustee for the fund.
Advisory Board Members and Executive Officers:
Correspondence intended for each executive officer may be sent to Fidelity Investments, 82 Devonshire Street, Boston, Massachusetts 02109.
Name, Age; Principal Occupation | |
Edward C. Johnson 3d (81) | |
| Year of Election or Appointment: 2011 Member of the Advisory Board of Fidelity's Equity and High Income Funds. Mr. Johnson serves as Chief Executive Officer, Chairman, and a Director of FMR LLC, and also serves as Chairman and Director of FIL Limited. Previously, Mr. Johnson served as a Trustee and Chairman of the Board of certain Fidelity Trusts, Chairman and a Director of FMR, Chairman and a Director of FMR Co., Inc., and President of FMR LLC (2006-2007). |
Peter S. Lynch (68) | |
| Year of Election or Appointment: 2003 Member of the Advisory Board of Fidelity's Equity and High Income Funds. Mr. Lynch is Vice Chairman and a Director of FMR and FMR Co., Inc. In addition, Mr. Lynch serves as a Trustee of Boston College and as the Chairman of the Inner-City Scholarship Fund. Previously, Mr. Lynch served on the Special Olympics International Board of Directors (1997-2006). |
Kenneth B. Robins (42) | |
| Year of Election or Appointment: 2008 President and Treasurer of Fidelity's Equity and High Income Funds. Mr. Robins also serves as President and Treasurer (2010-present) and Assistant Treasurer (2009-present) of other Fidelity funds and is an employee of Fidelity Investments (2004-present). Previously, Mr. Robins served as Deputy Treasurer of the Fidelity funds (2005-2008) and Treasurer and Chief Financial Officer of The North Carolina Capital Management Trust: Cash and Term Portfolios (2006-2008). |
Bruce T. Herring (46) | |
| Year of Election or Appointment: 2006 Vice President of certain Equity Funds. Mr. Herring also serves as President of Fidelity Research & Analysis Company (2010-present), Chief Investment Officer and Director of Fidelity Management & Research (U.K.) Inc. (2010-present) and Group Chief Investment Officer of FMR. Previously, Mr. Herring served as Vice President (2005-2006) and Senior Vice President (2006-2007) of Fidelity Management & Research Company, Vice President of FMR Co., Inc. (2001-2007) and as a portfolio manager for Fidelity U.S. Equity Funds. |
Brian B. Hogan (47) | |
| Year of Election or Appointment: 2009 Vice President of Equity and High Income Funds. Mr. Hogan also serves as President of FMR's Equity Division (2009-present). Previously, Mr. Hogan served as Senior Vice President, Equity Research of FMR (2006-2009) and as a portfolio manager. |
Scott C. Goebel (44) | |
| Year of Election or Appointment: 2008 Secretary and Chief Legal Officer (CLO) of the Fidelity funds. Mr. Goebel also serves as Secretary of Fidelity Investments Money Management, Inc. (FIMM) (2010-present) and Fidelity Research and Analysis Company (FRAC) (2010-present); Secretary and CLO of The North Carolina Capital Management Trust: Cash and Term Portfolios (2008-present); General Counsel, Secretary, and Senior Vice President of FMR (2008-present) and FMR Co., Inc. (2008-present); employed by FMR LLC or an affiliate (2001-present); Chief Legal Officer of Fidelity Management & Research (Hong Kong) Limited (2008-present) and Assistant Secretary of Fidelity Management & Research (Japan) Inc. (2008-present), and Fidelity Management & Research (U.K.) Inc. (2008-present). Previously, Mr. Goebel served as Assistant Secretary of FIMM (2008-2010), FRAC (2008-2010), and the Funds (2007-2008) and as Vice President and Secretary of Fidelity Distributors Corporation (FDC) (2005-2007). |
William C. Coffey (42) | |
| Year of Election or Appointment: 2009 Assistant Secretary of Fidelity's Equity and High Income Funds. Mr. Coffey also serves as Senior Vice President and Deputy General Counsel of FMR LLC (2010-present), and is an employee of Fidelity Investments. Previously, Mr. Coffey served as Vice President and Associate General Counsel of FMR LLC (2005-2009). |
Holly C. Laurent (57) | |
| Year of Election or Appointment: 2008 Anti-Money Laundering (AML) Officer of the Fidelity funds. Ms. Laurent also serves as AML Officer of The North Carolina Capital Management Trust: Cash and Term Portfolios (2008-present) and is an employee of Fidelity Investments. Previously, Ms. Laurent was Senior Vice President and Head of Legal for Fidelity Business Services India Pvt. Ltd. (2006-2008), and Senior Vice President, Deputy General Counsel and Group Head for FMR LLC (2005-2006). |
Christine Reynolds (53) | |
| Year of Election or Appointment: 2008 Chief Financial Officer of the Fidelity funds. Ms. Reynolds became President of Fidelity Pricing and Cash Management Services (FPCMS) in August 2008. Ms. Reynolds served as Chief Operating Officer of FPCMS (2007-2008). Previously, Ms. Reynolds served as President, Treasurer, and Anti-Money Laundering officer of the Fidelity funds (2004-2007). |
Kenneth A. Rathgeber (64) | |
| Year of Election or Appointment: 2004 Chief Compliance Officer of Fidelity's Equity and High Income Funds. Mr. Rathgeber is Chief Compliance Officer of Fidelity Management & Research (Hong Kong) Limited (2008-present), Fidelity Management & Research (Japan) Inc. (2008-present), FMR (2005-present), FMR Co., Inc. (2005-present), Fidelity Management & Research (U.K.) Inc. (2005-present), Fidelity Research & Analysis Company (2005-present), Fidelity Investments Money Management, Inc. (2005-present), Pyramis Global Advisors, LLC (2005-present), and Strategic Advisers, Inc. (2005-present). |
Joseph F. Zambello (54) | |
| Year of Election or Appointment: 2011 Deputy Treasurer of the Fidelity funds. Mr. Zambello is an employee of Fidelity Investments. Previously, Mr. Zambello served as Vice President of FMR's Program Management Group (2009-2011) and Vice President of the Transfer Agent Oversight Group (2005-2009). |
Adrien E. Deberghes (44) | |
| Year of Election or Appointment: 2008 Deputy Treasurer of Fidelity's Equity and High Income Funds. Mr. Deberghes also serves as Vice President and Assistant Treasurer of Fidelity Rutland Square Trust II and Fidelity Commonwealth Trust II (2011-present), Assistant Treasurer of other Fidelity funds (2010-present), and is an employee of Fidelity Investments (2008-present). Previously, Mr. Deberghes served as Senior Vice President of Mutual Fund Administration at State Street Corporation (2007-2008), Senior Director of Mutual Fund Administration at Investors Bank & Trust (2005-2007), and Director of Finance for Dunkin' Brands (2000-2005). |
Stephanie J. Dorsey (42) | |
| Year of Election or Appointment: 2010 Assistant Treasurer of Fidelity's Equity and High Income Funds. Ms. Dorsey also serves as Deputy Treasurer of other Fidelity funds (2008-present) and is an employee of Fidelity Investments (2008-present). Previously, Ms. Dorsey served as Treasurer (2004-2008) of the JPMorgan Mutual Funds and Vice President (2004-2008) of JPMorgan Chase Bank. |
John R. Hebble (53) | |
| Year of Election or Appointment: 2009 Assistant Treasurer of Fidelity's Equity and High Income Funds. Mr. Hebble also serves as President (2011-present), Treasurer, and Chief Financial Officer of The North Carolina Capital Management Trust: Cash and Term Portfolios (2008-present), President and Treasurer of other Fidelity funds (2008-present) and is an employee of Fidelity Investments. |
Gary W. Ryan (53) | |
| Year of Election or Appointment: 2005 Assistant Treasurer of the Fidelity funds. Mr. Ryan is an employee of Fidelity Investments. Previously, Mr. Ryan served as Vice President of Fund Reporting in Fidelity Pricing and Cash Management Services (FPCMS) (1999-2005). |
Jonathan Davis (43) | |
| Year of Election or Appointment: 2010 Assistant Treasurer of the Fidelity funds. Mr. Davis is also Assistant Treasurer of Fidelity Rutland Square Trust II and Fidelity Commonwealth Trust II. Mr. Davis is an employee of Fidelity Investments. Previously, Mr. Davis served as Vice President and Associate General Counsel of FMR LLC (2003-2010). |
Annual Report
Investment Adviser
Fidelity Management & Research Company
Boston, MA
Investment Sub-Advisers
FMR Co., Inc.
Fidelity Management & Research
(U.K.) Inc.
Fidelity Management & Research
(Hong Kong) Limited
Fidelity Management & Research
(Japan) Inc.
General Distributor
Fidelity Distributors Corporation
Boston, MA
Transfer and Service Agents
Fidelity Investments Institutional Operations Company, Inc.
Boston, MA
Fidelity Service Company, Inc.
Boston, MA
Custodian
Citibank, N.A.
New York, NY
AMCG-UANN-0312
1.838425.102
(Fidelity Investment logo)(registered trademark)
(Fidelity Investment logo)(registered trademark)
Fidelity Advisor®
Mid Cap Growth
Fund - Institutional Class
Annual Report
January 31, 2012
(Fidelity Cover Art)
Institutional Class is a class of
Fidelity® Mid Cap Growth Fund
Contents
Chairman's Message | The Chairman's message to shareholders. | |
Performance | How the fund has done over time. | |
Management's Discussion of Fund Performance | The Portfolio Manager's review of fund performance and strategy. | |
Shareholder Expense Example | An example of shareholder expenses. | |
Investment Changes | A summary of major shifts in the fund's investments over the past six months. | |
Investments | A complete list of the fund's investments with their market values. | |
Financial Statements | Statements of assets and liabilities, operations, and changes in net assets, as well as financial highlights. | |
Notes | Notes to the financial statements. | |
Report of Independent Registered Public Accounting Firm |
| |
Trustees and Officers |
|
To view a fund's proxy voting guidelines and proxy voting record for the 12-month period ended June 30, visit http://www.fidelity.com/proxyvotingresults or visit the Securities and Exchange Commission's (SEC) web site at http://www.sec.gov. You may also call 1-877-208-0098 to request a free copy of the proxy voting guidelines.
Standard & Poor's, S&P and S&P 500 are registered service marks of The McGraw-Hill Companies, Inc. and have been licensed for use by Fidelity Distributors Corporation.
Other third party marks appearing herein are the property of their respective owners.
All other marks appearing herein are registered or unregistered trademarks or service marks of FMR LLC or an affiliated company.
Annual Report
This report and the financial statements contained herein are submitted for the general information of the shareholders of the fund. This report is not authorized for distribution to prospective investors in the fund unless preceded or accompanied by an effective prospectus.
A fund files its complete schedule of portfolio holdings with the SEC for the first and third quarters of each fiscal year on Form N-Q. Forms N-Q are available on the SEC's web site at http://www.sec.gov. A fund's Forms N-Q may be reviewed and copied at the SEC's Public Reference Room in Washington, DC. Information regarding the operation of the SEC's Public Reference Room may be obtained by calling 1-800-SEC-0330. For a complete list of a fund's portfolio holdings, view the most recent holdings listing, semiannual report, or annual report on Fidelity's web site at http://www.fidelity.com, http://www.advisor.fidelity.com, or http://www.401k.com, as applicable.
NOT FDIC INSURED • MAY LOSE VALUE • NO BANK GUARANTEE
Neither the fund nor Fidelity Distributors Corporation is a bank.
Annual Report
Chairman's Message
(photo_of_James_C_Curvey)
Dear Shareholder:
Following a year marked by unusually high volatility, 2012 began with most major asset classes advancing steadily in January. For U.S. equities, it was the strongest start to a new year since 1997. International stocks fared even better, despite continued uncertainty related to the sovereign debt crisis in Europe. Investors have been acutely sensitive to the latest news, for better or worse, coming out of the eurozone and its impact on financial markets. As we look ahead, the unresolved debt crisis in Europe remains at the center of a series of risk factors, summarized below, that we believe have the greatest potential to influence the global investment landscape.
Deleveraging and the economy
In the euro-currency area, fiscal austerity among nations and debt deleveraging among financial companies loaded with sovereign debt are deflationary measures and serve to hinder economic growth in the short term. Such an economic and financial-market scenario has not been historically supportive of strong performance among riskier assets, and emerges at a time when many nations need a resurgent economy to assist them in closing their budget deficits and in building confidence among bond buyers to help them refinance their existing debt obligations.
Slowdown in China and Europe
China's economy is the second-largest in the world, and it has been the biggest contributor to global growth since the end of the last recession. Thus, the slower pace of domestic growth in China has led to lower demand for imports of commodities and other construction materials from the rest of the world. In addition, economic weakness in Europe and the broad-based global economic slowdown are putting pressure on China's export growth, which has been largely responsible for its breakneck pace of annual gross domestic product (GDP) growth during the past three decades.
Credit deterioration and contagion
The heightened macroeconomic risk and elevated credit risk swirling around certain European nations and financial institutions have caused many market participants to avoid purchases of or reduce exposure to short-term debt offerings by these issuers. With increased credit risk, there are growing concerns about the potential credit contraction and contagion from European issuers spreading to other financial markets.
We invite you to learn more by visiting us on the Internet or calling us by phone. It is our privilege to provide the resources you need to choose investments that are right for you.
Sincerely,
(The acting chairman's signature appears here.)
James C. Curvey
Acting Chairman
Annual Report
Performance: The Bottom Line
Average annual total return reflects the change in the value of an investment, assuming reinvestment of the class' distributions from dividend income and capital gains (the profits earned upon the sale of securities that have grown in value, if any) and assuming a constant rate of performance each year. The $10,000 table and the fund's returns do not reflect the deduction of taxes that a shareholder would pay on fund distributions or the redemption of fund shares. During periods of reimbursement by Fidelity, a fund's total return will be greater than it would be had the reimbursement not occurred. How a fund did yesterday is no guarantee of how it will do tomorrow.
Average Annual Total Returns
Periods ended January 31, 2012 | Past 1 | Past 5 | Past 10 |
Institutional Class A | -1.66% | -1.43% | 3.23% |
A The initial offering of Institutional Class shares took place on February 13, 2007. Returns prior to February 13, 2007 are those of Fidelity® Mid Cap Growth Fund, the original class of the fund.
$10,000 Over 10 Years
Let's say hypothetically that $10,000 was invested in Fidelity Advisor® Mid Cap Growth Fund - Institutional Class on January 31, 2002. The chart shows how the value of your investment would have changed, and also shows how the Russell Midcap® Growth Index performed over the same period. The initial offering of Institutional Class took place on February 13, 2007. See above for additional information regarding the performance of Institutional Class.
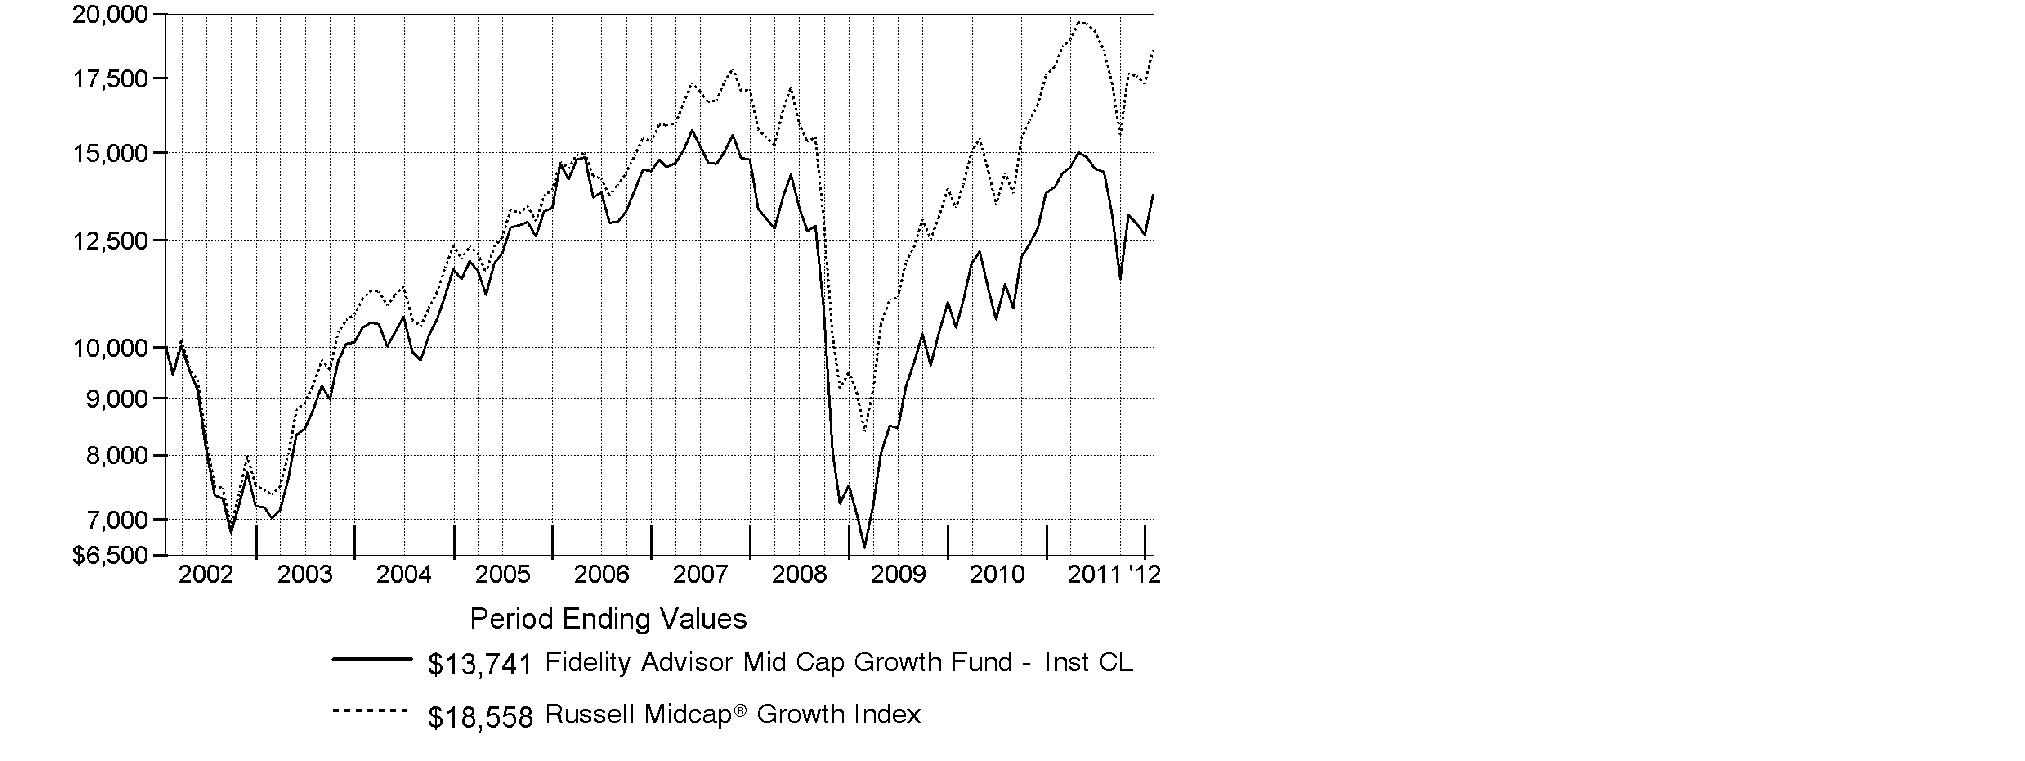
Annual Report
Management's Discussion of Fund Performance
Market Recap: After enduring one of the most volatile trading periods on record, U.S. stocks posted a gain for the 12 months ending January 31, 2012, sparked by a January rally. Strong corporate earnings reports and hints of economic recovery sent stocks mostly upward through April, when sovereign debt woes in Europe sparked fear of a global slowdown. In the summer, equities plummeted on eurozone instability, debate over the U.S. debt ceiling and a historic downgrade of the nation's sovereign debt rating. After falling as much as 13% by early August, the broad-based S&P 500® Index seesawed back to end the period on an optimistic note. For the full 12 months, the S&P 500® rose 4.22%, while the technology-laden Nasdaq Compositer Index added 5.26%. Investors began to shed perceived riskier smaller-cap stocks in favor of larger, more-established and dividend-paying names, helping to drive the Dow Jones® Industrial Average up 9.12% for the year, while the Russell 2000® - a proxy for small-caps - and Russell Midcap® indexes added 2.86% and 2.25%, respectively. Within the S&P 500®, defensive sectors such as health care (+16%) and utilities (+14%) fared best, while financials (-12%) struggled. Foreign developed-markets stocks were stung by Europe's turmoil, and the MSCI® EAFE® (Europe, Australasia, Far East) Index fell 9.49%.
Comments from Steven Calhoun, Portfolio Manager of Fidelity Advisor® Mid Cap Growth Fund: During the year, the fund's Institutional Class shares returned -1.66%, well behind the 3.42% gain of the Russell Midcap® Growth Index. Versus the index, unrewarding stock selection and a sizable overweighting in the weak-performing energy sector materially hurt the fund's performance, as did stock picking and an underweighting in the strong-performing consumer discretionary sector. China-based seed supplier Origin Agritech, our largest individual detractor, declined against the backdrop of tighter credit and weak stock market conditions in China, among other factors. Two producers of metallurgical coal, Alpha Natural Resources and Walter Energy, also dampened performance. Conversely, stock picking in health care aided performance, while positioning in information technology also helped. The shares of biopharmaceutical firm Inhibitex, the fund's top contributor, benefited from favorable test results for one of its hepatitis C drugs and from a lucrative buyout offer received by the company in January. I sold Inhibitex during the period. Also aiding performance were Idenix Pharmaceuticals and nitrogen fertilizer producer CVR Partners. Most of the stocks I've mentioned in this report were out-of-index holdings.
Annual Report
The views expressed above reflect those of the portfolio manager(s) only through the end of the period as stated on the cover of this report and do not necessarily represent the views of Fidelity or any other person in the Fidelity organization. Any such views are subject to change at any time based upon market or other conditions and Fidelity disclaims any responsibility to update such views. These views may not be relied on as investment advice and, because investment decisions for a Fidelity fund are based on numerous factors, may not be relied on as an indication of trading intent on behalf of any Fidelity fund.
Annual Report
Shareholder Expense Example
As a shareholder of the Fund, you incur two types of costs: (1) transaction costs, including sales charges (loads) on purchase payments or redemption proceeds, redemption fees, and (2) ongoing costs, including management fees, distribution and/or service (12b-1) fees and other Fund expenses. This Example is intended to help you understand your ongoing costs (in dollars) of investing in the Fund and to compare these costs with the ongoing costs of investing in other mutual funds.
The Example is based on an investment of $1,000 invested at the beginning of the period and held for the entire period (August 1, 2011 to January 31, 2012).
Actual Expenses
The first line of the accompanying table for each class of the Fund provides information about actual account values and actual expenses. You may use the information in this line, together with the amount you invested, to estimate the expenses that you paid over the period. Simply divide your account value by $1,000.00 (for example, an $8,600 account value divided by $1,000.00 = 8.6), then multiply the result by the number in the first line for a class of the Fund under the heading entitled "Expenses Paid During Period" to estimate the expenses you paid on your account during this period. A small balance maintenance fee of $12.00 that is charged once a year may apply for certain accounts with a value of less than $2,000. This fee is not included in the table below. If it was, the estimate of expenses you paid during the period would be higher, and your ending account value lower, by this amount. In addition, the Fund, as a shareholder in the underlying Fidelity Central Funds, will indirectly bear its pro-rata share of the fees and expenses incurred by the underlying Fidelity Central Funds. These fees and expenses are not included in the Fund's annualized expense ratio used to calculate the expense estimate in the table below.
Hypothetical Example for Comparison Purposes
The second line of the accompanying table for each class of the Fund provides information about hypothetical account values and hypothetical expenses based on a Class' actual expense ratio and an assumed rate of return of 5% per year before expenses, which is not the Class' actual return. The hypothetical account values and expenses may not be used to estimate the actual ending account balance or expenses you paid for the period. You may use this information to compare the ongoing costs of investing in the Fund and other funds. To do so, compare this 5% hypothetical example with the 5% hypothetical examples that appear in the shareholder reports of the other funds. A small balance maintenance fee of $12.00 that is charged once a year may apply for certain accounts with a value of less than $2,000. This fee is not included in the table below. If it was, the estimate of expenses you paid during the period would be higher, and your ending account value lower, by this amount. In addition, the Fund, as a shareholder in the underlying Fidelity Central Funds, will indirectly bear its pro-rata share of the fees and expenses incurred by the underlying Fidelity Central Funds. These fees and expenses are not included in the Fund's annualized expense ratio used to calculate the expense estimate in the table below.
Please note that the expenses shown in the table are meant to highlight your ongoing costs only and do not reflect any transaction costs. Therefore, the second line of the table is useful in comparing ongoing costs only, and will not help you determine the relative total costs of owning different funds. In addition, if these transactional costs were included, your costs would have been higher.
Annual Report
| Annualized | Beginning | Ending | Expenses Paid |
Class A | 1.03% |
|
|
|
Actual |
| $ 1,000.00 | $ 951.20 | $ 5.07 |
HypotheticalA |
| $ 1,000.00 | $ 1,020.01 | $ 5.24 |
Class T | 1.33% |
|
|
|
Actual |
| $ 1,000.00 | $ 949.90 | $ 6.54 |
HypotheticalA |
| $ 1,000.00 | $ 1,018.50 | $ 6.77 |
Class B | 1.77% |
|
|
|
Actual |
| $ 1,000.00 | $ 948.20 | $ 8.69 |
HypotheticalA |
| $ 1,000.00 | $ 1,016.28 | $ 9.00 |
Class C | 1.78% |
|
|
|
Actual |
| $ 1,000.00 | $ 948.20 | $ 8.74 |
HypotheticalA |
| $ 1,000.00 | $ 1,016.23 | $ 9.05 |
Mid Cap Growth | .77% |
|
|
|
Actual |
| $ 1,000.00 | $ 953.10 | $ 3.79 |
HypotheticalA |
| $ 1,000.00 | $ 1,021.32 | $ 3.92 |
Institutional Class | .65% |
|
|
|
Actual |
| $ 1,000.00 | $ 954.00 | $ 3.20 |
HypotheticalA |
| $ 1,000.00 | $ 1,021.93 | $ 3.31 |
A 5% return per year before expenses
* Expenses are equal to each Class' annualized expense ratio, multiplied by the average account value over the period, multiplied by 184/365 (to reflect the one-half year period).
Annual Report
Investment Changes (Unaudited)
Top Ten Stocks as of January 31, 2012 | ||
| % of fund's | % of fund's net assets |
CF Industries Holdings, Inc. | 2.6 | 4.0 |
Cyberonics, Inc. | 2.2 | 1.5 |
Potash Corp. of Saskatchewan, Inc. | 2.1 | 0.0 |
The Mosaic Co. | 2.0 | 1.1 |
Idenix Pharmaceuticals, Inc. | 1.9 | 0.7 |
Heckmann Corp. | 1.9 | 1.2 |
ArthroCare Corp. | 1.9 | 1.4 |
CNH Global NV | 1.7 | 1.1 |
Citrix Systems, Inc. | 1.6 | 0.7 |
CVR Partners LP | 1.6 | 1.6 |
| 19.5 | |
Top Five Market Sectors as of January 31, 2012 | ||
| % of fund's | % of fund's net assets 6 months ago |
Information Technology | 21.1 | 18.6 |
Health Care | 16.5 | 15.4 |
Consumer Discretionary | 16.5 | 15.5 |
Energy | 14.1 | 17.7 |
Materials | 12.3 | 11.9 |
Asset Allocation (% of fund's net assets) | |||||||
As of January 31, 2012* | As of July 31, 2011** | ||||||
| Stocks 96.4% |
| | Stocks 99.7% |
| ||
| Short-Term |
| | Short-Term |
| ||
* Foreign investments | 14.3% |
| ** Foreign investments | 15.5% |
| ||

Annual Report
Investments January 31, 2012
Showing Percentage of Net Assets
Common Stocks - 96.4% | |||
Shares | Value | ||
CONSUMER DISCRETIONARY - 16.5% | |||
Automobiles - 0.8% | |||
Tesla Motors, Inc. (a)(d) | 71,900 | $ 2,090,133 | |
Diversified Consumer Services - 1.1% | |||
Weight Watchers International, Inc. (d) | 40,500 | 3,083,265 | |
Hotels, Restaurants & Leisure - 2.2% | |||
BJ's Restaurants, Inc. (a) | 26,900 | 1,345,807 | |
Buffalo Wild Wings, Inc. (a)(d) | 20,200 | 1,344,512 | |
Panera Bread Co. Class A (a) | 12,000 | 1,779,000 | |
Texas Roadhouse, Inc. Class A | 96,100 | 1,456,876 | |
| 5,926,195 | ||
Media - 1.0% | |||
Discovery Communications, Inc. (a) | 63,700 | 2,731,456 | |
Multiline Retail - 1.0% | |||
Dollar Tree, Inc. (a) | 32,600 | 2,764,806 | |
Specialty Retail - 4.0% | |||
Abercrombie & Fitch Co. Class A | 39,000 | 1,791,660 | |
Body Central Corp. (a) | 62,500 | 1,680,000 | |
Limited Brands, Inc. | 74,400 | 3,114,384 | |
Tractor Supply Co. | 33,700 | 2,721,949 | |
Ulta Salon, Cosmetics & Fragrance, Inc. (a) | 21,700 | 1,653,974 | |
| 10,961,967 | ||
Textiles, Apparel & Luxury Goods - 6.4% | |||
Liz Claiborne, Inc. (a)(d) | 341,000 | 3,171,300 | |
Michael Kors Holdings Ltd. | 51,300 | 1,587,735 | |
PVH Corp. | 41,300 | 3,187,947 | |
Ralph Lauren Corp. | 25,000 | 3,800,000 | |
Under Armour, Inc. Class A (sub. vtg.) (a)(d) | 35,500 | 2,826,510 | |
Warnaco Group, Inc. (a) | 49,400 | 2,877,550 | |
| 17,451,042 | ||
TOTAL CONSUMER DISCRETIONARY | 45,008,864 | ||
CONSUMER STAPLES - 3.4% | |||
Beverages - 0.6% | |||
Monster Beverage Corp. (a) | 15,500 | 1,619,905 | |
Food & Staples Retailing - 1.1% | |||
Whole Foods Market, Inc. | 39,700 | 2,938,991 | |
Common Stocks - continued | |||
Shares | Value | ||
CONSUMER STAPLES - continued | |||
Food Products - 1.3% | |||
Green Mountain Coffee Roasters, Inc. (a)(d) | 48,300 | $ 2,576,322 | |
Origin Agritech Ltd. (a)(d) | 375,069 | 888,914 | |
| 3,465,236 | ||
Tobacco - 0.4% | |||
Lorillard, Inc. | 11,600 | 1,245,724 | |
TOTAL CONSUMER STAPLES | 9,269,856 | ||
ENERGY - 14.1% | |||
Energy Equipment & Services - 5.5% | |||
Cameron International Corp. (a) | 82,300 | 4,378,360 | |
Dresser-Rand Group, Inc. (a) | 57,200 | 2,930,356 | |
Heckmann Corp. (a)(d) | 1,022,900 | 5,227,019 | |
Rowan Companies, Inc. (a) | 77,300 | 2,628,973 | |
| 15,164,708 | ||
Oil, Gas & Consumable Fuels - 8.6% | |||
Alpha Natural Resources, Inc. (a) | 213,500 | 4,295,620 | |
Amyris, Inc. (a)(d) | 85,100 | 763,347 | |
Bumi PLC | 173,710 | 2,381,773 | |
Cabot Oil & Gas Corp. | 85,200 | 2,717,880 | |
EV Energy Partners LP | 42,500 | 2,835,600 | |
EXCO Resources, Inc. | 150,200 | 1,180,572 | |
Genel Energy PLC | 46,900 | 629,012 | |
Oasis Petroleum, Inc. (a)(d) | 83,400 | 2,813,916 | |
QEP Resources, Inc. | 94,800 | 2,715,072 | |
Range Resources Corp. | 37,500 | 2,157,000 | |
Solazyme, Inc. (d) | 76,000 | 883,120 | |
| 23,372,912 | ||
TOTAL ENERGY | 38,537,620 | ||
FINANCIALS - 1.0% | |||
Real Estate Management & Development - 1.0% | |||
Altisource Portfolio Solutions SA (a) | 50,900 | 2,722,641 | |
HEALTH CARE - 16.5% | |||
Biotechnology - 7.5% | |||
Alexion Pharmaceuticals, Inc. (a) | 36,300 | 2,786,388 | |
Human Genome Sciences, Inc. (a)(d) | 304,500 | 2,996,280 | |
Idenix Pharmaceuticals, Inc. (a)(d) | 398,800 | 5,339,932 | |
Common Stocks - continued | |||
Shares | Value | ||
HEALTH CARE - continued | |||
Biotechnology - continued | |||
InterMune, Inc. (a) | 163,500 | $ 2,452,500 | |
Theravance, Inc. (a) | 85,900 | 1,523,866 | |
United Therapeutics Corp. (a) | 57,600 | 2,832,768 | |
Vertex Pharmaceuticals, Inc. (a) | 73,100 | 2,701,045 | |
| 20,632,779 | ||
Health Care Equipment & Supplies - 7.7% | |||
ArthroCare Corp. (a) | 164,479 | 5,084,046 | |
Cyberonics, Inc. (a) | 180,687 | 5,872,328 | |
Insulet Corp. (a) | 76,800 | 1,495,296 | |
NuVasive, Inc. (a) | 230,231 | 3,568,581 | |
Zeltiq Aesthetics, Inc. (d) | 43,000 | 516,000 | |
Zoll Medical Corp. (a) | 64,300 | 4,409,694 | |
| 20,945,945 | ||
Health Care Technology - 0.8% | |||
Merge Healthcare, Inc. (a) | 381,032 | 2,088,055 | |
Life Sciences Tools & Services - 0.5% | |||
Illumina, Inc. (a) | 28,000 | 1,449,280 | |
TOTAL HEALTH CARE | 45,116,059 | ||
INDUSTRIALS - 11.5% | |||
Aerospace & Defense - 1.1% | |||
BE Aerospace, Inc. (a) | 72,000 | 3,038,400 | |
Building Products - 2.4% | |||
Lennox International, Inc. | 77,700 | 2,812,740 | |
Owens Corning (a) | 112,500 | 3,796,875 | |
| 6,609,615 | ||
Electrical Equipment - 2.2% | |||
Cooper Industries PLC Class A | 55,900 | 3,304,808 | |
Roper Industries, Inc. | 28,300 | 2,642,937 | |
| 5,947,745 | ||
Machinery - 4.9% | |||
CNH Global NV (a) | 109,600 | 4,574,704 | |
IDEX Corp. | 45,100 | 1,827,452 | |
Ingersoll-Rand PLC | 115,700 | 4,042,558 | |
WABCO Holdings, Inc. (a) | 31,100 | 1,612,535 | |
Westport Innovations, Inc. (a)(d) | 32,000 | 1,331,200 | |
| 13,388,449 | ||
Common Stocks - continued | |||
Shares | Value | ||
INDUSTRIALS - continued | |||
Marine - 0.9% | |||
Kirby Corp. (a) | 39,000 | $ 2,604,030 | |
TOTAL INDUSTRIALS | 31,588,239 | ||
INFORMATION TECHNOLOGY - 21.1% | |||
Communications Equipment - 1.5% | |||
Polycom, Inc. (a) | 155,000 | 3,092,250 | |
Riverbed Technology, Inc. (a) | 46,000 | 1,101,240 | |
| 4,193,490 | ||
Computers & Peripherals - 1.0% | |||
SanDisk Corp. (a) | 58,300 | 2,674,804 | |
Electronic Equipment & Components - 1.6% | |||
Aeroflex Holding Corp. (a) | 98,400 | 1,246,728 | |
Maxwell Technologies, Inc. (a)(d) | 149,100 | 3,050,586 | |
| 4,297,314 | ||
Internet Software & Services - 2.6% | |||
Blinkx PLC (a) | 601,900 | 635,558 | |
Rackspace Hosting, Inc. (a) | 61,061 | 2,650,658 | |
Velti PLC (a) | 104,400 | 913,500 | |
VeriSign, Inc. | 82,600 | 3,061,156 | |
| 7,260,872 | ||
IT Services - 1.1% | |||
Cognizant Technology Solutions Corp. Class A (a) | 42,100 | 3,020,675 | |
Semiconductors & Semiconductor Equipment - 5.1% | |||
ASML Holding NV | 64,400 | 2,768,556 | |
Ceva, Inc. (a) | 74,690 | 2,017,377 | |
Freescale Semiconductor Holdings I Ltd. (d) | 100,120 | 1,598,916 | |
KLA-Tencor Corp. | 55,700 | 2,847,941 | |
NVIDIA Corp. (a) | 200,000 | 2,954,000 | |
NXP Semiconductors NV (a) | 82,400 | 1,749,352 | |
| 13,936,142 | ||
Software - 8.2% | |||
ANSYS, Inc. (a) | 54,200 | 3,278,558 | |
Ariba, Inc. (a) | 50,900 | 1,389,570 | |
Autodesk, Inc. (a) | 83,800 | 3,016,800 | |
Check Point Software Technologies Ltd. (a) | 48,500 | 2,730,065 | |
Citrix Systems, Inc. (a) | 69,800 | 4,551,658 | |
Informatica Corp. (a) | 57,700 | 2,440,710 | |
Common Stocks - continued | |||
Shares | Value | ||
INFORMATION TECHNOLOGY - continued | |||
Software - continued | |||
Intuit, Inc. | 62,300 | $ 3,516,212 | |
Nuance Communications, Inc. (a) | 54,300 | 1,548,636 | |
| 22,472,209 | ||
TOTAL INFORMATION TECHNOLOGY | 57,855,506 | ||
MATERIALS - 12.3% | |||
Chemicals - 10.0% | |||
CF Industries Holdings, Inc. | 40,200 | 7,130,676 | |
CVR Partners LP | 147,000 | 4,420,290 | |
Monsanto Co. | 36,000 | 2,953,800 | |
Potash Corp. of Saskatchewan, Inc. | 122,000 | 5,715,841 | |
Rentech Nitrogen Partners LP | 71,800 | 1,642,066 | |
The Mosaic Co. | 99,000 | 5,541,030 | |
| 27,403,703 | ||
Metals & Mining - 2.3% | |||
First Quantum Minerals Ltd. | 91,600 | 2,006,019 | |
Ivanhoe Mines Ltd. (a) | 80,000 | 1,290,052 | |
Walter Energy, Inc. | 42,800 | 2,958,764 | |
| 6,254,835 | ||
TOTAL MATERIALS | 33,658,538 | ||
TOTAL COMMON STOCKS (Cost $257,242,067) |
| ||
Money Market Funds - 13.2% | |||
Shares | Value | ||
Fidelity Cash Central Fund, 0.12% (b) | 9,582,886 | $ 9,582,886 | |
Fidelity Securities Lending Cash Central Fund, 0.12% (b)(c) | 26,509,425 | 26,509,425 | |
TOTAL MONEY MARKET FUNDS (Cost $36,092,311) |
| ||
TOTAL INVESTMENT PORTFOLIO - 109.6% (Cost $293,334,378) | 299,849,634 | ||
NET OTHER ASSETS (LIABILITIES) - (9.6)% | (26,344,418) | ||
NET ASSETS - 100% | $ 273,505,216 | ||
Legend |
(a) Non-income producing |
(b) Affiliated fund that is available only to investment companies and other accounts managed by Fidelity Investments. The rate quoted is the annualized seven-day yield of the fund at period end. A complete unaudited listing of the fund's holdings as of its most recent quarter end is available upon request. In addition, each Fidelity Central Fund's financial statements, which are not covered by the Fund's Report of Independent Registered Public Accounting Firm, are available on the SEC's website or upon request. |
(c) Investment made with cash collateral received from securities on loan. |
(d) Security or a portion of the security is on loan at period end. |
Affiliated Central Funds |
Information regarding fiscal year to date income earned by the Fund from investments in Fidelity Central Funds is as follows: |
Fund | Income earned |
Fidelity Cash Central Fund | $ 5,926 |
Fidelity Securities Lending Cash Central Fund | 63,571 |
Total | $ 69,497 |
Other Information |
All investments are categorized as Level 1 under the Fair Value Hierarchy. The inputs or methodology used for valuing securities may not be an indication of the risk associated with investing in those securities. For more information on valuation inputs, please refer to the Security Valuation section in the accompanying Notes to Financial Statements. |
Distribution of investments by country of issue, as a percentage of total net assets, is as follows: (Unaudited) |
United States of America | 85.7% |
Canada | 3.8% |
Netherlands | 3.3% |
Ireland | 2.7% |
United Kingdom | 1.3% |
Israel | 1.0% |
Luxembourg | 1.0% |
Others (Individually Less Than 1%) | 1.2% |
| 100.0% |
See accompanying notes which are an integral part of the financial statements.
Annual Report
Financial Statements
Statement of Assets and Liabilities
| January 31, 2012 | |
Assets | ||
Investment in securities, at value (including securities loaned of $25,637,049) - See accompanying schedule: Unaffiliated issuers (cost $257,242,067) | $ 263,757,323 |
|
Fidelity Central Funds (cost $36,092,311) | 36,092,311 |
|
Total Investments (cost $293,334,378) |
| $ 299,849,634 |
Cash |
| 14,594 |
Receivable for investments sold | 812,984 | |
Receivable for fund shares sold | 641,814 | |
Dividends receivable | 52,005 | |
Distributions receivable from Fidelity Central Funds | 13,374 | |
Prepaid expenses | 769 | |
Other receivables | 10,957 | |
Total assets | 301,396,131 | |
|
|
|
Liabilities | ||
Payable for investments purchased | $ 807,378 | |
Payable for fund shares redeemed | 361,905 | |
Accrued management fee | 83,493 | |
Distribution and service plan fees payable | 8,006 | |
Other affiliated payables | 72,265 | |
Other payables and accrued expenses | 48,443 | |
Collateral on securities loaned, at value | 26,509,425 | |
Total liabilities | 27,890,915 | |
|
|
|
Net Assets | $ 273,505,216 | |
Net Assets consist of: |
| |
Paid in capital | $ 288,221,632 | |
Accumulated net investment loss | (175,072) | |
Accumulated undistributed net realized gain (loss) on investments and foreign currency transactions | (21,056,187) | |
Net unrealized appreciation (depreciation) on investments and assets and liabilities in foreign currencies | 6,514,843 | |
Net Assets | $ 273,505,216 | |
See accompanying notes which are an integral part of the financial statements.
Annual Report
Financial Statements - continued
Statement of Assets and Liabilities - continued
| January 31, 2012 | |
Calculation of Maximum Offering Price Class A: | $ 12.27 | |
|
|
|
Maximum offering price per share (100/94.25 of $12.27) | $ 13.02 | |
Class T: | $ 12.14 | |
|
|
|
Maximum offering price per share (100/96.50 of $12.14) | $ 12.58 | |
Class B: | $ 11.91 | |
|
|
|
Class C: | $ 11.91 | |
|
|
|
|
|
|
Mid Cap Growth: | $ 12.40 | |
|
|
|
Institutional Class: | $ 12.43 | |
A Redemption price per share is equal to net asset value less any applicable contingent deferred sales charge.
See accompanying notes which are an integral part of the financial statements.
Annual Report
Statement of Operations
| Year ended January 31, 2012 | |
Investment Income |
|
|
Dividends |
| $ 1,698,443 |
Income from Fidelity Central Funds |
| 69,497 |
Total income |
| 1,767,940 |
|
|
|
Expenses | ||
Management fee | $ 1,652,976 | |
Performance adjustment | (464,170) | |
Transfer agent fees | 852,587 | |
Distribution and service plan fees | 99,382 | |
Accounting and security lending fees | 117,602 | |
Custodian fees and expenses | 26,283 | |
Independent trustees' compensation | 1,733 | |
Registration fees | 68,351 | |
Audit | 68,420 | |
Legal | 1,003 | |
Miscellaneous | 2,622 | |
Total expenses before reductions | 2,426,789 | |
Expense reductions | (42,474) | 2,384,315 |
Net investment income (loss) | (616,375) | |
Realized and Unrealized Gain (Loss) Net realized gain (loss) on: | ||
Investment securities: |
|
|
Unaffiliated issuers | 26,763,675 | |
Foreign currency transactions | 26,304 | |
Total net realized gain (loss) |
| 26,789,979 |
Change in net unrealized appreciation (depreciation) on: Investment securities | (34,576,049) | |
Assets and liabilities in foreign currencies | 121 | |
Total change in net unrealized appreciation (depreciation) |
| (34,575,928) |
Net gain (loss) | (7,785,949) | |
Net increase (decrease) in net assets resulting from operations | $ (8,402,324) | |
See accompanying notes which are an integral part of the financial statements.
Annual Report
Financial Statements - continued
Statement of Changes in Net Assets
| Year ended | Year ended |
Increase (Decrease) in Net Assets |
|
|
Operations |
|
|
Net investment income (loss) | $ (616,375) | $ (751,163) |
Net realized gain (loss) | 26,789,979 | 49,618,736 |
Change in net unrealized appreciation (depreciation) | (34,575,928) | 25,698,331 |
Net increase (decrease) in net assets resulting | (8,402,324) | 74,565,904 |
Distributions to shareholders from net realized gain | - | (88,063) |
Share transactions - net increase (decrease) | (44,807,582) | 29,630,097 |
Redemption fees | 17,787 | 11,919 |
Total increase (decrease) in net assets | (53,192,119) | 104,119,857 |
|
|
|
Net Assets | ||
Beginning of period | 326,697,335 | 222,577,478 |
End of period (including accumulated net investment loss of $175,072 and accumulated net investment loss of $0, respectively) | $ 273,505,216 | $ 326,697,335 |
See accompanying notes which are an integral part of the financial statements.
Annual Report
Financial Highlights - Class A
Years ended January 31, | 2012 | 2011 | 2010 | 2009 | 2008 H |
Selected Per-Share Data |
|
|
|
|
|
Net asset value, beginning of period | $ 12.53 | $ 9.38 | $ 6.38 | $ 12.19 | $ 14.33 |
Income from Investment | |||||
Net investment income (loss)E | (.05) | (.06) | (.03) | .03 | (.05) |
Net realized and unrealized gain (loss) | (.21) | 3.21 | 3.03 | (5.79) | (1.30) |
Total from investment operations | (.26) | 3.15 | 3.00 | (5.76) | (1.35) |
Distributions from net investment income | - | - | - | (.05) | - |
Distributions from net realized gain | - | - | - | - | (.79) |
Total distributions | - | - | - | (.05) | (.79) |
Redemption fees added to paid in capital E,J | - | - | - | - | - |
Net asset value, end of period | $ 12.27 | $ 12.53 | $ 9.38 | $ 6.38 | $ 12.19 |
Total ReturnB,C,D | (2.08)% | 33.58% | 47.02% | (47.25)% | (9.95)% |
Ratios to Average Net AssetsF,I |
|
|
|
|
|
Expenses before reductions | 1.04% | 1.04% | .95% | .95% | 1.10% A |
Expenses net of fee waivers, if any | 1.04% | 1.04% | .95% | .95% | 1.10% A |
Expenses net of all reductions | 1.03% | 1.03% | .93% | .94% | 1.10% A |
Net investment income (loss) | (.43)% | (.52)% | (.30)% | .29% | (.41)% A |
Supplemental Data |
|
|
|
|
|
Net assets, end of period (000 omitted) | $ 10,062 | $ 10,751 | $ 6,095 | $ 1,623 | $ 1,936 |
Portfolio turnover rate G | 160% | 143% | 249% | 220% | 245% |
A Annualized
B Total returns for periods of less than one year are not annualized.
C Total returns would have been lower if certain expenses had not been reduced during the applicable periods shown.
D Total returns do not include the effect of the sales charges.
E Calculated based on average shares outstanding during the period.
F Fees and expenses of any underlying Fidelity Central Funds are not included in the Fund's expense ratio. The Fund indirectly bears its proportionate share of the expenses of any underlying Fidelity Central Funds.
G Amount does not include the portfolio activity of any underlying Fidelity Central Funds.
H For the period February 13, 2007 (commencement of sale of shares) to January 31, 2008.
I Expense ratios reflect operating expenses of the class. Expenses before reductions do not reflect amounts reimbursed by the investment adviser or reductions from brokerage service arrangements or reductions from other expense offset arrangements and do not represent the amount paid by the class during periods when reimbursements or reductions occur. Expense ratios before reductions for start-up periods may not be representative of longer-term operating periods. Expenses net of fee waivers reflect expenses after reimbursement by the investment adviser but prior to reductions from brokerage service arrangements or other expense offset arrangements. Expenses net of all reductions represent the net expenses paid by the class.
J Amount represents less than $.01 per share.
See accompanying notes which are an integral part of the financial statements.
Annual Report
Financial Highlights - Class T
Years ended January 31, | 2012 | 2011 | 2010 | 2009 | 2008 I |
Selected Per-Share Data |
|
|
|
|
|
Net asset value, beginning of period | $ 12.43 | $ 9.33 | $ 6.37 | $ 12.14 | $ 14.33 |
Income from Investment | |||||
Net investment income (loss) E | (.09) | (.09) | (.05) | - K | (.09) |
Net realized and unrealized gain (loss) | (.20) | 3.19 | 3.01 | (5.75) | (1.31) |
Total from investment operations | (.29) | 3.10 | 2.96 | (5.75) | (1.40) |
Distributions from net investment income | - | - | - | (.02) | - |
Distributions from net realized gain | - | - | - | - | (.79) |
Total distributions | - | - | - | (.02) | (.79) |
Redemption fees added to paid in capital E,K | - | - | - | - | - |
Net asset value, end of period | $ 12.14 | $ 12.43 | $ 9.33 | $ 6.37 | $ 12.14 |
Total Return B,C,D | (2.33)% | 33.23% | 46.47% | (47.37)% | (10.30)% |
Ratios to Average Net Assets F,J |
|
|
|
|
|
Expenses before reductions | 1.34% | 1.34% | 1.26% | 1.23% | 1.36% A |
Expenses net of fee waivers, if any | 1.34% | 1.34% | 1.26% | 1.23% | 1.36% A |
Expenses net of all reductions | 1.33% | 1.33% | 1.23% | 1.22% | 1.36% A |
Net investment income (loss) | (.73)% | (.81)% | (.61)% | .00% H | (.68)% A |
Supplemental Data |
|
|
|
|
|
Net assets, end of period (000 omitted) | $ 4,026 | $ 3,205 | $ 2,100 | $ 790 | $ 591 |
Portfolio turnover rate G | 160% | 143% | 249% | 220% | 245% |
A Annualized
B Total returns for periods of less than one year are not annualized.
C Total returns would have been lower if certain expenses had not been reduced during the applicable periods shown.
D Total returns do not include the effect of the sales charges.
E Calculated based on average shares outstanding during the period.
F Fees and expenses of any underlying Fidelity Central Funds are not included in the Fund's expense ratio. The Fund indirectly bears its proportionate share of the expenses of any underlying Fidelity Central Funds.
G Amount does not include the portfolio activity of any underlying Fidelity Central Funds.
H Amount represents less than .01%.
I For the period February 13, 2007 (commencement of sale of shares) to January 31, 2008.
J Expense ratios reflect operating expenses of the class. Expenses before reductions do not reflect amounts reimbursed by the investment adviser or reductions from brokerage service arrangements or reductions from other expense offset arrangements and do not represent the amount paid by the class during periods when reimbursements or reductions occur. Expense ratios before reductions for start-up periods may not be representative of longer-term operating periods. Expenses net of fee waivers reflect expenses after reimbursement by the investment adviser but prior to reductions from brokerage service arrangements or other expense offset arrangements. Expenses net of all reductions represent the net expenses paid by the class.
K Amount represents less than $.01 per share.
See accompanying notes which are an integral part of the financial statements.
Annual Report
Financial Highlights - Class B
Years ended January 31, | 2012 | 2011 | 2010 | 2009 | 2008 H |
Selected Per-Share Data |
|
|
|
|
|
Net asset value, beginning of period | $ 12.25 | $ 9.23 | $ 6.33 | $ 12.09 | $ 14.33 |
Income from Investment | |||||
Net investment income (loss) E | (.14) | (.13) | (.09) | (.05) | (.16) |
Net realized and unrealized gain (loss) | (.20) | 3.15 | 2.99 | (5.71) | (1.29) |
Total from investment operations | (.34) | 3.02 | 2.90 | (5.76) | (1.45) |
Distributions from net realized gain | - | - | - | - | (.79) |
Redemption fees added to paid in capital E,J | - | - | - | - | - |
Net asset value, end of period | $ 11.91 | $ 12.25 | $ 9.23 | $ 6.33 | $ 12.09 |
Total Return B,C,D | (2.78)% | 32.72% | 45.81% | (47.64)% | (10.65)% |
Ratios to Average Net Assets F,I |
|
|
|
|
|
Expenses before reductions | 1.80% | 1.80% | 1.70% | 1.70% | 1.85% A |
Expenses net of fee waivers, if any | 1.80% | 1.80% | 1.70% | 1.70% | 1.85% A |
Expenses net of all reductions | 1.78% | 1.79% | 1.67% | 1.69% | 1.85% A |
Net investment income (loss) | (1.19)% | (1.27)% | (1.05)% | (.46)% | (1.16)% A |
Supplemental Data |
|
|
|
|
|
Net assets, end of period (000 omitted) | $ 673 | $ 812 | $ 1,059 | $ 245 | $ 414 |
Portfolio turnover rate G | 160% | 143% | 249% | 220% | 245% |
A Annualized
B Total returns for periods of less than one year are not annualized.
C Total returns would have been lower if certain expenses had not been reduced during the applicable periods shown.
D Total returns do not include the effect of the contingent deferred sales charge.
E Calculated based on average shares outstanding during the period.
F Fees and expenses of any underlying Fidelity Central Funds are not included in the Fund's expense ratio. The Fund indirectly bears its proportionate share of the expenses of any underlying Fidelity Central Funds.
G Amount does not include the portfolio activity of any underlying Fidelity Central Funds.
H For the period February 13, 2007 (commencement of sale of shares) to January 31, 2008.
I Expense ratios reflect operating expenses of the class. Expenses before reductions do not reflect amounts reimbursed by the investment adviser or reductions from brokerage service arrangements or reductions from other expense offset arrangements and do not represent the amount paid by the class during periods when reimbursements or reductions occur. Expense ratios before reductions for start-up periods may not be representative of longer-term operating periods. Expenses net of fee waivers reflect expenses after reimbursement by the investment adviser but prior to reductions from brokerage service arrangements or other expense offset arrangements. Expenses net of all reductions represent the net expenses paid by the class.
J Amount represents less than $.01 per share.
See accompanying notes which are an integral part of the financial statements.
Annual Report
Financial Highlights - Class C
Years ended January 31, | 2012 | 2011 | 2010 | 2009 | 2008 H |
Selected Per-Share Data |
|
|
|
|
|
Net asset value, beginning of period | $ 12.25 | $ 9.24 | $ 6.33 | $ 12.09 | $ 14.33 |
Income from Investment Operations |
|
|
|
|
|
Net investment income (loss)E | (.14) | (.13) | (.09) | (.04) | (.15) |
Net realized and unrealized gain (loss) | (.20) | 3.14 | 3.00 | (5.72) | (1.30) |
Total from investment operations | (.34) | 3.01 | 2.91 | (5.76) | (1.45) |
Distributions from net realized gain | - | - | - | - | (.79) |
Redemption fees added to paid in capital E,J | - | - | - | - | - |
Net asset value, end of period | $ 11.91 | $ 12.25 | $ 9.24 | $ 6.33 | $ 12.09 |
Total Return B,C,D | (2.78)% | 32.58% | 45.97% | (47.64)% | (10.65)% |
Ratios to Average Net Assets F,I |
|
|
|
|
|
Expenses before reductions | 1.80% | 1.79% | 1.70% | 1.69% | 1.85% A |
Expenses net of fee waivers, if any | 1.80% | 1.79% | 1.70% | 1.69% | 1.85% A |
Expenses net of all reductions | 1.79% | 1.78% | 1.68% | 1.68% | 1.85% A |
Net investment income (loss) | (1.19)% | (1.26)% | (1.05)% | (.46)% | (1.16)% A |
Supplemental Data |
|
|
|
|
|
Net assets, end of period (000 omitted) | $ 4,905 | $ 4,852 | $ 2,029 | $ 699 | $ 697 |
Portfolio turnover rate G | 160% | 143% | 249% | 220% | 245% |
A Annualized
B Total returns for periods of less than one year are not annualized.
C Total returns would have been lower if certain expenses had not been reduced during the applicable periods shown.
D Total returns do not include the effect of the contingent deferred sales charge.
E Calculated based on average shares outstanding during the period.
F Fees and expenses of any underlying Fidelity Central Funds are not included in the Fund's expense ratio. The Fund indirectly bears its proportionate share of the expenses of any underlying Fidelity Central Funds.
G Amount does not include the portfolio activity of any underlying Fidelity Central Funds.
H For the period February 13, 2007 (commencement of sale of shares) to January 31, 2008.
I Expense ratios reflect operating expenses of the class. Expenses before reductions do not reflect amounts reimbursed by the investment adviser or reductions from brokerage service arrangements or reductions from other expense offset arrangements and do not represent the amount paid by the class during periods when reimbursements or reductions occur. Expense ratios before reductions for start-up periods may not be representative of longer-term operating periods. Expenses net of fee waivers reflect expenses after reimbursement by the investment adviser but prior to reductions from brokerage service arrangements or other expense offset arrangements. Expenses net of all reductions represent the net expenses paid by the class.
J Amount represents less than $.01 per share.
See accompanying notes which are an integral part of the financial statements.
Annual Report
Financial Highlights - Mid Cap Growth
Years ended January 31, | 2012 | 2011 | 2010 | 2009 | 2008 |
Selected Per-Share Data |
|
|
|
|
|
Net asset value, beginning of period | $ 12.63 | $ 9.43 | $ 6.40 | $ 12.21 | $ 14.31 |
Income from Investment | |||||
Net investment income (loss) B | (.02) | (.03) | - F | .06 | (.02) |
Net realized and unrealized gain (loss) | (.21) | 3.23 | 3.03 | (5.81) | (1.29) |
Total from investment operations | (.23) | 3.20 | 3.03 | (5.75) | (1.31) |
Distributions from net investment income | - | - | - | (.06) | - |
Distributions from net realized gain | - | - F | - F | - | (.79) |
Total distributions | - | - F | - F | (.06) | (.79) |
Redemption fees added to paid in capital B,F | - | - | - | - | - |
Net asset value, end of period | $ 12.40 | $ 12.63 | $ 9.43 | $ 6.40 | $ 12.21 |
Total Return A | (1.82)% | 33.99% | 47.37% | (47.09)% | (9.68)% |
Ratios to Average Net Assets C,E | |||||
Expenses before reductions | .79% | .79% | .70% | .69% | .83% |
Expenses net of fee waivers, if any | .79% | .79% | .70% | .68% | .81% |
Expenses net of all reductions | .77% | .78% | .67% | .67% | .81% |
Net investment income (loss) | (.17)% | (.26)% | (.05)% | .55% | (.12)% |
Supplemental Data |
|
|
|
|
|
Net assets, end of period (000 omitted) | $ 252,124 | $ 306,238 | $ 211,006 | $ 137,633 | $ 301,225 |
Portfolio turnover rate D | 160% | 143% | 249% | 220% | 245% |
A Total returns would have been lower if certain expenses had not been reduced during the applicable periods shown.
B Calculated based on average shares outstanding during the period.
C Fees and expenses of any underlying Fidelity Central Funds are not included in the Fund's expense ratio. The Fund indirectly bears its proportionate share of the expenses of any underlying Fidelity Central Funds.
D Amount does not include the portfolio activity of any underlying Fidelity Central Funds.
E Expense ratios reflect operating expenses of the class. Expenses before reductions do not reflect amounts reimbursed by the investment adviser or reductions from brokerage service arrangements or reductions from other expense offset arrangements and do not represent the amount paid by the class during periods when reimbursements or reductions occur. Expenses net of fee waivers reflect expenses after reimbursement by the investment adviser but prior to reductions from brokerage service arrangements or other expense offset arrangements. Expenses net of all reductions represent the net expenses paid by the class.
F Amount represents less than $.01 per share.
See accompanying notes which are an integral part of the financial statements.
Annual Report
Financial Highlights - Institutional Class
Years ended January 31, | 2012 | 2011 | 2010 | 2009 | 2008 G |
Selected Per-Share Data |
|
|
|
|
|
Net asset value, beginning of period | $ 12.64 | $ 9.43 | $ 6.40 | $ 12.22 | $ 14.33 |
Income from Investment Operations |
|
|
|
|
|
Net investment income (loss) D | (.01) | (.02) | - I | .07 | - I |
Net realized and unrealized gain (loss) | (.20) | 3.24 | 3.04 | (5.82) | (1.32) |
Total from investment operations | (.21) | 3.22 | 3.04 | (5.75) | (1.32) |
Distributions from net investment income | - | - | - | (.07) | - |
Distributions from net realized gain | - | (.01) | (.01) | - | (.79) |
Total distributions | - | (.01) | (.01) | (.07) | (.79) |
Redemption fees added to paid in capital D,I | - | - | - | - | - |
Net asset value, end of period | $ 12.43 | $ 12.64 | $ 9.43 | $ 6.40 | $ 12.22 |
Total Return B,C | (1.66)% | 34.10% | 47.54% | (47.09)% | (9.74)% |
Ratios to Average Net Assets E,H |
|
|
|
|
|
Expenses before reductions | .68% | .70% | .61% | .59% | .72% A |
Expenses net of fee waivers, if any | .68% | .70% | .61% | .59% | .72% A |
Expenses net of all reductions | .67% | .69% | .59% | .59% | .72% A |
Net investment income (loss) | (.07)% | (.18)% | .03% | .64% | (.03)% A |
Supplemental Data |
|
|
|
|
|
Net assets, end of period (000 omitted) | $ 1,714 | $ 839 | $ 288 | $ 109 | $ 182 |
Portfolio turnover rate F | 160% | 143% | 249% | 220% | 245% |
A Annualized
B Total returns for periods of less than one year are not annualized.
C Total returns would have been lower if certain expenses had not been reduced during the applicable periods shown.
D Calculated based on average shares outstanding during the period.
E Fees and expenses of any underlying Fidelity Central Funds are not included in the Fund's expense ratio. The Fund indirectly bears its proportionate share of the expenses of any underlying Fidelity Central Funds.
F Amount does not include the portfolio activity of any underlying Fidelity Central Funds.
G For the period February 13, 2007 (commencement of sale of shares) to January 31, 2008.
H Expense ratios reflect operating expenses of the class. Expenses before reductions do not reflect amounts reimbursed by the investment adviser or reductions from brokerage service arrangements or reductions from other expense offset arrangements and do not represent the amount paid by the class during periods when reimbursements or reductions occur. Expense ratios before reductions for start-up periods may not be representative of longer-term operating periods. Expenses net of fee waivers reflect expenses after reimbursement by the investment adviser but prior to reductions from brokerage service arrangements or other expense offset arrangements. Expenses net of all reductions represent the net expenses paid by the class.
I Amount represents less than $.01 per share.
See accompanying notes which are an integral part of the financial statements.
Annual Report
Notes to Financial Statements
For the period ended January 31, 2012
1. Organization.
Fidelity Mid Cap Growth Fund (the Fund) is a fund of Fidelity Devonshire Trust (the Trust) and is authorized to issue an unlimited number of shares. The Trust is registered under the Investment Company Act of 1940, as amended (the 1940 Act), as an open-end management investment company organized as a Massachusetts business trust. The Fund offers Class A, Class T, Class C, Mid Cap Growth, and Institutional Class shares, each of which, along with Class B shares, has equal rights as to assets and voting privileges. Effective after the close of business on September 1, 2010, Class B shares were closed to new accounts and additional purchases, except for exchanges and reinvestments. Each class has exclusive voting rights with respect to matters that affect that class. Class B shares will automatically convert to Class A shares after a holding period of seven years from the initial date of purchase. Investment income, realized and unrealized capital gains and losses, the common expenses of the Fund, and certain fund-level expense reductions, if any, are allocated on a pro-rata basis to each class based on the relative net assets of each class to the total net assets of the Fund. Each class differs with respect to transfer agent and distribution and service plan fees incurred. Certain expense reductions may also differ by class.
2. Investments in Fidelity Central Funds.
The Fund invests in Fidelity Central Funds, which are open-end investment companies available only to other investment companies and accounts managed by Fidelity Management & Research Company (FMR) and its affiliates. The Fund's Schedule of Investments lists each of the Fidelity Central Funds held as of period end, if any, as an investment of the Fund, but does not include the underlying holdings of each Fidelity Central Fund. As an Investing Fund, the Fund indirectly bears its proportionate share of the expenses of the underlying Fidelity Central Funds.
The Money Market Central Funds seek preservation of capital and current income and are managed by Fidelity Investments Money Management, Inc. (FIMM), an affiliate of FMR.
A complete unaudited list of holdings for each Fidelity Central Fund is available upon request or at the Securities and Exchange Commission (the SEC) web site at www.sec.gov. In addition, the financial statements of the Fidelity Central Funds, which are not covered by the Fund's Report of Independent Registered Public Accounting Firm, are available on the SEC web site or upon request.
3. Significant Accounting Policies.
The financial statements have been prepared in conformity with accounting principles generally accepted in the United States of America (GAAP), which require management to make certain estimates and assumptions at the date of the financial statements. Actual results could differ from those estimates. Subsequent events, if any, through the
Annual Report
Notes to Financial Statements - continued
3. Significant Accounting Policies - continued
date that the financial statements were issued have been evaluated in the preparation of the financial statements. The following summarizes the significant accounting policies of the Fund:
Security Valuation. Investments are valued as of 4:00 p.m. Eastern time on the last calendar day of the period. The Fund uses independent pricing services approved by the Board of Trustees to value its investments. When current market prices or quotations are not readily available or reliable, valuations may be determined in good faith in accordance with procedures adopted by the Board of Trustees. Factors used in determining value may include market or security specific events. The frequency with which these procedures are used cannot be predicted and they may be utilized to a significant extent. The value used for net asset value (NAV) calculation under these procedures may differ from published prices for the same securities.
The Fund categorizes the inputs to valuation techniques used to value its investments into a disclosure hierarchy consisting of three levels as shown below:
Level 1 - quoted prices in active markets for identical investments
Level 2 - other significant observable inputs (including quoted prices for similar investments, interest rates, prepayment speeds, etc.)
Level 3 - unobservable inputs (including the Fund's own assumptions based on the best information available)
Changes in valuation techniques may result in transfers in or out of an assigned level within the disclosure hierarchy. Valuation techniques used to value the Fund's investments by major category are as follows:
Equity securities, including restricted securities, for which market quotations are readily available, are valued at the last reported sale price or official closing price as reported by an independent pricing service on the primary market or exchange on which they are traded and are categorized as Level 1 in the hierarchy. In the event there were no sales during the day or closing prices are not available, securities are valued at the last quoted bid price or may be valued using the last available price and are generally categorized as Level 2 in the hierarchy. For foreign equity securities, when significant market or security specific events arise, comparisons to the valuation of American Depositary Receipts (ADRs), futures contracts, Exchange-traded funds (ETFs) and certain indexes as well as quoted prices for similar securities are used and are categorized as Level 2 in the hierarchy in these circumstances. Utilizing these techniques may result in transfers between Level 1 and Level 2. For restricted equity securities and private placements where observable inputs are limited, assumptions about market activity and risk are used and are categorized as Level 3 in the hierarchy.
Annual Report
3. Significant Accounting Policies - continued
Security Valuation - continued
Investments in open-end mutual funds, including the Fidelity Central Funds, are valued at their closing net asset value each business day and are categorized as Level 1 in the hierarchy.
New Accounting Pronouncements. In May 2011, the Financial Accounting Standards Board issued Accounting Standard Update No. 2011-04, Fair Value Measurement (Topic 820) - Amendments to Achieve Common Fair Value Measurement and Disclosure Requirements in U.S. GAAP and IFRSs. The update is effective during interim and annual periods beginning after December 15, 2011 and will result in additional disclosure for transfers between levels as well as expanded disclosure for securities categorized as Level 3 under the fair value hierarchy.
In December 2011, the Financial Accounting Standards Board issued Accounting Standard Update No. 2011-11, Disclosures about Offsetting Assets and Liabilities. The update creates new disclosure requirements requiring entities to disclose both gross and net information for derivatives and other financial instruments that are either offset in the Statement of Assets and Liabilities or subject to an enforceable master netting arrangement or similar agreement. The disclosure requirements are effective for interim and annual reporting periods beginning on or after January 1, 2013. Management is currently evaluating the impact of the update's adoption on the Fund's financial statement disclosures.
Foreign Currency. The Fund may use foreign currency contracts to facilitate transactions in foreign-denominated securities. Gains and losses from these transactions may arise from changes in the value of the foreign currency or if the counterparties do not perform under the contracts' terms.
Foreign-denominated assets, including investment securities, and liabilities are translated into U.S. dollars at the exchange rate at period end. Purchases and sales of investment securities, income and dividends received and expenses denominated in foreign currencies are translated into U.S. dollars at the exchange rate in effect on the transaction date.
The effects of exchange rate fluctuations on investments are included with the net realized and unrealized gain (loss) on investment securities. Other foreign currency transactions resulting in realized and unrealized gain (loss) are disclosed separately.
Investment Transactions and Income. For financial reporting purposes, the Fund's investment holdings and NAV include trades executed through the end of the last business day of the period. The NAV per share for processing shareholder transactions is calculated as of the close of business of the New York Stock Exchange (NYSE), normally 4:00 p.m. Eastern time and includes trades executed through the end of the prior
Annual Report
Notes to Financial Statements - continued
3. Significant Accounting Policies - continued
Investment Transactions and Income - continued
business day. Gains and losses on securities sold are determined on the basis of identified cost and may include proceeds received from litigation. Dividend income is recorded on the ex-dividend date, except for certain dividends from foreign securities where the ex-dividend date may have passed, which are recorded as soon as the Fund is informed of the ex-dividend date. Non-cash dividends included in dividend income, if any, are recorded at the fair market value of the securities received. Distributions received on securities that represent a return of capital or capital gain are recorded as a reduction of cost of investments and/or as a realized gain. The Fund estimates the components of distributions received that may be considered return of capital distributions or capital gain distributions. Interest income and distributions from the Fidelity Central Funds are accrued as earned. Interest income includes coupon interest and amortization of premium and accretion of discount on debt securities. Investment income is recorded net of foreign taxes withheld where recovery of such taxes is uncertain.
Expenses. Expenses directly attributable to a fund are charged to that fund. Expenses attributable to more than one fund are allocated among the respective funds on the basis of relative net assets or other appropriate methods. Expense estimates are accrued in the period to which they relate and adjustments are made when actual amounts are known.
Income Tax Information and Distributions to Shareholders. Each year, the Fund intends to qualify as a regulated investment company, including distributing substantially all of its taxable income and realized gains under Subchapter M of the Internal Revenue Code. As a result, no provision for income taxes is required. As of January 31, 2012, the Fund did not have any unrecognized tax benefits in the financial statements; nor is the Fund aware of any tax positions for which it is reasonably possible that the total amounts of unrecognized tax benefits will significantly change in the next twelve months. The Fund files a U.S. federal tax return, in addition to state and local tax returns as required. A fund's tax returns are subject to examination by the Internal Revenue Service (IRS) for a period of three fiscal years. State and local tax returns may be subject to examination for an additional fiscal year depending on the jurisdiction. Foreign taxes are provided for based on the Fund's understanding of the tax rules and rates that exist in the foreign markets in which it invests.
Distributions are declared and recorded on the ex-dividend date. Income dividends and capital gain distributions are declared separately for each class. Income and capital gain distributions are determined in accordance with income tax regulations, which may differ from GAAP.
Annual Report
3. Significant Accounting Policies - continued
Income Tax Information and Distributions to Shareholders - continued
Capital accounts within the financial statements are adjusted for permanent book-tax differences. These adjustments have no impact on net assets or the results of operations. Temporary book-tax differences will reverse in a subsequent period.
Book-tax differences are primarily due to the short-term gain distributions from the Underlying Funds, foreign currency transactions, passive foreign investment companies (PFIC), partnerships, net operating losses, capital loss carryforwards and losses deferred due to wash sales and excise tax regulations.
The federal tax cost of investment securities and unrealized appreciation (depreciation) as of period end were as follows:
Gross unrealized appreciation | $ 30,768,647 |
Gross unrealized depreciation | (24,933,919) |
Net unrealized appreciation (depreciation) on securities and other investments | $ 5,834,728 |
|
|
Tax Cost | $ 294,014,906 |
The tax-based components of distributable earnings as of period end were as follows:
Capital loss carryforward | $ (19,613,163) |
Net unrealized appreciation (depreciation) | $ 5,834,315 |
Capital loss carryforwards are only available to offset future capital gains of the Fund to the extent provided by regulations and may be limited. Under the Regulated Investment Company Modernization Act of 2010 (the Act), the Fund is permitted to carry forward capital losses incurred in taxable years beginning after December 22, 2010 for an unlimited period and such capital losses are required to be used prior to any losses that expire. Capital loss carryforwards were as follows:
Fiscal year of expiration |
|
2018 | $ (19,613,163) |
The tax character of distributions paid was as follows:
| January 31, 2012 | January 31, 2011 |
Ordinary Income | $ - | $ 88,063 |
Short-Term Trading (Redemption) Fees. Shares held by investors in the Fund less than 30 days are subject to a redemption fee equal to .75% of the net asset value of shares redeemed. All redemption fees, which reduce the proceeds of the shareholder redemption, are retained by the Fund and accounted for as an addition to paid in capital.
Annual Report
Notes to Financial Statements - continued
4. Purchases and Sales of Investments.
Purchases and sales of securities, other than short-term securities, aggregated $471,825,166 and $512,877,562, respectively.
5. Fees and Other Transactions with Affiliates.
Management Fee. FMR and its affiliates provide the Fund with investment management related services for which the Fund pays a monthly management fee. The management fee is the sum of an individual fund fee rate that is based on an annual rate of .30% of the Fund's average net assets and an annualized group fee rate that averaged .26% during the period. The group fee rate is based upon the average net assets of all the mutual funds advised by FMR. The group fee rate decreases as assets under management increase and increases as assets under management decrease. In addition, the management fee is subject to a performance adjustment (up to a maximum of ±.20% of the Fund's average net assets over a 36 month performance period). The upward or downward adjustment to the management fee is based on the relative investment performance of Mid Cap Growth as compared to an appropriate benchmark index. For the period, the total annual management fee rate, including the performance adjustment, was .40% of the Fund's average net assets.
Distribution and Service Plan Fees. In accordance with Rule 12b-1 of the 1940 Act, the Fund has adopted separate Distribution and Service Plans for each class of shares. Certain classes pay Fidelity Distributors Corporation (FDC), an affiliate of FMR, separate Distribution and Service Fees, each of which is based on an annual percentage of each class' average net assets. In addition, FDC may pay financial intermediaries for selling shares of the Fund and providing shareholder support services. For the period, the Distribution and Service Fee rates, total fees and amounts retained by FDC were as follows:
| Service | Distribution | Total Fees | Retained |
Class A | .25% | -% | $ 26,117 | $ 2,070 |
Class T | .25% | .25% | 17,252 | 1 |
Class B | .25% | .75% | 7,364 | 5,527 |
Class C | .25% | .75% | 48,649 | 17,243 |
|
|
| $ 99,382 | $ 24,841 |
Sales Load. FDC may receive a front-end sales charge of up to 5.75% for selling Class A shares and 3.50% for selling Class T shares, some of which is paid to financial intermediaries for selling shares of the Fund. Depending on the holding period, FDC may receive contingent deferred sales charges levied on Class A, Class T, Class B, and Class C redemptions. The deferred sales charges range from 5.00% to 1.00% for Class B, 1.00% for Class C, 1.00% for certain purchases of Class A shares and .25% for certain purchases of Class T shares.
Annual Report
5. Fees and Other Transactions with Affiliates - continued
Sales Load - continued
For the period, sales charge amounts retained by FDC were as follows:
| Retained |
Class A | $ 9,512 |
Class T | 3,598 |
Class B* | 1,445 |
Class C* | 2,334 |
| $ 16,889 |
* When Class B and Class C shares are initially sold, FDC pays commissions from its own resources to financial intermediaries through which the sales are made.
Transfer Agent Fees. Fidelity Investments Institutional Operations Company, Inc. (FIIOC), an affiliate of FMR, is the transfer, dividend disbursing and shareholder servicing agent for each class of the Fund. FIIOC receives account fees and asset-based fees that vary according to the account size and type of account of the shareholders of the respective classes of the Fund. FIIOC pays for typesetting, printing and mailing of shareholder reports, except proxy statements. For the period, transfer agent fees for each class were as follows:
| Amount | % of |
Class A | $ 30,715 | .29 |
Class T | 11,926 | .35 |
Class B | 2,202 | .30 |
Class C | 14,756 | .30 |
Mid Cap Growth | 791,113 | .29 |
Institutional Class | 1,875 | .18 |
| $ 852,587 |
|
Accounting and Security Lending Fees. Fidelity Service Company, Inc. (FSC), an affiliate of FMR, maintains the Fund's accounting records. The accounting fee is based on the level of average net assets for each month. Under a separate contract, FSC administers the security lending program. The security lending fee is based on the number and duration of lending transactions.
Brokerage Commissions. The Fund placed a portion of its portfolio transactions with brokerage firms which are affiliates of the investment adviser. The commissions paid to these affiliated firms were $9,007 for the period.
Annual Report
Notes to Financial Statements - continued
6. Committed Line of Credit.
The Fund participates with other funds managed by FMR or an affiliate in a $4.0 billion credit facility (the "line of credit") to be utilized for temporary or emergency purposes to fund shareholder redemptions or for other short-term liquidity purposes. The Fund has agreed to pay commitment fees on its pro-rata portion of the line of credit, which amounted to $892 and is reflected in Miscellaneous expenses on the Statement of Operations. During the period, there were no borrowings on this line of credit.
7. Security Lending.
The Fund lends portfolio securities through a lending agent from time to time in order to earn additional income. For equity securities, a lending agent is used and may loan securities to certain qualified borrowers, including Fidelity Capital Markets (FCM), a broker-dealer affiliated with the Fund. On the settlement date of the loan, the Fund receives collateral (in the form of U.S. Treasury obligations, letters of credit and/or cash) against the loaned securities and maintains collateral in an amount not less than 100% of the market value of the loaned securities during the period of the loan. The market value of the loaned securities is determined at the close of business of the Fund and any additional required collateral is delivered to the Fund on the next business day. If the borrower defaults on its obligation to return the securities loaned because of insolvency or other reasons, a fund could experience delays and costs in recovering the securities loaned or in gaining access to the collateral. Any cash collateral received is invested in the Fidelity Securities Lending Cash Central Fund. The value of loaned securities and cash collateral at period end are disclosed on the Fund's Statement of Assets and Liabilities. Security lending income represents the income earned on investing cash collateral, less rebates paid to borrowers and any lending agent fees associated with the loan, plus any premium payments received for lending certain types of securities. Security lending income is presented in the Statement of Operations as a component of income from Fidelity Central Funds. Total security lending income during the period amounted to $63,571. During the period, there were no securities loaned to FCM.
8. Expense Reductions.
Many of the brokers with whom FMR places trades on behalf of the Fund provided services to the Fund in addition to trade execution. These services included payments of certain expenses on behalf of the Fund totaling $42,474 for the period.
Annual Report
9. Distributions to Shareholders.
Distributions to shareholders of each class were as follows:
Years ended January 31, | 2012 | 2011 |
From net realized gain |
|
|
Mid Cap Growth | $ - | $ 87,897 |
Institutional Class | - | 166 |
Total | $ - | $ 88,063 |
10. Share Transactions.
Transactions for each class of shares were as follows:
| Shares | Dollars | ||
Years ended January 31, | 2012 | 2011 | 2012 | 2011 |
Class A |
|
|
|
|
Shares sold | 352,250 | 583,869 | $ 4,351,299 | $ 6,535,650 |
Shares redeemed | (390,419) | (375,849) | (4,756,474) | (3,922,105) |
Net increase (decrease) | (38,169) | 208,020 | $ (405,175) | $ 2,613,545 |
Class T |
|
|
|
|
Shares sold | 133,161 | 104,201 | $ 1,615,612 | $ 1,140,251 |
Shares redeemed | (59,316) | (71,459) | (707,985) | (756,606) |
Net increase (decrease) | 73,845 | 32,742 | $ 907,627 | $ 383,645 |
Class B |
|
|
|
|
Shares sold | 10,854 | 37,374 | $ 133,326 | $ 382,359 |
Shares redeemed | (20,668) | (85,747) | (249,828) | (903,867) |
Net increase (decrease) | (9,814) | (48,373) | $ (116,502) | $ (521,508) |
Class C |
|
|
|
|
Shares sold | 167,010 | 255,067 | $ 2,017,388 | $ 2,772,131 |
Shares redeemed | (151,149) | (78,775) | (1,741,389) | (836,250) |
Net increase (decrease) | 15,861 | 176,292 | $ 275,999 | $ 1,935,881 |
Mid Cap Growth |
|
|
|
|
Shares sold | 6,967,439 | 9,630,254 | $ 85,935,348 | $ 108,629,221 |
Reinvestment of distributions | - | 8,231 | - | 86,426 |
Shares redeemed | (10,887,596) | (7,764,226) | (132,262,341) | (83,888,689) |
Net increase (decrease) | (3,920,157) | 1,874,259 | $ (46,326,993) | $ 24,826,958 |
Institutional Class |
|
|
|
|
Shares sold | 100,295 | 66,364 | $ 1,204,093 | $ 728,116 |
Reinvestment of distributions | - | 13 | - | 141 |
Shares redeemed | (28,686) | (30,561) | (346,631) | (336,681) |
Net increase (decrease) | 71,609 | 35,816 | $ 857,462 | $ 391,576 |
Annual Report
Notes to Financial Statements - continued
11. Other.
The Fund's organizational documents provide former and current trustees and officers with a limited indemnification against liabilities arising in connection with the performance of their duties to the Fund. In the normal course of business, the Fund may also enter into contracts that provide general indemnifications. The Fund's maximum exposure under these arrangements is unknown as this would be dependent on future claims that may be made against the Fund. The risk of material loss from such claims is considered remote.
Annual Report
Report of Independent Registered Public Accounting Firm
To the Trustees of Fidelity Devonshire Trust and the Shareholders of Fidelity Mid Cap Growth Fund:
In our opinion, the accompanying statement of assets and liabilities, including the schedule of investments, and the related statements of operations and of changes in net assets and the financial highlights present fairly, in all material respects, the financial position of Fidelity Mid Cap Growth Fund (a fund of Fidelity Devonshire Trust) at January 31, 2012, the results of its operations for the year then ended, the changes in its net assets for each of the two years in the period then ended and the financial highlights for each of the periods indicated, in conformity with accounting principles generally accepted in the United States of America. These financial statements and financial highlights (hereafter referred to as "financial statements") are the responsibility of the Fidelity Mid Cap Growth Fund's management. Our responsibility is to express an opinion on these financial statements based on our audits. We conducted our audits of these financial statements in accordance with the standards of the Public Company Accounting Oversight Board (United States). Those standards require that we plan and perform the audit to obtain reasonable assurance about whether the financial statements are free of material misstatement. An audit includes examining, on a test basis, evidence supporting the amounts and disclosures in the financial statements, assessing the accounting principles used and significant estimates made by management, and evaluating the overall financial statement presentation. We believe that our audits, which included confirmation of securities at January 31, 2012 by correspondence with the custodian and brokers, provide a reasonable basis for our opinion.
/s/ PricewaterhouseCoopers LLP
PricewaterhouseCoopers LLP
Boston, Massachusetts
March 13, 2012
Annual Report
Trustees and Officers
The Trustees, Members of the Advisory Board, and executive officers of the trust and fund, as applicable, are listed below. The Board of Trustees governs the fund and is responsible for protecting the interests of shareholders. The Trustees are experienced executives who meet periodically throughout the year to oversee the fund's activities, review contractual arrangements with companies that provide services to the fund, oversee management of the risks associated with such activities and contractual arrangements, and review the fund's performance. Except for James C. Curvey, each of the Trustees oversees 226 funds advised by FMR or an affiliate. Mr. Curvey oversees 430 funds advised by FMR or an affiliate.
The Trustees hold office without limit in time except that (a) any Trustee may resign; (b) any Trustee may be removed by written instrument, signed by at least two-thirds of the number of Trustees prior to such removal; (c) any Trustee who requests to be retired or who has become incapacitated by illness or injury may be retired by written instrument signed by a majority of the other Trustees; and (d) any Trustee may be removed at any special meeting of shareholders by a two-thirds vote of the outstanding voting securities of the trust. Each Trustee who is not an interested person (as defined in the 1940 Act) (Independent Trustee), shall retire not later than the last day of the calendar year in which his or her 75th birthday occurs. The Independent Trustees may waive this mandatory retirement age policy with respect to individual Trustees. The executive officers and Advisory Board Members hold office without limit in time, except that any officer and Advisory Board Member may resign or may be removed by a vote of a majority of the Trustees at any regular meeting or any special meeting of the Trustees. Except as indicated, each individual has held the office shown or other offices in the same company for the past five years.
Experience, Skills, Attributes, and Qualifications of the Fund's Trustees. The Governance and Nominating Committee has adopted a statement of policy that describes the experience, qualifications, attributes, and skills that are necessary and desirable for potential Independent Trustee candidates (Statement of Policy). The Board believes that each Trustee satisfied at the time he or she was initially elected or appointed a Trustee, and continues to satisfy, the standards contemplated by the Statement of Policy. The Governance and Nominating Committee also engages professional search firms to help identify potential Independent Trustee candidates who have the experience, qualifications, attributes, and skills consistent with the Statement of Policy. From time to time, additional criteria based on the composition and skills of the current Independent Trustees, as well as experience or skills that may be appropriate in light of future changes to board composition, business conditions, and regulatory or other developments, have also been considered by the professional search firms and the Governance and Nominating Committee. In addition, the Board takes into account the Trustees' commitment and participation in Board and committee meetings, as well as their leadership of standing and ad hoc committees throughout their tenure.
In determining that a particular Trustee was and continues to be qualified to serve as a Trustee, the Board has considered a variety of criteria, none of which, in isolation, was controlling. The Board believes that, collectively, the Trustees have balanced and diverse experience, qualifications, attributes, and skills, which allow the Board to operate effectively in governing the fund and protecting the interests of shareholders. Information about the specific experience, skills, attributes, and qualifications of each Trustee, which in each case led to the Board's conclusion that the Trustee should serve (or continue to serve) as a trustee of the fund, is provided below.
Annual Report
Board Structure and Oversight Function. James C. Curvey is an interested person (as defined in the 1940 Act) and currently serves as Acting Chairman. The Trustees have determined that an interested Chairman is appropriate and benefits shareholders because an interested Chairman has a personal and professional stake in the quality and continuity of services provided to the fund. Independent Trustees exercise their informed business judgment to appoint an individual of their choosing to serve as Chairman, regardless of whether the Trustee happens to be independent or a member of management. The Independent Trustees have determined that they can act independently and effectively without having an Independent Trustee serve as Chairman and that a key structural component for assuring that they are in a position to do so is for the Independent Trustees to constitute a substantial majority for the Board. The Independent Trustees also regularly meet in executive session. Ned C. Lautenbach serves as Chairman of the Independent Trustees and as such (i) acts as a liaison between the Independent Trustees and management with respect to matters important to the Independent Trustees and (ii) with management prepares agendas for Board meetings.
Fidelity funds are overseen by different Boards of Trustees. The fund's Board oversees Fidelity's equity and high income funds and another Board oversees Fidelity's investment-grade bond, money market, and asset allocation funds. The asset allocation funds may invest in Fidelity funds overseen by the fund's Board. The use of separate Boards, each with its own committee structure, allows the Trustees of each group of Fidelity funds to focus on the unique issues of the funds they oversee, including common research, investment, and operational issues. On occasion, the separate Boards establish joint committees to address issues of overlapping consequences for the Fidelity funds overseen by each Board.
The Trustees operate using a system of committees to facilitate the timely and efficient consideration of all matters of importance to the Trustees, the fund, and fund shareholders and to facilitate compliance with legal and regulatory requirements and oversight of the fund's activities and associated risks. The Board, acting through its committees, has charged FMR and its affiliates with (i) identifying events or circumstances the occurrence of which could have demonstrably adverse effects on the fund's business and/or reputation; (ii) implementing processes and controls to lessen the possibility that such events or circumstances occur or to mitigate the effects of such events or circumstances if they do occur; and (iii) creating and maintaining a system designed to evaluate continuously business and market conditions in order to facilitate the identification and implementation processes described in (i) and (ii) above. Because the day-to-day operations and activities of the fund are carried out by or through FMR, its affiliates and other service providers, the fund's exposure to risks is mitigated but not eliminated by the processes overseen by the Trustees. While each of the Board's committees has responsibility for overseeing different aspects of the fund's activities, oversight is exercised primarily through the Operations, Audit, and Compliance Committees. In addition, the Independent Trustees have worked with FMR to enhance the Board's oversight of investment and financial risks, legal and regulatory risks, technology risks, and operational risks, including the development of additional risk reporting to the Board. For example, a working group comprised of Independent Trustees and FMR has worked and continues to work to review the Fidelity funds' valuation-related activities, reporting and risk management. Appropriate personnel, including but not limited to the fund's Chief Compliance Officer (CCO), FMR's internal auditor, the independent accountants, the fund's Treasurer and portfolio management personnel, make periodic reports to the Board's committees, as appropriate, including an annual review of FMR's risk management program for the Fidelity funds. The responsibilities of each standing committee, including their oversight responsibilities, are described further under "Standing Committees of the Fund's Trustees."
Annual Report
Trustees and Officers - continued
The fund's Statement of Additional Information (SAI) includes more information about the Trustees. To request a free copy, call Fidelity at 1-877-208-0098.
Interested Trustees*:
Correspondence intended for each Trustee who is an interested person may be sent to Fidelity Investments, 82 Devonshire Street, Boston, Massachusetts 02109.
Name, Age; Principal Occupations and Other Relevant Experience+ | |
James C. Curvey (76) | |
| Year of Election or Appointment: 2007 Mr. Curvey is Trustee and Acting Chairman of the Board of Trustees of certain Trusts. Mr. Curvey also serves as Trustee (2007-present) of other investment companies advised by FMR. Mr. Curvey is a Director of Fidelity Investments Money Management, Inc. (2009-present), Director of Fidelity Research & Analysis Co. (2009-present) and Director of FMR and FMR Co., Inc. (2007-present). Mr. Curvey is also Vice Chairman (2007-present) and Director of FMR LLC. In addition, Mr. Curvey serves as an Overseer for the Boston Symphony Orchestra and a member of the Trustees of Villanova University. Previously, Mr. Curvey was the Vice Chairman (2006-2007) and Director (2000-2007) of FMR Corp. |
Ronald P. O'Hanley (54) | |
| Year of Election or Appointment: 2011 Mr. O'Hanley is Director of FMR Co., Inc. (2010-present), Director of Fidelity Investments Money Management, Inc. (2010-present), Director of Fidelity Research & Analysis Company (2010-present), President of Fidelity Asset Management and Corporate Services and a member of Fidelity's Executive Committee (2010-present). Previously, Mr. O'Hanley served as President and Chief Executive Officer of BNY Mellon Asset Management (2007-2010). Mr. O'Hanley also served as Vice Chairman of Bank New York Mellon Corp. and a member of that firm's Executive Committee. Prior to the 2007 merger of The Bank of New York and Mellon Financial Corporation, he was Vice Chairman of Mellon Financial Corporation and President and Chief Executive Officer of Mellon Asset Management. He joined Mellon in February 1997. Mr. O'Hanley currently serves as Chairman of the Boston Public Library Foundation Board of Directors and sits on the Board of Directors of Beth Israel Deaconess Medical Center, the Board of Trustees of the Marine Biological Laboratory and the Advisory Board of the Maxwell School of Citizenship and Public Administration at Syracuse University. Mr. O'Hanley also chairs the Council on Asset Management for the Financial Services Roundtable and is a member of the Board of Directors of Institutional Investor's U.S. Institute. |
* Trustees have been determined to be "Interested Trustees" by virtue of, among other things, their affiliation with the trust or various entities under common control with FMR.
+ The information above includes each Trustee's principal occupation during the last five years and other information relating to the experience, attributes, and skills relevant to each Trustee's qualifications to serve as a Trustee, which led to the conclusion that each Trustee should serve as a Trustee for the fund.
Annual Report
Trustees and Officers - continued
Independent Trustees:
Correspondence intended for each Independent Trustee (that is, the Trustees other than the Interested Trustees) may be sent to Fidelity Investments, P.O. Box 55235, Boston, Massachusetts 02205-5235.
Name, Age; Principal Occupations and Other Relevant Experience+ | |
Dennis J. Dirks (63) | |
| Year of Election or Appointment: 2005 Prior to his retirement in May 2003, Mr. Dirks was Chief Operating Officer and a member of the Board of The Depository Trust & Clearing Corporation (DTCC). He also served as President, Chief Operating Officer, and Board member of The Depository Trust Company (DTC) and President and Board member of the National Securities Clearing Corporation (NSCC). In addition, Mr. Dirks served as Chief Executive Officer and Board member of the Government Securities Clearing Corporation, Chief Executive Officer and Board member of the Mortgage-Backed Securities Clearing Corporation, as a Trustee and a member of the Finance Committee of Manhattan College (2005-2008), and as a Trustee and a member of the Finance Committee of AHRC of Nassau County (2006-2008). Mr. Dirks is a member of the Independent Directors Council (IDC) Governing Council (2010-present) and Board of Directors for The Brookville Center for Children's Services, Inc. (2009-present). |
Alan J. Lacy (58) | |
| Year of Election or Appointment: 2008 Mr. Lacy serves as Senior Adviser (2007-present) of Oak Hill Capital Partners, L.P. (private equity). Mr. Lacy also served as Chief Executive Officer (2000-2005) and Vice Chairman (2005-2006) of Sears Holdings Corporation and Sears, Roebuck and Co. (retail). In addition, Mr. Lacy serves as a member of the Board of Directors of Dave & Buster's, Inc. (restaurant and entertainment complexes, 2010-present), The Hillman Companies, Inc. (hardware wholesalers, 2010-present), and Bristol-Myers Squibb Company (global pharmaceuticals, 2007-present). Mr. Lacy is a member of the Board of Trustees of The National Parks Conservation Association (2006-present). Previously, Mr. Lacy served as Chairman of the Board of Trustees of the National Parks Conservation Association (2008-2011) and as a member of the Board of Directors for the Western Union Company (global money transfer, 2006-2011). |
Ned C. Lautenbach (67) | |
| Year of Election or Appointment: 2000 Mr. Lautenbach is Chairman of the Independent Trustees of the Equity and High Income Funds (2006-present). Mr. Lautenbach currently serves as the Lead Director of the Eaton Corporation Board of Directors (diversified industrial, 1997-present). Mr. Lautenbach is also a member of the Board of Directors of the Philharmonic Center for the Arts in Naples, Florida (1999-present); a member of the Board of Trustees of Fairfield University (2005-present); and a member of the Council on Foreign Relations (1994-present). Previously, Mr. Lautenbach was a Partner/Advisory Partner at Clayton, Dubilier & Rice, LLC (private equity investment, 1998-2010), as well as a Director of Sony Corporation (2006-2007). |
Joseph Mauriello (67) | |
| Year of Election or Appointment: 2008 Prior to his retirement in January 2006, Mr. Mauriello served in numerous senior management positions including Deputy Chairman and Chief Operating Officer (2004-2005), and Vice Chairman of Financial Services (2002-2004) of KPMG LLP US (professional services, 1965-2005). Mr. Mauriello currently serves as a member of the Board of Directors of XL Group plc. (global insurance and re-insurance, 2006-present) and of Arcadia Resources Inc. (health care services and products, 2007-present). Previously, Mr. Mauriello served as a Director of the Hamilton Funds of the Bank of New York (2006-2007). |
Robert W. Selander (61) | |
| Year of Election or Appointment: 2011 Previously, Mr. Selander served as a Member of the Advisory Board of Fidelity's Equity and High Income Funds (2011), Executive Vice Chairman (2010), Chief Executive Officer (2009-2010), and President and Chief Executive Officer (1997-2009) of Mastercard, Inc. |
Cornelia M. Small (67) | |
| Year of Election or Appointment: 2005 Ms. Small is a member of the Board of Directors of the Teagle Foundation (2009-present). Ms. Small is also a member of the Investment Committee, and Chair (2008-present) and a member of the Board of Trustees of Smith College. In addition, Ms. Small serves on the Investment Committee of the Berkshire Taconic Community Foundation (2008-present). Previously, Ms. Small served as Chairperson of the Investment Committee (2002-2008) of Smith College. In addition, Ms. Small served as Chief Investment Officer, Director of Global Equity Investments, and a member of the Board of Directors of Scudder, Stevens & Clark and Scudder Kemper Investments. |
William S. Stavropoulos (72) | |
| Year of Election or Appointment: 2002 Mr. Stavropoulos is Vice Chairman of the Independent Trustees of the Equity and High Income Funds (2006-present). Mr. Stavropoulos serves as President and Founder of the Michigan Baseball Foundation, the Great Lakes Loons (2007-present). Mr. Stavropoulos is Chairman Emeritus of the Board of Directors of The Dow Chemical Company, where he previously served in numerous senior management positions, including President, CEO (1995-2000; 2002-2004), Chairman of the Executive Committee (2000-2006), and as a member of the Board of Directors (1990-2006). Currently, Mr. Stavropoulos is Chairman of Univar (global distributor of commodity and specialty chemicals, 2010-present), a Director of Teradata Corporation (data warehousing and technology solutions, 2008-present), Chemical Financial Corporation, Maersk Inc. (industrial conglomerate), Tyco International, Inc. (multinational manufacturing and services, 2007-present), and a member of the Advisory Board for Metalmark Capital (private equity investment, 2005-present). Mr. Stavropoulos is a special advisor to Clayton, Dubilier & Rice, LLC (private equity investment). In addition, Mr. Stavropoulos is a member of the University of Notre Dame Advisory Council for the College of Science. |
David M. Thomas (62) | |
| Year of Election or Appointment: 2008 Previously, Mr. Thomas served as Executive Chairman (2005-2006) and Chairman and Chief Executive Officer (2000-2005) of IMS Health, Inc. (pharmaceutical and healthcare information solutions). In addition, Mr. Thomas serves as a member of the Board of Directors of Fortune Brands, Inc. (consumer products), and Interpublic Group of Companies, Inc. (marketing communication, 2004-present). |
Michael E. Wiley (61) | |
| Year of Election or Appointment: 2008 Mr. Wiley also serves as a Director of Asia Pacific Exploration Consolidated (international oil and gas exploration and production, 2008-present). Mr. Wiley serves as a Director of Tesoro Corporation (independent oil refiner and marketer, 2005-present), and a Director of Bill Barrett Corporation (exploration and production, 2005-present). In addition, Mr. Wiley also serves as a Director of Post Oak Bank (privately-held bank, 2004-present). Previously, Mr. Wiley served as a member of the Board of Trustees of the University of Tulsa (2000-2006; 2007-2010), as a Senior Energy Advisor of Katzenbach Partners, LLC (consulting, 2006-2007), as an Advisory Director of Riverstone Holdings (private investment), Chairman, President, and CEO of Baker Hughes, Inc. (oilfield services, 2000-2004), and as Director of Spinnaker Exploration Company (exploration and production, 2001-2005). |
Annual Report
+ The information above includes each Trustee's principal occupation during the last five years and other information relating to the experience, attributes, and skills relevant to each Trustee's qualifications to serve as a Trustee, which led to the conclusion that each Trustee should serve as a Trustee for the fund.
Advisory Board Members and Executive Officers:
Correspondence intended for each executive officer may be sent to Fidelity Investments, 82 Devonshire Street, Boston, Massachusetts 02109.
Name, Age; Principal Occupation | |
Edward C. Johnson 3d (81) | |
| Year of Election or Appointment: 2011 Member of the Advisory Board of Fidelity's Equity and High Income Funds. Mr. Johnson serves as Chief Executive Officer, Chairman, and a Director of FMR LLC, and also serves as Chairman and Director of FIL Limited. Previously, Mr. Johnson served as a Trustee and Chairman of the Board of certain Fidelity Trusts, Chairman and a Director of FMR, Chairman and a Director of FMR Co., Inc., and President of FMR LLC (2006-2007). |
Peter S. Lynch (68) | |
| Year of Election or Appointment: 2003 Member of the Advisory Board of Fidelity's Equity and High Income Funds. Mr. Lynch is Vice Chairman and a Director of FMR and FMR Co., Inc. In addition, Mr. Lynch serves as a Trustee of Boston College and as the Chairman of the Inner-City Scholarship Fund. Previously, Mr. Lynch served on the Special Olympics International Board of Directors (1997-2006). |
Kenneth B. Robins (42) | |
| Year of Election or Appointment: 2008 President and Treasurer of Fidelity's Equity and High Income Funds. Mr. Robins also serves as President and Treasurer (2010-present) and Assistant Treasurer (2009-present) of other Fidelity funds and is an employee of Fidelity Investments (2004-present). Previously, Mr. Robins served as Deputy Treasurer of the Fidelity funds (2005-2008) and Treasurer and Chief Financial Officer of The North Carolina Capital Management Trust: Cash and Term Portfolios (2006-2008). |
Bruce T. Herring (46) | |
| Year of Election or Appointment: 2006 Vice President of certain Equity Funds. Mr. Herring also serves as President of Fidelity Research & Analysis Company (2010-present), Chief Investment Officer and Director of Fidelity Management & Research (U.K.) Inc. (2010-present) and Group Chief Investment Officer of FMR. Previously, Mr. Herring served as Vice President (2005-2006) and Senior Vice President (2006-2007) of Fidelity Management & Research Company, Vice President of FMR Co., Inc. (2001-2007) and as a portfolio manager for Fidelity U.S. Equity Funds. |
Brian B. Hogan (47) | |
| Year of Election or Appointment: 2009 Vice President of Equity and High Income Funds. Mr. Hogan also serves as President of FMR's Equity Division (2009-present). Previously, Mr. Hogan served as Senior Vice President, Equity Research of FMR (2006-2009) and as a portfolio manager. |
Scott C. Goebel (44) | |
| Year of Election or Appointment: 2008 Secretary and Chief Legal Officer (CLO) of the Fidelity funds. Mr. Goebel also serves as Secretary of Fidelity Investments Money Management, Inc. (FIMM) (2010-present) and Fidelity Research and Analysis Company (FRAC) (2010-present); Secretary and CLO of The North Carolina Capital Management Trust: Cash and Term Portfolios (2008-present); General Counsel, Secretary, and Senior Vice President of FMR (2008-present) and FMR Co., Inc. (2008-present); employed by FMR LLC or an affiliate (2001-present); Chief Legal Officer of Fidelity Management & Research (Hong Kong) Limited (2008-present) and Assistant Secretary of Fidelity Management & Research (Japan) Inc. (2008-present), and Fidelity Management & Research (U.K.) Inc. (2008-present). Previously, Mr. Goebel served as Assistant Secretary of FIMM (2008-2010), FRAC (2008-2010), and the Funds (2007-2008) and as Vice President and Secretary of Fidelity Distributors Corporation (FDC) (2005-2007). |
William C. Coffey (42) | |
| Year of Election or Appointment: 2009 Assistant Secretary of Fidelity's Equity and High Income Funds. Mr. Coffey also serves as Senior Vice President and Deputy General Counsel of FMR LLC (2010-present), and is an employee of Fidelity Investments. Previously, Mr. Coffey served as Vice President and Associate General Counsel of FMR LLC (2005-2009). |
Holly C. Laurent (57) | |
| Year of Election or Appointment: 2008 Anti-Money Laundering (AML) Officer of the Fidelity funds. Ms. Laurent also serves as AML Officer of The North Carolina Capital Management Trust: Cash and Term Portfolios (2008-present) and is an employee of Fidelity Investments. Previously, Ms. Laurent was Senior Vice President and Head of Legal for Fidelity Business Services India Pvt. Ltd. (2006-2008), and Senior Vice President, Deputy General Counsel and Group Head for FMR LLC (2005-2006). |
Christine Reynolds (53) | |
| Year of Election or Appointment: 2008 Chief Financial Officer of the Fidelity funds. Ms. Reynolds became President of Fidelity Pricing and Cash Management Services (FPCMS) in August 2008. Ms. Reynolds served as Chief Operating Officer of FPCMS (2007-2008). Previously, Ms. Reynolds served as President, Treasurer, and Anti-Money Laundering officer of the Fidelity funds (2004-2007). |
Kenneth A. Rathgeber (64) | |
| Year of Election or Appointment: 2004 Chief Compliance Officer of Fidelity's Equity and High Income Funds. Mr. Rathgeber is Chief Compliance Officer of Fidelity Management & Research (Hong Kong) Limited (2008-present), Fidelity Management & Research (Japan) Inc. (2008-present), FMR (2005-present), FMR Co., Inc. (2005-present), Fidelity Management & Research (U.K.) Inc. (2005-present), Fidelity Research & Analysis Company (2005-present), Fidelity Investments Money Management, Inc. (2005-present), Pyramis Global Advisors, LLC (2005-present), and Strategic Advisers, Inc. (2005-present). |
Joseph F. Zambello (54) | |
| Year of Election or Appointment: 2011 Deputy Treasurer of the Fidelity funds. Mr. Zambello is an employee of Fidelity Investments. Previously, Mr. Zambello served as Vice President of FMR's Program Management Group (2009-2011) and Vice President of the Transfer Agent Oversight Group (2005-2009). |
Adrien E. Deberghes (44) | |
| Year of Election or Appointment: 2008 Deputy Treasurer of Fidelity's Equity and High Income Funds. Mr. Deberghes also serves as Vice President and Assistant Treasurer of Fidelity Rutland Square Trust II and Fidelity Commonwealth Trust II (2011-present), Assistant Treasurer of other Fidelity funds (2010-present), and is an employee of Fidelity Investments (2008-present). Previously, Mr. Deberghes served as Senior Vice President of Mutual Fund Administration at State Street Corporation (2007-2008), Senior Director of Mutual Fund Administration at Investors Bank & Trust (2005-2007), and Director of Finance for Dunkin' Brands (2000-2005). |
Stephanie J. Dorsey (42) | |
| Year of Election or Appointment: 2010 Assistant Treasurer of Fidelity's Equity and High Income Funds. Ms. Dorsey also serves as Deputy Treasurer of other Fidelity funds (2008-present) and is an employee of Fidelity Investments (2008-present). Previously, Ms. Dorsey served as Treasurer (2004-2008) of the JPMorgan Mutual Funds and Vice President (2004-2008) of JPMorgan Chase Bank. |
John R. Hebble (53) | |
| Year of Election or Appointment: 2009 Assistant Treasurer of Fidelity's Equity and High Income Funds. Mr. Hebble also serves as President (2011-present), Treasurer, and Chief Financial Officer of The North Carolina Capital Management Trust: Cash and Term Portfolios (2008-present), President and Treasurer of other Fidelity funds (2008-present) and is an employee of Fidelity Investments. |
Gary W. Ryan (53) | |
| Year of Election or Appointment: 2005 Assistant Treasurer of the Fidelity funds. Mr. Ryan is an employee of Fidelity Investments. Previously, Mr. Ryan served as Vice President of Fund Reporting in Fidelity Pricing and Cash Management Services (FPCMS) (1999-2005). |
Jonathan Davis (43) | |
| Year of Election or Appointment: 2010 Assistant Treasurer of the Fidelity funds. Mr. Davis is also Assistant Treasurer of Fidelity Rutland Square Trust II and Fidelity Commonwealth Trust II. Mr. Davis is an employee of Fidelity Investments. Previously, Mr. Davis served as Vice President and Associate General Counsel of FMR LLC (2003-2010). |
Annual Report
Investment Adviser
Fidelity Management & Research Company
Boston, MA
Investment Sub-Advisers
FMR Co., Inc.
Fidelity Management & Research
(U.K.) Inc.
Fidelity Management & Research
(Hong Kong) Limited
Fidelity Management & Research
(Japan) Inc.
General Distributor
Fidelity Distributors Corporation
Boston, MA
Transfer and Service Agents
Fidelity Investments Institutional Operations Company, Inc.
Boston, MA
Fidelity Service Company, Inc.
Boston, MA
Custodian
Citibank, N.A.
New York, NY
AMCGI-UANN-0312
1.838418.102
(Fidelity Investment logo)(registered trademark)
Fidelity®
Mid Cap Value
Fund
Annual Report
January 31, 2012
(Fidelity Cover Art)
Contents
Chairman's Message | The Chairman's message to shareholders. | |
Performance | How the fund has done over time. | |
Management's Discussion of Fund Performance | The Portfolio Manager's review of fund performance and strategy. | |
Shareholder Expense Example | An example of shareholder expenses. | |
Investment Changes | A summary of major shifts in the fund's investments over the past six months. | |
Investments | A complete list of the fund's investments with their market values. | |
Financial Statements | Statements of assets and liabilities, operations, and changes in net assets, as well as financial highlights. | |
Notes | Notes to the financial statements. | |
Report of Independent Registered Public Accounting Firm |
| |
Trustees and Officers |
| |
Distributions |
|
To view a fund's proxy voting guidelines and proxy voting record for the 12-month period ended June 30, visit http://www.fidelity.com/proxyvotingresults or visit the Securities and Exchange Commission's (SEC) web site at http://www.sec.gov. You may also call 1-800-544-8544 to request a free copy of the proxy voting guidelines.
Standard & Poor's, S&P and S&P 500 are registered service marks of The McGraw-Hill Companies, Inc. and have been licensed for use by Fidelity Distributors Corporation.
Other third party marks appearing herein are the property of their respective owners.
All other marks appearing herein are registered or unregistered trademarks or service marks of FMR LLC or an affiliated company.
Annual Report
This report and the financial statements contained herein are submitted for the general information of the shareholders of the fund. This report is not authorized for distribution to prospective investors in the fund unless preceded or accompanied by an effective prospectus.
A fund files its complete schedule of portfolio holdings with the SEC for the first and third quarters of each fiscal year on Form N-Q. Forms N-Q are available on the SEC's web site at http://www.sec.gov. A fund's Forms N-Q may be reviewed and copied at the SEC's Public Reference Room in Washington, DC. Information regarding the operation of the SEC's Public Reference Room may be obtained by calling 1-800-SEC-0330. For a complete list of a fund's portfolio holdings, view the most recent holdings listing, semiannual report, or annual report on Fidelity's web site at http://www.fidelity.com, http://www.advisor.fidelity.com, or http://www.401k.com, as applicable.
NOT FDIC INSURED • MAY LOSE VALUE • NO BANK GUARANTEE
Neither the fund nor Fidelity Distributors Corporation is a bank.
Annual Report
Chairman's Message
(photo_of_James_C_Curvey)
Dear Shareholder:
Following a year marked by unusually high volatility, 2012 began with most major asset classes advancing steadily in January. For U.S. equities, it was the strongest start to a new year since 1997. International stocks fared even better, despite continued uncertainty related to the sovereign debt crisis in Europe. Investors have been acutely sensitive to the latest news, for better or worse, coming out of the eurozone and its impact on financial markets. As we look ahead, the unresolved debt crisis in Europe remains at the center of a series of risk factors, summarized below, that we believe have the greatest potential to influence the global investment landscape.
Deleveraging and the economy
In the euro-currency area, fiscal austerity among nations and debt deleveraging among financial companies loaded with sovereign debt are deflationary measures and serve to hinder economic growth in the short term. Such an economic and financial-market scenario has not been historically supportive of strong performance among riskier assets, and emerges at a time when many nations need a resurgent economy to assist them in closing their budget deficits and in building confidence among bond buyers to help them refinance their existing debt obligations.
Slowdown in China and Europe
China's economy is the second-largest in the world, and it has been the biggest contributor to global growth since the end of the last recession. Thus, the slower pace of domestic growth in China has led to lower demand for imports of commodities and other construction materials from the rest of the world. In addition, economic weakness in Europe and the broad-based global economic slowdown are putting pressure on China's export growth, which has been largely responsible for its breakneck pace of annual gross domestic product (GDP) growth during the past three decades.
Credit deterioration and contagion
The heightened macroeconomic risk and elevated credit risk swirling around certain European nations and financial institutions have caused many market participants to avoid purchases of or reduce exposure to short-term debt offerings by these issuers. With increased credit risk, there are growing concerns about the potential credit contraction and contagion from European issuers spreading to other financial markets.
We invite you to learn more by visiting us on the Internet or calling us by phone. It is our privilege to provide the resources you need to choose investments that are right for you.
Sincerely,
(The acting chairman's signature appears here.)
James C. Curvey
Acting Chairman
Annual Report
Performance: The Bottom Line
Average annual total return reflects the change in the value of an investment, assuming reinvestment of the class' distributions from dividend income and capital gains (the profits earned upon the sale of securities that have grown in value, if any) and assuming a constant rate of performance each year. The $10,000 table and the fund's returns do not reflect the deduction of taxes that a shareholder would pay on fund distributions or the redemption of fund shares. During periods of reimbursement by Fidelity, a fund's total return will be greater than it would be had the reimbursement not occurred. How a fund did yesterday is no guarantee of how it will do tomorrow.
Average Annual Total Returns
Periods ended January 31, 2012 | Past 1 | Past 5 | Past 10 |
Fidelity® Mid Cap Value Fund | -1.04% | 0.29% | 6.71% |
$10,000 Over 10 Years
Let's say hypothetically that $10,000 was invested in Fidelity® Mid Cap Value Fund, a class of the fund, on January 31, 2002. The chart shows how the value of your investment would have changed, and also shows how the Russell Midcap® Value Index performed over the same period.
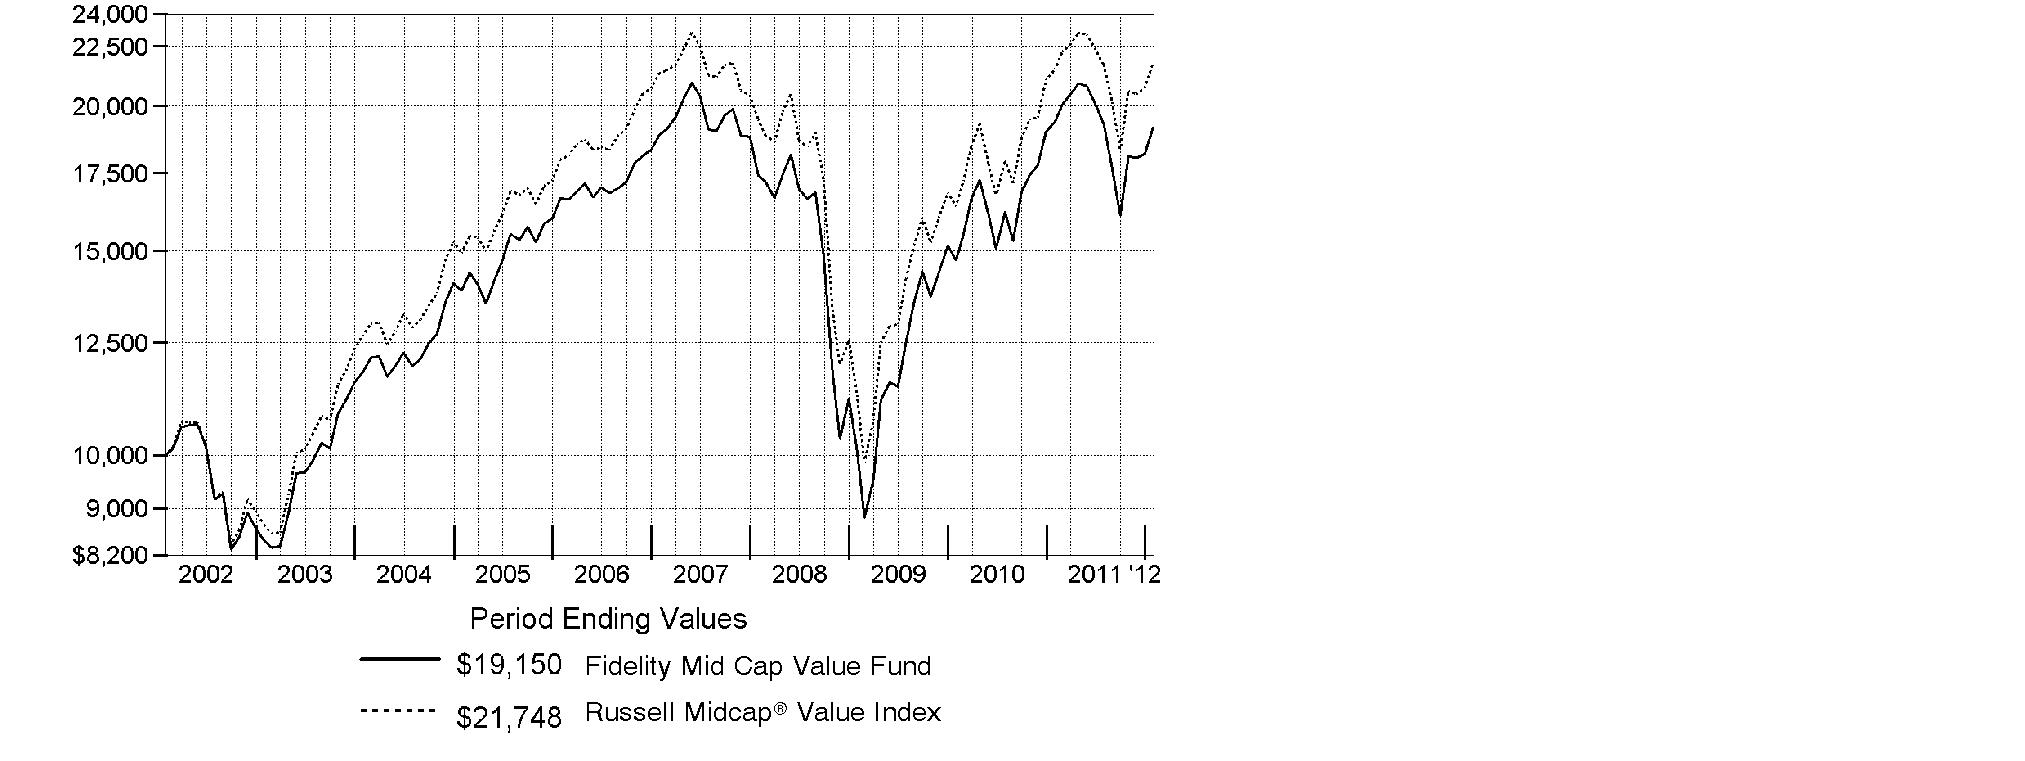
Annual Report
Management's Discussion of Fund Performance
Market Recap: After enduring one of the most volatile trading periods on record, U.S. stocks posted a gain for the 12 months ending January 31, 2012, sparked by a January rally. Strong corporate earnings reports and hints of economic recovery sent stocks mostly upward through April, when sovereign debt woes in Europe sparked fear of a global slowdown. In the summer, equities plummeted on eurozone instability, debate over the U.S. debt ceiling and a historic downgrade of the nation's sovereign debt rating. After falling as much as 13% by early August, the broad-based S&P 500® Index seesawed back to end the period on an optimistic note. For the full 12 months, the S&P 500® rose 4.22%, while the technology-laden Nasdaq Composite® Index added 5.26%. Investors began to shed perceived riskier smaller-cap stocks in favor of larger, more-established and dividend-paying names, helping to drive the Dow Jones® Industrial Average up 9.12% for the year, while the Russell 2000® - a proxy for small-caps - and Russell Midcap® indexes added 2.86% and 2.25%, respectively. Within the S&P 500®, defensive sectors such as health care (+16%) and utilities (+14%) fared best, while financials (-12%) struggled. Foreign developed-markets stocks were stung by Europe's turmoil, and the MSCI® EAFE® (Europe, Australasia, Far East) Index fell 9.49%.
Comments from Bruce Dirks, Portfolio Manager of Fidelity® Mid Cap Value Fund: For the year, the fund's Retail Class shares returned -1.04%, trailing the 1.19% gain of the Russell Midcap® Value Index. Weak stock picking in insurance and banks, coupled with adverse positioning within capital goods and utilities, were the biggest detractors from relative performance. On the plus side, security selection in consumer discretionary, health care and materials boosted relative results. From a market-capitalization perspective, stock picks among mid-cap companies in the $2 billion to $5 billion range helped the fund's return, while choices among those with a capitalization greater than $5 billion hurt. Individual relative detractors included untimely trading in the shares of electric utility PPL, along with airbag and safety equipment supplier TRW Automotive Holdings, regional bank SunTrust Banks, and an out-of-benchmark stake in integrated energy producer Hess. The top individual contributors versus the benchmark were Goodrich, a supplier of components and systems to commercial aircraft manufacturers, department store operator Macy's and apparel company VF. PPL and Goodrich were not held at period end.
The views expressed above reflect those of the portfolio manager(s) only through the end of the period as stated on the cover of this report and do not necessarily represent the views of Fidelity or any other person in the Fidelity organization. Any such views are subject to change at any time based upon market or other conditions and Fidelity disclaims any responsibility to update such views. These views may not be relied on as investment advice and, because investment decisions for a Fidelity fund are based on numerous factors, may not be relied on as an indication of trading intent on behalf of any Fidelity fund.
Annual Report
Shareholder Expense Example
As a shareholder of the Fund, you incur two types of costs: (1) transaction costs, including sales charges (loads) on purchase payments or redemption proceeds, redemption fees, and (2) ongoing costs, including management fees, distribution and/or service (12b-1) fees and other Fund expenses. This Example is intended to help you understand your ongoing costs (in dollars) of investing in the Fund and to compare these costs with the ongoing costs of investing in other mutual funds.
The Example is based on an investment of $1,000 invested at the beginning of the period and held for the entire period (August 1, 2011 to January 31, 2012).
Actual Expenses
The first line of the accompanying table for each class of the Fund provides information about actual account values and actual expenses. You may use the information in this line, together with the amount you invested, to estimate the expenses that you paid over the period. Simply divide your account value by $1,000.00 (for example, an $8,600 account value divided by $1,000.00 = 8.6), then multiply the result by the number in the first line for a class of the Fund under the heading entitled "Expenses Paid During Period" to estimate the expenses you paid on your account during this period. A small balance maintenance fee of $12.00 that is charged once a year may apply for certain accounts with a value of less than $2,000. This fee is not included in the table below. If it was, the estimate of expenses you paid during the period would be higher, and your ending account value lower, by this amount. In addition, the Fund, as a shareholder in the underlying Fidelity Central Funds, will indirectly bear its pro-rata share of the fees and expenses incurred by the underlying Fidelity Central Funds. These fees and expenses are not included in the Fund's annualized expense ratio used to calculate the expense estimate in the table below.
Hypothetical Example for Comparison Purposes
The second line of the accompanying table for each class of the Fund provides information about hypothetical account values and hypothetical expenses based on a Class' actual expense ratio and an assumed rate of return of 5% per year before expenses, which is not the Class' actual return. The hypothetical account values and expenses may not be used to estimate the actual ending account balance or expenses you paid for the period. You may use this information to compare the ongoing costs of investing in the Fund and other funds. To do so, compare this 5% hypothetical example with the 5% hypothetical examples that appear in the shareholder reports of the other funds. A small balance maintenance fee of $12.00 that is charged once a year may apply for certain accounts with a value of less than $2,000. This fee is not included in the table below. If it was, the estimate of expenses you paid during the period would be higher, and your ending account value lower, by this amount. In addition, the Fund, as a shareholder in the underlying Fidelity Central Funds, will indirectly bear its pro-rata share of the fees and expenses incurred by the underlying Fidelity Central Funds. These fees and expenses are not included in the Fund's annualized expense ratio used to calculate the expense estimate in the table below.
Please note that the expenses shown in the table are meant to highlight your ongoing costs only and do not reflect any transaction costs. Therefore, the second line of the table is useful in comparing ongoing costs only, and will not help you determine the relative total costs of owning different funds. In addition, if these transactional costs were included, your costs would have been higher.
Annual Report
Shareholder Expense Example - continued
| Annualized | Beginning | Ending | Expenses Paid |
Class A | 1.16% |
|
|
|
Actual |
| $ 1,000.00 | $ 992.10 | $ 5.82 |
HypotheticalA |
| $ 1,000.00 | $ 1,019.36 | $ 5.90 |
Class T | 1.43% |
|
|
|
Actual |
| $ 1,000.00 | $ 990.90 | $ 7.18 |
HypotheticalA |
| $ 1,000.00 | $ 1,018.00 | $ 7.27 |
Class B | 1.91% |
|
|
|
Actual |
| $ 1,000.00 | $ 988.70 | $ 9.57 |
HypotheticalA |
| $ 1,000.00 | $ 1,015.58 | $ 9.70 |
Class C | 1.91% |
|
|
|
Actual |
| $ 1,000.00 | $ 988.60 | $ 9.57 |
HypotheticalA |
| $ 1,000.00 | $ 1,015.58 | $ 9.70 |
Mid Cap Value | .88% |
|
|
|
Actual |
| $ 1,000.00 | $ 993.90 | $ 4.42 |
HypotheticalA |
| $ 1,000.00 | $ 1,020.77 | $ 4.48 |
Institutional Class | .90% |
|
|
|
Actual |
| $ 1,000.00 | $ 993.60 | $ 4.52 |
HypotheticalA |
| $ 1,000.00 | $ 1,020.67 | $ 4.58 |
A 5% return per year before expenses
* Expenses are equal to each Class' annualized expense ratio, multiplied by the average account value over the period, multiplied by 184/365 (to reflect the one-half year period).
Annual Report
Investment Changes (Unaudited)
Top Ten Stocks as of January 31, 2012 | ||
| % of fund's | % of fund's net assets |
Edison International | 1.7 | 1.6 |
Sempra Energy | 1.7 | 1.6 |
Discover Financial Services | 1.7 | 1.6 |
Macy's, Inc. | 1.6 | 1.1 |
Valero Energy Corp. | 1.6 | 1.7 |
Humana, Inc. | 1.5 | 1.4 |
Republic Services, Inc. | 1.5 | 1.3 |
ConAgra Foods, Inc. | 1.5 | 0.0 |
Lorillard, Inc. | 1.5 | 1.5 |
Clorox Co. | 1.4 | 0.0 |
| 15.7 | |
Top Five Market Sectors as of January 31, 2012 | ||
| % of fund's | % of fund's net assets |
Financials | 30.7 | 30.9 |
Utilities | 13.4 | 12.0 |
Consumer Discretionary | 11.0 | 11.2 |
Industrials | 10.6 | 10.2 |
Information Technology | 8.2 | 8.6 |
Asset Allocation (% of fund's net assets) | |||||||
As of January 31, 2012* | As of July 31, 2011** | ||||||
| Stocks 99.5% |
| | Stocks 99.7% |
| ||
| Short-Term |
| | Short-Term |
| ||
* Foreign investments | 3.1% |
| ** Foreign investments | 2.1% |
| ||

Annual Report
Investments January 31, 2012
Showing Percentage of Net Assets
Common Stocks - 99.5% | |||
Shares | Value | ||
CONSUMER DISCRETIONARY - 11.0% | |||
Auto Components - 1.1% | |||
TRW Automotive Holdings Corp. (a) | 168,700 | $ 6,329,624 | |
Hotels, Restaurants & Leisure - 0.9% | |||
Brinker International, Inc. (d) | 212,200 | 5,485,370 | |
Household Durables - 0.7% | |||
Jarden Corp. | 113,800 | 3,833,922 | |
Media - 1.6% | |||
CBS Corp. Class B | 164,300 | 4,679,264 | |
DISH Network Corp. Class A | 174,200 | 4,863,664 | |
| 9,542,928 | ||
Multiline Retail - 1.6% | |||
Macy's, Inc. | 282,500 | 9,517,425 | |
Specialty Retail - 2.9% | |||
Best Buy Co., Inc. | 209,300 | 5,012,735 | |
Foot Locker, Inc. | 270,500 | 7,097,920 | |
GameStop Corp. Class A (a)(d) | 219,300 | 5,122,848 | |
| 17,233,503 | ||
Textiles, Apparel & Luxury Goods - 2.2% | |||
PVH Corp. | 91,818 | 7,087,431 | |
VF Corp. | 45,900 | 6,035,391 | |
| 13,122,822 | ||
TOTAL CONSUMER DISCRETIONARY | 65,065,594 | ||
CONSUMER STAPLES - 7.0% | |||
Beverages - 1.0% | |||
Dr Pepper Snapple Group, Inc. | 155,200 | 6,024,864 | |
Food Products - 3.1% | |||
Campbell Soup Co. | 154,500 | 4,897,650 | |
ConAgra Foods, Inc. | 325,400 | 8,678,418 | |
Ralcorp Holdings, Inc. (a) | 50,100 | 4,381,245 | |
| 17,957,313 | ||
Household Products - 1.4% | |||
Clorox Co. | 123,500 | 8,479,510 | |
Tobacco - 1.5% | |||
Lorillard, Inc. | 80,500 | 8,644,895 | |
TOTAL CONSUMER STAPLES | 41,106,582 | ||
Common Stocks - continued | |||
Shares | Value | ||
ENERGY - 7.1% | |||
Energy Equipment & Services - 1.6% | |||
Helmerich & Payne, Inc. | 93,300 | $ 5,757,543 | |
Oil States International, Inc. (a) | 44,900 | 3,578,081 | |
| 9,335,624 | ||
Oil, Gas & Consumable Fuels - 5.5% | |||
Hess Corp. | 79,100 | 4,453,330 | |
Marathon Oil Corp. | 185,800 | 5,832,262 | |
Murphy Oil Corp. | 122,600 | 7,306,960 | |
Tesoro Corp. (a) | 227,100 | 5,684,313 | |
Valero Energy Corp. | 390,500 | 9,368,095 | |
| 32,644,960 | ||
TOTAL ENERGY | 41,980,584 | ||
FINANCIALS - 30.7% | |||
Capital Markets - 1.4% | |||
Ameriprise Financial, Inc. | 151,300 | 8,102,115 | |
Commercial Banks - 6.2% | |||
CapitalSource, Inc. | 513,100 | 3,545,521 | |
Comerica, Inc. | 214,600 | 5,937,982 | |
Huntington Bancshares, Inc. | 1,013,600 | 5,787,656 | |
KeyCorp | 995,900 | 7,738,143 | |
Regions Financial Corp. | 1,214,800 | 6,341,256 | |
SunTrust Banks, Inc. | 366,600 | 7,540,962 | |
| 36,891,520 | ||
Consumer Finance - 3.1% | |||
Discover Financial Services | 363,800 | 9,888,084 | |
SLM Corp. | 563,400 | 8,422,830 | |
| 18,310,914 | ||
Diversified Financial Services - 1.0% | |||
Leucadia National Corp. | 221,000 | 6,134,960 | |
Insurance - 7.2% | |||
Allied World Assurance Co. Holdings Ltd. | 82,900 | 5,100,837 | |
Assurant, Inc. | 167,100 | 6,617,160 | |
Hartford Financial Services Group, Inc. | 383,600 | 6,720,672 | |
Lincoln National Corp. | 306,900 | 6,610,626 | |
Torchmark Corp. | 129,500 | 5,914,265 | |
Unum Group | 219,600 | 5,013,468 | |
Validus Holdings Ltd. | 205,600 | 6,593,592 | |
| 42,570,620 | ||
Common Stocks - continued | |||
Shares | Value | ||
FINANCIALS - continued | |||
Real Estate Investment Trusts - 10.6% | |||
American Capital Agency Corp. | 170,700 | $ 5,004,924 | |
BRE Properties, Inc. | 110,700 | 5,736,474 | |
Douglas Emmett, Inc. | 325,900 | 6,814,569 | |
Essex Property Trust, Inc. | 36,200 | 5,212,800 | |
Kimco Realty Corp. | 436,700 | 7,969,775 | |
Prologis, Inc. | 229,500 | 7,277,445 | |
Rayonier, Inc. | 127,800 | 5,844,294 | |
SL Green Realty Corp. | 66,800 | 4,911,804 | |
The Macerich Co. | 134,000 | 7,276,200 | |
Ventas, Inc. | 109,000 | 6,355,790 | |
| 62,404,075 | ||
Thrifts & Mortgage Finance - 1.2% | |||
People's United Financial, Inc. | 552,200 | 6,808,626 | |
TOTAL FINANCIALS | 181,222,830 | ||
HEALTH CARE - 5.9% | |||
Health Care Providers & Services - 4.5% | |||
Community Health Systems, Inc. (a) | 311,800 | 5,830,660 | |
Health Net, Inc. (a) | 191,200 | 7,215,888 | |
Humana, Inc. | 100,800 | 8,973,216 | |
McKesson Corp. | 56,600 | 4,625,352 | |
| 26,645,116 | ||
Pharmaceuticals - 1.4% | |||
Mylan, Inc. (a) | 155,800 | 3,232,850 | |
Watson Pharmaceuticals, Inc. (a) | 82,100 | 4,813,523 | |
| 8,046,373 | ||
TOTAL HEALTH CARE | 34,691,489 | ||
INDUSTRIALS - 10.6% | |||
Aerospace & Defense - 2.7% | |||
Alliant Techsystems, Inc. | 57,100 | 3,392,311 | |
Esterline Technologies Corp. (a) | 75,400 | 4,610,710 | |
Textron, Inc. | 309,300 | 7,880,964 | |
| 15,883,985 | ||
Airlines - 0.8% | |||
Alaska Air Group, Inc. (a) | 59,500 | 4,529,735 | |
Common Stocks - continued | |||
Shares | Value | ||
INDUSTRIALS - continued | |||
Commercial Services & Supplies - 2.2% | |||
Pitney Bowes, Inc. (d) | 207,100 | $ 3,928,687 | |
Republic Services, Inc. | 303,500 | 8,886,480 | |
| 12,815,167 | ||
Construction & Engineering - 1.7% | |||
Fluor Corp. | 56,900 | 3,200,056 | |
KBR, Inc. | 223,900 | 7,196,146 | |
| 10,396,202 | ||
Machinery - 2.3% | |||
Cummins, Inc. | 56,100 | 5,834,400 | |
Parker Hannifin Corp. | 98,600 | 7,955,048 | |
| 13,789,448 | ||
Professional Services - 0.9% | |||
Towers Watson & Co. | 87,500 | 5,232,500 | |
TOTAL INDUSTRIALS | 62,647,037 | ||
INFORMATION TECHNOLOGY - 8.2% | |||
Communications Equipment - 1.6% | |||
Brocade Communications Systems, Inc. (a) | 932,600 | 5,231,886 | |
Motorola Solutions, Inc. | 93,800 | 4,353,258 | |
| 9,585,144 | ||
Computers & Peripherals - 1.3% | |||
SanDisk Corp. (a) | 166,600 | 7,643,608 | |
Electronic Equipment & Components - 0.8% | |||
Jabil Circuit, Inc. | 202,600 | 4,590,916 | |
IT Services - 0.5% | |||
Alliance Data Systems Corp. (a)(d) | 27,200 | 3,013,760 | |
Office Electronics - 1.3% | |||
Xerox Corp. | 968,100 | 7,502,775 | |
Semiconductors & Semiconductor Equipment - 2.7% | |||
KLA-Tencor Corp. | 98,400 | 5,031,192 | |
Marvell Technology Group Ltd. (a) | 432,600 | 6,718,278 | |
Skyworks Solutions, Inc. (a) | 208,600 | 4,501,588 | |
| 16,251,058 | ||
TOTAL INFORMATION TECHNOLOGY | 48,587,261 | ||
Common Stocks - continued | |||
Shares | Value | ||
MATERIALS - 4.9% | |||
Chemicals - 2.7% | |||
Ashland, Inc. | 94,600 | $ 5,965,476 | |
CF Industries Holdings, Inc. | 36,300 | 6,438,894 | |
W.R. Grace & Co. (a) | 61,000 | 3,265,940 | |
| 15,670,310 | ||
Containers & Packaging - 1.2% | |||
Ball Corp. | 78,700 | 3,089,762 | |
Rock-Tenn Co. Class A | 69,700 | 4,311,642 | |
| 7,401,404 | ||
Metals & Mining - 1.0% | |||
Commercial Metals Co. | 145,800 | 2,090,772 | |
Reliance Steel & Aluminum Co. | 73,900 | 3,931,480 | |
| 6,022,252 | ||
TOTAL MATERIALS | 29,093,966 | ||
TELECOMMUNICATION SERVICES - 0.7% | |||
Diversified Telecommunication Services - 0.7% | |||
Frontier Communications Corp. (d) | 909,300 | 3,891,804 | |
UTILITIES - 13.4% | |||
Electric Utilities - 5.0% | |||
Cleco Corp. | 65,300 | 2,596,328 | |
Edison International | 243,400 | 9,989,137 | |
El Paso Electric Co. | 162,700 | 5,661,960 | |
NV Energy, Inc. | 352,800 | 5,715,360 | |
PNM Resources, Inc. | 311,400 | 5,546,034 | |
| 29,508,819 | ||
Independent Power Producers & Energy Traders - 0.9% | |||
The AES Corp. (a) | 427,800 | 5,458,728 | |
Multi-Utilities - 7.5% | |||
Alliant Energy Corp. | 172,500 | 7,312,275 | |
CenterPoint Energy, Inc. | 366,400 | 6,767,408 | |
CMS Energy Corp. | 284,100 | 6,201,903 | |
NiSource, Inc. | 280,000 | 6,364,400 | |
Common Stocks - continued | |||
Shares | Value | ||
UTILITIES - continued | |||
Multi-Utilities - continued | |||
OGE Energy Corp. | 138,800 | $ 7,336,968 | |
Sempra Energy | 175,500 | 9,985,950 | |
| 43,968,904 | ||
TOTAL UTILITIES | 78,936,451 | ||
TOTAL COMMON STOCKS (Cost $565,672,480) |
| ||
Money Market Funds - 2.4% | |||
|
|
|
|
Fidelity Cash Central Fund, 0.12% (b) | 2,261,261 | 2,261,261 | |
Fidelity Securities Lending Cash Central Fund, 0.12% (b)(c) | 12,055,542 | 12,055,542 | |
TOTAL MONEY MARKET FUNDS (Cost $14,316,803) |
| ||
TOTAL INVESTMENT PORTFOLIO - 101.9% (Cost $579,989,283) | 601,540,401 | ||
NET OTHER ASSETS (LIABILITIES) - (1.9)% | (11,148,830) | ||
NET ASSETS - 100% | $ 590,391,571 | ||
Legend |
(a) Non-income producing |
(b) Affiliated fund that is available only to investment companies and other accounts managed by Fidelity Investments. The rate quoted is the annualized seven-day yield of the fund at period end. A complete unaudited listing of the fund's holdings as of its most recent quarter end is available upon request. In addition, each Fidelity Central Fund's financial statements, which are not covered by the Fund's Report of Independent Registered Public Accounting Firm, are available on the SEC's website or upon request. |
(c) Investment made with cash collateral received from securities on loan. |
(d) Security or a portion of the security is on loan at period end. |
Affiliated Central Funds |
Information regarding fiscal year to date income earned by the Fund from investments in Fidelity Central Funds is as follows: |
Fund | Income earned |
Fidelity Cash Central Fund | $ 4,244 |
Fidelity Securities Lending Cash Central Fund | 26,327 |
Total | $ 30,571 |
Other Information |
All investments are categorized as Level 1 under the Fair Value Hierarchy. The inputs or methodology used for valuing securities may not be an indication of the risk associated with investing in those securities. For more information on valuation inputs, please refer to the Security Valuation section in the accompanying Notes to Financial Statements. |
See accompanying notes which are an integral part of the financial statements.
Annual Report
Financial Statements
Statement of Assets and Liabilities
| January 31, 2012 | |
|
|
|
Assets | ||
Investment in securities, at value (including securities loaned of $11,629,259) - See accompanying schedule: Unaffiliated issuers (cost $565,672,480) | $ 587,223,598 |
|
Fidelity Central Funds (cost $14,316,803) | 14,316,803 |
|
Total Investments (cost $579,989,283) |
| $ 601,540,401 |
Receivable for investments sold | 5,922,361 | |
Receivable for fund shares sold | 503,414 | |
Dividends receivable | 465,532 | |
Distributions receivable from Fidelity Central Funds | 1,597 | |
Prepaid expenses | 1,626 | |
Other receivables | 22,353 | |
Total assets | 608,457,284 | |
|
|
|
Liabilities | ||
Payable to custodian bank | $ 41,147 | |
Payable for investments purchased | 4,574,379 | |
Payable for fund shares redeemed | 950,312 | |
Accrued management fee | 241,778 | |
Distribution and service plan fees payable | 12,070 | |
Other affiliated payables | 141,985 | |
Other payables and accrued expenses | 48,500 | |
Collateral on securities loaned, at value | 12,055,542 | |
Total liabilities | 18,065,713 | |
|
|
|
Net Assets | $ 590,391,571 | |
Net Assets consist of: |
| |
Paid in capital | $ 631,279,726 | |
Distributions in excess of net investment income | (137,586) | |
Accumulated undistributed net realized gain (loss) on investments | (62,301,687) | |
Net unrealized appreciation (depreciation) on investments | 21,551,118 | |
Net Assets | $ 590,391,571 | |
See accompanying notes which are an integral part of the financial statements.
Annual Report
Statement of Assets and Liabilities - continued
| January 31, 2012 | |
|
|
|
Calculation of Maximum Offering Price Class A: | $ 15.87 | |
|
|
|
Maximum offering price per share (100/94.25 of $15.87) | $ 16.84 | |
Class T: | $ 15.84 | |
|
|
|
Maximum offering price per share (100/96.50 of $15.84) | $ 16.41 | |
Class B: | $ 15.71 | |
|
|
|
Class C: | $ 15.65 | |
|
|
|
Mid Cap Value: | $ 15.97 | |
|
|
|
Institutional Class: | $ 15.91 | |
A Redemption price per share is equal to net asset value less any applicable contingent deferred sales charge.
See accompanying notes which are an integral part of the financial statements.
Annual Report
Financial Statements - continued
Statement of Operations
| Year ended January 31, 2012 | |
|
|
|
Investment Income |
|
|
Dividends |
| $ 10,284,144 |
Interest |
| 94 |
Income from Fidelity Central Funds |
| 30,571 |
Total income |
| 10,314,809 |
|
|
|
Expenses | ||
Management fee | $ 3,588,402 | |
Performance adjustment | (6,368) | |
Transfer agent fees | 1,694,073 | |
Distribution and service plan fees | 154,185 | |
Accounting and security lending fees | 236,372 | |
Custodian fees and expenses | 28,521 | |
Independent trustees' compensation | 3,756 | |
Registration fees | 72,124 | |
Audit | 54,963 | |
Legal | 2,193 | |
Interest | 529 | |
Miscellaneous | 6,596 | |
Total expenses before reductions | 5,835,346 | |
Expense reductions | (65,968) | 5,769,378 |
Net investment income (loss) | 4,545,431 | |
Realized and Unrealized Gain (Loss) Net realized gain (loss) on: | ||
Investment securities: |
|
|
Unaffiliated issuers |
| 70,353,241 |
Change in net unrealized appreciation (depreciation) on investment securities | (90,350,275) | |
Net gain (loss) | (19,997,034) | |
Net increase (decrease) in net assets resulting from operations | $ (15,451,603) | |
See accompanying notes which are an integral part of the financial statements.
Annual Report
Statement of Changes in Net Assets
| Year ended | Year ended |
Increase (Decrease) in Net Assets |
|
|
Operations |
|
|
Net investment income (loss) | $ 4,545,431 | $ 1,552,041 |
Net realized gain (loss) | 70,353,241 | 100,225,944 |
Change in net unrealized appreciation (depreciation) | (90,350,275) | 59,481,106 |
Net increase (decrease) in net assets resulting | (15,451,603) | 161,259,091 |
Distributions to shareholders from net investment income | (4,101,848) | (2,444,386) |
Share transactions - net increase (decrease) | (97,570,396) | 57,906,539 |
Redemption fees | 28,676 | 31,710 |
Total increase (decrease) in net assets | (117,095,171) | 216,752,954 |
|
|
|
Net Assets | ||
Beginning of period | 707,486,742 | 490,733,788 |
End of period (including distributions in excess of net investment income of $137,586 and distributions in excess of net investment income of $543,496, respectively) | $ 590,391,571 | $ 707,486,742 |
See accompanying notes which are an integral part of the financial statements.
Annual Report
Financial Highlights - Class A
Years ended January 31, | 2012 | 2011 | 2010 | 2009 | 2008 H |
Selected Per-Share Data |
|
|
|
|
|
Net asset value, beginning of period | $ 16.16 | $ 12.35 | $ 8.53 | $ 15.05 | $ 17.63 |
Income from Investment Operations |
|
|
|
|
|
Net investment income (loss) E | .07 | - J | .07 | .09 | .03 |
Net realized and unrealized gain (loss) | (.29) | 3.85 | 3.84 | (6.47) | (1.78) |
Total from investment operations | (.22) | 3.85 | 3.91 | (6.38) | (1.75) |
Distributions from net investment income | (.07) | (.04) | (.09) | (.14) | (.06) |
Distributions from net realized gain | - | - | - | - J | (.77) |
Total distributions | (.07) | (.04) | (.09) | (.14) | (.83) |
Redemption fees added to paid in capital E, J | - | - | - | - | - |
Net asset value, end of period | $ 15.87 | $ 16.16 | $ 12.35 | $ 8.53 | $ 15.05 |
Total Return B, C, D | (1.34)% | 31.14% | 45.79% | (42.40)% | (10.28)% |
Ratios to Average Net Assets F, I |
|
|
|
|
|
Expenses before reductions | 1.17% | 1.17% | 1.21% | 1.12% | 1.14% A |
Expenses net of fee waivers, if any | 1.17% | 1.17% | 1.21% | 1.12% | 1.14% A |
Expenses net of all reductions | 1.16% | 1.17% | 1.20% | 1.12% | 1.13% A |
Net investment income (loss) | .44% | .02% | .62% | .71% | .16% A |
Supplemental Data |
|
|
|
|
|
Net assets, end of period (000 omitted) | $ 19,578 | $ 23,608 | $ 10,640 | $ 6,404 | $ 7,445 |
Portfolio turnover rate G | 173% | 133% | 202% | 268% | 264% |
A Annualized
B Total returns for periods of less than one year are not annualized.
C Total returns would have been lower if certain expenses had not been reduced during the applicable periods shown.
D Total returns do not include the effect of the sales charges.
E Calculated based on average shares outstanding during the period.
F Fees and expenses of any underlying Fidelity Central Funds are not included in the Fund's expense ratio. The Fund indirectly bears its proportionate share of the expenses of any underlying Fidelity Central Funds.
G Amount does not include the portfolio activity of any underlying Fidelity Central Funds.
H For the period February 13, 2007 (commencement of sale of shares) to January 31, 2008.
I Expense ratios reflect operating expenses of the class. Expenses before reductions do not reflect amounts reimbursed by the investment adviser or reductions from brokerage service arrangements or reductions from other expense offset arrangements and do not represent the amount paid by the class during periods when reimbursements or reductions occur. Expense ratios before reductions for start-up periods may not be representative of longer-term operating periods. Expenses net of fee waivers reflect expenses after reimbursement by the investment adviser but prior to reductions from brokerage service arrangements or other expense offset arrangements. Expenses net of all reductions represent the net expenses paid by the class.
J Amount represents less than $.01 per share.
See accompanying notes which are an integral part of the financial statements.
Annual Report
Financial Highlights - Class T
Years ended January 31, | 2012 | 2011 | 2010 | 2009 | 2008 H |
Selected Per-Share Data |
|
|
|
|
|
Net asset value, beginning of period | $ 16.14 | $ 12.34 | $ 8.53 | $ 15.04 | $ 17.63 |
Income from Investment Operations |
|
|
|
|
|
Net investment income (loss) E | .03 | (.03) | .04 | .06 | (.02) |
Net realized and unrealized gain (loss) | (.29) | 3.83 | 3.84 | (6.46) | (1.76) |
Total from investment operations | (.26) | 3.80 | 3.88 | (6.40) | (1.78) |
Distributions from net investment income | (.04) | - | (.07) | (.11) | (.04) |
Distributions from net realized gain | - | - | - | - | (.77) |
Total distributions | (.04) | - | (.07) | (.11) | (.81) |
Redemption fees added to paid in capital E, J | - | - | - | - | - |
Net asset value, end of period | $ 15.84 | $ 16.14 | $ 12.34 | $ 8.53 | $ 15.04 |
Total Return B, C, D | (1.59)% | 30.79% | 45.44% | (42.57)% | (10.46)% |
Ratios to Average Net Assets F, I |
|
|
|
|
|
Expenses before reductions | 1.43% | 1.43% | 1.47% | 1.38% | 1.39% A |
Expenses net of fee waivers, if any | 1.43% | 1.43% | 1.47% | 1.38% | 1.39% A |
Expenses net of all reductions | 1.42% | 1.43% | 1.46% | 1.38% | 1.39% A |
Net investment income (loss) | .18% | (.24)% | .36% | .45% | (.10)% A |
Supplemental Data |
|
|
|
|
|
Net assets, end of period (000 omitted) | $ 6,823 | $ 6,993 | $ 4,010 | $ 2,413 | $ 3,714 |
Portfolio turnover rate G | 173% | 133% | 202% | 268% | 264% |
A Annualized
B Total returns for periods of less than one year are not annualized.
C Total returns would have been lower if certain expenses had not been reduced during the applicable periods shown.
D Total returns do not include the effect of the sales charges.
E Calculated based on average shares outstanding during the period.
F Fees and expenses of any underlying Fidelity Central Funds are not included in the Fund's expense ratio. The Fund indirectly bears its proportionate share of the expenses of any underlying Fidelity Central Funds.
G Amount does not include the portfolio activity of any underlying Fidelity Central Funds.
H For the period February 13, 2007 (commencement of sale of shares) to January 31, 2008.
I Expense ratios reflect operating expenses of the class. Expenses before reductions do not reflect amounts reimbursed by the investment adviser or reductions from brokerage service arrangements or reductions from other expense offset arrangements and do not represent the amount paid by the class during periods when reimbursements or reductions occur. Expense ratios before reductions for start-up periods may not be representative of longer-term operating periods. Expenses net of fee waivers reflect expenses after reimbursement by the investment adviser but prior to reductions from brokerage service arrangements or other expense offset arrangements. Expenses net of all reductions represent the net expenses paid by the class.
J Amount represents less than $.01 per share.
See accompanying notes which are an integral part of the financial statements.
Annual Report
Financial Highlights - Class B
Years ended January 31, | 2012 | 2011 | 2010 | 2009 | 2008 H |
Selected Per-Share Data |
|
|
|
|
|
Net asset value, beginning of period | $ 16.04 | $ 12.32 | $ 8.53 | $ 14.99 | $ 17.63 |
Income from Investment Operations |
|
|
|
|
|
Net investment income (loss) E | (.05) | (.10) | (.01) | (.01) | (.10) |
Net realized and unrealized gain (loss) | (.28) | 3.82 | 3.82 | (6.40) | (1.76) |
Total from investment operations | (.33) | 3.72 | 3.81 | (6.41) | (1.86) |
Distributions from net investment income | - | - | (.02) | (.05) | (.01) |
Distributions from net realized gain | - | - | - | - | (.77) |
Total distributions | - | - | (.02) | (.05) | (.78) |
Redemption fees added to paid in capital E, J | - | - | - | - | - |
Net asset value, end of period | $ 15.71 | $ 16.04 | $ 12.32 | $ 8.53 | $ 14.99 |
Total Return B, C, D | (2.06)% | 30.19% | 44.61% | (42.79)% | (10.88)% |
Ratios to Average Net Assets F, I |
|
|
|
|
|
Expenses before reductions | 1.92% | 1.93% | 1.97% | 1.87% | 1.89% A |
Expenses net of fee waivers, if any | 1.92% | 1.93% | 1.97% | 1.87% | 1.89% A |
Expenses net of all reductions | 1.91% | 1.92% | 1.96% | 1.87% | 1.89% A |
Net investment income (loss) | (.31)% | (.74)% | (.14)% | (.04)% | (.59)% A |
Supplemental Data |
|
|
|
|
|
Net assets, end of period (000 omitted) | $ 1,376 | $ 1,793 | $ 1,154 | $ 763 | $ 1,304 |
Portfolio turnover rate G | 173% | 133% | 202% | 268% | 264% |
A Annualized
B Total returns for periods of less than one year are not annualized.
C Total returns would have been lower if certain expenses had not been reduced during the applicable periods shown.
D Total returns do not include the effect of the contingent deferred sales charge.
E Calculated based on average shares outstanding during the period.
F Fees and expenses of any underlying Fidelity Central Funds are not included in the Fund's expense ratio. The Fund indirectly bears its proportionate share of the expenses of any underlying Fidelity Central Funds.
G Amount does not include the portfolio activity of any underlying Fidelity Central Funds.
H For the period February 13, 2007 (commencement of sale of shares) to January 31, 2008.
I Expense ratios reflect operating expenses of the class. Expenses before reductions do not reflect amounts reimbursed by the investment adviser or reductions from brokerage service arrangements or reductions from other expense offset arrangements and do not represent the amount paid by the class during periods when reimbursements or reductions occur. Expense ratios before reductions for start-up periods may not be representative of longer-term operating periods. Expenses net of fee waivers reflect expenses after reimbursement by the investment adviser but prior to reductions from brokerage service arrangements or other expense offset arrangements. Expenses net of all reductions represent the net expenses paid by the class.
J Amount represents less than $.01 per share.
See accompanying notes which are an integral part of the financial statements.
Annual Report
Financial Highlights - Class C
Years ended January 31, | 2012 | 2011 | 2010 | 2009 | 2008 H |
Selected Per-Share Data |
|
|
|
|
|
Net asset value, beginning of period | $ 15.98 | $ 12.27 | $ 8.50 | $ 14.98 | $ 17.63 |
Income from Investment Operations |
|
|
|
|
|
Net investment income (loss) E | (.05) | (.10) | (.01) | - | (.10) |
Net realized and unrealized gain (loss) | (.28) | 3.81 | 3.80 | (6.41) | (1.77) |
Total from investment operations | (.33) | 3.71 | 3.79 | (6.41) | (1.87) |
Distributions from net investment income | - | - | (.02) | (.07) | (.01) |
Distributions from net realized gain | - | - | - | - | (.77) |
Total distributions | - | - | (.02) | (.07) | (.78) |
Redemption fees added to paid in capital E, J | - | - | - | - | - |
Net asset value, end of period | $ 15.65 | $ 15.98 | $ 12.27 | $ 8.50 | $ 14.98 |
Total Return B, C, D | (2.07)% | 30.24% | 44.56% | (42.79)% | (10.94)% |
Ratios to Average Net Assets F, I |
|
|
|
|
|
Expenses before reductions | 1.92% | 1.93% | 1.96% | 1.86% | 1.90% A |
Expenses net of fee waivers, if any | 1.92% | 1.93% | 1.96% | 1.86% | 1.90% A |
Expenses net of all reductions | 1.91% | 1.92% | 1.95% | 1.86% | 1.90% A |
Net investment income (loss) | (.31)% | (.73)% | (.13)% | (.03)% | (.60)% A |
Supplemental Data |
|
|
|
|
|
Net assets, end of period (000 omitted) | $ 5,000 | $ 5,309 | $ 2,293 | $ 1,232 | $ 1,658 |
Portfolio turnover rate G | 173% | 133% | 202% | 268% | 264% |
A Annualized
B Total returns for periods of less than one year are not annualized.
C Total returns would have been lower if certain expenses had not been reduced during the applicable periods shown.
D Total returns do not include the effect of the contingent deferred sales charge.
E Calculated based on average shares outstanding during the period.
F Fees and expenses of any underlying Fidelity Central Funds are not included in the Fund's expense ratio. The Fund indirectly bears its proportionate share of the expenses of any underlying Fidelity Central Funds.
G Amount does not include the portfolio activity of any underlying Fidelity Central Funds.
H For the period February 13, 2007 (commencement of sale of shares) to January 31, 2008.
I Expense ratios reflect operating expenses of the class. Expenses before reductions do not reflect amounts reimbursed by the investment adviser or reductions from brokerage service arrangements or reductions from other expense offset arrangements and do not represent the amount paid by the class during periods when reimbursements or reductions occur. Expense ratios before reductions for start-up periods may not be representative of longer-term operating periods. Expenses net of fee waivers reflect expenses after reimbursement by the investment adviser but prior to reductions from brokerage service arrangements or other expense offset arrangements. Expenses net of all reductions represent the net expenses paid by the class.
J Amount represents less than $.01 per share.
See accompanying notes which are an integral part of the financial statements.
Annual Report
Financial Highlights - Mid Cap Value
Years ended January 31, | 2012 | 2011 | 2010 | 2009 | 2008 |
Selected Per-Share Data |
|
|
|
|
|
Net asset value, beginning of period | $ 16.26 | $ 12.41 | $ 8.57 | $ 15.09 | $ 17.18 |
Income from Investment Operations |
|
|
|
|
|
Net investment income (loss) B | .12 | .04 | .09 | .13 | .08 |
Net realized and unrealized gain (loss) | (.30) | 3.87 | 3.86 | (6.49) | (1.34) |
Total from investment operations | (.18) | 3.91 | 3.95 | (6.36) | (1.26) |
Distributions from net investment income | (.11) | (.06) | (.11) | (.16) | (.06) |
Distributions from net realized gain | - | - | - | - F | (.77) |
Total distributions | (.11) | (.06) | (.11) | (.16) | (.83) |
Redemption fees added to paid in capital B, F | - | - | - | - | - |
Net asset value, end of period | $ 15.97 | $ 16.26 | $ 12.41 | $ 8.57 | $ 15.09 |
Total Return A | (1.04)% | 31.51% | 46.06% | (42.19)% | (7.67)% |
Ratios to Average Net Assets C, E |
|
|
|
|
|
Expenses before reductions | .88% | .91% | .95% | .85% | .83% |
Expenses net of fee waivers, if any | .88% | .91% | .95% | .84% | .82% |
Expenses net of all reductions | .87% | .90% | .94% | .84% | .82% |
Net investment income (loss) | .73% | .28% | .88% | .99% | .47% |
Supplemental Data |
|
|
|
|
|
Net assets, end of period (000 omitted) | $ 553,947 | $ 666,277 | $ 469,476 | $ 358,380 | $ 737,234 |
Portfolio turnover rate D | 173% | 133% | 202% | 268% | 264% |
A Total returns would have been lower if certain expenses had not been reduced during the applicable periods shown.
B Calculated based on average shares outstanding during the period.
C Fees and expenses of any underlying Fidelity Central Funds are not included in the Fund's expense ratio. The Fund indirectly bears its proportionate share of the expenses of any underlying Fidelity Central Funds.
D Amount does not include the portfolio activity of any underlying Fidelity Central Funds.
E Expense ratios reflect operating expenses of the class. Expenses before reductions do not reflect amounts reimbursed by the investment adviser or reductions from brokerage service arrangements or reductions from other expense offset arrangements and do not represent the amount paid by the class during periods when reimbursements or reductions occur. Expenses net of fee waivers reflect expenses after reimbursement by the investment adviser but prior to reductions from brokerage service arrangements or other expense offset arrangements. Expenses net of all reductions represent the net expenses paid by the class.
F Amount represents less than $.01 per share.
See accompanying notes which are an integral part of the financial statements.
Annual Report
Financial Highlights - Institutional Class
Years ended January 31, | 2012 | 2011 | 2010 | 2009 | 2008 G |
Selected Per-Share Data |
|
|
|
|
|
Net asset value, beginning of period | $ 16.20 | $ 12.36 | $ 8.54 | $ 15.06 | $ 17.63 |
Income from Investment Operations |
|
|
|
|
|
Net investment income (loss) D | .11 | .04 | .10 | .12 | .07 |
Net realized and unrealized gain (loss) | (.29) | 3.85 | 3.84 | (6.48) | (1.78) |
Total from investment operations | (.18) | 3.89 | 3.94 | (6.36) | (1.71) |
Distributions from net investment income | (.11) | (.05) | (.12) | (.16) | (.09) |
Distributions from net realized gain | - | - | - | - | (.77) |
Total distributions | (.11) | (.05) | (.12) | (.16) | (.86) |
Redemption fees added to paid in capital D, I | - | - | - | - | - |
Net asset value, end of period | $ 15.91 | $ 16.20 | $ 12.36 | $ 8.54 | $ 15.06 |
Total Return B, C | (1.07)% | 31.51% | 46.12% | (42.26)% | (10.06)% |
Ratios to Average Net Assets E, H |
|
|
|
|
|
Expenses before reductions | .91% | .92% | .96% | .87% | .89% A |
Expenses net of fee waivers, if any | .91% | .92% | .96% | .87% | .89% A |
Expenses net of all reductions | .90% | .92% | .95% | .87% | .88% A |
Net investment income (loss) | .71% | .27% | .87% | .96% | .41% A |
Supplemental Data |
|
|
|
|
|
Net assets, end of period (000 omitted) | $ 3,667 | $ 3,507 | $ 3,162 | $ 894 | $ 1,452 |
Portfolio turnover rate F | 173% | 133% | 202% | 268% | 264% |
A Annualized
B Total returns for periods of less than one year are not annualized.
C Total returns would have been lower if certain expenses had not been reduced during the applicable periods shown.
D Calculated based on average shares outstanding during the period.
E Fees and expenses of any underlying Fidelity Central Funds are not included in the Fund's expense ratio. The Fund indirectly bears its proportionate share of the expenses of any underlying Fidelity Central Funds.
F Amount does not include the portfolio activity of any underlying Fidelity Central Funds.
G For the period February 13, 2007 (commencement of sale of shares) to January 31, 2008.
H Expense ratios reflect operating expenses of the class. Expenses before reductions do not reflect amounts reimbursed by the investment adviser or reductions from brokerage service arrangements or reductions from other expense offset arrangements and do not represent the amount paid by the class during periods when reimbursements or reductions occur. Expense ratios before reductions for start-up periods may not be representative of longer-term operating periods. Expenses net of fee waivers reflect expenses after reimbursement by the investment adviser but prior to reductions from brokerage service arrangements or other expense offset arrangements. Expenses net of all reductions represent the net expenses paid by the class.
I Amount represents less than $.01 per share.
See accompanying notes which are an integral part of the financial statements.
Annual Report
Notes to Financial Statements
For the period ended January 31, 2012
1. Organization.
Fidelity Mid Cap Value Fund (the Fund) is a fund of Fidelity Devonshire Trust (the Trust) and is authorized to issue an unlimited number of shares. The Trust is registered under the Investment Company Act of 1940, as amended (the 1940 Act), as an open-end management investment company organized as a Massachusetts business trust. The Fund offers Class A, Class T, Class C, Mid Cap Value and Institutional Class shares, each of which, along with Class B shares, has equal rights as to assets and voting privileges. Effective after the close of business on September 1, 2010, Class B shares were closed to new accounts and additional purchases, except for exchanges and reinvestments. Each class has exclusive voting rights with respect to matters that affect that class. Class B shares will automatically convert to Class A shares after a holding period of seven years from the initial date of purchase. Investment income, realized and unrealized capital gains and losses, the common expenses of the Fund, and certain fund-level expense reductions, if any, are allocated on a pro-rata basis to each class based on the relative net assets of each class to the total net assets of the Fund. Each class differs with respect to transfer agent and distribution and service plan fees incurred. Certain expense reductions may also differ by class. The Fund's investments in emerging markets can be subject to social, economic, regulatory, and political uncertainties and can be extremely volatile.
2. Investments in Fidelity Central Funds.
The Fund invests in Fidelity Central Funds, which are open-end investment companies available only to other investment companies and accounts managed by Fidelity Management & Research Company (FMR) and its affiliates. The Fund's Schedule of Investments lists each of the Fidelity Central Funds held as of period end, if any, as an investment of the Fund, but does not include the underlying holdings of each Fidelity Central Fund. As an Investing Fund, the Fund indirectly bears its proportionate share of the expenses of the underlying Fidelity Central Funds.
The Money Market Central Funds seek preservation of capital and current income and are managed by Fidelity Investments Money Management, Inc. (FIMM), an affiliate of FMR.
A complete unaudited list of holdings for each Fidelity Central Fund is available upon request or at the Securities and Exchange Commission (the SEC) web site at www.sec.gov. In addition, the financial statements of the Fidelity Central Funds, which are not covered by the Fund's Report of Independent Registered Public Accounting Firm, are available on the SEC web site or upon request.
Annual Report
Notes to Financial Statements - continued
3. Significant Accounting Policies.
The financial statements have been prepared in conformity with accounting principles generally accepted in the United States of America (GAAP), which require management to make certain estimates and assumptions at the date of the financial statements. Actual results could differ from those estimates. Subsequent events, if any, through the date that the financial statements were issued have been evaluated in the preparation of the financial statements. The following summarizes the significant accounting policies of the Fund:
Security Valuation. Investments are valued as of 4:00 p.m. Eastern time on the last calendar day of the period. The Fund uses independent pricing services approved by the Board of Trustees to value its investments. When current market prices or quotations are not readily available or reliable, valuations may be determined in good faith in accordance with procedures adopted by the Board of Trustees. Factors used in determining value may include market or security specific events. The frequency with which these procedures are used cannot be predicted and they may be utilized to a significant extent. The value used for net asset value (NAV) calculation under these procedures may differ from published prices for the same securities.
The Fund categorizes the inputs to valuation techniques used to value its investments into a disclosure hierarchy consisting of three levels as shown below:
Level 1 - quoted prices in active markets for identical investments
Level 2 - other significant observable inputs (including quoted prices for similar investments, interest rates, prepayment speeds, etc.)
Level 3 - unobservable inputs (including the Fund's own assumptions based on the best information available)
Changes in valuation techniques may result in transfers in or out of an assigned level within the disclosure hierarchy. Valuation techniques used to value the Fund's investments by major category are as follows:
Equity securities, including restricted securities, for which market quotations are readily available, are valued at the last reported sale price or official closing price as reported by an independent pricing service on the primary market or exchange on which they are traded and are categorized as Level 1 in the hierarchy. In the event there were no sales during the day or closing prices are not available, securities are valued at the last quoted bid price or may be valued using the last available price and are generally categorized as Level 2 in the hierarchy. For foreign equity securities, when significant market or security specific events arise, comparisons to the valuation of American Depositary Receipts (ADRs), futures contracts, Exchange-traded funds (ETFs) and certain indexes as well as quoted prices for similar securities are used and are categorized as Level 2 in the
Annual Report
3. Significant Accounting Policies - continued
Security Valuation - continued
hierarchy in these circumstances. Utilizing these techniques may result in transfers between Level 1 and Level 2. For restricted equity securities and private placements where observable inputs are limited, assumptions about market activity and risk are used and are categorized as Level 3 in the hierarchy.
Investments in open-end mutual funds, including the Fidelity Central Funds, are valued at their closing net asset value each business day and are categorized as Level 1 in the hierarchy.
New Accounting Pronouncements. In May 2011, the Financial Accounting Standards Board issued Accounting Standard Update No. 2011-04, Fair Value Measurement (Topic 820) - Amendments to Achieve Common Fair Value Measurement and Disclosure Requirements in U.S. GAAP and IFRSs. The update is effective during interim and annual periods beginning after December 15, 2011 and will result in additional disclosure for transfers between levels as well as expanded disclosure for securities categorized as Level 3 under the fair value hierarchy.
In December 2011, the Financial Accounting Standards Board issued Accounting Standard Update No. 2011-11, Disclosures about Offsetting Assets and Liabilities. The update creates new disclosure requirements requiring entities to disclose both gross and net information for derivatives and other financial instruments that are either offset in the Statement of Assets and Liabilities or subject to an enforceable master netting arrangement or similar agreement. The disclosure requirements are effective for interim and annual reporting periods beginning on or after January 1, 2013. Management is currently evaluating the impact of the update's adoption on the Fund's financial statement disclosures.
Foreign Currency. The Fund may use foreign currency contracts to facilitate transactions in foreign-denominated securities. Gains and losses from these transactions may arise from changes in the value of the foreign currency or if the counterparties do not perform under the contracts' terms.
Foreign-denominated assets, including investment securities, and liabilities are translated into U.S. dollars at the exchange rate at period end. Purchases and sales of investment securities, income and dividends received and expenses denominated in foreign currencies are translated into U.S. dollars at the exchange rate in effect on the transaction date.
The effects of exchange rate fluctuations on investments are included with the net realized and unrealized gain (loss) on investment securities. Other foreign currency transactions resulting in realized and unrealized gain (loss) are disclosed separately.
Annual Report
Notes to Financial Statements - continued
3. Significant Accounting Policies - continued
Investment Transactions and Income. For financial reporting purposes, the Fund's investment holdings and NAV include trades executed through the end of the last business day of the period. The NAV per share for processing shareholder transactions is calculated as of the close of business of the New York Stock Exchange (NYSE), normally 4:00 p.m. Eastern time and includes trades executed through the end of the prior business day. Gains and losses on securities sold are determined on the basis of identified cost and may include proceeds received from litigation. Dividend income is recorded on the ex-dividend date, except for certain dividends from foreign securities where the ex-dividend date may have passed, which are recorded as soon as the Fund is informed of the ex-dividend date. Non-cash dividends included in dividend income, if any, are recorded at the fair market value of the securities received. Distributions received on securities that represent a return of capital or capital gain are recorded as a reduction of cost of investments and/or as a realized gain. The Fund estimates the components of distributions received that may be considered return of capital distributions or capital gain distributions. Interest income and distributions from the Fidelity Central Funds are accrued as earned. Interest income includes coupon interest and amortization of premium and accretion of discount on debt securities. Investment income is recorded net of foreign taxes withheld where recovery of such taxes is uncertain.
Expenses. Expenses directly attributable to a fund are charged to that fund. Expenses attributable to more than one fund are allocated among the respective funds on the basis of relative net assets or other appropriate methods. Expense estimates are accrued in the period to which they relate and adjustments are made when actual amounts are known.
Income Tax Information and Distributions to Shareholders. Each year, the Fund intends to qualify as a regulated investment company, including distributing substantially all of its taxable income and realized gains under Subchapter M of the Internal Revenue Code. As a result, no provision for income taxes is required. As of January 31, 2012, the Fund did not have any unrecognized tax benefits in the financial statements; nor is the Fund aware of any tax positions for which it is reasonably possible that the total amounts of unrecognized tax benefits will significantly change in the next twelve months. The Fund files a U.S. federal tax return, in addition to state and local tax returns as required. A fund's tax returns are subject to examination by the Internal Revenue Service (IRS) for a period of three fiscal years. State and local tax returns may be subject to examination for an additional fiscal year depending on the jurisdiction. Foreign taxes are provided for based on the Fund's understanding of the tax rules and rates that exist in the foreign markets in which it invests.
Distributions are declared and recorded on the ex-dividend date. Income dividends and capital gain distributions are declared separately for each class. Income and capital gain
Annual Report
3. Significant Accounting Policies - continued
Income Tax Information and Distributions to Shareholders - continued
distributions are determined in accordance with income tax regulations, which may differ from GAAP.
Capital accounts within the financial statements are adjusted for permanent book-tax differences. These adjustments have no impact on net assets or the results of operations. Temporary book-tax differences will reverse in a subsequent period.
Book-tax differences are primarily due to short-term gain distributions from underlying funds, capital loss carryforwards and losses deferred due to wash sales and excise tax regulations.
The federal tax cost of investment securities and unrealized appreciation (depreciation) as of period end were as follows:
Gross unrealized appreciation | $ 45,960,283 |
Gross unrealized depreciation | (26,978,462) |
Net unrealized appreciation (depreciation) on securities and other investments | $ 18,981,821 |
|
|
Tax Cost | $ 582,558,580 |
The tax-based components of distributable earnings as of period end were as follows:
Capital loss carryforward | $ (59,732,390) |
Net unrealized appreciation (depreciation) | $ 18,981,821 |
Capital loss carryforwards are only available to offset future capital gains of the Fund to the extent provided by regulations and may be limited. Under the Regulated Investment Company Modernization Act of 2010 (the Act), the Fund is permitted to carry forward capital losses incurred in taxable years beginning after December 22, 2010 for an unlimited period and such capital losses are required to be used prior to any losses that expire. Capital loss carryforwards were as follows:
Fiscal year of expiration |
|
2018 | $ (59,732,390) |
Annual Report
Notes to Financial Statements - continued
3. Significant Accounting Policies - continued
Income Tax Information and Distributions to Shareholders - continued
The tax character of distributions paid was as follows:
| January 31, 2012 | January 31, 2011 |
Ordinary Income | $ 4,101,848 | $ 2,444,386 |
Short-Term Trading (Redemption) Fees. Shares held by investors in the Fund less than 30 days are subject to a redemption fee equal to .75% of the net asset value of shares redeemed. All redemption fees, which reduce the proceeds of the shareholder redemption, are retained by the Fund and accounted for as an addition to paid in capital.
4. Purchases and Sales of Investments.
Purchases and sales of securities, other than short-term securities, aggregated $1,120,384,304 and $1,218,402,135, respectively.
5. Fees and Other Transactions with Affiliates.
Management Fee. FMR and its affiliates provide the Fund with investment management related services for which the Fund pays a monthly management fee. The management fee is the sum of an individual fund fee rate that is based on an annual rate of .30% of the Fund's average net assets and an annualized group fee rate that averaged .26% during the period. The group fee rate is based upon the average net assets of all the mutual funds advised by FMR. The group fee rate decreases as assets under management increase and increases as assets under management decrease. In addition, the management fee is subject to a performance adjustment (up to a maximum of ± .20% of the Fund's average net assets over a 36 month performance period). The upward or downward adjustment to the management fee is based on the relative investment performance of Mid Cap Value as compared to an appropriate benchmark index. For the period, the total annual management fee rate, including the performance adjustment, was .56% of the Fund's average net assets.
Distribution and Service Plan Fees. In accordance with Rule 12b-1 of the 1940 Act, the Fund has adopted separate Distribution and Service Plans for each class of shares. Certain classes pay Fidelity Distributors Corporation (FDC), an affiliate of FMR, separate Distribution and Service Fees, each of which is based on an annual percentage of each class' average net assets. In addition, FDC may pay financial intermediaries for
Annual Report
5. Fees and Other Transactions with Affiliates - continued
Distribution and Service Plan Fees - continued
selling shares of the Fund and providing shareholder support services. For the period, the Distribution and Service Fee rates, total fees and amounts retained by FDC were as follows:
| Distribution | Service | Total Fees | Retained |
Class A | -% | .25% | $ 52,557 | $ 2,177 |
Class T | .25% | .25% | 33,452 | 113 |
Class B | .75% | .25% | 15,346 | 11,519 |
Class C | .75% | .25% | 52,830 | 17,080 |
|
|
| $ 154,185 | $ 30,889 |
Sales Load. FDC may receive a front-end sales charge of up to 5.75% for selling Class A shares and 3.50% for selling Class T shares, some of which is paid to financial intermediaries for selling shares of the Fund. Depending on the holding period, FDC may receive contingent deferred sales charges levied on Class A, Class T, Class B, and Class C redemptions. The deferred sales charges range from 5.00% to 1.00% for Class B, 1.00% for Class C, 1.00% for certain purchases of Class A shares and .25% for certain purchases of Class T shares.
For the period, sales charge amounts retained by FDC were as follows:
| Retained |
Class A | $ 15,237 |
Class T | 2,801 |
Class B* | 2,003 |
Class C* | 1,050 |
| $ 21,091 |
* When Class B and Class C shares are initially sold, FDC pays commissions from its own resources to financial intermediaries through which the sales are made.
Transfer Agent Fees. Fidelity Investments Institutional Operations Company, Inc. (FIIOC), an affiliate of FMR, is the transfer, dividend disbursing and shareholder servicing agent for each class of the Fund. FIIOC receives account fees and asset-based fees that vary according to the account size and type of account of the shareholders of the respective classes of the Fund. FIIOC pays for typesetting, printing and mailing of
Annual Report
Notes to Financial Statements - continued
5. Fees and Other Transactions with Affiliates - continued
Transfer Agent Fees - continued
shareholder reports, except proxy statements. For the period, transfer agent fees for each class were as follows:
| Amount | % of |
Class A | $ 63,412 | .30 |
Class T | 20,886 | .31 |
Class B | 4,630 | .30 |
Class C | 15,912 | .30 |
Mid Cap Value | 1,579,493 | .26 |
Institutional Class | 9,740 | .29 |
| $ 1,694,073 |
|
Accounting and Security Lending Fees. Fidelity Service Company, Inc. (FSC), an affiliate of FMR, maintains the Fund's accounting records. The accounting fee is based on the level of average net assets for each month. Under a separate contract, FSC administers the security lending program. The security lending fee is based on the number and duration of lending transactions.
Brokerage Commissions. The Fund placed a portion of its portfolio transactions with brokerage firms which are affiliates of the investment adviser. The commissions paid to these affiliated firms were $23,204 for the period.
Interfund Lending Program. Pursuant to an Exemptive Order issued by the SEC, the Fund, along with other registered investment companies having management contracts with FMR, may participate in an interfund lending program. This program provides an alternative credit facility allowing the funds to borrow from, or lend money to, other participating affiliated funds. At period end, there were no interfund loans outstanding. The Fund's activity in this program during the period for which loans were outstanding was as follows:
Borrower or Lender | Average | Weighted Average | Interest |
Borrower | $ 11,023,000 | .35% | $ 529 |
6. Committed Line of Credit.
The Fund participates with other funds managed by FMR or an affiliate in a $4.0 billion credit facility (the "line of credit") to be utilized for temporary or emergency purposes to fund shareholder redemptions or for other short-term liquidity purposes. The Fund has agreed to pay commitment fees on its pro-rata portion of the line of credit, which
Annual Report
6. Committed Line of Credit - continued
amounted to $1,937 and is reflected in Miscellaneous expenses on the Statement of Operations. During the period, there were no borrowings on this line of credit.
7. Security Lending.
The Fund lends portfolio securities through a lending agent from time to time in order to earn additional income. For equity securities, a lending agent is used and may loan securities to certain qualified borrowers, including Fidelity Capital Markets (FCM), a broker-dealer affiliated with the Fund. On the settlement date of the loan, the Fund receives collateral (in the form of U.S. Treasury obligations, letters of credit and/or cash) against the loaned securities and maintains collateral in an amount not less than 100% of the market value of the loaned securities during the period of the loan. The market value of the loaned securities is determined at the close of business of the Fund and any additional required collateral is delivered to the Fund on the next business day. If the borrower defaults on its obligation to return the securities loaned because of insolvency or other reasons, a fund could experience delays and costs in recovering the securities loaned or in gaining access to the collateral. Any cash collateral received is invested in the Fidelity Securities Lending Cash Central Fund. The value of loaned securities and cash collateral at period end are disclosed on the Fund's Statement of Assets and Liabilities. Security lending income represents the income earned on investing cash collateral, less rebates paid to borrowers and any lending agent fees associated with the loan, plus any premium payments received for lending certain types of securities. Security lending income is presented in the Statement of Operations as a component of income from Fidelity Central Funds. Total security lending income during the period amounted to $26,327. During the period, there were no securities loaned to FCM.
8. Expense Reductions.
Many of the brokers with whom FMR places trades on behalf of the Fund provided services in addition to trade execution. These services included payments of certain expenses on behalf of the Fund totaling $65,968 for the period.
9. Distributions to Shareholders.
Distributions to shareholders of each class were as follows:
Years ended January 31, | 2012 | 2011 |
From net investment income |
|
|
Class A | $ 84,201 | $ 48,967 |
Class T | 17,628 | - |
Mid Cap Value | 3,978,985 | 2,383,138 |
Institutional Class | 21,034 | 12,281 |
Total | $ 4,101,848 | $ 2,444,386 |
Annual Report
Notes to Financial Statements - continued
10. Share Transactions.
Transactions for each class of shares were as follows:
| Shares | Dollars | ||
Years ended January 31, | 2012 | 2011 | 2012 | 2011 |
Class A |
|
|
|
|
Shares sold | 471,749 | 979,279 | $ 7,485,577 | $ 13,831,042 |
Reinvestment of distributions | 5,251 | 2,902 | 78,338 | 45,422 |
Shares redeemed | (704,307) | (383,036) | (11,261,227) | (5,416,268) |
Net increase (decrease) | (227,307) | 599,145 | $ (3,697,312) | $ 8,460,196 |
Class T |
|
|
|
|
Shares sold | 161,524 | 277,811 | $ 2,605,707 | $ 3,916,314 |
Reinvestment of distributions | 1,166 | - | 17,360 | - |
Shares redeemed | (165,147) | (169,622) | (2,621,038) | (2,442,521) |
Net increase (decrease) | (2,457) | 108,189 | $ 2,029 | $ 1,473,793 |
Class B |
|
|
|
|
Shares sold | 9,800 | 68,215 | $ 158,077 | $ 957,007 |
Shares redeemed | (33,963) | (50,071) | (529,991) | (730,358) |
Net increase (decrease) | (24,163) | 18,144 | $ (371,914) | $ 226,649 |
Class C |
|
|
|
|
Shares sold | 124,340 | 223,953 | $ 1,963,624 | $ 3,145,394 |
Shares redeemed | (137,041) | (78,488) | (2,028,206) | (1,108,959) |
Net increase (decrease) | (12,701) | 145,465 | $ (64,582) | $ 2,036,435 |
Mid Cap Value |
|
|
|
|
Shares sold | 7,442,595 | 14,676,423 | $ 120,167,268 | $ 210,466,358 |
Reinvestment of distributions | 256,561 | 146,967 | 3,848,420 | 2,313,260 |
Shares redeemed | (13,984,343) | (11,678,158) | (217,785,024) | (166,435,604) |
Net increase (decrease) | (6,285,187) | 3,145,232 | $ (93,769,336) | $ 46,344,014 |
Institutional Class |
|
|
|
|
Shares sold | 158,721 | 152,312 | $ 2,526,829 | $ 2,150,351 |
Reinvestment of distributions | 1,314 | 744 | 19,637 | 11,662 |
Shares redeemed | (146,013) | (192,350) | (2,215,747) | (2,796,561) |
Net increase (decrease) | 14,022 | (39,294) | $ 330,719 | $ (634,548) |
11. Other.
The Fund's organizational documents provide former and current trustees and officers with a limited indemnification against liabilities arising in connection with the performance of their duties to the Fund. In the normal course of business, the Fund may also enter into contracts that provide general indemnifications. The Fund's maximum exposure under these arrangements is unknown as this would be dependent on future claims that may be made against the Fund. The risk of material loss from such claims is considered remote.
Annual Report
Report of Independent Registered Public Accounting Firm
To the Trustees of Fidelity Devonshire Trust and the Shareholders of Fidelity Mid Cap Value Fund:
In our opinion, the accompanying statement of assets and liabilities, including the schedule of investments, and the related statements of operations and of changes in net assets and the financial highlights present fairly, in all material respects, the financial position of Fidelity Mid Cap Value Fund (a fund of Fidelity Devonshire Trust) at January 31, 2012, the results of its operations for the year then ended, the changes in its net assets for each of the two years in the period then ended and the financial highlights for each of the periods indicated, in conformity with accounting principles generally accepted in the United States of America. These financial statements and financial highlights (hereafter referred to as "financial statements") are the responsibility of the Fidelity Mid Cap Value Fund's management. Our responsibility is to express an opinion on these financial statements based on our audits. We conducted our audits of these financial statements in accordance with the standards of the Public Company Accounting Oversight Board (United States). Those standards require that we plan and perform the audit to obtain reasonable assurance about whether the financial statements are free of material misstatement. An audit includes examining, on a test basis, evidence supporting the amounts and disclosures in the financial statements, assessing the accounting principles used and significant estimates made by management, and evaluating the overall financial statement presentation. We believe that our audits, which included confirmation of securities at January 31, 2012 by correspondence with the custodian and brokers, provide a reasonable basis for our opinion.
/s/ PricewaterhouseCoopers LLP
PricewaterhouseCoopers LLP
Boston, Massachusetts
March 13, 2012
Annual Report
Trustees and Officers
The Trustees, Members of the Advisory Board, and executive officers of the trust and fund, as applicable, are listed below. The Board of Trustees governs the fund and is responsible for protecting the interests of shareholders. The Trustees are experienced executives who meet periodically throughout the year to oversee the fund's activities, review contractual arrangements with companies that provide services to the fund, oversee management of the risks associated with such activities and contractual arrangements, and review the fund's performance. Except for James C. Curvey, each of the Trustees oversees 226 funds advised by FMR or an affiliate. Mr. Curvey oversees 430 funds advised by FMR or an affiliate.
The Trustees hold office without limit in time except that (a) any Trustee may resign; (b) any Trustee may be removed by written instrument, signed by at least two-thirds of the number of Trustees prior to such removal; (c) any Trustee who requests to be retired or who has become incapacitated by illness or injury may be retired by written instrument signed by a majority of the other Trustees; and (d) any Trustee may be removed at any special meeting of shareholders by a two-thirds vote of the outstanding voting securities of the trust. Each Trustee who is not an interested person (as defined in the 1940 Act) (Independent Trustee), shall retire not later than the last day of the calendar year in which his or her 75th birthday occurs. The Independent Trustees may waive this mandatory retirement age policy with respect to individual Trustees. The executive officers and Advisory Board Members hold office without limit in time, except that any officer and Advisory Board Member may resign or may be removed by a vote of a majority of the Trustees at any regular meeting or any special meeting of the Trustees. Except as indicated, each individual has held the office shown or other offices in the same company for the past five years.
Experience, Skills, Attributes, and Qualifications of the Fund's Trustees. The Governance and Nominating Committee has adopted a statement of policy that describes the experience, qualifications, attributes, and skills that are necessary and desirable for potential Independent Trustee candidates (Statement of Policy). The Board believes that each Trustee satisfied at the time he or she was initially elected or appointed a Trustee, and continues to satisfy, the standards contemplated by the Statement of Policy. The Governance and Nominating Committee also engages professional search firms to help identify potential Independent Trustee candidates who have the experience, qualifications, attributes, and skills consistent with the Statement of Policy. From time to time, additional criteria based on the composition and skills of the current Independent Trustees, as well as experience or skills that may be appropriate in light of future changes to board composition, business conditions, and regulatory or other developments, have also been considered by the professional search firms and the Governance and Nominating Committee. In addition, the Board takes into account the Trustees' commitment and participation in Board and committee meetings, as well as their leadership of standing and ad hoc committees throughout their tenure.
In determining that a particular Trustee was and continues to be qualified to serve as a Trustee, the Board has considered a variety of criteria, none of which, in isolation, was controlling. The Board believes that, collectively, the Trustees have balanced and diverse experience, qualifications, attributes, and skills, which allow the Board to operate effectively in governing the fund and protecting the interests of shareholders. Information about the specific experience, skills, attributes, and qualifications of each Trustee, which in each case led to the Board's conclusion that the Trustee should serve (or continue to serve) as a trustee of the fund, is provided below.
Annual Report
Board Structure and Oversight Function. James C. Curvey is an interested person (as defined in the 1940 Act) and currently serves as Acting Chairman. The Trustees have determined that an interested Chairman is appropriate and benefits shareholders because an interested Chairman has a personal and professional stake in the quality and continuity of services provided to the fund. Independent Trustees exercise their informed business judgment to appoint an individual of their choosing to serve as Chairman, regardless of whether the Trustee happens to be independent or a member of management. The Independent Trustees have determined that they can act independently and effectively without having an Independent Trustee serve as Chairman and that a key structural component for assuring that they are in a position to do so is for the Independent Trustees to constitute a substantial majority for the Board. The Independent Trustees also regularly meet in executive session. Ned C. Lautenbach serves as Chairman of the Independent Trustees and as such (i) acts as a liaison between the Independent Trustees and management with respect to matters important to the Independent Trustees and (ii) with management prepares agendas for Board meetings.
Fidelity funds are overseen by different Boards of Trustees. The fund's Board oversees Fidelity's equity and high income funds and another Board oversees Fidelity's investment-grade bond, money market, and asset allocation funds. The asset allocation funds may invest in Fidelity funds overseen by the fund's Board. The use of separate Boards, each with its own committee structure, allows the Trustees of each group of Fidelity funds to focus on the unique issues of the funds they oversee, including common research, investment, and operational issues. On occasion, the separate Boards establish joint committees to address issues of overlapping consequences for the Fidelity funds overseen by each Board.
The Trustees operate using a system of committees to facilitate the timely and efficient consideration of all matters of importance to the Trustees, the fund, and fund shareholders and to facilitate compliance with legal and regulatory requirements and oversight of the fund's activities and associated risks. The Board, acting through its committees, has charged FMR and its affiliates with (i) identifying events or circumstances the occurrence of which could have demonstrably adverse effects on the fund's business and/or reputation; (ii) implementing processes and controls to lessen the possibility that such events or circumstances occur or to mitigate the effects of such events or circumstances if they do occur; and (iii) creating and maintaining a system designed to evaluate continuously business and market conditions in order to facilitate the identification and implementation processes described in (i) and (ii) above. Because the day-to-day operations and activities of the fund are carried out by or through FMR, its affiliates and other service providers, the fund's exposure to risks is mitigated but not eliminated by the processes overseen by the Trustees. While each of the Board's committees has responsibility for overseeing different aspects of the fund's activities, oversight is exercised primarily through the Operations, Audit, and Compliance Committees. In addition, the Independent Trustees have worked with FMR to enhance the Board's oversight of investment and financial risks, legal and regulatory risks, technology risks, and operational risks, including the development of additional risk reporting to the Board. For example, a working group comprised of Independent Trustees and FMR has worked and continues to work to review the Fidelity funds' valuation-related activities, reporting and risk management. Appropriate personnel, including but not limited to the fund's Chief Compliance Officer (CCO), FMR's internal auditor, the independent accountants, the fund's Treasurer and portfolio management personnel, make periodic reports to the Board's committees, as appropriate, including an annual review of FMR's risk management program for the Fidelity funds. The responsibilities of each standing committee, including their oversight responsibilities, are described further under "Standing Committees of the Fund's Trustees."
Annual Report
Trustees and Officers - continued
The fund's Statement of Additional Information (SAI) includes more information about the Trustees. To request a free copy, call Fidelity at 1-800-544-8544.
Interested Trustees*:
Correspondence intended for each Trustee who is an interested person may be sent to Fidelity Investments, 82 Devonshire Street, Boston, Massachusetts 02109.
Name, Age; Principal Occupations and Other Relevant Experience+ | |
James C. Curvey (76) | |
| Year of Election or Appointment: 2007 Mr. Curvey is Trustee and Acting Chairman of the Board of Trustees of certain Trusts. Mr. Curvey also serves as Trustee (2007-present) of other investment companies advised by FMR. Mr. Curvey is a Director of Fidelity Investments Money Management, Inc. (2009-present), Director of Fidelity Research & Analysis Co. (2009-present) and Director of FMR and FMR Co., Inc. (2007-present). Mr. Curvey is also Vice Chairman (2007-present) and Director of FMR LLC. In addition, Mr. Curvey serves as an Overseer for the Boston Symphony Orchestra and a member of the Trustees of Villanova University. Previously, Mr. Curvey was the Vice Chairman (2006-2007) and Director (2000-2007) of FMR Corp. |
Ronald P. O'Hanley (54) | |
| Year of Election or Appointment: 2011 Mr. O'Hanley is Director of FMR Co., Inc. (2010-present), Director of Fidelity Investments Money Management, Inc. (2010-present), Director of Fidelity Research & Analysis Company (2010-present), President of Fidelity Asset Management and Corporate Services and a member of Fidelity's Executive Committee (2010-present). Previously, Mr. O'Hanley served as President and Chief Executive Officer of BNY Mellon Asset Management (2007-2010). Mr. O'Hanley also served as Vice Chairman of Bank New York Mellon Corp. and a member of that firm's Executive Committee. Prior to the 2007 merger of The Bank of New York and Mellon Financial Corporation, he was Vice Chairman of Mellon Financial Corporation and President and Chief Executive Officer of Mellon Asset Management. He joined Mellon in February 1997. Mr. O'Hanley currently serves as Chairman of the Boston Public Library Foundation Board of Directors and sits on the Board of Directors of Beth Israel Deaconess Medical Center, the Board of Trustees of the Marine Biological Laboratory and the Advisory Board of the Maxwell School of Citizenship and Public Administration at Syracuse University. Mr. O'Hanley also chairs the Council on Asset Management for the Financial Services Roundtable and is a member of the Board of Directors of Institutional Investor's U.S. Institute. |
* Trustees have been determined to be "Interested Trustees" by virtue of, among other things, their affiliation with the trust or various entities under common control with FMR.
+ The information above includes each Trustee's principal occupation during the last five years and other information relating to the experience, attributes, and skills relevant to each Trustee's qualifications to serve as a Trustee, which led to the conclusion that each Trustee should serve as a Trustee for the fund.
Annual Report
Trustees and Officers - continued
Independent Trustees:
Correspondence intended for each Independent Trustee (that is, the Trustees other than the Interested Trustees) may be sent to Fidelity Investments, P.O. Box 55235, Boston, Massachusetts 02205-5235.
Name, Age; Principal Occupations and Other Relevant Experience+ | |
Dennis J. Dirks (63) | |
| Year of Election or Appointment: 2005 Prior to his retirement in May 2003, Mr. Dirks was Chief Operating Officer and a member of the Board of The Depository Trust & Clearing Corporation (DTCC). He also served as President, Chief Operating Officer, and Board member of The Depository Trust Company (DTC) and President and Board member of the National Securities Clearing Corporation (NSCC). In addition, Mr. Dirks served as Chief Executive Officer and Board member of the Government Securities Clearing Corporation, Chief Executive Officer and Board member of the Mortgage-Backed Securities Clearing Corporation, as a Trustee and a member of the Finance Committee of Manhattan College (2005-2008), and as a Trustee and a member of the Finance Committee of AHRC of Nassau County (2006-2008). Mr. Dirks is a member of the Independent Directors Council (IDC) Governing Council (2010-present) and Board of Directors for The Brookville Center for Children's Services, Inc. (2009-present). |
Alan J. Lacy (58) | |
| Year of Election or Appointment: 2008 Mr. Lacy serves as Senior Adviser (2007-present) of Oak Hill Capital Partners, L.P. (private equity). Mr. Lacy also served as Chief Executive Officer (2000-2005) and Vice Chairman (2005-2006) of Sears Holdings Corporation and Sears, Roebuck and Co. (retail). In addition, Mr. Lacy serves as a member of the Board of Directors of Dave & Buster's, Inc. (restaurant and entertainment complexes, 2010-present), The Hillman Companies, Inc. (hardware wholesalers, 2010-present), and Bristol-Myers Squibb Company (global pharmaceuticals, 2007-present). Mr. Lacy is a member of the Board of Trustees of The National Parks Conservation Association (2006-present). Previously, Mr. Lacy served as Chairman of the Board of Trustees of the National Parks Conservation Association (2008-2011) and as a member of the Board of Directors for the Western Union Company (global money transfer, 2006-2011). |
Ned C. Lautenbach (67) | |
| Year of Election or Appointment: 2000 Mr. Lautenbach is Chairman of the Independent Trustees of the Equity and High Income Funds (2006-present). Mr. Lautenbach currently serves as the Lead Director of the Eaton Corporation Board of Directors (diversified industrial, 1997-present). Mr. Lautenbach is also a member of the Board of Directors of the Philharmonic Center for the Arts in Naples, Florida (1999-present); a member of the Board of Trustees of Fairfield University (2005-present); and a member of the Council on Foreign Relations (1994-present). Previously, Mr. Lautenbach was a Partner/Advisory Partner at Clayton, Dubilier & Rice, LLC (private equity investment, 1998-2010), as well as a Director of Sony Corporation (2006-2007). |
Joseph Mauriello (67) | |
| Year of Election or Appointment: 2008 Prior to his retirement in January 2006, Mr. Mauriello served in numerous senior management positions including Deputy Chairman and Chief Operating Officer (2004-2005), and Vice Chairman of Financial Services (2002-2004) of KPMG LLP US (professional services, 1965-2005). Mr. Mauriello currently serves as a member of the Board of Directors of XL Group plc. (global insurance and re-insurance, 2006-present) and of Arcadia Resources Inc. (health care services and products, 2007-present). Previously, Mr. Mauriello served as a Director of the Hamilton Funds of the Bank of New York (2006-2007). |
Robert W. Selander (61) | |
| Year of Election or Appointment: 2011 Previously, Mr. Selander served as a Member of the Advisory Board of Fidelity's Equity and High Income Funds (2011), Executive Vice Chairman (2010), Chief Executive Officer (2009-2010), and President and Chief Executive Officer (1997-2009) of Mastercard, Inc. |
Cornelia M. Small (67) | |
| Year of Election or Appointment: 2005 Ms. Small is a member of the Board of Directors of the Teagle Foundation (2009-present). Ms. Small is also a member of the Investment Committee, and Chair (2008-present) and a member of the Board of Trustees of Smith College. In addition, Ms. Small serves on the Investment Committee of the Berkshire Taconic Community Foundation (2008-present). Previously, Ms. Small served as Chairperson of the Investment Committee (2002-2008) of Smith College. In addition, Ms. Small served as Chief Investment Officer, Director of Global Equity Investments, and a member of the Board of Directors of Scudder, Stevens & Clark and Scudder Kemper Investments. |
William S. Stavropoulos (72) | |
| Year of Election or Appointment: 2002 Mr. Stavropoulos is Vice Chairman of the Independent Trustees of the Equity and High Income Funds (2006-present). Mr. Stavropoulos serves as President and Founder of the Michigan Baseball Foundation, the Great Lakes Loons (2007-present). Mr. Stavropoulos is Chairman Emeritus of the Board of Directors of The Dow Chemical Company, where he previously served in numerous senior management positions, including President, CEO (1995-2000; 2002-2004), Chairman of the Executive Committee (2000-2006), and as a member of the Board of Directors (1990-2006). Currently, Mr. Stavropoulos is Chairman of Univar (global distributor of commodity and specialty chemicals, 2010-present), a Director of Teradata Corporation (data warehousing and technology solutions, 2008-present), Chemical Financial Corporation, Maersk Inc. (industrial conglomerate), Tyco International, Inc. (multinational manufacturing and services, 2007-present), and a member of the Advisory Board for Metalmark Capital (private equity investment, 2005-present). Mr. Stavropoulos is a special advisor to Clayton, Dubilier & Rice, LLC (private equity investment). In addition, Mr. Stavropoulos is a member of the University of Notre Dame Advisory Council for the College of Science. |
David M. Thomas (62) | |
| Year of Election or Appointment: 2008 Previously, Mr. Thomas served as Executive Chairman (2005-2006) and Chairman and Chief Executive Officer (2000-2005) of IMS Health, Inc. (pharmaceutical and healthcare information solutions). In addition, Mr. Thomas serves as a member of the Board of Directors of Fortune Brands, Inc. (consumer products), and Interpublic Group of Companies, Inc. (marketing communication, 2004-present). |
Michael E. Wiley (61) | |
| Year of Election or Appointment: 2008 Mr. Wiley also serves as a Director of Asia Pacific Exploration Consolidated (international oil and gas exploration and production, 2008-present). Mr. Wiley serves as a Director of Tesoro Corporation (independent oil refiner and marketer, 2005-present), and a Director of Bill Barrett Corporation (exploration and production, 2005-present). In addition, Mr. Wiley also serves as a Director of Post Oak Bank (privately-held bank, 2004-present). Previously, Mr. Wiley served as a member of the Board of Trustees of the University of Tulsa (2000-2006; 2007-2010), as a Senior Energy Advisor of Katzenbach Partners, LLC (consulting, 2006-2007), as an Advisory Director of Riverstone Holdings (private investment), Chairman, President, and CEO of Baker Hughes, Inc. (oilfield services, 2000-2004), and as Director of Spinnaker Exploration Company (exploration and production, 2001-2005). |
Annual Report
+ The information above includes each Trustee's principal occupation during the last five years and other information relating to the experience, attributes, and skills relevant to each Trustee's qualifications to serve as a Trustee, which led to the conclusion that each Trustee should serve as a Trustee for the fund.
Advisory Board Members and Executive Officers:
Correspondence intended for each executive officer, Edward C. Johnson 3d, and Peter S. Lynch may be sent to Fidelity Investments, 82 Devonshire Street, Boston, Massachusetts 02109.
Name, Age; Principal Occupation | |
Edward C. Johnson 3d (81) | |
| Year of Election or Appointment: 2011 Member of the Advisory Board of Fidelity's Equity and High Income Funds. Mr. Johnson serves as Chief Executive Officer, Chairman, and a Director of FMR LLC, and also serves as Chairman and Director of FIL Limited. Previously, Mr. Johnson served as a Trustee and Chairman of the Board of certain Fidelity Trusts, Chairman and a Director of FMR, Chairman and a Director of FMR Co., Inc., and President of FMR LLC (2006-2007). |
Peter S. Lynch (68) | |
| Year of Election or Appointment: 2003 Member of the Advisory Board of Fidelity's Equity and High Income Funds. Mr. Lynch is Vice Chairman and a Director of FMR and FMR Co., Inc. In addition, Mr. Lynch serves as a Trustee of Boston College and as the Chairman of the Inner-City Scholarship Fund. Previously, Mr. Lynch served on the Special Olympics International Board of Directors (1997-2006). |
Kenneth B. Robins (42) | |
| Year of Election or Appointment: 2008 President and Treasurer of Fidelity's Equity and High Income Funds. Mr. Robins also serves as President and Treasurer (2010-present) and Assistant Treasurer (2009-present) of other Fidelity funds and is an employee of Fidelity Investments (2004-present). Previously, Mr. Robins served as Deputy Treasurer of the Fidelity funds (2005-2008) and Treasurer and Chief Financial Officer of The North Carolina Capital Management Trust: Cash and Term Portfolios (2006-2008). |
Brian B. Hogan (47) | |
| Year of Election or Appointment: 2009 Vice President of Equity and High Income Funds. Mr. Hogan also serves as President of FMR's Equity Division (2009-present). Previously, Mr. Hogan served as Senior Vice President, Equity Research of FMR (2006-2009) and as a portfolio manager. |
Thomas C. Hense (48) | |
| Year of Election or Appointment: 2008 or 2010 Vice President of Fidelity's High Income (2008), Small Cap (2008), and Value (2010) Funds. Previously, Mr. Hense served as a portfolio manager for Fidelity's Institutional Money Management Group (Pyramis) (2003-2008). |
Scott C. Goebel (44) | |
| Year of Election or Appointment: 2008 Secretary and Chief Legal Officer (CLO) of the Fidelity funds. Mr. Goebel also serves as Secretary of Fidelity Investments Money Management, Inc. (FIMM) (2010-present) and Fidelity Research and Analysis Company (FRAC) (2010-present); Secretary and CLO of The North Carolina Capital Management Trust: Cash and Term Portfolios (2008-present); General Counsel, Secretary, and Senior Vice President of FMR (2008-present) and FMR Co., Inc. (2008-present); employed by FMR LLC or an affiliate (2001-present); Chief Legal Officer of Fidelity Management & Research (Hong Kong) Limited (2008-present) and Assistant Secretary of Fidelity Management & Research (Japan) Inc. (2008-present), and Fidelity Management & Research (U.K.) Inc. (2008-present). Previously, Mr. Goebel served as Assistant Secretary of FIMM (2008-2010), FRAC (2008-2010), and the Funds (2007-2008) and as Vice President and Secretary of Fidelity Distributors Corporation (FDC) (2005-2007). |
William C. Coffey (42) | |
| Year of Election or Appointment: 2009 Assistant Secretary of Fidelity's Equity and High Income Funds. Mr. Coffey also serves as Senior Vice President and Deputy General Counsel of FMR LLC (2010-present), and is an employee of Fidelity Investments. Previously, Mr. Coffey served as Vice President and Associate General Counsel of FMR LLC (2005-2009). |
Holly C. Laurent (57) | |
| Year of Election or Appointment: 2008 Anti-Money Laundering (AML) Officer of the Fidelity funds. Ms. Laurent also serves as AML Officer of The North Carolina Capital Management Trust: Cash and Term Portfolios (2008-present) and is an employee of Fidelity Investments. Previously, Ms. Laurent was Senior Vice President and Head of Legal for Fidelity Business Services India Pvt. Ltd. (2006-2008), and Senior Vice President, Deputy General Counsel and Group Head for FMR LLC (2005-2006). |
Christine Reynolds (53) | |
| Year of Election or Appointment: 2008 Chief Financial Officer of the Fidelity funds. Ms. Reynolds became President of Fidelity Pricing and Cash Management Services (FPCMS) in August 2008. Ms. Reynolds served as Chief Operating Officer of FPCMS (2007-2008). Previously, Ms. Reynolds served as President, Treasurer, and Anti-Money Laundering officer of the Fidelity funds (2004-2007). |
Kenneth A. Rathgeber (64) | |
| Year of Election or Appointment: 2004 Chief Compliance Officer of Fidelity's Equity and High Income Funds. Mr. Rathgeber is Chief Compliance Officer of Fidelity Management & Research (Hong Kong) Limited (2008-present), Fidelity Management & Research (Japan) Inc. (2008-present), FMR (2005-present), FMR Co., Inc. (2005-present), Fidelity Management & Research (U.K.) Inc. (2005-present), Fidelity Research & Analysis Company (2005-present), Fidelity Investments Money Management, Inc. (2005-present), Pyramis Global Advisors, LLC (2005-present), and Strategic Advisers, Inc. (2005-present). |
Joseph F. Zambello (54) | |
| Year of Election or Appointment: 2011 Deputy Treasurer of the Fidelity funds. Mr. Zambello is an employee of Fidelity Investments. Previously, Mr. Zambello served as Vice President of FMR's Program Management Group (2009-2011) and Vice President of the Transfer Agent Oversight Group (2005-2009). |
Adrien E. Deberghes (44) | |
| Year of Election or Appointment: 2008 Deputy Treasurer of Fidelity's Equity and High Income Funds. Mr. Deberghes also serves as Vice President and Assistant Treasurer of Fidelity Rutland Square Trust II and Fidelity Commonwealth Trust II (2011-present), Assistant Treasurer of other Fidelity funds (2010-present), and is an employee of Fidelity Investments (2008-present). Previously, Mr. Deberghes served as Senior Vice President of Mutual Fund Administration at State Street Corporation (2007-2008), Senior Director of Mutual Fund Administration at Investors Bank & Trust (2005-2007), and Director of Finance for Dunkin' Brands (2000-2005). |
Stephanie J. Dorsey (42) | |
| Year of Election or Appointment: 2010 Assistant Treasurer of Fidelity's Equity and High Income Funds. Ms. Dorsey also serves as Deputy Treasurer of other Fidelity funds (2008-present) and is an employee of Fidelity Investments (2008-present). Previously, Ms. Dorsey served as Treasurer (2004-2008) of the JPMorgan Mutual Funds and Vice President (2004-2008) of JPMorgan Chase Bank. |
John R. Hebble (53) | |
| Year of Election or Appointment: 2009 Assistant Treasurer of Fidelity's Equity and High Income Funds. Mr. Hebble also serves as President (2011-present), Treasurer, and Chief Financial Officer of The North Carolina Capital Management Trust: Cash and Term Portfolios (2008-present), President and Treasurer of other Fidelity funds (2008-present) and is an employee of Fidelity Investments. |
Gary W. Ryan (53) | |
| Year of Election or Appointment: 2005 Assistant Treasurer of the Fidelity funds. Mr. Ryan is an employee of Fidelity Investments. Previously, Mr. Ryan served as Vice President of Fund Reporting in Fidelity Pricing and Cash Management Services (FPCMS) (1999-2005). |
Jonathan Davis (43) | |
| Year of Election or Appointment: 2010 Assistant Treasurer of the Fidelity funds. Mr. Davis is also Assistant Treasurer of Fidelity Rutland Square Trust II and Fidelity Commonwealth Trust II. Mr. Davis is an employee of Fidelity Investments. Previously, Mr. Davis served as Vice President and Associate General Counsel of FMR LLC (2003-2010). |
Annual Report
Distributions (Unaudited)
Mid Cap Value designates 100% of the dividends distributed during the fiscal year as qualifying for the dividends-received deduction for corporate shareholders.
Mid Cap Value designates 100% of the dividends distributed during the fiscal year as amounts which may be taken into account as a dividend for purposes of the maximum rate under section 1(h)(11) of the Internal Revenue Code.
The fund will notify shareholders in January 2013 of amounts for use in preparing 2012 income tax returns.
Annual Report
Managing Your Investments
Fidelity offers several ways to conveniently manage your personal investments via your telephone or PC. You can access your account information, conduct trades and research your investments 24 hours a day.
By Phone
Fidelity Automated Service Telephone provides a single toll-free number to access account balances, positions, quotes and trading. It's easy to navigate the service, and on your first call, the system will help you create a personal identification number (PIN) for security.
(phone graphic)Fidelity Automated
Service Telephone (FAST®)
1-800-544-5555
Press
1 For mutual fund and brokerage trading.
2 For quotes.*
3 For account balances and holdings.
4 To review orders and mutual
fund activity.
5 To change your PIN.
*0 To speak to a Fidelity representative.
By PC
Fidelity's web site on the Internet provides a wide range of information, including daily financial news, fund performance, interactive planning tools and news about Fidelity products and services.
(computer graphic)Fidelity's Web Site
www.fidelity.com
* When you call the quotes line, please remember that a fund's yield and return will vary and, except for money market funds, share price will also vary. This means that you may have a gain or loss when you sell your shares. There is no assurance that money market funds will be able to maintain a stable $1 share price; an investment in a money market fund is not insured or guaranteed by the U.S. government. Total returns are historical and include changes in share price, reinvestment of dividends and capital gains distributions, and the effects of any sales charges.
Annual Report
To Write Fidelity
We'll give your correspondence immediate attention and send you written confirmation upon completion of your request.
(envelope graphic)Making Changes
To Your Account
(such as changing name, address, bank, etc.)
Fidelity Investments
P.O. Box 770001
Cincinnati, OH 45277-0002
(envelope graphic)For Non-Retirement
Accounts
Buying shares
Fidelity Investments
P.O. Box 770001
Cincinnati, OH 45277-0003
Overnight Express
Fidelity Investments
Attn: Distribution Services
100 Crosby Parkway - KC1H
Covington, KY 41015
Selling shares
Fidelity Investments
P.O. Box 770001
Cincinnati, OH 45277-0035
Overnight Express
Fidelity Investments
Attn: Distribution Services
100 Crosby Parkway - KC1H
Covington, KY 41015
General Correspondence
Fidelity Investments
P.O. Box 500
Merrimack, NH 03054-0500
(envelope graphic)For Retirement
Accounts
Buying shares
Fidelity Investments
P.O. Box 770001
Cincinnati, OH 45277-0003
Selling shares
Fidelity Investments
P.O. Box 770001
Cincinnati, OH 45277-0035
Overnight Express
Fidelity Investments
Attn: Distribution Services
100 Crosby Parkway - KC1H
Covington, KY 41015
General Correspondence
Fidelity Investments
P.O. Box 500
Merrimack, NH 03054-0500
Annual Report
To Visit Fidelity
For directions and hours,
please call 1-800-544-9797.
Arizona
7001 West Ray Road
Chandler, AZ
15445 N. Scottsdale Road
Scottsdale, AZ
17550 North 75th Avenue
Glendale, AZ
5330 E. Broadway Blvd
Tucson, AZ
California
815 East Birch Street
Brea, CA
1411 Chapin Avenue
Burlingame, CA
851 East Hamilton Avenue
Campbell, CA
601 Larkspur Landing Circle
Larkspur, CA
2000 Avenue of the Stars
Los Angeles, CA
27101 Puerta Real
Mission Viejo, CA
73575 El Paseo
Palm Desert, CA
251 University Avenue
Palo Alto, CA
123 South Lake Avenue
Pasadena, CA
16656 Bernardo Ctr. Drive
Rancho Bernardo, CA
1220 Roseville Parkway
Roseville, CA
1740 Arden Way
Sacramento, CA
7676 Hazard Center Drive
San Diego, CA
11943 El Camino Real
San Diego, CA
8 Montgomery Street
San Francisco, CA
3793 State Street
Santa Barbara, CA
1200 Wilshire Boulevard
Santa Monica, CA
398 West El Camino Real
Sunnyvale, CA
111 South Westlake Blvd
Thousand Oaks, CA
21701 Hawthorne Boulevard
Torrance, CA
2001 North Main Street
Walnut Creek, CA
6326 Canoga Avenue
Woodland Hills, CA
2211 Michelson Drive
Irvine, CA
Colorado
281 East Flatiron Circle
Broomfield, CO
1625 Broadway
Denver, CO
9185 Westview Road
Lone Tree, CO
Connecticut
48 West Putnam Avenue
Greenwich, CT
265 Church Street
New Haven, CT
300 Atlantic Street
Stamford, CT
29 South Main Street
West Hartford, CT
1261 Post Road
Fairfield, CT
Delaware
400 Delaware Avenue
Wilmington, DE
Florida
175 East Altamonte Drive
Altamonte Springs, FL
1400 Glades Road
Boca Raton, FL
121 Alhambra Plaza
Coral Gables, FL
2948 N. Federal Highway
Ft. Lauderdale, FL
4671 Town Center Parkway
Jacksonville, FL
8880 Tamiami Trail, North
Naples, FL
230 Royal Palm Way
Palm Beach, FL
3501 PGA Boulevard
Palm Beach Gardens, FL
3550 Tamiami Trail, South
Sarasota, FL
1502 N. Westshore Blvd.
Tampa, FL
2465 State Road 7
Wellington, FL
Georgia
3242 Peachtree Road
Atlanta, GA
1000 Abernathy Road
Atlanta, GA
Illinois
One North LaSalle Street
Chicago, IL
401 North Michigan Avenue
Chicago, IL
One Skokie Valley Road
Highland Park, IL
1415 West 22nd Street
Oak Brook, IL
15105 S LaGrange Road
Orland Park, IL
1572 East Golf Road
Schaumburg, IL
1823 Freedom Drive
Naperville, IL
Indiana
8480 Keystone Crossing
Indianapolis, IN
Kansas
5400 College Boulevard
Overland Park, KS
Maine
Three Canal Plaza
Portland, ME
Maryland
7315 Wisconsin Avenue
Bethesda, MD
610 York Road
Towson, MD
Massachusetts
801 Boylston Street
Boston, MA
155 Congress Street
Boston, MA
300 Granite Street
Braintree, MA
44 Mall Road
Burlington, MA
238 Main Street
Cambridge, MA
200 Endicott Street
Danvers, MA
Annual Report
405 Cochituate Road
Framingham, MA
551 Boston Turnpike
Shrewsbury, MA
Michigan
500 E. Eisenhower Pkwy.
Ann Arbor, MI
280 N. Old Woodward Ave.
Birmingham, MI
30200 Northwestern Hwy.
Farmington Hills, MI
43420 Grand River Avenue
Novi, MI
3480 28th Street
Grand Rapids, MI
2425 S. Linden Road STE E
Flint, MI
Minnesota
7740 France Avenue South
Edina, MN
8342 3rd Street North
Oakdale, MN
Missouri
1524 South Lindbergh Blvd.
St. Louis, MO
Nevada
2225 Village Walk Drive
Henderson, NV
New Jersey
501 Route 73 South
Marlton, NJ
150 Essex Street
Millburn, NJ
35 Morris Street
Morristown, NJ
396 Route 17, North
Paramus, NJ
3518 Route 1 North
Princeton, NJ
530 Broad Street
Shrewsbury, NJ
New Mexico
2261 Q Street NE
Albuquerque, NM
New York
1130 Franklin Avenue
Garden City, NY
37 West Jericho Turnpike
Huntington Station, NY
1271 Avenue of the Americas
New York, NY
980 Madison Avenue
New York, NY
61 Broadway
New York, NY
350 Park Avenue
New York, NY
200 Fifth Avenue
New York, NY
733 Third Avenue
New York, NY
2070 Broadway
New York, NY
1075 Northern Blvd.
Roslyn, NY
799 Central Park Avenue
Scarsdale, NY
3349 Monroe Avenue
Rochester, NY
North Carolina
4611 Sharon Road
Charlotte, NC
7011 Fayetteville Road
Durham, NC
Ohio
3805 Edwards Road
Cincinnati, OH
1324 Polaris Parkway
Columbus, OH
1800 Crocker Road
Westlake, OH
28699 Chagrin Boulevard
Woodmere Village, OH
Oregon
7493 SW Bridgeport Road
Tigard, OR
Pennsylvania
600 West DeKalb Pike
King of Prussia, PA
1735 Market Street
Philadelphia, PA
12001 Perry Highway
Wexford, PA
Rhode Island
10 Memorial Boulevard
Providence, RI
Tennessee
3018 Peoples Street
Johnson City, TN
7628 West Farmington Blvd.
Germantown, TN
2035 Mallory Lane
Franklin, TN
Texas
10000 Research Boulevard
Austin, TX
4001 Northwest Parkway
Dallas, TX
12532 Memorial Drive
Houston, TX
2701 Drexel Drive
Houston, TX
6560 Fannin Street
Houston, TX
1701 Lake Robbins Drive
The Woodlands, TX
6500 N. MacArthur Blvd.
Irving, TX
6005 West Park Boulevard
Plano, TX
1576 East Southlake Blvd.
Southlake, TX
15600 Southwest Freeway
Sugar Land, TX
139 N. Loop 1604 East
San Antonio, TX
Utah
279 West South Temple
Salt Lake City, UT
Virginia
1861 International Drive
McLean, VA
11957 Democracy Drive
Reston, VA
Washington
10500 NE 8th Street
Bellevue, WA
1518 6th Avenue
Seattle, WA
304 Strander Blvd
Tukwila, WA
Washington, DC
1900 K Street, N.W.
Washington, DC
Wisconsin
16020 West Bluemound Road
Brookfield, WI
Fidelity Brokerage Services, Inc., 100 Summer St., Boston, MA 02110 Member NYSE/SIPC
Annual Report
Investment Adviser
Fidelity Management & Research Company
Boston, MA
Investment Sub-Advisers
FMR Co., Inc.
Fidelity Management & Research
(U.K.) Inc.
Fidelity Management & Research
(Hong Kong) Limited
Fidelity Management & Research
(Japan) Inc.
General Distributor
Fidelity Distributors Corporation
Boston, MA
Transfer and Service Agents
Fidelity Investments Institutional
Operations Company, Inc.
Boston, MA
Fidelity Service Company, Inc.
Boston, MA
Custodian
Citibank, N.A.
New York, NY
The Fidelity Telephone Connection
Mutual Fund 24-Hour Service
Exchanges/Redemptions
and Account Assistance 1-800-544-6666
Product Information 1-800-544-6666
Retirement Accounts 1-800-544-4774
(8 a.m. - 9 p.m.)
TDD Service 1-800-544-0118
for the deaf and hearing impaired
(9 a.m. - 9 p.m. Eastern time)
Fidelity Automated Service
Telephone (FAST®)
1-800-544-5555
Automated line for quickest service
(Fidelity Investment logo)(registered trademark)
Corporate Headquarters
82 Devonshire St., Boston, MA 02109
www.fidelity.com
MCV-UANN-0312
1.900179.102
(Fidelity Investment logo)(registered trademark)
Fidelity
Mid Cap Value
Fund - Class A, Class T, Class B
and Class C
Annual Report
January 31, 2012
(Fidelity Cover Art)
Class A, Class T, Class B, and Class C are classes of Fidelity®
Mid Cap Value Fund
Contents
Chairman's Message | The Chairman's message to shareholders. | |
Performance | How the fund has done over time. | |
Management's Discussion of Fund Performance | The Portfolio Manager's review of fund performance and strategy. | |
Shareholder Expense Example | An example of shareholder expenses. | |
Investment Changes | A summary of major shifts in the fund's investments over the past six months. | |
Investments | A complete list of the fund's investments with their market values. | |
Financial Statements | Statements of assets and liabilities, operations, and changes in net assets, as well as financial highlights. | |
Notes | Notes to the financial statements. | |
Report of Independent Registered Public Accounting Firm |
| |
Trustees and Officers |
| |
Distributions |
|
To view a fund's proxy voting guidelines and proxy voting record for the 12-month period ended June 30, visit http://www.fidelity.com/proxyvotingresults or visit the Securities and Exchange Commission's (SEC) web site at http://www.sec.gov. You may also call 1-877-208-0098 to request a free copy of the proxy voting guidelines.
Standard & Poor's, S&P and S&P 500 are registered service marks of The McGraw-Hill Companies, Inc. and have been licensed for use by Fidelity Distributors Corporation.
Other third party marks appearing herein are the property of their respective owners.
All other marks appearing herein are registered or unregistered trademarks or service marks of FMR LLC or an affiliated company.
Annual Report
This report and the financial statements contained herein are submitted for the general information of the shareholders of the fund. This report is not authorized for distribution to prospective investors in the fund unless preceded or accompanied by an effective prospectus.
A fund files its complete schedule of portfolio holdings with the SEC for the first and third quarters of each fiscal year on Form N-Q. Forms N-Q are available on the SEC's web site at http://www.sec.gov. A fund's Forms N-Q may be reviewed and copied at the SEC's Public Reference Room in Washington, DC. Information regarding the operation of the SEC's Public Reference Room may be obtained by calling 1-800-SEC-0330. For a complete list of a fund's portfolio holdings, view the most recent holdings listing, semiannual report, or annual report on Fidelity's web site at http://www.fidelity.com, http://www.advisor.fidelity.com, or http://www.401k.com, as applicable.
NOT FDIC INSURED • MAY LOSE VALUE • NO BANK GUARANTEE
Neither the fund nor Fidelity Distributors Corporation is a bank.
Annual Report
Chairman's Message
(photo_of_James_C_Curvey)
Dear Shareholder:
Following a year marked by unusually high volatility, 2012 began with most major asset classes advancing steadily in January. For U.S. equities, it was the strongest start to a new year since 1997. International stocks fared even better, despite continued uncertainty related to the sovereign debt crisis in Europe. Investors have been acutely sensitive to the latest news, for better or worse, coming out of the eurozone and its impact on financial markets. As we look ahead, the unresolved debt crisis in Europe remains at the center of a series of risk factors, summarized below, that we believe have the greatest potential to influence the global investment landscape.
Deleveraging and the economy
In the euro-currency area, fiscal austerity among nations and debt deleveraging among financial companies loaded with sovereign debt are deflationary measures and serve to hinder economic growth in the short term. Such an economic and financial-market scenario has not been historically supportive of strong performance among riskier assets, and emerges at a time when many nations need a resurgent economy to assist them in closing their budget deficits and in building confidence among bond buyers to help them refinance their existing debt obligations.
Slowdown in China and Europe
China's economy is the second-largest in the world, and it has been the biggest contributor to global growth since the end of the last recession. Thus, the slower pace of domestic growth in China has led to lower demand for imports of commodities and other construction materials from the rest of the world. In addition, economic weakness in Europe and the broad-based global economic slowdown are putting pressure on China's export growth, which has been largely responsible for its breakneck pace of annual gross domestic product (GDP) growth during the past three decades.
Credit deterioration and contagion
The heightened macroeconomic risk and elevated credit risk swirling around certain European nations and financial institutions have caused many market participants to avoid purchases of or reduce exposure to short-term debt offerings by these issuers. With increased credit risk, there are growing concerns about the potential credit contraction and contagion from European issuers spreading to other financial markets.
We invite you to learn more by visiting us on the Internet or calling us by phone. It is our privilege to provide the resources you need to choose investments that are right for you.
Sincerely,
(The acting chairman's signature appears here.)
James C. Curvey
Acting Chairman
Annual Report
Performance: The Bottom Line
Average annual total return reflects the change in the value of an investment, assuming reinvestment of the class' distributions from dividend income and capital gains (the profits earned upon the sale of securities that have grown in value, if any) and assuming a constant rate of performance each year. The $10,000 table and the fund's returns do not reflect the deduction of taxes that a shareholder would pay on fund distributions or the redemption of fund shares. During periods of reimbursement by Fidelity, a fund's total return will be greater than it would be had the reimbursement not occurred. How a fund did yesterday is no guarantee of how it will do tomorrow.
Average Annual Total Returns
Periods ended January 31, 2012 | Past 1 | Past 5 | Past 10 |
Class A (incl. 5.75% sales charge) A | -7.01% | -1.17% | 5.93% |
Class T (incl. 3.50% sales charge) B | -5.03% | -0.95% | 6.05% |
Class B (incl. contingent deferred sales charge) C | -6.95% | -1.09% | 6.18% |
Class C (incl. contingent deferred sales charge) D | -3.04% | -0.73% | 6.17% |
A Class A shares bear a 0.25% 12b-1 fee. The initial offering of Class A shares took place on February 13, 2007. Returns prior to February 13, 2007 are those of Fidelity® Mid Cap Value Fund, the original class of the fund, which has no 12b-1 fee. Had Class A's 12b-1 fee been reflected, returns prior to February 13, 2007 would have been lower.
B Class T shares bear a 0.50% 12b-1 fee. The initial offering of Class T shares took place on February 13, 2007. Returns prior to February 13, 2007 are those of Fidelity® Mid Cap Value Fund, the original class of the fund, which has no 12b-1 fee. Had Class T's 12b-1 fee been reflected, returns prior to February 13, 2007 would have been lower.
C Class B shares bear a 1.00% 12b-1 fee. The initial offering of Class B shares took place on February 13, 2007. Returns prior to February 13, 2007 are those of Fidelity Mid Cap Value Fund, the original class of the fund, which has no 12b-1 fee. Had Class B's 12b-1 fee been reflected, returns prior to February 13, 2007 would have been lower. Class B shares' contingent deferred sales charge included in the past one year, past five years, and past ten years total return figures are 5%, 2%, and 0%, respectively.
D Class C shares bear a 1.00% 12b-1 fee. The initial offering of Class C shares took place on February 13, 2007. Returns prior to February 13, 2007 are those of Fidelity Mid Cap Value Fund, the original class of the fund, which has no 12b-1 fee. Had Class C's 12b-1 fee been reflected, returns prior to February 13, 2007 would have been lower. Class C shares' contingent deferred sales charge included in the past one year, past five years, and past ten years total return figures are 1%, 0%, and 0%, respectively.
Annual Report
$10,000 Over 10 Years
Let's say hypothetically that $10,000 was invested in Fidelity Advisor® Mid Cap Value Fund - Class A on January 31, 2002. The chart shows how the value of your investment would have changed, and also shows how the Russell Midcap® Value Index performed over the same period. The initial offering of Class A took place on February 13, 2007. See the previous page for additional information regarding the performance of Class A.
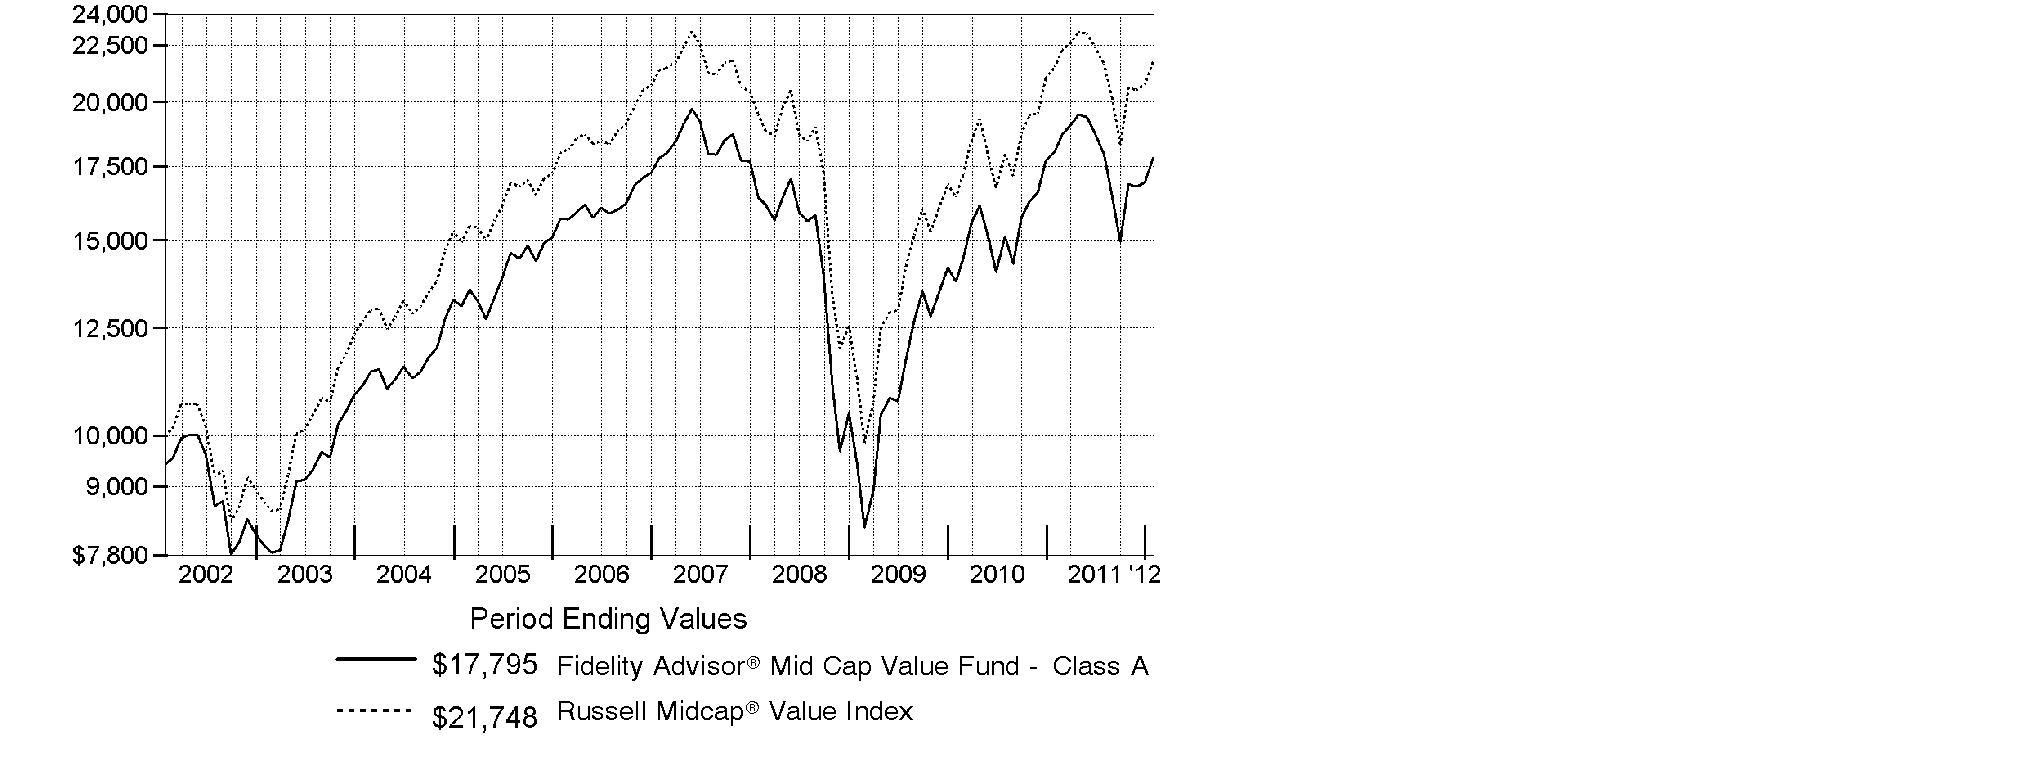
Annual Report
Management's Discussion of Fund Performance
Market Recap: After enduring one of the most volatile trading periods on record, U.S. stocks posted a gain for the 12 months ending January 31, 2012, sparked by a January rally. Strong corporate earnings reports and hints of economic recovery sent stocks mostly upward through April, when sovereign debt woes in Europe sparked fear of a global slowdown. In the summer, equities plummeted on eurozone instability, debate over the U.S. debt ceiling and a historic downgrade of the nation's sovereign debt rating. After falling as much as 13% by early August, the broad-based S&P 500® Index seesawed back to end the period on an optimistic note. For the full 12 months, the S&P 500® rose 4.22%, while the technology-laden Nasdaq Composite® Index added 5.26%. Investors began to shed perceived riskier smaller-cap stocks in favor of larger, more-established and dividend-paying names, helping to drive the Dow Jones® Industrial Average up 9.12% for the year, while the Russell 2000® - a proxy for small-caps - and Russell Midcap® indexes added 2.86% and 2.25%, respectively. Within the S&P 500®, defensive sectors such as health care (+16%) and utilities (+14%) fared best, while financials (-12%) struggled. Foreign developed-markets stocks were stung by Europe's turmoil, and the MSCI® EAFE® (Europe, Australasia, Far East) Index fell 9.49%.
Comments from Bruce Dirks, Portfolio Manager of Fidelity Advisor® Mid Cap Value Fund: For the year, the fund's Class A, Class T, Class B and Class C shares returned -1.34%, -1.59%, -2.06% and -2.07%, respectively (excluding sales charges), trailing the 1.19% gain of the Russell Midcap® Value Index. Weak stock picking in insurance and banks, coupled with adverse positioning within capital goods and utilities, were the biggest detractors from relative performance. On the plus side, security selection in consumer discretionary, health care and materials boosted relative results. From a market-capitalization perspective, stock picks among mid-cap companies in the $2 billion to $5 billion range helped the fund's return, while choices among those with a capitalization greater than $5 billion hurt. Individual relative detractors included untimely trading in the shares of electric utility PPL, along with airbag and safety equipment supplier TRW Automotive Holdings, regional bank SunTrust Banks, and an out-of-benchmark stake in integrated energy producer Hess. The top individual contributors versus the benchmark were Goodrich, a supplier of components and systems to commercial aircraft manufacturers, department store operator Macy's and apparel company VF. PPL and Goodrich were not held at period end.
Annual Report
The views expressed above reflect those of the portfolio manager(s) only through the end of the period as stated on the cover of this report and do not necessarily represent the views of Fidelity or any other person in the Fidelity organization. Any such views are subject to change at any time based upon market or other conditions and Fidelity disclaims any responsibility to update such views. These views may not be relied on as investment advice and, because investment decisions for a Fidelity fund are based on numerous factors, may not be relied on as an indication of trading intent on behalf of any Fidelity fund.
Annual Report
Shareholder Expense Example
As a shareholder of the Fund, you incur two types of costs: (1) transaction costs, including sales charges (loads) on purchase payments or redemption proceeds, redemption fees, and (2) ongoing costs, including management fees, distribution and/or service (12b-1) fees and other Fund expenses. This Example is intended to help you understand your ongoing costs (in dollars) of investing in the Fund and to compare these costs with the ongoing costs of investing in other mutual funds.
The Example is based on an investment of $1,000 invested at the beginning of the period and held for the entire period (August 1, 2011 to January 31, 2012).
Actual Expenses
The first line of the accompanying table for each class of the Fund provides information about actual account values and actual expenses. You may use the information in this line, together with the amount you invested, to estimate the expenses that you paid over the period. Simply divide your account value by $1,000.00 (for example, an $8,600 account value divided by $1,000.00 = 8.6), then multiply the result by the number in the first line for a class of the Fund under the heading entitled "Expenses Paid During Period" to estimate the expenses you paid on your account during this period. A small balance maintenance fee of $12.00 that is charged once a year may apply for certain accounts with a value of less than $2,000. This fee is not included in the table below. If it was, the estimate of expenses you paid during the period would be higher, and your ending account value lower, by this amount. In addition, the Fund, as a shareholder in the underlying Fidelity Central Funds, will indirectly bear its pro-rata share of the fees and expenses incurred by the underlying Fidelity Central Funds. These fees and expenses are not included in the Fund's annualized expense ratio used to calculate the expense estimate in the table below.
Hypothetical Example for Comparison Purposes
The second line of the accompanying table for each class of the Fund provides information about hypothetical account values and hypothetical expenses based on a Class' actual expense ratio and an assumed rate of return of 5% per year before expenses, which is not the Class' actual return. The hypothetical account values and expenses may not be used to estimate the actual ending account balance or expenses you paid for the period. You may use this information to compare the ongoing costs of investing in the Fund and other funds. To do so, compare this 5% hypothetical example with the 5% hypothetical examples that appear in the shareholder reports of the other funds. A small balance maintenance fee of $12.00 that is charged once a year may apply for certain accounts with a value of less than $2,000. This fee is not included in the table below. If it was, the estimate of expenses you paid during the period would be higher, and your ending account value lower, by this amount. In addition, the Fund, as a shareholder in the underlying Fidelity Central Funds, will indirectly bear its pro-rata share of the fees and expenses incurred by the underlying Fidelity Central Funds. These fees and expenses are not included in the Fund's annualized expense ratio used to calculate the expense estimate in the table below.
Please note that the expenses shown in the table are meant to highlight your ongoing costs only and do not reflect any transaction costs. Therefore, the second line of the table is useful in comparing ongoing costs only, and will not help you determine the relative total costs of owning different funds. In addition, if these transactional costs were included, your costs would have been higher.
Annual Report
| Annualized | Beginning | Ending | Expenses Paid |
Class A | 1.16% |
|
|
|
Actual |
| $ 1,000.00 | $ 992.10 | $ 5.82 |
HypotheticalA |
| $ 1,000.00 | $ 1,019.36 | $ 5.90 |
Class T | 1.43% |
|
|
|
Actual |
| $ 1,000.00 | $ 990.90 | $ 7.18 |
HypotheticalA |
| $ 1,000.00 | $ 1,018.00 | $ 7.27 |
Class B | 1.91% |
|
|
|
Actual |
| $ 1,000.00 | $ 988.70 | $ 9.57 |
HypotheticalA |
| $ 1,000.00 | $ 1,015.58 | $ 9.70 |
Class C | 1.91% |
|
|
|
Actual |
| $ 1,000.00 | $ 988.60 | $ 9.57 |
HypotheticalA |
| $ 1,000.00 | $ 1,015.58 | $ 9.70 |
Mid Cap Value | .88% |
|
|
|
Actual |
| $ 1,000.00 | $ 993.90 | $ 4.42 |
HypotheticalA |
| $ 1,000.00 | $ 1,020.77 | $ 4.48 |
Institutional Class | .90% |
|
|
|
Actual |
| $ 1,000.00 | $ 993.60 | $ 4.52 |
HypotheticalA |
| $ 1,000.00 | $ 1,020.67 | $ 4.58 |
A 5% return per year before expenses
* Expenses are equal to each Class' annualized expense ratio, multiplied by the average account value over the period, multiplied by 184/365 (to reflect the one-half year period).
Annual Report
Investment Changes (Unaudited)
Top Ten Stocks as of January 31, 2012 | ||
| % of fund's | % of fund's net assets |
Edison International | 1.7 | 1.6 |
Sempra Energy | 1.7 | 1.6 |
Discover Financial Services | 1.7 | 1.6 |
Macy's, Inc. | 1.6 | 1.1 |
Valero Energy Corp. | 1.6 | 1.7 |
Humana, Inc. | 1.5 | 1.4 |
Republic Services, Inc. | 1.5 | 1.3 |
ConAgra Foods, Inc. | 1.5 | 0.0 |
Lorillard, Inc. | 1.5 | 1.5 |
Clorox Co. | 1.4 | 0.0 |
| 15.7 | |
Top Five Market Sectors as of January 31, 2012 | ||
| % of fund's | % of fund's net assets |
Financials | 30.7 | 30.9 |
Utilities | 13.4 | 12.0 |
Consumer Discretionary | 11.0 | 11.2 |
Industrials | 10.6 | 10.2 |
Information Technology | 8.2 | 8.6 |
Asset Allocation (% of fund's net assets) | |||||||
As of January 31, 2012* | As of July 31, 2011** | ||||||
| Stocks 99.5% |
| | Stocks 99.7% |
| ||
| Short-Term |
| | Short-Term |
| ||
* Foreign investments | 3.1% |
| ** Foreign investments | 2.1% |
| ||

Annual Report
Investments January 31, 2012
Showing Percentage of Net Assets
Common Stocks - 99.5% | |||
Shares | Value | ||
CONSUMER DISCRETIONARY - 11.0% | |||
Auto Components - 1.1% | |||
TRW Automotive Holdings Corp. (a) | 168,700 | $ 6,329,624 | |
Hotels, Restaurants & Leisure - 0.9% | |||
Brinker International, Inc. (d) | 212,200 | 5,485,370 | |
Household Durables - 0.7% | |||
Jarden Corp. | 113,800 | 3,833,922 | |
Media - 1.6% | |||
CBS Corp. Class B | 164,300 | 4,679,264 | |
DISH Network Corp. Class A | 174,200 | 4,863,664 | |
| 9,542,928 | ||
Multiline Retail - 1.6% | |||
Macy's, Inc. | 282,500 | 9,517,425 | |
Specialty Retail - 2.9% | |||
Best Buy Co., Inc. | 209,300 | 5,012,735 | |
Foot Locker, Inc. | 270,500 | 7,097,920 | |
GameStop Corp. Class A (a)(d) | 219,300 | 5,122,848 | |
| 17,233,503 | ||
Textiles, Apparel & Luxury Goods - 2.2% | |||
PVH Corp. | 91,818 | 7,087,431 | |
VF Corp. | 45,900 | 6,035,391 | |
| 13,122,822 | ||
TOTAL CONSUMER DISCRETIONARY | 65,065,594 | ||
CONSUMER STAPLES - 7.0% | |||
Beverages - 1.0% | |||
Dr Pepper Snapple Group, Inc. | 155,200 | 6,024,864 | |
Food Products - 3.1% | |||
Campbell Soup Co. | 154,500 | 4,897,650 | |
ConAgra Foods, Inc. | 325,400 | 8,678,418 | |
Ralcorp Holdings, Inc. (a) | 50,100 | 4,381,245 | |
| 17,957,313 | ||
Household Products - 1.4% | |||
Clorox Co. | 123,500 | 8,479,510 | |
Tobacco - 1.5% | |||
Lorillard, Inc. | 80,500 | 8,644,895 | |
TOTAL CONSUMER STAPLES | 41,106,582 | ||
Common Stocks - continued | |||
Shares | Value | ||
ENERGY - 7.1% | |||
Energy Equipment & Services - 1.6% | |||
Helmerich & Payne, Inc. | 93,300 | $ 5,757,543 | |
Oil States International, Inc. (a) | 44,900 | 3,578,081 | |
| 9,335,624 | ||
Oil, Gas & Consumable Fuels - 5.5% | |||
Hess Corp. | 79,100 | 4,453,330 | |
Marathon Oil Corp. | 185,800 | 5,832,262 | |
Murphy Oil Corp. | 122,600 | 7,306,960 | |
Tesoro Corp. (a) | 227,100 | 5,684,313 | |
Valero Energy Corp. | 390,500 | 9,368,095 | |
| 32,644,960 | ||
TOTAL ENERGY | 41,980,584 | ||
FINANCIALS - 30.7% | |||
Capital Markets - 1.4% | |||
Ameriprise Financial, Inc. | 151,300 | 8,102,115 | |
Commercial Banks - 6.2% | |||
CapitalSource, Inc. | 513,100 | 3,545,521 | |
Comerica, Inc. | 214,600 | 5,937,982 | |
Huntington Bancshares, Inc. | 1,013,600 | 5,787,656 | |
KeyCorp | 995,900 | 7,738,143 | |
Regions Financial Corp. | 1,214,800 | 6,341,256 | |
SunTrust Banks, Inc. | 366,600 | 7,540,962 | |
| 36,891,520 | ||
Consumer Finance - 3.1% | |||
Discover Financial Services | 363,800 | 9,888,084 | |
SLM Corp. | 563,400 | 8,422,830 | |
| 18,310,914 | ||
Diversified Financial Services - 1.0% | |||
Leucadia National Corp. | 221,000 | 6,134,960 | |
Insurance - 7.2% | |||
Allied World Assurance Co. Holdings Ltd. | 82,900 | 5,100,837 | |
Assurant, Inc. | 167,100 | 6,617,160 | |
Hartford Financial Services Group, Inc. | 383,600 | 6,720,672 | |
Lincoln National Corp. | 306,900 | 6,610,626 | |
Torchmark Corp. | 129,500 | 5,914,265 | |
Unum Group | 219,600 | 5,013,468 | |
Validus Holdings Ltd. | 205,600 | 6,593,592 | |
| 42,570,620 | ||
Common Stocks - continued | |||
Shares | Value | ||
FINANCIALS - continued | |||
Real Estate Investment Trusts - 10.6% | |||
American Capital Agency Corp. | 170,700 | $ 5,004,924 | |
BRE Properties, Inc. | 110,700 | 5,736,474 | |
Douglas Emmett, Inc. | 325,900 | 6,814,569 | |
Essex Property Trust, Inc. | 36,200 | 5,212,800 | |
Kimco Realty Corp. | 436,700 | 7,969,775 | |
Prologis, Inc. | 229,500 | 7,277,445 | |
Rayonier, Inc. | 127,800 | 5,844,294 | |
SL Green Realty Corp. | 66,800 | 4,911,804 | |
The Macerich Co. | 134,000 | 7,276,200 | |
Ventas, Inc. | 109,000 | 6,355,790 | |
| 62,404,075 | ||
Thrifts & Mortgage Finance - 1.2% | |||
People's United Financial, Inc. | 552,200 | 6,808,626 | |
TOTAL FINANCIALS | 181,222,830 | ||
HEALTH CARE - 5.9% | |||
Health Care Providers & Services - 4.5% | |||
Community Health Systems, Inc. (a) | 311,800 | 5,830,660 | |
Health Net, Inc. (a) | 191,200 | 7,215,888 | |
Humana, Inc. | 100,800 | 8,973,216 | |
McKesson Corp. | 56,600 | 4,625,352 | |
| 26,645,116 | ||
Pharmaceuticals - 1.4% | |||
Mylan, Inc. (a) | 155,800 | 3,232,850 | |
Watson Pharmaceuticals, Inc. (a) | 82,100 | 4,813,523 | |
| 8,046,373 | ||
TOTAL HEALTH CARE | 34,691,489 | ||
INDUSTRIALS - 10.6% | |||
Aerospace & Defense - 2.7% | |||
Alliant Techsystems, Inc. | 57,100 | 3,392,311 | |
Esterline Technologies Corp. (a) | 75,400 | 4,610,710 | |
Textron, Inc. | 309,300 | 7,880,964 | |
| 15,883,985 | ||
Airlines - 0.8% | |||
Alaska Air Group, Inc. (a) | 59,500 | 4,529,735 | |
Common Stocks - continued | |||
Shares | Value | ||
INDUSTRIALS - continued | |||
Commercial Services & Supplies - 2.2% | |||
Pitney Bowes, Inc. (d) | 207,100 | $ 3,928,687 | |
Republic Services, Inc. | 303,500 | 8,886,480 | |
| 12,815,167 | ||
Construction & Engineering - 1.7% | |||
Fluor Corp. | 56,900 | 3,200,056 | |
KBR, Inc. | 223,900 | 7,196,146 | |
| 10,396,202 | ||
Machinery - 2.3% | |||
Cummins, Inc. | 56,100 | 5,834,400 | |
Parker Hannifin Corp. | 98,600 | 7,955,048 | |
| 13,789,448 | ||
Professional Services - 0.9% | |||
Towers Watson & Co. | 87,500 | 5,232,500 | |
TOTAL INDUSTRIALS | 62,647,037 | ||
INFORMATION TECHNOLOGY - 8.2% | |||
Communications Equipment - 1.6% | |||
Brocade Communications Systems, Inc. (a) | 932,600 | 5,231,886 | |
Motorola Solutions, Inc. | 93,800 | 4,353,258 | |
| 9,585,144 | ||
Computers & Peripherals - 1.3% | |||
SanDisk Corp. (a) | 166,600 | 7,643,608 | |
Electronic Equipment & Components - 0.8% | |||
Jabil Circuit, Inc. | 202,600 | 4,590,916 | |
IT Services - 0.5% | |||
Alliance Data Systems Corp. (a)(d) | 27,200 | 3,013,760 | |
Office Electronics - 1.3% | |||
Xerox Corp. | 968,100 | 7,502,775 | |
Semiconductors & Semiconductor Equipment - 2.7% | |||
KLA-Tencor Corp. | 98,400 | 5,031,192 | |
Marvell Technology Group Ltd. (a) | 432,600 | 6,718,278 | |
Skyworks Solutions, Inc. (a) | 208,600 | 4,501,588 | |
| 16,251,058 | ||
TOTAL INFORMATION TECHNOLOGY | 48,587,261 | ||
Common Stocks - continued | |||
Shares | Value | ||
MATERIALS - 4.9% | |||
Chemicals - 2.7% | |||
Ashland, Inc. | 94,600 | $ 5,965,476 | |
CF Industries Holdings, Inc. | 36,300 | 6,438,894 | |
W.R. Grace & Co. (a) | 61,000 | 3,265,940 | |
| 15,670,310 | ||
Containers & Packaging - 1.2% | |||
Ball Corp. | 78,700 | 3,089,762 | |
Rock-Tenn Co. Class A | 69,700 | 4,311,642 | |
| 7,401,404 | ||
Metals & Mining - 1.0% | |||
Commercial Metals Co. | 145,800 | 2,090,772 | |
Reliance Steel & Aluminum Co. | 73,900 | 3,931,480 | |
| 6,022,252 | ||
TOTAL MATERIALS | 29,093,966 | ||
TELECOMMUNICATION SERVICES - 0.7% | |||
Diversified Telecommunication Services - 0.7% | |||
Frontier Communications Corp. (d) | 909,300 | 3,891,804 | |
UTILITIES - 13.4% | |||
Electric Utilities - 5.0% | |||
Cleco Corp. | 65,300 | 2,596,328 | |
Edison International | 243,400 | 9,989,137 | |
El Paso Electric Co. | 162,700 | 5,661,960 | |
NV Energy, Inc. | 352,800 | 5,715,360 | |
PNM Resources, Inc. | 311,400 | 5,546,034 | |
| 29,508,819 | ||
Independent Power Producers & Energy Traders - 0.9% | |||
The AES Corp. (a) | 427,800 | 5,458,728 | |
Multi-Utilities - 7.5% | |||
Alliant Energy Corp. | 172,500 | 7,312,275 | |
CenterPoint Energy, Inc. | 366,400 | 6,767,408 | |
CMS Energy Corp. | 284,100 | 6,201,903 | |
NiSource, Inc. | 280,000 | 6,364,400 | |
Common Stocks - continued | |||
Shares | Value | ||
UTILITIES - continued | |||
Multi-Utilities - continued | |||
OGE Energy Corp. | 138,800 | $ 7,336,968 | |
Sempra Energy | 175,500 | 9,985,950 | |
| 43,968,904 | ||
TOTAL UTILITIES | 78,936,451 | ||
TOTAL COMMON STOCKS (Cost $565,672,480) |
| ||
Money Market Funds - 2.4% | |||
|
|
|
|
Fidelity Cash Central Fund, 0.12% (b) | 2,261,261 | 2,261,261 | |
Fidelity Securities Lending Cash Central Fund, 0.12% (b)(c) | 12,055,542 | 12,055,542 | |
TOTAL MONEY MARKET FUNDS (Cost $14,316,803) |
| ||
TOTAL INVESTMENT PORTFOLIO - 101.9% (Cost $579,989,283) | 601,540,401 | ||
NET OTHER ASSETS (LIABILITIES) - (1.9)% | (11,148,830) | ||
NET ASSETS - 100% | $ 590,391,571 | ||
Legend |
(a) Non-income producing |
(b) Affiliated fund that is available only to investment companies and other accounts managed by Fidelity Investments. The rate quoted is the annualized seven-day yield of the fund at period end. A complete unaudited listing of the fund's holdings as of its most recent quarter end is available upon request. In addition, each Fidelity Central Fund's financial statements, which are not covered by the Fund's Report of Independent Registered Public Accounting Firm, are available on the SEC's website or upon request. |
(c) Investment made with cash collateral received from securities on loan. |
(d) Security or a portion of the security is on loan at period end. |
Affiliated Central Funds |
Information regarding fiscal year to date income earned by the Fund from investments in Fidelity Central Funds is as follows: |
Fund | Income earned |
Fidelity Cash Central Fund | $ 4,244 |
Fidelity Securities Lending Cash Central Fund | 26,327 |
Total | $ 30,571 |
Other Information |
All investments are categorized as Level 1 under the Fair Value Hierarchy. The inputs or methodology used for valuing securities may not be an indication of the risk associated with investing in those securities. For more information on valuation inputs, please refer to the Security Valuation section in the accompanying Notes to Financial Statements. |
See accompanying notes which are an integral part of the financial statements.
Annual Report
Financial Statements
Statement of Assets and Liabilities
| January 31, 2012 | |
|
|
|
Assets | ||
Investment in securities, at value (including securities loaned of $11,629,259) - See accompanying schedule: Unaffiliated issuers (cost $565,672,480) | $ 587,223,598 |
|
Fidelity Central Funds (cost $14,316,803) | 14,316,803 |
|
Total Investments (cost $579,989,283) |
| $ 601,540,401 |
Receivable for investments sold | 5,922,361 | |
Receivable for fund shares sold | 503,414 | |
Dividends receivable | 465,532 | |
Distributions receivable from Fidelity Central Funds | 1,597 | |
Prepaid expenses | 1,626 | |
Other receivables | 22,353 | |
Total assets | 608,457,284 | |
|
|
|
Liabilities | ||
Payable to custodian bank | $ 41,147 | |
Payable for investments purchased | 4,574,379 | |
Payable for fund shares redeemed | 950,312 | |
Accrued management fee | 241,778 | |
Distribution and service plan fees payable | 12,070 | |
Other affiliated payables | 141,985 | |
Other payables and accrued expenses | 48,500 | |
Collateral on securities loaned, at value | 12,055,542 | |
Total liabilities | 18,065,713 | |
|
|
|
Net Assets | $ 590,391,571 | |
Net Assets consist of: |
| |
Paid in capital | $ 631,279,726 | |
Distributions in excess of net investment income | (137,586) | |
Accumulated undistributed net realized gain (loss) on investments | (62,301,687) | |
Net unrealized appreciation (depreciation) on investments | 21,551,118 | |
Net Assets | $ 590,391,571 | |
See accompanying notes which are an integral part of the financial statements.
Annual Report
Financial Statements - continued
Statement of Assets and Liabilities - continued
| January 31, 2012 | |
|
|
|
Calculation of Maximum Offering Price Class A: | $ 15.87 | |
|
|
|
Maximum offering price per share (100/94.25 of $15.87) | $ 16.84 | |
Class T: | $ 15.84 | |
|
|
|
Maximum offering price per share (100/96.50 of $15.84) | $ 16.41 | |
Class B: | $ 15.71 | |
|
|
|
Class C: | $ 15.65 | |
|
|
|
Mid Cap Value: | $ 15.97 | |
|
|
|
Institutional Class: | $ 15.91 | |
A Redemption price per share is equal to net asset value less any applicable contingent deferred sales charge.
See accompanying notes which are an integral part of the financial statements.
Annual Report
Statement of Operations
| Year ended January 31, 2012 | |
|
|
|
Investment Income |
|
|
Dividends |
| $ 10,284,144 |
Interest |
| 94 |
Income from Fidelity Central Funds |
| 30,571 |
Total income |
| 10,314,809 |
|
|
|
Expenses | ||
Management fee | $ 3,588,402 | |
Performance adjustment | (6,368) | |
Transfer agent fees | 1,694,073 | |
Distribution and service plan fees | 154,185 | |
Accounting and security lending fees | 236,372 | |
Custodian fees and expenses | 28,521 | |
Independent trustees' compensation | 3,756 | |
Registration fees | 72,124 | |
Audit | 54,963 | |
Legal | 2,193 | |
Interest | 529 | |
Miscellaneous | 6,596 | |
Total expenses before reductions | 5,835,346 | |
Expense reductions | (65,968) | 5,769,378 |
Net investment income (loss) | 4,545,431 | |
Realized and Unrealized Gain (Loss) Net realized gain (loss) on: | ||
Investment securities: |
|
|
Unaffiliated issuers |
| 70,353,241 |
Change in net unrealized appreciation (depreciation) on investment securities | (90,350,275) | |
Net gain (loss) | (19,997,034) | |
Net increase (decrease) in net assets resulting from operations | $ (15,451,603) | |
See accompanying notes which are an integral part of the financial statements.
Annual Report
Financial Statements - continued
Statement of Changes in Net Assets
| Year ended | Year ended |
Increase (Decrease) in Net Assets |
|
|
Operations |
|
|
Net investment income (loss) | $ 4,545,431 | $ 1,552,041 |
Net realized gain (loss) | 70,353,241 | 100,225,944 |
Change in net unrealized appreciation (depreciation) | (90,350,275) | 59,481,106 |
Net increase (decrease) in net assets resulting | (15,451,603) | 161,259,091 |
Distributions to shareholders from net investment income | (4,101,848) | (2,444,386) |
Share transactions - net increase (decrease) | (97,570,396) | 57,906,539 |
Redemption fees | 28,676 | 31,710 |
Total increase (decrease) in net assets | (117,095,171) | 216,752,954 |
|
|
|
Net Assets | ||
Beginning of period | 707,486,742 | 490,733,788 |
End of period (including distributions in excess of net investment income of $137,586 and distributions in excess of net investment income of $543,496, respectively) | $ 590,391,571 | $ 707,486,742 |
See accompanying notes which are an integral part of the financial statements.
Annual Report
Financial Highlights - Class A
Years ended January 31, | 2012 | 2011 | 2010 | 2009 | 2008 H |
Selected Per-Share Data |
|
|
|
|
|
Net asset value, beginning of period | $ 16.16 | $ 12.35 | $ 8.53 | $ 15.05 | $ 17.63 |
Income from Investment Operations |
|
|
|
|
|
Net investment income (loss) E | .07 | - J | .07 | .09 | .03 |
Net realized and unrealized gain (loss) | (.29) | 3.85 | 3.84 | (6.47) | (1.78) |
Total from investment operations | (.22) | 3.85 | 3.91 | (6.38) | (1.75) |
Distributions from net investment income | (.07) | (.04) | (.09) | (.14) | (.06) |
Distributions from net realized gain | - | - | - | - J | (.77) |
Total distributions | (.07) | (.04) | (.09) | (.14) | (.83) |
Redemption fees added to paid in capital E, J | - | - | - | - | - |
Net asset value, end of period | $ 15.87 | $ 16.16 | $ 12.35 | $ 8.53 | $ 15.05 |
Total Return B, C, D | (1.34)% | 31.14% | 45.79% | (42.40)% | (10.28)% |
Ratios to Average Net Assets F, I |
|
|
|
|
|
Expenses before reductions | 1.17% | 1.17% | 1.21% | 1.12% | 1.14% A |
Expenses net of fee waivers, if any | 1.17% | 1.17% | 1.21% | 1.12% | 1.14% A |
Expenses net of all reductions | 1.16% | 1.17% | 1.20% | 1.12% | 1.13% A |
Net investment income (loss) | .44% | .02% | .62% | .71% | .16% A |
Supplemental Data |
|
|
|
|
|
Net assets, end of period (000 omitted) | $ 19,578 | $ 23,608 | $ 10,640 | $ 6,404 | $ 7,445 |
Portfolio turnover rate G | 173% | 133% | 202% | 268% | 264% |
A Annualized
B Total returns for periods of less than one year are not annualized.
C Total returns would have been lower if certain expenses had not been reduced during the applicable periods shown.
D Total returns do not include the effect of the sales charges.
E Calculated based on average shares outstanding during the period.
F Fees and expenses of any underlying Fidelity Central Funds are not included in the Fund's expense ratio. The Fund indirectly bears its proportionate share of the expenses of any underlying Fidelity Central Funds.
G Amount does not include the portfolio activity of any underlying Fidelity Central Funds.
H For the period February 13, 2007 (commencement of sale of shares) to January 31, 2008.
I Expense ratios reflect operating expenses of the class. Expenses before reductions do not reflect amounts reimbursed by the investment adviser or reductions from brokerage service arrangements or reductions from other expense offset arrangements and do not represent the amount paid by the class during periods when reimbursements or reductions occur. Expense ratios before reductions for start-up periods may not be representative of longer-term operating periods. Expenses net of fee waivers reflect expenses after reimbursement by the investment adviser but prior to reductions from brokerage service arrangements or other expense offset arrangements. Expenses net of all reductions represent the net expenses paid by the class.
J Amount represents less than $.01 per share.
See accompanying notes which are an integral part of the financial statements.
Annual Report
Financial Highlights - Class T
Years ended January 31, | 2012 | 2011 | 2010 | 2009 | 2008 H |
Selected Per-Share Data |
|
|
|
|
|
Net asset value, beginning of period | $ 16.14 | $ 12.34 | $ 8.53 | $ 15.04 | $ 17.63 |
Income from Investment Operations |
|
|
|
|
|
Net investment income (loss) E | .03 | (.03) | .04 | .06 | (.02) |
Net realized and unrealized gain (loss) | (.29) | 3.83 | 3.84 | (6.46) | (1.76) |
Total from investment operations | (.26) | 3.80 | 3.88 | (6.40) | (1.78) |
Distributions from net investment income | (.04) | - | (.07) | (.11) | (.04) |
Distributions from net realized gain | - | - | - | - | (.77) |
Total distributions | (.04) | - | (.07) | (.11) | (.81) |
Redemption fees added to paid in capital E, J | - | - | - | - | - |
Net asset value, end of period | $ 15.84 | $ 16.14 | $ 12.34 | $ 8.53 | $ 15.04 |
Total Return B, C, D | (1.59)% | 30.79% | 45.44% | (42.57)% | (10.46)% |
Ratios to Average Net Assets F, I |
|
|
|
|
|
Expenses before reductions | 1.43% | 1.43% | 1.47% | 1.38% | 1.39% A |
Expenses net of fee waivers, if any | 1.43% | 1.43% | 1.47% | 1.38% | 1.39% A |
Expenses net of all reductions | 1.42% | 1.43% | 1.46% | 1.38% | 1.39% A |
Net investment income (loss) | .18% | (.24)% | .36% | .45% | (.10)% A |
Supplemental Data |
|
|
|
|
|
Net assets, end of period (000 omitted) | $ 6,823 | $ 6,993 | $ 4,010 | $ 2,413 | $ 3,714 |
Portfolio turnover rate G | 173% | 133% | 202% | 268% | 264% |
A Annualized
B Total returns for periods of less than one year are not annualized.
C Total returns would have been lower if certain expenses had not been reduced during the applicable periods shown.
D Total returns do not include the effect of the sales charges.
E Calculated based on average shares outstanding during the period.
F Fees and expenses of any underlying Fidelity Central Funds are not included in the Fund's expense ratio. The Fund indirectly bears its proportionate share of the expenses of any underlying Fidelity Central Funds.
G Amount does not include the portfolio activity of any underlying Fidelity Central Funds.
H For the period February 13, 2007 (commencement of sale of shares) to January 31, 2008.
I Expense ratios reflect operating expenses of the class. Expenses before reductions do not reflect amounts reimbursed by the investment adviser or reductions from brokerage service arrangements or reductions from other expense offset arrangements and do not represent the amount paid by the class during periods when reimbursements or reductions occur. Expense ratios before reductions for start-up periods may not be representative of longer-term operating periods. Expenses net of fee waivers reflect expenses after reimbursement by the investment adviser but prior to reductions from brokerage service arrangements or other expense offset arrangements. Expenses net of all reductions represent the net expenses paid by the class.
J Amount represents less than $.01 per share.
See accompanying notes which are an integral part of the financial statements.
Annual Report
Financial Highlights - Class B
Years ended January 31, | 2012 | 2011 | 2010 | 2009 | 2008 H |
Selected Per-Share Data |
|
|
|
|
|
Net asset value, beginning of period | $ 16.04 | $ 12.32 | $ 8.53 | $ 14.99 | $ 17.63 |
Income from Investment Operations |
|
|
|
|
|
Net investment income (loss) E | (.05) | (.10) | (.01) | (.01) | (.10) |
Net realized and unrealized gain (loss) | (.28) | 3.82 | 3.82 | (6.40) | (1.76) |
Total from investment operations | (.33) | 3.72 | 3.81 | (6.41) | (1.86) |
Distributions from net investment income | - | - | (.02) | (.05) | (.01) |
Distributions from net realized gain | - | - | - | - | (.77) |
Total distributions | - | - | (.02) | (.05) | (.78) |
Redemption fees added to paid in capital E, J | - | - | - | - | - |
Net asset value, end of period | $ 15.71 | $ 16.04 | $ 12.32 | $ 8.53 | $ 14.99 |
Total Return B, C, D | (2.06)% | 30.19% | 44.61% | (42.79)% | (10.88)% |
Ratios to Average Net Assets F, I |
|
|
|
|
|
Expenses before reductions | 1.92% | 1.93% | 1.97% | 1.87% | 1.89% A |
Expenses net of fee waivers, if any | 1.92% | 1.93% | 1.97% | 1.87% | 1.89% A |
Expenses net of all reductions | 1.91% | 1.92% | 1.96% | 1.87% | 1.89% A |
Net investment income (loss) | (.31)% | (.74)% | (.14)% | (.04)% | (.59)% A |
Supplemental Data |
|
|
|
|
|
Net assets, end of period (000 omitted) | $ 1,376 | $ 1,793 | $ 1,154 | $ 763 | $ 1,304 |
Portfolio turnover rate G | 173% | 133% | 202% | 268% | 264% |
A Annualized
B Total returns for periods of less than one year are not annualized.
C Total returns would have been lower if certain expenses had not been reduced during the applicable periods shown.
D Total returns do not include the effect of the contingent deferred sales charge.
E Calculated based on average shares outstanding during the period.
F Fees and expenses of any underlying Fidelity Central Funds are not included in the Fund's expense ratio. The Fund indirectly bears its proportionate share of the expenses of any underlying Fidelity Central Funds.
G Amount does not include the portfolio activity of any underlying Fidelity Central Funds.
H For the period February 13, 2007 (commencement of sale of shares) to January 31, 2008.
I Expense ratios reflect operating expenses of the class. Expenses before reductions do not reflect amounts reimbursed by the investment adviser or reductions from brokerage service arrangements or reductions from other expense offset arrangements and do not represent the amount paid by the class during periods when reimbursements or reductions occur. Expense ratios before reductions for start-up periods may not be representative of longer-term operating periods. Expenses net of fee waivers reflect expenses after reimbursement by the investment adviser but prior to reductions from brokerage service arrangements or other expense offset arrangements. Expenses net of all reductions represent the net expenses paid by the class.
J Amount represents less than $.01 per share.
See accompanying notes which are an integral part of the financial statements.
Annual Report
Financial Highlights - Class C
Years ended January 31, | 2012 | 2011 | 2010 | 2009 | 2008 H |
Selected Per-Share Data |
|
|
|
|
|
Net asset value, beginning of period | $ 15.98 | $ 12.27 | $ 8.50 | $ 14.98 | $ 17.63 |
Income from Investment Operations |
|
|
|
|
|
Net investment income (loss) E | (.05) | (.10) | (.01) | - | (.10) |
Net realized and unrealized gain (loss) | (.28) | 3.81 | 3.80 | (6.41) | (1.77) |
Total from investment operations | (.33) | 3.71 | 3.79 | (6.41) | (1.87) |
Distributions from net investment income | - | - | (.02) | (.07) | (.01) |
Distributions from net realized gain | - | - | - | - | (.77) |
Total distributions | - | - | (.02) | (.07) | (.78) |
Redemption fees added to paid in capital E, J | - | - | - | - | - |
Net asset value, end of period | $ 15.65 | $ 15.98 | $ 12.27 | $ 8.50 | $ 14.98 |
Total Return B, C, D | (2.07)% | 30.24% | 44.56% | (42.79)% | (10.94)% |
Ratios to Average Net Assets F, I |
|
|
|
|
|
Expenses before reductions | 1.92% | 1.93% | 1.96% | 1.86% | 1.90% A |
Expenses net of fee waivers, if any | 1.92% | 1.93% | 1.96% | 1.86% | 1.90% A |
Expenses net of all reductions | 1.91% | 1.92% | 1.95% | 1.86% | 1.90% A |
Net investment income (loss) | (.31)% | (.73)% | (.13)% | (.03)% | (.60)% A |
Supplemental Data |
|
|
|
|
|
Net assets, end of period (000 omitted) | $ 5,000 | $ 5,309 | $ 2,293 | $ 1,232 | $ 1,658 |
Portfolio turnover rate G | 173% | 133% | 202% | 268% | 264% |
A Annualized
B Total returns for periods of less than one year are not annualized.
C Total returns would have been lower if certain expenses had not been reduced during the applicable periods shown.
D Total returns do not include the effect of the contingent deferred sales charge.
E Calculated based on average shares outstanding during the period.
F Fees and expenses of any underlying Fidelity Central Funds are not included in the Fund's expense ratio. The Fund indirectly bears its proportionate share of the expenses of any underlying Fidelity Central Funds.
G Amount does not include the portfolio activity of any underlying Fidelity Central Funds.
H For the period February 13, 2007 (commencement of sale of shares) to January 31, 2008.
I Expense ratios reflect operating expenses of the class. Expenses before reductions do not reflect amounts reimbursed by the investment adviser or reductions from brokerage service arrangements or reductions from other expense offset arrangements and do not represent the amount paid by the class during periods when reimbursements or reductions occur. Expense ratios before reductions for start-up periods may not be representative of longer-term operating periods. Expenses net of fee waivers reflect expenses after reimbursement by the investment adviser but prior to reductions from brokerage service arrangements or other expense offset arrangements. Expenses net of all reductions represent the net expenses paid by the class.
J Amount represents less than $.01 per share.
See accompanying notes which are an integral part of the financial statements.
Annual Report
Financial Highlights - Mid Cap Value
Years ended January 31, | 2012 | 2011 | 2010 | 2009 | 2008 |
Selected Per-Share Data |
|
|
|
|
|
Net asset value, beginning of period | $ 16.26 | $ 12.41 | $ 8.57 | $ 15.09 | $ 17.18 |
Income from Investment Operations |
|
|
|
|
|
Net investment income (loss) B | .12 | .04 | .09 | .13 | .08 |
Net realized and unrealized gain (loss) | (.30) | 3.87 | 3.86 | (6.49) | (1.34) |
Total from investment operations | (.18) | 3.91 | 3.95 | (6.36) | (1.26) |
Distributions from net investment income | (.11) | (.06) | (.11) | (.16) | (.06) |
Distributions from net realized gain | - | - | - | - F | (.77) |
Total distributions | (.11) | (.06) | (.11) | (.16) | (.83) |
Redemption fees added to paid in capital B, F | - | - | - | - | - |
Net asset value, end of period | $ 15.97 | $ 16.26 | $ 12.41 | $ 8.57 | $ 15.09 |
Total Return A | (1.04)% | 31.51% | 46.06% | (42.19)% | (7.67)% |
Ratios to Average Net Assets C, E |
|
|
|
|
|
Expenses before reductions | .88% | .91% | .95% | .85% | .83% |
Expenses net of fee waivers, if any | .88% | .91% | .95% | .84% | .82% |
Expenses net of all reductions | .87% | .90% | .94% | .84% | .82% |
Net investment income (loss) | .73% | .28% | .88% | .99% | .47% |
Supplemental Data |
|
|
|
|
|
Net assets, end of period (000 omitted) | $ 553,947 | $ 666,277 | $ 469,476 | $ 358,380 | $ 737,234 |
Portfolio turnover rate D | 173% | 133% | 202% | 268% | 264% |
A Total returns would have been lower if certain expenses had not been reduced during the applicable periods shown.
B Calculated based on average shares outstanding during the period.
C Fees and expenses of any underlying Fidelity Central Funds are not included in the Fund's expense ratio. The Fund indirectly bears its proportionate share of the expenses of any underlying Fidelity Central Funds.
D Amount does not include the portfolio activity of any underlying Fidelity Central Funds.
E Expense ratios reflect operating expenses of the class. Expenses before reductions do not reflect amounts reimbursed by the investment adviser or reductions from brokerage service arrangements or reductions from other expense offset arrangements and do not represent the amount paid by the class during periods when reimbursements or reductions occur. Expenses net of fee waivers reflect expenses after reimbursement by the investment adviser but prior to reductions from brokerage service arrangements or other expense offset arrangements. Expenses net of all reductions represent the net expenses paid by the class.
F Amount represents less than $.01 per share.
See accompanying notes which are an integral part of the financial statements.
Annual Report
Financial Highlights - Institutional Class
Years ended January 31, | 2012 | 2011 | 2010 | 2009 | 2008 G |
Selected Per-Share Data |
|
|
|
|
|
Net asset value, beginning of period | $ 16.20 | $ 12.36 | $ 8.54 | $ 15.06 | $ 17.63 |
Income from Investment Operations |
|
|
|
|
|
Net investment income (loss) D | .11 | .04 | .10 | .12 | .07 |
Net realized and unrealized gain (loss) | (.29) | 3.85 | 3.84 | (6.48) | (1.78) |
Total from investment operations | (.18) | 3.89 | 3.94 | (6.36) | (1.71) |
Distributions from net investment income | (.11) | (.05) | (.12) | (.16) | (.09) |
Distributions from net realized gain | - | - | - | - | (.77) |
Total distributions | (.11) | (.05) | (.12) | (.16) | (.86) |
Redemption fees added to paid in capital D, I | - | - | - | - | - |
Net asset value, end of period | $ 15.91 | $ 16.20 | $ 12.36 | $ 8.54 | $ 15.06 |
Total Return B, C | (1.07)% | 31.51% | 46.12% | (42.26)% | (10.06)% |
Ratios to Average Net Assets E, H |
|
|
|
|
|
Expenses before reductions | .91% | .92% | .96% | .87% | .89% A |
Expenses net of fee waivers, if any | .91% | .92% | .96% | .87% | .89% A |
Expenses net of all reductions | .90% | .92% | .95% | .87% | .88% A |
Net investment income (loss) | .71% | .27% | .87% | .96% | .41% A |
Supplemental Data |
|
|
|
|
|
Net assets, end of period (000 omitted) | $ 3,667 | $ 3,507 | $ 3,162 | $ 894 | $ 1,452 |
Portfolio turnover rate F | 173% | 133% | 202% | 268% | 264% |
A Annualized
B Total returns for periods of less than one year are not annualized.
C Total returns would have been lower if certain expenses had not been reduced during the applicable periods shown.
D Calculated based on average shares outstanding during the period.
E Fees and expenses of any underlying Fidelity Central Funds are not included in the Fund's expense ratio. The Fund indirectly bears its proportionate share of the expenses of any underlying Fidelity Central Funds.
F Amount does not include the portfolio activity of any underlying Fidelity Central Funds.
G For the period February 13, 2007 (commencement of sale of shares) to January 31, 2008.
H Expense ratios reflect operating expenses of the class. Expenses before reductions do not reflect amounts reimbursed by the investment adviser or reductions from brokerage service arrangements or reductions from other expense offset arrangements and do not represent the amount paid by the class during periods when reimbursements or reductions occur. Expense ratios before reductions for start-up periods may not be representative of longer-term operating periods. Expenses net of fee waivers reflect expenses after reimbursement by the investment adviser but prior to reductions from brokerage service arrangements or other expense offset arrangements. Expenses net of all reductions represent the net expenses paid by the class.
I Amount represents less than $.01 per share.
See accompanying notes which are an integral part of the financial statements.
Annual Report
Notes to Financial Statements
For the period ended January 31, 2012
1. Organization.
Fidelity Mid Cap Value Fund (the Fund) is a fund of Fidelity Devonshire Trust (the Trust) and is authorized to issue an unlimited number of shares. The Trust is registered under the Investment Company Act of 1940, as amended (the 1940 Act), as an open-end management investment company organized as a Massachusetts business trust. The Fund offers Class A, Class T, Class C, Mid Cap Value and Institutional Class shares, each of which, along with Class B shares, has equal rights as to assets and voting privileges. Effective after the close of business on September 1, 2010, Class B shares were closed to new accounts and additional purchases, except for exchanges and reinvestments. Each class has exclusive voting rights with respect to matters that affect that class. Class B shares will automatically convert to Class A shares after a holding period of seven years from the initial date of purchase. Investment income, realized and unrealized capital gains and losses, the common expenses of the Fund, and certain fund-level expense reductions, if any, are allocated on a pro-rata basis to each class based on the relative net assets of each class to the total net assets of the Fund. Each class differs with respect to transfer agent and distribution and service plan fees incurred. Certain expense reductions may also differ by class. The Fund's investments in emerging markets can be subject to social, economic, regulatory, and political uncertainties and can be extremely volatile.
2. Investments in Fidelity Central Funds.
The Fund invests in Fidelity Central Funds, which are open-end investment companies available only to other investment companies and accounts managed by Fidelity Management & Research Company (FMR) and its affiliates. The Fund's Schedule of Investments lists each of the Fidelity Central Funds held as of period end, if any, as an investment of the Fund, but does not include the underlying holdings of each Fidelity Central Fund. As an Investing Fund, the Fund indirectly bears its proportionate share of the expenses of the underlying Fidelity Central Funds.
The Money Market Central Funds seek preservation of capital and current income and are managed by Fidelity Investments Money Management, Inc. (FIMM), an affiliate of FMR.
A complete unaudited list of holdings for each Fidelity Central Fund is available upon request or at the Securities and Exchange Commission (the SEC) web site at www.sec.gov. In addition, the financial statements of the Fidelity Central Funds, which are not covered by the Fund's Report of Independent Registered Public Accounting Firm, are available on the SEC web site or upon request.
Annual Report
Notes to Financial Statements - continued
3. Significant Accounting Policies.
The financial statements have been prepared in conformity with accounting principles generally accepted in the United States of America (GAAP), which require management to make certain estimates and assumptions at the date of the financial statements. Actual results could differ from those estimates. Subsequent events, if any, through the date that the financial statements were issued have been evaluated in the preparation of the financial statements. The following summarizes the significant accounting policies of the Fund:
Security Valuation. Investments are valued as of 4:00 p.m. Eastern time on the last calendar day of the period. The Fund uses independent pricing services approved by the Board of Trustees to value its investments. When current market prices or quotations are not readily available or reliable, valuations may be determined in good faith in accordance with procedures adopted by the Board of Trustees. Factors used in determining value may include market or security specific events. The frequency with which these procedures are used cannot be predicted and they may be utilized to a significant extent. The value used for net asset value (NAV) calculation under these procedures may differ from published prices for the same securities.
The Fund categorizes the inputs to valuation techniques used to value its investments into a disclosure hierarchy consisting of three levels as shown below:
Level 1 - quoted prices in active markets for identical investments
Level 2 - other significant observable inputs (including quoted prices for similar investments, interest rates, prepayment speeds, etc.)
Level 3 - unobservable inputs (including the Fund's own assumptions based on the best information available)
Changes in valuation techniques may result in transfers in or out of an assigned level within the disclosure hierarchy. Valuation techniques used to value the Fund's investments by major category are as follows:
Equity securities, including restricted securities, for which market quotations are readily available, are valued at the last reported sale price or official closing price as reported by an independent pricing service on the primary market or exchange on which they are traded and are categorized as Level 1 in the hierarchy. In the event there were no sales during the day or closing prices are not available, securities are valued at the last quoted bid price or may be valued using the last available price and are generally categorized as Level 2 in the hierarchy. For foreign equity securities, when significant market or security specific events arise, comparisons to the valuation of American Depositary Receipts (ADRs), futures contracts, Exchange-traded funds (ETFs) and certain indexes as well as quoted prices for similar securities are used and are categorized as Level 2 in the
Annual Report
3. Significant Accounting Policies - continued
Security Valuation - continued
hierarchy in these circumstances. Utilizing these techniques may result in transfers between Level 1 and Level 2. For restricted equity securities and private placements where observable inputs are limited, assumptions about market activity and risk are used and are categorized as Level 3 in the hierarchy.
Investments in open-end mutual funds, including the Fidelity Central Funds, are valued at their closing net asset value each business day and are categorized as Level 1 in the hierarchy.
New Accounting Pronouncements. In May 2011, the Financial Accounting Standards Board issued Accounting Standard Update No. 2011-04, Fair Value Measurement (Topic 820) - Amendments to Achieve Common Fair Value Measurement and Disclosure Requirements in U.S. GAAP and IFRSs. The update is effective during interim and annual periods beginning after December 15, 2011 and will result in additional disclosure for transfers between levels as well as expanded disclosure for securities categorized as Level 3 under the fair value hierarchy.
In December 2011, the Financial Accounting Standards Board issued Accounting Standard Update No. 2011-11, Disclosures about Offsetting Assets and Liabilities. The update creates new disclosure requirements requiring entities to disclose both gross and net information for derivatives and other financial instruments that are either offset in the Statement of Assets and Liabilities or subject to an enforceable master netting arrangement or similar agreement. The disclosure requirements are effective for interim and annual reporting periods beginning on or after January 1, 2013. Management is currently evaluating the impact of the update's adoption on the Fund's financial statement disclosures.
Foreign Currency. The Fund may use foreign currency contracts to facilitate transactions in foreign-denominated securities. Gains and losses from these transactions may arise from changes in the value of the foreign currency or if the counterparties do not perform under the contracts' terms.
Foreign-denominated assets, including investment securities, and liabilities are translated into U.S. dollars at the exchange rate at period end. Purchases and sales of investment securities, income and dividends received and expenses denominated in foreign currencies are translated into U.S. dollars at the exchange rate in effect on the transaction date.
The effects of exchange rate fluctuations on investments are included with the net realized and unrealized gain (loss) on investment securities. Other foreign currency transactions resulting in realized and unrealized gain (loss) are disclosed separately.
Annual Report
Notes to Financial Statements - continued
3. Significant Accounting Policies - continued
Investment Transactions and Income. For financial reporting purposes, the Fund's investment holdings and NAV include trades executed through the end of the last business day of the period. The NAV per share for processing shareholder transactions is calculated as of the close of business of the New York Stock Exchange (NYSE), normally 4:00 p.m. Eastern time and includes trades executed through the end of the prior business day. Gains and losses on securities sold are determined on the basis of identified cost and may include proceeds received from litigation. Dividend income is recorded on the ex-dividend date, except for certain dividends from foreign securities where the ex-dividend date may have passed, which are recorded as soon as the Fund is informed of the ex-dividend date. Non-cash dividends included in dividend income, if any, are recorded at the fair market value of the securities received. Distributions received on securities that represent a return of capital or capital gain are recorded as a reduction of cost of investments and/or as a realized gain. The Fund estimates the components of distributions received that may be considered return of capital distributions or capital gain distributions. Interest income and distributions from the Fidelity Central Funds are accrued as earned. Interest income includes coupon interest and amortization of premium and accretion of discount on debt securities. Investment income is recorded net of foreign taxes withheld where recovery of such taxes is uncertain.
Expenses. Expenses directly attributable to a fund are charged to that fund. Expenses attributable to more than one fund are allocated among the respective funds on the basis of relative net assets or other appropriate methods. Expense estimates are accrued in the period to which they relate and adjustments are made when actual amounts are known.
Income Tax Information and Distributions to Shareholders. Each year, the Fund intends to qualify as a regulated investment company, including distributing substantially all of its taxable income and realized gains under Subchapter M of the Internal Revenue Code. As a result, no provision for income taxes is required. As of January 31, 2012, the Fund did not have any unrecognized tax benefits in the financial statements; nor is the Fund aware of any tax positions for which it is reasonably possible that the total amounts of unrecognized tax benefits will significantly change in the next twelve months. The Fund files a U.S. federal tax return, in addition to state and local tax returns as required. A fund's tax returns are subject to examination by the Internal Revenue Service (IRS) for a period of three fiscal years. State and local tax returns may be subject to examination for an additional fiscal year depending on the jurisdiction. Foreign taxes are provided for based on the Fund's understanding of the tax rules and rates that exist in the foreign markets in which it invests.
Distributions are declared and recorded on the ex-dividend date. Income dividends and capital gain distributions are declared separately for each class. Income and capital gain
Annual Report
3. Significant Accounting Policies - continued
Income Tax Information and Distributions to Shareholders - continued
distributions are determined in accordance with income tax regulations, which may differ from GAAP.
Capital accounts within the financial statements are adjusted for permanent book-tax differences. These adjustments have no impact on net assets or the results of operations. Temporary book-tax differences will reverse in a subsequent period.
Book-tax differences are primarily due to short-term gain distributions from underlying funds, capital loss carryforwards and losses deferred due to wash sales and excise tax regulations.
The federal tax cost of investment securities and unrealized appreciation (depreciation) as of period end were as follows:
Gross unrealized appreciation | $ 45,960,283 |
Gross unrealized depreciation | (26,978,462) |
Net unrealized appreciation (depreciation) on securities and other investments | $ 18,981,821 |
|
|
Tax Cost | $ 582,558,580 |
The tax-based components of distributable earnings as of period end were as follows:
Capital loss carryforward | $ (59,732,390) |
Net unrealized appreciation (depreciation) | $ 18,981,821 |
Capital loss carryforwards are only available to offset future capital gains of the Fund to the extent provided by regulations and may be limited. Under the Regulated Investment Company Modernization Act of 2010 (the Act), the Fund is permitted to carry forward capital losses incurred in taxable years beginning after December 22, 2010 for an unlimited period and such capital losses are required to be used prior to any losses that expire. Capital loss carryforwards were as follows:
Fiscal year of expiration |
|
2018 | $ (59,732,390) |
Annual Report
Notes to Financial Statements - continued
3. Significant Accounting Policies - continued
Income Tax Information and Distributions to Shareholders - continued
The tax character of distributions paid was as follows:
| January 31, 2012 | January 31, 2011 |
Ordinary Income | $ 4,101,848 | $ 2,444,386 |
Short-Term Trading (Redemption) Fees. Shares held by investors in the Fund less than 30 days are subject to a redemption fee equal to .75% of the net asset value of shares redeemed. All redemption fees, which reduce the proceeds of the shareholder redemption, are retained by the Fund and accounted for as an addition to paid in capital.
4. Purchases and Sales of Investments.
Purchases and sales of securities, other than short-term securities, aggregated $1,120,384,304 and $1,218,402,135, respectively.
5. Fees and Other Transactions with Affiliates.
Management Fee. FMR and its affiliates provide the Fund with investment management related services for which the Fund pays a monthly management fee. The management fee is the sum of an individual fund fee rate that is based on an annual rate of .30% of the Fund's average net assets and an annualized group fee rate that averaged .26% during the period. The group fee rate is based upon the average net assets of all the mutual funds advised by FMR. The group fee rate decreases as assets under management increase and increases as assets under management decrease. In addition, the management fee is subject to a performance adjustment (up to a maximum of ± .20% of the Fund's average net assets over a 36 month performance period). The upward or downward adjustment to the management fee is based on the relative investment performance of Mid Cap Value as compared to an appropriate benchmark index. For the period, the total annual management fee rate, including the performance adjustment, was .56% of the Fund's average net assets.
Distribution and Service Plan Fees. In accordance with Rule 12b-1 of the 1940 Act, the Fund has adopted separate Distribution and Service Plans for each class of shares. Certain classes pay Fidelity Distributors Corporation (FDC), an affiliate of FMR, separate Distribution and Service Fees, each of which is based on an annual percentage of each class' average net assets. In addition, FDC may pay financial intermediaries for
Annual Report
5. Fees and Other Transactions with Affiliates - continued
Distribution and Service Plan Fees - continued
selling shares of the Fund and providing shareholder support services. For the period, the Distribution and Service Fee rates, total fees and amounts retained by FDC were as follows:
| Distribution | Service | Total Fees | Retained |
Class A | -% | .25% | $ 52,557 | $ 2,177 |
Class T | .25% | .25% | 33,452 | 113 |
Class B | .75% | .25% | 15,346 | 11,519 |
Class C | .75% | .25% | 52,830 | 17,080 |
|
|
| $ 154,185 | $ 30,889 |
Sales Load. FDC may receive a front-end sales charge of up to 5.75% for selling Class A shares and 3.50% for selling Class T shares, some of which is paid to financial intermediaries for selling shares of the Fund. Depending on the holding period, FDC may receive contingent deferred sales charges levied on Class A, Class T, Class B, and Class C redemptions. The deferred sales charges range from 5.00% to 1.00% for Class B, 1.00% for Class C, 1.00% for certain purchases of Class A shares and .25% for certain purchases of Class T shares.
For the period, sales charge amounts retained by FDC were as follows:
| Retained |
Class A | $ 15,237 |
Class T | 2,801 |
Class B* | 2,003 |
Class C* | 1,050 |
| $ 21,091 |
* When Class B and Class C shares are initially sold, FDC pays commissions from its own resources to financial intermediaries through which the sales are made.
Transfer Agent Fees. Fidelity Investments Institutional Operations Company, Inc. (FIIOC), an affiliate of FMR, is the transfer, dividend disbursing and shareholder servicing agent for each class of the Fund. FIIOC receives account fees and asset-based fees that vary according to the account size and type of account of the shareholders of the respective classes of the Fund. FIIOC pays for typesetting, printing and mailing of
Annual Report
Notes to Financial Statements - continued
5. Fees and Other Transactions with Affiliates - continued
Transfer Agent Fees - continued
shareholder reports, except proxy statements. For the period, transfer agent fees for each class were as follows:
| Amount | % of |
Class A | $ 63,412 | .30 |
Class T | 20,886 | .31 |
Class B | 4,630 | .30 |
Class C | 15,912 | .30 |
Mid Cap Value | 1,579,493 | .26 |
Institutional Class | 9,740 | .29 |
| $ 1,694,073 |
|
Accounting and Security Lending Fees. Fidelity Service Company, Inc. (FSC), an affiliate of FMR, maintains the Fund's accounting records. The accounting fee is based on the level of average net assets for each month. Under a separate contract, FSC administers the security lending program. The security lending fee is based on the number and duration of lending transactions.
Brokerage Commissions. The Fund placed a portion of its portfolio transactions with brokerage firms which are affiliates of the investment adviser. The commissions paid to these affiliated firms were $23,204 for the period.
Interfund Lending Program. Pursuant to an Exemptive Order issued by the SEC, the Fund, along with other registered investment companies having management contracts with FMR, may participate in an interfund lending program. This program provides an alternative credit facility allowing the funds to borrow from, or lend money to, other participating affiliated funds. At period end, there were no interfund loans outstanding. The Fund's activity in this program during the period for which loans were outstanding was as follows:
Borrower or Lender | Average | Weighted Average | Interest |
Borrower | $ 11,023,000 | .35% | $ 529 |
6. Committed Line of Credit.
The Fund participates with other funds managed by FMR or an affiliate in a $4.0 billion credit facility (the "line of credit") to be utilized for temporary or emergency purposes to fund shareholder redemptions or for other short-term liquidity purposes. The Fund has agreed to pay commitment fees on its pro-rata portion of the line of credit, which
Annual Report
6. Committed Line of Credit - continued
amounted to $1,937 and is reflected in Miscellaneous expenses on the Statement of Operations. During the period, there were no borrowings on this line of credit.
7. Security Lending.
The Fund lends portfolio securities through a lending agent from time to time in order to earn additional income. For equity securities, a lending agent is used and may loan securities to certain qualified borrowers, including Fidelity Capital Markets (FCM), a broker-dealer affiliated with the Fund. On the settlement date of the loan, the Fund receives collateral (in the form of U.S. Treasury obligations, letters of credit and/or cash) against the loaned securities and maintains collateral in an amount not less than 100% of the market value of the loaned securities during the period of the loan. The market value of the loaned securities is determined at the close of business of the Fund and any additional required collateral is delivered to the Fund on the next business day. If the borrower defaults on its obligation to return the securities loaned because of insolvency or other reasons, a fund could experience delays and costs in recovering the securities loaned or in gaining access to the collateral. Any cash collateral received is invested in the Fidelity Securities Lending Cash Central Fund. The value of loaned securities and cash collateral at period end are disclosed on the Fund's Statement of Assets and Liabilities. Security lending income represents the income earned on investing cash collateral, less rebates paid to borrowers and any lending agent fees associated with the loan, plus any premium payments received for lending certain types of securities. Security lending income is presented in the Statement of Operations as a component of income from Fidelity Central Funds. Total security lending income during the period amounted to $26,327. During the period, there were no securities loaned to FCM.
8. Expense Reductions.
Many of the brokers with whom FMR places trades on behalf of the Fund provided services in addition to trade execution. These services included payments of certain expenses on behalf of the Fund totaling $65,968 for the period.
9. Distributions to Shareholders.
Distributions to shareholders of each class were as follows:
Years ended January 31, | 2012 | 2011 |
From net investment income |
|
|
Class A | $ 84,201 | $ 48,967 |
Class T | 17,628 | - |
Mid Cap Value | 3,978,985 | 2,383,138 |
Institutional Class | 21,034 | 12,281 |
Total | $ 4,101,848 | $ 2,444,386 |
Annual Report
Notes to Financial Statements - continued
10. Share Transactions.
Transactions for each class of shares were as follows:
| Shares | Dollars | ||
Years ended January 31, | 2012 | 2011 | 2012 | 2011 |
Class A |
|
|
|
|
Shares sold | 471,749 | 979,279 | $ 7,485,577 | $ 13,831,042 |
Reinvestment of distributions | 5,251 | 2,902 | 78,338 | 45,422 |
Shares redeemed | (704,307) | (383,036) | (11,261,227) | (5,416,268) |
Net increase (decrease) | (227,307) | 599,145 | $ (3,697,312) | $ 8,460,196 |
Class T |
|
|
|
|
Shares sold | 161,524 | 277,811 | $ 2,605,707 | $ 3,916,314 |
Reinvestment of distributions | 1,166 | - | 17,360 | - |
Shares redeemed | (165,147) | (169,622) | (2,621,038) | (2,442,521) |
Net increase (decrease) | (2,457) | 108,189 | $ 2,029 | $ 1,473,793 |
Class B |
|
|
|
|
Shares sold | 9,800 | 68,215 | $ 158,077 | $ 957,007 |
Shares redeemed | (33,963) | (50,071) | (529,991) | (730,358) |
Net increase (decrease) | (24,163) | 18,144 | $ (371,914) | $ 226,649 |
Class C |
|
|
|
|
Shares sold | 124,340 | 223,953 | $ 1,963,624 | $ 3,145,394 |
Shares redeemed | (137,041) | (78,488) | (2,028,206) | (1,108,959) |
Net increase (decrease) | (12,701) | 145,465 | $ (64,582) | $ 2,036,435 |
Mid Cap Value |
|
|
|
|
Shares sold | 7,442,595 | 14,676,423 | $ 120,167,268 | $ 210,466,358 |
Reinvestment of distributions | 256,561 | 146,967 | 3,848,420 | 2,313,260 |
Shares redeemed | (13,984,343) | (11,678,158) | (217,785,024) | (166,435,604) |
Net increase (decrease) | (6,285,187) | 3,145,232 | $ (93,769,336) | $ 46,344,014 |
Institutional Class |
|
|
|
|
Shares sold | 158,721 | 152,312 | $ 2,526,829 | $ 2,150,351 |
Reinvestment of distributions | 1,314 | 744 | 19,637 | 11,662 |
Shares redeemed | (146,013) | (192,350) | (2,215,747) | (2,796,561) |
Net increase (decrease) | 14,022 | (39,294) | $ 330,719 | $ (634,548) |
11. Other.
The Fund's organizational documents provide former and current trustees and officers with a limited indemnification against liabilities arising in connection with the performance of their duties to the Fund. In the normal course of business, the Fund may also enter into contracts that provide general indemnifications. The Fund's maximum exposure under these arrangements is unknown as this would be dependent on future claims that may be made against the Fund. The risk of material loss from such claims is considered remote.
Annual Report
Report of Independent Registered Public Accounting Firm
To the Trustees of Fidelity Devonshire Trust and the Shareholders of Fidelity Mid Cap Value Fund:
In our opinion, the accompanying statement of assets and liabilities, including the schedule of investments, and the related statements of operations and of changes in net assets and the financial highlights present fairly, in all material respects, the financial position of Fidelity Mid Cap Value Fund (a fund of Fidelity Devonshire Trust) at January 31, 2012, the results of its operations for the year then ended, the changes in its net assets for each of the two years in the period then ended and the financial highlights for each of the periods indicated, in conformity with accounting principles generally accepted in the United States of America. These financial statements and financial highlights (hereafter referred to as "financial statements") are the responsibility of the Fidelity Mid Cap Value Fund's management. Our responsibility is to express an opinion on these financial statements based on our audits. We conducted our audits of these financial statements in accordance with the standards of the Public Company Accounting Oversight Board (United States). Those standards require that we plan and perform the audit to obtain reasonable assurance about whether the financial statements are free of material misstatement. An audit includes examining, on a test basis, evidence supporting the amounts and disclosures in the financial statements, assessing the accounting principles used and significant estimates made by management, and evaluating the overall financial statement presentation. We believe that our audits, which included confirmation of securities at January 31, 2012 by correspondence with the custodian and brokers, provide a reasonable basis for our opinion.
/s/ PricewaterhouseCoopers LLP
PricewaterhouseCoopers LLP
Boston, Massachusetts
March 13, 2012
Annual Report
Trustees and Officers
The Trustees, Members of the Advisory Board, and executive officers of the trust and fund, as applicable, are listed below. The Board of Trustees governs the fund and is responsible for protecting the interests of shareholders. The Trustees are experienced executives who meet periodically throughout the year to oversee the fund's activities, review contractual arrangements with companies that provide services to the fund, oversee management of the risks associated with such activities and contractual arrangements, and review the fund's performance. Except for James C. Curvey, each of the Trustees oversees 226 funds advised by FMR or an affiliate. Mr. Curvey oversees 430 funds advised by FMR or an affiliate.
The Trustees hold office without limit in time except that (a) any Trustee may resign; (b) any Trustee may be removed by written instrument, signed by at least two-thirds of the number of Trustees prior to such removal; (c) any Trustee who requests to be retired or who has become incapacitated by illness or injury may be retired by written instrument signed by a majority of the other Trustees; and (d) any Trustee may be removed at any special meeting of shareholders by a two-thirds vote of the outstanding voting securities of the trust. Each Trustee who is not an interested person (as defined in the 1940 Act) (Independent Trustee), shall retire not later than the last day of the calendar year in which his or her 75th birthday occurs. The Independent Trustees may waive this mandatory retirement age policy with respect to individual Trustees. The executive officers and Advisory Board Members hold office without limit in time, except that any officer and Advisory Board Member may resign or may be removed by a vote of a majority of the Trustees at any regular meeting or any special meeting of the Trustees. Except as indicated, each individual has held the office shown or other offices in the same company for the past five years.
Experience, Skills, Attributes, and Qualifications of the Fund's Trustees. The Governance and Nominating Committee has adopted a statement of policy that describes the experience, qualifications, attributes, and skills that are necessary and desirable for potential Independent Trustee candidates (Statement of Policy). The Board believes that each Trustee satisfied at the time he or she was initially elected or appointed a Trustee, and continues to satisfy, the standards contemplated by the Statement of Policy. The Governance and Nominating Committee also engages professional search firms to help identify potential Independent Trustee candidates who have the experience, qualifications, attributes, and skills consistent with the Statement of Policy. From time to time, additional criteria based on the composition and skills of the current Independent Trustees, as well as experience or skills that may be appropriate in light of future changes to board composition, business conditions, and regulatory or other developments, have also been considered by the professional search firms and the Governance and Nominating Committee. In addition, the Board takes into account the Trustees' commitment and participation in Board and committee meetings, as well as their leadership of standing and ad hoc committees throughout their tenure.
In determining that a particular Trustee was and continues to be qualified to serve as a Trustee, the Board has considered a variety of criteria, none of which, in isolation, was controlling. The Board believes that, collectively, the Trustees have balanced and diverse experience, qualifications, attributes, and skills, which allow the Board to operate effectively in governing the fund and protecting the interests of shareholders. Information about the specific experience, skills, attributes, and qualifications of each Trustee, which in each case led to the Board's conclusion that the Trustee should serve (or continue to serve) as a trustee of the fund, is provided below.
Annual Report
Board Structure and Oversight Function. James C. Curvey is an interested person (as defined in the 1940 Act) and currently serves as Acting Chairman. The Trustees have determined that an interested Chairman is appropriate and benefits shareholders because an interested Chairman has a personal and professional stake in the quality and continuity of services provided to the fund. Independent Trustees exercise their informed business judgment to appoint an individual of their choosing to serve as Chairman, regardless of whether the Trustee happens to be independent or a member of management. The Independent Trustees have determined that they can act independently and effectively without having an Independent Trustee serve as Chairman and that a key structural component for assuring that they are in a position to do so is for the Independent Trustees to constitute a substantial majority for the Board. The Independent Trustees also regularly meet in executive session. Ned C. Lautenbach serves as Chairman of the Independent Trustees and as such (i) acts as a liaison between the Independent Trustees and management with respect to matters important to the Independent Trustees and (ii) with management prepares agendas for Board meetings.
Fidelity funds are overseen by different Boards of Trustees. The fund's Board oversees Fidelity's equity and high income funds and another Board oversees Fidelity's investment-grade bond, money market, and asset allocation funds. The asset allocation funds may invest in Fidelity funds overseen by the fund's Board. The use of separate Boards, each with its own committee structure, allows the Trustees of each group of Fidelity funds to focus on the unique issues of the funds they oversee, including common research, investment, and operational issues. On occasion, the separate Boards establish joint committees to address issues of overlapping consequences for the Fidelity funds overseen by each Board.
The Trustees operate using a system of committees to facilitate the timely and efficient consideration of all matters of importance to the Trustees, the fund, and fund shareholders and to facilitate compliance with legal and regulatory requirements and oversight of the fund's activities and associated risks. The Board, acting through its committees, has charged FMR and its affiliates with (i) identifying events or circumstances the occurrence of which could have demonstrably adverse effects on the fund's business and/or reputation; (ii) implementing processes and controls to lessen the possibility that such events or circumstances occur or to mitigate the effects of such events or circumstances if they do occur; and (iii) creating and maintaining a system designed to evaluate continuously business and market conditions in order to facilitate the identification and implementation processes described in (i) and (ii) above. Because the day-to-day operations and activities of the fund are carried out by or through FMR, its affiliates and other service providers, the fund's exposure to risks is mitigated but not eliminated by the processes overseen by the Trustees. While each of the Board's committees has responsibility for overseeing different aspects of the fund's activities, oversight is exercised primarily through the Operations, Audit, and Compliance Committees. In addition, the Independent Trustees have worked with FMR to enhance the Board's oversight of investment and financial risks, legal and regulatory risks, technology risks, and operational risks, including the development of additional risk reporting to the Board. For example, a working group comprised of Independent Trustees and FMR has worked and continues to work to review the Fidelity funds' valuation-related activities, reporting and risk management. Appropriate personnel, including but not limited to the fund's Chief Compliance Officer (CCO), FMR's internal auditor, the independent accountants, the fund's Treasurer and portfolio management personnel, make periodic reports to the Board's committees, as appropriate, including an annual review of FMR's risk management program for the Fidelity funds. The responsibilities of each standing committee, including their oversight responsibilities, are described further under "Standing Committees of the Fund's Trustees."
Annual Report
Trustees and Officers - continued
The fund's Statement of Additional Information (SAI) includes more information about the Trustees. To request a free copy, call Fidelity at 1-877-208-0098.
Interested Trustees*:
Correspondence intended for each Trustee who is an interested person may be sent to Fidelity Investments, 82 Devonshire Street, Boston, Massachusetts 02109.
Name, Age; Principal Occupations and Other Relevant Experience+ | |
James C. Curvey (76) | |
| Year of Election or Appointment: 2007 Mr. Curvey is Trustee and Acting Chairman of the Board of Trustees of certain Trusts. Mr. Curvey also serves as Trustee (2007-present) of other investment companies advised by FMR. Mr. Curvey is a Director of Fidelity Investments Money Management, Inc. (2009-present), Director of Fidelity Research & Analysis Co. (2009-present) and Director of FMR and FMR Co., Inc. (2007-present). Mr. Curvey is also Vice Chairman (2007-present) and Director of FMR LLC. In addition, Mr. Curvey serves as an Overseer for the Boston Symphony Orchestra and a member of the Trustees of Villanova University. Previously, Mr. Curvey was the Vice Chairman (2006-2007) and Director (2000-2007) of FMR Corp. |
Ronald P. O'Hanley (54) | |
| Year of Election or Appointment: 2011 Mr. O'Hanley is Director of FMR Co., Inc. (2010-present), Director of Fidelity Investments Money Management, Inc. (2010-present), Director of Fidelity Research & Analysis Company (2010-present), President of Fidelity Asset Management and Corporate Services and a member of Fidelity's Executive Committee (2010-present). Previously, Mr. O'Hanley served as President and Chief Executive Officer of BNY Mellon Asset Management (2007-2010). Mr. O'Hanley also served as Vice Chairman of Bank New York Mellon Corp. and a member of that firm's Executive Committee. Prior to the 2007 merger of The Bank of New York and Mellon Financial Corporation, he was Vice Chairman of Mellon Financial Corporation and President and Chief Executive Officer of Mellon Asset Management. He joined Mellon in February 1997. Mr. O'Hanley currently serves as Chairman of the Boston Public Library Foundation Board of Directors and sits on the Board of Directors of Beth Israel Deaconess Medical Center, the Board of Trustees of the Marine Biological Laboratory and the Advisory Board of the Maxwell School of Citizenship and Public Administration at Syracuse University. Mr. O'Hanley also chairs the Council on Asset Management for the Financial Services Roundtable and is a member of the Board of Directors of Institutional Investor's U.S. Institute. |
* Trustees have been determined to be "Interested Trustees" by virtue of, among other things, their affiliation with the trust or various entities under common control with FMR.
+ The information above includes each Trustee's principal occupation during the last five years and other information relating to the experience, attributes, and skills relevant to each Trustee's qualifications to serve as a Trustee, which led to the conclusion that each Trustee should serve as a Trustee for the fund.
Annual Report
Trustees and Officers - continued
Independent Trustees:
Correspondence intended for each Independent Trustee (that is, the Trustees other than the Interested Trustees) may be sent to Fidelity Investments, P.O. Box 55235, Boston, Massachusetts 02205-5235.
Name, Age; Principal Occupations and Other Relevant Experience+ | |
Dennis J. Dirks (63) | |
| Year of Election or Appointment: 2005 Prior to his retirement in May 2003, Mr. Dirks was Chief Operating Officer and a member of the Board of The Depository Trust & Clearing Corporation (DTCC). He also served as President, Chief Operating Officer, and Board member of The Depository Trust Company (DTC) and President and Board member of the National Securities Clearing Corporation (NSCC). In addition, Mr. Dirks served as Chief Executive Officer and Board member of the Government Securities Clearing Corporation, Chief Executive Officer and Board member of the Mortgage-Backed Securities Clearing Corporation, as a Trustee and a member of the Finance Committee of Manhattan College (2005-2008), and as a Trustee and a member of the Finance Committee of AHRC of Nassau County (2006-2008). Mr. Dirks is a member of the Independent Directors Council (IDC) Governing Council (2010-present) and Board of Directors for The Brookville Center for Children's Services, Inc. (2009-present). |
Alan J. Lacy (58) | |
| Year of Election or Appointment: 2008 Mr. Lacy serves as Senior Adviser (2007-present) of Oak Hill Capital Partners, L.P. (private equity). Mr. Lacy also served as Chief Executive Officer (2000-2005) and Vice Chairman (2005-2006) of Sears Holdings Corporation and Sears, Roebuck and Co. (retail). In addition, Mr. Lacy serves as a member of the Board of Directors of Dave & Buster's, Inc. (restaurant and entertainment complexes, 2010-present), The Hillman Companies, Inc. (hardware wholesalers, 2010-present), and Bristol-Myers Squibb Company (global pharmaceuticals, 2007-present). Mr. Lacy is a member of the Board of Trustees of The National Parks Conservation Association (2006-present). Previously, Mr. Lacy served as Chairman of the Board of Trustees of the National Parks Conservation Association (2008-2011) and as a member of the Board of Directors for the Western Union Company (global money transfer, 2006-2011). |
Ned C. Lautenbach (67) | |
| Year of Election or Appointment: 2000 Mr. Lautenbach is Chairman of the Independent Trustees of the Equity and High Income Funds (2006-present). Mr. Lautenbach currently serves as the Lead Director of the Eaton Corporation Board of Directors (diversified industrial, 1997-present). Mr. Lautenbach is also a member of the Board of Directors of the Philharmonic Center for the Arts in Naples, Florida (1999-present); a member of the Board of Trustees of Fairfield University (2005-present); and a member of the Council on Foreign Relations (1994-present). Previously, Mr. Lautenbach was a Partner/Advisory Partner at Clayton, Dubilier & Rice, LLC (private equity investment, 1998-2010), as well as a Director of Sony Corporation (2006-2007). |
Joseph Mauriello (67) | |
| Year of Election or Appointment: 2008 Prior to his retirement in January 2006, Mr. Mauriello served in numerous senior management positions including Deputy Chairman and Chief Operating Officer (2004-2005), and Vice Chairman of Financial Services (2002-2004) of KPMG LLP US (professional services, 1965-2005). Mr. Mauriello currently serves as a member of the Board of Directors of XL Group plc. (global insurance and re-insurance, 2006-present) and of Arcadia Resources Inc. (health care services and products, 2007-present). Previously, Mr. Mauriello served as a Director of the Hamilton Funds of the Bank of New York (2006-2007). |
Robert W. Selander (61) | |
| Year of Election or Appointment: 2011 Previously, Mr. Selander served as a Member of the Advisory Board of Fidelity's Equity and High Income Funds (2011), Executive Vice Chairman (2010), Chief Executive Officer (2009-2010), and President and Chief Executive Officer (1997-2009) of Mastercard, Inc. |
Cornelia M. Small (67) | |
| Year of Election or Appointment: 2005 Ms. Small is a member of the Board of Directors of the Teagle Foundation (2009-present). Ms. Small is also a member of the Investment Committee, and Chair (2008-present) and a member of the Board of Trustees of Smith College. In addition, Ms. Small serves on the Investment Committee of the Berkshire Taconic Community Foundation (2008-present). Previously, Ms. Small served as Chairperson of the Investment Committee (2002-2008) of Smith College. In addition, Ms. Small served as Chief Investment Officer, Director of Global Equity Investments, and a member of the Board of Directors of Scudder, Stevens & Clark and Scudder Kemper Investments. |
William S. Stavropoulos (72) | |
| Year of Election or Appointment: 2002 Mr. Stavropoulos is Vice Chairman of the Independent Trustees of the Equity and High Income Funds (2006-present). Mr. Stavropoulos serves as President and Founder of the Michigan Baseball Foundation, the Great Lakes Loons (2007-present). Mr. Stavropoulos is Chairman Emeritus of the Board of Directors of The Dow Chemical Company, where he previously served in numerous senior management positions, including President, CEO (1995-2000; 2002-2004), Chairman of the Executive Committee (2000-2006), and as a member of the Board of Directors (1990-2006). Currently, Mr. Stavropoulos is Chairman of Univar (global distributor of commodity and specialty chemicals, 2010-present), a Director of Teradata Corporation (data warehousing and technology solutions, 2008-present), Chemical Financial Corporation, Maersk Inc. (industrial conglomerate), Tyco International, Inc. (multinational manufacturing and services, 2007-present), and a member of the Advisory Board for Metalmark Capital (private equity investment, 2005-present). Mr. Stavropoulos is a special advisor to Clayton, Dubilier & Rice, LLC (private equity investment). In addition, Mr. Stavropoulos is a member of the University of Notre Dame Advisory Council for the College of Science. |
David M. Thomas (62) | |
| Year of Election or Appointment: 2008 Previously, Mr. Thomas served as Executive Chairman (2005-2006) and Chairman and Chief Executive Officer (2000-2005) of IMS Health, Inc. (pharmaceutical and healthcare information solutions). In addition, Mr. Thomas serves as a member of the Board of Directors of Fortune Brands, Inc. (consumer products), and Interpublic Group of Companies, Inc. (marketing communication, 2004-present). |
Michael E. Wiley (61) | |
| Year of Election or Appointment: 2008 Mr. Wiley also serves as a Director of Asia Pacific Exploration Consolidated (international oil and gas exploration and production, 2008-present). Mr. Wiley serves as a Director of Tesoro Corporation (independent oil refiner and marketer, 2005-present), and a Director of Bill Barrett Corporation (exploration and production, 2005-present). In addition, Mr. Wiley also serves as a Director of Post Oak Bank (privately-held bank, 2004-present). Previously, Mr. Wiley served as a member of the Board of Trustees of the University of Tulsa (2000-2006; 2007-2010), as a Senior Energy Advisor of Katzenbach Partners, LLC (consulting, 2006-2007), as an Advisory Director of Riverstone Holdings (private investment), Chairman, President, and CEO of Baker Hughes, Inc. (oilfield services, 2000-2004), and as Director of Spinnaker Exploration Company (exploration and production, 2001-2005). |
Annual Report
+ The information above includes each Trustee's principal occupation during the last five years and other information relating to the experience, attributes, and skills relevant to each Trustee's qualifications to serve as a Trustee, which led to the conclusion that each Trustee should serve as a Trustee for the fund.
Advisory Board Members and Executive Officers:
Correspondence intended for each executive officer, Edward C. Johnson 3d, and Peter S. Lynch may be sent to Fidelity Investments, 82 Devonshire Street, Boston, Massachusetts 02109.
Name, Age; Principal Occupation | |
Edward C. Johnson 3d (81) | |
| Year of Election or Appointment: 2011 Member of the Advisory Board of Fidelity's Equity and High Income Funds. Mr. Johnson serves as Chief Executive Officer, Chairman, and a Director of FMR LLC, and also serves as Chairman and Director of FIL Limited. Previously, Mr. Johnson served as a Trustee and Chairman of the Board of certain Fidelity Trusts, Chairman and a Director of FMR, Chairman and a Director of FMR Co., Inc., and President of FMR LLC (2006-2007). |
Peter S. Lynch (68) | |
| Year of Election or Appointment: 2003 Member of the Advisory Board of Fidelity's Equity and High Income Funds. Mr. Lynch is Vice Chairman and a Director of FMR and FMR Co., Inc. In addition, Mr. Lynch serves as a Trustee of Boston College and as the Chairman of the Inner-City Scholarship Fund. Previously, Mr. Lynch served on the Special Olympics International Board of Directors (1997-2006). |
Kenneth B. Robins (42) | |
| Year of Election or Appointment: 2008 President and Treasurer of Fidelity's Equity and High Income Funds. Mr. Robins also serves as President and Treasurer (2010-present) and Assistant Treasurer (2009-present) of other Fidelity funds and is an employee of Fidelity Investments (2004-present). Previously, Mr. Robins served as Deputy Treasurer of the Fidelity funds (2005-2008) and Treasurer and Chief Financial Officer of The North Carolina Capital Management Trust: Cash and Term Portfolios (2006-2008). |
Brian B. Hogan (47) | |
| Year of Election or Appointment: 2009 Vice President of Equity and High Income Funds. Mr. Hogan also serves as President of FMR's Equity Division (2009-present). Previously, Mr. Hogan served as Senior Vice President, Equity Research of FMR (2006-2009) and as a portfolio manager. |
Thomas C. Hense (48) | |
| Year of Election or Appointment: 2008 or 2010 Vice President of Fidelity's High Income (2008), Small Cap (2008), and Value (2010) Funds. Previously, Mr. Hense served as a portfolio manager for Fidelity's Institutional Money Management Group (Pyramis) (2003-2008). |
Scott C. Goebel (44) | |
| Year of Election or Appointment: 2008 Secretary and Chief Legal Officer (CLO) of the Fidelity funds. Mr. Goebel also serves as Secretary of Fidelity Investments Money Management, Inc. (FIMM) (2010-present) and Fidelity Research and Analysis Company (FRAC) (2010-present); Secretary and CLO of The North Carolina Capital Management Trust: Cash and Term Portfolios (2008-present); General Counsel, Secretary, and Senior Vice President of FMR (2008-present) and FMR Co., Inc. (2008-present); employed by FMR LLC or an affiliate (2001-present); Chief Legal Officer of Fidelity Management & Research (Hong Kong) Limited (2008-present) and Assistant Secretary of Fidelity Management & Research (Japan) Inc. (2008-present), and Fidelity Management & Research (U.K.) Inc. (2008-present). Previously, Mr. Goebel served as Assistant Secretary of FIMM (2008-2010), FRAC (2008-2010), and the Funds (2007-2008) and as Vice President and Secretary of Fidelity Distributors Corporation (FDC) (2005-2007). |
William C. Coffey (42) | |
| Year of Election or Appointment: 2009 Assistant Secretary of Fidelity's Equity and High Income Funds. Mr. Coffey also serves as Senior Vice President and Deputy General Counsel of FMR LLC (2010-present), and is an employee of Fidelity Investments. Previously, Mr. Coffey served as Vice President and Associate General Counsel of FMR LLC (2005-2009). |
Holly C. Laurent (57) | |
| Year of Election or Appointment: 2008 Anti-Money Laundering (AML) Officer of the Fidelity funds. Ms. Laurent also serves as AML Officer of The North Carolina Capital Management Trust: Cash and Term Portfolios (2008-present) and is an employee of Fidelity Investments. Previously, Ms. Laurent was Senior Vice President and Head of Legal for Fidelity Business Services India Pvt. Ltd. (2006-2008), and Senior Vice President, Deputy General Counsel and Group Head for FMR LLC (2005-2006). |
Christine Reynolds (53) | |
| Year of Election or Appointment: 2008 Chief Financial Officer of the Fidelity funds. Ms. Reynolds became President of Fidelity Pricing and Cash Management Services (FPCMS) in August 2008. Ms. Reynolds served as Chief Operating Officer of FPCMS (2007-2008). Previously, Ms. Reynolds served as President, Treasurer, and Anti-Money Laundering officer of the Fidelity funds (2004-2007). |
Kenneth A. Rathgeber (64) | |
| Year of Election or Appointment: 2004 Chief Compliance Officer of Fidelity's Equity and High Income Funds. Mr. Rathgeber is Chief Compliance Officer of Fidelity Management & Research (Hong Kong) Limited (2008-present), Fidelity Management & Research (Japan) Inc. (2008-present), FMR (2005-present), FMR Co., Inc. (2005-present), Fidelity Management & Research (U.K.) Inc. (2005-present), Fidelity Research & Analysis Company (2005-present), Fidelity Investments Money Management, Inc. (2005-present), Pyramis Global Advisors, LLC (2005-present), and Strategic Advisers, Inc. (2005-present). |
Joseph F. Zambello (54) | |
| Year of Election or Appointment: 2011 Deputy Treasurer of the Fidelity funds. Mr. Zambello is an employee of Fidelity Investments. Previously, Mr. Zambello served as Vice President of FMR's Program Management Group (2009-2011) and Vice President of the Transfer Agent Oversight Group (2005-2009). |
Adrien E. Deberghes (44) | |
| Year of Election or Appointment: 2008 Deputy Treasurer of Fidelity's Equity and High Income Funds. Mr. Deberghes also serves as Vice President and Assistant Treasurer of Fidelity Rutland Square Trust II and Fidelity Commonwealth Trust II (2011-present), Assistant Treasurer of other Fidelity funds (2010-present), and is an employee of Fidelity Investments (2008-present). Previously, Mr. Deberghes served as Senior Vice President of Mutual Fund Administration at State Street Corporation (2007-2008), Senior Director of Mutual Fund Administration at Investors Bank & Trust (2005-2007), and Director of Finance for Dunkin' Brands (2000-2005). |
Stephanie J. Dorsey (42) | |
| Year of Election or Appointment: 2010 Assistant Treasurer of Fidelity's Equity and High Income Funds. Ms. Dorsey also serves as Deputy Treasurer of other Fidelity funds (2008-present) and is an employee of Fidelity Investments (2008-present). Previously, Ms. Dorsey served as Treasurer (2004-2008) of the JPMorgan Mutual Funds and Vice President (2004-2008) of JPMorgan Chase Bank. |
John R. Hebble (53) | |
| Year of Election or Appointment: 2009 Assistant Treasurer of Fidelity's Equity and High Income Funds. Mr. Hebble also serves as President (2011-present), Treasurer, and Chief Financial Officer of The North Carolina Capital Management Trust: Cash and Term Portfolios (2008-present), President and Treasurer of other Fidelity funds (2008-present) and is an employee of Fidelity Investments. |
Gary W. Ryan (53) | |
| Year of Election or Appointment: 2005 Assistant Treasurer of the Fidelity funds. Mr. Ryan is an employee of Fidelity Investments. Previously, Mr. Ryan served as Vice President of Fund Reporting in Fidelity Pricing and Cash Management Services (FPCMS) (1999-2005). |
Jonathan Davis (43) | |
| Year of Election or Appointment: 2010 Assistant Treasurer of the Fidelity funds. Mr. Davis is also Assistant Treasurer of Fidelity Rutland Square Trust II and Fidelity Commonwealth Trust II. Mr. Davis is an employee of Fidelity Investments. Previously, Mr. Davis served as Vice President and Associate General Counsel of FMR LLC (2003-2010). |
Annual Report
Distributions (Unaudited)
Class A and T designate 100% of the dividends distributed during the fiscal year as qualifying for the dividends-received deduction for corporate shareholders.
Class A and T designate 100% of the dividends distributed during the fiscal year as amounts which may be taken into account as a dividend for purposes of the maximum rate under section 1(h)(11) of the Internal Revenue Code.
The fund will notify shareholders in January 2013 of amounts for use in preparing 2012 income tax returns.
Annual Report
Investment Adviser
Fidelity Management & Research Company
Boston, MA
Investment Sub-Advisers
FMR Co., Inc.
Fidelity Management & Research
(U.K.) Inc.
Fidelity Management & Research
(Hong Kong) Limited
Fidelity Management & Research
(Japan) Inc.
General Distributor
Fidelity Distributors Corporation
Boston, MA
Transfer and Service Agents
Fidelity Investments Institutional Operations Company, Inc.
Boston, MA
Fidelity Service Company, Inc.
Boston, MA
Custodian
Citibank, N.A.
New York, NY
AMCV-UANN-0312
1.838439.102
(Fidelity Investment logo)(registered trademark)
(Fidelity Investment logo)(registered trademark)
Fidelity Advisor®
Mid Cap Value
Fund - Institutional Class
Annual Report
January 31, 2012
(Fidelity Cover Art)
Institutional Class is a class of
Fidelity® Mid Cap Value Fund
Contents
Chairman's Message | The Chairman's message to shareholders. | |
Performance | How the fund has done over time. | |
Management's Discussion of Fund Performance | The Portfolio Manager's review of fund performance and strategy. | |
Shareholder Expense Example | An example of shareholder expenses. | |
Investment Changes | A summary of major shifts in the fund's investments over the past six months. | |
Investments | A complete list of the fund's investments with their market values. | |
Financial Statements | Statements of assets and liabilities, operations, and changes in net assets, as well as financial highlights. | |
Notes | Notes to the financial statements. | |
Report of Independent Registered Public Accounting Firm |
| |
Trustees and Officers |
| |
Distributions |
|
To view a fund's proxy voting guidelines and proxy voting record for the 12-month period ended June 30, visit http://www.fidelity.com/proxyvotingresults or visit the Securities and Exchange Commission's (SEC) web site at http://www.sec.gov. You may also call 1-877-208-0098 to request a free copy of the proxy voting guidelines.
Standard & Poor's, S&P and S&P 500 are registered service marks of The McGraw-Hill Companies, Inc. and have been licensed for use by Fidelity Distributors Corporation.
Other third party marks appearing herein are the property of their respective owners.
All other marks appearing herein are registered or unregistered trademarks or service marks of FMR LLC or an affiliated company.
Annual Report
This report and the financial statements contained herein are submitted for the general information of the shareholders of the fund. This report is not authorized for distribution to prospective investors in the fund unless preceded or accompanied by an effective prospectus.
A fund files its complete schedule of portfolio holdings with the SEC for the first and third quarters of each fiscal year on Form N-Q. Forms N-Q are available on the SEC's web site at http://www.sec.gov. A fund's Forms N-Q may be reviewed and copied at the SEC's Public Reference Room in Washington, DC. Information regarding the operation of the SEC's Public Reference Room may be obtained by calling 1-800-SEC-0330. For a complete list of a fund's portfolio holdings, view the most recent holdings listing, semiannual report, or annual report on Fidelity's web site at http://www.fidelity.com, http://www.advisor.fidelity.com, or http://www.401k.com, as applicable.
NOT FDIC INSURED • MAY LOSE VALUE • NO BANK GUARANTEE
Neither the fund nor Fidelity Distributors Corporation is a bank.
Annual Report
Chairman's Message
(photo_of_James_C_Curvey)
Dear Shareholder:
Following a year marked by unusually high volatility, 2012 began with most major asset classes advancing steadily in January. For U.S. equities, it was the strongest start to a new year since 1997. International stocks fared even better, despite continued uncertainty related to the sovereign debt crisis in Europe. Investors have been acutely sensitive to the latest news, for better or worse, coming out of the eurozone and its impact on financial markets. As we look ahead, the unresolved debt crisis in Europe remains at the center of a series of risk factors, summarized below, that we believe have the greatest potential to influence the global investment landscape.
Deleveraging and the economy
In the euro-currency area, fiscal austerity among nations and debt deleveraging among financial companies loaded with sovereign debt are deflationary measures and serve to hinder economic growth in the short term. Such an economic and financial-market scenario has not been historically supportive of strong performance among riskier assets, and emerges at a time when many nations need a resurgent economy to assist them in closing their budget deficits and in building confidence among bond buyers to help them refinance their existing debt obligations.
Slowdown in China and Europe
China's economy is the second-largest in the world, and it has been the biggest contributor to global growth since the end of the last recession. Thus, the slower pace of domestic growth in China has led to lower demand for imports of commodities and other construction materials from the rest of the world. In addition, economic weakness in Europe and the broad-based global economic slowdown are putting pressure on China's export growth, which has been largely responsible for its breakneck pace of annual gross domestic product (GDP) growth during the past three decades.
Credit deterioration and contagion
The heightened macroeconomic risk and elevated credit risk swirling around certain European nations and financial institutions have caused many market participants to avoid purchases of or reduce exposure to short-term debt offerings by these issuers. With increased credit risk, there are growing concerns about the potential credit contraction and contagion from European issuers spreading to other financial markets.
We invite you to learn more by visiting us on the Internet or calling us by phone. It is our privilege to provide the resources you need to choose investments that are right for you.
Sincerely,
(The acting chairman's signature appears here.)
James C. Curvey
Acting Chairman
Annual Report
Performance: The Bottom Line
Average annual total return reflects the change in the value of an investment, assuming reinvestment of the class' distributions from dividend income and capital gains (the profits earned upon the sale of securities that have grown in value, if any) and assuming a constant rate of performance each year. The $10,000 table and the fund's returns do not reflect the deduction of taxes that a shareholder would pay on fund distributions or the redemption of fund shares. During periods of reimbursement by Fidelity, a fund's total return will be greater than it would be had the reimbursement not occurred. How a fund did yesterday is no guarantee of how it will do tomorrow.
Average Annual Total Returns
Periods ended January 31, 2012 | Past 1 | Past 5 | Past 10 |
Institutional Class A | -1.07% | 0.26% | 6.70% |
A The initial offering of Institutional Class shares took place on February 13, 2007. Returns prior to February 13, 2007 are those of Fidelity® Mid Cap Value Fund, the original class of the fund.
$10,000 Over 10 Years
Let's say hypothetically that $10,000 was invested in Fidelity Advisor® Mid Cap Value Fund - Institutional Class on January 31, 2002. The chart shows how the value of your investment would have changed, and also shows how the Russell Midcap® Value Index performed over the same period. The initial offering of Institutional Class took place on February 13, 2007. See above for additional information regarding the performance of Institutional Class.
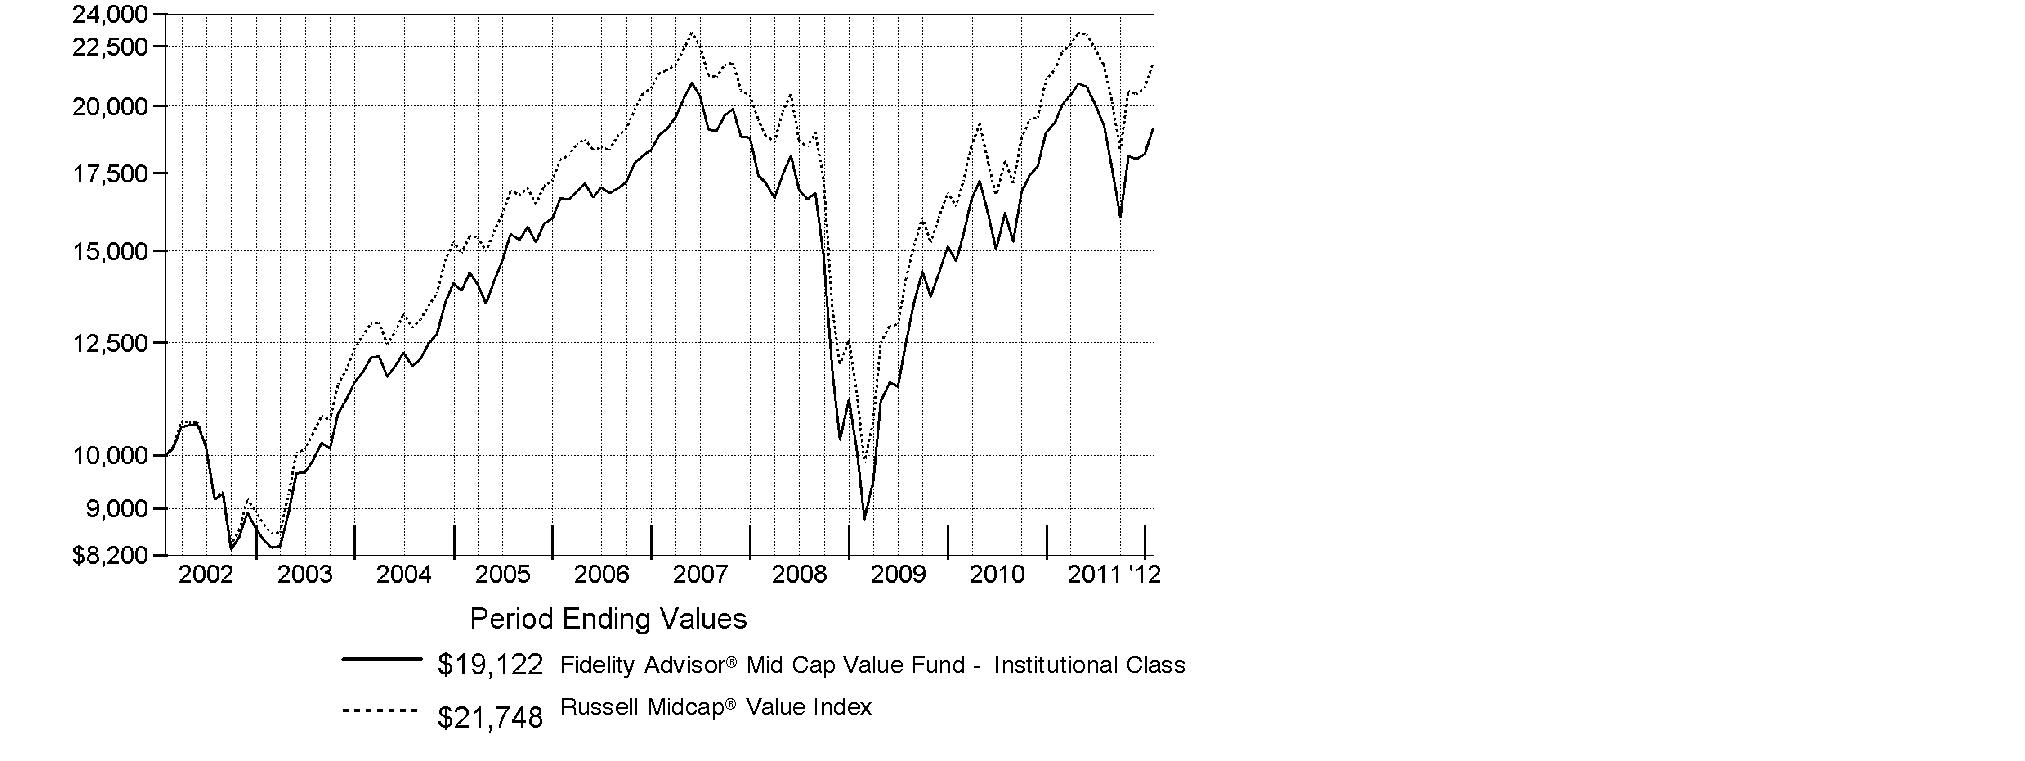
Annual Report
Management's Discussion of Fund Performance
Market Recap: After enduring one of the most volatile trading periods on record, U.S. stocks posted a gain for the 12 months ending January 31, 2012, sparked by a January rally. Strong corporate earnings reports and hints of economic recovery sent stocks mostly upward through April, when sovereign debt woes in Europe sparked fear of a global slowdown. In the summer, equities plummeted on eurozone instability, debate over the U.S. debt ceiling and a historic downgrade of the nation's sovereign debt rating. After falling as much as 13% by early August, the broad-based S&P 500® Index seesawed back to end the period on an optimistic note. For the full 12 months, the S&P 500® rose 4.22%, while the technology-laden Nasdaq Composite® Index added 5.26%. Investors began to shed perceived riskier smaller-cap stocks in favor of larger, more-established and dividend-paying names, helping to drive the Dow Jones® Industrial Average up 9.12% for the year, while the Russell 2000® - a proxy for small-caps - and Russell Midcap® indexes added 2.86% and 2.25%, respectively. Within the S&P 500®, defensive sectors such as health care (+16%) and utilities (+14%) fared best, while financials (-12%) struggled. Foreign developed-markets stocks were stung by Europe's turmoil, and the MSCI® EAFE® (Europe, Australasia, Far East) Index fell 9.49%.
Comments from Bruce Dirks, Portfolio Manager of Fidelity Advisor® Mid Cap Value Fund: For the year, the fund's Institutional Class shares returned -1.07%, trailing the 1.19% gain of the Russell Midcap® Value Index. Weak stock picking in insurance and banks, coupled with adverse positioning within capital goods and utilities, were the biggest detractors from relative performance. On the plus side, security selection in consumer discretionary, health care and materials boosted relative results. From a market-capitalization perspective, stock picks among mid-cap companies in the $2 billion to $5 billion range helped the fund's return, while choices among those with a capitalization greater than $5 billion hurt. Individual relative detractors included untimely trading in the shares of electric utility PPL, along with airbag and safety equipment supplier TRW Automotive Holdings, regional bank SunTrust Banks, and an out-of-benchmark stake in integrated energy producer Hess. The top individual contributors versus the benchmark were Goodrich, a supplier of components and systems to commercial aircraft manufacturers, department store operator Macy's and apparel company VF. PPL and Goodrich were not held at period end.
Annual Report
The views expressed above reflect those of the portfolio manager(s) only through the end of the period as stated on the cover of this report and do not necessarily represent the views of Fidelity or any other person in the Fidelity organization. Any such views are subject to change at any time based upon market or other conditions and Fidelity disclaims any responsibility to update such views. These views may not be relied on as investment advice and, because investment decisions for a Fidelity fund are based on numerous factors, may not be relied on as an indication of trading intent on behalf of any Fidelity fund.
Annual Report
Shareholder Expense Example
As a shareholder of the Fund, you incur two types of costs: (1) transaction costs, including sales charges (loads) on purchase payments or redemption proceeds, redemption fees, and (2) ongoing costs, including management fees, distribution and/or service (12b-1) fees and other Fund expenses. This Example is intended to help you understand your ongoing costs (in dollars) of investing in the Fund and to compare these costs with the ongoing costs of investing in other mutual funds.
The Example is based on an investment of $1,000 invested at the beginning of the period and held for the entire period (August 1, 2011 to January 31, 2012).
Actual Expenses
The first line of the accompanying table for each class of the Fund provides information about actual account values and actual expenses. You may use the information in this line, together with the amount you invested, to estimate the expenses that you paid over the period. Simply divide your account value by $1,000.00 (for example, an $8,600 account value divided by $1,000.00 = 8.6), then multiply the result by the number in the first line for a class of the Fund under the heading entitled "Expenses Paid During Period" to estimate the expenses you paid on your account during this period. A small balance maintenance fee of $12.00 that is charged once a year may apply for certain accounts with a value of less than $2,000. This fee is not included in the table below. If it was, the estimate of expenses you paid during the period would be higher, and your ending account value lower, by this amount. In addition, the Fund, as a shareholder in the underlying Fidelity Central Funds, will indirectly bear its pro-rata share of the fees and expenses incurred by the underlying Fidelity Central Funds. These fees and expenses are not included in the Fund's annualized expense ratio used to calculate the expense estimate in the table below.
Hypothetical Example for Comparison Purposes
The second line of the accompanying table for each class of the Fund provides information about hypothetical account values and hypothetical expenses based on a Class' actual expense ratio and an assumed rate of return of 5% per year before expenses, which is not the Class' actual return. The hypothetical account values and expenses may not be used to estimate the actual ending account balance or expenses you paid for the period. You may use this information to compare the ongoing costs of investing in the Fund and other funds. To do so, compare this 5% hypothetical example with the 5% hypothetical examples that appear in the shareholder reports of the other funds. A small balance maintenance fee of $12.00 that is charged once a year may apply for certain accounts with a value of less than $2,000. This fee is not included in the table below. If it was, the estimate of expenses you paid during the period would be higher, and your ending account value lower, by this amount. In addition, the Fund, as a shareholder in the underlying Fidelity Central Funds, will indirectly bear its pro-rata share of the fees and expenses incurred by the underlying Fidelity Central Funds. These fees and expenses are not included in the Fund's annualized expense ratio used to calculate the expense estimate in the table below.
Please note that the expenses shown in the table are meant to highlight your ongoing costs only and do not reflect any transaction costs. Therefore, the second line of the table is useful in comparing ongoing costs only, and will not help you determine the relative total costs of owning different funds. In addition, if these transactional costs were included, your costs would have been higher.
Annual Report
| Annualized | Beginning | Ending | Expenses Paid |
Class A | 1.16% |
|
|
|
Actual |
| $ 1,000.00 | $ 992.10 | $ 5.82 |
HypotheticalA |
| $ 1,000.00 | $ 1,019.36 | $ 5.90 |
Class T | 1.43% |
|
|
|
Actual |
| $ 1,000.00 | $ 990.90 | $ 7.18 |
HypotheticalA |
| $ 1,000.00 | $ 1,018.00 | $ 7.27 |
Class B | 1.91% |
|
|
|
Actual |
| $ 1,000.00 | $ 988.70 | $ 9.57 |
HypotheticalA |
| $ 1,000.00 | $ 1,015.58 | $ 9.70 |
Class C | 1.91% |
|
|
|
Actual |
| $ 1,000.00 | $ 988.60 | $ 9.57 |
HypotheticalA |
| $ 1,000.00 | $ 1,015.58 | $ 9.70 |
Mid Cap Value | .88% |
|
|
|
Actual |
| $ 1,000.00 | $ 993.90 | $ 4.42 |
HypotheticalA |
| $ 1,000.00 | $ 1,020.77 | $ 4.48 |
Institutional Class | .90% |
|
|
|
Actual |
| $ 1,000.00 | $ 993.60 | $ 4.52 |
HypotheticalA |
| $ 1,000.00 | $ 1,020.67 | $ 4.58 |
A 5% return per year before expenses
* Expenses are equal to each Class' annualized expense ratio, multiplied by the average account value over the period, multiplied by 184/365 (to reflect the one-half year period).
Annual Report
Investment Changes (Unaudited)
Top Ten Stocks as of January 31, 2012 | ||
| % of fund's | % of fund's net assets |
Edison International | 1.7 | 1.6 |
Sempra Energy | 1.7 | 1.6 |
Discover Financial Services | 1.7 | 1.6 |
Macy's, Inc. | 1.6 | 1.1 |
Valero Energy Corp. | 1.6 | 1.7 |
Humana, Inc. | 1.5 | 1.4 |
Republic Services, Inc. | 1.5 | 1.3 |
ConAgra Foods, Inc. | 1.5 | 0.0 |
Lorillard, Inc. | 1.5 | 1.5 |
Clorox Co. | 1.4 | 0.0 |
| 15.7 | |
Top Five Market Sectors as of January 31, 2012 | ||
| % of fund's | % of fund's net assets |
Financials | 30.7 | 30.9 |
Utilities | 13.4 | 12.0 |
Consumer Discretionary | 11.0 | 11.2 |
Industrials | 10.6 | 10.2 |
Information Technology | 8.2 | 8.6 |
Asset Allocation (% of fund's net assets) | |||||||
As of January 31, 2012* | As of July 31, 2011** | ||||||
| Stocks 99.5% |
| | Stocks 99.7% |
| ||
| Short-Term |
| | Short-Term |
| ||
* Foreign investments | 3.1% |
| ** Foreign investments | 2.1% |
| ||

Annual Report
Investments January 31, 2012
Showing Percentage of Net Assets
Common Stocks - 99.5% | |||
Shares | Value | ||
CONSUMER DISCRETIONARY - 11.0% | |||
Auto Components - 1.1% | |||
TRW Automotive Holdings Corp. (a) | 168,700 | $ 6,329,624 | |
Hotels, Restaurants & Leisure - 0.9% | |||
Brinker International, Inc. (d) | 212,200 | 5,485,370 | |
Household Durables - 0.7% | |||
Jarden Corp. | 113,800 | 3,833,922 | |
Media - 1.6% | |||
CBS Corp. Class B | 164,300 | 4,679,264 | |
DISH Network Corp. Class A | 174,200 | 4,863,664 | |
| 9,542,928 | ||
Multiline Retail - 1.6% | |||
Macy's, Inc. | 282,500 | 9,517,425 | |
Specialty Retail - 2.9% | |||
Best Buy Co., Inc. | 209,300 | 5,012,735 | |
Foot Locker, Inc. | 270,500 | 7,097,920 | |
GameStop Corp. Class A (a)(d) | 219,300 | 5,122,848 | |
| 17,233,503 | ||
Textiles, Apparel & Luxury Goods - 2.2% | |||
PVH Corp. | 91,818 | 7,087,431 | |
VF Corp. | 45,900 | 6,035,391 | |
| 13,122,822 | ||
TOTAL CONSUMER DISCRETIONARY | 65,065,594 | ||
CONSUMER STAPLES - 7.0% | |||
Beverages - 1.0% | |||
Dr Pepper Snapple Group, Inc. | 155,200 | 6,024,864 | |
Food Products - 3.1% | |||
Campbell Soup Co. | 154,500 | 4,897,650 | |
ConAgra Foods, Inc. | 325,400 | 8,678,418 | |
Ralcorp Holdings, Inc. (a) | 50,100 | 4,381,245 | |
| 17,957,313 | ||
Household Products - 1.4% | |||
Clorox Co. | 123,500 | 8,479,510 | |
Tobacco - 1.5% | |||
Lorillard, Inc. | 80,500 | 8,644,895 | |
TOTAL CONSUMER STAPLES | 41,106,582 | ||
Common Stocks - continued | |||
Shares | Value | ||
ENERGY - 7.1% | |||
Energy Equipment & Services - 1.6% | |||
Helmerich & Payne, Inc. | 93,300 | $ 5,757,543 | |
Oil States International, Inc. (a) | 44,900 | 3,578,081 | |
| 9,335,624 | ||
Oil, Gas & Consumable Fuels - 5.5% | |||
Hess Corp. | 79,100 | 4,453,330 | |
Marathon Oil Corp. | 185,800 | 5,832,262 | |
Murphy Oil Corp. | 122,600 | 7,306,960 | |
Tesoro Corp. (a) | 227,100 | 5,684,313 | |
Valero Energy Corp. | 390,500 | 9,368,095 | |
| 32,644,960 | ||
TOTAL ENERGY | 41,980,584 | ||
FINANCIALS - 30.7% | |||
Capital Markets - 1.4% | |||
Ameriprise Financial, Inc. | 151,300 | 8,102,115 | |
Commercial Banks - 6.2% | |||
CapitalSource, Inc. | 513,100 | 3,545,521 | |
Comerica, Inc. | 214,600 | 5,937,982 | |
Huntington Bancshares, Inc. | 1,013,600 | 5,787,656 | |
KeyCorp | 995,900 | 7,738,143 | |
Regions Financial Corp. | 1,214,800 | 6,341,256 | |
SunTrust Banks, Inc. | 366,600 | 7,540,962 | |
| 36,891,520 | ||
Consumer Finance - 3.1% | |||
Discover Financial Services | 363,800 | 9,888,084 | |
SLM Corp. | 563,400 | 8,422,830 | |
| 18,310,914 | ||
Diversified Financial Services - 1.0% | |||
Leucadia National Corp. | 221,000 | 6,134,960 | |
Insurance - 7.2% | |||
Allied World Assurance Co. Holdings Ltd. | 82,900 | 5,100,837 | |
Assurant, Inc. | 167,100 | 6,617,160 | |
Hartford Financial Services Group, Inc. | 383,600 | 6,720,672 | |
Lincoln National Corp. | 306,900 | 6,610,626 | |
Torchmark Corp. | 129,500 | 5,914,265 | |
Unum Group | 219,600 | 5,013,468 | |
Validus Holdings Ltd. | 205,600 | 6,593,592 | |
| 42,570,620 | ||
Common Stocks - continued | |||
Shares | Value | ||
FINANCIALS - continued | |||
Real Estate Investment Trusts - 10.6% | |||
American Capital Agency Corp. | 170,700 | $ 5,004,924 | |
BRE Properties, Inc. | 110,700 | 5,736,474 | |
Douglas Emmett, Inc. | 325,900 | 6,814,569 | |
Essex Property Trust, Inc. | 36,200 | 5,212,800 | |
Kimco Realty Corp. | 436,700 | 7,969,775 | |
Prologis, Inc. | 229,500 | 7,277,445 | |
Rayonier, Inc. | 127,800 | 5,844,294 | |
SL Green Realty Corp. | 66,800 | 4,911,804 | |
The Macerich Co. | 134,000 | 7,276,200 | |
Ventas, Inc. | 109,000 | 6,355,790 | |
| 62,404,075 | ||
Thrifts & Mortgage Finance - 1.2% | |||
People's United Financial, Inc. | 552,200 | 6,808,626 | |
TOTAL FINANCIALS | 181,222,830 | ||
HEALTH CARE - 5.9% | |||
Health Care Providers & Services - 4.5% | |||
Community Health Systems, Inc. (a) | 311,800 | 5,830,660 | |
Health Net, Inc. (a) | 191,200 | 7,215,888 | |
Humana, Inc. | 100,800 | 8,973,216 | |
McKesson Corp. | 56,600 | 4,625,352 | |
| 26,645,116 | ||
Pharmaceuticals - 1.4% | |||
Mylan, Inc. (a) | 155,800 | 3,232,850 | |
Watson Pharmaceuticals, Inc. (a) | 82,100 | 4,813,523 | |
| 8,046,373 | ||
TOTAL HEALTH CARE | 34,691,489 | ||
INDUSTRIALS - 10.6% | |||
Aerospace & Defense - 2.7% | |||
Alliant Techsystems, Inc. | 57,100 | 3,392,311 | |
Esterline Technologies Corp. (a) | 75,400 | 4,610,710 | |
Textron, Inc. | 309,300 | 7,880,964 | |
| 15,883,985 | ||
Airlines - 0.8% | |||
Alaska Air Group, Inc. (a) | 59,500 | 4,529,735 | |
Common Stocks - continued | |||
Shares | Value | ||
INDUSTRIALS - continued | |||
Commercial Services & Supplies - 2.2% | |||
Pitney Bowes, Inc. (d) | 207,100 | $ 3,928,687 | |
Republic Services, Inc. | 303,500 | 8,886,480 | |
| 12,815,167 | ||
Construction & Engineering - 1.7% | |||
Fluor Corp. | 56,900 | 3,200,056 | |
KBR, Inc. | 223,900 | 7,196,146 | |
| 10,396,202 | ||
Machinery - 2.3% | |||
Cummins, Inc. | 56,100 | 5,834,400 | |
Parker Hannifin Corp. | 98,600 | 7,955,048 | |
| 13,789,448 | ||
Professional Services - 0.9% | |||
Towers Watson & Co. | 87,500 | 5,232,500 | |
TOTAL INDUSTRIALS | 62,647,037 | ||
INFORMATION TECHNOLOGY - 8.2% | |||
Communications Equipment - 1.6% | |||
Brocade Communications Systems, Inc. (a) | 932,600 | 5,231,886 | |
Motorola Solutions, Inc. | 93,800 | 4,353,258 | |
| 9,585,144 | ||
Computers & Peripherals - 1.3% | |||
SanDisk Corp. (a) | 166,600 | 7,643,608 | |
Electronic Equipment & Components - 0.8% | |||
Jabil Circuit, Inc. | 202,600 | 4,590,916 | |
IT Services - 0.5% | |||
Alliance Data Systems Corp. (a)(d) | 27,200 | 3,013,760 | |
Office Electronics - 1.3% | |||
Xerox Corp. | 968,100 | 7,502,775 | |
Semiconductors & Semiconductor Equipment - 2.7% | |||
KLA-Tencor Corp. | 98,400 | 5,031,192 | |
Marvell Technology Group Ltd. (a) | 432,600 | 6,718,278 | |
Skyworks Solutions, Inc. (a) | 208,600 | 4,501,588 | |
| 16,251,058 | ||
TOTAL INFORMATION TECHNOLOGY | 48,587,261 | ||
Common Stocks - continued | |||
Shares | Value | ||
MATERIALS - 4.9% | |||
Chemicals - 2.7% | |||
Ashland, Inc. | 94,600 | $ 5,965,476 | |
CF Industries Holdings, Inc. | 36,300 | 6,438,894 | |
W.R. Grace & Co. (a) | 61,000 | 3,265,940 | |
| 15,670,310 | ||
Containers & Packaging - 1.2% | |||
Ball Corp. | 78,700 | 3,089,762 | |
Rock-Tenn Co. Class A | 69,700 | 4,311,642 | |
| 7,401,404 | ||
Metals & Mining - 1.0% | |||
Commercial Metals Co. | 145,800 | 2,090,772 | |
Reliance Steel & Aluminum Co. | 73,900 | 3,931,480 | |
| 6,022,252 | ||
TOTAL MATERIALS | 29,093,966 | ||
TELECOMMUNICATION SERVICES - 0.7% | |||
Diversified Telecommunication Services - 0.7% | |||
Frontier Communications Corp. (d) | 909,300 | 3,891,804 | |
UTILITIES - 13.4% | |||
Electric Utilities - 5.0% | |||
Cleco Corp. | 65,300 | 2,596,328 | |
Edison International | 243,400 | 9,989,137 | |
El Paso Electric Co. | 162,700 | 5,661,960 | |
NV Energy, Inc. | 352,800 | 5,715,360 | |
PNM Resources, Inc. | 311,400 | 5,546,034 | |
| 29,508,819 | ||
Independent Power Producers & Energy Traders - 0.9% | |||
The AES Corp. (a) | 427,800 | 5,458,728 | |
Multi-Utilities - 7.5% | |||
Alliant Energy Corp. | 172,500 | 7,312,275 | |
CenterPoint Energy, Inc. | 366,400 | 6,767,408 | |
CMS Energy Corp. | 284,100 | 6,201,903 | |
NiSource, Inc. | 280,000 | 6,364,400 | |
Common Stocks - continued | |||
Shares | Value | ||
UTILITIES - continued | |||
Multi-Utilities - continued | |||
OGE Energy Corp. | 138,800 | $ 7,336,968 | |
Sempra Energy | 175,500 | 9,985,950 | |
| 43,968,904 | ||
TOTAL UTILITIES | 78,936,451 | ||
TOTAL COMMON STOCKS (Cost $565,672,480) |
| ||
Money Market Funds - 2.4% | |||
|
|
|
|
Fidelity Cash Central Fund, 0.12% (b) | 2,261,261 | 2,261,261 | |
Fidelity Securities Lending Cash Central Fund, 0.12% (b)(c) | 12,055,542 | 12,055,542 | |
TOTAL MONEY MARKET FUNDS (Cost $14,316,803) |
| ||
TOTAL INVESTMENT PORTFOLIO - 101.9% (Cost $579,989,283) | 601,540,401 | ||
NET OTHER ASSETS (LIABILITIES) - (1.9)% | (11,148,830) | ||
NET ASSETS - 100% | $ 590,391,571 | ||
Legend |
(a) Non-income producing |
(b) Affiliated fund that is available only to investment companies and other accounts managed by Fidelity Investments. The rate quoted is the annualized seven-day yield of the fund at period end. A complete unaudited listing of the fund's holdings as of its most recent quarter end is available upon request. In addition, each Fidelity Central Fund's financial statements, which are not covered by the Fund's Report of Independent Registered Public Accounting Firm, are available on the SEC's website or upon request. |
(c) Investment made with cash collateral received from securities on loan. |
(d) Security or a portion of the security is on loan at period end. |
Affiliated Central Funds |
Information regarding fiscal year to date income earned by the Fund from investments in Fidelity Central Funds is as follows: |
Fund | Income earned |
Fidelity Cash Central Fund | $ 4,244 |
Fidelity Securities Lending Cash Central Fund | 26,327 |
Total | $ 30,571 |
Other Information |
All investments are categorized as Level 1 under the Fair Value Hierarchy. The inputs or methodology used for valuing securities may not be an indication of the risk associated with investing in those securities. For more information on valuation inputs, please refer to the Security Valuation section in the accompanying Notes to Financial Statements. |
See accompanying notes which are an integral part of the financial statements.
Annual Report
Financial Statements
Statement of Assets and Liabilities
| January 31, 2012 | |
|
|
|
Assets | ||
Investment in securities, at value (including securities loaned of $11,629,259) - See accompanying schedule: Unaffiliated issuers (cost $565,672,480) | $ 587,223,598 |
|
Fidelity Central Funds (cost $14,316,803) | 14,316,803 |
|
Total Investments (cost $579,989,283) |
| $ 601,540,401 |
Receivable for investments sold | 5,922,361 | |
Receivable for fund shares sold | 503,414 | |
Dividends receivable | 465,532 | |
Distributions receivable from Fidelity Central Funds | 1,597 | |
Prepaid expenses | 1,626 | |
Other receivables | 22,353 | |
Total assets | 608,457,284 | |
|
|
|
Liabilities | ||
Payable to custodian bank | $ 41,147 | |
Payable for investments purchased | 4,574,379 | |
Payable for fund shares redeemed | 950,312 | |
Accrued management fee | 241,778 | |
Distribution and service plan fees payable | 12,070 | |
Other affiliated payables | 141,985 | |
Other payables and accrued expenses | 48,500 | |
Collateral on securities loaned, at value | 12,055,542 | |
Total liabilities | 18,065,713 | |
|
|
|
Net Assets | $ 590,391,571 | |
Net Assets consist of: |
| |
Paid in capital | $ 631,279,726 | |
Distributions in excess of net investment income | (137,586) | |
Accumulated undistributed net realized gain (loss) on investments | (62,301,687) | |
Net unrealized appreciation (depreciation) on investments | 21,551,118 | |
Net Assets | $ 590,391,571 | |
See accompanying notes which are an integral part of the financial statements.
Annual Report
Financial Statements - continued
Statement of Assets and Liabilities - continued
| January 31, 2012 | |
|
|
|
Calculation of Maximum Offering Price Class A: | $ 15.87 | |
|
|
|
Maximum offering price per share (100/94.25 of $15.87) | $ 16.84 | |
Class T: | $ 15.84 | |
|
|
|
Maximum offering price per share (100/96.50 of $15.84) | $ 16.41 | |
Class B: | $ 15.71 | |
|
|
|
Class C: | $ 15.65 | |
|
|
|
Mid Cap Value: | $ 15.97 | |
|
|
|
Institutional Class: | $ 15.91 | |
A Redemption price per share is equal to net asset value less any applicable contingent deferred sales charge.
See accompanying notes which are an integral part of the financial statements.
Annual Report
Statement of Operations
| Year ended January 31, 2012 | |
|
|
|
Investment Income |
|
|
Dividends |
| $ 10,284,144 |
Interest |
| 94 |
Income from Fidelity Central Funds |
| 30,571 |
Total income |
| 10,314,809 |
|
|
|
Expenses | ||
Management fee | $ 3,588,402 | |
Performance adjustment | (6,368) | |
Transfer agent fees | 1,694,073 | |
Distribution and service plan fees | 154,185 | |
Accounting and security lending fees | 236,372 | |
Custodian fees and expenses | 28,521 | |
Independent trustees' compensation | 3,756 | |
Registration fees | 72,124 | |
Audit | 54,963 | |
Legal | 2,193 | |
Interest | 529 | |
Miscellaneous | 6,596 | |
Total expenses before reductions | 5,835,346 | |
Expense reductions | (65,968) | 5,769,378 |
Net investment income (loss) | 4,545,431 | |
Realized and Unrealized Gain (Loss) Net realized gain (loss) on: | ||
Investment securities: |
|
|
Unaffiliated issuers |
| 70,353,241 |
Change in net unrealized appreciation (depreciation) on investment securities | (90,350,275) | |
Net gain (loss) | (19,997,034) | |
Net increase (decrease) in net assets resulting from operations | $ (15,451,603) | |
See accompanying notes which are an integral part of the financial statements.
Annual Report
Financial Statements - continued
Statement of Changes in Net Assets
| Year ended | Year ended |
Increase (Decrease) in Net Assets |
|
|
Operations |
|
|
Net investment income (loss) | $ 4,545,431 | $ 1,552,041 |
Net realized gain (loss) | 70,353,241 | 100,225,944 |
Change in net unrealized appreciation (depreciation) | (90,350,275) | 59,481,106 |
Net increase (decrease) in net assets resulting | (15,451,603) | 161,259,091 |
Distributions to shareholders from net investment income | (4,101,848) | (2,444,386) |
Share transactions - net increase (decrease) | (97,570,396) | 57,906,539 |
Redemption fees | 28,676 | 31,710 |
Total increase (decrease) in net assets | (117,095,171) | 216,752,954 |
|
|
|
Net Assets | ||
Beginning of period | 707,486,742 | 490,733,788 |
End of period (including distributions in excess of net investment income of $137,586 and distributions in excess of net investment income of $543,496, respectively) | $ 590,391,571 | $ 707,486,742 |
See accompanying notes which are an integral part of the financial statements.
Annual Report
Financial Highlights - Class A
Years ended January 31, | 2012 | 2011 | 2010 | 2009 | 2008 H |
Selected Per-Share Data |
|
|
|
|
|
Net asset value, beginning of period | $ 16.16 | $ 12.35 | $ 8.53 | $ 15.05 | $ 17.63 |
Income from Investment Operations |
|
|
|
|
|
Net investment income (loss) E | .07 | - J | .07 | .09 | .03 |
Net realized and unrealized gain (loss) | (.29) | 3.85 | 3.84 | (6.47) | (1.78) |
Total from investment operations | (.22) | 3.85 | 3.91 | (6.38) | (1.75) |
Distributions from net investment income | (.07) | (.04) | (.09) | (.14) | (.06) |
Distributions from net realized gain | - | - | - | - J | (.77) |
Total distributions | (.07) | (.04) | (.09) | (.14) | (.83) |
Redemption fees added to paid in capital E, J | - | - | - | - | - |
Net asset value, end of period | $ 15.87 | $ 16.16 | $ 12.35 | $ 8.53 | $ 15.05 |
Total Return B, C, D | (1.34)% | 31.14% | 45.79% | (42.40)% | (10.28)% |
Ratios to Average Net Assets F, I |
|
|
|
|
|
Expenses before reductions | 1.17% | 1.17% | 1.21% | 1.12% | 1.14% A |
Expenses net of fee waivers, if any | 1.17% | 1.17% | 1.21% | 1.12% | 1.14% A |
Expenses net of all reductions | 1.16% | 1.17% | 1.20% | 1.12% | 1.13% A |
Net investment income (loss) | .44% | .02% | .62% | .71% | .16% A |
Supplemental Data |
|
|
|
|
|
Net assets, end of period (000 omitted) | $ 19,578 | $ 23,608 | $ 10,640 | $ 6,404 | $ 7,445 |
Portfolio turnover rate G | 173% | 133% | 202% | 268% | 264% |
A Annualized
B Total returns for periods of less than one year are not annualized.
C Total returns would have been lower if certain expenses had not been reduced during the applicable periods shown.
D Total returns do not include the effect of the sales charges.
E Calculated based on average shares outstanding during the period.
F Fees and expenses of any underlying Fidelity Central Funds are not included in the Fund's expense ratio. The Fund indirectly bears its proportionate share of the expenses of any underlying Fidelity Central Funds.
G Amount does not include the portfolio activity of any underlying Fidelity Central Funds.
H For the period February 13, 2007 (commencement of sale of shares) to January 31, 2008.
I Expense ratios reflect operating expenses of the class. Expenses before reductions do not reflect amounts reimbursed by the investment adviser or reductions from brokerage service arrangements or reductions from other expense offset arrangements and do not represent the amount paid by the class during periods when reimbursements or reductions occur. Expense ratios before reductions for start-up periods may not be representative of longer-term operating periods. Expenses net of fee waivers reflect expenses after reimbursement by the investment adviser but prior to reductions from brokerage service arrangements or other expense offset arrangements. Expenses net of all reductions represent the net expenses paid by the class.
J Amount represents less than $.01 per share.
See accompanying notes which are an integral part of the financial statements.
Annual Report
Financial Highlights - Class T
Years ended January 31, | 2012 | 2011 | 2010 | 2009 | 2008 H |
Selected Per-Share Data |
|
|
|
|
|
Net asset value, beginning of period | $ 16.14 | $ 12.34 | $ 8.53 | $ 15.04 | $ 17.63 |
Income from Investment Operations |
|
|
|
|
|
Net investment income (loss) E | .03 | (.03) | .04 | .06 | (.02) |
Net realized and unrealized gain (loss) | (.29) | 3.83 | 3.84 | (6.46) | (1.76) |
Total from investment operations | (.26) | 3.80 | 3.88 | (6.40) | (1.78) |
Distributions from net investment income | (.04) | - | (.07) | (.11) | (.04) |
Distributions from net realized gain | - | - | - | - | (.77) |
Total distributions | (.04) | - | (.07) | (.11) | (.81) |
Redemption fees added to paid in capital E, J | - | - | - | - | - |
Net asset value, end of period | $ 15.84 | $ 16.14 | $ 12.34 | $ 8.53 | $ 15.04 |
Total Return B, C, D | (1.59)% | 30.79% | 45.44% | (42.57)% | (10.46)% |
Ratios to Average Net Assets F, I |
|
|
|
|
|
Expenses before reductions | 1.43% | 1.43% | 1.47% | 1.38% | 1.39% A |
Expenses net of fee waivers, if any | 1.43% | 1.43% | 1.47% | 1.38% | 1.39% A |
Expenses net of all reductions | 1.42% | 1.43% | 1.46% | 1.38% | 1.39% A |
Net investment income (loss) | .18% | (.24)% | .36% | .45% | (.10)% A |
Supplemental Data |
|
|
|
|
|
Net assets, end of period (000 omitted) | $ 6,823 | $ 6,993 | $ 4,010 | $ 2,413 | $ 3,714 |
Portfolio turnover rate G | 173% | 133% | 202% | 268% | 264% |
A Annualized
B Total returns for periods of less than one year are not annualized.
C Total returns would have been lower if certain expenses had not been reduced during the applicable periods shown.
D Total returns do not include the effect of the sales charges.
E Calculated based on average shares outstanding during the period.
F Fees and expenses of any underlying Fidelity Central Funds are not included in the Fund's expense ratio. The Fund indirectly bears its proportionate share of the expenses of any underlying Fidelity Central Funds.
G Amount does not include the portfolio activity of any underlying Fidelity Central Funds.
H For the period February 13, 2007 (commencement of sale of shares) to January 31, 2008.
I Expense ratios reflect operating expenses of the class. Expenses before reductions do not reflect amounts reimbursed by the investment adviser or reductions from brokerage service arrangements or reductions from other expense offset arrangements and do not represent the amount paid by the class during periods when reimbursements or reductions occur. Expense ratios before reductions for start-up periods may not be representative of longer-term operating periods. Expenses net of fee waivers reflect expenses after reimbursement by the investment adviser but prior to reductions from brokerage service arrangements or other expense offset arrangements. Expenses net of all reductions represent the net expenses paid by the class.
J Amount represents less than $.01 per share.
See accompanying notes which are an integral part of the financial statements.
Annual Report
Financial Highlights - Class B
Years ended January 31, | 2012 | 2011 | 2010 | 2009 | 2008 H |
Selected Per-Share Data |
|
|
|
|
|
Net asset value, beginning of period | $ 16.04 | $ 12.32 | $ 8.53 | $ 14.99 | $ 17.63 |
Income from Investment Operations |
|
|
|
|
|
Net investment income (loss) E | (.05) | (.10) | (.01) | (.01) | (.10) |
Net realized and unrealized gain (loss) | (.28) | 3.82 | 3.82 | (6.40) | (1.76) |
Total from investment operations | (.33) | 3.72 | 3.81 | (6.41) | (1.86) |
Distributions from net investment income | - | - | (.02) | (.05) | (.01) |
Distributions from net realized gain | - | - | - | - | (.77) |
Total distributions | - | - | (.02) | (.05) | (.78) |
Redemption fees added to paid in capital E, J | - | - | - | - | - |
Net asset value, end of period | $ 15.71 | $ 16.04 | $ 12.32 | $ 8.53 | $ 14.99 |
Total Return B, C, D | (2.06)% | 30.19% | 44.61% | (42.79)% | (10.88)% |
Ratios to Average Net Assets F, I |
|
|
|
|
|
Expenses before reductions | 1.92% | 1.93% | 1.97% | 1.87% | 1.89% A |
Expenses net of fee waivers, if any | 1.92% | 1.93% | 1.97% | 1.87% | 1.89% A |
Expenses net of all reductions | 1.91% | 1.92% | 1.96% | 1.87% | 1.89% A |
Net investment income (loss) | (.31)% | (.74)% | (.14)% | (.04)% | (.59)% A |
Supplemental Data |
|
|
|
|
|
Net assets, end of period (000 omitted) | $ 1,376 | $ 1,793 | $ 1,154 | $ 763 | $ 1,304 |
Portfolio turnover rate G | 173% | 133% | 202% | 268% | 264% |
A Annualized
B Total returns for periods of less than one year are not annualized.
C Total returns would have been lower if certain expenses had not been reduced during the applicable periods shown.
D Total returns do not include the effect of the contingent deferred sales charge.
E Calculated based on average shares outstanding during the period.
F Fees and expenses of any underlying Fidelity Central Funds are not included in the Fund's expense ratio. The Fund indirectly bears its proportionate share of the expenses of any underlying Fidelity Central Funds.
G Amount does not include the portfolio activity of any underlying Fidelity Central Funds.
H For the period February 13, 2007 (commencement of sale of shares) to January 31, 2008.
I Expense ratios reflect operating expenses of the class. Expenses before reductions do not reflect amounts reimbursed by the investment adviser or reductions from brokerage service arrangements or reductions from other expense offset arrangements and do not represent the amount paid by the class during periods when reimbursements or reductions occur. Expense ratios before reductions for start-up periods may not be representative of longer-term operating periods. Expenses net of fee waivers reflect expenses after reimbursement by the investment adviser but prior to reductions from brokerage service arrangements or other expense offset arrangements. Expenses net of all reductions represent the net expenses paid by the class.
J Amount represents less than $.01 per share.
See accompanying notes which are an integral part of the financial statements.
Annual Report
Financial Highlights - Class C
Years ended January 31, | 2012 | 2011 | 2010 | 2009 | 2008 H |
Selected Per-Share Data |
|
|
|
|
|
Net asset value, beginning of period | $ 15.98 | $ 12.27 | $ 8.50 | $ 14.98 | $ 17.63 |
Income from Investment Operations |
|
|
|
|
|
Net investment income (loss) E | (.05) | (.10) | (.01) | - | (.10) |
Net realized and unrealized gain (loss) | (.28) | 3.81 | 3.80 | (6.41) | (1.77) |
Total from investment operations | (.33) | 3.71 | 3.79 | (6.41) | (1.87) |
Distributions from net investment income | - | - | (.02) | (.07) | (.01) |
Distributions from net realized gain | - | - | - | - | (.77) |
Total distributions | - | - | (.02) | (.07) | (.78) |
Redemption fees added to paid in capital E, J | - | - | - | - | - |
Net asset value, end of period | $ 15.65 | $ 15.98 | $ 12.27 | $ 8.50 | $ 14.98 |
Total Return B, C, D | (2.07)% | 30.24% | 44.56% | (42.79)% | (10.94)% |
Ratios to Average Net Assets F, I |
|
|
|
|
|
Expenses before reductions | 1.92% | 1.93% | 1.96% | 1.86% | 1.90% A |
Expenses net of fee waivers, if any | 1.92% | 1.93% | 1.96% | 1.86% | 1.90% A |
Expenses net of all reductions | 1.91% | 1.92% | 1.95% | 1.86% | 1.90% A |
Net investment income (loss) | (.31)% | (.73)% | (.13)% | (.03)% | (.60)% A |
Supplemental Data |
|
|
|
|
|
Net assets, end of period (000 omitted) | $ 5,000 | $ 5,309 | $ 2,293 | $ 1,232 | $ 1,658 |
Portfolio turnover rate G | 173% | 133% | 202% | 268% | 264% |
A Annualized
B Total returns for periods of less than one year are not annualized.
C Total returns would have been lower if certain expenses had not been reduced during the applicable periods shown.
D Total returns do not include the effect of the contingent deferred sales charge.
E Calculated based on average shares outstanding during the period.
F Fees and expenses of any underlying Fidelity Central Funds are not included in the Fund's expense ratio. The Fund indirectly bears its proportionate share of the expenses of any underlying Fidelity Central Funds.
G Amount does not include the portfolio activity of any underlying Fidelity Central Funds.
H For the period February 13, 2007 (commencement of sale of shares) to January 31, 2008.
I Expense ratios reflect operating expenses of the class. Expenses before reductions do not reflect amounts reimbursed by the investment adviser or reductions from brokerage service arrangements or reductions from other expense offset arrangements and do not represent the amount paid by the class during periods when reimbursements or reductions occur. Expense ratios before reductions for start-up periods may not be representative of longer-term operating periods. Expenses net of fee waivers reflect expenses after reimbursement by the investment adviser but prior to reductions from brokerage service arrangements or other expense offset arrangements. Expenses net of all reductions represent the net expenses paid by the class.
J Amount represents less than $.01 per share.
See accompanying notes which are an integral part of the financial statements.
Annual Report
Financial Highlights - Mid Cap Value
Years ended January 31, | 2012 | 2011 | 2010 | 2009 | 2008 |
Selected Per-Share Data |
|
|
|
|
|
Net asset value, beginning of period | $ 16.26 | $ 12.41 | $ 8.57 | $ 15.09 | $ 17.18 |
Income from Investment Operations |
|
|
|
|
|
Net investment income (loss) B | .12 | .04 | .09 | .13 | .08 |
Net realized and unrealized gain (loss) | (.30) | 3.87 | 3.86 | (6.49) | (1.34) |
Total from investment operations | (.18) | 3.91 | 3.95 | (6.36) | (1.26) |
Distributions from net investment income | (.11) | (.06) | (.11) | (.16) | (.06) |
Distributions from net realized gain | - | - | - | - F | (.77) |
Total distributions | (.11) | (.06) | (.11) | (.16) | (.83) |
Redemption fees added to paid in capital B, F | - | - | - | - | - |
Net asset value, end of period | $ 15.97 | $ 16.26 | $ 12.41 | $ 8.57 | $ 15.09 |
Total Return A | (1.04)% | 31.51% | 46.06% | (42.19)% | (7.67)% |
Ratios to Average Net Assets C, E |
|
|
|
|
|
Expenses before reductions | .88% | .91% | .95% | .85% | .83% |
Expenses net of fee waivers, if any | .88% | .91% | .95% | .84% | .82% |
Expenses net of all reductions | .87% | .90% | .94% | .84% | .82% |
Net investment income (loss) | .73% | .28% | .88% | .99% | .47% |
Supplemental Data |
|
|
|
|
|
Net assets, end of period (000 omitted) | $ 553,947 | $ 666,277 | $ 469,476 | $ 358,380 | $ 737,234 |
Portfolio turnover rate D | 173% | 133% | 202% | 268% | 264% |
A Total returns would have been lower if certain expenses had not been reduced during the applicable periods shown.
B Calculated based on average shares outstanding during the period.
C Fees and expenses of any underlying Fidelity Central Funds are not included in the Fund's expense ratio. The Fund indirectly bears its proportionate share of the expenses of any underlying Fidelity Central Funds.
D Amount does not include the portfolio activity of any underlying Fidelity Central Funds.
E Expense ratios reflect operating expenses of the class. Expenses before reductions do not reflect amounts reimbursed by the investment adviser or reductions from brokerage service arrangements or reductions from other expense offset arrangements and do not represent the amount paid by the class during periods when reimbursements or reductions occur. Expenses net of fee waivers reflect expenses after reimbursement by the investment adviser but prior to reductions from brokerage service arrangements or other expense offset arrangements. Expenses net of all reductions represent the net expenses paid by the class.
F Amount represents less than $.01 per share.
See accompanying notes which are an integral part of the financial statements.
Annual Report
Financial Highlights - Institutional Class
Years ended January 31, | 2012 | 2011 | 2010 | 2009 | 2008 G |
Selected Per-Share Data |
|
|
|
|
|
Net asset value, beginning of period | $ 16.20 | $ 12.36 | $ 8.54 | $ 15.06 | $ 17.63 |
Income from Investment Operations |
|
|
|
|
|
Net investment income (loss) D | .11 | .04 | .10 | .12 | .07 |
Net realized and unrealized gain (loss) | (.29) | 3.85 | 3.84 | (6.48) | (1.78) |
Total from investment operations | (.18) | 3.89 | 3.94 | (6.36) | (1.71) |
Distributions from net investment income | (.11) | (.05) | (.12) | (.16) | (.09) |
Distributions from net realized gain | - | - | - | - | (.77) |
Total distributions | (.11) | (.05) | (.12) | (.16) | (.86) |
Redemption fees added to paid in capital D, I | - | - | - | - | - |
Net asset value, end of period | $ 15.91 | $ 16.20 | $ 12.36 | $ 8.54 | $ 15.06 |
Total Return B, C | (1.07)% | 31.51% | 46.12% | (42.26)% | (10.06)% |
Ratios to Average Net Assets E, H |
|
|
|
|
|
Expenses before reductions | .91% | .92% | .96% | .87% | .89% A |
Expenses net of fee waivers, if any | .91% | .92% | .96% | .87% | .89% A |
Expenses net of all reductions | .90% | .92% | .95% | .87% | .88% A |
Net investment income (loss) | .71% | .27% | .87% | .96% | .41% A |
Supplemental Data |
|
|
|
|
|
Net assets, end of period (000 omitted) | $ 3,667 | $ 3,507 | $ 3,162 | $ 894 | $ 1,452 |
Portfolio turnover rate F | 173% | 133% | 202% | 268% | 264% |
A Annualized
B Total returns for periods of less than one year are not annualized.
C Total returns would have been lower if certain expenses had not been reduced during the applicable periods shown.
D Calculated based on average shares outstanding during the period.
E Fees and expenses of any underlying Fidelity Central Funds are not included in the Fund's expense ratio. The Fund indirectly bears its proportionate share of the expenses of any underlying Fidelity Central Funds.
F Amount does not include the portfolio activity of any underlying Fidelity Central Funds.
G For the period February 13, 2007 (commencement of sale of shares) to January 31, 2008.
H Expense ratios reflect operating expenses of the class. Expenses before reductions do not reflect amounts reimbursed by the investment adviser or reductions from brokerage service arrangements or reductions from other expense offset arrangements and do not represent the amount paid by the class during periods when reimbursements or reductions occur. Expense ratios before reductions for start-up periods may not be representative of longer-term operating periods. Expenses net of fee waivers reflect expenses after reimbursement by the investment adviser but prior to reductions from brokerage service arrangements or other expense offset arrangements. Expenses net of all reductions represent the net expenses paid by the class.
I Amount represents less than $.01 per share.
See accompanying notes which are an integral part of the financial statements.
Annual Report
Notes to Financial Statements
For the period ended January 31, 2012
1. Organization.
Fidelity Mid Cap Value Fund (the Fund) is a fund of Fidelity Devonshire Trust (the Trust) and is authorized to issue an unlimited number of shares. The Trust is registered under the Investment Company Act of 1940, as amended (the 1940 Act), as an open-end management investment company organized as a Massachusetts business trust. The Fund offers Class A, Class T, Class C, Mid Cap Value and Institutional Class shares, each of which, along with Class B shares, has equal rights as to assets and voting privileges. Effective after the close of business on September 1, 2010, Class B shares were closed to new accounts and additional purchases, except for exchanges and reinvestments. Each class has exclusive voting rights with respect to matters that affect that class. Class B shares will automatically convert to Class A shares after a holding period of seven years from the initial date of purchase. Investment income, realized and unrealized capital gains and losses, the common expenses of the Fund, and certain fund-level expense reductions, if any, are allocated on a pro-rata basis to each class based on the relative net assets of each class to the total net assets of the Fund. Each class differs with respect to transfer agent and distribution and service plan fees incurred. Certain expense reductions may also differ by class. The Fund's investments in emerging markets can be subject to social, economic, regulatory, and political uncertainties and can be extremely volatile.
2. Investments in Fidelity Central Funds.
The Fund invests in Fidelity Central Funds, which are open-end investment companies available only to other investment companies and accounts managed by Fidelity Management & Research Company (FMR) and its affiliates. The Fund's Schedule of Investments lists each of the Fidelity Central Funds held as of period end, if any, as an investment of the Fund, but does not include the underlying holdings of each Fidelity Central Fund. As an Investing Fund, the Fund indirectly bears its proportionate share of the expenses of the underlying Fidelity Central Funds.
The Money Market Central Funds seek preservation of capital and current income and are managed by Fidelity Investments Money Management, Inc. (FIMM), an affiliate of FMR.
A complete unaudited list of holdings for each Fidelity Central Fund is available upon request or at the Securities and Exchange Commission (the SEC) web site at www.sec.gov. In addition, the financial statements of the Fidelity Central Funds, which are not covered by the Fund's Report of Independent Registered Public Accounting Firm, are available on the SEC web site or upon request.
Annual Report
Notes to Financial Statements - continued
3. Significant Accounting Policies.
The financial statements have been prepared in conformity with accounting principles generally accepted in the United States of America (GAAP), which require management to make certain estimates and assumptions at the date of the financial statements. Actual results could differ from those estimates. Subsequent events, if any, through the date that the financial statements were issued have been evaluated in the preparation of the financial statements. The following summarizes the significant accounting policies of the Fund:
Security Valuation. Investments are valued as of 4:00 p.m. Eastern time on the last calendar day of the period. The Fund uses independent pricing services approved by the Board of Trustees to value its investments. When current market prices or quotations are not readily available or reliable, valuations may be determined in good faith in accordance with procedures adopted by the Board of Trustees. Factors used in determining value may include market or security specific events. The frequency with which these procedures are used cannot be predicted and they may be utilized to a significant extent. The value used for net asset value (NAV) calculation under these procedures may differ from published prices for the same securities.
The Fund categorizes the inputs to valuation techniques used to value its investments into a disclosure hierarchy consisting of three levels as shown below:
Level 1 - quoted prices in active markets for identical investments
Level 2 - other significant observable inputs (including quoted prices for similar investments, interest rates, prepayment speeds, etc.)
Level 3 - unobservable inputs (including the Fund's own assumptions based on the best information available)
Changes in valuation techniques may result in transfers in or out of an assigned level within the disclosure hierarchy. Valuation techniques used to value the Fund's investments by major category are as follows:
Equity securities, including restricted securities, for which market quotations are readily available, are valued at the last reported sale price or official closing price as reported by an independent pricing service on the primary market or exchange on which they are traded and are categorized as Level 1 in the hierarchy. In the event there were no sales during the day or closing prices are not available, securities are valued at the last quoted bid price or may be valued using the last available price and are generally categorized as Level 2 in the hierarchy. For foreign equity securities, when significant market or security specific events arise, comparisons to the valuation of American Depositary Receipts (ADRs), futures contracts, Exchange-traded funds (ETFs) and certain indexes as well as quoted prices for similar securities are used and are categorized as Level 2 in the
Annual Report
3. Significant Accounting Policies - continued
Security Valuation - continued
hierarchy in these circumstances. Utilizing these techniques may result in transfers between Level 1 and Level 2. For restricted equity securities and private placements where observable inputs are limited, assumptions about market activity and risk are used and are categorized as Level 3 in the hierarchy.
Investments in open-end mutual funds, including the Fidelity Central Funds, are valued at their closing net asset value each business day and are categorized as Level 1 in the hierarchy.
New Accounting Pronouncements. In May 2011, the Financial Accounting Standards Board issued Accounting Standard Update No. 2011-04, Fair Value Measurement (Topic 820) - Amendments to Achieve Common Fair Value Measurement and Disclosure Requirements in U.S. GAAP and IFRSs. The update is effective during interim and annual periods beginning after December 15, 2011 and will result in additional disclosure for transfers between levels as well as expanded disclosure for securities categorized as Level 3 under the fair value hierarchy.
In December 2011, the Financial Accounting Standards Board issued Accounting Standard Update No. 2011-11, Disclosures about Offsetting Assets and Liabilities. The update creates new disclosure requirements requiring entities to disclose both gross and net information for derivatives and other financial instruments that are either offset in the Statement of Assets and Liabilities or subject to an enforceable master netting arrangement or similar agreement. The disclosure requirements are effective for interim and annual reporting periods beginning on or after January 1, 2013. Management is currently evaluating the impact of the update's adoption on the Fund's financial statement disclosures.
Foreign Currency. The Fund may use foreign currency contracts to facilitate transactions in foreign-denominated securities. Gains and losses from these transactions may arise from changes in the value of the foreign currency or if the counterparties do not perform under the contracts' terms.
Foreign-denominated assets, including investment securities, and liabilities are translated into U.S. dollars at the exchange rate at period end. Purchases and sales of investment securities, income and dividends received and expenses denominated in foreign currencies are translated into U.S. dollars at the exchange rate in effect on the transaction date.
The effects of exchange rate fluctuations on investments are included with the net realized and unrealized gain (loss) on investment securities. Other foreign currency transactions resulting in realized and unrealized gain (loss) are disclosed separately.
Annual Report
Notes to Financial Statements - continued
3. Significant Accounting Policies - continued
Investment Transactions and Income. For financial reporting purposes, the Fund's investment holdings and NAV include trades executed through the end of the last business day of the period. The NAV per share for processing shareholder transactions is calculated as of the close of business of the New York Stock Exchange (NYSE), normally 4:00 p.m. Eastern time and includes trades executed through the end of the prior business day. Gains and losses on securities sold are determined on the basis of identified cost and may include proceeds received from litigation. Dividend income is recorded on the ex-dividend date, except for certain dividends from foreign securities where the ex-dividend date may have passed, which are recorded as soon as the Fund is informed of the ex-dividend date. Non-cash dividends included in dividend income, if any, are recorded at the fair market value of the securities received. Distributions received on securities that represent a return of capital or capital gain are recorded as a reduction of cost of investments and/or as a realized gain. The Fund estimates the components of distributions received that may be considered return of capital distributions or capital gain distributions. Interest income and distributions from the Fidelity Central Funds are accrued as earned. Interest income includes coupon interest and amortization of premium and accretion of discount on debt securities. Investment income is recorded net of foreign taxes withheld where recovery of such taxes is uncertain.
Expenses. Expenses directly attributable to a fund are charged to that fund. Expenses attributable to more than one fund are allocated among the respective funds on the basis of relative net assets or other appropriate methods. Expense estimates are accrued in the period to which they relate and adjustments are made when actual amounts are known.
Income Tax Information and Distributions to Shareholders. Each year, the Fund intends to qualify as a regulated investment company, including distributing substantially all of its taxable income and realized gains under Subchapter M of the Internal Revenue Code. As a result, no provision for income taxes is required. As of January 31, 2012, the Fund did not have any unrecognized tax benefits in the financial statements; nor is the Fund aware of any tax positions for which it is reasonably possible that the total amounts of unrecognized tax benefits will significantly change in the next twelve months. The Fund files a U.S. federal tax return, in addition to state and local tax returns as required. A fund's tax returns are subject to examination by the Internal Revenue Service (IRS) for a period of three fiscal years. State and local tax returns may be subject to examination for an additional fiscal year depending on the jurisdiction. Foreign taxes are provided for based on the Fund's understanding of the tax rules and rates that exist in the foreign markets in which it invests.
Distributions are declared and recorded on the ex-dividend date. Income dividends and capital gain distributions are declared separately for each class. Income and capital gain
Annual Report
3. Significant Accounting Policies - continued
Income Tax Information and Distributions to Shareholders - continued
distributions are determined in accordance with income tax regulations, which may differ from GAAP.
Capital accounts within the financial statements are adjusted for permanent book-tax differences. These adjustments have no impact on net assets or the results of operations. Temporary book-tax differences will reverse in a subsequent period.
Book-tax differences are primarily due to short-term gain distributions from underlying funds, capital loss carryforwards and losses deferred due to wash sales and excise tax regulations.
The federal tax cost of investment securities and unrealized appreciation (depreciation) as of period end were as follows:
Gross unrealized appreciation | $ 45,960,283 |
Gross unrealized depreciation | (26,978,462) |
Net unrealized appreciation (depreciation) on securities and other investments | $ 18,981,821 |
|
|
Tax Cost | $ 582,558,580 |
The tax-based components of distributable earnings as of period end were as follows:
Capital loss carryforward | $ (59,732,390) |
Net unrealized appreciation (depreciation) | $ 18,981,821 |
Capital loss carryforwards are only available to offset future capital gains of the Fund to the extent provided by regulations and may be limited. Under the Regulated Investment Company Modernization Act of 2010 (the Act), the Fund is permitted to carry forward capital losses incurred in taxable years beginning after December 22, 2010 for an unlimited period and such capital losses are required to be used prior to any losses that expire. Capital loss carryforwards were as follows:
Fiscal year of expiration |
|
2018 | $ (59,732,390) |
Annual Report
Notes to Financial Statements - continued
3. Significant Accounting Policies - continued
Income Tax Information and Distributions to Shareholders - continued
The tax character of distributions paid was as follows:
| January 31, 2012 | January 31, 2011 |
Ordinary Income | $ 4,101,848 | $ 2,444,386 |
Short-Term Trading (Redemption) Fees. Shares held by investors in the Fund less than 30 days are subject to a redemption fee equal to .75% of the net asset value of shares redeemed. All redemption fees, which reduce the proceeds of the shareholder redemption, are retained by the Fund and accounted for as an addition to paid in capital.
4. Purchases and Sales of Investments.
Purchases and sales of securities, other than short-term securities, aggregated $1,120,384,304 and $1,218,402,135, respectively.
5. Fees and Other Transactions with Affiliates.
Management Fee. FMR and its affiliates provide the Fund with investment management related services for which the Fund pays a monthly management fee. The management fee is the sum of an individual fund fee rate that is based on an annual rate of .30% of the Fund's average net assets and an annualized group fee rate that averaged .26% during the period. The group fee rate is based upon the average net assets of all the mutual funds advised by FMR. The group fee rate decreases as assets under management increase and increases as assets under management decrease. In addition, the management fee is subject to a performance adjustment (up to a maximum of ± .20% of the Fund's average net assets over a 36 month performance period). The upward or downward adjustment to the management fee is based on the relative investment performance of Mid Cap Value as compared to an appropriate benchmark index. For the period, the total annual management fee rate, including the performance adjustment, was .56% of the Fund's average net assets.
Distribution and Service Plan Fees. In accordance with Rule 12b-1 of the 1940 Act, the Fund has adopted separate Distribution and Service Plans for each class of shares. Certain classes pay Fidelity Distributors Corporation (FDC), an affiliate of FMR, separate Distribution and Service Fees, each of which is based on an annual percentage of each class' average net assets. In addition, FDC may pay financial intermediaries for
Annual Report
5. Fees and Other Transactions with Affiliates - continued
Distribution and Service Plan Fees - continued
selling shares of the Fund and providing shareholder support services. For the period, the Distribution and Service Fee rates, total fees and amounts retained by FDC were as follows:
| Distribution | Service | Total Fees | Retained |
Class A | -% | .25% | $ 52,557 | $ 2,177 |
Class T | .25% | .25% | 33,452 | 113 |
Class B | .75% | .25% | 15,346 | 11,519 |
Class C | .75% | .25% | 52,830 | 17,080 |
|
|
| $ 154,185 | $ 30,889 |
Sales Load. FDC may receive a front-end sales charge of up to 5.75% for selling Class A shares and 3.50% for selling Class T shares, some of which is paid to financial intermediaries for selling shares of the Fund. Depending on the holding period, FDC may receive contingent deferred sales charges levied on Class A, Class T, Class B, and Class C redemptions. The deferred sales charges range from 5.00% to 1.00% for Class B, 1.00% for Class C, 1.00% for certain purchases of Class A shares and .25% for certain purchases of Class T shares.
For the period, sales charge amounts retained by FDC were as follows:
| Retained |
Class A | $ 15,237 |
Class T | 2,801 |
Class B* | 2,003 |
Class C* | 1,050 |
| $ 21,091 |
* When Class B and Class C shares are initially sold, FDC pays commissions from its own resources to financial intermediaries through which the sales are made.
Transfer Agent Fees. Fidelity Investments Institutional Operations Company, Inc. (FIIOC), an affiliate of FMR, is the transfer, dividend disbursing and shareholder servicing agent for each class of the Fund. FIIOC receives account fees and asset-based fees that vary according to the account size and type of account of the shareholders of the respective classes of the Fund. FIIOC pays for typesetting, printing and mailing of
Annual Report
Notes to Financial Statements - continued
5. Fees and Other Transactions with Affiliates - continued
Transfer Agent Fees - continued
shareholder reports, except proxy statements. For the period, transfer agent fees for each class were as follows:
| Amount | % of |
Class A | $ 63,412 | .30 |
Class T | 20,886 | .31 |
Class B | 4,630 | .30 |
Class C | 15,912 | .30 |
Mid Cap Value | 1,579,493 | .26 |
Institutional Class | 9,740 | .29 |
| $ 1,694,073 |
|
Accounting and Security Lending Fees. Fidelity Service Company, Inc. (FSC), an affiliate of FMR, maintains the Fund's accounting records. The accounting fee is based on the level of average net assets for each month. Under a separate contract, FSC administers the security lending program. The security lending fee is based on the number and duration of lending transactions.
Brokerage Commissions. The Fund placed a portion of its portfolio transactions with brokerage firms which are affiliates of the investment adviser. The commissions paid to these affiliated firms were $23,204 for the period.
Interfund Lending Program. Pursuant to an Exemptive Order issued by the SEC, the Fund, along with other registered investment companies having management contracts with FMR, may participate in an interfund lending program. This program provides an alternative credit facility allowing the funds to borrow from, or lend money to, other participating affiliated funds. At period end, there were no interfund loans outstanding. The Fund's activity in this program during the period for which loans were outstanding was as follows:
Borrower or Lender | Average | Weighted Average | Interest |
Borrower | $ 11,023,000 | .35% | $ 529 |
6. Committed Line of Credit.
The Fund participates with other funds managed by FMR or an affiliate in a $4.0 billion credit facility (the "line of credit") to be utilized for temporary or emergency purposes to fund shareholder redemptions or for other short-term liquidity purposes. The Fund has agreed to pay commitment fees on its pro-rata portion of the line of credit, which
Annual Report
6. Committed Line of Credit - continued
amounted to $1,937 and is reflected in Miscellaneous expenses on the Statement of Operations. During the period, there were no borrowings on this line of credit.
7. Security Lending.
The Fund lends portfolio securities through a lending agent from time to time in order to earn additional income. For equity securities, a lending agent is used and may loan securities to certain qualified borrowers, including Fidelity Capital Markets (FCM), a broker-dealer affiliated with the Fund. On the settlement date of the loan, the Fund receives collateral (in the form of U.S. Treasury obligations, letters of credit and/or cash) against the loaned securities and maintains collateral in an amount not less than 100% of the market value of the loaned securities during the period of the loan. The market value of the loaned securities is determined at the close of business of the Fund and any additional required collateral is delivered to the Fund on the next business day. If the borrower defaults on its obligation to return the securities loaned because of insolvency or other reasons, a fund could experience delays and costs in recovering the securities loaned or in gaining access to the collateral. Any cash collateral received is invested in the Fidelity Securities Lending Cash Central Fund. The value of loaned securities and cash collateral at period end are disclosed on the Fund's Statement of Assets and Liabilities. Security lending income represents the income earned on investing cash collateral, less rebates paid to borrowers and any lending agent fees associated with the loan, plus any premium payments received for lending certain types of securities. Security lending income is presented in the Statement of Operations as a component of income from Fidelity Central Funds. Total security lending income during the period amounted to $26,327. During the period, there were no securities loaned to FCM.
8. Expense Reductions.
Many of the brokers with whom FMR places trades on behalf of the Fund provided services in addition to trade execution. These services included payments of certain expenses on behalf of the Fund totaling $65,968 for the period.
9. Distributions to Shareholders.
Distributions to shareholders of each class were as follows:
Years ended January 31, | 2012 | 2011 |
From net investment income |
|
|
Class A | $ 84,201 | $ 48,967 |
Class T | 17,628 | - |
Mid Cap Value | 3,978,985 | 2,383,138 |
Institutional Class | 21,034 | 12,281 |
Total | $ 4,101,848 | $ 2,444,386 |
Annual Report
Notes to Financial Statements - continued
10. Share Transactions.
Transactions for each class of shares were as follows:
| Shares | Dollars | ||
Years ended January 31, | 2012 | 2011 | 2012 | 2011 |
Class A |
|
|
|
|
Shares sold | 471,749 | 979,279 | $ 7,485,577 | $ 13,831,042 |
Reinvestment of distributions | 5,251 | 2,902 | 78,338 | 45,422 |
Shares redeemed | (704,307) | (383,036) | (11,261,227) | (5,416,268) |
Net increase (decrease) | (227,307) | 599,145 | $ (3,697,312) | $ 8,460,196 |
Class T |
|
|
|
|
Shares sold | 161,524 | 277,811 | $ 2,605,707 | $ 3,916,314 |
Reinvestment of distributions | 1,166 | - | 17,360 | - |
Shares redeemed | (165,147) | (169,622) | (2,621,038) | (2,442,521) |
Net increase (decrease) | (2,457) | 108,189 | $ 2,029 | $ 1,473,793 |
Class B |
|
|
|
|
Shares sold | 9,800 | 68,215 | $ 158,077 | $ 957,007 |
Shares redeemed | (33,963) | (50,071) | (529,991) | (730,358) |
Net increase (decrease) | (24,163) | 18,144 | $ (371,914) | $ 226,649 |
Class C |
|
|
|
|
Shares sold | 124,340 | 223,953 | $ 1,963,624 | $ 3,145,394 |
Shares redeemed | (137,041) | (78,488) | (2,028,206) | (1,108,959) |
Net increase (decrease) | (12,701) | 145,465 | $ (64,582) | $ 2,036,435 |
Mid Cap Value |
|
|
|
|
Shares sold | 7,442,595 | 14,676,423 | $ 120,167,268 | $ 210,466,358 |
Reinvestment of distributions | 256,561 | 146,967 | 3,848,420 | 2,313,260 |
Shares redeemed | (13,984,343) | (11,678,158) | (217,785,024) | (166,435,604) |
Net increase (decrease) | (6,285,187) | 3,145,232 | $ (93,769,336) | $ 46,344,014 |
Institutional Class |
|
|
|
|
Shares sold | 158,721 | 152,312 | $ 2,526,829 | $ 2,150,351 |
Reinvestment of distributions | 1,314 | 744 | 19,637 | 11,662 |
Shares redeemed | (146,013) | (192,350) | (2,215,747) | (2,796,561) |
Net increase (decrease) | 14,022 | (39,294) | $ 330,719 | $ (634,548) |
11. Other.
The Fund's organizational documents provide former and current trustees and officers with a limited indemnification against liabilities arising in connection with the performance of their duties to the Fund. In the normal course of business, the Fund may also enter into contracts that provide general indemnifications. The Fund's maximum exposure under these arrangements is unknown as this would be dependent on future claims that may be made against the Fund. The risk of material loss from such claims is considered remote.
Annual Report
Report of Independent Registered Public Accounting Firm
To the Trustees of Fidelity Devonshire Trust and the Shareholders of Fidelity Mid Cap Value Fund:
In our opinion, the accompanying statement of assets and liabilities, including the schedule of investments, and the related statements of operations and of changes in net assets and the financial highlights present fairly, in all material respects, the financial position of Fidelity Mid Cap Value Fund (a fund of Fidelity Devonshire Trust) at January 31, 2012, the results of its operations for the year then ended, the changes in its net assets for each of the two years in the period then ended and the financial highlights for each of the periods indicated, in conformity with accounting principles generally accepted in the United States of America. These financial statements and financial highlights (hereafter referred to as "financial statements") are the responsibility of the Fidelity Mid Cap Value Fund's management. Our responsibility is to express an opinion on these financial statements based on our audits. We conducted our audits of these financial statements in accordance with the standards of the Public Company Accounting Oversight Board (United States). Those standards require that we plan and perform the audit to obtain reasonable assurance about whether the financial statements are free of material misstatement. An audit includes examining, on a test basis, evidence supporting the amounts and disclosures in the financial statements, assessing the accounting principles used and significant estimates made by management, and evaluating the overall financial statement presentation. We believe that our audits, which included confirmation of securities at January 31, 2012 by correspondence with the custodian and brokers, provide a reasonable basis for our opinion.
/s/ PricewaterhouseCoopers LLP
PricewaterhouseCoopers LLP
Boston, Massachusetts
March 13, 2012
Annual Report
Trustees and Officers
The Trustees, Members of the Advisory Board, and executive officers of the trust and fund, as applicable, are listed below. The Board of Trustees governs the fund and is responsible for protecting the interests of shareholders. The Trustees are experienced executives who meet periodically throughout the year to oversee the fund's activities, review contractual arrangements with companies that provide services to the fund, oversee management of the risks associated with such activities and contractual arrangements, and review the fund's performance. Except for James C. Curvey, each of the Trustees oversees 226 funds advised by FMR or an affiliate. Mr. Curvey oversees 430 funds advised by FMR or an affiliate.
The Trustees hold office without limit in time except that (a) any Trustee may resign; (b) any Trustee may be removed by written instrument, signed by at least two-thirds of the number of Trustees prior to such removal; (c) any Trustee who requests to be retired or who has become incapacitated by illness or injury may be retired by written instrument signed by a majority of the other Trustees; and (d) any Trustee may be removed at any special meeting of shareholders by a two-thirds vote of the outstanding voting securities of the trust. Each Trustee who is not an interested person (as defined in the 1940 Act) (Independent Trustee), shall retire not later than the last day of the calendar year in which his or her 75th birthday occurs. The Independent Trustees may waive this mandatory retirement age policy with respect to individual Trustees. The executive officers and Advisory Board Members hold office without limit in time, except that any officer and Advisory Board Member may resign or may be removed by a vote of a majority of the Trustees at any regular meeting or any special meeting of the Trustees. Except as indicated, each individual has held the office shown or other offices in the same company for the past five years.
Experience, Skills, Attributes, and Qualifications of the Fund's Trustees. The Governance and Nominating Committee has adopted a statement of policy that describes the experience, qualifications, attributes, and skills that are necessary and desirable for potential Independent Trustee candidates (Statement of Policy). The Board believes that each Trustee satisfied at the time he or she was initially elected or appointed a Trustee, and continues to satisfy, the standards contemplated by the Statement of Policy. The Governance and Nominating Committee also engages professional search firms to help identify potential Independent Trustee candidates who have the experience, qualifications, attributes, and skills consistent with the Statement of Policy. From time to time, additional criteria based on the composition and skills of the current Independent Trustees, as well as experience or skills that may be appropriate in light of future changes to board composition, business conditions, and regulatory or other developments, have also been considered by the professional search firms and the Governance and Nominating Committee. In addition, the Board takes into account the Trustees' commitment and participation in Board and committee meetings, as well as their leadership of standing and ad hoc committees throughout their tenure.
In determining that a particular Trustee was and continues to be qualified to serve as a Trustee, the Board has considered a variety of criteria, none of which, in isolation, was controlling. The Board believes that, collectively, the Trustees have balanced and diverse experience, qualifications, attributes, and skills, which allow the Board to operate effectively in governing the fund and protecting the interests of shareholders. Information about the specific experience, skills, attributes, and qualifications of each Trustee, which in each case led to the Board's conclusion that the Trustee should serve (or continue to serve) as a trustee of the fund, is provided below.
Annual Report
Board Structure and Oversight Function. James C. Curvey is an interested person (as defined in the 1940 Act) and currently serves as Acting Chairman. The Trustees have determined that an interested Chairman is appropriate and benefits shareholders because an interested Chairman has a personal and professional stake in the quality and continuity of services provided to the fund. Independent Trustees exercise their informed business judgment to appoint an individual of their choosing to serve as Chairman, regardless of whether the Trustee happens to be independent or a member of management. The Independent Trustees have determined that they can act independently and effectively without having an Independent Trustee serve as Chairman and that a key structural component for assuring that they are in a position to do so is for the Independent Trustees to constitute a substantial majority for the Board. The Independent Trustees also regularly meet in executive session. Ned C. Lautenbach serves as Chairman of the Independent Trustees and as such (i) acts as a liaison between the Independent Trustees and management with respect to matters important to the Independent Trustees and (ii) with management prepares agendas for Board meetings.
Fidelity funds are overseen by different Boards of Trustees. The fund's Board oversees Fidelity's equity and high income funds and another Board oversees Fidelity's investment-grade bond, money market, and asset allocation funds. The asset allocation funds may invest in Fidelity funds overseen by the fund's Board. The use of separate Boards, each with its own committee structure, allows the Trustees of each group of Fidelity funds to focus on the unique issues of the funds they oversee, including common research, investment, and operational issues. On occasion, the separate Boards establish joint committees to address issues of overlapping consequences for the Fidelity funds overseen by each Board.
The Trustees operate using a system of committees to facilitate the timely and efficient consideration of all matters of importance to the Trustees, the fund, and fund shareholders and to facilitate compliance with legal and regulatory requirements and oversight of the fund's activities and associated risks. The Board, acting through its committees, has charged FMR and its affiliates with (i) identifying events or circumstances the occurrence of which could have demonstrably adverse effects on the fund's business and/or reputation; (ii) implementing processes and controls to lessen the possibility that such events or circumstances occur or to mitigate the effects of such events or circumstances if they do occur; and (iii) creating and maintaining a system designed to evaluate continuously business and market conditions in order to facilitate the identification and implementation processes described in (i) and (ii) above. Because the day-to-day operations and activities of the fund are carried out by or through FMR, its affiliates and other service providers, the fund's exposure to risks is mitigated but not eliminated by the processes overseen by the Trustees. While each of the Board's committees has responsibility for overseeing different aspects of the fund's activities, oversight is exercised primarily through the Operations, Audit, and Compliance Committees. In addition, the Independent Trustees have worked with FMR to enhance the Board's oversight of investment and financial risks, legal and regulatory risks, technology risks, and operational risks, including the development of additional risk reporting to the Board. For example, a working group comprised of Independent Trustees and FMR has worked and continues to work to review the Fidelity funds' valuation-related activities, reporting and risk management. Appropriate personnel, including but not limited to the fund's Chief Compliance Officer (CCO), FMR's internal auditor, the independent accountants, the fund's Treasurer and portfolio management personnel, make periodic reports to the Board's committees, as appropriate, including an annual review of FMR's risk management program for the Fidelity funds. The responsibilities of each standing committee, including their oversight responsibilities, are described further under "Standing Committees of the Fund's Trustees."
Annual Report
Trustees and Officers - continued
The fund's Statement of Additional Information (SAI) includes more information about the Trustees. To request a free copy, call Fidelity at 1-877-208-0098.
Interested Trustees*:
Correspondence intended for each Trustee who is an interested person may be sent to Fidelity Investments, 82 Devonshire Street, Boston, Massachusetts 02109.
Name, Age; Principal Occupations and Other Relevant Experience+ | |
James C. Curvey (76) | |
| Year of Election or Appointment: 2007 Mr. Curvey is Trustee and Acting Chairman of the Board of Trustees of certain Trusts. Mr. Curvey also serves as Trustee (2007-present) of other investment companies advised by FMR. Mr. Curvey is a Director of Fidelity Investments Money Management, Inc. (2009-present), Director of Fidelity Research & Analysis Co. (2009-present) and Director of FMR and FMR Co., Inc. (2007-present). Mr. Curvey is also Vice Chairman (2007-present) and Director of FMR LLC. In addition, Mr. Curvey serves as an Overseer for the Boston Symphony Orchestra and a member of the Trustees of Villanova University. Previously, Mr. Curvey was the Vice Chairman (2006-2007) and Director (2000-2007) of FMR Corp. |
Ronald P. O'Hanley (54) | |
| Year of Election or Appointment: 2011 Mr. O'Hanley is Director of FMR Co., Inc. (2010-present), Director of Fidelity Investments Money Management, Inc. (2010-present), Director of Fidelity Research & Analysis Company (2010-present), President of Fidelity Asset Management and Corporate Services and a member of Fidelity's Executive Committee (2010-present). Previously, Mr. O'Hanley served as President and Chief Executive Officer of BNY Mellon Asset Management (2007-2010). Mr. O'Hanley also served as Vice Chairman of Bank New York Mellon Corp. and a member of that firm's Executive Committee. Prior to the 2007 merger of The Bank of New York and Mellon Financial Corporation, he was Vice Chairman of Mellon Financial Corporation and President and Chief Executive Officer of Mellon Asset Management. He joined Mellon in February 1997. Mr. O'Hanley currently serves as Chairman of the Boston Public Library Foundation Board of Directors and sits on the Board of Directors of Beth Israel Deaconess Medical Center, the Board of Trustees of the Marine Biological Laboratory and the Advisory Board of the Maxwell School of Citizenship and Public Administration at Syracuse University. Mr. O'Hanley also chairs the Council on Asset Management for the Financial Services Roundtable and is a member of the Board of Directors of Institutional Investor's U.S. Institute. |
* Trustees have been determined to be "Interested Trustees" by virtue of, among other things, their affiliation with the trust or various entities under common control with FMR.
+ The information above includes each Trustee's principal occupation during the last five years and other information relating to the experience, attributes, and skills relevant to each Trustee's qualifications to serve as a Trustee, which led to the conclusion that each Trustee should serve as a Trustee for the fund.
Annual Report
Trustees and Officers - continued
Independent Trustees:
Correspondence intended for each Independent Trustee (that is, the Trustees other than the Interested Trustees) may be sent to Fidelity Investments, P.O. Box 55235, Boston, Massachusetts 02205-5235.
Name, Age; Principal Occupations and Other Relevant Experience+ | |
Dennis J. Dirks (63) | |
| Year of Election or Appointment: 2005 Prior to his retirement in May 2003, Mr. Dirks was Chief Operating Officer and a member of the Board of The Depository Trust & Clearing Corporation (DTCC). He also served as President, Chief Operating Officer, and Board member of The Depository Trust Company (DTC) and President and Board member of the National Securities Clearing Corporation (NSCC). In addition, Mr. Dirks served as Chief Executive Officer and Board member of the Government Securities Clearing Corporation, Chief Executive Officer and Board member of the Mortgage-Backed Securities Clearing Corporation, as a Trustee and a member of the Finance Committee of Manhattan College (2005-2008), and as a Trustee and a member of the Finance Committee of AHRC of Nassau County (2006-2008). Mr. Dirks is a member of the Independent Directors Council (IDC) Governing Council (2010-present) and Board of Directors for The Brookville Center for Children's Services, Inc. (2009-present). |
Alan J. Lacy (58) | |
| Year of Election or Appointment: 2008 Mr. Lacy serves as Senior Adviser (2007-present) of Oak Hill Capital Partners, L.P. (private equity). Mr. Lacy also served as Chief Executive Officer (2000-2005) and Vice Chairman (2005-2006) of Sears Holdings Corporation and Sears, Roebuck and Co. (retail). In addition, Mr. Lacy serves as a member of the Board of Directors of Dave & Buster's, Inc. (restaurant and entertainment complexes, 2010-present), The Hillman Companies, Inc. (hardware wholesalers, 2010-present), and Bristol-Myers Squibb Company (global pharmaceuticals, 2007-present). Mr. Lacy is a member of the Board of Trustees of The National Parks Conservation Association (2006-present). Previously, Mr. Lacy served as Chairman of the Board of Trustees of the National Parks Conservation Association (2008-2011) and as a member of the Board of Directors for the Western Union Company (global money transfer, 2006-2011). |
Ned C. Lautenbach (67) | |
| Year of Election or Appointment: 2000 Mr. Lautenbach is Chairman of the Independent Trustees of the Equity and High Income Funds (2006-present). Mr. Lautenbach currently serves as the Lead Director of the Eaton Corporation Board of Directors (diversified industrial, 1997-present). Mr. Lautenbach is also a member of the Board of Directors of the Philharmonic Center for the Arts in Naples, Florida (1999-present); a member of the Board of Trustees of Fairfield University (2005-present); and a member of the Council on Foreign Relations (1994-present). Previously, Mr. Lautenbach was a Partner/Advisory Partner at Clayton, Dubilier & Rice, LLC (private equity investment, 1998-2010), as well as a Director of Sony Corporation (2006-2007). |
Joseph Mauriello (67) | |
| Year of Election or Appointment: 2008 Prior to his retirement in January 2006, Mr. Mauriello served in numerous senior management positions including Deputy Chairman and Chief Operating Officer (2004-2005), and Vice Chairman of Financial Services (2002-2004) of KPMG LLP US (professional services, 1965-2005). Mr. Mauriello currently serves as a member of the Board of Directors of XL Group plc. (global insurance and re-insurance, 2006-present) and of Arcadia Resources Inc. (health care services and products, 2007-present). Previously, Mr. Mauriello served as a Director of the Hamilton Funds of the Bank of New York (2006-2007). |
Robert W. Selander (61) | |
| Year of Election or Appointment: 2011 Previously, Mr. Selander served as a Member of the Advisory Board of Fidelity's Equity and High Income Funds (2011), Executive Vice Chairman (2010), Chief Executive Officer (2009-2010), and President and Chief Executive Officer (1997-2009) of Mastercard, Inc. |
Cornelia M. Small (67) | |
| Year of Election or Appointment: 2005 Ms. Small is a member of the Board of Directors of the Teagle Foundation (2009-present). Ms. Small is also a member of the Investment Committee, and Chair (2008-present) and a member of the Board of Trustees of Smith College. In addition, Ms. Small serves on the Investment Committee of the Berkshire Taconic Community Foundation (2008-present). Previously, Ms. Small served as Chairperson of the Investment Committee (2002-2008) of Smith College. In addition, Ms. Small served as Chief Investment Officer, Director of Global Equity Investments, and a member of the Board of Directors of Scudder, Stevens & Clark and Scudder Kemper Investments. |
William S. Stavropoulos (72) | |
| Year of Election or Appointment: 2002 Mr. Stavropoulos is Vice Chairman of the Independent Trustees of the Equity and High Income Funds (2006-present). Mr. Stavropoulos serves as President and Founder of the Michigan Baseball Foundation, the Great Lakes Loons (2007-present). Mr. Stavropoulos is Chairman Emeritus of the Board of Directors of The Dow Chemical Company, where he previously served in numerous senior management positions, including President, CEO (1995-2000; 2002-2004), Chairman of the Executive Committee (2000-2006), and as a member of the Board of Directors (1990-2006). Currently, Mr. Stavropoulos is Chairman of Univar (global distributor of commodity and specialty chemicals, 2010-present), a Director of Teradata Corporation (data warehousing and technology solutions, 2008-present), Chemical Financial Corporation, Maersk Inc. (industrial conglomerate), Tyco International, Inc. (multinational manufacturing and services, 2007-present), and a member of the Advisory Board for Metalmark Capital (private equity investment, 2005-present). Mr. Stavropoulos is a special advisor to Clayton, Dubilier & Rice, LLC (private equity investment). In addition, Mr. Stavropoulos is a member of the University of Notre Dame Advisory Council for the College of Science. |
David M. Thomas (62) | |
| Year of Election or Appointment: 2008 Previously, Mr. Thomas served as Executive Chairman (2005-2006) and Chairman and Chief Executive Officer (2000-2005) of IMS Health, Inc. (pharmaceutical and healthcare information solutions). In addition, Mr. Thomas serves as a member of the Board of Directors of Fortune Brands, Inc. (consumer products), and Interpublic Group of Companies, Inc. (marketing communication, 2004-present). |
Michael E. Wiley (61) | |
| Year of Election or Appointment: 2008 Mr. Wiley also serves as a Director of Asia Pacific Exploration Consolidated (international oil and gas exploration and production, 2008-present). Mr. Wiley serves as a Director of Tesoro Corporation (independent oil refiner and marketer, 2005-present), and a Director of Bill Barrett Corporation (exploration and production, 2005-present). In addition, Mr. Wiley also serves as a Director of Post Oak Bank (privately-held bank, 2004-present). Previously, Mr. Wiley served as a member of the Board of Trustees of the University of Tulsa (2000-2006; 2007-2010), as a Senior Energy Advisor of Katzenbach Partners, LLC (consulting, 2006-2007), as an Advisory Director of Riverstone Holdings (private investment), Chairman, President, and CEO of Baker Hughes, Inc. (oilfield services, 2000-2004), and as Director of Spinnaker Exploration Company (exploration and production, 2001-2005). |
Annual Report
+ The information above includes each Trustee's principal occupation during the last five years and other information relating to the experience, attributes, and skills relevant to each Trustee's qualifications to serve as a Trustee, which led to the conclusion that each Trustee should serve as a Trustee for the fund.
Advisory Board Members and Executive Officers:
Correspondence intended for each executive officer, Edward C. Johnson 3d, and Peter S. Lynch may be sent to Fidelity Investments, 82 Devonshire Street, Boston, Massachusetts 02109.
Name, Age; Principal Occupation | |
Edward C. Johnson 3d (81) | |
| Year of Election or Appointment: 2011 Member of the Advisory Board of Fidelity's Equity and High Income Funds. Mr. Johnson serves as Chief Executive Officer, Chairman, and a Director of FMR LLC, and also serves as Chairman and Director of FIL Limited. Previously, Mr. Johnson served as a Trustee and Chairman of the Board of certain Fidelity Trusts, Chairman and a Director of FMR, Chairman and a Director of FMR Co., Inc., and President of FMR LLC (2006-2007). |
Peter S. Lynch (68) | |
| Year of Election or Appointment: 2003 Member of the Advisory Board of Fidelity's Equity and High Income Funds. Mr. Lynch is Vice Chairman and a Director of FMR and FMR Co., Inc. In addition, Mr. Lynch serves as a Trustee of Boston College and as the Chairman of the Inner-City Scholarship Fund. Previously, Mr. Lynch served on the Special Olympics International Board of Directors (1997-2006). |
Kenneth B. Robins (42) | |
| Year of Election or Appointment: 2008 President and Treasurer of Fidelity's Equity and High Income Funds. Mr. Robins also serves as President and Treasurer (2010-present) and Assistant Treasurer (2009-present) of other Fidelity funds and is an employee of Fidelity Investments (2004-present). Previously, Mr. Robins served as Deputy Treasurer of the Fidelity funds (2005-2008) and Treasurer and Chief Financial Officer of The North Carolina Capital Management Trust: Cash and Term Portfolios (2006-2008). |
Brian B. Hogan (47) | |
| Year of Election or Appointment: 2009 Vice President of Equity and High Income Funds. Mr. Hogan also serves as President of FMR's Equity Division (2009-present). Previously, Mr. Hogan served as Senior Vice President, Equity Research of FMR (2006-2009) and as a portfolio manager. |
Thomas C. Hense (48) | |
| Year of Election or Appointment: 2008 or 2010 Vice President of Fidelity's High Income (2008), Small Cap (2008), and Value (2010) Funds. Previously, Mr. Hense served as a portfolio manager for Fidelity's Institutional Money Management Group (Pyramis) (2003-2008). |
Scott C. Goebel (44) | |
| Year of Election or Appointment: 2008 Secretary and Chief Legal Officer (CLO) of the Fidelity funds. Mr. Goebel also serves as Secretary of Fidelity Investments Money Management, Inc. (FIMM) (2010-present) and Fidelity Research and Analysis Company (FRAC) (2010-present); Secretary and CLO of The North Carolina Capital Management Trust: Cash and Term Portfolios (2008-present); General Counsel, Secretary, and Senior Vice President of FMR (2008-present) and FMR Co., Inc. (2008-present); employed by FMR LLC or an affiliate (2001-present); Chief Legal Officer of Fidelity Management & Research (Hong Kong) Limited (2008-present) and Assistant Secretary of Fidelity Management & Research (Japan) Inc. (2008-present), and Fidelity Management & Research (U.K.) Inc. (2008-present). Previously, Mr. Goebel served as Assistant Secretary of FIMM (2008-2010), FRAC (2008-2010), and the Funds (2007-2008) and as Vice President and Secretary of Fidelity Distributors Corporation (FDC) (2005-2007). |
William C. Coffey (42) | |
| Year of Election or Appointment: 2009 Assistant Secretary of Fidelity's Equity and High Income Funds. Mr. Coffey also serves as Senior Vice President and Deputy General Counsel of FMR LLC (2010-present), and is an employee of Fidelity Investments. Previously, Mr. Coffey served as Vice President and Associate General Counsel of FMR LLC (2005-2009). |
Holly C. Laurent (57) | |
| Year of Election or Appointment: 2008 Anti-Money Laundering (AML) Officer of the Fidelity funds. Ms. Laurent also serves as AML Officer of The North Carolina Capital Management Trust: Cash and Term Portfolios (2008-present) and is an employee of Fidelity Investments. Previously, Ms. Laurent was Senior Vice President and Head of Legal for Fidelity Business Services India Pvt. Ltd. (2006-2008), and Senior Vice President, Deputy General Counsel and Group Head for FMR LLC (2005-2006). |
Christine Reynolds (53) | |
| Year of Election or Appointment: 2008 Chief Financial Officer of the Fidelity funds. Ms. Reynolds became President of Fidelity Pricing and Cash Management Services (FPCMS) in August 2008. Ms. Reynolds served as Chief Operating Officer of FPCMS (2007-2008). Previously, Ms. Reynolds served as President, Treasurer, and Anti-Money Laundering officer of the Fidelity funds (2004-2007). |
Kenneth A. Rathgeber (64) | |
| Year of Election or Appointment: 2004 Chief Compliance Officer of Fidelity's Equity and High Income Funds. Mr. Rathgeber is Chief Compliance Officer of Fidelity Management & Research (Hong Kong) Limited (2008-present), Fidelity Management & Research (Japan) Inc. (2008-present), FMR (2005-present), FMR Co., Inc. (2005-present), Fidelity Management & Research (U.K.) Inc. (2005-present), Fidelity Research & Analysis Company (2005-present), Fidelity Investments Money Management, Inc. (2005-present), Pyramis Global Advisors, LLC (2005-present), and Strategic Advisers, Inc. (2005-present). |
Joseph F. Zambello (54) | |
| Year of Election or Appointment: 2011 Deputy Treasurer of the Fidelity funds. Mr. Zambello is an employee of Fidelity Investments. Previously, Mr. Zambello served as Vice President of FMR's Program Management Group (2009-2011) and Vice President of the Transfer Agent Oversight Group (2005-2009). |
Adrien E. Deberghes (44) | |
| Year of Election or Appointment: 2008 Deputy Treasurer of Fidelity's Equity and High Income Funds. Mr. Deberghes also serves as Vice President and Assistant Treasurer of Fidelity Rutland Square Trust II and Fidelity Commonwealth Trust II (2011-present), Assistant Treasurer of other Fidelity funds (2010-present), and is an employee of Fidelity Investments (2008-present). Previously, Mr. Deberghes served as Senior Vice President of Mutual Fund Administration at State Street Corporation (2007-2008), Senior Director of Mutual Fund Administration at Investors Bank & Trust (2005-2007), and Director of Finance for Dunkin' Brands (2000-2005). |
Stephanie J. Dorsey (42) | |
| Year of Election or Appointment: 2010 Assistant Treasurer of Fidelity's Equity and High Income Funds. Ms. Dorsey also serves as Deputy Treasurer of other Fidelity funds (2008-present) and is an employee of Fidelity Investments (2008-present). Previously, Ms. Dorsey served as Treasurer (2004-2008) of the JPMorgan Mutual Funds and Vice President (2004-2008) of JPMorgan Chase Bank. |
John R. Hebble (53) | |
| Year of Election or Appointment: 2009 Assistant Treasurer of Fidelity's Equity and High Income Funds. Mr. Hebble also serves as President (2011-present), Treasurer, and Chief Financial Officer of The North Carolina Capital Management Trust: Cash and Term Portfolios (2008-present), President and Treasurer of other Fidelity funds (2008-present) and is an employee of Fidelity Investments. |
Gary W. Ryan (53) | |
| Year of Election or Appointment: 2005 Assistant Treasurer of the Fidelity funds. Mr. Ryan is an employee of Fidelity Investments. Previously, Mr. Ryan served as Vice President of Fund Reporting in Fidelity Pricing and Cash Management Services (FPCMS) (1999-2005). |
Jonathan Davis (43) | |
| Year of Election or Appointment: 2010 Assistant Treasurer of the Fidelity funds. Mr. Davis is also Assistant Treasurer of Fidelity Rutland Square Trust II and Fidelity Commonwealth Trust II. Mr. Davis is an employee of Fidelity Investments. Previously, Mr. Davis served as Vice President and Associate General Counsel of FMR LLC (2003-2010). |
Annual Report
Distributions (Unaudited)
Institutional Class designates 100% of the dividends distributed during the fiscal year as qualifying for the dividends-received deduction for corporate shareholders.
Institutional Class designates 100% of the dividends distributed during the fiscal year as amounts which may be taken into account as a dividend for purposes of the maximum rate under section 1(h)(11) of the Internal Revenue Code.
The fund will notify shareholders in January 2013 of amounts for use in preparing 2012 income tax returns.
Annual Report
Investment Adviser
Fidelity Management & Research Company
Boston, MA
Investment Sub-Advisers
FMR Co., Inc.
Fidelity Management & Research
(U.K.) Inc.
Fidelity Management & Research
(Hong Kong) Limited
Fidelity Management & Research
(Japan) Inc.
General Distributor
Fidelity Distributors Corporation
Boston, MA
Transfer and Service Agents
Fidelity Investments Institutional Operations Company, Inc.
Boston, MA
Fidelity Service Company, Inc.
Boston, MA
Custodian
Citibank, N.A.
New York, NY
AMCVI-UANN-0312
1.838432.102
(Fidelity Investment logo)(registered trademark)
Fidelity®
Series Large Cap Value Fund
and
Fidelity
Series All-Sector Equity Fund
Fidelity Series Large Cap Value Fund
Fidelity Series All-Sector Equity Fund
Class F
Annual Report
January 31, 2012
(Fidelity Cover Art)
Contents
Note to Shareholders | Important information about the fund. | |
Shareholder Expense Example | An example of shareholder expenses. | |
Fidelity® Series Large Cap Value Fund | ||
Performance | How the fund has done over time. | |
Management's Discussion of Fund Performance | The Portfolio Managers' review of fund performance and strategy. | |
Investment Changes | A summary of major shifts in the fund's investment's over the past six months. | |
Investments | A complete list of the fund's investments with their market values. | |
Financial Statements | Statements of assets and liabilities, operations, and changes in net assets, as well as financial highlights. | |
Fidelity® Series All-Sector Equity Fund | ||
Performance | How the fund has done over time. | |
Management's Discussion of Fund Performance | The Portfolio Manager's review of fund performance and strategy. | |
Investment Changes | A summary of major shifts in the fund's investment's over the past six months. | |
Investments | A complete list of the fund's investments with their market values. | |
Financial Statements | Statements of assets and liabilities, operations, and changes in net assets, as well as financial highlights. | |
Notes | Notes to the Financial Statements. | |
Report of Independent Registered Public Accounting Firm |
| |
Trustees and Officers |
| |
Distributions |
| |
Annual Report
To view a fund's proxy voting guidelines and proxy voting record for the 12-month period ended June 30, visit http://www.fidelity.com/proxyvotingresults or visit the Securities and Exchange Commission's (SEC) web site at http://www.sec.gov. You may also call 1-800-544-8544 for Fidelity Series Large Cap Value Fund and Fidelity Series All-Sector Equity Fund or 1-800-835-5092 for Class F of each fund to request a free copy of the proxy voting guidelines.
Standard & Poor's, S&P and S&P 500 are registered service marks of The McGraw-Hill Companies, Inc. and have been licensed for use by Fidelity Distributors Corporation.
Other third party marks appearing herein are the property of their respective owners.
All other marks appearing herein are registered or unregistered trademarks or service marks of FMR LLC or an affiliated company.
This report and the financial statements contained herein are submitted for the general information of the shareholders of the funds. This report is not authorized for distribution to prospective investors in the funds unless preceded or accompanied by an effective prospectus.
A fund files its complete schedule of portfolio holdings with the SEC for the first and third quarters of each fiscal year on Form N-Q. Forms N-Q are available on the SEC's web site at http://www.sec.gov. A fund's Forms N-Q may be reviewed and copied at the SEC's Public Reference Room in Washington, DC. Information regarding the operation of the SEC's Public Reference Room may be obtained by calling 1-800-SEC-0330. For a complete list of a fund's portfolio holdings, view the most recent holdings listing, semiannual report, or annual report on Fidelity's web site at http://www.fidelity.com, http://www.advisor.fidelity.com, or http://www.401k.com, as applicable.
NOT FDIC INSURED • MAY LOSE VALUE • NO BANK GUARANTEE
Neither the funds nor Fidelity Distributors Corporation is a bank.
Annual Report
Note to Shareholders
The following changes relate to Fidelity® Series All-Sector Equity Fund.
Effective as of November 1, 2011:
• Tobias Welo was named Co-Portfolio Manager, replacing John Avery and Matthew Friedman in managing the fund's materials sector investments.
Effective as of March 8, 2011:
• Matthew Friedman is no longer Co-Portfolio Manager of the fund's energy sector investments, which are solely managed by Co-Portfolio Manager Nathan Strik.
• Peter Saperstone was named Co-Portfolio Manager, replacing John Roth in managing the fund's consumer discretionary sector investments.
• The Multi-Manager Group (MMG) was renamed the Stock Selector Large Cap Group, recognizing stock selection as the dominant driver of performance within the portfolios it manages. There is no change in philosophy or process. The group includes experienced portfolio managers who are specialists in one or more market sectors and manage all of Fidelity® Series All-Sector Equity Fund's equity investments.
Annual Report
Shareholder Expense Example
As a shareholder of a Fund, you incur two types of costs: (1) transaction costs, and (2) ongoing costs, including management fees and other Fund expenses. This Example is intended to help you understand your ongoing costs (in dollars) of investing in the Funds and to compare these costs with the ongoing costs of investing in other mutual funds.
The Example is based on an investment of $1,000 invested at the beginning of the period and held for the entire period (August 1, 2011 to January 31, 2012).
Actual Expenses
The first line of the accompanying table for each class of each fund provides information about actual account values and actual expenses. You may use the information in this line, together with the amount you invested, to estimate the expenses that you paid over the period. Simply divide your account value by $1,000.00 (for example, an $8,600 account value divided by $1,000.00 = 8.6), then multiply the result by the number in the first line for a class of the fund under the heading entitled "Expenses Paid During Period" to estimate the expenses you paid on your account during this period. In addition, each Fund, as a shareholder in the underlying Fidelity Central Funds, will indirectly bear its pro-rata share of the fees and expenses incurred by the underlying Fidelity Central Funds. These fees and expenses are not included in the Fund's annualized expense ratio used to calculate the expense estimate in the table below.
Hypothetical Example for Comparison Purposes
The second line of the accompanying table for each class of each fund provides information about hypothetical account values and hypothetical expenses based on a Class' actual expense ratio and an assumed rate of return of 5% per year before expenses, which is not the Class' actual return. The hypothetical account values and expenses may not be used to estimate the actual ending account balance or expenses you paid for the period. You may use this information to compare the ongoing costs of investing in the Fund and other funds. To do so, compare this 5% hypothetical example with the 5% hypothetical examples that appear in the shareholder reports of the other funds. In addition, each Fund, as a shareholder in the underlying Fidelity Central Funds, will indirectly bear its pro-rata share of the fees and expenses incurred by the underlying Fidelity Central Funds. These fees and expenses are not included in the Fund's annualized expense ratio used to calculate the expense estimate in the table below.
Please note that the expenses shown in the table are meant to highlight your ongoing costs only and do not reflect any transaction costs. Therefore, the second line of the table is useful in comparing ongoing costs only, and will not help you determine the relative total costs of owning different funds.
Annual Report
Shareholder Expense Example - continued
| Annualized | Beginning | Ending | Expenses Paid |
Fidelity Series Large Cap Value Fund |
|
|
|
|
Series Large Cap Value | .62% |
|
|
|
Actual |
| $ 1,000.00 | $ 974.20 | $ 3.09 |
HypotheticalA |
| $ 1,000.00 | $ 1,022.08 | $ 3.16 |
Class F | .42% |
|
|
|
Actual |
| $ 1,000.00 | $ 975.50 | $ 2.09 |
HypotheticalA |
| $ 1,000.00 | $ 1,023.09 | $ 2.14 |
Fidelity Series All-Sector Equity Fund |
|
|
|
|
Series All-Sector Equity | .87% |
|
|
|
Actual |
| $ 1,000.00 | $ 988.20 | $ 4.36 |
HypotheticalA |
| $ 1,000.00 | $ 1,020.82 | $ 4.43 |
Class F | .67% |
|
|
|
Actual |
| $ 1,000.00 | $ 989.50 | $ 3.36 |
HypotheticalA |
| $ 1,000.00 | $ 1,021.83 | $ 3.41 |
A 5% return per year before expenses
* Expenses are equal to each Class' annualized expense ratio, multiplied by the average account value over the period, multiplied by 184/365 (to reflect the one-half year period).
Annual Report
Fidelity Series Large Cap Value Fund
Performance: The Bottom Line
Average annual total return reflects the change in the value of an investment, assuming reinvestment of the class' distributions from dividend income and capital gains (the profits earned upon the sale of securities that have grown in value, if any) and assuming a constant rate of performance each year. The $10,000 table and the fund's returns do not reflect the deduction of taxes that a shareholder would pay on fund distributions or the redemption of fund shares. During periods of reimbursement by Fidelity, a fund's total return will be greater than it would be had the reimbursement not occurred. How a fund did yesterday is no guarantee of how it will do tomorrow.
Average Annual Total Returns
Periods ended January 31, 2012 | Past 1 | Life of |
Fidelity® Series Large Cap Value Fund | -4.28% | 8.76% |
Class F B | -4.06% | 8.95% |
A From October 24, 2008.
B The initial offering of Class F shares took place on June 26, 2009. Returns prior to June 26, 2009 are those of Fidelity Series Large Cap Value Fund, the original class of the fund.
$10,000 Over Life of Fund
Let's say hypothetically that $10,000 was invested in Fidelity ® Series Large Cap Value Fund, a class of the fund, on October 24, 2008, when the fund started. The chart shows how the value of your investment would have changed, and also shows how the Russell 1000® Value Index performed over the same period.
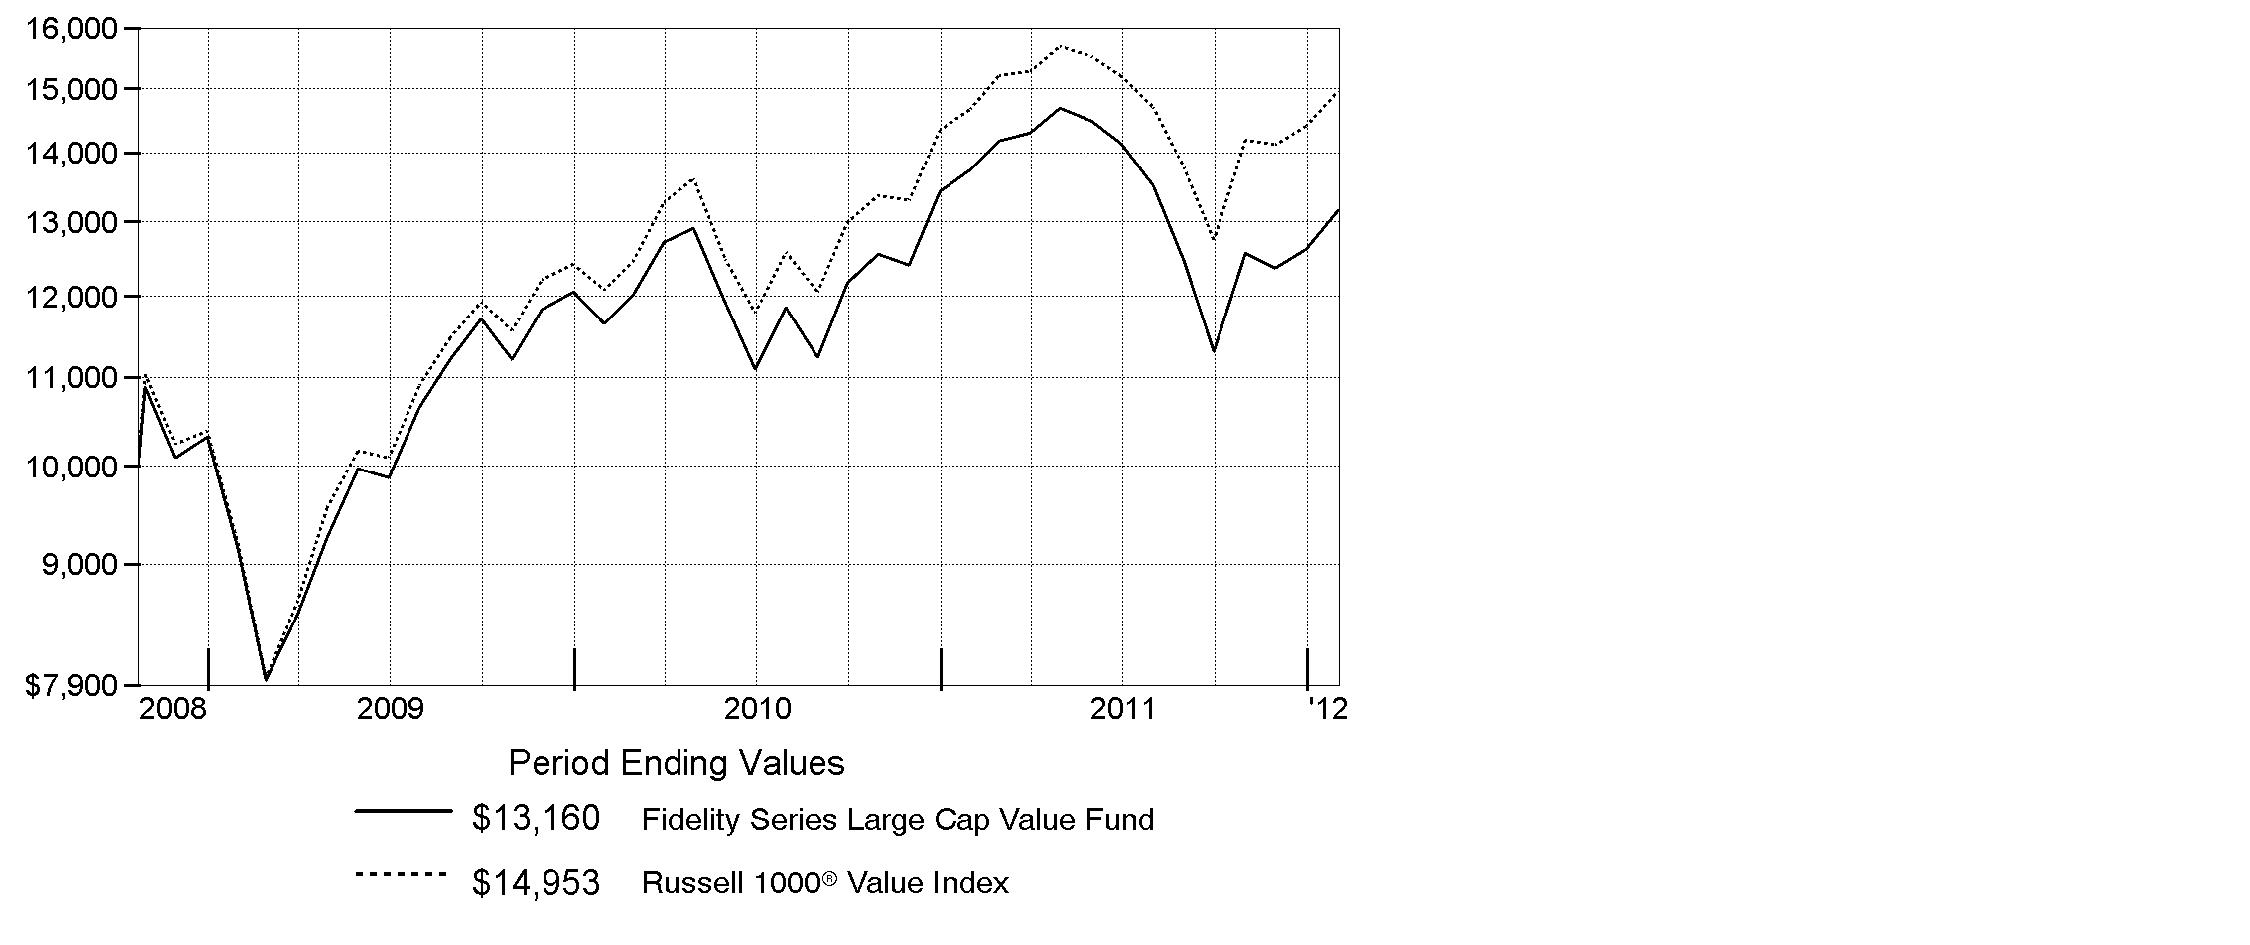
Annual Report
Fidelity Series Large Cap Value Fund
Management's Discussion of Fund Performance
Market Recap: After enduring one of the most volatile trading periods on record, U.S. stocks posted a gain for the 12 months ending January 31, 2012, sparked by a January rally. Strong corporate earnings reports and hints of economic recovery sent stocks mostly upward through April, when sovereign debt woes in Europe sparked fear of a global slowdown. In the summer, equities plummeted on eurozone instability, debate over the U.S. debt ceiling and a historic downgrade of the nation's sovereign debt rating. After falling as much as 13% by early August, the broad-based S&P 500® Index seesawed back to end the period on an optimistic note. For the full 12 months, the S&P 500® rose 4.22%, while the technology-laden Nasdaq Composite® Index added 5.26%. Investors began to shed perceived riskier smaller-cap stocks in favor of larger, more-established and dividend-paying names, helping to drive the Dow Jones® Industrial Average up 9.12% for the year, while the Russell 2000® - a proxy for small-caps - and Russell Midcap® indexes added 2.86% and 2.25%, respectively. Within the S&P 500®, defensive sectors such as health care (+16%) and utilities (+14%) fared best, while financials (-12%) struggled. Foreign developed-markets stocks were stung by Europe's turmoil, and the MSCI® EAFE® (Europe, Australasia, Far East) Index fell 9.49%.
Comments from Bruce Dirks and Michael Chren, Co-Portfolio Managers of Fidelity® Series Large Cap Value Fund: For the year, the fund's Series Large Cap Value and Class F shares returned -4.28% and -4.06%, respectively, trailing the 1.88% gain of the Russell 1000® Value Index. Information technology, financials and industrials all had a significant negative impact on the fund's relative performance, mainly because of weak security selection, which overwhelmed solid positioning in consumer discretionary and energy. Underweighting the strong-performing utilities sector, along with negative stock selection in the category, also notably hampered results. Individual detractors included two non-U.S. out-of-benchmark investments: French telecommunications equipment provider Alcatel-Lucent - which was by far the biggest individual detractor - and Swiss specialty chemicals company Clariant. Overweighting diversified financial services giant Citigroup and underweighting semiconductor maker Intel also hurt. On the plus side, a substantial overweighting in Garmin, which develops GPS-enabled navigation and communication products, proved advantageous. Additional contributors included an underweighting in Bank of America - which dramatically lagged the benchmark - and pharmaceuticals heavyweight Pfizer.
The views expressed above reflect those of the portfolio manager(s) only through the end of the period as stated on the cover of this report and do not necessarily represent the views of Fidelity or any other person in the Fidelity organization. Any such views are subject to change at any time based upon market or other conditions and Fidelity disclaims any responsibility to update such views. These views may not be relied on as investment advice and, because investment decisions for a Fidelity fund are based on numerous factors, may not be relied on as an indication of trading intent on behalf of any Fidelity fund.
Annual Report
Fidelity Series Large Cap Value Fund
Investment Changes (Unaudited)
Top Ten Stocks as of January 31, 2012 | ||
| % of fund's | % of fund's net assets |
Pfizer, Inc. | 3.7 | 2.8 |
Chevron Corp. | 3.4 | 3.5 |
Citigroup, Inc. | 3.3 | 3.6 |
General Electric Co. | 3.2 | 2.8 |
Merck & Co., Inc. | 3.1 | 2.6 |
JPMorgan Chase & Co. | 2.8 | 2.7 |
Wells Fargo & Co. | 2.7 | 2.5 |
Johnson & Johnson | 2.5 | 2.2 |
Grupo Modelo SAB de CV Series C | 2.4 | 2.4 |
Procter & Gamble Co. | 2.3 | 0.9 |
| 29.4 | |
Top Five Market Sectors as of January 31, 2012 | ||
| % of fund's | % of fund's net assets |
Financials | 24.4 | 25.9 |
Health Care | 13.9 | 13.2 |
Energy | 10.6 | 12.8 |
Information Technology | 10.4 | 11.7 |
Consumer Staples | 9.8 | 8.4 |
Asset Allocation (% of fund's net assets) | |||||||
As of January 31, 2012* | As of July 31, 2011** | ||||||
| Stocks 95.9% |
| | Stocks 98.8% |
| ||
| Short-Term |
| | Short-Term |
| ||
* Foreign investments | 12.7% |
| ** Foreign investments | 14.7% |
| ||

Annual Report
Fidelity Series Large Cap Value Fund
Investments January 31, 2012
Showing Percentage of Net Assets
Common Stocks - 95.9% | |||
Shares | Value | ||
CONSUMER DISCRETIONARY - 8.6% | |||
Auto Components - 0.3% | |||
TRW Automotive Holdings Corp. (a) | 829,300 | $ 31,115,336 | |
Automobiles - 0.4% | |||
Honda Motor Co. Ltd. | 1,097,400 | 37,868,070 | |
Hotels, Restaurants & Leisure - 0.4% | |||
McDonald's Corp. | 403,900 | 40,006,295 | |
Household Durables - 2.0% | |||
D.R. Horton, Inc. | 2,115,862 | 29,452,799 | |
Garmin Ltd. (d) | 4,256,658 | 177,502,639 | |
| 206,955,438 | ||
Media - 2.1% | |||
CBS Corp. Class B | 1,835,100 | 52,263,648 | |
DISH Network Corp. Class A | 1,429,400 | 39,908,848 | |
Time Warner, Inc. | 2,293,870 | 85,010,822 | |
Washington Post Co. Class B (d) | 116,878 | 44,262,867 | |
| 221,446,185 | ||
Multiline Retail - 1.9% | |||
JCPenney Co., Inc. (d) | 3,050,674 | 126,755,505 | |
Macy's, Inc. | 1,848,800 | 62,286,072 | |
Target Corp. | 252,187 | 12,813,621 | |
| 201,855,198 | ||
Specialty Retail - 1.1% | |||
Foot Locker, Inc. | 1,172,800 | 30,774,272 | |
GameStop Corp. Class A (a) | 1,173,600 | 27,415,296 | |
Home Depot, Inc. | 1,379,600 | 61,240,444 | |
| 119,430,012 | ||
Textiles, Apparel & Luxury Goods - 0.4% | |||
PVH Corp. | 587,000 | 45,310,530 | |
TOTAL CONSUMER DISCRETIONARY | 903,987,064 | ||
CONSUMER STAPLES - 9.8% | |||
Beverages - 2.7% | |||
Dr Pepper Snapple Group, Inc. | 697,600 | 27,080,832 | |
Grupo Modelo SAB de CV Series C | 41,203,028 | 255,348,940 | |
| 282,429,772 | ||
Common Stocks - continued | |||
Shares | Value | ||
CONSUMER STAPLES - continued | |||
Food & Staples Retailing - 1.4% | |||
CVS Caremark Corp. | 1,994,121 | $ 83,254,552 | |
Wal-Mart Stores, Inc. | 1,101,191 | 67,569,080 | |
| 150,823,632 | ||
Food Products - 2.2% | |||
ConAgra Foods, Inc. | 1,763,900 | 47,043,213 | |
Kraft Foods, Inc. Class A | 4,858,764 | 186,090,661 | |
| 233,133,874 | ||
Household Products - 2.7% | |||
Kimberly-Clark Corp. | 589,300 | 42,170,308 | |
Procter & Gamble Co. | 3,868,478 | 243,868,853 | |
| 286,039,161 | ||
Tobacco - 0.8% | |||
Lorillard, Inc. | 445,461 | 47,838,057 | |
Philip Morris International, Inc. | 471,800 | 35,276,486 | |
| 83,114,543 | ||
TOTAL CONSUMER STAPLES | 1,035,540,982 | ||
ENERGY - 10.6% | |||
Energy Equipment & Services - 2.1% | |||
Cameron International Corp. (a) | 232,300 | 12,358,360 | |
Halliburton Co. | 1,155,100 | 42,484,578 | |
Helmerich & Payne, Inc. | 875,958 | 54,055,368 | |
National Oilwell Varco, Inc. | 877,400 | 64,910,052 | |
Weatherford International Ltd. (a) | 2,914,979 | 48,796,748 | |
| 222,605,106 | ||
Oil, Gas & Consumable Fuels - 8.5% | |||
Alpha Natural Resources, Inc. (a) | 443,842 | 8,930,101 | |
Anadarko Petroleum Corp. | 780,056 | 62,966,120 | |
Apache Corp. | 216,400 | 21,397,632 | |
Chevron Corp. | 3,466,435 | 357,320,120 | |
Exxon Mobil Corp. | 410,200 | 34,350,148 | |
Marathon Oil Corp. | 2,240,000 | 70,313,600 | |
Marathon Petroleum Corp. | 1,959,936 | 74,908,754 | |
Nexen, Inc. | 2,229,900 | 39,961,409 | |
Occidental Petroleum Corp. | 1,042,382 | 103,998,452 | |
Royal Dutch Shell PLC Class A sponsored ADR | 749,300 | 53,470,048 | |
Common Stocks - continued | |||
Shares | Value | ||
ENERGY - continued | |||
Oil, Gas & Consumable Fuels - continued | |||
Tesoro Corp. (a) | 1,139,000 | $ 28,509,170 | |
Valero Energy Corp. | 1,536,200 | 36,853,438 | |
| 892,978,992 | ||
TOTAL ENERGY | 1,115,584,098 | ||
FINANCIALS - 24.4% | |||
Capital Markets - 3.0% | |||
Bank of New York Mellon Corp. | 1,676,800 | 33,753,984 | |
E*TRADE Financial Corp. (a) | 10,502,498 | 86,015,459 | |
Goldman Sachs Group, Inc. | 227,950 | 25,409,587 | |
Lazard Ltd. Class A | 484,800 | 13,923,456 | |
Morgan Stanley | 3,811,037 | 71,075,840 | |
State Street Corp. | 2,161,162 | 84,674,327 | |
| 314,852,653 | ||
Commercial Banks - 6.8% | |||
Aozora Bank Ltd. | 37,779,000 | 105,065,565 | |
BB&T Corp. | 1,531,600 | 41,644,204 | |
Fifth Third Bancorp | 2,590,600 | 33,703,706 | |
KeyCorp | 9,280,900 | 72,112,593 | |
Regions Financial Corp. | 6,440,000 | 33,616,800 | |
U.S. Bancorp | 5,157,421 | 145,542,421 | |
Wells Fargo & Co. | 9,599,745 | 280,408,551 | |
| 712,093,840 | ||
Consumer Finance - 1.5% | |||
Capital One Financial Corp. | 1,907,300 | 87,258,975 | |
Discover Financial Services | 1,380,500 | 37,521,990 | |
SLM Corp. | 2,192,300 | 32,774,885 | |
| 157,555,850 | ||
Diversified Financial Services - 6.6% | |||
Bank of America Corp. | 7,536,632 | 53,736,186 | |
Citigroup, Inc. | 11,369,074 | 349,257,953 | |
JPMorgan Chase & Co. | 7,728,786 | 288,283,718 | |
| 691,277,857 | ||
Insurance - 5.2% | |||
ACE Ltd. | 828,300 | 57,649,680 | |
Assurant, Inc. | 1,399,209 | 55,408,676 | |
Berkshire Hathaway, Inc. Class B (a) | 892,630 | 69,955,413 | |
Common Stocks - continued | |||
Shares | Value | ||
FINANCIALS - continued | |||
Insurance - continued | |||
Hartford Financial Services Group, Inc. | 1,910,800 | $ 33,477,216 | |
Lincoln National Corp. | 1,490,900 | 32,113,986 | |
MetLife, Inc. | 1,181,757 | 41,751,475 | |
Prudential Financial, Inc. | 1,306,800 | 74,801,232 | |
RenaissanceRe Holdings Ltd. | 276,794 | 20,236,409 | |
The Chubb Corp. | 674,967 | 45,499,525 | |
Unum Group | 1,413,400 | 32,267,922 | |
Validus Holdings Ltd. | 895,300 | 28,712,271 | |
XL Group PLC Class A | 2,851,438 | 57,798,648 | |
| 549,672,453 | ||
Real Estate Investment Trusts - 1.2% | |||
American Capital Agency Corp. | 960,600 | 28,164,792 | |
AvalonBay Communities, Inc. | 270,100 | 36,736,301 | |
Simon Property Group, Inc. | 242,200 | 32,905,292 | |
Weyerhaeuser Co. | 1,650,477 | 33,042,550 | |
| 130,848,935 | ||
Thrifts & Mortgage Finance - 0.1% | |||
Radian Group, Inc. (d) | 3,189,405 | 8,770,864 | |
TOTAL FINANCIALS | 2,565,072,452 | ||
HEALTH CARE - 13.9% | |||
Biotechnology - 1.4% | |||
Amgen, Inc. | 2,196,100 | 149,137,151 | |
Health Care Equipment & Supplies - 0.3% | |||
CareFusion Corp. (a) | 1,209,704 | 28,972,411 | |
Health Care Providers & Services - 1.5% | |||
Aetna, Inc. | 1,198,500 | 52,374,450 | |
UnitedHealth Group, Inc. | 1,363,000 | 70,589,770 | |
WellPoint, Inc. | 644,800 | 41,473,536 | |
| 164,437,756 | ||
Pharmaceuticals - 10.7% | |||
Eli Lilly & Co. | 520,097 | 20,668,655 | |
Johnson & Johnson | 3,898,154 | 256,927,330 | |
Merck & Co., Inc. | 8,546,808 | 327,000,874 | |
Common Stocks - continued | |||
Shares | Value | ||
HEALTH CARE - continued | |||
Pharmaceuticals - continued | |||
Pfizer, Inc. | 18,318,087 | $ 392,007,065 | |
Sanofi-aventis sponsored ADR | 3,397,625 | 126,153,816 | |
| 1,122,757,740 | ||
TOTAL HEALTH CARE | 1,465,305,058 | ||
INDUSTRIALS - 7.0% | |||
Aerospace & Defense - 1.1% | |||
Raytheon Co. | 832,400 | 39,946,876 | |
Textron, Inc. | 3,027,357 | 77,137,056 | |
| 117,083,932 | ||
Commercial Services & Supplies - 0.5% | |||
Republic Services, Inc. | 1,678,400 | 49,143,552 | |
Construction & Engineering - 0.6% | |||
Jacobs Engineering Group, Inc. (a) | 707,136 | 31,651,407 | |
KBR, Inc. | 987,252 | 31,730,279 | |
| 63,381,686 | ||
Industrial Conglomerates - 3.2% | |||
General Electric Co. | 18,287,721 | 342,163,260 | |
Machinery - 0.7% | |||
Cummins, Inc. | 364,400 | 37,897,600 | |
Parker Hannifin Corp. | 386,600 | 31,190,888 | |
| 69,088,488 | ||
Professional Services - 0.3% | |||
Towers Watson & Co. | 476,500 | 28,494,700 | |
Road & Rail - 0.6% | |||
Union Pacific Corp. | 562,400 | 64,287,944 | |
TOTAL INDUSTRIALS | 733,643,562 | ||
INFORMATION TECHNOLOGY - 10.4% | |||
Communications Equipment - 4.9% | |||
Alcatel-Lucent SA sponsored ADR (a)(d) | 82,789,143 | 144,053,109 | |
Brocade Communications Systems, Inc. (a) | 4,822,800 | 27,055,908 | |
Cisco Systems, Inc. | 10,236,587 | 200,944,203 | |
Common Stocks - continued | |||
Shares | Value | ||
INFORMATION TECHNOLOGY - continued | |||
Communications Equipment - continued | |||
Comverse Technology, Inc. (a)(e) | 16,216,081 | $ 102,161,310 | |
Motorola Solutions, Inc. | 791,200 | 36,719,592 | |
| 510,934,122 | ||
Computers & Peripherals - 0.9% | |||
Apple, Inc. (a) | 59,000 | 26,932,320 | |
Hewlett-Packard Co. | 2,529,900 | 70,786,602 | |
| 97,718,922 | ||
Electronic Equipment & Components - 1.3% | |||
Corning, Inc. | 8,814,492 | 113,442,512 | |
Jabil Circuit, Inc. | 1,179,600 | 26,729,736 | |
| 140,172,248 | ||
Office Electronics - 0.5% | |||
Xerox Corp. | 7,041,339 | 54,570,377 | |
Semiconductors & Semiconductor Equipment - 2.0% | |||
Advanced Micro Devices, Inc. (a) | 18,231,694 | 122,334,667 | |
Intel Corp. | 2,195,500 | 58,005,110 | |
KLA-Tencor Corp. | 557,700 | 28,515,201 | |
| 208,854,978 | ||
Software - 0.8% | |||
Microsoft Corp. | 2,696,850 | 79,637,981 | |
TOTAL INFORMATION TECHNOLOGY | 1,091,888,628 | ||
MATERIALS - 3.1% | |||
Chemicals - 1.9% | |||
Ashland, Inc. | 471,300 | 29,720,178 | |
CF Industries Holdings, Inc. | 158,600 | 28,132,468 | |
Clariant AG (Reg.) (a) | 7,036,266 | 85,482,699 | |
LyondellBasell Industries NV Class A | 1,190,500 | 51,310,550 | |
| 194,645,895 | ||
Containers & Packaging - 0.2% | |||
Rock-Tenn Co. Class A | 399,800 | 24,731,628 | |
Common Stocks - continued | |||
Shares | Value | ||
MATERIALS - continued | |||
Metals & Mining - 1.0% | |||
Newmont Mining Corp. | 1,156,254 | $ 71,086,496 | |
Nucor Corp. | 777,962 | 34,611,529 | |
| 105,698,025 | ||
TOTAL MATERIALS | 325,075,548 | ||
TELECOMMUNICATION SERVICES - 2.9% | |||
Diversified Telecommunication Services - 2.7% | |||
AT&T, Inc. | 5,863,986 | 172,459,828 | |
CenturyLink, Inc. | 1,734,178 | 64,216,611 | |
Verizon Communications, Inc. | 1,088,000 | 40,974,080 | |
| 277,650,519 | ||
Wireless Telecommunication Services - 0.2% | |||
Vodafone Group PLC sponsored ADR | 919,700 | 24,914,673 | |
TOTAL TELECOMMUNICATION SERVICES | 302,565,192 | ||
UTILITIES - 5.2% | |||
Electric Utilities - 3.8% | |||
Duke Energy Corp. | 3,567,600 | 76,025,556 | |
Edison International | 1,247,400 | 51,193,296 | |
Exelon Corp. | 1,369,376 | 54,473,777 | |
FirstEnergy Corp. | 2,401,065 | 101,372,964 | |
NextEra Energy, Inc. | 1,949,174 | 116,658,064 | |
| 399,723,657 | ||
Independent Power Producers & Energy Traders - 0.3% | |||
The AES Corp. (a) | 2,576,900 | 32,881,244 | |
Multi-Utilities - 1.1% | |||
CenterPoint Energy, Inc. | 1,757,200 | 32,455,484 | |
NiSource, Inc. | 1,373,500 | 31,219,655 | |
Sempra Energy | 897,394 | 51,061,719 | |
| 114,736,858 | ||
TOTAL UTILITIES | 547,341,759 | ||
TOTAL COMMON STOCKS (Cost $9,281,115,493) |
| ||
Money Market Funds - 6.0% | |||
Shares | Value | ||
Fidelity Cash Central Fund, 0.12% (b) | 429,090,985 | $ 429,090,985 | |
Fidelity Securities Lending Cash Central Fund, 0.12% (b)(c) | 202,579,205 | 202,579,205 | |
TOTAL MONEY MARKET FUNDS (Cost $631,670,190) |
| ||
Cash Equivalents - 0.1% | |||
Maturity Amount |
| ||
Investments in repurchase agreements in a joint trading account at 0.2%, dated 1/31/12 due 2/1/12 (Collateralized by U.S. Government Obligations) # | $ 8,929,049 |
| |
TOTAL INVESTMENT PORTFOLIO - 102.0% (Cost $9,921,714,683) | 10,726,603,533 | ||
NET OTHER ASSETS (LIABILITIES) - (2.0)% | (206,037,868) | ||
NET ASSETS - 100% | $ 10,520,565,665 | ||
Legend |
(a) Non-income producing |
(b) Affiliated fund that is available only to investment companies and other accounts managed by Fidelity Investments. The rate quoted is the annualized seven-day yield of the fund at period end. A complete unaudited listing of the fund's holdings as of its most recent quarter end is available upon request. In addition, each Fidelity Central Fund's financial statements, which are not covered by the Fund's Report of Independent Registered Public Accounting Firm, are available on the SEC's website or upon request. |
(c) Investment made with cash collateral received from securities on loan. |
(d) Security or a portion of the security is on loan at period end. |
(e) Affiliated company |
# Additional information on each counterparty to the repurchase agreement is as follows: |
Repurchase Agreement / Counterparty | Value |
$8,929,000 due 2/01/12 at 0.20% | |
BNP Paribas Securities Corp. | $ 4,710,054 |
Barclays Capital, Inc. | 2,505,348 |
Merrill Lynch, Pierce, Fenner & Smith, Inc. | 1,713,598 |
| $ 8,929,000 |
Affiliated Central Funds |
Information regarding fiscal year to date income earned by the Fund from investments in Fidelity Central Funds is as follows: |
Fund | Income earned |
Fidelity Cash Central Fund | $ 348,561 |
Fidelity Securities Lending Cash Central Fund | 3,762,106 |
Total | $ 4,110,667 |
Other Affiliated Issuers |
An affiliated company is a company in which the Fund has ownership of at least 5% of the voting securities. Fiscal year to date transactions with companies which are or were affiliates are as follows: |
Affiliate | Value, beginning of period | Purchases | Sales | Dividend Income | Value, |
Comverse Technology, Inc. | $ 71,836,599 | $ 44,293,506 | $ 6,504,730 | $ - | $ 102,161,310 |
Grupo Modelo SAB de CV Series C | 143,092,865 | 163,936,186 | 56,033,545 | 5,912,352 | - |
Total | $ 214,929,464 | $ 208,229,692 | $ 62,538,275 | $ 5,912,352 | $ 102,161,310 |
Other Information |
The following is a summary of the inputs used, as of January 31, 2012, involving the Fund's assets and liabilities carried at fair value. The inputs or methodology used for valuing securities may not be an indication of the risk associated with investing in those securities. For more information on valuation inputs, and their aggregation into the levels used in the table below, please refer to the Security Valuation section in the accompanying Notes to Financial Statements. |
Valuation Inputs at Reporting Date: | ||||
Description | Total | Level 1 | Level 2 | Level 3 |
Investments in Securities: | ||||
Equities: | ||||
Consumer Discretionary | $ 903,987,064 | $ 866,118,994 | $ 37,868,070 | $ - |
Consumer Staples | 1,035,540,982 | 1,035,540,982 | - | - |
Energy | 1,115,584,098 | 1,115,584,098 | - | - |
Financials | 2,565,072,452 | 2,565,072,452 | - | - |
Health Care | 1,465,305,058 | 1,465,305,058 | - | - |
Industrials | 733,643,562 | 733,643,562 | - | - |
Information Technology | 1,091,888,628 | 1,091,888,628 | - | - |
Materials | 325,075,548 | 325,075,548 | - | - |
Telecommunication Services | 302,565,192 | 302,565,192 | - | - |
Utilities | 547,341,759 | 547,341,759 | - | - |
Money Market Funds | 631,670,190 | 631,670,190 | - | - |
Cash Equivalents | 8,929,000 | - | 8,929,000 | - |
Total Investments in Securities: | $ 10,726,603,533 | $ 10,679,806,463 | $ 46,797,070 | $ - |
Distribution of investments by country of issue, as a percentage of total net assets, is as follows: (Unaudited) |
United States of America | 87.3% |
Switzerland | 3.5% |
France | 2.6% |
Mexico | 2.4% |
Japan | 1.4% |
Others (Individually Less Than 1%) | 2.8% |
| 100.0% |
See accompanying notes which are an integral part of the financial statements.
Annual Report
Fidelity Series Large Cap Value Fund
Financial Statements
Statement of Assets and Liabilities
| January 31, 2012 | |
|
|
|
Assets | ||
Investment in securities, at value (including securities loaned of $197,461,974 and repurchase agreements of $8,929,000) - See accompanying schedule: Unaffiliated issuers (cost $9,166,829,634) | $ 9,992,772,033 |
|
Fidelity Central Funds (cost $631,670,190) | 631,670,190 |
|
Other affiliated issuers (cost $123,214,859) | 102,161,310 |
|
Total Investments (cost $9,921,714,683) |
| $ 10,726,603,533 |
Cash |
| 3,462 |
Foreign currency held at value (cost $108) | 107 | |
Receivable for investments sold | 104,589,438 | |
Receivable for fund shares sold | 6,970,473 | |
Dividends receivable | 9,221,309 | |
Distributions receivable from Fidelity Central Funds | 132,285 | |
Prepaid expenses | 25,244 | |
Other receivables | 248,057 | |
Total assets | 10,847,793,908 | |
|
|
|
Liabilities | ||
Payable for investments purchased | $ 99,336,328 | |
Payable for fund shares redeemed | 20,514,421 | |
Accrued management fee | 3,457,665 | |
Other affiliated payables | 1,244,479 | |
Other payables and accrued expenses | 96,145 | |
Collateral on securities loaned, at value | 202,579,205 | |
Total liabilities | 327,228,243 | |
|
|
|
Net Assets | $ 10,520,565,665 | |
Net Assets consist of: |
| |
Paid in capital | $ 9,808,563,271 | |
Accumulated undistributed net realized gain (loss) on investments and foreign currency transactions | (92,886,790) | |
Net unrealized appreciation (depreciation) on investments and assets and liabilities in foreign currencies | 804,889,184 | |
Net Assets | $ 10,520,565,665 | |
See accompanying notes which are an integral part of the financial statements.
Annual Report
Statement of Assets and Liabilities - continued
| January 31, 2012 | |
|
|
|
Series Large Cap Value: | $ 10.50 | |
|
|
|
Class F: | $ 10.50 | |
See accompanying notes which are an integral part of the financial statements.
Annual Report
Fidelity Series Large Cap Value Fund
Financial Statements - continued
Statement of Operations
| Year ended January 31, 2012 | |
|
|
|
Investment Income |
|
|
Dividends (including $5,912,352 earned from other affiliated issuers) |
| $ 226,951,706 |
Interest |
| 1,632 |
Income from Fidelity Central Funds |
| 4,110,667 |
Total income |
| 231,064,005 |
|
|
|
Expenses | ||
Management fee | $ 57,488,392 | |
Performance adjustment | (13,726,740) | |
Transfer agent fees | 15,490,776 | |
Accounting and security lending fees | 1,355,010 | |
Custodian fees and expenses | 244,533 | |
Independent trustees' compensation | 59,798 | |
Audit | 82,948 | |
Legal | 33,182 | |
Miscellaneous | 102,174 | |
Total expenses before reductions | 61,130,073 | |
Expense reductions | (1,133,977) | 59,996,096 |
Net investment income (loss) | 171,067,909 | |
Realized and Unrealized Gain (Loss) Net realized gain (loss) on: | ||
Investment securities: |
|
|
Unaffiliated issuers | 442,041,815 | |
Other affiliated issuers | (3,193,908) |
|
Foreign currency transactions | (184,252) | |
Total net realized gain (loss) |
| 438,663,655 |
Change in net unrealized appreciation (depreciation) on: Investment securities | (1,034,889,803) | |
Assets and liabilities in foreign currencies | (725) | |
Total change in net unrealized appreciation (depreciation) |
| (1,034,890,528) |
Net gain (loss) | (596,226,873) | |
Net increase (decrease) in net assets resulting from operations | $ (425,158,964) | |
See accompanying notes which are an integral part of the financial statements.
Annual Report
Statement of Changes in Net Assets
| Year ended | Year ended |
Increase (Decrease) in Net Assets |
|
|
Operations |
|
|
Net investment income (loss) | $ 171,067,909 | $ 107,333,748 |
Net realized gain (loss) | 438,663,655 | 812,235,433 |
Change in net unrealized appreciation (depreciation) | (1,034,890,528) | 649,316,216 |
Net increase (decrease) in net assets resulting | (425,158,964) | 1,568,885,397 |
Distributions to shareholders from net investment income | (168,634,380) | (112,496,239) |
Distributions to shareholders from net realized gain | (828,507,893) | (591,131,337) |
Total distributions | (997,142,273) | (703,627,576) |
Share transactions - net increase (decrease) | 1,333,251,117 | 1,908,720,100 |
Total increase (decrease) in net assets | (89,050,120) | 2,773,977,921 |
|
|
|
Net Assets | ||
Beginning of period | 10,609,615,785 | 7,835,637,864 |
End of period | $ 10,520,565,665 | $ 10,609,615,785 |
See accompanying notes which are an integral part of the financial statements.
Annual Report
Financial Highlights - Series Large Cap Value
Years ended January 31, | 2012 | 2011 | 2010 | 2009G |
Selected Per-Share Data |
|
|
|
|
Net asset value, beginning of period | $ 12.12 | $ 11.05 | $ 9.11 | $ 10.00 |
Income from Investment Operations |
|
|
|
|
Net investment income (loss)D | .18 | .14 | .13 | .05 |
Net realized and unrealized gain (loss) | (.71) | 1.80 | 2.35 | (.90) |
Total from investment operations | (.53) | 1.94 | 2.48 | (.85) |
Distributions from net investment income | (.17) | (.13) | (.11) | (.04) |
Distributions from net realized gain | (.92) | (.74) | (.43) | - |
Total distributions | (1.09) | (.87) | (.54) | (.04) |
Net asset value, end of period | $ 10.50 | $ 12.12 | $ 11.05 | $ 9.11 |
Total ReturnB,C | (4.28)% | 18.02% | 27.43% | (8.58)% |
Ratios to Average Net AssetsE,H |
|
|
|
|
Expenses before reductions | .65% | .73% | .85% | .90%A |
Expenses net of fee waivers, if any | .65% | .73% | .85% | .90%A |
Expenses net of all reductions | .64% | .72% | .84% | .90%A |
Net investment income (loss) | 1.61% | 1.18% | 1.24% | 1.96%A |
Supplemental Data |
|
|
|
|
Net assets, end of period (000 omitted) | $ 6,677,103 | $ 8,404,097 | $ 7,388,558 | $ 2,056,896 |
Portfolio turnover rateF | 121% | 102% | 138% | 118% |
A Annualized
B Total returns for periods of less than one year are not annualized.
C Total returns would have been lower if certain expenses had not been reduced during the applicable periods shown.
D Calculated based on average shares outstanding during the period.
E Fees and expenses of any underlying Fidelity Central Funds are not included in the Fund's expense ratio. The Fund indirectly bears its proportionate share of the expenses of any underlying Fidelity Central Funds.
F Amount does not include the portfolio activity of any underlying Fidelity Central Funds.
G For the period October 24, 2008 (commencement of operations) to January 31, 2009.
H Expense ratios reflect operating expenses of the class. Expenses before reductions do not reflect amounts reimbursed by the investment adviser or reductions from brokerage service arrangements or reductions from other expense offset arrangements and do not represent the amount paid by the class during periods when reimbursements or reductions occur. Expense ratios before reductions for start-up periods may not be representative of longer-term operating periods. Expenses net of fee waivers reflect expenses after reimbursement by the investment adviser but prior to reductions from brokerage service arrangements or other expense offset arrangements. Expenses net of all reductions represent the net expenses paid by the class.
See accompanying notes which are an integral part of the financial statements.
Annual Report
Financial Highlights - Class F
Years ended January 31, | 2012 | 2011 | 2010G |
Selected Per-Share Data |
|
|
|
Net asset value, beginning of period | $ 12.12 | $ 11.05 | $ 9.72 |
Income from Investment Operations |
|
|
|
Net investment income (loss)D | .20 | .16 | .05 |
Net realized and unrealized gain (loss) | (.70) | 1.81 | 1.77 |
Total from investment operations | (.50) | 1.97 | 1.82 |
Distributions from net investment income | (.20) | (.16) | (.13) |
Distributions from net realized gain | (.92) | (.74) | (.36) |
Total distributions | (1.12) | (.90) | (.49) |
Net asset value, end of period | $ 10.50 | $ 12.12 | $ 11.05 |
Total ReturnB,C | (4.06)% | 18.26% | 18.56% |
Ratios to Average Net AssetsE,H |
|
|
|
Expenses before reductions | .44% | .50% | .58%A |
Expenses net of fee waivers, if any | .44% | .50% | .58%A |
Expenses net of all reductions | .43% | .49% | .57%A |
Net investment income (loss) | 1.81% | 1.40% | .79%A |
Supplemental Data |
|
|
|
Net assets, end of period (000 omitted) | $ 3,843,463 | $ 2,205,519 | $ 447,080 |
Portfolio turnover rateF | 121% | 102% | 138% |
A Annualized
B Total returns for periods of less than one year are not annualized.
C Total returns would have been lower if certain expenses had not been reduced during the applicable periods shown.
D Calculated based on average shares outstanding during the period.
E Fees and expenses of any underlying Fidelity Central Funds are not included in the Fund's expense ratio. The Fund indirectly bears its proportionate share of the expenses of any underlying Fidelity Central Funds.
F Amount does not include the portfolio activity of any underlying Fidelity Central Funds.
G For the period June 26, 2009 (commencement of sale of shares) to January 31, 2010.
H Expense ratios reflect operating expenses of the class. Expenses before reductions do not reflect amounts reimbursed by the investment adviser or reductions from brokerage service arrangements or reductions from other expense offset arrangements and do not represent the amount paid by the class during periods when reimbursements or reductions occur. Expense ratios before reductions for start-up periods may not be representative of longer-term operating periods. Expenses net of fee waivers reflect expenses after reimbursement by the investment adviser but prior to reductions from brokerage service arrangements or other expense offset arrangements. Expenses net of all reductions represent the net expenses paid by the class.
See accompanying notes which are an integral part of the financial statements.
Annual Report
Fidelity Series All-Sector Equity Fund
Performance: The Bottom Line
Average annual total return reflects the change in the value of an investment, assuming reinvestment of the class' distributions from dividend income and capital gains (the profits earned upon the sale of securities that have grown in value, if any) and assuming a constant rate of performance each year. The $10,000 table and the fund's returns do not reflect the deduction of taxes that a shareholder would pay on fund distributions or the redemption of fund shares. During periods of reimbursement by Fidelity, a fund's total return will be greater than it would be had the reimbursement not occurred. How a fund did yesterday is no guarantee of how it will do tomorrow.
Average Annual Total Returns
Periods ended January 31, 2012 | Past 1 | Life of |
Fidelity® Series All-Sector Equity Fund | -0.12% | 12.42% |
Class F B | 0.10% | 12.61% |
A From October 17, 2008.
B The initial offering of Class F shares took place on June 26, 2009. Returns prior to June 26, 2009 are those of Fidelity Series All-Sector Equity Fund, the original class of the fund.
$10,000 Over Life of Fund
Let's say hypothetically that $10,000 was invested in Fidelity ® Series All-Sector Equity Fund, a class of the fund, on October 17, 2008, when the fund started. The chart shows how the value of your investment would have changed, and also shows how the S&P 500® Index performed over the same period.
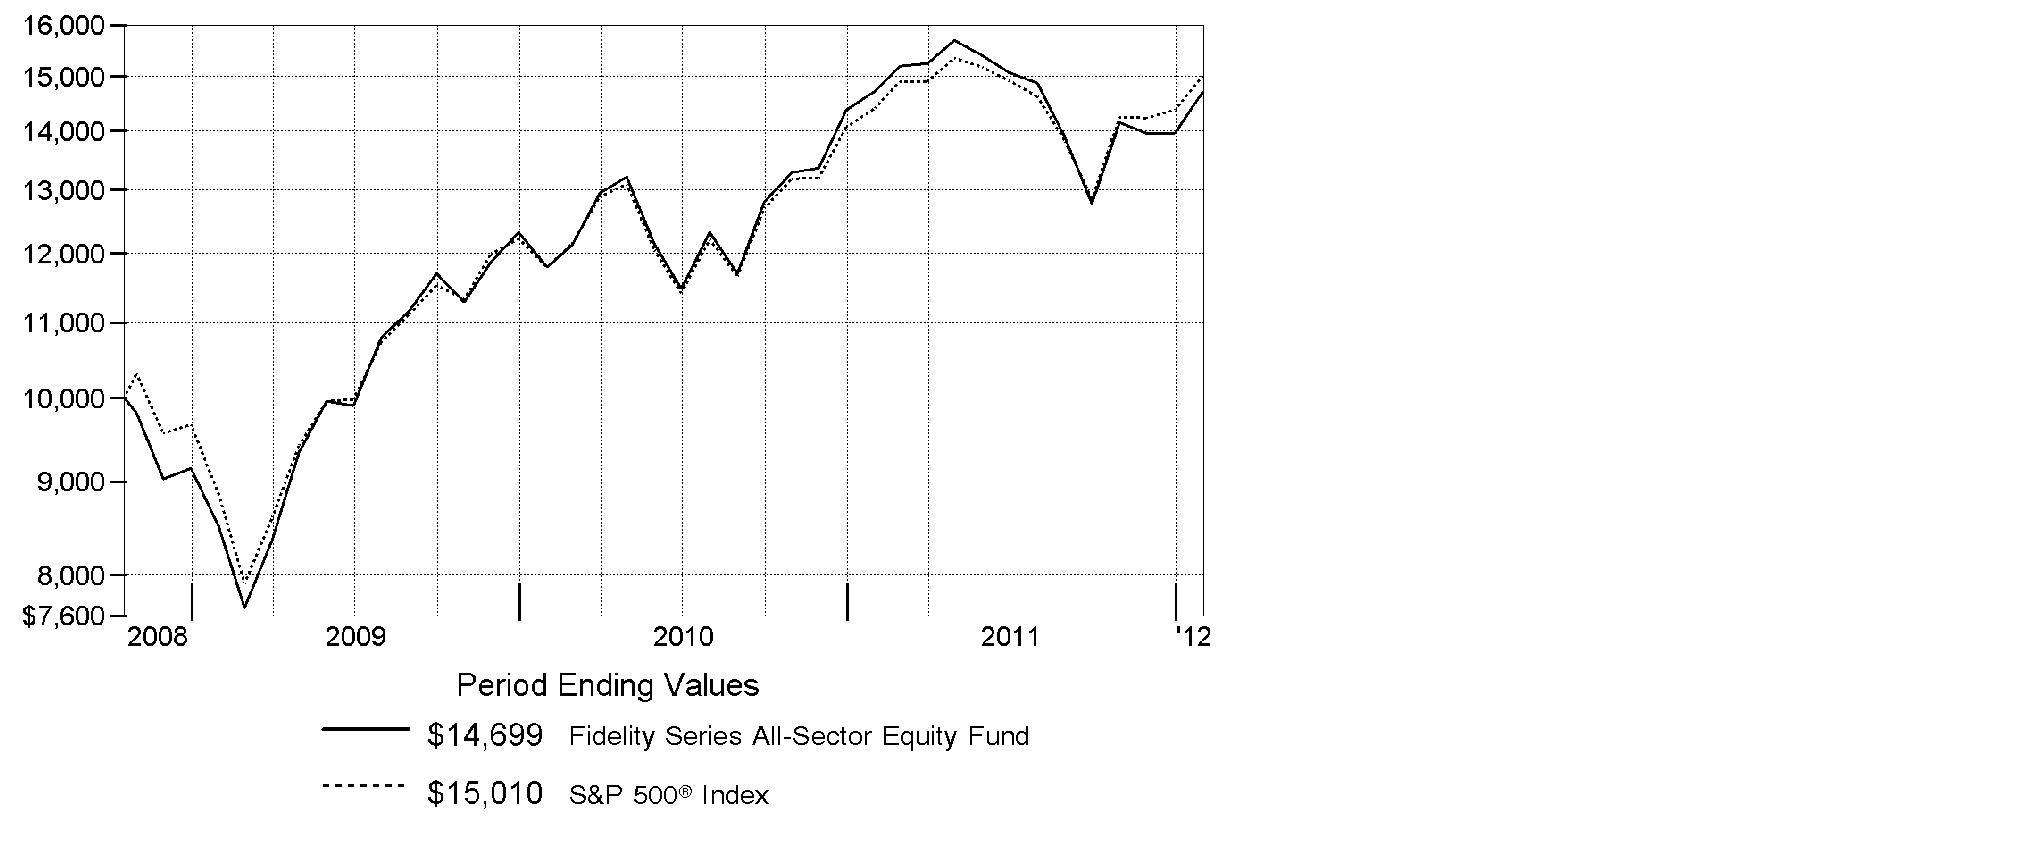
Annual Report
Fidelity Series All-Sector Equity Fund
Management's Discussion of Fund Performance
Market Recap: After enduring one of the most volatile trading periods on record, U.S. stocks posted a gain for the 12 months ending January 31, 2012, sparked by a January rally. Strong corporate earnings reports and hints of economic recovery sent stocks mostly upward through April, when sovereign debt woes in Europe sparked fear of a global slowdown. In the summer, equities plummeted on eurozone instability, debate over the U.S. debt ceiling and a historic downgrade of the nation's sovereign debt rating. After falling as much as 13% by early August, the broad-based S&P 500® Index seesawed back to end the period on an optimistic note. For the full 12 months, the S&P 500® rose 4.22%, while the technology-laden Nasdaq Composite® Index added 5.26%. Investors began to shed perceived riskier smaller-cap stocks in favor of larger, more-established and dividend-paying names, helping to drive the Dow Jones® Industrial Average up 9.12% for the year, while the Russell 2000® - a proxy for small-caps - and Russell Midcap® indexes added 2.86% and 2.25%, respectively. Within the S&P 500®, defensive sectors such as health care (+16%) and utilities (+14%) fared best, while financials (-12%) struggled. Foreign developed-markets stocks were stung by Europe's turmoil, and the MSCI® EAFE® (Europe, Australasia, Far East) Index fell 9.49%.
Comments from Robert Stansky, Head of Fidelity's Stock Selector Large Cap Group, which manages Fidelity® Series All-Sector Equity Fund: For the year, the fund's Series All-Sector Equity and Class F shares returned -0.12% and 0.10%, respectively, trailing the S&P 500®. This underperformance was largely driven by weak security selection, especially in the semiconductors/semiconductor equipment industry within information technology. Picks in energy, telecommunication services and the capital goods segment of industrials also notably detracted, as did underweighting the strong-performing pharmaceuticals/biotechnology/life science group within health care. Conversely, the fund was helped by positioning in financials and the hardware/equipment area of tech. Individual detractors included a stake in semiconductor firm Micron Technology, which struggled during the period. In financials, overweighting Citigroup hurt because the stock lost ground amid increased regulatory pressure. Not owning index component International Business Machines also detracted, as did underweighting restaurant chain McDonald's. On the upside, underweighting and eventually selling Bank of America was helpful. A heavy stake in consumer electronics maker Apple, our largest holding at period end, lifted performance, as did largely avoiding computer and peripherals maker and index component Hewlett-Packard, which was not held at period end.
The views expressed above reflect those of the portfolio manager(s) only through the end of the period as stated on the cover of this report and do not necessarily represent the views of Fidelity or any other person in the Fidelity organization. Any such views are subject to change at any time based upon market or other conditions and Fidelity disclaims any responsibility to update such views. These views may not be relied on as investment advice and, because investment decisions for a Fidelity fund are based on numerous factors, may not be relied on as an indication of trading intent on behalf of any Fidelity fund.
Annual Report
Fidelity Series All-Sector Equity Fund
Investment Changes (Unaudited)
Top Ten Stocks as of January 31, 2012 | ||
| % of fund's | % of fund's net assets |
Apple, Inc. | 6.0 | 4.6 |
Procter & Gamble Co. | 2.1 | 1.9 |
QUALCOMM, Inc. | 2.0 | 1.7 |
JPMorgan Chase & Co. | 1.9 | 0.0 |
The Coca-Cola Co. | 1.7 | 1.7 |
Exxon Mobil Corp. | 1.5 | 1.1 |
Royal Dutch Shell PLC Class B sponsored ADR | 1.5 | 1.6 |
Berkshire Hathaway, Inc. Class B | 1.4 | 0.6 |
British American Tobacco PLC sponsored ADR | 1.4 | 1.0 |
U.S. Bancorp | 1.3 | 1.2 |
| 20.8 | |
Top Five Market Sectors as of January 31, 2012 | ||
| % of fund's | % of fund's net assets |
Information Technology | 19.9 | 19.1 |
Financials | 14.8 | 14.3 |
Energy | 12.0 | 12.7 |
Health Care | 11.3 | 10.9 |
Industrials | 10.8 | 10.6 |
Asset Allocation (% of fund's net assets) | |||||||
As of January 31, 2012* | As of July 31, 2011** | ||||||
| Stocks and |
| | Stocks and |
| ||
| Short-Term |
| | Short-Term |
| ||
* Foreign investments | 16.5% |
| ** Foreign investments | 20.2% |
| ||

Annual Report
Fidelity Series All-Sector Equity Fund
Investments January 31, 2012
Showing Percentage of Net Assets
Common Stocks - 97.5% | |||
Shares | Value | ||
CONSUMER DISCRETIONARY - 9.5% | |||
Diversified Consumer Services - 0.3% | |||
Weight Watchers International, Inc. | 394,410 | $ 30,026,433 | |
Hotels, Restaurants & Leisure - 3.1% | |||
Arcos Dorados Holdings, Inc. | 1,219,300 | 26,214,950 | |
Betfair Group PLC | 1,552,895 | 21,316,527 | |
McDonald's Corp. | 1,268,586 | 125,653,443 | |
Starbucks Corp. | 1,981,058 | 94,952,110 | |
Yum! Brands, Inc. | 1,417,435 | 89,766,159 | |
| 357,903,189 | ||
Media - 2.6% | |||
Comcast Corp. Class A | 1,497,924 | 39,829,799 | |
DIRECTV (a) | 2,246,764 | 101,126,848 | |
Legend Pictures LLC (a)(g)(h) | 3,706 | 2,779,500 | |
The Walt Disney Co. | 2,617,581 | 101,823,901 | |
Time Warner, Inc. | 1,495,948 | 55,439,833 | |
| 300,999,881 | ||
Multiline Retail - 0.7% | |||
Dollar General Corp. (a) | 1,943,711 | 82,821,526 | |
Specialty Retail - 2.2% | |||
Abercrombie & Fitch Co. Class A | 1,121,668 | 51,529,428 | |
Limited Brands, Inc. | 995,073 | 41,653,756 | |
Lowe's Companies, Inc. | 2,672,863 | 71,712,914 | |
TJX Companies, Inc. | 1,346,931 | 91,779,878 | |
| 256,675,976 | ||
Textiles, Apparel & Luxury Goods - 0.6% | |||
Deckers Outdoor Corp. (a) | 442,824 | 35,802,320 | |
Under Armour, Inc. Class A (sub. vtg.) (a) | 499,592 | 39,777,515 | |
| 75,579,835 | ||
TOTAL CONSUMER DISCRETIONARY | 1,104,006,840 | ||
CONSUMER STAPLES - 10.6% | |||
Beverages - 4.3% | |||
Anheuser-Busch InBev SA NV | 641,405 | 38,995,171 | |
Coca-Cola Bottling Co. CONSOLIDATED | 103,395 | 6,301,925 | |
Coca-Cola FEMSA SAB de CV sponsored ADR | 66,153 | 6,482,994 | |
Coca-Cola Icecek A/S | 404,488 | 5,292,558 | |
Companhia de Bebidas das Americas (AmBev) (PN) sponsored ADR | 178,535 | 6,496,889 | |
Common Stocks - continued | |||
Shares | Value | ||
CONSUMER STAPLES - continued | |||
Beverages - continued | |||
Constellation Brands, Inc. Class A (sub. vtg.) (a) | 2,025,567 | $ 42,334,350 | |
Diageo PLC sponsored ADR | 485,252 | 42,988,475 | |
Embotelladora Andina SA sponsored ADR | 231,538 | 6,413,603 | |
Molson Coors Brewing Co. Class B | 878,944 | 37,697,908 | |
PepsiCo, Inc. | 751,594 | 49,357,178 | |
Pernod Ricard SA | 336,475 | 32,298,387 | |
Remy Cointreau SA | 304,881 | 26,841,148 | |
The Coca-Cola Co. | 2,978,605 | 201,145,196 | |
| 502,645,782 | ||
Food & Staples Retailing - 1.3% | |||
CVS Caremark Corp. | 2,619,381 | 109,359,157 | |
Drogasil SA | 511,200 | 4,242,445 | |
Walgreen Co. | 1,019,415 | 34,007,684 | |
| 147,609,286 | ||
Food Products - 0.9% | |||
Bunge Ltd. | 339,480 | 19,442,020 | |
First Resources Ltd. | 2,162,000 | 2,818,842 | |
Green Mountain Coffee Roasters, Inc. (a) | 248,580 | 13,259,257 | |
Mead Johnson Nutrition Co. Class A | 147,600 | 10,935,684 | |
Nestle SA | 308,141 | 17,663,067 | |
Orion Corp. | 5,615 | 3,419,194 | |
Pilgrims Pride Corp. (a) | 641,133 | 3,449,296 | |
Pilgrims Pride Corp. rights 2/17/12 (a) | 641,133 | 116,902 | |
Unilever NV (NY Reg.) | 851,961 | 28,412,899 | |
Viterra, Inc. | 298,300 | 3,209,830 | |
| 102,726,991 | ||
Household Products - 2.2% | |||
Colgate-Palmolive Co. | 122,887 | 11,148,309 | |
Procter & Gamble Co. | 3,802,054 | 239,681,484 | |
Spectrum Brands Holdings, Inc. (a) | 209,964 | 6,078,458 | |
| 256,908,251 | ||
Personal Products - 0.4% | |||
Amoreg | 11,230 | 2,574,393 | |
Avon Products, Inc. | 486,520 | 8,645,460 | |
L'Oreal SA | 287,300 | 30,554,187 | |
Nu Skin Enterprises, Inc. Class A | 130,390 | 6,512,981 | |
| 48,287,021 | ||
Tobacco - 1.5% | |||
British American Tobacco PLC sponsored ADR | 1,711,245 | 157,793,901 | |
Common Stocks - continued | |||
Shares | Value | ||
CONSUMER STAPLES - continued | |||
Tobacco - continued | |||
Japan Tobacco, Inc. | 619 | $ 3,045,061 | |
Souza Cruz Industria Comerico | 480,700 | 6,256,363 | |
| 167,095,325 | ||
TOTAL CONSUMER STAPLES | 1,225,272,656 | ||
ENERGY - 12.0% | |||
Energy Equipment & Services - 3.2% | |||
Baker Hughes, Inc. | 875,900 | 43,032,967 | |
C&J Energy Services, Inc. | 347,700 | 5,789,205 | |
Cameron International Corp. (a) | 507,882 | 27,019,322 | |
Discovery Offshore S.A. (a)(e) | 853,300 | 1,236,161 | |
Ensco International Ltd. ADR | 755,966 | 39,794,050 | |
Halliburton Co. | 1,810,884 | 66,604,314 | |
National Oilwell Varco, Inc. | 698,724 | 51,691,602 | |
Noble Corp. | 1,283,025 | 44,700,591 | |
Ocean Rig UDW, Inc. (United States) | 718,984 | 10,971,696 | |
Oceaneering International, Inc. | 400,718 | 19,470,888 | |
Schlumberger Ltd. | 554,481 | 41,680,337 | |
Transocean Ltd. (United States) | 243,574 | 11,521,050 | |
Vantage Drilling Co. (a) | 3,799,042 | 4,710,812 | |
| 368,222,995 | ||
Oil, Gas & Consumable Fuels - 8.8% | |||
Alpha Natural Resources, Inc. (a) | 1,030,441 | 20,732,473 | |
Anadarko Petroleum Corp. | 1,006,406 | 81,237,092 | |
Apache Corp. | 871,653 | 86,189,049 | |
BP PLC sponsored ADR | 900,990 | 41,364,451 | |
Canadian Natural Resources Ltd. | 715,900 | 28,357,565 | |
CVR Energy, Inc. (a) | 385,055 | 9,603,272 | |
EV Energy Partners LP | 45,700 | 3,049,104 | |
Exxon Mobil Corp. | 2,035,018 | 170,412,407 | |
HollyFrontier Corp. | 1,996,784 | 58,585,643 | |
InterOil Corp. (a)(d) | 365,411 | 24,519,078 | |
Marathon Oil Corp. | 2,230,889 | 70,027,606 | |
Marathon Petroleum Corp. | 1,353,315 | 51,723,699 | |
Niko Resources Ltd. | 328,900 | 16,068,622 | |
Occidental Petroleum Corp. | 961,655 | 95,944,319 | |
Petrobank Energy & Resources Ltd. (a) | 553,897 | 7,711,196 | |
Petrominerales Ltd. | 380,500 | 7,942,024 | |
Common Stocks - continued | |||
Shares | Value | ||
ENERGY - continued | |||
Oil, Gas & Consumable Fuels - continued | |||
Resolute Energy Corp. (a) | 783,902 | $ 8,818,898 | |
Royal Dutch Shell PLC Class B sponsored ADR | 2,293,479 | 168,203,750 | |
Suncor Energy, Inc. | 721,500 | 24,852,266 | |
Western Refining, Inc. | 691,884 | 11,436,843 | |
Williams Companies, Inc. | 1,244,600 | 35,869,372 | |
WPX Energy, Inc. | 123,133 | 2,029,232 | |
| 1,024,677,961 | ||
TOTAL ENERGY | 1,392,900,956 | ||
FINANCIALS - 14.8% | |||
Capital Markets - 1.3% | |||
Ameriprise Financial, Inc. | 383,400 | 20,531,070 | |
E*TRADE Financial Corp. (a) | 597,352 | 4,892,313 | |
Evercore Partners, Inc. Class A | 198,110 | 5,584,721 | |
ICAP PLC | 937,658 | 4,965,237 | |
Invesco Ltd. | 1,049,695 | 23,691,616 | |
Morgan Stanley | 2,230,023 | 41,589,929 | |
State Street Corp. | 977,108 | 38,283,091 | |
TD Ameritrade Holding Corp. | 737,900 | 11,887,569 | |
| 151,425,546 | ||
Commercial Banks - 2.1% | |||
CIT Group, Inc. (a) | 259,330 | 9,890,846 | |
Comerica, Inc. | 491,100 | 13,588,737 | |
FirstMerit Corp. | 598,368 | 9,388,394 | |
Huntington Bancshares, Inc. | 3,032,100 | 17,313,291 | |
Regions Financial Corp. | 1,567,100 | 8,180,262 | |
SunTrust Banks, Inc. | 1,081,934 | 22,255,382 | |
Synovus Financial Corp. | 4,208,160 | 7,322,198 | |
U.S. Bancorp | 5,360,765 | 151,280,788 | |
| 239,219,898 | ||
Consumer Finance - 1.5% | |||
Capital One Financial Corp. | 2,802,508 | 128,214,741 | |
Credit Saison Co. Ltd. | 254,400 | 5,176,104 | |
Green Dot Corp. Class A (a)(d) | 89,651 | 2,544,295 | |
SLM Corp. | 2,997,646 | 44,814,808 | |
| 180,749,948 | ||
Common Stocks - continued | |||
Shares | Value | ||
FINANCIALS - continued | |||
Diversified Financial Services - 2.9% | |||
African Bank Investments Ltd. | 2,002,448 | $ 9,349,095 | |
Citigroup, Inc. | 3,312,674 | 101,765,345 | |
JPMorgan Chase & Co. | 5,843,518 | 217,963,221 | |
NBH Holdings Corp. Class A (a)(e) | 361,500 | 5,874,375 | |
| 334,952,036 | ||
Insurance - 4.2% | |||
ACE Ltd. | 586,320 | 40,807,872 | |
AFLAC, Inc. | 216,600 | 10,446,618 | |
Amlin PLC | 2,013,624 | 10,789,803 | |
Aon Corp. | 573,170 | 27,758,623 | |
Berkshire Hathaway, Inc.: | |||
Class A (a) | 182 | 21,462,350 | |
Class B (a) | 2,102,734 | 164,791,264 | |
Fairfax Financial Holdings Ltd. (sub. vtg.) | 109,900 | 44,606,632 | |
MetLife, Inc. | 3,691,572 | 130,423,239 | |
Torchmark Corp. | 380,500 | 17,377,435 | |
Validus Holdings Ltd. | 469,161 | 15,045,993 | |
| 483,509,829 | ||
Real Estate Investment Trusts - 2.4% | |||
American Capital Agency Corp. | 493,425 | 14,467,221 | |
American Tower Corp. | 1,775,215 | 112,743,905 | |
Camden Property Trust (SBI) | 298,856 | 19,276,212 | |
Equity Lifestyle Properties, Inc. | 136,000 | 9,539,040 | |
Japan Retail Fund Investment Corp. | 4,668 | 6,766,549 | |
Prologis, Inc. | 1,109,280 | 35,175,269 | |
Public Storage | 320,766 | 44,541,567 | |
The Macerich Co. | 609,133 | 33,075,922 | |
| 275,585,685 | ||
Real Estate Management & Development - 0.1% | |||
BR Malls Participacoes SA | 478,300 | 5,220,456 | |
PT Lippo Karawaci Tbk | 104,295,375 | 7,772,868 | |
| 12,993,324 | ||
Thrifts & Mortgage Finance - 0.3% | |||
Ocwen Financial Corp. (a) | 2,358,449 | 33,938,081 | |
TOTAL FINANCIALS | 1,712,374,347 | ||
Common Stocks - continued | |||
Shares | Value | ||
HEALTH CARE - 11.3% | |||
Biotechnology - 2.7% | |||
Alexion Pharmaceuticals, Inc. (a) | 240,078 | $ 18,428,387 | |
Amgen, Inc. | 1,825,465 | 123,967,328 | |
AVEO Pharmaceuticals, Inc. (a) | 353,452 | 4,658,497 | |
Biogen Idec, Inc. (a) | 582,176 | 68,650,194 | |
BioMarin Pharmaceutical, Inc. (a) | 579,678 | 20,677,114 | |
Gilead Sciences, Inc. (a) | 1,487,099 | 72,629,915 | |
ONYX Pharmaceuticals, Inc. (a) | 246,005 | 10,071,445 | |
| 319,082,880 | ||
Health Care Equipment & Supplies - 2.1% | |||
Baxter International, Inc. | 789,540 | 43,803,679 | |
Boston Scientific Corp. (a) | 2,412,812 | 14,380,360 | |
Covidien PLC | 1,393,551 | 71,767,877 | |
Edwards Lifesciences Corp. (a) | 646,448 | 53,441,856 | |
Mako Surgical Corp. (a) | 522,617 | 18,699,236 | |
Quidel Corp. (a) | 1,045,279 | 14,947,490 | |
The Cooper Companies, Inc. | 255,802 | 18,453,556 | |
Wright Medical Group, Inc. (a) | 374,200 | 6,342,690 | |
| 241,836,744 | ||
Health Care Providers & Services - 2.4% | |||
CIGNA Corp. | 775,199 | 34,752,171 | |
Henry Schein, Inc. (a) | 587,187 | 41,625,686 | |
McKesson Corp. | 488,615 | 39,929,618 | |
Medco Health Solutions, Inc. (a) | 454,573 | 28,192,617 | |
Omnicare, Inc. | 614,480 | 20,173,378 | |
UnitedHealth Group, Inc. | 2,188,651 | 113,350,235 | |
| 278,023,705 | ||
Life Sciences Tools & Services - 0.3% | |||
Agilent Technologies, Inc. | 706,385 | 30,000,171 | |
Pharmaceuticals - 3.8% | |||
Allergan, Inc. | 472,813 | 41,564,991 | |
Eli Lilly & Co. | 168,100 | 6,680,294 | |
GlaxoSmithKline PLC sponsored ADR | 1,198,100 | 53,363,374 | |
Jazz Pharmaceuticals PLC (a) | 280,623 | 13,048,970 | |
Merck & Co., Inc. | 1,899,546 | 72,676,630 | |
Optimer Pharmaceuticals, Inc. (a) | 377,019 | 4,889,936 | |
Pfizer, Inc. | 6,023,733 | 128,907,886 | |
Sanofi-aventis sponsored ADR | 941,300 | 34,950,469 | |
Common Stocks - continued | |||
Shares | Value | ||
HEALTH CARE - continued | |||
Pharmaceuticals - continued | |||
Shire PLC sponsored ADR | 519,067 | $ 51,657,548 | |
Valeant Pharmaceuticals International, Inc. (Canada) (a) | 805,762 | 39,020,496 | |
| 446,760,594 | ||
TOTAL HEALTH CARE | 1,315,704,094 | ||
INDUSTRIALS - 10.8% | |||
Aerospace & Defense - 3.5% | |||
Honeywell International, Inc. | 1,338,110 | 77,663,904 | |
MTU Aero Engines Holdings AG | 220,402 | 15,367,929 | |
Precision Castparts Corp. | 415,167 | 67,954,535 | |
Textron, Inc. | 1,962,154 | 49,995,684 | |
The Boeing Co. | 1,328,265 | 98,530,698 | |
United Technologies Corp. | 1,285,696 | 100,734,282 | |
| 410,247,032 | ||
Air Freight & Logistics - 0.3% | |||
C.H. Robinson Worldwide, Inc. | 542,270 | 37,329,867 | |
Building Products - 0.5% | |||
Armstrong World Industries, Inc. (a) | 535,649 | 25,014,808 | |
Owens Corning (a) | 1,124,999 | 37,968,716 | |
| 62,983,524 | ||
Commercial Services & Supplies - 0.2% | |||
Stericycle, Inc. (a) | 274,583 | 23,070,464 | |
Construction & Engineering - 0.4% | |||
Fluor Corp. | 542,497 | 30,510,031 | |
Foster Wheeler AG (a) | 791,722 | 17,782,076 | |
| 48,292,107 | ||
Electrical Equipment - 0.5% | |||
Regal-Beloit Corp. | 550,688 | 31,262,558 | |
Roper Industries, Inc. | 262,777 | 24,540,744 | |
| 55,803,302 | ||
Industrial Conglomerates - 1.4% | |||
Danaher Corp. | 1,438,600 | 75,540,886 | |
General Electric Co. | 4,524,980 | 84,662,376 | |
| 160,203,262 | ||
Machinery - 2.6% | |||
Caterpillar, Inc. | 927,194 | 101,175,409 | |
Cummins, Inc. | 726,987 | 75,606,648 | |
Common Stocks - continued | |||
Shares | Value | ||
INDUSTRIALS - continued | |||
Machinery - continued | |||
Fanuc Corp. | 198,700 | $ 33,390,358 | |
Fiat Industrial SpA (a) | 949,800 | 9,304,759 | |
Illinois Tool Works, Inc. | 514,424 | 27,279,905 | |
Joy Global, Inc. | 304,070 | 27,576,108 | |
Parker Hannifin Corp. | 287,123 | 23,165,084 | |
| 297,498,271 | ||
Professional Services - 0.1% | |||
CoStar Group, Inc. (a) | 99,834 | 5,657,593 | |
Road & Rail - 1.3% | |||
CSX Corp. | 2,465,622 | 55,599,776 | |
Union Pacific Corp. | 833,075 | 95,228,803 | |
| 150,828,579 | ||
TOTAL INDUSTRIALS | 1,251,914,001 | ||
INFORMATION TECHNOLOGY - 19.9% | |||
Communications Equipment - 2.4% | |||
Acme Packet, Inc. (a) | 435,032 | 12,715,985 | |
Ciena Corp. (a) | 238,541 | 3,470,772 | |
Polycom, Inc. (a) | 474,313 | 9,462,544 | |
QUALCOMM, Inc. | 3,941,203 | 231,821,560 | |
Telefonaktiebolaget LM Ericsson (B Shares) sponsored ADR | 747,434 | 6,928,713 | |
ZTE Corp. (H Shares) | 4,121,800 | 11,214,336 | |
| 275,613,910 | ||
Computers & Peripherals - 6.8% | |||
Apple, Inc. (a) | 1,514,306 | 691,250,406 | |
EMC Corp. (a) | 587,827 | 15,142,424 | |
SanDisk Corp. (a) | 1,868,331 | 85,719,026 | |
| 792,111,856 | ||
Electronic Equipment & Components - 0.2% | |||
Arrow Electronics, Inc. (a) | 631,304 | 26,066,542 | |
Internet Software & Services - 1.7% | |||
Baidu.com, Inc. sponsored ADR (a) | 65,482 | 8,350,265 | |
Bankrate, Inc. | 167,248 | 3,911,931 | |
Dice Holdings, Inc. (a) | 897,201 | 8,496,493 | |
eBay, Inc. (a) | 1,043,611 | 32,978,108 | |
Google, Inc. Class A (a) | 134,140 | 77,815,955 | |
Common Stocks - continued | |||
Shares | Value | ||
INFORMATION TECHNOLOGY - continued | |||
Internet Software & Services - continued | |||
Mail.ru Group Ltd.: | |||
GDR (a)(e) | 290,800 | $ 9,596,400 | |
GDR (Reg. S) (a) | 55,800 | 1,841,400 | |
VeriSign, Inc. | 1,231,018 | 45,621,527 | |
Yahoo!, Inc. (a) | 212,800 | 3,292,016 | |
| 191,904,095 | ||
IT Services - 1.1% | |||
Accenture PLC Class A | 1,714,491 | 98,308,914 | |
Cognizant Technology Solutions Corp. Class A (a) | 466,728 | 33,487,734 | |
| 131,796,648 | ||
Semiconductors & Semiconductor Equipment - 3.8% | |||
Amkor Technology, Inc. (a) | 729,620 | 4,180,723 | |
Analog Devices, Inc. | 2,973,647 | 116,358,807 | |
ARM Holdings PLC sponsored ADR | 854,059 | 24,665,224 | |
ASML Holding NV | 359,440 | 15,452,326 | |
Atmel Corp. (a) | 591,845 | 5,746,815 | |
Avago Technologies Ltd. | 711,379 | 24,144,203 | |
Broadcom Corp. Class A | 1,937,526 | 66,534,643 | |
Cree, Inc. (a) | 165,100 | 4,198,493 | |
Fairchild Semiconductor International, Inc. (a) | 635,551 | 8,885,003 | |
International Rectifier Corp. (a) | 743,929 | 16,961,581 | |
KLA-Tencor Corp. | 320,805 | 16,402,760 | |
Marvell Technology Group Ltd. (a) | 2,699,010 | 41,915,625 | |
Micron Technology, Inc. (a) | 7,311,489 | 55,494,202 | |
NXP Semiconductors NV (a) | 1,070,141 | 22,719,093 | |
PMC-Sierra, Inc. (a) | 28,800 | 187,200 | |
RF Micro Devices, Inc. (a) | 3,259,513 | 16,264,970 | |
Siliconware Precision Industries Co. Ltd. sponsored ADR | 284,700 | 1,608,555 | |
| 441,720,223 | ||
Software - 3.9% | |||
Ariba, Inc. (a) | 1,200,428 | 32,771,684 | |
Check Point Software Technologies Ltd. (a) | 1,544,929 | 86,964,053 | |
Citrix Systems, Inc. (a) | 1,222,028 | 79,688,446 | |
Fortinet, Inc. (a) | 624,657 | 14,248,426 | |
Intuit, Inc. | 975,519 | 55,058,292 | |
Microsoft Corp. | 3,639,006 | 107,459,847 | |
Common Stocks - continued | |||
Shares | Value | ||
INFORMATION TECHNOLOGY - continued | |||
Software - continued | |||
Nuance Communications, Inc. (a) | 222,438 | $ 6,343,932 | |
Oracle Corp. | 2,527,221 | 71,267,632 | |
| 453,802,312 | ||
TOTAL INFORMATION TECHNOLOGY | 2,313,015,586 | ||
MATERIALS - 3.5% | |||
Chemicals - 2.2% | |||
Air Products & Chemicals, Inc. | 515,516 | 45,380,873 | |
E.I. du Pont de Nemours & Co. | 1,594,283 | 81,133,062 | |
Eastman Chemical Co. | 249,503 | 12,554,991 | |
Ecolab, Inc. | 754,795 | 45,619,810 | |
Sherwin-Williams Co. | 375,498 | 36,622,320 | |
The Mosaic Co. | 533,518 | 29,861,002 | |
| 251,172,058 | ||
Containers & Packaging - 0.4% | |||
Ball Corp. | 520,277 | 20,426,075 | |
Rock-Tenn Co. Class A | 434,648 | 26,887,325 | |
| 47,313,400 | ||
Metals & Mining - 0.9% | |||
First Quantum Minerals Ltd. | 1,525,055 | 33,398,362 | |
Goldcorp, Inc. | 660,822 | 31,961,972 | |
Ivanhoe Mines Ltd. (a) | 941,100 | 15,175,853 | |
Nucor Corp. | 603,828 | 26,864,308 | |
| 107,400,495 | ||
TOTAL MATERIALS | 405,885,953 | ||
TELECOMMUNICATION SERVICES - 1.6% | |||
Diversified Telecommunication Services - 1.4% | |||
CenturyLink, Inc. | 2,498,977 | 92,537,118 | |
Verizon Communications, Inc. | 2,069,490 | 77,936,993 | |
| 170,474,111 | ||
Wireless Telecommunication Services - 0.2% | |||
Clearwire Corp. Class A (a) | 3,825,288 | 6,464,737 | |
Common Stocks - continued | |||
Shares | Value | ||
TELECOMMUNICATION SERVICES - continued | |||
Wireless Telecommunication Services - continued | |||
MetroPCS Communications, Inc. (a) | 821,500 | $ 7,262,060 | |
TIM Participacoes SA sponsored ADR | 228,600 | 6,595,110 | |
| 20,321,907 | ||
TOTAL TELECOMMUNICATION SERVICES | 190,796,018 | ||
UTILITIES - 3.5% | |||
Electric Utilities - 2.3% | |||
Duke Energy Corp. | 2,498,675 | 53,246,764 | |
Edison International | 1,347,115 | 55,285,600 | |
Exelon Corp. | 431,913 | 17,181,499 | |
FirstEnergy Corp. | 1,332,222 | 56,246,413 | |
NextEra Energy, Inc. | 1,010,591 | 60,483,871 | |
Progress Energy, Inc. | 400,895 | 21,780,625 | |
| 264,224,772 | ||
Gas Utilities - 0.0% | |||
ONEOK, Inc. | 31,200 | 2,594,592 | |
Independent Power Producers & Energy Traders - 0.6% | |||
Constellation Energy Group, Inc. | 1,230,474 | 44,826,168 | |
The AES Corp. (a) | 2,428,867 | 30,992,343 | |
| 75,818,511 | ||
Multi-Utilities - 0.6% | |||
NiSource, Inc. | 555,396 | 12,624,151 | |
PG&E Corp. | 101,018 | 4,107,392 | |
Sempra Energy | 872,645 | 49,653,501 | |
| 66,385,044 | ||
TOTAL UTILITIES | 409,022,919 | ||
TOTAL COMMON STOCKS (Cost $9,508,228,840) |
| ||
U.S. Treasury Obligations - 0.1% | ||||
| Principal Amount |
| ||
U.S. Treasury Bills, yield at date of purchase 0% to 0.05% 2/23/12 to 4/19/12 (f) | $ 8,260,000 |
| ||
Money Market Funds - 2.8% | |||
Shares | Value | ||
Fidelity Cash Central Fund, 0.12% (b) | 301,695,566 | $ 301,695,566 | |
Fidelity Securities Lending Cash Central Fund, 0.12% (b)(c) | 19,160,525 | 19,160,525 | |
TOTAL MONEY MARKET FUNDS (Cost $320,856,091) |
| ||
TOTAL INVESTMENT PORTFOLIO - 100.4% (Cost $9,837,344,787) | 11,650,009,159 | ||
NET OTHER ASSETS (LIABILITIES) - (0.4)% | (42,241,504) | ||
NET ASSETS - 100% | $ 11,607,767,655 | ||
Futures Contracts | |||||
Expiration Date | Underlying Face Amount at Value | Unrealized Appreciation/ | |||
Purchased | |||||
Equity Index Contracts | |||||
1,646 CME E-mini S&P 500 Index Contracts | March 2012 | $ 107,664,860 | $ 4,341,118 | ||
|
The face value of futures purchased as a percentage of net assets is 0.9% |
Legend |
(a) Non-income producing |
(b) Affiliated fund that is available only to investment companies and other accounts managed by Fidelity Investments. The rate quoted is the annualized seven-day yield of the fund at period end. A complete unaudited listing of the fund's holdings as of its most recent quarter end is available upon request. In addition, each Fidelity Central Fund's financial statements, which are not covered by the Fund's Report of Independent Registered Public Accounting Firm, are available on the SEC's website or upon request. |
(c) Investment made with cash collateral received from securities on loan. |
(d) Security or a portion of the security is on loan at period end. |
(e) Security exempt from registration under Rule 144A of the Securities Act of 1933. These securities may be resold in transactions exempt from registration, normally to qualified institutional buyers. At the end of the period, the value of these securities amounted to $16,706,936 or 0.1% of net assets. |
(f) Security or a portion of the security was pledged to cover margin requirements for futures contracts. At the period end, the value of securities pledged amounted to $7,159,727. |
(g) Investment is owned by an entity that is treated as a corporation for U.S. tax purposes which is owned by the Fund. |
(h) Restricted securities - Investment in securities not registered under the Securities Act of 1933 (excluding 144A issues). At the end of the period, the value of restricted securities (excluding 144A issues) amounted to $2,779,500 or 0.0% of net assets. |
Additional information on each restricted holding is as follows: |
Security | Acquisition Date | Acquisition Cost |
Legend Pictures LLC | 9/23/10 | $ 2,779,500 |
Affiliated Central Funds |
Information regarding fiscal year to date income earned by the Fund from investments in Fidelity Central Funds is as follows: |
Fund | Income earned |
Fidelity Cash Central Fund | $ 430,340 |
Fidelity Securities Lending Cash Central Fund | 1,747,185 |
Total | $ 2,177,525 |
Other Information |
The following is a summary of the inputs used, as of January 31, 2012, involving the Fund's assets and liabilities carried at fair value. The inputs or methodology used for valuing securities may not be an indication of the risk associated with investing in those securities. For more information on valuation inputs, and their aggregation into the levels used in the tables below, please refer to the Security Valuation section in the accompanying Notes to Financial Statements. |
Valuation Inputs at Reporting Date: | ||||
Description | Total | Level 1 | Level 2 | Level 3 |
Investments in Securities: | ||||
Equities: | ||||
Consumer Discretionary | $ 1,104,006,840 | $ 1,101,227,340 | $ - | $ 2,779,500 |
Consumer Staples | 1,225,272,656 | 1,186,160,583 | 39,112,073 | - |
Energy | 1,392,900,956 | 1,392,900,956 | - | - |
Financials | 1,712,374,347 | 1,706,499,972 | - | 5,874,375 |
Health Care | 1,315,704,094 | 1,315,704,094 | - | - |
Industrials | 1,251,914,001 | 1,251,914,001 | - | - |
Information Technology | 2,313,015,586 | 2,313,015,586 | - | - |
Materials | 405,885,953 | 405,885,953 | - | - |
Telecommunication Services | 190,796,018 | 190,796,018 | - | - |
Utilities | 409,022,919 | 409,022,919 | - | - |
U.S. Government and Government Agency Obligations | 8,259,698 | - | 8,259,698 | - |
Money Market Funds | 320,856,091 | 320,856,091 | - | - |
Total Investments in Securities: | $ 11,650,009,159 | $ 11,593,983,513 | $ 47,371,771 | $ 8,653,875 |
Derivative Instruments: | ||||
Assets | ||||
Futures Contracts | $ 4,341,118 | $ 4,341,118 | $ - | $ - |
The following is a reconciliation of Investments in Securities for which Level 3 inputs were used in determining value: |
Investments in Securities: | |
Beginning Balance | $ 2,779,500 |
Total Realized Gain (Loss) | - |
Total Unrealized Gain (Loss) | (181,770) |
Cost of Purchases | 1,020 |
Proceeds of Sales | - |
Amortization/Accretion | - |
Transfers in to Level 3 | 6,055,125 |
Transfers out of Level 3 | - |
Ending Balance | $ 8,653,875 |
The change in unrealized gain (loss) for the period attributable to Level 3 securities held at January 31, 2012 | $ (181,770) |
The information used in the above reconciliation represents fiscal year to date activity for any Investments in Securities identified as using Level 3 inputs at either the beginning or the end of the current fiscal period. Transfers in or out of Level 3 represent the beginning value of any Security or Instrument where a change in the pricing level occurred from the beginning to the end of the period. The cost of purchases and the proceeds of sales may include securities received or delivered through corporate actions or exchanges. Realized and unrealized gains (losses) disclosed in the reconciliation are included in Net Gain (Loss) on the Fund's Statement of Operations. |
Value of Derivative Instruments |
The following table is a summary of the Fund's value of derivative instruments by risk exposure as of January 31, 2012. For additional information on derivative instruments, please refer to the Derivative Instruments section in the accompanying Notes to Financial Statements. |
Risk Exposure / | Value | |
| Asset | Liability |
Equity Risk | ||
Futures Contracts (a) | $ 4,341,118 | $ - |
Total Value of Derivatives | $ 4,341,118 | $ - |
(a) Reflects cumulative appreciation/(depreciation) on futures contracts as disclosed on the Schedule of Investments. Only the period end variation margin is separately disclosed on the Statement of Assets and Liabilities. |
Distribution of investments by country of issue, as a percentage of total net assets, is as follows: (Unaudited) |
United States of America | 83.5% |
United Kingdom | 5.0% |
Canada | 2.3% |
Ireland | 1.5% |
Switzerland | 1.2% |
France | 1.1% |
Others (Individually Less Than 1%) | 5.4% |
| 100.0% |
See accompanying notes which are an integral part of the financial statements.
Annual Report
Fidelity Series All-Sector Equity Fund
Financial Statements
Statement of Assets and Liabilities
| January 31, 2012 | |
|
|
|
Assets | ||
Investment in securities, at value (including securities loaned of $18,566,614) - See accompanying schedule: Unaffiliated issuers (cost $9,516,488,696) | $ 11,329,153,068 |
|
Fidelity Central Funds (cost $320,856,091) | 320,856,091 |
|
Total Investments (cost $9,837,344,787) |
| $ 11,650,009,159 |
Foreign currency held at value (cost $3,101,783) | 3,101,783 | |
Receivable for investments sold | 160,095,488 | |
Receivable for fund shares sold | 7,487,236 | |
Dividends receivable | 6,835,270 | |
Distributions receivable from Fidelity Central Funds | 61,318 | |
Prepaid expenses | 27,798 | |
Other receivables | 676,495 | |
Total assets | 11,828,294,547 | |
|
|
|
Liabilities | ||
Payable to custodian bank | $ 832 | |
Payable for investments purchased | 179,579,352 | |
Payable for fund shares redeemed | 14,487,616 | |
Accrued management fee | 5,740,417 | |
Payable for daily variation margin on futures contracts | 57,614 | |
Other affiliated payables | 1,353,085 | |
Other payables and accrued expenses | 147,451 | |
Collateral on securities loaned, at value | 19,160,525 | |
Total liabilities | 220,526,892 | |
|
|
|
Net Assets | $ 11,607,767,655 | |
Net Assets consist of: |
| |
Paid in capital | $ 9,981,762,996 | |
Accumulated undistributed net realized gain (loss) on investments and foreign currency transactions | (190,922,607) | |
Net unrealized appreciation (depreciation) on investments and assets and liabilities in foreign currencies | 1,816,927,266 | |
Net Assets | $ 11,607,767,655 | |
See accompanying notes which are an integral part of the financial statements.
Annual Report
Fidelity Series All-Sector Equity Fund
Financial Statements - continued
Statement of Assets and Liabilities - continued
| January 31, 2012 | |
|
|
|
Series All-Sector Equity: | $ 11.82 | |
|
|
|
Class F: | $ 11.82 | |
See accompanying notes which are an integral part of the financial statements.
Annual Report
Statement of Operations
| Year ended January 31, 2012 | |
|
|
|
Investment Income |
|
|
Dividends |
| $ 185,354,097 |
Interest |
| 6,754 |
Income from Fidelity Central Funds |
| 2,177,525 |
Total income |
| 187,538,376 |
|
|
|
Expenses | ||
Management fee | $ 62,325,764 | |
Performance adjustment | 11,740,099 | |
Transfer agent fees | 16,749,137 | |
Accounting and security lending fees | 1,349,977 | |
Custodian fees and expenses | 451,018 | |
Independent trustees' compensation | 64,843 | |
Audit | 86,188 | |
Legal | 36,687 | |
Miscellaneous | 108,131 | |
Total expenses before reductions | 92,911,844 | |
Expense reductions | (1,688,525) | 91,223,319 |
Net investment income (loss) | 96,315,057 | |
Realized and Unrealized Gain (Loss) Net realized gain (loss) on: | ||
Investment securities: |
|
|
Unaffiliated issuers | 461,140,992 | |
Foreign currency transactions | (475,402) | |
Futures contracts | 16,928,999 | |
Total net realized gain (loss) |
| 477,594,589 |
Change in net unrealized appreciation (depreciation) on: Investment securities | (568,791,016) | |
Assets and liabilities in foreign currencies | (153,623) | |
Futures contracts | 2,776,225 | |
Total change in net unrealized appreciation (depreciation) |
| (566,168,414) |
Net gain (loss) | (88,573,825) | |
Net increase (decrease) in net assets resulting from operations | $ 7,741,232 | |
See accompanying notes which are an integral part of the financial statements.
Annual Report
Fidelity Series All-Sector Equity Fund
Financial Statements - continued
Statement of Changes in Net Assets
| Year ended | Year ended |
Increase (Decrease) in Net Assets |
|
|
Operations |
|
|
Net investment income (loss) | $ 96,315,057 | $ 74,714,087 |
Net realized gain (loss) | 477,594,589 | 756,937,910 |
Change in net unrealized appreciation (depreciation) | (566,168,414) | 1,328,384,082 |
Net increase (decrease) in net assets resulting | 7,741,232 | 2,160,036,079 |
Distributions to shareholders from net investment income | (100,591,386) | (71,754,222) |
Distributions to shareholders from net realized gain | (903,235,315) | (751,557,997) |
Total distributions | (1,003,826,701) | (823,312,219) |
Share transactions - net increase (decrease) | 1,302,246,045 | 2,421,412,979 |
Total increase (decrease) in net assets | 306,160,576 | 3,758,136,839 |
|
|
|
Net Assets | ||
Beginning of period | 11,301,607,079 | 7,543,470,240 |
End of period (including undistributed net investment income of $0 and undistributed net investment income of $3,483,600, respectively) | $ 11,607,767,655 | $ 11,301,607,079 |
See accompanying notes which are an integral part of the financial statements.
Annual Report
Financial Highlights - Series All-Sector Equity
Years ended January 31, | 2012 | 2011 | 2010 | 2009G |
Selected Per-Share Data |
|
|
|
|
Net asset value, beginning of period | $ 12.98 | $ 11.32 | $ 8.48 | $ 10.00 |
Income from Investment Operations |
|
|
|
|
Net investment income (loss)D | .10 | .09 | .09 | .03 |
Net realized and unrealized gain (loss) | (.15) | 2.63 | 3.18 | (1.52) |
Total from investment operations | (.05) | 2.72 | 3.27 | (1.49) |
Distributions from net investment income | (.10) | (.08) | (.08) | (.03) |
Distributions from net realized gain | (1.01) | (.98) | (.35) | - |
Total distributions | (1.11) | (1.06) | (.43) | (.03) |
Net asset value, end of period | $ 11.82 | $ 12.98 | $ 11.32 | $ 8.48 |
Total ReturnB,C | (.12)% | 24.87% | 38.51% | (14.91)% |
Ratios to Average Net AssetsE,H |
|
|
|
|
Expenses before reductions | .89% | .91% | .90% | .95%A |
Expenses net of fee waivers, if any | .89% | .91% | .90% | .95%A |
Expenses net of all reductions | .87% | .89% | .88% | .95%A |
Net investment income (loss) | .81% | .79% | .88% | 1.17%A |
Supplemental Data |
|
|
|
|
Net assets, end of period (000 omitted) | $ 7,338,658 | $ 8,937,188 | $ 7,142,899 | $ 3,056,733 |
Portfolio turnover rateF | 135% | 117% | 144% | 98% |
A Annualized
B Total returns for periods of less than one year are not annualized.
C Total returns would have been lower if certain expenses had not been reduced during the applicable periods shown.
D Calculated based on average shares outstanding during the period.
E Fees and expenses of any underlying Fidelity Central Funds are not included in the Fund's expense ratio. The Fund indirectly bears its proportionate share of the expenses of any underlying Fidelity Central Funds.
F Amount does not include the portfolio activity of any underlying Fidelity Central Funds.
G For the period October 17, 2008 (commencement of operations) to January 31, 2009.
H Expense ratios reflect operating expenses of the class. Expenses before reductions do not reflect amounts reimbursed by the investment adviser or reductions from brokerage service arrangements or reductions from other expense offset arrangements and do not represent the amount paid by the class during periods when reimbursements or reductions occur. Expense ratios before reductions for start-up periods may not be representative of longer-term operating periods. Expenses net of fee waivers reflect expenses after reimbursement by the investment adviser but prior to reductions from brokerage service arrangements or other expense offset arrangements. Expenses net of all reductions represent the net expenses paid by the class.
See accompanying notes which are an integral part of the financial statements.
Annual Report
Financial Highlights - Class F
Years ended January 31, | 2012 | 2011 | 2010G |
Selected Per-Share Data |
|
|
|
Net asset value, beginning of period | $ 12.98 | $ 11.32 | $ 9.84 |
Income from Investment Operations |
|
|
|
Net investment income (loss)D | .12 | .12 | .04 |
Net realized and unrealized gain (loss) | (.14) | 2.63 | 1.89 |
Total from investment operations | (.02) | 2.75 | 1.93 |
Distributions from net investment income | (.13) | (.11) | (.10) |
Distributions from net realized gain | (1.01) | (.98) | (.35) |
Total distributions | (1.14) | (1.09) | (.45) |
Net asset value, end of period | $ 11.82 | $ 12.98 | $ 11.32 |
Total ReturnB,C | .10% | 25.12% | 19.49% |
Ratios to Average Net AssetsE,H |
|
|
|
Expenses before reductions | .68% | .69% | .63%A |
Expenses net of fee waivers, if any | .68% | .69% | .63%A |
Expenses net of all reductions | .67% | .67% | .61%A |
Net investment income (loss) | 1.01% | 1.01% | .62%A |
Supplemental Data |
|
|
|
Net assets, end of period (000 omitted) | $ 4,269,110 | $ 2,364,419 | $ 400,571 |
Portfolio turnover rateF | 135% | 117% | 144% |
A Annualized
B Total returns for periods of less than one year are not annualized.
C Total returns would have been lower if certain expenses had not been reduced during the applicable periods shown.
D Calculated based on average shares outstanding during the period.
E Fees and expenses of any underlying Fidelity Central Funds are not included in the Fund's expense ratio. The Fund indirectly bears its proportionate share of the expenses of any underlying Fidelity Central Funds.
F Amount does not include the portfolio activity of any underlying Fidelity Central Funds.
G For the period June 26, 2009 (commencement of sale of shares) to January 31, 2010.
H Expense ratios reflect operating expenses of the class. Expenses before reductions do not reflect amounts reimbursed by the investment adviser or reductions from brokerage service arrangements or reductions from other expense offset arrangements and do not represent the amount paid by the class during periods when reimbursements or reductions occur. Expense ratios before reductions for start-up periods may not be representative of longer-term operating periods. Expenses net of fee waivers reflect expenses after reimbursement by the investment adviser but prior to reductions from brokerage service arrangements or other expense offset arrangements. Expenses net of all reductions represent the net expenses paid by the class.
See accompanying notes which are an integral part of the financial statements.
Annual Report
Notes to Financial Statements
For the period ended January 31, 2012
1. Organization.
Fidelity Series Large Cap Value Fund and Fidelity Series All-Sector Equity Fund (the Funds) are funds of Fidelity Devonshire Trust (the Trust). The Trust is registered under the Investment Company Act of 1940, as amended (the 1940 Act), as an open-end management investment company organized as a Massachusetts business trust. Each Fund is authorized to issue an unlimited number of shares. Shares of the Funds are only available for purchase by mutual funds for which Fidelity Management & Research Company (FMR) or an affiliate serves as an investment manager. Fidelity Series Large Cap Value Fund offers Series Large Cap Value shares and Class F shares. Fidelity Series All-Sector Equity Fund offers Series All-Sector Equity shares and Class F shares. All classes have equal rights as to assets and voting privileges. Each class has exclusive voting rights with respect to matters that affect that class. Investment income, realized and unrealized capital gains and losses, the common expenses of each Fund, and certain fund-level expense reductions, if any, are allocated on a pro-rata basis to each class based on the relative net assets of each class to the total net assets of each Fund. Each class differs with respect to transfer agent fees incurred and certain class-level expense reductions.
2. Investments in Fidelity Central Funds.
The Funds invests in Fidelity Central Funds, which are open-end investment companies available only to other investment companies and accounts managed by FMR and its affiliates. The Funds' Schedules of Investments list each of the Fidelity Central Funds held as of period end, if any, as an investment of each Fund, but does not include the underlying holdings of each Fidelity Central Fund. As an Investing Fund, the Funds indirectly bear their proportionate share of the expenses of the underlying Fidelity Central Funds.
The Money Market Central Funds seek preservation of capital and current income and are managed by Fidelity Investments Money Management, Inc. (FIMM), an affiliate of FMR.
A complete unaudited list of holdings for each Fidelity Central Fund is available upon request or at the Securities and Exchange Commission (the SEC) web site at www.sec.gov. In addition, the financial statements of the Fidelity Central Funds, which are not covered by the Funds' Report of Independent Registered Public Accounting Firm, are available on the SEC web site or upon request.
3. Significant Accounting Policies.
The financial statements have been prepared in conformity with accounting principles generally accepted in the United States of America (GAAP), which require management to make certain estimates and assumptions at the date of the financial statements.
Annual Report
Notes to Financial Statements - continued
3. Significant Accounting Policies - continued
Actual results could differ from those estimates. Subsequent events, if any, through the date that the financial statements were issued have been evaluated in the preparation of the financial statements. The following summarizes the significant accounting policies of the Funds:
Security Valuation. Investments are valued as of 4:00 p.m. Eastern time on the last calendar day of the period. Each Fund uses independent pricing services approved by the Board of Trustees to value their investments. When current market prices or quotations are not readily available or reliable, valuations may be determined in good faith in accordance with procedures adopted by the Board of Trustees. Factors used in determining value may include market or security specific events. The frequency with which these procedures are used cannot be predicted and they may be utilized to a significant extent. The value used for net asset value (NAV) calculation under these procedures may differ from published prices for the same securities.
Each Fund categorizes the inputs to valuation techniques used to value their investments into a disclosure hierarchy consisting of three levels as shown below:
Level 1 - quoted prices in active markets for identical investments
Level 2 - other significant observable inputs (including quoted prices for similar investments, interest rates, prepayment speeds, etc.)
Level 3 - unobservable inputs (including the Fund's own assumptions based on the best information available)
Changes in valuation techniques may result in transfers in or out of an assigned level within the disclosure hierarchy. The aggregate value of investments by input level, as of January 31, 2012, as well as a roll forward of Level 3 securities, is included at the end of each Fund's Schedule of Investments. Valuation techniques used to value each Fund's investments by major category are as follows:
Equity securities, including restricted securities, for which market quotations are readily available, are valued at the last reported sale price or official closing price as reported by an independent pricing service on the primary market or exchange on which they are traded and are categorized as Level 1 in the hierarchy. In the event there were no sales during the day or closing prices are not available, securities are valued at the last quoted bid price or may be valued using the last available price and are generally categorized as Level 2 in the hierarchy. For foreign equity securities, when significant market or security specific events arise, comparisons to the valuation of American Depositary Receipts (ADRs), futures contracts, Exchange-traded funds (ETFs) and certain indexes as well as quoted prices for similar securities are used and are categorized as Level 2 in the hierarchy in these circumstances. Utilizing these techniques may result in transfers between
Annual Report
3. Significant Accounting Policies - continued
Security Valuation - continued
Level 1 and Level 2. For restricted equity securities and private placements where observable inputs are limited, assumptions about market activity and risk are used and are categorized as Level 3 in the hierarchy.
Debt securities, including restricted securities, are valued based on evaluated prices received from independent pricing services or from dealers who make markets in such securities. For U.S. government and government agency obligations, pricing services utilize matrix pricing which considers yield or price of bonds of comparable quality, coupon, maturity and type as well as dealer supplied prices and are generally categorized as Level 2 in the hierarchy. When independent prices are unavailable or unreliable, debt securities may be valued utilizing pricing matrices which consider similar factors that would be used by independent pricing services. These are generally categorized as Level 2 in the hierarchy but may be Level 3 depending on the circumstances.
Futures contracts are valued at the settlement price established each day by the board of trade or exchange on which they are traded and are categorized as Level 1 in the hierarchy. Investments in open-end mutual funds, including the Fidelity Central Funds, are valued at their closing net asset value each business day and are categorized as Level 1 in the hierarchy. Short-term securities with remaining maturities of sixty days or less may be valued at amortized cost, which approximates fair value, and are categorized as Level 2 in the hierarchy.
New Accounting Pronouncements. In May 2011, the Financial Accounting Standards Board issued Accounting Standard Update No. 2011-04, Fair Value Measurement (Topic 820) - Amendments to Achieve Common Fair Value Measurement and Disclosure Requirements in U.S. GAAP and IFRSs. The update is effective during interim and annual periods beginning after December 15, 2011 and will result in additional disclosure for transfers between levels as well as expanded disclosure for securities categorized as Level 3 under the fair value hierarchy.
In December 2011, the Financial Accounting Standards Board issued Accounting Standard Update No. 2011-11, Disclosures about Offsetting Assets and Liabilities. The update creates new disclosure requirements requiring entities to disclose both gross and net information for derivatives and other financial instruments that are either offset in the Statement of Assets and Liabilities or subject to an enforceable master netting arrangement or similar agreement. The disclosure requirements are effective for interim and annual reporting periods beginning on or after January 1, 2013. Management is currently evaluating the impact of the update's adoption on the Fund's financial statement disclosures.
Annual Report
Notes to Financial Statements - continued
3. Significant Accounting Policies - continued
Foreign Currency. The Funds may use foreign currency contracts to facilitate transactions in foreign-denominated securities. Gains and losses from these transactions may arise from changes in the value of the foreign currency or if the counterparties do not perform under the contracts' terms.
Foreign-denominated assets, including investment securities, and liabilities are translated into U.S. dollars at the exchange rate at period end. Purchases and sales of investment securities, income and dividends received and expenses denominated in foreign currencies are translated into U.S. dollars at the exchange rate in effect on the transaction date.
The effects of exchange rate fluctuations on investments are included with the net realized and unrealized gain (loss) on investment securities. Other foreign currency transactions resulting in realized and unrealized gain (loss) are disclosed separately.
Investment Transactions and Income. For financial reporting purposes, the Funds' investment holdings and NAV include trades executed through the end of the last business day of the period. The NAV per share for processing shareholder transactions is calculated as of the close of business of the New York Stock Exchange (NYSE), normally 4:00 p.m. Eastern time and includes trades executed through the end of the prior business day. Gains and losses on securities sold are determined on the basis of identified cost and may include proceeds received from litigation. Dividend income is recorded on the ex-dividend date, except for certain dividends from foreign securities where the ex-dividend date may have passed, which are recorded as soon as the Funds are informed of the ex-dividend date. Non-cash dividends included in dividend income, if any, are recorded at the fair market value of the securities received. Distributions received on securities that represent a return of capital or capital gain are recorded as a reduction of cost of investments and/or as a realized gain. The Funds estimate the components of distributions received that may be considered return of capital distributions or capital gain distributions. Interest income and distributions from the Fidelity Central Funds are accrued as earned. Interest income includes coupon interest and amortization of premium and accretion of discount on debt securities. Investment income is recorded net of foreign taxes withheld where recovery of such taxes is uncertain.
Expenses. Expenses directly attributable to a fund are charged to that fund. Expenses attributable to more than one fund are allocated among the respective funds on the basis of relative net assets or other appropriate methods. Expense estimates are accrued in the period to which they relate and adjustments are made when actual amounts are known.
Income Tax Information and Distributions to Shareholders. Each year, each Fund intends to qualify as a regulated investment company, including distributing substantially all of its taxable income and realized gains under Subchapter M of the Internal
Annual Report
3. Significant Accounting Policies - continued
Income Tax Information and Distributions to Shareholders - continued
Revenue Code. As a result, no provision for income taxes is required. As of January 31, 2012, each Fund did not have any unrecognized tax benefits in the financial statements; nor is each Fund aware of any tax positions for which it is reasonably possible that the total amounts of unrecognized tax benefits will significantly change in the next twelve months. Each Fund files a U.S. federal tax return, in addition to state and local tax returns as required. A fund's tax returns are subject to examination by the Internal Revenue Service (IRS) for a period of three fiscal years. State and local tax returns may be subject to examination for an additional fiscal year depending on the jurisdiction. Foreign taxes are provided for based on each Fund's understanding of the tax rules and rates that exist in the foreign markets in which it invests.
Distributions are declared and recorded on the ex-dividend date. Income dividends and capital gain distributions are declared separately for each class. Income and capital gain distributions are determined in accordance with income tax regulations, which may differ from GAAP.
Capital accounts within the financial statements are adjusted for permanent book-tax differences. These adjustments have no impact on net assets or the results of operations. Temporary book-tax differences will reverse in a subsequent period.
Book-tax differences are primarily due to futures transactions, foreign currency transactions, passive foreign investment companies (PFIC), market discount, partnerships, and losses deferred due to wash sales and excise tax regulations.
The federal tax cost of investment securities and unrealized appreciation (depreciation) as of period end were as follows for each Fund:
| Tax cost | Gross unrealized appreciation | Gross unrealized depreciation | Net unrealized appreciation |
Fidelity Series Large Cap Value Fund | $ 10,001,435,729 | $ 1,307,057,515 | $ (581,889,711) | $ 725,167,804 |
Fidelity Series All-Sector Equity Fund | 9,889,598,072 | 1,961,085,872 | (200,674,785) | 1,760,411,087 |
Annual Report
Notes to Financial Statements - continued
3. Significant Accounting Policies - continued
Income Tax Information and Distributions to Shareholders - continued
The tax-based components of distributable earnings as of period end were as follows for each Fund:
| Net unrealized appreciation |
Fidelity Series Large Cap Value Fund | $ 725,168,138 |
Fidelity Series All-Sector Equity Fund | 1,760,332,863 |
Certain of the Funds intend to elect to defer to the fiscal year ending January 31, 2013 capital losses recognized during the period November 1, 2011 to January 31, 2012. Loss deferrals were as follows:
| Capital losses |
Fidelity Series All-Sector Equity Fund | $ (134,328,203) |
The tax character of distributions paid was as follows:
January 31, 2012 | Ordinary | Long-term | Total |
Fidelity Series Large Cap Value Fund | $ 309,649,849 | $ 687,492,424 | $ 997,142,273 |
Fidelity Series All-Sector Equity Fund | 191,063,365 | 812,763,336 | 1,003,826,701 |
January 31, 2011 | Ordinary | Long-term | Total |
Fidelity Series Large Cap Value Fund | $ 380,586,061 | $ 323,041,515 | $ 703,627,576 |
Fidelity Series All-Sector Equity Fund | 351,681,090 | 471,631,129 | 823,312,219 |
4. Operating Policies.
Repurchase Agreements. FMR has received an Exemptive Order from the SEC which permits the Funds and other affiliated entities of FMR to transfer uninvested cash balances into joint trading accounts which are then invested in repurchase agreements. The Funds may also invest directly with institutions in repurchase agreements. Repurchase agreements are collateralized by government or non-government securities. Upon settlement date, collateral is held in segregated accounts with custodian banks and may be obtained in the event of a default of the counterparty. Each applicable Fund monitors, on a daily basis, the value of the collateral to ensure it is at least equal to the principal amount of the repurchase agreement (including accrued interest). In the event of a default by the counterparty, realization of the collateral proceeds could be delayed, during which time the value of the collateral may decline.
Annual Report
4. Operating Policies - continued
Restricted Securities. The Funds may invest in securities that are subject to legal or contractual restrictions on resale. These securities generally may be resold in transactions exempt from registration or to the public if the securities are registered. Disposal of these securities may involve time-consuming negotiations and expense, and prompt sale at an acceptable price may be difficult. Information regarding restricted securities is included at the end of each applicable Fund's Schedule of Investments.
5. Derivative Instruments.
Risk Exposures and the Use of Derivative Instruments. The Funds used derivative instruments (derivatives), including futures contracts, in order to meet their investment objectives. The strategy is to use derivatives to increase returns, to gain exposure to certain types of assets and to manage exposure to certain risks as defined below. The success of any strategy involving derivatives depends on analysis of numerous economic factors, and if the strategies for investment do not work as intended, the Funds may not achieve their objectives.
The Funds' use of derivatives increased or decreased their exposure to the following risk:
Equity Risk | Equity risk relates to the fluctuations in the value of financial instruments as a result of changes in market prices (other than those arising from interest rate risk or foreign exchange risk), whether caused by factors specific to an individual investment, its issuer, or all factors affecting all instruments traded in a market or market segment. |
The Funds are also exposed to additional risks from investing in derivatives, such as liquidity risk and counterparty credit risk. Liquidity risk is the risk that the Funds will be unable to close out the derivative in the open market in a timely manner. Counterparty credit risk is the risk that the counterparty will not be able to fulfill its obligation to the Funds. Counterparty credit risk related to exchange-traded futures contracts is minimal because of the protection provided by the exchange on which they trade. Derivatives involve, to varying degrees, risk of loss in excess of the amounts recognized in the Statement of Assets and Liabilities.
Futures Contracts. A futures contract is an agreement between two parties to buy or sell a specified underlying instrument for a fixed price at a specified future date. The Funds used futures contracts to manage their exposure to the stock market.
Upon entering into a futures contract, a fund is required to deposit either cash or securities (initial margin) with a clearing broker in an amount equal to a certain percentage of the face value of the contract. Futures contracts are marked-to-market daily and subsequent payments (variation margin) are made or received by a fund depending on the daily fluctuations in the value of the futures contracts and are recorded as unrealized appreciation or (depreciation). This receivable and/or payable is included in daily
Annual Report
Notes to Financial Statements - continued
5. Derivative Instruments - continued
Futures Contracts - continued
variation margin on futures contracts in the Statement of Assets and Liabilities. Realized gain or (loss) is recorded upon the expiration or closing of a futures contract. The net realized gain (loss) and change in net unrealized appreciation (depreciation) on futures contracts during the period is included in the Statement of Operations.
The underlying face amount at value of open futures contracts at period end is shown in the Schedule of Investments under the caption "Futures Contracts." This amount reflects each contract's exposure to the underlying instrument at period end and is representative of activity for the period. Securities deposited to meet initial margin requirements are identified in the Schedule of Investments.
During the period the Fidelity Series All-Sector Equity Fund recognized net realized gain (loss) of $16,928,999 and a change in net unrealized appreciation (depreciation) of $2,776,225 related to its investment in futures contracts. These amounts are included in the Statement of Operations.
6. Purchases and Sales of Investments.
Purchases and sales of securities, other than short-term securities, are noted in the table below.
| Purchases ($) | Sales ($) |
Fidelity Series Large Cap Value Fund | 12,532,128,358 | 12,278,282,415 |
Fidelity Series All-Sector Equity Fund | 15,350,922,128 | 14,874,067,011 |
7. Fees and Other Transactions with Affiliates.
Management Fee. FMR and its affiliates provide the Funds with investment management related services for which the Funds pay a monthly management fee. The management fee is the sum of an individual fund fee rate and an annualized group fee rate. The individual fund fee rate is applied to each Fund's average net assets. The group fee rate is based upon the average net assets of all the mutual funds advised by FMR. The group fee rate decreases as assets under management increase and increases as assets under management decrease. In addition, the management fee for Fidelity Series All-Sector Equity Fund and Fidelity Series Large Cap Value Fund is subject to a performance adjustment (up to a maximum ±.20% of each applicable Fund's average net assets over a 36 month performance period). The upward or downward adjustment to the management fee is based on each applicable Fund's relative investment performance of the asset-weighted return of all classes as compared to an appropriate benchmark index. For the period, each Fund's annual management fee rate expressed as a percentage of each Fund's average net assets, including the performance adjustment, if applicable was as follows:
Annual Report
7. Fees and Other Transactions with Affiliates - continued
Management Fee - continued
| Individual Rate | Group Rate | Total |
Fidelity Series Large Cap Value Fund | .30% | .26% | .43% |
Fidelity Series All-Sector Equity Fund | .30% | .26% | .66% |
Transfer Agent Fees. Fidelity Investments Institutional Operations Company, Inc. (FIIOC), an affiliate of FMR, is the transfer, dividend disbursing and shareholder servicing agent for each class of the Funds. FIIOC receives account fees and asset-based fees that vary according to the account size and type of account of the shareholders of the respective classes of each Fund except for Class F. FIIOC receives no fees for providing transfer agency services to Class F. FIIOC pays for typesetting, printing and mailing of shareholder reports, except proxy statements. For the period, transfer agent fees for each class were as follows:
| Amount | % of |
Fidelity Series Large Cap Value Fund | $ 15,490,776 | .21 |
Fidelity Series All-Sector Equity Fund | 16,749,137 | .21 |
Accounting and Security Lending Fees. Fidelity Service Company, Inc. (FSC), an affiliate of FMR, maintains each Fund's accounting records. The accounting fee is based on the level of average net assets for each month. Under a separate contract, FSC administers the security lending program. The security lending fee is based on the number and duration of lending transactions.
Brokerage Commissions. Certain Funds placed a portion of their portfolio transactions with brokerage firms which are affiliates of the investment adviser. The commissions paid to these affiliated firms were as follows:
| Amount |
Fidelity Series Large Cap Value Fund | $ 579,987 |
Fidelity Series All-Sector Equity Fund | 529,301 |
8. Committed Line of Credit.
Certain Funds participate with other funds managed by FMR or an affiliate in a $4.0 billion credit facility (the "line of credit") to be utilized for temporary or emergency purposes to fund shareholder redemptions or for other short-term liquidity purposes. The participating funds have agreed to pay commitment fees on their pro-rata portion of the line of credit, which are reflected in Miscellaneous expenses on the Statement of Operations, and are as follows:
Annual Report
Notes to Financial Statements - continued
8. Committed Line of Credit - continued
Fidelity Series Large Cap Value Fund | $ 30,475 |
Fidelity Series All-Sector Equity Fund | 32,931 |
During the period, there were no borrowings on this line of credit.
9. Security Lending.
Certain Funds lend portfolio securities through a lending agent from time to time in order to earn additional income. For equity securities, a lending agent is used and may loan securities to certain qualified borrowers, including Fidelity Capital Markets (FCM), a broker-dealer affiliated with the Funds. On the settlement date of the loan, each applicable Fund receives collateral (in the form of U.S. Treasury obligations, letters of credit and/or cash) against the loaned securities and maintains collateral in an amount not less than 100% of the market value of the loaned securities during the period of the loan. The market value of the loaned securities is determined at the close of business of the Funds and any additional required collateral is delivered to the Funds on the next business day. If the borrower defaults on its obligation to return the securities loaned because of insolvency or other reasons, a fund could experience delays and costs in recovering the securities loaned or in gaining access to the collateral. Any cash collateral received is invested in the Fidelity Securities Lending Cash Central Fund. The value of loaned securities and cash collateral at period end are disclosed on each applicable Fund's Statement of Assets and Liabilities. At period end, there were no security loans outstanding with FCM. Security lending income represents the income earned on investing cash collateral, less rebates paid to borrowers and any lending agent fees associated with the loan, plus any premium payments received for lending certain types of securities. Security lending income is presented on each applicable Fund's Statement of Operations as a component of income from Fidelity Central Funds. Security lending activity as of and during the period was as follows:
| Total Security | Security Lending |
Fidelity Series Large Cap Value Fund | $ 3,762,106 | $ 12,600 |
Fidelity Series All-Sector Equity Fund | 1,747,185 | 8,541 |
10. Expense Reductions.
Many of the brokers with whom FMR places trades on behalf of certain Funds provided services to these Funds in addition to trade execution. These services included payments of expenses on behalf of each applicable Fund. In addition, through arrangements with each applicable Fund's custodian, credits realized as a result of uninvested cash balances
Annual Report
10. Expense Reductions - continued
were used to reduce the Fund's expenses. All of the applicable expense reductions are noted in the table below.
| Brokerage Service | Custody |
Fidelity Series Large Cap Value Fund | $ 1,133,496 | $ 481 |
Fidelity Series All-Sector Equity Fund | 1,688,525 | - |
11. Distributions to Shareholders.
Distributions to shareholders of each class were as follows:
Years ended January 31, | 2012 | 2011 |
Fidelity Series Large Cap Value Fund |
|
|
From net investment income |
|
|
Series Large Cap Value | $ 108,393,071 | $ 89,131,579 |
Class F | 60,241,309 | 23,364,660 |
Total | $ 168,634,380 | $ 112,496,239 |
From net realized gain |
|
|
Series Large Cap Value | $ 592,235,098 | $ 497,760,174 |
Class F | 236,272,795 | 93,371,163 |
Total | $ 828,507,893 | $ 591,131,337 |
Fidelity Series All-Sector Equity Fund |
|
|
From net investment income |
|
|
Series All-Sector Equity | $ 62,319,226 | $ 55,409,300 |
Class F | 38,272,160 | 16,344,922 |
Total | $ 100,591,386 | $ 71,754,222 |
From net realized gain |
|
|
Series All-Sector Equity | $ 634,348,109 | $ 645,937,626 |
Class F | 268,887,206 | 105,620,371 |
Total | $ 903,235,315 | $ 751,557,997 |
Annual Report
Notes to Financial Statements - continued
12. Share Transactions.
Transactions for each class of shares were as follows:
| Shares | Dollars | ||
Years ended | 2012 | 2011 | 2012 | 2011 |
Fidelity Series Large |
|
|
|
|
Series Large Cap |
|
|
|
|
Shares sold | 74,784,511 | 161,692,202 | $ 833,802,569 | $ 1,853,159,776 |
Reinvestment of distributions | 65,566,961 | 50,554,229 | 700,628,169 | 586,891,753 |
Shares redeemed | (198,370,255) | (187,059,933) | (2,184,624,803) | (2,163,487,162) |
Net increase (decrease) | (58,018,783) | 25,186,498 | $ (650,194,065) | $ 276,564,367 |
Class F |
|
|
|
|
Shares sold | 184,985,420 | 139,874,808 | $ 2,017,097,287 | $ 1,613,929,256 |
Reinvestment of distributions | 28,372,486 | 10,049,509 | 296,514,104 | 116,735,823 |
Shares redeemed | (29,458,031) | (8,373,871) | (330,166,209) | (98,509,346) |
Net increase (decrease) | 183,899,875 | 141,550,446 | $ 1,983,445,182 | $ 1,632,155,733 |
Fidelity Series All- |
|
|
|
|
Series All-Sector |
|
|
|
|
Shares sold | 73,617,124 | 170,413,098 | $ 905,741,088 | $ 2,009,265,010 |
Reinvestment of distributions | 59,278,225 | 57,697,782 | 696,667,335 | 701,346,926 |
Shares redeemed | (200,470,026) | (170,625,195) | (2,441,040,063) | (2,055,372,432) |
Net increase (decrease) | (67,574,677) | 57,485,685 | $ (838,631,640) | $ 655,239,504 |
Class F |
|
|
|
|
Shares sold | 182,988,272 | 141,944,318 | $ 2,210,442,127 | $ 1,707,612,201 |
Reinvestment of distributions | 26,555,861 | 9,883,257 | 307,159,366 | 121,965,293 |
Shares redeemed | (30,434,525) | (5,090,160) | (376,723,808) | (63,404,019) |
Net increase (decrease) | 179,109,608 | 146,737,415 | $ 2,140,877,685 | $ 1,766,173,475 |
Annual Report
13. Other.
The Funds' organizational documents provide former and current trustees and officers with a limited indemnification against liabilities arising in connection with the performance of their duties to the Funds. In the normal course of business, the Funds may also enter into contracts that provide general indemnifications. The Funds' maximum exposure under these arrangements is unknown as this would be dependent on future claims that may be made against the Funds. The risk of material loss from such claims is considered remote.
At the end of the period, mutual funds managed by FMR or an FMR affiliate were the owners of record of all of the outstanding shares of the Funds.
Annual Report
Report of Independent Registered Public Accounting Firm
To the Trustees of Fidelity Devonshire Trust and the Shareholders of Fidelity Series Large Cap Value Fund and Fidelity Series All-Sector Equity Fund:
We have audited the accompanying statements of assets and liabilities of, including the schedules of investments, as of January 31, 2012, and the related statements of operations for the year then ended, the statements of changes in net assets for each of the two years in the period then ended, and the financial highlights for each of the periods presented. These financial statements and financial highlights are the responsibility of the Funds' management. Our responsibility is to express an opinion on these financial statements and financial highlights based on our audits.
We conducted our audits in accordance with the standards of the Public Company Accounting Oversight Board (United States). Those standards require that we plan and perform the audit to obtain reasonable assurance about whether the financial statements and financial highlights are free of material misstatement. The Funds are not required to have, nor were we engaged to perform, an audit of the internal control over financial reporting. Our audits included consideration of internal control over financial reporting as a basis for designing audit procedures that are appropriate in the circumstances, but not for the purpose of expressing an opinion on the effectiveness of the Funds' internal control over financial reporting. Accordingly, we express no such opinion. An audit also includes examining, on a test basis, evidence supporting the amounts and disclosures in the financial statements, assessing the accounting principles used and significant estimates made by management, as well as evaluating the overall financial statement presentation. Our procedures included confirmation of securities owned as of January 31, 2012, by correspondence with the custodians and brokers; where replies were not received from brokers, we performed other auditing procedures. We believe that our audits provide a reasonable basis for our opinion.
In our opinion, the financial statements and financial highlights referred to above present fairly, in all material respects, the financial position of Fidelity Series Large Cap Value Fund and Fidelity Series All-Sector Equity Fund as of January 31, 2012, the results of their operations for the year then ended, the changes in their net assets for each of the two years in the period then ended, and their financial highlights for each of the periods presented, in conformity with accounting principles generally accepted in the United States of America.
/s/ Deloitte & Touche LLP
DELOITTE & TOUCHE LLP
Boston, Massachusetts
March 13, 2012
Annual Report
Trustees and Officers
The Trustees, Members of the Advisory Board, and executive officers of the trust and funds, as applicable, are listed below. The Board of Trustees governs each fund and is responsible for protecting the interests of shareholders. The Trustees are experienced executives who meet periodically throughout the year to oversee each fund's activities, review contractual arrangements with companies that provide services to each fund, oversee management of the risks associated with such activities and contractual arrangements, and review each fund's performance. Except for James C. Curvey, each of the Trustees oversees 226 funds advised by FMR or an affiliate. Mr. Curvey oversees 430 funds advised by FMR or an affiliate.
The Trustees hold office without limit in time except that (a) any Trustee may resign; (b) any Trustee may be removed by written instrument, signed by at least two-thirds of the number of Trustees prior to such removal; (c) any Trustee who requests to be retired or who has become incapacitated by illness or injury may be retired by written instrument signed by a majority of the other Trustees; and (d) any Trustee may be removed at any special meeting of shareholders by a two-thirds vote of the outstanding voting securities of the trust. Each Trustee who is not an interested person (as defined in the 1940 Act) (Independent Trustee), shall retire not later than the last day of the calendar year in which his or her 75th birthday occurs. The Independent Trustees may waive this mandatory retirement age policy with respect to individual Trustees. The executive officers and Advisory Board Members hold office without limit in time, except that any officer and Advisory Board Member may resign or may be removed by a vote of a majority of the Trustees at any regular meeting or any special meeting of the Trustees. Except as indicated, each individual has held the office shown or other offices in the same company for the past five years.
Experience, Skills, Attributes, and Qualifications of the Funds' Trustees. The Governance and Nominating Committee has adopted a statement of policy that describes the experience, qualifications, attributes, and skills that are necessary and desirable for potential Independent Trustee candidates (Statement of Policy). The Board believes that each Trustee satisfied at the time he or she was initially elected or appointed a Trustee, and continues to satisfy, the standards contemplated by the Statement of Policy. The Governance and Nominating Committee also engages professional search firms to help identify potential Independent Trustee candidates who have the experience, qualifications, attributes, and skills consistent with the Statement of Policy. From time to time, additional criteria based on the composition and skills of the current Independent Trustees, as well as experience or skills that may be appropriate in light of future changes to board composition, business conditions, and regulatory or other developments, have also been considered by the professional search firms and the Governance and Nominating Committee. In addition, the Board takes into account the Trustees' commitment and participation in Board and committee meetings, as well as their leadership of standing and ad hoc committees throughout their tenure.
In determining that a particular Trustee was and continues to be qualified to serve as a Trustee, the Board has considered a variety of criteria, none of which, in isolation, was controlling. The Board believes that, collectively, the Trustees have balanced and diverse experience, qualifications, attributes, and skills, which allow the Board to operate effectively in governing each fund and protecting the interests of shareholders. Information about the specific experience, skills, attributes, and qualifications of each Trustee, which in each case led to the Board's conclusion that the Trustee should serve (or continue to serve) as a trustee of the funds, is provided below.
Annual Report
Trustees and Officers - continued
Board Structure and Oversight Function. James C. Curvey is an interested person (as defined in the 1940 Act) and currently serves as Acting Chairman. The Trustees have determined that an interested Chairman is appropriate and benefits shareholders because an interested Chairman has a personal and professional stake in the quality and continuity of services provided to the funds. Independent Trustees exercise their informed business judgment to appoint an individual of their choosing to serve as Chairman, regardless of whether the Trustee happens to be independent or a member of management. The Independent Trustees have determined that they can act independently and effectively without having an Independent Trustee serve as Chairman and that a key structural component for assuring that they are in a position to do so is for the Independent Trustees to constitute a substantial majority for the Board. The Independent Trustees also regularly meet in executive session. Ned C. Lautenbach serves as Chairman of the Independent Trustees and as such (i) acts as a liaison between the Independent Trustees and management with respect to matters important to the Independent Trustees and (ii) with management prepares agendas for Board meetings.
Fidelity funds are overseen by different Boards of Trustees. The funds' Board oversees Fidelity's equity and high income funds and another Board oversees Fidelity's investment-grade bond, money market, and asset allocation funds. The asset allocation funds may invest in Fidelity funds overseen by the funds' Board. The use of separate Boards, each with its own committee structure, allows the Trustees of each group of Fidelity funds to focus on the unique issues of the funds they oversee, including common research, investment, and operational issues. On occasion, the separate Boards establish joint committees to address issues of overlapping consequences for the Fidelity funds overseen by each Board.
The Trustees operate using a system of committees to facilitate the timely and efficient consideration of all matters of importance to the Trustees, each fund, and fund shareholders and to facilitate compliance with legal and regulatory requirements and oversight of the funds' activities and associated risks. The Board, acting through its committees, has charged FMR and its affiliates with (i) identifying events or circumstances the occurrence of which could have demonstrably adverse effects on the funds' business and/or reputation; (ii) implementing processes and controls to lessen the possibility that such events or circumstances occur or to mitigate the effects of such events or circumstances if they do occur; and (iii) creating and maintaining a system designed to evaluate continuously business and market conditions in order to facilitate the identification and implementation processes described in (i) and (ii) above. Because the day-to-day operations and activities of the funds are carried out by or through FMR, its affiliates and other service providers, the funds' exposure to risks is mitigated but not eliminated by the processes overseen by the Trustees. While each of the Board's committees has responsibility for overseeing different aspects of the funds' activities, oversight is exercised primarily through the Operations, Audit, and Compliance Committees. In addition, the Independent Trustees have worked with FMR to enhance the Board's oversight of investment and financial risks, legal and regulatory risks, technology risks, and operational risks, including the development of additional risk reporting to the Board. For example, a working group comprised of Independent Trustees and FMR has worked and continues to work to review the Fidelity funds' valuation-related activities, reporting and risk management. Appropriate personnel, including but not limited to the funds' Chief Compliance Officer (CCO), FMR's internal auditor, the independent accountants, the funds' Treasurer and portfolio management personnel, make periodic reports to the Board's committees, as appropriate, including an annual review of FMR's risk management program for the Fidelity funds. The responsibilities of each standing committee, including their oversight responsibilities, are described further under "Standing Committees of the Funds' Trustees."
Annual Report
The funds' Statement of Additional Information (SAI) includes more information about the Trustees. To request a copy, call Fidelity at 1-800-544-8544 for Series Class or 1-800-835-5092 for Class F.
Interested Trustees*:
Correspondence intended for each Trustee who is an interested person may be sent to Fidelity Investments, 82 Devonshire Street, Boston, Massachusetts 02109.
Name, Age; Principal Occupations and Other Relevant Experience+ | |
James C. Curvey (76) | |
| Year of Election or Appointment: 2007 Mr. Curvey is Trustee and Acting Chairman of the Board of Trustees of certain Trusts. Mr. Curvey also serves as Trustee (2007-present) of other investment companies advised by FMR. Mr. Curvey is a Director of Fidelity Investments Money Management, Inc. (2009-present), Director of Fidelity Research & Analysis Co. (2009-present) and Director of FMR and FMR Co., Inc. (2007-present). Mr. Curvey is also Vice Chairman (2007-present) and Director of FMR LLC. In addition, Mr. Curvey serves as an Overseer for the Boston Symphony Orchestra and a member of the Trustees of Villanova University. Previously, Mr. Curvey was the Vice Chairman (2006-2007) and Director (2000-2007) of FMR Corp. |
Ronald P. O'Hanley (54) | |
| Year of Election or Appointment: 2011 Mr. O'Hanley is Director of FMR Co., Inc. (2010-present), Director of Fidelity Investments Money Management, Inc. (2010-present), Director of Fidelity Research & Analysis Company (2010-present), President of Fidelity Asset Management and Corporate Services and a member of Fidelity's Executive Committee (2010-present). Previously, Mr. O'Hanley served as President and Chief Executive Officer of BNY Mellon Asset Management (2007-2010). Mr. O'Hanley also served as Vice Chairman of Bank New York Mellon Corp. and a member of that firm's Executive Committee. Prior to the 2007 merger of The Bank of New York and Mellon Financial Corporation, he was Vice Chairman of Mellon Financial Corporation and President and Chief Executive Officer of Mellon Asset Management. He joined Mellon in February 1997. Mr. O'Hanley currently serves as Chairman of the Boston Public Library Foundation Board of Directors and sits on the Board of Directors of Beth Israel Deaconess Medical Center, the Board of Trustees of the Marine Biological Laboratory and the Advisory Board of the Maxwell School of Citizenship and Public Administration at Syracuse University. Mr. O'Hanley also chairs the Council on Asset Management for the Financial Services Roundtable and is a member of the Board of Directors of Institutional Investor's U.S. Institute. |
* Trustees have been determined to be "Interested Trustees" by virtue of, among other things, their affiliation with the trust or various entities under common control with FMR.
+ The information above includes each Trustee's principal occupation during the last five years and other information relating to the experience, attributes, and skills relevant to each Trustee's qualifications to serve as a Trustee, which led to the conclusion that each Trustee should serve as a Trustee for each fund.
Annual Report
Independent Trustees:
Correspondence intended for each Independent Trustee (that is, the Trustees other than the Interested Trustees) may be sent to Fidelity Investments, P.O. Box 55235, Boston, Massachusetts 02205-5235.
Name, Age; Principal Occupations and Other Relevant Experience+ | |
Dennis J. Dirks (63) | |
| Year of Election or Appointment: 2005 Prior to his retirement in May 2003, Mr. Dirks was Chief Operating Officer and a member of the Board of The Depository Trust & Clearing Corporation (DTCC). He also served as President, Chief Operating Officer, and Board member of The Depository Trust Company (DTC) and President and Board member of the National Securities Clearing Corporation (NSCC). In addition, Mr. Dirks served as Chief Executive Officer and Board member of the Government Securities Clearing Corporation, Chief Executive Officer and Board member of the Mortgage-Backed Securities Clearing Corporation, as a Trustee and a member of the Finance Committee of Manhattan College (2005-2008), and as a Trustee and a member of the Finance Committee of AHRC of Nassau County (2006-2008). Mr. Dirks is a member of the Independent Directors Council (IDC) Governing Council (2010-present) and Board of Directors for The Brookville Center for Children's Services, Inc. (2009-present). |
Alan J. Lacy (58) | |
| Year of Election or Appointment: 2008 Mr. Lacy serves as Senior Adviser (2007-present) of Oak Hill Capital Partners, L.P. (private equity). Mr. Lacy also served as Chief Executive Officer (2000-2005) and Vice Chairman (2005-2006) of Sears Holdings Corporation and Sears, Roebuck and Co. (retail). In addition, Mr. Lacy serves as a member of the Board of Directors of Dave & Buster's, Inc. (restaurant and entertainment complexes, 2010-present), The Hillman Companies, Inc. (hardware wholesalers, 2010-present), and Bristol-Myers Squibb Company (global pharmaceuticals, 2007-present). Mr. Lacy is a member of the Board of Trustees of The National Parks Conservation Association (2006-present). Previously, Mr. Lacy served as Chairman of the Board of Trustees of the National Parks Conservation Association (2008-2011) and as a member of the Board of Directors for the Western Union Company (global money transfer, 2006-2011). |
Ned C. Lautenbach (67) | |
| Year of Election or Appointment: 2000 Mr. Lautenbach is Chairman of the Independent Trustees of the Equity and High Income Funds (2006-present). Mr. Lautenbach currently serves as the Lead Director of the Eaton Corporation Board of Directors (diversified industrial, 1997-present). Mr. Lautenbach is also a member of the Board of Directors of the Philharmonic Center for the Arts in Naples, Florida (1999-present); a member of the Board of Trustees of Fairfield University (2005-present); and a member of the Council on Foreign Relations (1994-present). Previously, Mr. Lautenbach was a Partner/Advisory Partner at Clayton, Dubilier & Rice, LLC (private equity investment, 1998-2010), as well as a Director of Sony Corporation (2006-2007). |
Joseph Mauriello (67) | |
| Year of Election or Appointment: 2008 Prior to his retirement in January 2006, Mr. Mauriello served in numerous senior management positions including Deputy Chairman and Chief Operating Officer (2004-2005), and Vice Chairman of Financial Services (2002-2004) of KPMG LLP US (professional services, 1965-2005). Mr. Mauriello currently serves as a member of the Board of Directors of XL Group plc. (global insurance and re-insurance, 2006-present) and of Arcadia Resources Inc. (health care services and products, 2007-present). Previously, Mr. Mauriello served as a Director of the Hamilton Funds of the Bank of New York (2006-2007). |
Robert W. Selander (61) | |
| Year of Election or Appointment: 2011 Previously, Mr. Selander served as a Member of the Advisory Board of Fidelity's Equity and High Income Funds (2011), Executive Vice Chairman (2010), Chief Executive Officer (2009-2010), and President and Chief Executive Officer (1997-2009) of Mastercard, Inc. |
Cornelia M. Small (67) | |
| Year of Election or Appointment: 2005 Ms. Small is a member of the Board of Directors of the Teagle Foundation (2009-present). Ms. Small is also a member of the Investment Committee, and Chair (2008-present) and a member of the Board of Trustees of Smith College. In addition, Ms. Small serves on the Investment Committee of the Berkshire Taconic Community Foundation (2008-present). Previously, Ms. Small served as Chairperson of the Investment Committee (2002-2008) of Smith College. In addition, Ms. Small served as Chief Investment Officer, Director of Global Equity Investments, and a member of the Board of Directors of Scudder, Stevens & Clark and Scudder Kemper Investments. |
William S. Stavropoulos (72) | |
| Year of Election or Appointment: 2001 Mr. Stavropoulos is Vice Chairman of the Independent Trustees of the Equity and High Income Funds (2006-present). Mr. Stavropoulos serves as President and Founder of the Michigan Baseball Foundation, the Great Lakes Loons (2007-present). Mr. Stavropoulos is Chairman Emeritus of the Board of Directors of The Dow Chemical Company, where he previously served in numerous senior management positions, including President, CEO (1995-2000; 2002-2004), Chairman of the Executive Committee (2000-2006), and as a member of the Board of Directors (1990-2006). Currently, Mr. Stavropoulos is Chairman of Univar (global distributor of commodity and specialty chemicals, 2010-present), a Director of Teradata Corporation (data warehousing and technology solutions, 2008-present), Chemical Financial Corporation, Maersk Inc. (industrial conglomerate), Tyco International, Inc. (multinational manufacturing and services, 2007-present), and a member of the Advisory Board for Metalmark Capital (private equity investment, 2005-present). Mr. Stavropoulos is a special advisor to Clayton, Dubilier & Rice, LLC (private equity investment). In addition, Mr. Stavropoulos is a member of the University of Notre Dame Advisory Council for the College of Science. |
David M. Thomas (62) | |
| Year of Election or Appointment: 2008 Previously, Mr. Thomas served as Executive Chairman (2005-2006) and Chairman and Chief Executive Officer (2000-2005) of IMS Health, Inc. (pharmaceutical and healthcare information solutions). In addition, Mr. Thomas serves as a member of the Board of Directors of Fortune Brands, Inc. (consumer products), and Interpublic Group of Companies, Inc. (marketing communication, 2004-present). |
Michael E. Wiley (61) | |
| Year of Election or Appointment: 2008 Mr. Wiley also serves as a Director of Asia Pacific Exploration Consolidated (international oil and gas exploration and production, 2008-present). Mr. Wiley serves as a Director of Tesoro Corporation (independent oil refiner and marketer, 2005-present), and a Director of Bill Barrett Corporation (exploration and production, 2005-present). In addition, Mr. Wiley also serves as a Director of Post Oak Bank (privately-held bank, 2004-present). Previously, Mr. Wiley served as a member of the Board of Trustees of the University of Tulsa (2000-2006; 2007-2010), as a Senior Energy Advisor of Katzenbach Partners, LLC (consulting, 2006-2007), as an Advisory Director of Riverstone Holdings (private investment), Chairman, President, and CEO of Baker Hughes, Inc. (oilfield services, 2000-2004), and as Director of Spinnaker Exploration Company (exploration and production, 2001-2005). |
Annual Report
Trustees and Officers - continued
+ The information above includes each Trustee's principal occupation during the last five years and other information relating to the experience, attributes, and skills relevant to each Trustee's qualifications to serve as a Trustee, which led to the conclusion that each Trustee should serve as a Trustee for each fund.
Advisory Board Members and Executive Officers:
Correspondence intended for each executive officer, Edward C. Johnson 3d, and Peter S. Lynch may be sent to Fidelity Investments, 82 Devonshire Street, Boston, Massachusetts 02109.
Name, Age; Principal Occupation | |
Edward C. Johnson 3d (81) | |
| Year of Election or Appointment: 2011 Member of the Advisory Board of Fidelity's Equity and High Income Funds. Mr. Johnson serves as Chief Executive Officer, Chairman, and a Director of FMR LLC, and also serves as Chairman and Director of FIL Limited. Previously, Mr. Johnson served as a Trustee and Chairman of the Board of certain Fidelity Trusts, Chairman and a Director of FMR, Chairman and a Director of FMR Co., Inc., and President of FMR LLC (2006-2007). |
Peter S. Lynch (68) | |
| Year of Election or Appointment: 2003 Member of the Advisory Board of Fidelity's Equity and High Income Funds. Mr. Lynch is Vice Chairman and a Director of FMR and FMR Co., Inc. In addition, Mr. Lynch serves as a Trustee of Boston College and as the Chairman of the Inner-City Scholarship Fund. Previously, Mr. Lynch served on the Special Olympics International Board of Directors (1997-2006). |
Kenneth B. Robins (42) | |
| Year of Election or Appointment: 2008 President and Treasurer of Fidelity's Equity and High Income Funds. Mr. Robins also serves as President and Treasurer (2010-present) and Assistant Treasurer (2009-present) of other Fidelity funds and is an employee of Fidelity Investments (2004-present). Previously, Mr. Robins served as Deputy Treasurer of the Fidelity funds (2005-2008) and Treasurer and Chief Financial Officer of The North Carolina Capital Management Trust: Cash and Term Portfolios (2006-2008). |
Bruce T. Herring (46) | |
| Year of Election or Appointment: 2006 Vice President of certain Equity Funds. Mr. Herring also serves as President of Fidelity Research & Analysis Company (2010-present), Chief Investment Officer and Director of Fidelity Management & Research (U.K.) Inc. (2010-present) and Group Chief Investment Officer of FMR. Previously, Mr. Herring served as Vice President (2005-2006) and Senior Vice President (2006-2007) of Fidelity Management & Research Company, Vice President of FMR Co., Inc. (2001-2007) and as a portfolio manager for Fidelity U.S. Equity Funds.] |
Brian B. Hogan (47) | |
| Year of Election or Appointment: 2009 Vice President of Equity and High Income Funds. Mr. Hogan also serves as President of FMR's Equity Division (2009-present). Previously, Mr. Hogan served as Senior Vice President, Equity Research of FMR (2006-2009) and as a portfolio manager. |
Thomas C. Hense (48) | |
| Year of Election or Appointment: 2008 or 2010 Vice President of Fidelity's High Income (2008), Small Cap (2008), and Value (2010) Funds. Previously, Mr. Hense served as a portfolio manager for Fidelity's Institutional Money Management Group (Pyramis) (2003-2008). |
Scott C. Goebel (44) | |
| Year of Election or Appointment: 2008 Secretary and Chief Legal Officer (CLO) of the Fidelity funds. Mr. Goebel also serves as Secretary of Fidelity Investments Money Management, Inc. (FIMM) (2010-present) and Fidelity Research and Analysis Company (FRAC) (2010-present); Secretary and CLO of The North Carolina Capital Management Trust: Cash and Term Portfolios (2008-present); General Counsel, Secretary, and Senior Vice President of FMR (2008-present) and FMR Co., Inc. (2008-present); employed by FMR LLC or an affiliate (2001-present); Chief Legal Officer of Fidelity Management & Research (Hong Kong) Limited (2008-present) and Assistant Secretary of Fidelity Management & Research (Japan) Inc. (2008-present), and Fidelity Management & Research (U.K.) Inc. (2008-present). Previously, Mr. Goebel served as Assistant Secretary of FIMM (2008-2010), FRAC (2008-2010), and the Funds (2007-2008) and as Vice President and Secretary of Fidelity Distributors Corporation (FDC) (2005-2007). |
William C. Coffey (42) | |
| Year of Election or Appointment: 2009 Assistant Secretary of Fidelity's Equity and High Income Funds. Mr. Coffey also serves as Senior Vice President and Deputy General Counsel of FMR LLC (2010-present), and is an employee of Fidelity Investments. Previously, Mr. Coffey served as Vice President and Associate General Counsel of FMR LLC (2005-2009). |
Holly C. Laurent (57) | |
| Year of Election or Appointment: 2008 Anti-Money Laundering (AML) Officer of the Fidelity funds. Ms. Laurent also serves as AML Officer of The North Carolina Capital Management Trust: Cash and Term Portfolios (2008-present) and is an employee of Fidelity Investments. Previously, Ms. Laurent was Senior Vice President and Head of Legal for Fidelity Business Services India Pvt. Ltd. (2006-2008), and Senior Vice President, Deputy General Counsel and Group Head for FMR LLC (2005-2006). |
Christine Reynolds (53) | |
| Year of Election or Appointment: 2008 Chief Financial Officer of the Fidelity funds. Ms. Reynolds became President of Fidelity Pricing and Cash Management Services (FPCMS) in August 2008. Ms. Reynolds served as Chief Operating Officer of FPCMS (2007-2008). Previously, Ms. Reynolds served as President, Treasurer, and Anti-Money Laundering officer of the Fidelity funds (2004-2007). |
Kenneth A. Rathgeber (64) | |
| Year of Election or Appointment: 2004 Chief Compliance Officer of Fidelity's Equity and High Income Funds. Mr. Rathgeber is Chief Compliance Officer of Fidelity Management & Research (Hong Kong) Limited (2008-present), Fidelity Management & Research (Japan) Inc. (2008-present), FMR (2005-present), FMR Co., Inc. (2005-present), Fidelity Management & Research (U.K.) Inc. (2005-present), Fidelity Research & Analysis Company (2005-present), Fidelity Investments Money Management, Inc. (2005-present), Pyramis Global Advisors, LLC (2005-present), and Strategic Advisers, Inc. (2005-present). |
Joseph F. Zambello (54) | |
| Year of Election or Appointment: 2011 Deputy Treasurer of the Fidelity funds. Mr. Zambello is an employee of Fidelity Investments. Previously, Mr. Zambello served as Vice President of FMR's Program Management Group (2009-2011) and Vice President of the Transfer Agent Oversight Group (2005-2009). |
Adrien E. Deberghes (44) | |
| Year of Election or Appointment: 2008 Deputy Treasurer of Fidelity's Equity and High Income Funds. Mr. Deberghes also serves as Vice President and Assistant Treasurer of Fidelity Rutland Square Trust II and Fidelity Commonwealth Trust II (2011-present), Assistant Treasurer of other Fidelity funds (2010-present), and is an employee of Fidelity Investments (2008-present). Previously, Mr. Deberghes served as Senior Vice President of Mutual Fund Administration at State Street Corporation (2007-2008), Senior Director of Mutual Fund Administration at Investors Bank & Trust (2005-2007), and Director of Finance for Dunkin' Brands (2000-2005). |
Stephanie J. Dorsey (42) | |
| Year of Election or Appointment: 2010 Assistant Treasurer of Fidelity's Equity and High Income Funds. Ms. Dorsey also serves as Deputy Treasurer of other Fidelity funds (2008-present) and is an employee of Fidelity Investments (2008-present). Previously, Ms. Dorsey served as Treasurer (2004-2008) of the JPMorgan Mutual Funds and Vice President (2004-2008) of JPMorgan Chase Bank. |
John R. Hebble (53) | |
| Year of Election or Appointment: 2009 Assistant Treasurer of Fidelity's Equity and High Income Funds. Mr. Hebble also serves as President (2011-present), Treasurer, and Chief Financial Officer of The North Carolina Capital Management Trust: Cash and Term Portfolios (2008-present), President and Treasurer of other Fidelity funds (2008-present) and is an employee of Fidelity Investments. |
Gary W. Ryan (53) | |
| Year of Election or Appointment: 2005 Assistant Treasurer of the Fidelity funds. Mr. Ryan is an employee of Fidelity Investments. Previously, Mr. Ryan served as Vice President of Fund Reporting in Fidelity Pricing and Cash Management Services (FPCMS) (1999-2005). |
Jonathan Davis (43) | |
| Year of Election or Appointment: 2010 Assistant Treasurer of the Fidelity funds. Mr. Davis is also Assistant Treasurer of Fidelity Rutland Square Trust II and Fidelity Commonwealth Trust II. Mr. Davis is an employee of Fidelity Investments. Previously, Mr. Davis served as Vice President and Associate General Counsel of FMR LLC (2003-2010). |
Annual Report
Distributions (Unaudited)
The funds hereby designate as a capital gain dividend the amounts noted below for the taxable year ended January 31st 2012 or, if subsequently determined to be different, the net capital gain of such year.
Fidelity Series Large Cap Value Fund | $ 494,838,606 |
Fidelity Series All-Sector Equity Fund | $ 628,230,351 |
A percentage of the dividends distributed during the fiscal year for the following funds qualifies for the dividends-received deduction for corporate shareholders:
Fidelity Series Large Cap Value Fund | March | December |
Series Large Cap Value | 2% | 100% |
Class F | 2% | 100% |
Fidelity Series All-Sector Equity Fund |
|
|
Series All-Sector Equity | 10% | 100% |
Class F | 10% | 100% |
A percentage of the dividends distributed during the fiscal year for the following funds may be taken into account as a dividend for purposes of the maximum rate under section 1(h) (11) of the Internal Revenue Code:
Fidelity Series Large Cap Value Fund | March | December |
Series Large Cap Value | 3% | 100% |
Class F | 3% | 100% |
Fidelity Series All-Sector Equity Fund |
|
|
Series All-Sector Equity | 12% | 100% |
Class F | 12% | 100% |
The fund will notify shareholders in January 2013 of amounts for use in preparing 2012 income tax returns.
Annual Report
Managing Your Investments
Fidelity offers several ways to conveniently manage your workplace benefits (including your workplace savings plan, investments, and additional services) via your telephone or PC. You can access your plan and account information and research your investments 24 hours a day.
By Phone
Fidelity provides a single toll-free number to access plan information, account balances, positions, and quotes*. It's easy to navigate the service, and on your first call, the system will help you create a personal identification number (PIN) for security.
(phone graphic)Fidelity Workplace
Investing
1-800-835-5092
By PC
Fidelity's web site on the Internet provides a wide range of information, including plan information, daily financial news, fund performance, interactive planning tools, and news about Fidelity products and services.
(computer graphic)Fidelity's Web Site
www.401k.com
* When you call the quotes line, please remember that a fund's yield and return will vary and, except for money market funds, share price will also vary. This means that you may have a gain or loss when you sell your shares. There is no assurance that money market funds will be able to maintain a stable $1 share price; an investment in a money market fund is not insured or guaranteed by the U.S. government. Total returns are historical and include changes in share price, reinvestment of dividends and capital gains distributions, and the effects of any sales charges.
Annual Report
To Write Fidelity
We'll give your correspondence immediate attention and send you written confirmation upon completion of your request.
(envelope graphic)For Non-Retirement
Accounts
Buying shares
Fidelity Investments
P.O. Box 770001
Cincinnati, OH 45277-0003
Overnight Express
Fidelity Investments
Attn: Distribution Services
100 Crosby Parkway - KC1H
Covington, KY 41015
Selling shares
Fidelity Investments
P.O. Box 770001
Cincinnati, OH 45277-0035
Overnight Express
Fidelity Investments
Attn: Distribution Services
100 Crosby Parkway - KC1H
Covington, KY 41015
General Correspondence
Fidelity Investments
P.O. Box 500
Merrimack, NH 03054-0500
(envelope graphic)For Retirement
Accounts
Buying shares
Fidelity Investments
P.O. Box 770001
Cincinnati, OH 45277-0003
Selling shares
Fidelity Investments
P.O. Box 770001
Cincinnati, OH 45277-0035
Overnight Express
Fidelity Investments
Attn: Distribution Services
100 Crosby Parkway - KC1H
Covington, KY 41015
General Correspondence
Fidelity Investments
P.O. Box 500
Merrimack, NH 03054-0500
Annual Report
Investment Adviser
Fidelity Management & Research Company
Boston, MA
Investment Sub-Advisers
FMR Co., Inc.
Fidelity Management & Research (U.K.) Inc.
Fidelity Management & Research (Hong Kong) Limited
Fidelity Management & Research (Japan) Inc.
General Distributor
Fidelity Distributors Corporation
Boston, MA
Transfer and Service Agents
Fidelity Investments Institutional Operations Company, Inc.
Boston, MA
Fidelity Service Company, Inc.
Boston, MA
Custodian
JPMorgan Chase Bank
New York, NY
Fidelity Series Large Cap Value Fund
The Northern Trust Company
Chicago, IL
Fidelity Series All-Sector Equity Fund
DLF-ANN-0312
1.873097.103
(Fidelity Investment logo)(registered trademark)
Corporate Headquarters
82 Devonshire St., Boston, MA 02109
www.fidelity.com
Fidelity®
Stock Selector Large Cap Value
Fund
(formerly Fidelity Large Cap Value Fund)
Annual Report
January 31, 2012
(Fidelity Cover Art)
Contents
Chairman's Message | The Chairman's message to shareholders. | |
Performance | How the fund has done over time. | |
Management's Discussion of Fund Performance | The Portfolio Manager's review of fund performance and strategy. | |
Shareholder Expense Example | An example of shareholder expenses. | |
Investment Changes | A summary of major shifts in the fund's investments over the past six months. | |
Investments | A complete list of the fund's investments with their market values. | |
Financial Statements | Statements of assets and liabilities, operations, and changes in net assets, as well as financial highlights. | |
Notes | Notes to the financial statements. | |
Report of Independent Registered Public Accounting Firm |
| |
Trustees and Officers |
| |
Distributions |
|
To view a fund's proxy voting guidelines and proxy voting record for the 12-month period ended June 30, visit http://www.fidelity.com/proxyvotingresults or visit the Securities and Exchange Commission's (SEC) web site at http://www.sec.gov. You may also call 1-800-544-8544 to request a free copy of the proxy voting guidelines.
Standard & Poor's, S&P and S&P 500 are registered service marks of The McGraw-Hill Companies, Inc. and have been licensed for use by Fidelity Distributors Corporation.
Other third party marks appearing herein are the property of their respective owners.
All other marks appearing herein are registered or unregistered trademarks or service marks of FMR LLC or an affiliated company.
Annual Report
This report and the financial statements contained herein are submitted for the general information of the shareholders of the fund. This report is not authorized for distribution to prospective investors in the fund unless preceded or accompanied by an effective prospectus.
A fund files its complete schedule of portfolio holdings with the SEC for the first and third quarters of each fiscal year on Form N-Q. Forms N-Q are available on the SEC's web site at http://www.sec.gov. A fund's Forms N-Q may be reviewed and copied at the SEC's Public Reference Room in Washington, DC. Information regarding the operation of the SEC's Public Reference Room may be obtained by calling 1-800-SEC-0330. For a complete list of a fund's portfolio holdings, view the most recent holdings listing, semiannual report, or annual report on Fidelity's web site at http://www.fidelity.com, http://www.advisor.fidelity.com, or http://www.401k.com, as applicable.
NOT FDIC INSURED • MAY LOSE VALUE • NO BANK GUARANTEE
Neither the fund nor Fidelity Distributors Corporation is a bank.
Annual Report
Chairman's Message
(photo_of_James_C_Curvey)
Dear Shareholder:
Following a year marked by unusually high volatility, 2012 began with most major asset classes advancing steadily in January. For U.S. equities, it was the strongest start to a new year since 1997. International stocks fared even better, despite continued uncertainty related to the sovereign debt crisis in Europe. Investors have been acutely sensitive to the latest news, for better or worse, coming out of the eurozone and its impact on financial markets. As we look ahead, the unresolved debt crisis in Europe remains at the center of a series of risk factors, summarized below, that we believe have the greatest potential to influence the global investment landscape.
Deleveraging and the economy
In the euro-currency area, fiscal austerity among nations and debt deleveraging among financial companies loaded with sovereign debt are deflationary measures and serve to hinder economic growth in the short term. Such an economic and financial-market scenario has not been historically supportive of strong performance among riskier assets, and emerges at a time when many nations need a resurgent economy to assist them in closing their budget deficits and in building confidence among bond buyers to help them refinance their existing debt obligations.
Slowdown in China and Europe
China's economy is the second-largest in the world, and it has been the biggest contributor to global growth since the end of the last recession. Thus, the slower pace of domestic growth in China has led to lower demand for imports of commodities and other construction materials from the rest of the world. In addition, economic weakness in Europe and the broad-based global economic slowdown are putting pressure on China's export growth, which has been largely responsible for its breakneck pace of annual gross domestic product (GDP) growth during the past three decades.
Credit deterioration and contagion
The heightened macroeconomic risk and elevated credit risk swirling around certain European nations and financial institutions have caused many market participants to avoid purchases of or reduce exposure to short-term debt offerings by these issuers. With increased credit risk, there are growing concerns about the potential credit contraction and contagion from European issuers spreading to other financial markets.
We invite you to learn more by visiting us on the Internet or calling us by phone. It is our privilege to provide the resources you need to choose investments that are right for you.
Sincerely,
(The acting chairman's signature appears here.)
James C. Curvey
Acting Chairman
Annual Report
Performance: The Bottom Line
Average annual total return reflects the change in the value of an investment, assuming reinvestment of the class' distributions from dividend income and capital gains (the profits earned upon the sale of securities that have grown in value, if any) and assuming a constant rate of performance each year. The $10,000 table and the fund's returns do not reflect the deduction of taxes that a shareholder would pay on fund distributions or the redemption of fund shares. During periods of reimbursement by Fidelity, a fund's total return will be greater than it would be had the reimbursement not occurred. How a fund did yesterday is no guarantee of how it will do tomorrow.
Average Annual Total Returns
Periods ended January 31, 2012 |
| Past 1 | Past 5 | Past 10 |
Fidelity® Stock Selector Large Cap Value Fund |
| 1.85% | -4.06% | 2.92% |
$10,000 Over 10 Years
Let's say hypothetically that $10,000 was invested in Fidelity® Stock Selector Large Cap Value Fund, a class of the fund, on January 31, 2002. The chart shows how the value of your investment would have changed, and also shows how the Russell 1000® Value Index performed over the same period.
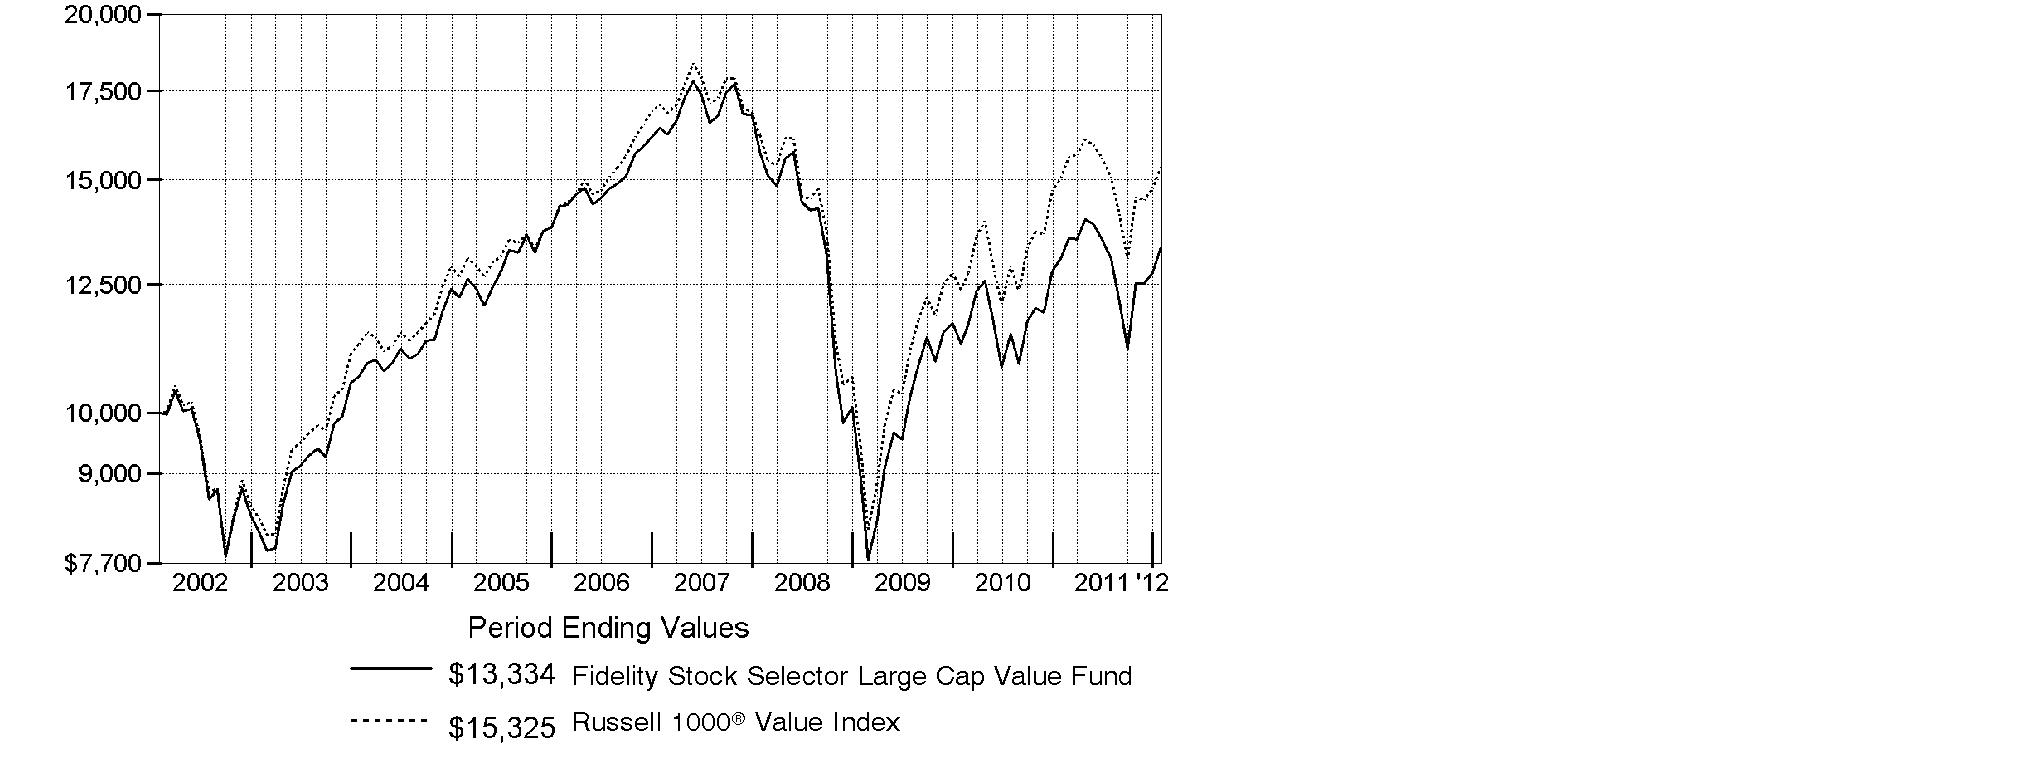
Annual Report
Management's Discussion of Fund Performance
Market Recap: After enduring one of the most volatile trading periods on record, U.S. stocks posted a gain for the 12 months ending January 31, 2012, sparked by a January rally. Strong corporate earnings reports and hints of economic recovery sent stocks mostly upward through April, when sovereign debt woes in Europe sparked fear of a global slowdown. In the summer, equities plummeted on eurozone instability, debate over the U.S. debt ceiling and a historic downgrade of the nation's sovereign debt rating. After falling as much as 13% by early August, the broad-based S&P 500® Index seesawed back to end the period on an optimistic note. For the full 12 months, the S&P 500® rose 4.22%, while the technology-laden Nasdaq Composite® Index added 5.26%. Investors began to shed perceived riskier smaller-cap stocks in favor of larger, more-established and dividend-paying names, helping to drive the Dow Jones® Industrial Average up 9.12% for the year, while the Russell 2000® - a proxy for small-caps - and Russell Midcap® indexes added 2.86% and 2.25%, respectively. Within the S&P 500®, defensive sectors such as health care (+16%) and utilities (+14%) fared best, while financials (-12%) struggled. Foreign developed-markets stocks were stung by Europe's turmoil, and the MSCI® EAFE® (Europe, Australasia, Far East) Index fell 9.49%.
Comments from Bruce Dirks, Lead Portfolio Manager of Fidelity® Stock Selector Large Cap Value Fund: For the year, the fund's Retail Class shares returned 1.85%, performing in line with the 1.88% gain of the Russell 1000® Value Index. During the period, the fund transitioned to a multi-manager structure and its name was subsequently changed. Strong security selection in financials, coupled with substantially underweighting diversified financials - which was by far the poorest-performing industry group - helped the fund's relative return, as did stock picks in energy. On the downside, stock choices in telecommunication services, health care and information technology notably hampered performance. Four of the five top individual contributors were underweightings in diversified financial services providers Bank of America, Citigroup, Goldman Sachs Group and JPMorgan Chase, whose stocks declined by double digits. I sold all four by period end. An out-of-benchmark stake in real estate investment company Kennedy-Wilson Holdings also aided results. Detractors included Puerto Rico-based regional bank Popular, offshore oil driller Transocean - also not in the benchmark - technology manufacturer Hewlett-Packard, wireless communications provider NII Holdings and hospital operator Community Health Systems. Not owning semiconductor maker and index component Intel also hurt. Transocean was not held at period end.
The views expressed above reflect those of the portfolio manager(s) only through the end of the period as stated on the cover of this report and do not necessarily represent the views of Fidelity or any other person in the Fidelity organization. Any such views are subject to change at any time based upon market or other conditions and Fidelity disclaims any responsibility to update such views. These views may not be relied on as investment advice and, because investment decisions for a Fidelity fund are based on numerous factors, may not be relied on as an indication of trading intent on behalf of any Fidelity fund.
Annual Report
Shareholder Expense Example
As a shareholder of the Fund, you incur two types of costs: (1) transaction costs, including sales charges (loads) on purchase payments or redemption proceeds, and (2) ongoing costs, including management fees, distribution and/or service (12b-1) fees and other Fund expenses. This Example is intended to help you understand your ongoing costs (in dollars) of investing in the Fund and to compare these costs with the ongoing costs of investing in other mutual funds.
The Example is based on an investment of $1,000 invested at the beginning of the period and held for the entire period (August 1, 2011 to January 31, 2012).
Actual Expenses
The first line of the accompanying table for each class of the Fund provides information about actual account values and actual expenses. You may use the information in this line, together with the amount you invested, to estimate the expenses that you paid over the period. Simply divide your account value by $1,000.00 (for example, an $8,600 account value divided by $1,000.00 = 8.6), then multiply the result by the number in the first line for a class of the Fund under the heading entitled "Expenses Paid During Period" to estimate the expenses you paid on your account during this period. A small balance maintenance fee of $12.00 that is charged once a year may apply for certain accounts with a value of less than $2,000. This fee is not included in the table below. If it was, the estimate of expenses you paid during the period would be higher, and your ending account value lower, by this amount. In addition, the Fund, as a shareholder in the underlying Fidelity Central Funds, will indirectly bear its pro-rata share of the fees and expenses incurred by the underlying Fidelity Central Funds. These fees and expenses are not included in the Fund's annualized expense ratio used to calculate the expense estimate in the table below.
Hypothetical Example for Comparison Purposes
The second line of the accompanying table for each class of the Fund provides information about hypothetical account values and hypothetical expenses based on a Class' actual expense ratio and an assumed rate of return of 5% per year before expenses, which is not the Class' actual return. The hypothetical account values and expenses may not be used to estimate the actual ending account balance or expenses you paid for the period. You may use this information to compare the ongoing costs of investing in the Fund and other funds. To do so, compare this 5% hypothetical example with the 5% hypothetical examples that appear in the shareholder reports of the other funds. A small balance maintenance fee of $12.00 that is charged once a year may apply for certain accounts with a value of less than $2,000. This fee is not included in the table below. If it was, the estimate of expenses you paid during the period would be higher, and your ending account value lower, by this amount. In addition, the Fund, as a shareholder in the underlying Fidelity Central Funds, will indirectly bear its pro-rata share of the fees and expenses incurred by the underlying Fidelity Central Funds. These fees and expenses are not included in the Fund's annualized expense ratio used to calculate the expense estimate in the table below.
Please note that the expenses shown in the table are meant to highlight your ongoing costs only and do not reflect any transaction costs. Therefore, the second line of the table is useful in comparing ongoing costs only, and will not help you determine the relative total costs of owning different funds. In addition, if these transactional costs were included, your costs would have been higher.
Annual Report
| Annualized | Beginning | Ending | Expenses Paid |
Class A | .85% |
|
|
|
Actual |
| $ 1,000.00 | $ 1,018.60 | $ 4.32 |
Hypothetical A |
| $ 1,000.00 | $ 1,020.92 | $ 4.33 |
Class T | 1.12% |
|
|
|
Actual |
| $ 1,000.00 | $ 1,016.40 | $ 5.69 |
Hypothetical A |
| $ 1,000.00 | $ 1,019.56 | $ 5.70 |
Class B | 1.60% |
|
|
|
Actual |
| $ 1,000.00 | $ 1,015.20 | $ 8.13 |
Hypothetical A |
| $ 1,000.00 | $ 1,017.14 | $ 8.13 |
Class C | 1.60% |
|
|
|
Actual |
| $ 1,000.00 | $ 1,014.20 | $ 8.12 |
Hypothetical A |
| $ 1,000.00 | $ 1,017.14 | $ 8.13 |
Stock Selector Large Cap Value | .56% |
|
|
|
Actual |
| $ 1,000.00 | $ 1,019.50 | $ 2.85 |
Hypothetical A |
| $ 1,000.00 | $ 1,022.38 | $ 2.85 |
Institutional Class | .57% |
|
|
|
Actual |
| $ 1,000.00 | $ 1,020.10 | $ 2.90 |
Hypothetical A |
| $ 1,000.00 | $ 1,022.33 | $ 2.91 |
A 5% return per year before expenses
* Expenses are equal to each Class' annualized expense ratio, multiplied by the average account value over the period, multiplied by 184/365 (to reflect the one-half year period).
Annual Report
Investment Changes (Unaudited)
Top Ten Stocks as of January 31, 2012 | ||
| % of fund's | % of fund's net assets |
Royal Dutch Shell PLC Class A sponsored ADR | 2.8 | 2.7 |
Pfizer, Inc. | 2.8 | 2.2 |
General Electric Co. | 2.8 | 2.5 |
Wells Fargo & Co. | 2.8 | 2.9 |
AT&T, Inc. | 2.7 | 2.7 |
Berkshire Hathaway, Inc. Class B | 2.7 | 2.8 |
Cisco Systems, Inc. | 2.3 | 2.3 |
Merck & Co., Inc. | 2.1 | 2.0 |
Kennedy-Wilson Holdings, Inc. | 2.1 | 1.2 |
Procter & Gamble Co. | 2.0 | 2.0 |
| 25.1 | |
Top Five Market Sectors as of January 31, 2012 | ||
| % of fund's | % of fund's net assets |
Financials | 25.0 | 26.1 |
Health Care | 12.4 | 11.9 |
Energy | 12.4 | 13.1 |
Industrials | 9.0 | 9.1 |
Information Technology | 8.9 | 8.7 |
Asset Allocation (% of fund's net assets) | |||||||
As of January 31, 2012* | As of July 31, 2011** | ||||||
| Stocks and |
| | Stocks 99.7% |
| ||
| Short-Term |
| | Short-Term |
| ||
* Foreign investments | 14.1% |
| ** Foreign investments | 16.1% |
| ||

Annual Report
Investments January 31, 2012
Showing Percentage of Net Assets
Common Stocks - 98.7% | |||
Shares | Value | ||
CONSUMER DISCRETIONARY - 8.6% | |||
Auto Components - 0.6% | |||
Autoliv, Inc. (d) | 51,900 | $ 3,274,371 | |
Hotels, Restaurants & Leisure - 0.8% | |||
Carnival Corp. unit | 46,800 | 1,413,360 | |
Penn National Gaming, Inc. (a) | 63,449 | 2,597,602 | |
| 4,010,962 | ||
Household Durables - 0.8% | |||
Jarden Corp. | 118,995 | 4,008,942 | |
Media - 3.3% | |||
Comcast Corp. Class A | 209,975 | 5,583,235 | |
The Walt Disney Co. | 190,400 | 7,406,560 | |
Time Warner, Inc. | 108,500 | 4,021,010 | |
| 17,010,805 | ||
Multiline Retail - 1.6% | |||
Macy's, Inc. | 96,400 | 3,247,716 | |
Target Corp. | 102,534 | 5,209,753 | |
| 8,457,469 | ||
Specialty Retail - 1.5% | |||
Best Buy Co., Inc. | 90,400 | 2,165,080 | |
Lowe's Companies, Inc. | 197,363 | 5,295,249 | |
| 7,460,329 | ||
TOTAL CONSUMER DISCRETIONARY | 44,222,878 | ||
CONSUMER STAPLES - 7.6% | |||
Beverages - 0.8% | |||
Coca-Cola Enterprises, Inc. | 82,770 | 2,217,408 | |
PepsiCo, Inc. | 27,680 | 1,817,746 | |
| 4,035,154 | ||
Food & Staples Retailing - 1.4% | |||
CVS Caremark Corp. | 65,490 | 2,734,208 | |
Kroger Co. | 105,430 | 2,505,017 | |
Walgreen Co. | 58,340 | 1,946,222 | |
| 7,185,447 | ||
Food Products - 3.1% | |||
Archer Daniels Midland Co. | 73,630 | 2,108,027 | |
ConAgra Foods, Inc. | 101,310 | 2,701,938 | |
Kraft Foods, Inc. Class A | 147,390 | 5,645,037 | |
Common Stocks - continued | |||
Shares | Value | ||
CONSUMER STAPLES - continued | |||
Food Products - continued | |||
Sara Lee Corp. | 125,940 | $ 2,411,751 | |
The J.M. Smucker Co. | 36,920 | 2,908,558 | |
| 15,775,311 | ||
Household Products - 2.0% | |||
Procter & Gamble Co. | 167,780 | 10,576,851 | |
Tobacco - 0.3% | |||
Lorillard, Inc. | 14,400 | 1,546,416 | |
TOTAL CONSUMER STAPLES | 39,119,179 | ||
ENERGY - 12.4% | |||
Energy Equipment & Services - 0.8% | |||
Halliburton Co. | 118,146 | 4,345,410 | |
Oil, Gas & Consumable Fuels - 11.6% | |||
Anadarko Petroleum Corp. | 64,920 | 5,240,342 | |
Apache Corp. | 37,692 | 3,726,985 | |
BP PLC sponsored ADR | 49,200 | 2,258,772 | |
Canadian Natural Resources Ltd. | 115,570 | 4,577,851 | |
Chevron Corp. | 49,500 | 5,102,460 | |
HollyFrontier Corp. | 56,600 | 1,660,644 | |
Marathon Petroleum Corp. | 90,000 | 3,439,800 | |
Noble Energy, Inc. | 41,580 | 4,185,859 | |
Occidental Petroleum Corp. | 92,378 | 9,216,553 | |
Royal Dutch Shell PLC Class A sponsored ADR | 204,576 | 14,598,541 | |
Suncor Energy, Inc. | 63,800 | 2,197,609 | |
Williams Companies, Inc. | 121,198 | 3,492,926 | |
| 59,698,342 | ||
TOTAL ENERGY | 64,043,752 | ||
FINANCIALS - 25.0% | |||
Capital Markets - 3.5% | |||
Bank of New York Mellon Corp. | 238,000 | 4,790,940 | |
Invesco Ltd. | 189,800 | 4,283,786 | |
Morgan Stanley | 175,800 | 3,278,670 | |
State Street Corp. | 138,500 | 5,426,430 | |
| 17,779,826 | ||
Commercial Banks - 8.0% | |||
CIT Group, Inc. (a) | 109,700 | 4,183,958 | |
Itau Unibanco Banco Multiplo SA sponsored ADR | 200,500 | 4,001,980 | |
Common Stocks - continued | |||
Shares | Value | ||
FINANCIALS - continued | |||
Commercial Banks - continued | |||
PNC Financial Services Group, Inc. | 105,400 | $ 6,210,168 | |
Popular, Inc. (a) | 1,362,500 | 2,139,125 | |
Regions Financial Corp. | 450,000 | 2,349,000 | |
U.S. Bancorp | 294,900 | 8,322,078 | |
Wells Fargo & Co. | 486,700 | 14,216,507 | |
| 41,422,816 | ||
Consumer Finance - 0.9% | |||
SLM Corp. | 302,800 | 4,526,860 | |
Insurance - 8.3% | |||
ACE Ltd. | 73,700 | 5,129,520 | |
AFLAC, Inc. | 96,950 | 4,675,899 | |
Allstate Corp. | 162,900 | 4,699,665 | |
Berkshire Hathaway, Inc. Class B (a) | 175,257 | 13,734,891 | |
MetLife, Inc. | 139,400 | 4,925,002 | |
StanCorp Financial Group, Inc. | 63,000 | 2,435,580 | |
Torchmark Corp. | 68,850 | 3,144,380 | |
XL Group PLC Class A | 199,200 | 4,037,784 | |
| 42,782,721 | ||
Real Estate Investment Trusts - 1.5% | |||
American Tower Corp. | 50,100 | 3,181,851 | |
Public Storage | 32,200 | 4,471,292 | |
| 7,653,143 | ||
Real Estate Management & Development - 2.1% | |||
Kennedy-Wilson Holdings, Inc. | 792,800 | 10,647,304 | |
Thrifts & Mortgage Finance - 0.7% | |||
People's United Financial, Inc. | 310,000 | 3,822,300 | |
TOTAL FINANCIALS | 128,634,970 | ||
HEALTH CARE - 12.4% | |||
Biotechnology - 1.1% | |||
Amgen, Inc. | 81,400 | 5,527,874 | |
Health Care Equipment & Supplies - 0.9% | |||
Baxter International, Inc. | 4,100 | 227,468 | |
Covidien PLC | 28,900 | 1,488,350 | |
Zimmer Holdings, Inc. | 47,800 | 2,903,850 | |
| 4,619,668 | ||
Common Stocks - continued | |||
Shares | Value | ||
HEALTH CARE - continued | |||
Health Care Providers & Services - 2.2% | |||
Aetna, Inc. | 14,600 | $ 638,020 | |
Cardinal Health, Inc. | 33,800 | 1,454,414 | |
Community Health Systems, Inc. (a) | 58,000 | 1,084,600 | |
Express Scripts, Inc. (a) | 9,000 | 460,440 | |
Quest Diagnostics, Inc. | 6,100 | 354,288 | |
UnitedHealth Group, Inc. | 101,200 | 5,241,148 | |
WellPoint, Inc. | 38,000 | 2,444,160 | |
| 11,677,070 | ||
Life Sciences Tools & Services - 0.6% | |||
Thermo Fisher Scientific, Inc. (a) | 56,442 | 2,985,782 | |
Pharmaceuticals - 7.6% | |||
Bristol-Myers Squibb Co. | 65,600 | 2,114,944 | |
Johnson & Johnson | 156,900 | 10,341,279 | |
Merck & Co., Inc. | 287,400 | 10,995,924 | |
Pfizer, Inc. | 674,900 | 14,442,860 | |
Sanofi-aventis sponsored ADR | 38,300 | 1,422,079 | |
| 39,317,086 | ||
TOTAL HEALTH CARE | 64,127,480 | ||
INDUSTRIALS - 9.0% | |||
Aerospace & Defense - 1.2% | |||
Meggitt PLC | 276,784 | 1,583,448 | |
Raytheon Co. | 95,800 | 4,597,442 | |
| 6,180,890 | ||
Airlines - 0.4% | |||
SkyWest, Inc. | 142,000 | 1,817,600 | |
Commercial Services & Supplies - 1.4% | |||
Corrections Corp. of America (a) | 110,700 | 2,604,771 | |
Republic Services, Inc. | 166,300 | 4,869,264 | |
| 7,474,035 | ||
Construction & Engineering - 0.8% | |||
Foster Wheeler AG (a) | 192,100 | 4,314,566 | |
Industrial Conglomerates - 2.8% | |||
General Electric Co. | 771,100 | 14,427,281 | |
Machinery - 0.4% | |||
Stanley Black & Decker, Inc. | 26,517 | 1,860,963 | |
Road & Rail - 2.0% | |||
Con-way, Inc. | 94,000 | 2,983,560 | |
Common Stocks - continued | |||
Shares | Value | ||
INDUSTRIALS - continued | |||
Road & Rail - continued | |||
Quality Distribution, Inc. (a) | 252,349 | $ 3,098,846 | |
Union Pacific Corp. | 39,000 | 4,458,090 | |
| 10,540,496 | ||
TOTAL INDUSTRIALS | 46,615,831 | ||
INFORMATION TECHNOLOGY - 8.9% | |||
Communications Equipment - 2.3% | |||
Cisco Systems, Inc. | 607,700 | 11,929,151 | |
Computers & Peripherals - 1.7% | |||
Hewlett-Packard Co. | 305,127 | 8,537,453 | |
Electronic Equipment & Components - 1.3% | |||
Corning, Inc. | 349,798 | 4,501,900 | |
Jabil Circuit, Inc. | 101,648 | 2,303,344 | |
| 6,805,244 | ||
Internet Software & Services - 0.6% | |||
eBay, Inc. (a) | 99,271 | 3,136,964 | |
Semiconductors & Semiconductor Equipment - 2.8% | |||
Freescale Semiconductor Holdings I Ltd. (d) | 174,459 | 2,786,110 | |
Intersil Corp. Class A | 292,238 | 3,290,600 | |
Marvell Technology Group Ltd. (a) | 364,264 | 5,657,020 | |
Micron Technology, Inc. (a) | 357,700 | 2,714,943 | |
| 14,448,673 | ||
Software - 0.2% | |||
CA, Inc. | 29,160 | 751,745 | |
TOTAL INFORMATION TECHNOLOGY | 45,609,230 | ||
MATERIALS - 2.9% | |||
Chemicals - 2.0% | |||
Air Products & Chemicals, Inc. | 23,350 | 2,055,501 | |
Ashland, Inc. | 63,000 | 3,972,780 | |
Celanese Corp. Class A | 25,050 | 1,220,186 | |
LyondellBasell Industries NV Class A | 66,520 | 2,867,012 | |
| 10,115,479 | ||
Containers & Packaging - 0.3% | |||
Rock-Tenn Co. Class A | 26,970 | 1,668,364 | |
Common Stocks - continued | |||
Shares | Value | ||
MATERIALS - continued | |||
Metals & Mining - 0.6% | |||
Anglo American PLC (United Kingdom) | 77,139 | $ 3,190,025 | |
TOTAL MATERIALS | 14,973,868 | ||
TELECOMMUNICATION SERVICES - 4.4% | |||
Diversified Telecommunication Services - 3.2% | |||
AT&T, Inc. | 471,500 | 13,866,815 | |
CenturyLink, Inc. | 78,314 | 2,899,967 | |
| 16,766,782 | ||
Wireless Telecommunication Services - 1.2% | |||
NII Holdings, Inc. (a) | 219,200 | 4,408,112 | |
Sprint Nextel Corp. (a) | 739,700 | 1,568,164 | |
| 5,976,276 | ||
TOTAL TELECOMMUNICATION SERVICES | 22,743,058 | ||
UTILITIES - 7.5% | |||
Electric Utilities - 3.6% | |||
Cleco Corp. | 39,800 | 1,582,448 | |
Duke Energy Corp. | 193,300 | 4,119,223 | |
FirstEnergy Corp. | 92,600 | 3,909,572 | |
NextEra Energy, Inc. | 80,810 | 4,836,479 | |
PPL Corp. | 142,800 | 3,968,412 | |
| 18,416,134 | ||
Gas Utilities - 0.0% | |||
ONEOK, Inc. | 1,820 | 151,351 | |
Independent Power Producers & Energy Traders - 0.7% | |||
Calpine Corp. (a) | 94,230 | 1,375,758 | |
The AES Corp. (a) | 186,890 | 2,384,716 | |
| 3,760,474 | ||
Multi-Utilities - 3.2% | |||
CMS Energy Corp. | 142,100 | 3,102,043 | |
National Grid PLC sponsored ADR (d) | 74,130 | 3,698,346 | |
Common Stocks - continued | |||
Shares | Value | ||
UTILITIES - continued | |||
Multi-Utilities - continued | |||
OGE Energy Corp. | 50,940 | $ 2,692,688 | |
Sempra Energy | 122,550 | 6,973,095 | |
| 16,466,172 | ||
TOTAL UTILITIES | 38,794,131 | ||
TOTAL COMMON STOCKS (Cost $522,045,385) |
| ||
Nonconvertible Preferred Stocks - 0.1% | |||
|
|
|
|
CONSUMER DISCRETIONARY - 0.1% | |||
Automobiles - 0.1% | |||
Volkswagen AG (Cost $847,577) | 4,300 |
| |
U.S. Treasury Obligations - 0.3% | ||||
| Principal Amount |
| ||
U.S. Treasury Bills, yield at date of purchase 0% to 0.01% 2/23/12 (e) | $ 1,350,000 |
| ||
Money Market Funds - 2.8% | |||
Shares |
| ||
Fidelity Cash Central Fund, 0.12% (b) | 8,051,708 | 8,051,708 | |
Fidelity Securities Lending Cash Central Fund, 0.12% (b)(c) | 6,580,950 | 6,580,950 | |
TOTAL MONEY MARKET FUNDS (Cost $14,632,658) |
| ||
TOTAL INVESTMENT PORTFOLIO - 101.9% (Cost $538,875,615) | 525,628,233 | ||
NET OTHER ASSETS (LIABILITIES) - (1.9)% | (9,857,674) | ||
NET ASSETS - 100% | $ 515,770,559 | ||
Futures Contracts | |||||
Expiration Date | Underlying Face Amount at Value | Unrealized Appreciation/ | |||
Purchased | |||||
Equity Index Contracts | |||||
57 CME E-mini S&P 500 Index Contracts | March 2012 | $ 3,728,370 | $ (3,313) | ||
5 NYFE Russell 2000 Mini Index Contracts | March 2012 | 395,600 | 5,890 | ||
TOTAL EQUITY INDEX CONTRACTS | $ 4,123,970 | $ 2,577 | |||
|
The face value of futures purchased as a percentage of net assets is 0.8% |
Legend |
(a) Non-income producing |
(b) Affiliated fund that is available only to investment companies and other accounts managed by Fidelity Investments. The rate quoted is the annualized seven-day yield of the fund at period end. A complete unaudited listing of the fund's holdings as of its most recent quarter end is available upon request. In addition, each Fidelity Central Fund's financial statements, which are not covered by the Fund's Report of Independent Registered Public Accounting Firm, are available on the SEC's website or upon request. |
(c) Investment made with cash collateral received from securities on loan. |
(d) Security or a portion of the security is on loan at period end. |
(e) Security or a portion of the security was pledged to cover margin requirements for futures contracts. At the period end, the value of securities pledged amounted to $299,992. |
Affiliated Central Funds |
Information regarding fiscal year to date income earned by the Fund from investments in Fidelity Central Funds is as follows: |
Fund | Income earned |
Fidelity Cash Central Fund | $ 8,291 |
Fidelity Securities Lending Cash Central Fund | 19,063 |
Total | $ 27,354 |
Other Information |
The following is a summary of the inputs used, as of January 31, 2012, involving the Fund's assets and liabilities carried at fair value. The inputs or methodology used for valuing securities may not be an indication of the risk associated with investing in those securities. For more information on valuation inputs, and their aggregation into the levels used in the tables below, please refer to the Security Valuation section in the accompanying Notes to Financial Statements. |
Valuation Inputs at Reporting Date: | ||||
Description | Total | Level 1 | Level 2 | Level 3 |
Investments in Securities: | ||||
Equities: | ||||
Consumer Discretionary | $ 44,984,111 | $ 44,984,111 | $ - | $ - |
Consumer Staples | 39,119,179 | 39,119,179 | - | - |
Energy | 64,043,752 | 64,043,752 | - | - |
Financials | 128,634,970 | 128,634,970 | - | - |
Health Care | 64,127,480 | 64,127,480 | - | - |
Industrials | 46,615,831 | 46,615,831 | - | - |
Information Technology | 45,609,230 | 45,609,230 | - | - |
Materials | 14,973,868 | 14,973,868 | - | - |
Telecommunication Services | 22,743,058 | 22,743,058 | - | - |
Utilities | 38,794,131 | 38,794,131 | - | - |
U.S. Government and Government Agency Obligations | 1,349,965 | - | 1,349,965 | - |
Money Market Funds | 14,632,658 | 14,632,658 | - | - |
Total Investments in Securities: | $ 525,628,233 | $ 524,278,268 | $ 1,349,965 | $ - |
Derivative Instruments: | ||||
Assets | ||||
Futures Contracts | $ 5,890 | $ 5,890 | $ - | $ - |
Liabilities | ||||
Futures Contracts | $ (3,313) | $ (3,313) | $ - | $ - |
Total Derivative Instruments: | $ 2,577 | $ 2,577 | $ - | $ - |
Value of Derivative Instruments |
The following table is a summary of the Fund's value of derivative instruments by risk exposure as of January 31, 2012. For additional information on derivative instruments, please refer to the Derivative Instruments section in the accompanying Notes to Financial Statements. |
Risk Exposure / | Value | |
| Asset | Liability |
Equity Risk | ||
Futures Contracts (a) | $ 5,890 | $ (3,313) |
Total Value of Derivatives | $ 5,890 | $ (3,313) |
(a) Reflects cumulative appreciation/(depreciation) on futures contracts as disclosed on the Schedule of Investments. Only the period end variation margin is separately disclosed on the Statement of Assets and Liabilities. |
Distribution of investments by country of issue, as a percentage of total net assets, is as follows: (Unaudited) |
United States of America | 85.9% |
United Kingdom | 4.9% |
Bermuda | 2.5% |
Switzerland | 1.8% |
Canada | 1.3% |
Ireland | 1.1% |
Others (Individually Less Than 1%) | 2.5% |
| 100.0% |
See accompanying notes which are an integral part of the financial statements.
Annual Report
Financial Statements
Statement of Assets and Liabilities
| January 31, 2012 | |
|
|
|
Assets | ||
Investment in securities, at value (including securities loaned of $6,397,132) - See accompanying schedule: Unaffiliated issuers (cost $524,242,957) | $ 510,995,575 |
|
Fidelity Central Funds (cost $14,632,658) | 14,632,658 |
|
Total Investments (cost $538,875,615) |
| $ 525,628,233 |
Receivable for investments sold | 2,503,384 | |
Receivable for fund shares sold | 312,428 | |
Dividends receivable | 630,053 | |
Distributions receivable from Fidelity Central Funds | 1,397 | |
Prepaid expenses | 949 | |
Other receivables | 2,808 | |
Total assets | 529,079,252 | |
|
|
|
Liabilities | ||
Payable to custodian bank | $ 2,809,965 | |
Payable for investments purchased | 2,987,240 | |
Payable for fund shares redeemed | 633,468 | |
Accrued management fee | 104,126 | |
Distribution and service plan fees payable | 11,804 | |
Payable for daily variation margin on futures contracts | 1,645 | |
Other affiliated payables | 130,779 | |
Other payables and accrued expenses | 48,716 | |
Collateral on securities loaned, at value | 6,580,950 | |
Total liabilities | 13,308,693 | |
|
|
|
Net Assets | $ 515,770,559 | |
Net Assets consist of: |
| |
Paid in capital | $ 909,409,528 | |
Distributions in excess of net investment income | (41,141) | |
Accumulated undistributed net realized gain (loss) on investments and foreign currency transactions | (380,353,023) | |
Net unrealized appreciation (depreciation) on investments | (13,244,805) | |
Net Assets | $ 515,770,559 | |
See accompanying notes which are an integral part of the financial statements.
Annual Report
Statement of Assets and Liabilities - continued
| January 31, 2012 | |
|
|
|
Calculation of Maximum Offering Price Class A: | $ 10.71 | |
|
|
|
Maximum offering price per share (100/94.25 of $10.71) | $ 11.36 | |
Class T: | $ 10.72 | |
|
|
|
Maximum offering price per share (100/96.50 of $10.72) | $ 11.11 | |
Class B: | $ 10.72 | |
|
|
|
Class C: | $ 10.61 | |
|
|
|
Stock Selector Large Cap Value: | $ 10.77 | |
|
|
|
Institutional Class: | $ 10.74 | |
A Redemption price per share is equal to net asset value less any applicable contingent deferred sales charge.
See accompanying notes which are an integral part of the financial statements.
Annual Report
Financial Statements - continued
Statement of Operations
| Year ended January 31, 2012 | |
|
|
|
Investment Income |
|
|
Dividends |
| $ 13,771,452 |
Interest |
| 20 |
Income from Fidelity Central Funds |
| 27,354 |
Total income |
| 13,798,826 |
|
|
|
Expenses | ||
Management fee | $ 3,437,760 | |
Performance adjustment | (1,860,095) | |
Transfer agent fees | 1,536,906 | |
Distribution and service plan fees | 138,517 | |
Accounting and security lending fees | 227,292 | |
Custodian fees and expenses | 29,427 | |
Independent trustees' compensation | 3,693 | |
Registration fees | 64,073 | |
Audit | 54,944 | |
Legal | 2,251 | |
Interest | 307 | |
Miscellaneous | 8,510 | |
Total expenses before reductions | 3,643,585 | |
Expense reductions | (42,992) | 3,600,593 |
Net investment income (loss) | 10,198,233 | |
Realized and Unrealized Gain (Loss) Net realized gain (loss) on: | ||
Investment securities: |
|
|
Unaffiliated issuers | 82,006,935 | |
Foreign currency transactions | 5,915 | |
Futures contracts | 64,921 | |
Total net realized gain (loss) |
| 82,077,771 |
Change in net unrealized appreciation (depreciation) on: Investment securities | (80,820,632) | |
Futures contracts | 2,577 | |
Total change in net unrealized appreciation (depreciation) |
| (80,818,055) |
Net gain (loss) | 1,259,716 | |
Net increase (decrease) in net assets resulting from operations | $ 11,457,949 | |
See accompanying notes which are an integral part of the financial statements.
Annual Report
Statement of Changes in Net Assets
| Year ended | Year ended |
Increase (Decrease) in Net Assets |
|
|
Operations |
|
|
Net investment income (loss) | $ 10,198,233 | $ 10,347,123 |
Net realized gain (loss) | 82,077,771 | 92,822,563 |
Change in net unrealized appreciation (depreciation) | (80,818,055) | 32,667,985 |
Net increase (decrease) in net assets resulting | 11,457,949 | 135,837,671 |
Distributions to shareholders from net investment income | (10,179,715) | (10,612,123) |
Share transactions - net increase (decrease) | (323,065,032) | (243,855,298) |
Total increase (decrease) in net assets | (321,786,798) | (118,629,750) |
|
|
|
Net Assets | ||
Beginning of period | 837,557,357 | 956,187,107 |
End of period (including distributions in excess of net investment income of $41,141 and undistributed net investment income of $0, respectively) | $ 515,770,559 | $ 837,557,357 |
See accompanying notes which are an integral part of the financial statements.
Annual Report
Financial Highlights - Class A
Years ended January 31, | 2012 | 2011 | 2010 | 2009 | 2008 H |
Selected Per-Share Data |
|
|
|
|
|
Net asset value, beginning of period | $ 10.72 | $ 9.35 | $ 7.53 | $ 13.54 | $ 15.41 |
Income from Investment Operations |
|
|
|
|
|
Net investment income (loss) E | .14 | .09 | .09 | .16 | .12 |
Net realized and unrealized gain (loss) | .02 | 1.38 | 1.85 | (6.00) | (1.00) |
Total from investment operations | .16 | 1.47 | 1.94 | (5.84) | (.88) |
Distributions from net investment income | (.17) | (.10) | (.12) | (.17) | (.12) |
Distributions from net realized gain | - | - | - | - | (.87) |
Total distributions | (.17) | (.10) | (.12) | (.17) | (.99) |
Net asset value, end of period | $ 10.71 | $ 10.72 | $ 9.35 | $ 7.53 | $ 13.54 |
Total Return B,C,D | 1.58% | 15.79% | 25.74% | (43.20)% | (6.04)% |
Ratios to Average Net Assets F,I |
|
|
|
|
|
Expenses before reductions | .87% | 1.00% | 1.15% | 1.17% | 1.22% A |
Expenses net of fee waivers, if any | .87% | 1.00% | 1.15% | 1.17% | 1.22% A |
Expenses net of all reductions | .86% | 1.00% | 1.13% | 1.17% | 1.22% A |
Net investment income (loss) | 1.38% | .87% | 1.08% | 1.47% | .81% A |
Supplemental Data |
|
|
|
|
|
Net assets, end of period (000 omitted) | $ 18,900 | $ 20,815 | $ 23,778 | $ 22,577 | $ 9,774 |
Portfolio turnover rate G | 128% | 120% | 171% | 243% | 204% |
A Annualized
B Total returns for periods of less than one year are not annualized.
C Total returns would have been lower if certain expenses had not been reduced during the applicable periods shown.
D Total returns do not include the effect of the sales charges.
E Calculated based on average shares outstanding during the period.
F Fees and expenses of any underlying Fidelity Central Funds are not included in the Fund's expense ratio. The Fund indirectly bears its proportionate share of the expenses of any underlying Fidelity Central Funds.
G Amount does not include the portfolio activity of any underlying Fidelity Central Funds.
H For the period February 13, 2007 (commencement of sale of shares) to January 31, 2008.
I Expense ratios reflect operating expenses of the class. Expenses before reductions do not reflect amounts reimbursed by the investment adviser or reductions from brokerage service arrangements or reductions from other expense offset arrangements and do not represent the amount paid by the class during periods when reimbursements or reductions occur. Expense ratios before reductions for start-up periods may not be representative of longer-term operating periods. Expenses net of fee waivers reflect expenses after reimbursement by the investment adviser but prior to reductions from brokerage service arrangements or other expense offset arrangements. Expenses net of all reductions represent the net expenses paid by the class.
See accompanying notes which are an integral part of the financial statements.
Annual Report
Financial Highlights - Class T
Years ended January 31, | 2012 | 2011 | 2010 | 2009 | 2008 H |
Selected Per-Share Data |
|
|
|
|
|
Net asset value, beginning of period | $ 10.74 | $ 9.36 | $ 7.54 | $ 13.53 | $ 15.41 |
Income from Investment Operations |
|
|
|
|
|
Net investment income (loss) E | .12 | .06 | .07 | .12 | .08 |
Net realized and unrealized gain (loss) | .01 | 1.39 | 1.84 | (5.97) | (1.01) |
Total from investment operations | .13 | 1.45 | 1.91 | (5.85) | (.93) |
Distributions from net investment income | (.15) | (.07) | (.09) | (.14) | (.08) |
Distributions from net realized gain | - | - | - | - | (.87) |
Total distributions | (.15) | (.07) | (.09) | (.14) | (.95) |
Net asset value, end of period | $ 10.72 | $ 10.74 | $ 9.36 | $ 7.54 | $ 13.53 |
Total Return B,C,D | 1.26% | 15.50% | 25.30% | (43.34)% | (6.34)% |
Ratios to Average Net Assets F,I |
|
|
|
|
|
Expenses before reductions | 1.14% | 1.29% | 1.45% | 1.49% | 1.47% A |
Expenses net of fee waivers, if any | 1.14% | 1.29% | 1.45% | 1.49% | 1.47% A |
Expenses net of all reductions | 1.13% | 1.28% | 1.44% | 1.49% | 1.47% A |
Net investment income (loss) | 1.11% | .59% | .78% | 1.15% | .56% A |
Supplemental Data |
|
|
|
|
|
Net assets, end of period (000 omitted) | $ 5,603 | $ 5,625 | $ 9,101 | $ 9,792 | $ 5,976 |
Portfolio turnover rate G | 128% | 120% | 171% | 243% | 204% |
A Annualized
B Total returns for periods of less than one year are not annualized.
C Total returns would have been lower if certain expenses had not been reduced during the applicable periods shown.
D Total returns do not include the effect of the sales charges.
E Calculated based on average shares outstanding during the period.
F Fees and expenses of any underlying Fidelity Central Funds are not included in the Fund's expense ratio. The Fund indirectly bears its proportionate share of the expenses of any underlying Fidelity Central Funds.
G Amount does not include the portfolio activity of any underlying Fidelity Central Funds.
H For the period February 13, 2007 (commencement of sale of shares) to January 31, 2008.
I Expense ratios reflect operating expenses of the class. Expenses before reductions do not reflect amounts reimbursed by the investment adviser or reductions from brokerage service arrangements or reductions from other expense offset arrangements and do not represent the amount paid by the class during periods when reimbursements or reductions occur. Expense ratios before reductions for start-up periods may not be representative of longer-term operating periods. Expenses net of fee waivers reflect expenses after reimbursement by the investment adviser but prior to reductions from brokerage service arrangements or other expense offset arrangements. Expenses net of all reductions represent the net expenses paid by the class.
See accompanying notes which are an integral part of the financial statements.
Annual Report
Financial Highlights - Class B
Years ended January 31, | 2012 | 2011 | 2010 | 2009 | 2008 H |
Selected Per-Share Data |
|
|
|
|
|
Net asset value, beginning of period | $ 10.72 | $ 9.35 | $ 7.53 | $ 13.54 | $ 15.41 |
Income from Investment Operations |
|
|
|
|
|
Net investment income (loss) E | .07 | .01 | .02 | .07 | .01 |
Net realized and unrealized gain (loss) | .02 | 1.38 | 1.85 | (5.98) | (1.00) |
Total from investment operations | .09 | 1.39 | 1.87 | (5.91) | (.99) |
Distributions from net investment income | (.09) | (.02) | (.05) | (.10) | (.01) |
Distributions from net realized gain | - | - | - | - | (.87) |
Total distributions | (.09) | (.02) | (.05) | (.10) | (.88) |
Net asset value, end of period | $ 10.72 | $ 10.72 | $ 9.35 | $ 7.53 | $ 13.54 |
Total Return B,C,D | .86% | 14.87% | 24.79% | (43.71)% | (6.74)% |
Ratios to Average Net Assets F,I |
|
|
|
|
|
Expenses before reductions | 1.62% | 1.80% | 1.98% | 2.07% | 1.99% A |
Expenses net of fee waivers, if any | 1.62% | 1.80% | 1.98% | 2.00% | 1.99% A |
Expenses net of all reductions | 1.62% | 1.79% | 1.97% | 2.00% | 1.99% A |
Net investment income (loss) | .63% | .08% | .24% | .64% | .04% A |
Supplemental Data |
|
|
|
|
|
Net assets, end of period (000 omitted) | $ 1,819 | $ 2,274 | $ 2,711 | $ 2,600 | $ 1,860 |
Portfolio turnover rate G | 128% | 120% | 171% | 243% | 204% |
A Annualized
B Total returns for periods of less than one year are not annualized.
C Total returns would have been lower if certain expenses had not been reduced during the applicable periods shown.
D Total returns do not include the effect of the contingent deferred sales charge.
E Calculated based on average shares outstanding during the period.
F Fees and expenses of any underlying Fidelity Central Funds are not included in the Fund's expense ratio. The Fund indirectly bears its proportionate share of the expenses of any underlying Fidelity Central Funds.
G Amount does not include the portfolio activity of any underlying Fidelity Central Funds.
H For the period February 13, 2007 (commencement of sale of shares) to January 31, 2008.
I Expense ratios reflect operating expenses of the class. Expenses before reductions do not reflect amounts reimbursed by the investment adviser or reductions from brokerage service arrangements or reductions from other expense offset arrangements and do not represent the amount paid by the class during periods when reimbursements or reductions occur. Expense ratios before reductions for start-up periods may not be representative of longer-term operating periods. Expenses net of fee waivers reflect expenses after reimbursement by the investment adviser but prior to reductions from brokerage service arrangements or other expense offset arrangements. Expenses net of all reductions represent the net expenses paid by the class.
See accompanying notes which are an integral part of the financial statements.
Annual Report
Financial Highlights - Class C
Years ended January 31, | 2012 | 2011 | 2010 | 2009 | 2008 H |
Selected Per-Share Data |
|
|
|
|
|
Net asset value, beginning of period | $ 10.63 | $ 9.30 | $ 7.49 | $ 13.52 | $ 15.41 |
Income from Investment Operations |
|
|
|
|
|
Net investment income (loss) E | .07 | .01 | .03 | .08 | .01 |
Net realized and unrealized gain (loss) | .01 | 1.36 | 1.84 | (5.97) | (.98) |
Total from investment operations | .08 | 1.37 | 1.87 | (5.89) | (.97) |
Distributions from net investment income | (.10) | (.04) | (.06) | (.14) | (.05) |
Distributions from net realized gain | - | - | - | - | (.87) |
Total distributions | (.10) | (.04) | (.06) | (.14) | (.92) |
Net asset value, end of period | $ 10.61 | $ 10.63 | $ 9.30 | $ 7.49 | $ 13.52 |
Total Return B,C,D | .85% | 14.79% | 24.97% | (43.65)% | (6.61)% |
Ratios to Average Net Assets F,I |
|
|
|
|
|
Expenses before reductions | 1.62% | 1.75% | 1.89% | 1.91% | 1.94% A |
Expenses net of fee waivers, if any | 1.62% | 1.75% | 1.89% | 1.91% | 1.94% A |
Expenses net of all reductions | 1.61% | 1.74% | 1.88% | 1.91% | 1.94% A |
Net investment income (loss) | .63% | .13% | .34% | .73% | .09% A |
Supplemental Data |
|
|
|
|
|
Net assets, end of period (000 omitted) | $ 4,979 | $ 3,959 | $ 3,491 | $ 2,352 | $ 1,208 |
Portfolio turnover rate G | 128% | 120% | 171% | 243% | 204% |
A Annualized
B Total returns for periods of less than one year are not annualized.
C Total returns would have been lower if certain expenses had not been reduced during the applicable periods shown.
D Total returns do not include the effect of the contingent deferred sales charge.
E Calculated based on average shares outstanding during the period.
F Fees and expenses of any underlying Fidelity Central Funds are not included in the Fund's expense ratio. The Fund indirectly bears its proportionate share of the expenses of any underlying Fidelity Central Funds.
G Amount does not include the portfolio activity of any underlying Fidelity Central Funds.
H For the period February 13, 2007 (commencement of sale of shares) to January 31, 2008.
I Expense ratios reflect operating expenses of the class. Expenses before reductions do not reflect amounts reimbursed by the investment adviser or reductions from brokerage service arrangements or reductions from other expense offset arrangements and do not represent the amount paid by the class during periods when reimbursements or reductions occur. Expense ratios before reductions for start-up periods may not be representative of longer-term operating periods. Expenses net of fee waivers reflect expenses after reimbursement by the investment adviser but prior to reductions from brokerage service arrangements or other expense offset arrangements. Expenses net of all reductions represent the net expenses paid by the class.
See accompanying notes which are an integral part of the financial statements.
Annual Report
Financial Highlights - Stock Selector Large Cap Value
Years ended January 31, | 2012 | 2011 | 2010 | 2009 | 2008 |
Selected Per-Share Data |
|
|
|
|
|
Net asset value, beginning of period | $ 10.78 | $ 9.40 | $ 7.56 | $ 13.57 | $ 15.19 |
Income from Investment Operations |
|
|
|
|
|
Net investment income (loss) B | .18 | .11 | .12 | .20 | .18 |
Net realized and unrealized gain (loss) | .01 | 1.40 | 1.86 | (6.02) | (.80) |
Total from investment operations | .19 | 1.51 | 1.98 | (5.82) | (.62) |
Distributions from net investment income | (.20) | (.13) | (.14) | (.19) | (.13) |
Distributions from net realized gain | - | - | - | - | (.87) |
Total distributions | (.20) | (.13) | (.14) | (.19) | (1.00) |
Net asset value, end of period | $ 10.77 | $ 10.78 | $ 9.40 | $ 7.56 | $ 13.57 |
Total Return A | 1.85% | 16.09% | 26.21% | (43.03)% | (4.39)% |
Ratios to Average Net Assets C,E |
|
|
|
|
|
Expenses before reductions | .57% | .73% | .85% | .86% | .86% |
Expenses net of fee waivers, if any | .57% | .73% | .85% | .86% | .85% |
Expenses net of all reductions | .56% | .72% | .84% | .86% | .85% |
Net investment income (loss) | 1.68% | 1.15% | 1.38% | 1.78% | 1.18% |
Supplemental Data |
|
|
|
|
|
Net assets, end of period (000 omitted) | $ 482,950 | $ 803,009 | $ 914,828 | $ 916,490 | $ 1,483,574 |
Portfolio turnover rate D | 128% | 120% | 171% | 243% | 204% |
A Total returns would have been lower if certain expenses had not been reduced during the applicable periods shown.
B Calculated based on average shares outstanding during the period.
C Fees and expenses of any underlying Fidelity Central Funds are not included in the Fund's expense ratio. The Fund indirectly bears its proportionate share of the expenses of any underlying Fidelity Central Funds.
D Amount does not include the portfolio activity of any underlying Fidelity Central Funds.
E Expense ratios reflect operating expenses of the class. Expenses before reductions do not reflect amounts reimbursed by the investment adviser or reductions from brokerage service arrangements or reductions from other expense offset arrangements and do not represent the amount paid by the class during periods when reimbursements or reductions occur. Expenses net of fee waivers reflect expenses after reimbursement by the investment adviser but prior to reductions from brokerage service arrangements or other expense offset arrangements. Expenses net of all reductions represent the net expenses paid by the class.
See accompanying notes which are an integral part of the financial statements.
Annual Report
Financial Highlights - Institutional Class
Years ended January 31, | 2012 | 2011 | 2010 | 2009 | 2008 G |
Selected Per-Share Data |
|
|
|
|
|
Net asset value, beginning of period | $ 10.74 | $ 9.37 | $ 7.54 | $ 13.54 | $ 15.41 |
Income from Investment Operations |
|
|
|
|
|
Net investment income (loss) D | .17 | .11 | .12 | .20 | .17 |
Net realized and unrealized gain (loss) | .02 | 1.39 | 1.85 | (6.01) | (1.02) |
Total from investment operations | .19 | 1.50 | 1.97 | (5.81) | (.85) |
Distributions from net investment income | (.19) | (.13) | (.14) | (.19) | (.15) |
Distributions from net realized gain | - | - | - | - | (.87) |
Total distributions | (.19) | (.13) | (.14) | (.19) | (1.02) |
Net asset value, end of period | $ 10.74 | $ 10.74 | $ 9.37 | $ 7.54 | $ 13.54 |
Total Return B,C | 1.92% | 16.04% | 26.18% | (43.00)% | (5.82)% |
Ratios to Average Net Assets E,H |
|
|
|
|
|
Expenses before reductions | .60% | .74% | .87% | .85% | .85% A |
Expenses net of fee waivers, if any | .60% | .74% | .87% | .85% | .85% A |
Expenses net of all reductions | .60% | .73% | .86% | .85% | .84% A |
Net investment income (loss) | 1.65% | 1.14% | 1.36% | 1.79% | 1.19% A |
Supplemental Data |
|
|
|
|
|
Net assets, end of period (000 omitted) | $ 1,519 | $ 1,876 | $ 2,279 | $ 1,304 | $ 1,060 |
Portfolio turnover rate F | 128% | 120% | 171% | 243% | 204% |
A Annualized
B Total returns for periods of less than one year are not annualized.
C Total returns would have been lower if certain expenses had not been reduced during the applicable periods shown.
D Calculated based on average shares outstanding during the period.
E Fees and expenses of any underlying Fidelity Central Funds are not included in the Fund's expense ratio. The Fund indirectly bears its proportionate share of the expenses of any underlying Fidelity Central Funds.
F Amount does not include the portfolio activity of any underlying Fidelity Central Funds.
G For the period February 13, 2007 (commencement of sale of shares) to January 31, 2008.
H Expense ratios reflect operating expenses of the class. Expenses before reductions do not reflect amounts reimbursed by the investment adviser or reductions from brokerage service arrangements or reductions from other expense offset arrangements and do not represent the amount paid by the class during periods when reimbursements or reductions occur. Expense ratios before reductions for start-up periods may not be representative of longer-term operating periods. Expenses net of fee waivers reflect expenses after reimbursement by the investment adviser but prior to reductions from brokerage service arrangements or other expense offset arrangements. Expenses net of all reductions represent the net expenses paid by the class.
See accompanying notes which are an integral part of the financial statements.
Annual Report
Notes to Financial Statements
For the period ended January 31, 2012
1. Organization.
Fidelity Stock Selector Large Cap Value Fund (the Fund) is a fund of Fidelity Devonshire Trust (the Trust) and is authorized to issue an unlimited number of shares. The Trust is registered under the Investment Company Act of 1940, as amended (the 1940 Act), as an open-end management investment company organized as a Massachusetts business trust. The Fund offers Class A, Class T, Class C, Stock Selector Large Cap Value and Institutional Class shares, each of which, along with Class B shares, has equal rights as to assets and voting privileges. Effective after the close of business on September 1, 2010, Class B shares were closed to new accounts and additional purchases, except for exchanges and reinvestments. Each class has exclusive voting rights with respect to matters that affect that class. Class B shares will automatically convert to Class A shares after a holding period of seven years from the initial date of purchase. Investment income, realized and unrealized capital gains and losses, the common expenses of the Fund, and certain fund-level expense reductions, if any, are allocated on a pro-rata basis to each class based on the relative net assets of each class to the total net assets of the Fund. Each class differs with respect to transfer agent and distribution and service plan fees incurred. Certain expense reductions may also differ by class. In April 2011, the Board of Trustees approved a change in the name of Fidelity Large Cap Value Fund to Fidelity Stock Selector Large Cap Value Fund effective August 31, 2011.
2. Investments in Fidelity Central Funds.
The Fund invests in Fidelity Central Funds, which are open-end investment companies available only to other investment companies and accounts managed by Fidelity Management & Research Company (FMR) and its affiliates. The Fund's Schedule of Investments lists each of the Fidelity Central Funds held as of period end, if any, as an investment of the Fund, but does not include the underlying holdings of each Fidelity Central Fund. As an Investing Fund, the Fund indirectly bears its proportionate share of the expenses of the underlying Fidelity Central Funds.
The Money Market Central Funds seek preservation of capital and current income and are managed by Fidelity Investments Money Management, Inc. (FIMM), an affiliate of FMR.
A complete unaudited list of holdings for each Fidelity Central Fund is available upon request or at the Securities and Exchange Commission (the SEC) web site at www.sec.gov. In addition, the financial statements of the Fidelity Central Funds, which are not covered by the Fund's Report of Independent Registered Public Accounting Firm, are available on the SEC web site or upon request.
Annual Report
3. Significant Accounting Policies.
The financial statements have been prepared in conformity with accounting principles generally accepted in the United States of America (GAAP), which require management to make certain estimates and assumptions at the date of the financial statements. Actual results could differ from those estimates. Subsequent events, if any, through the date that the financial statements were issued have been evaluated in the preparation of the financial statements. The following summarizes the significant accounting policies of the Fund:
Security Valuation. Investments are valued as of 4:00 p.m. Eastern time on the last calendar day of the period. The Fund uses independent pricing services approved by the Board of Trustees to value its investments. When current market prices or quotations are not readily available or reliable, valuations may be determined in good faith in accordance with procedures adopted by the Board of Trustees. Factors used in determining value may include market or security specific events. The frequency with which these procedures are used cannot be predicted and they may be utilized to a significant extent. The value used for net asset value (NAV) calculation under these procedures may differ from published prices for the same securities.
The Fund categorizes the inputs to valuation techniques used to value its investments into a disclosure hierarchy consisting of three levels as shown below:
Level 1 - quoted prices in active markets for identical investments
Level 2 - other significant observable inputs (including quoted prices for similar investments, interest rates, prepayment speeds, etc.)
Level 3 - unobservable inputs (including the Fund's own assumptions based on the best information available)
Changes in valuation techniques may result in transfers in or out of an assigned level within the disclosure hierarchy. The aggregate value of investments by input level, as of January 31, 2012, is included at the end of the Fund's Schedule of Investments. Valuation techniques used to value the Fund's investments by major category are as follows:
Equity securities, including restricted securities, for which market quotations are readily available, are valued at the last reported sale price or official closing price as reported by an independent pricing service on the primary market or exchange on which they are traded and are categorized as Level 1 in the hierarchy. In the event there were no sales during the day or closing prices are not available, securities are valued at the last quoted bid price or may be valued using the last available price and are generally categorized as Level 2 in the hierarchy. For foreign equity securities, when significant market or security specific events arise, comparisons to the valuation of American Depositary Receipts
Annual Report
Notes to Financial Statements - continued
3. Significant Accounting Policies - continued
Security Valuation - continued
(ADRs), futures contracts, Exchange-traded funds (ETFs) and certain indexes as well as quoted prices for similar securities are used and are categorized as Level 2 in the hierarchy in these circumstances. Utilizing these techniques may result in transfers between Level 1 and Level 2. For restricted equity securities and private placements where observable inputs are limited, assumptions about market activity and risk are used and are categorized as Level 3 in the hierarchy.
Debt securities, including restricted securities, are valued based on evaluated prices received from independent pricing services or from dealers who make markets in such securities. For U.S. government and government agency obligations, pricing services utilize matrix pricing which considers yield or price of bonds of comparable quality, coupon, maturity and type as well as dealer supplied prices and are generally categorized as Level 2 in the hierarchy. When independent prices are unavailable or unreliable, debt securities may be valued utilizing pricing matrices which consider similar factors that would be used by independent pricing services. These are generally categorized as Level 2 in the hierarchy but may be Level 3 depending on the circumstances.
Futures contracts are valued at the settlement price established each day by the board of trade or exchange on which they are traded and are categorized as Level 1 in the hierarchy. Investments in open-end mutual funds, including the Fidelity Central Funds, are valued at their closing net asset value each business day and are categorized as Level 1 in the hierarchy.
New Accounting Pronouncements. In May 2011, the Financial Accounting Standards Board issued Accounting Standard Update No. 2011-04, Fair Value Measurement (Topic 820) - Amendments to Achieve Common Fair Value Measurement and Disclosure Requirements in U.S. GAAP and IFRSs. The update is effective during interim and annual periods beginning after December 15, 2011 and will result in additional disclosure for transfers between levels as well as expanded disclosure for securities categorized as Level 3 under the fair value hierarchy.
In December 2011, the Financial Accounting Standards Board issued Accounting Standard Update No. 2011-11, Disclosures about Offsetting Assets and Liabilities. The update creates new disclosure requirements requiring entities to disclose both gross and net information for derivatives and other financial instruments that are either offset in the Statement of Assets and Liabilities or subject to an enforceable master netting arrangement or similar agreement. The disclosure requirements are effective for interim and annual reporting periods beginning on or after January 1, 2013. Management is currently evaluating the impact of the update's adoption on the Fund's financial statement disclosures.
Annual Report
3. Significant Accounting Policies - continued
Foreign Currency. The Fund may use foreign currency contracts to facilitate transactions in foreign-denominated securities. Gains and losses from these transactions may arise from changes in the value of the foreign currency or if the counterparties do not perform under the contracts' terms.
Foreign-denominated assets, including investment securities, and liabilities are translated into U.S. dollars at the exchange rate at period end. Purchases and sales of investment securities, income and dividends received and expenses denominated in foreign currencies are translated into U.S. dollars at the exchange rate in effect on the transaction date.
The effects of exchange rate fluctuations on investments are included with the net realized and unrealized gain (loss) on investment securities. Other foreign currency transactions resulting in realized and unrealized gain (loss) are disclosed separately.
Investment Transactions and Income. For financial reporting purposes, the Fund's investment holdings and NAV include trades executed through the end of the last business day of the period. The NAV per share for processing shareholder transactions is calculated as of the close of business of the New York Stock Exchange (NYSE), normally 4:00 p.m. Eastern time and includes trades executed through the end of the prior business day. Gains and losses on securities sold are determined on the basis of identified cost and may include proceeds received from litigation. Dividend income is recorded on the ex-dividend date, except for certain dividends from foreign securities where the ex-dividend date may have passed, which are recorded as soon as the Fund is informed of the ex-dividend date. Non-cash dividends included in dividend income, if any, are recorded at the fair market value of the securities received. Distributions received on securities that represent a return of capital or capital gain are recorded as a reduction of cost of investments and/or as a realized gain. The Fund estimates the components of distributions received that may be considered return of capital distributions or capital gain distributions. Interest income and distributions from the Fidelity Central Funds are accrued as earned. Interest income includes coupon interest and amortization of premium and accretion of discount on debt securities. Investment income is recorded net of foreign taxes withheld where recovery of such taxes is uncertain.
Expenses. Expenses directly attributable to a fund are charged to that fund. Expenses attributable to more than one fund are allocated among the respective funds on the basis of relative net assets or other appropriate methods. Expense estimates are accrued in the period to which they relate and adjustments are made when actual amounts are known.
Income Tax Information and Distributions to Shareholders. Each year, the Fund intends to qualify as a regulated investment company, including distributing substantially all of its taxable income and realized gains under Subchapter M of the Internal
Annual Report
Notes to Financial Statements - continued
3. Significant Accounting Policies - continued
Income Tax Information and Distributions to Shareholders - continued
Revenue Code. As a result, no provision for income taxes is required. As of January 31, 2012, the Fund did not have any unrecognized tax benefits in the financial statements; nor is the Fund aware of any tax positions for which it is reasonably possible that the total amounts of unrecognized tax benefits will significantly change in the next twelve months. The Fund files a U.S. federal tax return, in addition to state and local tax returns as required. A fund's tax returns are subject to examination by the Internal Revenue Service (IRS) for a period of three fiscal years. State and local tax returns may be subject to examination for an additional fiscal year depending on the jurisdiction. Foreign taxes are provided for based on the Fund's understanding of the tax rules and rates that exist in the foreign markets in which it invests.
Distributions are declared and recorded on the ex-dividend date. Income dividends and capital gain distributions are declared separately for each class. Income and capital gain distributions are determined in accordance with income tax regulations, which may differ from GAAP.
Capital accounts within the financial statements are adjusted for permanent book-tax differences. These adjustments have no impact on net assets or the results of operations. Temporary book-tax differences will reverse in a subsequent period.
Book-tax differences are primarily due to futures transactions, foreign currency transactions, market discount, capital loss carryforwards and losses deferred due to wash sales and excise tax regulations.
The federal tax cost of investment securities and unrealized appreciation (depreciation) as of period end were as follows:
Gross unrealized appreciation | $ 30,248,509 |
Gross unrealized depreciation | (49,977,208) |
Net unrealized appreciation (depreciation) on securities and other investments | $ (19,728,699) |
|
|
Tax Cost | $ 545,356,932 |
The tax-based components of distributable earnings as of period end were as follows:
Capital loss carryforward | $ (371,005,041) |
Net unrealized appreciation (depreciation) | $ (19,728,699) |
Annual Report
3. Significant Accounting Policies - continued
Income Tax Information and Distributions to Shareholders - continued
Capital loss carryforwards are only available to offset future capital gains of the Fund to the extent provided by regulations and may be limited. Under the Regulated Investment Company Modernization Act of 2010 (the Act), the Fund is permitted to carry forward capital losses incurred in taxable years beginning after December 22, 2010 for an unlimited period and such capital losses are required to be used prior to any losses that expire. Capital loss carryforwards were as follows:
Fiscal year of expiration |
|
2017 | $ (182,900,202) |
2018 | (188,104,839) |
Total with expiration | $ (371,005,041) |
The tax character of distributions paid was as follows:
| January 31, 2012 | January 31, 2011 |
Ordinary Income | $ 10,179,715 | $ 10,612,123 |
4. Derivative Instruments.
Risk Exposures and the Use of Derivative Instruments. The Fund used derivative instruments (derivatives), including futures contracts, in order to meet its investment objectives. The strategy is to use derivatives to increase returns and to manage exposure to certain risks as defined below. The success of any strategy involving derivatives depends on analysis of numerous economic factors, and if the strategies for investment do not work as intended, the Fund may not achieve its objectives.
The Fund's use of derivatives increased or decreased its exposure to the following risk:
Equity Risk | Equity risk relates to the fluctuations in the value of financial instruments as a result of changes in market prices (other than those arising from interest rate risk or foreign exchange risk), whether caused by factors specific to an individual investment, its issuer, or all factors affecting all instruments traded in a market or market segment. |
The Fund is also exposed to additional risks from investing in derivatives, such as liquidity risk and counterparty credit risk. Liquidity risk is the risk that the Fund will be unable to close out the derivative in the open market in a timely manner. Counterparty credit risk is the risk that the counterparty will not be able to fulfill its obligation to the Fund. Counterparty credit risk related to exchange-traded futures contracts is minimal because of the protection provided by the exchange on which they trade. Derivatives involve, to varying degrees, risk of loss in excess of the amounts recognized in the Statement of Assets and Liabilities.
Annual Report
Notes to Financial Statements - continued
4. Derivative Instruments - continued
Futures Contracts. A futures contract is an agreement between two parties to buy or sell a specified underlying instrument for a fixed price at a specified future date. The Fund used futures contracts to manage its exposure to the stock market.
Upon entering into a futures contract, a fund is required to deposit either cash or securities (initial margin) with a clearing broker in an amount equal to a certain percentage of the face value of the contract. Futures contracts are marked-to-market daily and subsequent payments (variation margin) are made or received by a fund depending on the daily fluctuations in the value of the futures contracts and are recorded as unrealized appreciation or (depreciation). This receivable and/or payable is included in daily variation margin on futures contracts in the Statement of Assets and Liabilities. Realized gain or (loss) is recorded upon the expiration or closing of a futures contract.
The underlying face amount at value of open futures contracts at period end is shown in the Schedule of Investments under the caption "Futures Contracts." This amount reflects each contract's exposure to the underlying instrument at period end and is representative of activity for the period. Securities deposited to meet initial margin requirements are identified in the Schedule of Investments.
During the period the Fund recognized net realized gain (loss) of $64,921 and a change in net unrealized appreciation (depreciation) of $2,577 related to its investment in futures contracts. These amounts are included in the Statement of Operations.
5. Purchases and Sales of Investments.
Purchases and sales of securities, other than short-term securities, aggregated $795,702,411 and $1,118,875,137, respectively.
6. Fees and Other Transactions with Affiliates.
Management Fee. FMR and its affiliates provide the Fund with investment management related services for which the Fund pays a monthly management fee. The management fee is the sum of an individual fund fee rate that is based on an annual rate of .30% of the Fund's average net assets and an annualized group fee rate that averaged .26% during the period. The group fee rate is based upon the average net assets of all the mutual funds advised by FMR. The group fee rate decreases as assets under management increase and increases as assets under management decrease. In addition, the management fee is subject to a performance adjustment (up to a maximum of ± .20% of the Fund's average net assets over a 36 month performance period). The upward or downward adjustment to the management fee is based on the relative investment performance of Stock Selector Large Cap Value as compared to an appropriate benchmark
Annual Report
6. Fees and Other Transactions with Affiliates - continued
Management Fee - continued
index. For the period, the total annual management fee rate, including the performance adjustment, was .26% of the Fund's average net assets.
Distribution and Service Plan Fees. In accordance with Rule 12b-1 of the 1940 Act, the Fund has adopted separate Distribution and Service Plans for each class of shares. Certain classes pay Fidelity Distributors Corporation (FDC), an affiliate of FMR, separate Distribution and Service Fees, each of which is based on an annual percentage of each class' average net assets. In addition, FDC may pay financial intermediaries for selling shares of the Fund and providing shareholder support services. For the period, the Distribution and Service Fee rates, total fees and amounts retained by FDC were as follows:
| Distribution | Service | Total Fees | Retained |
Class A | -% | .25% | $ 48,117 | $ 906 |
Class T | .25% | .25% | 27,426 | 57 |
Class B | .75% | .25% | 19,719 | 14,805 |
Class C | .75% | .25% | 43,255 | 11,261 |
|
|
| $ 138,517 | $ 27,029 |
Sales Load. FDC may receive a front-end sales charge of up to 5.75% for selling Class A shares and 3.50% for selling Class T shares, some of which is paid to financial intermediaries for selling shares of the Fund. Depending on the holding period, FDC may receive contingent deferred sales charges levied on Class A, Class T, Class B, and Class C redemptions. The deferred sales charges range from 5.00% to 1.00% for Class B, 1.00% for Class C, 1.00% for certain purchases of Class A shares and .25% for certain purchases of Class T shares.
For the period, sales charge amounts retained by FDC were as follows:
| Retained |
Class A | $ 9,835 |
Class T | 1,853 |
Class B* | 2,848 |
Class C* | 791 |
| $ 15,327 |
* When Class B and Class C shares are initially sold, FDC pays commissions from its own resources to financial intermediaries through which the sales are made.
Annual Report
Notes to Financial Statements - continued
6. Fees and Other Transactions with Affiliates - continued
Transfer Agent Fees. Fidelity Investments Institutional Operations Company, Inc. (FIIOC), an affiliate of FMR, is the transfer, dividend disbursing and shareholder servicing agent for each class of the Fund. FIIOC receives account fees and asset-based fees that vary according to the account size and type of account of the shareholders of the respective classes of the Fund. FIIOC pays for typesetting, printing and mailing of shareholder reports, except proxy statements. For the period, transfer agent fees for each class were as follows:
| Amount | % of |
Class A | $ 57,559 | .30 |
Class T | 17,249 | .31 |
Class B | 5,965 | .30 |
Class C | 12,943 | .30 |
Stock Selector Large Cap Value | 1,438,489 | .25 |
Institutional Class | 4,701 | .28 |
| $ 1,536,906 |
|
Accounting and Security Lending Fees. Fidelity Service Company, Inc. (FSC), an affiliate of FMR, maintains the Fund's accounting records. The accounting fee is based on the level of average net assets for each month. Under a separate contract, FSC administers the security lending program. The security lending fee is based on the number and duration of lending transactions.
Brokerage Commissions. The Fund placed a portion of its portfolio transactions with brokerage firms which are affiliates of the investment adviser. The commissions paid to these affiliated firms were $17,211 for the period.
Interfund Lending Program. Pursuant to an Exemptive Order issued by the SEC, the Fund, along with other registered investment companies having management contracts with FMR, may participate in an interfund lending program. This program provides an alternative credit facility allowing the funds to borrow from, or lend money to, other participating affiliated funds. At period end, there were no interfund loans outstanding. The Fund's activity in this program during the period for which loans were outstanding was as follows:
Borrower or Lender | Average Loan | Weighted Average Interest Rate | Interest |
Borrower | $ 3,153,636 | .32% | $ 307 |
Annual Report
7. Committed Line of Credit.
The Fund participates with other funds managed by FMR or an affiliate in a $4.0 billion credit facility (the "line of credit") to be utilized for temporary or emergency purposes to fund shareholder redemptions or for other short-term liquidity purposes. The Fund has agreed to pay commitment fees on its pro-rata portion of the line of credit, which amounted to $1,960 and is reflected in Miscellaneous expenses on the Statement of Operations. During the period, there were no borrowings on this line of credit.
8. Security Lending.
The Fund lends portfolio securities through a lending agent from time to time in order to earn additional income. For equity securities, a lending agent is used and may loan securities to certain qualified borrowers, including Fidelity Capital Markets (FCM), a broker-dealer affiliated with the Fund. On the settlement date of the loan, the Fund receives collateral (in the form of U.S. Treasury obligations, letters of credit and/or cash) against the loaned securities and maintains collateral in an amount not less than 100% of the market value of the loaned securities during the period of the loan. The market value of the loaned securities is determined at the close of business of the Fund and any additional required collateral is delivered to the Fund on the next business day. If the borrower defaults on its obligation to return the securities loaned because of insolvency or other reasons, a fund could experience delays and costs in recovering the securities loaned or in gaining access to the collateral. Any cash collateral received is invested in the Fidelity Securities Lending Cash Central Fund. The value of loaned securities and cash collateral at period end are disclosed on the Fund's Statement of Assets and Liabilities. Security lending income represents the income earned on investing cash collateral, less rebates paid to borrowers and any lending agent fees associated with the loan, plus any premium payments received for lending certain types of securities. Security lending income is presented in the Statement of Operations as a component of income from Fidelity Central Funds. Total security lending income during the period amounted to $19,063. During the period, there were no securities loaned to FCM.
9. Expense Reductions.
Many of the brokers with whom FMR places trades on behalf of the Fund provided services to the Fund in addition to trade execution. These services included payments of certain expenses on behalf of the Fund totaling $42,992 for the period.
Annual Report
Notes to Financial Statements - continued
10. Distributions to Shareholders.
Distributions to shareholders of each class were as follows:
Years ended January 31, | 2012 | 2011 |
From net investment income |
|
|
Class A | $ 291,163 | $ 196,415 |
Class T | 76,828 | 37,346 |
Class B | 14,902 | 4,323 |
Class C | 43,527 | 17,678 |
Stock Selector Large Cap Value | 9,726,457 | 10,334,423 |
Institutional Class | 26,838 | 21,938 |
Total | $ 10,179,715 | $ 10,612,123 |
11. Share Transactions.
Transactions for each class of shares were as follows:
| Shares | Dollars | ||
Years ended January 31, | 2012 | 2011 | 2012 | 2011 |
Class A |
|
|
|
|
Shares sold | 537,296 | 509,581 | $ 5,591,381 | $ 5,070,258 |
Reinvestment of distributions | 26,981 | 17,752 | 272,774 | 183,027 |
Shares redeemed | (742,040) | (1,127,883) | (7,769,301) | (11,172,418) |
Net increase (decrease) | (177,763) | (600,550) | $ (1,905,146) | $ (5,919,133) |
Class T |
|
|
|
|
Shares sold | 164,778 | 239,347 | $ 1,752,467 | $ 2,379,089 |
Reinvestment of distributions | 7,415 | 3,520 | 75,038 | 36,365 |
Shares redeemed | (173,682) | (691,112) | (1,851,245) | (6,965,488) |
Net increase (decrease) | (1,489) | (448,245) | $ (23,740) | $ (4,550,034) |
Class B |
|
|
|
|
Shares sold | 9,062 | 64,791 | $ 86,884 | $ 633,133 |
Reinvestment of distributions | 1,307 | 374 | 13,227 | 3,863 |
Shares redeemed | (52,766) | (142,878) | (549,800) | (1,418,300) |
Net increase (decrease) | (42,397) | (77,713) | $ (449,689) | $ (781,304) |
Class C |
|
|
|
|
Shares sold | 201,797 | 193,335 | $ 2,080,198 | $ 1,918,253 |
Reinvestment of distributions | 3,605 | 1,440 | 36,155 | 14,747 |
Shares redeemed | (108,651) | (197,933) | (1,106,480) | (1,934,239) |
Net increase (decrease) | 96,751 | (3,158) | $ 1,009,873 | $ (1,239) |
Stock Selector Large Cap Value |
|
|
|
|
Shares sold | 6,854,527 | 11,945,116 | $ 72,065,849 | $ 119,799,397 |
Reinvestment of distributions | 935,043 | 980,495 | 9,500,032 | 10,157,929 |
Shares redeemed | (37,479,739) | (35,741,742) | (402,880,177) | (361,864,131) |
Net increase (decrease) | (29,690,169) | (22,816,131) | $ (321,314,296) | $ (231,906,805) |
Annual Report
11. Share Transactions - continued
| Shares | Dollars | ||
Years ended January 31, | 2012 | 2011 | 2012 | 2011 |
Institutional Class |
|
|
|
|
Shares sold | 58,013 | 40,757 | $ 608,335 | $ 403,599 |
Reinvestment of distributions | 2,632 | 2,125 | 26,662 | 21,926 |
Shares redeemed | (93,801) | (111,512) | (1,017,031) | (1,122,308) |
Net increase (decrease) | (33,156) | (68,630) | $ (382,034) | $ (696,783) |
12. Other.
The Fund's organizational documents provide former and current trustees and officers with a limited indemnification against liabilities arising in connection with the performance of their duties to the Fund. In the normal course of business, the Fund may also enter into contracts that provide general indemnifications. The Fund's maximum exposure under these arrangements is unknown as this would be dependent on future claims that may be made against the Fund. The risk of material loss from such claims is considered remote.
Annual Report
Report of Independent Registered Public Accounting Firm
To the Trustees of Fidelity Devonshire Trust and the Shareholders of Fidelity Stock Selector Large Cap Value Fund:
In our opinion, the accompanying statement of assets and liabilities, including the schedule of investments, and the related statements of operations and of changes in net assets and the financial highlights present fairly, in all material respects, the financial position of Fidelity Stock Selector Large Cap Value Fund (a fund of Fidelity Devonshire Trust) at January 31, 2012, the results of its operations for the year then ended, the changes in its net assets for each of the two years in the period then ended and the financial highlights for each of the periods indicated, in conformity with accounting principles generally accepted in the United States of America. These financial statements and financial highlights (hereafter referred to as "financial statements") are the responsibility of the Fidelity Stock Selector Large Cap Value Fund's management. Our responsibility is to express an opinion on these financial statements based on our audits. We conducted our audits of these financial statements in accordance with the standards of the Public Company Accounting Oversight Board (United States). Those standards require that we plan and perform the audit to obtain reasonable assurance about whether the financial statements are free of material misstatement. An audit includes examining, on a test basis, evidence supporting the amounts and disclosures in the financial statements, assessing the accounting principles used and significant estimates made by management, and evaluating the overall financial statement presentation. We believe that our audits, which included confirmation of securities at January 31, 2012 by correspondence with the custodian and brokers, provide a reasonable basis for our opinion.
/s/ PricewaterhouseCoopers LLP
PricewaterhouseCoopers LLP
Boston, Massachusetts
March 13, 2012
Annual Report
Trustees and Officers
The Trustees, Members of the Advisory Board, and executive officers of the trust and fund, as applicable, are listed below. The Board of Trustees governs the fund and is responsible for protecting the interests of shareholders. The Trustees are experienced executives who meet periodically throughout the year to oversee the fund's activities, review contractual arrangements with companies that provide services to the fund, oversee management of the risks associated with such activities and contractual arrangements, and review the fund's performance. Except for James C. Curvey, each of the Trustees oversees 226 funds advised by FMR or an affiliate. Mr. Curvey oversees 430 funds advised by FMR or an affiliate.
The Trustees hold office without limit in time except that (a) any Trustee may resign; (b) any Trustee may be removed by written instrument, signed by at least two-thirds of the number of Trustees prior to such removal; (c) any Trustee who requests to be retired or who has become incapacitated by illness or injury may be retired by written instrument signed by a majority of the other Trustees; and (d) any Trustee may be removed at any special meeting of shareholders by a two-thirds vote of the outstanding voting securities of the trust. Each Trustee who is not an interested person (as defined in the 1940 Act) (Independent Trustee), shall retire not later than the last day of the calendar year in which his or her 75th birthday occurs. The Independent Trustees may waive this mandatory retirement age policy with respect to individual Trustees. The executive officers and Advisory Board Members hold office without limit in time, except that any officer and Advisory Board Member may resign or may be removed by a vote of a majority of the Trustees at any regular meeting or any special meeting of the Trustees. Except as indicated, each individual has held the office shown or other offices in the same company for the past five years.
Experience, Skills, Attributes, and Qualifications of the Fund's Trustees. The Governance and Nominating Committee has adopted a statement of policy that describes the experience, qualifications, attributes, and skills that are necessary and desirable for potential Independent Trustee candidates (Statement of Policy). The Board believes that each Trustee satisfied at the time he or she was initially elected or appointed a Trustee, and continues to satisfy, the standards contemplated by the Statement of Policy. The Governance and Nominating Committee also engages professional search firms to help identify potential Independent Trustee candidates who have the experience, qualifications, attributes, and skills consistent with the Statement of Policy. From time to time, additional criteria based on the composition and skills of the current Independent Trustees, as well as experience or skills that may be appropriate in light of future changes to board composition, business conditions, and regulatory or other developments, have also been considered by the professional search firms and the Governance and Nominating Committee. In addition, the Board takes into account the Trustees' commitment and participation in Board and committee meetings, as well as their leadership of standing and ad hoc committees throughout their tenure.
In determining that a particular Trustee was and continues to be qualified to serve as a Trustee, the Board has considered a variety of criteria, none of which, in isolation, was controlling. The Board believes that, collectively, the Trustees have balanced and diverse experience, qualifications, attributes, and skills, which allow the Board to operate effectively in governing the fund and protecting the interests of shareholders. Information about the specific experience, skills, attributes, and qualifications of each Trustee, which in each case led to the Board's conclusion that the Trustee should serve (or continue to serve) as a trustee of the fund, is provided below.
Annual Report
Board Structure and Oversight Function. James C. Curvey is an interested person (as defined in the 1940 Act) and currently serves as Acting Chairman. The Trustees have determined that an interested Chairman is appropriate and benefits shareholders because an interested Chairman has a personal and professional stake in the quality and continuity of services provided to the fund. Independent Trustees exercise their informed business judgment to appoint an individual of their choosing to serve as Chairman, regardless of whether the Trustee happens to be independent or a member of management. The Independent Trustees have determined that they can act independently and effectively without having an Independent Trustee serve as Chairman and that a key structural component for assuring that they are in a position to do so is for the Independent Trustees to constitute a substantial majority for the Board. The Independent Trustees also regularly meet in executive session. Ned C. Lautenbach serves as Chairman of the Independent Trustees and as such (i) acts as a liaison between the Independent Trustees and management with respect to matters important to the Independent Trustees and (ii) with management prepares agendas for Board meetings.
Fidelity funds are overseen by different Boards of Trustees. The fund's Board oversees Fidelity's equity and high income funds and another Board oversees Fidelity's investment-grade bond, money market, and asset allocation funds. The asset allocation funds may invest in Fidelity funds overseen by the fund's Board. The use of separate Boards, each with its own committee structure, allows the Trustees of each group of Fidelity funds to focus on the unique issues of the funds they oversee, including common research, investment, and operational issues. On occasion, the separate Boards establish joint committees to address issues of overlapping consequences for the Fidelity funds overseen by each Board.
The Trustees operate using a system of committees to facilitate the timely and efficient consideration of all matters of importance to the Trustees, the fund, and fund shareholders and to facilitate compliance with legal and regulatory requirements and oversight of the fund's activities and associated risks. The Board, acting through its committees, has charged FMR and its affiliates with (i) identifying events or circumstances the occurrence of which could have demonstrably adverse effects on the fund's business and/or reputation; (ii) implementing processes and controls to lessen the possibility that such events or circumstances occur or to mitigate the effects of such events or circumstances if they do occur; and (iii) creating and maintaining a system designed to evaluate continuously business and market conditions in order to facilitate the identification and implementation processes described in (i) and (ii) above. Because the day-to-day operations and activities of the fund are carried out by or through FMR, its affiliates and other service providers, the fund's exposure to risks is mitigated but not eliminated by the processes overseen by the Trustees. While each of the Board's committees has responsibility for overseeing different aspects of the fund's activities, oversight is exercised primarily through the Operations, Audit, and Compliance Committees. In addition, the Independent Trustees have worked with FMR to enhance the Board's oversight of investment and financial risks, legal and regulatory risks, technology risks, and operational risks, including the development of additional risk reporting to the Board. For example, a working group comprised of Independent Trustees and FMR has worked and continues to work to review the Fidelity funds' valuation-related activities, reporting and risk management. Appropriate personnel, including but not limited to the fund's Chief Compliance Officer (CCO), FMR's internal auditor, the independent accountants, the fund's Treasurer and portfolio management personnel, make periodic reports to the Board's committees, as appropriate, including an annual review of FMR's risk management program for the Fidelity funds. The responsibilities of each standing committee, including their oversight responsibilities, are described further under "Standing Committees of the Fund's Trustees."
Annual Report
Trustees and Officers - continued
The fund's Statement of Additional Information (SAI) includes more information about the Trustees. To request a free copy, call Fidelity at 1-800-544-8544.
Interested Trustees*:
Correspondence intended for each Trustee who is an interested person may be sent to Fidelity Investments, 82 Devonshire Street, Boston, Massachusetts 02109.
Name, Age; Principal Occupations and Other Relevant Experience+ | |
James C. Curvey (76) | |
| Year of Election or Appointment: 2007 Mr. Curvey is Trustee and Acting Chairman of the Board of Trustees of certain Trusts. Mr. Curvey also serves as Trustee (2007-present) of other investment companies advised by FMR. Mr. Curvey is a Director of Fidelity Investments Money Management, Inc. (2009-present), Director of Fidelity Research & Analysis Co. (2009-present) and Director of FMR and FMR Co., Inc. (2007-present). Mr. Curvey is also Vice Chairman (2007-present) and Director of FMR LLC. In addition, Mr. Curvey serves as an Overseer for the Boston Symphony Orchestra and a member of the Trustees of Villanova University. Previously, Mr. Curvey was the Vice Chairman (2006-2007) and Director (2000-2007) of FMR Corp. |
Ronald P. O'Hanley (54) | |
| Year of Election or Appointment: 2011 Mr. O'Hanley is Director of FMR Co., Inc. (2010-present), Director of Fidelity Investments Money Management, Inc. (2010-present), Director of Fidelity Research & Analysis Company (2010-present), President of Fidelity Asset Management and Corporate Services and a member of Fidelity's Executive Committee (2010-present). Previously, Mr. O'Hanley served as President and Chief Executive Officer of BNY Mellon Asset Management (2007-2010). Mr. O'Hanley also served as Vice Chairman of Bank New York Mellon Corp. and a member of that firm's Executive Committee. Prior to the 2007 merger of The Bank of New York and Mellon Financial Corporation, he was Vice Chairman of Mellon Financial Corporation and President and Chief Executive Officer of Mellon Asset Management. He joined Mellon in February 1997. Mr. O'Hanley currently serves as Chairman of the Boston Public Library Foundation Board of Directors and sits on the Board of Directors of Beth Israel Deaconess Medical Center, the Board of Trustees of the Marine Biological Laboratory and the Advisory Board of the Maxwell School of Citizenship and Public Administration at Syracuse University. Mr. O'Hanley also chairs the Council on Asset Management for the Financial Services Roundtable and is a member of the Board of Directors of Institutional Investor's U.S. Institute. |
* Trustees have been determined to be "Interested Trustees" by virtue of, among other things, their affiliation with the trust or various entities under common control with FMR.
+ The information above includes each Trustee's principal occupation during the last five years and other information relating to the experience, attributes, and skills relevant to each Trustee's qualifications to serve as a Trustee, which led to the conclusion that each Trustee should serve as a Trustee for the fund.
Annual Report
Trustees and Officers - continued
Independent Trustees:
Correspondence intended for each Independent Trustee (that is, the Trustees other than the Interested Trustees) may be sent to Fidelity Investments, P.O. Box 55235, Boston, Massachusetts 02205-5235.
Name, Age; Principal Occupations and Other Relevant Experience+ | |
Dennis J. Dirks (63) | |
| Year of Election or Appointment: 2005 Prior to his retirement in May 2003, Mr. Dirks was Chief Operating Officer and a member of the Board of The Depository Trust & Clearing Corporation (DTCC). He also served as President, Chief Operating Officer, and Board member of The Depository Trust Company (DTC) and President and Board member of the National Securities Clearing Corporation (NSCC). In addition, Mr. Dirks served as Chief Executive Officer and Board member of the Government Securities Clearing Corporation, Chief Executive Officer and Board member of the Mortgage-Backed Securities Clearing Corporation, as a Trustee and a member of the Finance Committee of Manhattan College (2005-2008), and as a Trustee and a member of the Finance Committee of AHRC of Nassau County (2006-2008). Mr. Dirks is a member of the Independent Directors Council (IDC) Governing Council (2010-present) and Board of Directors for The Brookville Center for Children's Services, Inc. (2009-present). |
Alan J. Lacy (58) | |
| Year of Election or Appointment: 2008 Mr. Lacy serves as Senior Adviser (2007-present) of Oak Hill Capital Partners, L.P. (private equity). Mr. Lacy also served as Chief Executive Officer (2000-2005) and Vice Chairman (2005-2006) of Sears Holdings Corporation and Sears, Roebuck and Co. (retail). In addition, Mr. Lacy serves as a member of the Board of Directors of Dave & Buster's, Inc. (restaurant and entertainment complexes, 2010-present), The Hillman Companies, Inc. (hardware wholesalers, 2010-present), and Bristol-Myers Squibb Company (global pharmaceuticals, 2007-present). Mr. Lacy is a member of the Board of Trustees of The National Parks Conservation Association (2006-present). Previously, Mr. Lacy served as Chairman of the Board of Trustees of the National Parks Conservation Association (2008-2011) and as a member of the Board of Directors for the Western Union Company (global money transfer, 2006-2011). |
Ned C. Lautenbach (67) | |
| Year of Election or Appointment: 2000 Mr. Lautenbach is Chairman of the Independent Trustees of the Equity and High Income Funds (2006-present). Mr. Lautenbach currently serves as the Lead Director of the Eaton Corporation Board of Directors (diversified industrial, 1997-present). Mr. Lautenbach is also a member of the Board of Directors of the Philharmonic Center for the Arts in Naples, Florida (1999-present); a member of the Board of Trustees of Fairfield University (2005-present); and a member of the Council on Foreign Relations (1994-present). Previously, Mr. Lautenbach was a Partner/Advisory Partner at Clayton, Dubilier & Rice, LLC (private equity investment, 1998-2010), as well as a Director of Sony Corporation (2006-2007). |
Joseph Mauriello (67) | |
| Year of Election or Appointment: 2008 Prior to his retirement in January 2006, Mr. Mauriello served in numerous senior management positions including Deputy Chairman and Chief Operating Officer (2004-2005), and Vice Chairman of Financial Services (2002-2004) of KPMG LLP US (professional services, 1965-2005). Mr. Mauriello currently serves as a member of the Board of Directors of XL Group plc. (global insurance and re-insurance, 2006-present) and of Arcadia Resources Inc. (health care services and products, 2007-present). Previously, Mr. Mauriello served as a Director of the Hamilton Funds of the Bank of New York (2006-2007). |
Robert W. Selander (61) | |
| Year of Election or Appointment: 2011 Previously, Mr. Selander served as a Member of the Advisory Board of Fidelity's Equity and High Income Funds (2011), Executive Vice Chairman (2010), Chief Executive Officer (2009-2010), and President and Chief Executive Officer (1997-2009) of Mastercard, Inc. |
Cornelia M. Small (67) | |
| Year of Election or Appointment: 2005 Ms. Small is a member of the Board of Directors of the Teagle Foundation (2009-present). Ms. Small is also a member of the Investment Committee, and Chair (2008-present) and a member of the Board of Trustees of Smith College. In addition, Ms. Small serves on the Investment Committee of the Berkshire Taconic Community Foundation (2008-present). Previously, Ms. Small served as Chairperson of the Investment Committee (2002-2008) of Smith College. In addition, Ms. Small served as Chief Investment Officer, Director of Global Equity Investments, and a member of the Board of Directors of Scudder, Stevens & Clark and Scudder Kemper Investments. |
William S. Stavropoulos (72) | |
| Year of Election or Appointment: 2002 Mr. Stavropoulos is Vice Chairman of the Independent Trustees of the Equity and High Income Funds (2006-present). Mr. Stavropoulos serves as President and Founder of the Michigan Baseball Foundation, the Great Lakes Loons (2007-present). Mr. Stavropoulos is Chairman Emeritus of the Board of Directors of The Dow Chemical Company, where he previously served in numerous senior management positions, including President, CEO (1995-2000; 2002-2004), Chairman of the Executive Committee (2000-2006), and as a member of the Board of Directors (1990-2006). Currently, Mr. Stavropoulos is Chairman of Univar (global distributor of commodity and specialty chemicals, 2010-present), a Director of Teradata Corporation (data warehousing and technology solutions, 2008-present), Chemical Financial Corporation, Maersk Inc. (industrial conglomerate), Tyco International, Inc. (multinational manufacturing and services, 2007-present), and a member of the Advisory Board for Metalmark Capital (private equity investment, 2005-present). Mr. Stavropoulos is a special advisor to Clayton, Dubilier & Rice, LLC (private equity investment). In addition, Mr. Stavropoulos is a member of the University of Notre Dame Advisory Council for the College of Science. |
David M. Thomas (62) | |
| Year of Election or Appointment: 2008 Previously, Mr. Thomas served as Executive Chairman (2005-2006) and Chairman and Chief Executive Officer (2000-2005) of IMS Health, Inc. (pharmaceutical and healthcare information solutions). In addition, Mr. Thomas serves as a member of the Board of Directors of Fortune Brands, Inc. (consumer products), and Interpublic Group of Companies, Inc. (marketing communication, 2004-present). |
Michael E. Wiley (61) | |
| Year of Election or Appointment: 2008 Mr. Wiley also serves as a Director of Asia Pacific Exploration Consolidated (international oil and gas exploration and production, 2008-present). Mr. Wiley serves as a Director of Tesoro Corporation (independent oil refiner and marketer, 2005-present), and a Director of Bill Barrett Corporation (exploration and production, 2005-present). In addition, Mr. Wiley also serves as a Director of Post Oak Bank (privately-held bank, 2004-present). Previously, Mr. Wiley served as a member of the Board of Trustees of the University of Tulsa (2000-2006; 2007-2010), as a Senior Energy Advisor of Katzenbach Partners, LLC (consulting, 2006-2007), as an Advisory Director of Riverstone Holdings (private investment), Chairman, President, and CEO of Baker Hughes, Inc. (oilfield services, 2000-2004), and as Director of Spinnaker Exploration Company (exploration and production, 2001-2005). |
Annual Report
+ The information above includes each Trustee's principal occupation during the last five years and other information relating to the experience, attributes, and skills relevant to each Trustee's qualifications to serve as a Trustee, which led to the conclusion that each Trustee should serve as a Trustee for the fund.
Advisory Board Members and Executive Officers:
Correspondence intended for each executive officer, Edward C. Johnson 3d, and Peter S. Lynch may be sent to Fidelity Investments, 82 Devonshire Street, Boston, Massachusetts 02109.
Name, Age; Principal Occupation | |
Edward C. Johnson 3d (81) | |
| Year of Election or Appointment: 2011 Member of the Advisory Board of Fidelity's Equity and High Income Funds. Mr. Johnson serves as Chief Executive Officer, Chairman, and a Director of FMR LLC, and also serves as Chairman and Director of FIL Limited. Previously, Mr. Johnson served as a Trustee and Chairman of the Board of certain Fidelity Trusts, Chairman and a Director of FMR, Chairman and a Director of FMR Co., Inc., and President of FMR LLC (2006-2007). |
Peter S. Lynch (68) | |
| Year of Election or Appointment: 2003 Member of the Advisory Board of Fidelity's Equity and High Income Funds. Mr. Lynch is Vice Chairman and a Director of FMR and FMR Co., Inc. In addition, Mr. Lynch serves as a Trustee of Boston College and as the Chairman of the Inner-City Scholarship Fund. Previously, Mr. Lynch served on the Special Olympics International Board of Directors (1997-2006). |
Kenneth B. Robins (42) | |
| Year of Election or Appointment: 2008 President and Treasurer of Fidelity's Equity and High Income Funds. Mr. Robins also serves as President and Treasurer (2010-present) and Assistant Treasurer (2009-present) of other Fidelity funds and is an employee of Fidelity Investments (2004-present). Previously, Mr. Robins served as Deputy Treasurer of the Fidelity funds (2005-2008) and Treasurer and Chief Financial Officer of The North Carolina Capital Management Trust: Cash and Term Portfolios (2006-2008). |
Brian B. Hogan (47) | |
| Year of Election or Appointment: 2009 Vice President of Equity and High Income Funds. Mr. Hogan also serves as President of FMR's Equity Division (2009-present). Previously, Mr. Hogan served as Senior Vice President, Equity Research of FMR (2006-2009) and as a portfolio manager. |
Thomas C. Hense (48) | |
| Year of Election or Appointment: 2008 or 2010 Vice President of Fidelity's High Income (2008), Small Cap (2008), and Value (2010) Funds. Previously, Mr. Hense served as a portfolio manager for Fidelity's Institutional Money Management Group (Pyramis) (2003-2008). |
Scott C. Goebel (44) | |
| Year of Election or Appointment: 2008 Secretary and Chief Legal Officer (CLO) of the Fidelity funds. Mr. Goebel also serves as Secretary of Fidelity Investments Money Management, Inc. (FIMM) (2010-present) and Fidelity Research and Analysis Company (FRAC) (2010-present); Secretary and CLO of The North Carolina Capital Management Trust: Cash and Term Portfolios (2008-present); General Counsel, Secretary, and Senior Vice President of FMR (2008-present) and FMR Co., Inc. (2008-present); employed by FMR LLC or an affiliate (2001-present); Chief Legal Officer of Fidelity Management & Research (Hong Kong) Limited (2008-present) and Assistant Secretary of Fidelity Management & Research (Japan) Inc. (2008-present), and Fidelity Management & Research (U.K.) Inc. (2008-present). Previously, Mr. Goebel served as Assistant Secretary of FIMM (2008-2010), FRAC (2008-2010), and the Funds (2007-2008) and as Vice President and Secretary of Fidelity Distributors Corporation (FDC) (2005-2007). |
William C. Coffey (42) | |
| Year of Election or Appointment: 2009 Assistant Secretary of Fidelity's Equity and High Income Funds. Mr. Coffey also serves as Senior Vice President and Deputy General Counsel of FMR LLC (2010-present), and is an employee of Fidelity Investments. Previously, Mr. Coffey served as Vice President and Associate General Counsel of FMR LLC (2005-2009). |
Holly C. Laurent (57) | |
| Year of Election or Appointment: 2008 Anti-Money Laundering (AML) Officer of the Fidelity funds. Ms. Laurent also serves as AML Officer of The North Carolina Capital Management Trust: Cash and Term Portfolios (2008-present) and is an employee of Fidelity Investments. Previously, Ms. Laurent was Senior Vice President and Head of Legal for Fidelity Business Services India Pvt. Ltd. (2006-2008), and Senior Vice President, Deputy General Counsel and Group Head for FMR LLC (2005-2006). |
Christine Reynolds (53) | |
| Year of Election or Appointment: 2008 Chief Financial Officer of the Fidelity funds. Ms. Reynolds became President of Fidelity Pricing and Cash Management Services (FPCMS) in August 2008. Ms. Reynolds served as Chief Operating Officer of FPCMS (2007-2008). Previously, Ms. Reynolds served as President, Treasurer, and Anti-Money Laundering officer of the Fidelity funds (2004-2007). |
Kenneth A. Rathgeber (64) | |
| Year of Election or Appointment: 2004 Chief Compliance Officer of Fidelity's Equity and High Income Funds. Mr. Rathgeber is Chief Compliance Officer of Fidelity Management & Research (Hong Kong) Limited (2008-present), Fidelity Management & Research (Japan) Inc. (2008-present), FMR (2005-present), FMR Co., Inc. (2005-present), Fidelity Management & Research (U.K.) Inc. (2005-present), Fidelity Research & Analysis Company (2005-present), Fidelity Investments Money Management, Inc. (2005-present), Pyramis Global Advisors, LLC (2005-present), and Strategic Advisers, Inc. (2005-present). |
Joseph F. Zambello (54) | |
| Year of Election or Appointment: 2011 Deputy Treasurer of the Fidelity funds. Mr. Zambello is an employee of Fidelity Investments. Previously, Mr. Zambello served as Vice President of FMR's Program Management Group (2009-2011) and Vice President of the Transfer Agent Oversight Group (2005-2009). |
Adrien E. Deberghes (44) | |
| Year of Election or Appointment: 2008 Deputy Treasurer of Fidelity's Equity and High Income Funds. Mr. Deberghes also serves as Vice President and Assistant Treasurer of Fidelity Rutland Square Trust II and Fidelity Commonwealth Trust II (2011-present), Assistant Treasurer of other Fidelity funds (2010-present), and is an employee of Fidelity Investments (2008-present). Previously, Mr. Deberghes served as Senior Vice President of Mutual Fund Administration at State Street Corporation (2007-2008), Senior Director of Mutual Fund Administration at Investors Bank & Trust (2005-2007), and Director of Finance for Dunkin' Brands (2000-2005). |
Stephanie J. Dorsey (42) | |
| Year of Election or Appointment: 2010 Assistant Treasurer of Fidelity's Equity and High Income Funds. Ms. Dorsey also serves as Deputy Treasurer of other Fidelity funds (2008-present) and is an employee of Fidelity Investments (2008-present). Previously, Ms. Dorsey served as Treasurer (2004-2008) of the JPMorgan Mutual Funds and Vice President (2004-2008) of JPMorgan Chase Bank. |
John R. Hebble (53) | |
| Year of Election or Appointment: 2009 Assistant Treasurer of Fidelity's Equity and High Income Funds. Mr. Hebble also serves as President (2011-present), Treasurer, and Chief Financial Officer of The North Carolina Capital Management Trust: Cash and Term Portfolios (2008-present), President and Treasurer of other Fidelity funds (2008-present) and is an employee of Fidelity Investments. |
Gary W. Ryan (53) | |
| Year of Election or Appointment: 2005 Assistant Treasurer of the Fidelity funds. Mr. Ryan is an employee of Fidelity Investments. Previously, Mr. Ryan served as Vice President of Fund Reporting in Fidelity Pricing and Cash Management Services (FPCMS) (1999-2005). |
Jonathan Davis (43) | |
| Year of Election or Appointment: 2010 Assistant Treasurer of the Fidelity funds. Mr. Davis is also Assistant Treasurer of Fidelity Rutland Square Trust II and Fidelity Commonwealth Trust II. Mr. Davis is an employee of Fidelity Investments. Previously, Mr. Davis served as Vice President and Associate General Counsel of FMR LLC (2003-2010). |
Annual Report
Distributions (Unaudited)
Stock Selector Large Cap Value designates 100% of the dividends distributed during the fiscal year as qualifying for the dividends-received deduction for corporate shareholders.
Stock Selector Large Cap Value designates 100% of the dividends distributed during the fiscal year as amounts which may be taken into account as a dividend for purposes of the maximum rate under section 1(h)(11) of the Internal Revenue Code.
The fund will notify shareholders in January 2013 of amounts for use in preparing 2012 income tax returns.
Annual Report
Managing Your Investments
Fidelity offers several ways to conveniently manage your personal investments via your telephone or PC. You can access your account information, conduct trades and research your investments 24 hours a day.
By Phone
Fidelity Automated Service Telephone provides a single toll-free number to access account balances, positions, quotes and trading. It's easy to navigate the service, and on your first call, the system will help you create a personal identification number (PIN) for security.
(phone graphic)Fidelity Automated
Service Telephone (FAST®)
1-800-544-5555
Press
1 For mutual fund and brokerage trading.
2 For quotes.*
3 For account balances and holdings.
4 To review orders and mutual
fund activity.
5 To change your PIN.
*0 To speak to a Fidelity representative.
By PC
Fidelity's web site on the Internet provides a wide range of information, including daily financial news, fund performance, interactive planning tools and news about Fidelity products and services.
(computer graphic)Fidelity's Web Site
www.fidelity.com
* When you call the quotes line, please remember that a fund's yield and return will vary and, except for money market funds, share price will also vary. This means that you may have a gain or loss when you sell your shares. There is no assurance that money market funds will be able to maintain a stable $1 share price; an investment in a money market fund is not insured or guaranteed by the U.S. government. Total returns are historical and include changes in share price, reinvestment of dividends and capital gains distributions, and the effects of any sales charges.
Annual Report
To Visit Fidelity
For directions and hours,
please call 1-800-544-9797.
Arizona
7001 West Ray Road
Chandler, AZ
15445 N. Scottsdale Road
Scottsdale, AZ
17550 North 75th Avenue
Glendale, AZ
5330 E. Broadway Blvd
Tucson, AZ
California
815 East Birch Street
Brea, CA
1411 Chapin Avenue
Burlingame, CA
851 East Hamilton Avenue
Campbell, CA
601 Larkspur Landing Circle
Larkspur, CA
2000 Avenue of the Stars
Los Angeles, CA
27101 Puerta Real
Mission Viejo, CA
73575 El Paseo
Palm Desert, CA
251 University Avenue
Palo Alto, CA
123 South Lake Avenue
Pasadena, CA
16656 Bernardo Ctr. Drive
Rancho Bernardo, CA
1220 Roseville Parkway
Roseville, CA
1740 Arden Way
Sacramento, CA
7676 Hazard Center Drive
San Diego, CA
11943 El Camino Real
San Diego, CA
8 Montgomery Street
San Francisco, CA
3793 State Street
Santa Barbara, CA
1200 Wilshire Boulevard
Santa Monica, CA
398 West El Camino Real
Sunnyvale, CA
111 South Westlake Blvd
Thousand Oaks, CA
21701 Hawthorne Boulevard
Torrance, CA
2001 North Main Street
Walnut Creek, CA
6326 Canoga Avenue
Woodland Hills, CA
2211 Michelson Drive
Irvine, CA
Colorado
281 East Flatiron Circle
Broomfield, CO
1625 Broadway
Denver, CO
9185 Westview Road
Lone Tree, CO
Connecticut
48 West Putnam Avenue
Greenwich, CT
265 Church Street
New Haven, CT
300 Atlantic Street
Stamford, CT
29 South Main Street
West Hartford, CT
1261 Post Road
Fairfield, CT
Delaware
400 Delaware Avenue
Wilmington, DE
Florida
175 East Altamonte Drive
Altamonte Springs, FL
1400 Glades Road
Boca Raton, FL
121 Alhambra Plaza
Coral Gables, FL
2948 N. Federal Highway
Ft. Lauderdale, FL
4671 Town Center Parkway
Jacksonville, FL
8880 Tamiami Trail, North
Naples, FL
230 Royal Palm Way
Palm Beach, FL
3501 PGA Boulevard
Palm Beach Gardens, FL
3550 Tamiami Trail, South
Sarasota, FL
1502 N. Westshore Blvd.
Tampa, FL
2465 State Road 7
Wellington, FL
Georgia
3242 Peachtree Road
Atlanta, GA
1000 Abernathy Road
Atlanta, GA
Illinois
One North LaSalle Street
Chicago, IL
401 North Michigan Avenue
Chicago, IL
One Skokie Valley Road
Highland Park, IL
1415 West 22nd Street
Oak Brook, IL
15105 S LaGrange Road
Orland Park, IL
1572 East Golf Road
Schaumburg, IL
1823 Freedom Drive
Naperville, IL
Indiana
8480 Keystone Crossing
Indianapolis, IN
Kansas
5400 College Boulevard
Overland Park, KS
Maine
Three Canal Plaza
Portland, ME
Maryland
7315 Wisconsin Avenue
Bethesda, MD
610 York Road
Towson, MD
Massachusetts
801 Boylston Street
Boston, MA
155 Congress Street
Boston, MA
300 Granite Street
Braintree, MA
44 Mall Road
Burlington, MA
238 Main Street
Cambridge, MA
200 Endicott Street
Danvers, MA
Annual Report
405 Cochituate Road
Framingham, MA
551 Boston Turnpike
Shrewsbury, MA
Michigan
500 E. Eisenhower Pkwy.
Ann Arbor, MI
280 N. Old Woodward Ave.
Birmingham, MI
30200 Northwestern Hwy.
Farmington Hills, MI
43420 Grand River Avenue
Novi, MI
3480 28th Street
Grand Rapids, MI
2425 S. Linden Road STE E
Flint, MI
Minnesota
7740 France Avenue South
Edina, MN
8342 3rd Street North
Oakdale, MN
Missouri
1524 South Lindbergh Blvd.
St. Louis, MO
Nevada
2225 Village Walk Drive
Henderson, NV
New Jersey
501 Route 73 South
Marlton, NJ
150 Essex Street
Millburn, NJ
35 Morris Street
Morristown, NJ
396 Route 17, North
Paramus, NJ
3518 Route 1 North
Princeton, NJ
530 Broad Street
Shrewsbury, NJ
New Mexico
2261 Q Street NE
Albuquerque, NM
New York
1130 Franklin Avenue
Garden City, NY
37 West Jericho Turnpike
Huntington Station, NY
1271 Avenue of the Americas
New York, NY
980 Madison Avenue
New York, NY
61 Broadway
New York, NY
350 Park Avenue
New York, NY
200 Fifth Avenue
New York, NY
733 Third Avenue
New York, NY
2070 Broadway
New York, NY
1075 Northern Blvd.
Roslyn, NY
799 Central Park Avenue
Scarsdale, NY
3349 Monroe Avenue
Rochester, NY
North Carolina
4611 Sharon Road
Charlotte, NC
7011 Fayetteville Road
Durham, NC
Ohio
3805 Edwards Road
Cincinnati, OH
1324 Polaris Parkway
Columbus, OH
1800 Crocker Road
Westlake, OH
28699 Chagrin Boulevard
Woodmere Village, OH
Oregon
7493 SW Bridgeport Road
Tigard, OR
Pennsylvania
600 West DeKalb Pike
King of Prussia, PA
1735 Market Street
Philadelphia, PA
12001 Perry Highway
Wexford, PA
Rhode Island
10 Memorial Boulevard
Providence, RI
Tennessee
3018 Peoples Street
Johnson City, TN
7628 West Farmington Blvd.
Germantown, TN
2035 Mallory Lane
Franklin, TN
Texas
10000 Research Boulevard
Austin, TX
4001 Northwest Parkway
Dallas, TX
12532 Memorial Drive
Houston, TX
2701 Drexel Drive
Houston, TX
6560 Fannin Street
Houston, TX
1701 Lake Robbins Drive
The Woodlands, TX
6500 N. MacArthur Blvd.
Irving, TX
6005 West Park Boulevard
Plano, TX
1576 East Southlake Blvd.
Southlake, TX
15600 Southwest Freeway
Sugar Land, TX
139 N. Loop 1604 East
San Antonio, TX
Utah
279 West South Temple
Salt Lake City, UT
Virginia
1861 International Drive
McLean, VA
11957 Democracy Drive
Reston, VA
Washington
10500 NE 8th Street
Bellevue, WA
1518 6th Avenue
Seattle, WA
304 Strander Blvd
Tukwila, WA
Washington, DC
1900 K Street, N.W.
Washington, DC
Wisconsin
16020 West Bluemound Road
Brookfield, WI
Fidelity Brokerage Services, Inc., 100 Summer St., Boston, MA 02110 Member NYSE/SIPC
Annual Report
To Write Fidelity
We'll give your correspondence immediate attention and send you written confirmation upon completion of your request.
(envelope graphic)Making Changes
To Your Account
(such as changing name, address, bank, etc.)
Fidelity Investments
P.O. Box 770001
Cincinnati, OH 45277-0002
(envelope graphic)For Non-Retirement
Accounts
Buying shares
Fidelity Investments
P.O. Box 770001
Cincinnati, OH 45277-0003
Overnight Express
Fidelity Investments
Attn: Distribution Services
100 Crosby Parkway - KC1H
Covington, KY 41015
Selling shares
Fidelity Investments
P.O. Box 770001
Cincinnati, OH 45277-0035
Overnight Express
Fidelity Investments
Attn: Distribution Services
100 Crosby Parkway - KC1H
Covington, KY 41015
General Correspondence
Fidelity Investments
P.O. Box 500
Merrimack, NH 03054-0500
(envelope graphic)For Retirement
Accounts
Buying shares
Fidelity Investments
P.O. Box 770001
Cincinnati, OH 45277-0003
Selling shares
Fidelity Investments
P.O. Box 770001
Cincinnati, OH 45277-0035
Overnight Express
Fidelity Investments
Attn: Distribution Services
100 Crosby Parkway - KC1H
Covington, KY 41015
General Correspondence
Fidelity Investments
P.O. Box 500
Merrimack, NH 03054-0500
Annual Report
Investment Adviser
Fidelity Management & Research Company
Boston, MA
Investment Sub-Advisers
FMR Co., Inc.
Fidelity Management & Research
(U.K.) Inc.
Fidelity Management & Research
(Hong Kong) Limited
Fidelity Management & Research
(Japan) Inc.
General Distributor
Fidelity Distributors Corporation
Boston, MA
Transfer and Service Agents
Fidelity Investments Institutional
Operations Company, Inc.
Boston, MA
Fidelity Service Company, Inc.
Boston, MA
Custodian
Citibank, N.A.
New York, NY
The Fidelity Telephone Connection
Mutual Fund 24-Hour Service
Exchanges/Redemptions
and Account Assistance 1-800-544-6666
Product Information 1-800-544-6666
Retirement Accounts 1-800-544-4774
(8 a.m. - 9 p.m.)
TDD Service 1-800-544-0118
for the deaf and hearing impaired
(9 a.m. - 9 p.m. Eastern time)
Fidelity Automated Service
Telephone (FAST®)
1-800-544-5555
Automated line for quickest service
LCV-UANN-0312
1.900193.102
(Fidelity Investment logo)(registered trademark)
Corporate Headquarters
82 Devonshire St., Boston, MA 02109
www.fidelity.com
(Fidelity Investment logo)(registered trademark)
Fidelity Advisor®
Stock Selector
Large Cap Value
Fund - Class A, Class T, Class B
and Class C
(formerly Fidelity Advisor Large Cap Value Fund)
Annual Report
January 31, 2012
(Fidelity Cover Art)
Class A, Class T, Class B,
and Class C are classes of
Fidelity® Stock Selector Large
Cap Value Fund
Contents
Chairman's Message | The Chairman's message to shareholders. | |
Performance | How the fund has done over time. | |
Management's Discussion of Fund Performance | The Portfolio Manager's review of fund performance and strategy. | |
Shareholder Expense Example | An example of shareholder expenses. | |
Investment Changes | A summary of major shifts in the fund's investments over the past six months. | |
Investments | A complete list of the fund's investments with their market values. | |
Financial Statements | Statements of assets and liabilities, operations, and changes in net assets, as well as financial highlights. | |
Notes | Notes to the financial statements. | |
Report of Independent Registered Public Accounting Firm |
| |
Trustees and Officers |
| |
Distributions |
|
To view a fund's proxy voting guidelines and proxy voting record for the 12-month period ended June 30, visit http://www.fidelity.com/proxyvotingresults or visit the Securities and Exchange Commission's (SEC) web site at http://www.sec.gov. You may also call 1-877-208-0098 to request a free copy of the proxy voting guidelines.
Standard & Poor's, S&P and S&P 500 are registered service marks of The McGraw-Hill Companies, Inc. and have been licensed for use by Fidelity Distributors Corporation.
Other third party marks appearing herein are the property of their respective owners.
All other marks appearing herein are registered or unregistered trademarks or service marks of FMR LLC or an affiliated company.
Annual Report
This report and the financial statements contained herein are submitted for the general information of the shareholders of the fund. This report is not authorized for distribution to prospective investors in the fund unless preceded or accompanied by an effective prospectus.
A fund files its complete schedule of portfolio holdings with the SEC for the first and third quarters of each fiscal year on Form N-Q. Forms N-Q are available on the SEC's web site at http://www.sec.gov. A fund's Forms N-Q may be reviewed and copied at the SEC's Public Reference Room in Washington, DC. Information regarding the operation of the SEC's Public Reference Room may be obtained by calling 1-800-SEC-0330. For a complete list of a fund's portfolio holdings, view the most recent holdings listing, semiannual report, or annual report on Fidelity's web site at http://www.fidelity.com, http://www.advisor.fidelity.com, or http://www.401k.com, as applicable.
NOT FDIC INSURED • MAY LOSE VALUE • NO BANK GUARANTEE
Neither the fund nor Fidelity Distributors Corporation is a bank.
Annual Report
Chairman's Message
(photo_of_James_C_Curvey)
Dear Shareholder:
Following a year marked by unusually high volatility, 2012 began with most major asset classes advancing steadily in January. For U.S. equities, it was the strongest start to a new year since 1997. International stocks fared even better, despite continued uncertainty related to the sovereign debt crisis in Europe. Investors have been acutely sensitive to the latest news, for better or worse, coming out of the eurozone and its impact on financial markets. As we look ahead, the unresolved debt crisis in Europe remains at the center of a series of risk factors, summarized below, that we believe have the greatest potential to influence the global investment landscape.
Deleveraging and the economy
In the euro-currency area, fiscal austerity among nations and debt deleveraging among financial companies loaded with sovereign debt are deflationary measures and serve to hinder economic growth in the short term. Such an economic and financial-market scenario has not been historically supportive of strong performance among riskier assets, and emerges at a time when many nations need a resurgent economy to assist them in closing their budget deficits and in building confidence among bond buyers to help them refinance their existing debt obligations.
Slowdown in China and Europe
China's economy is the second-largest in the world, and it has been the biggest contributor to global growth since the end of the last recession. Thus, the slower pace of domestic growth in China has led to lower demand for imports of commodities and other construction materials from the rest of the world. In addition, economic weakness in Europe and the broad-based global economic slowdown are putting pressure on China's export growth, which has been largely responsible for its breakneck pace of annual gross domestic product (GDP) growth during the past three decades.
Credit deterioration and contagion
The heightened macroeconomic risk and elevated credit risk swirling around certain European nations and financial institutions have caused many market participants to avoid purchases of or reduce exposure to short-term debt offerings by these issuers. With increased credit risk, there are growing concerns about the potential credit contraction and contagion from European issuers spreading to other financial markets.
We invite you to learn more by visiting us on the Internet or calling us by phone. It is our privilege to provide the resources you need to choose investments that are right for you.
Sincerely,
(The acting chairman's signature appears here.)
James C. Curvey
Acting Chairman
Annual Report
Performance: The Bottom Line
Average annual total return reflects the change in the value of an investment, assuming reinvestment of the class' distributions from dividend income and capital gains (the profits earned upon the sale of securities that have grown in value, if any) and assuming a constant rate of performance each year. The $10,000 table does not reflect the deduction of taxes that a shareholder would pay on fund distributions or the redemption of fund shares. During periods of reimbursement by Fidelity, a fund's total return will be greater than it would be had the reimbursement not occurred. How a fund did yesterday is no guarantee of how it will do tomorrow.
Average Annual Total Returns
Periods ended January 31, 2012 | Past 1 | Past 5 | Past 10 |
Class A (incl. 5.75% sales charge) A | -4.26% | -5.48% | 2.16% |
Class T (incl. 3.50% sales charge) B | -2.28% | -5.31% | 2.25% |
Class B (incl. contingent deferred | -4.14% | -5.45% | 2.36% |
Class C (incl. contingent deferred | -0.15% | -5.03% | 2.40% |
A Class A shares bear a 0.25% 12b-1 fee. The initial offering of Class A shares took place on February 13, 2007. Returns prior to February 13, 2007 are those of Fidelity® Large Cap Value Fund, the original class of the fund, which has no 12b-1 fee. Had Class A shares' 12b-1 fee been reflected, returns prior to February 13, 2007 would have been lower.
B Class T shares bear a 0.50% 12b-1 fee. The initial offering of Class T shares took place on February 13, 2007. Returns prior to February 13, 2007 are those of Fidelity® Large Cap Value Fund, the original class of the fund, which has no 12b-1 fee. Had Class T shares' 12b-1 fee been reflected, returns prior to February 13, 2007 would have been lower.
C Class B shares bear a 1.00% 12b-1 fee. The initial offering of Class B shares took place on February 13, 2007. Returns prior to February 13, 2007 are those of Fidelity Large Cap Value Fund, the original class of the fund, which has no 12b-1 fee. Had Class B shares' 12b-1 fee been reflected, returns prior to February 13, 2007 would have been lower. Class B shares' contingent deferred sales charge included in the past one year, past five years, and life of fund total return figures are 5%, 2%, and 0%, respectively.
D Class C shares bear a 1.00% 12b-1 fee. The initial offering of Class C shares took place on February 13, 2007. Returns prior to February 13, 2007 are those of Fidelity Large Cap Value Fund, the original class of the fund, which has no 12b-1 fee. Had Class C shares' 12b-1 fee been reflected, returns prior to February 13, 2007 would have been lower. Class C shares' contingent deferred sales charge included in the past one year, past five years, and life of fund total return figures are 1%, 0%, and 0%, respectively.
Annual Report
$10,000 Over 10 Years
Let's say hypothetically that $10,000 was invested in Fidelity Advisor® Stock Selector Large Cap Value Fund - Class A on January 31, 2002. The chart shows how the value of your investment would have changed, and also shows how the Russell 1000® Value Index performed over the same period. The initial offering of Class A took place on February 13, 2007. See the previous page for additional information regarding the performance of Class A.
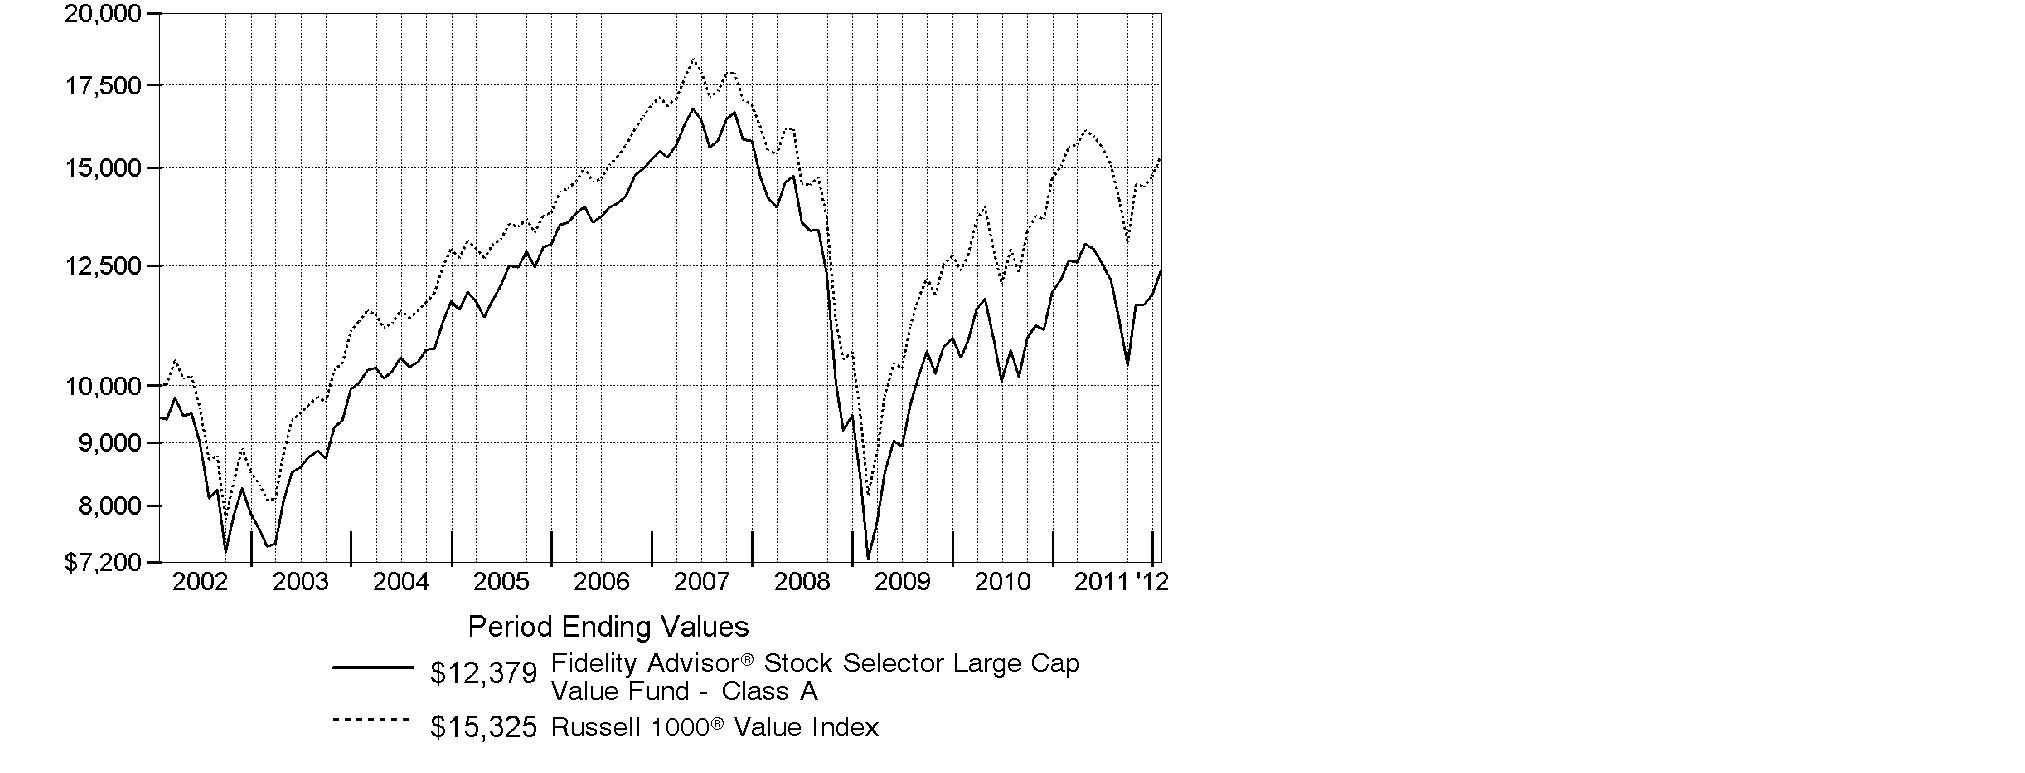
Annual Report
Management's Discussion of Fund Performance
Market Recap: After enduring one of the most volatile trading periods on record, U.S. stocks posted a gain for the 12 months ending January 31, 2012, sparked by a January rally. Strong corporate earnings reports and hints of economic recovery sent stocks mostly upward through April, when sovereign debt woes in Europe sparked fear of a global slowdown. In the summer, equities plummeted on eurozone instability, debate over the U.S. debt ceiling and a historic downgrade of the nation's sovereign debt rating. After falling as much as 13% by early August, the broad-based S&P 500® Index seesawed back to end the period on an optimistic note. For the full 12 months, the S&P 500® rose 4.22%, while the technology-laden Nasdaq Composite® Index added 5.26%. Investors began to shed perceived riskier smaller-cap stocks in favor of larger, more-established and dividend-paying names, helping to drive the Dow Jones® Industrial Average up 9.12% for the year, while the Russell 2000® - a proxy for small-caps - and Russell Midcap® indexes added 2.86% and 2.25%, respectively. Within the S&P 500®, defensive sectors such as health care (+16%) and utilities (+14%) fared best, while financials (-12%) struggled. Foreign developed-markets stocks were stung by Europe's turmoil, and the MSCI® EAFE® (Europe, Australasia, Far East) Index fell 9.49%.
Comments from Bruce Dirks, Lead Portfolio Manager of Fidelity Advisor® Stock Selector Large Cap Value Fund: For the year, the fund's Class A, Class T, Class B and Class C shares returned 1.58%, 1.26%, 0.86% and 0.85%, respectively (excluding sales charges), versus 1.88% for the Russell 1000® Value Index. During the period, the fund transitioned to a multi-manager structure and its name was subsequently changed. Strong security selection in financials, coupled with substantially underweighting diversified financials - which was by far the poorest-performing industry group - helped the fund's relative return, as did stock picks in energy. On the downside, stock choices in telecommunication services, health care and information technology notably hampered performance. Four of the five top individual contributors were underweightings in diversified financial services providers Bank of America, Citigroup, Goldman Sachs Group and JPMorgan Chase, whose stocks declined by double digits. I sold all four by period end. An out-of-benchmark stake in real estate investment company Kennedy-Wilson Holdings also aided results. Detractors included Puerto Rico-based regional bank Popular, offshore oil driller Transocean - also not in the benchmark - technology manufacturer Hewlett-Packard, wireless communications provider NII Holdings and hospital operator Community Health Systems. Not owning semiconductor maker and index component Intel also hurt. Transocean was not held at period end.
Annual Report
The views expressed above reflect those of the portfolio manager(s) only through the end of the period as stated on the cover of this report and do not necessarily represent the views of Fidelity or any other person in the Fidelity organization. Any such views are subject to change at any time based upon market or other conditions and Fidelity disclaims any responsibility to update such views. These views may not be relied on as investment advice and, because investment decisions for a Fidelity fund are based on numerous factors, may not be relied on as an indication of trading intent on behalf of any Fidelity fund.
Annual Report
Shareholder Expense Example
As a shareholder of the Fund, you incur two types of costs: (1) transaction costs, including sales charges (loads) on purchase payments or redemption proceeds, and (2) ongoing costs, including management fees, distribution and/or service (12b-1) fees and other Fund expenses. This Example is intended to help you understand your ongoing costs (in dollars) of investing in the Fund and to compare these costs with the ongoing costs of investing in other mutual funds.
The Example is based on an investment of $1,000 invested at the beginning of the period and held for the entire period (August 1, 2011 to January 31, 2012).
Actual Expenses
The first line of the accompanying table for each class of the Fund provides information about actual account values and actual expenses. You may use the information in this line, together with the amount you invested, to estimate the expenses that you paid over the period. Simply divide your account value by $1,000.00 (for example, an $8,600 account value divided by $1,000.00 = 8.6), then multiply the result by the number in the first line for a class of the Fund under the heading entitled "Expenses Paid During Period" to estimate the expenses you paid on your account during this period. A small balance maintenance fee of $12.00 that is charged once a year may apply for certain accounts with a value of less than $2,000. This fee is not included in the table below. If it was, the estimate of expenses you paid during the period would be higher, and your ending account value lower, by this amount. In addition, the Fund, as a shareholder in the underlying Fidelity Central Funds, will indirectly bear its pro-rata share of the fees and expenses incurred by the underlying Fidelity Central Funds. These fees and expenses are not included in the Fund's annualized expense ratio used to calculate the expense estimate in the table below.
Hypothetical Example for Comparison Purposes
The second line of the accompanying table for each class of the Fund provides information about hypothetical account values and hypothetical expenses based on a Class' actual expense ratio and an assumed rate of return of 5% per year before expenses, which is not the Class' actual return. The hypothetical account values and expenses may not be used to estimate the actual ending account balance or expenses you paid for the period. You may use this information to compare the ongoing costs of investing in the Fund and other funds. To do so, compare this 5% hypothetical example with the 5% hypothetical examples that appear in the shareholder reports of the other funds. A small balance maintenance fee of $12.00 that is charged once a year may apply for certain accounts with a value of less than $2,000. This fee is not included in the table below. If it was, the estimate of expenses you paid during the period would be higher, and your ending account value lower, by this amount. In addition, the Fund, as a shareholder in the underlying Fidelity Central Funds, will indirectly bear its pro-rata share of the fees and expenses incurred by the underlying Fidelity Central Funds. These fees and expenses are not included in the Fund's annualized expense ratio used to calculate the expense estimate in the table below.
Please note that the expenses shown in the table are meant to highlight your ongoing costs only and do not reflect any transaction costs. Therefore, the second line of the table is useful in comparing ongoing costs only, and will not help you determine the relative total costs of owning different funds. In addition, if these transactional costs were included, your costs would have been higher.
Annual Report
| Annualized | Beginning | Ending | Expenses Paid |
Class A | .85% |
|
|
|
Actual |
| $ 1,000.00 | $ 1,018.60 | $ 4.32 |
Hypothetical A |
| $ 1,000.00 | $ 1,020.92 | $ 4.33 |
Class T | 1.12% |
|
|
|
Actual |
| $ 1,000.00 | $ 1,016.40 | $ 5.69 |
Hypothetical A |
| $ 1,000.00 | $ 1,019.56 | $ 5.70 |
Class B | 1.60% |
|
|
|
Actual |
| $ 1,000.00 | $ 1,015.20 | $ 8.13 |
Hypothetical A |
| $ 1,000.00 | $ 1,017.14 | $ 8.13 |
Class C | 1.60% |
|
|
|
Actual |
| $ 1,000.00 | $ 1,014.20 | $ 8.12 |
Hypothetical A |
| $ 1,000.00 | $ 1,017.14 | $ 8.13 |
Stock Selector Large Cap Value | .56% |
|
|
|
Actual |
| $ 1,000.00 | $ 1,019.50 | $ 2.85 |
Hypothetical A |
| $ 1,000.00 | $ 1,022.38 | $ 2.85 |
Institutional Class | .57% |
|
|
|
Actual |
| $ 1,000.00 | $ 1,020.10 | $ 2.90 |
Hypothetical A |
| $ 1,000.00 | $ 1,022.33 | $ 2.91 |
A 5% return per year before expenses
* Expenses are equal to each Class' annualized expense ratio, multiplied by the average account value over the period, multiplied by 184/365 (to reflect the one-half year period).
Annual Report
Investment Changes (Unaudited)
Top Ten Stocks as of January 31, 2012 | ||
| % of fund's | % of fund's net assets |
Royal Dutch Shell PLC Class A sponsored ADR | 2.8 | 2.7 |
Pfizer, Inc. | 2.8 | 2.2 |
General Electric Co. | 2.8 | 2.5 |
Wells Fargo & Co. | 2.8 | 2.9 |
AT&T, Inc. | 2.7 | 2.7 |
Berkshire Hathaway, Inc. Class B | 2.7 | 2.8 |
Cisco Systems, Inc. | 2.3 | 2.3 |
Merck & Co., Inc. | 2.1 | 2.0 |
Kennedy-Wilson Holdings, Inc. | 2.1 | 1.2 |
Procter & Gamble Co. | 2.0 | 2.0 |
| 25.1 | |
Top Five Market Sectors as of January 31, 2012 | ||
| % of fund's | % of fund's net assets |
Financials | 25.0 | 26.1 |
Health Care | 12.4 | 11.9 |
Energy | 12.4 | 13.1 |
Industrials | 9.0 | 9.1 |
Information Technology | 8.9 | 8.7 |
Asset Allocation (% of fund's net assets) | |||||||
As of January 31, 2012* | As of July 31, 2011** | ||||||
| Stocks and |
| | Stocks 99.7% |
| ||
| Short-Term |
| | Short-Term |
| ||
* Foreign investments | 14.1% |
| ** Foreign investments | 16.1% |
| ||

Annual Report
Investments January 31, 2012
Showing Percentage of Net Assets
Common Stocks - 98.7% | |||
Shares | Value | ||
CONSUMER DISCRETIONARY - 8.6% | |||
Auto Components - 0.6% | |||
Autoliv, Inc. (d) | 51,900 | $ 3,274,371 | |
Hotels, Restaurants & Leisure - 0.8% | |||
Carnival Corp. unit | 46,800 | 1,413,360 | |
Penn National Gaming, Inc. (a) | 63,449 | 2,597,602 | |
| 4,010,962 | ||
Household Durables - 0.8% | |||
Jarden Corp. | 118,995 | 4,008,942 | |
Media - 3.3% | |||
Comcast Corp. Class A | 209,975 | 5,583,235 | |
The Walt Disney Co. | 190,400 | 7,406,560 | |
Time Warner, Inc. | 108,500 | 4,021,010 | |
| 17,010,805 | ||
Multiline Retail - 1.6% | |||
Macy's, Inc. | 96,400 | 3,247,716 | |
Target Corp. | 102,534 | 5,209,753 | |
| 8,457,469 | ||
Specialty Retail - 1.5% | |||
Best Buy Co., Inc. | 90,400 | 2,165,080 | |
Lowe's Companies, Inc. | 197,363 | 5,295,249 | |
| 7,460,329 | ||
TOTAL CONSUMER DISCRETIONARY | 44,222,878 | ||
CONSUMER STAPLES - 7.6% | |||
Beverages - 0.8% | |||
Coca-Cola Enterprises, Inc. | 82,770 | 2,217,408 | |
PepsiCo, Inc. | 27,680 | 1,817,746 | |
| 4,035,154 | ||
Food & Staples Retailing - 1.4% | |||
CVS Caremark Corp. | 65,490 | 2,734,208 | |
Kroger Co. | 105,430 | 2,505,017 | |
Walgreen Co. | 58,340 | 1,946,222 | |
| 7,185,447 | ||
Food Products - 3.1% | |||
Archer Daniels Midland Co. | 73,630 | 2,108,027 | |
ConAgra Foods, Inc. | 101,310 | 2,701,938 | |
Kraft Foods, Inc. Class A | 147,390 | 5,645,037 | |
Common Stocks - continued | |||
Shares | Value | ||
CONSUMER STAPLES - continued | |||
Food Products - continued | |||
Sara Lee Corp. | 125,940 | $ 2,411,751 | |
The J.M. Smucker Co. | 36,920 | 2,908,558 | |
| 15,775,311 | ||
Household Products - 2.0% | |||
Procter & Gamble Co. | 167,780 | 10,576,851 | |
Tobacco - 0.3% | |||
Lorillard, Inc. | 14,400 | 1,546,416 | |
TOTAL CONSUMER STAPLES | 39,119,179 | ||
ENERGY - 12.4% | |||
Energy Equipment & Services - 0.8% | |||
Halliburton Co. | 118,146 | 4,345,410 | |
Oil, Gas & Consumable Fuels - 11.6% | |||
Anadarko Petroleum Corp. | 64,920 | 5,240,342 | |
Apache Corp. | 37,692 | 3,726,985 | |
BP PLC sponsored ADR | 49,200 | 2,258,772 | |
Canadian Natural Resources Ltd. | 115,570 | 4,577,851 | |
Chevron Corp. | 49,500 | 5,102,460 | |
HollyFrontier Corp. | 56,600 | 1,660,644 | |
Marathon Petroleum Corp. | 90,000 | 3,439,800 | |
Noble Energy, Inc. | 41,580 | 4,185,859 | |
Occidental Petroleum Corp. | 92,378 | 9,216,553 | |
Royal Dutch Shell PLC Class A sponsored ADR | 204,576 | 14,598,541 | |
Suncor Energy, Inc. | 63,800 | 2,197,609 | |
Williams Companies, Inc. | 121,198 | 3,492,926 | |
| 59,698,342 | ||
TOTAL ENERGY | 64,043,752 | ||
FINANCIALS - 25.0% | |||
Capital Markets - 3.5% | |||
Bank of New York Mellon Corp. | 238,000 | 4,790,940 | |
Invesco Ltd. | 189,800 | 4,283,786 | |
Morgan Stanley | 175,800 | 3,278,670 | |
State Street Corp. | 138,500 | 5,426,430 | |
| 17,779,826 | ||
Commercial Banks - 8.0% | |||
CIT Group, Inc. (a) | 109,700 | 4,183,958 | |
Itau Unibanco Banco Multiplo SA sponsored ADR | 200,500 | 4,001,980 | |
Common Stocks - continued | |||
Shares | Value | ||
FINANCIALS - continued | |||
Commercial Banks - continued | |||
PNC Financial Services Group, Inc. | 105,400 | $ 6,210,168 | |
Popular, Inc. (a) | 1,362,500 | 2,139,125 | |
Regions Financial Corp. | 450,000 | 2,349,000 | |
U.S. Bancorp | 294,900 | 8,322,078 | |
Wells Fargo & Co. | 486,700 | 14,216,507 | |
| 41,422,816 | ||
Consumer Finance - 0.9% | |||
SLM Corp. | 302,800 | 4,526,860 | |
Insurance - 8.3% | |||
ACE Ltd. | 73,700 | 5,129,520 | |
AFLAC, Inc. | 96,950 | 4,675,899 | |
Allstate Corp. | 162,900 | 4,699,665 | |
Berkshire Hathaway, Inc. Class B (a) | 175,257 | 13,734,891 | |
MetLife, Inc. | 139,400 | 4,925,002 | |
StanCorp Financial Group, Inc. | 63,000 | 2,435,580 | |
Torchmark Corp. | 68,850 | 3,144,380 | |
XL Group PLC Class A | 199,200 | 4,037,784 | |
| 42,782,721 | ||
Real Estate Investment Trusts - 1.5% | |||
American Tower Corp. | 50,100 | 3,181,851 | |
Public Storage | 32,200 | 4,471,292 | |
| 7,653,143 | ||
Real Estate Management & Development - 2.1% | |||
Kennedy-Wilson Holdings, Inc. | 792,800 | 10,647,304 | |
Thrifts & Mortgage Finance - 0.7% | |||
People's United Financial, Inc. | 310,000 | 3,822,300 | |
TOTAL FINANCIALS | 128,634,970 | ||
HEALTH CARE - 12.4% | |||
Biotechnology - 1.1% | |||
Amgen, Inc. | 81,400 | 5,527,874 | |
Health Care Equipment & Supplies - 0.9% | |||
Baxter International, Inc. | 4,100 | 227,468 | |
Covidien PLC | 28,900 | 1,488,350 | |
Zimmer Holdings, Inc. | 47,800 | 2,903,850 | |
| 4,619,668 | ||
Common Stocks - continued | |||
Shares | Value | ||
HEALTH CARE - continued | |||
Health Care Providers & Services - 2.2% | |||
Aetna, Inc. | 14,600 | $ 638,020 | |
Cardinal Health, Inc. | 33,800 | 1,454,414 | |
Community Health Systems, Inc. (a) | 58,000 | 1,084,600 | |
Express Scripts, Inc. (a) | 9,000 | 460,440 | |
Quest Diagnostics, Inc. | 6,100 | 354,288 | |
UnitedHealth Group, Inc. | 101,200 | 5,241,148 | |
WellPoint, Inc. | 38,000 | 2,444,160 | |
| 11,677,070 | ||
Life Sciences Tools & Services - 0.6% | |||
Thermo Fisher Scientific, Inc. (a) | 56,442 | 2,985,782 | |
Pharmaceuticals - 7.6% | |||
Bristol-Myers Squibb Co. | 65,600 | 2,114,944 | |
Johnson & Johnson | 156,900 | 10,341,279 | |
Merck & Co., Inc. | 287,400 | 10,995,924 | |
Pfizer, Inc. | 674,900 | 14,442,860 | |
Sanofi-aventis sponsored ADR | 38,300 | 1,422,079 | |
| 39,317,086 | ||
TOTAL HEALTH CARE | 64,127,480 | ||
INDUSTRIALS - 9.0% | |||
Aerospace & Defense - 1.2% | |||
Meggitt PLC | 276,784 | 1,583,448 | |
Raytheon Co. | 95,800 | 4,597,442 | |
| 6,180,890 | ||
Airlines - 0.4% | |||
SkyWest, Inc. | 142,000 | 1,817,600 | |
Commercial Services & Supplies - 1.4% | |||
Corrections Corp. of America (a) | 110,700 | 2,604,771 | |
Republic Services, Inc. | 166,300 | 4,869,264 | |
| 7,474,035 | ||
Construction & Engineering - 0.8% | |||
Foster Wheeler AG (a) | 192,100 | 4,314,566 | |
Industrial Conglomerates - 2.8% | |||
General Electric Co. | 771,100 | 14,427,281 | |
Machinery - 0.4% | |||
Stanley Black & Decker, Inc. | 26,517 | 1,860,963 | |
Road & Rail - 2.0% | |||
Con-way, Inc. | 94,000 | 2,983,560 | |
Common Stocks - continued | |||
Shares | Value | ||
INDUSTRIALS - continued | |||
Road & Rail - continued | |||
Quality Distribution, Inc. (a) | 252,349 | $ 3,098,846 | |
Union Pacific Corp. | 39,000 | 4,458,090 | |
| 10,540,496 | ||
TOTAL INDUSTRIALS | 46,615,831 | ||
INFORMATION TECHNOLOGY - 8.9% | |||
Communications Equipment - 2.3% | |||
Cisco Systems, Inc. | 607,700 | 11,929,151 | |
Computers & Peripherals - 1.7% | |||
Hewlett-Packard Co. | 305,127 | 8,537,453 | |
Electronic Equipment & Components - 1.3% | |||
Corning, Inc. | 349,798 | 4,501,900 | |
Jabil Circuit, Inc. | 101,648 | 2,303,344 | |
| 6,805,244 | ||
Internet Software & Services - 0.6% | |||
eBay, Inc. (a) | 99,271 | 3,136,964 | |
Semiconductors & Semiconductor Equipment - 2.8% | |||
Freescale Semiconductor Holdings I Ltd. (d) | 174,459 | 2,786,110 | |
Intersil Corp. Class A | 292,238 | 3,290,600 | |
Marvell Technology Group Ltd. (a) | 364,264 | 5,657,020 | |
Micron Technology, Inc. (a) | 357,700 | 2,714,943 | |
| 14,448,673 | ||
Software - 0.2% | |||
CA, Inc. | 29,160 | 751,745 | |
TOTAL INFORMATION TECHNOLOGY | 45,609,230 | ||
MATERIALS - 2.9% | |||
Chemicals - 2.0% | |||
Air Products & Chemicals, Inc. | 23,350 | 2,055,501 | |
Ashland, Inc. | 63,000 | 3,972,780 | |
Celanese Corp. Class A | 25,050 | 1,220,186 | |
LyondellBasell Industries NV Class A | 66,520 | 2,867,012 | |
| 10,115,479 | ||
Containers & Packaging - 0.3% | |||
Rock-Tenn Co. Class A | 26,970 | 1,668,364 | |
Common Stocks - continued | |||
Shares | Value | ||
MATERIALS - continued | |||
Metals & Mining - 0.6% | |||
Anglo American PLC (United Kingdom) | 77,139 | $ 3,190,025 | |
TOTAL MATERIALS | 14,973,868 | ||
TELECOMMUNICATION SERVICES - 4.4% | |||
Diversified Telecommunication Services - 3.2% | |||
AT&T, Inc. | 471,500 | 13,866,815 | |
CenturyLink, Inc. | 78,314 | 2,899,967 | |
| 16,766,782 | ||
Wireless Telecommunication Services - 1.2% | |||
NII Holdings, Inc. (a) | 219,200 | 4,408,112 | |
Sprint Nextel Corp. (a) | 739,700 | 1,568,164 | |
| 5,976,276 | ||
TOTAL TELECOMMUNICATION SERVICES | 22,743,058 | ||
UTILITIES - 7.5% | |||
Electric Utilities - 3.6% | |||
Cleco Corp. | 39,800 | 1,582,448 | |
Duke Energy Corp. | 193,300 | 4,119,223 | |
FirstEnergy Corp. | 92,600 | 3,909,572 | |
NextEra Energy, Inc. | 80,810 | 4,836,479 | |
PPL Corp. | 142,800 | 3,968,412 | |
| 18,416,134 | ||
Gas Utilities - 0.0% | |||
ONEOK, Inc. | 1,820 | 151,351 | |
Independent Power Producers & Energy Traders - 0.7% | |||
Calpine Corp. (a) | 94,230 | 1,375,758 | |
The AES Corp. (a) | 186,890 | 2,384,716 | |
| 3,760,474 | ||
Multi-Utilities - 3.2% | |||
CMS Energy Corp. | 142,100 | 3,102,043 | |
National Grid PLC sponsored ADR (d) | 74,130 | 3,698,346 | |
Common Stocks - continued | |||
Shares | Value | ||
UTILITIES - continued | |||
Multi-Utilities - continued | |||
OGE Energy Corp. | 50,940 | $ 2,692,688 | |
Sempra Energy | 122,550 | 6,973,095 | |
| 16,466,172 | ||
TOTAL UTILITIES | 38,794,131 | ||
TOTAL COMMON STOCKS (Cost $522,045,385) |
| ||
Nonconvertible Preferred Stocks - 0.1% | |||
|
|
|
|
CONSUMER DISCRETIONARY - 0.1% | |||
Automobiles - 0.1% | |||
Volkswagen AG (Cost $847,577) | 4,300 |
| |
U.S. Treasury Obligations - 0.3% | ||||
| Principal Amount |
| ||
U.S. Treasury Bills, yield at date of purchase 0% to 0.01% 2/23/12 (e) | $ 1,350,000 |
| ||
Money Market Funds - 2.8% | |||
Shares |
| ||
Fidelity Cash Central Fund, 0.12% (b) | 8,051,708 | 8,051,708 | |
Fidelity Securities Lending Cash Central Fund, 0.12% (b)(c) | 6,580,950 | 6,580,950 | |
TOTAL MONEY MARKET FUNDS (Cost $14,632,658) |
| ||
TOTAL INVESTMENT PORTFOLIO - 101.9% (Cost $538,875,615) | 525,628,233 | ||
NET OTHER ASSETS (LIABILITIES) - (1.9)% | (9,857,674) | ||
NET ASSETS - 100% | $ 515,770,559 | ||
Futures Contracts | |||||
Expiration Date | Underlying Face Amount at Value | Unrealized Appreciation/ | |||
Purchased | |||||
Equity Index Contracts | |||||
57 CME E-mini S&P 500 Index Contracts | March 2012 | $ 3,728,370 | $ (3,313) | ||
5 NYFE Russell 2000 Mini Index Contracts | March 2012 | 395,600 | 5,890 | ||
TOTAL EQUITY INDEX CONTRACTS | $ 4,123,970 | $ 2,577 | |||
|
The face value of futures purchased as a percentage of net assets is 0.8% |
Legend |
(a) Non-income producing |
(b) Affiliated fund that is available only to investment companies and other accounts managed by Fidelity Investments. The rate quoted is the annualized seven-day yield of the fund at period end. A complete unaudited listing of the fund's holdings as of its most recent quarter end is available upon request. In addition, each Fidelity Central Fund's financial statements, which are not covered by the Fund's Report of Independent Registered Public Accounting Firm, are available on the SEC's website or upon request. |
(c) Investment made with cash collateral received from securities on loan. |
(d) Security or a portion of the security is on loan at period end. |
(e) Security or a portion of the security was pledged to cover margin requirements for futures contracts. At the period end, the value of securities pledged amounted to $299,992. |
Affiliated Central Funds |
Information regarding fiscal year to date income earned by the Fund from investments in Fidelity Central Funds is as follows: |
Fund | Income earned |
Fidelity Cash Central Fund | $ 8,291 |
Fidelity Securities Lending Cash Central Fund | 19,063 |
Total | $ 27,354 |
Other Information |
The following is a summary of the inputs used, as of January 31, 2012, involving the Fund's assets and liabilities carried at fair value. The inputs or methodology used for valuing securities may not be an indication of the risk associated with investing in those securities. For more information on valuation inputs, and their aggregation into the levels used in the tables below, please refer to the Security Valuation section in the accompanying Notes to Financial Statements. |
Valuation Inputs at Reporting Date: | ||||
Description | Total | Level 1 | Level 2 | Level 3 |
Investments in Securities: | ||||
Equities: | ||||
Consumer Discretionary | $ 44,984,111 | $ 44,984,111 | $ - | $ - |
Consumer Staples | 39,119,179 | 39,119,179 | - | - |
Energy | 64,043,752 | 64,043,752 | - | - |
Financials | 128,634,970 | 128,634,970 | - | - |
Health Care | 64,127,480 | 64,127,480 | - | - |
Industrials | 46,615,831 | 46,615,831 | - | - |
Information Technology | 45,609,230 | 45,609,230 | - | - |
Materials | 14,973,868 | 14,973,868 | - | - |
Telecommunication Services | 22,743,058 | 22,743,058 | - | - |
Utilities | 38,794,131 | 38,794,131 | - | - |
U.S. Government and Government Agency Obligations | 1,349,965 | - | 1,349,965 | - |
Money Market Funds | 14,632,658 | 14,632,658 | - | - |
Total Investments in Securities: | $ 525,628,233 | $ 524,278,268 | $ 1,349,965 | $ - |
Derivative Instruments: | ||||
Assets | ||||
Futures Contracts | $ 5,890 | $ 5,890 | $ - | $ - |
Liabilities | ||||
Futures Contracts | $ (3,313) | $ (3,313) | $ - | $ - |
Total Derivative Instruments: | $ 2,577 | $ 2,577 | $ - | $ - |
Value of Derivative Instruments |
The following table is a summary of the Fund's value of derivative instruments by risk exposure as of January 31, 2012. For additional information on derivative instruments, please refer to the Derivative Instruments section in the accompanying Notes to Financial Statements. |
Risk Exposure / | Value | |
| Asset | Liability |
Equity Risk | ||
Futures Contracts (a) | $ 5,890 | $ (3,313) |
Total Value of Derivatives | $ 5,890 | $ (3,313) |
(a) Reflects cumulative appreciation/(depreciation) on futures contracts as disclosed on the Schedule of Investments. Only the period end variation margin is separately disclosed on the Statement of Assets and Liabilities. |
Distribution of investments by country of issue, as a percentage of total net assets, is as follows: (Unaudited) |
United States of America | 85.9% |
United Kingdom | 4.9% |
Bermuda | 2.5% |
Switzerland | 1.8% |
Canada | 1.3% |
Ireland | 1.1% |
Others (Individually Less Than 1%) | 2.5% |
| 100.0% |
See accompanying notes which are an integral part of the financial statements.
Annual Report
Financial Statements
Statement of Assets and Liabilities
| January 31, 2012 | |
|
|
|
Assets | ||
Investment in securities, at value (including securities loaned of $6,397,132) - See accompanying schedule: Unaffiliated issuers (cost $524,242,957) | $ 510,995,575 |
|
Fidelity Central Funds (cost $14,632,658) | 14,632,658 |
|
Total Investments (cost $538,875,615) |
| $ 525,628,233 |
Receivable for investments sold | 2,503,384 | |
Receivable for fund shares sold | 312,428 | |
Dividends receivable | 630,053 | |
Distributions receivable from Fidelity Central Funds | 1,397 | |
Prepaid expenses | 949 | |
Other receivables | 2,808 | |
Total assets | 529,079,252 | |
|
|
|
Liabilities | ||
Payable to custodian bank | $ 2,809,965 | |
Payable for investments purchased | 2,987,240 | |
Payable for fund shares redeemed | 633,468 | |
Accrued management fee | 104,126 | |
Distribution and service plan fees payable | 11,804 | |
Payable for daily variation margin on futures contracts | 1,645 | |
Other affiliated payables | 130,779 | |
Other payables and accrued expenses | 48,716 | |
Collateral on securities loaned, at value | 6,580,950 | |
Total liabilities | 13,308,693 | |
|
|
|
Net Assets | $ 515,770,559 | |
Net Assets consist of: |
| |
Paid in capital | $ 909,409,528 | |
Distributions in excess of net investment income | (41,141) | |
Accumulated undistributed net realized gain (loss) on investments and foreign currency transactions | (380,353,023) | |
Net unrealized appreciation (depreciation) on investments | (13,244,805) | |
Net Assets | $ 515,770,559 | |
See accompanying notes which are an integral part of the financial statements.
Annual Report
Statement of Assets and Liabilities - continued
| January 31, 2012 | |
|
|
|
Calculation of Maximum Offering Price Class A: | $ 10.71 | |
|
|
|
Maximum offering price per share (100/94.25 of $10.71) | $ 11.36 | |
Class T: | $ 10.72 | |
|
|
|
Maximum offering price per share (100/96.50 of $10.72) | $ 11.11 | |
Class B: | $ 10.72 | |
|
|
|
Class C: | $ 10.61 | |
|
|
|
Stock Selector Large Cap Value: | $ 10.77 | |
|
|
|
Institutional Class: | $ 10.74 | |
A Redemption price per share is equal to net asset value less any applicable contingent deferred sales charge.
See accompanying notes which are an integral part of the financial statements.
Annual Report
Financial Statements - continued
Statement of Operations
| Year ended January 31, 2012 | |
|
|
|
Investment Income |
|
|
Dividends |
| $ 13,771,452 |
Interest |
| 20 |
Income from Fidelity Central Funds |
| 27,354 |
Total income |
| 13,798,826 |
|
|
|
Expenses | ||
Management fee | $ 3,437,760 | |
Performance adjustment | (1,860,095) | |
Transfer agent fees | 1,536,906 | |
Distribution and service plan fees | 138,517 | |
Accounting and security lending fees | 227,292 | |
Custodian fees and expenses | 29,427 | |
Independent trustees' compensation | 3,693 | |
Registration fees | 64,073 | |
Audit | 54,944 | |
Legal | 2,251 | |
Interest | 307 | |
Miscellaneous | 8,510 | |
Total expenses before reductions | 3,643,585 | |
Expense reductions | (42,992) | 3,600,593 |
Net investment income (loss) | 10,198,233 | |
Realized and Unrealized Gain (Loss) Net realized gain (loss) on: | ||
Investment securities: |
|
|
Unaffiliated issuers | 82,006,935 | |
Foreign currency transactions | 5,915 | |
Futures contracts | 64,921 | |
Total net realized gain (loss) |
| 82,077,771 |
Change in net unrealized appreciation (depreciation) on: Investment securities | (80,820,632) | |
Futures contracts | 2,577 | |
Total change in net unrealized appreciation (depreciation) |
| (80,818,055) |
Net gain (loss) | 1,259,716 | |
Net increase (decrease) in net assets resulting from operations | $ 11,457,949 | |
See accompanying notes which are an integral part of the financial statements.
Annual Report
Statement of Changes in Net Assets
| Year ended | Year ended |
Increase (Decrease) in Net Assets |
|
|
Operations |
|
|
Net investment income (loss) | $ 10,198,233 | $ 10,347,123 |
Net realized gain (loss) | 82,077,771 | 92,822,563 |
Change in net unrealized appreciation (depreciation) | (80,818,055) | 32,667,985 |
Net increase (decrease) in net assets resulting | 11,457,949 | 135,837,671 |
Distributions to shareholders from net investment income | (10,179,715) | (10,612,123) |
Share transactions - net increase (decrease) | (323,065,032) | (243,855,298) |
Total increase (decrease) in net assets | (321,786,798) | (118,629,750) |
|
|
|
Net Assets | ||
Beginning of period | 837,557,357 | 956,187,107 |
End of period (including distributions in excess of net investment income of $41,141 and undistributed net investment income of $0, respectively) | $ 515,770,559 | $ 837,557,357 |
See accompanying notes which are an integral part of the financial statements.
Annual Report
Financial Highlights - Class A
Years ended January 31, | 2012 | 2011 | 2010 | 2009 | 2008 H |
Selected Per-Share Data |
|
|
|
|
|
Net asset value, beginning of period | $ 10.72 | $ 9.35 | $ 7.53 | $ 13.54 | $ 15.41 |
Income from Investment Operations |
|
|
|
|
|
Net investment income (loss) E | .14 | .09 | .09 | .16 | .12 |
Net realized and unrealized gain (loss) | .02 | 1.38 | 1.85 | (6.00) | (1.00) |
Total from investment operations | .16 | 1.47 | 1.94 | (5.84) | (.88) |
Distributions from net investment income | (.17) | (.10) | (.12) | (.17) | (.12) |
Distributions from net realized gain | - | - | - | - | (.87) |
Total distributions | (.17) | (.10) | (.12) | (.17) | (.99) |
Net asset value, end of period | $ 10.71 | $ 10.72 | $ 9.35 | $ 7.53 | $ 13.54 |
Total Return B,C,D | 1.58% | 15.79% | 25.74% | (43.20)% | (6.04)% |
Ratios to Average Net Assets F,I |
|
|
|
|
|
Expenses before reductions | .87% | 1.00% | 1.15% | 1.17% | 1.22% A |
Expenses net of fee waivers, if any | .87% | 1.00% | 1.15% | 1.17% | 1.22% A |
Expenses net of all reductions | .86% | 1.00% | 1.13% | 1.17% | 1.22% A |
Net investment income (loss) | 1.38% | .87% | 1.08% | 1.47% | .81% A |
Supplemental Data |
|
|
|
|
|
Net assets, end of period (000 omitted) | $ 18,900 | $ 20,815 | $ 23,778 | $ 22,577 | $ 9,774 |
Portfolio turnover rate G | 128% | 120% | 171% | 243% | 204% |
A Annualized
B Total returns for periods of less than one year are not annualized.
C Total returns would have been lower if certain expenses had not been reduced during the applicable periods shown.
D Total returns do not include the effect of the sales charges.
E Calculated based on average shares outstanding during the period.
F Fees and expenses of any underlying Fidelity Central Funds are not included in the Fund's expense ratio. The Fund indirectly bears its proportionate share of the expenses of any underlying Fidelity Central Funds.
G Amount does not include the portfolio activity of any underlying Fidelity Central Funds.
H For the period February 13, 2007 (commencement of sale of shares) to January 31, 2008.
I Expense ratios reflect operating expenses of the class. Expenses before reductions do not reflect amounts reimbursed by the investment adviser or reductions from brokerage service arrangements or reductions from other expense offset arrangements and do not represent the amount paid by the class during periods when reimbursements or reductions occur. Expense ratios before reductions for start-up periods may not be representative of longer-term operating periods. Expenses net of fee waivers reflect expenses after reimbursement by the investment adviser but prior to reductions from brokerage service arrangements or other expense offset arrangements. Expenses net of all reductions represent the net expenses paid by the class.
See accompanying notes which are an integral part of the financial statements.
Annual Report
Financial Highlights - Class T
Years ended January 31, | 2012 | 2011 | 2010 | 2009 | 2008 H |
Selected Per-Share Data |
|
|
|
|
|
Net asset value, beginning of period | $ 10.74 | $ 9.36 | $ 7.54 | $ 13.53 | $ 15.41 |
Income from Investment Operations |
|
|
|
|
|
Net investment income (loss) E | .12 | .06 | .07 | .12 | .08 |
Net realized and unrealized gain (loss) | .01 | 1.39 | 1.84 | (5.97) | (1.01) |
Total from investment operations | .13 | 1.45 | 1.91 | (5.85) | (.93) |
Distributions from net investment income | (.15) | (.07) | (.09) | (.14) | (.08) |
Distributions from net realized gain | - | - | - | - | (.87) |
Total distributions | (.15) | (.07) | (.09) | (.14) | (.95) |
Net asset value, end of period | $ 10.72 | $ 10.74 | $ 9.36 | $ 7.54 | $ 13.53 |
Total Return B,C,D | 1.26% | 15.50% | 25.30% | (43.34)% | (6.34)% |
Ratios to Average Net Assets F,I |
|
|
|
|
|
Expenses before reductions | 1.14% | 1.29% | 1.45% | 1.49% | 1.47% A |
Expenses net of fee waivers, if any | 1.14% | 1.29% | 1.45% | 1.49% | 1.47% A |
Expenses net of all reductions | 1.13% | 1.28% | 1.44% | 1.49% | 1.47% A |
Net investment income (loss) | 1.11% | .59% | .78% | 1.15% | .56% A |
Supplemental Data |
|
|
|
|
|
Net assets, end of period (000 omitted) | $ 5,603 | $ 5,625 | $ 9,101 | $ 9,792 | $ 5,976 |
Portfolio turnover rate G | 128% | 120% | 171% | 243% | 204% |
A Annualized
B Total returns for periods of less than one year are not annualized.
C Total returns would have been lower if certain expenses had not been reduced during the applicable periods shown.
D Total returns do not include the effect of the sales charges.
E Calculated based on average shares outstanding during the period.
F Fees and expenses of any underlying Fidelity Central Funds are not included in the Fund's expense ratio. The Fund indirectly bears its proportionate share of the expenses of any underlying Fidelity Central Funds.
G Amount does not include the portfolio activity of any underlying Fidelity Central Funds.
H For the period February 13, 2007 (commencement of sale of shares) to January 31, 2008.
I Expense ratios reflect operating expenses of the class. Expenses before reductions do not reflect amounts reimbursed by the investment adviser or reductions from brokerage service arrangements or reductions from other expense offset arrangements and do not represent the amount paid by the class during periods when reimbursements or reductions occur. Expense ratios before reductions for start-up periods may not be representative of longer-term operating periods. Expenses net of fee waivers reflect expenses after reimbursement by the investment adviser but prior to reductions from brokerage service arrangements or other expense offset arrangements. Expenses net of all reductions represent the net expenses paid by the class.
See accompanying notes which are an integral part of the financial statements.
Annual Report
Financial Highlights - Class B
Years ended January 31, | 2012 | 2011 | 2010 | 2009 | 2008 H |
Selected Per-Share Data |
|
|
|
|
|
Net asset value, beginning of period | $ 10.72 | $ 9.35 | $ 7.53 | $ 13.54 | $ 15.41 |
Income from Investment Operations |
|
|
|
|
|
Net investment income (loss) E | .07 | .01 | .02 | .07 | .01 |
Net realized and unrealized gain (loss) | .02 | 1.38 | 1.85 | (5.98) | (1.00) |
Total from investment operations | .09 | 1.39 | 1.87 | (5.91) | (.99) |
Distributions from net investment income | (.09) | (.02) | (.05) | (.10) | (.01) |
Distributions from net realized gain | - | - | - | - | (.87) |
Total distributions | (.09) | (.02) | (.05) | (.10) | (.88) |
Net asset value, end of period | $ 10.72 | $ 10.72 | $ 9.35 | $ 7.53 | $ 13.54 |
Total Return B,C,D | .86% | 14.87% | 24.79% | (43.71)% | (6.74)% |
Ratios to Average Net Assets F,I |
|
|
|
|
|
Expenses before reductions | 1.62% | 1.80% | 1.98% | 2.07% | 1.99% A |
Expenses net of fee waivers, if any | 1.62% | 1.80% | 1.98% | 2.00% | 1.99% A |
Expenses net of all reductions | 1.62% | 1.79% | 1.97% | 2.00% | 1.99% A |
Net investment income (loss) | .63% | .08% | .24% | .64% | .04% A |
Supplemental Data |
|
|
|
|
|
Net assets, end of period (000 omitted) | $ 1,819 | $ 2,274 | $ 2,711 | $ 2,600 | $ 1,860 |
Portfolio turnover rate G | 128% | 120% | 171% | 243% | 204% |
A Annualized
B Total returns for periods of less than one year are not annualized.
C Total returns would have been lower if certain expenses had not been reduced during the applicable periods shown.
D Total returns do not include the effect of the contingent deferred sales charge.
E Calculated based on average shares outstanding during the period.
F Fees and expenses of any underlying Fidelity Central Funds are not included in the Fund's expense ratio. The Fund indirectly bears its proportionate share of the expenses of any underlying Fidelity Central Funds.
G Amount does not include the portfolio activity of any underlying Fidelity Central Funds.
H For the period February 13, 2007 (commencement of sale of shares) to January 31, 2008.
I Expense ratios reflect operating expenses of the class. Expenses before reductions do not reflect amounts reimbursed by the investment adviser or reductions from brokerage service arrangements or reductions from other expense offset arrangements and do not represent the amount paid by the class during periods when reimbursements or reductions occur. Expense ratios before reductions for start-up periods may not be representative of longer-term operating periods. Expenses net of fee waivers reflect expenses after reimbursement by the investment adviser but prior to reductions from brokerage service arrangements or other expense offset arrangements. Expenses net of all reductions represent the net expenses paid by the class.
See accompanying notes which are an integral part of the financial statements.
Annual Report
Financial Highlights - Class C
Years ended January 31, | 2012 | 2011 | 2010 | 2009 | 2008 H |
Selected Per-Share Data |
|
|
|
|
|
Net asset value, beginning of period | $ 10.63 | $ 9.30 | $ 7.49 | $ 13.52 | $ 15.41 |
Income from Investment Operations |
|
|
|
|
|
Net investment income (loss) E | .07 | .01 | .03 | .08 | .01 |
Net realized and unrealized gain (loss) | .01 | 1.36 | 1.84 | (5.97) | (.98) |
Total from investment operations | .08 | 1.37 | 1.87 | (5.89) | (.97) |
Distributions from net investment income | (.10) | (.04) | (.06) | (.14) | (.05) |
Distributions from net realized gain | - | - | - | - | (.87) |
Total distributions | (.10) | (.04) | (.06) | (.14) | (.92) |
Net asset value, end of period | $ 10.61 | $ 10.63 | $ 9.30 | $ 7.49 | $ 13.52 |
Total Return B,C,D | .85% | 14.79% | 24.97% | (43.65)% | (6.61)% |
Ratios to Average Net Assets F,I |
|
|
|
|
|
Expenses before reductions | 1.62% | 1.75% | 1.89% | 1.91% | 1.94% A |
Expenses net of fee waivers, if any | 1.62% | 1.75% | 1.89% | 1.91% | 1.94% A |
Expenses net of all reductions | 1.61% | 1.74% | 1.88% | 1.91% | 1.94% A |
Net investment income (loss) | .63% | .13% | .34% | .73% | .09% A |
Supplemental Data |
|
|
|
|
|
Net assets, end of period (000 omitted) | $ 4,979 | $ 3,959 | $ 3,491 | $ 2,352 | $ 1,208 |
Portfolio turnover rate G | 128% | 120% | 171% | 243% | 204% |
A Annualized
B Total returns for periods of less than one year are not annualized.
C Total returns would have been lower if certain expenses had not been reduced during the applicable periods shown.
D Total returns do not include the effect of the contingent deferred sales charge.
E Calculated based on average shares outstanding during the period.
F Fees and expenses of any underlying Fidelity Central Funds are not included in the Fund's expense ratio. The Fund indirectly bears its proportionate share of the expenses of any underlying Fidelity Central Funds.
G Amount does not include the portfolio activity of any underlying Fidelity Central Funds.
H For the period February 13, 2007 (commencement of sale of shares) to January 31, 2008.
I Expense ratios reflect operating expenses of the class. Expenses before reductions do not reflect amounts reimbursed by the investment adviser or reductions from brokerage service arrangements or reductions from other expense offset arrangements and do not represent the amount paid by the class during periods when reimbursements or reductions occur. Expense ratios before reductions for start-up periods may not be representative of longer-term operating periods. Expenses net of fee waivers reflect expenses after reimbursement by the investment adviser but prior to reductions from brokerage service arrangements or other expense offset arrangements. Expenses net of all reductions represent the net expenses paid by the class.
See accompanying notes which are an integral part of the financial statements.
Annual Report
Financial Highlights - Stock Selector Large Cap Value
Years ended January 31, | 2012 | 2011 | 2010 | 2009 | 2008 |
Selected Per-Share Data |
|
|
|
|
|
Net asset value, beginning of period | $ 10.78 | $ 9.40 | $ 7.56 | $ 13.57 | $ 15.19 |
Income from Investment Operations |
|
|
|
|
|
Net investment income (loss) B | .18 | .11 | .12 | .20 | .18 |
Net realized and unrealized gain (loss) | .01 | 1.40 | 1.86 | (6.02) | (.80) |
Total from investment operations | .19 | 1.51 | 1.98 | (5.82) | (.62) |
Distributions from net investment income | (.20) | (.13) | (.14) | (.19) | (.13) |
Distributions from net realized gain | - | - | - | - | (.87) |
Total distributions | (.20) | (.13) | (.14) | (.19) | (1.00) |
Net asset value, end of period | $ 10.77 | $ 10.78 | $ 9.40 | $ 7.56 | $ 13.57 |
Total Return A | 1.85% | 16.09% | 26.21% | (43.03)% | (4.39)% |
Ratios to Average Net Assets C,E |
|
|
|
|
|
Expenses before reductions | .57% | .73% | .85% | .86% | .86% |
Expenses net of fee waivers, if any | .57% | .73% | .85% | .86% | .85% |
Expenses net of all reductions | .56% | .72% | .84% | .86% | .85% |
Net investment income (loss) | 1.68% | 1.15% | 1.38% | 1.78% | 1.18% |
Supplemental Data |
|
|
|
|
|
Net assets, end of period (000 omitted) | $ 482,950 | $ 803,009 | $ 914,828 | $ 916,490 | $ 1,483,574 |
Portfolio turnover rate D | 128% | 120% | 171% | 243% | 204% |
A Total returns would have been lower if certain expenses had not been reduced during the applicable periods shown.
B Calculated based on average shares outstanding during the period.
C Fees and expenses of any underlying Fidelity Central Funds are not included in the Fund's expense ratio. The Fund indirectly bears its proportionate share of the expenses of any underlying Fidelity Central Funds.
D Amount does not include the portfolio activity of any underlying Fidelity Central Funds.
E Expense ratios reflect operating expenses of the class. Expenses before reductions do not reflect amounts reimbursed by the investment adviser or reductions from brokerage service arrangements or reductions from other expense offset arrangements and do not represent the amount paid by the class during periods when reimbursements or reductions occur. Expenses net of fee waivers reflect expenses after reimbursement by the investment adviser but prior to reductions from brokerage service arrangements or other expense offset arrangements. Expenses net of all reductions represent the net expenses paid by the class.
See accompanying notes which are an integral part of the financial statements.
Annual Report
Financial Highlights - Institutional Class
Years ended January 31, | 2012 | 2011 | 2010 | 2009 | 2008 G |
Selected Per-Share Data |
|
|
|
|
|
Net asset value, beginning of period | $ 10.74 | $ 9.37 | $ 7.54 | $ 13.54 | $ 15.41 |
Income from Investment Operations |
|
|
|
|
|
Net investment income (loss) D | .17 | .11 | .12 | .20 | .17 |
Net realized and unrealized gain (loss) | .02 | 1.39 | 1.85 | (6.01) | (1.02) |
Total from investment operations | .19 | 1.50 | 1.97 | (5.81) | (.85) |
Distributions from net investment income | (.19) | (.13) | (.14) | (.19) | (.15) |
Distributions from net realized gain | - | - | - | - | (.87) |
Total distributions | (.19) | (.13) | (.14) | (.19) | (1.02) |
Net asset value, end of period | $ 10.74 | $ 10.74 | $ 9.37 | $ 7.54 | $ 13.54 |
Total Return B,C | 1.92% | 16.04% | 26.18% | (43.00)% | (5.82)% |
Ratios to Average Net Assets E,H |
|
|
|
|
|
Expenses before reductions | .60% | .74% | .87% | .85% | .85% A |
Expenses net of fee waivers, if any | .60% | .74% | .87% | .85% | .85% A |
Expenses net of all reductions | .60% | .73% | .86% | .85% | .84% A |
Net investment income (loss) | 1.65% | 1.14% | 1.36% | 1.79% | 1.19% A |
Supplemental Data |
|
|
|
|
|
Net assets, end of period (000 omitted) | $ 1,519 | $ 1,876 | $ 2,279 | $ 1,304 | $ 1,060 |
Portfolio turnover rate F | 128% | 120% | 171% | 243% | 204% |
A Annualized
B Total returns for periods of less than one year are not annualized.
C Total returns would have been lower if certain expenses had not been reduced during the applicable periods shown.
D Calculated based on average shares outstanding during the period.
E Fees and expenses of any underlying Fidelity Central Funds are not included in the Fund's expense ratio. The Fund indirectly bears its proportionate share of the expenses of any underlying Fidelity Central Funds.
F Amount does not include the portfolio activity of any underlying Fidelity Central Funds.
G For the period February 13, 2007 (commencement of sale of shares) to January 31, 2008.
H Expense ratios reflect operating expenses of the class. Expenses before reductions do not reflect amounts reimbursed by the investment adviser or reductions from brokerage service arrangements or reductions from other expense offset arrangements and do not represent the amount paid by the class during periods when reimbursements or reductions occur. Expense ratios before reductions for start-up periods may not be representative of longer-term operating periods. Expenses net of fee waivers reflect expenses after reimbursement by the investment adviser but prior to reductions from brokerage service arrangements or other expense offset arrangements. Expenses net of all reductions represent the net expenses paid by the class.
See accompanying notes which are an integral part of the financial statements.
Annual Report
Notes to Financial Statements
For the period ended January 31, 2012
1. Organization.
Fidelity Stock Selector Large Cap Value Fund (the Fund) is a fund of Fidelity Devonshire Trust (the Trust) and is authorized to issue an unlimited number of shares. The Trust is registered under the Investment Company Act of 1940, as amended (the 1940 Act), as an open-end management investment company organized as a Massachusetts business trust. The Fund offers Class A, Class T, Class C, Stock Selector Large Cap Value and Institutional Class shares, each of which, along with Class B shares, has equal rights as to assets and voting privileges. Effective after the close of business on September 1, 2010, Class B shares were closed to new accounts and additional purchases, except for exchanges and reinvestments. Each class has exclusive voting rights with respect to matters that affect that class. Class B shares will automatically convert to Class A shares after a holding period of seven years from the initial date of purchase. Investment income, realized and unrealized capital gains and losses, the common expenses of the Fund, and certain fund-level expense reductions, if any, are allocated on a pro-rata basis to each class based on the relative net assets of each class to the total net assets of the Fund. Each class differs with respect to transfer agent and distribution and service plan fees incurred. Certain expense reductions may also differ by class. In April 2011, the Board of Trustees approved a change in the name of Fidelity Large Cap Value Fund to Fidelity Stock Selector Large Cap Value Fund effective August 31, 2011.
2. Investments in Fidelity Central Funds.
The Fund invests in Fidelity Central Funds, which are open-end investment companies available only to other investment companies and accounts managed by Fidelity Management & Research Company (FMR) and its affiliates. The Fund's Schedule of Investments lists each of the Fidelity Central Funds held as of period end, if any, as an investment of the Fund, but does not include the underlying holdings of each Fidelity Central Fund. As an Investing Fund, the Fund indirectly bears its proportionate share of the expenses of the underlying Fidelity Central Funds.
The Money Market Central Funds seek preservation of capital and current income and are managed by Fidelity Investments Money Management, Inc. (FIMM), an affiliate of FMR.
A complete unaudited list of holdings for each Fidelity Central Fund is available upon request or at the Securities and Exchange Commission (the SEC) web site at www.sec.gov. In addition, the financial statements of the Fidelity Central Funds, which are not covered by the Fund's Report of Independent Registered Public Accounting Firm, are available on the SEC web site or upon request.
Annual Report
3. Significant Accounting Policies.
The financial statements have been prepared in conformity with accounting principles generally accepted in the United States of America (GAAP), which require management to make certain estimates and assumptions at the date of the financial statements. Actual results could differ from those estimates. Subsequent events, if any, through the date that the financial statements were issued have been evaluated in the preparation of the financial statements. The following summarizes the significant accounting policies of the Fund:
Security Valuation. Investments are valued as of 4:00 p.m. Eastern time on the last calendar day of the period. The Fund uses independent pricing services approved by the Board of Trustees to value its investments. When current market prices or quotations are not readily available or reliable, valuations may be determined in good faith in accordance with procedures adopted by the Board of Trustees. Factors used in determining value may include market or security specific events. The frequency with which these procedures are used cannot be predicted and they may be utilized to a significant extent. The value used for net asset value (NAV) calculation under these procedures may differ from published prices for the same securities.
The Fund categorizes the inputs to valuation techniques used to value its investments into a disclosure hierarchy consisting of three levels as shown below:
Level 1 - quoted prices in active markets for identical investments
Level 2 - other significant observable inputs (including quoted prices for similar investments, interest rates, prepayment speeds, etc.)
Level 3 - unobservable inputs (including the Fund's own assumptions based on the best information available)
Changes in valuation techniques may result in transfers in or out of an assigned level within the disclosure hierarchy. The aggregate value of investments by input level, as of January 31, 2012, is included at the end of the Fund's Schedule of Investments. Valuation techniques used to value the Fund's investments by major category are as follows:
Equity securities, including restricted securities, for which market quotations are readily available, are valued at the last reported sale price or official closing price as reported by an independent pricing service on the primary market or exchange on which they are traded and are categorized as Level 1 in the hierarchy. In the event there were no sales during the day or closing prices are not available, securities are valued at the last quoted bid price or may be valued using the last available price and are generally categorized as Level 2 in the hierarchy. For foreign equity securities, when significant market or security specific events arise, comparisons to the valuation of American Depositary Receipts
Annual Report
Notes to Financial Statements - continued
3. Significant Accounting Policies - continued
Security Valuation - continued
(ADRs), futures contracts, Exchange-traded funds (ETFs) and certain indexes as well as quoted prices for similar securities are used and are categorized as Level 2 in the hierarchy in these circumstances. Utilizing these techniques may result in transfers between Level 1 and Level 2. For restricted equity securities and private placements where observable inputs are limited, assumptions about market activity and risk are used and are categorized as Level 3 in the hierarchy.
Debt securities, including restricted securities, are valued based on evaluated prices received from independent pricing services or from dealers who make markets in such securities. For U.S. government and government agency obligations, pricing services utilize matrix pricing which considers yield or price of bonds of comparable quality, coupon, maturity and type as well as dealer supplied prices and are generally categorized as Level 2 in the hierarchy. When independent prices are unavailable or unreliable, debt securities may be valued utilizing pricing matrices which consider similar factors that would be used by independent pricing services. These are generally categorized as Level 2 in the hierarchy but may be Level 3 depending on the circumstances.
Futures contracts are valued at the settlement price established each day by the board of trade or exchange on which they are traded and are categorized as Level 1 in the hierarchy. Investments in open-end mutual funds, including the Fidelity Central Funds, are valued at their closing net asset value each business day and are categorized as Level 1 in the hierarchy.
New Accounting Pronouncements. In May 2011, the Financial Accounting Standards Board issued Accounting Standard Update No. 2011-04, Fair Value Measurement (Topic 820) - Amendments to Achieve Common Fair Value Measurement and Disclosure Requirements in U.S. GAAP and IFRSs. The update is effective during interim and annual periods beginning after December 15, 2011 and will result in additional disclosure for transfers between levels as well as expanded disclosure for securities categorized as Level 3 under the fair value hierarchy.
In December 2011, the Financial Accounting Standards Board issued Accounting Standard Update No. 2011-11, Disclosures about Offsetting Assets and Liabilities. The update creates new disclosure requirements requiring entities to disclose both gross and net information for derivatives and other financial instruments that are either offset in the Statement of Assets and Liabilities or subject to an enforceable master netting arrangement or similar agreement. The disclosure requirements are effective for interim and annual reporting periods beginning on or after January 1, 2013. Management is currently evaluating the impact of the update's adoption on the Fund's financial statement disclosures.
Annual Report
3. Significant Accounting Policies - continued
Foreign Currency. The Fund may use foreign currency contracts to facilitate transactions in foreign-denominated securities. Gains and losses from these transactions may arise from changes in the value of the foreign currency or if the counterparties do not perform under the contracts' terms.
Foreign-denominated assets, including investment securities, and liabilities are translated into U.S. dollars at the exchange rate at period end. Purchases and sales of investment securities, income and dividends received and expenses denominated in foreign currencies are translated into U.S. dollars at the exchange rate in effect on the transaction date.
The effects of exchange rate fluctuations on investments are included with the net realized and unrealized gain (loss) on investment securities. Other foreign currency transactions resulting in realized and unrealized gain (loss) are disclosed separately.
Investment Transactions and Income. For financial reporting purposes, the Fund's investment holdings and NAV include trades executed through the end of the last business day of the period. The NAV per share for processing shareholder transactions is calculated as of the close of business of the New York Stock Exchange (NYSE), normally 4:00 p.m. Eastern time and includes trades executed through the end of the prior business day. Gains and losses on securities sold are determined on the basis of identified cost and may include proceeds received from litigation. Dividend income is recorded on the ex-dividend date, except for certain dividends from foreign securities where the ex-dividend date may have passed, which are recorded as soon as the Fund is informed of the ex-dividend date. Non-cash dividends included in dividend income, if any, are recorded at the fair market value of the securities received. Distributions received on securities that represent a return of capital or capital gain are recorded as a reduction of cost of investments and/or as a realized gain. The Fund estimates the components of distributions received that may be considered return of capital distributions or capital gain distributions. Interest income and distributions from the Fidelity Central Funds are accrued as earned. Interest income includes coupon interest and amortization of premium and accretion of discount on debt securities. Investment income is recorded net of foreign taxes withheld where recovery of such taxes is uncertain.
Expenses. Expenses directly attributable to a fund are charged to that fund. Expenses attributable to more than one fund are allocated among the respective funds on the basis of relative net assets or other appropriate methods. Expense estimates are accrued in the period to which they relate and adjustments are made when actual amounts are known.
Income Tax Information and Distributions to Shareholders. Each year, the Fund intends to qualify as a regulated investment company, including distributing substantially all of its taxable income and realized gains under Subchapter M of the Internal
Annual Report
Notes to Financial Statements - continued
3. Significant Accounting Policies - continued
Income Tax Information and Distributions to Shareholders - continued
Revenue Code. As a result, no provision for income taxes is required. As of January 31, 2012, the Fund did not have any unrecognized tax benefits in the financial statements; nor is the Fund aware of any tax positions for which it is reasonably possible that the total amounts of unrecognized tax benefits will significantly change in the next twelve months. The Fund files a U.S. federal tax return, in addition to state and local tax returns as required. A fund's tax returns are subject to examination by the Internal Revenue Service (IRS) for a period of three fiscal years. State and local tax returns may be subject to examination for an additional fiscal year depending on the jurisdiction. Foreign taxes are provided for based on the Fund's understanding of the tax rules and rates that exist in the foreign markets in which it invests.
Distributions are declared and recorded on the ex-dividend date. Income dividends and capital gain distributions are declared separately for each class. Income and capital gain distributions are determined in accordance with income tax regulations, which may differ from GAAP.
Capital accounts within the financial statements are adjusted for permanent book-tax differences. These adjustments have no impact on net assets or the results of operations. Temporary book-tax differences will reverse in a subsequent period.
Book-tax differences are primarily due to futures transactions, foreign currency transactions, market discount, capital loss carryforwards and losses deferred due to wash sales and excise tax regulations.
The federal tax cost of investment securities and unrealized appreciation (depreciation) as of period end were as follows:
Gross unrealized appreciation | $ 30,248,509 |
Gross unrealized depreciation | (49,977,208) |
Net unrealized appreciation (depreciation) on securities and other investments | $ (19,728,699) |
|
|
Tax Cost | $ 545,356,932 |
The tax-based components of distributable earnings as of period end were as follows:
Capital loss carryforward | $ (371,005,041) |
Net unrealized appreciation (depreciation) | $ (19,728,699) |
Annual Report
3. Significant Accounting Policies - continued
Income Tax Information and Distributions to Shareholders - continued
Capital loss carryforwards are only available to offset future capital gains of the Fund to the extent provided by regulations and may be limited. Under the Regulated Investment Company Modernization Act of 2010 (the Act), the Fund is permitted to carry forward capital losses incurred in taxable years beginning after December 22, 2010 for an unlimited period and such capital losses are required to be used prior to any losses that expire. Capital loss carryforwards were as follows:
Fiscal year of expiration |
|
2017 | $ (182,900,202) |
2018 | (188,104,839) |
Total with expiration | $ (371,005,041) |
The tax character of distributions paid was as follows:
| January 31, 2012 | January 31, 2011 |
Ordinary Income | $ 10,179,715 | $ 10,612,123 |
4. Derivative Instruments.
Risk Exposures and the Use of Derivative Instruments. The Fund used derivative instruments (derivatives), including futures contracts, in order to meet its investment objectives. The strategy is to use derivatives to increase returns and to manage exposure to certain risks as defined below. The success of any strategy involving derivatives depends on analysis of numerous economic factors, and if the strategies for investment do not work as intended, the Fund may not achieve its objectives.
The Fund's use of derivatives increased or decreased its exposure to the following risk:
Equity Risk | Equity risk relates to the fluctuations in the value of financial instruments as a result of changes in market prices (other than those arising from interest rate risk or foreign exchange risk), whether caused by factors specific to an individual investment, its issuer, or all factors affecting all instruments traded in a market or market segment. |
The Fund is also exposed to additional risks from investing in derivatives, such as liquidity risk and counterparty credit risk. Liquidity risk is the risk that the Fund will be unable to close out the derivative in the open market in a timely manner. Counterparty credit risk is the risk that the counterparty will not be able to fulfill its obligation to the Fund. Counterparty credit risk related to exchange-traded futures contracts is minimal because of the protection provided by the exchange on which they trade. Derivatives involve, to varying degrees, risk of loss in excess of the amounts recognized in the Statement of Assets and Liabilities.
Annual Report
Notes to Financial Statements - continued
4. Derivative Instruments - continued
Futures Contracts. A futures contract is an agreement between two parties to buy or sell a specified underlying instrument for a fixed price at a specified future date. The Fund used futures contracts to manage its exposure to the stock market.
Upon entering into a futures contract, a fund is required to deposit either cash or securities (initial margin) with a clearing broker in an amount equal to a certain percentage of the face value of the contract. Futures contracts are marked-to-market daily and subsequent payments (variation margin) are made or received by a fund depending on the daily fluctuations in the value of the futures contracts and are recorded as unrealized appreciation or (depreciation). This receivable and/or payable is included in daily variation margin on futures contracts in the Statement of Assets and Liabilities. Realized gain or (loss) is recorded upon the expiration or closing of a futures contract.
The underlying face amount at value of open futures contracts at period end is shown in the Schedule of Investments under the caption "Futures Contracts." This amount reflects each contract's exposure to the underlying instrument at period end and is representative of activity for the period. Securities deposited to meet initial margin requirements are identified in the Schedule of Investments.
During the period the Fund recognized net realized gain (loss) of $64,921 and a change in net unrealized appreciation (depreciation) of $2,577 related to its investment in futures contracts. These amounts are included in the Statement of Operations.
5. Purchases and Sales of Investments.
Purchases and sales of securities, other than short-term securities, aggregated $795,702,411 and $1,118,875,137, respectively.
6. Fees and Other Transactions with Affiliates.
Management Fee. FMR and its affiliates provide the Fund with investment management related services for which the Fund pays a monthly management fee. The management fee is the sum of an individual fund fee rate that is based on an annual rate of .30% of the Fund's average net assets and an annualized group fee rate that averaged .26% during the period. The group fee rate is based upon the average net assets of all the mutual funds advised by FMR. The group fee rate decreases as assets under management increase and increases as assets under management decrease. In addition, the management fee is subject to a performance adjustment (up to a maximum of ± .20% of the Fund's average net assets over a 36 month performance period). The upward or downward adjustment to the management fee is based on the relative investment performance of Stock Selector Large Cap Value as compared to an appropriate benchmark
Annual Report
6. Fees and Other Transactions with Affiliates - continued
Management Fee - continued
index. For the period, the total annual management fee rate, including the performance adjustment, was .26% of the Fund's average net assets.
Distribution and Service Plan Fees. In accordance with Rule 12b-1 of the 1940 Act, the Fund has adopted separate Distribution and Service Plans for each class of shares. Certain classes pay Fidelity Distributors Corporation (FDC), an affiliate of FMR, separate Distribution and Service Fees, each of which is based on an annual percentage of each class' average net assets. In addition, FDC may pay financial intermediaries for selling shares of the Fund and providing shareholder support services. For the period, the Distribution and Service Fee rates, total fees and amounts retained by FDC were as follows:
| Distribution | Service | Total Fees | Retained |
Class A | -% | .25% | $ 48,117 | $ 906 |
Class T | .25% | .25% | 27,426 | 57 |
Class B | .75% | .25% | 19,719 | 14,805 |
Class C | .75% | .25% | 43,255 | 11,261 |
|
|
| $ 138,517 | $ 27,029 |
Sales Load. FDC may receive a front-end sales charge of up to 5.75% for selling Class A shares and 3.50% for selling Class T shares, some of which is paid to financial intermediaries for selling shares of the Fund. Depending on the holding period, FDC may receive contingent deferred sales charges levied on Class A, Class T, Class B, and Class C redemptions. The deferred sales charges range from 5.00% to 1.00% for Class B, 1.00% for Class C, 1.00% for certain purchases of Class A shares and .25% for certain purchases of Class T shares.
For the period, sales charge amounts retained by FDC were as follows:
| Retained |
Class A | $ 9,835 |
Class T | 1,853 |
Class B* | 2,848 |
Class C* | 791 |
| $ 15,327 |
* When Class B and Class C shares are initially sold, FDC pays commissions from its own resources to financial intermediaries through which the sales are made.
Annual Report
Notes to Financial Statements - continued
6. Fees and Other Transactions with Affiliates - continued
Transfer Agent Fees. Fidelity Investments Institutional Operations Company, Inc. (FIIOC), an affiliate of FMR, is the transfer, dividend disbursing and shareholder servicing agent for each class of the Fund. FIIOC receives account fees and asset-based fees that vary according to the account size and type of account of the shareholders of the respective classes of the Fund. FIIOC pays for typesetting, printing and mailing of shareholder reports, except proxy statements. For the period, transfer agent fees for each class were as follows:
| Amount | % of |
Class A | $ 57,559 | .30 |
Class T | 17,249 | .31 |
Class B | 5,965 | .30 |
Class C | 12,943 | .30 |
Stock Selector Large Cap Value | 1,438,489 | .25 |
Institutional Class | 4,701 | .28 |
| $ 1,536,906 |
|
Accounting and Security Lending Fees. Fidelity Service Company, Inc. (FSC), an affiliate of FMR, maintains the Fund's accounting records. The accounting fee is based on the level of average net assets for each month. Under a separate contract, FSC administers the security lending program. The security lending fee is based on the number and duration of lending transactions.
Brokerage Commissions. The Fund placed a portion of its portfolio transactions with brokerage firms which are affiliates of the investment adviser. The commissions paid to these affiliated firms were $17,211 for the period.
Interfund Lending Program. Pursuant to an Exemptive Order issued by the SEC, the Fund, along with other registered investment companies having management contracts with FMR, may participate in an interfund lending program. This program provides an alternative credit facility allowing the funds to borrow from, or lend money to, other participating affiliated funds. At period end, there were no interfund loans outstanding. The Fund's activity in this program during the period for which loans were outstanding was as follows:
Borrower or Lender | Average Loan | Weighted Average Interest Rate | Interest |
Borrower | $ 3,153,636 | .32% | $ 307 |
Annual Report
7. Committed Line of Credit.
The Fund participates with other funds managed by FMR or an affiliate in a $4.0 billion credit facility (the "line of credit") to be utilized for temporary or emergency purposes to fund shareholder redemptions or for other short-term liquidity purposes. The Fund has agreed to pay commitment fees on its pro-rata portion of the line of credit, which amounted to $1,960 and is reflected in Miscellaneous expenses on the Statement of Operations. During the period, there were no borrowings on this line of credit.
8. Security Lending.
The Fund lends portfolio securities through a lending agent from time to time in order to earn additional income. For equity securities, a lending agent is used and may loan securities to certain qualified borrowers, including Fidelity Capital Markets (FCM), a broker-dealer affiliated with the Fund. On the settlement date of the loan, the Fund receives collateral (in the form of U.S. Treasury obligations, letters of credit and/or cash) against the loaned securities and maintains collateral in an amount not less than 100% of the market value of the loaned securities during the period of the loan. The market value of the loaned securities is determined at the close of business of the Fund and any additional required collateral is delivered to the Fund on the next business day. If the borrower defaults on its obligation to return the securities loaned because of insolvency or other reasons, a fund could experience delays and costs in recovering the securities loaned or in gaining access to the collateral. Any cash collateral received is invested in the Fidelity Securities Lending Cash Central Fund. The value of loaned securities and cash collateral at period end are disclosed on the Fund's Statement of Assets and Liabilities. Security lending income represents the income earned on investing cash collateral, less rebates paid to borrowers and any lending agent fees associated with the loan, plus any premium payments received for lending certain types of securities. Security lending income is presented in the Statement of Operations as a component of income from Fidelity Central Funds. Total security lending income during the period amounted to $19,063. During the period, there were no securities loaned to FCM.
9. Expense Reductions.
Many of the brokers with whom FMR places trades on behalf of the Fund provided services to the Fund in addition to trade execution. These services included payments of certain expenses on behalf of the Fund totaling $42,992 for the period.
Annual Report
Notes to Financial Statements - continued
10. Distributions to Shareholders.
Distributions to shareholders of each class were as follows:
Years ended January 31, | 2012 | 2011 |
From net investment income |
|
|
Class A | $ 291,163 | $ 196,415 |
Class T | 76,828 | 37,346 |
Class B | 14,902 | 4,323 |
Class C | 43,527 | 17,678 |
Stock Selector Large Cap Value | 9,726,457 | 10,334,423 |
Institutional Class | 26,838 | 21,938 |
Total | $ 10,179,715 | $ 10,612,123 |
11. Share Transactions.
Transactions for each class of shares were as follows:
| Shares | Dollars | ||
Years ended January 31, | 2012 | 2011 | 2012 | 2011 |
Class A |
|
|
|
|
Shares sold | 537,296 | 509,581 | $ 5,591,381 | $ 5,070,258 |
Reinvestment of distributions | 26,981 | 17,752 | 272,774 | 183,027 |
Shares redeemed | (742,040) | (1,127,883) | (7,769,301) | (11,172,418) |
Net increase (decrease) | (177,763) | (600,550) | $ (1,905,146) | $ (5,919,133) |
Class T |
|
|
|
|
Shares sold | 164,778 | 239,347 | $ 1,752,467 | $ 2,379,089 |
Reinvestment of distributions | 7,415 | 3,520 | 75,038 | 36,365 |
Shares redeemed | (173,682) | (691,112) | (1,851,245) | (6,965,488) |
Net increase (decrease) | (1,489) | (448,245) | $ (23,740) | $ (4,550,034) |
Class B |
|
|
|
|
Shares sold | 9,062 | 64,791 | $ 86,884 | $ 633,133 |
Reinvestment of distributions | 1,307 | 374 | 13,227 | 3,863 |
Shares redeemed | (52,766) | (142,878) | (549,800) | (1,418,300) |
Net increase (decrease) | (42,397) | (77,713) | $ (449,689) | $ (781,304) |
Class C |
|
|
|
|
Shares sold | 201,797 | 193,335 | $ 2,080,198 | $ 1,918,253 |
Reinvestment of distributions | 3,605 | 1,440 | 36,155 | 14,747 |
Shares redeemed | (108,651) | (197,933) | (1,106,480) | (1,934,239) |
Net increase (decrease) | 96,751 | (3,158) | $ 1,009,873 | $ (1,239) |
Stock Selector Large Cap Value |
|
|
|
|
Shares sold | 6,854,527 | 11,945,116 | $ 72,065,849 | $ 119,799,397 |
Reinvestment of distributions | 935,043 | 980,495 | 9,500,032 | 10,157,929 |
Shares redeemed | (37,479,739) | (35,741,742) | (402,880,177) | (361,864,131) |
Net increase (decrease) | (29,690,169) | (22,816,131) | $ (321,314,296) | $ (231,906,805) |
Annual Report
11. Share Transactions - continued
| Shares | Dollars | ||
Years ended January 31, | 2012 | 2011 | 2012 | 2011 |
Institutional Class |
|
|
|
|
Shares sold | 58,013 | 40,757 | $ 608,335 | $ 403,599 |
Reinvestment of distributions | 2,632 | 2,125 | 26,662 | 21,926 |
Shares redeemed | (93,801) | (111,512) | (1,017,031) | (1,122,308) |
Net increase (decrease) | (33,156) | (68,630) | $ (382,034) | $ (696,783) |
12. Other.
The Fund's organizational documents provide former and current trustees and officers with a limited indemnification against liabilities arising in connection with the performance of their duties to the Fund. In the normal course of business, the Fund may also enter into contracts that provide general indemnifications. The Fund's maximum exposure under these arrangements is unknown as this would be dependent on future claims that may be made against the Fund. The risk of material loss from such claims is considered remote.
Annual Report
Report of Independent Registered Public Accounting Firm
To the Trustees of Fidelity Devonshire Trust and the Shareholders of Fidelity Stock Selector Large Cap Value Fund:
In our opinion, the accompanying statement of assets and liabilities, including the schedule of investments, and the related statements of operations and of changes in net assets and the financial highlights present fairly, in all material respects, the financial position of Fidelity Stock Selector Large Cap Value Fund (a fund of Fidelity Devonshire Trust) at January 31, 2012, the results of its operations for the year then ended, the changes in its net assets for each of the two years in the period then ended and the financial highlights for each of the periods indicated, in conformity with accounting principles generally accepted in the United States of America. These financial statements and financial highlights (hereafter referred to as "financial statements") are the responsibility of the Fidelity Stock Selector Large Cap Value Fund's management. Our responsibility is to express an opinion on these financial statements based on our audits. We conducted our audits of these financial statements in accordance with the standards of the Public Company Accounting Oversight Board (United States). Those standards require that we plan and perform the audit to obtain reasonable assurance about whether the financial statements are free of material misstatement. An audit includes examining, on a test basis, evidence supporting the amounts and disclosures in the financial statements, assessing the accounting principles used and significant estimates made by management, and evaluating the overall financial statement presentation. We believe that our audits, which included confirmation of securities at January 31, 2012 by correspondence with the custodian and brokers, provide a reasonable basis for our opinion.
/s/ PricewaterhouseCoopers LLP
PricewaterhouseCoopers LLP
Boston, Massachusetts
March 13, 2012
Annual Report
Trustees and Officers
The Trustees, Members of the Advisory Board, and executive officers of the trust and fund, as applicable, are listed below. The Board of Trustees governs the fund and is responsible for protecting the interests of shareholders. The Trustees are experienced executives who meet periodically throughout the year to oversee the fund's activities, review contractual arrangements with companies that provide services to the fund, oversee management of the risks associated with such activities and contractual arrangements, and review the fund's performance. Except for James C. Curvey, each of the Trustees oversees 226 funds advised by FMR or an affiliate. Mr. Curvey oversees 430 funds advised by FMR or an affiliate.
The Trustees hold office without limit in time except that (a) any Trustee may resign; (b) any Trustee may be removed by written instrument, signed by at least two-thirds of the number of Trustees prior to such removal; (c) any Trustee who requests to be retired or who has become incapacitated by illness or injury may be retired by written instrument signed by a majority of the other Trustees; and (d) any Trustee may be removed at any special meeting of shareholders by a two-thirds vote of the outstanding voting securities of the trust. Each Trustee who is not an interested person (as defined in the 1940 Act) (Independent Trustee), shall retire not later than the last day of the calendar year in which his or her 75th birthday occurs. The Independent Trustees may waive this mandatory retirement age policy with respect to individual Trustees. The executive officers and Advisory Board Members hold office without limit in time, except that any officer and Advisory Board Member may resign or may be removed by a vote of a majority of the Trustees at any regular meeting or any special meeting of the Trustees. Except as indicated, each individual has held the office shown or other offices in the same company for the past five years.
Experience, Skills, Attributes, and Qualifications of the Fund's Trustees. The Governance and Nominating Committee has adopted a statement of policy that describes the experience, qualifications, attributes, and skills that are necessary and desirable for potential Independent Trustee candidates (Statement of Policy). The Board believes that each Trustee satisfied at the time he or she was initially elected or appointed a Trustee, and continues to satisfy, the standards contemplated by the Statement of Policy. The Governance and Nominating Committee also engages professional search firms to help identify potential Independent Trustee candidates who have the experience, qualifications, attributes, and skills consistent with the Statement of Policy. From time to time, additional criteria based on the composition and skills of the current Independent Trustees, as well as experience or skills that may be appropriate in light of future changes to board composition, business conditions, and regulatory or other developments, have also been considered by the professional search firms and the Governance and Nominating Committee. In addition, the Board takes into account the Trustees' commitment and participation in Board and committee meetings, as well as their leadership of standing and ad hoc committees throughout their tenure.
In determining that a particular Trustee was and continues to be qualified to serve as a Trustee, the Board has considered a variety of criteria, none of which, in isolation, was controlling. The Board believes that, collectively, the Trustees have balanced and diverse experience, qualifications, attributes, and skills, which allow the Board to operate effectively in governing the fund and protecting the interests of shareholders. Information about the specific experience, skills, attributes, and qualifications of each Trustee, which in each case led to the Board's conclusion that the Trustee should serve (or continue to serve) as a trustee of the fund, is provided below.
Annual Report
Board Structure and Oversight Function. James C. Curvey is an interested person (as defined in the 1940 Act) and currently serves as Acting Chairman. The Trustees have determined that an interested Chairman is appropriate and benefits shareholders because an interested Chairman has a personal and professional stake in the quality and continuity of services provided to the fund. Independent Trustees exercise their informed business judgment to appoint an individual of their choosing to serve as Chairman, regardless of whether the Trustee happens to be independent or a member of management. The Independent Trustees have determined that they can act independently and effectively without having an Independent Trustee serve as Chairman and that a key structural component for assuring that they are in a position to do so is for the Independent Trustees to constitute a substantial majority for the Board. The Independent Trustees also regularly meet in executive session. Ned C. Lautenbach serves as Chairman of the Independent Trustees and as such (i) acts as a liaison between the Independent Trustees and management with respect to matters important to the Independent Trustees and (ii) with management prepares agendas for Board meetings.
Fidelity funds are overseen by different Boards of Trustees. The fund's Board oversees Fidelity's equity and high income funds and another Board oversees Fidelity's investment-grade bond, money market, and asset allocation funds. The asset allocation funds may invest in Fidelity funds overseen by the fund's Board. The use of separate Boards, each with its own committee structure, allows the Trustees of each group of Fidelity funds to focus on the unique issues of the funds they oversee, including common research, investment, and operational issues. On occasion, the separate Boards establish joint committees to address issues of overlapping consequences for the Fidelity funds overseen by each Board.
The Trustees operate using a system of committees to facilitate the timely and efficient consideration of all matters of importance to the Trustees, the fund, and fund shareholders and to facilitate compliance with legal and regulatory requirements and oversight of the fund's activities and associated risks. The Board, acting through its committees, has charged FMR and its affiliates with (i) identifying events or circumstances the occurrence of which could have demonstrably adverse effects on the fund's business and/or reputation; (ii) implementing processes and controls to lessen the possibility that such events or circumstances occur or to mitigate the effects of such events or circumstances if they do occur; and (iii) creating and maintaining a system designed to evaluate continuously business and market conditions in order to facilitate the identification and implementation processes described in (i) and (ii) above. Because the day-to-day operations and activities of the fund are carried out by or through FMR, its affiliates and other service providers, the fund's exposure to risks is mitigated but not eliminated by the processes overseen by the Trustees. While each of the Board's committees has responsibility for overseeing different aspects of the fund's activities, oversight is exercised primarily through the Operations, Audit, and Compliance Committees. In addition, the Independent Trustees have worked with FMR to enhance the Board's oversight of investment and financial risks, legal and regulatory risks, technology risks, and operational risks, including the development of additional risk reporting to the Board. For example, a working group comprised of Independent Trustees and FMR has worked and continues to work to review the Fidelity funds' valuation-related activities, reporting and risk management. Appropriate personnel, including but not limited to the fund's Chief Compliance Officer (CCO), FMR's internal auditor, the independent accountants, the fund's Treasurer and portfolio management personnel, make periodic reports to the Board's committees, as appropriate, including an annual review of FMR's risk management program for the Fidelity funds. The responsibilities of each standing committee, including their oversight responsibilities, are described further under "Standing Committees of the Fund's Trustees."
Annual Report
Trustees and Officers - continued
The fund's Statement of Additional Information (SAI) includes more information about the Trustees. To request a free copy, call Fidelity at 1-877-208-0098.
Interested Trustees*:
Correspondence intended for each Trustee who is an interested person may be sent to Fidelity Investments, 82 Devonshire Street, Boston, Massachusetts 02109.
Name, Age; Principal Occupations and Other Relevant Experience+ | |
James C. Curvey (76) | |
| Year of Election or Appointment: 2007 Mr. Curvey is Trustee and Acting Chairman of the Board of Trustees of certain Trusts. Mr. Curvey also serves as Trustee (2007-present) of other investment companies advised by FMR. Mr. Curvey is a Director of Fidelity Investments Money Management, Inc. (2009-present), Director of Fidelity Research & Analysis Co. (2009-present) and Director of FMR and FMR Co., Inc. (2007-present). Mr. Curvey is also Vice Chairman (2007-present) and Director of FMR LLC. In addition, Mr. Curvey serves as an Overseer for the Boston Symphony Orchestra and a member of the Trustees of Villanova University. Previously, Mr. Curvey was the Vice Chairman (2006-2007) and Director (2000-2007) of FMR Corp. |
Ronald P. O'Hanley (54) | |
| Year of Election or Appointment: 2011 Mr. O'Hanley is Director of FMR Co., Inc. (2010-present), Director of Fidelity Investments Money Management, Inc. (2010-present), Director of Fidelity Research & Analysis Company (2010-present), President of Fidelity Asset Management and Corporate Services and a member of Fidelity's Executive Committee (2010-present). Previously, Mr. O'Hanley served as President and Chief Executive Officer of BNY Mellon Asset Management (2007-2010). Mr. O'Hanley also served as Vice Chairman of Bank New York Mellon Corp. and a member of that firm's Executive Committee. Prior to the 2007 merger of The Bank of New York and Mellon Financial Corporation, he was Vice Chairman of Mellon Financial Corporation and President and Chief Executive Officer of Mellon Asset Management. He joined Mellon in February 1997. Mr. O'Hanley currently serves as Chairman of the Boston Public Library Foundation Board of Directors and sits on the Board of Directors of Beth Israel Deaconess Medical Center, the Board of Trustees of the Marine Biological Laboratory and the Advisory Board of the Maxwell School of Citizenship and Public Administration at Syracuse University. Mr. O'Hanley also chairs the Council on Asset Management for the Financial Services Roundtable and is a member of the Board of Directors of Institutional Investor's U.S. Institute. |
* Trustees have been determined to be "Interested Trustees" by virtue of, among other things, their affiliation with the trust or various entities under common control with FMR.
+ The information above includes each Trustee's principal occupation during the last five years and other information relating to the experience, attributes, and skills relevant to each Trustee's qualifications to serve as a Trustee, which led to the conclusion that each Trustee should serve as a Trustee for the fund.
Annual Report
Trustees and Officers - continued
Independent Trustees:
Correspondence intended for each Independent Trustee (that is, the Trustees other than the Interested Trustees) may be sent to Fidelity Investments, P.O. Box 55235, Boston, Massachusetts 02205-5235.
Name, Age; Principal Occupations and Other Relevant Experience+ | |
Dennis J. Dirks (63) | |
| Year of Election or Appointment: 2005 Prior to his retirement in May 2003, Mr. Dirks was Chief Operating Officer and a member of the Board of The Depository Trust & Clearing Corporation (DTCC). He also served as President, Chief Operating Officer, and Board member of The Depository Trust Company (DTC) and President and Board member of the National Securities Clearing Corporation (NSCC). In addition, Mr. Dirks served as Chief Executive Officer and Board member of the Government Securities Clearing Corporation, Chief Executive Officer and Board member of the Mortgage-Backed Securities Clearing Corporation, as a Trustee and a member of the Finance Committee of Manhattan College (2005-2008), and as a Trustee and a member of the Finance Committee of AHRC of Nassau County (2006-2008). Mr. Dirks is a member of the Independent Directors Council (IDC) Governing Council (2010-present) and Board of Directors for The Brookville Center for Children's Services, Inc. (2009-present). |
Alan J. Lacy (58) | |
| Year of Election or Appointment: 2008 Mr. Lacy serves as Senior Adviser (2007-present) of Oak Hill Capital Partners, L.P. (private equity). Mr. Lacy also served as Chief Executive Officer (2000-2005) and Vice Chairman (2005-2006) of Sears Holdings Corporation and Sears, Roebuck and Co. (retail). In addition, Mr. Lacy serves as a member of the Board of Directors of Dave & Buster's, Inc. (restaurant and entertainment complexes, 2010-present), The Hillman Companies, Inc. (hardware wholesalers, 2010-present), and Bristol-Myers Squibb Company (global pharmaceuticals, 2007-present). Mr. Lacy is a member of the Board of Trustees of The National Parks Conservation Association (2006-present). Previously, Mr. Lacy served as Chairman of the Board of Trustees of the National Parks Conservation Association (2008-2011) and as a member of the Board of Directors for the Western Union Company (global money transfer, 2006-2011). |
Ned C. Lautenbach (67) | |
| Year of Election or Appointment: 2000 Mr. Lautenbach is Chairman of the Independent Trustees of the Equity and High Income Funds (2006-present). Mr. Lautenbach currently serves as the Lead Director of the Eaton Corporation Board of Directors (diversified industrial, 1997-present). Mr. Lautenbach is also a member of the Board of Directors of the Philharmonic Center for the Arts in Naples, Florida (1999-present); a member of the Board of Trustees of Fairfield University (2005-present); and a member of the Council on Foreign Relations (1994-present). Previously, Mr. Lautenbach was a Partner/Advisory Partner at Clayton, Dubilier & Rice, LLC (private equity investment, 1998-2010), as well as a Director of Sony Corporation (2006-2007). |
Joseph Mauriello (67) | |
| Year of Election or Appointment: 2008 Prior to his retirement in January 2006, Mr. Mauriello served in numerous senior management positions including Deputy Chairman and Chief Operating Officer (2004-2005), and Vice Chairman of Financial Services (2002-2004) of KPMG LLP US (professional services, 1965-2005). Mr. Mauriello currently serves as a member of the Board of Directors of XL Group plc. (global insurance and re-insurance, 2006-present) and of Arcadia Resources Inc. (health care services and products, 2007-present). Previously, Mr. Mauriello served as a Director of the Hamilton Funds of the Bank of New York (2006-2007). |
Robert W. Selander (61) | |
| Year of Election or Appointment: 2011 Previously, Mr. Selander served as a Member of the Advisory Board of Fidelity's Equity and High Income Funds (2011), Executive Vice Chairman (2010), Chief Executive Officer (2009-2010), and President and Chief Executive Officer (1997-2009) of Mastercard, Inc. |
Cornelia M. Small (67) | |
| Year of Election or Appointment: 2005 Ms. Small is a member of the Board of Directors of the Teagle Foundation (2009-present). Ms. Small is also a member of the Investment Committee, and Chair (2008-present) and a member of the Board of Trustees of Smith College. In addition, Ms. Small serves on the Investment Committee of the Berkshire Taconic Community Foundation (2008-present). Previously, Ms. Small served as Chairperson of the Investment Committee (2002-2008) of Smith College. In addition, Ms. Small served as Chief Investment Officer, Director of Global Equity Investments, and a member of the Board of Directors of Scudder, Stevens & Clark and Scudder Kemper Investments. |
William S. Stavropoulos (72) | |
| Year of Election or Appointment: 2002 Mr. Stavropoulos is Vice Chairman of the Independent Trustees of the Equity and High Income Funds (2006-present). Mr. Stavropoulos serves as President and Founder of the Michigan Baseball Foundation, the Great Lakes Loons (2007-present). Mr. Stavropoulos is Chairman Emeritus of the Board of Directors of The Dow Chemical Company, where he previously served in numerous senior management positions, including President, CEO (1995-2000; 2002-2004), Chairman of the Executive Committee (2000-2006), and as a member of the Board of Directors (1990-2006). Currently, Mr. Stavropoulos is Chairman of Univar (global distributor of commodity and specialty chemicals, 2010-present), a Director of Teradata Corporation (data warehousing and technology solutions, 2008-present), Chemical Financial Corporation, Maersk Inc. (industrial conglomerate), Tyco International, Inc. (multinational manufacturing and services, 2007-present), and a member of the Advisory Board for Metalmark Capital (private equity investment, 2005-present). Mr. Stavropoulos is a special advisor to Clayton, Dubilier & Rice, LLC (private equity investment). In addition, Mr. Stavropoulos is a member of the University of Notre Dame Advisory Council for the College of Science. |
David M. Thomas (62) | |
| Year of Election or Appointment: 2008 Previously, Mr. Thomas served as Executive Chairman (2005-2006) and Chairman and Chief Executive Officer (2000-2005) of IMS Health, Inc. (pharmaceutical and healthcare information solutions). In addition, Mr. Thomas serves as a member of the Board of Directors of Fortune Brands, Inc. (consumer products), and Interpublic Group of Companies, Inc. (marketing communication, 2004-present). |
Michael E. Wiley (61) | |
| Year of Election or Appointment: 2008 Mr. Wiley also serves as a Director of Asia Pacific Exploration Consolidated (international oil and gas exploration and production, 2008-present). Mr. Wiley serves as a Director of Tesoro Corporation (independent oil refiner and marketer, 2005-present), and a Director of Bill Barrett Corporation (exploration and production, 2005-present). In addition, Mr. Wiley also serves as a Director of Post Oak Bank (privately-held bank, 2004-present). Previously, Mr. Wiley served as a member of the Board of Trustees of the University of Tulsa (2000-2006; 2007-2010), as a Senior Energy Advisor of Katzenbach Partners, LLC (consulting, 2006-2007), as an Advisory Director of Riverstone Holdings (private investment), Chairman, President, and CEO of Baker Hughes, Inc. (oilfield services, 2000-2004), and as Director of Spinnaker Exploration Company (exploration and production, 2001-2005). |
Annual Report
+ The information above includes each Trustee's principal occupation during the last five years and other information relating to the experience, attributes, and skills relevant to each Trustee's qualifications to serve as a Trustee, which led to the conclusion that each Trustee should serve as a Trustee for the fund.
Advisory Board Members and Executive Officers:
Correspondence intended for each executive officer, Edward C. Johnson 3d, and Peter S. Lynch may be sent to Fidelity Investments, 82 Devonshire Street, Boston, Massachusetts 02109.
Name, Age; Principal Occupation | |
Edward C. Johnson 3d (81) | |
| Year of Election or Appointment: 2011 Member of the Advisory Board of Fidelity's Equity and High Income Funds. Mr. Johnson serves as Chief Executive Officer, Chairman, and a Director of FMR LLC, and also serves as Chairman and Director of FIL Limited. Previously, Mr. Johnson served as a Trustee and Chairman of the Board of certain Fidelity Trusts, Chairman and a Director of FMR, Chairman and a Director of FMR Co., Inc., and President of FMR LLC (2006-2007). |
Peter S. Lynch (68) | |
| Year of Election or Appointment: 2003 Member of the Advisory Board of Fidelity's Equity and High Income Funds. Mr. Lynch is Vice Chairman and a Director of FMR and FMR Co., Inc. In addition, Mr. Lynch serves as a Trustee of Boston College and as the Chairman of the Inner-City Scholarship Fund. Previously, Mr. Lynch served on the Special Olympics International Board of Directors (1997-2006). |
Kenneth B. Robins (42) | |
| Year of Election or Appointment: 2008 President and Treasurer of Fidelity's Equity and High Income Funds. Mr. Robins also serves as President and Treasurer (2010-present) and Assistant Treasurer (2009-present) of other Fidelity funds and is an employee of Fidelity Investments (2004-present). Previously, Mr. Robins served as Deputy Treasurer of the Fidelity funds (2005-2008) and Treasurer and Chief Financial Officer of The North Carolina Capital Management Trust: Cash and Term Portfolios (2006-2008). |
Brian B. Hogan (47) | |
| Year of Election or Appointment: 2009 Vice President of Equity and High Income Funds. Mr. Hogan also serves as President of FMR's Equity Division (2009-present). Previously, Mr. Hogan served as Senior Vice President, Equity Research of FMR (2006-2009) and as a portfolio manager. |
Thomas C. Hense (48) | |
| Year of Election or Appointment: 2008 or 2010 Vice President of Fidelity's High Income (2008), Small Cap (2008), and Value (2010) Funds. Previously, Mr. Hense served as a portfolio manager for Fidelity's Institutional Money Management Group (Pyramis) (2003-2008). |
Scott C. Goebel (44) | |
| Year of Election or Appointment: 2008 Secretary and Chief Legal Officer (CLO) of the Fidelity funds. Mr. Goebel also serves as Secretary of Fidelity Investments Money Management, Inc. (FIMM) (2010-present) and Fidelity Research and Analysis Company (FRAC) (2010-present); Secretary and CLO of The North Carolina Capital Management Trust: Cash and Term Portfolios (2008-present); General Counsel, Secretary, and Senior Vice President of FMR (2008-present) and FMR Co., Inc. (2008-present); employed by FMR LLC or an affiliate (2001-present); Chief Legal Officer of Fidelity Management & Research (Hong Kong) Limited (2008-present) and Assistant Secretary of Fidelity Management & Research (Japan) Inc. (2008-present), and Fidelity Management & Research (U.K.) Inc. (2008-present). Previously, Mr. Goebel served as Assistant Secretary of FIMM (2008-2010), FRAC (2008-2010), and the Funds (2007-2008) and as Vice President and Secretary of Fidelity Distributors Corporation (FDC) (2005-2007). |
William C. Coffey (42) | |
| Year of Election or Appointment: 2009 Assistant Secretary of Fidelity's Equity and High Income Funds. Mr. Coffey also serves as Senior Vice President and Deputy General Counsel of FMR LLC (2010-present), and is an employee of Fidelity Investments. Previously, Mr. Coffey served as Vice President and Associate General Counsel of FMR LLC (2005-2009). |
Holly C. Laurent (57) | |
| Year of Election or Appointment: 2008 Anti-Money Laundering (AML) Officer of the Fidelity funds. Ms. Laurent also serves as AML Officer of The North Carolina Capital Management Trust: Cash and Term Portfolios (2008-present) and is an employee of Fidelity Investments. Previously, Ms. Laurent was Senior Vice President and Head of Legal for Fidelity Business Services India Pvt. Ltd. (2006-2008), and Senior Vice President, Deputy General Counsel and Group Head for FMR LLC (2005-2006). |
Christine Reynolds (53) | |
| Year of Election or Appointment: 2008 Chief Financial Officer of the Fidelity funds. Ms. Reynolds became President of Fidelity Pricing and Cash Management Services (FPCMS) in August 2008. Ms. Reynolds served as Chief Operating Officer of FPCMS (2007-2008). Previously, Ms. Reynolds served as President, Treasurer, and Anti-Money Laundering officer of the Fidelity funds (2004-2007). |
Kenneth A. Rathgeber (64) | |
| Year of Election or Appointment: 2004 Chief Compliance Officer of Fidelity's Equity and High Income Funds. Mr. Rathgeber is Chief Compliance Officer of Fidelity Management & Research (Hong Kong) Limited (2008-present), Fidelity Management & Research (Japan) Inc. (2008-present), FMR (2005-present), FMR Co., Inc. (2005-present), Fidelity Management & Research (U.K.) Inc. (2005-present), Fidelity Research & Analysis Company (2005-present), Fidelity Investments Money Management, Inc. (2005-present), Pyramis Global Advisors, LLC (2005-present), and Strategic Advisers, Inc. (2005-present). |
Joseph F. Zambello (54) | |
| Year of Election or Appointment: 2011 Deputy Treasurer of the Fidelity funds. Mr. Zambello is an employee of Fidelity Investments. Previously, Mr. Zambello served as Vice President of FMR's Program Management Group (2009-2011) and Vice President of the Transfer Agent Oversight Group (2005-2009). |
Adrien E. Deberghes (44) | |
| Year of Election or Appointment: 2008 Deputy Treasurer of Fidelity's Equity and High Income Funds. Mr. Deberghes also serves as Vice President and Assistant Treasurer of Fidelity Rutland Square Trust II and Fidelity Commonwealth Trust II (2011-present), Assistant Treasurer of other Fidelity funds (2010-present), and is an employee of Fidelity Investments (2008-present). Previously, Mr. Deberghes served as Senior Vice President of Mutual Fund Administration at State Street Corporation (2007-2008), Senior Director of Mutual Fund Administration at Investors Bank & Trust (2005-2007), and Director of Finance for Dunkin' Brands (2000-2005). |
Stephanie J. Dorsey (42) | |
| Year of Election or Appointment: 2010 Assistant Treasurer of Fidelity's Equity and High Income Funds. Ms. Dorsey also serves as Deputy Treasurer of other Fidelity funds (2008-present) and is an employee of Fidelity Investments (2008-present). Previously, Ms. Dorsey served as Treasurer (2004-2008) of the JPMorgan Mutual Funds and Vice President (2004-2008) of JPMorgan Chase Bank. |
John R. Hebble (53) | |
| Year of Election or Appointment: 2009 Assistant Treasurer of Fidelity's Equity and High Income Funds. Mr. Hebble also serves as President (2011-present), Treasurer, and Chief Financial Officer of The North Carolina Capital Management Trust: Cash and Term Portfolios (2008-present), President and Treasurer of other Fidelity funds (2008-present) and is an employee of Fidelity Investments. |
Gary W. Ryan (53) | |
| Year of Election or Appointment: 2005 Assistant Treasurer of the Fidelity funds. Mr. Ryan is an employee of Fidelity Investments. Previously, Mr. Ryan served as Vice President of Fund Reporting in Fidelity Pricing and Cash Management Services (FPCMS) (1999-2005). |
Jonathan Davis (43) | |
| Year of Election or Appointment: 2010 Assistant Treasurer of the Fidelity funds. Mr. Davis is also Assistant Treasurer of Fidelity Rutland Square Trust II and Fidelity Commonwealth Trust II. Mr. Davis is an employee of Fidelity Investments. Previously, Mr. Davis served as Vice President and Associate General Counsel of FMR LLC (2003-2010). |
Annual Report
Distributions (Unaudited)
Class A, Class T, Class B and Class C designate 100% of the dividends distributed during the fiscal year as qualifying for the dividends-received deduction for corporate shareholders.
Class A, Class T, Class B and Class C designate 100% of the dividends distributed during the fiscal year as amounts which may be taken into account as a dividend for purposes of the maximum rate under section 1(h)(11) of the Internal Revenue Code.
The fund will notify shareholders in January 2013 of amounts for use in preparing 2012 income tax returns.
Annual Report
Investment Adviser
Fidelity Management & Research Company
Boston, MA
Investment Sub-Advisers
FMR Co., Inc.
Fidelity Management & Research
(U.K.) Inc.
Fidelity Management & Research
(Hong Kong) Limited
Fidelity Management & Research
(Japan) Inc.
General Distributor
Fidelity Distributors Corporation
Boston, MA
Transfer and Service Agents
Fidelity Investments Institutional Operations Company, Inc.
Boston, MA
Fidelity Service Company, Inc.
Boston, MA
Custodian
Citibank, N.A.
New York, NY
ALCV-UANN-0312
1.838393.102
(Fidelity Investment logo)(registered trademark)
(Fidelity Investment logo)(registered trademark)
Fidelity Advisor®
Stock Selector
Large Cap Value
Fund - Institutional Class
(formerly Fidelity Advisor Large Cap Value Fund)
Annual Report
January 31, 2012
(Fidelity Cover Art)
Institutional Class is a class of
Fidelity® Stock Selector Large Cap
Value Fund
Contents
Chairman's Message | The Chairman's message to shareholders. | |
Performance | How the fund has done over time. | |
Management's Discussion of Fund Performance | The Portfolio Manager's review of fund performance and strategy. | |
Shareholder Expense Example | An example of shareholder expenses. | |
Investment Changes | A summary of major shifts in the fund's investments over the past six months. | |
Investments | A complete list of the fund's investments with their market values. | |
Financial Statements | Statements of assets and liabilities, operations, and changes in net assets, as well as financial highlights. | |
Notes | Notes to the financial statements. | |
Report of Independent Registered Public Accounting Firm |
| |
Trustees and Officers |
| |
Distributions |
|
To view a fund's proxy voting guidelines and proxy voting record for the 12-month period ended June 30, visit http://www.fidelity.com/proxyvotingresults or visit the Securities and Exchange Commission's (SEC) web site at http://www.sec.gov. You may also call 1-877-208-0098 to request a free copy of the proxy voting guidelines.
Standard & Poor's, S&P and S&P 500 are registered service marks of The McGraw-Hill Companies, Inc. and have been licensed for use by Fidelity Distributors Corporation.
Other third party marks appearing herein are the property of their respective owners.
All other marks appearing herein are registered or unregistered trademarks or service marks of FMR LLC or an affiliated company.
Annual Report
This report and the financial statements contained herein are submitted for the general information of the shareholders of the fund. This report is not authorized for distribution to prospective investors in the fund unless preceded or accompanied by an effective prospectus.
A fund files its complete schedule of portfolio holdings with the SEC for the first and third quarters of each fiscal year on Form N-Q. Forms N-Q are available on the SEC's web site at http://www.sec.gov. A fund's Forms N-Q may be reviewed and copied at the SEC's Public Reference Room in Washington, DC. Information regarding the operation of the SEC's Public Reference Room may be obtained by calling 1-800-SEC-0330. For a complete list of a fund's portfolio holdings, view the most recent holdings listing, semiannual report, or annual report on Fidelity's web site at http://www.fidelity.com, http://www.advisor.fidelity.com, or http://www.401k.com, as applicable.
NOT FDIC INSURED • MAY LOSE VALUE • NO BANK GUARANTEE
Neither the fund nor Fidelity Distributors Corporation is a bank.
Annual Report
Chairman's Message
(photo_of_James_C_Curvey)
Dear Shareholder:
Following a year marked by unusually high volatility, 2012 began with most major asset classes advancing steadily in January. For U.S. equities, it was the strongest start to a new year since 1997. International stocks fared even better, despite continued uncertainty related to the sovereign debt crisis in Europe. Investors have been acutely sensitive to the latest news, for better or worse, coming out of the eurozone and its impact on financial markets. As we look ahead, the unresolved debt crisis in Europe remains at the center of a series of risk factors, summarized below, that we believe have the greatest potential to influence the global investment landscape.
Deleveraging and the economy
In the euro-currency area, fiscal austerity among nations and debt deleveraging among financial companies loaded with sovereign debt are deflationary measures and serve to hinder economic growth in the short term. Such an economic and financial-market scenario has not been historically supportive of strong performance among riskier assets, and emerges at a time when many nations need a resurgent economy to assist them in closing their budget deficits and in building confidence among bond buyers to help them refinance their existing debt obligations.
Slowdown in China and Europe
China's economy is the second-largest in the world, and it has been the biggest contributor to global growth since the end of the last recession. Thus, the slower pace of domestic growth in China has led to lower demand for imports of commodities and other construction materials from the rest of the world. In addition, economic weakness in Europe and the broad-based global economic slowdown are putting pressure on China's export growth, which has been largely responsible for its breakneck pace of annual gross domestic product (GDP) growth during the past three decades.
Credit deterioration and contagion
The heightened macroeconomic risk and elevated credit risk swirling around certain European nations and financial institutions have caused many market participants to avoid purchases of or reduce exposure to short-term debt offerings by these issuers. With increased credit risk, there are growing concerns about the potential credit contraction and contagion from European issuers spreading to other financial markets.
We invite you to learn more by visiting us on the Internet or calling us by phone. It is our privilege to provide the resources you need to choose investments that are right for you.
Sincerely,
(The acting chairman's signature appears here.)
James C. Curvey
Acting Chairman
Annual Report
Performance: The Bottom Line
Average annual total return reflects the change in the value of an investment, assuming reinvestment of the class' distributions from dividend income and capital gains (the profits earned upon the sale of securities that have grown in value, if any) and assuming a constant rate of performance each year. The $10,000 table does not reflect the deduction of taxes that a shareholder would pay on fund distributions or the redemption of fund shares. During periods of reimbursement by Fidelity, a fund's total return will be greater than it would be had the reimbursement not occurred. How a fund did yesterday is no guarantee of how it will do tomorrow.
Average Annual Total Returns
Periods ended January 31, 2012 | Past 1 | Past 5 | Past 10 |
Institutional Class A | 1.92% | -4.06% | 2.92% |
A The initial offering of Institutional Class shares took place on February 13, 2007. Returns prior to February 13, 2007 are those of Fidelity® Large Cap Value Fund, the original class of the fund.
$10,000 Over 10 Years
Let's say hypothetically that $10,000 was invested in Fidelity Advisor® Stock Selector Large Cap Value Fund - Institutional Class on January 31, 2002. The chart shows how the value of your investment would have changed, and also shows how the Russell 1000® Value Index performed over the same period. The initial offering of Institutional Class took place on February 13, 2007. See above for additional information regarding the performance of Institutional Class.
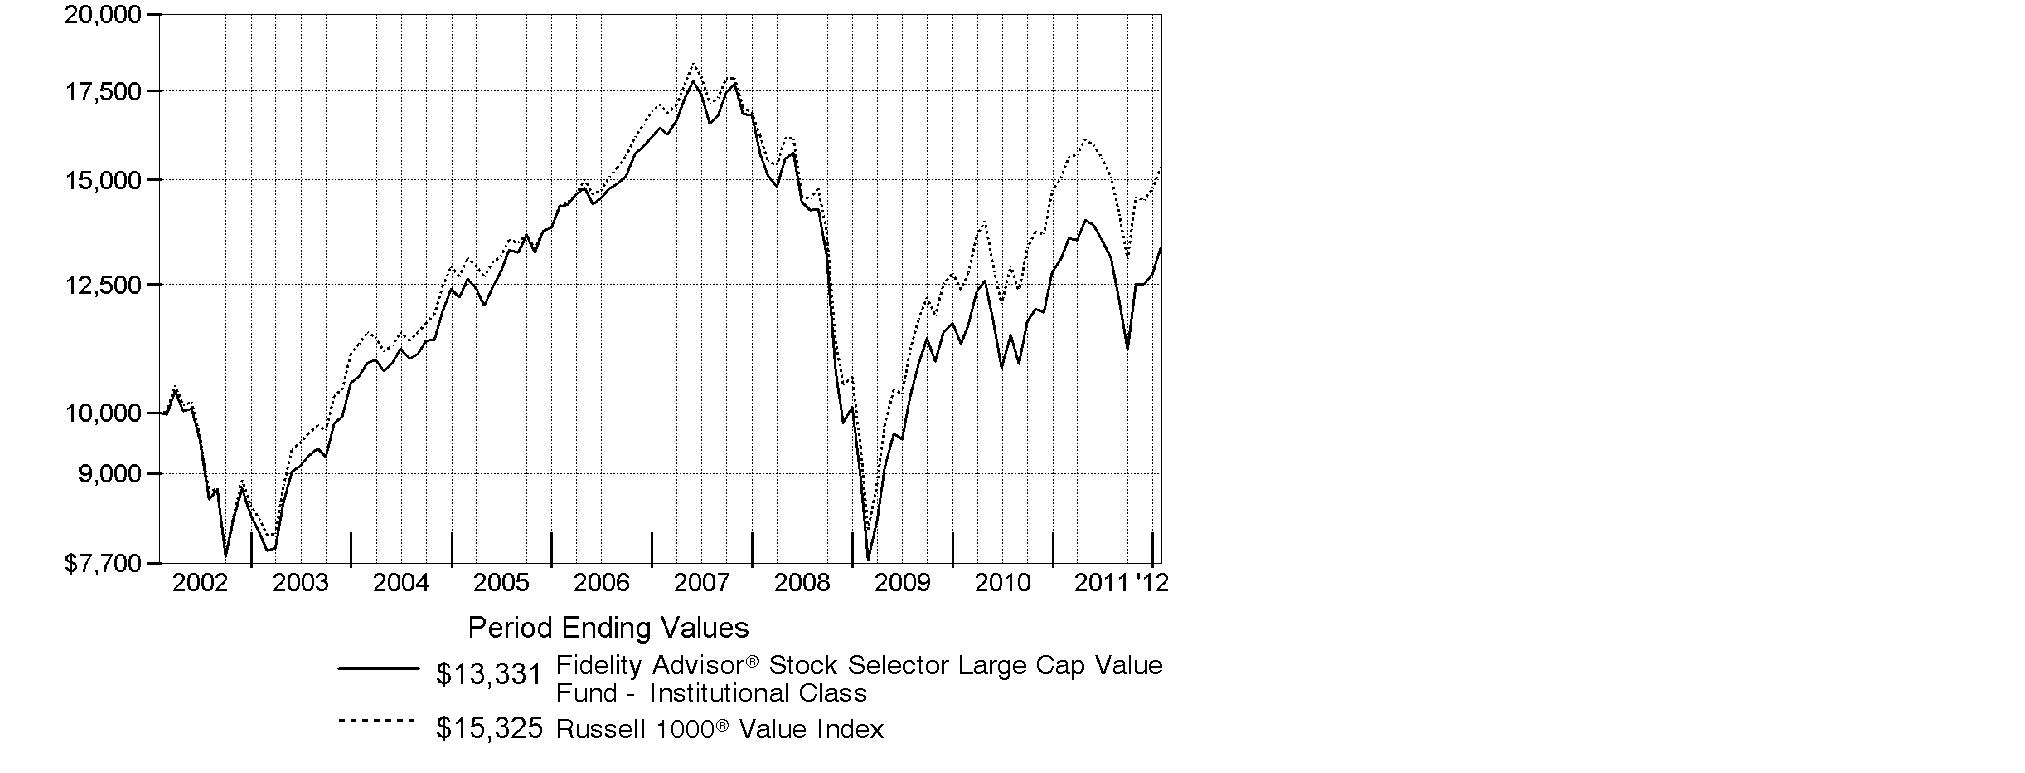
Annual Report
Management's Discussion of Fund Performance
Market Recap: After enduring one of the most volatile trading periods on record, U.S. stocks posted a gain for the 12 months ending January 31, 2012, sparked by a January rally. Strong corporate earnings reports and hints of economic recovery sent stocks mostly upward through April, when sovereign debt woes in Europe sparked fear of a global slowdown. In the summer, equities plummeted on eurozone instability, debate over the U.S. debt ceiling and a historic downgrade of the nation's sovereign debt rating. After falling as much as 13% by early August, the broad-based S&P 500® Index seesawed back to end the period on an optimistic note. For the full 12 months, the S&P 500® rose 4.22%, while the technology-laden Nasdaq Composite® Index added 5.26%. Investors began to shed perceived riskier smaller-cap stocks in favor of larger, more-established and dividend-paying names, helping to drive the Dow Jones® Industrial Average up 9.12% for the year, while the Russell 2000® - a proxy for small-caps - and Russell Midcap® indexes added 2.86% and 2.25%, respectively. Within the S&P 500®, defensive sectors such as health care (+16%) and utilities (+14%) fared best, while financials (-12%) struggled. Foreign developed-markets stocks were stung by Europe's turmoil, and the MSCI® EAFE® (Europe, Australasia, Far East) Index fell 9.49%.
Comments from Bruce Dirks, Lead Portfolio Manager of Fidelity Advisor® Stock Selector Large Cap Value Fund: For the year, the fund's Institutional Class shares returned 1.92%, performing in line with the 1.88% gain of the Russell 1000® Value Index. During the period, the fund transitioned to a multi-manager structure and its name was subsequently changed. Strong security selection in financials, coupled with substantially underweighting diversified financials - which was by far the poorest-performing industry group - helped the fund's relative return, as did stock picks in energy. On the downside, stock choices in telecommunication services, health care and information technology notably hampered performance. Four of the five top individual contributors were underweightings in diversified financial services providers Bank of America, Citigroup, Goldman Sachs Group and JPMorgan Chase, whose stocks declined by double digits. I sold all four by period end. An out-of-benchmark stake in real estate investment company Kennedy-Wilson Holdings also aided results. Detractors included Puerto Rico-based regional bank Popular, offshore oil driller Transocean - also not in the benchmark - technology manufacturer Hewlett-Packard, wireless communications provider NII Holdings and hospital operator Community Health Systems. Not owning semiconductor maker and index component Intel also hurt. Transocean was not held at period end.
Annual Report
The views expressed above reflect those of the portfolio manager(s) only through the end of the period as stated on the cover of this report and do not necessarily represent the views of Fidelity or any other person in the Fidelity organization. Any such views are subject to change at any time based upon market or other conditions and Fidelity disclaims any responsibility to update such views. These views may not be relied on as investment advice and, because investment decisions for a Fidelity fund are based on numerous factors, may not be relied on as an indication of trading intent on behalf of any Fidelity fund.
Annual Report
Shareholder Expense Example
As a shareholder of the Fund, you incur two types of costs: (1) transaction costs, including sales charges (loads) on purchase payments or redemption proceeds, and (2) ongoing costs, including management fees, distribution and/or service (12b-1) fees and other Fund expenses. This Example is intended to help you understand your ongoing costs (in dollars) of investing in the Fund and to compare these costs with the ongoing costs of investing in other mutual funds.
The Example is based on an investment of $1,000 invested at the beginning of the period and held for the entire period (August 1, 2011 to January 31, 2012).
Actual Expenses
The first line of the accompanying table for each class of the Fund provides information about actual account values and actual expenses. You may use the information in this line, together with the amount you invested, to estimate the expenses that you paid over the period. Simply divide your account value by $1,000.00 (for example, an $8,600 account value divided by $1,000.00 = 8.6), then multiply the result by the number in the first line for a class of the Fund under the heading entitled "Expenses Paid During Period" to estimate the expenses you paid on your account during this period. A small balance maintenance fee of $12.00 that is charged once a year may apply for certain accounts with a value of less than $2,000. This fee is not included in the table below. If it was, the estimate of expenses you paid during the period would be higher, and your ending account value lower, by this amount. In addition, the Fund, as a shareholder in the underlying Fidelity Central Funds, will indirectly bear its pro-rata share of the fees and expenses incurred by the underlying Fidelity Central Funds. These fees and expenses are not included in the Fund's annualized expense ratio used to calculate the expense estimate in the table below.
Hypothetical Example for Comparison Purposes
The second line of the accompanying table for each class of the Fund provides information about hypothetical account values and hypothetical expenses based on a Class' actual expense ratio and an assumed rate of return of 5% per year before expenses, which is not the Class' actual return. The hypothetical account values and expenses may not be used to estimate the actual ending account balance or expenses you paid for the period. You may use this information to compare the ongoing costs of investing in the Fund and other funds. To do so, compare this 5% hypothetical example with the 5% hypothetical examples that appear in the shareholder reports of the other funds. A small balance maintenance fee of $12.00 that is charged once a year may apply for certain accounts with a value of less than $2,000. This fee is not included in the table below. If it was, the estimate of expenses you paid during the period would be higher, and your ending account value lower, by this amount. In addition, the Fund, as a shareholder in the underlying Fidelity Central Funds, will indirectly bear its pro-rata share of the fees and expenses incurred by the underlying Fidelity Central Funds. These fees and expenses are not included in the Fund's annualized expense ratio used to calculate the expense estimate in the table below.
Please note that the expenses shown in the table are meant to highlight your ongoing costs only and do not reflect any transaction costs. Therefore, the second line of the table is useful in comparing ongoing costs only, and will not help you determine the relative total costs of owning different funds. In addition, if these transactional costs were included, your costs would have been higher.
Annual Report
| Annualized | Beginning | Ending | Expenses Paid |
Class A | .85% |
|
|
|
Actual |
| $ 1,000.00 | $ 1,018.60 | $ 4.32 |
Hypothetical A |
| $ 1,000.00 | $ 1,020.92 | $ 4.33 |
Class T | 1.12% |
|
|
|
Actual |
| $ 1,000.00 | $ 1,016.40 | $ 5.69 |
Hypothetical A |
| $ 1,000.00 | $ 1,019.56 | $ 5.70 |
Class B | 1.60% |
|
|
|
Actual |
| $ 1,000.00 | $ 1,015.20 | $ 8.13 |
Hypothetical A |
| $ 1,000.00 | $ 1,017.14 | $ 8.13 |
Class C | 1.60% |
|
|
|
Actual |
| $ 1,000.00 | $ 1,014.20 | $ 8.12 |
Hypothetical A |
| $ 1,000.00 | $ 1,017.14 | $ 8.13 |
Stock Selector Large Cap Value | .56% |
|
|
|
Actual |
| $ 1,000.00 | $ 1,019.50 | $ 2.85 |
Hypothetical A |
| $ 1,000.00 | $ 1,022.38 | $ 2.85 |
Institutional Class | .57% |
|
|
|
Actual |
| $ 1,000.00 | $ 1,020.10 | $ 2.90 |
Hypothetical A |
| $ 1,000.00 | $ 1,022.33 | $ 2.91 |
A 5% return per year before expenses
* Expenses are equal to each Class' annualized expense ratio, multiplied by the average account value over the period, multiplied by 184/365 (to reflect the one-half year period).
Annual Report
Investment Changes (Unaudited)
Top Ten Stocks as of January 31, 2012 | ||
| % of fund's | % of fund's net assets |
Royal Dutch Shell PLC Class A sponsored ADR | 2.8 | 2.7 |
Pfizer, Inc. | 2.8 | 2.2 |
General Electric Co. | 2.8 | 2.5 |
Wells Fargo & Co. | 2.8 | 2.9 |
AT&T, Inc. | 2.7 | 2.7 |
Berkshire Hathaway, Inc. Class B | 2.7 | 2.8 |
Cisco Systems, Inc. | 2.3 | 2.3 |
Merck & Co., Inc. | 2.1 | 2.0 |
Kennedy-Wilson Holdings, Inc. | 2.1 | 1.2 |
Procter & Gamble Co. | 2.0 | 2.0 |
| 25.1 | |
Top Five Market Sectors as of January 31, 2012 | ||
| % of fund's | % of fund's net assets |
Financials | 25.0 | 26.1 |
Health Care | 12.4 | 11.9 |
Energy | 12.4 | 13.1 |
Industrials | 9.0 | 9.1 |
Information Technology | 8.9 | 8.7 |
Asset Allocation (% of fund's net assets) | |||||||
As of January 31, 2012* | As of July 31, 2011** | ||||||
| Stocks and |
| | Stocks 99.7% |
| ||
| Short-Term |
| | Short-Term |
| ||
* Foreign investments | 14.1% |
| ** Foreign investments | 16.1% |
| ||

Annual Report
Investments January 31, 2012
Showing Percentage of Net Assets
Common Stocks - 98.7% | |||
Shares | Value | ||
CONSUMER DISCRETIONARY - 8.6% | |||
Auto Components - 0.6% | |||
Autoliv, Inc. (d) | 51,900 | $ 3,274,371 | |
Hotels, Restaurants & Leisure - 0.8% | |||
Carnival Corp. unit | 46,800 | 1,413,360 | |
Penn National Gaming, Inc. (a) | 63,449 | 2,597,602 | |
| 4,010,962 | ||
Household Durables - 0.8% | |||
Jarden Corp. | 118,995 | 4,008,942 | |
Media - 3.3% | |||
Comcast Corp. Class A | 209,975 | 5,583,235 | |
The Walt Disney Co. | 190,400 | 7,406,560 | |
Time Warner, Inc. | 108,500 | 4,021,010 | |
| 17,010,805 | ||
Multiline Retail - 1.6% | |||
Macy's, Inc. | 96,400 | 3,247,716 | |
Target Corp. | 102,534 | 5,209,753 | |
| 8,457,469 | ||
Specialty Retail - 1.5% | |||
Best Buy Co., Inc. | 90,400 | 2,165,080 | |
Lowe's Companies, Inc. | 197,363 | 5,295,249 | |
| 7,460,329 | ||
TOTAL CONSUMER DISCRETIONARY | 44,222,878 | ||
CONSUMER STAPLES - 7.6% | |||
Beverages - 0.8% | |||
Coca-Cola Enterprises, Inc. | 82,770 | 2,217,408 | |
PepsiCo, Inc. | 27,680 | 1,817,746 | |
| 4,035,154 | ||
Food & Staples Retailing - 1.4% | |||
CVS Caremark Corp. | 65,490 | 2,734,208 | |
Kroger Co. | 105,430 | 2,505,017 | |
Walgreen Co. | 58,340 | 1,946,222 | |
| 7,185,447 | ||
Food Products - 3.1% | |||
Archer Daniels Midland Co. | 73,630 | 2,108,027 | |
ConAgra Foods, Inc. | 101,310 | 2,701,938 | |
Kraft Foods, Inc. Class A | 147,390 | 5,645,037 | |
Common Stocks - continued | |||
Shares | Value | ||
CONSUMER STAPLES - continued | |||
Food Products - continued | |||
Sara Lee Corp. | 125,940 | $ 2,411,751 | |
The J.M. Smucker Co. | 36,920 | 2,908,558 | |
| 15,775,311 | ||
Household Products - 2.0% | |||
Procter & Gamble Co. | 167,780 | 10,576,851 | |
Tobacco - 0.3% | |||
Lorillard, Inc. | 14,400 | 1,546,416 | |
TOTAL CONSUMER STAPLES | 39,119,179 | ||
ENERGY - 12.4% | |||
Energy Equipment & Services - 0.8% | |||
Halliburton Co. | 118,146 | 4,345,410 | |
Oil, Gas & Consumable Fuels - 11.6% | |||
Anadarko Petroleum Corp. | 64,920 | 5,240,342 | |
Apache Corp. | 37,692 | 3,726,985 | |
BP PLC sponsored ADR | 49,200 | 2,258,772 | |
Canadian Natural Resources Ltd. | 115,570 | 4,577,851 | |
Chevron Corp. | 49,500 | 5,102,460 | |
HollyFrontier Corp. | 56,600 | 1,660,644 | |
Marathon Petroleum Corp. | 90,000 | 3,439,800 | |
Noble Energy, Inc. | 41,580 | 4,185,859 | |
Occidental Petroleum Corp. | 92,378 | 9,216,553 | |
Royal Dutch Shell PLC Class A sponsored ADR | 204,576 | 14,598,541 | |
Suncor Energy, Inc. | 63,800 | 2,197,609 | |
Williams Companies, Inc. | 121,198 | 3,492,926 | |
| 59,698,342 | ||
TOTAL ENERGY | 64,043,752 | ||
FINANCIALS - 25.0% | |||
Capital Markets - 3.5% | |||
Bank of New York Mellon Corp. | 238,000 | 4,790,940 | |
Invesco Ltd. | 189,800 | 4,283,786 | |
Morgan Stanley | 175,800 | 3,278,670 | |
State Street Corp. | 138,500 | 5,426,430 | |
| 17,779,826 | ||
Commercial Banks - 8.0% | |||
CIT Group, Inc. (a) | 109,700 | 4,183,958 | |
Itau Unibanco Banco Multiplo SA sponsored ADR | 200,500 | 4,001,980 | |
Common Stocks - continued | |||
Shares | Value | ||
FINANCIALS - continued | |||
Commercial Banks - continued | |||
PNC Financial Services Group, Inc. | 105,400 | $ 6,210,168 | |
Popular, Inc. (a) | 1,362,500 | 2,139,125 | |
Regions Financial Corp. | 450,000 | 2,349,000 | |
U.S. Bancorp | 294,900 | 8,322,078 | |
Wells Fargo & Co. | 486,700 | 14,216,507 | |
| 41,422,816 | ||
Consumer Finance - 0.9% | |||
SLM Corp. | 302,800 | 4,526,860 | |
Insurance - 8.3% | |||
ACE Ltd. | 73,700 | 5,129,520 | |
AFLAC, Inc. | 96,950 | 4,675,899 | |
Allstate Corp. | 162,900 | 4,699,665 | |
Berkshire Hathaway, Inc. Class B (a) | 175,257 | 13,734,891 | |
MetLife, Inc. | 139,400 | 4,925,002 | |
StanCorp Financial Group, Inc. | 63,000 | 2,435,580 | |
Torchmark Corp. | 68,850 | 3,144,380 | |
XL Group PLC Class A | 199,200 | 4,037,784 | |
| 42,782,721 | ||
Real Estate Investment Trusts - 1.5% | |||
American Tower Corp. | 50,100 | 3,181,851 | |
Public Storage | 32,200 | 4,471,292 | |
| 7,653,143 | ||
Real Estate Management & Development - 2.1% | |||
Kennedy-Wilson Holdings, Inc. | 792,800 | 10,647,304 | |
Thrifts & Mortgage Finance - 0.7% | |||
People's United Financial, Inc. | 310,000 | 3,822,300 | |
TOTAL FINANCIALS | 128,634,970 | ||
HEALTH CARE - 12.4% | |||
Biotechnology - 1.1% | |||
Amgen, Inc. | 81,400 | 5,527,874 | |
Health Care Equipment & Supplies - 0.9% | |||
Baxter International, Inc. | 4,100 | 227,468 | |
Covidien PLC | 28,900 | 1,488,350 | |
Zimmer Holdings, Inc. | 47,800 | 2,903,850 | |
| 4,619,668 | ||
Common Stocks - continued | |||
Shares | Value | ||
HEALTH CARE - continued | |||
Health Care Providers & Services - 2.2% | |||
Aetna, Inc. | 14,600 | $ 638,020 | |
Cardinal Health, Inc. | 33,800 | 1,454,414 | |
Community Health Systems, Inc. (a) | 58,000 | 1,084,600 | |
Express Scripts, Inc. (a) | 9,000 | 460,440 | |
Quest Diagnostics, Inc. | 6,100 | 354,288 | |
UnitedHealth Group, Inc. | 101,200 | 5,241,148 | |
WellPoint, Inc. | 38,000 | 2,444,160 | |
| 11,677,070 | ||
Life Sciences Tools & Services - 0.6% | |||
Thermo Fisher Scientific, Inc. (a) | 56,442 | 2,985,782 | |
Pharmaceuticals - 7.6% | |||
Bristol-Myers Squibb Co. | 65,600 | 2,114,944 | |
Johnson & Johnson | 156,900 | 10,341,279 | |
Merck & Co., Inc. | 287,400 | 10,995,924 | |
Pfizer, Inc. | 674,900 | 14,442,860 | |
Sanofi-aventis sponsored ADR | 38,300 | 1,422,079 | |
| 39,317,086 | ||
TOTAL HEALTH CARE | 64,127,480 | ||
INDUSTRIALS - 9.0% | |||
Aerospace & Defense - 1.2% | |||
Meggitt PLC | 276,784 | 1,583,448 | |
Raytheon Co. | 95,800 | 4,597,442 | |
| 6,180,890 | ||
Airlines - 0.4% | |||
SkyWest, Inc. | 142,000 | 1,817,600 | |
Commercial Services & Supplies - 1.4% | |||
Corrections Corp. of America (a) | 110,700 | 2,604,771 | |
Republic Services, Inc. | 166,300 | 4,869,264 | |
| 7,474,035 | ||
Construction & Engineering - 0.8% | |||
Foster Wheeler AG (a) | 192,100 | 4,314,566 | |
Industrial Conglomerates - 2.8% | |||
General Electric Co. | 771,100 | 14,427,281 | |
Machinery - 0.4% | |||
Stanley Black & Decker, Inc. | 26,517 | 1,860,963 | |
Road & Rail - 2.0% | |||
Con-way, Inc. | 94,000 | 2,983,560 | |
Common Stocks - continued | |||
Shares | Value | ||
INDUSTRIALS - continued | |||
Road & Rail - continued | |||
Quality Distribution, Inc. (a) | 252,349 | $ 3,098,846 | |
Union Pacific Corp. | 39,000 | 4,458,090 | |
| 10,540,496 | ||
TOTAL INDUSTRIALS | 46,615,831 | ||
INFORMATION TECHNOLOGY - 8.9% | |||
Communications Equipment - 2.3% | |||
Cisco Systems, Inc. | 607,700 | 11,929,151 | |
Computers & Peripherals - 1.7% | |||
Hewlett-Packard Co. | 305,127 | 8,537,453 | |
Electronic Equipment & Components - 1.3% | |||
Corning, Inc. | 349,798 | 4,501,900 | |
Jabil Circuit, Inc. | 101,648 | 2,303,344 | |
| 6,805,244 | ||
Internet Software & Services - 0.6% | |||
eBay, Inc. (a) | 99,271 | 3,136,964 | |
Semiconductors & Semiconductor Equipment - 2.8% | |||
Freescale Semiconductor Holdings I Ltd. (d) | 174,459 | 2,786,110 | |
Intersil Corp. Class A | 292,238 | 3,290,600 | |
Marvell Technology Group Ltd. (a) | 364,264 | 5,657,020 | |
Micron Technology, Inc. (a) | 357,700 | 2,714,943 | |
| 14,448,673 | ||
Software - 0.2% | |||
CA, Inc. | 29,160 | 751,745 | |
TOTAL INFORMATION TECHNOLOGY | 45,609,230 | ||
MATERIALS - 2.9% | |||
Chemicals - 2.0% | |||
Air Products & Chemicals, Inc. | 23,350 | 2,055,501 | |
Ashland, Inc. | 63,000 | 3,972,780 | |
Celanese Corp. Class A | 25,050 | 1,220,186 | |
LyondellBasell Industries NV Class A | 66,520 | 2,867,012 | |
| 10,115,479 | ||
Containers & Packaging - 0.3% | |||
Rock-Tenn Co. Class A | 26,970 | 1,668,364 | |
Common Stocks - continued | |||
Shares | Value | ||
MATERIALS - continued | |||
Metals & Mining - 0.6% | |||
Anglo American PLC (United Kingdom) | 77,139 | $ 3,190,025 | |
TOTAL MATERIALS | 14,973,868 | ||
TELECOMMUNICATION SERVICES - 4.4% | |||
Diversified Telecommunication Services - 3.2% | |||
AT&T, Inc. | 471,500 | 13,866,815 | |
CenturyLink, Inc. | 78,314 | 2,899,967 | |
| 16,766,782 | ||
Wireless Telecommunication Services - 1.2% | |||
NII Holdings, Inc. (a) | 219,200 | 4,408,112 | |
Sprint Nextel Corp. (a) | 739,700 | 1,568,164 | |
| 5,976,276 | ||
TOTAL TELECOMMUNICATION SERVICES | 22,743,058 | ||
UTILITIES - 7.5% | |||
Electric Utilities - 3.6% | |||
Cleco Corp. | 39,800 | 1,582,448 | |
Duke Energy Corp. | 193,300 | 4,119,223 | |
FirstEnergy Corp. | 92,600 | 3,909,572 | |
NextEra Energy, Inc. | 80,810 | 4,836,479 | |
PPL Corp. | 142,800 | 3,968,412 | |
| 18,416,134 | ||
Gas Utilities - 0.0% | |||
ONEOK, Inc. | 1,820 | 151,351 | |
Independent Power Producers & Energy Traders - 0.7% | |||
Calpine Corp. (a) | 94,230 | 1,375,758 | |
The AES Corp. (a) | 186,890 | 2,384,716 | |
| 3,760,474 | ||
Multi-Utilities - 3.2% | |||
CMS Energy Corp. | 142,100 | 3,102,043 | |
National Grid PLC sponsored ADR (d) | 74,130 | 3,698,346 | |
Common Stocks - continued | |||
Shares | Value | ||
UTILITIES - continued | |||
Multi-Utilities - continued | |||
OGE Energy Corp. | 50,940 | $ 2,692,688 | |
Sempra Energy | 122,550 | 6,973,095 | |
| 16,466,172 | ||
TOTAL UTILITIES | 38,794,131 | ||
TOTAL COMMON STOCKS (Cost $522,045,385) |
| ||
Nonconvertible Preferred Stocks - 0.1% | |||
|
|
|
|
CONSUMER DISCRETIONARY - 0.1% | |||
Automobiles - 0.1% | |||
Volkswagen AG (Cost $847,577) | 4,300 |
| |
U.S. Treasury Obligations - 0.3% | ||||
| Principal Amount |
| ||
U.S. Treasury Bills, yield at date of purchase 0% to 0.01% 2/23/12 (e) | $ 1,350,000 |
| ||
Money Market Funds - 2.8% | |||
Shares |
| ||
Fidelity Cash Central Fund, 0.12% (b) | 8,051,708 | 8,051,708 | |
Fidelity Securities Lending Cash Central Fund, 0.12% (b)(c) | 6,580,950 | 6,580,950 | |
TOTAL MONEY MARKET FUNDS (Cost $14,632,658) |
| ||
TOTAL INVESTMENT PORTFOLIO - 101.9% (Cost $538,875,615) | 525,628,233 | ||
NET OTHER ASSETS (LIABILITIES) - (1.9)% | (9,857,674) | ||
NET ASSETS - 100% | $ 515,770,559 | ||
Futures Contracts | |||||
Expiration Date | Underlying Face Amount at Value | Unrealized Appreciation/ | |||
Purchased | |||||
Equity Index Contracts | |||||
57 CME E-mini S&P 500 Index Contracts | March 2012 | $ 3,728,370 | $ (3,313) | ||
5 NYFE Russell 2000 Mini Index Contracts | March 2012 | 395,600 | 5,890 | ||
TOTAL EQUITY INDEX CONTRACTS | $ 4,123,970 | $ 2,577 | |||
|
The face value of futures purchased as a percentage of net assets is 0.8% |
Legend |
(a) Non-income producing |
(b) Affiliated fund that is available only to investment companies and other accounts managed by Fidelity Investments. The rate quoted is the annualized seven-day yield of the fund at period end. A complete unaudited listing of the fund's holdings as of its most recent quarter end is available upon request. In addition, each Fidelity Central Fund's financial statements, which are not covered by the Fund's Report of Independent Registered Public Accounting Firm, are available on the SEC's website or upon request. |
(c) Investment made with cash collateral received from securities on loan. |
(d) Security or a portion of the security is on loan at period end. |
(e) Security or a portion of the security was pledged to cover margin requirements for futures contracts. At the period end, the value of securities pledged amounted to $299,992. |
Affiliated Central Funds |
Information regarding fiscal year to date income earned by the Fund from investments in Fidelity Central Funds is as follows: |
Fund | Income earned |
Fidelity Cash Central Fund | $ 8,291 |
Fidelity Securities Lending Cash Central Fund | 19,063 |
Total | $ 27,354 |
Other Information |
The following is a summary of the inputs used, as of January 31, 2012, involving the Fund's assets and liabilities carried at fair value. The inputs or methodology used for valuing securities may not be an indication of the risk associated with investing in those securities. For more information on valuation inputs, and their aggregation into the levels used in the tables below, please refer to the Security Valuation section in the accompanying Notes to Financial Statements. |
Valuation Inputs at Reporting Date: | ||||
Description | Total | Level 1 | Level 2 | Level 3 |
Investments in Securities: | ||||
Equities: | ||||
Consumer Discretionary | $ 44,984,111 | $ 44,984,111 | $ - | $ - |
Consumer Staples | 39,119,179 | 39,119,179 | - | - |
Energy | 64,043,752 | 64,043,752 | - | - |
Financials | 128,634,970 | 128,634,970 | - | - |
Health Care | 64,127,480 | 64,127,480 | - | - |
Industrials | 46,615,831 | 46,615,831 | - | - |
Information Technology | 45,609,230 | 45,609,230 | - | - |
Materials | 14,973,868 | 14,973,868 | - | - |
Telecommunication Services | 22,743,058 | 22,743,058 | - | - |
Utilities | 38,794,131 | 38,794,131 | - | - |
U.S. Government and Government Agency Obligations | 1,349,965 | - | 1,349,965 | - |
Money Market Funds | 14,632,658 | 14,632,658 | - | - |
Total Investments in Securities: | $ 525,628,233 | $ 524,278,268 | $ 1,349,965 | $ - |
Derivative Instruments: | ||||
Assets | ||||
Futures Contracts | $ 5,890 | $ 5,890 | $ - | $ - |
Liabilities | ||||
Futures Contracts | $ (3,313) | $ (3,313) | $ - | $ - |
Total Derivative Instruments: | $ 2,577 | $ 2,577 | $ - | $ - |
Value of Derivative Instruments |
The following table is a summary of the Fund's value of derivative instruments by risk exposure as of January 31, 2012. For additional information on derivative instruments, please refer to the Derivative Instruments section in the accompanying Notes to Financial Statements. |
Risk Exposure / | Value | |
| Asset | Liability |
Equity Risk | ||
Futures Contracts (a) | $ 5,890 | $ (3,313) |
Total Value of Derivatives | $ 5,890 | $ (3,313) |
(a) Reflects cumulative appreciation/(depreciation) on futures contracts as disclosed on the Schedule of Investments. Only the period end variation margin is separately disclosed on the Statement of Assets and Liabilities. |
Distribution of investments by country of issue, as a percentage of total net assets, is as follows: (Unaudited) |
United States of America | 85.9% |
United Kingdom | 4.9% |
Bermuda | 2.5% |
Switzerland | 1.8% |
Canada | 1.3% |
Ireland | 1.1% |
Others (Individually Less Than 1%) | 2.5% |
| 100.0% |
See accompanying notes which are an integral part of the financial statements.
Annual Report
Financial Statements
Statement of Assets and Liabilities
| January 31, 2012 | |
|
|
|
Assets | ||
Investment in securities, at value (including securities loaned of $6,397,132) - See accompanying schedule: Unaffiliated issuers (cost $524,242,957) | $ 510,995,575 |
|
Fidelity Central Funds (cost $14,632,658) | 14,632,658 |
|
Total Investments (cost $538,875,615) |
| $ 525,628,233 |
Receivable for investments sold | 2,503,384 | |
Receivable for fund shares sold | 312,428 | |
Dividends receivable | 630,053 | |
Distributions receivable from Fidelity Central Funds | 1,397 | |
Prepaid expenses | 949 | |
Other receivables | 2,808 | |
Total assets | 529,079,252 | |
|
|
|
Liabilities | ||
Payable to custodian bank | $ 2,809,965 | |
Payable for investments purchased | 2,987,240 | |
Payable for fund shares redeemed | 633,468 | |
Accrued management fee | 104,126 | |
Distribution and service plan fees payable | 11,804 | |
Payable for daily variation margin on futures contracts | 1,645 | |
Other affiliated payables | 130,779 | |
Other payables and accrued expenses | 48,716 | |
Collateral on securities loaned, at value | 6,580,950 | |
Total liabilities | 13,308,693 | |
|
|
|
Net Assets | $ 515,770,559 | |
Net Assets consist of: |
| |
Paid in capital | $ 909,409,528 | |
Distributions in excess of net investment income | (41,141) | |
Accumulated undistributed net realized gain (loss) on investments and foreign currency transactions | (380,353,023) | |
Net unrealized appreciation (depreciation) on investments | (13,244,805) | |
Net Assets | $ 515,770,559 | |
See accompanying notes which are an integral part of the financial statements.
Annual Report
Statement of Assets and Liabilities - continued
| January 31, 2012 | |
|
|
|
Calculation of Maximum Offering Price Class A: | $ 10.71 | |
|
|
|
Maximum offering price per share (100/94.25 of $10.71) | $ 11.36 | |
Class T: | $ 10.72 | |
|
|
|
Maximum offering price per share (100/96.50 of $10.72) | $ 11.11 | |
Class B: | $ 10.72 | |
|
|
|
Class C: | $ 10.61 | |
|
|
|
Stock Selector Large Cap Value: | $ 10.77 | |
|
|
|
Institutional Class: | $ 10.74 | |
A Redemption price per share is equal to net asset value less any applicable contingent deferred sales charge.
See accompanying notes which are an integral part of the financial statements.
Annual Report
Financial Statements - continued
Statement of Operations
| Year ended January 31, 2012 | |
|
|
|
Investment Income |
|
|
Dividends |
| $ 13,771,452 |
Interest |
| 20 |
Income from Fidelity Central Funds |
| 27,354 |
Total income |
| 13,798,826 |
|
|
|
Expenses | ||
Management fee | $ 3,437,760 | |
Performance adjustment | (1,860,095) | |
Transfer agent fees | 1,536,906 | |
Distribution and service plan fees | 138,517 | |
Accounting and security lending fees | 227,292 | |
Custodian fees and expenses | 29,427 | |
Independent trustees' compensation | 3,693 | |
Registration fees | 64,073 | |
Audit | 54,944 | |
Legal | 2,251 | |
Interest | 307 | |
Miscellaneous | 8,510 | |
Total expenses before reductions | 3,643,585 | |
Expense reductions | (42,992) | 3,600,593 |
Net investment income (loss) | 10,198,233 | |
Realized and Unrealized Gain (Loss) Net realized gain (loss) on: | ||
Investment securities: |
|
|
Unaffiliated issuers | 82,006,935 | |
Foreign currency transactions | 5,915 | |
Futures contracts | 64,921 | |
Total net realized gain (loss) |
| 82,077,771 |
Change in net unrealized appreciation (depreciation) on: Investment securities | (80,820,632) | |
Futures contracts | 2,577 | |
Total change in net unrealized appreciation (depreciation) |
| (80,818,055) |
Net gain (loss) | 1,259,716 | |
Net increase (decrease) in net assets resulting from operations | $ 11,457,949 | |
See accompanying notes which are an integral part of the financial statements.
Annual Report
Statement of Changes in Net Assets
| Year ended | Year ended |
Increase (Decrease) in Net Assets |
|
|
Operations |
|
|
Net investment income (loss) | $ 10,198,233 | $ 10,347,123 |
Net realized gain (loss) | 82,077,771 | 92,822,563 |
Change in net unrealized appreciation (depreciation) | (80,818,055) | 32,667,985 |
Net increase (decrease) in net assets resulting | 11,457,949 | 135,837,671 |
Distributions to shareholders from net investment income | (10,179,715) | (10,612,123) |
Share transactions - net increase (decrease) | (323,065,032) | (243,855,298) |
Total increase (decrease) in net assets | (321,786,798) | (118,629,750) |
|
|
|
Net Assets | ||
Beginning of period | 837,557,357 | 956,187,107 |
End of period (including distributions in excess of net investment income of $41,141 and undistributed net investment income of $0, respectively) | $ 515,770,559 | $ 837,557,357 |
See accompanying notes which are an integral part of the financial statements.
Annual Report
Financial Highlights - Class A
Years ended January 31, | 2012 | 2011 | 2010 | 2009 | 2008 H |
Selected Per-Share Data |
|
|
|
|
|
Net asset value, beginning of period | $ 10.72 | $ 9.35 | $ 7.53 | $ 13.54 | $ 15.41 |
Income from Investment Operations |
|
|
|
|
|
Net investment income (loss) E | .14 | .09 | .09 | .16 | .12 |
Net realized and unrealized gain (loss) | .02 | 1.38 | 1.85 | (6.00) | (1.00) |
Total from investment operations | .16 | 1.47 | 1.94 | (5.84) | (.88) |
Distributions from net investment income | (.17) | (.10) | (.12) | (.17) | (.12) |
Distributions from net realized gain | - | - | - | - | (.87) |
Total distributions | (.17) | (.10) | (.12) | (.17) | (.99) |
Net asset value, end of period | $ 10.71 | $ 10.72 | $ 9.35 | $ 7.53 | $ 13.54 |
Total Return B,C,D | 1.58% | 15.79% | 25.74% | (43.20)% | (6.04)% |
Ratios to Average Net Assets F,I |
|
|
|
|
|
Expenses before reductions | .87% | 1.00% | 1.15% | 1.17% | 1.22% A |
Expenses net of fee waivers, if any | .87% | 1.00% | 1.15% | 1.17% | 1.22% A |
Expenses net of all reductions | .86% | 1.00% | 1.13% | 1.17% | 1.22% A |
Net investment income (loss) | 1.38% | .87% | 1.08% | 1.47% | .81% A |
Supplemental Data |
|
|
|
|
|
Net assets, end of period (000 omitted) | $ 18,900 | $ 20,815 | $ 23,778 | $ 22,577 | $ 9,774 |
Portfolio turnover rate G | 128% | 120% | 171% | 243% | 204% |
A Annualized
B Total returns for periods of less than one year are not annualized.
C Total returns would have been lower if certain expenses had not been reduced during the applicable periods shown.
D Total returns do not include the effect of the sales charges.
E Calculated based on average shares outstanding during the period.
F Fees and expenses of any underlying Fidelity Central Funds are not included in the Fund's expense ratio. The Fund indirectly bears its proportionate share of the expenses of any underlying Fidelity Central Funds.
G Amount does not include the portfolio activity of any underlying Fidelity Central Funds.
H For the period February 13, 2007 (commencement of sale of shares) to January 31, 2008.
I Expense ratios reflect operating expenses of the class. Expenses before reductions do not reflect amounts reimbursed by the investment adviser or reductions from brokerage service arrangements or reductions from other expense offset arrangements and do not represent the amount paid by the class during periods when reimbursements or reductions occur. Expense ratios before reductions for start-up periods may not be representative of longer-term operating periods. Expenses net of fee waivers reflect expenses after reimbursement by the investment adviser but prior to reductions from brokerage service arrangements or other expense offset arrangements. Expenses net of all reductions represent the net expenses paid by the class.
See accompanying notes which are an integral part of the financial statements.
Annual Report
Financial Highlights - Class T
Years ended January 31, | 2012 | 2011 | 2010 | 2009 | 2008 H |
Selected Per-Share Data |
|
|
|
|
|
Net asset value, beginning of period | $ 10.74 | $ 9.36 | $ 7.54 | $ 13.53 | $ 15.41 |
Income from Investment Operations |
|
|
|
|
|
Net investment income (loss) E | .12 | .06 | .07 | .12 | .08 |
Net realized and unrealized gain (loss) | .01 | 1.39 | 1.84 | (5.97) | (1.01) |
Total from investment operations | .13 | 1.45 | 1.91 | (5.85) | (.93) |
Distributions from net investment income | (.15) | (.07) | (.09) | (.14) | (.08) |
Distributions from net realized gain | - | - | - | - | (.87) |
Total distributions | (.15) | (.07) | (.09) | (.14) | (.95) |
Net asset value, end of period | $ 10.72 | $ 10.74 | $ 9.36 | $ 7.54 | $ 13.53 |
Total Return B,C,D | 1.26% | 15.50% | 25.30% | (43.34)% | (6.34)% |
Ratios to Average Net Assets F,I |
|
|
|
|
|
Expenses before reductions | 1.14% | 1.29% | 1.45% | 1.49% | 1.47% A |
Expenses net of fee waivers, if any | 1.14% | 1.29% | 1.45% | 1.49% | 1.47% A |
Expenses net of all reductions | 1.13% | 1.28% | 1.44% | 1.49% | 1.47% A |
Net investment income (loss) | 1.11% | .59% | .78% | 1.15% | .56% A |
Supplemental Data |
|
|
|
|
|
Net assets, end of period (000 omitted) | $ 5,603 | $ 5,625 | $ 9,101 | $ 9,792 | $ 5,976 |
Portfolio turnover rate G | 128% | 120% | 171% | 243% | 204% |
A Annualized
B Total returns for periods of less than one year are not annualized.
C Total returns would have been lower if certain expenses had not been reduced during the applicable periods shown.
D Total returns do not include the effect of the sales charges.
E Calculated based on average shares outstanding during the period.
F Fees and expenses of any underlying Fidelity Central Funds are not included in the Fund's expense ratio. The Fund indirectly bears its proportionate share of the expenses of any underlying Fidelity Central Funds.
G Amount does not include the portfolio activity of any underlying Fidelity Central Funds.
H For the period February 13, 2007 (commencement of sale of shares) to January 31, 2008.
I Expense ratios reflect operating expenses of the class. Expenses before reductions do not reflect amounts reimbursed by the investment adviser or reductions from brokerage service arrangements or reductions from other expense offset arrangements and do not represent the amount paid by the class during periods when reimbursements or reductions occur. Expense ratios before reductions for start-up periods may not be representative of longer-term operating periods. Expenses net of fee waivers reflect expenses after reimbursement by the investment adviser but prior to reductions from brokerage service arrangements or other expense offset arrangements. Expenses net of all reductions represent the net expenses paid by the class.
See accompanying notes which are an integral part of the financial statements.
Annual Report
Financial Highlights - Class B
Years ended January 31, | 2012 | 2011 | 2010 | 2009 | 2008 H |
Selected Per-Share Data |
|
|
|
|
|
Net asset value, beginning of period | $ 10.72 | $ 9.35 | $ 7.53 | $ 13.54 | $ 15.41 |
Income from Investment Operations |
|
|
|
|
|
Net investment income (loss) E | .07 | .01 | .02 | .07 | .01 |
Net realized and unrealized gain (loss) | .02 | 1.38 | 1.85 | (5.98) | (1.00) |
Total from investment operations | .09 | 1.39 | 1.87 | (5.91) | (.99) |
Distributions from net investment income | (.09) | (.02) | (.05) | (.10) | (.01) |
Distributions from net realized gain | - | - | - | - | (.87) |
Total distributions | (.09) | (.02) | (.05) | (.10) | (.88) |
Net asset value, end of period | $ 10.72 | $ 10.72 | $ 9.35 | $ 7.53 | $ 13.54 |
Total Return B,C,D | .86% | 14.87% | 24.79% | (43.71)% | (6.74)% |
Ratios to Average Net Assets F,I |
|
|
|
|
|
Expenses before reductions | 1.62% | 1.80% | 1.98% | 2.07% | 1.99% A |
Expenses net of fee waivers, if any | 1.62% | 1.80% | 1.98% | 2.00% | 1.99% A |
Expenses net of all reductions | 1.62% | 1.79% | 1.97% | 2.00% | 1.99% A |
Net investment income (loss) | .63% | .08% | .24% | .64% | .04% A |
Supplemental Data |
|
|
|
|
|
Net assets, end of period (000 omitted) | $ 1,819 | $ 2,274 | $ 2,711 | $ 2,600 | $ 1,860 |
Portfolio turnover rate G | 128% | 120% | 171% | 243% | 204% |
A Annualized
B Total returns for periods of less than one year are not annualized.
C Total returns would have been lower if certain expenses had not been reduced during the applicable periods shown.
D Total returns do not include the effect of the contingent deferred sales charge.
E Calculated based on average shares outstanding during the period.
F Fees and expenses of any underlying Fidelity Central Funds are not included in the Fund's expense ratio. The Fund indirectly bears its proportionate share of the expenses of any underlying Fidelity Central Funds.
G Amount does not include the portfolio activity of any underlying Fidelity Central Funds.
H For the period February 13, 2007 (commencement of sale of shares) to January 31, 2008.
I Expense ratios reflect operating expenses of the class. Expenses before reductions do not reflect amounts reimbursed by the investment adviser or reductions from brokerage service arrangements or reductions from other expense offset arrangements and do not represent the amount paid by the class during periods when reimbursements or reductions occur. Expense ratios before reductions for start-up periods may not be representative of longer-term operating periods. Expenses net of fee waivers reflect expenses after reimbursement by the investment adviser but prior to reductions from brokerage service arrangements or other expense offset arrangements. Expenses net of all reductions represent the net expenses paid by the class.
See accompanying notes which are an integral part of the financial statements.
Annual Report
Financial Highlights - Class C
Years ended January 31, | 2012 | 2011 | 2010 | 2009 | 2008 H |
Selected Per-Share Data |
|
|
|
|
|
Net asset value, beginning of period | $ 10.63 | $ 9.30 | $ 7.49 | $ 13.52 | $ 15.41 |
Income from Investment Operations |
|
|
|
|
|
Net investment income (loss) E | .07 | .01 | .03 | .08 | .01 |
Net realized and unrealized gain (loss) | .01 | 1.36 | 1.84 | (5.97) | (.98) |
Total from investment operations | .08 | 1.37 | 1.87 | (5.89) | (.97) |
Distributions from net investment income | (.10) | (.04) | (.06) | (.14) | (.05) |
Distributions from net realized gain | - | - | - | - | (.87) |
Total distributions | (.10) | (.04) | (.06) | (.14) | (.92) |
Net asset value, end of period | $ 10.61 | $ 10.63 | $ 9.30 | $ 7.49 | $ 13.52 |
Total Return B,C,D | .85% | 14.79% | 24.97% | (43.65)% | (6.61)% |
Ratios to Average Net Assets F,I |
|
|
|
|
|
Expenses before reductions | 1.62% | 1.75% | 1.89% | 1.91% | 1.94% A |
Expenses net of fee waivers, if any | 1.62% | 1.75% | 1.89% | 1.91% | 1.94% A |
Expenses net of all reductions | 1.61% | 1.74% | 1.88% | 1.91% | 1.94% A |
Net investment income (loss) | .63% | .13% | .34% | .73% | .09% A |
Supplemental Data |
|
|
|
|
|
Net assets, end of period (000 omitted) | $ 4,979 | $ 3,959 | $ 3,491 | $ 2,352 | $ 1,208 |
Portfolio turnover rate G | 128% | 120% | 171% | 243% | 204% |
A Annualized
B Total returns for periods of less than one year are not annualized.
C Total returns would have been lower if certain expenses had not been reduced during the applicable periods shown.
D Total returns do not include the effect of the contingent deferred sales charge.
E Calculated based on average shares outstanding during the period.
F Fees and expenses of any underlying Fidelity Central Funds are not included in the Fund's expense ratio. The Fund indirectly bears its proportionate share of the expenses of any underlying Fidelity Central Funds.
G Amount does not include the portfolio activity of any underlying Fidelity Central Funds.
H For the period February 13, 2007 (commencement of sale of shares) to January 31, 2008.
I Expense ratios reflect operating expenses of the class. Expenses before reductions do not reflect amounts reimbursed by the investment adviser or reductions from brokerage service arrangements or reductions from other expense offset arrangements and do not represent the amount paid by the class during periods when reimbursements or reductions occur. Expense ratios before reductions for start-up periods may not be representative of longer-term operating periods. Expenses net of fee waivers reflect expenses after reimbursement by the investment adviser but prior to reductions from brokerage service arrangements or other expense offset arrangements. Expenses net of all reductions represent the net expenses paid by the class.
See accompanying notes which are an integral part of the financial statements.
Annual Report
Financial Highlights - Stock Selector Large Cap Value
Years ended January 31, | 2012 | 2011 | 2010 | 2009 | 2008 |
Selected Per-Share Data |
|
|
|
|
|
Net asset value, beginning of period | $ 10.78 | $ 9.40 | $ 7.56 | $ 13.57 | $ 15.19 |
Income from Investment Operations |
|
|
|
|
|
Net investment income (loss) B | .18 | .11 | .12 | .20 | .18 |
Net realized and unrealized gain (loss) | .01 | 1.40 | 1.86 | (6.02) | (.80) |
Total from investment operations | .19 | 1.51 | 1.98 | (5.82) | (.62) |
Distributions from net investment income | (.20) | (.13) | (.14) | (.19) | (.13) |
Distributions from net realized gain | - | - | - | - | (.87) |
Total distributions | (.20) | (.13) | (.14) | (.19) | (1.00) |
Net asset value, end of period | $ 10.77 | $ 10.78 | $ 9.40 | $ 7.56 | $ 13.57 |
Total Return A | 1.85% | 16.09% | 26.21% | (43.03)% | (4.39)% |
Ratios to Average Net Assets C,E |
|
|
|
|
|
Expenses before reductions | .57% | .73% | .85% | .86% | .86% |
Expenses net of fee waivers, if any | .57% | .73% | .85% | .86% | .85% |
Expenses net of all reductions | .56% | .72% | .84% | .86% | .85% |
Net investment income (loss) | 1.68% | 1.15% | 1.38% | 1.78% | 1.18% |
Supplemental Data |
|
|
|
|
|
Net assets, end of period (000 omitted) | $ 482,950 | $ 803,009 | $ 914,828 | $ 916,490 | $ 1,483,574 |
Portfolio turnover rate D | 128% | 120% | 171% | 243% | 204% |
A Total returns would have been lower if certain expenses had not been reduced during the applicable periods shown.
B Calculated based on average shares outstanding during the period.
C Fees and expenses of any underlying Fidelity Central Funds are not included in the Fund's expense ratio. The Fund indirectly bears its proportionate share of the expenses of any underlying Fidelity Central Funds.
D Amount does not include the portfolio activity of any underlying Fidelity Central Funds.
E Expense ratios reflect operating expenses of the class. Expenses before reductions do not reflect amounts reimbursed by the investment adviser or reductions from brokerage service arrangements or reductions from other expense offset arrangements and do not represent the amount paid by the class during periods when reimbursements or reductions occur. Expenses net of fee waivers reflect expenses after reimbursement by the investment adviser but prior to reductions from brokerage service arrangements or other expense offset arrangements. Expenses net of all reductions represent the net expenses paid by the class.
See accompanying notes which are an integral part of the financial statements.
Annual Report
Financial Highlights - Institutional Class
Years ended January 31, | 2012 | 2011 | 2010 | 2009 | 2008 G |
Selected Per-Share Data |
|
|
|
|
|
Net asset value, beginning of period | $ 10.74 | $ 9.37 | $ 7.54 | $ 13.54 | $ 15.41 |
Income from Investment Operations |
|
|
|
|
|
Net investment income (loss) D | .17 | .11 | .12 | .20 | .17 |
Net realized and unrealized gain (loss) | .02 | 1.39 | 1.85 | (6.01) | (1.02) |
Total from investment operations | .19 | 1.50 | 1.97 | (5.81) | (.85) |
Distributions from net investment income | (.19) | (.13) | (.14) | (.19) | (.15) |
Distributions from net realized gain | - | - | - | - | (.87) |
Total distributions | (.19) | (.13) | (.14) | (.19) | (1.02) |
Net asset value, end of period | $ 10.74 | $ 10.74 | $ 9.37 | $ 7.54 | $ 13.54 |
Total Return B,C | 1.92% | 16.04% | 26.18% | (43.00)% | (5.82)% |
Ratios to Average Net Assets E,H |
|
|
|
|
|
Expenses before reductions | .60% | .74% | .87% | .85% | .85% A |
Expenses net of fee waivers, if any | .60% | .74% | .87% | .85% | .85% A |
Expenses net of all reductions | .60% | .73% | .86% | .85% | .84% A |
Net investment income (loss) | 1.65% | 1.14% | 1.36% | 1.79% | 1.19% A |
Supplemental Data |
|
|
|
|
|
Net assets, end of period (000 omitted) | $ 1,519 | $ 1,876 | $ 2,279 | $ 1,304 | $ 1,060 |
Portfolio turnover rate F | 128% | 120% | 171% | 243% | 204% |
A Annualized
B Total returns for periods of less than one year are not annualized.
C Total returns would have been lower if certain expenses had not been reduced during the applicable periods shown.
D Calculated based on average shares outstanding during the period.
E Fees and expenses of any underlying Fidelity Central Funds are not included in the Fund's expense ratio. The Fund indirectly bears its proportionate share of the expenses of any underlying Fidelity Central Funds.
F Amount does not include the portfolio activity of any underlying Fidelity Central Funds.
G For the period February 13, 2007 (commencement of sale of shares) to January 31, 2008.
H Expense ratios reflect operating expenses of the class. Expenses before reductions do not reflect amounts reimbursed by the investment adviser or reductions from brokerage service arrangements or reductions from other expense offset arrangements and do not represent the amount paid by the class during periods when reimbursements or reductions occur. Expense ratios before reductions for start-up periods may not be representative of longer-term operating periods. Expenses net of fee waivers reflect expenses after reimbursement by the investment adviser but prior to reductions from brokerage service arrangements or other expense offset arrangements. Expenses net of all reductions represent the net expenses paid by the class.
See accompanying notes which are an integral part of the financial statements.
Annual Report
Notes to Financial Statements
For the period ended January 31, 2012
1. Organization.
Fidelity Stock Selector Large Cap Value Fund (the Fund) is a fund of Fidelity Devonshire Trust (the Trust) and is authorized to issue an unlimited number of shares. The Trust is registered under the Investment Company Act of 1940, as amended (the 1940 Act), as an open-end management investment company organized as a Massachusetts business trust. The Fund offers Class A, Class T, Class C, Stock Selector Large Cap Value and Institutional Class shares, each of which, along with Class B shares, has equal rights as to assets and voting privileges. Effective after the close of business on September 1, 2010, Class B shares were closed to new accounts and additional purchases, except for exchanges and reinvestments. Each class has exclusive voting rights with respect to matters that affect that class. Class B shares will automatically convert to Class A shares after a holding period of seven years from the initial date of purchase. Investment income, realized and unrealized capital gains and losses, the common expenses of the Fund, and certain fund-level expense reductions, if any, are allocated on a pro-rata basis to each class based on the relative net assets of each class to the total net assets of the Fund. Each class differs with respect to transfer agent and distribution and service plan fees incurred. Certain expense reductions may also differ by class. In April 2011, the Board of Trustees approved a change in the name of Fidelity Large Cap Value Fund to Fidelity Stock Selector Large Cap Value Fund effective August 31, 2011.
2. Investments in Fidelity Central Funds.
The Fund invests in Fidelity Central Funds, which are open-end investment companies available only to other investment companies and accounts managed by Fidelity Management & Research Company (FMR) and its affiliates. The Fund's Schedule of Investments lists each of the Fidelity Central Funds held as of period end, if any, as an investment of the Fund, but does not include the underlying holdings of each Fidelity Central Fund. As an Investing Fund, the Fund indirectly bears its proportionate share of the expenses of the underlying Fidelity Central Funds.
The Money Market Central Funds seek preservation of capital and current income and are managed by Fidelity Investments Money Management, Inc. (FIMM), an affiliate of FMR.
A complete unaudited list of holdings for each Fidelity Central Fund is available upon request or at the Securities and Exchange Commission (the SEC) web site at www.sec.gov. In addition, the financial statements of the Fidelity Central Funds, which are not covered by the Fund's Report of Independent Registered Public Accounting Firm, are available on the SEC web site or upon request.
Annual Report
3. Significant Accounting Policies.
The financial statements have been prepared in conformity with accounting principles generally accepted in the United States of America (GAAP), which require management to make certain estimates and assumptions at the date of the financial statements. Actual results could differ from those estimates. Subsequent events, if any, through the date that the financial statements were issued have been evaluated in the preparation of the financial statements. The following summarizes the significant accounting policies of the Fund:
Security Valuation. Investments are valued as of 4:00 p.m. Eastern time on the last calendar day of the period. The Fund uses independent pricing services approved by the Board of Trustees to value its investments. When current market prices or quotations are not readily available or reliable, valuations may be determined in good faith in accordance with procedures adopted by the Board of Trustees. Factors used in determining value may include market or security specific events. The frequency with which these procedures are used cannot be predicted and they may be utilized to a significant extent. The value used for net asset value (NAV) calculation under these procedures may differ from published prices for the same securities.
The Fund categorizes the inputs to valuation techniques used to value its investments into a disclosure hierarchy consisting of three levels as shown below:
Level 1 - quoted prices in active markets for identical investments
Level 2 - other significant observable inputs (including quoted prices for similar investments, interest rates, prepayment speeds, etc.)
Level 3 - unobservable inputs (including the Fund's own assumptions based on the best information available)
Changes in valuation techniques may result in transfers in or out of an assigned level within the disclosure hierarchy. The aggregate value of investments by input level, as of January 31, 2012, is included at the end of the Fund's Schedule of Investments. Valuation techniques used to value the Fund's investments by major category are as follows:
Equity securities, including restricted securities, for which market quotations are readily available, are valued at the last reported sale price or official closing price as reported by an independent pricing service on the primary market or exchange on which they are traded and are categorized as Level 1 in the hierarchy. In the event there were no sales during the day or closing prices are not available, securities are valued at the last quoted bid price or may be valued using the last available price and are generally categorized as Level 2 in the hierarchy. For foreign equity securities, when significant market or security specific events arise, comparisons to the valuation of American Depositary Receipts
Annual Report
Notes to Financial Statements - continued
3. Significant Accounting Policies - continued
Security Valuation - continued
(ADRs), futures contracts, Exchange-traded funds (ETFs) and certain indexes as well as quoted prices for similar securities are used and are categorized as Level 2 in the hierarchy in these circumstances. Utilizing these techniques may result in transfers between Level 1 and Level 2. For restricted equity securities and private placements where observable inputs are limited, assumptions about market activity and risk are used and are categorized as Level 3 in the hierarchy.
Debt securities, including restricted securities, are valued based on evaluated prices received from independent pricing services or from dealers who make markets in such securities. For U.S. government and government agency obligations, pricing services utilize matrix pricing which considers yield or price of bonds of comparable quality, coupon, maturity and type as well as dealer supplied prices and are generally categorized as Level 2 in the hierarchy. When independent prices are unavailable or unreliable, debt securities may be valued utilizing pricing matrices which consider similar factors that would be used by independent pricing services. These are generally categorized as Level 2 in the hierarchy but may be Level 3 depending on the circumstances.
Futures contracts are valued at the settlement price established each day by the board of trade or exchange on which they are traded and are categorized as Level 1 in the hierarchy. Investments in open-end mutual funds, including the Fidelity Central Funds, are valued at their closing net asset value each business day and are categorized as Level 1 in the hierarchy.
New Accounting Pronouncements. In May 2011, the Financial Accounting Standards Board issued Accounting Standard Update No. 2011-04, Fair Value Measurement (Topic 820) - Amendments to Achieve Common Fair Value Measurement and Disclosure Requirements in U.S. GAAP and IFRSs. The update is effective during interim and annual periods beginning after December 15, 2011 and will result in additional disclosure for transfers between levels as well as expanded disclosure for securities categorized as Level 3 under the fair value hierarchy.
In December 2011, the Financial Accounting Standards Board issued Accounting Standard Update No. 2011-11, Disclosures about Offsetting Assets and Liabilities. The update creates new disclosure requirements requiring entities to disclose both gross and net information for derivatives and other financial instruments that are either offset in the Statement of Assets and Liabilities or subject to an enforceable master netting arrangement or similar agreement. The disclosure requirements are effective for interim and annual reporting periods beginning on or after January 1, 2013. Management is currently evaluating the impact of the update's adoption on the Fund's financial statement disclosures.
Annual Report
3. Significant Accounting Policies - continued
Foreign Currency. The Fund may use foreign currency contracts to facilitate transactions in foreign-denominated securities. Gains and losses from these transactions may arise from changes in the value of the foreign currency or if the counterparties do not perform under the contracts' terms.
Foreign-denominated assets, including investment securities, and liabilities are translated into U.S. dollars at the exchange rate at period end. Purchases and sales of investment securities, income and dividends received and expenses denominated in foreign currencies are translated into U.S. dollars at the exchange rate in effect on the transaction date.
The effects of exchange rate fluctuations on investments are included with the net realized and unrealized gain (loss) on investment securities. Other foreign currency transactions resulting in realized and unrealized gain (loss) are disclosed separately.
Investment Transactions and Income. For financial reporting purposes, the Fund's investment holdings and NAV include trades executed through the end of the last business day of the period. The NAV per share for processing shareholder transactions is calculated as of the close of business of the New York Stock Exchange (NYSE), normally 4:00 p.m. Eastern time and includes trades executed through the end of the prior business day. Gains and losses on securities sold are determined on the basis of identified cost and may include proceeds received from litigation. Dividend income is recorded on the ex-dividend date, except for certain dividends from foreign securities where the ex-dividend date may have passed, which are recorded as soon as the Fund is informed of the ex-dividend date. Non-cash dividends included in dividend income, if any, are recorded at the fair market value of the securities received. Distributions received on securities that represent a return of capital or capital gain are recorded as a reduction of cost of investments and/or as a realized gain. The Fund estimates the components of distributions received that may be considered return of capital distributions or capital gain distributions. Interest income and distributions from the Fidelity Central Funds are accrued as earned. Interest income includes coupon interest and amortization of premium and accretion of discount on debt securities. Investment income is recorded net of foreign taxes withheld where recovery of such taxes is uncertain.
Expenses. Expenses directly attributable to a fund are charged to that fund. Expenses attributable to more than one fund are allocated among the respective funds on the basis of relative net assets or other appropriate methods. Expense estimates are accrued in the period to which they relate and adjustments are made when actual amounts are known.
Income Tax Information and Distributions to Shareholders. Each year, the Fund intends to qualify as a regulated investment company, including distributing substantially all of its taxable income and realized gains under Subchapter M of the Internal
Annual Report
Notes to Financial Statements - continued
3. Significant Accounting Policies - continued
Income Tax Information and Distributions to Shareholders - continued
Revenue Code. As a result, no provision for income taxes is required. As of January 31, 2012, the Fund did not have any unrecognized tax benefits in the financial statements; nor is the Fund aware of any tax positions for which it is reasonably possible that the total amounts of unrecognized tax benefits will significantly change in the next twelve months. The Fund files a U.S. federal tax return, in addition to state and local tax returns as required. A fund's tax returns are subject to examination by the Internal Revenue Service (IRS) for a period of three fiscal years. State and local tax returns may be subject to examination for an additional fiscal year depending on the jurisdiction. Foreign taxes are provided for based on the Fund's understanding of the tax rules and rates that exist in the foreign markets in which it invests.
Distributions are declared and recorded on the ex-dividend date. Income dividends and capital gain distributions are declared separately for each class. Income and capital gain distributions are determined in accordance with income tax regulations, which may differ from GAAP.
Capital accounts within the financial statements are adjusted for permanent book-tax differences. These adjustments have no impact on net assets or the results of operations. Temporary book-tax differences will reverse in a subsequent period.
Book-tax differences are primarily due to futures transactions, foreign currency transactions, market discount, capital loss carryforwards and losses deferred due to wash sales and excise tax regulations.
The federal tax cost of investment securities and unrealized appreciation (depreciation) as of period end were as follows:
Gross unrealized appreciation | $ 30,248,509 |
Gross unrealized depreciation | (49,977,208) |
Net unrealized appreciation (depreciation) on securities and other investments | $ (19,728,699) |
|
|
Tax Cost | $ 545,356,932 |
The tax-based components of distributable earnings as of period end were as follows:
Capital loss carryforward | $ (371,005,041) |
Net unrealized appreciation (depreciation) | $ (19,728,699) |
Annual Report
3. Significant Accounting Policies - continued
Income Tax Information and Distributions to Shareholders - continued
Capital loss carryforwards are only available to offset future capital gains of the Fund to the extent provided by regulations and may be limited. Under the Regulated Investment Company Modernization Act of 2010 (the Act), the Fund is permitted to carry forward capital losses incurred in taxable years beginning after December 22, 2010 for an unlimited period and such capital losses are required to be used prior to any losses that expire. Capital loss carryforwards were as follows:
Fiscal year of expiration |
|
2017 | $ (182,900,202) |
2018 | (188,104,839) |
Total with expiration | $ (371,005,041) |
The tax character of distributions paid was as follows:
| January 31, 2012 | January 31, 2011 |
Ordinary Income | $ 10,179,715 | $ 10,612,123 |
4. Derivative Instruments.
Risk Exposures and the Use of Derivative Instruments. The Fund used derivative instruments (derivatives), including futures contracts, in order to meet its investment objectives. The strategy is to use derivatives to increase returns and to manage exposure to certain risks as defined below. The success of any strategy involving derivatives depends on analysis of numerous economic factors, and if the strategies for investment do not work as intended, the Fund may not achieve its objectives.
The Fund's use of derivatives increased or decreased its exposure to the following risk:
Equity Risk | Equity risk relates to the fluctuations in the value of financial instruments as a result of changes in market prices (other than those arising from interest rate risk or foreign exchange risk), whether caused by factors specific to an individual investment, its issuer, or all factors affecting all instruments traded in a market or market segment. |
The Fund is also exposed to additional risks from investing in derivatives, such as liquidity risk and counterparty credit risk. Liquidity risk is the risk that the Fund will be unable to close out the derivative in the open market in a timely manner. Counterparty credit risk is the risk that the counterparty will not be able to fulfill its obligation to the Fund. Counterparty credit risk related to exchange-traded futures contracts is minimal because of the protection provided by the exchange on which they trade. Derivatives involve, to varying degrees, risk of loss in excess of the amounts recognized in the Statement of Assets and Liabilities.
Annual Report
Notes to Financial Statements - continued
4. Derivative Instruments - continued
Futures Contracts. A futures contract is an agreement between two parties to buy or sell a specified underlying instrument for a fixed price at a specified future date. The Fund used futures contracts to manage its exposure to the stock market.
Upon entering into a futures contract, a fund is required to deposit either cash or securities (initial margin) with a clearing broker in an amount equal to a certain percentage of the face value of the contract. Futures contracts are marked-to-market daily and subsequent payments (variation margin) are made or received by a fund depending on the daily fluctuations in the value of the futures contracts and are recorded as unrealized appreciation or (depreciation). This receivable and/or payable is included in daily variation margin on futures contracts in the Statement of Assets and Liabilities. Realized gain or (loss) is recorded upon the expiration or closing of a futures contract.
The underlying face amount at value of open futures contracts at period end is shown in the Schedule of Investments under the caption "Futures Contracts." This amount reflects each contract's exposure to the underlying instrument at period end and is representative of activity for the period. Securities deposited to meet initial margin requirements are identified in the Schedule of Investments.
During the period the Fund recognized net realized gain (loss) of $64,921 and a change in net unrealized appreciation (depreciation) of $2,577 related to its investment in futures contracts. These amounts are included in the Statement of Operations.
5. Purchases and Sales of Investments.
Purchases and sales of securities, other than short-term securities, aggregated $795,702,411 and $1,118,875,137, respectively.
6. Fees and Other Transactions with Affiliates.
Management Fee. FMR and its affiliates provide the Fund with investment management related services for which the Fund pays a monthly management fee. The management fee is the sum of an individual fund fee rate that is based on an annual rate of .30% of the Fund's average net assets and an annualized group fee rate that averaged .26% during the period. The group fee rate is based upon the average net assets of all the mutual funds advised by FMR. The group fee rate decreases as assets under management increase and increases as assets under management decrease. In addition, the management fee is subject to a performance adjustment (up to a maximum of ± .20% of the Fund's average net assets over a 36 month performance period). The upward or downward adjustment to the management fee is based on the relative investment performance of Stock Selector Large Cap Value as compared to an appropriate benchmark
Annual Report
6. Fees and Other Transactions with Affiliates - continued
Management Fee - continued
index. For the period, the total annual management fee rate, including the performance adjustment, was .26% of the Fund's average net assets.
Distribution and Service Plan Fees. In accordance with Rule 12b-1 of the 1940 Act, the Fund has adopted separate Distribution and Service Plans for each class of shares. Certain classes pay Fidelity Distributors Corporation (FDC), an affiliate of FMR, separate Distribution and Service Fees, each of which is based on an annual percentage of each class' average net assets. In addition, FDC may pay financial intermediaries for selling shares of the Fund and providing shareholder support services. For the period, the Distribution and Service Fee rates, total fees and amounts retained by FDC were as follows:
| Distribution | Service | Total Fees | Retained |
Class A | -% | .25% | $ 48,117 | $ 906 |
Class T | .25% | .25% | 27,426 | 57 |
Class B | .75% | .25% | 19,719 | 14,805 |
Class C | .75% | .25% | 43,255 | 11,261 |
|
|
| $ 138,517 | $ 27,029 |
Sales Load. FDC may receive a front-end sales charge of up to 5.75% for selling Class A shares and 3.50% for selling Class T shares, some of which is paid to financial intermediaries for selling shares of the Fund. Depending on the holding period, FDC may receive contingent deferred sales charges levied on Class A, Class T, Class B, and Class C redemptions. The deferred sales charges range from 5.00% to 1.00% for Class B, 1.00% for Class C, 1.00% for certain purchases of Class A shares and .25% for certain purchases of Class T shares.
For the period, sales charge amounts retained by FDC were as follows:
| Retained |
Class A | $ 9,835 |
Class T | 1,853 |
Class B* | 2,848 |
Class C* | 791 |
| $ 15,327 |
* When Class B and Class C shares are initially sold, FDC pays commissions from its own resources to financial intermediaries through which the sales are made.
Annual Report
Notes to Financial Statements - continued
6. Fees and Other Transactions with Affiliates - continued
Transfer Agent Fees. Fidelity Investments Institutional Operations Company, Inc. (FIIOC), an affiliate of FMR, is the transfer, dividend disbursing and shareholder servicing agent for each class of the Fund. FIIOC receives account fees and asset-based fees that vary according to the account size and type of account of the shareholders of the respective classes of the Fund. FIIOC pays for typesetting, printing and mailing of shareholder reports, except proxy statements. For the period, transfer agent fees for each class were as follows:
| Amount | % of |
Class A | $ 57,559 | .30 |
Class T | 17,249 | .31 |
Class B | 5,965 | .30 |
Class C | 12,943 | .30 |
Stock Selector Large Cap Value | 1,438,489 | .25 |
Institutional Class | 4,701 | .28 |
| $ 1,536,906 |
|
Accounting and Security Lending Fees. Fidelity Service Company, Inc. (FSC), an affiliate of FMR, maintains the Fund's accounting records. The accounting fee is based on the level of average net assets for each month. Under a separate contract, FSC administers the security lending program. The security lending fee is based on the number and duration of lending transactions.
Brokerage Commissions. The Fund placed a portion of its portfolio transactions with brokerage firms which are affiliates of the investment adviser. The commissions paid to these affiliated firms were $17,211 for the period.
Interfund Lending Program. Pursuant to an Exemptive Order issued by the SEC, the Fund, along with other registered investment companies having management contracts with FMR, may participate in an interfund lending program. This program provides an alternative credit facility allowing the funds to borrow from, or lend money to, other participating affiliated funds. At period end, there were no interfund loans outstanding. The Fund's activity in this program during the period for which loans were outstanding was as follows:
Borrower or Lender | Average Loan | Weighted Average Interest Rate | Interest |
Borrower | $ 3,153,636 | .32% | $ 307 |
Annual Report
7. Committed Line of Credit.
The Fund participates with other funds managed by FMR or an affiliate in a $4.0 billion credit facility (the "line of credit") to be utilized for temporary or emergency purposes to fund shareholder redemptions or for other short-term liquidity purposes. The Fund has agreed to pay commitment fees on its pro-rata portion of the line of credit, which amounted to $1,960 and is reflected in Miscellaneous expenses on the Statement of Operations. During the period, there were no borrowings on this line of credit.
8. Security Lending.
The Fund lends portfolio securities through a lending agent from time to time in order to earn additional income. For equity securities, a lending agent is used and may loan securities to certain qualified borrowers, including Fidelity Capital Markets (FCM), a broker-dealer affiliated with the Fund. On the settlement date of the loan, the Fund receives collateral (in the form of U.S. Treasury obligations, letters of credit and/or cash) against the loaned securities and maintains collateral in an amount not less than 100% of the market value of the loaned securities during the period of the loan. The market value of the loaned securities is determined at the close of business of the Fund and any additional required collateral is delivered to the Fund on the next business day. If the borrower defaults on its obligation to return the securities loaned because of insolvency or other reasons, a fund could experience delays and costs in recovering the securities loaned or in gaining access to the collateral. Any cash collateral received is invested in the Fidelity Securities Lending Cash Central Fund. The value of loaned securities and cash collateral at period end are disclosed on the Fund's Statement of Assets and Liabilities. Security lending income represents the income earned on investing cash collateral, less rebates paid to borrowers and any lending agent fees associated with the loan, plus any premium payments received for lending certain types of securities. Security lending income is presented in the Statement of Operations as a component of income from Fidelity Central Funds. Total security lending income during the period amounted to $19,063. During the period, there were no securities loaned to FCM.
9. Expense Reductions.
Many of the brokers with whom FMR places trades on behalf of the Fund provided services to the Fund in addition to trade execution. These services included payments of certain expenses on behalf of the Fund totaling $42,992 for the period.
Annual Report
Notes to Financial Statements - continued
10. Distributions to Shareholders.
Distributions to shareholders of each class were as follows:
Years ended January 31, | 2012 | 2011 |
From net investment income |
|
|
Class A | $ 291,163 | $ 196,415 |
Class T | 76,828 | 37,346 |
Class B | 14,902 | 4,323 |
Class C | 43,527 | 17,678 |
Stock Selector Large Cap Value | 9,726,457 | 10,334,423 |
Institutional Class | 26,838 | 21,938 |
Total | $ 10,179,715 | $ 10,612,123 |
11. Share Transactions.
Transactions for each class of shares were as follows:
| Shares | Dollars | ||
Years ended January 31, | 2012 | 2011 | 2012 | 2011 |
Class A |
|
|
|
|
Shares sold | 537,296 | 509,581 | $ 5,591,381 | $ 5,070,258 |
Reinvestment of distributions | 26,981 | 17,752 | 272,774 | 183,027 |
Shares redeemed | (742,040) | (1,127,883) | (7,769,301) | (11,172,418) |
Net increase (decrease) | (177,763) | (600,550) | $ (1,905,146) | $ (5,919,133) |
Class T |
|
|
|
|
Shares sold | 164,778 | 239,347 | $ 1,752,467 | $ 2,379,089 |
Reinvestment of distributions | 7,415 | 3,520 | 75,038 | 36,365 |
Shares redeemed | (173,682) | (691,112) | (1,851,245) | (6,965,488) |
Net increase (decrease) | (1,489) | (448,245) | $ (23,740) | $ (4,550,034) |
Class B |
|
|
|
|
Shares sold | 9,062 | 64,791 | $ 86,884 | $ 633,133 |
Reinvestment of distributions | 1,307 | 374 | 13,227 | 3,863 |
Shares redeemed | (52,766) | (142,878) | (549,800) | (1,418,300) |
Net increase (decrease) | (42,397) | (77,713) | $ (449,689) | $ (781,304) |
Class C |
|
|
|
|
Shares sold | 201,797 | 193,335 | $ 2,080,198 | $ 1,918,253 |
Reinvestment of distributions | 3,605 | 1,440 | 36,155 | 14,747 |
Shares redeemed | (108,651) | (197,933) | (1,106,480) | (1,934,239) |
Net increase (decrease) | 96,751 | (3,158) | $ 1,009,873 | $ (1,239) |
Stock Selector Large Cap Value |
|
|
|
|
Shares sold | 6,854,527 | 11,945,116 | $ 72,065,849 | $ 119,799,397 |
Reinvestment of distributions | 935,043 | 980,495 | 9,500,032 | 10,157,929 |
Shares redeemed | (37,479,739) | (35,741,742) | (402,880,177) | (361,864,131) |
Net increase (decrease) | (29,690,169) | (22,816,131) | $ (321,314,296) | $ (231,906,805) |
Annual Report
11. Share Transactions - continued
| Shares | Dollars | ||
Years ended January 31, | 2012 | 2011 | 2012 | 2011 |
Institutional Class |
|
|
|
|
Shares sold | 58,013 | 40,757 | $ 608,335 | $ 403,599 |
Reinvestment of distributions | 2,632 | 2,125 | 26,662 | 21,926 |
Shares redeemed | (93,801) | (111,512) | (1,017,031) | (1,122,308) |
Net increase (decrease) | (33,156) | (68,630) | $ (382,034) | $ (696,783) |
12. Other.
The Fund's organizational documents provide former and current trustees and officers with a limited indemnification against liabilities arising in connection with the performance of their duties to the Fund. In the normal course of business, the Fund may also enter into contracts that provide general indemnifications. The Fund's maximum exposure under these arrangements is unknown as this would be dependent on future claims that may be made against the Fund. The risk of material loss from such claims is considered remote.
Annual Report
Report of Independent Registered Public Accounting Firm
To the Trustees of Fidelity Devonshire Trust and the Shareholders of Fidelity Stock Selector Large Cap Value Fund:
In our opinion, the accompanying statement of assets and liabilities, including the schedule of investments, and the related statements of operations and of changes in net assets and the financial highlights present fairly, in all material respects, the financial position of Fidelity Stock Selector Large Cap Value Fund (a fund of Fidelity Devonshire Trust) at January 31, 2012, the results of its operations for the year then ended, the changes in its net assets for each of the two years in the period then ended and the financial highlights for each of the periods indicated, in conformity with accounting principles generally accepted in the United States of America. These financial statements and financial highlights (hereafter referred to as "financial statements") are the responsibility of the Fidelity Stock Selector Large Cap Value Fund's management. Our responsibility is to express an opinion on these financial statements based on our audits. We conducted our audits of these financial statements in accordance with the standards of the Public Company Accounting Oversight Board (United States). Those standards require that we plan and perform the audit to obtain reasonable assurance about whether the financial statements are free of material misstatement. An audit includes examining, on a test basis, evidence supporting the amounts and disclosures in the financial statements, assessing the accounting principles used and significant estimates made by management, and evaluating the overall financial statement presentation. We believe that our audits, which included confirmation of securities at January 31, 2012 by correspondence with the custodian and brokers, provide a reasonable basis for our opinion.
/s/ PricewaterhouseCoopers LLP
PricewaterhouseCoopers LLP
Boston, Massachusetts
March 13, 2012
Annual Report
Trustees and Officers
The Trustees, Members of the Advisory Board, and executive officers of the trust and fund, as applicable, are listed below. The Board of Trustees governs the fund and is responsible for protecting the interests of shareholders. The Trustees are experienced executives who meet periodically throughout the year to oversee the fund's activities, review contractual arrangements with companies that provide services to the fund, oversee management of the risks associated with such activities and contractual arrangements, and review the fund's performance. Except for James C. Curvey, each of the Trustees oversees 226 funds advised by FMR or an affiliate. Mr. Curvey oversees 430 funds advised by FMR or an affiliate.
The Trustees hold office without limit in time except that (a) any Trustee may resign; (b) any Trustee may be removed by written instrument, signed by at least two-thirds of the number of Trustees prior to such removal; (c) any Trustee who requests to be retired or who has become incapacitated by illness or injury may be retired by written instrument signed by a majority of the other Trustees; and (d) any Trustee may be removed at any special meeting of shareholders by a two-thirds vote of the outstanding voting securities of the trust. Each Trustee who is not an interested person (as defined in the 1940 Act) (Independent Trustee), shall retire not later than the last day of the calendar year in which his or her 75th birthday occurs. The Independent Trustees may waive this mandatory retirement age policy with respect to individual Trustees. The executive officers and Advisory Board Members hold office without limit in time, except that any officer and Advisory Board Member may resign or may be removed by a vote of a majority of the Trustees at any regular meeting or any special meeting of the Trustees. Except as indicated, each individual has held the office shown or other offices in the same company for the past five years.
Experience, Skills, Attributes, and Qualifications of the Fund's Trustees. The Governance and Nominating Committee has adopted a statement of policy that describes the experience, qualifications, attributes, and skills that are necessary and desirable for potential Independent Trustee candidates (Statement of Policy). The Board believes that each Trustee satisfied at the time he or she was initially elected or appointed a Trustee, and continues to satisfy, the standards contemplated by the Statement of Policy. The Governance and Nominating Committee also engages professional search firms to help identify potential Independent Trustee candidates who have the experience, qualifications, attributes, and skills consistent with the Statement of Policy. From time to time, additional criteria based on the composition and skills of the current Independent Trustees, as well as experience or skills that may be appropriate in light of future changes to board composition, business conditions, and regulatory or other developments, have also been considered by the professional search firms and the Governance and Nominating Committee. In addition, the Board takes into account the Trustees' commitment and participation in Board and committee meetings, as well as their leadership of standing and ad hoc committees throughout their tenure.
In determining that a particular Trustee was and continues to be qualified to serve as a Trustee, the Board has considered a variety of criteria, none of which, in isolation, was controlling. The Board believes that, collectively, the Trustees have balanced and diverse experience, qualifications, attributes, and skills, which allow the Board to operate effectively in governing the fund and protecting the interests of shareholders. Information about the specific experience, skills, attributes, and qualifications of each Trustee, which in each case led to the Board's conclusion that the Trustee should serve (or continue to serve) as a trustee of the fund, is provided below.
Annual Report
Board Structure and Oversight Function. James C. Curvey is an interested person (as defined in the 1940 Act) and currently serves as Acting Chairman. The Trustees have determined that an interested Chairman is appropriate and benefits shareholders because an interested Chairman has a personal and professional stake in the quality and continuity of services provided to the fund. Independent Trustees exercise their informed business judgment to appoint an individual of their choosing to serve as Chairman, regardless of whether the Trustee happens to be independent or a member of management. The Independent Trustees have determined that they can act independently and effectively without having an Independent Trustee serve as Chairman and that a key structural component for assuring that they are in a position to do so is for the Independent Trustees to constitute a substantial majority for the Board. The Independent Trustees also regularly meet in executive session. Ned C. Lautenbach serves as Chairman of the Independent Trustees and as such (i) acts as a liaison between the Independent Trustees and management with respect to matters important to the Independent Trustees and (ii) with management prepares agendas for Board meetings.
Fidelity funds are overseen by different Boards of Trustees. The fund's Board oversees Fidelity's equity and high income funds and another Board oversees Fidelity's investment-grade bond, money market, and asset allocation funds. The asset allocation funds may invest in Fidelity funds overseen by the fund's Board. The use of separate Boards, each with its own committee structure, allows the Trustees of each group of Fidelity funds to focus on the unique issues of the funds they oversee, including common research, investment, and operational issues. On occasion, the separate Boards establish joint committees to address issues of overlapping consequences for the Fidelity funds overseen by each Board.
The Trustees operate using a system of committees to facilitate the timely and efficient consideration of all matters of importance to the Trustees, the fund, and fund shareholders and to facilitate compliance with legal and regulatory requirements and oversight of the fund's activities and associated risks. The Board, acting through its committees, has charged FMR and its affiliates with (i) identifying events or circumstances the occurrence of which could have demonstrably adverse effects on the fund's business and/or reputation; (ii) implementing processes and controls to lessen the possibility that such events or circumstances occur or to mitigate the effects of such events or circumstances if they do occur; and (iii) creating and maintaining a system designed to evaluate continuously business and market conditions in order to facilitate the identification and implementation processes described in (i) and (ii) above. Because the day-to-day operations and activities of the fund are carried out by or through FMR, its affiliates and other service providers, the fund's exposure to risks is mitigated but not eliminated by the processes overseen by the Trustees. While each of the Board's committees has responsibility for overseeing different aspects of the fund's activities, oversight is exercised primarily through the Operations, Audit, and Compliance Committees. In addition, the Independent Trustees have worked with FMR to enhance the Board's oversight of investment and financial risks, legal and regulatory risks, technology risks, and operational risks, including the development of additional risk reporting to the Board. For example, a working group comprised of Independent Trustees and FMR has worked and continues to work to review the Fidelity funds' valuation-related activities, reporting and risk management. Appropriate personnel, including but not limited to the fund's Chief Compliance Officer (CCO), FMR's internal auditor, the independent accountants, the fund's Treasurer and portfolio management personnel, make periodic reports to the Board's committees, as appropriate, including an annual review of FMR's risk management program for the Fidelity funds. The responsibilities of each standing committee, including their oversight responsibilities, are described further under "Standing Committees of the Fund's Trustees."
Annual Report
Trustees and Officers - continued
The fund's Statement of Additional Information (SAI) includes more information about the Trustees. To request a free copy, call Fidelity at 1-877-208-0098.
Interested Trustees*:
Correspondence intended for each Trustee who is an interested person may be sent to Fidelity Investments, 82 Devonshire Street, Boston, Massachusetts 02109.
Name, Age; Principal Occupations and Other Relevant Experience+ | |
James C. Curvey (76) | |
| Year of Election or Appointment: 2007 Mr. Curvey is Trustee and Acting Chairman of the Board of Trustees of certain Trusts. Mr. Curvey also serves as Trustee (2007-present) of other investment companies advised by FMR. Mr. Curvey is a Director of Fidelity Investments Money Management, Inc. (2009-present), Director of Fidelity Research & Analysis Co. (2009-present) and Director of FMR and FMR Co., Inc. (2007-present). Mr. Curvey is also Vice Chairman (2007-present) and Director of FMR LLC. In addition, Mr. Curvey serves as an Overseer for the Boston Symphony Orchestra and a member of the Trustees of Villanova University. Previously, Mr. Curvey was the Vice Chairman (2006-2007) and Director (2000-2007) of FMR Corp. |
Ronald P. O'Hanley (54) | |
| Year of Election or Appointment: 2011 Mr. O'Hanley is Director of FMR Co., Inc. (2010-present), Director of Fidelity Investments Money Management, Inc. (2010-present), Director of Fidelity Research & Analysis Company (2010-present), President of Fidelity Asset Management and Corporate Services and a member of Fidelity's Executive Committee (2010-present). Previously, Mr. O'Hanley served as President and Chief Executive Officer of BNY Mellon Asset Management (2007-2010). Mr. O'Hanley also served as Vice Chairman of Bank New York Mellon Corp. and a member of that firm's Executive Committee. Prior to the 2007 merger of The Bank of New York and Mellon Financial Corporation, he was Vice Chairman of Mellon Financial Corporation and President and Chief Executive Officer of Mellon Asset Management. He joined Mellon in February 1997. Mr. O'Hanley currently serves as Chairman of the Boston Public Library Foundation Board of Directors and sits on the Board of Directors of Beth Israel Deaconess Medical Center, the Board of Trustees of the Marine Biological Laboratory and the Advisory Board of the Maxwell School of Citizenship and Public Administration at Syracuse University. Mr. O'Hanley also chairs the Council on Asset Management for the Financial Services Roundtable and is a member of the Board of Directors of Institutional Investor's U.S. Institute. |
* Trustees have been determined to be "Interested Trustees" by virtue of, among other things, their affiliation with the trust or various entities under common control with FMR.
+ The information above includes each Trustee's principal occupation during the last five years and other information relating to the experience, attributes, and skills relevant to each Trustee's qualifications to serve as a Trustee, which led to the conclusion that each Trustee should serve as a Trustee for the fund.
Annual Report
Trustees and Officers - continued
Independent Trustees:
Correspondence intended for each Independent Trustee (that is, the Trustees other than the Interested Trustees) may be sent to Fidelity Investments, P.O. Box 55235, Boston, Massachusetts 02205-5235.
Name, Age; Principal Occupations and Other Relevant Experience+ | |
Dennis J. Dirks (63) | |
| Year of Election or Appointment: 2005 Prior to his retirement in May 2003, Mr. Dirks was Chief Operating Officer and a member of the Board of The Depository Trust & Clearing Corporation (DTCC). He also served as President, Chief Operating Officer, and Board member of The Depository Trust Company (DTC) and President and Board member of the National Securities Clearing Corporation (NSCC). In addition, Mr. Dirks served as Chief Executive Officer and Board member of the Government Securities Clearing Corporation, Chief Executive Officer and Board member of the Mortgage-Backed Securities Clearing Corporation, as a Trustee and a member of the Finance Committee of Manhattan College (2005-2008), and as a Trustee and a member of the Finance Committee of AHRC of Nassau County (2006-2008). Mr. Dirks is a member of the Independent Directors Council (IDC) Governing Council (2010-present) and Board of Directors for The Brookville Center for Children's Services, Inc. (2009-present). |
Alan J. Lacy (58) | |
| Year of Election or Appointment: 2008 Mr. Lacy serves as Senior Adviser (2007-present) of Oak Hill Capital Partners, L.P. (private equity). Mr. Lacy also served as Chief Executive Officer (2000-2005) and Vice Chairman (2005-2006) of Sears Holdings Corporation and Sears, Roebuck and Co. (retail). In addition, Mr. Lacy serves as a member of the Board of Directors of Dave & Buster's, Inc. (restaurant and entertainment complexes, 2010-present), The Hillman Companies, Inc. (hardware wholesalers, 2010-present), and Bristol-Myers Squibb Company (global pharmaceuticals, 2007-present). Mr. Lacy is a member of the Board of Trustees of The National Parks Conservation Association (2006-present). Previously, Mr. Lacy served as Chairman of the Board of Trustees of the National Parks Conservation Association (2008-2011) and as a member of the Board of Directors for the Western Union Company (global money transfer, 2006-2011). |
Ned C. Lautenbach (67) | |
| Year of Election or Appointment: 2000 Mr. Lautenbach is Chairman of the Independent Trustees of the Equity and High Income Funds (2006-present). Mr. Lautenbach currently serves as the Lead Director of the Eaton Corporation Board of Directors (diversified industrial, 1997-present). Mr. Lautenbach is also a member of the Board of Directors of the Philharmonic Center for the Arts in Naples, Florida (1999-present); a member of the Board of Trustees of Fairfield University (2005-present); and a member of the Council on Foreign Relations (1994-present). Previously, Mr. Lautenbach was a Partner/Advisory Partner at Clayton, Dubilier & Rice, LLC (private equity investment, 1998-2010), as well as a Director of Sony Corporation (2006-2007). |
Joseph Mauriello (67) | |
| Year of Election or Appointment: 2008 Prior to his retirement in January 2006, Mr. Mauriello served in numerous senior management positions including Deputy Chairman and Chief Operating Officer (2004-2005), and Vice Chairman of Financial Services (2002-2004) of KPMG LLP US (professional services, 1965-2005). Mr. Mauriello currently serves as a member of the Board of Directors of XL Group plc. (global insurance and re-insurance, 2006-present) and of Arcadia Resources Inc. (health care services and products, 2007-present). Previously, Mr. Mauriello served as a Director of the Hamilton Funds of the Bank of New York (2006-2007). |
Robert W. Selander (61) | |
| Year of Election or Appointment: 2011 Previously, Mr. Selander served as a Member of the Advisory Board of Fidelity's Equity and High Income Funds (2011), Executive Vice Chairman (2010), Chief Executive Officer (2009-2010), and President and Chief Executive Officer (1997-2009) of Mastercard, Inc. |
Cornelia M. Small (67) | |
| Year of Election or Appointment: 2005 Ms. Small is a member of the Board of Directors of the Teagle Foundation (2009-present). Ms. Small is also a member of the Investment Committee, and Chair (2008-present) and a member of the Board of Trustees of Smith College. In addition, Ms. Small serves on the Investment Committee of the Berkshire Taconic Community Foundation (2008-present). Previously, Ms. Small served as Chairperson of the Investment Committee (2002-2008) of Smith College. In addition, Ms. Small served as Chief Investment Officer, Director of Global Equity Investments, and a member of the Board of Directors of Scudder, Stevens & Clark and Scudder Kemper Investments. |
William S. Stavropoulos (72) | |
| Year of Election or Appointment: 2002 Mr. Stavropoulos is Vice Chairman of the Independent Trustees of the Equity and High Income Funds (2006-present). Mr. Stavropoulos serves as President and Founder of the Michigan Baseball Foundation, the Great Lakes Loons (2007-present). Mr. Stavropoulos is Chairman Emeritus of the Board of Directors of The Dow Chemical Company, where he previously served in numerous senior management positions, including President, CEO (1995-2000; 2002-2004), Chairman of the Executive Committee (2000-2006), and as a member of the Board of Directors (1990-2006). Currently, Mr. Stavropoulos is Chairman of Univar (global distributor of commodity and specialty chemicals, 2010-present), a Director of Teradata Corporation (data warehousing and technology solutions, 2008-present), Chemical Financial Corporation, Maersk Inc. (industrial conglomerate), Tyco International, Inc. (multinational manufacturing and services, 2007-present), and a member of the Advisory Board for Metalmark Capital (private equity investment, 2005-present). Mr. Stavropoulos is a special advisor to Clayton, Dubilier & Rice, LLC (private equity investment). In addition, Mr. Stavropoulos is a member of the University of Notre Dame Advisory Council for the College of Science. |
David M. Thomas (62) | |
| Year of Election or Appointment: 2008 Previously, Mr. Thomas served as Executive Chairman (2005-2006) and Chairman and Chief Executive Officer (2000-2005) of IMS Health, Inc. (pharmaceutical and healthcare information solutions). In addition, Mr. Thomas serves as a member of the Board of Directors of Fortune Brands, Inc. (consumer products), and Interpublic Group of Companies, Inc. (marketing communication, 2004-present). |
Michael E. Wiley (61) | |
| Year of Election or Appointment: 2008 Mr. Wiley also serves as a Director of Asia Pacific Exploration Consolidated (international oil and gas exploration and production, 2008-present). Mr. Wiley serves as a Director of Tesoro Corporation (independent oil refiner and marketer, 2005-present), and a Director of Bill Barrett Corporation (exploration and production, 2005-present). In addition, Mr. Wiley also serves as a Director of Post Oak Bank (privately-held bank, 2004-present). Previously, Mr. Wiley served as a member of the Board of Trustees of the University of Tulsa (2000-2006; 2007-2010), as a Senior Energy Advisor of Katzenbach Partners, LLC (consulting, 2006-2007), as an Advisory Director of Riverstone Holdings (private investment), Chairman, President, and CEO of Baker Hughes, Inc. (oilfield services, 2000-2004), and as Director of Spinnaker Exploration Company (exploration and production, 2001-2005). |
Annual Report
+ The information above includes each Trustee's principal occupation during the last five years and other information relating to the experience, attributes, and skills relevant to each Trustee's qualifications to serve as a Trustee, which led to the conclusion that each Trustee should serve as a Trustee for the fund.
Advisory Board Members and Executive Officers:
Correspondence intended for each executive officer, Edward C. Johnson 3d, and Peter S. Lynch may be sent to Fidelity Investments, 82 Devonshire Street, Boston, Massachusetts 02109.
Name, Age; Principal Occupation | |
Edward C. Johnson 3d (81) | |
| Year of Election or Appointment: 2011 Member of the Advisory Board of Fidelity's Equity and High Income Funds. Mr. Johnson serves as Chief Executive Officer, Chairman, and a Director of FMR LLC, and also serves as Chairman and Director of FIL Limited. Previously, Mr. Johnson served as a Trustee and Chairman of the Board of certain Fidelity Trusts, Chairman and a Director of FMR, Chairman and a Director of FMR Co., Inc., and President of FMR LLC (2006-2007). |
Peter S. Lynch (68) | |
| Year of Election or Appointment: 2003 Member of the Advisory Board of Fidelity's Equity and High Income Funds. Mr. Lynch is Vice Chairman and a Director of FMR and FMR Co., Inc. In addition, Mr. Lynch serves as a Trustee of Boston College and as the Chairman of the Inner-City Scholarship Fund. Previously, Mr. Lynch served on the Special Olympics International Board of Directors (1997-2006). |
Kenneth B. Robins (42) | |
| Year of Election or Appointment: 2008 President and Treasurer of Fidelity's Equity and High Income Funds. Mr. Robins also serves as President and Treasurer (2010-present) and Assistant Treasurer (2009-present) of other Fidelity funds and is an employee of Fidelity Investments (2004-present). Previously, Mr. Robins served as Deputy Treasurer of the Fidelity funds (2005-2008) and Treasurer and Chief Financial Officer of The North Carolina Capital Management Trust: Cash and Term Portfolios (2006-2008). |
Brian B. Hogan (47) | |
| Year of Election or Appointment: 2009 Vice President of Equity and High Income Funds. Mr. Hogan also serves as President of FMR's Equity Division (2009-present). Previously, Mr. Hogan served as Senior Vice President, Equity Research of FMR (2006-2009) and as a portfolio manager. |
Thomas C. Hense (48) | |
| Year of Election or Appointment: 2008 or 2010 Vice President of Fidelity's High Income (2008), Small Cap (2008), and Value (2010) Funds. Previously, Mr. Hense served as a portfolio manager for Fidelity's Institutional Money Management Group (Pyramis) (2003-2008). |
Scott C. Goebel (44) | |
| Year of Election or Appointment: 2008 Secretary and Chief Legal Officer (CLO) of the Fidelity funds. Mr. Goebel also serves as Secretary of Fidelity Investments Money Management, Inc. (FIMM) (2010-present) and Fidelity Research and Analysis Company (FRAC) (2010-present); Secretary and CLO of The North Carolina Capital Management Trust: Cash and Term Portfolios (2008-present); General Counsel, Secretary, and Senior Vice President of FMR (2008-present) and FMR Co., Inc. (2008-present); employed by FMR LLC or an affiliate (2001-present); Chief Legal Officer of Fidelity Management & Research (Hong Kong) Limited (2008-present) and Assistant Secretary of Fidelity Management & Research (Japan) Inc. (2008-present), and Fidelity Management & Research (U.K.) Inc. (2008-present). Previously, Mr. Goebel served as Assistant Secretary of FIMM (2008-2010), FRAC (2008-2010), and the Funds (2007-2008) and as Vice President and Secretary of Fidelity Distributors Corporation (FDC) (2005-2007). |
William C. Coffey (42) | |
| Year of Election or Appointment: 2009 Assistant Secretary of Fidelity's Equity and High Income Funds. Mr. Coffey also serves as Senior Vice President and Deputy General Counsel of FMR LLC (2010-present), and is an employee of Fidelity Investments. Previously, Mr. Coffey served as Vice President and Associate General Counsel of FMR LLC (2005-2009). |
Holly C. Laurent (57) | |
| Year of Election or Appointment: 2008 Anti-Money Laundering (AML) Officer of the Fidelity funds. Ms. Laurent also serves as AML Officer of The North Carolina Capital Management Trust: Cash and Term Portfolios (2008-present) and is an employee of Fidelity Investments. Previously, Ms. Laurent was Senior Vice President and Head of Legal for Fidelity Business Services India Pvt. Ltd. (2006-2008), and Senior Vice President, Deputy General Counsel and Group Head for FMR LLC (2005-2006). |
Christine Reynolds (53) | |
| Year of Election or Appointment: 2008 Chief Financial Officer of the Fidelity funds. Ms. Reynolds became President of Fidelity Pricing and Cash Management Services (FPCMS) in August 2008. Ms. Reynolds served as Chief Operating Officer of FPCMS (2007-2008). Previously, Ms. Reynolds served as President, Treasurer, and Anti-Money Laundering officer of the Fidelity funds (2004-2007). |
Kenneth A. Rathgeber (64) | |
| Year of Election or Appointment: 2004 Chief Compliance Officer of Fidelity's Equity and High Income Funds. Mr. Rathgeber is Chief Compliance Officer of Fidelity Management & Research (Hong Kong) Limited (2008-present), Fidelity Management & Research (Japan) Inc. (2008-present), FMR (2005-present), FMR Co., Inc. (2005-present), Fidelity Management & Research (U.K.) Inc. (2005-present), Fidelity Research & Analysis Company (2005-present), Fidelity Investments Money Management, Inc. (2005-present), Pyramis Global Advisors, LLC (2005-present), and Strategic Advisers, Inc. (2005-present). |
Joseph F. Zambello (54) | |
| Year of Election or Appointment: 2011 Deputy Treasurer of the Fidelity funds. Mr. Zambello is an employee of Fidelity Investments. Previously, Mr. Zambello served as Vice President of FMR's Program Management Group (2009-2011) and Vice President of the Transfer Agent Oversight Group (2005-2009). |
Adrien E. Deberghes (44) | |
| Year of Election or Appointment: 2008 Deputy Treasurer of Fidelity's Equity and High Income Funds. Mr. Deberghes also serves as Vice President and Assistant Treasurer of Fidelity Rutland Square Trust II and Fidelity Commonwealth Trust II (2011-present), Assistant Treasurer of other Fidelity funds (2010-present), and is an employee of Fidelity Investments (2008-present). Previously, Mr. Deberghes served as Senior Vice President of Mutual Fund Administration at State Street Corporation (2007-2008), Senior Director of Mutual Fund Administration at Investors Bank & Trust (2005-2007), and Director of Finance for Dunkin' Brands (2000-2005). |
Stephanie J. Dorsey (42) | |
| Year of Election or Appointment: 2010 Assistant Treasurer of Fidelity's Equity and High Income Funds. Ms. Dorsey also serves as Deputy Treasurer of other Fidelity funds (2008-present) and is an employee of Fidelity Investments (2008-present). Previously, Ms. Dorsey served as Treasurer (2004-2008) of the JPMorgan Mutual Funds and Vice President (2004-2008) of JPMorgan Chase Bank. |
John R. Hebble (53) | |
| Year of Election or Appointment: 2009 Assistant Treasurer of Fidelity's Equity and High Income Funds. Mr. Hebble also serves as President (2011-present), Treasurer, and Chief Financial Officer of The North Carolina Capital Management Trust: Cash and Term Portfolios (2008-present), President and Treasurer of other Fidelity funds (2008-present) and is an employee of Fidelity Investments. |
Gary W. Ryan (53) | |
| Year of Election or Appointment: 2005 Assistant Treasurer of the Fidelity funds. Mr. Ryan is an employee of Fidelity Investments. Previously, Mr. Ryan served as Vice President of Fund Reporting in Fidelity Pricing and Cash Management Services (FPCMS) (1999-2005). |
Jonathan Davis (43) | |
| Year of Election or Appointment: 2010 Assistant Treasurer of the Fidelity funds. Mr. Davis is also Assistant Treasurer of Fidelity Rutland Square Trust II and Fidelity Commonwealth Trust II. Mr. Davis is an employee of Fidelity Investments. Previously, Mr. Davis served as Vice President and Associate General Counsel of FMR LLC (2003-2010). |
Annual Report
Distributions (Unaudited)
Institutional Class designates 100% of the dividends distributed during the fiscal year as qualifying for the dividends-received deduction for corporate shareholders.
Institutional Class designates 100% of the dividends distributed during the fiscal year as amounts which may be taken into account as a dividend for purposes of the maximum rate under section 1(h)(11) of the Internal Revenue Code.
The fund will notify shareholders in January 2013 of amounts for use in preparing 2012 income tax returns.
Annual Report
Investment Adviser
Fidelity Management & Research Company
Boston, MA
Investment Sub-Advisers
FMR Co., Inc.
Fidelity Management & Research
(U.K.) Inc.
Fidelity Management & Research
(Hong Kong) Limited
Fidelity Management & Research
(Japan) Inc.
General Distributor
Fidelity Distributors Corporation
Boston, MA
Transfer and Service Agents
Fidelity Investments Institutional Operations Company, Inc.
Boston, MA
Fidelity Service Company, Inc.
Boston, MA
Custodian
Citibank, N.A.
New York, NY
ALCVI-UANN-0312
1.838383.102
(Fidelity Investment logo)(registered trademark)
Fidelity®
Telecom and Utilities
Fund
Annual Report
January 31, 2012
(Fidelity Cover Art)
Contents
Chairman's Message | The Chairman's message to shareholders. | |
Performance | How the fund has done over time. | |
Management's Discussion of Fund Performance | The Portfolio Manager's review of fund performance and strategy. | |
Shareholder Expense Example | An example of shareholder expenses. | |
Investment Changes | A summary of major shifts in the fund's investments over the past six months. | |
Investments | A complete list of the fund's investments with their market values. | |
Financial Statements | Statements of assets and liabilities, operations, and changes in net assets, as well as financial highlights. | |
Notes | Notes to the financial statements. | |
Report of Independent Registered Public Accounting Firm |
| |
Trustees and Officers |
| |
Distributions |
|
To view a fund's proxy voting guidelines and proxy voting record for the 12-month period ended June 30, visit http://www.fidelity.com/proxyvotingresults or visit the Securities and Exchange Commission's (SEC) web site at http://www.sec.gov. You may also call 1-800-544-8544 to request a free copy of the proxy voting guidelines.
Standard & Poor's, S&P and S&P 500 are registered service marks of The McGraw-Hill Companies, Inc. and have been licensed for use by Fidelity Distributors Corporation.
Other third party marks appearing herein are the property of their respective owners.
All other marks appearing herein are registered or unregistered trademarks or service marks of FMR LLC or an affiliated company.
Annual Report
This report and the financial statements contained herein are submitted for the general information of the shareholders of the fund. This report is not authorized for distribution to prospective investors in the fund unless preceded or accompanied by an effective prospectus.
A fund files its complete schedule of portfolio holdings with the SEC for the first and third quarters of each fiscal year on Form N-Q. Forms N-Q are available on the SEC's web site at http://www.sec.gov. A fund's Forms N-Q may be reviewed and copied at the SEC's Public Reference Room in Washington, DC. Information regarding the operation of the SEC's Public Reference Room may be obtained by calling 1-800-SEC-0330. For a complete list of a fund's portfolio holdings, view the most recent holdings listing, semiannual report, or annual report on Fidelity's web site at http://www.fidelity.com, http://www.advisor.fidelity.com, or http://www.401k.com, as applicable.
NOT FDIC INSURED • MAY LOSE VALUE • NO BANK GUARANTEE
Neither the fund nor Fidelity Distributors Corporation is a bank.
Annual Report
Chairman's Message
(photo_of_James_C_Curvey)
Dear Shareholder:
Following a year marked by unusually high volatility, 2012 began with most major asset classes advancing steadily in January. For U.S. equities, it was the strongest start to a new year since 1997. International stocks fared even better, despite continued uncertainty related to the sovereign debt crisis in Europe. Investors have been acutely sensitive to the latest news, for better or worse, coming out of the eurozone and its impact on financial markets. As we look ahead, the unresolved debt crisis in Europe remains at the center of a series of risk factors, summarized below, that we believe have the greatest potential to influence the global investment landscape.
Deleveraging and the economy
In the euro-currency area, fiscal austerity among nations and debt deleveraging among financial companies loaded with sovereign debt are deflationary measures and serve to hinder economic growth in the short term. Such an economic and financial-market scenario has not been historically supportive of strong performance among riskier assets, and emerges at a time when many nations need a resurgent economy to assist them in closing their budget deficits and in building confidence among bond buyers to help them refinance their existing debt obligations.
Slowdown in China and Europe
China's economy is the second-largest in the world, and it has been the biggest contributor to global growth since the end of the last recession. Thus, the slower pace of domestic growth in China has led to lower demand for imports of commodities and other construction materials from the rest of the world. In addition, economic weakness in Europe and the broad-based global economic slowdown are putting pressure on China's export growth, which has been largely responsible for its breakneck pace of annual gross domestic product (GDP) growth during the past three decades.
Credit deterioration and contagion
The heightened macroeconomic risk and elevated credit risk swirling around certain European nations and financial institutions have caused many market participants to avoid purchases of or reduce exposure to short-term debt offerings by these issuers. With increased credit risk, there are growing concerns about the potential credit contraction and contagion from European issuers spreading to other financial markets.
We invite you to learn more by visiting us on the Internet or calling us by phone. It is our privilege to provide the resources you need to choose investments that are right for you.
Sincerely,
(The acting chairman's signature appears here.)
James C. Curvey
Acting Chairman
Annual Report
Performance: The Bottom Line
Average annual total return reflects the change in the value of an investment, assuming reinvestment of the fund's distributions from dividend income and capital gains (the profits earned upon the sale of securities that have grown in value, if any) and assuming a constant rate of performance each year. The $10,000 table and the fund's returns do not reflect the deduction of taxes that a shareholder would pay on fund distributions or the redemption of fund shares. During periods of reimbursement by Fidelity, a fund's total return will be greater than it would be had the reimbursement not occurred. How a fund did yesterday is no guarantee of how it will do tomorrow.
Average Annual Total Returns
Periods ended January 31, 2012 | Past 1 | Past 5 | Past 10 |
Fidelity® Telecom and Utilities Fund | 6.35% | -0.11% | 5.20% |
$10,000 Over 10 Years
Let's say hypothetically that $10,000 was invested in Fidelity® Telecom and Utilities Fund on January 31, 2002. The chart shows how the value of your investment would have changed, and also shows how the S&P 500® Index performed over the same period.
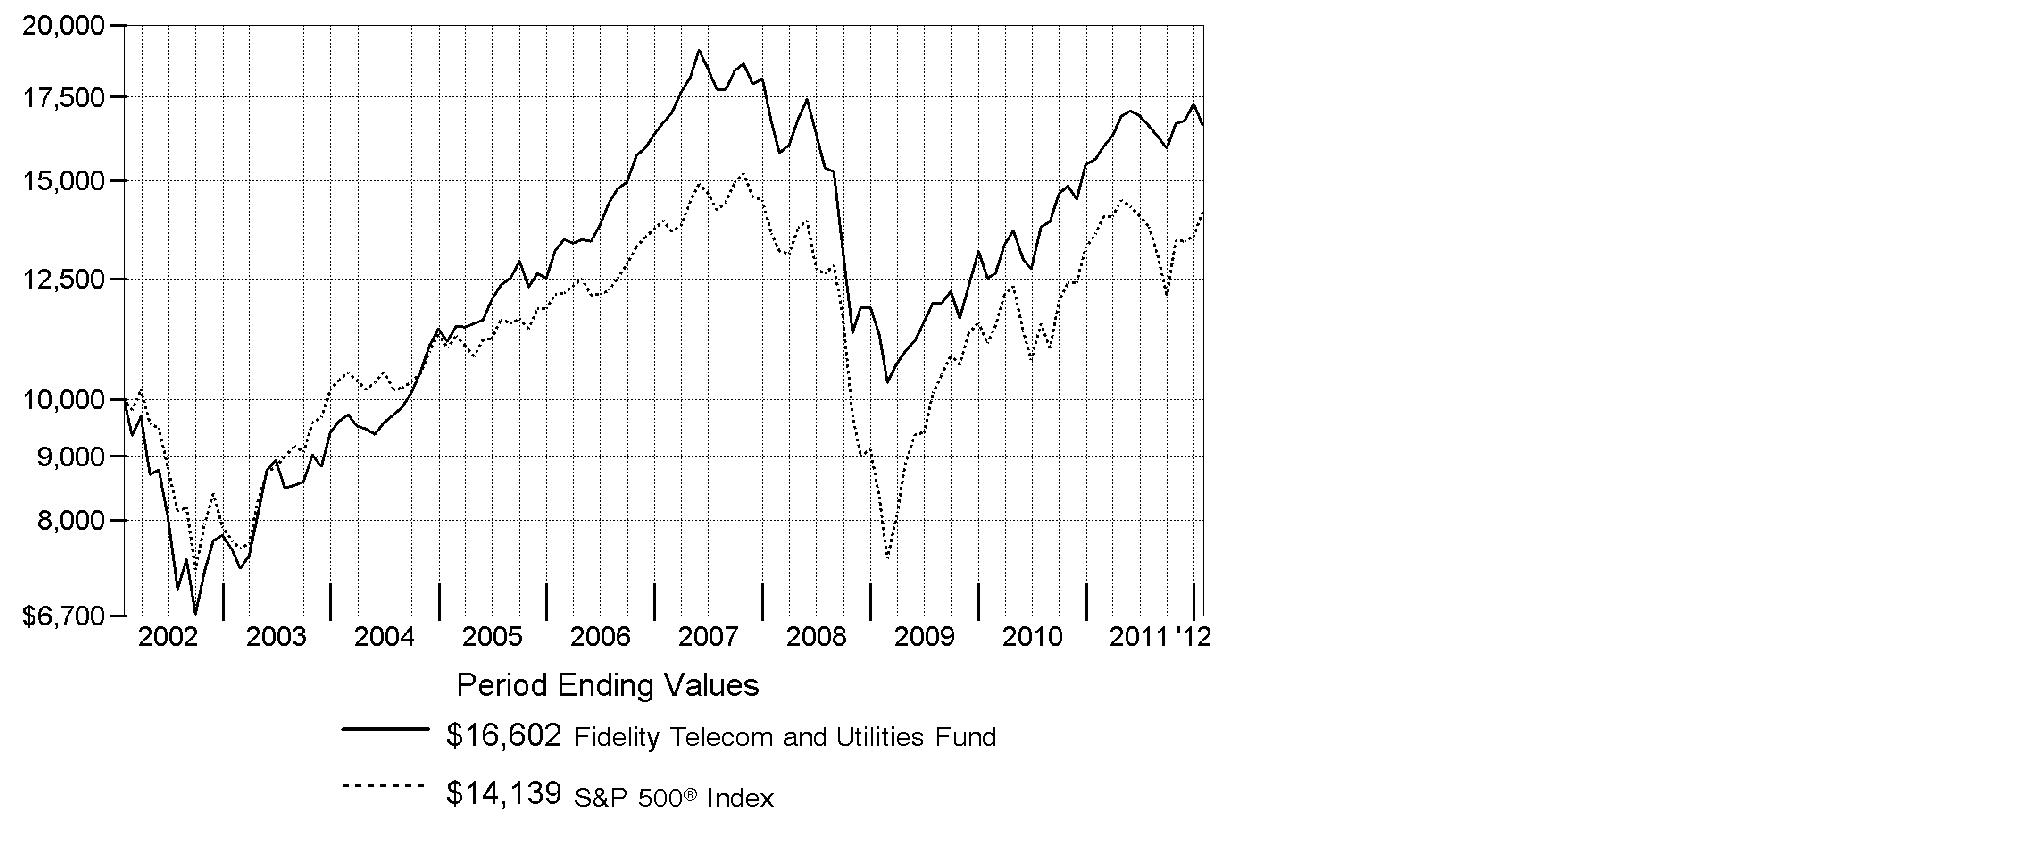
Annual Report
Management's Discussion of Fund Performance
Market Recap: After enduring one of the most volatile trading periods on record, U.S. stocks posted a gain for the 12 months ending January 31, 2012, sparked by a January rally. Strong corporate earnings reports and hints of economic recovery sent stocks mostly upward through April, when sovereign debt woes in Europe sparked fear of a global slowdown. In the summer, equities plummeted on eurozone instability, debate over the U.S. debt ceiling and a historic downgrade of the nation's sovereign debt rating. After falling as much as 13% by early August, the broad-based S&P 500® Index seesawed back to end the period on an optimistic note. For the full 12 months, the S&P 500® rose 4.22%, while the technology-laden Nasdaq Composite® Index added 5.26%. Investors began to shed perceived riskier smaller-cap stocks in favor of larger, more-established and dividend-paying names, helping to drive the Dow Jones® Industrial Average up 9.12% for the year, while the Russell 2000® - a proxy for small-caps - and Russell Midcap® indexes added 2.86% and 2.25%, respectively. Within the S&P 500®, defensive sectors such as health care (+16%) and utilities (+14%) fared best, while financials (-12%) struggled. Foreign developed-markets stocks were stung by Europe's turmoil, and the MSCI® EAFE® (Europe, Australasia, Far East) Index fell 9.49%.
Comments from Douglas Simmons, Portfolio Manager of Fidelity® Telecom and Utilities Fund: For the year ending January 31, 2012, the fund returned 6.35%, underperforming the 9.35% gain of the Russell 3000® Utilities Index. Security selection among integrated telecommunication services providers hurt, including underweighting benchmark heavyweight AT&T, which I sold from the fund before period end. My positioning on the utility side also detracted, as I shifted some assets from regulated utilities to deregulated power producers, a move that failed to pay off in an uncertain market. Individual detractors included an overweighting in New York gas utility National Fuel Gas and underweightings in two electric utilities and significant index components, Virginia's Dominion Resources and Atlanta's Southern Company, the latter of which I sold. On the plus side, stock selection in independent power energy trade helped offset much of the negative effect of overweighting that group. Our small position in telecom company Global Crossing performed well due to its acquisition by Level 3 Communications. We sold this stock in April after the deal was announced. Oklahoma-based gas utility and pipeline company ONEOK also contributed, as did underweighting rural wireline company Frontier Communications.
The views expressed above reflect those of the portfolio manager(s) only through the end of the period as stated on the cover of this report and do not necessarily represent the views of Fidelity or any other person in the Fidelity organization. Any such views are subject to change at any time based upon market or other conditions and Fidelity disclaims any responsibility to update such views. These views may not be relied on as investment advice and, because investment decisions for a Fidelity fund are based on numerous factors, may not be relied on as an indication of trading intent on behalf of any Fidelity fund.
Annual Report
Shareholder Expense Example
As a shareholder of the Fund, you incur two types of costs: (1) transaction costs, and (2) ongoing costs, including management fees and other Fund expenses. This Example is intended to help you understand your ongoing costs (in dollars) of investing in the Fund and to compare these costs with the ongoing costs of investing in other mutual funds.
The Example is based on an investment of $1,000 invested at the beginning of the period and held for the entire period (August 1, 2011 to January 31, 2012).
Actual Expenses
The first line of the accompanying table provides information about actual account values and actual expenses. You may use the information in this line, together with the amount you invested, to estimate the expenses that you paid over the period. Simply divide your account value by $1,000.00 (for example, an $8,600 account value divided by $1,000.00 = 8.6), then multiply the result by the number in the first line under the heading entitled "Expenses Paid During Period" to estimate the expenses you paid on your account during this period. A small balance maintenance fee of $12.00 that is charged once a year may apply for certain accounts with a value of less than $2,000. This fee is not included in the table below. If it was, the estimate of expenses you paid during the period would be higher, and your ending account value lower, by this amount. In addition, the Fund, as a shareholder in the underlying Fidelity Central Funds, will indirectly bear its pro-rata share of the fees and expenses incurred by the underlying Fidelity Central Funds. These fees and expenses are not included in the Fund's annualized expense ratio used to calculate the expense estimate in the table below.
Hypothetical Example for Comparison Purposes
The second line of the accompanying table provides information about hypothetical account values and hypothetical expenses based on the Fund's actual expense ratio and an assumed rate of return of 5% per year before expenses, which is not the Fund's actual return. The hypothetical account values and expenses may not be used to estimate the actual ending account balance or expenses you paid for the period. You may use this information to compare the ongoing costs of investing in the Fund and other funds. To do so, compare this 5% hypothetical example with the 5% hypothetical examples that appear in the shareholder reports of the other funds. A small balance maintenance fee of $12.00 that is charged once a year may apply for certain accounts with a value of less than $2,000. This fee is not included in the table below. If it was, the estimate of expenses you paid during the period would be higher, and your ending account value lower, by this amount. In addition, the Fund, as a shareholder in the underlying Fidelity Central Funds, will indirectly bear its pro-rata share of the fees and expenses incurred by the underlying Fidelity Central Funds. These fees and expenses are not included in the Fund's annualized expense ratio used to calculate the expense estimate in the table below.
Please note that the expenses shown in the table are meant to highlight your ongoing costs only and do not reflect any transaction costs. Therefore, the second line of the table is useful in comparing ongoing costs only, and will not help you determine the relative total costs of owning different funds.
Annual Report
Shareholder Expense Example - continued
| Annualized | Beginning | Ending | Expenses Paid |
Actual | .81% | $ 1,000.00 | $ 1,001.70 | $ 4.09 |
Hypothetical (5% return per year before expenses) |
| $ 1,000.00 | $ 1,021.12 | $ 4.13 |
* Expenses are equal to the Fund's annualized expense ratio, multiplied by the average account value over the period, multiplied by 184/365 (to reflect the one-half year period).
Annual Report
Investment Changes (Unaudited)
Top Ten Stocks as of January 31, 2012 | ||
| % of fund's | % of fund's net assets |
Verizon Communications, Inc. | 13.5 | 4.9 |
NextEra Energy, Inc. | 9.2 | 7.6 |
CenturyLink, Inc. | 7.0 | 6.0 |
Edison International | 6.7 | 5.5 |
Duke Energy Corp. | 5.7 | 0.0 |
FirstEnergy Corp. | 4.9 | 4.2 |
Constellation Energy Group, Inc. | 4.7 | 3.5 |
The AES Corp. | 4.6 | 3.9 |
Sempra Energy | 3.8 | 0.0 |
Progress Energy, Inc. | 3.5 | 0.0 |
| 63.6 | |
Top Five Industries as of January 31, 2012 | ||
| % of fund's | % of fund's net assets 6 months ago |
Electric Utilities | 35.8 | 34.6 |
Diversified Telecommunication Services | 22.0 | 25.7 |
Multi-Utilities | 13.3 | 12.2 |
Independent Power Producers & Energy Traders | 13.0 | 12.7 |
Gas Utilities | 5.1 | 5.8 |
Asset Allocation (% of fund's net assets) | |||||||
As of January 31, 2012* | As of July 31, 2011** | ||||||
| Stocks 99.8% |
| | Stocks 99.7% |
| ||
| Short-Term |
| | Short-Term |
| ||
* Foreign investments | 0.6% |
| * * Foreign investments | 4.4% |
| ||

Annual Report
Investments January 31, 2012
Showing Percentage of Net Assets
Common Stocks - 99.8% | |||
Shares | Value (000s) | ||
CONSUMER DISCRETIONARY - 3.7% | |||
Media - 3.7% | |||
Comcast Corp. Class A | 808,800 | $ 21,506 | |
DISH Network Corp. Class A | 343,900 | 9,602 | |
| 31,108 | ||
ENERGY - 1.6% | |||
Oil, Gas & Consumable Fuels - 1.6% | |||
El Paso Corp. | 351,600 | 9,447 | |
Williams Companies, Inc. | 140,900 | 4,061 | |
| 13,508 | ||
FINANCIALS - 2.1% | |||
Real Estate Investment Trusts - 2.1% | |||
American Tower Corp. | 281,800 | 17,897 | |
TELECOMMUNICATION SERVICES - 24.6% | |||
Diversified Telecommunication Services - 22.0% | |||
CenturyLink, Inc. | 1,594,242 | 59,035 | |
Frontier Communications Corp. | 2,936,700 | 12,569 | |
Verizon Communications, Inc. | 2,995,600 | 112,815 | |
| 184,419 | ||
Wireless Telecommunication Services - 2.6% | |||
Clearwire Corp. Class A (a) | 9,957,100 | 16,827 | |
TIM Participacoes SA sponsored ADR | 176,100 | 5,080 | |
| 21,907 | ||
TOTAL TELECOMMUNICATION SERVICES | 206,326 | ||
UTILITIES - 67.8% | |||
Electric Utilities - 35.8% | |||
American Electric Power Co., Inc. | 689,900 | 27,292 | |
Duke Energy Corp. | 2,227,400 | 47,466 | |
Edison International | 1,375,828 | 56,464 | |
FirstEnergy Corp. | 969,800 | 40,945 | |
ITC Holdings Corp. | 117,500 | 8,661 | |
NextEra Energy, Inc. | 1,287,500 | 77,057 | |
NV Energy, Inc. | 802,785 | 13,005 | |
Progress Energy, Inc. | 540,000 | 29,338 | |
| 300,228 | ||
Common Stocks - continued | |||
Shares | Value (000s) | ||
UTILITIES - continued | |||
Gas Utilities - 5.1% | |||
National Fuel Gas Co. | 321,585 | $ 16,169 | |
ONEOK, Inc. | 321,217 | 26,712 | |
| 42,881 | ||
Independent Power Producers & Energy Traders - 13.0% | |||
Calpine Corp. (a) | 1,999,320 | 29,190 | |
Constellation Energy Group, Inc. | 1,091,979 | 39,781 | |
GenOn Energy, Inc. (a) | 788,292 | 1,679 | |
The AES Corp. (a) | 3,034,700 | 38,723 | |
| 109,373 | ||
Multi-Utilities - 13.3% | |||
CenterPoint Energy, Inc. | 1,260,400 | 23,280 | |
Dominion Resources, Inc. | 573,509 | 28,698 | |
NiSource, Inc. | 500,000 | 11,365 | |
OGE Energy Corp. | 161,639 | 8,544 | |
PG&E Corp. | 194,508 | 7,909 | |
Sempra Energy | 552,119 | 31,416 | |
| 111,212 | ||
Water Utilities - 0.6% | |||
American Water Works Co., Inc. | 139,300 | 4,699 | |
TOTAL UTILITIES | 568,393 | ||
TOTAL INVESTMENT PORTFOLIO - 99.8% (Cost $790,910) | 837,232 | ||
NET OTHER ASSETS (LIABILITIES) - 0.2% | 1,514 | ||
NET ASSETS - 100% | $ 838,746 | ||
Legend |
(a) Non-income producing |
Affiliated Central Funds |
Information regarding fiscal year to date income earned by the Fund from investments in Fidelity Central Funds is as follows: |
Fund | Income earned |
Fidelity Cash Central Fund | $ 19 |
Fidelity Securities Lending Cash Central Fund | 6 |
Total | $ 25 |
Other Information |
All investments are categorized as Level 1 under the Fair Value Hierarchy. The inputs or methodology used for valuing securities may not be an indication of the risk associated with investing in those securities. For more information on valuation inputs, please refer to the Security Valuation section in the accompanying Notes to Financial Statements. |
See accompanying notes which are an integral part of the financial statements.
Annual Report
Financial Statements
Statement of Assets and Liabilities
Amounts in thousands (except per-share amount) | January 31, 2012 | |
|
|
|
Assets | ||
Investment in securities, at value - See accompanying schedule: Unaffiliated issuers (cost $790,910) |
| $ 837,232 |
Cash |
| 1 |
Receivable for investments sold | 33,972 | |
Receivable for fund shares sold | 509 | |
Dividends receivable | 1,573 | |
Distributions receivable from Fidelity Central Funds | 1 | |
Prepaid expenses | 2 | |
Other receivables | 186 | |
Total assets | 873,476 | |
|
|
|
Liabilities | ||
Payable for investments purchased | $ 15,678 | |
Payable for fund shares redeemed | 6,480 | |
Accrued management fee | 406 | |
Notes payable to affiliates | 6,637 | |
Notes payable | 5,275 | |
Other affiliated payables | 184 | |
Other payables and accrued expenses | 70 | |
Total liabilities | 34,730 | |
|
|
|
Net Assets | $ 838,746 | |
Net Assets consist of: |
| |
Paid in capital | $ 1,091,649 | |
Undistributed net investment income | 505 | |
Accumulated undistributed net realized gain (loss) on investments and foreign currency transactions | (299,730) | |
Net unrealized appreciation (depreciation) on investments | 46,322 | |
Net Assets, for 50,313 shares outstanding | $ 838,746 | |
Net Asset Value, offering price and redemption price per share ($838,746 ÷ 50,313 shares) | $ 16.67 | |
See accompanying notes which are an integral part of the financial statements.
Annual Report
Statement of Operations
Amounts in thousands | Year ended January 31, 2012 | |
|
|
|
Investment Income |
|
|
Dividends |
| $ 33,612 |
Income from Fidelity Central Funds |
| 25 |
Total income |
| 33,637 |
|
|
|
Expenses | ||
Management fee | $ 4,153 | |
Performance adjustment | 215 | |
Transfer agent fees | 1,968 | |
Accounting and security lending fees | 307 | |
Custodian fees and expenses | 9 | |
Independent trustees' compensation | 5 | |
Registration fees | 44 | |
Audit | 59 | |
Legal | 7 | |
Interest | 2 | |
Miscellaneous | 9 | |
Total expenses before reductions | 6,778 | |
Expense reductions | (348) | 6,430 |
Net investment income (loss) | 27,207 | |
Realized and Unrealized Gain (Loss) Net realized gain (loss) on: | ||
Investment securities: |
|
|
Unaffiliated issuers | 58,340 | |
Foreign currency transactions | (20) | |
Total net realized gain (loss) |
| 58,320 |
Change in net unrealized appreciation (depreciation) on: Investment securities | (33,302) | |
Assets and liabilities in foreign currencies | (2) | |
Total change in net unrealized appreciation (depreciation) |
| (33,304) |
Net gain (loss) | 25,016 | |
Net increase (decrease) in net assets resulting from operations | $ 52,223 | |
See accompanying notes which are an integral part of the financial statements.
Annual Report
Financial Statements - continued
Statement of Changes in Net Assets
Amounts in thousands | Year ended | Year ended |
Increase (Decrease) in Net Assets |
|
|
Operations |
|
|
Net investment income (loss) | $ 27,207 | $ 24,450 |
Net realized gain (loss) | 58,320 | 98,221 |
Change in net unrealized appreciation (depreciation) | (33,304) | 55,264 |
Net increase (decrease) in net assets resulting | 52,223 | 177,935 |
Distributions to shareholders from net investment income | (26,128) | (24,829) |
Share transactions | 209,153 | 190,398 |
Reinvestment of distributions | 23,972 | 22,622 |
Cost of shares redeemed | (298,611) | (193,259) |
Net increase (decrease) in net assets resulting from share transactions | (65,486) | 19,761 |
Total increase (decrease) in net assets | (39,391) | 172,867 |
|
|
|
Net Assets | ||
Beginning of period | 878,137 | 705,270 |
End of period (including undistributed net investment income of $505 and undistributed net investment income of $58, respectively) | $ 838,746 | $ 878,137 |
Other Information Shares | ||
Sold | 12,409 | 13,014 |
Issued in reinvestment of distributions | 1,430 | 1,520 |
Redeemed | (17,968) | (13,012) |
Net increase (decrease) | (4,129) | 1,522 |
See accompanying notes which are an integral part of the financial statements.
Annual Report
Financial Highlights
Years ended January 31, | 2012 | 2011 | 2010 | 2009 | 2008 |
Selected Per-Share Data |
|
|
|
|
|
Net asset value, beginning of period | $ 16.13 | $ 13.33 | $ 12.43 | $ 19.00 | $ 19.29 |
Income from Investment Operations |
|
|
|
|
|
Net investment income (loss) B | .50 | .46 | .39 | .44 | .32 |
Net realized and unrealized gain (loss) | .52 | 2.80 | .95 | (6.58) | (.24) |
Total from investment operations | 1.02 | 3.26 | 1.34 | (6.14) | .08 |
Distributions from net investment income | (.48) | (.46) | (.44) | (.43) | (.37) |
Net asset value, end of period | $ 16.67 | $ 16.13 | $ 13.33 | $ 12.43 | $ 19.00 |
Total Return A | 6.35% | 24.79% | 11.05% | (32.68)% | .24% |
Ratios to Average Net Assets C,E |
|
|
|
|
|
Expenses before reductions | .75% | .66% | .58% | .77% | .82% |
Expenses net of fee waivers, if any | .75% | .66% | .58% | .77% | .82% |
Expenses net of all reductions | .71% | .60% | .56% | .77% | .82% |
Net investment income (loss) | 3.00% | 3.10% | 3.06% | 2.72% | 1.56% |
Supplemental Data |
|
|
|
|
|
Net assets, end of period | $ 839 | $ 878 | $ 705 | $ 743 | $ 1,233 |
Portfolio turnover rate D | 160% | 228% | 224% | 110% | 56% |
A Total returns would have been lower if certain expenses had not been reduced during the applicable periods shown.
B Calculated based on average shares outstanding during the period.
C Fees and expenses of any underlying Fidelity Central Funds are not included in the Fund's expense ratio. The Fund indirectly bears its proportionate share of the expenses of any underlying Fidelity Central Funds.
D Amount does not include the portfolio activity of any underlying Fidelity Central Funds.
E Expense ratios reflect operating expenses of the Fund. Expenses before reductions do not reflect amounts reimbursed by the investment adviser or reductions from brokerage service arrangements or reductions from other expense offset arrangements and do not represent the amount paid by the Fund during periods when reimbursements or reductions occur. Expenses net of fee waivers reflect expenses after reimbursement by the investment adviser but prior to reductions from brokerage service arrangements or other expense offset arrangements. Expenses net of all reductions represent the net expenses paid by the Fund.
See accompanying notes which are an integral part of the financial statements.
Annual Report
Notes to Financial Statements
For the period ended January 31, 2012
(Amounts in thousands except percentages)
1. Organization.
Fidelity Telecom and Utilities Fund (the Fund) is a non-diversified fund of Fidelity Devonshire Trust (the Trust) and is authorized to issue an unlimited number of shares. The Trust is registered under the Investment Company Act of 1940, as amended (the 1940 Act), as an open-end management investment company organized as a Massachusetts business trust.
2. Investments in Fidelity Central Funds.
The Fund may invest in Fidelity Central Funds, which are open-end investment companies available only to other investment companies and accounts managed by Fidelity Management & Research Company (FMR) and its affiliates. The Fund's Schedule of Investments lists each of the Fidelity Central Funds held as of period end, if any, as an investment of the Fund, but does not include the underlying holdings of each Fidelity Central Fund. As an Investing Fund, the Fund indirectly bears its proportionate share of the expenses of the underlying Fidelity Central Funds.
The Money Market Central Funds seek preservation of capital and current income and are managed by Fidelity Investments Money Management, Inc. (FIMM), an affiliate of FMR.
A complete unaudited list of holdings for each Fidelity Central Fund is available upon request or at the Securities and Exchange Commission (the SEC) web site at www.sec.gov. In addition, the financial statements of the Fidelity Central Funds, which are not covered by the Fund's Report of Independent Registered Public Accounting Firm, are available on the SEC web site or upon request.
3. Significant Accounting Policies.
The financial statements have been prepared in conformity with accounting principles generally accepted in the United States of America (GAAP), which require management to make certain estimates and assumptions at the date of the financial statements. Actual results could differ from those estimates. Subsequent events, if any, through the date that the financial statements were issued have been evaluated in the preparation of the financial statements. The following summarizes the significant accounting policies of the Fund:
Security Valuation. Investments are valued as of 4:00 p.m. Eastern time on the last calendar day of the period. The Fund uses independent pricing services approved by the Board of Trustees to value its investments. When current market prices or quotations are not readily available or reliable, valuations may be determined in good faith in accordance with procedures adopted by the Board of Trustees. Factors used in determining value may include market or security specific events. The frequency with which these
Annual Report
Notes to Financial Statements - continued
(Amounts in thousands except percentages)
3. Significant Accounting Policies - continued
Security Valuation - continued
procedures are used cannot be predicted and they may be utilized to a significant extent. The value used for net asset value (NAV) calculation under these procedures may differ from published prices for the same securities.
The Fund categorizes the inputs to valuation techniques used to value its investments into a disclosure hierarchy consisting of three levels as shown below:
Level 1 - quoted prices in active markets for identical investments
Level 2 - other significant observable inputs (including quoted prices for similar investments, interest rates, prepayment speeds, etc.)
Level 3 - unobservable inputs (including the Fund's own assumptions based on the best information available)
Changes in valuation techniques may result in transfers in or out of an assigned level within the disclosure hierarchy. Valuation techniques used to value the Fund's investments by major category are as follows:
Equity securities, including restricted securities, for which market quotations are readily available, are valued at the last reported sale price or official closing price as reported by an independent pricing service on the primary market or exchange on which they are traded and are categorized as Level 1 in the hierarchy. In the event there were no sales during the day or closing prices are not available, securities are valued at the last quoted bid price or may be valued using the last available price and are generally categorized as Level 2 in the hierarchy. For foreign equity securities, when significant market or security specific events arise, comparisons to the valuation of American Depositary Receipts (ADRs), futures contracts, Exchange-traded funds (ETFs) and certain indexes as well as quoted prices for similar securities are used and are categorized as Level 2 in the hierarchy in these circumstances. Utilizing these techniques may result in transfers between Level 1 and Level 2. For restricted equity securities and private placements where observable inputs are limited, assumptions about market activity and risk are used and are categorized as Level 3 in the hierarchy.
New Accounting Pronouncements. In May 2011, the Financial Accounting Standards Board issued Accounting Standard Update No. 2011-04, Fair Value Measurement (Topic 820) - Amendments to Achieve Common Fair Value Measurement and Disclosure Requirements in U.S. GAAP and IFRSs. The update is effective during interim and annual periods beginning after December 15, 2011 and will result in additional disclosure for transfers between levels as well as expanded disclosure for securities categorized as Level 3 under the fair value hierarchy.
Annual Report
3. Significant Accounting Policies - continued
New Accounting Pronouncements - continued
In December 2011, the Financial Accounting Standards Board issued Accounting Standard Update No. 2011-11, Disclosures about Offsetting Assets and Liabilities. The update creates new disclosure requirements requiring entities to disclose both gross and net information for derivatives and other financial instruments that are either offset in the Statement of Assets and Liabilities or subject to an enforceable master netting arrangement or similar agreement. The disclosure requirements are effective for interim and annual reporting periods beginning on or after January 1, 2013. Management is currently evaluating the impact of the update's adoption on the Fund's financial statement disclosures.
Foreign Currency. The Fund may use foreign currency contracts to facilitate transactions in foreign-denominated securities. Gains and losses from these transactions may arise from changes in the value of the foreign currency or if the counterparties do not perform under the contracts' terms.
Foreign-denominated assets, including investment securities, and liabilities are translated into U.S. dollars at the exchange rate at period end. Purchases and sales of investment securities, income and dividends received and expenses denominated in foreign currencies are translated into U.S. dollars at the exchange rate in effect on the transaction date.
The effects of exchange rate fluctuations on investments are included with the net realized and unrealized gain (loss) on investment securities. Other foreign currency transactions resulting in realized and unrealized gain (loss) are disclosed separately.
Investment Transactions and Income. For financial reporting purposes, the Fund's investment holdings and NAV include trades executed through the end of the last business day of the period. The NAV per share for processing shareholder transactions is calculated as of the close of business of the New York Stock Exchange (NYSE), normally 4:00 p.m. Eastern time and includes trades executed through the end of the prior business day. Gains and losses on securities sold are determined on the basis of identified cost and may include proceeds received from litigation. Dividend income is recorded on the ex-dividend date, except for certain dividends from foreign securities where the ex-dividend date may have passed, which are recorded as soon as the Fund is informed of the ex-dividend date. Non-cash dividends included in dividend income, if any, are recorded at the fair market value of the securities received. Distributions received on securities that represent a return of capital or capital gain are recorded as a reduction of cost of investments and/or as a realized gain. The Fund estimates the components of distributions received that may be considered return of capital distributions or capital gain distributions. Interest income and distributions from the Fidelity Central Funds are accrued as earned. Interest income includes coupon interest and amortization of premium and accretion of discount on debt securities. Investment income is recorded net of foreign taxes withheld where recovery of such taxes is uncertain.
Annual Report
Notes to Financial Statements - continued
(Amounts in thousands except percentages)
3. Significant Accounting Policies - continued
Expenses. Expenses directly attributable to a fund are charged to that fund. Expenses attributable to more than one fund are allocated among the respective funds on the basis of relative net assets or other appropriate methods. Expense estimates are accrued in the period to which they relate and adjustments are made when actual amounts are known.
Deferred Trustee Compensation. Under a Deferred Compensation Plan (the Plan), independent Trustees may elect to defer receipt of a portion of their annual compensation. Deferred amounts are invested in a cross-section of Fidelity funds, are marked-to-market and remain in the Fund until distributed in accordance with the Plan. The investment of deferred amounts and the offsetting payable to the Trustees are included in the accompanying Statement of Assets and Liabilities.
Income Tax Information and Distributions to Shareholders. Each year, the Fund intends to qualify as a regulated investment company, including distributing substantially all of its taxable income and realized gains under Subchapter M of the Internal Revenue Code. As a result, no provision for income taxes is required. As of January 31, 2012, the Fund did not have any unrecognized tax benefits in the financial statements; nor is the Fund aware of any tax positions for which it is reasonably possible that the total amounts of unrecognized tax benefits will significantly change in the next twelve months. The Fund files a U.S. federal tax return, in addition to state and local tax returns as required. A fund's tax returns are subject to examination by the Internal Revenue Service (IRS) for a period of three fiscal years. State and local tax returns may be subject to examination for an additional fiscal year depending on the jurisdiction. Foreign taxes are provided for based on the Fund's understanding of the tax rules and rates that exist in the foreign markets in which it invests.
Distributions are declared and recorded on the ex-dividend date. Income and capital gain distributions are determined in accordance with income tax regulations, which may differ from GAAP.
Capital accounts within the financial statements are adjusted for permanent book-tax differences. These adjustments have no impact on net assets or the results of operations. Temporary book-tax differences will reverse in a subsequent period.
Book-tax differences are primarily due to foreign currency transactions, deferred trustees compensation, capital loss carryforwards and losses deferred due to wash sales and excise tax regulations.
Annual Report
3. Significant Accounting Policies - continued
Income Tax Information and Distributions to Shareholders - continued
The federal tax cost of investment securities and unrealized appreciation (depreciation) as of period end were as follows:
Gross unrealized appreciation | $ 60,971 |
Gross unrealized depreciation | (17,380) |
Net unrealized appreciation (depreciation) on securities and other investments | $ 43,591 |
|
|
Tax Cost | $ 793,641 |
The tax-based components of distributable earnings as of period end were as follows:
Undistributed ordinary income | $ 528 |
Capital loss carryforward | $ (287,068) |
Net unrealized appreciation (depreciation) | $ 43,591 |
Capital loss carryforwards are only available to offset future capital gains of the Fund to the extent provided by regulations and may be limited. Under the Regulated Investment Company Modernization Act of 2010 (the Act), the Fund is permitted to carry forward capital losses incurred in taxable years beginning after December 22, 2010 for an unlimited period and such capital losses are required to be used prior to any losses that expire. Capital loss carryforwards were as follows:
Fiscal year of expiration |
|
2017 | $ (77,238) |
2018 | (209,830) |
Total capital loss carryforward | $ (287,068) |
The Fund intends to elect to defer to its fiscal year ending January 31, 2013 approximately $9,931 of losses recognized during the period November 1, 2011 to January 31, 2012.
The tax character of distributions paid was as follows:
| January 31, 2012 | January 31, 2011 |
Ordinary Income | $ 26,128 | $ 24,829 |
4. Purchases and Sales of Investments.
Purchases and sales of securities, other than short-term securities, aggregated $1,420,635 and $1,462,032, respectively.
Annual Report
Notes to Financial Statements - continued
(Amounts in thousands except percentages)
5. Fees and Other Transactions with Affiliates.
Management Fee. FMR and its affiliates provide the Fund with investment management related services for which the Fund pays a monthly management fee. The management fee is the sum of an individual fund fee rate that is based on an annual rate of .20% of the Fund's average net assets and an annualized group fee rate that averaged .26% during the period. The group fee rate is based upon the average net assets of all the mutual funds advised by FMR. The group fee rate decreases as assets under management increase and increases as assets under management decrease. In addition, the management fee is subject to a performance adjustment (up to a maximum of ± .15% of the Fund's average net assets over a 36 month performance period). The upward or downward adjustment to the management fee is based on the Fund's relative investment performance as compared to an appropriate benchmark index. For the period, the total annual management fee rate, including the performance adjustment, was .48% of the Fund's average net assets.
Transfer Agent Fees. Fidelity Investments Institutional Operations Company, Inc. (FIIOC), an affiliate of FMR, is the Fund's transfer, dividend disbursing and shareholder servicing agent. FIIOC receives account fees and asset-based fees that vary according to account size and type of account. FIIOC pays for typesetting, printing and mailing of shareholder reports, except proxy statements. For the period, the transfer agent fees were equivalent to an annual rate of .22% of average net assets.
Accounting and Security Lending Fees. Fidelity Service Company, Inc. (FSC), an affiliate of FMR, maintains the Fund's accounting records. The accounting fee is based on the level of average net assets for each month. Under a separate contract, FSC administers the security lending program. The security lending fee is based on the number and duration of lending transactions.
Brokerage Commissions. The Fund placed a portion of its portfolio transactions with brokerage firms which are affiliates of the investment adviser. The commissions paid to these affiliated firms were $49 for the period.
Interfund Lending Program. Pursuant to an Exemptive Order issued by the SEC, the Fund, along with other registered investment companies having management contracts with FMR, may participate in an interfund lending program. This program provides an alternative credit facility allowing the funds to borrow from, or lend money to, other participating affiliated funds. Any open loans, including accrued interest, at period end are presented under the caption "Notes payable to affiliates" in the Fund's Statement of Assets and Liabilities. The Fund's activity in this program during the period for which loans were outstanding was as follows:
Borrower or Lender | Average Loan | Weighted Average Interest Rate | Interest |
Borrower | $ 5,142 | .34% | $ 2 |
Annual Report
6. Committed Line of Credit.
The Fund participates with other funds managed by FMR or an affiliate in a $4.0 billion credit facility (the "line of credit") to be utilized for temporary or emergency purposes to fund shareholder redemptions or for other short-term liquidity purposes. The Fund has agreed to pay commitment fees on its pro-rata portion of the line of credit, which amounted to $3 and is reflected in Miscellaneous expenses on the Statement of Operations. During the period, there were no borrowings on this line of credit.
7. Security Lending.
The Fund lends portfolio securities through a lending agent from time to time in order to earn additional income. For equity securities, a lending agent is used and may loan securities to certain qualified borrowers, including Fidelity Capital Markets (FCM), a broker-dealer affiliated with the Fund. On the settlement date of the loan, the Fund receives collateral (in the form of U.S. Treasury obligations, letters of credit and/or cash) against the loaned securities and maintains collateral in an amount not less than 100% of the market value of the loaned securities during the period of the loan. The market value of the loaned securities is determined at the close of business of the Fund and any additional required collateral is delivered to the Fund on the next business day. If the borrower defaults on its obligation to return the securities loaned because of insolvency or other reasons, a fund could experience delays and costs in recovering the securities loaned or in gaining access to the collateral. Any cash collateral received is invested in the Fidelity Securities Lending Cash Central Fund. At period end, there were no security loans outstanding. Security lending income represents the income earned on investing cash collateral, less rebates paid to borrowers and any lending agent fees associated with the loan, plus any premium payments received for lending certain types of securities. Security lending income is presented in the Statement of Operations as a component of income from Fidelity Central Funds. Total security lending income during the period amounted to $6. During the period, there were no securities loaned to FCM.
8. Bank Borrowings.
The Fund is permitted to have bank borrowings for temporary or emergency purposes to fund shareholder redemptions or for other short-term liquidity requirements. The Fund has established borrowing arrangements with certain banks. The interest rate on the borrowings is the bank's base rate, as revised from time to time. The average loan balance during the period for which loans were outstanding amounted to $7,249. The weighted average interest rate was .57%. The interest expense amounted to two hundred thirty dollars under the bank borrowing program.
Annual Report
Notes to Financial Statements - continued
(Amounts in thousands except percentages)
9. Expense Reductions.
Many of the brokers with whom FMR places trades on behalf of the Fund provided services to the Fund in addition to trade execution. These services included payments of certain expenses on behalf of the Fund totaling $348 for the period.
10. Other.
The Fund's organizational documents provide former and current trustees and officers with a limited indemnification against liabilities arising in connection with the performance of their duties to the Fund. In the normal course of business, the Fund may also enter into contracts that provide general indemnifications. The Fund's maximum exposure under these arrangements is unknown as this would be dependent on future claims that may be made against the Fund. The risk of material loss from such claims is considered remote.
Annual Report
Report of Independent Registered Public Accounting Firm
To the Trustees of Fidelity Devonshire Trust and the Shareholders of Fidelity Telecom and Utilities Fund:
In our opinion, the accompanying statement of assets and liabilities, including the schedule of investments, and the related statements of operations and of changes in net assets and the financial highlights present fairly, in all material respects, the financial position of Fidelity Telecom and Utilities Fund (a fund of Fidelity Devonshire Trust) at January 31, 2012, the results of its operations for the year then ended, the changes in its net assets for each of the two years in the period then ended and the financial highlights for each of the five years in the period then ended, in conformity with accounting principles generally accepted in the United States of America. These financial statements and financial highlights (hereafter referred to as "financial statements") are the responsibility of the Fidelity Telecom and Utilities Fund's management. Our responsibility is to express an opinion on these financial statements based on our audits. We conducted our audits of these financial statements in accordance with the standards of the Public Company Accounting Oversight Board (United States). Those standards require that we plan and perform the audit to obtain reasonable assurance about whether the financial statements are free of material misstatement. An audit includes examining, on a test basis, evidence supporting the amounts and disclosures in the financial statements, assessing the accounting principles used and significant estimates made by management, and evaluating the overall financial statement presentation. We believe that our audits, which included confirmation of securities at January 31, 2012 by correspondence with the custodian and brokers, provide a reasonable basis for our opinion.
/s/ PricewaterhouseCoopers LLP
PricewaterhouseCoopers LLP
Boston, Massachusetts
March 13, 2012
Annual Report
Trustees and Officers
The Trustees, Members of the Advisory Board, and executive officers of the trust and fund, as applicable, are listed below. The Board of Trustees governs the fund and is responsible for protecting the interests of shareholders. The Trustees are experienced executives who meet periodically throughout the year to oversee the fund's activities, review contractual arrangements with companies that provide services to the fund, oversee management of the risks associated with such activities and contractual arrangements, and review the fund's performance. Except for James C. Curvey, each of the Trustees oversees 226 funds advised by FMR or an affiliate. Mr. Curvey oversees 430 funds advised by FMR or an affiliate.
The Trustees hold office without limit in time except that (a) any Trustee may resign; (b) any Trustee may be removed by written instrument, signed by at least two-thirds of the number of Trustees prior to such removal; (c) any Trustee who requests to be retired or who has become incapacitated by illness or injury may be retired by written instrument signed by a majority of the other Trustees; and (d) any Trustee may be removed at any special meeting of shareholders by a two-thirds vote of the outstanding voting securities of the trust. Each Trustee who is not an interested person (as defined in the 1940 Act) (Independent Trustee), shall retire not later than the last day of the calendar year in which his or her 75th birthday occurs. The Independent Trustees may waive this mandatory retirement age policy with respect to individual Trustees. The executive officers and Advisory Board Members hold office without limit in time, except that any officer and Advisory Board Member may resign or may be removed by a vote of a majority of the Trustees at any regular meeting or any special meeting of the Trustees. Except as indicated, each individual has held the office shown or other offices in the same company for the past five years.
Experience, Skills, Attributes, and Qualifications of the Fund's Trustees. The Governance and Nominating Committee has adopted a statement of policy that describes the experience, qualifications, attributes, and skills that are necessary and desirable for potential Independent Trustee candidates (Statement of Policy). The Board believes that each Trustee satisfied at the time he or she was initially elected or appointed a Trustee, and continues to satisfy, the standards contemplated by the Statement of Policy. The Governance and Nominating Committee also engages professional search firms to help identify potential Independent Trustee candidates who have the experience, qualifications, attributes, and skills consistent with the Statement of Policy. From time to time, additional criteria based on the composition and skills of the current Independent Trustees, as well as experience or skills that may be appropriate in light of future changes to board composition, business conditions, and regulatory or other developments, have also been considered by the professional search firms and the Governance and Nominating Committee. In addition, the Board takes into account the Trustees' commitment and participation in Board and committee meetings, as well as their leadership of standing and ad hoc committees throughout their tenure.
In determining that a particular Trustee was and continues to be qualified to serve as a Trustee, the Board has considered a variety of criteria, none of which, in isolation, was controlling. The Board believes that, collectively, the Trustees have balanced and diverse experience, qualifications, attributes, and skills, which allow the Board to operate effectively in governing the fund and protecting the interests of shareholders. Information about the specific experience, skills, attributes, and qualifications of each Trustee, which in each case led to the Board's conclusion that the Trustee should serve (or continue to serve) as a trustee of the fund, is provided below.
Annual Report
Board Structure and Oversight Function. James C. Curvey is an interested person (as defined in the 1940 Act) and currently serves as Acting Chairman. The Trustees have determined that an interested Chairman is appropriate and benefits shareholders because an interested Chairman has a personal and professional stake in the quality and continuity of services provided to the fund. Independent Trustees exercise their informed business judgment to appoint an individual of their choosing to serve as Chairman, regardless of whether the Trustee happens to be independent or a member of management. The Independent Trustees have determined that they can act independently and effectively without having an Independent Trustee serve as Chairman and that a key structural component for assuring that they are in a position to do so is for the Independent Trustees to constitute a substantial majority for the Board. The Independent Trustees also regularly meet in executive session. Ned C. Lautenbach serves as Chairman of the Independent Trustees and as such (i) acts as a liaison between the Independent Trustees and management with respect to matters important to the Independent Trustees and (ii) with management prepares agendas for Board meetings.
Fidelity funds are overseen by different Boards of Trustees. The fund's Board oversees Fidelity's equity and high income funds and another Board oversees Fidelity's investment-grade bond, money market, and asset allocation funds. The asset allocation funds may invest in Fidelity funds overseen by the fund's Board. The use of separate Boards, each with its own committee structure, allows the Trustees of each group of Fidelity funds to focus on the unique issues of the funds they oversee, including common research, investment, and operational issues. On occasion, the separate Boards establish joint committees to address issues of overlapping consequences for the Fidelity funds overseen by each Board.
The Trustees operate using a system of committees to facilitate the timely and efficient consideration of all matters of importance to the Trustees, the fund, and fund shareholders and to facilitate compliance with legal and regulatory requirements and oversight of the fund's activities and associated risks. The Board, acting through its committees, has charged FMR and its affiliates with (i) identifying events or circumstances the occurrence of which could have demonstrably adverse effects on the fund's business and/or reputation; (ii) implementing processes and controls to lessen the possibility that such events or circumstances occur or to mitigate the effects of such events or circumstances if they do occur; and (iii) creating and maintaining a system designed to evaluate continuously business and market conditions in order to facilitate the identification and implementation processes described in (i) and (ii) above. Because the day-to-day operations and activities of the fund are carried out by or through FMR, its affiliates and other service providers, the fund's exposure to risks is mitigated but not eliminated by the processes overseen by the Trustees. While each of the Board's committees has responsibility for overseeing different aspects of the fund's activities, oversight is exercised primarily through the Operations, Audit, and Compliance Committees. In addition, the Independent Trustees have worked with FMR to enhance the Board's oversight of investment and financial risks, legal and regulatory risks, technology risks, and operational risks, including the development of additional risk reporting to the Board. For example, a working group comprised of Independent Trustees and FMR has worked and continues to work to review the Fidelity funds' valuation-related activities, reporting and risk management. Appropriate personnel, including but not limited to the fund's Chief Compliance Officer (CCO), FMR's internal auditor, the independent accountants, the fund's Treasurer and portfolio management personnel, make periodic reports to the Board's committees, as appropriate, including an annual review of FMR's risk management program for the Fidelity funds. The responsibilities of each standing committee, including their oversight responsibilities, are described further under "Standing Committees of the Fund's Trustees."
Annual Report
Trustees and Officers - continued
The fund's Statement of Additional Information (SAI) includes more information about the Trustees. To request a free copy, call Fidelity at 1-800-544-8544.
Interested Trustees*:
Correspondence intended for each Trustee who is an interested person may be sent to Fidelity Investments, 82 Devonshire Street, Boston, Massachusetts 02109.
Name, Age; Principal Occupations and Other Relevant Experience+ | |
James C. Curvey (76) | |
| Year of Election or Appointment: 2007 Mr. Curvey is Trustee and Acting Chairman of the Board of Trustees of certain Trusts. Mr. Curvey also serves as Trustee (2007-present) of other investment companies advised by FMR. Mr. Curvey is a Director of Fidelity Investments Money Management, Inc. (2009-present), Director of Fidelity Research & Analysis Co. (2009-present) and Director of FMR and FMR Co., Inc. (2007-present). Mr. Curvey is also Vice Chairman (2007-present) and Director of FMR LLC. In addition, Mr. Curvey serves as an Overseer for the Boston Symphony Orchestra and a member of the Trustees of Villanova University. Previously, Mr. Curvey was the Vice Chairman (2006-2007) and Director (2000-2007) of FMR Corp. |
Ronald P. O'Hanley (54) | |
| Year of Election or Appointment: 2011 Mr. O'Hanley is Director of FMR Co., Inc. (2010-present), Director of Fidelity Investments Money Management, Inc. (2010-present), Director of Fidelity Research & Analysis Company (2010-present), President of Fidelity Asset Management and Corporate Services and a member of Fidelity's Executive Committee (2010-present). Previously, Mr. O'Hanley served as President and Chief Executive Officer of BNY Mellon Asset Management (2007-2010). Mr. O'Hanley also served as Vice Chairman of Bank New York Mellon Corp. and a member of that firm's Executive Committee. Prior to the 2007 merger of The Bank of New York and Mellon Financial Corporation, he was Vice Chairman of Mellon Financial Corporation and President and Chief Executive Officer of Mellon Asset Management. He joined Mellon in February 1997. Mr. O'Hanley currently serves as Chairman of the Boston Public Library Foundation Board of Directors and sits on the Board of Directors of Beth Israel Deaconess Medical Center, the Board of Trustees of the Marine Biological Laboratory and the Advisory Board of the Maxwell School of Citizenship and Public Administration at Syracuse University. Mr. O'Hanley also chairs the Council on Asset Management for the Financial Services Roundtable and is a member of the Board of Directors of Institutional Investor's U.S. Institute. |
* Trustees have been determined to be "Interested Trustees" by virtue of, among other things, their affiliation with the trust or various entities under common control with FMR.
+ The information above includes each Trustee's principal occupation during the last five years and other information relating to the experience, attributes, and skills relevant to each Trustee's qualifications to serve as a Trustee, which led to the conclusion that each Trustee should serve as a Trustee for the fund.
Annual Report
Trustees and Officers - continued
Independent Trustees:
Correspondence intended for each Independent Trustee (that is, the Trustees other than the Interested Trustees) may be sent to Fidelity Investments, P.O. Box 55235, Boston, Massachusetts 02205-5235.
Name, Age; Principal Occupations and Other Relevant Experience+ | |
Dennis J. Dirks (63) | |
| Year of Election or Appointment: 2005 Prior to his retirement in May 2003, Mr. Dirks was Chief Operating Officer and a member of the Board of The Depository Trust & Clearing Corporation (DTCC). He also served as President, Chief Operating Officer, and Board member of The Depository Trust Company (DTC) and President and Board member of the National Securities Clearing Corporation (NSCC). In addition, Mr. Dirks served as Chief Executive Officer and Board member of the Government Securities Clearing Corporation, Chief Executive Officer and Board member of the Mortgage-Backed Securities Clearing Corporation, as a Trustee and a member of the Finance Committee of Manhattan College (2005-2008), and as a Trustee and a member of the Finance Committee of AHRC of Nassau County (2006-2008). Mr. Dirks is a member of the Independent Directors Council (IDC) Governing Council (2010-present) and Board of Directors for The Brookville Center for Children's Services, Inc. (2009-present). |
Alan J. Lacy (58) | |
| Year of Election or Appointment: 2008 Mr. Lacy serves as Senior Adviser (2007-present) of Oak Hill Capital Partners, L.P. (private equity). Mr. Lacy also served as Chief Executive Officer (2000-2005) and Vice Chairman (2005-2006) of Sears Holdings Corporation and Sears, Roebuck and Co. (retail). In addition, Mr. Lacy serves as a member of the Board of Directors of Dave & Buster's, Inc. (restaurant and entertainment complexes, 2010-present), The Hillman Companies, Inc. (hardware wholesalers, 2010-present), and Bristol-Myers Squibb Company (global pharmaceuticals, 2007-present). Mr. Lacy is a member of the Board of Trustees of The National Parks Conservation Association (2006-present). Previously, Mr. Lacy served as Chairman of the Board of Trustees of the National Parks Conservation Association (2008-2011) and as a member of the Board of Directors for the Western Union Company (global money transfer, 2006-2011). |
Ned C. Lautenbach (67) | |
| Year of Election or Appointment: 2000 Mr. Lautenbach is Chairman of the Independent Trustees of the Equity and High Income Funds (2006-present). Mr. Lautenbach currently serves as the Lead Director of the Eaton Corporation Board of Directors (diversified industrial, 1997-present). Mr. Lautenbach is also a member of the Board of Directors of the Philharmonic Center for the Arts in Naples, Florida (1999-present); a member of the Board of Trustees of Fairfield University (2005-present); and a member of the Council on Foreign Relations (1994-present). Previously, Mr. Lautenbach was a Partner/Advisory Partner at Clayton, Dubilier & Rice, LLC (private equity investment, 1998-2010), as well as a Director of Sony Corporation (2006-2007). |
Joseph Mauriello (67) | |
| Year of Election or Appointment: 2008 Prior to his retirement in January 2006, Mr. Mauriello served in numerous senior management positions including Deputy Chairman and Chief Operating Officer (2004-2005), and Vice Chairman of Financial Services (2002-2004) of KPMG LLP US (professional services, 1965-2005). Mr. Mauriello currently serves as a member of the Board of Directors of XL Group plc. (global insurance and re-insurance, 2006-present) and of Arcadia Resources Inc. (health care services and products, 2007-present). Previously, Mr. Mauriello served as a Director of the Hamilton Funds of the Bank of New York (2006-2007). |
Robert W. Selander (61) | |
| Year of Election or Appointment: 2011 Previously, Mr. Selander served as a Member of the Advisory Board of Fidelity's Equity and High Income Funds (2011), Executive Vice Chairman (2010), Chief Executive Officer (2009-2010), and President and Chief Executive Officer (1997-2009) of Mastercard, Inc. |
Cornelia M. Small (67) | |
| Year of Election or Appointment: 2005 Ms. Small is a member of the Board of Directors of the Teagle Foundation (2009-present). Ms. Small is also a member of the Investment Committee, and Chair (2008-present) and a member of the Board of Trustees of Smith College. In addition, Ms. Small serves on the Investment Committee of the Berkshire Taconic Community Foundation (2008-present). Previously, Ms. Small served as Chairperson of the Investment Committee (2002-2008) of Smith College. In addition, Ms. Small served as Chief Investment Officer, Director of Global Equity Investments, and a member of the Board of Directors of Scudder, Stevens & Clark and Scudder Kemper Investments. |
William S. Stavropoulos (72) | |
| Year of Election or Appointment: 2002 Mr. Stavropoulos is Vice Chairman of the Independent Trustees of the Equity and High Income Funds (2006-present). Mr. Stavropoulos serves as President and Founder of the Michigan Baseball Foundation, the Great Lakes Loons (2007-present). Mr. Stavropoulos is Chairman Emeritus of the Board of Directors of The Dow Chemical Company, where he previously served in numerous senior management positions, including President, CEO (1995-2000; 2002-2004), Chairman of the Executive Committee (2000-2006), and as a member of the Board of Directors (1990-2006). Currently, Mr. Stavropoulos is Chairman of Univar (global distributor of commodity and specialty chemicals, 2010-present), a Director of Teradata Corporation (data warehousing and technology solutions, 2008-present), Chemical Financial Corporation, Maersk Inc. (industrial conglomerate), Tyco International, Inc. (multinational manufacturing and services, 2007-present), and a member of the Advisory Board for Metalmark Capital (private equity investment, 2005-present). Mr. Stavropoulos is a special advisor to Clayton, Dubilier & Rice, LLC (private equity investment). In addition, Mr. Stavropoulos is a member of the University of Notre Dame Advisory Council for the College of Science. |
David M. Thomas (62) | |
| Year of Election or Appointment: 2008 Previously, Mr. Thomas served as Executive Chairman (2005-2006) and Chairman and Chief Executive Officer (2000-2005) of IMS Health, Inc. (pharmaceutical and healthcare information solutions). In addition, Mr. Thomas serves as a member of the Board of Directors of Fortune Brands, Inc. (consumer products), and Interpublic Group of Companies, Inc. (marketing communication, 2004-present). |
Michael E. Wiley (61) | |
| Year of Election or Appointment: 2008 Mr. Wiley also serves as a Director of Asia Pacific Exploration Consolidated (international oil and gas exploration and production, 2008-present). Mr. Wiley serves as a Director of Tesoro Corporation (independent oil refiner and marketer, 2005-present), and a Director of Bill Barrett Corporation (exploration and production, 2005-present). In addition, Mr. Wiley also serves as a Director of Post Oak Bank (privately-held bank, 2004-present). Previously, Mr. Wiley served as a member of the Board of Trustees of the University of Tulsa (2000-2006; 2007-2010), as a Senior Energy Advisor of Katzenbach Partners, LLC (consulting, 2006-2007), as an Advisory Director of Riverstone Holdings (private investment), Chairman, President, and CEO of Baker Hughes, Inc. (oilfield services, 2000-2004), and as Director of Spinnaker Exploration Company (exploration and production, 2001-2005). |
Annual Report
+ The information above includes each Trustee's principal occupation during the last five years and other information relating to the experience, attributes, and skills relevant to each Trustee's qualifications to serve as a Trustee, which led to the conclusion that each Trustee should serve as a Trustee for the fund.
Advisory Board Members and Executive Officers:
Correspondence intended for each executive officer, Edward C. Johnson 3d, and Peter S. Lynch may be sent to Fidelity Investments, 82 Devonshire Street, Boston, Massachusetts 02109.
Name, Age; Principal Occupation | |
Edward C. Johnson 3d (81) | |
| Year of Election or Appointment: 2011 Member of the Advisory Board of Fidelity's Equity and High Income Funds. Mr. Johnson serves as Chief Executive Officer, Chairman, and a Director of FMR LLC, and also serves as Chairman and Director of FIL Limited. Previously, Mr. Johnson served as a Trustee and Chairman of the Board of certain Fidelity Trusts, Chairman and a Director of FMR, Chairman and a Director of FMR Co., Inc., and President of FMR LLC (2006-2007). |
Peter S. Lynch (68) | |
| Year of Election or Appointment: 2003 Member of the Advisory Board of Fidelity's Equity and High Income Funds. Mr. Lynch is Vice Chairman and a Director of FMR and FMR Co., Inc. In addition, Mr. Lynch serves as a Trustee of Boston College and as the Chairman of the Inner-City Scholarship Fund. Previously, Mr. Lynch served on the Special Olympics International Board of Directors (1997-2006). |
Kenneth B. Robins (42) | |
| Year of Election or Appointment: 2008 President and Treasurer of Fidelity's Equity and High Income Funds. Mr. Robins also serves as President and Treasurer (2010-present) and Assistant Treasurer (2009-present) of other Fidelity funds and is an employee of Fidelity Investments (2004-present). Previously, Mr. Robins served as Deputy Treasurer of the Fidelity funds (2005-2008) and Treasurer and Chief Financial Officer of The North Carolina Capital Management Trust: Cash and Term Portfolios (2006-2008). |
Brian B. Hogan (47) | |
| Year of Election or Appointment: 2009 Vice President of Equity and High Income Funds. Mr. Hogan also serves as President of FMR's Equity Division (2009-present). Previously, Mr. Hogan served as Senior Vice President, Equity Research of FMR (2006-2009) and as a portfolio manager. |
Christopher S. Bartel (40) | |
| Year of Election or Appointment: 2009 Vice President of Fidelity's Sector and Real Estate Equity Funds. Mr. Bartel also serves as a Director of Fidelity Management & Research (Japan) Inc. (2012-present), Director of Fidelity Management & Research (Hong Kong) Limited (2012-present), and Senior Vice President of Global Equity Research (2010-present). Previously, Mr. Bartel served as Senior Vice President of Equity Research (2009-2010), Managing Director of Research (2006-2009), and an analyst and portfolio manager (2000-2006). |
Scott C. Goebel (44) | |
| Year of Election or Appointment: 2008 Secretary and Chief Legal Officer (CLO) of the Fidelity funds. Mr. Goebel also serves as Secretary of Fidelity Investments Money Management, Inc. (FIMM) (2010-present) and Fidelity Research and Analysis Company (FRAC) (2010-present); Secretary and CLO of The North Carolina Capital Management Trust: Cash and Term Portfolios (2008-present); General Counsel, Secretary, and Senior Vice President of FMR (2008-present) and FMR Co., Inc. (2008-present); employed by FMR LLC or an affiliate (2001-present); Chief Legal Officer of Fidelity Management & Research (Hong Kong) Limited (2008-present) and Assistant Secretary of Fidelity Management & Research (Japan) Inc. (2008-present), and Fidelity Management & Research (U.K.) Inc. (2008-present). Previously, Mr. Goebel served as Assistant Secretary of FIMM (2008-2010), FRAC (2008-2010), and the Funds (2007-2008) and as Vice President and Secretary of Fidelity Distributors Corporation (FDC) (2005-2007). |
William C. Coffey (42) | |
| Year of Election or Appointment: 2009 Assistant Secretary of Fidelity's Equity and High Income Funds. Mr. Coffey also serves as Senior Vice President and Deputy General Counsel of FMR LLC (2010-present), and is an employee of Fidelity Investments. Previously, Mr. Coffey served as Vice President and Associate General Counsel of FMR LLC (2005-2009). |
Holly C. Laurent (57) | |
| Year of Election or Appointment: 2008 Anti-Money Laundering (AML) Officer of the Fidelity funds. Ms. Laurent also serves as AML Officer of The North Carolina Capital Management Trust: Cash and Term Portfolios (2008-present) and is an employee of Fidelity Investments. Previously, Ms. Laurent was Senior Vice President and Head of Legal for Fidelity Business Services India Pvt. Ltd. (2006-2008), and Senior Vice President, Deputy General Counsel and Group Head for FMR LLC (2005-2006). |
Christine Reynolds (53) | |
| Year of Election or Appointment: 2008 Chief Financial Officer of the Fidelity funds. Ms. Reynolds became President of Fidelity Pricing and Cash Management Services (FPCMS) in August 2008. Ms. Reynolds served as Chief Operating Officer of FPCMS (2007-2008). Previously, Ms. Reynolds served as President, Treasurer, and Anti-Money Laundering officer of the Fidelity funds (2004-2007). |
Kenneth A. Rathgeber (64) | |
| Year of Election or Appointment: 2004 Chief Compliance Officer of Fidelity's Equity and High Income Funds. Mr. Rathgeber is Chief Compliance Officer of Fidelity Management & Research (Hong Kong) Limited (2008-present), Fidelity Management & Research (Japan) Inc. (2008-present), FMR (2005-present), FMR Co., Inc. (2005-present), Fidelity Management & Research (U.K.) Inc. (2005-present), Fidelity Research & Analysis Company (2005-present), Fidelity Investments Money Management, Inc. (2005-present), Pyramis Global Advisors, LLC (2005-present), and Strategic Advisers, Inc. (2005-present). |
Joseph F. Zambello (54) | |
| Year of Election or Appointment: 2011 Deputy Treasurer of the Fidelity funds. Mr. Zambello is an employee of Fidelity Investments. Previously, Mr. Zambello served as Vice President of FMR's Program Management Group (2009-2011) and Vice President of the Transfer Agent Oversight Group (2005-2009). |
Adrien E. Deberghes (44) | |
| Year of Election or Appointment: 2008 Deputy Treasurer of Fidelity's Equity and High Income Funds. Mr. Deberghes also serves as Vice President and Assistant Treasurer of Fidelity Rutland Square Trust II and Fidelity Commonwealth Trust II (2011-present), Assistant Treasurer of other Fidelity funds (2010-present), and is an employee of Fidelity Investments (2008-present). Previously, Mr. Deberghes served as Senior Vice President of Mutual Fund Administration at State Street Corporation (2007-2008), Senior Director of Mutual Fund Administration at Investors Bank & Trust (2005-2007), and Director of Finance for Dunkin' Brands (2000-2005). |
Stephanie J. Dorsey (42) | |
| Year of Election or Appointment: 2010 Assistant Treasurer of Fidelity's Equity and High Income Funds. Ms. Dorsey also serves as Deputy Treasurer of other Fidelity funds (2008-present) and is an employee of Fidelity Investments (2008-present). Previously, Ms. Dorsey served as Treasurer (2004-2008) of the JPMorgan Mutual Funds and Vice President (2004-2008) of JPMorgan Chase Bank. |
John R. Hebble (53) | |
| Year of Election or Appointment: 2009 Assistant Treasurer of Fidelity's Equity and High Income Funds. Mr. Hebble also serves as President (2011-present), Treasurer, and Chief Financial Officer of The North Carolina Capital Management Trust: Cash and Term Portfolios (2008-present), President and Treasurer of other Fidelity funds (2008-present) and is an employee of Fidelity Investments. |
Gary W. Ryan (53) | |
| Year of Election or Appointment: 2005 Assistant Treasurer of the Fidelity funds. Mr. Ryan is an employee of Fidelity Investments. Previously, Mr. Ryan served as Vice President of Fund Reporting in Fidelity Pricing and Cash Management Services (FPCMS) (1999-2005). |
Jonathan Davis (43) | |
| Year of Election or Appointment: 2010 Assistant Treasurer of the Fidelity funds. Mr. Davis is also Assistant Treasurer of Fidelity Rutland Square Trust II and Fidelity Commonwealth Trust II. Mr. Davis is an employee of Fidelity Investments. Previously, Mr. Davis served as Vice President and Associate General Counsel of FMR LLC (2003-2010). |
Annual Report
Distributions (Unaudited)
A total of 0.02% of the dividends distributed during the fiscal year were derived from interest on U.S. Government securities which is generally exempt from state income tax.
The fund designates 100% of the dividends distributed during the fiscal year as qualifying for the dividends-received deduction for corporate shareholders.
The fund designates 100% of the dividends distributed in April, July, October and December during the fiscal year as amounts which may be taken into account as a dividend for the purposes of the maximum rate under section 1(h)(11) of the Internal Revenue Code.
The fund will notify shareholders in January 2013 of amounts for use in preparing 2012 income tax returns.
Annual Report
Managing Your Investments
Fidelity offers several ways to conveniently manage your personal investments via your telephone or PC. You can access your account information, conduct trades and research your investments 24 hours a day.
By Phone
Fidelity Automated Service Telephone provides a single toll-free number to access account balances, positions, quotes and trading. It's easy to navigate the service, and on your first call, the system will help you create a personal identification number (PIN) for security.
(phone graphic)Fidelity Automated
Service Telephone (FAST®)
1-800-544-5555
Press
1 For mutual fund and brokerage trading.
2 For quotes.*
3 For account balances and holdings.
4 To review orders and mutual
fund activity.
5 To change your PIN.
*0 To speak to a Fidelity representative.
By PC
Fidelity's web site on the Internet provides a wide range of information, including daily financial news, fund performance, interactive planning tools and news about Fidelity products and services.
(computer graphic)Fidelity's Web Site
www.fidelity.com
* When you call the quotes line, please remember that a fund's yield and return will vary and, except for money market funds, share price will also vary. This means that you may have a gain or loss when you sell your shares. There is no assurance that money market funds will be able to maintain a stable $1 share price; an investment in a money market fund is not insured or guaranteed by the U.S. government. Total returns are historical and include changes in share price, reinvestment of dividends and capital gains distributions, and the effects of any sales charges.
Annual Report
To Write Fidelity
We'll give your correspondence immediate attention and send you written confirmation upon completion of your request.
(envelope graphic)Making Changes
To Your Account
(such as changing name, address, bank, etc.)
Fidelity Investments
P.O. Box 770001
Cincinnati, OH 45277-0002
(envelope graphic)For Non-Retirement
Accounts
Buying shares
Fidelity Investments
P.O. Box 770001
Cincinnati, OH 45277-0003
Overnight Express
Fidelity Investments
Attn: Distribution Services
100 Crosby Parkway - KC1H
Covington, KY 41015
Selling shares
Fidelity Investments
P.O. Box 770001
Cincinnati, OH 45277-0035
Overnight Express
Fidelity Investments
Attn: Distribution Services
100 Crosby Parkway - KC1H
Covington, KY 41015
General Correspondence
Fidelity Investments
P.O. Box 500
Merrimack, NH 03054-0500
(envelope graphic)For Retirement
Accounts
Buying shares
Fidelity Investments
P.O. Box 770001
Cincinnati, OH 45277-0003
Selling shares
Fidelity Investments
P.O. Box 770001
Cincinnati, OH 45277-0035
Overnight Express
Fidelity Investments
Attn: Distribution Services
100 Crosby Parkway - KC1H
Covington, KY 41015
General Correspondence
Fidelity Investments
P.O. Box 500
Merrimack, NH 03054-0500
Annual Report
Investment Adviser
Fidelity Management & Research Company
Boston, MA
Investment Sub-Advisers
FMR Co., Inc.
Fidelity Management & Research (U.K.) Inc.
Fidelity Management & Research
(Hong Kong) Limited
Fidelity Management & Research
(Japan) Inc.
General Distributor
Fidelity Distributors Corporation
Boston, MA
Transfer and Service Agents
Fidelity Investments Institutional Operations Company, Inc.
Boston, MA
Fidelity Service Company, Inc.
Boston, MA
Custodian
Brown Brothers Harriman & Co.
Boston, MA
The Fidelity Telephone Connection
Mutual Fund 24-Hour Service
Exchanges/Redemptions
and Account Assistance 1-800-544-6666
Product Information 1-800-544-6666
Retirement Accounts 1-800-544-4774
(8 a.m. - 9 p.m.)
TDD Service 1-800-544-0118
for the deaf and hearing impaired
(9 a.m. - 9 p.m. Eastern time)
Fidelity Automated Service
Telephone (FAST®)
1-800-544-5555
Automated line for quickest service
UIF-UANN-0312
1.789258.109
(Fidelity Investment logo)(registered trademark)
Corporate Headquarters
82 Devonshire St., Boston, MA 02109
www.fidelity.com
Item 2. Code of Ethics
As of the end of the period, January 31, 2012, Fidelity Devonshire Trust (the trust) has adopted a code of ethics, as defined in Item 2 of Form N-CSR, that applies to its President and Treasurer and its Chief Financial Officer. A copy of the code of ethics is filed as an exhibit to this Form N-CSR.
Item 3. Audit Committee Financial Expert
The Board of Trustees of the trust has determined that Joseph Mauriello is an audit committee financial expert, as defined in Item 3 of Form N-CSR. Mr. Mauriello is independent for purposes of Item 3 of Form N-CSR.
Item 4. Principal Accountant Fees and Services
Fees and Services
The following table presents fees billed by Deloitte & Touche LLP, the member firms of Deloitte Touche Tohmatsu, and their respective affiliates (collectively, "Deloitte Entities") in each of the last two fiscal years for services rendered to Fidelity Series All-Sector Equity Fund and Fidelity Series Large Cap Value Fund (the "Funds"):
Services Billed by Deloitte Entities
January 31, 2012 FeesA
| Audit Fees | Audit-Related Fees | Tax Fees | All Other Fees |
Fidelity Series All-Sector Equity Fund | $42,000 | $- | $4,600 | $1,800 |
Fidelity Series Large Cap Value Fund | $54,000 | $- | $6,600 | $1,700 |
January 31, 2011 FeesA
| Audit Fees | Audit-Related Fees | Tax Fees | All Other Fees |
Fidelity Series All-Sector Equity Fund | $43,000 | $- | $4,600 | $- |
Fidelity Series Large Cap Value Fund | $53,000 | $- | $6,600 | $- |
A Amounts may reflect rounding.
The following table presents fees billed by PricewaterhouseCoopers LLP ("PwC") in each of the last two fiscal years for services rendered to Fidelity Equity-Income Fund, Fidelity Large Cap Growth Fund, Fidelity Stock Selector Large Cap Value Fund, Fidelity Mid Cap Growth Fund, Fidelity Mid Cap Value Fund and Fidelity Telecom and Utilities Fund (the "Funds"):
Services Billed by PwC
January 31, 2012 FeesA
| Audit Fees | Audit-Related Fees | Tax Fees | All Other Fees |
Fidelity Equity-Income Fund | $169,000 | $- | $4,300 | $6,100 |
Fidelity Large Cap Growth Fund | $49,000 | $- | $3,300 | $1,600 |
Fidelity Stock Selector Large Cap Value Fund | $49,000 | $- | $3,300 | $1,800 |
Fidelity Mid Cap Growth Fund | $49,000 | $- | $3,300 | $1,700 |
Fidelity Mid Cap Value Fund | $49,000 | $- | $3,300 | $1,800 |
Fidelity Telecom and Utilities Fund | $53,000 | $- | $3,300 | $1,900 |
January 31, 2011 FeesA
| Audit Fees | Audit-Related Fees | Tax Fees | All Other Fees |
Fidelity Equity-Income Fund | $178,000 | $- | $4,300 | $11,100 |
Fidelity Large Cap Growth Fund | $50,000 | $- | $3,300 | $2,100 |
Fidelity Stock Selector Large Cap Value Fund | $51,000 | $- | $3,300 | $2,600 |
Fidelity Mid Cap Growth Fund | $50,000 | $- | $3,300 | $2,200 |
Fidelity Mid Cap Value Fund | $50,000 | $- | $3,300 | $2,400 |
Fidelity Telecom and Utilities Fund | $53,000 | $- | $3,300 | $2,500 |
A Amounts may reflect rounding.
The following table presents fees billed by PwC and Deloitte Entities that were required to be approved by the Audit Committee for services that relate directly to the operations and financial reporting of the Funds and that are rendered on behalf of Fidelity Management & Research Company ("FMR") and entities controlling, controlled by, or under common control with FMR (not including any sub-adviser whose role is primarily portfolio management and is subcontracted with or overseen by another investment adviser) that provide ongoing services to the Funds ("Fund Service Providers"):
Services Billed by Deloitte Entities
| January 31, 2012A | January 31, 2011A |
Audit-Related Fees | $612,000 | $645,000 |
Tax Fees | $- | $- |
All Other Fees | $635,000 | $705,000 |
A Amounts may reflect rounding.
Services Billed by PwC
| January 31, 2012A | January 31, 2011A |
Audit-Related Fees | $3,793,000 | $2,550,000 |
Tax Fees | $- | $- |
All Other Fees | $- | $510,000 |
A Amounts may reflect rounding.
"Audit-Related Fees" represent fees billed for assurance and related services that are reasonably related to the performance of the fund audit or the review of the fund's financial statements and that are not reported under Audit Fees.
"Tax Fees" represent fees billed for tax compliance, tax advice or tax planning that relate directly to the operations and financial reporting of the fund.
"All Other Fees" represent fees billed for services provided to the fund or Fund Service Provider, a significant portion of which are assurance related, that relate directly to the operations and financial reporting of the fund, excluding those services that are reported under Audit Fees, Audit-Related Fees or Tax Fees.
Assurance services must be performed by an independent public accountant.
* * *
The aggregate non-audit fees billed by PwC and Deloitte Entities for services rendered to the Funds, FMR (not including any sub-adviser whose role is primarily portfolio management and is subcontracted with or overseen by another investment adviser), and any Fund Service Provider for each of the last two fiscal years of the Funds are as follows:
Billed By | January 31, 2012 A | January 31, 2011 A |
PwC | $5,110,000 | $4,905,000 |
Deloitte Entities | $1,355,000 | $1,455,000 |
A Amounts may reflect rounding.
The trust's Audit Committee has considered non-audit services that were not pre-approved that were provided by PwC and Deloitte Entities to Fund Service Providers to be compatible with maintaining the independence of PwC and Deloitte Entities in their audits of the Funds, taking into account representations from PwC and Deloitte Entities, in accordance with Public Company Accounting Oversight Board rules, regarding their independence from the Funds and their related entities and FMR's review of the appropriateness and permissibility under applicable law of such non-audit services prior to their provision to the Fund Service Providers.
Audit Committee Pre-Approval Policies and Procedures
The trust's Audit Committee must pre-approve all audit and non-audit services provided by a fund's independent registered public accounting firm relating to the operations or financial reporting of the fund. Prior to the commencement of any audit or non-audit services to a fund, the Audit Committee reviews the services to determine whether they are appropriate and permissible under applicable law.
The Audit Committee has adopted policies and procedures to, among other purposes, provide a framework for the Committee's consideration of non-audit services by the audit firms that audit the Fidelity funds. The policies and procedures require that any non-audit service provided by a fund audit firm to a Fidelity fund and any non-audit service provided by a fund auditor to a Fund Service Provider that relates directly to the operations and financial reporting of a Fidelity fund ("Covered Service") are subject to approval by the Audit Committee before such service is provided.
All Covered Services must be approved in advance of provision of the service either: (i) by formal resolution of the Audit Committee, or (ii) by oral or written approval of the service by the Chair of the Audit Committee (or if the Chair is unavailable, such other member of the Audit Committee as may be designated by the Chair to act in the Chair's absence). The approval contemplated by (ii) above is permitted where the Treasurer determines that action on such an engagement is necessary before the next meeting of the Audit Committee.
Non-audit services provided by a fund audit firm to a Fund Service Provider that do not relate directly to the operations and financial reporting of a Fidelity fund are reported to the Audit Committee on a periodic basis.
Non-Audit Services Approved Pursuant to Rule 2-01(c)(7)(i)(C) and (ii) of Regulation S-X ("De Minimis Exception")
There were no non-audit services approved or required to be approved by the Audit Committee pursuant to the De Minimis Exception during the Funds' last two fiscal years relating to services provided to (i) the Funds or (ii) any Fund Service Provider that relate directly to the operations and financial reporting of the Funds.
Item 5. Audit Committee of Listed Registrants
Not applicable.
Item 6. Investments
(a) Not applicable.
(b) Not applicable
Item 7. Disclosure of Proxy Voting Policies and Procedures for Closed-End Management Investment Companies
Not applicable.
Item 8. Portfolio Managers of Closed-End Management Investment Companies
Not applicable.
Item 9. Purchase of Equity Securities by Closed-End Management Investment Company and Affiliated Purchasers
Not applicable.
Item 10. Submission of Matters to a Vote of Security Holders
There were no material changes to the procedures by which shareholders may recommend nominees to the trust's Board of Trustees.
Item 11. Controls and Procedures
(a)(i) The President and Treasurer and the Chief Financial Officer have concluded that the trust's disclosure controls and procedures (as defined in Rule 30a-3(c) under the Investment Company Act) provide reasonable assurances that material information relating to the trust is made known to them by the appropriate persons, based on their evaluation of these controls and procedures as of a date within 90 days of the filing date of this report.
(a)(ii) There was no change in the trust's internal control over financial reporting (as defined in Rule 30a-3(d) under the Investment Company Act) that occurred during the second fiscal quarter of the period covered by this report that has materially affected, or is reasonably likely to materially affect, the trust's internal control over financial reporting.
Item 12. Exhibits
(a) | (1) | Code of Ethics pursuant to Item 2 of Form N-CSR is filed and attached hereto as EX-99.CODE ETH. |
(a) | (2) | Certification pursuant to Rule 30a-2(a) under the Investment Company Act of 1940 (17 CFR 270.30a-2(a)) is filed and attached hereto as Exhibit 99.CERT. |
(a) | (3) | Not applicable. |
(b) |
| Certification pursuant to Rule 30a-2(b) under the Investment Company Act of 1940 (17 CFR 270.30a-2(b)) is furnished and attached hereto as Exhibit 99.906CERT. |
SIGNATURES
Pursuant to the requirements of the Securities Exchange Act of 1934 and the Investment Company Act of 1940, the registrant has duly caused this report to be signed on its behalf by the undersigned, thereunto duly authorized.
Fidelity Devonshire Trust
By: | /s/Kenneth B. Robins |
| Kenneth B. Robins |
| President and Treasurer |
|
|
Date: | March 27, 2012 |
Pursuant to the requirements of the Securities Exchange Act of 1934 and the Investment Company Act of 1940, this report has been signed below by the following persons on behalf of the registrant and in the capacities and on the dates indicated.
By: | /s/Kenneth B. Robins |
| Kenneth B. Robins |
| President and Treasurer |
|
|
Date: | March 27, 2012 |
By: | /s/Christine Reynolds |
| Christine Reynolds |
| Chief Financial Officer |
|
|
Date: | March 27, 2012 |