UNITED STATES
SECURITIES AND EXCHANGE COMMISSION
Washington, D.C. 20549
FORM N-CSR
CERTIFIED SHAREHOLDER REPORT OF REGISTERED
MANAGEMENT INVESTMENT COMPANIES
Investment Company Act file number 811-1352
Fidelity Devonshire Trust
(Exact name of registrant as specified in charter)
245 Summer St., Boston, Massachusetts 02210
(Address of principal executive offices) (Zip code)
Scott C. Goebel, Secretary
245 Summer St.
Boston, Massachusetts 02210
(Name and address of agent for service)
Registrant's telephone number, including area code: 617-563-7000
Date of fiscal year end: | January 31 |
|
|
Date of reporting period: | January 31, 2014 |
Item 1. Reports to Stockholders
Fidelity Advisor®
Series Equity-Income Fund
and
Fidelity Advisor®
Series Stock Selector Large Cap Value Fund
Annual Report
January 31, 2014
(Fidelity Cover Art)
Contents
Performance | How the fund has done over time. | |
Management's Discussion of Fund Performance | The Portfolio Manager's review of fund performance and strategy. | |
Shareholder Expense Example | An example of shareholder expenses. | |
Fidelity Advisor® Series Equity-Income Fund | ||
Investment Changes | A summary of major shifts in the fund's investments over the past six months. | |
Investments | A complete list of the fund's investments with their market values. | |
Financial Statements | Statements of assets and liabilities, operations, and changes in net assets, as well as financial highlights. | |
Fidelity Advisor® Series Stock Selector Large Cap Value Fund | ||
Investment Changes | A summary of major shifts in the fund's investments over the past six months. | |
Investments | A complete list of the fund's investments with their market values. | |
Financial Statements | Statements of assets and liabilities, operations, and changes in net assets, as well as financial highlights. | |
Notes | Notes to the Financial Statements. | |
Reports of Independent Registered Public Accounting Firms |
| |
Trustees and Officers |
| |
Distributions |
| |
To view a fund's proxy voting guidelines and proxy voting record for the 12-month period ended June 30, visit http://www.fidelity.com/proxyvotingresults or visit the Securities and Exchange Commission's (SEC) web site at http://www.sec.gov. You may also call 1-877-208-0098 to request a free copy of the proxy voting guidelines.
Standard & Poor's, S&P and S&P 500 are registered service marks of The McGraw-Hill Companies, Inc. and have been licensed for use by Fidelity Distributors Corporation.
Other third-party marks appearing herein are the property of their respective owners.
All other marks appearing herein are registered or unregistered trademarks or service marks of FMR LLC or an affiliated company. © 2014 FMR LLC. All rights reserved.
Annual Report
This report and the financial statements contained herein are submitted for the general information of the shareholders of the funds. This report is not authorized for distribution to prospective investors in the funds unless preceded or accompanied by an effective prospectus.
A fund files its complete schedule of portfolio holdings with the SEC for the first and third quarters of each fiscal year on Form N-Q. Forms N-Q are available on the SEC's web site at http://www.sec.gov. A fund's Forms N-Q may be reviewed and copied at the SEC's Public Reference Room in Washington, DC. Information regarding the operation of the SEC's Public Reference Room may be obtained by calling 1-800-SEC-0330. For a complete list of a fund's portfolio holdings, view the most recent holdings listing, semiannual report, or annual report on Fidelity's web site at http://www.fidelity.com, http://www.advisor.fidelity.com, or http://www.401k.com, as applicable.
NOT FDIC INSURED • MAY LOSE VALUE • NO BANK GUARANTEE
Neither the funds nor Fidelity Distributors Corporation is a bank.
Annual Report
Fidelity Advisor® Series Equity-Income Fund
Performance: The Bottom Line
Average annual total return reflects the change in the value of an investment, assuming reinvestment of the fund's distributions from dividend income and capital gains (the profits earned upon the sale of securities that have grown in value, if any) and assuming a constant rate of performance each year. The $10,000 table and the fund's returns do not reflect the deduction of taxes that a shareholder would pay on fund distributions or the redemption of fund shares. During periods of reimbursement by Fidelity, a fund's total return will be greater than it would be had the reimbursement not occurred. How a fund did yesterday is no guarantee of how it will do tomorrow.
Average Annual Total Returns
Periods ended January 31, 2014 | Past 1 | Life of |
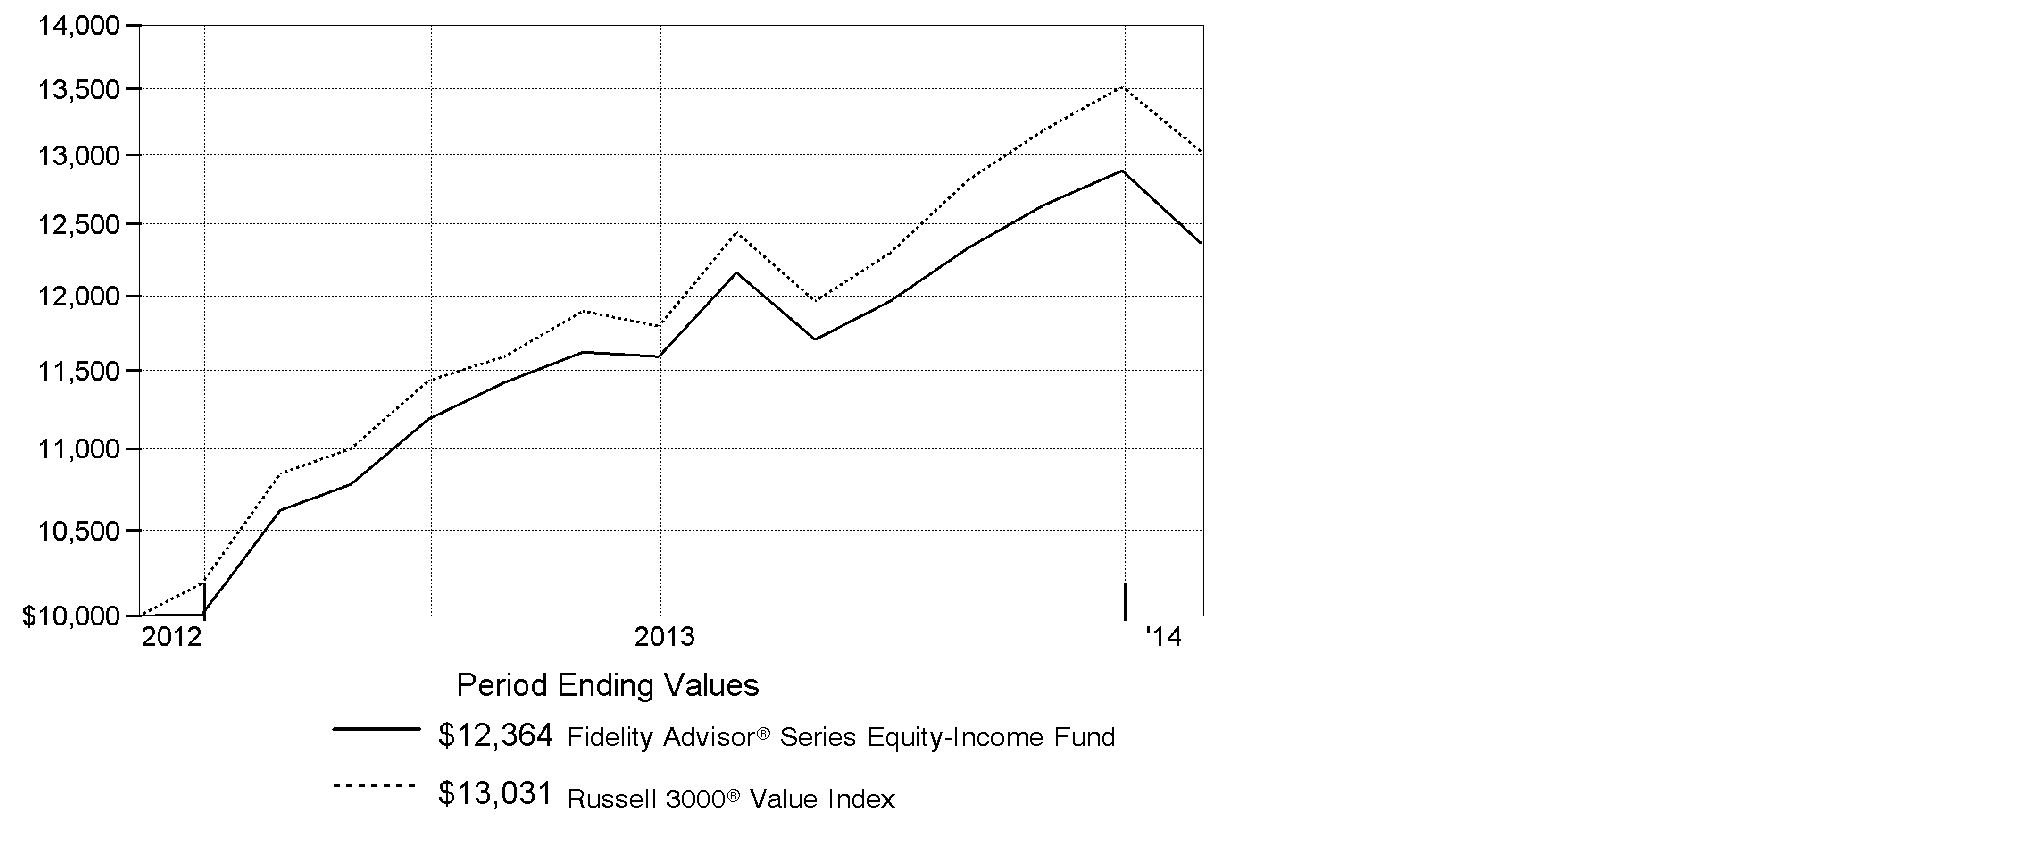
Fidelity Advisor® Series Equity-Income Fund | 16.44% | 20.20% |
A From December 6, 2012.
$10,000 Over Life of Fund
Let's say hypothetically that $10,000 was invested in Fidelity Advisor® Series Equity-Income Fund on December 6, 2012, when the fund started. The chart shows how the value of your investment would have changed, and also shows how the Russell 3000® Value Index performed over the same period.
Annual Report
Fidelity Advisor® Series Stock Selector Large Cap Value Fund
Performance: The Bottom Line
Average annual total return reflects the change in the value of an investment, assuming reinvestment of the fund's distributions from dividend income and capital gains (the profits earned upon the sale of securities that have grown in value, if any) and assuming a constant rate of performance each year. The $10,000 table and the fund's returns do not reflect the deduction of taxes that a shareholder would pay on fund distributions or the redemption of fund shares. During periods of reimbursement by Fidelity, a fund's total return will be greater than it would be had the reimbursement not occurred. How a fund did yesterday is no guarantee of how it will do tomorrow.
Average Annual Total Returns
Periods ended January 31, 2014 | Past 1 | Life of |
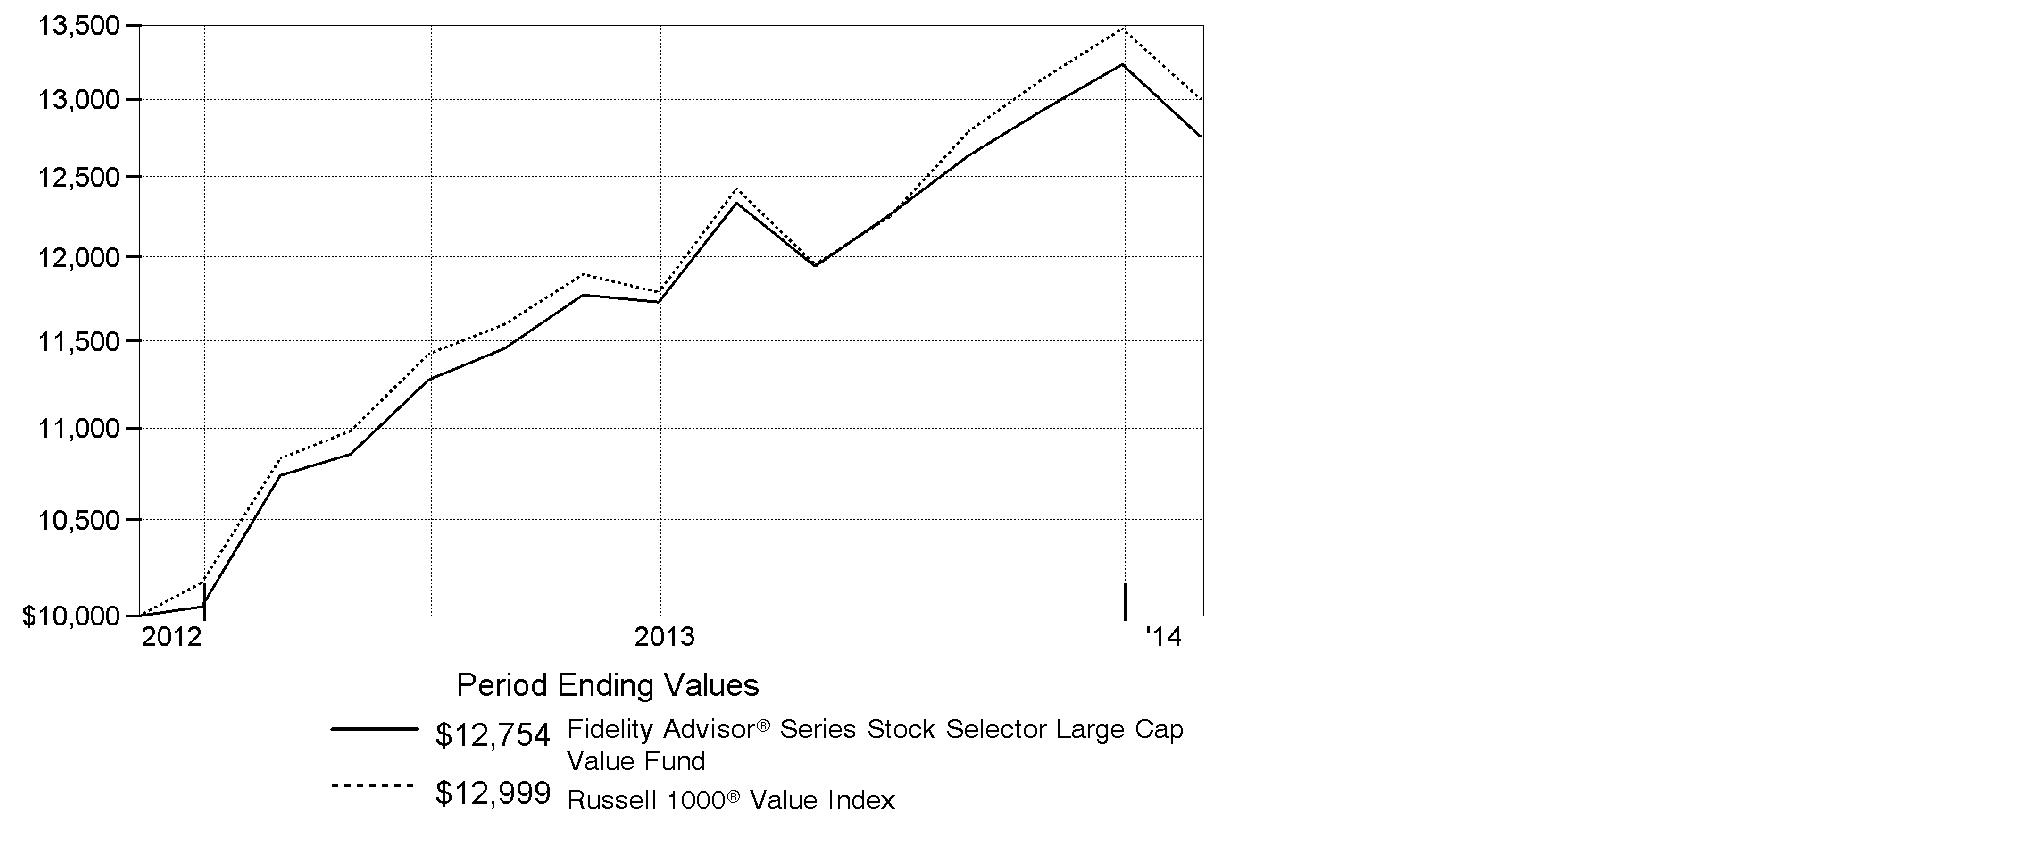
Fidelity Advisor® Series Stock Selector Large Cap Value Fund | 18.79% | 23.49% |
A From December 6, 2012.
$10,000 Over Life of Fund
Let's say hypothetically that $10,000 was invested in Fidelity Advisor® Series Stock Selector Large Cap Value Fund on December 6, 2012, when the fund started. The chart shows how the value of your investment would have changed, and also shows how the Russell 1000® Value Index performed over the same period.
Annual Report
Fidelity Advisor Series Equity-Income Fund
Management's Discussion of Fund Performance
Market Recap: Despite the worst January in years, markets finished notably higher for the 12 months ending January 31, 2014, amid a generally improving global economy and accommodative monetary policies worldwide. After achieving a series of highs in 2013, both the broad S&P 500® Index and the blue-chip Dow Jones Industrial AverageSM pulled back in the new year, bringing their 12-month returns to 21.52% and 16.07%, respectively. The growth-oriented Nasdaq Composite Index®, having run hotter in 2013 and cooled less in January, retained a loftier 32.33% result. For the period overall, smaller-cap stocks generally outperformed larger-caps, and growth outperformed value across market-cap segments. Bullish sentiment drove stocks higher through mid-May, but mixed signals from the U.S. Federal Reserve as to when it might curtail its stimulative bond-buying program, along with jitters over a potential U.S. military strike in Syria, put the markets in flux over the summer. Stocks regained their momentum in October despite a budget impasse that briefly shuttered the federal government, and volatility remained subdued heading into the holidays, allowing many markets to hit all-time highs by year-end. In January, renewed optimism for Europe and other developed markets was overrun by renewed concern about Fed tapering, the economic slowdown in China and a sell-off in emerging markets.
Comments from James Morrow, Portfolio Manager of Fidelity Advisor® Series Equity-Income Fund: For the year, the fund shares gained 16.44%, trailing the Russell 3000® Value Index, which rose 20.18%. Compared with the index, stock picking in information technology and industrials was detrimental. The fund's average cash allocation of about 5% also detracted in a rising market. On the positive side, the fund benefited from favorable allocations in several sectors, especially software & services within information technology. Nevertheless, the fund's biggest individual detractor - IBM, a diversified technology services company not held in the benchmark - came from this group. Steady growers like IBM were somewhat out of favor in a market environment rewarding faster-growing stocks. Another source of underperformance was Bank of America, a benchmark component that I held only intermittently during the 12 months, and not at period end. On the positive side, media company and cable service provider Comcast was the top relative contributor. As Comcast's shares continued rising, I gradually reduced my holding. Another notable contributor was Paychex, a provider of payroll and human resources services whose shares rose along with an improving employment market as well as higher interest rates.
The views expressed above reflect those of the portfolio manager(s) only through the end of the period as stated on the cover of this report and do not necessarily represent the views of Fidelity or any other person in the Fidelity organization. Any such views are subject to change at any time based upon market or other conditions and Fidelity disclaims any responsibility to update such views. These views may not be relied on as investment advice and, because investment decisions for a Fidelity fund are based on numerous factors, may not be relied on as an indication of trading intent on behalf of any Fidelity fund.
Annual Report
Fidelity Advisor Series Stock Selector Large Cap Value Fund
Management's Discussion of Fund Performance
Market Recap: Despite the worst January in years, markets finished notably higher for the 12 months ending January 31, 2014, amid a generally improving global economy and accommodative monetary policies worldwide. After achieving a series of highs in 2013, both the broad S&P 500® Index and the blue-chip Dow Jones Industrial AverageSM pulled back in the new year, bringing their 12-month returns to 21.52% and 16.07%, respectively. The growth-oriented Nasdaq Composite Index®, having run hotter in 2013 and cooled less in January, retained a loftier 32.33% result. For the period overall, smaller-cap stocks generally outperformed larger-caps, and growth outperformed value across market-cap segments. Bullish sentiment drove stocks higher through mid-May, but mixed signals from the U.S. Federal Reserve as to when it might curtail its stimulative bond-buying program, along with jitters over a potential U.S. military strike in Syria, put the markets in flux over the summer. Stocks regained their momentum in October despite a budget impasse that briefly shuttered the federal government, and volatility remained subdued heading into the holidays, allowing many markets to hit all-time highs by year-end. In January, renewed optimism for Europe and other developed markets was overrun by renewed concern about Fed tapering, the economic slowdown in China and a sell-off in emerging markets.
Comments from Matthew Friedman, Lead Portfolio Manager of Fidelity Advisor® Series Stock Selector Large Cap Value Fund: For the year, the fund rose 18.79%, modestly underperforming the 20.02% return of the Russell 1000® Value Index. The fund's performance versus the benchmark during the past year primarily resulted from strong stock choices in health care, consumer discretionary and utilities, which were offset by some stock-specific mistakes, most notably in energy and industrials. A modest cash stake in a rising market also dampened relative performance. Among individual stock, Ireland-based Jazz Pharmaceuticals was the fund's biggest relative contributor during the reporting period. Shares of the specialty pharma firm surged at the end of the calendar year after the company announced a definitive agreement to acquire smaller-cap Italian orphan drug firm Gentium. Timely ownership of Juniper Networks was another plus. We added the stock of the networking equipment manufacturer to the fund during the past year and it rallied toward the end of the period after the firm announced better-than-expected earnings and revenue. We sold the stock prior to period end. Conversely, overweighting two energy names and index components was detrimental: integrated energy firm Chevron and oil/gas exploration & production company Occidental Petroleum. Chevron - which we added to the fund during the period - and Occidental were both hurt buy falling crude oil prices. Additionally, Chevron had a volatile run during the past year, including consecutive quarters of weaker-than-expected financial results.
The views expressed above reflect those of the portfolio manager(s) only through the end of the period as stated on the cover of this report and do not necessarily represent the views of Fidelity or any other person in the Fidelity organization. Any such views are subject to change at any time based upon market or other conditions and Fidelity disclaims any responsibility to update such views. These views may not be relied on as investment advice and, because investment decisions for a Fidelity fund are based on numerous factors, may not be relied on as an indication of trading intent on behalf of any Fidelity fund.
Annual Report
Shareholder Expense Example
As a shareholder of a Fund, you incur two types of costs: (1) transaction costs, and (2) ongoing costs, including management fees and other Fund expenses. This Example is intended to help you understand your ongoing costs (in dollars) of investing in the Funds and to compare these costs with the ongoing costs of investing in other mutual funds.
The Example is based on an investment of $1,000 invested at the beginning of the period and held for the entire period (August 1, 2013 to January 31, 2014).
Actual Expenses
The first line of the accompanying table for each fund provides information about actual account values and actual expenses. You may use the information in this line, together with the amount you invested, to estimate the expenses that you paid over the period. Simply divide your account value by $1,000.00 (for example, an $8,600 account value divided by $1,000.00 = 8.6), then multiply the result by the number in the first line for a fund under the heading entitled "Expenses Paid During Period" to estimate the expenses you paid on your account during this period. In addition, each Fund, as a shareholder in the underlying Fidelity Central Funds, will indirectly bear its pro-rata share of the fees and expenses incurred by the underlying Fidelity Central Funds. These fees and expenses are not included in the Fund's annualized expense ratio used to calculate the expense estimate in the table below.
Hypothetical Example for Comparison Purposes
The second line of the accompanying table for each fund provides information about hypothetical account values and hypothetical expenses based on a fund's actual expense ratio and an assumed rate of return of 5% per year before expenses, which is not the Fund's actual return. The hypothetical account values and expenses may not be used to estimate the actual ending account balance or expenses you paid for the period. You may use this information to compare the ongoing costs of investing in the Fund and other funds. To do so, compare this 5% hypothetical example with the 5% hypothetical examples that appear in the shareholder reports of the other funds. In addition, each Fund, as a shareholder in the underlying Fidelity Central Funds, will indirectly bear its pro-rata share of the fees and expenses incurred by the underlying Fidelity Central Funds. These fees and expenses are not included in the Fund's annualized expense ratio used to calculate the expense estimate in the table below.
Please note that the expenses shown in the table are meant to highlight your ongoing costs only and do not reflect any transaction costs. Therefore, the second line of the table is useful in comparing ongoing costs only, and will not help you determine the relative total costs of owning different funds.
Annual Report
| Annualized | Beginning | Ending | Expenses Paid |
Fidelity Advisor Series Equity-Income Fund | .68% |
|
|
|
Actual |
| $ 1,000.00 | $ 1,017.00 | $ 3.46 |
Hypothetical A |
| $ 1,000.00 | $ 1,021.78 | $ 3.47 |
Fidelity Advisor Series Stock Selector Large Cap Value Fund | .78% |
|
|
|
Actual |
| $ 1,000.00 | $ 1,034.20 | $ 4.00 |
Hypothetical A |
| $ 1,000.00 | $ 1,021.27 | $ 3.97 |
A 5% return per year before expenses
B Annualized expense ratio reflects expenses net of applicable fee waivers.
* Expenses are equal to each Fund's annualized expense ratio, multiplied by the average account value over the period, multiplied by 184/365 (to reflect the one-half year period).
Annual Report
Fidelity Advisor Series Equity-Income Fund
Investment Changes (Unaudited)
Top Ten Stocks as of January 31, 2014 | ||
| % of fund's | % of fund's net assets |
JPMorgan Chase & Co.* | 4.2 | 4.1 |
Chevron Corp. | 4.1 | 4.5 |
Exxon Mobil Corp.* | 3.8 | 3.8 |
Wells Fargo & Co. | 3.1 | 4.3 |
General Electric Co. | 3.1 | 3.1 |
MetLife, Inc.* | 3.0 | 2.9 |
Cisco Systems, Inc. | 2.7 | 2.7 |
Procter & Gamble Co. | 2.5 | 2.5 |
Johnson & Johnson | 2.3 | 2.6 |
Merck & Co., Inc.* | 2.2 | 2.2 |
| 31.0 | |
* Security or a portion of the security is pledged as collateral for call options written. |
Top Five Market Sectors as of January 31, 2014 | ||
| % of fund's | % of fund's net assets |
Financials | 22.6 | 25.7 |
Energy | 14.4 | 14.7 |
Information Technology | 11.8 | 10.2 |
Consumer Staples | 11.6 | 9.7 |
Health Care | 9.2 | 11.7 |
Asset Allocation (% of fund's net assets) | |||||||
As of January 31, 2014* | As of July 31, 2013** | ||||||
 | Stocks 95.6% |
| | Stocks 97.4% |
| ||
 | Short-Term |
| | Short-Term |
| ||
* Foreign investments | 3.3% |
| ** Foreign investments | 3.5% |
| ||

* Written options | (0.1)% |
| ** Written options | 0.0% |
| ||
Annual Report
Fidelity Advisor Series Equity-Income Fund
Investments January 31, 2014
Showing Percentage of Net Assets
Common Stocks - 95.6% | |||
Shares | Value | ||
CONSUMER DISCRETIONARY - 7.8% | |||
Auto Components - 0.3% | |||
Gentex Corp. | 168,121 | $ 5,445,439 | |
Hotels, Restaurants & Leisure - 1.9% | |||
Darden Restaurants, Inc. | 51,873 | 2,564,601 | |
McDonald's Corp. | 193,427 | 18,215,021 | |
Texas Roadhouse, Inc. Class A | 97,007 | 2,352,420 | |
Yum! Brands, Inc. | 149,267 | 10,023,279 | |
| 33,155,321 | ||
Media - 2.6% | |||
Comcast Corp. Class A | 477,128 | 25,979,620 | |
Sinclair Broadcast Group, Inc. Class A | 77,101 | 2,422,513 | |
Time Warner, Inc. (e) | 280,609 | 17,630,663 | |
| 46,032,796 | ||
Multiline Retail - 2.3% | |||
Kohl's Corp. | 271,192 | 13,730,451 | |
Target Corp. | 481,597 | 27,277,654 | |
| 41,008,105 | ||
Specialty Retail - 0.7% | |||
Abercrombie & Fitch Co. Class A | 102,500 | 3,626,450 | |
Foot Locker, Inc. | 134,241 | 5,181,703 | |
Staples, Inc. | 317,827 | 4,182,603 | |
| 12,990,756 | ||
TOTAL CONSUMER DISCRETIONARY | 138,632,417 | ||
CONSUMER STAPLES - 11.6% | |||
Beverages - 1.7% | |||
Molson Coors Brewing Co. Class B | 146,800 | 7,727,552 | |
The Coca-Cola Co. | 576,097 | 21,787,989 | |
| 29,515,541 | ||
Food & Staples Retailing - 2.5% | |||
CVS Caremark Corp. | 147,687 | 10,001,364 | |
Wal-Mart Stores, Inc. | 103,242 | 7,710,113 | |
Walgreen Co. | 465,416 | 26,691,608 | |
| 44,403,085 | ||
Food Products - 1.3% | |||
B&G Foods, Inc. Class A | 31,805 | 1,042,250 | |
Kellogg Co. | 387,703 | 22,479,020 | |
| 23,521,270 | ||
Common Stocks - continued | |||
Shares | Value | ||
CONSUMER STAPLES - continued | |||
Household Products - 2.5% | |||
Procter & Gamble Co. | 562,781 | $ 43,120,280 | |
Tobacco - 3.6% | |||
Altria Group, Inc. (e) | 621,238 | 21,880,002 | |
Lorillard, Inc. | 394,579 | 19,421,178 | |
Philip Morris International, Inc. | 176,931 | 13,825,388 | |
Reynolds American, Inc. | 185,629 | 9,003,007 | |
| 64,129,575 | ||
TOTAL CONSUMER STAPLES | 204,689,751 | ||
ENERGY - 14.4% | |||
Energy Equipment & Services - 1.3% | |||
Ensco PLC Class A | 95,953 | 4,833,153 | |
Halliburton Co. | 14,001 | 686,189 | |
National Oilwell Varco, Inc. | 117,900 | 8,843,679 | |
Noble Corp. | 194,300 | 6,029,129 | |
Schlumberger Ltd. | 41,544 | 3,638,008 | |
| 24,030,158 | ||
Oil, Gas & Consumable Fuels - 13.1% | |||
Access Midstream Partners LP | 33,587 | 1,882,551 | |
Apache Corp. | 191,395 | 15,361,363 | |
Chevron Corp. | 651,469 | 72,723,484 | |
CONSOL Energy, Inc. | 158,306 | 5,912,729 | |
EV Energy Partners LP | 202,860 | 7,290,788 | |
Exxon Mobil Corp. (e) | 733,100 | 67,562,496 | |
Hess Corp. | 88,600 | 6,688,414 | |
Holly Energy Partners LP | 86,100 | 2,786,196 | |
HollyFrontier Corp. | 24,724 | 1,144,721 | |
Legacy Reserves LP | 51,300 | 1,337,904 | |
Markwest Energy Partners LP | 122,181 | 8,575,884 | |
Occidental Petroleum Corp. | 175,683 | 15,384,560 | |
Scorpio Tankers, Inc. | 59,672 | 596,720 | |
The Williams Companies, Inc. | 571,900 | 23,156,231 | |
Williams Partners LP | 27,100 | 1,357,710 | |
| 231,761,751 | ||
TOTAL ENERGY | 255,791,909 | ||
Common Stocks - continued | |||
Shares | Value | ||
FINANCIALS - 22.6% | |||
Capital Markets - 3.5% | |||
Apollo Global Management LLC Class A | 55,447 | $ 1,799,255 | |
Apollo Investment Corp. | 859,700 | 7,255,868 | |
Ares Capital Corp. | 78,326 | 1,387,153 | |
BlackRock, Inc. Class A (e) | 11,214 | 3,369,471 | |
Carlyle Group LP | 39,500 | 1,374,995 | |
Charles Schwab Corp. | 359,764 | 8,929,342 | |
Greenhill & Co., Inc. | 29,391 | 1,526,862 | |
Invesco Ltd. | 76,100 | 2,530,325 | |
KKR & Co. LP | 380,500 | 9,173,855 | |
Morgan Stanley | 445,700 | 13,152,607 | |
The Blackstone Group LP | 372,000 | 12,183,000 | |
| 62,682,733 | ||
Commercial Banks - 6.0% | |||
CIT Group, Inc. (e) | 29,900 | 1,391,845 | |
Comerica, Inc. | 200,500 | 9,182,900 | |
M&T Bank Corp. | 168,170 | 18,752,637 | |
PNC Financial Services Group, Inc. | 39,500 | 3,155,260 | |
U.S. Bancorp | 463,321 | 18,407,743 | |
Wells Fargo & Co. | 1,222,549 | 55,430,372 | |
| 106,320,757 | ||
Diversified Financial Services - 4.8% | |||
JPMorgan Chase & Co. (e) | 1,335,130 | 73,912,796 | |
KKR Financial Holdings LLC | 924,566 | 11,187,249 | |
| 85,100,045 | ||
Insurance - 5.5% | |||
ACE Ltd. | 157,100 | 14,737,551 | |
AFLAC, Inc. | 51,946 | 3,261,170 | |
MetLife, Inc. (e) | 1,091,800 | 53,552,790 | |
Prudential Financial, Inc. | 160,092 | 13,510,164 | |
The Travelers Companies, Inc. | 51,700 | 4,202,176 | |
Validus Holdings Ltd. | 214,704 | 7,712,168 | |
| 96,976,019 | ||
Real Estate Investment Trusts - 2.7% | |||
American Capital Agency Corp. | 520,273 | 10,899,719 | |
Annaly Capital Management, Inc. | 921,600 | 9,925,632 | |
CBL & Associates Properties, Inc. | 201,700 | 3,426,883 | |
Coresite Realty Corp. | 48,333 | 1,482,856 | |
First Potomac Realty Trust | 261,433 | 3,414,315 | |
Home Properties, Inc. | 111,475 | 6,214,731 | |
Common Stocks - continued | |||
Shares | Value | ||
FINANCIALS - continued | |||
Real Estate Investment Trusts - continued | |||
Piedmont Office Realty Trust, Inc. Class A | 108,600 | $ 1,810,362 | |
Rayonier, Inc. | 81,700 | 3,616,042 | |
Retail Properties America, Inc. | 153,500 | 2,024,665 | |
Two Harbors Investment Corp. | 366,900 | 3,606,627 | |
Ventas, Inc. | 21,200 | 1,322,668 | |
| 47,744,500 | ||
Thrifts & Mortgage Finance - 0.1% | |||
Radian Group, Inc. | 106,562 | 1,585,643 | |
TOTAL FINANCIALS | 400,409,697 | ||
HEALTH CARE - 9.2% | |||
Biotechnology - 0.2% | |||
Amgen, Inc. | 29,700 | 3,532,815 | |
Health Care Equipment & Supplies - 0.9% | |||
Baxter International, Inc. | 116,024 | 7,924,439 | |
Covidien PLC | 70,800 | 4,831,392 | |
St. Jude Medical, Inc. | 53,800 | 3,267,274 | |
| 16,023,105 | ||
Health Care Providers & Services - 1.3% | |||
Aetna, Inc. | 44,160 | 3,017,453 | |
Quest Diagnostics, Inc. | 96,435 | 5,062,838 | |
UnitedHealth Group, Inc. | 152,921 | 11,053,130 | |
WellPoint, Inc. | 48,536 | 4,174,096 | |
| 23,307,517 | ||
Pharmaceuticals - 6.8% | |||
AbbVie, Inc. | 74,800 | 3,682,404 | |
Actavis PLC (a) | 39,567 | 7,477,372 | |
Eli Lilly & Co. | 145,500 | 7,858,455 | |
Johnson & Johnson | 447,993 | 39,633,941 | |
Merck & Co., Inc. (e) | 738,214 | 39,103,196 | |
Pfizer, Inc. | 708,736 | 21,545,574 | |
| 119,300,942 | ||
TOTAL HEALTH CARE | 162,164,379 | ||
INDUSTRIALS - 8.8% | |||
Aerospace & Defense - 0.7% | |||
United Technologies Corp. (e) | 104,000 | 11,858,080 | |
Common Stocks - continued | |||
Shares | Value | ||
INDUSTRIALS - continued | |||
Air Freight & Logistics - 2.1% | |||
C.H. Robinson Worldwide, Inc. | 203,043 | $ 11,886,137 | |
United Parcel Service, Inc. Class B | 277,900 | 26,464,417 | |
| 38,350,554 | ||
Commercial Services & Supplies - 0.9% | |||
Republic Services, Inc. | 495,000 | 15,854,850 | |
Electrical Equipment - 0.5% | |||
Eaton Corp. PLC | 34,600 | 2,528,914 | |
Emerson Electric Co. | 54,000 | 3,560,760 | |
Hubbell, Inc. Class B | 27,156 | 3,169,920 | |
| 9,259,594 | ||
Industrial Conglomerates - 3.1% | |||
General Electric Co. | 2,166,156 | 54,435,500 | |
Machinery - 1.0% | |||
Cummins, Inc. | 44,600 | 5,663,308 | |
Stanley Black & Decker, Inc. (e) | 150,918 | 11,681,053 | |
| 17,344,361 | ||
Professional Services - 0.1% | |||
Acacia Research Corp. | 84,406 | 1,166,491 | |
Road & Rail - 0.4% | |||
CSX Corp. | 291,500 | 7,844,265 | |
TOTAL INDUSTRIALS | 156,113,695 | ||
INFORMATION TECHNOLOGY - 11.8% | |||
Communications Equipment - 3.1% | |||
Cisco Systems, Inc. | 2,164,059 | 47,414,533 | |
QUALCOMM, Inc. | 96,010 | 7,125,862 | |
| 54,540,395 | ||
Computers & Peripherals - 0.4% | |||
Apple, Inc. | 15,715 | 7,866,929 | |
Electronic Equipment & Components - 0.4% | |||
TE Connectivity Ltd. | 115,624 | 6,533,912 | |
IT Services - 3.6% | |||
IBM Corp. | 198,384 | 35,050,485 | |
Paychex, Inc. | 688,591 | 28,796,876 | |
| 63,847,361 | ||
Office Electronics - 0.2% | |||
Xerox Corp. | 314,213 | 3,409,211 | |
Common Stocks - continued | |||
Shares | Value | ||
INFORMATION TECHNOLOGY - continued | |||
Semiconductors & Semiconductor Equipment - 2.1% | |||
Applied Materials, Inc. | 1,027,086 | $ 17,275,587 | |
Broadcom Corp. Class A | 578,995 | 17,230,891 | |
Maxim Integrated Products, Inc. | 125,400 | 3,794,604 | |
| 38,301,082 | ||
Software - 2.0% | |||
CA Technologies, Inc. | 238,200 | 7,641,456 | |
Microsoft Corp. | 726,100 | 27,482,885 | |
| 35,124,341 | ||
TOTAL INFORMATION TECHNOLOGY | 209,623,231 | ||
MATERIALS - 0.6% | |||
Chemicals - 0.3% | |||
RPM International, Inc. | 107,968 | 4,283,091 | |
Tronox Ltd. Class A | 23,500 | 516,060 | |
| 4,799,151 | ||
Metals & Mining - 0.3% | |||
Commercial Metals Co. | 236,625 | 4,510,073 | |
Freeport-McMoRan Copper & Gold, Inc. | 12,900 | 418,089 | |
| 4,928,162 | ||
TOTAL MATERIALS | 9,727,313 | ||
TELECOMMUNICATION SERVICES - 3.9% | |||
Diversified Telecommunication Services - 3.9% | |||
AT&T, Inc. | 775,991 | 25,856,020 | |
CenturyLink, Inc. | 371,650 | 10,725,819 | |
Verizon Communications, Inc. | 673,590 | 32,345,792 | |
| 68,927,631 | ||
UTILITIES - 4.9% | |||
Electric Utilities - 4.5% | |||
American Electric Power Co., Inc. | 118,945 | 5,805,705 | |
Duke Energy Corp. | 109,900 | 7,761,138 | |
Exelon Corp. | 100,061 | 2,901,769 | |
FirstEnergy Corp. | 229,867 | 7,238,512 | |
Hawaiian Electric Industries, Inc. (d) | 180,198 | 4,688,752 | |
NextEra Energy, Inc. | 110,716 | 10,178,122 | |
Northeast Utilities | 44,507 | 1,949,407 | |
PPL Corp. | 495,537 | 15,148,566 | |
Common Stocks - continued | |||
Shares | Value | ||
UTILITIES - continued | |||
Electric Utilities - continued | |||
Southern Co. | 468,234 | $ 19,309,970 | |
Xcel Energy, Inc. | 187,900 | 5,432,189 | |
| 80,414,130 | ||
Multi-Utilities - 0.4% | |||
CenterPoint Energy, Inc. | 22,682 | 530,759 | |
Sempra Energy | 61,703 | 5,720,485 | |
| 6,251,244 | ||
TOTAL UTILITIES | 86,665,374 | ||
TOTAL COMMON STOCKS (Cost $1,606,865,909) |
| ||
Money Market Funds - 4.8% | |||
|
|
|
|
Fidelity Cash Central Fund, 0.10% (b) | 82,610,518 | 82,610,518 | |
Fidelity Securities Lending Cash Central Fund, 0.09% (b)(c) | 1,706,400 | 1,706,400 | |
TOTAL MONEY MARKET FUNDS (Cost $84,316,918) |
| ||
TOTAL INVESTMENT PORTFOLIO - 100.4% (Cost $1,691,182,827) | 1,777,062,315 | ||
NET OTHER ASSETS (LIABILITIES) - (0.4)% | (6,289,226) | ||
NET ASSETS - 100% | $ 1,770,773,089 | ||
Written Options | |||||||
Expiration Date/Exercise Price | Number of Contracts | Premium | Value | ||||
Call Options | |||||||
Altria Group, Inc. | 3/22/14 - | 1,732 | $ 66,509 | $ (14,722) | |||
BlackRock, Inc. Class A | 3/22/14 - | 28 | 5,387 | (5,320) | |||
CIT Group, Inc. | 4/19/14 - | 150 | 13,956 | (10,050) | |||
Exxon Mobil Corp. | 4/19/14 - | 1,833 | 152,872 | (68,737) | |||
JPMorgan Chase & Co. | 4/19/14 - | 2,670 | 139,185 | (170,880) | |||
Merck & Co., Inc. | 3/22/14 - | 2,436 | 418,265 | (392,196) | |||
MetLife, Inc. | 4/19/14 - | 3,603 | 120,412 | (151,326) | |||
Stanley Black & Decker, | 4/19/14 - | 498 | 26,095 | (27,390) | |||
Time Warner, Inc. | 3/22/14 - | 926 | 45,837 | (48,615) | |||
United Technologies | 3/22/14 - | 343 | 73,882 | (76,318) | |||
TOTAL WRITTEN OPTIONS | $ 1,062,400 | $ (965,554) | |||||
Legend |
(a) Non-income producing |
(b) Affiliated fund that is generally available only to investment companies and other accounts managed by Fidelity Investments. The rate quoted is the annualized seven-day yield of the fund at period end. A complete unaudited listing of the fund's holdings as of its most recent quarter end is available upon request. In addition, each Fidelity Central Fund's financial statements, which are not covered by the Fund's Report of Independent Registered Public Accounting Firm, are available on the SEC's website or upon request. |
(c) Investment made with cash collateral received from securities on loan. |
(d) Security or a portion of the security is on loan at period end. |
(e) Security or a portion of the security is pledged as collateral for call options written. At period end, the value of securities pledged amounted to $83,473,389. |
Affiliated Central Funds |
Information regarding fiscal year to date income earned by the Fund from investments in Fidelity Central Funds is as follows: |
Fund | Income earned |
Fidelity Cash Central Fund | $ 36,492 |
Fidelity Securities Lending Cash Central Fund | 21,822 |
Total | $ 58,314 |
Other Information |
All investments and derivative instruments are categorized as Level 1 under the Fair Value Hierarchy. The inputs or methodology used for valuing securities may not be an indication of the risk associated with investing in those securities. For more information on valuation inputs, please refer to the Investment Valuation section in the accompanying Notes to Financial Statements. |
Value of Derivative Instruments |
The following table is a summary of the Fund's value of derivative instruments by primary risk exposure as of January 31, 2014. For additional information on derivative instruments, please refer to the Derivative Instruments section in the accompanying Notes to Financial Statements. |
Primary Risk Exposure / | Value | |
| Asset | Liability |
Equity Risk | ||
Written Options (a) | $ - | $ (965,554) |
Total Value of Derivatives | $ - | $ (965,554) |
(a) Gross value is presented in the Statement of Assets and Liabilities in the written options, at value line-item. |
See accompanying notes which are an integral part of the financial statements.
Annual Report
Fidelity Advisor Series Equity-Income Fund
Financial Statements
Statement of Assets and Liabilities
| January 31, 2014 | |
|
|
|
Assets | ||
Investment in securities, at value (including securities loaned of $1,644,464) - See accompanying schedule: Unaffiliated issuers (cost $1,606,865,909) | $ 1,692,745,397 |
|
Fidelity Central Funds (cost $84,316,918) | 84,316,918 |
|
Total Investments (cost $1,691,182,827) |
| $ 1,777,062,315 |
Cash |
| 572,335 |
Receivable for fund shares sold | 190,406 | |
Dividends receivable | 1,843,194 | |
Distributions receivable from Fidelity Central Funds | 4,810 | |
Prepaid expenses | 2,447 | |
Other affiliated receivables | 26,178 | |
Other receivables | 4,572 | |
Total assets | 1,779,706,257 | |
|
|
|
Liabilities | ||
Payable for investments purchased | $ 2,774,680 | |
Payable for fund shares redeemed | 2,446,075 | |
Accrued management fee | 674,361 | |
Written options, at value (premium received $1,062,400) | 965,554 | |
Other affiliated payables | 297,684 | |
Other payables and accrued expenses | 68,414 | |
Collateral on securities loaned, at value | 1,706,400 | |
Total liabilities | 8,933,168 | |
|
|
|
Net Assets | $ 1,770,773,089 | |
Net Assets consist of: |
| |
Paid in capital | $ 1,680,493,649 | |
Undistributed net investment income | 1,691,331 | |
Accumulated undistributed net realized gain (loss) on investments and foreign currency transactions | 2,611,775 | |
Net unrealized appreciation (depreciation) on investments | 85,976,334 | |
Net Assets, for 149,614,240 shares outstanding | $ 1,770,773,089 | |
Net Asset Value, offering price and redemption price per share ($1,770,773,089 ÷ 149,614,240 shares) | $ 11.84 | |
See accompanying notes which are an integral part of the financial statements.
Annual Report
Fidelity Advisor Series Equity-Income Fund
Financial Statements - continued
Statement of Operations
| Year ended January 31, 2014 | |
|
|
|
Investment Income |
|
|
Dividends |
| $ 28,078,290 |
Interest |
| 57 |
Income from Fidelity Central Funds |
| 58,314 |
Total income |
| 28,136,661 |
|
|
|
Expenses | ||
Management fee | $ 4,508,792 | |
Transfer agent fees | 1,808,668 | |
Accounting and security lending fees | 332,341 | |
Custodian fees and expenses | 42,481 | |
Independent trustees' compensation | 4,456 | |
Audit | 60,461 | |
Legal | 2,481 | |
Miscellaneous | 3,091 | |
Total expenses before reductions | 6,762,771 | |
Expense reductions | (17,428) | 6,745,343 |
Net investment income (loss) | 21,391,318 | |
Realized and Unrealized Gain (Loss) Net realized gain (loss) on: | ||
Investment securities: |
|
|
Unaffiliated issuers | 34,762,350 | |
Foreign currency transactions | (378) | |
Written options | 519,359 | |
Total net realized gain (loss) |
| 35,281,331 |
Change in net unrealized appreciation (depreciation) on: Investment securities | 48,550,214 | |
Assets and liabilities in foreign currencies | (70) | |
Written options | 96,846 | |
Total change in net unrealized appreciation (depreciation) |
| 48,646,990 |
Net gain (loss) | 83,928,321 | |
Net increase (decrease) in net assets resulting from operations | $ 105,319,639 | |
See accompanying notes which are an integral part of the financial statements.
Annual Report
Statement of Changes in Net Assets
| Year ended | For the period |
Increase (Decrease) in Net Assets |
|
|
Operations |
|
|
Net investment income (loss) | $ 21,391,318 | $ 2,078,209 |
Net realized gain (loss) | 35,281,331 | 1,717,752 |
Change in net unrealized appreciation (depreciation) | 48,646,990 | 37,329,344 |
Net increase (decrease) in net assets resulting | 105,319,639 | 41,125,305 |
Distributions to shareholders from net investment income | (20,256,597) | (1,147,778) |
Distributions to shareholders from net realized gain | (34,761,129) | - |
Total distributions | (55,017,726) | (1,147,778) |
Share transactions | 1,154,653,492 | 675,225,856 |
Reinvestment of distributions | 55,017,726 | 1,147,778 |
Cost of shares redeemed | (195,212,286) | (10,338,917) |
Net increase (decrease) in net assets resulting from share transactions | 1,014,458,932 | 666,034,717 |
Total increase (decrease) in net assets | 1,064,760,845 | 706,012,244 |
|
|
|
Net Assets | ||
Beginning of period | 706,012,244 | - |
End of period (including undistributed net investment income of $1,691,331 and undistributed net investment income of $899,123, respectively) | $ 1,770,773,089 | $ 706,012,244 |
Other Information Shares | ||
Sold | 94,671,189 | 67,522,485 |
Issued in reinvestment of distributions | 4,606,882 | 114,207 |
Redeemed | (16,287,927) | (1,012,596) |
Net increase (decrease) | 82,990,144 | 66,624,096 |
See accompanying notes which are an integral part of the financial statements.
Annual Report
Financial Highlights
Years ended January 31, | 2014 | 2013 G |
Selected Per-Share Data |
|
|
Net asset value, beginning of period | $ 10.60 | $ 10.00 |
Income from Investment Operations |
|
|
Net investment income (loss)D | .25 | .03 |
Net realized and unrealized gain (loss) | 1.49 | .59 |
Total from investment operations | 1.74 | .62 |
Distributions from net investment income | (.24) | (.02) |
Distributions from net realized gain | (.26) | - |
Total distributions | (.50) | (.02) |
Net asset value, end of period | $ 11.84 | $ 10.60 |
Total Return B,C | 16.44% | 6.18% |
Ratios to Average Net Assets E,H |
|
|
Expenses before reductions | .68% | .75% A |
Expenses net of fee waivers, if any | .68% | .75% A |
Expenses net of all reductions | .68% | .68% A |
Net investment income (loss) | 2.15% | 2.07% A |
Supplemental Data |
|
|
Net assets, end of period (000 omitted) | $ 1,770,773 | $ 706,012 |
Portfolio turnover rate F | 44% | 34% I |
A Annualized
B Total returns for periods of less than one year are not annualized.
C Total returns would have been lower if certain expenses had not been reduced during the applicable periods shown.
D Calculated based on average shares outstanding during the period.
E Fees and expenses of any underlying Fidelity Central Funds are not included in the Fund's expense ratio. The Fund indirectly bears its proportionate share of the expenses of any underlying Fidelity Central Funds.
F Amount does not include the portfolio activity of any underlying Fidelity Central Funds.
G For the period December 6, 2012 (commencement of operations) to January 31, 2013.
H Expense ratios reflect operating expenses of the Fund. Expenses before reductions do not reflect amounts reimbursed by the investment adviser or reductions from brokerage service arrangements or reductions from other expense offset arrangements and do not represent the amount paid by the Fund during periods when reimbursements or reductions occur. Expense ratios before reductions for start-up periods may not be representative of longer term operating periods. Expenses net of fee waivers reflect expenses after reimbursement by the investment adviser but prior to reductions from brokerage service arrangements or other expense offset arrangements. Expenses net of all reductions represent the net expenses paid by the Fund.
I Amount not annualized.
See accompanying notes which are an integral part of the financial statements.
Annual Report
Fidelity Advisor Series Stock Selector Large Cap Value Fund
Investment Changes (Unaudited)
Top Ten Stocks as of January 31, 2014 | ||
| % of fund's | % of fund's net assets |
Chevron Corp. | 4.8 | 6.2 |
Wells Fargo & Co. | 3.4 | 3.7 |
Berkshire Hathaway, Inc. Class B | 3.3 | 3.5 |
General Electric Co. | 3.3 | 2.8 |
Occidental Petroleum Corp. | 2.5 | 2.7 |
Merck & Co., Inc. | 2.1 | 3.0 |
Goldman Sachs Group, Inc. | 2.0 | 0.0 |
U.S. Bancorp | 1.9 | 2.0 |
Cisco Systems, Inc. | 1.9 | 1.2 |
Apple, Inc. | 1.7 | 1.6 |
| 26.9 | |
Top Five Market Sectors as of January 31, 2014 | ||
| % of fund's | % of fund's net assets |
Financials | 26.8 | 28.1 |
Energy | 14.1 | 14.7 |
Health Care | 13.2 | 12.4 |
Industrials | 9.4 | 9.0 |
Information Technology | 8.9 | 8.9 |
Asset Allocation (% of fund's net assets) | |||||||
As of January 31, 2014* | As of July 31, 2013** | ||||||
| Stocks and |
| | Stocks and |
| ||
| Short-Term |
| | Short-Term |
| ||
* Foreign investments | 6.7% |
| ** Foreign investments | 4.8% |
| ||

Annual Report
Fidelity Advisor Series Stock Selector Large Cap Value Fund
Investments January 31, 2014
Showing Percentage of Net Assets
Common Stocks - 95.4% | |||
Shares | Value | ||
CONSUMER DISCRETIONARY - 6.3% | |||
Auto Components - 1.5% | |||
Delphi Automotive PLC | 121,051 | $ 7,370,795 | |
TRW Automotive Holdings Corp. (a) | 127,777 | 9,474,665 | |
| 16,845,460 | ||
Internet & Catalog Retail - 0.4% | |||
Liberty Interactive Corp. Series A (a) | 167,686 | 4,478,893 | |
Media - 2.2% | |||
Comcast Corp. Class A | 183,322 | 9,981,883 | |
Omnicom Group, Inc. | 60,200 | 4,369,316 | |
Twenty-First Century Fox, Inc. Class A | 339,660 | 10,807,981 | |
| 25,159,180 | ||
Multiline Retail - 1.5% | |||
Macy's, Inc. | 137,235 | 7,300,902 | |
Target Corp. | 167,019 | 9,459,956 | |
| 16,760,858 | ||
Specialty Retail - 0.7% | |||
Staples, Inc. | 646,749 | 8,511,217 | |
TOTAL CONSUMER DISCRETIONARY | 71,755,608 | ||
CONSUMER STAPLES - 5.7% | |||
Beverages - 0.3% | |||
Molson Coors Brewing Co. Class B | 72,453 | 3,813,926 | |
Food & Staples Retailing - 1.4% | |||
Wal-Mart Stores, Inc. | 120,386 | 8,990,426 | |
Walgreen Co. | 111,975 | 6,421,766 | |
| 15,412,192 | ||
Food Products - 1.9% | |||
Bunge Ltd. | 91,766 | 6,952,192 | |
Mondelez International, Inc. | 264,443 | 8,660,508 | |
The J.M. Smucker Co. | 65,536 | 6,317,015 | |
| 21,929,715 | ||
Household Products - 1.6% | |||
Procter & Gamble Co. | 232,185 | 17,790,015 | |
Personal Products - 0.5% | |||
Coty, Inc. Class A (d) | 429,510 | 5,794,090 | |
TOTAL CONSUMER STAPLES | 64,739,938 | ||
Common Stocks - continued | |||
Shares | Value | ||
ENERGY - 14.1% | |||
Energy Equipment & Services - 2.5% | |||
Cameron International Corp. (a) | 167,880 | $ 10,067,764 | |
National Oilwell Varco, Inc. | 198,216 | 14,868,182 | |
Rowan Companies PLC (a) | 115,200 | 3,613,824 | |
| 28,549,770 | ||
Oil, Gas & Consumable Fuels - 11.6% | |||
Anadarko Petroleum Corp. | 173,600 | 14,007,784 | |
Apache Corp. | 109,892 | 8,819,932 | |
Chevron Corp. | 492,886 | 55,020,863 | |
Energen Corp. | 106,900 | 7,559,968 | |
Marathon Petroleum Corp. | 205,000 | 17,845,250 | |
Occidental Petroleum Corp. | 323,182 | 28,301,048 | |
| 131,554,845 | ||
TOTAL ENERGY | 160,104,615 | ||
FINANCIALS - 26.8% | |||
Capital Markets - 4.3% | |||
BlackRock, Inc. Class A | 50,119 | 15,059,256 | |
Goldman Sachs Group, Inc. | 139,722 | 22,931,175 | |
State Street Corp. | 165,054 | 11,050,365 | |
| 49,040,796 | ||
Commercial Banks - 8.1% | |||
CIT Group, Inc. | 221,500 | 10,310,825 | |
PNC Financial Services Group, Inc. | 218,900 | 17,485,732 | |
Popular, Inc. (a) | 164,474 | 4,342,114 | |
U.S. Bancorp | 552,708 | 21,959,089 | |
Wells Fargo & Co. | 852,075 | 38,633,081 | |
| 92,730,841 | ||
Consumer Finance - 1.6% | |||
Capital One Financial Corp. | 256,986 | 18,145,781 | |
Diversified Financial Services - 4.2% | |||
Berkshire Hathaway, Inc. Class B (a) | 338,439 | 37,769,792 | |
The NASDAQ Stock Market, Inc. | 268,101 | 10,228,053 | |
| 47,997,845 | ||
Insurance - 6.3% | |||
ACE Ltd. | 157,320 | 14,758,189 | |
AFLAC, Inc. | 167,800 | 10,534,484 | |
Axis Capital Holdings Ltd. | 239,400 | 10,777,788 | |
MetLife, Inc. | 256,951 | 12,603,447 | |
Common Stocks - continued | |||
Shares | Value | ||
FINANCIALS - continued | |||
Insurance - continued | |||
Reinsurance Group of America, Inc. | 136,800 | $ 10,214,856 | |
The Travelers Companies, Inc. | 153,200 | 12,452,096 | |
| 71,340,860 | ||
Real Estate Investment Trusts - 1.4% | |||
Annaly Capital Management, Inc. | 211,100 | 2,273,547 | |
General Growth Properties, Inc. | 223,341 | 4,498,088 | |
The Macerich Co. | 73,079 | 4,136,271 | |
Vornado Realty Trust | 53,702 | 4,931,455 | |
| 15,839,361 | ||
Real Estate Management & Development - 0.9% | |||
CBRE Group, Inc. (a) | 368,371 | 9,776,566 | |
TOTAL FINANCIALS | 304,872,050 | ||
HEALTH CARE - 13.2% | |||
Biotechnology - 0.9% | |||
Amgen, Inc. | 34,738 | 4,132,085 | |
Cubist Pharmaceuticals, Inc. (a) | 88,798 | 6,490,246 | |
Prothena Corp. PLC (a) | 9 | 278 | |
| 10,622,609 | ||
Health Care Equipment & Supplies - 1.4% | |||
Covidien PLC | 136,683 | 9,327,248 | |
St. Jude Medical, Inc. | 106,869 | 6,490,154 | |
| 15,817,402 | ||
Health Care Providers & Services - 4.8% | |||
Express Scripts Holding Co. (a) | 83,437 | 6,231,910 | |
HCA Holdings, Inc. (a) | 244,600 | 12,296,042 | |
McKesson Corp. | 45,439 | 7,925,016 | |
Quest Diagnostics, Inc. | 79,493 | 4,173,383 | |
Team Health Holdings, Inc. (a) | 52,015 | 2,244,967 | |
UnitedHealth Group, Inc. | 243,000 | 17,564,040 | |
WellPoint, Inc. | 52,147 | 4,484,642 | |
| 54,920,000 | ||
Pharmaceuticals - 6.1% | |||
Allergan, Inc. | 7,250 | 830,850 | |
Endo Health Solutions, Inc. (a)(d) | 85,067 | 5,604,214 | |
Jazz Pharmaceuticals PLC (a) | 90,287 | 13,692,926 | |
Johnson & Johnson | 207,205 | 18,331,426 | |
Common Stocks - continued | |||
Shares | Value | ||
HEALTH CARE - continued | |||
Pharmaceuticals - continued | |||
Merck & Co., Inc. | 450,900 | $ 23,884,173 | |
Pfizer, Inc. | 219,338 | 6,667,875 | |
| 69,011,464 | ||
TOTAL HEALTH CARE | 150,371,475 | ||
INDUSTRIALS - 9.4% | |||
Aerospace & Defense - 0.5% | |||
Textron, Inc. | 180,982 | 6,424,861 | |
Air Freight & Logistics - 1.3% | |||
FedEx Corp. | 110,955 | 14,792,521 | |
Commercial Services & Supplies - 0.6% | |||
Waste Management, Inc. | 159,724 | 6,673,269 | |
Construction & Engineering - 1.9% | |||
AECOM Technology Corp. (a) | 348,518 | 9,992,011 | |
URS Corp. | 226,538 | 11,372,208 | |
| 21,364,219 | ||
Electrical Equipment - 0.7% | |||
Babcock & Wilcox Co. | 223,523 | 7,662,368 | |
Industrial Conglomerates - 3.3% | |||
General Electric Co. | 1,485,556 | 37,332,022 | |
Machinery - 0.4% | |||
Caterpillar, Inc. | 24,293 | 2,281,356 | |
Terex Corp. | 51,230 | 2,100,430 | |
| 4,381,786 | ||
Road & Rail - 0.7% | |||
CSX Corp. | 296,661 | 7,983,148 | |
TOTAL INDUSTRIALS | 106,614,194 | ||
INFORMATION TECHNOLOGY - 8.9% | |||
Communications Equipment - 1.9% | |||
Cisco Systems, Inc. | 991,165 | 21,716,425 | |
Computers & Peripherals - 3.1% | |||
Apple, Inc. | 38,558 | 19,302,135 | |
EMC Corp. | 674,703 | 16,354,801 | |
| 35,656,936 | ||
Electronic Equipment & Components - 0.5% | |||
Jabil Circuit, Inc. | 308,221 | 5,538,731 | |
Common Stocks - continued | |||
Shares | Value | ||
INFORMATION TECHNOLOGY - continued | |||
Internet Software & Services - 0.6% | |||
Yahoo!, Inc. (a) | 199,252 | $ 7,177,057 | |
IT Services - 0.4% | |||
Total System Services, Inc. | 162,736 | 4,862,552 | |
Semiconductors & Semiconductor Equipment - 1.4% | |||
Broadcom Corp. Class A | 541,449 | 16,113,522 | |
Software - 1.0% | |||
Oracle Corp. | 209,931 | 7,746,454 | |
Symantec Corp. | 139,295 | 2,982,306 | |
| 10,728,760 | ||
TOTAL INFORMATION TECHNOLOGY | 101,793,983 | ||
MATERIALS - 2.4% | |||
Chemicals - 1.8% | |||
Ashland, Inc. | 48,000 | 4,454,880 | |
Axiall Corp. | 76,794 | 3,064,081 | |
Chemtura Corp. (a) | 87,205 | 2,187,101 | |
Eastman Chemical Co. | 83,700 | 6,525,252 | |
LyondellBasell Industries NV Class A | 58,700 | 4,623,212 | |
| 20,854,526 | ||
Metals & Mining - 0.6% | |||
Freeport-McMoRan Copper & Gold, Inc. | 215,688 | 6,990,448 | |
TOTAL MATERIALS | 27,844,974 | ||
TELECOMMUNICATION SERVICES - 2.3% | |||
Diversified Telecommunication Services - 2.1% | |||
AT&T, Inc. | 461,905 | 15,390,675 | |
CenturyLink, Inc. | 230,603 | 6,655,203 | |
Frontier Communications Corp. (d) | 435,213 | 2,045,501 | |
| 24,091,379 | ||
Wireless Telecommunication Services - 0.2% | |||
NII Holdings, Inc. (a) | 399,898 | 1,203,693 | |
T-Mobile U.S., Inc. (a) | 43,600 | 1,332,852 | |
| 2,536,545 | ||
TOTAL TELECOMMUNICATION SERVICES | 26,627,924 | ||
Common Stocks - continued | |||
Shares | Value | ||
UTILITIES - 6.3% | |||
Electric Utilities - 2.8% | |||
Edison International | 129,000 | $ 6,212,640 | |
ITC Holdings Corp. | 83,970 | 8,690,895 | |
NextEra Energy, Inc. | 124,400 | 11,436,092 | |
Xcel Energy, Inc. | 190,100 | 5,495,791 | |
| 31,835,418 | ||
Gas Utilities - 1.0% | |||
Atmos Energy Corp. | 124,569 | 5,980,558 | |
National Fuel Gas Co. | 71,400 | 5,380,704 | |
| 11,361,262 | ||
Multi-Utilities - 2.5% | |||
Ameren Corp. | 156,700 | 5,929,528 | |
CMS Energy Corp. | 198,400 | 5,513,536 | |
NiSource, Inc. | 237,400 | 8,159,438 | |
Sempra Energy | 98,432 | 9,125,631 | |
| 28,728,133 | ||
TOTAL UTILITIES | 71,924,813 | ||
TOTAL COMMON STOCKS (Cost $974,400,248) |
| ||
U.S. Treasury Obligations - 0.0% | ||||
| Principal Amount |
| ||
U.S. Treasury Bills, yield at date of purchase 0.03% to 0.05% 2/6/14 to 2/27/14 (e) | $ 325,000 |
| ||
Money Market Funds - 6.7% | |||
Shares | Value | ||
Fidelity Cash Central Fund, 0.10% (b) | 67,098,485 | $ 67,098,485 | |
Fidelity Securities Lending Cash Central Fund, 0.09% (b)(c) | 9,710,400 | 9,710,400 | |
TOTAL MONEY MARKET FUNDS (Cost $76,808,885) |
| ||
TOTAL INVESTMENT PORTFOLIO - 102.1% (Cost $1,051,534,130) | 1,163,783,458 | ||
NET OTHER ASSETS (LIABILITIES) - (2.1)% | (24,360,758) | ||
NET ASSETS - 100% | $ 1,139,422,700 | ||
Futures Contracts | |||||
Expiration Date | Underlying Face Amount at Value | Unrealized Appreciation/ | |||
Purchased | |||||
Equity Index Contracts | |||||
122 ICE Russell 1000 Value Index Contracts (United States) | March 2014 | $ 10,851,900 | $ (366,253) | ||
|
The face value of futures purchased as a percentage of net assets is 1% |
Legend |
(a) Non-income producing |
(b) Affiliated fund that is generally available only to investment companies and other accounts managed by Fidelity Investments. The rate quoted is the annualized seven-day yield of the fund at period end. A complete unaudited listing of the fund's holdings as of its most recent quarter end is available upon request. In addition, each Fidelity Central Fund's financial statements, which are not covered by the Fund's Report of Independent Registered Public Accounting Firm, are available on the SEC's website or upon request. |
(c) Investment made with cash collateral received from securities on loan. |
(d) Security or a portion of the security is on loan at period end. |
(e) Security or a portion of the security was pledged to cover margin requirements for futures contracts. At period end, the value of securities pledged amounted to $314,999. |
Affiliated Central Funds |
Information regarding fiscal year to date income earned by the Fund from investments in Fidelity Central Funds is as follows: |
Fund | Income earned |
Fidelity Cash Central Fund | $ 37,577 |
Fidelity Securities Lending Cash Central Fund | 41,918 |
Total | $ 79,495 |
Other Information |
The following is a summary of the inputs used, as of January 31, 2014, involving the Fund's assets and liabilities carried at fair value. The inputs or methodology used for valuing securities may not be an indication of the risk associated with investing in those securities. For more information on valuation inputs, and their aggregation into the levels used in the table below, please refer to the Investment Valuation section in the accompanying Notes to Financial Statements. |
Valuation Inputs at Reporting Date: | ||||
Description | Total | Level 1 | Level 2 | Level 3 |
Investments in Securities: | ||||
Equities: | ||||
Consumer Discretionary | $ 71,755,608 | $ 71,755,608 | $ - | $ - |
Consumer Staples | 64,739,938 | 64,739,938 | - | - |
Energy | 160,104,615 | 160,104,615 | - | - |
Financials | 304,872,050 | 304,872,050 | - | - |
Health Care | 150,371,475 | 150,371,475 | - | - |
Industrials | 106,614,194 | 106,614,194 | - | - |
Information Technology | 101,793,983 | 101,793,983 | - | - |
Materials | 27,844,974 | 27,844,974 | - | - |
Telecommunication Services | 26,627,924 | 26,627,924 | - | - |
Utilities | 71,924,813 | 71,924,813 | - | - |
U.S. Government and Government Agency Obligations | 324,999 | - | 324,999 | - |
Money Market Funds | 76,808,885 | 76,808,885 | - | - |
Total Investments in Securities: | $ 1,163,783,458 | $ 1,163,458,459 | $ 324,999 | $ - |
Derivative Instruments: | ||||
Liabilities | ||||
Futures Contracts | $ (366,253) | $ (366,253) | $ - | $ - |
Value of Derivative Instruments |
The following table is a summary of the Fund's value of derivative instruments by primary risk exposure as of January 31, 2014. For additional information on derivative instruments, please refer to the Derivative Instruments section in the accompanying Notes to Financial Statements. |
Primary Risk Exposure / | Value | |
| Asset | Liability |
Equity Risk | ||
Futures Contracts (a) | $ - | $ (366,253) |
Total Value of Derivatives | $ - | $ (366,253) |
(a) Reflects gross cumulative appreciation (depreciation) on futures contracts as presented in the Schedule of Investments. Only the period end receivable or payable for daily variation margin and net unrealized appreciation (depreciation) are presented in the Statement of Assets and Liabilities. |
See accompanying notes which are an integral part of the financial statements.
Annual Report
Fidelity Advisor Series Stock Selector Large Cap Value Fund
Financial Statements
Statement of Assets and Liabilities
| January 31, 2014 | |
|
|
|
Assets | ||
Investment in securities, at value (including securities loaned of $9,369,686) - See accompanying schedule: Unaffiliated issuers (cost $974,725,245) | $ 1,086,974,573 |
|
Fidelity Central Funds (cost $76,808,885) | 76,808,885 |
|
Total Investments (cost $1,051,534,130) |
| $ 1,163,783,458 |
Cash |
| 53,838 |
Receivable for investments sold | 6,291,527 | |
Receivable for fund shares sold | 126,885 | |
Dividends receivable | 617,363 | |
Distributions receivable from Fidelity Central Funds | 7,251 | |
Prepaid expenses | 2,467 | |
Other receivables | 3,862 | |
Total assets | 1,170,886,651 | |
|
|
|
Liabilities | ||
Payable for investments purchased | $ 19,263,904 | |
Payable for fund shares redeemed | 1,631,489 | |
Accrued management fee | 517,340 | |
Payable for daily variation margin for derivative instruments | 92,720 | |
Other affiliated payables | 190,807 | |
Other payables and accrued expenses | 57,291 | |
Collateral on securities loaned, at value | 9,710,400 | |
Total liabilities | 31,463,951 | |
|
|
|
Net Assets | $ 1,139,422,700 | |
Net Assets consist of: |
| |
Paid in capital | $ 1,017,108,594 | |
Accumulated undistributed net realized gain (loss) on investments | 10,431,031 | |
Net unrealized appreciation (depreciation) on investments | 111,883,075 | |
Net Assets, for 94,397,667 shares outstanding | $ 1,139,422,700 | |
Net Asset Value, offering price and redemption price per share ($1,139,422,700 ÷ 94,397,667 shares) | $ 12.07 | |
See accompanying notes which are an integral part of the financial statements.
Annual Report
Fidelity Advisor Series Stock Selector Large Cap Value Fund
Financial Statements - continued
Statement of Operations
| Year ended January 31, 2014 | |
|
|
|
Investment Income |
|
|
Dividends |
| $ 16,580,647 |
Interest |
| 121 |
Income from Fidelity Central Funds |
| 79,495 |
Total income |
| 16,660,263 |
|
|
|
Expenses | ||
Management fee | $ 4,676,243 | |
Performance adjustment | (20,073) | |
Transfer agent fees | 1,541,996 | |
Accounting and security lending fees | 290,317 | |
Custodian fees and expenses | 61,159 | |
Independent trustees' compensation | 4,081 | |
Audit | 48,987 | |
Legal | 2,492 | |
Miscellaneous | 3,309 | |
Total expenses before reductions | 6,608,511 | |
Expense reductions | (16,750) | 6,591,761 |
Net investment income (loss) | 10,068,502 | |
Realized and Unrealized Gain (Loss) Net realized gain (loss) on: | ||
Investment securities: |
|
|
Unaffiliated issuers | 52,736,208 | |
Futures contracts | 878,659 | |
Total net realized gain (loss) |
| 53,614,867 |
Change in net unrealized appreciation (depreciation) on: Investment securities | 68,414,579 | |
Futures contracts | (366,253) | |
Total change in net unrealized appreciation (depreciation) |
| 68,048,326 |
Net gain (loss) | 121,663,193 | |
Net increase (decrease) in net assets resulting from operations | $ 131,731,695 | |
See accompanying notes which are an integral part of the financial statements.
Annual Report
Statement of Changes in Net Assets
| Year ended | For the period |
Increase (Decrease) in Net Assets |
|
|
Operations |
|
|
Net investment income (loss) | $ 10,068,502 | $ 1,267,206 |
Net realized gain (loss) | 53,614,867 | 3,887,443 |
Change in net unrealized appreciation (depreciation) | 68,048,326 | 43,834,749 |
Net increase (decrease) in net assets resulting | 131,731,695 | 48,989,398 |
Distributions to shareholders from net investment income | (10,491,891) | (1,011,826) |
Distributions to shareholders from net realized gain | (46,903,270) | - |
Total distributions | (57,395,161) | (1,011,826) |
Share transactions | 439,014,862 | 674,612,777 |
Reinvestment of distributions | 57,395,161 | 1,011,826 |
Cost of shares redeemed | (143,884,461) | (11,041,571) |
Net increase (decrease) in net assets resulting from share transactions | 352,525,562 | 664,583,032 |
Total increase (decrease) in net assets | 426,862,096 | 712,560,604 |
|
|
|
Net Assets | ||
Beginning of period | 712,560,604 | - |
End of period (including undistributed net investment income of $0 and undistributed net investment income of $266,102, respectively) | $ 1,139,422,700 | $ 712,560,604 |
Other Information Shares | ||
Sold | 35,128,957 | 67,461,144 |
Issued in reinvestment of distributions | 4,708,092 | 100,579 |
Redeemed | (11,927,963) | (1,073,142) |
Net increase (decrease) | 27,909,086 | 66,488,581 |
See accompanying notes which are an integral part of the financial statements.
Annual Report
Financial Highlights
Years ended January 31, | 2014 | 2013 G |
Selected Per-Share Data |
|
|
Net asset value, beginning of period | $ 10.72 | $ 10.00 |
Income from Investment Operations |
|
|
Net investment income (loss) D | .14 | .02 |
Net realized and unrealized gain (loss) | 1.88 | .72 |
Total from investment operations | 2.02 | .74 |
Distributions from net investment income | (.12) | (.02) |
Distributions from net realized gain | (.55) | - |
Total distributions | (.67) | (.02) |
Net asset value, end of period | $ 12.07 | $ 10.72 |
Total Return B,C | 18.79% | 7.36% |
Ratios to Average Net Assets E,H |
|
|
Expenses before reductions | .78% | .85% A |
Expenses net of fee waivers, if any | .78% | .85% A |
Expenses net of all reductions | .78% | .77% A |
Net investment income (loss) | 1.19% | 1.25% A |
Supplemental Data |
|
|
Net assets, end of period (000 omitted) | $ 1,139,423 | $ 712,561 |
Portfolio turnover rate F | 61% | 48% I |
A Annualized
B Total returns for periods of less than one year are not annualized.
C Total returns would have been lower if certain expenses had not been reduced during the applicable periods shown.
D Calculated based on average shares outstanding during the period.
E Fees and expenses of any underlying Fidelity Central Funds are not included in the Fund's expense ratio. The Fund indirectly bears its proportionate share of the expenses of any underlying Fidelity Central Funds.
F Amount does not include the portfolio activity of any underlying Fidelity Central Funds.
G For the period December 6, 2012 (commencement of operations) to January 31, 2013.
H Expense ratios reflect operating expenses of the Fund. Expenses before reductions do not reflect amounts reimbursed by the investment adviser or reductions from brokerage service arrangements or reductions from other expense offset arrangements and do not represent the amount paid by the Fund during periods when reimbursements or reductions occur. Expense ratios before reductions for start-up periods may not be representative of longer term operating periods. Expenses net of fee waivers reflect expenses after reimbursement by the investment adviser but prior to reductions from brokerage service arrangements or other expense offset arrangements. Expenses net of all reductions represent the net expenses paid by the Fund.
I Amount not annualized.
See accompanying notes which are an integral part of the financial statements.
Annual Report
Notes to Financial Statements
For the period ended January 31, 2014
1. Organization.
Fidelity Advisor Series Equity-Income Fund and Fidelity Advisor Series Stock Selector Large Cap Value Fund (the Funds) are funds of Fidelity Devonshire Trust (the Trust). The Trust is registered under the Investment Company Act of 1940, as amended (the 1940 Act), as an open-end management investment company organized as a Massachusetts business trust. Each Fund is authorized to issue an unlimited number of shares. Shares of the Funds are only available for purchase by mutual funds for which Fidelity Management & Research Company (FMR) or an affiliate serves as an investment manager.
2. Investments in Fidelity Central Funds.
The Funds invest in Fidelity Central Funds, which are open-end investment companies generally available only to other investment companies and accounts managed by the investment adviser and its affiliates. The Funds' Schedules of Investments list each of the Fidelity Central Funds held as of period end, if any, as an investment of each Fund, but do not include the underlying holdings of each Fidelity Central Fund. As an Investing Fund, each Fund indirectly bears its proportionate share of the expenses of the underlying Fidelity Central Funds.
The Money Market Central Funds seek preservation of capital and current income and are managed by Fidelity Investments Money Management, Inc. (FIMM), an affiliate of the investment adviser. Annualized expenses of the Money Market Central Funds as of their most recent shareholder report date are less than .01%.
A complete unaudited list of holdings for each Fidelity Central Fund is available upon request or at the Securities and Exchange Commission (the SEC) website at www.sec.gov. In addition, the financial statements of the Fidelity Central Funds, which are not covered by the Funds' Report of Independent Registered Public Accounting Firm, are available on the SEC website or upon request.
3. Significant Accounting Policies.
The financial statements have been prepared in conformity with accounting principles generally accepted in the United States of America (GAAP), which require management to make certain estimates and assumptions at the date of the financial statements. Actual results could differ from those estimates. Subsequent events, if any, through the date that the financial statements were issued have been evaluated in the preparation of the financial statements. The following summarizes the significant accounting policies of the Funds:
Investment Valuation. Investments are valued as of 4:00 p.m. Eastern time on the last calendar day of the period. In accordance with valuation policies and procedures
Annual Report
3. Significant Accounting Policies - continued
Investment Valuation - continued
approved by the Board of Trustees (the Board), each Fund attempts to obtain prices from one or more third party pricing vendors or brokers to value its investments. When current market prices, quotations or currency exchange rates are not readily available or reliable, investments will be fair valued in good faith by the FMR Fair Value Committee (the Committee), in accordance with procedures adopted by the Board. Factors used in determining fair value vary by investment type and may include market or investment specific events, changes in interest rates and credit quality. The frequency with which these procedures are used cannot be predicted and they may be utilized to a significant extent. The Committee oversees each Fund's valuation policies and procedures and is responsible for approving and reporting to the Board all fair value determinations.
Each Fund categorizes the inputs to valuation techniques used to value their investments into a disclosure hierarchy consisting of three levels as shown below:
Level 1 - quoted prices in active markets for identical investments
Level 2 - other significant observable inputs (including quoted prices for similar investments, interest rates, prepayment speeds, etc.)
Level 3 - unobservable inputs (including the Fund's own assumptions based on the best information available)
Valuation techniques used to value each Fund's investments by major category are as follows:
Equity securities, including restricted securities, for which market quotations are readily available, are valued at the last reported sale price or official closing price as reported by a third party pricing vendor on the primary market or exchange on which they are traded and are categorized as Level 1 in the hierarchy. In the event there were no sales during the day or closing prices are not available, securities are valued at the last quoted bid price or may be valued using the last available price and are generally categorized as Level 2 in the hierarchy. For foreign equity securities, when market or security specific events arise, comparisons to the valuation of American Depositary Receipts (ADRs), futures contracts, Exchange-Traded Funds (ETFs) and certain indexes as well as quoted prices for similar securities may be used and would be categorized as Level 2 in the hierarchy. Utilizing these techniques may result in transfers between Level 1 and Level 2. For equity securities, including restricted securities, where observable inputs are limited, assumptions about market activity and risk are used and these securities may be categorized as Level 3 in the hierarchy.
Annual Report
Notes to Financial Statements - continued
3. Significant Accounting Policies - continued
Investment Valuation - continued
Debt securities, including restricted securities, are valued based on evaluated prices received from third party pricing vendors or from brokers who make markets in such securities. U.S. government and government agency obligations are valued by pricing vendors who utilize matrix pricing which considers yield or price of bonds of comparable quality, coupon, maturity and type or by broker-supplied prices. When independent prices are unavailable or unreliable, debt securities may be valued utilizing pricing methodologies which consider similar factors that would be used by third party pricing vendors. Debt securities are generally categorized as Level 2 in the hierarchy but may be Level 3 depending on the circumstances.
Futures contracts are valued at the settlement price established each day by the board of trade or exchange on which they are traded and are categorized as Level 1 in the hierarchy. Exchange-traded options are valued using the last sale price or, in the absence of a sale, the last offering price and are categorized as Level 1 in the hierarchy. Investments in open-end mutual funds, including the Fidelity Central Funds, are valued at their closing net asset value (NAV) each business day and are categorized as Level 1 in the hierarchy.
Changes in valuation techniques may result in transfers in or out of an assigned level within the disclosure hierarchy. The aggregate value of investments by input level, as of January 31, 2014 is included at the end of each applicable Fund's Schedule of Investments.
Foreign Currency. The Funds may use foreign currency contracts to facilitate transactions in foreign-denominated securities. Gains and losses from these transactions may arise from changes in the value of the foreign currency or if the counterparties do not perform under the contracts' terms.
Foreign-denominated assets, including investment securities, and liabilities are translated into U.S. dollars at the exchange rates at period end. Purchases and sales of investment securities, income and dividends received and expenses denominated in foreign currencies are translated into U.S. dollars at the exchange rate in effect on the transaction date.
The effects of exchange rate fluctuations on investments are included with the net realized and unrealized gain (loss) on investment securities. Other foreign currency transactions resulting in realized and unrealized gain (loss) are disclosed separately.
Investment Transactions and Income. For financial reporting purposes, the Funds' investment holdings and NAV include trades executed through the end of the last business day of the period. The NAV per share for processing shareholder transactions is
Annual Report
3. Significant Accounting Policies - continued
Investment Transactions and Income - continued
calculated as of the close of business of the New York Stock Exchange (NYSE), normally 4:00 p.m. Eastern time and includes trades executed through the end of the prior business day. Gains and losses on securities sold are determined on the basis of identified cost. Dividend income is recorded on the ex-dividend date, except for certain dividends from foreign securities where the ex-dividend date may have passed, which are recorded as soon as the Funds are informed of the ex-dividend date. Non-cash dividends included in dividend income, if any, are recorded at the fair market value of the securities received. Distributions received on securities that represent a return of capital or capital gain are recorded as a reduction of cost of investments and/or as a realized gain. Subsequent to ex-dividend date the Funds determine the components of these distributions, based upon receipt of tax filings or other correspondence relating to the underlying investment. Interest income and distributions from the Fidelity Central Funds are accrued as earned. Interest income includes coupon interest and amortization of premium and accretion of discount on debt securities. Investment income is recorded net of foreign taxes withheld where recovery of such taxes is uncertain.
Expenses. Expenses directly attributable to a fund are charged to that fund. Expenses attributable to more than one fund are allocated among the respective funds on the basis of relative net assets or other appropriate methods. Expense estimates are accrued in the period to which they relate and adjustments are made when actual amounts are known.
Income Tax Information and Distributions to Shareholders. Each year, each Fund intends to qualify as a regulated investment company under Subchapter M of the Internal Revenue Code, including distributing substantially all of its taxable income and realized gains. As a result, no provision for U.S. Federal income taxes is required. As of January 31, 2014, each Fund did not have any unrecognized tax benefits in the financial statements; nor is each Fund aware of any tax positions for which it is reasonably possible that the total amounts of unrecognized tax benefits will significantly change in the next twelve months. Each Fund files a U.S. federal tax return, in addition to state and local tax returns as required. The Funds' federal income tax returns are subject to examination by the Internal Revenue Service (IRS) for a period of three fiscal years after they are filed. State and local tax returns may be subject to examination for an additional fiscal year depending on the jurisdiction. Foreign taxes are provided for based on each Fund's understanding of the tax rules and rates that exist in the foreign markets in which it invests.
Distributions are declared and recorded on the ex-dividend date. Income and capital gain distributions are determined in accordance with income tax regulations, which may differ from GAAP.
Annual Report
Notes to Financial Statements - continued
3. Significant Accounting Policies - continued
Income Tax Information and Distributions to Shareholders - continued
Capital accounts within the financial statements are adjusted for permanent book-tax differences. These adjustments have no impact on net assets or the results of operations. Capital accounts are not adjusted for temporary book-tax differences which will reverse in a subsequent period.
Book-tax differences are primarily due to futures contracts, passive foreign investment companies (PFIC), foreign currency transactions, market discount, partnerships and losses deferred due to wash sales.
The federal tax cost of investment securities and unrealized appreciation (depreciation) as of period end were as follows for each Fund:
| Tax cost | Gross unrealized | Gross unrealized | Net unrealized |
Fidelity Advisor Series Equity-Income Fund | $ 1,692,204,276 | $ 133,537,630 | $ (48,679,591) | $ 84,858,039 |
Fidelity Advisor Series Stock Selector Large Cap Value Fund | 1,051,932,227 | 135,689,448 | (23,838,217) | 111,851,231 |
The tax-based components of distributable earnings as of period end were as follows for each Fund:
| Undistributed | Undistributed long-term | Net unrealized appreciation |
Fidelity Advisor Series Equity-Income Fund | $ 4,277,718 | $ 1,046,837 | $ 84,954,885 |
Fidelity Advisor Series Stock Selector Large Cap Value Fund | 8,153,598 | 2,309,276 | 111,851,231 |
The tax character of distributions paid was as follows:
January 31, 2014 |
|
|
|
| Ordinary | Long-term | Total |
Fidelity Advisor Series Equity-Income Fund | $ 54,730,839 | $ 286,887 | $ 55,017,726 |
Fidelity Advisor Series Stock Selector Large Cap Value Fund | 56,953,452 | 441,709 | 57,395,161 |
Annual Report
3. Significant Accounting Policies - continued
Income Tax Information and Distributions to Shareholders - continued
January 31, 2013 |
|
| Ordinary Income |
Fidelity Advisor Series Equity-Income Fund | $ 1,147,778 |
Fidelity Advisor Series Stock Selector Large Cap Value Fund | 1,011,826 |
4. Derivative Instruments.
Risk Exposures and the Use of Derivative Instruments. The Funds' investment objective allows the Funds to enter into various types of derivative contracts, including futures contracts and options. Derivatives are investments whose value is primarily derived from underlying assets, indices or reference rates and may be transacted on an exchange or over-the-counter (OTC). Derivatives may involve a future commitment to buy or sell a specified asset based on specified terms, to exchange future cash flows at periodic intervals based on a notional principal amount, or for one party to make one or more payments upon the occurrence of specified events in exchange for periodic payments from the other party.
The Funds used derivatives to increase returns and to manage exposure to certain risks as defined below. The success of any strategy involving derivatives depends on analysis of numerous economic factors, and if the strategies for investment do not work as intended, the Funds may not achieve their objectives.
The Funds' use of derivatives increased or decreased their exposure to the following risk:
Equity Risk | Equity risk relates to the fluctuations in the value of financial instruments as a result of changes in market prices (other than those arising from interest rate risk or foreign exchange risk), whether caused by factors specific to an individual investment, its issuer, or all factors affecting all instruments traded in a market or market segment. |
The Funds are also exposed to additional risks from investing in derivatives, such as liquidity risk and counterparty credit risk. Liquidity risk is the risk that the Funds will be unable to close out the derivative in the open market in a timely manner. Counterparty credit risk is the risk that the counterparty will not be able to fulfill its obligation to the Funds. Counterparty credit risk related to exchange-traded futures contracts and exchange-traded options may be mitigated by the protection provided by the exchange on which they trade.
Investing in derivatives may involve greater risks than investing in the underlying assets directly and, to varying degrees, may involve risk of loss in excess of any initial investment and collateral received and amounts recognized in the Statement of Assets and
Annual Report
Notes to Financial Statements - continued
4. Derivative Instruments - continued
Risk Exposures and the Use of Derivative Instruments - continued
Liabilities. In addition, there may be the risk that the change in value of the derivative contract does not correspond to the change in value of the underlying instrument.
Net Realized Gain (Loss) and Change in Net Unrealized Appreciation (Depreciation) on Derivatives. The table below, which reflects the impacts of derivatives on the financial performance of the Funds, summarizes the net realized gain (loss) and change in net unrealized appreciation (depreciation) for derivatives during the period as presented in the Statement of Operations.
Primary Risk Exposure / Derivative Type | Net Realized Gain | Change in Net |
Fidelity Advisor Series Equity-Income Fund |
|
|
Equity Risk |
|
|
Written Options (a) | 519,359 | 96,846 |
Fidelity Advisor Series Stock Selector Large Cap Value Fund |
|
|
Equity Risk |
|
|
Futures Contracts (a) | 878,659 | (366,253) |
(a) A summary of the value of derivatives by primary risk exposure as of period end is included at the end of the Schedule of Investments
Futures Contracts. A futures contract is an agreement between two parties to buy or sell a specified underlying instrument for a fixed price at a specified future date. Fidelity Advisor Series Stock Selector Large Cap Value Fund used futures contracts to manage its exposure to the stock market.
Upon entering into a futures contract, a fund is required to deposit either cash or securities (initial margin) with a clearing broker in an amount equal to a certain percentage of the face value of the contract. Futures contracts are marked-to-market daily and subsequent daily payments (variation margin) are made or received by a fund depending on the daily fluctuations in the value of the futures contracts and are recorded as unrealized appreciation or (depreciation). This receivable and/or payable, if any, is included in daily variation margin for derivative instruments in the Statement of Assets and Liabilities. Realized gain or (loss) is recorded upon the expiration or closing of a futures contract. The net realized gain (loss) and change in net unrealized appreciation (depreciation) on futures contracts during the period is included in the Statement of Operations.
Any open futures contracts at period end are presented in the Schedule of Investments under the caption "Futures Contracts." The underlying face amount at value reflects each contract's exposure to the underlying instrument or index at period end and is
Annual Report
4. Derivative Instruments - continued
Futures Contracts - continued
representative of volume of activity during the period. Securities deposited to meet initial margin requirements are identified in the Schedule of Investments.
Options. Options give the purchaser the right, but not the obligation, to buy (call) or sell (put) an underlying security or financial instrument at an agreed exercise or strike price between or on certain dates. Options obligate the seller (writer) to buy (put) or sell (call) an underlying instrument at the exercise or strike price or cash settle an underlying derivative instrument if the holder exercises the option on or before the expiration date.
Fidelity Advisor Series Equity-Income Fund (the Fund) used exchange-traded written covered call options to manage its exposure to the market. When the Fund writes a covered call option, the Fund holds the underlying instrument which must be delivered to the holder upon the exercise of the option.
Upon entering into a written options contract, the Fund will receive a premium. Premiums received are reflected as a liability on the Statement of Assets and Liabilities. Options are valued daily and any unrealized appreciation (depreciation) is reflected on the Statement of Assets and Liabilities. When a written option is exercised, the premium is added to the proceeds from the sale of the underlying instrument in determining the gain or loss realized on that investment. When an option is closed the Fund will realize a gain or loss depending on whether the proceeds or amount paid for the closing sale transaction are greater or less than the premium received. When an option expires, gains and losses are realized to the extent of premiums received. The net realized gain (loss) on closed and expired written options and the change in net unrealized appreciation (depreciation) on written options are reflected separately on the Statement of Operations.
Writing call options tends to decrease exposure to the underlying instrument and risk of loss is the change in value in excess of the premium received.
Any open options at period end are presented in the Schedule of Investments under the caption "Written Options" and are representative of volume of activity during the period.
Annual Report
Notes to Financial Statements - continued
4. Derivative Instruments - continued
Options - continued
The following is a summary of the Fund's written options activity:
Written Options | Number of Contracts | Amount of Premiums |
Outstanding at beginning of period | - | $ - |
Options Opened | 34,255 | 2,392,248 |
Options Exercised | (12,573) | (764,763) |
Options Closed | (4,812) | (262,822) |
Options Expired | (2,651) | (302,263) |
Outstanding at end of period | 14,219 | $ 1,062,400 |
5. Purchases and Sales of Investments.
Purchases and sales of securities, including in-kind transactions for Fidelity Advisor Series Equity-Income Fund, other than short-term securities, are noted in the table below.
| Purchases ($) | Sales ($) |
Fidelity Advisor Series Equity-Income Fund | 1,347,841,871 | 432,865,465 |
Fidelity Advisor Series Stock Selector Large Cap Value Fund | 767,204,640 | 501,052,714 |
6. Fees and Other Transactions with Affiliates.
Management Fee. Fidelity Management & Research Company and its affiliates provide the Funds with investment management related services for which the Funds pay a monthly management fee. The management fee is the sum of an individual fund fee rate and an annualized group fee rate. The individual fund fee rate is applied to each Fund's average net assets. The group fee rate is based upon the average net assets of all the mutual funds advised by the investment adviser, including any mutual funds previously advised by the investment adviser that are currently advised by Fidelity SelectCo, LLC, an affiliate of the investment adviser. The group fee rate decreases as assets under management increase and increases as assets under management decrease. In addition, the management fee for Fidelity Advisor Series Stock Selector Large Cap Value Fund is subject to a performance adjustment (up to a maximum of ± .20% of each applicable Fund's average net assets over a 36 month performance period.) The upward or downward adjustment to the management fee is based on Fidelity Advisor Series Stock Selector Large Cap Value Fund's relative investment performance as compared to its benchmark index over the same 36 month performance period. Fidelity Advisor Series Stock Selector Large Cap Value Fund's performance adjustment took effect in December 2013. Subsequent months will be added until the performance period includes 36 months. For the reporting period, each Fund's annual management fee rate expressed as
Annual Report
6. Fees and Other Transactions with Affiliates - continued
Management Fee - continued
a percentage of each Fund's average net assets, including the performance adjustment, if applicable was as follows. The performance adjustment included in the management fee rate may be higher or lower than the maximum performance adjustment rate due to the difference between the average net asset for the reporting and performance periods.
| Individual Rate | Group Rate | Total |
Fidelity Advisor Series Equity-Income Fund | .20% | .25% | .45% |
Fidelity Advisor Series Stock Selector Large Cap Value Fund | .30% | .25% | .55% |
Fund Name | Performance Benchmark | ||
Fidelity Advisor Series Stock Selector Large Cap Value Fund | Russell 1000 Value Index | ||
Transfer Agent Fees. Fidelity Investments Institutional Operations Company, Inc. (FIIOC), an affiliate of the investment adviser, is the Funds' transfer, dividend disbursing and shareholder servicing agent. FIIOC receives account fees and asset-based fees that vary according to account size and type of account. FIIOC pays for typesetting, printing and mailing of shareholder reports, except proxy statements. For the period, transfer agent fees were equivalent to the following annual rates expressed as a percentage of average net assets:
Fidelity Advisor Series Equity-Income Fund | .18% |
Fidelity Advisor Series Stock Selector Large Cap Value Fund | .18% |
Accounting and Security Lending Fees. Fidelity Service Company, Inc. (FSC), an affiliate of the investment adviser, maintains each Fund's accounting records. The accounting fee is based on the level of average net assets for each month. Under a separate contract, FSC administers the security lending program. The security lending fee is based on the number and duration of lending transactions.
Brokerage Commissions. Certain Funds placed a portion of their portfolio transactions with brokerage firms which are affiliates of the investment adviser. Brokerage commissions are included in net realized gain (loss) and change in net unrealized appreciation (depreciation) in the Statement of Operations. The commissions paid to these affiliated firms were as follows:
| Amount |
Fidelity Advisor Series Equity-Income Fund | $ 17,112 |
Fidelity Advisor Series Stock Selector Large Cap Value Fund | 16,636 |
Annual Report
Notes to Financial Statements - continued
6. Fees and Other Transactions with Affiliates - continued
Exchanges In-Kind. During the period, certain investment companies managed by the investment adviser or its affiliates (Investing Funds) completed exchanges in-kind with the Fund. The Investing Funds delivered securities and other assets, including accrued interest, valued at $418,714,861 in exchange for 34,152,925 shares of the Fund. The amount of in-kind exchanges is included in share transactions in the accompanying Statement of Changes in Net Assets. The Fund recognized no gain or loss for federal income tax purposes.
7. Committed Line of Credit.
Certain Funds participate with other funds managed by the investment adviser or an affiliate in a $4.25 billion credit facility (the "line of credit") to be utilized for temporary or emergency purposes to fund shareholder redemptions or for other short-term liquidity purposes. The participating funds have agreed to pay commitment fees on their pro-rata portion of the line of credit, which are reflected in Miscellaneous expenses on the Statement of Operations, and are as follows:
Fidelity Advisor Series Equity-Income Fund | $ 806 |
Fidelity Advisor Series Stock Selector Large Cap Value Fund | 810 |
During the period, there were no borrowings on this line of credit.
8. Security Lending.
Certain Funds lend portfolio securities through a lending agent from time to time in order to earn additional income. For equity securities, a lending agent is used and may loan securities to certain qualified borrowers, including Fidelity Capital Markets (FCM), a broker-dealer affiliated with the Funds. On the settlement date of the loan, each applicable Fund receives collateral (in the form of U.S. Treasury obligations, letters of credit and/or cash) against the loaned securities and maintains collateral in an amount not less than 100% of the market value of the loaned securities during the period of the loan. The market value of the loaned securities is determined at the close of business of the Funds and any additional required collateral is delivered to the Funds on the next business day. If the borrower defaults on its obligation to return the securities loaned because of insolvency or other reasons, the Funds may apply collateral received from the borrower against the obligation. The Funds may experience delays and costs in recovering the securities loaned. Any cash collateral received is invested in the Fidelity Securities Lending Cash Central Fund. The value of loaned securities and cash collateral at period end are disclosed on each applicable Fund's Statement of Assets and Liabilities. Security lending income represents the income earned on investing cash collateral, less rebates paid to borrowers and any lending agent fees associated with the loan, plus any
Annual Report
8. Security Lending - continued
premium payments received for lending certain types of securities. Security lending income is presented on each applicable Fund's Statement of Operations as a component of income from Fidelity Central Funds. Security lending activity was as follows:
| Total Security Lending | Security Lending | Value of |
Fidelity Advisor Series Equity-Income Fund | $ 21,822 | $ - | $ - |
Fidelity Advisor Series Stock Selector Large Cap Value Fund | $ 41,918 | $ 26,977 | $ 2,014,837 |
9. Expense Reductions.
Commissions paid to certain brokers with whom the investment adviser, or its affiliates, places trades on behalf of Certain Funds include an amount in addition to trade execution, which may be rebated back to the Funds to offset certain expenses. In addition, through arrangements with each applicable Fund's custodian, credits realized as a result of uninvested cash balances were used to reduce each applicable Fund's expenses. All of the applicable expense reductions are noted in the table below.
| Brokerage Service | Custody |
Fidelity Advisor Series Equity-Income Fund | $ 17,414 | $ 14 |
Fidelity Advisor Series Stock Selector Large Cap Value Fund | 16,750 | - |
10. Other.
The Funds' organizational documents provide former and current trustees and officers with a limited indemnification against liabilities arising in connection with the performance of their duties to the Funds. In the normal course of business, the Funds may also enter into contracts that provide general indemnifications. The Funds' maximum exposure under these arrangements is unknown as this would be dependent on future claims that may be made against the Funds. The risk of material loss from such claims is considered remote.
At the end of the period, mutual funds managed by the investment adviser or its affiliates were the owners of record of all of the outstanding shares of the Funds.
Annual Report
Report of Independent Registered Public Accounting Firm
To the Trustees of Fidelity Devonshire Trust and the Shareholders of Fidelity Advisor Series Equity-Income Fund:
We have audited the accompanying statement of assets and liabilities of Fidelity Advisor Series Equity-Income Fund (the Fund), a fund of Fidelity Devonshire Trust, including the schedule of investments, as of January 31, 2014, and the related statement of operations for the year then ended and the statements of changes in net assets and the financial highlights for the periods presented. These financial statements and financial highlights are the responsibility of the Fund's management. Our responsibility is to express an opinion on these financial statements and financial highlights based on our audits.
We conducted our audits in accordance with the standards of the Public Company Accounting Oversight Board (United States). Those standards require that we plan and perform the audit to obtain reasonable assurance about whether the financial statements and financial highlights are free of material misstatement. The Fund is not required to have, nor were we engaged to perform, an audit of its internal control over financial reporting. Our audits included consideration of internal control over financial reporting as a basis for designing audit procedures that are appropriate in the circumstances, but not for the purpose of expressing an opinion on the effectiveness of the Fund's internal control over financial reporting. Accordingly, we express no such opinion. An audit also includes examining, on a test basis, evidence supporting the amounts and disclosures in the financial statements, assessing the accounting principles used and significant estimates made by management, as well as evaluating the overall financial statement presentation. Our procedures included confirmation of securities owned as of January 31, 2014, by correspondence with the custodians and brokers; where replies were not received from brokers, we performed other auditing procedures. We believe that our audits provide a reasonable basis for our opinion.
In our opinion, the financial statements and financial highlights referred to above present fairly, in all material respects, the financial position of Fidelity Advisor Series Equity-Income Fund as of January 31, 2014, the results of its operations for the year then ended and the changes in its net assets and the financial highlights for the periods presented, in conformity with accounting principles generally accepted in the United States of America.
DELOITTE & TOUCHE LLP
Boston, Massachusetts
March 18, 2014
Annual Report
Report of Independent Registered Public Accounting Firm
To the Trustees of Fidelity Devonshire Trust and the Shareholders of Fidelity Advisor Series Stock Selector Large Cap Value Fund:
In our opinion, the accompanying statement of assets and liabilities, including the schedule of investments, and the related statements of operations and of changes in net assets and the financial highlights present fairly, in all material respects, the financial position of Fidelity Advisor Series Stock Selector Large Cap Value Fund (a fund of Fidelity Devonshire Trust) at January 31, 2014, the results of its operations for the year then ended, the changes in its net assets for each of the periods indicated and the financial highlights for each of the periods indicated, in conformity with accounting principles generally accepted in the United States of America. These financial statements and financial highlights (hereafter referred to as "financial statements") are the responsibility of the Fidelity Advisor Series Stock Selector Large Cap Value Fund's management. Our responsibility is to express an opinion on these financial statements based on our audits. We conducted our audits of these financial statements in accordance with the standards of the Public Company Accounting Oversight Board (United States). Those standards require that we plan and perform the audit to obtain reasonable assurance about whether the financial statements are free of material misstatement. An audit includes examining, on a test basis, evidence supporting the amounts and disclosures in the financial statements, assessing the accounting principles used and significant estimates made by management, and evaluating the overall financial statement presentation. We believe that our audits, which included confirmation of securities at January 31, 2014 by correspondence with the custodian and brokers, provide a reasonable basis for our opinion.
PricewaterhouseCoopers LLP
Boston, Massachusetts
March 18, 2014
Annual Report
Trustees and Officers
The Trustees, Member of the Advisory Board, and officers of the trust and funds, as applicable, are listed below. The Board of Trustees governs each fund and is responsible for protecting the interests of shareholders. The Trustees are experienced executives who meet periodically throughout the year to oversee each fund's activities, review contractual arrangements with companies that provide services to each fund, oversee management of the risks associated with such activities and contractual arrangements, and review each fund's performance. Except for James C. Curvey, Ned C. Lautenbach, and William S. Stavropoulos, each of the Trustees oversees 173 funds. Mr. Curvey oversees 396 funds. Mr. Lautenbach and Mr. Stavropoulos each oversees 247 funds.
The Trustees hold office without limit in time except that (a) any Trustee may resign; (b) any Trustee may be removed by written instrument, signed by at least two-thirds of the number of Trustees prior to such removal; (c) any Trustee who requests to be retired or who has become incapacitated by illness or injury may be retired by written instrument signed by a majority of the other Trustees; and (d) any Trustee may be removed at any special meeting of shareholders by a two-thirds vote of the outstanding voting securities of the trust. Each Trustee who is not an interested person (as defined in the 1940 Act) of the trust and the funds (Independent Trustee), shall retire not later than the last day of the calendar year in which his or her 75th birthday occurs. The Independent Trustees may waive this mandatory retirement age policy with respect to individual Trustees. The officers and Advisory Board Member hold office without limit in time, except that any officer and Advisory Board Member may resign or may be removed by a vote of a majority of the Trustees at any regular meeting or any special meeting of the Trustees. Except as indicated, each individual has held the office shown or other offices in the same company for the past five years.
Experience, Skills, Attributes, and Qualifications of the Funds' Trustees. The Governance and Nominating Committee has adopted a statement of policy that describes the experience, qualifications, attributes, and skills that are necessary and desirable for potential Independent Trustee candidates (Statement of Policy). The Board believes that each Trustee satisfied at the time he or she was initially elected or appointed a Trustee, and continues to satisfy, the standards contemplated by the Statement of Policy. The Governance and Nominating Committee also engages professional search firms to help identify potential Independent Trustee candidates who have the experience, qualifications, attributes, and skills consistent with the Statement of Policy. From time to time, additional criteria based on the composition and skills of the current Independent Trustees, as well as experience or skills that may be appropriate in light of future changes to board composition, business conditions, and regulatory or other developments, have also been considered by the professional search firms and the Governance and Nominating Committee. In addition, the Board takes into account the Trustees' commitment and participation in Board and committee meetings, as well as their leadership of standing and ad hoc committees throughout their tenure.
In determining that a particular Trustee was and continues to be qualified to serve as a Trustee, the Board has considered a variety of criteria, none of which, in isolation, was controlling. The Board believes that, collectively, the Trustees have balanced and diverse experience, qualifications, attributes, and skills, which allow the Board to operate effectively in governing each fund and protecting the interests of shareholders. Information about the specific experience, skills, attributes, and qualifications of each Trustee, which in each case led to the Board's conclusion that the Trustee should serve (or continue to serve) as a trustee of the funds, is provided below.
Annual Report
Trustees and Officers - continued
Board Structure and Oversight Function. James C. Curvey is an interested person (as defined in the 1940 Act) and currently serves as Chairman. The Trustees have determined that an interested Chairman is appropriate and benefits shareholders because an interested Chairman has a personal and professional stake in the quality and continuity of services provided to the funds. Independent Trustees exercise their informed business judgment to appoint an individual of their choosing to serve as Chairman, regardless of whether the Trustee happens to be independent or a member of management. The Independent Trustees have determined that they can act independently and effectively without having an Independent Trustee serve as Chairman and that a key structural component for assuring that they are in a position to do so is for the Independent Trustees to constitute a substantial majority for the Board. The Independent Trustees also regularly meet in executive session. Ned C. Lautenbach serves as Chairman of the Independent Trustees and as such (i) acts as a liaison between the Independent Trustees and management with respect to matters important to the Independent Trustees and (ii) with management prepares agendas for Board meetings.
Fidelity funds are overseen by different Boards of Trustees. The funds' Board oversees Fidelity's equity and high income funds and another Board oversees Fidelity's investment-grade bond, money market, and asset allocation funds. The asset allocation funds may invest in Fidelity funds overseen by the funds' Board. The use of separate Boards, each with its own committee structure, allows the Trustees of each group of Fidelity funds to focus on the unique issues of the funds they oversee, including common research, investment, and operational issues. On occasion, the separate Boards establish joint committees to address issues of overlapping consequences for the Fidelity funds overseen by each Board.
The Trustees operate using a system of committees to facilitate the timely and efficient consideration of all matters of importance to the Trustees, each fund, and fund shareholders and to facilitate compliance with legal and regulatory requirements and oversight of the funds' activities and associated risks. The Board, acting through its committees, has charged FMR and its affiliates with (i) identifying events or circumstances the occurrence of which could have demonstrably adverse effects on the funds' business and/or reputation; (ii) implementing processes and controls to lessen the possibility that such events or circumstances occur or to mitigate the effects of such events or circumstances if they do occur; and (iii) creating and maintaining a system designed to evaluate continuously business and market conditions in order to facilitate the identification and implementation processes described in (i) and (ii) above. Because the day-to-day operations and activities of the funds are carried out by or through FMR, its affiliates and other service providers, the funds' exposure to risks is mitigated but not eliminated by the processes overseen by the Trustees. While each of the Board's committees has responsibility for overseeing different aspects of the funds' activities, oversight is exercised primarily through the Operations, Audit, and Compliance Committees. In addition, the Independent Trustees have worked with FMR to enhance the Board's oversight of investment and financial risks, legal and regulatory risks, technology risks, and operational risks, including the development of additional risk reporting to the Board. For example, a working group comprised of Independent Trustees and FMR has worked and continues to work to review the Fidelity funds' valuation-related activities, reporting and risk management. Appropriate personnel, including but not limited to the funds' Chief Compliance Officer (CCO), FMR's internal auditor, the independent accountants, the funds' Treasurer and portfolio management personnel, make periodic reports to the Board's committees, as appropriate, including an annual review of FMR's risk management program for the Fidelity funds. The responsibilities of each standing committee, including their oversight responsibilities, are described further under "Standing Committees of the Funds' Trustees."
Annual Report
The funds' Statements of Additional Information (SAIs) includes more information about the Trustees. To request a free copy, call Fidelity at 1-877-208-0098.
Interested Trustees*:
Correspondence intended for each Trustee who is an interested person may be sent to Fidelity Investments, 245 Summer Street, Boston, Massachusetts 02210.
Name, Year of Birth; Principal Occupations and Other Relevant Experience+ | |
James C. Curvey (1935) | |
Year of Election or Appointment: 2007 Trustee Chairman of the Board of Trustees | |
| Mr. Curvey also serves as Trustee of other Fidelity funds. Mr. Curvey is a Director of Fidelity Investments Money Management, Inc. (2009- |
Charles S. Morrison (1960) | |
Year of Election or Appointment: 2014 Trustee | |
| Mr. Morrison also serves as Trustee or Vice President of other funds. He serves as President, Asset Management (2014-present) and is an employee of Fidelity Investments. Previously, Mr. Morrison served as President, Fixed Income (2011-2014), Vice President of Fidelity's Money Market Funds (2005-2009), President, Money Market Group Leader of FMR (2009), and Senior Vice President, Money Market Group of FMR (2004-2009). Mr. Morrison also served as Vice President of Fidelity's Bond Funds (2002-2005), certain Balanced Funds (2002-2005), and certain Asset Allocation Funds (2002-2007), and as Senior Vice President (2002-2005) of Fidelity's Bond Division. |
* Trustees have been determined to be "Interested Trustees" by virtue of, among other things, their affiliation with the trust or various entities under common control with FMR.
+ The information above includes each Trustee's principal occupation during the last five years and other information relating to the experience, attributes, and skills relevant to each Trustee's qualifications to serve as a Trustee, which led to the conclusion that each Trustee should serve as a Trustee for each fund.
Annual Report
Independent Trustees:
Correspondence intended for each Independent Trustee (that is, the Trustees other than the Interested Trustees) may be sent to Fidelity Investments, P.O. Box 55235, Boston, Massachusetts 02205-5235.
Name, Year of Birth; Principal Occupations and Other Relevant Experience+ | |
Dennis J. Dirks (1948) | |
Year of Election or Appointment: 2005 Trustee | |
| Mr. Dirks also serves as Trustee of other Fidelity funds. Prior to his retirement in May 2003, Mr. Dirks was Chief Operating Officer and a member of the Board of The Depository Trust & Clearing Corporation (DTCC). He also served as President, Chief Operating Officer, and Board member of The Depository Trust Company (DTC) and President and Board member of the National Securities Clearing Corporation (NSCC). In addition, Mr. Dirks served as Chief Executive Officer and Board member of the Government Securities Clearing Corporation, Chief Executive Officer and Board member of the Mortgage-Backed Securities Clearing Corporation, as a Trustee and a member of the Finance Committee of Manhattan College (2005-2008), and as a Trustee and a member of the Finance Committee of AHRC of Nassau County (2006-2008). Mr. Dirks is a member of the Independent Directors Council (IDC) Governing Council (2010-present) and Board of Directors for The Brookville Center for Children's Services, Inc. (2009-present). |
Alan J. Lacy (1953) | |
Year of Election or Appointment: 2008 Trustee | |
| Mr. Lacy also serves as Trustee of other Fidelity funds. Mr. Lacy serves as Senior Adviser (2007-present) of Oak Hill Capital Partners, L.P. (private equity). Mr. Lacy also served as Chief Executive Officer (2000-2005) and Vice Chairman (2005-2006) of Sears Holdings Corporation and Sears, Roebuck and Co. (retail). In addition, Mr. Lacy serves as a member of the Board of Directors of Dave & Buster's Entertainment, Inc. (restaurant and entertainment complexes, 2010-present), Earth Fare, Inc. (retail grocery, 2012-present), The Hillman Companies, Inc. (hardware wholesalers, 2010-present), and Bristol-Myers Squibb Company (global pharmaceuticals, 2008-present). Mr. Lacy is a member of the Board of Trustees of The National Parks Conservation Association (2006-present). Previously, Mr. Lacy served as Chairman of the Board of Trustees of the National Parks Conservation Association (2008-2011) and as a member of the Board of Directors for the Western Union Company (global money transfer, 2006-2011). |
Ned C. Lautenbach (1944) | |
Year of Election or Appointment: 2000 Trustee Chairman of the Independent Trustees | |
| Mr. Lautenbach also serves as Trustee of other Fidelity funds. Mr. Lautenbach currently serves as the Lead Director of the Eaton Corporation Board of Directors (diversified industrial, 1997-present). Mr. Lautenbach is Chairman of the Board of Directors of the Philharmonic Center for the Arts in Naples, Florida (2012-present) and a member of the Council on Foreign Relations (1994-present). Previously, Mr. Lautenbach was a Partner/Advisory Partner at Clayton, Dubilier & Rice, LLC (private equity investment, 1998-2010), as well as a Director of Sony Corporation (2006-2007). |
Joseph Mauriello (1944) | |
Year of Election or Appointment: 2008 Trustee | |
| Mr. Mauriello also serves as Trustee of other Fidelity funds. Prior to his retirement in January 2006, Mr. Mauriello served in numerous senior management positions including Deputy Chairman and Chief Operating Officer (2004-2005), and Vice Chairman of Financial Services (2002-2004) of KPMG LLP US (professional services, 1965-2005). Mr. Mauriello currently serves as a member of the Board of Directors of XL Group plc. (global insurance and re-insurance, 2006-present). Previously, Mr. Mauriello served as a Director of the Hamilton Funds of the Bank of New York (2006-2007) and of Arcadia Resources Inc. (health care services and products, 2007-2012). |
Robert W. Selander (1950) | |
Year of Election or Appointment: 2011 Trustee | |
| Mr. Selander also serves as Trustee of other Fidelity funds. Previously, Mr. Selander served as a Member of the Advisory Board of other Fidelity funds (2011), and Executive Vice Chairman (2010), Chief Executive Officer (2009-2010), and President and Chief Executive Officer (1997-2009) of Mastercard, Inc. |
Cornelia M. Small (1944) | |
Year of Election or Appointment: 2005 Trustee | |
| Ms. Small also serves as Trustee of other Fidelity funds. Ms. Small is a member of the Board of Directors (2009-present) and Chair of the Investment Committee (2010-present) of the Teagle Foundation. Ms. Small also serves on the Investment Committee of the Berkshire Taconic Community Foundation (2008-present). Previously, Ms. Small served as Chairperson (2002-2008) and a member of the Investment Committee and Chairperson (2008-2012) and a member of the Board of Trustees of Smith College. In addition, Ms. Small served as Chief Investment Officer, Director of Global Equity Investments, and a member of the Board of Directors of Scudder, Stevens & Clark and Scudder Kemper Investments. |
William S. Stavropoulos (1939) | |
Year of Election or Appointment: 2002 Trustee Vice Chairman of the Independent Trustees | |
| Mr. Stavropoulos also serves as Trustee of other Fidelity funds. Mr. Stavropoulos serves as President and Founder of the Michigan Baseball Foundation, the Great Lakes Loons (2007-present). Mr. Stavropoulos is Chairman Emeritus of the Board of Directors of The Dow Chemical Company, where he previously served in numerous senior management positions, including President, CEO (1995-2000; 2002-2004), Chairman of the Executive Committee (2000-2006), and as a member of the Board of Directors (1990-2006). Currently, Mr. Stavropoulos is Chairman of the Board of Directors of Univar Inc. (global distributor of commodity and specialty chemicals), a Director of Teradata Corporation (data warehousing and technology solutions), and Maersk Inc. (industrial conglomerate), and a member of the Advisory Board for Metalmark Capital LLC (private equity investment, 2005-present). Mr. Stavropoulos is an operating advisor to Clayton, Dubilier & Rice, LLC (private equity investment). In addition, Mr. Stavropoulos is a member of the University of Notre Dame Advisory Council for the College of Science, a Trustee of the Rollin L. Gerstacker Foundation, and a Director of the Naples Philharmonic Center for the Arts. Previously, Mr. Stavropoulos served as a Director of Chemical Financial Corporation (bank holding company, 1993-2012) and Tyco International, Ltd. (multinational manufacturing and services, 2007-2012). |
David M. Thomas (1949) | |
Year of Election or Appointment: 2008 Trustee | |
| Mr. Thomas also serves as Trustee of other Fidelity funds. Mr. Thomas serves as Non-Executive Chairman of the Board of Directors of Fortune Brands Home and Security (home and security products, 2011-present), and as a member of the Board of Directors of Interpublic Group of Companies, Inc. (marketing communication, 2004-present). Previously, Mr. Thomas served as Executive Chairman (2005-2006) and Chairman and Chief Executive Officer (2000-2005) of IMS Health, Inc. (pharmaceutical and healthcare information solutions), and a Director of Fortune Brands, Inc. (consumer products, 2000-2011). |
+ The information above includes each Trustee's principal occupation during the last five years and other information relating to the experience, attributes, and skills relevant to each Trustee's qualifications to serve as a Trustee, which led to the conclusion that each Trustee should serve as a Trustee for each fund.
Advisory Board Member and Officers:
Correspondence intended for each officer and Peter S. Lynch may be sent to Fidelity Investments, 245 Summer Street, Boston, Massachusetts 02210. Officers appear below in alphabetical order.
Name, Year of Birth; Principal Occupation | |
Peter S. Lynch (1944) | |
Year of Election or Appointment: 2003 Member of the Advisory Board | |
| Mr. Lynch also serves as Member of the Advisory Board of other Fidelity funds. Mr. Lynch is Vice Chairman and a Director of FMR and FMR Co., Inc. In addition, Mr. Lynch serves as a Trustee of Boston College and as the Chairman of the Inner-City Scholarship Fund. Previously, Mr. Lynch served on the Special Olympics International Board of Directors (1997-2006). |
Elizabeth Paige Baumann (1968) | |
Year of Election or Appointment: 2012 Anti-Money Laundering (AML) Officer | |
| Ms. Baumann also serves as AML Officer of other funds. She is Chief AML Officer of FMR LLC (2012-present) and is an employee of Fidelity Investments. Previously, Ms. Baumann served as Vice President and Deputy Anti-Money Laundering Officer (2007-2012). |
William C. Coffey (1969) | |
Year of Election or Appointment: 2009 Assistant Secretary | |
| Mr. Coffey also serves as Assistant Secretary of other funds. He is Senior Vice President and Deputy General Counsel of FMR LLC (2010-present), and is an employee of Fidelity Investments. Previously, Mr. Coffey served as Vice President and Associate General Counsel of FMR LLC (2005-2009). |
Jonathan Davis (1968) | |
Year of Election or Appointment: 2010 Assistant Treasurer | |
| Mr. Davis also serves as Assistant Treasurer of other funds. Mr. Davis is an employee of Fidelity Investments. Previously, Mr. Davis served as Vice President and Associate General Counsel of FMR LLC (2003-2010). |
Adrien E. Deberghes (1967) | |
Year of Election or Appointment: 2008 Deputy Treasurer | |
| Mr. Deberghes also serves as an officer of other funds. He is an employee of Fidelity Investments (2008-present). Prior to joining Fidelity Investments, Mr. Deberghes was Senior Vice President of Mutual Fund Administration at State Street Corporation (2007-2008), Senior Director of Mutual Fund Administration at Investors Bank & Trust (2005-2007), and Director of Finance for Dunkin' Brands (2000-2005). |
Stephanie J. Dorsey (1969) | |
Year of Election or Appointment: 2010 Assistant Treasurer | |
| Ms. Dorsey also serves as an officer of other funds. She is an employee of Fidelity Investments (2008-present) and has served in other fund officer roles. Prior to joining Fidelity Investments, Ms. Dorsey served as Treasurer (2004-2008) of the JPMorgan Mutual Funds and Vice President (2004-2008) of JPMorgan Chase Bank. |
Scott C. Goebel (1968) | |
Year of Election or Appointment: 2008 Secretary and Chief Legal Officer (CLO) | |
| Mr. Goebel serves as Secretary and CLO of other funds. Mr. Goebel also serves as Secretary of Fidelity SelectCo, LLC (2013-present), Fidelity Investments Money Management, Inc. (FIMM) (2010-present) and Fidelity Research and Analysis Company (FRAC) (2010-present); General Counsel, Secretary, and Senior Vice President of FMR (2008-present) and FMR Co., Inc. (2008-present); Chief Legal Officer of Fidelity Management & Research (Hong Kong) Limited (2008-present); and Assistant Secretary of Fidelity Management & Research (Japan) Inc. (2008-present) and Fidelity Management & Research (U.K.) Inc. (2008-present). Previously, Mr. Goebel served as Secretary and CLO of other Fidelity funds (2008-2013), Assistant Secretary of FIMM (2008-2010), FRAC (2008-2010), and certain funds (2007-2008); and as Vice President and Secretary of Fidelity Distributors Corporation (FDC) (2005-2007). Mr. Goebel has been employed by FMR LLC or an affiliate since 2001. |
Joseph A. Hanlon (1968) | |
Year of Election or Appointment: 2012 Chief Compliance Officer | |
| Mr. Hanlon also serves as Chief Compliance Officer of other funds. Mr. Hanlon serves as Compliance Officer of FMR, FMR Co., Inc., Fidelity Investments Money Management, Inc. (FIMM), Fidelity Research and Analysis Company (FRAC), and Fidelity Management & Research (Hong Kong) (2009-present), as Senior Vice President of the Fidelity Asset Management Division (2009-present), and is an employee of Fidelity Investments. Previously, Mr. Hanlon served as Compliance Officer of Fidelity Management & Research (Japan) Inc. (2009-2013), Strategic Advisers, Inc. (2009-2013), and Fidelity Management & Research (U.K.) Inc. (2009-2013). |
Thomas C. Hense (1964) | |
Year of Election or Appointment: 2008/2010 Vice President | |
| Mr. Hense also serves as Vice President of other funds (High Income (2008), Small Cap (2008), and Value (2010) funds). Previously, Mr. Hense served as a portfolio manager for Fidelity's Institutional Money Management Group (Pyramis) (2003-2008). |
Bruce T. Herring (1965) | |
Year of Election or Appointment: 2006 Vice President of certain Equity Funds | |
| Mr. Herring also serves as Vice President of other funds. He serves as Chief Investment Officer of Fidelity Global Asset Allocation (GAA) (2013-present), Group Chief Investment Officer of FMR, and President of Fidelity Research & Analysis Company (2010-present). Previously, Mr. Herring served as Chief Investment Officer and Director of Fidelity Management & Research (U.K.) Inc. (2010-2013), Vice President (2005-2006) and Senior Vice President (2006-2007) of Fidelity Management & Research Company, Vice President of FMR Co., Inc. (2001-2007), and as a portfolio manager for Fidelity U.S. Equity Funds. |
Brian B. Hogan (1964) | |
Year of Election or Appointment: 2009 Vice President | |
| Mr. Hogan also serves as Trustee or Vice President of other funds. Mr. Hogan serves as President of FMR's Equity Division (2009-present). Previously, Mr. Hogan served as Senior Vice President, Equity Research of FMR (2006-2009) and as a portfolio manager. |
Chris Maher (1972) | |
Year of Election or Appointment: 2013 Assistant Treasurer | |
| Mr. Maher serves as Assistant Treasurer of other funds. Mr. Maher is Vice President of Valuation Oversight and is an employee of Fidelity Investments. Previously, Mr. Maher served as Vice President of Asset Management Compliance (2013), Vice President of FMR's Program Management Group (2010-2013), and Vice President of Valuation Oversight (2008-2010). |
Christine Reynolds (1958) | |
Year of Election or Appointment: 2008 Chief Financial Officer | |
| Ms. Reynolds also serves as Chief Financial Officer of other funds. Ms. Reynolds became President of Fidelity Pricing and Cash Management Services (FPCMS) in August 2008. Ms. Reynolds served as Chief Operating Officer of FPCMS (2007-2008). Previously, Ms. Reynolds served as President, Treasurer, and Anti-Money Laundering officer of the Fidelity funds (2004-2007). |
Kenneth B. Robins (1969) | |
Year of Election or Appointment: 2008 President and Treasurer | |
| Mr. Robins also serves as an officer of other funds. Mr. Robins serves as Executive Vice President of Fidelity Investments Money Management, Inc. (FIMM) (2013-present) and is an employee of Fidelity Investments (2004-present). Previously, Mr. Robins served in other fund officer roles. |
Gary W. Ryan (1958) | |
Year of Election or Appointment: 2005 Assistant Treasurer | |
| Mr. Ryan also serves as Assistant Treasurer of other funds. Mr. Ryan is an employee of Fidelity Investments and has served in other fund officer roles. Previously, Mr. Ryan served as Vice President of Fund Reporting in Fidelity Pricing and Cash Management Services (FPCMS) (1999-2005). |
Stephen Sadoski (1971) | |
Year of Election or Appointment: 2012 Deputy Treasurer | |
| Mr. Sadoski also serves as Deputy Treasurer of other funds. He is an employee of Fidelity Investments (2012-present) and has served in another fund officer role. Prior to joining Fidelity Investments, Mr. Sadoski served as an assistant chief accountant in the Division of Investment Management of the Securities and Exchange Commission (SEC) (2009-2012) and as a senior manager at Deloitte & Touche LLP (1997-2009). |
Stacie M. Smith (1974) | |
Year of Election or Appointment: 2013 Deputy Treasurer | |
| Ms. Smith also serves as an officer of other funds. She is an employee of Fidelity Investments (2009-present) and has served in other fund officer roles. Prior to joining Fidelity Investments, Ms. Smith served as Senior Audit Manager of Ernst & Young LLP (1996-2009). |
Renee Stagnone (1975) | |
Year of Election or Appointment: 2013 Deputy Treasurer | |
| Ms. Stagnone also serves as Deputy Treasurer of other funds. Ms. Stagnone is an employee of Fidelity Investments. |
Joseph F. Zambello (1957) | |
Year of Election or Appointment: 2011 Deputy Treasurer | |
| Mr. Zambello also serves as Deputy Treasurer of other funds. Mr. Zambello is an employee of Fidelity Investments. Previously, Mr. Zambello served as Vice President of FMR's Program Management Group (2009-2011) and Vice President of the Transfer Agent Oversight Group (2005-2009). |
Annual Report
Distributions (Unaudited)
The Board of Trustees of each voted to pay to shareholders of record at the opening of business on record date, the following distributions per share derived from capital gains realized from sales of portfolio securities:
| Pay Date | Record Date | Capital Gains |
Fidelity Advisor Series Equity-Income Fund | 03/17/14 | 03/14/14 | $0.026 |
Fidelity Advisor Series Stock Selector Large Cap Value Fund | 03/17/14 | 03/14/14 | $0.110 |
The funds hereby designate as a capital gain dividend the amounts noted below for the taxable year ended January 31, 2014 or, if subsequently determined to be different, the net capital gain of such year.
Fidelity Advisor Series Equity-Income Fund | $ 1,311,035 |
Fidelity Advisor Series Stock Selector Large Cap Value Fund | $ 2,749,384 |
A percentage of the dividends distributed during the fiscal year for the following fund was derived from interest on U.S. Government securities which is generally exempt from state income tax.
Fidelity Advisor Series Equity-Income Fund | 0.04% |
A percentage of the dividends distributed during the fiscal year for the following funds qualifies for the dividends-received deduction for corporate shareholders:
| March | April | July | October | December |
Fidelity Advisor Series Equity-Income Fund | 42% | 41% | 41% | 41% | 41% |
Fidelity Advisor Series Stock Selector Large Cap Value Fund | 18% | 0% | 0% | 0% | 28% |
Annual Report
A percentage of the dividends distributed during the fiscal year for the following funds may be taken into account as a dividend for purposes of a maximum rate under 1(h) (11) of the Internal Revenue Code.
| March | April | July | October | December |
Fidelity Advisor Series Equity-Income Fund | 43% | 44% | 44% | 44% | 44% |
Fidelity Advisor Series Stock Selector Large Cap Value Fund | 16% | 0% | 0% | 0% | 30% |
The fund will notify shareholders in January 2015 of amounts for use in preparing 2014 income tax returns.
Annual Report
Investment Adviser
Fidelity Management & Research Company
Boston, MA
Investment Sub-Advisers
FMR Co., Inc.
Fidelity Management & Research (U.K.) Inc.
Fidelity Management & Research (Hong Kong) Limited
Fidelity Management & Research (Japan) Inc.
General Distributor
Fidelity Distributors Corporation
Smithfield, RI
Transfer and Service Agents
Fidelity Investments Institutional Operations Company, Inc.
Boston, MA
Fidelity Service Company, Inc.
Boston, MA
Custodians
The Northern Trust Company
Chicago, IL
Fidelity Advisor Series Equity-Income Fund
State Street Bank and Trust Company
Quincy, MA
Fidelity Advisor Series Stock Selector Large Cap Value Fund
(Fidelity Investment logo)(registered trademark)
Corporate Headquarters
245 Summer St., Boston, MA 02210
www.fidelity.com
AEDTI-ALDTI-ANN-0314
1.956891.101
Fidelity®
Equity-Income
Fund
Annual Report
January 31, 2014
(Fidelity Cover Art)
Contents
Performance | How the fund has done over time. | |
Management's Discussion of Fund Performance | The Portfolio Manager's review of fund performance and strategy. | |
Shareholder Expense Example | An example of shareholder expenses. | |
Investment Changes | A summary of major shifts in the fund's investments over the past six months. | |
Investments | A complete list of the fund's investments with their market values. | |
Financial Statements | Statements of assets and liabilities, operations, and changes in net assets, as well as financial highlights. | |
Notes | Notes to the financial statements. | |
Report of Independent Registered Public Accounting Firm |
| |
Trustees and Officers |
| |
Distributions |
|
To view a fund's proxy voting guidelines and proxy voting record for the 12-month period ended June 30, visit http://www.fidelity.com/proxyvotingresults or visit the Securities and Exchange Commission's (SEC) web site at http://www.sec.gov. You may also call 1-800-544-8544 to request a free copy of the proxy voting guidelines.
Standard & Poor's, S&P and S&P 500 are registered service marks of The McGraw-Hill Companies, Inc. and have been licensed for use by Fidelity Distributors Corporation.
Other third-party marks appearing herein are the property of their respective owners.
All other marks appearing herein are registered or unregistered trademarks or service marks of FMR LLC or an affiliated company. © 2014 FMR LLC. All rights reserved.
Annual Report
This report and the financial statements contained herein are submitted for the general information of the shareholders of the fund. This report is not authorized for distribution to prospective investors in the fund unless preceded or accompanied by an effective prospectus.
A fund files its complete schedule of portfolio holdings with the SEC for the first and third quarters of each fiscal year on Form N-Q. Forms N-Q are available on the SEC's web site at http://www.sec.gov. A fund's Forms N-Q may be reviewed and copied at the SEC's Public Reference Room in Washington, DC. Information regarding the operation of the SEC's Public Reference Room may be obtained by calling 1-800-SEC-0330. For a complete list of a fund's portfolio holdings, view the most recent holdings listing, semiannual report, or annual report on Fidelity's web site at http://www.fidelity.com, http://www.advisor.fidelity.com, or http://www.401k.com, as applicable.
NOT FDIC INSURED • MAY LOSE VALUE • NO BANK GUARANTEE
Neither the fund nor Fidelity Distributors Corporation is a bank.
Annual Report
Performance: The Bottom Line
Average annual total return reflects the change in the value of an investment, assuming reinvestment of the class' distributions from dividend income and capital gains (the profits earned upon the sale of securities that have grown in value, if any) and assuming a constant rate of performance each year. The $10,000 table and the fund's returns do not reflect the deduction of taxes that a shareholder would pay on fund distributions or the redemption of fund shares. During periods of reimbursement by Fidelity, a fund's total return will be greater than it would be had the reimbursement not occurred. How a fund did yesterday is no guarantee of how it will do tomorrow.
Average Annual Total Returns
Periods ended January 31, 2014 | Past 1 | Past 5 | Past 10 |
Fidelity® Equity-Income Fund | 16.72% | 18.21% | 5.43% |
$10,000 Over 10 Years
Let's say hypothetically that $10,000 was invested in Fidelity® Equity-Income Fund, a class of the fund, on January 31, 2004. The chart shows how the value of your investment would have changed, and also shows how the Russell 3000® Value Index performed over the same period.
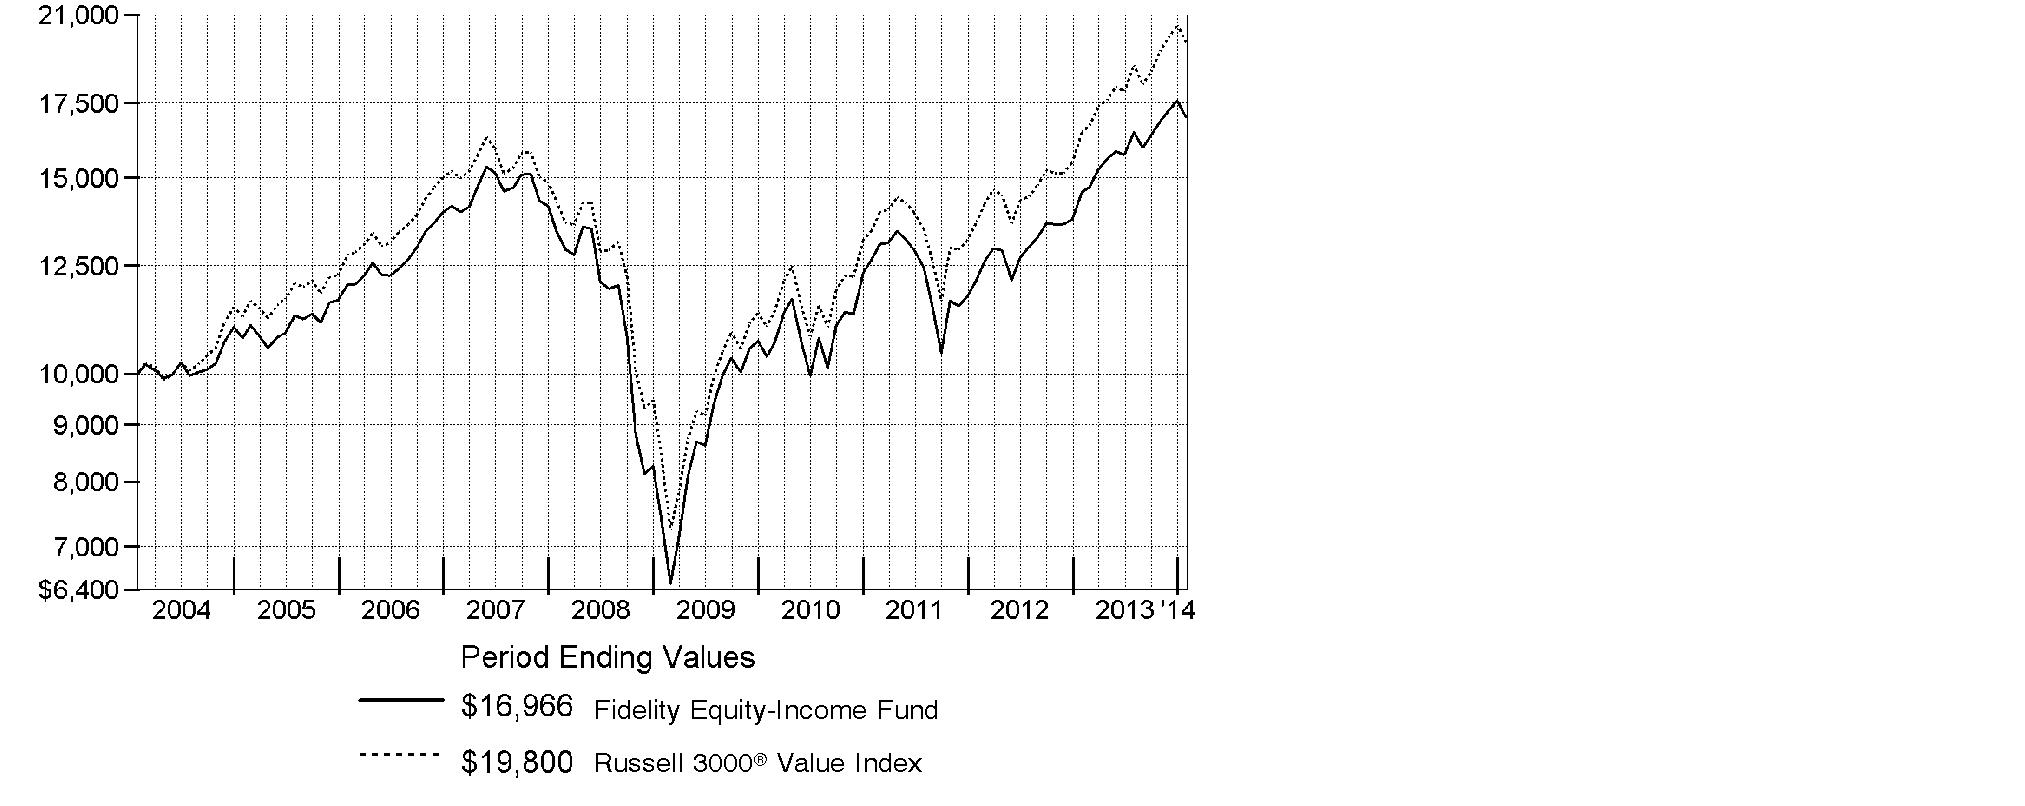
Annual Report
Management's Discussion of Fund Performance
Market Recap: Despite the worst January in years, markets finished notably higher for the 12 months ending January 31, 2014, amid a generally improving global economy and accommodative monetary policies worldwide. After achieving a series of highs in 2013, both the broad S&P 500® Index and the blue-chip Dow Jones Industrial AverageSM pulled back in the new year, bringing their 12-month returns to 21.52% and 16.07%, respectively. The growth-oriented Nasdaq Composite Index®, having run hotter in 2013 and cooled less in January, retained a loftier 32.33% result. For the period overall, smaller-cap stocks generally outperformed larger-caps, and growth outperformed value across market-cap segments. Bullish sentiment drove stocks higher through mid-May, but mixed signals from the U.S. Federal Reserve as to when it might curtail its stimulative bond-buying program, along with jitters over a potential U.S. military strike in Syria, put the markets in flux over the summer. Stocks regained their momentum in October despite a budget impasse that briefly shuttered the federal government, and volatility remained subdued heading into the holidays, allowing many markets to hit all-time highs by year-end. In January, renewed optimism for Europe and other developed markets was overrun by renewed concern about Fed tapering, the economic slowdown in China and a sell-off in emerging markets.
Comments from James Morrow, Lead Portfolio Manager of Fidelity® Equity-Income Fund: For the year, the fund's Retail Class shares gained 16.72%, trailing the Russell 3000® Value Index, which rose 20.18%. Compared with the index, stock picking in information technology and industrials was detrimental. The fund's average cash allocation of about 5% also detracted in a rising market. On the positive side, the fund benefited from favorable allocations in several sectors, especially software & services within information technology. Nevertheless, the fund's biggest individual detractor - IBM, a diversified technology services company not held in the benchmark - came from this group. In a market environment that rewarded fast-growing, momentum-oriented stocks, steady growers like IBM suffered. Another source of underperformance was Bank of America, a benchmark component that we held only intermittently during the 12 months, and not at period end. Bank of America was the beneficiary of "multiple expansion," which was reflected in a rising stock price without a corresponding increase in estimated earnings. On the positive side, alternative asset manager Blackstone Group was a strong performer, benefiting in part from its dominant competitive position. Media company and cable service provider Comcast was another meaningful contributor.
The views expressed above reflect those of the portfolio manager(s) only through the end of the period as stated on the cover of this report and do not necessarily represent the views of Fidelity or any other person in the Fidelity organization. Any such views are subject to change at any time based upon market or other conditions and Fidelity disclaims any responsibility to update such views. These views may not be relied on as investment advice and, because investment decisions for a Fidelity fund are based on numerous factors, may not be relied on as an indication of trading intent on behalf of any Fidelity fund.
Annual Report
Shareholder Expense Example
As a shareholder of the Fund, you incur two types of costs: (1) transaction costs and (2) ongoing costs, including management fees and other Fund expenses. This Example is intended to help you understand your ongoing costs (in dollars) of investing in the Fund and to compare these costs with the ongoing costs of investing in other mutual funds.
The Example is based on an investment of $1,000 invested at the beginning of the period and held for the entire period (August 1, 2013 to January 31, 2014).
Actual Expenses
The first line of the accompanying table for each class of the Fund provides information about actual account values and actual expenses. You may use the information in this line, together with the amount you invested, to estimate the expenses that you paid over the period. Simply divide your account value by $1,000.00 (for example, an $8,600 account value divided by $1,000.00 = 8.6), then multiply the result by the number in the first line for a class of the Fund under the heading entitled "Expenses Paid During Period" to estimate the expenses you paid on your account during this period. A small balance maintenance fee of $12.00 that is charged once a year may apply for certain accounts with a value of less than $2,000. This fee is not included in the table below. If it was, the estimate of expenses you paid during the period would be higher, and your ending account value lower, by this amount. In addition, the Fund, as a shareholder in the underlying Fidelity Central Funds, will indirectly bear its pro-rata share of the fees and expenses incurred by the underlying Fidelity Central Funds. These fees and expenses are not included in the Fund's annualized expense ratio used to calculate the expense estimate in the table below.
Hypothetical Example for Comparison Purposes
The second line of the accompanying table for each class of the Fund provides information about hypothetical account values and hypothetical expenses based on a Class' actual expense ratio and an assumed rate of return of 5% per year before expenses, which is not the Class' actual return. The hypothetical account values and expenses may not be used to estimate the actual ending account balance or expenses you paid for the period. You may use this information to compare the ongoing costs of investing in the Fund and other funds. To do so, compare this 5% hypothetical example with the 5% hypothetical examples that appear in the shareholder reports of the other funds. A small balance maintenance fee of $12.00 that is charged once a year may apply for certain accounts with a value of less than $2,000. This fee is not included in the table below. If it was, the estimate of expenses you paid during the period would be higher, and your ending account value lower, by this amount. In addition, the Fund, as a shareholder in the underlying Fidelity Central Funds, will indirectly bear its pro-rata share of the fees and expenses incurred by the underlying Fidelity Central Funds. These fees and expenses are not included in the Fund's annualized expense ratio used to calculate the expense estimate in the table below.
Please note that the expenses shown in the table are meant to highlight your ongoing costs only and do not reflect any transaction costs. Therefore, the second line of the table is useful in comparing ongoing costs only, and will not help you determine the relative total costs of owning different funds.
Annual Report
Shareholder Expense Example - continued
| Annualized | Beginning | Ending | Expenses Paid |
Equity-Income | .64% |
|
|
|
Actual |
| $ 1,000.00 | $ 1,029.50 | $ 3.27 |
HypotheticalA |
| $ 1,000.00 | $ 1,021.98 | $ 3.26 |
Class K | .52% |
|
|
|
Actual |
| $ 1,000.00 | $ 1,030.10 | $ 2.66 |
HypotheticalA |
| $ 1,000.00 | $ 1,022.58 | $ 2.65 |
A 5% return per year before expenses
B Annualized expense ratio reflects expenses net of applicable fee waivers.
* Expenses are equal to each Class' annualized expense ratio, multiplied by the average account value over the period, multiplied by 184/365 (to reflect the one-half year period).
Annual Report
Investment Changes (Unaudited)
Top Ten Stocks as of January 31, 2014 | ||
| % of fund's | % of fund's net assets |
JPMorgan Chase & Co.* | 3.9 | 3.8 |
Chevron Corp. | 2.7 | 2.9 |
Exxon Mobil Corp.* | 2.3 | 2.3 |
Cisco Systems, Inc. | 2.3 | 2.3 |
General Electric Co. | 2.3 | 2.3 |
MetLife, Inc.* | 2.1 | 2.0 |
Merck & Co., Inc.* | 2.0 | 2.0 |
Procter & Gamble Co. | 2.0 | 2.0 |
Johnson & Johnson | 1.8 | 2.4 |
Verizon Communications, Inc. | 1.7 | 1.4 |
| 23.1 | |
* Security or a portion of the security is pledged as collateral for call options written. |
Top Five Market Sectors as of January 31, 2014 | ||
| % of fund's | % of fund's net assets |
Financials | 21.5 | 22.5 |
Energy | 13.5 | 13.2 |
Health Care | 11.8 | 13.6 |
Information Technology | 11.5 | 10.7 |
Industrials | 10.8 | 11.5 |
Asset Allocation (% of fund's net assets) | |||||||
As of January 31, 2014* | As of July 31, 2013** | ||||||
 | Stocks 92.0% |
| | Stocks 92.2% |
| ||
 | Bonds 0.1% |
| | Bonds 0.1% |
| ||
 | Convertible |
| | Convertible |
| ||
 | Other Investments 0.4% |
| | Other Investments 0.3% |
| ||
 | Short-Term |
| | Short-Term |
| ||
* Foreign investments | 13.8% |
| ** Foreign investments | 13.1% |
| ||
* Written options | (0.1)% |
| ** Written options | 0.0% |
| ||

Annual Report
Investments January 31, 2014
Showing Percentage of Net Assets
Common Stocks - 91.5% | |||
Shares | Value (000s) | ||
CONSUMER DISCRETIONARY - 7.3% | |||
Auto Components - 0.3% | |||
Gentex Corp. | 724,673 | $ 23,472 | |
Automobiles - 0.2% | |||
General Motors Co. | 456,057 | 16,455 | |
Diversified Consumer Services - 0.1% | |||
H&R Block, Inc. | 402,200 | 12,227 | |
Hotels, Restaurants & Leisure - 1.7% | |||
Darden Restaurants, Inc. | 257,000 | 12,706 | |
McDonald's Corp. | 806,087 | 75,909 | |
Texas Roadhouse, Inc. Class A | 787,367 | 19,094 | |
Wynn Resorts Ltd. (i) | 44,100 | 9,588 | |
Yum! Brands, Inc. | 568,179 | 38,153 | |
| 155,450 | ||
Household Durables - 0.1% | |||
Coway Co. Ltd. | 67,927 | 4,357 | |
Internet & Catalog Retail - 0.0% | |||
Liberty Interactive Corp. Series A (a) | 151,900 | 4,057 | |
Media - 2.6% | |||
Atresmedia Corporacion de Medios de Comunicacion SA (a) | 406,964 | 7,657 | |
Comcast Corp. Class A | 2,407,479 | 131,087 | |
Sinclair Broadcast Group, Inc. Class A | 414,716 | 13,030 | |
Time Warner, Inc. (i) | 1,506,831 | 94,674 | |
| 246,448 | ||
Multiline Retail - 1.5% | |||
Kohl's Corp. | 826,163 | 41,829 | |
Target Corp. | 1,740,949 | 98,607 | |
| 140,436 | ||
Specialty Retail - 0.7% | |||
Abercrombie & Fitch Co. Class A | 499,920 | 17,687 | |
Dunelm Group PLC | 854,200 | 12,954 | |
Foot Locker, Inc. | 428,635 | 16,545 | |
Lewis Group Ltd. | 972,000 | 5,215 | |
Staples, Inc. | 1,277,404 | 16,811 | |
| 69,212 | ||
Textiles, Apparel & Luxury Goods - 0.1% | |||
Coach, Inc. | 259,806 | 12,442 | |
TOTAL CONSUMER DISCRETIONARY | 684,556 | ||
Common Stocks - continued | |||
Shares | Value (000s) | ||
CONSUMER STAPLES - 10.6% | |||
Beverages - 1.8% | |||
Molson Coors Brewing Co. Class B | 614,395 | $ 32,342 | |
PepsiCo, Inc. | 419,709 | 33,728 | |
The Coca-Cola Co. | 2,556,203 | 96,676 | |
| 162,746 | ||
Food & Staples Retailing - 2.0% | |||
CVS Caremark Corp. | 626,700 | 42,440 | |
Rami Levi Chain Stores Hashikma Marketing 2006 Ltd. | 241,904 | 14,105 | |
Wal-Mart Stores, Inc. | 579,591 | 43,284 | |
Walgreen Co. | 1,565,348 | 89,773 | |
| 189,602 | ||
Food Products - 1.2% | |||
Astral Foods Ltd. | 585,177 | 4,603 | |
B&G Foods, Inc. Class A | 168,593 | 5,525 | |
Hilton Food Group PLC | 2,686,432 | 20,315 | |
Kellogg Co. | 1,392,491 | 80,737 | |
| 111,180 | ||
Household Products - 2.0% | |||
Procter & Gamble Co. | 2,427,697 | 186,010 | |
Tobacco - 3.6% | |||
Altria Group, Inc. (i) | 2,695,758 | 94,945 | |
British American Tobacco PLC: | |||
(United Kingdom) | 360,500 | 17,202 | |
sponsored ADR | 374,672 | 35,965 | |
Japan Tobacco, Inc. | 426,300 | 13,160 | |
Lorillard, Inc. | 1,686,571 | 83,013 | |
Philip Morris International, Inc. | 598,278 | 46,749 | |
Reynolds American, Inc. | 919,300 | 44,586 | |
| 335,620 | ||
TOTAL CONSUMER STAPLES | 985,158 | ||
ENERGY - 12.7% | |||
Energy Equipment & Services - 1.5% | |||
Ensco PLC Class A | 525,847 | 26,487 | |
Halliburton Co. | 52,988 | 2,597 | |
National Oilwell Varco, Inc. | 473,424 | 35,512 | |
Noble Corp. | 1,054,302 | 32,715 | |
Schlumberger Ltd. | 475,643 | 41,652 | |
| 138,963 | ||
Common Stocks - continued | |||
Shares | Value (000s) | ||
ENERGY - continued | |||
Oil, Gas & Consumable Fuels - 11.2% | |||
Access Midstream Partners LP | 273,472 | $ 15,328 | |
Apache Corp. | 816,549 | 65,536 | |
Canadian Natural Resources Ltd. (e) | 1,333,200 | 43,716 | |
Chevron Corp. | 2,244,372 | 250,539 | |
ConocoPhillips Co. | 179,700 | 11,672 | |
CONSOL Energy, Inc. | 834,469 | 31,167 | |
EV Energy Partners LP | 944,117 | 33,932 | |
Exxon Mobil Corp. (i) | 2,335,596 | 215,249 | |
Holly Energy Partners LP | 438,344 | 14,185 | |
HollyFrontier Corp. | 291,732 | 13,507 | |
Legacy Reserves LP | 438,900 | 11,447 | |
Markwest Energy Partners LP | 780,788 | 54,804 | |
Occidental Petroleum Corp. | 802,700 | 70,292 | |
Royal Dutch Shell PLC Class A sponsored ADR | 658,213 | 45,483 | |
Scorpio Tankers, Inc. | 476,084 | 4,761 | |
Suncor Energy, Inc. | 1,542,900 | 50,689 | |
The Williams Companies, Inc. | 2,516,143 | 101,879 | |
Williams Partners LP | 232,900 | 11,668 | |
| 1,045,854 | ||
TOTAL ENERGY | 1,184,817 | ||
FINANCIALS - 20.5% | |||
Capital Markets - 4.0% | |||
Apollo Global Management LLC Class A | 277,260 | 8,997 | |
Apollo Investment Corp. | 3,133,502 | 26,447 | |
Ares Capital Corp. | 384,002 | 6,801 | |
Ashmore Group PLC | 4,542,395 | 24,298 | |
AURELIUS AG | 259,590 | 9,786 | |
BlackRock, Inc. Class A (i) | 50,023 | 15,030 | |
Carlyle Group LP | 330,300 | 11,498 | |
Charles Schwab Corp. | 1,635,153 | 40,584 | |
Greenhill & Co., Inc. | 273,783 | 14,223 | |
Invesco Ltd. | 400,600 | 13,320 | |
KKR & Co. LP | 3,279,900 | 79,078 | |
Morgan Stanley | 1,408,331 | 41,560 | |
The Blackstone Group LP | 2,631,032 | 86,166 | |
| 377,788 | ||
Commercial Banks - 4.4% | |||
CIT Group, Inc. (i) | 271,200 | 12,624 | |
Common Stocks - continued | |||
Shares | Value (000s) | ||
FINANCIALS - continued | |||
Commercial Banks - continued | |||
Comerica, Inc. | 496,300 | $ 22,731 | |
Lakeland Financial Corp. | 224,700 | 8,231 | |
M&T Bank Corp. | 499,178 | 55,663 | |
National Penn Bancshares, Inc. | 426,862 | 4,431 | |
Nordea Bank AB | 810,600 | 10,851 | |
PNC Financial Services Group, Inc. | 264,000 | 21,088 | |
Standard Chartered PLC (United Kingdom) | 1,506,565 | 30,710 | |
Svenska Handelsbanken AB (A Shares) | 432,400 | 20,566 | |
U.S. Bancorp | 2,141,322 | 85,075 | |
Wells Fargo & Co. | 3,020,350 | 136,943 | |
| 408,913 | ||
Diversified Financial Services - 4.7% | |||
JPMorgan Chase & Co. (i) | 6,589,682 | 364,799 | |
KKR Financial Holdings LLC | 6,009,345 | 72,713 | |
| 437,512 | ||
Insurance - 4.6% | |||
ACE Ltd. | 774,727 | 72,677 | |
AFLAC, Inc. | 258,224 | 16,211 | |
Brasil Insurance Participacoes e Administracao SA | 1,394,700 | 10,952 | |
esure Group PLC | 2,656,000 | 11,902 | |
FBD Holdings PLC | 399,803 | 9,598 | |
MetLife, Inc. (i) | 4,053,039 | 198,802 | |
MetLife, Inc. unit | 283,800 | 8,281 | |
Prudential Financial, Inc. | 434,277 | 36,649 | |
The Travelers Companies, Inc. | 256,200 | 20,824 | |
Validus Holdings Ltd. | 1,142,191 | 41,028 | |
| 426,924 | ||
Real Estate Investment Trusts - 2.6% | |||
American Capital Agency Corp. | 2,129,463 | 44,612 | |
American Tower Corp. | 82,200 | 6,648 | |
Annaly Capital Management, Inc. | 3,452,213 | 37,180 | |
CBL & Associates Properties, Inc. | 992,600 | 16,864 | |
Coresite Realty Corp. | 387,764 | 11,897 | |
First Potomac Realty Trust | 1,707,476 | 22,300 | |
Home Properties, Inc. | 574,815 | 32,046 | |
Piedmont Office Realty Trust, Inc. Class A | 535,200 | 8,922 | |
Rayonier, Inc. | 373,055 | 16,511 | |
Retail Properties America, Inc. | 1,553,071 | 20,485 | |
Common Stocks - continued | |||
Shares | Value (000s) | ||
FINANCIALS - continued | |||
Real Estate Investment Trusts - continued | |||
Two Harbors Investment Corp. | 2,155,278 | $ 21,186 | |
Ventas, Inc. | 161,403 | 10,070 | |
| 248,721 | ||
Real Estate Management & Development - 0.1% | |||
Beazer Pre-Owned Rental Homes, Inc. (a)(l) | 393,400 | 8,360 | |
Thrifts & Mortgage Finance - 0.1% | |||
Radian Group, Inc. | 438,145 | 6,520 | |
TOTAL FINANCIALS | 1,914,738 | ||
HEALTH CARE - 10.8% | |||
Biotechnology - 1.0% | |||
Amgen, Inc. | 586,109 | 69,718 | |
Grifols SA ADR | 439,244 | 17,398 | |
| 87,116 | ||
Health Care Equipment & Supplies - 0.7% | |||
Baxter International, Inc. | 275,400 | 18,810 | |
Covidien PLC | 408,000 | 27,842 | |
St. Jude Medical, Inc. | 343,777 | 20,878 | |
| 67,530 | ||
Health Care Providers & Services - 1.1% | |||
Aetna, Inc. | 260,228 | 17,781 | |
Quest Diagnostics, Inc. | 374,872 | 19,681 | |
UnitedHealth Group, Inc. | 681,420 | 49,253 | |
WellPoint, Inc. | 187,379 | 16,115 | |
| 102,830 | ||
Pharmaceuticals - 8.0% | |||
AbbVie, Inc. | 423,144 | 20,831 | |
Actavis PLC (a) | 202,185 | 38,209 | |
Astellas Pharma, Inc. | 310,000 | 19,157 | |
AstraZeneca PLC sponsored ADR | 1,537,100 | 97,606 | |
Eli Lilly & Co. | 412,941 | 22,303 | |
Johnson & Johnson | 1,926,348 | 170,424 | |
Merck & Co., Inc. (i) | 3,555,040 | 188,310 | |
Pfizer, Inc. | 3,608,679 | 109,704 | |
Common Stocks - continued | |||
Shares | Value (000s) | ||
HEALTH CARE - continued | |||
Pharmaceuticals - continued | |||
Sanofi SA | 272,689 | $ 26,658 | |
Teva Pharmaceutical Industries Ltd. sponsored ADR | 1,229,880 | 54,890 | |
| 748,092 | ||
TOTAL HEALTH CARE | 1,005,568 | ||
INDUSTRIALS - 10.2% | |||
Aerospace & Defense - 1.3% | |||
United Technologies Corp. (i) | 1,086,815 | 123,919 | |
Air Freight & Logistics - 2.0% | |||
C.H. Robinson Worldwide, Inc. | 944,456 | 55,288 | |
United Parcel Service, Inc. Class B | 1,397,165 | 133,052 | |
| 188,340 | ||
Airlines - 0.1% | |||
Copa Holdings SA Class A | 54,700 | 7,149 | |
Commercial Services & Supplies - 1.2% | |||
Intrum Justitia AB | 1,358,855 | 38,372 | |
Republic Services, Inc. | 2,430,267 | 77,841 | |
| 116,213 | ||
Electrical Equipment - 0.7% | |||
Eaton Corp. PLC | 203,300 | 14,859 | |
Emerson Electric Co. | 290,487 | 19,155 | |
Hubbell, Inc. Class B | 297,549 | 34,733 | |
| 68,747 | ||
Industrial Conglomerates - 2.4% | |||
General Electric Co. | 8,443,760 | 212,192 | |
Siemens AG (e) | 78,159 | 9,888 | |
| 222,080 | ||
Machinery - 1.2% | |||
Cummins, Inc. | 278,728 | 35,393 | |
Harsco Corp. | 497,691 | 12,636 | |
Stanley Black & Decker, Inc. (i) | 761,378 | 58,931 | |
| 106,960 | ||
Marine - 0.1% | |||
Irish Continental Group PLC unit | 269,300 | 10,061 | |
Professional Services - 0.7% | |||
Acacia Research Corp. | 759,191 | 10,492 | |
Common Stocks - continued | |||
Shares | Value (000s) | ||
INDUSTRIALS - continued | |||
Professional Services - continued | |||
Bureau Veritas SA | 320,327 | $ 8,336 | |
Dun & Bradstreet Corp. | 118,100 | 12,991 | |
Michael Page International PLC | 4,045,483 | 29,607 | |
| 61,426 | ||
Road & Rail - 0.3% | |||
Union Pacific Corp. | 164,276 | 28,623 | |
Trading Companies & Distributors - 0.2% | |||
Wolseley PLC | 259,879 | 14,021 | |
TOTAL INDUSTRIALS | 947,539 | ||
INFORMATION TECHNOLOGY - 10.8% | |||
Communications Equipment - 2.7% | |||
Cisco Systems, Inc. | 9,781,086 | 214,304 | |
QUALCOMM, Inc. | 474,416 | 35,211 | |
| 249,515 | ||
Computers & Peripherals - 0.4% | |||
Apple, Inc. | 56,399 | 28,233 | |
EMC Corp. | 288,562 | 6,995 | |
| 35,228 | ||
Electronic Equipment & Components - 0.4% | |||
TE Connectivity Ltd. | 593,532 | 33,540 | |
IT Services - 3.8% | |||
Accenture PLC Class A | 693,958 | 55,433 | |
IBM Corp. | 871,547 | 153,985 | |
Paychex, Inc. | 3,434,389 | 143,626 | |
| 353,044 | ||
Office Electronics - 0.2% | |||
Xerox Corp. | 1,537,007 | 16,677 | |
Semiconductors & Semiconductor Equipment - 1.6% | |||
Applied Materials, Inc. | 3,552,182 | 59,748 | |
Broadcom Corp. Class A | 2,429,629 | 72,306 | |
Maxim Integrated Products, Inc. | 624,124 | 18,886 | |
| 150,940 | ||
Software - 1.7% | |||
CA Technologies, Inc. | 699,000 | 22,424 | |
Common Stocks - continued | |||
Shares | Value (000s) | ||
INFORMATION TECHNOLOGY - continued | |||
Software - continued | |||
Exact Holdings NV | 215,215 | $ 6,910 | |
Microsoft Corp. | 3,555,516 | 134,576 | |
| 163,910 | ||
TOTAL INFORMATION TECHNOLOGY | 1,002,854 | ||
MATERIALS - 0.9% | |||
Chemicals - 0.5% | |||
Chemtura Corp. (a) | 159,700 | 4,005 | |
RPM International, Inc. | 686,300 | 27,226 | |
Sociedad Quimica y Minera de Chile SA (PN-B) sponsored ADR | 387,618 | 9,656 | |
Tronox Ltd. Class A | 188,735 | 4,145 | |
| 45,032 | ||
Metals & Mining - 0.4% | |||
Commercial Metals Co. | 1,092,066 | 20,815 | |
Freeport-McMoRan Copper & Gold, Inc. | 414,392 | 13,430 | |
| 34,245 | ||
TOTAL MATERIALS | 79,277 | ||
TELECOMMUNICATION SERVICES - 3.9% | |||
Diversified Telecommunication Services - 3.1% | |||
AT&T, Inc. | 2,429,389 | 80,947 | |
CenturyLink, Inc. | 1,644,624 | 47,464 | |
Verizon Communications, Inc. | 3,407,437 | 163,625 | |
| 292,036 | ||
Wireless Telecommunication Services - 0.8% | |||
Safaricom Ltd. | 17,359,000 | 2,208 | |
Vodafone Group PLC | 18,502,641 | 68,566 | |
| 70,774 | ||
TOTAL TELECOMMUNICATION SERVICES | 362,810 | ||
UTILITIES - 3.8% | |||
Electric Utilities - 3.5% | |||
American Electric Power Co., Inc. | 619,582 | 30,242 | |
Exelon Corp. | 498,334 | 14,452 | |
FirstEnergy Corp. | 819,192 | 25,796 | |
Hawaiian Electric Industries, Inc. | 829,915 | 21,594 | |
NextEra Energy, Inc. | 556,767 | 51,184 | |
Common Stocks - continued | |||
Shares | Value (000s) | ||
UTILITIES - continued | |||
Electric Utilities - continued | |||
Northeast Utilities | 307,481 | $ 13,468 | |
PPL Corp. | 1,897,686 | 58,012 | |
Southern Co. | 2,082,277 | 85,873 | |
Xcel Energy, Inc. | 981,735 | 28,382 | |
| 329,003 | ||
Multi-Utilities - 0.3% | |||
Sempra Energy | 326,234 | 30,245 | |
TOTAL UTILITIES | 359,248 | ||
TOTAL COMMON STOCKS (Cost $7,173,969) |
| ||
Preferred Stocks - 1.7% | |||
|
|
|
|
Convertible Preferred Stocks - 1.2% | |||
FINANCIALS - 0.1% | |||
Real Estate Investment Trusts - 0.1% | |||
Weyerhaeuser Co. Series A, 6.375% | 166,500 | 8,929 | |
HEALTH CARE - 0.1% | |||
Health Care Equipment & Supplies - 0.1% | |||
Alere, Inc. 3.00% | 44,000 | 12,959 | |
INDUSTRIALS - 0.2% | |||
Aerospace & Defense - 0.2% | |||
United Technologies Corp. 7.50% | 238,900 | 15,392 | |
Machinery - 0.0% | |||
Stanley Black & Decker, Inc. 6.25% (a) | 20,000 | 2,035 | |
TOTAL INDUSTRIALS | 17,427 | ||
TELECOMMUNICATION SERVICES - 0.2% | |||
Wireless Telecommunication Services - 0.2% | |||
Crown Castle International Corp. Series A, 4.50% | 161,100 | 15,704 | |
UTILITIES - 0.6% | |||
Electric Utilities - 0.2% | |||
NextEra Energy, Inc.: | |||
5.889% | 136,549 | 8,166 | |
Series E, 5.599% | 233,300 | 14,294 | |
| 22,460 | ||
Preferred Stocks - continued | |||
Shares | Value (000s) | ||
Convertible Preferred Stocks - continued | |||
UTILITIES - continued | |||
Multi-Utilities - 0.4% | |||
CenterPoint Energy, Inc. 2.00% ZENS | 274,400 | $ 14,064 | |
Dominion Resources, Inc.: | |||
Series A, 6.125% | 168,100 | 9,402 | |
Series B, 6.00% | 168,100 | 9,419 | |
| 32,885 | ||
TOTAL UTILITIES | 55,345 | ||
TOTAL CONVERTIBLE PREFERRED STOCKS | 110,364 | ||
Nonconvertible Preferred Stocks - 0.5% | |||
CONSUMER DISCRETIONARY - 0.1% | |||
Automobiles - 0.1% | |||
Volkswagen AG | 69,709 | 17,680 | |
FINANCIALS - 0.4% | |||
Consumer Finance - 0.4% | |||
Ally Financial, Inc.: | |||
7.00% (g) | 32,565 | 31,507 | |
Series A, 8.50% | 181,464 | 4,905 | |
| 36,412 | ||
TOTAL NONCONVERTIBLE PREFERRED STOCKS | 54,092 | ||
TOTAL PREFERRED STOCKS (Cost $147,087) |
| ||
Corporate Bonds - 3.2% | ||||
| Principal |
| ||
Convertible Bonds - 3.1% | ||||
CONSUMER DISCRETIONARY - 0.2% | ||||
Automobiles - 0.2% | ||||
Volkswagen International Finance NV 5.5% 11/9/15 (d)(g) | EUR | 9,200 | 14,380 | |
Corporate Bonds - continued | ||||
| Principal | Value (000s) | ||
Convertible Bonds - continued | ||||
ENERGY - 0.5% | ||||
Oil, Gas & Consumable Fuels - 0.5% | ||||
Alpha Natural Resources, Inc. 3.75% 12/15/17 | $ 7,820 | $ 7,400 | ||
Amyris, Inc. 3% 2/27/17 | 2,101 | 1,819 | ||
BPZ Energy, Inc. 8.5% 10/1/17 | 3,640 | 3,413 | ||
Chesapeake Energy Corp. 2.5% 5/15/37 | 13,480 | 13,677 | ||
Cobalt International Energy, Inc. 2.625% 12/1/19 | 5,280 | 4,726 | ||
Ship Finance International Ltd. 3.25% 2/1/18 | 14,710 | 15,475 | ||
| 46,510 | |||
FINANCIALS - 0.4% | ||||
Insurance - 0.2% | ||||
Fidelity National Financial, Inc. 4.25% 8/15/18 | 9,980 | 15,918 | ||
Thrifts & Mortgage Finance - 0.2% | ||||
MGIC Investment Corp. 9% 4/1/63 (g) | 17,382 | 20,057 | ||
TOTAL FINANCIALS | 35,975 | |||
HEALTH CARE - 0.9% | ||||
Biotechnology - 0.1% | ||||
Theravance, Inc. 2.125% 1/15/23 | 7,010 | 10,362 | ||
Health Care Equipment & Supplies - 0.2% | ||||
Teleflex, Inc. 3.875% 8/1/17 | 9,920 | 15,618 | ||
Health Care Providers & Services - 0.6% | ||||
HealthSouth Corp. 2% 12/1/43 | 18,444 | 18,481 | ||
Molina Healthcare, Inc. 1.125% 1/15/20 (g) | 9,410 | 10,139 | ||
WellPoint, Inc. 2.75% 10/15/42 | 22,830 | 29,665 | ||
| 58,285 | |||
TOTAL HEALTH CARE | 84,265 | |||
INDUSTRIALS - 0.4% | ||||
Commercial Services & Supplies - 0.1% | ||||
Covanta Holding Corp. 3.25% 6/1/14 | 8,800 | 10,318 | ||
Construction & Engineering - 0.3% | ||||
Layne Christensen Co. 4.25% 11/15/18 (g) | 5,360 | 5,526 | ||
Corporate Bonds - continued | ||||
| Principal | Value (000s) | ||
Convertible Bonds - continued | ||||
INDUSTRIALS - continued | ||||
Construction & Engineering - continued | ||||
MasTec, Inc.: | ||||
4% 6/15/14 | $ 5,720 | $ 13,056 | ||
4.25% 12/15/14 | 1,970 | 4,606 | ||
| 23,188 | |||
TOTAL INDUSTRIALS | 33,506 | |||
INFORMATION TECHNOLOGY - 0.7% | ||||
Communications Equipment - 0.3% | ||||
InterDigital, Inc. 2.5% 3/15/16 | 18,230 | 18,527 | ||
Liberty Interactive LLC 0.75% 3/30/43 (g) | 4,710 | 5,699 | ||
| 24,226 | |||
Semiconductors & Semiconductor Equipment - 0.3% | ||||
GT Advanced Technologies, Inc.: | ||||
3% 10/1/17 | 19,990 | 30,335 | ||
3% 12/15/20 | 710 | 793 | ||
| 31,128 | |||
Software - 0.1% | ||||
TiVo, Inc. 4% 3/15/16 (g) | 10,130 | 13,321 | ||
TOTAL INFORMATION TECHNOLOGY | 68,675 | |||
MATERIALS - 0.0% | ||||
Chemicals - 0.0% | ||||
RPM International, Inc. 2.25% 12/15/20 | 2,350 | 2,705 | ||
TOTAL CONVERTIBLE BONDS | 286,016 | |||
Nonconvertible Bonds - 0.1% | ||||
FINANCIALS - 0.0% | ||||
Diversified Financial Services - 0.0% | ||||
ILFC E-Capital Trust I 5.46% 12/21/65 (g)(j) | 810 | 740 | ||
MATERIALS - 0.1% | ||||
Metals & Mining - 0.1% | ||||
Boart Longyear Management Pty Ltd. 7% 4/1/21 (g) | 5,525 | 4,158 | ||
Corporate Bonds - continued | ||||
| Principal | Value (000s) | ||
Nonconvertible Bonds - continued | ||||
MATERIALS - continued | ||||
Metals & Mining - continued | ||||
JMC Steel Group, Inc. 8.25% 3/15/18 (g) | $ 2,265 | $ 2,344 | ||
Walter Energy, Inc. 8.5% 4/15/21 | 7,720 | 5,713 | ||
| 12,215 | |||
TOTAL NONCONVERTIBLE BONDS | 12,955 | |||
TOTAL CORPORATE BONDS (Cost $269,667) |
| |||
Preferred Securities - 0.1% | |||
|
|
|
|
FINANCIALS - 0.1% | |||
Diversified Financial Services - 0.1% | |||
Baggot Securities Ltd. 10.24% (g)(h) (Cost $6,128) | 3,990 |
| |
Other - 0.3% | |||
|
|
|
|
ENERGY - 0.3% | |||
Oil, Gas & Consumable Fuels - 0.3% | |||
EQTY ER Holdings, LLC 12% 1/28/18 (f)(k)(l) | 22,667 | 22,667 | |
Shares |
| ||
EQTY ER Holdings, LLC (f)(k)(l) | 11,333,334 | 10,312 | |
TOTAL OTHER (Cost $34,000) |
| ||
Money Market Funds - 3.3% | |||
|
|
|
|
Fidelity Cash Central Fund, 0.10% (b) | 285,111,312 | 285,111 | |
Fidelity Securities Lending Cash Central Fund, 0.09% (b)(c) | 21,094,938 | 21,095 | |
TOTAL MONEY MARKET FUNDS (Cost $306,206) |
| ||
Cash Equivalents - 0.1% | |||
Maturity Amount (000s) | Value (000s) | ||
Investments in repurchase agreements in a joint trading account at 0.03%, dated 1/31/14 due 2/3/14 (Collateralized by U.S. Treasury Obligations) # | $ 6,705 | $ 6,705 | |
TOTAL INVESTMENT PORTFOLIO - 100.2% (Cost $7,943,762) | 9,342,153 | ||
NET OTHER ASSETS (LIABILITIES) - (0.2)% | (20,497) | ||
NET ASSETS - 100% | $ 9,321,656 | ||
Written Options | |||||||
Expiration Date/Exercise Price | Number of Contracts | Premium (000s) | Value | ||||
Call Options | |||||||
Altria Group, Inc. | 3/22/14 - | 7,346 | $ 282 | $ (62) | |||
BlackRock, Inc. Class A | 3/22/14 - | 125 | 24 | (24) | |||
CIT Group, Inc. | 4/19/14 - | 1,356 | 126 | (91) | |||
Exxon Mobil Corp. | 4/19/14 - | 5,839 | 487 | (219) | |||
JPMorgan Chase & Co. | 4/19/14 - | 13,179 | 687 | (843) | |||
Merck & Co., Inc. | 3/22/14 - | 11,732 | 2,015 | (1,889) | |||
MetLife, Inc. | 4/19/14 - | 13,375 | 447 | (562) | |||
Stanley Black & Decker, Inc. | 4/19/14 - | 2,513 | 132 | (138) | |||
Time Warner, Inc. | 3/22/14 - | 4,973 | 246 | (261) | |||
Written Options - continued | |||||||
Expiration Date/Exercise Price | Number of Contracts | Premium (000s) | Value (000s) | ||||
Call Options - continued | |||||||
United Technologies Corp. | 3/22/14 - | 3,120 | $ 672 | $ (694) | |||
Wynn Resorts Ltd. | 3/22/14 - | 221 | 101 | (333) | |||
TOTAL WRITTEN OPTIONS | $ 5,219 | $ (5,116) | |||||
Currency Abbreviations | ||
EUR | - | European Monetary Unit |
Legend |
(a) Non-income producing |
(b) Affiliated fund that is generally available only to investment companies and other accounts managed by Fidelity Investments. The rate quoted is the annualized seven-day yield of the fund at period end. A complete unaudited listing of the fund's holdings as of its most recent quarter end is available upon request. In addition, each Fidelity Central Fund's financial statements, which are not covered by the Fund's Report of Independent Registered Public Accounting Firm, are available on the SEC's website or upon request. |
(c) Investment made with cash collateral received from securities on loan. |
(d) Amount is stated in United States dollars unless otherwise noted. |
(e) Security or a portion of the security is on loan at period end. |
(f) Affiliated company |
(g) Security exempt from registration under Rule 144A of the Securities Act of 1933. These securities may be resold in transactions exempt from registration, normally to qualified institutional buyers. At the end of the period, the value of these securities amounted to $114,142,000 or 1.2% of net assets. |
(h) Security is perpetual in nature with no stated maturity date. |
(i) Security or a portion of the security is pledged as collateral for call options written. At period end, the value of securities pledged amounted to $381,536,000. |
(j) Coupon rates for floating and adjustable rate securities reflect the rates in effect at period end. |
(k) Investments represent a non-operating interest in oil and gas wells through an entity owned by the fund that is treated as a corporation for U.S. tax purposes. |
(l) Restricted securities - Investment in securities not registered under the Securities Act of 1933 (excluding 144A issues). At the end of the period, the value of restricted securities (excluding 144A issues) amounted to $41,339,000 or 0.4% of net assets. |
Additional information on each restricted holding is as follows: |
Security | Acquisition Date | Acquisition Cost (000s) |
Beazer Pre-Owned Rental Homes, Inc. | 5/3/12 - 10/23/12 | $ 7,868 |
EQTY ER Holdings, LLC 12% 1/28/18 | 1/29/13 | $ 22,667 |
EQTY ER Holdings, LLC | 1/29/13 | $ 11,333 |
# Additional information on each counterparty to the repurchase agreement is as follows: |
Repurchase Agreement / Counterparty | Value |
$6,705,000 due 2/03/14 at 0.03% | |
BNP Paribas Securities Corp. | $ 3,499 |
Barclays Capital, Inc. | 1,861 |
Merrill Lynch, Pierce, Fenner & Smith, Inc. | 1,345 |
| $ 6,705 |
Affiliated Central Funds |
Information regarding fiscal year to date income earned by the Fund from investments in Fidelity Central Funds is as follows: |
Fund | Income earned |
Fidelity Cash Central Fund | $ 443 |
Fidelity Securities Lending Cash Central Fund | 1,015 |
Total | $ 1,458 |
Other Affiliated Issuers |
An affiliated company is a company in which the Fund has ownership of at least 5% of the voting securities. Fiscal year to date transactions with companies which are or were affiliates are as follows: |
Affiliate | Value, | Purchases | Sales | Income | Value, |
EQTY ER Holdings, LLC 12% 1/28/18 | $ 22,667 | $ - | $ - | $ 2,720 | $ 22,667 |
EQTY ER Holdings, LLC | 11,333 | - | - | - | 10,312 |
Manning & Napier, Inc. Class A | 9,577 | - | 13,431 | 109 | - |
Total | $ 43,577 | $ - | $ 13,431 | $ 2,829 | $ 32,979 |
Other Information |
The following is a summary of the inputs used, as of January 31, 2014, involving the Fund's assets and liabilities carried at fair value. The inputs or methodology used for valuing securities may not be an indication of the risk associated with investing in those securities. For more information on valuation inputs, and their aggregation into the levels used in the table below, please refer to the Investment Valuation section in the accompanying Notes to Financial Statements. |
Valuation Inputs at Reporting Date: | ||||
Description | Total | Level 1 | Level 2 | Level 3 |
Investments in Securities: | ||||
Equities: | ||||
Consumer Discretionary | $ 702,236 | $ 697,879 | $ 4,357 | $ - |
Consumer Staples | 985,158 | 954,796 | 30,362 | - |
Energy | 1,184,817 | 1,184,817 | - | - |
Financials | 1,960,079 | 1,903,002 | 48,717 | 8,360 |
Health Care | 1,018,527 | 972,712 | 45,815 | - |
Industrials | 964,966 | 955,078 | 9,888 | - |
Information Technology | 1,002,854 | 1,002,854 | - | - |
Materials | 79,277 | 79,277 | - | - |
Telecommunication Services | 378,514 | 294,244 | 84,270 | - |
Utilities | 414,593 | 378,069 | 36,524 | - |
Corporate Bonds | 298,971 | - | 298,971 | - |
Preferred Securities | 6,271 | - | 6,271 | - |
Other/Energy | 32,979 | - | - | 32,979 |
Valuation Inputs at Reporting Date: | ||||
Description | Total | Level 1 | Level 2 | Level 3 |
Investments in Securities: | ||||
Money Market Funds | $ 306,206 | $ 306,206 | $ - | $ - |
Cash Equivalents | 6,705 | - | 6,705 | - |
Total Investments in Securities: | $ 9,342,153 | $ 8,728,934 | $ 571,880 | $ 41,339 |
Derivative Instruments: | ||||
Liabilities | ||||
Written Options | $ (5,116) | $ (5,116) | $ - | $ - |
Value of Derivative Instruments |
The following table is a summary of the Fund's value of derivative instruments by primary risk exposure as of January 31, 2014. For additional information on derivative instruments, please refer to the Derivative Instruments section in the accompanying Notes to Financial Statements. |
Primary Risk Exposure / | Value | |
| Asset | Liability |
Equity Risk | ||
Written Options (a) | $ - | $ (5,116) |
Total Value of Derivatives | $ - | $ (5,116) |
(a) Gross value is presented in the Statement of Assets and Liabilities in the written options, at value line-item. |
Distribution of investments by country or territory of incorporation, as a percentage of total net assets, is as follows (Unaudited): |
United States of America | 86.2% |
United Kingdom | 5.0% |
Ireland | 1.7% |
Switzerland | 1.2% |
Canada | 1.0% |
Others (Individually Less Than 1%) | 4.9% |
| 100.0% |
See accompanying notes which are an integral part of the financial statements.
Annual Report
Financial Statements
Statement of Assets and Liabilities
Amounts in thousands (except per-share amounts) | January 31, 2014 | |
|
|
|
Assets | ||
Investment in securities, at value (including securities loaned of $20,165 and repurchase agreements of $6,705) - See accompanying schedule: Unaffiliated issuers (cost $7,603,556) | $ 9,002,968 |
|
Fidelity Central Funds (cost $306,206) | 306,206 |
|
Other affiliated issuers (cost $34,000) | 32,979 |
|
Total Investments (cost $7,943,762) |
| $ 9,342,153 |
Cash |
| 486 |
Receivable for investments sold | 16,211 | |
Receivable for fund shares sold | 4,793 | |
Dividends receivable | 11,776 | |
Interest receivable | 2,788 | |
Distributions receivable from Fidelity Central Funds | 33 | |
Prepaid expenses | 20 | |
Other receivables | 977 | |
Total assets | 9,379,237 | |
|
|
|
Liabilities | ||
Payable for investments purchased | $ 18,677 | |
Payable for fund shares redeemed | 6,929 | |
Accrued management fee | 3,614 | |
Written options, at value (premium received $5,219) | 5,116 | |
Other affiliated payables | 1,188 | |
Other payables and accrued expenses | 962 | |
Collateral on securities loaned, at value | 21,095 | |
Total liabilities | 57,581 | |
|
|
|
Net Assets | $ 9,321,656 | |
Net Assets consist of: |
| |
Paid in capital | $ 7,943,130 | |
Undistributed net investment income | 286 | |
Accumulated undistributed net realized gain (loss) on investments and foreign currency transactions | (19,962) | |
Net unrealized appreciation (depreciation) on investments and assets and liabilities in foreign currencies | 1,398,202 | |
Net Assets | $ 9,321,656 | |
See accompanying notes which are an integral part of the financial statements.
Annual Report
Statement of Assets and Liabilities - continued
Amounts in thousands (except per-share amounts) | January 31, 2014 | |
|
|
|
Equity-Income: | $ 56.69 | |
|
|
|
Class K: | $ 56.67 | |
See accompanying notes which are an integral part of the financial statements.
Annual Report
Financial Statements - continued
Statement of Operations
Amounts in thousands | Year ended January 31, 2014 | |
|
|
|
Investment Income |
|
|
Dividends (including $109 earned from other affiliated issuers) |
| $ 262,049 |
Interest (including $2,720 earned from other affiliated issuers) |
| 14,139 |
Income from Fidelity Central Funds |
| 1,458 |
Total income |
| 277,646 |
|
|
|
Expenses | ||
Management fee | $ 42,750 | |
Transfer agent fees | 12,982 | |
Accounting and security lending fees | 1,272 | |
Custodian fees and expenses | 244 | |
Independent trustees' compensation | 49 | |
Appreciation in deferred trustee compensation account | 3 | |
Registration fees | 162 | |
Audit | 131 | |
Legal | 38 | |
Miscellaneous | 78 | |
Total expenses before reductions | 57,709 | |
Expense reductions | (303) | 57,406 |
Net investment income (loss) | 220,240 | |
Realized and Unrealized Gain (Loss) Net realized gain (loss) on: | ||
Investment securities: |
|
|
Unaffiliated issuers | 1,027,450 | |
Other affiliated issuers | 4,854 |
|
Foreign currency transactions | (217) | |
Written options | 4,552 | |
Total net realized gain (loss) |
| 1,036,639 |
Change in net unrealized appreciation (depreciation) on: Investment securities | 189,386 | |
Assets and liabilities in foreign currencies | (317) | |
Written options | 103 | |
Total change in net unrealized appreciation (depreciation) |
| 189,172 |
Net gain (loss) | 1,225,811 | |
Net increase (decrease) in net assets resulting from operations | $ 1,446,051 | |
See accompanying notes which are an integral part of the financial statements.
Annual Report
Statement of Changes in Net Assets
Amounts in thousands | Year ended | Year ended |
Increase (Decrease) in Net Assets |
|
|
Operations |
|
|
Net investment income (loss) | $ 220,240 | $ 252,434 |
Net realized gain (loss) | 1,036,639 | 813,853 |
Change in net unrealized appreciation (depreciation) | 189,172 | 485,528 |
Net increase (decrease) in net assets resulting | 1,446,051 | 1,551,815 |
Distributions to shareholders from net investment income | (223,502) | (248,423) |
Share transactions - net increase (decrease) | (578,318) | (1,576,112) |
Total increase (decrease) in net assets | 644,231 | (272,720) |
|
|
|
Net Assets | ||
Beginning of period | 8,677,425 | 8,950,145 |
End of period (including undistributed net investment income of $286 and undistributed net investment income of $8,523, respectively) | $ 9,321,656 | $ 8,677,425 |
See accompanying notes which are an integral part of the financial statements.
Annual Report
Financial Highlights - Equity-Income
Years ended January 31, | 2014 | 2013 | 2012 | 2011 | 2010 |
Selected Per-Share Data |
|
|
|
|
|
Net asset value, beginning of period | $ 49.72 | $ 42.77 | $ 45.57 | $ 37.93 | $ 27.48 |
Income from Investment Operations |
|
|
|
|
|
Net investment income (loss) B | 1.26 | 1.32 | .89 | .66 | .63 |
Net realized and unrealized gain (loss) | 6.99 | 6.95 | (2.80) | 7.72 | 10.51 |
Total from investment operations | 8.25 | 8.27 | (1.91) | 8.38 | 11.14 |
Distributions from net investment income | (1.28) | (1.32) | (.89) | (.74) | (.69) |
Net asset value, end of period | $ 56.69 | $ 49.72 | $ 42.77 | $ 45.57 | $ 37.93 |
Total Return A | 16.72% | 19.63% | (4.15)% | 22.32% | 41.02% |
Ratios to Average Net Assets C, E |
|
|
|
|
|
Expenses before reductions | .64% | .67% | .68% | .69% | .74% |
Expenses net of fee waivers, if any | .64% | .67% | .68% | .69% | .74% |
Expenses net of all reductions | .64% | .66% | .67% | .68% | .74% |
Net investment income (loss) | 2.30% | 2.89% | 2.04% | 1.62% | 1.87% |
Supplemental Data |
|
|
|
|
|
Net assets, end of period (in millions) | $ 6,842 | $ 6,401 | $ 6,844 | $ 10,049 | $ 15,061 |
Portfolio turnover rate D | 43% | 43% | 80% | 28% | 30% |
A Total returns would have been lower if certain expenses had not been reduced during the applicable periods shown.
B Calculated based on average shares outstanding during the period.
C Fees and expenses of any underlying Fidelity Central Funds are not included in the Fund's expense ratio. The Fund indirectly bears its proportionate share of the expenses of any underlying Fidelity Central Funds.
D Amount does not include the portfolio activity of any underlying Fidelity Central Funds.
E Expense ratios reflect operating expenses of the class. Expenses before reductions do not reflect amounts reimbursed by the investment adviser or reductions from brokerage service arrangements or reductions from other expense offset arrangements and do not represent the amount paid by the class during periods when reimbursements or reductions occur. Expenses net of fee waivers reflect expenses after reimbursement by the investment adviser but prior to reductions from brokerage service arrangements or other expense offset arrangements. Expenses net of all reductions represent the net expenses paid by the class.
See accompanying notes which are an integral part of the financial statements.
Annual Report
Financial Highlights - Class K
Years ended January 31, | 2014 | 2013 | 2012 | 2011 | 2010 |
Selected Per-Share Data |
|
|
|
|
|
Net asset value, beginning of period | $ 49.70 | $ 42.76 | $ 45.56 | $ 37.93 | $ 27.48 |
Income from Investment Operations |
|
|
|
|
|
Net investment income (loss) B | 1.33 | 1.38 | .95 | .72 | .72 |
Net realized and unrealized gain (loss) | 6.99 | 6.95 | (2.79) | 7.72 | 10.48 |
Total from investment operations | 8.32 | 8.33 | (1.84) | 8.44 | 11.20 |
Distributions from net investment income | (1.35) | (1.39) | (.96) | (.81) | (.75) |
Net asset value, end of period | $ 56.67 | $ 49.70 | $ 42.76 | $ 45.56 | $ 37.93 |
Total Return A | 16.87% | 19.78% | (4.00)% | 22.50% | 41.30% |
Ratios to Average Net Assets C, E |
|
|
|
|
|
Expenses before reductions | .52% | .53% | .53% | .53% | .54% |
Expenses net of fee waivers, if any | .52% | .53% | .53% | .53% | .54% |
Expenses net of all reductions | .52% | .52% | .52% | .53% | .54% |
Net investment income (loss) | 2.42% | 3.03% | 2.19% | 1.78% | 2.07% |
Supplemental Data |
|
|
|
|
|
Net assets, end of period (in millions) | $ 2,480 | $ 2,276 | $ 2,106 | $ 2,559 | $ 2,017 |
Portfolio turnover rate D | 43% | 43% | 80% | 28% | 30% |
A Total returns would have been lower if certain expenses had not been reduced during the applicable periods shown.
B Calculated based on average shares outstanding during the period.
C Fees and expenses of any underlying Fidelity Central Funds are not included in the Fund's expense ratio. The Fund indirectly bears its proportionate share of the expenses of any underlying Fidelity Central Funds.
D Amount does not include the portfolio activity of any underlying Fidelity Central Funds.
E Expense ratios reflect operating expenses of the class. Expenses before reductions do not reflect amounts reimbursed by the investment adviser or reductions from brokerage service arrangements or reductions from other expense offset arrangements and do not represent the amount paid by the class during periods when reimbursements or reductions occur. Expenses net of fee waivers reflect expenses after reimbursement by the investment adviser but prior to reductions from brokerage service arrangements or other expense offset arrangements. Expenses net of all reductions represent the net expenses paid by the class.
See accompanying notes which are an integral part of the financial statements.
Annual Report
Notes to Financial Statements
For the period ended January 31, 2014
(Amounts in thousands except percentages)
1. Organization.
Fidelity Equity-Income Fund (the Fund) is a fund of Fidelity Devonshire Trust (the Trust) and is authorized to issue an unlimited number of shares. The Trust is registered under the Investment Company Act of 1940, as amended (the 1940 Act), as an open-end management investment company organized as a Massachusetts business trust. The Fund offers Equity-Income and Class K shares, each of which has equal rights as to assets and voting privileges. Each class has exclusive voting rights with respect to matters that affect that class.
2. Investments in Fidelity Central Funds.
The Fund invests in Fidelity Central Funds, which are open-end investment companies generally available only to other investment companies and accounts managed by the investment adviser and its affiliates. The Fund's Schedule of Investments lists each of the Fidelity Central Funds held as of period end, if any, as an investment of the Fund, but does not include the underlying holdings of each Fidelity Central Fund. As an Investing Fund, the Fund indirectly bears its proportionate share of the expenses of the underlying Fidelity Central Funds.
The Money Market Central Funds seek preservation of capital and current income and are managed by Fidelity Investments Money Management, Inc. (FIMM), an affiliate of the investment adviser. Annualized expenses of the Money Market Central Funds as of their most recent shareholder report date are less than .01%.
A complete unaudited list of holdings for each Fidelity Central Fund is available upon request or at the Securities and Exchange Commission (the SEC) website at www.sec.gov. In addition, the financial statements of the Fidelity Central Funds, which are not covered by the Fund's Report of Independent Registered Public Accounting Firm, are available on the SEC website or upon request.
3. Significant Accounting Policies.
The financial statements have been prepared in conformity with accounting principles generally accepted in the United States of America (GAAP), which require management to make certain estimates and assumptions at the date of the financial statements. Actual results could differ from those estimates. Subsequent events, if any, through the date that the financial statements were issued have been evaluated in the preparation of the financial statements. The following summarizes the significant accounting policies of the Fund:
Investment Valuation. Investments are valued as of 4:00 p.m. Eastern time on the last calendar day of the period. In accordance with valuation policies and procedures approved by the Board of Trustees (the Board), the Fund attempts to obtain prices from
Annual Report
Notes to Financial Statements - continued
(Amounts in thousands except percentages)
3. Significant Accounting Policies - continued
Investment Valuation - continued
one or more third party pricing vendors or brokers to value its investments. When current market prices, quotations or currency exchange rates are not readily available or reliable, investments will be fair valued in good faith by the Fidelity Management & Research Company (FMR) Fair Value Committee (the Committee), in accordance with procedures adopted by the Board. Factors used in determining fair value vary by investment type and may include market or investment specific events, changes in interest rates and credit quality. The frequency with which these procedures are used cannot be predicted and they may be utilized to a significant extent. The Committee oversees the Fund's valuation policies and procedures and is responsible for approving and reporting to the Board all fair value determinations.
The Fund categorizes the inputs to valuation techniques used to value its investments into a disclosure hierarchy consisting of three levels as shown below:
Level 1 - quoted prices in active markets for identical investments
Level 2 - other significant observable inputs (including quoted prices for similar investments, interest rates, prepayment speeds, etc.)
Level 3 - unobservable inputs (including the Fund's own assumptions based on the best information available)
Valuation techniques used to value the Fund's investments by major category are as follows:
Equity securities, including restricted securities, for which market quotations are readily available, are valued at the last reported sale price or official closing price as reported by a third party pricing vendor on the primary market or exchange on which they are traded and are categorized as Level 1 in the hierarchy. In the event there were no sales during the day or closing prices are not available, securities are valued at the last quoted bid price or may be valued using the last available price and are generally categorized as Level 2 in the hierarchy. For foreign equity securities, when market or security specific events arise, comparisons to the valuation of American Depositary Receipts (ADRs), futures contracts, Exchange-Traded Funds (ETFs) and certain indexes as well as quoted prices for similar securities may be used and would be categorized as Level 2 in the hierarchy. Utilizing these techniques may result in transfers between Level 1 and Level 2. For equity securities, including restricted securities, where observable inputs are limited, assumptions about market activity and risk are used and these securities may be categorized as Level 3 in the hierarchy.
Debt securities, including restricted securities, are valued based on evaluated prices received from third party pricing vendors or from brokers who make markets in such
Annual Report
3. Significant Accounting Policies - continued
Investment Valuation - continued
securities. Corporate bonds and preferred securities are valued by pricing vendors who utilize matrix pricing which considers yield or price of bonds of comparable quality, coupon, maturity and type or by broker-supplied prices. When independent prices are unavailable or unreliable, debt securities may be valued utilizing pricing methodologies which consider similar factors that would be used by third party pricing vendors. Debt securities are generally categorized as Level 2 in the hierarchy but may be Level 3 depending on the circumstances.
Exchange-traded options are valued using the last sale price or, in the absence of a sale, the last offering price and are categorized as Level 1 in the hierarchy. Investments in open-end mutual funds, including the Fidelity Central Funds, are valued at their closing net asset value (NAV) each business day and are categorized as Level 1 in the hierarchy. Short-term securities with remaining maturities of sixty days or less may be valued at amortized cost, which approximates fair value, and are categorized as Level 2 in the hierarchy.
Changes in valuation techniques may result in transfers in or out of an assigned level within the disclosure hierarchy. The aggregate value of investments by input level, as of January 31, 2014, is included at the end of the Fund's Schedule of Investments.
Foreign Currency. The Fund may use foreign currency contracts to facilitate transactions in foreign-denominated securities. Gains and losses from these transactions may arise from changes in the value of the foreign currency or if the counterparties do not perform under the contracts' terms.
Foreign-denominated assets, including investment securities, and liabilities are translated into U.S. dollars at the exchange rates at period end. Purchases and sales of investment securities, income and dividends received and expenses denominated in foreign currencies are translated into U.S. dollars at the exchange rate in effect on the transaction date.
The effects of exchange rate fluctuations on investments are included with the net realized and unrealized gain (loss) on investment securities. Other foreign currency transactions resulting in realized and unrealized gain (loss) are disclosed separately.
Investment Transactions and Income. For financial reporting purposes, the Fund's investment holdings and NAV include trades executed through the end of the last business day of the period. The NAV per share for processing shareholder transactions is calculated as of the close of business of the New York Stock Exchange (NYSE), normally 4:00 p.m. Eastern time and includes trades executed through the end of the prior business day. Gains and losses on securities sold are determined on the basis of identified
Annual Report
Notes to Financial Statements - continued
(Amounts in thousands except percentages)
3. Significant Accounting Policies - continued
Investment Transactions and Income - continued
cost and may include proceeds received from litigation. Dividend income is recorded on the ex-dividend date, except for certain dividends from foreign securities where the ex-dividend date may have passed, which are recorded as soon as the Fund is informed of the ex-dividend date. Non-cash dividends included in dividend income, if any, are recorded at the fair market value of the securities received. Distributions received on securities that represent a return of capital or capital gain are recorded as a reduction of cost of investments and/or as a realized gain. Subsequent to ex-dividend date the Fund determines the components of these distributions, based upon receipt of tax filings or other correspondence relating to the underlying investment. Interest income and distributions from the Fidelity Central Funds are accrued as earned. Interest income includes coupon interest and amortization of premium and accretion of discount on debt securities. Investment income is recorded net of foreign taxes withheld where recovery of such taxes is uncertain.
Class Allocations and Expenses. Investment income, realized and unrealized capital gains and losses, common expenses of the Fund, and certain fund-level expense reductions, if any, are allocated daily on a pro-rata basis to each class based on the relative net assets of each class to the total net assets of the Fund. Each class differs with respect to transfer agent fees incurred. Certain expense reductions may also differ by class. For the reporting period, the allocated portion of income and expenses to each class as a percent of its average net assets may vary due to the timing of recording these transactions in relation to fluctuating net assets of the classes. Expenses directly attributable to a fund are charged to that fund. Expenses attributable to more than one fund are allocated among the respective funds on the basis of relative net assets or other appropriate methods. Expense estimates are accrued in the period to which they relate and adjustments are made when actual amounts are known.
Deferred Trustee Compensation. Under a Deferred Compensation Plan (the Plan), independent Trustees may elect to defer receipt of a portion of their annual compensation. Deferred amounts are invested in a cross-section of Fidelity funds, are marked-to-market and remain in the Fund until distributed in accordance with the Plan. The investment of deferred amounts and the offsetting payable to the Trustees are included in the accompanying Statement of Assets and Liabilities.
Income Tax Information and Distributions to Shareholders. Each year, the Fund intends to qualify as a regulated investment company under Subchapter M of the Internal Revenue Code, including distributing substantially all of its taxable income and realized gains. As a result, no provision for U.S. Federal income taxes is required. As of January 31, 2014, the Fund did not have any unrecognized tax benefits in the financial statements; nor is the Fund aware of any tax positions for which it is reasonably possible
Annual Report
3. Significant Accounting Policies - continued
Income Tax Information and Distributions to Shareholders - continued
that the total amounts of unrecognized tax benefits will significantly change in the next twelve months. The Fund files a U.S. federal tax return, in addition to state and local tax returns as required. The Fund's federal income tax returns are subject to examination by the Internal Revenue Service (IRS) for a period of three fiscal years after they are filed. State and local tax returns may be subject to examination for an additional fiscal year depending on the jurisdiction. Foreign taxes are provided for based on the Fund's understanding of the tax rules and rates that exist in the foreign markets in which it invests.
Distributions are declared and recorded on the ex-dividend date. Income dividends and capital gain distributions are declared separately for each class. Income and capital gain distributions are determined in accordance with income tax regulations, which may differ from GAAP. In addition, the Fund claimed a portion of the payment made to redeeming shareholders as a distribution for income tax purposes.
Capital accounts within the financial statements are adjusted for permanent book-tax differences. These adjustments have no impact on net assets or the results of operations. Capital accounts are not adjusted for temporary book-tax differences which will reverse in a subsequent period.
Book-tax differences are primarily due to foreign currency transactions, passive foreign investment companies (PFIC), market discount, contingent interest, equity-debt classifications, partnerships, deferred trustees compensation, capital loss carryforwards and losses deferred due to wash sales.
The federal tax cost of investment securities and unrealized appreciation (depreciation) as of period end were as follows:
Gross unrealized appreciation | $ 1,579,251 |
Gross unrealized depreciation | (200,535) |
Net unrealized appreciation (depreciation) on securities and other investments | $ 1,378,716 |
|
|
Tax Cost | $ 7,963,437 |
The tax-based components of distributable earnings as of period end were as follows:
Undistributed ordinary income | $ 4,268 |
Net unrealized appreciation (depreciation) | $ 1,378,527 |
The tax character of distributions paid was as follows:
| January 31, 2014 | January 31, 2013 |
Ordinary Income | $ 223,502 | $ 248,423 |
Annual Report
Notes to Financial Statements - continued
(Amounts in thousands except percentages)
3. Significant Accounting Policies - continued
Repurchase Agreements. Pursuant to an Exemptive Order issued by the SEC, the Fund along with other registered investment companies having management contracts with FMR, or other affiliated entities of FMR, are permitted to transfer uninvested cash balances into joint trading accounts which are then invested in repurchase agreements. The Fund may also invest directly with institutions in repurchase agreements. Repurchase agreements may be collateralized by government or non-government securities. Upon settlement date, collateral is held in segregated accounts with custodian banks and may be obtained in the event of a default of the counterparty. The Fund monitors, on a daily basis, the value of the collateral to ensure it is at least equal to the principal amount of the repurchase agreement (including accrued interest). In the event of a default by the counterparty, realization of the collateral proceeds could be delayed, during which time the value of the collateral may decline.
Restricted Securities. The Fund may invest in securities that are subject to legal or contractual restrictions on resale. These securities generally may be resold in transactions exempt from registration or to the public if the securities are registered. Disposal of these securities may involve time-consuming negotiations and expense, and prompt sale at an acceptable price may be difficult. Information regarding restricted securities is included at the end of the Fund's Schedule of Investments.
4. Derivative Instruments.
Risk Exposures and the Use of Derivative Instruments. The Fund's investment objective allows the Fund to enter into various types of derivative contracts, including options. Derivatives are investments whose value is primarily derived from underlying assets, indices or reference rates and may be transacted on an exchange or over-the-counter (OTC). Derivatives may involve a future commitment to buy or sell a specified asset based on specified terms, to exchange future cash flows at periodic intervals based on a notional principal amount, or for one party to make one or more payments upon the occurrence of specified events in exchange for periodic payments from the other party.
The Fund used derivatives to increase returns and to manage exposure to certain risks as defined below. The success of any strategy involving derivatives depends on analysis of numerous economic factors, and if the strategies for investment do not work as intended, the Fund may not achieve its objectives.
Annual Report
4. Derivative Instruments - continued
Risk Exposures and the Use of Derivative Instruments - continued
The Fund's use of derivatives increased or decreased its exposure to the following risk:
Equity Risk | Equity risk relates to the fluctuations in the value of financial instruments as a result of changes in market prices (other than those arising from interest rate risk or foreign exchange risk), whether caused by factors specific to an individual investment, its issuer, or all factors affecting all instruments traded in a market or market segment. |
The Fund is also exposed to additional risks from investing in derivatives, such as liquidity risk and counterparty credit risk. Liquidity risk is the risk that the Fund will be unable to close out the derivative in the open market in a timely manner. Counterparty credit risk is the risk that the counterparty will not be able to fulfill its obligation to the Fund. Counterparty credit risk related to exchange-traded options may be mitigated by the protection provided by the exchange on which they trade.
Investing in derivatives may involve greater risks than investing in the underlying assets directly and, to varying degrees, may involve risk of loss in excess of any initial investment and collateral received and amounts recognized in the Statement of Assets and Liabilities. In addition, there may be the risk that the change in value of the derivative contract does not correspond to the change in value of the underlying instrument.
Options. Options give the purchaser the right, but not the obligation, to buy (call) or sell (put) an underlying security or financial instrument at an agreed exercise or strike price between or on certain dates. Options obligate the seller (writer) to buy (put) or sell (call) an underlying instrument at the exercise or strike price or cash settle an underlying derivative instrument if the holder exercises the option on or before the expiration date.
The Fund used exchange-traded written covered call options to manage its exposure to the market. When the Fund writes a covered call option, the Fund holds the underlying instrument which must be delivered to the holder upon the exercise of the option.
Upon entering into a written options contract, the Fund will receive a premium. Premiums received are reflected as a liability on the Statement of Assets and Liabilities. Options are valued daily and any unrealized appreciation (depreciation) is reflected on the Statement of Assets and Liabilities. When a written option is exercised, the premium is added to the proceeds from the sale of the underlying instrument in determining the gain or loss realized on that investment. When an option is closed the Fund will realize a gain or loss depending on whether the proceeds or amount paid for the closing sale transaction are greater or less than the premium received. When an option expires, gains and losses are realized to the extent of premiums received. The net realized gain (loss)
Annual Report
Notes to Financial Statements - continued
(Amounts in thousands except percentages)
4. Derivative Instruments - continued
Options - continued
on closed and expired written options and the change in net unrealized appreciation (depreciation) on written options are reflected separately on the Statement of Operations.
Writing call options tends to decrease exposure to the underlying instrument and risk of loss is the change in value in excess of the premium received.
Any open options at period end are presented in the Schedule of Investments under the caption "Written Options" and are representative of volume of activity during the period.
During the period, the Fund recognized net realized gain (loss) of $4,552 and a change in net unrealized appreciation (depreciation) of $103 related to its investment in written options. This amount is included in the Statement of Operations.
The following is a summary of the Fund's written options activity:
Written Options | Number of Contracts | Amount of Premiums |
Outstanding at beginning of period | - | $ - |
Options Opened | 232 | 16,412 |
Options Exercised | (96) | (6,184) |
Options Closed | (50) | (2,551) |
Options Expired | (22) | (2,458) |
Outstanding at end of period | 64 | $ 5,219 |
5. Purchases and Sales of Investments.
Purchases and sales of securities, other than short-term securities, aggregated $3,854,100 and $4,519,550, respectively.
6. Fees and Other Transactions with Affiliates.
Management Fee. Fidelity Management & Research Company (the investment adviser) and its affiliates provide the Fund with investment management related services for which the Fund pays a monthly management fee. The management fee is the sum of an individual fund fee rate that is based on an annual rate of .20% of the Fund's average net assets and an annualized group fee rate that averaged .25% during the period. The group fee rate is based upon the average net assets of all the mutual funds advised by the investment adviser, including any mutual funds previously advised by the investment adviser that are currently advised by Fidelity SelectCo, LLC, an affiliate of the investment adviser. The group fee rate decreases as assets under management increase and increases as assets under management decrease. For the reporting period, the total annual management fee rate was .45% of the Fund's average net assets.
Annual Report
6. Fees and Other Transactions with Affiliates - continued
Transfer Agent Fees. Fidelity Investments Institutional Operations Company, Inc., (FIIOC), an affiliate of the investment adviser, is the transfer, dividend disbursing and shareholder servicing agent for each class of the Fund. FIIOC receives account fees and asset-based fees that vary according to the account size and type of account of the shareholders of Equity-Income. FIIOC receives an asset-based fee of Class K's average net assets. FIIOC pays for typesetting, printing and mailing of shareholder reports, except proxy statements.
For the period, transfer agent fees for each class were as follows:
| Amount | % of |
Equity-Income | $ 11,782 | .17 |
Class K | 1,200 | .05 |
| $ 12,982 |
|
Accounting and Security Lending Fees. Fidelity Service Company, Inc. (FSC), an affiliate of the investment adviser, maintains the Fund's accounting records. The accounting fee is based on the level of average net assets for each month. Under a separate contract, FSC administers the security lending program. The security lending fee is based on the number and duration of lending transactions.
Brokerage Commissions. The Fund placed a portion of its portfolio transactions with brokerage firms which are affiliates of the investment adviser. Brokerage commissions are included in net realized gain (loss) and change in net unrealized appreciation (depreciation) in the Statement of Operations. The commissions paid to these affiliated firms were $69 for the period.
7. Committed Line of Credit.
The Fund participates with other funds managed by the investment adviser or an affiliate in a $4.25 billion credit facility (the "line of credit") to be utilized for temporary or emergency purposes to fund shareholder redemptions or for other short-term liquidity purposes. The Fund has agreed to pay commitment fees on its pro-rata portion of the line of credit, which amounted to $18 and is reflected in Miscellaneous expenses on the Statement of Operations. During the period, there were no borrowings on this line of credit.
8. Security Lending.
The Fund lends portfolio securities through a lending agent from time to time in order to earn additional income. For equity securities, a lending agent is used and may loan
Annual Report
Notes to Financial Statements - continued
(Amounts in thousands except percentages)
8. Security Lending - continued
securities to certain qualified borrowers, including Fidelity Capital Markets (FCM), a broker-dealer affiliated with the Fund. On the settlement date of the loan, the Fund receives collateral (in the form of U.S. Treasury obligations, letters of credit and/or cash) against the loaned securities and maintains collateral in an amount not less than 100% of the market value of the loaned securities during the period of the loan. The market value of the loaned securities is determined at the close of business of the Fund and any additional required collateral is delivered to the Fund on the next business day. If the borrower defaults on its obligation to return the securities loaned because of insolvency or other reasons, the Fund may apply collateral received from the borrower against the obligation. The Fund may experience delays and costs in recovering the securities loaned. Any cash collateral received is invested in the Fidelity Securities Lending Cash Central Fund. The value of loaned securities and cash collateral at period end are disclosed on the Fund's Statement of Assets and Liabilities. At period end, there were no security loans outstanding with FCM. Security lending income represents the income earned on investing cash collateral, less rebates paid to borrowers and any lending agent fees associated with the loan, plus any premium payments received for lending certain types of securities. Security lending income is presented in the Statement of Operations as a component of income from Fidelity Central Funds. Total security lending income during the period amounted to $1,015, including $4 from securities loaned to FCM.
9. Expense Reductions.
Commissions paid to certain brokers with whom the investment adviser, or its affiliates, places trades on behalf of the Fund include an amount in addition to trade execution, which may be rebated back to the Fund to offset certain expenses. This amount totaled $205 for the period. In addition, through arrangements with the Fund's custodian, credits realized as a result of uninvested cash balances were used to reduce the Fund's expenses. During the period, these credits reduced the Fund's custody expenses by $3.
The investment adviser reimbursed a portion of the Fund's operating expenses during the period in the amount of $95.
10. Distributions to Shareholders.
Distributions to shareholders of each class were as follows:
Years ended January 31, | 2014 | 2013 |
From net investment income |
|
|
Equity-Income | $ 162,301 | $ 184,959 |
Class K | 61,201 | 63,464 |
Total | $ 223,502 | $ 248,423 |
Annual Report
11. Share Transactions.
Transactions for each class of shares were as follows:
| Shares | Dollars | ||
Years ended January 31, | 2014 | 2013 | 2014 | 2013 |
Equity-Income |
|
|
|
|
Shares sold | 17,005 | 14,447 | $ 931,713 | $ 652,997 |
Reinvestment of distributions | 2,821 | 3,847 | 154,118 | 176,234 |
Shares redeemed | (27,886) | (49,571) | (1,544,782) | (2,252,887) |
Net increase (decrease) | (8,060) | (31,277) | $ (458,951) | $ (1,423,656) |
Class K |
|
|
|
|
Shares sold | 10,707 | 14,463 | $ 584,691 | $ 662,159 |
Reinvestment of distributions | 1,121 | 1,385 | 61,201 | 63,464 |
Shares redeemed | (13,867) | (19,293) | (765,259) | (878,079) |
Net increase (decrease) | (2,039) | (3,445) | $ (119,367) | $ (152,456) |
12. Other.
The Fund's organizational documents provide former and current trustees and officers with a limited indemnification against liabilities arising in connection with the performance of their duties to the Fund. In the normal course of business, the Fund may also enter into contracts that provide general indemnifications. The Fund's maximum exposure under these arrangements is unknown as this would be dependent on future claims that may be made against the Fund. The risk of material loss from such claims is considered remote.
Annual Report
Report of Independent Registered Public Accounting Firm
To the Trustees of Fidelity Devonshire Trust and the Shareholders of Fidelity Equity-Income Fund:
In our opinion, the accompanying statement of assets and liabilities, including the schedule of investments, and the related statements of operations and of changes in net assets and the financial highlights present fairly, in all material respects, the financial position of Fidelity Equity-Income Fund (a fund of Fidelity Devonshire Trust) at January 31, 2014, the results of its operations for the year then ended, the changes in its net assets for each of the two years in the period then ended and the financial highlights for each of the five years in the period then ended, in conformity with accounting principles generally accepted in the United States of America. These financial statements and financial highlights (hereafter referred to as "financial statements") are the responsibility of the Fidelity Equity-Income Fund's management. Our responsibility is to express an opinion on these financial statements based on our audits. We conducted our audits of these financial statements in accordance with the standards of the Public Company Accounting Oversight Board (United States). Those standards require that we plan and perform the audit to obtain reasonable assurance about whether the financial statements are free of material misstatement. An audit includes examining, on a test basis, evidence supporting the amounts and disclosures in the financial statements, assessing the accounting principles used and significant estimates made by management, and evaluating the overall financial statement presentation. We believe that our audits, which included confirmation of securities at January 31, 2014 by correspondence with the custodian and brokers, provide a reasonable basis for our opinion.
PricewaterhouseCoopers LLP
Boston, Massachusetts
March 19, 2014
Annual Report
Trustees and Officers
The Trustees, Member of the Advisory Board, and officers of the trust and fund, as applicable, are listed below. The Board of Trustees governs the fund and is responsible for protecting the interests of shareholders. The Trustees are experienced executives who meet periodically throughout the year to oversee the fund's activities, review contractual arrangements with companies that provide services to the fund, oversee management of the risks associated with such activities and contractual arrangements, and review the fund's performance. Except for James C. Curvey, Ned C. Lautenbach, and William S. Stavropoulos, each of the Trustees oversees 173 funds. Mr. Curvey oversees 396 funds. Mr. Lautenbach and Mr. Stavropoulos each oversees 247 funds.
The Trustees hold office without limit in time except that (a) any Trustee may resign; (b) any Trustee may be removed by written instrument, signed by at least two-thirds of the number of Trustees prior to such removal; (c) any Trustee who requests to be retired or who has become incapacitated by illness or injury may be retired by written instrument signed by a majority of the other Trustees; and (d) any Trustee may be removed at any special meeting of shareholders by a two-thirds vote of the outstanding voting securities of the trust. Each Trustee who is not an interested person (as defined in the 1940 Act) of the trust and the fund (Independent Trustee), shall retire not later than the last day of the calendar year in which his or her 75th birthday occurs. The Independent Trustees may waive this mandatory retirement age policy with respect to individual Trustees. The officers and Advisory Board Member hold office without limit in time, except that any officer and Advisory Board Member may resign or may be removed by a vote of a majority of the Trustees at any regular meeting or any special meeting of the Trustees. Except as indicated, each individual has held the office shown or other offices in the same company for the past five years.
Experience, Skills, Attributes, and Qualifications of the Fund's Trustees. The Governance and Nominating Committee has adopted a statement of policy that describes the experience, qualifications, attributes, and skills that are necessary and desirable for potential Independent Trustee candidates (Statement of Policy). The Board believes that each Trustee satisfied at the time he or she was initially elected or appointed a Trustee, and continues to satisfy, the standards contemplated by the Statement of Policy. The Governance and Nominating Committee also engages professional search firms to help identify potential Independent Trustee candidates who have the experience, qualifications, attributes, and skills consistent with the Statement of Policy. From time to time, additional criteria based on the composition and skills of the current Independent Trustees, as well as experience or skills that may be appropriate in light of future changes to board composition, business conditions, and regulatory or other developments, have also been considered by the professional search firms and the Governance and Nominating Committee. In addition, the Board takes into account the Trustees' commitment and participation in Board and committee meetings, as well as their leadership of standing and ad hoc committees throughout their tenure.
In determining that a particular Trustee was and continues to be qualified to serve as a Trustee, the Board has considered a variety of criteria, none of which, in isolation, was controlling. The Board believes that, collectively, the Trustees have balanced and diverse experience, qualifications, attributes, and skills, which allow the Board to operate effectively in governing the fund and protecting the interests of shareholders. Information about the specific experience, skills, attributes, and qualifications of each Trustee, which in each case led to the Board's conclusion that the Trustee should serve (or continue to serve) as a trustee of the fund, is provided below.
Annual Report
Trustees and Officers - continued
Board Structure and Oversight Function. James C. Curvey is an interested person (as defined in the 1940 Act) and currently serves as Chairman. The Trustees have determined that an interested Chairman is appropriate and benefits shareholders because an interested Chairman has a personal and professional stake in the quality and continuity of services provided to the fund. Independent Trustees exercise their informed business judgment to appoint an individual of their choosing to serve as Chairman, regardless of whether the Trustee happens to be independent or a member of management. The Independent Trustees have determined that they can act independently and effectively without having an Independent Trustee serve as Chairman and that a key structural component for assuring that they are in a position to do so is for the Independent Trustees to constitute a substantial majority for the Board. The Independent Trustees also regularly meet in executive session. Ned C. Lautenbach serves as Chairman of the Independent Trustees and as such (i) acts as a liaison between the Independent Trustees and management with respect to matters important to the Independent Trustees and (ii) with management prepares agendas for Board meetings.
Fidelity funds are overseen by different Boards of Trustees. The fund's Board oversees Fidelity's equity and high income funds and another Board oversees Fidelity's investment-grade bond, money market, and asset allocation funds. The asset allocation funds may invest in Fidelity funds overseen by the fund's Board. The use of separate Boards, each with its own committee structure, allows the Trustees of each group of Fidelity funds to focus on the unique issues of the funds they oversee, including common research, investment, and operational issues. On occasion, the separate Boards establish joint committees to address issues of overlapping consequences for the Fidelity funds overseen by each Board.
The Trustees operate using a system of committees to facilitate the timely and efficient consideration of all matters of importance to the Trustees, the fund, and fund shareholders and to facilitate compliance with legal and regulatory requirements and oversight of the fund's activities and associated risks. The Board, acting through its committees, has charged FMR and its affiliates with (i) identifying events or circumstances the occurrence of which could have demonstrably adverse effects on the fund's business and/or reputation; (ii) implementing processes and controls to lessen the possibility that such events or circumstances occur or to mitigate the effects of such events or circumstances if they do occur; and (iii) creating and maintaining a system designed to evaluate continuously business and market conditions in order to facilitate the identification and implementation processes described in (i) and (ii) above. Because the day-to-day operations and activities of the fund are carried out by or through FMR, its affiliates and other service providers, the fund's exposure to risks is mitigated but not eliminated by the processes overseen by the Trustees. While each of the Board's committees has responsibility for overseeing different aspects of the fund's activities, oversight is exercised primarily through the Operations, Audit, and Compliance Committees. In addition, the Independent Trustees have worked with FMR to enhance the Board's oversight of investment and financial risks, legal and regulatory risks, technology risks, and operational risks, including the development of additional risk reporting to the Board. For example, a working group comprised of Independent Trustees and FMR has worked and continues to work to review the Fidelity funds' valuation-related activities, reporting and risk management. Appropriate personnel, including but not limited to the fund's Chief Compliance Officer (CCO), FMR's internal auditor, the independent accountants, the fund's Treasurer and portfolio management personnel, make periodic reports to the Board's committees, as appropriate, including an annual review of FMR's risk management program for the Fidelity funds. The responsibilities of each standing committee, including their oversight responsibilities, are described further under "Standing Committees of the Fund's Trustees."
Annual Report
The fund's Statement of Additional Information (SAI) includes more information about the Trustees. To request a free copy, call Fidelity at 1-800-544-8544.
Interested Trustees*:
Correspondence intended for each Trustee who is an interested person may be sent to Fidelity Investments, 245 Summer Street, Boston, Massachusetts 02210.
Name, Year of Birth; Principal Occupations and Other Relevant Experience+ | |
James C. Curvey (1935) | |
Year of Election or Appointment: 2007 Trustee Chairman of the Board of Trustees | |
| Mr. Curvey also serves as Trustee of other Fidelity funds. Mr. Curvey is a Director of Fidelity Investments Money Management, Inc. (2009-present), Director of Fidelity Research & Analysis Co. (2009-present) and Director of FMR and FMR Co., Inc. (2007-present). Mr. Curvey is also Vice Chairman (2007-present) and Director of FMR LLC. In addition, Mr. Curvey serves as an Overseer for the Boston Symphony Orchestra and a member of the Trustees of Villanova University. Previously, Mr. Curvey was the Vice Chairman (2006-2007) and Director (2000-2007) of FMR Corp. |
Charles S. Morrison (1960) | |
Year of Election or Appointment: 2014 Trustee | |
| Mr. Morrison also serves as Trustee or Vice President of other funds. He serves as President, Asset Management (2014-present) and is an employee of Fidelity Investments. Previously, Mr. Morrison served as President, Fixed Income (2011-2014), Vice President of Fidelity's Money Market Funds (2005-2009), President, Money Market Group Leader of FMR (2009), and Senior Vice President, Money Market Group of FMR (2004-2009). Mr. Morrison also served as Vice President of Fidelity's Bond Funds (2002-2005), certain Balanced Funds (2002-2005), and certain Asset Allocation Funds (2002-2007), and as Senior Vice President (2002-2005) of Fidelity's Bond Division. |
* Trustees have been determined to be "Interested Trustees" by virtue of, among other things, their affiliation with the trust or various entities under common control with FMR.
+ The information above includes each Trustee's principal occupation during the last five years and other information relating to the experience, attributes, and skills relevant to each Trustee's qualifications to serve as a Trustee, which led to the conclusion that each Trustee should serve as a Trustee for the fund.
Annual Report
Independent Trustees:
Correspondence intended for each Independent Trustee (that is, the Trustees other than the Interested Trustees) may be sent to Fidelity Investments, P.O. Box 55235, Boston, Massachusetts 02205-5235.
Name, Year of Birth; Principal Occupations and Other Relevant Experience+ | |
Dennis J. Dirks (1948) | |
Year of Election or Appointment: 2005 Trustee | |
| Mr. Dirks also serves as Trustee of other Fidelity funds. Prior to his retirement in May 2003, Mr. Dirks was Chief Operating Officer and a member of the Board of The Depository Trust & Clearing Corporation (DTCC). He also served as President, Chief Operating Officer, and Board member of The Depository Trust Company (DTC) and President and Board member of the National Securities Clearing Corporation (NSCC). In addition, Mr. Dirks served as Chief Executive Officer and Board member of the Government Securities Clearing Corporation, Chief Executive Officer and Board member of the Mortgage-Backed Securities Clearing Corporation, as a Trustee and a member of the Finance Committee of Manhattan College (2005-2008), and as a Trustee and a member of the Finance Committee of AHRC of Nassau County (2006-2008). Mr. Dirks is a member of the Independent Directors Council (IDC) Governing Council (2010-present) and Board of Directors for The Brookville Center for Children's Services, Inc. (2009-present). |
Alan J. Lacy (1953) | |
Year of Election or Appointment: 2008 Trustee | |
| Mr. Lacy also serves as Trustee of other Fidelity funds. Mr. Lacy serves as Senior Adviser (2007-present) of Oak Hill Capital Partners, L.P. (private equity). Mr. Lacy also served as Chief Executive Officer (2000-2005) and Vice Chairman (2005-2006) of Sears Holdings Corporation and Sears, Roebuck and Co. (retail). In addition, Mr. Lacy serves as a member of the Board of Directors of Dave & Buster's Entertainment, Inc. (restaurant and entertainment complexes, 2010-present), Earth Fare, Inc. (retail grocery, 2012-present), The Hillman Companies, Inc. (hardware wholesalers, 2010-present), and Bristol-Myers Squibb Company (global pharmaceuticals, 2008-present). Mr. Lacy is a member of the Board of Trustees of The National Parks Conservation Association (2006-present). Previously, Mr. Lacy served as Chairman of the Board of Trustees of the National Parks Conservation Association (2008-2011) and as a member of the Board of Directors for the Western Union Company (global money transfer, 2006-2011). |
Ned C. Lautenbach (1944) | |
Year of Election or Appointment: 2000 Trustee Chairman of the Independent Trustees | |
| Mr. Lautenbach also serves as Trustee of other Fidelity funds. Mr. Lautenbach currently serves as the Lead Director of the Eaton Corporation Board of Directors (diversified industrial, 1997-present). Mr. Lautenbach is Chairman of the Board of Directors of the Philharmonic Center for the Arts in Naples, Florida (2012-present) and a member of the Council on Foreign Relations (1994-present). Previously, Mr. Lautenbach was a Partner/Advisory Partner at Clayton, Dubilier & Rice, LLC (private equity investment, 1998-2010), as well as a Director of Sony Corporation (2006-2007). |
Joseph Mauriello (1944) | |
Year of Election or Appointment: 2008 Trustee | |
| Mr. Mauriello also serves as Trustee of other Fidelity funds. Prior to his retirement in January 2006, Mr. Mauriello served in numerous senior management positions including Deputy Chairman and Chief Operating Officer (2004-2005), and Vice Chairman of Financial Services (2002-2004) of KPMG LLP US (professional services, 1965-2005). Mr. Mauriello currently serves as a member of the Board of Directors of XL Group plc. (global insurance and re-insurance, 2006-present). Previously, Mr. Mauriello served as a Director of the Hamilton Funds of the Bank of New York (2006-2007) and of Arcadia Resources Inc. (health care services and products, 2007-2012). |
Robert W. Selander (1950) | |
Year of Election or Appointment: 2011 Trustee | |
| Mr. Selander also serves as Trustee of other Fidelity funds. Previously, Mr. Selander served as a Member of the Advisory Board of other Fidelity funds (2011), and Executive Vice Chairman (2010), Chief Executive Officer (2009-2010), and President and Chief Executive Officer (1997-2009) of Mastercard, Inc. |
Cornelia M. Small (1944) | |
Year of Election or Appointment: 2005 Trustee | |
| Ms. Small also serves as Trustee of other Fidelity funds. Ms. Small is a member of the Board of Directors (2009-present) and Chair of the Investment Committee (2010-present) of the Teagle Foundation. Ms. Small also serves on the Investment Committee of the Berkshire Taconic Community Foundation (2008-present). Previously, Ms. Small served as Chairperson (2002-2008) and a member of the Investment Committee and Chairperson (2008-2012) and a member of the Board of Trustees of Smith College. In addition, Ms. Small served as Chief Investment Officer, Director of Global Equity Investments, and a member of the Board of Directors of Scudder, Stevens & Clark and Scudder Kemper Investments. |
William S. Stavropoulos (1939) | |
Year of Election or Appointment: 2002 Trustee Vice Chairman of the Independent Trustees | |
| Mr. Stavropoulos also serves as Trustee of other Fidelity funds. Mr. Stavropoulos serves as President and Founder of the Michigan Baseball Foundation, the Great Lakes Loons (2007-present). Mr. Stavropoulos is Chairman Emeritus of the Board of Directors of The Dow Chemical Company, where he previously served in numerous senior management positions, including President, CEO (1995-2000; 2002-2004), Chairman of the Executive Committee (2000-2006), and as a member of the Board of Directors (1990-2006). Currently, Mr. Stavropoulos is Chairman of the Board of Directors of Univar Inc. (global distributor of commodity and specialty chemicals), a Director of Teradata Corporation (data warehousing and technology solutions), and Maersk Inc. (industrial conglomerate), and a member of the Advisory Board for Metalmark Capital LLC (private equity investment, 2005-present). Mr. Stavropoulos is an operating advisor to Clayton, Dubilier & Rice, LLC (private equity investment). In addition, Mr. Stavropoulos is a member of the University of Notre Dame Advisory Council for the College of Science, a Trustee of the Rollin L. Gerstacker Foundation, and a Director of the Naples Philharmonic Center for the Arts. Previously, Mr. Stavropoulos served as a Director of Chemical Financial Corporation (bank holding company, 1993-2012) and Tyco International, Ltd. (multinational manufacturing and services, 2007-2012). |
David M. Thomas (1949) | |
Year of Election or Appointment: 2008 Trustee | |
| Mr. Thomas also serves as Trustee of other Fidelity funds. Mr. Thomas serves as Non-Executive Chairman of the Board of Directors of Fortune Brands Home and Security (home and security products, 2011-present), and as a member of the Board of Directors of Interpublic Group of Companies, Inc. (marketing communication, 2004-present). Previously, Mr. Thomas served as Executive Chairman (2005-2006) and Chairman and Chief Executive Officer (2000-2005) of IMS Health, Inc. (pharmaceutical and healthcare information solutions), and a Director of Fortune Brands, Inc. (consumer products, 2000-2011). |
+ The information above includes each Trustee's principal occupation during the last five years and other information relating to the experience, attributes, and skills relevant to each Trustee's qualifications to serve as a Trustee, which led to the conclusion that each Trustee should serve as a Trustee for the fund.
Advisory Board Member and Officers:
Correspondence intended for each officer and Peter S. Lynch may be sent to Fidelity Investments, 245 Summer Street, Boston, Massachusetts 02210. Officers appear below in alphabetical order.
Name, Year of Birth; Principal Occupation | |
Peter S. Lynch (1944) | |
Year of Election or Appointment: 2003 Member of the Advisory Board | |
| Mr. Lynch also serves as Member of the Advisory Board of other Fidelity funds. Mr. Lynch is Vice Chairman and a Director of FMR and FMR Co., Inc. In addition, Mr. Lynch serves as a Trustee of Boston College and as the Chairman of the Inner-City Scholarship Fund. Previously, Mr. Lynch served on the Special Olympics International Board of Directors (1997-2006). |
Elizabeth Paige Baumann (1968) | |
Year of Election or Appointment: 2012 Anti-Money Laundering (AML) Officer | |
| Ms. Baumann also serves as AML Officer of other funds. She is Chief AML Officer of FMR LLC (2012-present) and is an employee of Fidelity Investments. Previously, Ms. Baumann served as Vice President and Deputy Anti-Money Laundering Officer (2007-2012). |
William C. Coffey (1969) | |
Year of Election or Appointment: 2009 Assistant Secretary | |
| Mr. Coffey also serves as Assistant Secretary of other funds. He is Senior Vice President and Deputy General Counsel of FMR LLC (2010-present), and is an employee of Fidelity Investments. Previously, Mr. Coffey served as Vice President and Associate General Counsel of FMR LLC (2005-2009). |
Jonathan Davis (1968) | |
Year of Election or Appointment: 2010 Assistant Treasurer | |
| Mr. Davis also serves as Assistant Treasurer of other funds. Mr. Davis is an employee of Fidelity Investments. Previously, Mr. Davis served as Vice President and Associate General Counsel of FMR LLC (2003-2010). |
Adrien E. Deberghes (1967) | |
Year of Election or Appointment: 2008 Deputy Treasurer | |
| Mr. Deberghes also serves as an officer of other funds. He is an employee of Fidelity Investments (2008-present). Prior to joining Fidelity Investments, Mr. Deberghes was Senior Vice President of Mutual Fund Administration at State Street Corporation (2007-2008), Senior Director of Mutual Fund Administration at Investors Bank & Trust (2005-2007), and Director of Finance for Dunkin' Brands (2000-2005). |
Stephanie J. Dorsey (1969) | |
Year of Election or Appointment: 2010 Assistant Treasurer | |
| Ms. Dorsey also serves as an officer of other funds. She is an employee of Fidelity Investments (2008-present) and has served in other fund officer roles. Prior to joining Fidelity Investments, Ms. Dorsey served as Treasurer (2004-2008) of the JPMorgan Mutual Funds and Vice President (2004-2008) of JPMorgan Chase Bank. |
Scott C. Goebel (1968) | |
Year of Election or Appointment: 2008 Secretary and Chief Legal Officer (CLO) | |
| Mr. Goebel serves as Secretary and CLO of other funds. Mr. Goebel also serves as Secretary of Fidelity SelectCo, LLC (2013-present), Fidelity Investments Money Management, Inc. (FIMM) (2010-present) and Fidelity Research and Analysis Company (FRAC) (2010-present); General Counsel, Secretary, and Senior Vice President of FMR (2008-present) and FMR Co., Inc. (2008-present); Chief Legal Officer of Fidelity Management & Research (Hong Kong) Limited (2008-present); and Assistant Secretary of Fidelity Management & Research (Japan) Inc. (2008-present) and Fidelity Management & Research (U.K.) Inc. (2008-present). Previously, Mr. Goebel served as Secretary and CLO of other Fidelity funds (2008-2013), Assistant Secretary of FIMM (2008-2010), FRAC (2008-2010), and certain funds (2007-2008); and as Vice President and Secretary of Fidelity Distributors Corporation (FDC) (2005-2007). Mr. Goebel has been employed by FMR LLC or an affiliate since 2001. |
Joseph A. Hanlon (1968) | |
Year of Election or Appointment: 2012 Chief Compliance Officer | |
| Mr. Hanlon also serves as Chief Compliance Officer of other funds. Mr. Hanlon serves as Compliance Officer of FMR, FMR Co., Inc., Fidelity Investments Money Management, Inc. (FIMM), Fidelity Research and Analysis Company (FRAC), and Fidelity Management & Research (Hong Kong) (2009-present), as Senior Vice President of the Fidelity Asset Management Division (2009-present), and is an employee of Fidelity Investments. Previously, Mr. Hanlon served as Compliance Officer of Fidelity Management & Research (Japan) Inc. (2009-2013), Strategic Advisers, Inc. (2009-2013), and Fidelity Management & Research (U.K.) Inc. (2009-2013). |
Bruce T. Herring (1965) | |
Year of Election or Appointment: 2006 Vice President of certain Equity Funds | |
| Mr. Herring also serves as Vice President of other funds. He serves as Chief Investment Officer of Fidelity Global Asset Allocation (GAA) (2013-present), Group Chief Investment Officer of FMR, and President of Fidelity Research & Analysis Company (2010-present). Previously, Mr. Herring served as Chief Investment Officer and Director of Fidelity Management & Research (U.K.) Inc. (2010-2013), Vice President (2005-2006) and Senior Vice President (2006-2007) of Fidelity Management & Research Company, Vice President of FMR Co., Inc. (2001-2007), and as a portfolio manager for Fidelity U.S. Equity Funds. |
Brian B. Hogan (1964) | |
Year of Election or Appointment: 2009 Vice President | |
| Mr. Hogan also serves as Trustee or Vice President of other funds. Mr. Hogan serves as President of FMR's Equity Division (2009-present). Previously, Mr. Hogan served as Senior Vice President, Equity Research of FMR (2006-2009) and as a portfolio manager. |
Chris Maher (1972) | |
Year of Election or Appointment: 2013 Assistant Treasurer | |
| Mr. Maher serves as Assistant Treasurer of other funds. Mr. Maher is Vice President of Valuation Oversight and is an employee of Fidelity Investments. Previously, Mr. Maher served as Vice President of Asset Management Compliance (2013), Vice President of FMR's Program Management Group (2010-2013), and Vice President of Valuation Oversight (2008-2010). |
Christine Reynolds (1958) | |
Year of Election or Appointment: 2008 Chief Financial Officer | |
| Ms. Reynolds also serves as Chief Financial Officer of other funds. Ms. Reynolds became President of Fidelity Pricing and Cash Management Services (FPCMS) in August 2008. Ms. Reynolds served as Chief Operating Officer of FPCMS (2007-2008). Previously, Ms. Reynolds served as President, Treasurer, and Anti-Money Laundering officer of the Fidelity funds (2004-2007). |
Kenneth B. Robins (1969) | |
Year of Election or Appointment: 2008 President and Treasurer | |
| Mr. Robins also serves as an officer of other funds. Mr. Robins serves as Executive Vice President of Fidelity Investments Money Management, Inc. (FIMM) (2013-present) and is an employee of Fidelity Investments (2004-present). Previously, Mr. Robins served in other fund officer roles. |
Gary W. Ryan (1958) | |
Year of Election or Appointment: 2005 Assistant Treasurer | |
| Mr. Ryan also serves as Assistant Treasurer of other funds. Mr. Ryan is an employee of Fidelity Investments and has served in other fund officer roles. Previously, Mr. Ryan served as Vice President of Fund Reporting in Fidelity Pricing and Cash Management Services (FPCMS) (1999-2005). |
Stephen Sadoski (1971) | |
Year of Election or Appointment: 2012 Deputy Treasurer | |
| Mr. Sadoski also serves as Deputy Treasurer of other funds. He is an employee of Fidelity Investments (2012-present) and has served in another fund officer role. Prior to joining Fidelity Investments, Mr. Sadoski served as an assistant chief accountant in the Division of Investment Management of the Securities and Exchange Commission (SEC) (2009-2012) and as a senior manager at Deloitte & Touche LLP (1997-2009). |
Stacie M. Smith (1974) | |
Year of Election or Appointment: 2013 Deputy Treasurer | |
| Ms. Smith also serves as an officer of other funds. She is an employee of Fidelity Investments (2009-present) and has served in other fund officer roles. Prior to joining Fidelity Investments, Ms. Smith served as Senior Audit Manager of Ernst & Young LLP (1996-2009). |
Renee Stagnone (1975) | |
Year of Election or Appointment: 2013 Deputy Treasurer | |
| Ms. Stagnone also serves as Deputy Treasurer of other funds. Ms. Stagnone is an employee of Fidelity Investments. |
Joseph F. Zambello (1957) | |
Year of Election or Appointment: 2011 Deputy Treasurer | |
| Mr. Zambello also serves as Deputy Treasurer of other funds. Mr. Zambello is an employee of Fidelity Investments. Previously, Mr. Zambello served as Vice President of FMR's Program Management Group (2009-2011) and Vice President of the Transfer Agent Oversight Group (2005-2009). |
Annual Report
Distributions (Unaudited)
The fund hereby designates as a capital gain dividend with respect to the taxable year ended January 31, 2014, $2,355,477, or, if subsequently determined to be different, the net capital gain of such year.
A total of 0.05% of the dividends distributed during the fiscal year was derived from interest on U.S. Government securities which is generally exempt from state income tax.
Equity-Income designates 86%, 82%, 82% and 82% of the dividends distributed in April, July, October and December 2013, respectively during the fiscal year as qualifying for the dividends-received deduction for corporate shareholders.
Equity-Income designates 99%, 98%, 98% and 98% of the dividends distributed in April, July, October and December 2013, respectively during the fiscal year as amounts which may be taken into account as a dividend for the purposes of the maximum rate under section 1(h)(11) of the Internal Revenue Code.
The fund will notify shareholders in January 2015 of amounts for use in preparing 2014 income tax returns.
Annual Report
Investment Adviser
Fidelity Management & Research Company
Boston, MA
Investment Sub-Advisers
FMR Co., Inc.
Fidelity Management & Research
(U.K.) Inc.
Fidelity Management & Research
(Japan) Inc.
Fidelity Management & Research
(Hong Kong) Limited
General Distributor
Fidelity Distributors Corporation
Smithfield, RI
Transfer and Service Agents
Fidelity Investments Institutional
Operations Company, Inc.
Boston, MA
Fidelity Service Company, Inc.
Boston, MA
Custodian
The Northern Trust Company
Chicago, IL
The Fidelity Telephone Connection
Mutual Fund 24-Hour Service
Exchanges/Redemptions
and Account Assistance 1-800-544-6666
Product Information 1-800-544-6666
Retirement Accounts 1-800-544-4774
(8 a.m. - 9 p.m.)
TDD Service 1-800-544-0118
for the deaf and hearing impaired
(9 a.m. - 9 p.m. Eastern time)
Fidelity Automated Service
Telephone (FAST®)
1-800-544-5555
Automated line for quickest service
(Fidelity Investment logo)(registered trademark)
Corporate Headquarters
245 Summer St., Boston, MA 02210
www.fidelity.com
EQU-UANN-0314
1.789253.112
Fidelity®
Equity-Income
Fund -
Class K
Annual Report
January 31, 2014
(Fidelity Cover Art)
Contents
Performance | How the fund has done over time. | |
Management's Discussion of Fund Performance | The Portfolio Manager's review of fund performance and strategy. | |
Shareholder Expense Example | An example of shareholder expenses. | |
Investment Changes | A summary of major shifts in the fund's investments over the past six months. | |
Investments | A complete list of the fund's investments with their market values. | |
Financial Statements | Statements of assets and liabilities, operations, and changes in net assets, as well as financial highlights. | |
Notes | Notes to the financial statements. | |
Report of Independent Registered Public Accounting Firm |
| |
Trustees and Officers |
| |
Distributions |
|
To view a fund's proxy voting guidelines and proxy voting record for the 12-month period ended June 30, visit http://www.fidelity.com/proxyvotingresults or visit the Securities and Exchange Commission's (SEC) web site at http://www.sec.gov. You may also call 1-800-835-5092 to request a free copy of the proxy voting guidelines.
Standard & Poor's, S&P and S&P 500 are registered service marks of The McGraw-Hill Companies, Inc. and have been licensed for use by Fidelity Distributors Corporation.
Other third-party marks appearing herein are the property of their respective owners.
All other marks appearing herein are registered or unregistered trademarks or service marks of FMR LLC or an affiliated company. © 2014 FMR LLC. All rights reserved.
Annual Report
This report and the financial statements contained herein are submitted for the general information of the shareholders of the fund. This report is not authorized for distribution to prospective investors in the fund unless preceded or accompanied by an effective prospectus.
A fund files its complete schedule of portfolio holdings with the SEC for the first and third quarters of each fiscal year on Form N-Q. Forms N-Q are available on the SEC's web site at http://www.sec.gov. A fund's Forms N-Q may be reviewed and copied at the SEC's Public Reference Room in Washington, DC. Information regarding the operation of the SEC's Public Reference Room may be obtained by calling 1-800-SEC-0330. For a complete list of a fund's portfolio holdings, view the most recent holdings listing, semiannual report, or annual report on Fidelity's web site at http://www.fidelity.com, http://www.advisor.fidelity.com, or http://www.401k.com, as applicable.
NOT FDIC INSURED • MAY LOSE VALUE • NO BANK GUARANTEE
Neither the fund nor Fidelity Distributors Corporation is a bank.
Annual Report
Performance: The Bottom Line
Average annual total return reflects the change in the value of an investment, assuming reinvestment of the class' distributions from dividend income and capital gains (the profits earned upon the sale of securities that have grown in value, if any) and assuming a constant rate of performance each year. The $10,000 table and the fund's returns do not reflect the deduction of taxes that a shareholder would pay on fund distributions or the redemption of fund shares. During periods of reimbursement by Fidelity, a fund's total return will be greater than it would be had the reimbursement not occurred. How a fund did yesterday is no guarantee of how it will do tomorrow.
Average Annual Total Returns
Periods ended January 31, 2014 | Past 1 | Past 5 | Past 10 |
Class KA | 16.87% | 18.39% | 5.52% |
A The initial offering of Class K shares took place on May 9, 2008. Returns prior to May 9, 2008, are those of Fidelity® Equity-Income Fund, the original class of the fund.
$10,000 Over 10 Years
Let's say hypothetically that $10,000 was invested in Fidelity® Equity-Income Fund - Class K on January 31, 2004. The chart shows how the value of your investment would have changed, and also shows how the Russell 3000® Value Index performed over the same period. See footnote A above for additional information regarding the performance of Class K.
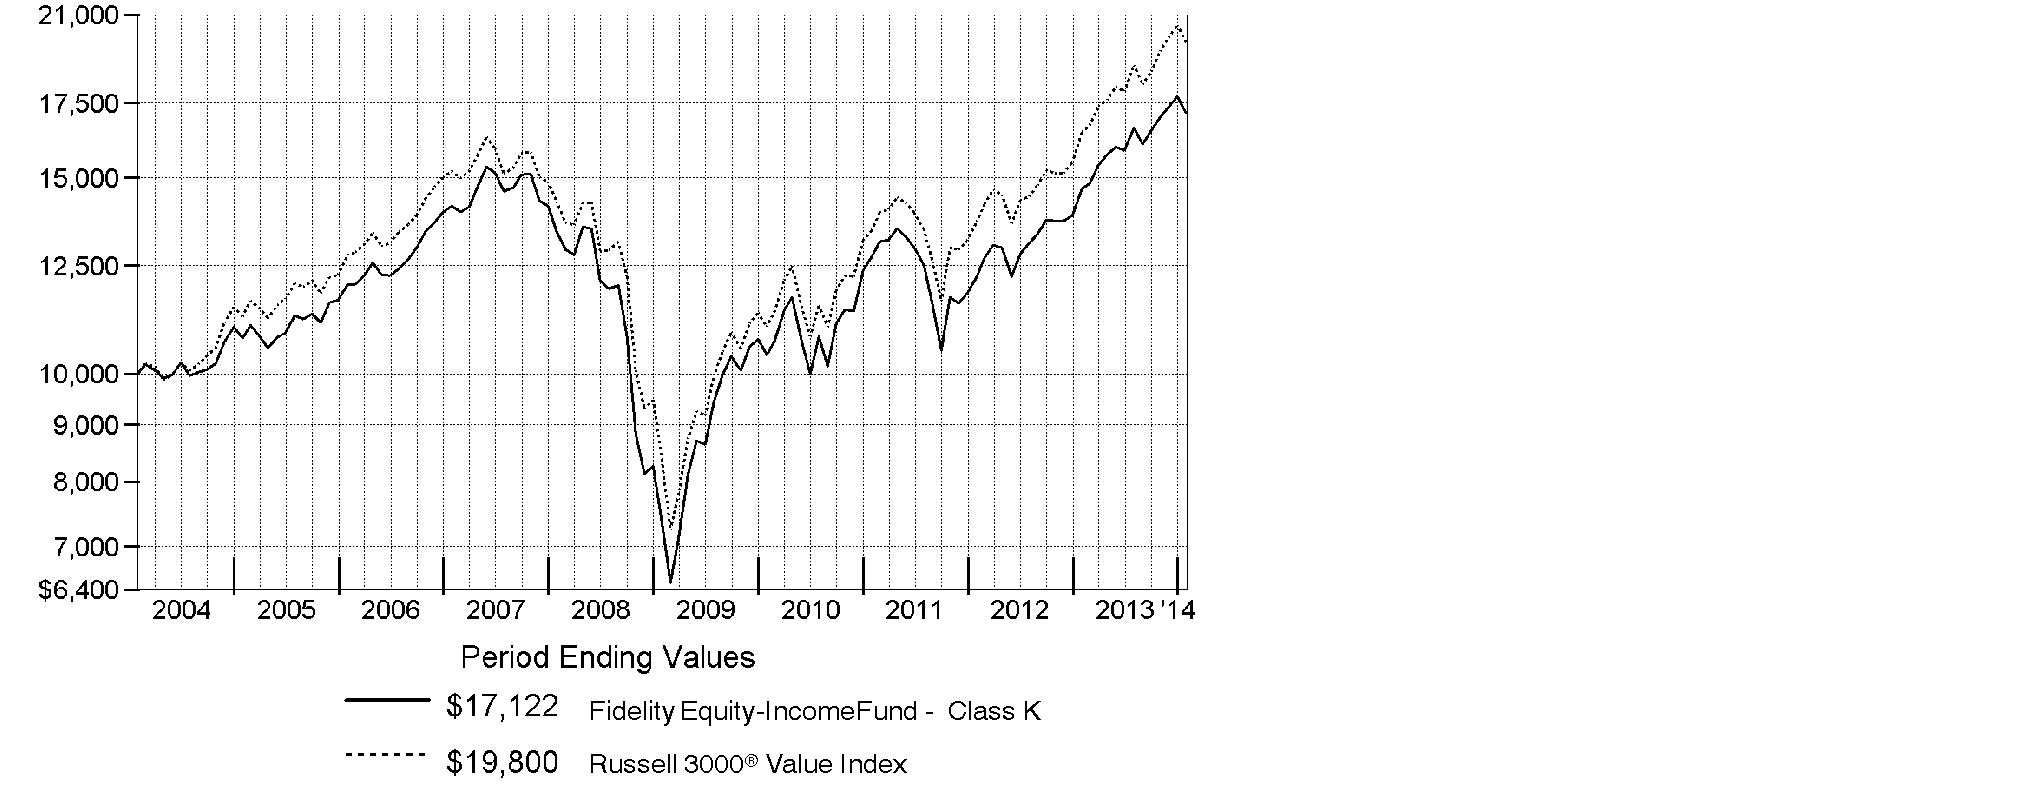
Annual Report
Management's Discussion of Fund Performance
Market Recap: Despite the worst January in years, markets finished notably higher for the 12 months ending January 31, 2014, amid a generally improving global economy and accommodative monetary policies worldwide. After achieving a series of highs in 2013, both the broad S&P 500® Index and the blue-chip Dow Jones Industrial AverageSM pulled back in the new year, bringing their 12-month returns to 21.52% and 16.07%, respectively. The growth-oriented Nasdaq Composite Index®, having run hotter in 2013 and cooled less in January, retained a loftier 32.33% result. For the period overall, smaller-cap stocks generally outperformed larger-caps, and growth outperformed value across market-cap segments. Bullish sentiment drove stocks higher through mid-May, but mixed signals from the U.S. Federal Reserve as to when it might curtail its stimulative bond-buying program, along with jitters over a potential U.S. military strike in Syria, put the markets in flux over the summer. Stocks regained their momentum in October despite a budget impasse that briefly shuttered the federal government, and volatility remained subdued heading into the holidays, allowing many markets to hit all-time highs by year-end. In January, renewed optimism for Europe and other developed markets was overrun by renewed concern about Fed tapering, the economic slowdown in China and a sell-off in emerging markets.
Comments from James Morrow, Lead Portfolio Manager of Fidelity® Equity-Income Fund: For the year, the fund's Class K shares gained 16.87%, trailing the Russell 3000® Value Index, which rose 20.18%. Compared with the index, stock picking in information technology and industrials was detrimental. The fund's average cash allocation of about 5% also detracted in a rising market. On the positive side, the fund benefited from favorable allocations in several sectors, especially software & services within information technology. Nevertheless, the fund's biggest individual detractor - IBM, a diversified technology services company not held in the benchmark - came from this group. In a market environment that rewarded fast-growing, momentum-oriented stocks, steady growers like IBM suffered. Another source of underperformance was Bank of America, a benchmark component that we held only intermittently during the 12 months, and not at period end. Bank of America was the beneficiary of "multiple expansion," which was reflected in a rising stock price without a corresponding increase in estimated earnings. On the positive side, alternative asset manager Blackstone Group was a strong performer, benefiting in part from its dominant competitive position. Media company and cable service provider Comcast was another meaningful contributor.
The views expressed above reflect those of the portfolio manager(s) only through the end of the period as stated on the cover of this report and do not necessarily represent the views of Fidelity or any other person in the Fidelity organization. Any such views are subject to change at any time based upon market or other conditions and Fidelity disclaims any responsibility to update such views. These views may not be relied on as investment advice and, because investment decisions for a Fidelity fund are based on numerous factors, may not be relied on as an indication of trading intent on behalf of any Fidelity fund.
Annual Report
Shareholder Expense Example
As a shareholder of the Fund, you incur two types of costs: (1) transaction costs and (2) ongoing costs, including management fees and other Fund expenses. This Example is intended to help you understand your ongoing costs (in dollars) of investing in the Fund and to compare these costs with the ongoing costs of investing in other mutual funds.
The Example is based on an investment of $1,000 invested at the beginning of the period and held for the entire period (August 1, 2013 to January 31, 2014).
Actual Expenses
The first line of the accompanying table for each class of the Fund provides information about actual account values and actual expenses. You may use the information in this line, together with the amount you invested, to estimate the expenses that you paid over the period. Simply divide your account value by $1,000.00 (for example, an $8,600 account value divided by $1,000.00 = 8.6), then multiply the result by the number in the first line for a class of the Fund under the heading entitled "Expenses Paid During Period" to estimate the expenses you paid on your account during this period. A small balance maintenance fee of $12.00 that is charged once a year may apply for certain accounts with a value of less than $2,000. This fee is not included in the table below. If it was, the estimate of expenses you paid during the period would be higher, and your ending account value lower, by this amount. In addition, the Fund, as a shareholder in the underlying Fidelity Central Funds, will indirectly bear its pro-rata share of the fees and expenses incurred by the underlying Fidelity Central Funds. These fees and expenses are not included in the Fund's annualized expense ratio used to calculate the expense estimate in the table below.
Hypothetical Example for Comparison Purposes
The second line of the accompanying table for each class of the Fund provides information about hypothetical account values and hypothetical expenses based on a Class' actual expense ratio and an assumed rate of return of 5% per year before expenses, which is not the Class' actual return. The hypothetical account values and expenses may not be used to estimate the actual ending account balance or expenses you paid for the period. You may use this information to compare the ongoing costs of investing in the Fund and other funds. To do so, compare this 5% hypothetical example with the 5% hypothetical examples that appear in the shareholder reports of the other funds. A small balance maintenance fee of $12.00 that is charged once a year may apply for certain accounts with a value of less than $2,000. This fee is not included in the table below. If it was, the estimate of expenses you paid during the period would be higher, and your ending account value lower, by this amount. In addition, the Fund, as a shareholder in the underlying Fidelity Central Funds, will indirectly bear its pro-rata share of the fees and expenses incurred by the underlying Fidelity Central Funds. These fees and expenses are not included in the Fund's annualized expense ratio used to calculate the expense estimate in the table below.
Please note that the expenses shown in the table are meant to highlight your ongoing costs only and do not reflect any transaction costs. Therefore, the second line of the table is useful in comparing ongoing costs only, and will not help you determine the relative total costs of owning different funds.
Annual Report
| Annualized | Beginning | Ending | Expenses Paid |
Equity-Income | .64% |
|
|
|
Actual |
| $ 1,000.00 | $ 1,029.50 | $ 3.27 |
HypotheticalA |
| $ 1,000.00 | $ 1,021.98 | $ 3.26 |
Class K | .52% |
|
|
|
Actual |
| $ 1,000.00 | $ 1,030.10 | $ 2.66 |
HypotheticalA |
| $ 1,000.00 | $ 1,022.58 | $ 2.65 |
A 5% return per year before expenses
B Annualized expense ratio reflects expenses net of applicable fee waivers.
* Expenses are equal to each Class' annualized expense ratio, multiplied by the average account value over the period, multiplied by 184/365 (to reflect the one-half year period).
Annual Report
Investment Changes (Unaudited)
Top Ten Stocks as of January 31, 2014 | ||
| % of fund's | % of fund's net assets |
JPMorgan Chase & Co.* | 3.9 | 3.8 |
Chevron Corp. | 2.7 | 2.9 |
Exxon Mobil Corp.* | 2.3 | 2.3 |
Cisco Systems, Inc. | 2.3 | 2.3 |
General Electric Co. | 2.3 | 2.3 |
MetLife, Inc.* | 2.1 | 2.0 |
Merck & Co., Inc.* | 2.0 | 2.0 |
Procter & Gamble Co. | 2.0 | 2.0 |
Johnson & Johnson | 1.8 | 2.4 |
Verizon Communications, Inc. | 1.7 | 1.4 |
| 23.1 | |
* Security or a portion of the security is pledged as collateral for call options written. |
Top Five Market Sectors as of January 31, 2014 | ||
| % of fund's | % of fund's net assets |
Financials | 21.5 | 22.5 |
Energy | 13.5 | 13.2 |
Health Care | 11.8 | 13.6 |
Information Technology | 11.5 | 10.7 |
Industrials | 10.8 | 11.5 |
Asset Allocation (% of fund's net assets) | |||||||
As of January 31, 2014* | As of July 31, 2013** | ||||||
 | Stocks 92.0% |
| | Stocks 92.2% |
| ||
 | Bonds 0.1% |
| | Bonds 0.1% |
| ||
 | Convertible |
| | Convertible |
| ||
 | Other Investments 0.4% |
| | Other Investments 0.3% |
| ||
 | Short-Term |
| | Short-Term |
| ||
* Foreign investments | 13.8% |
| ** Foreign investments | 13.1% |
| ||
* Written options | (0.1)% |
| ** Written options | 0.0% |
| ||

Annual Report
Investments January 31, 2014
Showing Percentage of Net Assets
Common Stocks - 91.5% | |||
Shares | Value (000s) | ||
CONSUMER DISCRETIONARY - 7.3% | |||
Auto Components - 0.3% | |||
Gentex Corp. | 724,673 | $ 23,472 | |
Automobiles - 0.2% | |||
General Motors Co. | 456,057 | 16,455 | |
Diversified Consumer Services - 0.1% | |||
H&R Block, Inc. | 402,200 | 12,227 | |
Hotels, Restaurants & Leisure - 1.7% | |||
Darden Restaurants, Inc. | 257,000 | 12,706 | |
McDonald's Corp. | 806,087 | 75,909 | |
Texas Roadhouse, Inc. Class A | 787,367 | 19,094 | |
Wynn Resorts Ltd. (i) | 44,100 | 9,588 | |
Yum! Brands, Inc. | 568,179 | 38,153 | |
| 155,450 | ||
Household Durables - 0.1% | |||
Coway Co. Ltd. | 67,927 | 4,357 | |
Internet & Catalog Retail - 0.0% | |||
Liberty Interactive Corp. Series A (a) | 151,900 | 4,057 | |
Media - 2.6% | |||
Atresmedia Corporacion de Medios de Comunicacion SA (a) | 406,964 | 7,657 | |
Comcast Corp. Class A | 2,407,479 | 131,087 | |
Sinclair Broadcast Group, Inc. Class A | 414,716 | 13,030 | |
Time Warner, Inc. (i) | 1,506,831 | 94,674 | |
| 246,448 | ||
Multiline Retail - 1.5% | |||
Kohl's Corp. | 826,163 | 41,829 | |
Target Corp. | 1,740,949 | 98,607 | |
| 140,436 | ||
Specialty Retail - 0.7% | |||
Abercrombie & Fitch Co. Class A | 499,920 | 17,687 | |
Dunelm Group PLC | 854,200 | 12,954 | |
Foot Locker, Inc. | 428,635 | 16,545 | |
Lewis Group Ltd. | 972,000 | 5,215 | |
Staples, Inc. | 1,277,404 | 16,811 | |
| 69,212 | ||
Textiles, Apparel & Luxury Goods - 0.1% | |||
Coach, Inc. | 259,806 | 12,442 | |
TOTAL CONSUMER DISCRETIONARY | 684,556 | ||
Common Stocks - continued | |||
Shares | Value (000s) | ||
CONSUMER STAPLES - 10.6% | |||
Beverages - 1.8% | |||
Molson Coors Brewing Co. Class B | 614,395 | $ 32,342 | |
PepsiCo, Inc. | 419,709 | 33,728 | |
The Coca-Cola Co. | 2,556,203 | 96,676 | |
| 162,746 | ||
Food & Staples Retailing - 2.0% | |||
CVS Caremark Corp. | 626,700 | 42,440 | |
Rami Levi Chain Stores Hashikma Marketing 2006 Ltd. | 241,904 | 14,105 | |
Wal-Mart Stores, Inc. | 579,591 | 43,284 | |
Walgreen Co. | 1,565,348 | 89,773 | |
| 189,602 | ||
Food Products - 1.2% | |||
Astral Foods Ltd. | 585,177 | 4,603 | |
B&G Foods, Inc. Class A | 168,593 | 5,525 | |
Hilton Food Group PLC | 2,686,432 | 20,315 | |
Kellogg Co. | 1,392,491 | 80,737 | |
| 111,180 | ||
Household Products - 2.0% | |||
Procter & Gamble Co. | 2,427,697 | 186,010 | |
Tobacco - 3.6% | |||
Altria Group, Inc. (i) | 2,695,758 | 94,945 | |
British American Tobacco PLC: | |||
(United Kingdom) | 360,500 | 17,202 | |
sponsored ADR | 374,672 | 35,965 | |
Japan Tobacco, Inc. | 426,300 | 13,160 | |
Lorillard, Inc. | 1,686,571 | 83,013 | |
Philip Morris International, Inc. | 598,278 | 46,749 | |
Reynolds American, Inc. | 919,300 | 44,586 | |
| 335,620 | ||
TOTAL CONSUMER STAPLES | 985,158 | ||
ENERGY - 12.7% | |||
Energy Equipment & Services - 1.5% | |||
Ensco PLC Class A | 525,847 | 26,487 | |
Halliburton Co. | 52,988 | 2,597 | |
National Oilwell Varco, Inc. | 473,424 | 35,512 | |
Noble Corp. | 1,054,302 | 32,715 | |
Schlumberger Ltd. | 475,643 | 41,652 | |
| 138,963 | ||
Common Stocks - continued | |||
Shares | Value (000s) | ||
ENERGY - continued | |||
Oil, Gas & Consumable Fuels - 11.2% | |||
Access Midstream Partners LP | 273,472 | $ 15,328 | |
Apache Corp. | 816,549 | 65,536 | |
Canadian Natural Resources Ltd. (e) | 1,333,200 | 43,716 | |
Chevron Corp. | 2,244,372 | 250,539 | |
ConocoPhillips Co. | 179,700 | 11,672 | |
CONSOL Energy, Inc. | 834,469 | 31,167 | |
EV Energy Partners LP | 944,117 | 33,932 | |
Exxon Mobil Corp. (i) | 2,335,596 | 215,249 | |
Holly Energy Partners LP | 438,344 | 14,185 | |
HollyFrontier Corp. | 291,732 | 13,507 | |
Legacy Reserves LP | 438,900 | 11,447 | |
Markwest Energy Partners LP | 780,788 | 54,804 | |
Occidental Petroleum Corp. | 802,700 | 70,292 | |
Royal Dutch Shell PLC Class A sponsored ADR | 658,213 | 45,483 | |
Scorpio Tankers, Inc. | 476,084 | 4,761 | |
Suncor Energy, Inc. | 1,542,900 | 50,689 | |
The Williams Companies, Inc. | 2,516,143 | 101,879 | |
Williams Partners LP | 232,900 | 11,668 | |
| 1,045,854 | ||
TOTAL ENERGY | 1,184,817 | ||
FINANCIALS - 20.5% | |||
Capital Markets - 4.0% | |||
Apollo Global Management LLC Class A | 277,260 | 8,997 | |
Apollo Investment Corp. | 3,133,502 | 26,447 | |
Ares Capital Corp. | 384,002 | 6,801 | |
Ashmore Group PLC | 4,542,395 | 24,298 | |
AURELIUS AG | 259,590 | 9,786 | |
BlackRock, Inc. Class A (i) | 50,023 | 15,030 | |
Carlyle Group LP | 330,300 | 11,498 | |
Charles Schwab Corp. | 1,635,153 | 40,584 | |
Greenhill & Co., Inc. | 273,783 | 14,223 | |
Invesco Ltd. | 400,600 | 13,320 | |
KKR & Co. LP | 3,279,900 | 79,078 | |
Morgan Stanley | 1,408,331 | 41,560 | |
The Blackstone Group LP | 2,631,032 | 86,166 | |
| 377,788 | ||
Commercial Banks - 4.4% | |||
CIT Group, Inc. (i) | 271,200 | 12,624 | |
Common Stocks - continued | |||
Shares | Value (000s) | ||
FINANCIALS - continued | |||
Commercial Banks - continued | |||
Comerica, Inc. | 496,300 | $ 22,731 | |
Lakeland Financial Corp. | 224,700 | 8,231 | |
M&T Bank Corp. | 499,178 | 55,663 | |
National Penn Bancshares, Inc. | 426,862 | 4,431 | |
Nordea Bank AB | 810,600 | 10,851 | |
PNC Financial Services Group, Inc. | 264,000 | 21,088 | |
Standard Chartered PLC (United Kingdom) | 1,506,565 | 30,710 | |
Svenska Handelsbanken AB (A Shares) | 432,400 | 20,566 | |
U.S. Bancorp | 2,141,322 | 85,075 | |
Wells Fargo & Co. | 3,020,350 | 136,943 | |
| 408,913 | ||
Diversified Financial Services - 4.7% | |||
JPMorgan Chase & Co. (i) | 6,589,682 | 364,799 | |
KKR Financial Holdings LLC | 6,009,345 | 72,713 | |
| 437,512 | ||
Insurance - 4.6% | |||
ACE Ltd. | 774,727 | 72,677 | |
AFLAC, Inc. | 258,224 | 16,211 | |
Brasil Insurance Participacoes e Administracao SA | 1,394,700 | 10,952 | |
esure Group PLC | 2,656,000 | 11,902 | |
FBD Holdings PLC | 399,803 | 9,598 | |
MetLife, Inc. (i) | 4,053,039 | 198,802 | |
MetLife, Inc. unit | 283,800 | 8,281 | |
Prudential Financial, Inc. | 434,277 | 36,649 | |
The Travelers Companies, Inc. | 256,200 | 20,824 | |
Validus Holdings Ltd. | 1,142,191 | 41,028 | |
| 426,924 | ||
Real Estate Investment Trusts - 2.6% | |||
American Capital Agency Corp. | 2,129,463 | 44,612 | |
American Tower Corp. | 82,200 | 6,648 | |
Annaly Capital Management, Inc. | 3,452,213 | 37,180 | |
CBL & Associates Properties, Inc. | 992,600 | 16,864 | |
Coresite Realty Corp. | 387,764 | 11,897 | |
First Potomac Realty Trust | 1,707,476 | 22,300 | |
Home Properties, Inc. | 574,815 | 32,046 | |
Piedmont Office Realty Trust, Inc. Class A | 535,200 | 8,922 | |
Rayonier, Inc. | 373,055 | 16,511 | |
Retail Properties America, Inc. | 1,553,071 | 20,485 | |
Common Stocks - continued | |||
Shares | Value (000s) | ||
FINANCIALS - continued | |||
Real Estate Investment Trusts - continued | |||
Two Harbors Investment Corp. | 2,155,278 | $ 21,186 | |
Ventas, Inc. | 161,403 | 10,070 | |
| 248,721 | ||
Real Estate Management & Development - 0.1% | |||
Beazer Pre-Owned Rental Homes, Inc. (a)(l) | 393,400 | 8,360 | |
Thrifts & Mortgage Finance - 0.1% | |||
Radian Group, Inc. | 438,145 | 6,520 | |
TOTAL FINANCIALS | 1,914,738 | ||
HEALTH CARE - 10.8% | |||
Biotechnology - 1.0% | |||
Amgen, Inc. | 586,109 | 69,718 | |
Grifols SA ADR | 439,244 | 17,398 | |
| 87,116 | ||
Health Care Equipment & Supplies - 0.7% | |||
Baxter International, Inc. | 275,400 | 18,810 | |
Covidien PLC | 408,000 | 27,842 | |
St. Jude Medical, Inc. | 343,777 | 20,878 | |
| 67,530 | ||
Health Care Providers & Services - 1.1% | |||
Aetna, Inc. | 260,228 | 17,781 | |
Quest Diagnostics, Inc. | 374,872 | 19,681 | |
UnitedHealth Group, Inc. | 681,420 | 49,253 | |
WellPoint, Inc. | 187,379 | 16,115 | |
| 102,830 | ||
Pharmaceuticals - 8.0% | |||
AbbVie, Inc. | 423,144 | 20,831 | |
Actavis PLC (a) | 202,185 | 38,209 | |
Astellas Pharma, Inc. | 310,000 | 19,157 | |
AstraZeneca PLC sponsored ADR | 1,537,100 | 97,606 | |
Eli Lilly & Co. | 412,941 | 22,303 | |
Johnson & Johnson | 1,926,348 | 170,424 | |
Merck & Co., Inc. (i) | 3,555,040 | 188,310 | |
Pfizer, Inc. | 3,608,679 | 109,704 | |
Common Stocks - continued | |||
Shares | Value (000s) | ||
HEALTH CARE - continued | |||
Pharmaceuticals - continued | |||
Sanofi SA | 272,689 | $ 26,658 | |
Teva Pharmaceutical Industries Ltd. sponsored ADR | 1,229,880 | 54,890 | |
| 748,092 | ||
TOTAL HEALTH CARE | 1,005,568 | ||
INDUSTRIALS - 10.2% | |||
Aerospace & Defense - 1.3% | |||
United Technologies Corp. (i) | 1,086,815 | 123,919 | |
Air Freight & Logistics - 2.0% | |||
C.H. Robinson Worldwide, Inc. | 944,456 | 55,288 | |
United Parcel Service, Inc. Class B | 1,397,165 | 133,052 | |
| 188,340 | ||
Airlines - 0.1% | |||
Copa Holdings SA Class A | 54,700 | 7,149 | |
Commercial Services & Supplies - 1.2% | |||
Intrum Justitia AB | 1,358,855 | 38,372 | |
Republic Services, Inc. | 2,430,267 | 77,841 | |
| 116,213 | ||
Electrical Equipment - 0.7% | |||
Eaton Corp. PLC | 203,300 | 14,859 | |
Emerson Electric Co. | 290,487 | 19,155 | |
Hubbell, Inc. Class B | 297,549 | 34,733 | |
| 68,747 | ||
Industrial Conglomerates - 2.4% | |||
General Electric Co. | 8,443,760 | 212,192 | |
Siemens AG (e) | 78,159 | 9,888 | |
| 222,080 | ||
Machinery - 1.2% | |||
Cummins, Inc. | 278,728 | 35,393 | |
Harsco Corp. | 497,691 | 12,636 | |
Stanley Black & Decker, Inc. (i) | 761,378 | 58,931 | |
| 106,960 | ||
Marine - 0.1% | |||
Irish Continental Group PLC unit | 269,300 | 10,061 | |
Professional Services - 0.7% | |||
Acacia Research Corp. | 759,191 | 10,492 | |
Common Stocks - continued | |||
Shares | Value (000s) | ||
INDUSTRIALS - continued | |||
Professional Services - continued | |||
Bureau Veritas SA | 320,327 | $ 8,336 | |
Dun & Bradstreet Corp. | 118,100 | 12,991 | |
Michael Page International PLC | 4,045,483 | 29,607 | |
| 61,426 | ||
Road & Rail - 0.3% | |||
Union Pacific Corp. | 164,276 | 28,623 | |
Trading Companies & Distributors - 0.2% | |||
Wolseley PLC | 259,879 | 14,021 | |
TOTAL INDUSTRIALS | 947,539 | ||
INFORMATION TECHNOLOGY - 10.8% | |||
Communications Equipment - 2.7% | |||
Cisco Systems, Inc. | 9,781,086 | 214,304 | |
QUALCOMM, Inc. | 474,416 | 35,211 | |
| 249,515 | ||
Computers & Peripherals - 0.4% | |||
Apple, Inc. | 56,399 | 28,233 | |
EMC Corp. | 288,562 | 6,995 | |
| 35,228 | ||
Electronic Equipment & Components - 0.4% | |||
TE Connectivity Ltd. | 593,532 | 33,540 | |
IT Services - 3.8% | |||
Accenture PLC Class A | 693,958 | 55,433 | |
IBM Corp. | 871,547 | 153,985 | |
Paychex, Inc. | 3,434,389 | 143,626 | |
| 353,044 | ||
Office Electronics - 0.2% | |||
Xerox Corp. | 1,537,007 | 16,677 | |
Semiconductors & Semiconductor Equipment - 1.6% | |||
Applied Materials, Inc. | 3,552,182 | 59,748 | |
Broadcom Corp. Class A | 2,429,629 | 72,306 | |
Maxim Integrated Products, Inc. | 624,124 | 18,886 | |
| 150,940 | ||
Software - 1.7% | |||
CA Technologies, Inc. | 699,000 | 22,424 | |
Common Stocks - continued | |||
Shares | Value (000s) | ||
INFORMATION TECHNOLOGY - continued | |||
Software - continued | |||
Exact Holdings NV | 215,215 | $ 6,910 | |
Microsoft Corp. | 3,555,516 | 134,576 | |
| 163,910 | ||
TOTAL INFORMATION TECHNOLOGY | 1,002,854 | ||
MATERIALS - 0.9% | |||
Chemicals - 0.5% | |||
Chemtura Corp. (a) | 159,700 | 4,005 | |
RPM International, Inc. | 686,300 | 27,226 | |
Sociedad Quimica y Minera de Chile SA (PN-B) sponsored ADR | 387,618 | 9,656 | |
Tronox Ltd. Class A | 188,735 | 4,145 | |
| 45,032 | ||
Metals & Mining - 0.4% | |||
Commercial Metals Co. | 1,092,066 | 20,815 | |
Freeport-McMoRan Copper & Gold, Inc. | 414,392 | 13,430 | |
| 34,245 | ||
TOTAL MATERIALS | 79,277 | ||
TELECOMMUNICATION SERVICES - 3.9% | |||
Diversified Telecommunication Services - 3.1% | |||
AT&T, Inc. | 2,429,389 | 80,947 | |
CenturyLink, Inc. | 1,644,624 | 47,464 | |
Verizon Communications, Inc. | 3,407,437 | 163,625 | |
| 292,036 | ||
Wireless Telecommunication Services - 0.8% | |||
Safaricom Ltd. | 17,359,000 | 2,208 | |
Vodafone Group PLC | 18,502,641 | 68,566 | |
| 70,774 | ||
TOTAL TELECOMMUNICATION SERVICES | 362,810 | ||
UTILITIES - 3.8% | |||
Electric Utilities - 3.5% | |||
American Electric Power Co., Inc. | 619,582 | 30,242 | |
Exelon Corp. | 498,334 | 14,452 | |
FirstEnergy Corp. | 819,192 | 25,796 | |
Hawaiian Electric Industries, Inc. | 829,915 | 21,594 | |
NextEra Energy, Inc. | 556,767 | 51,184 | |
Common Stocks - continued | |||
Shares | Value (000s) | ||
UTILITIES - continued | |||
Electric Utilities - continued | |||
Northeast Utilities | 307,481 | $ 13,468 | |
PPL Corp. | 1,897,686 | 58,012 | |
Southern Co. | 2,082,277 | 85,873 | |
Xcel Energy, Inc. | 981,735 | 28,382 | |
| 329,003 | ||
Multi-Utilities - 0.3% | |||
Sempra Energy | 326,234 | 30,245 | |
TOTAL UTILITIES | 359,248 | ||
TOTAL COMMON STOCKS (Cost $7,173,969) |
| ||
Preferred Stocks - 1.7% | |||
|
|
|
|
Convertible Preferred Stocks - 1.2% | |||
FINANCIALS - 0.1% | |||
Real Estate Investment Trusts - 0.1% | |||
Weyerhaeuser Co. Series A, 6.375% | 166,500 | 8,929 | |
HEALTH CARE - 0.1% | |||
Health Care Equipment & Supplies - 0.1% | |||
Alere, Inc. 3.00% | 44,000 | 12,959 | |
INDUSTRIALS - 0.2% | |||
Aerospace & Defense - 0.2% | |||
United Technologies Corp. 7.50% | 238,900 | 15,392 | |
Machinery - 0.0% | |||
Stanley Black & Decker, Inc. 6.25% (a) | 20,000 | 2,035 | |
TOTAL INDUSTRIALS | 17,427 | ||
TELECOMMUNICATION SERVICES - 0.2% | |||
Wireless Telecommunication Services - 0.2% | |||
Crown Castle International Corp. Series A, 4.50% | 161,100 | 15,704 | |
UTILITIES - 0.6% | |||
Electric Utilities - 0.2% | |||
NextEra Energy, Inc.: | |||
5.889% | 136,549 | 8,166 | |
Series E, 5.599% | 233,300 | 14,294 | |
| 22,460 | ||
Preferred Stocks - continued | |||
Shares | Value (000s) | ||
Convertible Preferred Stocks - continued | |||
UTILITIES - continued | |||
Multi-Utilities - 0.4% | |||
CenterPoint Energy, Inc. 2.00% ZENS | 274,400 | $ 14,064 | |
Dominion Resources, Inc.: | |||
Series A, 6.125% | 168,100 | 9,402 | |
Series B, 6.00% | 168,100 | 9,419 | |
| 32,885 | ||
TOTAL UTILITIES | 55,345 | ||
TOTAL CONVERTIBLE PREFERRED STOCKS | 110,364 | ||
Nonconvertible Preferred Stocks - 0.5% | |||
CONSUMER DISCRETIONARY - 0.1% | |||
Automobiles - 0.1% | |||
Volkswagen AG | 69,709 | 17,680 | |
FINANCIALS - 0.4% | |||
Consumer Finance - 0.4% | |||
Ally Financial, Inc.: | |||
7.00% (g) | 32,565 | 31,507 | |
Series A, 8.50% | 181,464 | 4,905 | |
| 36,412 | ||
TOTAL NONCONVERTIBLE PREFERRED STOCKS | 54,092 | ||
TOTAL PREFERRED STOCKS (Cost $147,087) |
| ||
Corporate Bonds - 3.2% | ||||
| Principal |
| ||
Convertible Bonds - 3.1% | ||||
CONSUMER DISCRETIONARY - 0.2% | ||||
Automobiles - 0.2% | ||||
Volkswagen International Finance NV 5.5% 11/9/15 (d)(g) | EUR | 9,200 | 14,380 | |
Corporate Bonds - continued | ||||
| Principal | Value (000s) | ||
Convertible Bonds - continued | ||||
ENERGY - 0.5% | ||||
Oil, Gas & Consumable Fuels - 0.5% | ||||
Alpha Natural Resources, Inc. 3.75% 12/15/17 | $ 7,820 | $ 7,400 | ||
Amyris, Inc. 3% 2/27/17 | 2,101 | 1,819 | ||
BPZ Energy, Inc. 8.5% 10/1/17 | 3,640 | 3,413 | ||
Chesapeake Energy Corp. 2.5% 5/15/37 | 13,480 | 13,677 | ||
Cobalt International Energy, Inc. 2.625% 12/1/19 | 5,280 | 4,726 | ||
Ship Finance International Ltd. 3.25% 2/1/18 | 14,710 | 15,475 | ||
| 46,510 | |||
FINANCIALS - 0.4% | ||||
Insurance - 0.2% | ||||
Fidelity National Financial, Inc. 4.25% 8/15/18 | 9,980 | 15,918 | ||
Thrifts & Mortgage Finance - 0.2% | ||||
MGIC Investment Corp. 9% 4/1/63 (g) | 17,382 | 20,057 | ||
TOTAL FINANCIALS | 35,975 | |||
HEALTH CARE - 0.9% | ||||
Biotechnology - 0.1% | ||||
Theravance, Inc. 2.125% 1/15/23 | 7,010 | 10,362 | ||
Health Care Equipment & Supplies - 0.2% | ||||
Teleflex, Inc. 3.875% 8/1/17 | 9,920 | 15,618 | ||
Health Care Providers & Services - 0.6% | ||||
HealthSouth Corp. 2% 12/1/43 | 18,444 | 18,481 | ||
Molina Healthcare, Inc. 1.125% 1/15/20 (g) | 9,410 | 10,139 | ||
WellPoint, Inc. 2.75% 10/15/42 | 22,830 | 29,665 | ||
| 58,285 | |||
TOTAL HEALTH CARE | 84,265 | |||
INDUSTRIALS - 0.4% | ||||
Commercial Services & Supplies - 0.1% | ||||
Covanta Holding Corp. 3.25% 6/1/14 | 8,800 | 10,318 | ||
Construction & Engineering - 0.3% | ||||
Layne Christensen Co. 4.25% 11/15/18 (g) | 5,360 | 5,526 | ||
Corporate Bonds - continued | ||||
| Principal | Value (000s) | ||
Convertible Bonds - continued | ||||
INDUSTRIALS - continued | ||||
Construction & Engineering - continued | ||||
MasTec, Inc.: | ||||
4% 6/15/14 | $ 5,720 | $ 13,056 | ||
4.25% 12/15/14 | 1,970 | 4,606 | ||
| 23,188 | |||
TOTAL INDUSTRIALS | 33,506 | |||
INFORMATION TECHNOLOGY - 0.7% | ||||
Communications Equipment - 0.3% | ||||
InterDigital, Inc. 2.5% 3/15/16 | 18,230 | 18,527 | ||
Liberty Interactive LLC 0.75% 3/30/43 (g) | 4,710 | 5,699 | ||
| 24,226 | |||
Semiconductors & Semiconductor Equipment - 0.3% | ||||
GT Advanced Technologies, Inc.: | ||||
3% 10/1/17 | 19,990 | 30,335 | ||
3% 12/15/20 | 710 | 793 | ||
| 31,128 | |||
Software - 0.1% | ||||
TiVo, Inc. 4% 3/15/16 (g) | 10,130 | 13,321 | ||
TOTAL INFORMATION TECHNOLOGY | 68,675 | |||
MATERIALS - 0.0% | ||||
Chemicals - 0.0% | ||||
RPM International, Inc. 2.25% 12/15/20 | 2,350 | 2,705 | ||
TOTAL CONVERTIBLE BONDS | 286,016 | |||
Nonconvertible Bonds - 0.1% | ||||
FINANCIALS - 0.0% | ||||
Diversified Financial Services - 0.0% | ||||
ILFC E-Capital Trust I 5.46% 12/21/65 (g)(j) | 810 | 740 | ||
MATERIALS - 0.1% | ||||
Metals & Mining - 0.1% | ||||
Boart Longyear Management Pty Ltd. 7% 4/1/21 (g) | 5,525 | 4,158 | ||
Corporate Bonds - continued | ||||
| Principal | Value (000s) | ||
Nonconvertible Bonds - continued | ||||
MATERIALS - continued | ||||
Metals & Mining - continued | ||||
JMC Steel Group, Inc. 8.25% 3/15/18 (g) | $ 2,265 | $ 2,344 | ||
Walter Energy, Inc. 8.5% 4/15/21 | 7,720 | 5,713 | ||
| 12,215 | |||
TOTAL NONCONVERTIBLE BONDS | 12,955 | |||
TOTAL CORPORATE BONDS (Cost $269,667) |
| |||
Preferred Securities - 0.1% | |||
|
|
|
|
FINANCIALS - 0.1% | |||
Diversified Financial Services - 0.1% | |||
Baggot Securities Ltd. 10.24% (g)(h) (Cost $6,128) | 3,990 |
| |
Other - 0.3% | |||
|
|
|
|
ENERGY - 0.3% | |||
Oil, Gas & Consumable Fuels - 0.3% | |||
EQTY ER Holdings, LLC 12% 1/28/18 (f)(k)(l) | 22,667 | 22,667 | |
Shares |
| ||
EQTY ER Holdings, LLC (f)(k)(l) | 11,333,334 | 10,312 | |
TOTAL OTHER (Cost $34,000) |
| ||
Money Market Funds - 3.3% | |||
|
|
|
|
Fidelity Cash Central Fund, 0.10% (b) | 285,111,312 | 285,111 | |
Fidelity Securities Lending Cash Central Fund, 0.09% (b)(c) | 21,094,938 | 21,095 | |
TOTAL MONEY MARKET FUNDS (Cost $306,206) |
| ||
Cash Equivalents - 0.1% | |||
Maturity Amount (000s) | Value (000s) | ||
Investments in repurchase agreements in a joint trading account at 0.03%, dated 1/31/14 due 2/3/14 (Collateralized by U.S. Treasury Obligations) # | $ 6,705 | $ 6,705 | |
TOTAL INVESTMENT PORTFOLIO - 100.2% (Cost $7,943,762) | 9,342,153 | ||
NET OTHER ASSETS (LIABILITIES) - (0.2)% | (20,497) | ||
NET ASSETS - 100% | $ 9,321,656 | ||
Written Options | |||||||
Expiration Date/Exercise Price | Number of Contracts | Premium (000s) | Value | ||||
Call Options | |||||||
Altria Group, Inc. | 3/22/14 - | 7,346 | $ 282 | $ (62) | |||
BlackRock, Inc. Class A | 3/22/14 - | 125 | 24 | (24) | |||
CIT Group, Inc. | 4/19/14 - | 1,356 | 126 | (91) | |||
Exxon Mobil Corp. | 4/19/14 - | 5,839 | 487 | (219) | |||
JPMorgan Chase & Co. | 4/19/14 - | 13,179 | 687 | (843) | |||
Merck & Co., Inc. | 3/22/14 - | 11,732 | 2,015 | (1,889) | |||
MetLife, Inc. | 4/19/14 - | 13,375 | 447 | (562) | |||
Stanley Black & Decker, Inc. | 4/19/14 - | 2,513 | 132 | (138) | |||
Time Warner, Inc. | 3/22/14 - | 4,973 | 246 | (261) | |||
Written Options - continued | |||||||
Expiration Date/Exercise Price | Number of Contracts | Premium (000s) | Value (000s) | ||||
Call Options - continued | |||||||
United Technologies Corp. | 3/22/14 - | 3,120 | $ 672 | $ (694) | |||
Wynn Resorts Ltd. | 3/22/14 - | 221 | 101 | (333) | |||
TOTAL WRITTEN OPTIONS | $ 5,219 | $ (5,116) | |||||
Currency Abbreviations | ||
EUR | - | European Monetary Unit |
Legend |
(a) Non-income producing |
(b) Affiliated fund that is generally available only to investment companies and other accounts managed by Fidelity Investments. The rate quoted is the annualized seven-day yield of the fund at period end. A complete unaudited listing of the fund's holdings as of its most recent quarter end is available upon request. In addition, each Fidelity Central Fund's financial statements, which are not covered by the Fund's Report of Independent Registered Public Accounting Firm, are available on the SEC's website or upon request. |
(c) Investment made with cash collateral received from securities on loan. |
(d) Amount is stated in United States dollars unless otherwise noted. |
(e) Security or a portion of the security is on loan at period end. |
(f) Affiliated company |
(g) Security exempt from registration under Rule 144A of the Securities Act of 1933. These securities may be resold in transactions exempt from registration, normally to qualified institutional buyers. At the end of the period, the value of these securities amounted to $114,142,000 or 1.2% of net assets. |
(h) Security is perpetual in nature with no stated maturity date. |
(i) Security or a portion of the security is pledged as collateral for call options written. At period end, the value of securities pledged amounted to $381,536,000. |
(j) Coupon rates for floating and adjustable rate securities reflect the rates in effect at period end. |
(k) Investments represent a non-operating interest in oil and gas wells through an entity owned by the fund that is treated as a corporation for U.S. tax purposes. |
(l) Restricted securities - Investment in securities not registered under the Securities Act of 1933 (excluding 144A issues). At the end of the period, the value of restricted securities (excluding 144A issues) amounted to $41,339,000 or 0.4% of net assets. |
Additional information on each restricted holding is as follows: |
Security | Acquisition Date | Acquisition Cost (000s) |
Beazer Pre-Owned Rental Homes, Inc. | 5/3/12 - 10/23/12 | $ 7,868 |
EQTY ER Holdings, LLC 12% 1/28/18 | 1/29/13 | $ 22,667 |
EQTY ER Holdings, LLC | 1/29/13 | $ 11,333 |
# Additional information on each counterparty to the repurchase agreement is as follows: |
Repurchase Agreement / Counterparty | Value |
$6,705,000 due 2/03/14 at 0.03% | |
BNP Paribas Securities Corp. | $ 3,499 |
Barclays Capital, Inc. | 1,861 |
Merrill Lynch, Pierce, Fenner & Smith, Inc. | 1,345 |
| $ 6,705 |
Affiliated Central Funds |
Information regarding fiscal year to date income earned by the Fund from investments in Fidelity Central Funds is as follows: |
Fund | Income earned |
Fidelity Cash Central Fund | $ 443 |
Fidelity Securities Lending Cash Central Fund | 1,015 |
Total | $ 1,458 |
Other Affiliated Issuers |
An affiliated company is a company in which the Fund has ownership of at least 5% of the voting securities. Fiscal year to date transactions with companies which are or were affiliates are as follows: |
Affiliate | Value, | Purchases | Sales | Income | Value, |
EQTY ER Holdings, LLC 12% 1/28/18 | $ 22,667 | $ - | $ - | $ 2,720 | $ 22,667 |
EQTY ER Holdings, LLC | 11,333 | - | - | - | 10,312 |
Manning & Napier, Inc. Class A | 9,577 | - | 13,431 | 109 | - |
Total | $ 43,577 | $ - | $ 13,431 | $ 2,829 | $ 32,979 |
Other Information |
The following is a summary of the inputs used, as of January 31, 2014, involving the Fund's assets and liabilities carried at fair value. The inputs or methodology used for valuing securities may not be an indication of the risk associated with investing in those securities. For more information on valuation inputs, and their aggregation into the levels used in the table below, please refer to the Investment Valuation section in the accompanying Notes to Financial Statements. |
Valuation Inputs at Reporting Date: | ||||
Description | Total | Level 1 | Level 2 | Level 3 |
Investments in Securities: | ||||
Equities: | ||||
Consumer Discretionary | $ 702,236 | $ 697,879 | $ 4,357 | $ - |
Consumer Staples | 985,158 | 954,796 | 30,362 | - |
Energy | 1,184,817 | 1,184,817 | - | - |
Financials | 1,960,079 | 1,903,002 | 48,717 | 8,360 |
Health Care | 1,018,527 | 972,712 | 45,815 | - |
Industrials | 964,966 | 955,078 | 9,888 | - |
Information Technology | 1,002,854 | 1,002,854 | - | - |
Materials | 79,277 | 79,277 | - | - |
Telecommunication Services | 378,514 | 294,244 | 84,270 | - |
Utilities | 414,593 | 378,069 | 36,524 | - |
Corporate Bonds | 298,971 | - | 298,971 | - |
Preferred Securities | 6,271 | - | 6,271 | - |
Other/Energy | 32,979 | - | - | 32,979 |
Valuation Inputs at Reporting Date: | ||||
Description | Total | Level 1 | Level 2 | Level 3 |
Investments in Securities: | ||||
Money Market Funds | $ 306,206 | $ 306,206 | $ - | $ - |
Cash Equivalents | 6,705 | - | 6,705 | - |
Total Investments in Securities: | $ 9,342,153 | $ 8,728,934 | $ 571,880 | $ 41,339 |
Derivative Instruments: | ||||
Liabilities | ||||
Written Options | $ (5,116) | $ (5,116) | $ - | $ - |
Value of Derivative Instruments |
The following table is a summary of the Fund's value of derivative instruments by primary risk exposure as of January 31, 2014. For additional information on derivative instruments, please refer to the Derivative Instruments section in the accompanying Notes to Financial Statements. |
Primary Risk Exposure / | Value | |
| Asset | Liability |
Equity Risk | ||
Written Options (a) | $ - | $ (5,116) |
Total Value of Derivatives | $ - | $ (5,116) |
(a) Gross value is presented in the Statement of Assets and Liabilities in the written options, at value line-item. |
Distribution of investments by country or territory of incorporation, as a percentage of total net assets, is as follows (Unaudited): |
United States of America | 86.2% |
United Kingdom | 5.0% |
Ireland | 1.7% |
Switzerland | 1.2% |
Canada | 1.0% |
Others (Individually Less Than 1%) | 4.9% |
| 100.0% |
See accompanying notes which are an integral part of the financial statements.
Annual Report
Financial Statements
Statement of Assets and Liabilities
Amounts in thousands (except per-share amounts) | January 31, 2014 | |
|
|
|
Assets | ||
Investment in securities, at value (including securities loaned of $20,165 and repurchase agreements of $6,705) - See accompanying schedule: Unaffiliated issuers (cost $7,603,556) | $ 9,002,968 |
|
Fidelity Central Funds (cost $306,206) | 306,206 |
|
Other affiliated issuers (cost $34,000) | 32,979 |
|
Total Investments (cost $7,943,762) |
| $ 9,342,153 |
Cash |
| 486 |
Receivable for investments sold | 16,211 | |
Receivable for fund shares sold | 4,793 | |
Dividends receivable | 11,776 | |
Interest receivable | 2,788 | |
Distributions receivable from Fidelity Central Funds | 33 | |
Prepaid expenses | 20 | |
Other receivables | 977 | |
Total assets | 9,379,237 | |
|
|
|
Liabilities | ||
Payable for investments purchased | $ 18,677 | |
Payable for fund shares redeemed | 6,929 | |
Accrued management fee | 3,614 | |
Written options, at value (premium received $5,219) | 5,116 | |
Other affiliated payables | 1,188 | |
Other payables and accrued expenses | 962 | |
Collateral on securities loaned, at value | 21,095 | |
Total liabilities | 57,581 | |
|
|
|
Net Assets | $ 9,321,656 | |
Net Assets consist of: |
| |
Paid in capital | $ 7,943,130 | |
Undistributed net investment income | 286 | |
Accumulated undistributed net realized gain (loss) on investments and foreign currency transactions | (19,962) | |
Net unrealized appreciation (depreciation) on investments and assets and liabilities in foreign currencies | 1,398,202 | |
Net Assets | $ 9,321,656 | |
See accompanying notes which are an integral part of the financial statements.
Annual Report
Financial Statements - continued
Statement of Assets and Liabilities - continued
Amounts in thousands (except per-share amounts) | January 31, 2014 | |
|
|
|
Equity-Income: | $ 56.69 | |
|
|
|
Class K: | $ 56.67 | |
See accompanying notes which are an integral part of the financial statements.
Annual Report
Statement of Operations
Amounts in thousands | Year ended January 31, 2014 | |
|
|
|
Investment Income |
|
|
Dividends (including $109 earned from other affiliated issuers) |
| $ 262,049 |
Interest (including $2,720 earned from other affiliated issuers) |
| 14,139 |
Income from Fidelity Central Funds |
| 1,458 |
Total income |
| 277,646 |
|
|
|
Expenses | ||
Management fee | $ 42,750 | |
Transfer agent fees | 12,982 | |
Accounting and security lending fees | 1,272 | |
Custodian fees and expenses | 244 | |
Independent trustees' compensation | 49 | |
Appreciation in deferred trustee compensation account | 3 | |
Registration fees | 162 | |
Audit | 131 | |
Legal | 38 | |
Miscellaneous | 78 | |
Total expenses before reductions | 57,709 | |
Expense reductions | (303) | 57,406 |
Net investment income (loss) | 220,240 | |
Realized and Unrealized Gain (Loss) Net realized gain (loss) on: | ||
Investment securities: |
|
|
Unaffiliated issuers | 1,027,450 | |
Other affiliated issuers | 4,854 |
|
Foreign currency transactions | (217) | |
Written options | 4,552 | |
Total net realized gain (loss) |
| 1,036,639 |
Change in net unrealized appreciation (depreciation) on: Investment securities | 189,386 | |
Assets and liabilities in foreign currencies | (317) | |
Written options | 103 | |
Total change in net unrealized appreciation (depreciation) |
| 189,172 |
Net gain (loss) | 1,225,811 | |
Net increase (decrease) in net assets resulting from operations | $ 1,446,051 | |
See accompanying notes which are an integral part of the financial statements.
Annual Report
Financial Statements - continued
Statement of Changes in Net Assets
Amounts in thousands | Year ended | Year ended |
Increase (Decrease) in Net Assets |
|
|
Operations |
|
|
Net investment income (loss) | $ 220,240 | $ 252,434 |
Net realized gain (loss) | 1,036,639 | 813,853 |
Change in net unrealized appreciation (depreciation) | 189,172 | 485,528 |
Net increase (decrease) in net assets resulting | 1,446,051 | 1,551,815 |
Distributions to shareholders from net investment income | (223,502) | (248,423) |
Share transactions - net increase (decrease) | (578,318) | (1,576,112) |
Total increase (decrease) in net assets | 644,231 | (272,720) |
|
|
|
Net Assets | ||
Beginning of period | 8,677,425 | 8,950,145 |
End of period (including undistributed net investment income of $286 and undistributed net investment income of $8,523, respectively) | $ 9,321,656 | $ 8,677,425 |
See accompanying notes which are an integral part of the financial statements.
Annual Report
Financial Highlights - Equity-Income
Years ended January 31, | 2014 | 2013 | 2012 | 2011 | 2010 |
Selected Per-Share Data |
|
|
|
|
|
Net asset value, beginning of period | $ 49.72 | $ 42.77 | $ 45.57 | $ 37.93 | $ 27.48 |
Income from Investment Operations |
|
|
|
|
|
Net investment income (loss) B | 1.26 | 1.32 | .89 | .66 | .63 |
Net realized and unrealized gain (loss) | 6.99 | 6.95 | (2.80) | 7.72 | 10.51 |
Total from investment operations | 8.25 | 8.27 | (1.91) | 8.38 | 11.14 |
Distributions from net investment income | (1.28) | (1.32) | (.89) | (.74) | (.69) |
Net asset value, end of period | $ 56.69 | $ 49.72 | $ 42.77 | $ 45.57 | $ 37.93 |
Total Return A | 16.72% | 19.63% | (4.15)% | 22.32% | 41.02% |
Ratios to Average Net Assets C, E |
|
|
|
|
|
Expenses before reductions | .64% | .67% | .68% | .69% | .74% |
Expenses net of fee waivers, if any | .64% | .67% | .68% | .69% | .74% |
Expenses net of all reductions | .64% | .66% | .67% | .68% | .74% |
Net investment income (loss) | 2.30% | 2.89% | 2.04% | 1.62% | 1.87% |
Supplemental Data |
|
|
|
|
|
Net assets, end of period (in millions) | $ 6,842 | $ 6,401 | $ 6,844 | $ 10,049 | $ 15,061 |
Portfolio turnover rate D | 43% | 43% | 80% | 28% | 30% |
A Total returns would have been lower if certain expenses had not been reduced during the applicable periods shown.
B Calculated based on average shares outstanding during the period.
C Fees and expenses of any underlying Fidelity Central Funds are not included in the Fund's expense ratio. The Fund indirectly bears its proportionate share of the expenses of any underlying Fidelity Central Funds.
D Amount does not include the portfolio activity of any underlying Fidelity Central Funds.
E Expense ratios reflect operating expenses of the class. Expenses before reductions do not reflect amounts reimbursed by the investment adviser or reductions from brokerage service arrangements or reductions from other expense offset arrangements and do not represent the amount paid by the class during periods when reimbursements or reductions occur. Expenses net of fee waivers reflect expenses after reimbursement by the investment adviser but prior to reductions from brokerage service arrangements or other expense offset arrangements. Expenses net of all reductions represent the net expenses paid by the class.
See accompanying notes which are an integral part of the financial statements.
Annual Report
Financial Highlights - Class K
Years ended January 31, | 2014 | 2013 | 2012 | 2011 | 2010 |
Selected Per-Share Data |
|
|
|
|
|
Net asset value, beginning of period | $ 49.70 | $ 42.76 | $ 45.56 | $ 37.93 | $ 27.48 |
Income from Investment Operations |
|
|
|
|
|
Net investment income (loss) B | 1.33 | 1.38 | .95 | .72 | .72 |
Net realized and unrealized gain (loss) | 6.99 | 6.95 | (2.79) | 7.72 | 10.48 |
Total from investment operations | 8.32 | 8.33 | (1.84) | 8.44 | 11.20 |
Distributions from net investment income | (1.35) | (1.39) | (.96) | (.81) | (.75) |
Net asset value, end of period | $ 56.67 | $ 49.70 | $ 42.76 | $ 45.56 | $ 37.93 |
Total Return A | 16.87% | 19.78% | (4.00)% | 22.50% | 41.30% |
Ratios to Average Net Assets C, E |
|
|
|
|
|
Expenses before reductions | .52% | .53% | .53% | .53% | .54% |
Expenses net of fee waivers, if any | .52% | .53% | .53% | .53% | .54% |
Expenses net of all reductions | .52% | .52% | .52% | .53% | .54% |
Net investment income (loss) | 2.42% | 3.03% | 2.19% | 1.78% | 2.07% |
Supplemental Data |
|
|
|
|
|
Net assets, end of period (in millions) | $ 2,480 | $ 2,276 | $ 2,106 | $ 2,559 | $ 2,017 |
Portfolio turnover rate D | 43% | 43% | 80% | 28% | 30% |
A Total returns would have been lower if certain expenses had not been reduced during the applicable periods shown.
B Calculated based on average shares outstanding during the period.
C Fees and expenses of any underlying Fidelity Central Funds are not included in the Fund's expense ratio. The Fund indirectly bears its proportionate share of the expenses of any underlying Fidelity Central Funds.
D Amount does not include the portfolio activity of any underlying Fidelity Central Funds.
E Expense ratios reflect operating expenses of the class. Expenses before reductions do not reflect amounts reimbursed by the investment adviser or reductions from brokerage service arrangements or reductions from other expense offset arrangements and do not represent the amount paid by the class during periods when reimbursements or reductions occur. Expenses net of fee waivers reflect expenses after reimbursement by the investment adviser but prior to reductions from brokerage service arrangements or other expense offset arrangements. Expenses net of all reductions represent the net expenses paid by the class.
See accompanying notes which are an integral part of the financial statements.
Annual Report
Notes to Financial Statements
For the period ended January 31, 2014
(Amounts in thousands except percentages)
1. Organization.
Fidelity Equity-Income Fund (the Fund) is a fund of Fidelity Devonshire Trust (the Trust) and is authorized to issue an unlimited number of shares. The Trust is registered under the Investment Company Act of 1940, as amended (the 1940 Act), as an open-end management investment company organized as a Massachusetts business trust. The Fund offers Equity-Income and Class K shares, each of which has equal rights as to assets and voting privileges. Each class has exclusive voting rights with respect to matters that affect that class.
2. Investments in Fidelity Central Funds.
The Fund invests in Fidelity Central Funds, which are open-end investment companies generally available only to other investment companies and accounts managed by the investment adviser and its affiliates. The Fund's Schedule of Investments lists each of the Fidelity Central Funds held as of period end, if any, as an investment of the Fund, but does not include the underlying holdings of each Fidelity Central Fund. As an Investing Fund, the Fund indirectly bears its proportionate share of the expenses of the underlying Fidelity Central Funds.
The Money Market Central Funds seek preservation of capital and current income and are managed by Fidelity Investments Money Management, Inc. (FIMM), an affiliate of the investment adviser. Annualized expenses of the Money Market Central Funds as of their most recent shareholder report date are less than .01%.
A complete unaudited list of holdings for each Fidelity Central Fund is available upon request or at the Securities and Exchange Commission (the SEC) website at www.sec.gov. In addition, the financial statements of the Fidelity Central Funds, which are not covered by the Fund's Report of Independent Registered Public Accounting Firm, are available on the SEC website or upon request.
3. Significant Accounting Policies.
The financial statements have been prepared in conformity with accounting principles generally accepted in the United States of America (GAAP), which require management to make certain estimates and assumptions at the date of the financial statements. Actual results could differ from those estimates. Subsequent events, if any, through the date that the financial statements were issued have been evaluated in the preparation of the financial statements. The following summarizes the significant accounting policies of the Fund:
Investment Valuation. Investments are valued as of 4:00 p.m. Eastern time on the last calendar day of the period. In accordance with valuation policies and procedures approved by the Board of Trustees (the Board), the Fund attempts to obtain prices from
Annual Report
3. Significant Accounting Policies - continued
Investment Valuation - continued
one or more third party pricing vendors or brokers to value its investments. When current market prices, quotations or currency exchange rates are not readily available or reliable, investments will be fair valued in good faith by the Fidelity Management & Research Company (FMR) Fair Value Committee (the Committee), in accordance with procedures adopted by the Board. Factors used in determining fair value vary by investment type and may include market or investment specific events, changes in interest rates and credit quality. The frequency with which these procedures are used cannot be predicted and they may be utilized to a significant extent. The Committee oversees the Fund's valuation policies and procedures and is responsible for approving and reporting to the Board all fair value determinations.
The Fund categorizes the inputs to valuation techniques used to value its investments into a disclosure hierarchy consisting of three levels as shown below:
Level 1 - quoted prices in active markets for identical investments
Level 2 - other significant observable inputs (including quoted prices for similar investments, interest rates, prepayment speeds, etc.)
Level 3 - unobservable inputs (including the Fund's own assumptions based on the best information available)
Valuation techniques used to value the Fund's investments by major category are as follows:
Equity securities, including restricted securities, for which market quotations are readily available, are valued at the last reported sale price or official closing price as reported by a third party pricing vendor on the primary market or exchange on which they are traded and are categorized as Level 1 in the hierarchy. In the event there were no sales during the day or closing prices are not available, securities are valued at the last quoted bid price or may be valued using the last available price and are generally categorized as Level 2 in the hierarchy. For foreign equity securities, when market or security specific events arise, comparisons to the valuation of American Depositary Receipts (ADRs), futures contracts, Exchange-Traded Funds (ETFs) and certain indexes as well as quoted prices for similar securities may be used and would be categorized as Level 2 in the hierarchy. Utilizing these techniques may result in transfers between Level 1 and Level 2. For equity securities, including restricted securities, where observable inputs are limited, assumptions about market activity and risk are used and these securities may be categorized as Level 3 in the hierarchy.
Debt securities, including restricted securities, are valued based on evaluated prices received from third party pricing vendors or from brokers who make markets in such
Annual Report
Notes to Financial Statements - continued
(Amounts in thousands except percentages)
3. Significant Accounting Policies - continued
Investment Valuation - continued
securities. Corporate bonds and preferred securities are valued by pricing vendors who utilize matrix pricing which considers yield or price of bonds of comparable quality, coupon, maturity and type or by broker-supplied prices. When independent prices are unavailable or unreliable, debt securities may be valued utilizing pricing methodologies which consider similar factors that would be used by third party pricing vendors. Debt securities are generally categorized as Level 2 in the hierarchy but may be Level 3 depending on the circumstances.
Exchange-traded options are valued using the last sale price or, in the absence of a sale, the last offering price and are categorized as Level 1 in the hierarchy. Investments in open-end mutual funds, including the Fidelity Central Funds, are valued at their closing net asset value (NAV) each business day and are categorized as Level 1 in the hierarchy. Short-term securities with remaining maturities of sixty days or less may be valued at amortized cost, which approximates fair value, and are categorized as Level 2 in the hierarchy.
Changes in valuation techniques may result in transfers in or out of an assigned level within the disclosure hierarchy. The aggregate value of investments by input level, as of January 31, 2014, is included at the end of the Fund's Schedule of Investments.
Foreign Currency. The Fund may use foreign currency contracts to facilitate transactions in foreign-denominated securities. Gains and losses from these transactions may arise from changes in the value of the foreign currency or if the counterparties do not perform under the contracts' terms.
Foreign-denominated assets, including investment securities, and liabilities are translated into U.S. dollars at the exchange rates at period end. Purchases and sales of investment securities, income and dividends received and expenses denominated in foreign currencies are translated into U.S. dollars at the exchange rate in effect on the transaction date.
The effects of exchange rate fluctuations on investments are included with the net realized and unrealized gain (loss) on investment securities. Other foreign currency transactions resulting in realized and unrealized gain (loss) are disclosed separately.
Investment Transactions and Income. For financial reporting purposes, the Fund's investment holdings and NAV include trades executed through the end of the last business day of the period. The NAV per share for processing shareholder transactions is calculated as of the close of business of the New York Stock Exchange (NYSE), normally 4:00 p.m. Eastern time and includes trades executed through the end of the prior business day. Gains and losses on securities sold are determined on the basis of identified
Annual Report
3. Significant Accounting Policies - continued
Investment Transactions and Income - continued
cost and may include proceeds received from litigation. Dividend income is recorded on the ex-dividend date, except for certain dividends from foreign securities where the ex-dividend date may have passed, which are recorded as soon as the Fund is informed of the ex-dividend date. Non-cash dividends included in dividend income, if any, are recorded at the fair market value of the securities received. Distributions received on securities that represent a return of capital or capital gain are recorded as a reduction of cost of investments and/or as a realized gain. Subsequent to ex-dividend date the Fund determines the components of these distributions, based upon receipt of tax filings or other correspondence relating to the underlying investment. Interest income and distributions from the Fidelity Central Funds are accrued as earned. Interest income includes coupon interest and amortization of premium and accretion of discount on debt securities. Investment income is recorded net of foreign taxes withheld where recovery of such taxes is uncertain.
Class Allocations and Expenses. Investment income, realized and unrealized capital gains and losses, common expenses of the Fund, and certain fund-level expense reductions, if any, are allocated daily on a pro-rata basis to each class based on the relative net assets of each class to the total net assets of the Fund. Each class differs with respect to transfer agent fees incurred. Certain expense reductions may also differ by class. For the reporting period, the allocated portion of income and expenses to each class as a percent of its average net assets may vary due to the timing of recording these transactions in relation to fluctuating net assets of the classes. Expenses directly attributable to a fund are charged to that fund. Expenses attributable to more than one fund are allocated among the respective funds on the basis of relative net assets or other appropriate methods. Expense estimates are accrued in the period to which they relate and adjustments are made when actual amounts are known.
Deferred Trustee Compensation. Under a Deferred Compensation Plan (the Plan), independent Trustees may elect to defer receipt of a portion of their annual compensation. Deferred amounts are invested in a cross-section of Fidelity funds, are marked-to-market and remain in the Fund until distributed in accordance with the Plan. The investment of deferred amounts and the offsetting payable to the Trustees are included in the accompanying Statement of Assets and Liabilities.
Income Tax Information and Distributions to Shareholders. Each year, the Fund intends to qualify as a regulated investment company under Subchapter M of the Internal Revenue Code, including distributing substantially all of its taxable income and realized gains. As a result, no provision for U.S. Federal income taxes is required. As of January 31, 2014, the Fund did not have any unrecognized tax benefits in the financial statements; nor is the Fund aware of any tax positions for which it is reasonably possible
Annual Report
Notes to Financial Statements - continued
(Amounts in thousands except percentages)
3. Significant Accounting Policies - continued
Income Tax Information and Distributions to Shareholders - continued
that the total amounts of unrecognized tax benefits will significantly change in the next twelve months. The Fund files a U.S. federal tax return, in addition to state and local tax returns as required. The Fund's federal income tax returns are subject to examination by the Internal Revenue Service (IRS) for a period of three fiscal years after they are filed. State and local tax returns may be subject to examination for an additional fiscal year depending on the jurisdiction. Foreign taxes are provided for based on the Fund's understanding of the tax rules and rates that exist in the foreign markets in which it invests.
Distributions are declared and recorded on the ex-dividend date. Income dividends and capital gain distributions are declared separately for each class. Income and capital gain distributions are determined in accordance with income tax regulations, which may differ from GAAP. In addition, the Fund claimed a portion of the payment made to redeeming shareholders as a distribution for income tax purposes.
Capital accounts within the financial statements are adjusted for permanent book-tax differences. These adjustments have no impact on net assets or the results of operations. Capital accounts are not adjusted for temporary book-tax differences which will reverse in a subsequent period.
Book-tax differences are primarily due to foreign currency transactions, passive foreign investment companies (PFIC), market discount, contingent interest, equity-debt classifications, partnerships, deferred trustees compensation, capital loss carryforwards and losses deferred due to wash sales.
The federal tax cost of investment securities and unrealized appreciation (depreciation) as of period end were as follows:
Gross unrealized appreciation | $ 1,579,251 |
Gross unrealized depreciation | (200,535) |
Net unrealized appreciation (depreciation) on securities and other investments | $ 1,378,716 |
|
|
Tax Cost | $ 7,963,437 |
The tax-based components of distributable earnings as of period end were as follows:
Undistributed ordinary income | $ 4,268 |
Net unrealized appreciation (depreciation) | $ 1,378,527 |
The tax character of distributions paid was as follows:
| January 31, 2014 | January 31, 2013 |
Ordinary Income | $ 223,502 | $ 248,423 |
Annual Report
3. Significant Accounting Policies - continued
Repurchase Agreements. Pursuant to an Exemptive Order issued by the SEC, the Fund along with other registered investment companies having management contracts with FMR, or other affiliated entities of FMR, are permitted to transfer uninvested cash balances into joint trading accounts which are then invested in repurchase agreements. The Fund may also invest directly with institutions in repurchase agreements. Repurchase agreements may be collateralized by government or non-government securities. Upon settlement date, collateral is held in segregated accounts with custodian banks and may be obtained in the event of a default of the counterparty. The Fund monitors, on a daily basis, the value of the collateral to ensure it is at least equal to the principal amount of the repurchase agreement (including accrued interest). In the event of a default by the counterparty, realization of the collateral proceeds could be delayed, during which time the value of the collateral may decline.
Restricted Securities. The Fund may invest in securities that are subject to legal or contractual restrictions on resale. These securities generally may be resold in transactions exempt from registration or to the public if the securities are registered. Disposal of these securities may involve time-consuming negotiations and expense, and prompt sale at an acceptable price may be difficult. Information regarding restricted securities is included at the end of the Fund's Schedule of Investments.
4. Derivative Instruments.
Risk Exposures and the Use of Derivative Instruments. The Fund's investment objective allows the Fund to enter into various types of derivative contracts, including options. Derivatives are investments whose value is primarily derived from underlying assets, indices or reference rates and may be transacted on an exchange or over-the-counter (OTC). Derivatives may involve a future commitment to buy or sell a specified asset based on specified terms, to exchange future cash flows at periodic intervals based on a notional principal amount, or for one party to make one or more payments upon the occurrence of specified events in exchange for periodic payments from the other party.
The Fund used derivatives to increase returns and to manage exposure to certain risks as defined below. The success of any strategy involving derivatives depends on analysis of numerous economic factors, and if the strategies for investment do not work as intended, the Fund may not achieve its objectives.
Annual Report
Notes to Financial Statements - continued
(Amounts in thousands except percentages)
4. Derivative Instruments - continued
Risk Exposures and the Use of Derivative Instruments - continued
The Fund's use of derivatives increased or decreased its exposure to the following risk:
Equity Risk | Equity risk relates to the fluctuations in the value of financial instruments as a result of changes in market prices (other than those arising from interest rate risk or foreign exchange risk), whether caused by factors specific to an individual investment, its issuer, or all factors affecting all instruments traded in a market or market segment. |
The Fund is also exposed to additional risks from investing in derivatives, such as liquidity risk and counterparty credit risk. Liquidity risk is the risk that the Fund will be unable to close out the derivative in the open market in a timely manner. Counterparty credit risk is the risk that the counterparty will not be able to fulfill its obligation to the Fund. Counterparty credit risk related to exchange-traded options may be mitigated by the protection provided by the exchange on which they trade.
Investing in derivatives may involve greater risks than investing in the underlying assets directly and, to varying degrees, may involve risk of loss in excess of any initial investment and collateral received and amounts recognized in the Statement of Assets and Liabilities. In addition, there may be the risk that the change in value of the derivative contract does not correspond to the change in value of the underlying instrument.
Options. Options give the purchaser the right, but not the obligation, to buy (call) or sell (put) an underlying security or financial instrument at an agreed exercise or strike price between or on certain dates. Options obligate the seller (writer) to buy (put) or sell (call) an underlying instrument at the exercise or strike price or cash settle an underlying derivative instrument if the holder exercises the option on or before the expiration date.
The Fund used exchange-traded written covered call options to manage its exposure to the market. When the Fund writes a covered call option, the Fund holds the underlying instrument which must be delivered to the holder upon the exercise of the option.
Upon entering into a written options contract, the Fund will receive a premium. Premiums received are reflected as a liability on the Statement of Assets and Liabilities. Options are valued daily and any unrealized appreciation (depreciation) is reflected on the Statement of Assets and Liabilities. When a written option is exercised, the premium is added to the proceeds from the sale of the underlying instrument in determining the gain or loss realized on that investment. When an option is closed the Fund will realize a gain or loss depending on whether the proceeds or amount paid for the closing sale transaction are greater or less than the premium received. When an option expires, gains and losses are realized to the extent of premiums received. The net realized gain (loss)
Annual Report
4. Derivative Instruments - continued
Options - continued
on closed and expired written options and the change in net unrealized appreciation (depreciation) on written options are reflected separately on the Statement of Operations.
Writing call options tends to decrease exposure to the underlying instrument and risk of loss is the change in value in excess of the premium received.
Any open options at period end are presented in the Schedule of Investments under the caption "Written Options" and are representative of volume of activity during the period.
During the period, the Fund recognized net realized gain (loss) of $4,552 and a change in net unrealized appreciation (depreciation) of $103 related to its investment in written options. This amount is included in the Statement of Operations.
The following is a summary of the Fund's written options activity:
Written Options | Number of Contracts | Amount of Premiums |
Outstanding at beginning of period | - | $ - |
Options Opened | 232 | 16,412 |
Options Exercised | (96) | (6,184) |
Options Closed | (50) | (2,551) |
Options Expired | (22) | (2,458) |
Outstanding at end of period | 64 | $ 5,219 |
5. Purchases and Sales of Investments.
Purchases and sales of securities, other than short-term securities, aggregated $3,854,100 and $4,519,550, respectively.
6. Fees and Other Transactions with Affiliates.
Management Fee. Fidelity Management & Research Company (the investment adviser) and its affiliates provide the Fund with investment management related services for which the Fund pays a monthly management fee. The management fee is the sum of an individual fund fee rate that is based on an annual rate of .20% of the Fund's average net assets and an annualized group fee rate that averaged .25% during the period. The group fee rate is based upon the average net assets of all the mutual funds advised by the investment adviser, including any mutual funds previously advised by the investment adviser that are currently advised by Fidelity SelectCo, LLC, an affiliate of the investment adviser. The group fee rate decreases as assets under management increase and increases as assets under management decrease. For the reporting period, the total annual management fee rate was .45% of the Fund's average net assets.
Annual Report
Notes to Financial Statements - continued
(Amounts in thousands except percentages)
6. Fees and Other Transactions with Affiliates - continued
Transfer Agent Fees. Fidelity Investments Institutional Operations Company, Inc., (FIIOC), an affiliate of the investment adviser, is the transfer, dividend disbursing and shareholder servicing agent for each class of the Fund. FIIOC receives account fees and asset-based fees that vary according to the account size and type of account of the shareholders of Equity-Income. FIIOC receives an asset-based fee of Class K's average net assets. FIIOC pays for typesetting, printing and mailing of shareholder reports, except proxy statements.
For the period, transfer agent fees for each class were as follows:
| Amount | % of |
Equity-Income | $ 11,782 | .17 |
Class K | 1,200 | .05 |
| $ 12,982 |
|
Accounting and Security Lending Fees. Fidelity Service Company, Inc. (FSC), an affiliate of the investment adviser, maintains the Fund's accounting records. The accounting fee is based on the level of average net assets for each month. Under a separate contract, FSC administers the security lending program. The security lending fee is based on the number and duration of lending transactions.
Brokerage Commissions. The Fund placed a portion of its portfolio transactions with brokerage firms which are affiliates of the investment adviser. Brokerage commissions are included in net realized gain (loss) and change in net unrealized appreciation (depreciation) in the Statement of Operations. The commissions paid to these affiliated firms were $69 for the period.
7. Committed Line of Credit.
The Fund participates with other funds managed by the investment adviser or an affiliate in a $4.25 billion credit facility (the "line of credit") to be utilized for temporary or emergency purposes to fund shareholder redemptions or for other short-term liquidity purposes. The Fund has agreed to pay commitment fees on its pro-rata portion of the line of credit, which amounted to $18 and is reflected in Miscellaneous expenses on the Statement of Operations. During the period, there were no borrowings on this line of credit.
8. Security Lending.
The Fund lends portfolio securities through a lending agent from time to time in order to earn additional income. For equity securities, a lending agent is used and may loan
Annual Report
8. Security Lending - continued
securities to certain qualified borrowers, including Fidelity Capital Markets (FCM), a broker-dealer affiliated with the Fund. On the settlement date of the loan, the Fund receives collateral (in the form of U.S. Treasury obligations, letters of credit and/or cash) against the loaned securities and maintains collateral in an amount not less than 100% of the market value of the loaned securities during the period of the loan. The market value of the loaned securities is determined at the close of business of the Fund and any additional required collateral is delivered to the Fund on the next business day. If the borrower defaults on its obligation to return the securities loaned because of insolvency or other reasons, the Fund may apply collateral received from the borrower against the obligation. The Fund may experience delays and costs in recovering the securities loaned. Any cash collateral received is invested in the Fidelity Securities Lending Cash Central Fund. The value of loaned securities and cash collateral at period end are disclosed on the Fund's Statement of Assets and Liabilities. At period end, there were no security loans outstanding with FCM. Security lending income represents the income earned on investing cash collateral, less rebates paid to borrowers and any lending agent fees associated with the loan, plus any premium payments received for lending certain types of securities. Security lending income is presented in the Statement of Operations as a component of income from Fidelity Central Funds. Total security lending income during the period amounted to $1,015, including $4 from securities loaned to FCM.
9. Expense Reductions.
Commissions paid to certain brokers with whom the investment adviser, or its affiliates, places trades on behalf of the Fund include an amount in addition to trade execution, which may be rebated back to the Fund to offset certain expenses. This amount totaled $205 for the period. In addition, through arrangements with the Fund's custodian, credits realized as a result of uninvested cash balances were used to reduce the Fund's expenses. During the period, these credits reduced the Fund's custody expenses by $3.
The investment adviser reimbursed a portion of the Fund's operating expenses during the period in the amount of $95.
10. Distributions to Shareholders.
Distributions to shareholders of each class were as follows:
Years ended January 31, | 2014 | 2013 |
From net investment income |
|
|
Equity-Income | $ 162,301 | $ 184,959 |
Class K | 61,201 | 63,464 |
Total | $ 223,502 | $ 248,423 |
Annual Report
Notes to Financial Statements - continued
(Amounts in thousands except percentages)
11. Share Transactions.
Transactions for each class of shares were as follows:
| Shares | Dollars | ||
Years ended January 31, | 2014 | 2013 | 2014 | 2013 |
Equity-Income |
|
|
|
|
Shares sold | 17,005 | 14,447 | $ 931,713 | $ 652,997 |
Reinvestment of distributions | 2,821 | 3,847 | 154,118 | 176,234 |
Shares redeemed | (27,886) | (49,571) | (1,544,782) | (2,252,887) |
Net increase (decrease) | (8,060) | (31,277) | $ (458,951) | $ (1,423,656) |
Class K |
|
|
|
|
Shares sold | 10,707 | 14,463 | $ 584,691 | $ 662,159 |
Reinvestment of distributions | 1,121 | 1,385 | 61,201 | 63,464 |
Shares redeemed | (13,867) | (19,293) | (765,259) | (878,079) |
Net increase (decrease) | (2,039) | (3,445) | $ (119,367) | $ (152,456) |
12. Other.
The Fund's organizational documents provide former and current trustees and officers with a limited indemnification against liabilities arising in connection with the performance of their duties to the Fund. In the normal course of business, the Fund may also enter into contracts that provide general indemnifications. The Fund's maximum exposure under these arrangements is unknown as this would be dependent on future claims that may be made against the Fund. The risk of material loss from such claims is considered remote.
Annual Report
Report of Independent Registered Public Accounting Firm
To the Trustees of Fidelity Devonshire Trust and the Shareholders of Fidelity Equity-Income Fund:
In our opinion, the accompanying statement of assets and liabilities, including the schedule of investments, and the related statements of operations and of changes in net assets and the financial highlights present fairly, in all material respects, the financial position of Fidelity Equity-Income Fund (a fund of Fidelity Devonshire Trust) at January 31, 2014, the results of its operations for the year then ended, the changes in its net assets for each of the two years in the period then ended and the financial highlights for each of the five years in the period then ended, in conformity with accounting principles generally accepted in the United States of America. These financial statements and financial highlights (hereafter referred to as "financial statements") are the responsibility of the Fidelity Equity-Income Fund's management. Our responsibility is to express an opinion on these financial statements based on our audits. We conducted our audits of these financial statements in accordance with the standards of the Public Company Accounting Oversight Board (United States). Those standards require that we plan and perform the audit to obtain reasonable assurance about whether the financial statements are free of material misstatement. An audit includes examining, on a test basis, evidence supporting the amounts and disclosures in the financial statements, assessing the accounting principles used and significant estimates made by management, and evaluating the overall financial statement presentation. We believe that our audits, which included confirmation of securities at January 31, 2014 by correspondence with the custodian and brokers, provide a reasonable basis for our opinion.
PricewaterhouseCoopers LLP
Boston, Massachusetts
March 19, 2014
Annual Report
Trustees and Officers
The Trustees, Member of the Advisory Board, and officers of the trust and fund, as applicable, are listed below. The Board of Trustees governs the fund and is responsible for protecting the interests of shareholders. The Trustees are experienced executives who meet periodically throughout the year to oversee the fund's activities, review contractual arrangements with companies that provide services to the fund, oversee management of the risks associated with such activities and contractual arrangements, and review the fund's performance. Except for James C. Curvey, Ned C. Lautenbach, and William S. Stavropoulos, each of the Trustees oversees 173 funds. Mr. Curvey oversees 396 funds. Mr. Lautenbach and Mr. Stavropoulos each oversees 247 funds.
The Trustees hold office without limit in time except that (a) any Trustee may resign; (b) any Trustee may be removed by written instrument, signed by at least two-thirds of the number of Trustees prior to such removal; (c) any Trustee who requests to be retired or who has become incapacitated by illness or injury may be retired by written instrument signed by a majority of the other Trustees; and (d) any Trustee may be removed at any special meeting of shareholders by a two-thirds vote of the outstanding voting securities of the trust. Each Trustee who is not an interested person (as defined in the 1940 Act) of the trust and the fund (Independent Trustee), shall retire not later than the last day of the calendar year in which his or her 75th birthday occurs. The Independent Trustees may waive this mandatory retirement age policy with respect to individual Trustees. The officers and Advisory Board Member hold office without limit in time, except that any officer and Advisory Board Member may resign or may be removed by a vote of a majority of the Trustees at any regular meeting or any special meeting of the Trustees. Except as indicated, each individual has held the office shown or other offices in the same company for the past five years.
Experience, Skills, Attributes, and Qualifications of the Fund's Trustees. The Governance and Nominating Committee has adopted a statement of policy that describes the experience, qualifications, attributes, and skills that are necessary and desirable for potential Independent Trustee candidates (Statement of Policy). The Board believes that each Trustee satisfied at the time he or she was initially elected or appointed a Trustee, and continues to satisfy, the standards contemplated by the Statement of Policy. The Governance and Nominating Committee also engages professional search firms to help identify potential Independent Trustee candidates who have the experience, qualifications, attributes, and skills consistent with the Statement of Policy. From time to time, additional criteria based on the composition and skills of the current Independent Trustees, as well as experience or skills that may be appropriate in light of future changes to board composition, business conditions, and regulatory or other developments, have also been considered by the professional search firms and the Governance and Nominating Committee. In addition, the Board takes into account the Trustees' commitment and participation in Board and committee meetings, as well as their leadership of standing and ad hoc committees throughout their tenure.
In determining that a particular Trustee was and continues to be qualified to serve as a Trustee, the Board has considered a variety of criteria, none of which, in isolation, was controlling. The Board believes that, collectively, the Trustees have balanced and diverse experience, qualifications, attributes, and skills, which allow the Board to operate effectively in governing the fund and protecting the interests of shareholders. Information about the specific experience, skills, attributes, and qualifications of each Trustee, which in each case led to the Board's conclusion that the Trustee should serve (or continue to serve) as a trustee of the fund, is provided below.
Annual Report
Trustees and Officers - continued
Board Structure and Oversight Function. James C. Curvey is an interested person (as defined in the 1940 Act) and currently serves as Chairman. The Trustees have determined that an interested Chairman is appropriate and benefits shareholders because an interested Chairman has a personal and professional stake in the quality and continuity of services provided to the fund. Independent Trustees exercise their informed business judgment to appoint an individual of their choosing to serve as Chairman, regardless of whether the Trustee happens to be independent or a member of management. The Independent Trustees have determined that they can act independently and effectively without having an Independent Trustee serve as Chairman and that a key structural component for assuring that they are in a position to do so is for the Independent Trustees to constitute a substantial majority for the Board. The Independent Trustees also regularly meet in executive session. Ned C. Lautenbach serves as Chairman of the Independent Trustees and as such (i) acts as a liaison between the Independent Trustees and management with respect to matters important to the Independent Trustees and (ii) with management prepares agendas for Board meetings.
Fidelity funds are overseen by different Boards of Trustees. The fund's Board oversees Fidelity's equity and high income funds and another Board oversees Fidelity's investment-grade bond, money market, and asset allocation funds. The asset allocation funds may invest in Fidelity funds overseen by the fund's Board. The use of separate Boards, each with its own committee structure, allows the Trustees of each group of Fidelity funds to focus on the unique issues of the funds they oversee, including common research, investment, and operational issues. On occasion, the separate Boards establish joint committees to address issues of overlapping consequences for the Fidelity funds overseen by each Board.
The Trustees operate using a system of committees to facilitate the timely and efficient consideration of all matters of importance to the Trustees, the fund, and fund shareholders and to facilitate compliance with legal and regulatory requirements and oversight of the fund's activities and associated risks. The Board, acting through its committees, has charged FMR and its affiliates with (i) identifying events or circumstances the occurrence of which could have demonstrably adverse effects on the fund's business and/or reputation; (ii) implementing processes and controls to lessen the possibility that such events or circumstances occur or to mitigate the effects of such events or circumstances if they do occur; and (iii) creating and maintaining a system designed to evaluate continuously business and market conditions in order to facilitate the identification and implementation processes described in (i) and (ii) above. Because the day-to-day operations and activities of the fund are carried out by or through FMR, its affiliates and other service providers, the fund's exposure to risks is mitigated but not eliminated by the processes overseen by the Trustees. While each of the Board's committees has responsibility for overseeing different aspects of the fund's activities, oversight is exercised primarily through the Operations, Audit, and Compliance Committees. In addition, the Independent Trustees have worked with FMR to enhance the Board's oversight of investment and financial risks, legal and regulatory risks, technology risks, and operational risks, including the development of additional risk reporting to the Board. For example, a working group comprised of Independent Trustees and FMR has worked and continues to work to review the Fidelity funds' valuation-related activities, reporting and risk management. Appropriate personnel, including but not limited to the fund's Chief Compliance Officer (CCO), FMR's internal auditor, the independent accountants, the fund's Treasurer and portfolio management personnel, make periodic reports to the Board's committees, as appropriate, including an annual review of FMR's risk management program for the Fidelity funds. The responsibilities of each standing committee, including their oversight responsibilities, are described further under "Standing Committees of the Fund's Trustees."
Annual Report
The fund's Statement of Additional Information (SAI) includes more information about the Trustees. To request a free copy, call Fidelity at 1-800-835-5092.
Interested Trustees*:
Correspondence intended for each Trustee who is an interested person may be sent to Fidelity Investments, 245 Summer Street, Boston, Massachusetts 02210.
Name, Year of Birth; Principal Occupations and Other Relevant Experience+ | |
James C. Curvey (1935) | |
Year of Election or Appointment: 2007 Trustee Chairman of the Board of Trustees | |
| Mr. Curvey also serves as Trustee of other Fidelity funds. Mr. Curvey is a Director of Fidelity Investments Money Management, Inc. (2009-present), Director of Fidelity Research & Analysis Co. (2009-present) and Director of FMR and FMR Co., Inc. (2007-present). Mr. Curvey is also Vice Chairman (2007-present) and Director of FMR LLC. In addition, Mr. Curvey serves as an Overseer for the Boston Symphony Orchestra and a member of the Trustees of Villanova University. Previously, Mr. Curvey was the Vice Chairman (2006-2007) and Director (2000-2007) of FMR Corp. |
Charles S. Morrison (1960) | |
Year of Election or Appointment: 2014 Trustee | |
| Mr. Morrison also serves as Trustee or Vice President of other funds. He serves as President, Asset Management (2014-present) and is an employee of Fidelity Investments. Previously, Mr. Morrison served as President, Fixed Income (2011-2014), Vice President of Fidelity's Money Market Funds (2005-2009), President, Money Market Group Leader of FMR (2009), and Senior Vice President, Money Market Group of FMR (2004-2009). Mr. Morrison also served as Vice President of Fidelity's Bond Funds (2002-2005), certain Balanced Funds (2002-2005), and certain Asset Allocation Funds (2002-2007), and as Senior Vice President (2002-2005) of Fidelity's Bond Division. |
* Trustees have been determined to be "Interested Trustees" by virtue of, among other things, their affiliation with the trust or various entities under common control with FMR.
+ The information above includes each Trustee's principal occupation during the last five years and other information relating to the experience, attributes, and skills relevant to each Trustee's qualifications to serve as a Trustee, which led to the conclusion that each Trustee should serve as a Trustee for the fund.
Annual Report
Independent Trustees:
Correspondence intended for each Independent Trustee (that is, the Trustees other than the Interested Trustees) may be sent to Fidelity Investments, P.O. Box 55235, Boston, Massachusetts 02205-5235.
Name, Year of Birth; Principal Occupations and Other Relevant Experience+ | |
Dennis J. Dirks (1948) | |
Year of Election or Appointment: 2005 Trustee | |
| Mr. Dirks also serves as Trustee of other Fidelity funds. Prior to his retirement in May 2003, Mr. Dirks was Chief Operating Officer and a member of the Board of The Depository Trust & Clearing Corporation (DTCC). He also served as President, Chief Operating Officer, and Board member of The Depository Trust Company (DTC) and President and Board member of the National Securities Clearing Corporation (NSCC). In addition, Mr. Dirks served as Chief Executive Officer and Board member of the Government Securities Clearing Corporation, Chief Executive Officer and Board member of the Mortgage-Backed Securities Clearing Corporation, as a Trustee and a member of the Finance Committee of Manhattan College (2005-2008), and as a Trustee and a member of the Finance Committee of AHRC of Nassau County (2006-2008). Mr. Dirks is a member of the Independent Directors Council (IDC) Governing Council (2010-present) and Board of Directors for The Brookville Center for Children's Services, Inc. (2009-present). |
Alan J. Lacy (1953) | |
Year of Election or Appointment: 2008 Trustee | |
| Mr. Lacy also serves as Trustee of other Fidelity funds. Mr. Lacy serves as Senior Adviser (2007-present) of Oak Hill Capital Partners, L.P. (private equity). Mr. Lacy also served as Chief Executive Officer (2000-2005) and Vice Chairman (2005-2006) of Sears Holdings Corporation and Sears, Roebuck and Co. (retail). In addition, Mr. Lacy serves as a member of the Board of Directors of Dave & Buster's Entertainment, Inc. (restaurant and entertainment complexes, 2010-present), Earth Fare, Inc. (retail grocery, 2012-present), The Hillman Companies, Inc. (hardware wholesalers, 2010-present), and Bristol-Myers Squibb Company (global pharmaceuticals, 2008-present). Mr. Lacy is a member of the Board of Trustees of The National Parks Conservation Association (2006-present). Previously, Mr. Lacy served as Chairman of the Board of Trustees of the National Parks Conservation Association (2008-2011) and as a member of the Board of Directors for the Western Union Company (global money transfer, 2006-2011). |
Ned C. Lautenbach (1944) | |
Year of Election or Appointment: 2000 Trustee Chairman of the Independent Trustees | |
| Mr. Lautenbach also serves as Trustee of other Fidelity funds. Mr. Lautenbach currently serves as the Lead Director of the Eaton Corporation Board of Directors (diversified industrial, 1997-present). Mr. Lautenbach is Chairman of the Board of Directors of the Philharmonic Center for the Arts in Naples, Florida (2012-present) and a member of the Council on Foreign Relations (1994-present). Previously, Mr. Lautenbach was a Partner/Advisory Partner at Clayton, Dubilier & Rice, LLC (private equity investment, 1998-2010), as well as a Director of Sony Corporation (2006-2007). |
Joseph Mauriello (1944) | |
Year of Election or Appointment: 2008 Trustee | |
| Mr. Mauriello also serves as Trustee of other Fidelity funds. Prior to his retirement in January 2006, Mr. Mauriello served in numerous senior management positions including Deputy Chairman and Chief Operating Officer (2004-2005), and Vice Chairman of Financial Services (2002-2004) of KPMG LLP US (professional services, 1965-2005). Mr. Mauriello currently serves as a member of the Board of Directors of XL Group plc. (global insurance and re-insurance, 2006-present). Previously, Mr. Mauriello served as a Director of the Hamilton Funds of the Bank of New York (2006-2007) and of Arcadia Resources Inc. (health care services and products, 2007-2012). |
Robert W. Selander (1950) | |
Year of Election or Appointment: 2011 Trustee | |
| Mr. Selander also serves as Trustee of other Fidelity funds. Previously, Mr. Selander served as a Member of the Advisory Board of other Fidelity funds (2011), and Executive Vice Chairman (2010), Chief Executive Officer (2009-2010), and President and Chief Executive Officer (1997-2009) of Mastercard, Inc. |
Cornelia M. Small (1944) | |
Year of Election or Appointment: 2005 Trustee | |
| Ms. Small also serves as Trustee of other Fidelity funds. Ms. Small is a member of the Board of Directors (2009-present) and Chair of the Investment Committee (2010-present) of the Teagle Foundation. Ms. Small also serves on the Investment Committee of the Berkshire Taconic Community Foundation (2008-present). Previously, Ms. Small served as Chairperson (2002-2008) and a member of the Investment Committee and Chairperson (2008-2012) and a member of the Board of Trustees of Smith College. In addition, Ms. Small served as Chief Investment Officer, Director of Global Equity Investments, and a member of the Board of Directors of Scudder, Stevens & Clark and Scudder Kemper Investments. |
William S. Stavropoulos (1939) | |
Year of Election or Appointment: 2002 Trustee Vice Chairman of the Independent Trustees | |
| Mr. Stavropoulos also serves as Trustee of other Fidelity funds. Mr. Stavropoulos serves as President and Founder of the Michigan Baseball Foundation, the Great Lakes Loons (2007-present). Mr. Stavropoulos is Chairman Emeritus of the Board of Directors of The Dow Chemical Company, where he previously served in numerous senior management positions, including President, CEO (1995-2000; 2002-2004), Chairman of the Executive Committee (2000-2006), and as a member of the Board of Directors (1990-2006). Currently, Mr. Stavropoulos is Chairman of the Board of Directors of Univar Inc. (global distributor of commodity and specialty chemicals), a Director of Teradata Corporation (data warehousing and technology solutions), and Maersk Inc. (industrial conglomerate), and a member of the Advisory Board for Metalmark Capital LLC (private equity investment, 2005-present). Mr. Stavropoulos is an operating advisor to Clayton, Dubilier & Rice, LLC (private equity investment). In addition, Mr. Stavropoulos is a member of the University of Notre Dame Advisory Council for the College of Science, a Trustee of the Rollin L. Gerstacker Foundation, and a Director of the Naples Philharmonic Center for the Arts. Previously, Mr. Stavropoulos served as a Director of Chemical Financial Corporation (bank holding company, 1993-2012) and Tyco International, Ltd. (multinational manufacturing and services, 2007-2012). |
David M. Thomas (1949) | |
Year of Election or Appointment: 2008 Trustee | |
| Mr. Thomas also serves as Trustee of other Fidelity funds. Mr. Thomas serves as Non-Executive Chairman of the Board of Directors of Fortune Brands Home and Security (home and security products, 2011-present), and as a member of the Board of Directors of Interpublic Group of Companies, Inc. (marketing communication, 2004-present). Previously, Mr. Thomas served as Executive Chairman (2005-2006) and Chairman and Chief Executive Officer (2000-2005) of IMS Health, Inc. (pharmaceutical and healthcare information solutions), and a Director of Fortune Brands, Inc. (consumer products, 2000-2011). |
+ The information above includes each Trustee's principal occupation during the last five years and other information relating to the experience, attributes, and skills relevant to each Trustee's qualifications to serve as a Trustee, which led to the conclusion that each Trustee should serve as a Trustee for the fund.
Advisory Board Member and Officers:
Correspondence intended for each officer and Peter S. Lynch may be sent to Fidelity Investments, 245 Summer Street, Boston, Massachusetts 02210. Officers appear below in alphabetical order.
Name, Year of Birth; Principal Occupation | |
Peter S. Lynch (1944) | |
Year of Election or Appointment: 2003 Member of the Advisory Board | |
| Mr. Lynch also serves as Member of the Advisory Board of other Fidelity funds. Mr. Lynch is Vice Chairman and a Director of FMR and FMR Co., Inc. In addition, Mr. Lynch serves as a Trustee of Boston College and as the Chairman of the Inner-City Scholarship Fund. Previously, Mr. Lynch served on the Special Olympics International Board of Directors (1997-2006). |
Elizabeth Paige Baumann (1968) | |
Year of Election or Appointment: 2012 Anti-Money Laundering (AML) Officer | |
| Ms. Baumann also serves as AML Officer of other funds. She is Chief AML Officer of FMR LLC (2012-present) and is an employee of Fidelity Investments. Previously, Ms. Baumann served as Vice President and Deputy Anti-Money Laundering Officer (2007-2012). |
William C. Coffey (1969) | |
Year of Election or Appointment: 2009 Assistant Secretary | |
| Mr. Coffey also serves as Assistant Secretary of other funds. He is Senior Vice President and Deputy General Counsel of FMR LLC (2010-present), and is an employee of Fidelity Investments. Previously, Mr. Coffey served as Vice President and Associate General Counsel of FMR LLC (2005-2009). |
Jonathan Davis (1968) | |
Year of Election or Appointment: 2010 Assistant Treasurer | |
| Mr. Davis also serves as Assistant Treasurer of other funds. Mr. Davis is an employee of Fidelity Investments. Previously, Mr. Davis served as Vice President and Associate General Counsel of FMR LLC (2003-2010). |
Adrien E. Deberghes (1967) | |
Year of Election or Appointment: 2008 Deputy Treasurer | |
| Mr. Deberghes also serves as an officer of other funds. He is an employee of Fidelity Investments (2008-present). Prior to joining Fidelity Investments, Mr. Deberghes was Senior Vice President of Mutual Fund Administration at State Street Corporation (2007-2008), Senior Director of Mutual Fund Administration at Investors Bank & Trust (2005-2007), and Director of Finance for Dunkin' Brands (2000-2005). |
Stephanie J. Dorsey (1969) | |
Year of Election or Appointment: 2010 Assistant Treasurer | |
| Ms. Dorsey also serves as an officer of other funds. She is an employee of Fidelity Investments (2008-present) and has served in other fund officer roles. Prior to joining Fidelity Investments, Ms. Dorsey served as Treasurer (2004-2008) of the JPMorgan Mutual Funds and Vice President (2004-2008) of JPMorgan Chase Bank. |
Scott C. Goebel (1968) | |
Year of Election or Appointment: 2008 Secretary and Chief Legal Officer (CLO) | |
| Mr. Goebel serves as Secretary and CLO of other funds. Mr. Goebel also serves as Secretary of Fidelity SelectCo, LLC (2013-present), Fidelity Investments Money Management, Inc. (FIMM) (2010-present) and Fidelity Research and Analysis Company (FRAC) (2010-present); General Counsel, Secretary, and Senior Vice President of FMR (2008-present) and FMR Co., Inc. (2008-present); Chief Legal Officer of Fidelity Management & Research (Hong Kong) Limited (2008-present); and Assistant Secretary of Fidelity Management & Research (Japan) Inc. (2008-present) and Fidelity Management & Research (U.K.) Inc. (2008-present). Previously, Mr. Goebel served as Secretary and CLO of other Fidelity funds (2008-2013), Assistant Secretary of FIMM (2008-2010), FRAC (2008-2010) and certain funds (2007-2008); and as Vice President and Secretary of Fidelity Distributors Corporation (FDC) (2005-2007). Mr. Goebel has been employed by FMR LLC or an affiliate since 2001. |
Joseph A. Hanlon (1968) | |
Year of Election or Appointment: 2012 Chief Compliance Officer | |
| Mr. Hanlon also serves as Chief Compliance Officer of other funds. Mr. Hanlon serves as Compliance Officer of FMR, FMR Co., Inc., Fidelity Investments Money Management, Inc. (FIMM), Fidelity Research and Analysis Company (FRAC), and Fidelity Management & Research (Hong Kong) (2009-present), as Senior Vice President of the Fidelity Asset Management Division (2009-present), and is an employee of Fidelity Investments. Previously, Mr. Hanlon served as Compliance Officer of Fidelity Management & Research (Japan) Inc. (2009-2013), Strategic Advisers, Inc. (2009-2013), and Fidelity Management & Research (U.K.) Inc. (2009-2013). |
Bruce T. Herring (1965) | |
Year of Election or Appointment: 2006 Vice President of certain Equity Funds | |
| Mr. Herring also serves as Vice President of other funds. He serves as Chief Investment Officer of Fidelity Global Asset Allocation (GAA) (2013-present), Group Chief Investment Officer of FMR, and President of Fidelity Research & Analysis Company (2010-present). Previously, Mr. Herring served as Chief Investment Officer and Director of Fidelity Management & Research (U.K.) Inc. (2010-2013), Vice President (2005-2006) and Senior Vice President (2006-2007) of Fidelity Management & Research Company, Vice President of FMR Co., Inc. (2001-2007), and as a portfolio manager for Fidelity U.S. Equity Funds. |
Brian B. Hogan (1964) | |
Year of Election or Appointment: 2009 Vice President | |
| Mr. Hogan also serves as Trustee or Vice President of other funds. Mr. Hogan serves as President of FMR's Equity Division (2009-present). Previously, Mr. Hogan served as Senior Vice President, Equity Research of FMR (2006-2009) and as a portfolio manager. |
Chris Maher (1972) | |
Year of Election or Appointment: 2013 Assistant Treasurer | |
| Mr. Maher serves as Assistant Treasurer of other funds. Mr. Maher is Vice President of Valuation Oversight and is an employee of Fidelity Investments. Previously, Mr. Maher served as Vice President of Asset Management Compliance (2013), Vice President of FMR's Program Management Group (2010-2013), and Vice President of Valuation Oversight (2008-2010). |
Christine Reynolds (1958) | |
Year of Election or Appointment: 2008 Chief Financial Officer | |
| Ms. Reynolds also serves as Chief Financial Officer of other funds. Ms. Reynolds became President of Fidelity Pricing and Cash Management Services (FPCMS) in August 2008. Ms. Reynolds served as Chief Operating Officer of FPCMS (2007-2008). Previously, Ms. Reynolds served as President, Treasurer, and Anti-Money Laundering officer of the Fidelity funds (2004-2007). |
Kenneth B. Robins (1969) | |
Year of Election or Appointment: 2008 President and Treasurer | |
| Mr. Robins also serves as an officer of other funds. Mr. Robins serves as Executive Vice President of Fidelity Investments Money Management, Inc. (FIMM) (2013-present) and is an employee of Fidelity Investments (2004-present). Previously, Mr. Robins served in other fund officer roles. |
Gary W. Ryan (1958) | |
Year of Election or Appointment: 2005 Assistant Treasurer | |
| Mr. Ryan also serves as Assistant Treasurer of other funds. Mr. Ryan is an employee of Fidelity Investments and has served in other fund officer roles. Previously, Mr. Ryan served as Vice President of Fund Reporting in Fidelity Pricing and Cash Management Services (FPCMS) (1999-2005). |
Stephen Sadoski (1971) | |
Year of Election or Appointment: 2012 Deputy Treasurer | |
| Mr. Sadoski also serves as Deputy Treasurer of other funds. He is an employee of Fidelity Investments (2012-present) and has served in another fund officer role. Prior to joining Fidelity Investments, Mr. Sadoski served as an assistant chief accountant in the Division of Investment Management of the Securities and Exchange Commission (SEC) (2009-2012) and as a senior manager at Deloitte & Touche LLP (1997-2009). |
Stacie M. Smith (1974) | |
Year of Election or Appointment: 2013 Deputy Treasurer | |
| Ms. Smith also serves as an officer of other funds. She is an employee of Fidelity Investments (2009-present) and has served in other fund officer roles. Prior to joining Fidelity Investments, Ms. Smith served as Senior Audit Manager of Ernst & Young LLP (1996-2009). |
Renee Stagnone (1975) | |
Year of Election or Appointment: 2013 Deputy Treasurer | |
| Ms. Stagnone also serves as Deputy Treasurer of other funds. Ms. Stagnone is an employee of Fidelity Investments. |
Joseph F. Zambello (1957) | |
Year of Election or Appointment: 2011 Deputy Treasurer | |
| Mr. Zambello also serves as Deputy Treasurer of other funds. Mr. Zambello is an employee of Fidelity Investments. Previously, Mr. Zambello served as Vice President of FMR's Program Management Group (2009-2011) and Vice President of the Transfer Agent Oversight Group (2005-2009). |
Annual Report
Distributions (Unaudited)
The fund hereby designates as a capital gain dividend with respect to the taxable year ended January 31, 2014, $2,355,477, or, if subsequently determined to be different, the net capital gain of such year.
A total of 0.05% of the dividends distributed during the fiscal year was derived from interest on U.S. Government securities which is generally exempt from state income tax.
Class K designates 81%, 78%, 78% and 79% of the dividends distributed in April, July, October and December 2013, respectively during the fiscal year as qualifying for the dividends-received deduction for corporate shareholders.
Class K designates 93%, 93%, 93% and 94% of the dividends distributed in April, July, October and December 2013, respectively during the fiscal year as amounts which may be taken into account as a dividend for the purposes of the maximum rate under section 1(h)(11) of the Internal Revenue Code.
The fund will notify shareholders in January 2015 of amounts for use in preparing 2014 income tax returns.
Annual Report
Investment Adviser
Fidelity Management & Research Company
Boston, MA
Investment Sub-Advisers
FMR Co., Inc.
Fidelity Management & Research
(U.K.) Inc.
Fidelity Management & Research
(Hong Kong) Limited
Fidelity Management & Research
(Japan) Inc.
General Distributor
Fidelity Distributors Corporation
Smithfield, RI
Transfer and Service Agents
Fidelity Investments Institutional
Operations Company, Inc.
Boston, MA
Fidelity Service Company, Inc.
Boston, MA
Custodian
The Northern Trust Company
Chicago, IL
(Fidelity Investment logo)(registered trademark)
Corporate Headquarters
245 Summer St., Boston, MA 02210
www.fidelity.com
EQU-K-UANN-0314
1.863281.105
(Fidelity Investment logo)(registered trademark)
Fidelity Advisor®
Mid Cap Value
Fund - Class A, Class T, Class B
and Class C
Annual Report
January 31, 2014
(Fidelity Cover Art)
Class A, Class T, Class B, and
Class C are classes of Fidelity®
Mid Cap Value Fund
Contents
Performance | How the fund has done over time. | |
Management's Discussion of Fund Performance | The Portfolio Manager's review of fund performance and strategy. | |
Shareholder Expense Example | An example of shareholder expenses. | |
Investment Changes | A summary of major shifts in the fund's investments over the past six months. | |
Investments | A complete list of the fund's investments with their market values. | |
Financial Statements | Statements of assets and liabilities, operations, and changes in net assets, as well as financial highlights. | |
Notes | Notes to the financial statements. | |
Report of Independent Registered Public Accounting Firm |
| |
Trustees and Officers |
| |
Distributions |
|
To view a fund's proxy voting guidelines and proxy voting record for the 12-month period ended June 30, visit http://www.fidelity.com/proxyvotingresults or visit the Securities and Exchange Commission's (SEC) web site at http://www.sec.gov. You may also call 1-877-208-0098 to request a free copy of the proxy voting guidelines.
Standard & Poor's, S&P and S&P 500 are registered service marks of The McGraw-Hill Companies, Inc. and have been licensed for use by Fidelity Distributors Corporation.
Other third-party marks appearing herein are the property of their respective owners.
All other marks appearing herein are registered or unregistered trademarks or service marks of FMR LLC or an affiliated company. © 2014 FMR LLC. All rights reserved.
Annual Report
This report and the financial statements contained herein are submitted for the general information of the shareholders of the fund. This report is not authorized for distribution to prospective investors in the fund unless preceded or accompanied by an effective prospectus.
A fund files its complete schedule of portfolio holdings with the SEC for the first and third quarters of each fiscal year on Form N-Q. Forms N-Q are available on the SEC's web site at http://www.sec.gov. A fund's Forms N-Q may be reviewed and copied at the SEC's Public Reference Room in Washington, DC. Information regarding the operation of the SEC's Public Reference Room may be obtained by calling 1-800-SEC-0330. For a complete list of a fund's portfolio holdings, view the most recent holdings listing, semiannual report, or annual report on Fidelity's web site at http://www.fidelity.com, http://www.advisor.fidelity.com, or http://www.401k.com, as applicable.
NOT FDIC INSURED • MAY LOSE VALUE • NO BANK GUARANTEE
Neither the fund nor Fidelity Distributors Corporation is a bank.
Annual Report
Performance: The Bottom Line
Average annual total return reflects the change in the value of an investment, assuming reinvestment of the class' distributions from dividend income and capital gains (the profits earned upon the sale of securities that have grown in value, if any) and assuming a constant rate of performance each year. The $10,000 table and the fund's returns do not reflect the deduction of taxes that a shareholder would pay on fund distributions or the redemption of fund shares. During periods of reimbursement by Fidelity, a fund's total return will be greater than it would be had the reimbursement not occurred. How a fund did yesterday is no guarantee of how it will do tomorrow.
Average Annual Total Returns
Periods ended January 31, 2014 | Past 1 | Past 5 | Past 10 |
Class A (incl. 5.75% sales charge) A | 16.58% | 21.97% | 8.66% |
Class T (incl. 3.50% sales charge) B | 19.00% | 22.22% | 8.72% |
Class B (incl. contingent deferred sales charge) C | 17.70% | 22.29% | 8.74% |
Class C (incl. contingent deferred sales charge) D | 21.77% | 22.47% | 8.73% |
A Class A shares bear a 0.25% 12b-1 fee. The initial offering of Class A shares took place on February 13, 2007. Returns prior to February 13, 2007 are those of Fidelity® Mid Cap Value Fund, the original class of the fund, which has no 12b-1 fee. Had Class A's 12b-1 fee been reflected, returns prior to February 13, 2007 would have been lower.
B Class T shares bear a 0.50% 12b-1 fee. The initial offering of Class T shares took place on February 13, 2007. Returns prior to February 13, 2007 are those of Fidelity® Mid Cap Value Fund, the original class of the fund, which has no 12b-1 fee. Had Class T's 12b-1 fee been reflected, returns prior to February 13, 2007 would have been lower.
C Class B shares bear a 1.00% 12b-1 fee. The initial offering of Class B shares took place on February 13, 2007. Returns prior to February 13, 2007 are those of Fidelity Mid Cap Value Fund, the original class of the fund, which has no 12b-1 fee. Had Class B's 12b-1 fee been reflected, returns prior to February 13, 2007 would have been lower. Class B shares' contingent deferred sales charge included in the past one year, past five years, and past ten years total return figures are 5%, 2%, and 0%, respectively.
D Class C shares bear a 1.00% 12b-1 fee. The initial offering of Class C shares took place on February 13, 2007. Returns prior to February 13, 2007 are those of Fidelity Mid Cap Value Fund, the original class of the fund, which has no 12b-1 fee. Had Class C's 12b-1 fee been reflected, returns prior to February 13, 2007 would have been lower. Class C shares' contingent deferred sales charge included in the past one year, past five years, and past ten years total return figures are 1%, 0%, and 0%, respectively.
Annual Report
$10,000 Over 10 Years
Let's say hypothetically that $10,000 was invested in Fidelity Advisor® Mid Cap Value Fund - Class A on January 31, 2004, and the current 5.75% sales charge was paid. The chart shows how the value of your investment would have changed, and also shows how the Russell Midcap® Value Index performed over the same period. See footnote A on the previous page for additional information regarding the performance of Class A.
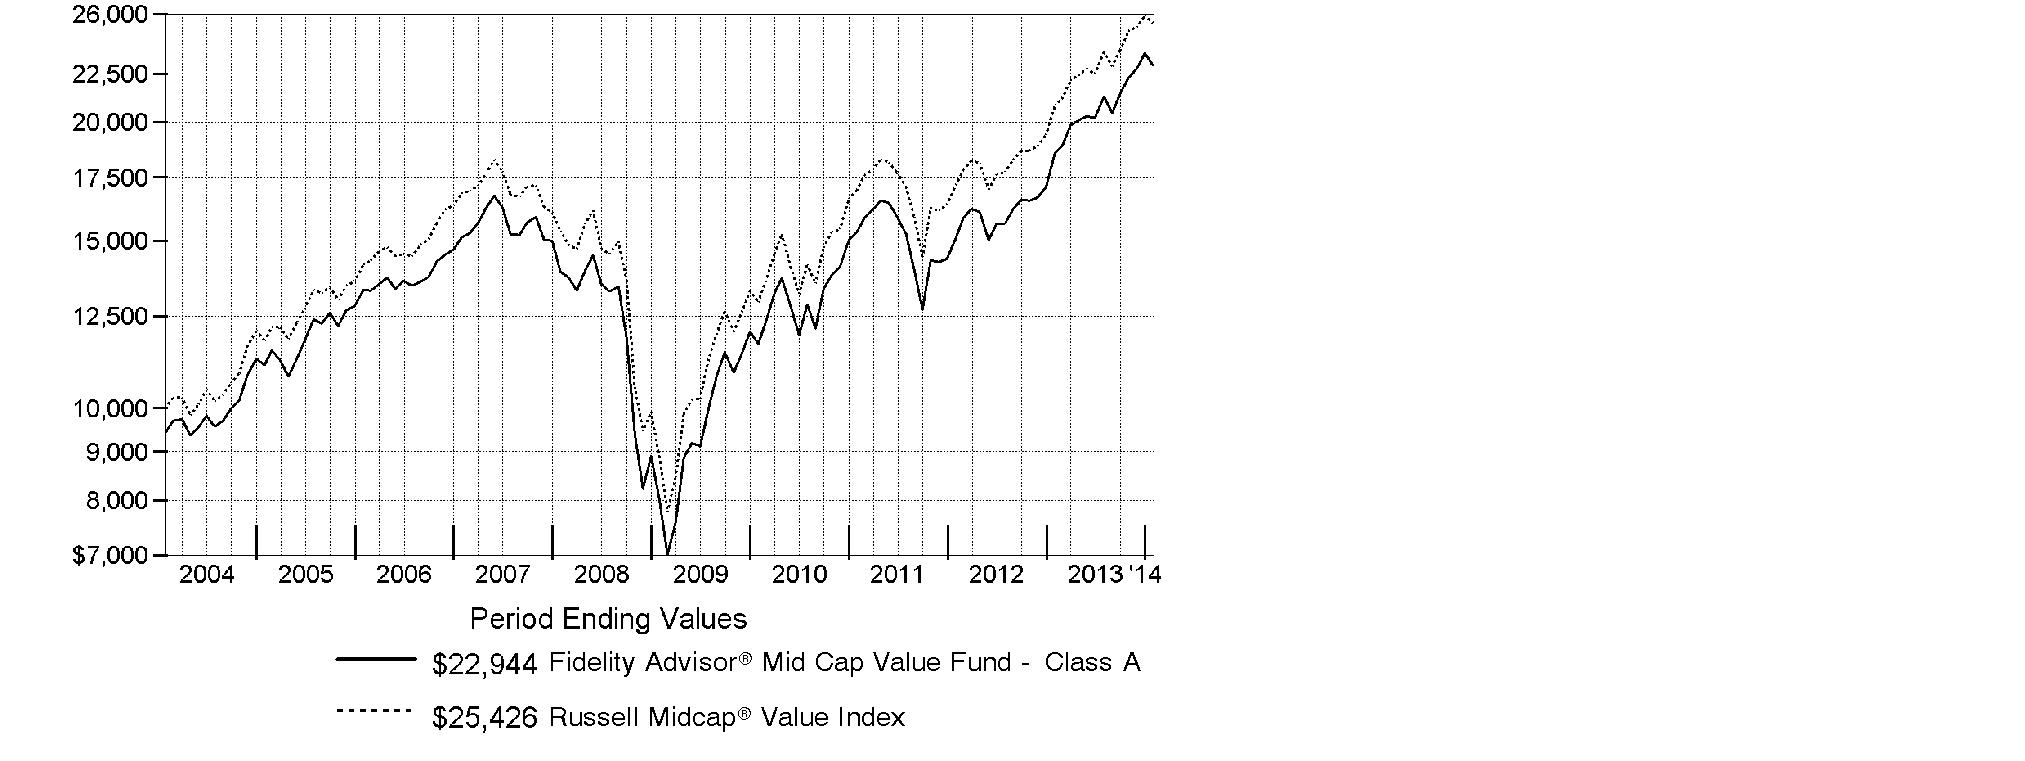
Annual Report
Management's Discussion of Fund Performance
Market Recap: Despite the worst January in years, markets finished notably higher for the 12 months ending January 31, 2014, amid a generally improving global economy and accommodative monetary policies worldwide. After achieving a series of highs in 2013, both the broad S&P 500® Index and the blue-chip Dow Jones Industrial AverageSM pulled back in the new year, bringing their 12-month returns to 21.52% and 16.07%, respectively. The growth-oriented Nasdaq Composite Index®, having run hotter in 2013 and cooled less in January, retained a loftier 32.33% result. For the period overall, smaller-cap stocks generally outperformed larger-caps, and growth outperformed value across market-cap segments. Bullish sentiment drove stocks higher through mid-May, but mixed signals from the U.S. Federal Reserve as to when it might curtail its stimulative bond-buying program, along with jitters over a potential U.S. military strike in Syria, put the markets in flux over the summer. Stocks regained their momentum in October despite a budget impasse that briefly shuttered the federal government, and volatility remained subdued heading into the holidays, allowing many markets to hit all-time highs by year-end. In January, renewed optimism for Europe and other developed markets was overrun by renewed concern about Fed tapering, the economic slowdown in China and a sell-off in emerging markets.
Comments from Court Dignan, who became Portfolio Manager of Fidelity Advisor® Mid Cap Value Fund on April 12, 2013: For the year, the fund's Class A, Class T, Class B and Class C shares returned 23.69%, 23.32%, 22.70% and 22.77%, respectively (excluding sales charges), versus 22.14% for the Russell Midcap® Value Index. Security selection, which focused on higher- or average-quality mid-cap companies selling at average or discounted prices, was especially strong in financials. Top individual contributors included alternative asset managers Blackstone Group and Apollo Global Management, whose steep share price gains were fueled by growing appreciation of their earnings growth potential. An investment in commercial real estate investment trust (REIT) NorthStar Realty Finance soared on news that the company would spin off its asset management business. All were out-of-index positions. By contrast, stock picks in information technology hindered relative performance. Individual disappointments came from not owning semiconductor chipmaker Micron Technology, an index component whose shares took off when a fire at a competitor's facility reduced supply and pricing rose. Elsewhere, being early in buying retail REIT CBL & Associates Properties hurt, as rising interest rates and slowing mall traffic pressured its return.
The views expressed above reflect those of the portfolio manager(s) only through the end of the period as stated on the cover of this report and do not necessarily represent the views of Fidelity or any other person in the Fidelity organization. Any such views are subject to change at any time based upon market or other conditions and Fidelity disclaims any responsibility to update such views. These views may not be relied on as investment advice and, because investment decisions for a Fidelity fund are based on numerous factors, may not be relied on as an indication of trading intent on behalf of any Fidelity fund.
Annual Report
Shareholder Expense Example
As a shareholder of the Fund, you incur two types of costs: (1) transaction costs, including sales charges (loads) on purchase payments or redemption proceeds, redemption fees and (2) ongoing costs, including management fees, distribution and/or service (12b-1) fees and other Fund expenses. This Example is intended to help you understand your ongoing costs (in dollars) of investing in the Fund and to compare these costs with the ongoing costs of investing in other mutual funds.
The Example is based on an investment of $1,000 invested at the beginning of the period and held for the entire period (August 1, 2013 to January 31, 2014).
Actual Expenses
The first line of the accompanying table for each class of the Fund provides information about actual account values and actual expenses. You may use the information in this line, together with the amount you invested, to estimate the expenses that you paid over the period. Simply divide your account value by $1,000.00 (for example, an $8,600 account value divided by $1,000.00 = 8.6), then multiply the result by the number in the first line for a class of the Fund under the heading entitled "Expenses Paid During Period" to estimate the expenses you paid on your account during this period. A small balance maintenance fee of $12.00 that is charged once a year may apply for certain accounts with a value of less than $2,000. This fee is not included in the table below. If it was, the estimate of expenses you paid during the period would be higher, and your ending account value lower, by this amount. In addition, the Fund, as a shareholder in the underlying Fidelity Central Funds, will indirectly bear its pro-rata share of the fees and expenses incurred by the underlying Fidelity Central Funds. These fees and expenses are not included in the Fund's annualized expense ratio used to calculate the expense estimate in the table below.
Hypothetical Example for Comparison Purposes
The second line of the accompanying table for each class of the Fund provides information about hypothetical account values and hypothetical expenses based on a Class' actual expense ratio and an assumed rate of return of 5% per year before expenses, which is not the Class' actual return. The hypothetical account values and expenses may not be used to estimate the actual ending account balance or expenses you paid for the period. You may use this information to compare the ongoing costs of investing in the Fund and other funds. To do so, compare this 5% hypothetical example with the 5% hypothetical examples that appear in the shareholder reports of the other funds. A small balance maintenance fee of $12.00 that is charged once a year may apply for certain accounts with a value of less than $2,000. This fee is not included in the table below. If it was, the estimate of expenses you paid during the period would be higher, and your ending account value lower, by this amount. In addition, the Fund, as a shareholder in the underlying Fidelity Central Funds, will indirectly bear its pro-rata share of the fees and expenses incurred by the underlying Fidelity Central Funds. These fees and expenses are not included in the Fund's annualized expense ratio used to calculate the expense estimate in the table below.
Please note that the expenses shown in the table are meant to highlight your ongoing costs only and do not reflect any transaction costs. Therefore, the second line of the table is useful in comparing ongoing costs only, and will not help you determine the relative total costs of owning different funds. In addition, if these transactional costs were included, your costs would have been higher.
Annual Report
| Annualized | Beginning | Ending | Expenses Paid |
Class A | 1.15% |
|
|
|
Actual |
| $ 1,000.00 | $ 1,079.30 | $ 6.03 |
HypotheticalA |
| $ 1,000.00 | $ 1,019.41 | $ 5.85 |
Class T | 1.43% |
|
|
|
Actual |
| $ 1,000.00 | $ 1,077.30 | $ 7.49 |
HypotheticalA |
| $ 1,000.00 | $ 1,018.00 | $ 7.27 |
Class B | 1.92% |
|
|
|
Actual |
| $ 1,000.00 | $ 1,075.00 | $ 10.04 |
HypotheticalA |
| $ 1,000.00 | $ 1,015.53 | $ 9.75 |
Class C | 1.89% |
|
|
|
Actual |
| $ 1,000.00 | $ 1,074.90 | $ 9.88 |
HypotheticalA |
| $ 1,000.00 | $ 1,015.68 | $ 9.60 |
Mid Cap Value | .79% |
|
|
|
Actual |
| $ 1,000.00 | $ 1,080.70 | $ 4.14 |
HypotheticalA |
| $ 1,000.00 | $ 1,021.22 | $ 4.02 |
Institutional Class | .84% |
|
|
|
Actual |
| $ 1,000.00 | $ 1,080.20 | $ 4.40 |
HypotheticalA |
| $ 1,000.00 | $ 1,020.97 | $ 4.28 |
A 5% return per year before expenses
B Annualized expense ratio reflects expenses net of applicable fee waivers.
* Expenses are equal to each Class' annualized expense ratio, multiplied by the average account value over the period, multiplied by 184/365 (to reflect the one-half year period).
Annual Report
Investment Changes (Unaudited)
Top Ten Stocks as of January 31, 2014 | ||
| % of fund's | % of fund's net assets |
Edison International | 1.6 | 1.5 |
Fifth Third Bancorp | 1.6 | 1.6 |
Cigna Corp. | 1.6 | 1.5 |
SLM Corp. | 1.6 | 1.6 |
Capital One Financial Corp. | 1.5 | 0.0 |
M&T Bank Corp. | 1.5 | 1.8 |
Allstate Corp. | 1.5 | 0.0 |
Invesco Ltd. | 1.4 | 0.0 |
CF Industries Holdings, Inc. | 1.4 | 0.0 |
Hartford Financial Services Group, Inc. | 1.4 | 1.5 |
| 15.1 | |
Top Five Market Sectors as of January 31, 2014 | ||
| % of fund's | % of fund's net assets |
Financials | 31.7 | 31.6 |
Information Technology | 11.5 | 11.4 |
Industrials | 10.7 | 11.1 |
Utilities | 10.7 | 12.0 |
Health Care | 9.9 | 8.2 |
Asset Allocation (% of fund's net assets) | |||||||
As of January 31, 2014 * | As of July 31, 2013 ** | ||||||
 | Stocks 98.6% |
| | Stocks 98.9% |
| ||
 | Short-Term |
| | Short-Term |
| ||

* Foreign investments | 11.4% |
| ** Foreign investments | 6.4% |
| ||
Annual Report
Investments January 31, 2014
Showing Percentage of Net Assets
Common Stocks - 98.6% | |||
Shares | Value | ||
CONSUMER DISCRETIONARY - 8.5% | |||
Hotels, Restaurants & Leisure - 1.0% | |||
Wyndham Worldwide Corp. | 223,200 | $ 15,833,808 | |
Household Durables - 0.8% | |||
Whirlpool Corp. | 95,800 | 12,770,140 | |
Multiline Retail - 2.6% | |||
Big Lots, Inc. (a) | 377,978 | 10,126,031 | |
Kohl's Corp. | 204,800 | 10,369,024 | |
Macy's, Inc. | 360,900 | 19,199,880 | |
| 39,694,935 | ||
Specialty Retail - 3.3% | |||
AutoZone, Inc. (a) | 32,400 | 16,039,944 | |
Bed Bath & Beyond, Inc. (a) | 132,900 | 8,485,665 | |
GameStop Corp. Class A | 175,700 | 6,161,799 | |
Staples, Inc. | 1,527,000 | 20,095,320 | |
| 50,782,728 | ||
Textiles, Apparel & Luxury Goods - 0.8% | |||
Coach, Inc. | 221,000 | 10,583,690 | |
Deckers Outdoor Corp. (a)(d) | 30,900 | 2,408,655 | |
| 12,992,345 | ||
TOTAL CONSUMER DISCRETIONARY | 132,073,956 | ||
CONSUMER STAPLES - 3.3% | |||
Beverages - 0.8% | |||
Molson Coors Brewing Co. Class B | 236,100 | 12,428,304 | |
Food & Staples Retailing - 0.9% | |||
Kroger Co. | 382,800 | 13,819,080 | |
Food Products - 1.6% | |||
Bunge Ltd. | 185,700 | 14,068,632 | |
The J.M. Smucker Co. | 108,300 | 10,439,037 | |
| 24,507,669 | ||
TOTAL CONSUMER STAPLES | 50,755,053 | ||
ENERGY - 6.3% | |||
Energy Equipment & Services - 1.9% | |||
Ensco PLC Class A | 303,700 | 15,297,369 | |
National Oilwell Varco, Inc. | 189,600 | 14,221,896 | |
| 29,519,265 | ||
Common Stocks - continued | |||
Shares | Value | ||
ENERGY - continued | |||
Oil, Gas & Consumable Fuels - 4.4% | |||
Canadian Natural Resources Ltd. | 438,700 | $ 14,385,027 | |
Cimarex Energy Co. | 153,300 | 15,020,334 | |
Energen Corp. | 130,500 | 9,228,960 | |
Marathon Oil Corp. | 301,800 | 9,896,022 | |
Tesoro Corp. | 290,900 | 14,987,168 | |
Valero Energy Corp. | 76,900 | 3,929,590 | |
| 67,447,101 | ||
TOTAL ENERGY | 96,966,366 | ||
FINANCIALS - 31.7% | |||
Capital Markets - 5.4% | |||
Apollo Global Management LLC Class A | 483,700 | 15,696,065 | |
Carlyle Group LP | 171,900 | 5,983,839 | |
Invesco Ltd. | 673,500 | 22,393,875 | |
KKR & Co. LP | 760,300 | 18,330,833 | |
The Blackstone Group LP | 659,100 | 21,585,525 | |
| 83,990,137 | ||
Commercial Banks - 7.1% | |||
BB&T Corp. | 430,000 | 16,086,300 | |
Fifth Third Bancorp | 1,197,857 | 25,178,954 | |
Huntington Bancshares, Inc. | 1,655,600 | 15,016,292 | |
M&T Bank Corp. (d) | 213,000 | 23,751,630 | |
SunTrust Banks, Inc. | 433,800 | 16,059,276 | |
U.S. Bancorp | 348,100 | 13,830,013 | |
| 109,922,465 | ||
Consumer Finance - 3.1% | |||
Capital One Financial Corp. | 338,400 | 23,894,424 | |
SLM Corp. | 1,061,400 | 24,157,464 | |
| 48,051,888 | ||
Diversified Financial Services - 0.5% | |||
The NASDAQ Stock Market, Inc. | 185,400 | 7,073,010 | |
Insurance - 8.8% | |||
ACE Ltd. | 182,700 | 17,139,087 | |
Allied World Assurance Co. Holdings Ltd. | 139,500 | 14,357,340 | |
Allstate Corp. | 444,300 | 22,748,160 | |
Amtrust Financial Services, Inc. (d) | 384,600 | 12,414,888 | |
Brown & Brown, Inc. | 159,500 | 5,022,655 | |
Everest Re Group Ltd. | 120,800 | 17,487,008 | |
Common Stocks - continued | |||
Shares | Value | ||
FINANCIALS - continued | |||
Insurance - continued | |||
Fidelity National Financial, Inc. Class A | 555,500 | $ 17,520,470 | |
Hartford Financial Services Group, Inc. | 661,300 | 21,988,225 | |
Symetra Financial Corp. | 443,949 | 8,501,623 | |
| 137,179,456 | ||
Real Estate Investment Trusts - 6.8% | |||
American Capital Agency Corp. | 1,044,400 | 21,880,180 | |
CBL & Associates Properties, Inc. | 1,051,400 | 17,863,286 | |
Equity Lifestyle Properties, Inc. | 482,300 | 18,959,213 | |
MFA Financial, Inc. | 1,170,200 | 8,530,758 | |
NorthStar Realty Finance Corp. (d) | 1,062,700 | 15,504,793 | |
Pennsylvania Real Estate Investment Trust (SBI) | 664,800 | 12,398,520 | |
RLJ Lodging Trust | 405,500 | 10,129,390 | |
| 105,266,140 | ||
TOTAL FINANCIALS | 491,483,096 | ||
HEALTH CARE - 9.9% | |||
Biotechnology - 1.0% | |||
United Therapeutics Corp. (a) | 143,200 | 14,695,184 | |
Health Care Equipment & Supplies - 1.0% | |||
C.R. Bard, Inc. | 23,600 | 3,058,324 | |
St. Jude Medical, Inc. | 211,300 | 12,832,249 | |
| 15,890,573 | ||
Health Care Providers & Services - 6.1% | |||
Cardinal Health, Inc. | 197,400 | 13,427,148 | |
Cigna Corp. | 288,600 | 24,909,066 | |
Community Health Systems, Inc. (a) | 211,700 | 8,766,497 | |
DaVita HealthCare Partners, Inc. (a) | 203,900 | 13,239,227 | |
HCA Holdings, Inc. (a) | 289,100 | 14,533,057 | |
Omnicare, Inc. | 234,100 | 14,621,886 | |
VCA Antech, Inc. (a) | 171,300 | 5,471,322 | |
| 94,968,203 | ||
Pharmaceuticals - 1.8% | |||
Actavis PLC (a) | 86,900 | 16,422,362 | |
Mylan, Inc. (a) | 170,000 | 7,719,700 | |
Teva Pharmaceutical Industries Ltd. sponsored ADR | 89,800 | 4,007,774 | |
| 28,149,836 | ||
TOTAL HEALTH CARE | 153,703,796 | ||
Common Stocks - continued | |||
Shares | Value | ||
INDUSTRIALS - 10.7% | |||
Aerospace & Defense - 2.1% | |||
Esterline Technologies Corp. (a) | 138,600 | $ 14,268,870 | |
Meggitt PLC | 2,068,200 | 17,526,557 | |
| 31,795,427 | ||
Airlines - 0.6% | |||
American Airlines Group, Inc. (a)(d) | 289,200 | 9,702,660 | |
Commercial Services & Supplies - 0.8% | |||
Tetra Tech, Inc. (a) | 429,542 | 12,675,784 | |
Construction & Engineering - 1.8% | |||
AECOM Technology Corp. (a) | 496,300 | 14,228,921 | |
URS Corp. | 286,203 | 14,367,391 | |
| 28,596,312 | ||
Electrical Equipment - 1.2% | |||
EnerSys | 213,500 | 14,530,810 | |
Rockwell Automation, Inc. | 39,900 | 4,582,116 | |
| 19,112,926 | ||
Machinery - 2.0% | |||
Cummins, Inc. | 128,000 | 16,253,440 | |
Parker Hannifin Corp. | 19,200 | 2,176,704 | |
Terex Corp. | 64,500 | 2,644,500 | |
Valmont Industries, Inc. | 63,500 | 9,295,130 | |
| 30,369,774 | ||
Professional Services - 1.2% | |||
Dun & Bradstreet Corp. | 168,500 | 18,535,000 | |
Trading Companies & Distributors - 1.0% | |||
WESCO International, Inc. (a) | 186,900 | 15,505,224 | |
TOTAL INDUSTRIALS | 166,293,107 | ||
INFORMATION TECHNOLOGY - 11.5% | |||
Communications Equipment - 0.7% | |||
Plantronics, Inc. | 251,400 | 10,792,602 | |
Computers & Peripherals - 2.4% | |||
EMC Corp. | 600,400 | 14,553,696 | |
SanDisk Corp. | 160,000 | 11,128,000 | |
Western Digital Corp. | 137,200 | 11,822,524 | |
| 37,504,220 | ||
Electronic Equipment & Components - 1.7% | |||
Arrow Electronics, Inc. (a) | 193,800 | 9,957,444 | |
Common Stocks - continued | |||
Shares | Value | ||
INFORMATION TECHNOLOGY - continued | |||
Electronic Equipment & Components - continued | |||
Avnet, Inc. | 222,100 | $ 9,121,647 | |
TE Connectivity Ltd. | 135,400 | 7,651,454 | |
| 26,730,545 | ||
IT Services - 2.3% | |||
Amdocs Ltd. | 376,200 | 16,274,412 | |
EVERTEC, Inc. | 190,000 | 4,584,700 | |
Total System Services, Inc. | 478,500 | 14,297,580 | |
| 35,156,692 | ||
Semiconductors & Semiconductor Equipment - 1.7% | |||
Avago Technologies Ltd. | 82,300 | 4,496,872 | |
Broadcom Corp. Class A | 265,200 | 7,892,352 | |
Maxim Integrated Products, Inc. | 103,200 | 3,122,832 | |
Skyworks Solutions, Inc. (a) | 346,600 | 10,484,650 | |
| 25,996,706 | ||
Software - 2.7% | |||
CA Technologies, Inc. | 426,600 | 13,685,328 | |
Check Point Software Technologies Ltd. (a) | 115,500 | 7,557,165 | |
Symantec Corp. | 458,000 | 9,805,780 | |
Synopsys, Inc. (a) | 280,100 | 11,164,786 | |
| 42,213,059 | ||
TOTAL INFORMATION TECHNOLOGY | 178,393,824 | ||
MATERIALS - 6.0% | |||
Chemicals - 3.1% | |||
Cabot Corp. | 184,200 | 8,965,014 | |
CF Industries Holdings, Inc. | 95,300 | 22,000,958 | |
Eastman Chemical Co. | 216,900 | 16,909,524 | |
| 47,875,496 | ||
Containers & Packaging - 1.0% | |||
Graphic Packaging Holding Co. (a) | 1,601,400 | 15,213,300 | |
Metals & Mining - 0.9% | |||
Reliance Steel & Aluminum Co. | 211,000 | 14,759,450 | |
Paper & Forest Products - 1.0% | |||
International Paper Co. | 331,900 | 15,844,906 | |
TOTAL MATERIALS | 93,693,152 | ||
Common Stocks - continued | |||
Shares | Value | ||
UTILITIES - 10.7% | |||
Electric Utilities - 3.9% | |||
Edison International | 526,300 | $ 25,346,608 | |
Great Plains Energy, Inc. | 31,600 | 779,888 | |
IDACORP, Inc. | 295,100 | 15,560,623 | |
PNM Resources, Inc. | 250,800 | 6,182,220 | |
Xcel Energy, Inc. | 424,700 | 12,278,077 | |
| 60,147,416 | ||
Gas Utilities - 0.9% | |||
Atmos Energy Corp. | 282,200 | 13,548,422 | |
Independent Power Producers & Energy Traders - 1.0% | |||
The AES Corp. | 1,134,500 | 15,951,070 | |
Multi-Utilities - 4.9% | |||
Ameren Corp. | 562,900 | 21,300,136 | |
CMS Energy Corp. | 755,700 | 21,000,903 | |
DTE Energy Co. | 319,200 | 21,775,824 | |
NiSource, Inc. | 363,800 | 12,503,806 | |
| 76,580,669 | ||
TOTAL UTILITIES | 166,227,577 | ||
TOTAL COMMON STOCKS (Cost $1,378,474,916) |
| ||
Money Market Funds - 3.9% | |||
|
|
|
|
Fidelity Cash Central Fund, 0.10% (b) | 14,457,505 | 14,457,505 | |
Fidelity Securities Lending Cash Central Fund, 0.09% (b)(c) | 45,348,950 | 45,348,950 | |
TOTAL MONEY MARKET FUNDS (Cost $59,806,455) |
| ||
TOTAL INVESTMENT PORTFOLIO - 102.5% (Cost $1,438,281,371) | 1,589,396,382 | ||
NET OTHER ASSETS (LIABILITIES) - (2.5)% | (38,710,723) | ||
NET ASSETS - 100% | $ 1,550,685,659 | ||
Legend |
(a) Non-income producing |
(b) Affiliated fund that is generally available only to investment companies and other accounts managed by Fidelity Investments. The rate quoted is the annualized seven-day yield of the fund at period end. A complete unaudited listing of the fund's holdings as of its most recent quarter end is available upon request. In addition, each Fidelity Central Fund's financial statements, which are not covered by the Fund's Report of Independent Registered Public Accounting Firm, are available on the SEC's website or upon request. |
(c) Investment made with cash collateral received from securities on loan. |
(d) Security or a portion of the security is on loan at period end. |
Affiliated Central Funds |
Information regarding fiscal year to date income earned by the Fund from investments in Fidelity Central Funds is as follows: |
Fund | Income earned |
Fidelity Cash Central Fund | $ 23,403 |
Fidelity Securities Lending Cash Central Fund | 89,777 |
Total | $ 113,180 |
Other Information |
All investments are categorized as Level 1 under the Fair Value Hierarchy. The inputs or methodology used for valuing securities may not be an indication of the risk associated with investing in those securities. For more information on valuation inputs, please refer to the Investment Valuation section in the accompanying Notes to Financial Statements. |
Distribution of investments by country or territory of incorporation, as a percentage of total net assets, is as follows (Unaudited): |
United States of America | 88.6% |
Bermuda | 3.4% |
Switzerland | 2.5% |
United Kingdom | 2.2% |
Ireland | 1.1% |
Others (Individually Less Than 1%) | 2.2% |
| 100.0% |
See accompanying notes which are an integral part of the financial statements.
Annual Report
Financial Statements
Statement of Assets and Liabilities
| January 31, 2014 | |
|
|
|
Assets | ||
Investment in securities, at value (including securities loaned of $43,982,931) - See accompanying schedule: Unaffiliated issuers (cost $1,378,474,916) | $ 1,529,589,927 |
|
Fidelity Central Funds (cost $59,806,455) | 59,806,455 |
|
Total Investments (cost $1,438,281,371) |
| $ 1,589,396,382 |
Receivable for investments sold | 13,397,169 | |
Receivable for fund shares sold | 10,264,317 | |
Dividends receivable | 170,018 | |
Distributions receivable from Fidelity Central Funds | 33,858 | |
Prepaid expenses | 3,581 | |
Other receivables | 16,056 | |
Total assets | 1,613,281,381 | |
|
|
|
Liabilities | ||
Payable for investments purchased | $ 13,944,196 | |
Payable for fund shares redeemed | 2,178,523 | |
Accrued management fee | 735,209 | |
Distribution and service plan fees payable | 47,330 | |
Other affiliated payables | 270,564 | |
Other payables and accrued expenses | 70,950 | |
Collateral on securities loaned, at value | 45,348,950 | |
Total liabilities | 62,595,722 | |
|
|
|
Net Assets | $ 1,550,685,659 | |
Net Assets consist of: |
| |
Paid in capital | $ 1,366,380,230 | |
Undistributed net investment income | 435,958 | |
Accumulated undistributed net realized gain (loss) on investments and foreign currency transactions | 32,754,460 | |
Net unrealized appreciation (depreciation) on investments | 151,115,011 | |
Net Assets | $ 1,550,685,659 | |
See accompanying notes which are an integral part of the financial statements.
Annual Report
Financial Statements - continued
Statement of Assets and Liabilities - continued
| January 31, 2014 | |
|
|
|
Calculation of Maximum Offering Price Class A: | $ 21.78 | |
|
|
|
Maximum offering price per share (100/94.25 of $21.78) | $ 23.11 | |
Class T: | $ 21.70 | |
|
|
|
Maximum offering price per share (100/96.50 of $21.70) | $ 22.49 | |
Class B: | $ 21.48 | |
|
|
|
Class C: | $ 21.31 | |
|
|
|
Mid Cap Value: | $ 21.96 | |
|
|
|
Institutional Class: | $ 21.84 | |
A Redemption price per share is equal to net asset value less any applicable contingent deferred sales charge.
See accompanying notes which are an integral part of the financial statements.
Annual Report
Statement of Operations
| Year ended January 31, 2014 | |
|
|
|
Investment Income |
|
|
Dividends |
| $ 28,788,810 |
Interest |
| 64 |
Income from Fidelity Central Funds |
| 113,180 |
Total income |
| 28,902,054 |
|
|
|
Expenses | ||
Management fee | $ 7,073,945 | |
Performance adjustment | 60,558 | |
Transfer agent fees | 2,515,888 | |
Distribution and service plan fees | 392,671 | |
Accounting and security lending fees | 411,663 | |
Custodian fees and expenses | 89,950 | |
Independent trustees' compensation | 5,975 | |
Registration fees | 181,003 | |
Audit | 58,413 | |
Legal | 3,557 | |
Miscellaneous | 7,200 | |
Total expenses before reductions | 10,800,823 | |
Expense reductions | (76,747) | 10,724,076 |
Net investment income (loss) | 18,177,978 | |
Realized and Unrealized Gain (Loss) Net realized gain (loss) on: | ||
Investment securities: |
|
|
Unaffiliated issuers | 168,913,149 | |
Foreign currency transactions | (25,247) | |
Total net realized gain (loss) |
| 168,887,902 |
Change in net unrealized appreciation (depreciation) on investment securities | 69,583,401 | |
Net gain (loss) | 238,471,303 | |
Net increase (decrease) in net assets resulting from operations | $ 256,649,281 | |
See accompanying notes which are an integral part of the financial statements.
Annual Report
Financial Statements - continued
Statement of Changes in Net Assets
| Year ended | Year ended |
Increase (Decrease) in Net Assets |
|
|
Operations |
|
|
Net investment income (loss) | $ 18,177,978 | $ 8,506,032 |
Net realized gain (loss) | 168,887,902 | 58,044,668 |
Change in net unrealized appreciation (depreciation) | 69,583,401 | 59,980,492 |
Net increase (decrease) in net assets resulting | 256,649,281 | 126,531,192 |
Distributions to shareholders from net investment income | (15,306,348) | (8,438,509) |
Distributions to shareholders from net realized gain | (113,515,093) | - |
Total distributions | (128,821,441) | (8,438,509) |
Share transactions - net increase (decrease) | 735,344,302 | (21,044,685) |
Redemption fees | 65,786 | 8,162 |
Total increase (decrease) in net assets | 863,237,928 | 97,056,160 |
|
|
|
Net Assets | ||
Beginning of period | 687,447,731 | 590,391,571 |
End of period (including undistributed net investment income of $435,958 and $0, respectively) | $ 1,550,685,659 | $ 687,447,731 |
See accompanying notes which are an integral part of the financial statements.
Annual Report
Financial Highlights - Class A
Years ended January 31, | 2014 | 2013 | 2012 | 2011 | 2010 |
Selected Per-Share Data |
|
|
|
|
|
Net asset value, beginning of period | $ 19.24 | $ 15.87 | $ 16.16 | $ 12.35 | $ 8.53 |
Income from Investment Operations |
|
|
|
|
|
Net investment income (loss) C | .24 | .20 | .07 | - G | .07 |
Net realized and unrealized gain (loss) | 4.29 | 3.38 | (.29) | 3.85 | 3.84 |
Total from investment operations | 4.53 | 3.58 | (.22) | 3.85 | 3.91 |
Distributions from net investment income | (.19) | (.21) | (.07) | (.04) | (.09) |
Distributions from net realized gain | (1.79) | - | - | - | - |
Total distributions | (1.99) H | (.21) | (.07) | (.04) | (.09) |
Redemption fees added to paid in capital C,G | - | - | - | - | - |
Net asset value, end of period | $ 21.78 | $ 19.24 | $ 15.87 | $ 16.16 | $ 12.35 |
Total Return A,B | 23.69% | 22.73% | (1.34)% | 31.14% | 45.79% |
Ratios to Average Net Assets D,F |
|
|
|
|
|
Expenses before reductions | 1.15% | 1.15% | 1.17% | 1.17% | 1.21% |
Expenses net of fee waivers, if any | 1.15% | 1.15% | 1.17% | 1.17% | 1.21% |
Expenses net of all reductions | 1.14% | 1.12% | 1.16% | 1.17% | 1.20% |
Net investment income (loss) | 1.11% | 1.15% | .44% | .02% | .62% |
Supplemental Data |
|
|
|
|
|
Net assets, end of period (000 omitted) | $ 67,826 | $ 24,436 | $ 19,578 | $ 23,608 | $ 10,640 |
Portfolio turnover rate E | 169% | 180% | 173% | 133% | 202% |
A Total returns would have been lower if certain expenses had not been reduced during the applicable periods shown.
B Total returns do not include the effect of the sales charges.
C Calculated based on average shares outstanding during the period.
D Fees and expenses of any underlying Fidelity Central Funds are not included in the Fund's expense ratio. The Fund indirectly bears its proportionate share of the expenses of any underlying Fidelity Central Funds.
E Amount does not include the portfolio activity of any underlying Fidelity Central Funds.
F Expense ratios reflect operating expenses of the class. Expenses before reductions do not reflect amounts reimbursed by the investment adviser or reductions from brokerage service arrangements or reductions from other expense offset arrangements and do not represent the amount paid by the class during periods when reimbursements or reductions occur. Expenses net of fee waivers reflect expenses after reimbursement by the investment adviser but prior to reductions from brokerage service arrangements or other expense offset arrangements. Expenses net of all reductions represent the net expenses paid by the class.
G Amount represents less than $.01 per share.
H Total distributions of $1.99 per share is comprised of distributions from net investment income of $.193 and distributions from net realized gain of $1.793 per share.
See accompanying notes which are an integral part of the financial statements.
Annual Report
Financial Highlights - Class T
Years ended January 31, | 2014 | 2013 | 2012 | 2011 | 2010 |
Selected Per-Share Data |
|
|
|
|
|
Net asset value, beginning of period | $ 19.21 | $ 15.84 | $ 16.14 | $ 12.34 | $ 8.53 |
Income from Investment Operations |
|
|
|
|
|
Net investment income (loss) C | .18 | .15 | .03 | (.03) | .04 |
Net realized and unrealized gain (loss) | 4.27 | 3.38 | (.29) | 3.83 | 3.84 |
Total from investment operations | 4.45 | 3.53 | (.26) | 3.80 | 3.88 |
Distributions from net investment income | (.17) | (.16) | (.04) | - | (.07) |
Distributions from net realized gain | (1.79) | - | - | - | - |
Total distributions | (1.96) | (.16) | (.04) | - | (.07) |
Redemption fees added to paid in capital C,G | - | - | - | - | - |
Net asset value, end of period | $ 21.70 | $ 19.21 | $ 15.84 | $ 16.14 | $ 12.34 |
Total Return A,B | 23.32% | 22.42% | (1.59)% | 30.79% | 45.44% |
Ratios to Average Net Assets D,F |
|
|
|
|
|
Expenses before reductions | 1.42% | 1.42% | 1.43% | 1.43% | 1.47% |
Expenses net of fee waivers, if any | 1.42% | 1.42% | 1.43% | 1.43% | 1.47% |
Expenses net of all reductions | 1.41% | 1.38% | 1.42% | 1.43% | 1.46% |
Net investment income (loss) | .84% | .89% | .18% | (.24)% | .36% |
Supplemental Data |
|
|
|
|
|
Net assets, end of period (000 omitted) | $ 24,136 | $ 8,358 | $ 6,823 | $ 6,993 | $ 4,010 |
Portfolio turnover rate E | 169% | 180% | 173% | 133% | 202% |
A Total returns would have been lower if certain expenses had not been reduced during the applicable periods shown.
B Total returns do not include the effect of the sales charges.
C Calculated based on average shares outstanding during the period.
D Fees and expenses of any underlying Fidelity Central Funds are not included in the Fund's expense ratio. The Fund indirectly bears its proportionate share of the expenses of any underlying Fidelity Central Funds.
E Amount does not include the portfolio activity of any underlying Fidelity Central Funds.
F Expense ratios reflect operating expenses of the class. Expenses before reductions do not reflect amounts reimbursed by the investment adviser or reductions from brokerage service arrangements or reductions from other expense offset arrangements and do not represent the amount paid by the class during periods when reimbursements or reductions occur. Expenses net of fee waivers reflect expenses after reimbursement by the investment adviser but prior to reductions from brokerage service arrangements or other expense offset arrangements. Expenses net of all reductions represent the net expenses paid by the class.
G Amount represents less than $.01 per share.
See accompanying notes which are an integral part of the financial statements.
Annual Report
Financial Highlights - Class B
Years ended January 31, | 2014 | 2013 | 2012 | 2011 | 2010 |
Selected Per-Share Data |
|
|
|
|
|
Net asset value, beginning of period | $ 19.03 | $ 15.71 | $ 16.04 | $ 12.32 | $ 8.53 |
Income from Investment Operations |
|
|
|
|
|
Net investment income (loss) C | .07 | .07 | (.05) | (.10) | (.01) |
Net realized and unrealized gain (loss) | 4.22 | 3.34 | (.28) | 3.82 | 3.82 |
Total from investment operations | 4.29 | 3.41 | (.33) | 3.72 | 3.81 |
Distributions from net investment income | (.05) | (.09) | - | - | (.02) |
Distributions from net realized gain | (1.79) | - | - | - | - |
Total distributions | (1.84) | (.09) | - | - | (.02) |
Redemption fees added to paid in capital C,G | - | - | - | - | - |
Net asset value, end of period | $ 21.48 | $ 19.03 | $ 15.71 | $ 16.04 | $ 12.32 |
Total Return A,B | 22.70% | 21.79% | (2.06)% | 30.19% | 44.61% |
Ratios to Average Net Assets D,F |
|
|
|
|
|
Expenses before reductions | 1.91% | 1.91% | 1.92% | 1.93% | 1.97% |
Expenses net of fee waivers, if any | 1.91% | 1.91% | 1.92% | 1.93% | 1.97% |
Expenses net of all reductions | 1.91% | 1.87% | 1.91% | 1.92% | 1.96% |
Net investment income (loss) | .34% | .40% | (.31)% | (.74)% | (.14)% |
Supplemental Data |
|
|
|
|
|
Net assets, end of period (000 omitted) | $ 2,302 | $ 1,533 | $ 1,376 | $ 1,793 | $ 1,154 |
Portfolio turnover rate E | 169% | 180% | 173% | 133% | 202% |
A Total returns would have been lower if certain expenses had not been reduced during the applicable periods shown.
B Total returns do not include the effect of the contingent deferred sales charge.
C Calculated based on average shares outstanding during the period.
D Fees and expenses of any underlying Fidelity Central Funds are not included in the Fund's expense ratio. The Fund indirectly bears its proportionate share of the expenses of any underlying Fidelity Central Funds.
E Amount does not include the portfolio activity of any underlying Fidelity Central Funds.
F Expense ratios reflect operating expenses of the class. Expenses before reductions do not reflect amounts reimbursed by the investment adviser or reductions from brokerage service arrangements or reductions from other expense offset arrangements and do not represent the amount paid by the class during periods when reimbursements or reductions occur. Expenses net of fee waivers reflect expenses after reimbursement by the investment adviser but prior to reductions from brokerage service arrangements or other expense offset arrangements. Expenses net of all reductions represent the net expenses paid by the class.
G Amount represents less than $.01 per share.
See accompanying notes which are an integral part of the financial statements.
Annual Report
Financial Highlights - Class C
Years ended January 31, | 2014 | 2013 | 2012 | 2011 | 2010 |
Selected Per-Share Data |
|
|
|
|
|
Net asset value, beginning of period | $ 18.93 | $ 15.65 | $ 15.98 | $ 12.27 | $ 8.50 |
Income from Investment Operations |
|
|
|
|
|
Net investment income (loss) C | .08 | .07 | (.05) | (.10) | (.01) |
Net realized and unrealized gain (loss) | 4.20 | 3.32 | (.28) | 3.81 | 3.80 |
Total from investment operations | 4.28 | 3.39 | (.33) | 3.71 | 3.79 |
Distributions from net investment income | (.11) | (.11) | - | - | (.02) |
Distributions from net realized gain | (1.79) | - | - | - | - |
Total distributions | (1.90) | (.11) | - | - | (.02) |
Redemption fees added to paid in capital C,G | - | - | - | - | - |
Net asset value, end of period | $ 21.31 | $ 18.93 | $ 15.65 | $ 15.98 | $ 12.27 |
Total Return A,B | 22.77% | 21.73% | (2.07)% | 30.24% | 44.56% |
Ratios to Average Net Assets D,F |
|
|
|
|
|
Expenses before reductions | 1.89% | 1.91% | 1.92% | 1.93% | 1.96% |
Expenses net of fee waivers, if any | 1.89% | 1.91% | 1.92% | 1.93% | 1.96% |
Expenses net of all reductions | 1.89% | 1.87% | 1.91% | 1.92% | 1.95% |
Net investment income (loss) | .36% | .40% | (.31)% | (.73)% | (.13)% |
Supplemental Data |
|
|
|
|
|
Net assets, end of period (000 omitted) | $ 25,177 | $ 6,820 | $ 5,000 | $ 5,309 | $ 2,293 |
Portfolio turnover rate E | 169% | 180% | 173% | 133% | 202% |
A Total returns would have been lower if certain expenses had not been reduced during the applicable periods shown.
B Total returns do not include the effect of the contingent deferred sales charge.
C Calculated based on average shares outstanding during the period.
D Fees and expenses of any underlying Fidelity Central Funds are not included in the Fund's expense ratio. The Fund indirectly bears its proportionate share of the expenses of any underlying Fidelity Central Funds.
E Amount does not include the portfolio activity of any underlying Fidelity Central Funds.
F Expense ratios reflect operating expenses of the class. Expenses before reductions do not reflect amounts reimbursed by the investment adviser or reductions from brokerage service arrangements or reductions from other expense offset arrangements and do not represent the amount paid by the class during periods when reimbursements or reductions occur. Expenses net of fee waivers reflect expenses after reimbursement by the investment adviser but prior to reductions from brokerage service arrangements or other expense offset arrangements. Expenses net of all reductions represent the net expenses paid by the class.
G Amount represents less than $.01 per share.
See accompanying notes which are an integral part of the financial statements.
Annual Report
Financial Highlights - Mid Cap Value
Years ended January 31, | 2014 | 2013 | 2012 | 2011 | 2010 |
Selected Per-Share Data |
|
|
|
|
|
Net asset value, beginning of period | $ 19.37 | $ 15.97 | $ 16.26 | $ 12.41 | $ 8.57 |
Income from Investment Operations |
|
|
|
|
|
Net investment income (loss) B | .32 | .25 | .12 | .04 | .09 |
Net realized and unrealized gain (loss) | 4.31 | 3.41 | (.30) | 3.87 | 3.86 |
Total from investment operations | 4.63 | 3.66 | (.18) | 3.91 | 3.95 |
Distributions from net investment income | (.25) | (.26) | (.11) | (.06) | (.11) |
Distributions from net realized gain | (1.79) | - | - | - | - |
Total distributions | (2.04) | (.26) | (.11) | (.06) | (.11) |
Redemption fees added to paid in capital B,F | - | - | - | - | - |
Net asset value, end of period | $ 21.96 | $ 19.37 | $ 15.97 | $ 16.26 | $ 12.41 |
Total Return A | 24.08% | 23.07% | (1.04)% | 31.51% | 46.06% |
Ratios to Average Net Assets C,E |
|
|
|
|
|
Expenses before reductions | .80% | .85% | .88% | .91% | .95% |
Expenses net of fee waivers, if any | .80% | .85% | .88% | .91% | .95% |
Expenses net of all reductions | .80% | .81% | .87% | .90% | .94% |
Net investment income (loss) | 1.45% | 1.46% | .73% | .28% | .88% |
Supplemental Data |
|
|
|
|
|
Net assets, end of period (000 omitted) | $ 1,404,968 | $ 638,425 | $ 553,947 | $ 666,277 | $ 469,476 |
Portfolio turnover rate D | 169% | 180% | 173% | 133% | 202% |
A Total returns would have been lower if certain expenses had not been reduced during the applicable periods shown.
B Calculated based on average shares outstanding during the period.
C Fees and expenses of any underlying Fidelity Central Funds are not included in the Fund's expense ratio. The Fund indirectly bears its proportionate share of the expenses of any underlying Fidelity Central Funds.
D Amount does not include the portfolio activity of any underlying Fidelity Central Funds.
E Expense ratios reflect operating expenses of the class. Expenses before reductions do not reflect amounts reimbursed by the investment adviser or reductions from brokerage service arrangements or reductions from other expense offset arrangements and do not represent the amount paid by the class during periods when reimbursements or reductions occur. Expenses net of fee waivers reflect expenses after reimbursement by the investment adviser but prior to reductions from brokerage service arrangements or other expense offset arrangements. Expenses net of all reductions represent the net expenses paid by the class.
F Amount represents less than $.01 per share.
See accompanying notes which are an integral part of the financial statements.
Annual Report
Financial Highlights - Institutional Class
Years ended January 31, | 2014 | 2013 | 2012 | 2011 | 2010 |
Selected Per-Share Data |
|
|
|
|
|
Net asset value, beginning of period | $ 19.29 | $ 15.91 | $ 16.20 | $ 12.36 | $ 8.54 |
Income from Investment Operations |
|
|
|
|
|
Net investment income (loss) B | .31 | .24 | .11 | .04 | .10 |
Net realized and unrealized gain (loss) | 4.28 | 3.40 | (.29) | 3.85 | 3.84 |
Total from investment operations | 4.59 | 3.64 | (.18) | 3.89 | 3.94 |
Distributions from net investment income | (.25) | (.26) | (.11) | (.05) | (.12) |
Distributions from net realized gain | (1.79) | - | - | - | - |
Total distributions | (2.04) | (.26) | (.11) | (.05) | (.12) |
Redemption fees added to paid in capital B,F | - | - | - | - | - |
Net asset value, end of period | $ 21.84 | $ 19.29 | $ 15.91 | $ 16.20 | $ 12.36 |
Total Return A | 23.98% | 23.05% | (1.07)% | 31.51% | 46.12% |
Ratios to Average Net Assets C,E |
|
|
|
|
|
Expenses before reductions | .85% | .89% | .91% | .92% | .96% |
Expenses net of fee waivers, if any | .85% | .89% | .91% | .92% | .96% |
Expenses net of all reductions | .85% | .85% | .90% | .92% | .95% |
Net investment income (loss) | 1.40% | 1.42% | .71% | .27% | .87% |
Supplemental Data |
|
|
|
|
|
Net assets, end of period (000 omitted) | $ 26,277 | $ 7,875 | $ 3,667 | $ 3,507 | $ 3,162 |
Portfolio turnover rate D | 169% | 180% | 173% | 133% | 202% |
A Total returns would have been lower if certain expenses had not been reduced during the applicable periods shown.
B Calculated based on average shares outstanding during the period.
C Fees and expenses of any underlying Fidelity Central Funds are not included in the Fund's expense ratio. The Fund indirectly bears its proportionate share of the expenses of any underlying Fidelity Central Funds.
D Amount does not include the portfolio activity of any underlying Fidelity Central Funds.
E Expense ratios reflect operating expenses of the class. Expenses before reductions do not reflect amounts reimbursed by the investment adviser or reductions from brokerage service arrangements or reductions from other expense offset arrangements and do not represent the amount paid by the class during periods when reimbursements or reductions occur. Expenses net of fee waivers reflect expenses after reimbursement by the investment adviser but prior to reductions from brokerage service arrangements or other expense offset arrangements. Expenses net of all reductions represent the net expenses paid by the class.
F Amount represents less than $.01 per share.
See accompanying notes which are an integral part of the financial statements.
Annual Report
Notes to Financial Statements
For the period ended January 31, 2014
1. Organization.
Fidelity Mid Cap Value Fund (the Fund) is a fund of Fidelity Devonshire Trust (the Trust) and is authorized to issue an unlimited number of shares. The Trust is registered under the Investment Company Act of 1940, as amended (the 1940 Act), as an open-end management investment company organized as a Massachusetts business trust. The Fund offers Class A, Class T, Class C, Mid Cap Value and Institutional Class shares, each of which, along with Class B shares, has equal rights as to assets and voting privileges. Class B shares are closed to new accounts and additional purchases, except for exchanges and reinvestments. Each class has exclusive voting rights with respect to matters that affect that class. Class B shares will automatically convert to Class A shares after a holding period of seven years from the initial date of purchase.
2. Investments in Fidelity Central Funds.
The Fund invests in Fidelity Central Funds, which are open-end investment companies generally available only to other investment companies and accounts managed by the investment adviser and its affiliates. The Fund's Schedule of Investments lists each of the Fidelity Central Funds held as of period end, if any, as an investment of the Fund, but does not include the underlying holdings of each Fidelity Central Fund. As an Investing Fund, the Fund indirectly bears its proportionate share of the expenses of the underlying Fidelity Central Funds.
The Money Market Central Funds seek preservation of capital and current income and are managed by Fidelity Investments Money Management, Inc. (FIMM), an affiliate of the investment adviser. Annualized expenses of the Money Market Central Funds as of their most recent shareholder report date are less than .01%.
A complete unaudited list of holdings for each Fidelity Central Fund is available upon request or at the Securities and Exchange Commission (the SEC) website at www.sec.gov. In addition, the financial statements of the Fidelity Central Funds, which are not covered by the Fund's Report of Independent Registered Public Accounting Firm, are available on the SEC website or upon request.
3. Significant Accounting Policies.
The financial statements have been prepared in conformity with accounting principles generally accepted in the United States of America (GAAP), which require management to make certain estimates and assumptions at the date of the financial statements. Actual results could differ from those estimates. Subsequent events, if any, through the date that the financial statements were issued have been evaluated in the preparation of the financial statements. The following summarizes the significant accounting policies of the Fund:
Annual Report
3. Significant Accounting Policies - continued
Investment Valuation. Investments are valued as of 4:00 p.m. Eastern time on the last calendar day of the period. In accordance with valuation policies and procedures approved by the Board of Trustees (the Board), the Fund attempts to obtain prices from one or more third party pricing vendors or brokers to value its investments. When current market prices, quotations or currency exchange rates are not readily available or reliable, investments will be fair valued in good faith by the Fidelity Management & Research Company (FMR) Fair Value Committee (the Committee), in accordance with procedures adopted by the Board. Factors used in determining fair value vary by investment type and may include market or investment specific events. The frequency with which these procedures are used cannot be predicted and they may be utilized to a significant extent. The Committee oversees the Fund's valuation policies and procedures and is responsible for approving and reporting to the Board all fair value determinations.
The Fund categorizes the inputs to valuation techniques used to value its investments into a disclosure hierarchy consisting of three levels as shown below:
Level 1 - quoted prices in active markets for identical investments
Level 2 - other significant observable inputs (including quoted prices for similar investments, interest rates, prepayment speeds, etc.)
Level 3 - unobservable inputs (including the Fund's own assumptions based on the best information available)
Valuation techniques used to value the Fund's investments by major category are as follows:
Equity securities, including restricted securities, for which market quotations are readily available, are valued at the last reported sale price or official closing price as reported by a third party pricing vendor on the primary market or exchange on which they are traded and are categorized as Level 1 in the hierarchy. In the event there were no sales during the day or closing prices are not available, securities are valued at the last quoted bid price or may be valued using the last available price and are generally categorized as Level 2 in the hierarchy. For foreign equity securities, when market or security specific events arise, comparisons to the valuation of American Depositary Receipts (ADRs), futures contracts, Exchange-Traded Funds (ETFs) and certain indexes as well as quoted prices for similar securities may be used and would be categorized as Level 2 in the hierarchy. Utilizing these techniques may result in transfers between Level 1 and Level 2. For equity securities, including restricted securities, where observable inputs are limited, assumptions about market activity and risk are used and these securities may be categorized as Level 3 in the hierarchy.
Annual Report
Notes to Financial Statements - continued
3. Significant Accounting Policies - continued
Investment Valuation - continued
Investments in open-end mutual funds, including the Fidelity Central Funds, are valued at their closing net asset value (NAV) each business day and are categorized as Level 1 in the hierarchy.
Changes in valuation techniques may result in transfers in or out of an assigned level within the disclosure hierarchy.
Foreign Currency. The Fund may use foreign currency contracts to facilitate transactions in foreign-denominated securities. Gains and losses from these transactions may arise from changes in the value of the foreign currency or if the counterparties do not perform under the contracts' terms.
Foreign-denominated assets, including investment securities, and liabilities are translated into U.S. dollars at the exchange rates at period end. Purchases and sales of investment securities, income and dividends received and expenses denominated in foreign currencies are translated into U.S. dollars at the exchange rate in effect on the transaction date.
The effects of exchange rate fluctuations on investments are included with the net realized and unrealized gain (loss) on investment securities. Other foreign currency transactions resulting in realized and unrealized gain (loss) are disclosed separately.
Investment Transactions and Income. For financial reporting purposes, the Fund's investment holdings and NAV include trades executed through the end of the last business day of the period. The NAV per share for processing shareholder transactions is calculated as of the close of business of the New York Stock Exchange (NYSE), normally 4:00 p.m. Eastern time and includes trades executed through the end of the prior business day. Gains and losses on securities sold are determined on the basis of identified cost and may include proceeds received from litigation. Dividend income is recorded on the ex-dividend date, except for certain dividends from foreign securities where the ex-dividend date may have passed, which are recorded as soon as the Fund is informed of the ex-dividend date. Non-cash dividends included in dividend income, if any, are recorded at the fair market value of the securities received. Distributions received on securities that represent a return of capital or capital gain are recorded as a reduction of cost of investments and/or as a realized gain. Subsequent to ex-dividend date the Fund determines the components of these distributions, based upon receipt of tax filings or other correspondence relating to the underlying investment. Interest income and distributions from the Fidelity Central Funds are accrued as earned. Interest income includes coupon interest and amortization of premium and accretion of discount on debt securities. Investment income is recorded net of foreign taxes withheld where recovery of such taxes is uncertain.
Annual Report
3. Significant Accounting Policies - continued
Class Allocations and Expenses. Investment income, realized and unrealized capital gains and losses, common expenses of the Fund, and certain fund-level expense reductions, if any, are allocated daily on a pro-rata basis to each class based on the relative net assets of each class to the total net assets of the Fund. Each class differs with respect to transfer agent and distribution and service plan fees incurred. Certain expense reductions may also differ by class. For the reporting period, the allocated portion of income and expenses to each class as a percent of its average net assets may vary due to the timing of recording these transactions in relation to fluctuating net assets of the classes. Expenses directly attributable to a fund are charged to that fund. Expenses attributable to more than one fund are allocated among the respective funds on the basis of relative net assets or other appropriate methods. Expense estimates are accrued in the period to which they relate and adjustments are made when actual amounts are known.
Income Tax Information and Distributions to Shareholders. Each year, the Fund intends to qualify as a regulated investment company under Subchapter M of the Internal Revenue Code, including distributing substantially all of its taxable income and realized gains. As a result, no provision for U.S. Federal income taxes is required. As of January 31, 2014, the Fund did not have any unrecognized tax benefits in the financial statements; nor is the Fund aware of any tax positions for which it is reasonably possible that the total amounts of unrecognized tax benefits will significantly change in the next twelve months. The Fund files a U.S. federal tax return, in addition to state and local tax returns as required. The Fund's federal income tax returns are subject to examination by the Internal Revenue Service (IRS) for a period of three fiscal years after they are filed. State and local tax returns may be subject to examination for an additional fiscal year depending on the jurisdiction. Foreign taxes are provided for based on the Fund's understanding of the tax rules and rates that exist in the foreign markets in which it invests.
Distributions are declared and recorded on the ex-dividend date. Income dividends and capital gain distributions are declared separately for each class. Income and capital gain distributions are determined in accordance with income tax regulations, which may differ from GAAP. In addition, the Fund claimed a portion of the payment made to redeeming shareholders as a distribution for income tax purposes.
Capital accounts within the financial statements are adjusted for permanent book-tax differences. These adjustments have no impact on net assets or the results of operations. Capital accounts are not adjusted for temporary book-tax differences which will reverse in a subsequent period.
Book-tax differences are primarily due to partnerships, foreign currency transactions, capital loss carryforwards and losses deferred due to wash sales and excise tax regulations.
Annual Report
Notes to Financial Statements - continued
3. Significant Accounting Policies - continued
Income Tax Information and Distributions to Shareholders - continued
The federal tax cost of investment securities and unrealized appreciation (depreciation) as of period end were as follows:
Gross unrealized appreciation | $ 184,053,049 |
Gross unrealized depreciation | (33,814,413) |
Net unrealized appreciation (depreciation) on securities and other investments | $ 150,238,636 |
|
|
Tax Cost | $ 1,439,157,746 |
The tax-based components of distributable earnings as of period end were as follows:
Undistributed ordinary income | $ 29,168,718 |
Undistributed long-term capital gain | $ 4,898,076 |
Net unrealized appreciation (depreciation) | $ 150,238,636 |
The tax character of distributions paid was as follows:
| January 31, 2014 | January 31, 2013 |
Ordinary Income | $ 97,039,748 | $ 8,438,509 |
Long-term Capital Gains | 31,781,693 | - |
Total | $ 128,821,441 | $ 8,438,509 |
Short-Term Trading (Redemption) Fees. Shares held by investors in the Fund less than 30 days may have been subject to a redemption fee equal to .75% of the NAV of shares redeemed. All redemption fees, which reduce the proceeds of the shareholder redemption, are retained by the Fund and accounted for as an addition to paid in capital.
4. Purchases and Sales of Investments.
Purchases and sales of securities, other than short-term securities, aggregated $2,712,269,364 and $2,096,788,012, respectively.
5. Fees and Other Transactions with Affiliates.
Management Fee. Fidelity Management & Research Company (the investment adviser) and its affiliates provide the Fund with investment management related services for which the Fund pays a monthly management fee. The management fee is the sum of an individual fund fee rate that is based on an annual rate of .30% of the Fund's average net assets and an annualized group fee rate that averaged .25% during the period. The group fee rate is based upon the average net assets of all the mutual funds
Annual Report
5. Fees and Other Transactions with Affiliates - continued
Management Fee - continued
advised by the investment adviser, including any mutual funds previously advised by the investment adviser that are currently advised by Fidelity SelectCo, LLC, an affiliate of the investment adviser. The group fee rate decreases as assets under management increase and increases as assets under management decrease. In addition, the management fee is subject to a performance adjustment (up to a maximum of ± .20% of the Fund's average net assets over a 36 month performance period). The upward or downward adjustment to the management fee is based on the relative investment performance of Mid Cap Value as compared to its benchmark index, the Russell Midcap Value Index, over the same 36 month performance period. For the reporting period, the total annual management fee rate, including the performance adjustment, was .56% of the Fund's average net assets. The performance adjustment included in the management fee rate may be higher or lower than the maximum performance adjustment rate due to the difference between the average net assets for the reporting and performance periods.
Distribution and Service Plan Fees. In accordance with Rule 12b-1 of the 1940 Act, the Fund has adopted separate Distribution and Service Plans for each class of shares. Certain classes pay Fidelity Distributors Corporation (FDC), an affiliate of the investment adviser, separate Distribution and Service Fees, each of which is based on an annual percentage of each class' average net assets. In addition, FDC may pay financial intermediaries for selling shares of the Fund and providing shareholder support services. For the period, the Distribution and Service Fee rates, total fees and amounts retained by FDC were as follows:
| Distribution | Service | Total Fees | Retained |
Class A | -% | .25% | $ 128,923 | $ 11,198 |
Class T | .25% | .25% | 81,928 | 6,010 |
Class B | .75% | .25% | 19,848 | 15,164 |
Class C | .75% | .25% | 161,972 | 55,405 |
|
|
| $ 392,671 | $ 87,777 |
Sales Load. FDC may receive a front-end sales charge of up to 5.75% for selling Class A shares and 3.50% for selling Class T shares, some of which is paid to financial intermediaries for selling shares of the Fund. Depending on the holding period, FDC may receive contingent deferred sales charges levied on Class A, Class T, Class B, and Class C redemptions. The deferred sales charges range from 5.00% to 1.00% for Class B shares, 1.00% for Class C shares, 1.00% for certain purchases of Class A shares and .25% for certain purchases of Class T shares.
Annual Report
Notes to Financial Statements - continued
5. Fees and Other Transactions with Affiliates - continued
Sales Load - continued
For the period, sales charge amounts retained by FDC were as follows:
| Retained |
Class A | $ 77,911 |
Class T | 15,473 |
Class B* | 2,172 |
Class C* | 2,495 |
| $ 98,051 |
* When Class B and Class C shares are initially sold, FDC pays commissions from its own resources to financial intermediaries through which the sales are made.
Transfer Agent Fees. Fidelity Investments Institutional Operations Company, Inc., (FIIOC), an affiliate of the investment adviser, is the transfer, dividend disbursing and shareholder servicing agent for each class of the Fund. FIIOC receives account fees and asset-based fees that vary according to the account size and type of account of the shareholders of the respective classes of the Fund. FIIOC pays for typesetting, printing and mailing of shareholder reports, except proxy statements. For the period, transfer agent fees for each class were as follows:
| Amount | % of |
Class A | $ 148,427 | .29 |
Class T | 50,447 | .31 |
Class B | 6,015 | .30 |
Class C | 46,001 | .28 |
Mid Cap Value | 2,226,404 | .19 |
Institutional Class | 38,594 | .24 |
| $ 2,515,888 |
|
Accounting and Security Lending Fees. Fidelity Service Company, Inc. (FSC), an affiliate of the investment adviser, maintains the Fund's accounting records. The accounting fee is based on the level of average net assets for each month. Under a separate contract, FSC administers the security lending program. The security lending fee is based on the number and duration of lending transactions.
Brokerage Commissions. The Fund placed a portion of its portfolio transactions with brokerage firms which are affiliates of the investment adviser. Brokerage commissions are included in net realized gain (loss) and change in net unrealized appreciation (depreciation) in the Statement of Operations. The commissions paid to these affiliated firms were $84,397 for the period.
Annual Report
6. Committed Line of Credit.
The Fund participates with other funds managed by the investment adviser or an affiliate in a $4.25 billion credit facility (the "line of credit") to be utilized for temporary or emergency purposes to fund shareholder redemptions or for other short-term liquidity purposes. The Fund has agreed to pay commitment fees on its pro-rata portion of the line of credit, which amounted to $1,644 and is reflected in Miscellaneous expenses on the Statement of Operations. During the period, there were no borrowings on this line of credit.
7. Security Lending.
The Fund lends portfolio securities through a lending agent from time to time in order to earn additional income. For equity securities, a lending agent is used and may loan securities to certain qualified borrowers, including Fidelity Capital Markets (FCM), a broker-dealer affiliated with the Fund. On the settlement date of the loan, the Fund receives collateral (in the form of U.S. Treasury obligations, letters of credit and/or cash) against the loaned securities and maintains collateral in an amount not less than 100% of the market value of the loaned securities during the period of the loan. The market value of the loaned securities is determined at the close of business of the Fund and any additional required collateral is delivered to the Fund on the next business day. If the borrower defaults on its obligation to return the securities loaned because of insolvency or other reasons, the Fund may apply collateral received from the borrower against the obligation. The Fund may experience delays and costs in recovering the securities loaned. Any cash collateral received is invested in the Fidelity Securities Lending Cash Central Fund. The value of loaned securities and cash collateral at period end are disclosed on the Fund's Statement of Assets and Liabilities. At period end, there were no security loans outstanding with FCM. Security lending income represents the income earned on investing cash collateral, less rebates paid to borrowers and any lending agent fees associated with the loan, plus any premium payments received for lending certain types of securities. Security lending income is presented in the Statement of Operations as a component of income from Fidelity Central Funds. Total security lending income during the period amounted to $89,777, including $12,095 from securities loaned to FCM.
8. Expense Reductions.
Commissions paid to certain brokers with whom the investment adviser, or its affiliates, places trades on behalf of the Fund include an amount in addition to trade execution, which may be rebated back to the Fund to offset certain expenses. This amount totaled $61,188 for the period. Through arrangements with the Fund's custodian, credits realized as a result of uninvested cash balances were used to reduce the Fund's expenses. During the period, these credits reduced the Fund's custody expenses by $42.
In addition, the investment adviser reimbursed a portion of the Fund's operating expenses during the period in the amount of $15,517.
Annual Report
Notes to Financial Statements - continued
9. Distributions to Shareholders.
Distributions to shareholders of each class were as follows:
Years ended January 31, | 2014 | 2013 |
From net investment income |
|
|
Class A | $ 530,640 | $ 253,117 |
Class T | 161,696 | 66,091 |
Class B | 4,861 | 7,351 |
Class C | 110,531 | 38,428 |
Mid Cap Value | 14,250,519 | 7,992,338 |
Institutional Class | 248,101 | 81,184 |
Total | $ 15,306,348 | $ 8,438,509 |
From net realized gain |
|
|
Class A | $ 4,929,724 | $ - |
Class T | 1,757,088 | - |
Class B | 177,882 | - |
Class C | 1,834,950 | - |
Mid Cap Value | 103,028,925 | - |
Institutional Class | 1,786,524 | - |
Total | $ 113,515,093 | $ - |
10. Share Transactions.
Transactions for each class of shares were as follows:
| Shares | Dollars | ||
Years ended January 31, | 2014 | 2013 | 2014 | 2013 |
Class A |
|
|
|
|
Shares sold | 2,457,916 | 457,731 | $ 52,076,305 | $ 7,879,366 |
Reinvestment of distributions | 241,636 | 13,590 | 5,178,254 | 235,643 |
Shares redeemed | (854,915) | (434,657) | (18,574,514) | (7,246,773) |
Net increase (decrease) | 1,844,637 | 36,664 | $ 38,680,045 | $ 868,236 |
Class T |
|
|
|
|
Shares sold | 800,279 | 155,888 | $ 17,075,459 | $ 2,678,394 |
Reinvestment of distributions | 89,099 | 3,790 | 1,903,163 | 65,644 |
Shares redeemed | (212,274) | (155,220) | (4,598,389) | (2,624,883) |
Net increase (decrease) | 677,104 | 4,458 | $ 14,380,233 | $ 119,155 |
Class B |
|
|
|
|
Shares sold | 43,830 | 10,295 | $ 911,529 | $ 177,345 |
Reinvestment of distributions | 8,260 | 397 | 174,775 | 6,824 |
Shares redeemed | (25,492) | (17,720) | (538,771) | (295,503) |
Net increase (decrease) | 26,598 | (7,028) | $ 547,533 | $ (111,334) |
Annual Report
10. Share Transactions - continued
| Shares | Dollars | ||
Years ended January 31, | 2014 | 2013 | 2014 | 2013 |
Class C |
|
|
|
|
Shares sold | 893,750 | 137,133 | $ 18,935,706 | $ 2,295,740 |
Reinvestment of distributions | 88,255 | 2,090 | 1,852,478 | 35,705 |
Shares redeemed | (160,748) | (98,602) | (3,440,149) | (1,645,075) |
Net increase (decrease) | 821,257 | 40,621 | $ 17,348,035 | $ 686,370 |
Mid Cap Value |
|
|
|
|
Shares sold | 42,202,723 | 6,300,912 | $ 892,720,042 | $ 110,558,662 |
Reinvestment of distributions | 5,185,864 | 443,673 | 112,014,623 | 7,742,097 |
Shares redeemed | (16,376,666) | (8,477,007) | (357,731,128) | (144,053,750) |
Net increase (decrease) | 31,011,921 | (1,732,422) | $ 647,003,537 | $ (25,752,991) |
Institutional Class |
|
|
|
|
Shares sold | 942,589 | 281,696 | $ 20,627,562 | $ 4,930,560 |
Reinvestment of distributions | 87,006 | 4,459 | 1,869,755 | 77,497 |
Shares redeemed | (234,974) | (108,318) | (5,112,398) | (1,862,178) |
Net increase (decrease) | 794,621 | 177,837 | $ 17,384,919 | $ 3,145,879 |
11. Other.
The Fund's organizational documents provide former and current trustees and officers with a limited indemnification against liabilities arising in connection with the performance of their duties to the Fund. In the normal course of business, the Fund may also enter into contracts that provide general indemnifications. The Fund's maximum exposure under these arrangements is unknown as this would be dependent on future claims that may be made against the Fund. The risk of material loss from such claims is considered remote.
Annual Report
Report of Independent Registered Public Accounting Firm
To the Trustees of Fidelity Devonshire Trust and the Shareholders of Fidelity Mid Cap Value Fund:
In our opinion, the accompanying statement of assets and liabilities, including the schedule of investments, and the related statements of operations and of changes in net assets and the financial highlights present fairly, in all material respects, the financial position of Fidelity Mid Cap Value Fund (a fund of Fidelity Devonshire Trust) at January 31, 2014, the results of its operations for the year then ended, the changes in its net assets for each of the two years in the period then ended and the financial highlights for each of the five years in the period then ended, in conformity with accounting principles generally accepted in the United States of America. These financial statements and financial highlights (hereafter referred to as "financial statements") are the responsibility of the Fidelity Mid Cap Value Fund's management. Our responsibility is to express an opinion on these financial statements based on our audits. We conducted our audits of these financial statements in accordance with the standards of the Public Company Accounting Oversight Board (United States). Those standards require that we plan and perform the audit to obtain reasonable assurance about whether the financial statements are free of material misstatement. An audit includes examining, on a test basis, evidence supporting the amounts and disclosures in the financial statements, assessing the accounting principles used and significant estimates made by management, and evaluating the overall financial statement presentation. We believe that our audits, which included confirmation of securities at January 31, 2014 by correspondence with the custodian and brokers, provide a reasonable basis for our opinion.
PricewaterhouseCoopers LLP
Boston, Massachusetts
March 14, 2014
Annual Report
Trustees and Officers
The Trustees, Member of the Advisory Board, and officers of the trust and fund, as applicable, are listed below. The Board of Trustees governs the fund and is responsible for protecting the interests of shareholders. The Trustees are experienced executives who meet periodically throughout the year to oversee the fund's activities, review contractual arrangements with companies that provide services to the fund, oversee management of the risks associated with such activities and contractual arrangements, and review the fund's performance. Except for James C. Curvey, Ned C. Lautenbach, and William S. Stavropoulos, each of the Trustees oversees 173 funds. Mr. Curvey oversees 396 funds. Mr. Lautenbach and Mr. Stavropoulos each oversees 247 funds.
The Trustees hold office without limit in time except that (a) any Trustee may resign; (b) any Trustee may be removed by written instrument, signed by at least two-thirds of the number of Trustees prior to such removal; (c) any Trustee who requests to be retired or who has become incapacitated by illness or injury may be retired by written instrument signed by a majority of the other Trustees; and (d) any Trustee may be removed at any special meeting of shareholders by a two-thirds vote of the outstanding voting securities of the trust. Each Trustee who is not an interested person (as defined in the 1940 Act) of the trust and the fund (Independent Trustee), shall retire not later than the last day of the calendar year in which his or her 75th birthday occurs. The Independent Trustees may waive this mandatory retirement age policy with respect to individual Trustees. The officers and Advisory Board Member hold office without limit in time, except that any officer and Advisory Board Member may resign or may be removed by a vote of a majority of the Trustees at any regular meeting or any special meeting of the Trustees. Except as indicated, each individual has held the office shown or other offices in the same company for the past five years.
Experience, Skills, Attributes, and Qualifications of the Fund's Trustees. The Governance and Nominating Committee has adopted a statement of policy that describes the experience, qualifications, attributes, and skills that are necessary and desirable for potential Independent Trustee candidates (Statement of Policy). The Board believes that each Trustee satisfied at the time he or she was initially elected or appointed a Trustee, and continues to satisfy, the standards contemplated by the Statement of Policy. The Governance and Nominating Committee also engages professional search firms to help identify potential Independent Trustee candidates who have the experience, qualifications, attributes, and skills consistent with the Statement of Policy. From time to time, additional criteria based on the composition and skills of the current Independent Trustees, as well as experience or skills that may be appropriate in light of future changes to board composition, business conditions, and regulatory or other developments, have also been considered by the professional search firms and the Governance and Nominating Committee. In addition, the Board takes into account the Trustees' commitment and participation in Board and committee meetings, as well as their leadership of standing and ad hoc committees throughout their tenure.
Annual Report
Trustees and Officers - continued
In determining that a particular Trustee was and continues to be qualified to serve as a Trustee, the Board has considered a variety of criteria, none of which, in isolation, was controlling. The Board believes that, collectively, the Trustees have balanced and diverse experience, qualifications, attributes, and skills, which allow the Board to operate effectively in governing the fund and protecting the interests of shareholders. Information about the specific experience, skills, attributes, and qualifications of each Trustee, which in each case led to the Board's conclusion that the Trustee should serve (or continue to serve) as a trustee of the fund, is provided below.
Board Structure and Oversight Function. James C. Curvey is an interested person (as defined in the 1940 Act) and currently serves as Chairman. The Trustees have determined that an interested Chairman is appropriate and benefits shareholders because an interested Chairman has a personal and professional stake in the quality and continuity of services provided to the fund. Independent Trustees exercise their informed business judgment to appoint an individual of their choosing to serve as Chairman, regardless of whether the Trustee happens to be independent or a member of management. The Independent Trustees have determined that they can act independently and effectively without having an Independent Trustee serve as Chairman and that a key structural component for assuring that they are in a position to do so is for the Independent Trustees to constitute a substantial majority for the Board. The Independent Trustees also regularly meet in executive session. Ned C. Lautenbach serves as Chairman of the Independent Trustees and as such (i) acts as a liaison between the Independent Trustees and management with respect to matters important to the Independent Trustees and (ii) with management prepares agendas for Board meetings.
Fidelity funds are overseen by different Boards of Trustees. The fund's Board oversees Fidelity's equity and high income funds and another Board oversees Fidelity's investment-grade bond, money market, and asset allocation funds. The asset allocation funds may invest in Fidelity funds overseen by the fund's Board. The use of separate Boards, each with its own committee structure, allows the Trustees of each group of Fidelity funds to focus on the unique issues of the funds they oversee, including common research, investment, and operational issues. On occasion, the separate Boards establish joint committees to address issues of overlapping consequences for the Fidelity funds overseen by each Board.
The Trustees operate using a system of committees to facilitate the timely and efficient consideration of all matters of importance to the Trustees, the fund, and fund shareholders and to facilitate compliance with legal and regulatory requirements and oversight of the fund's activities and associated risks. The Board, acting through its committees, has charged FMR and its affiliates with (i) identifying events or circumstances the occurrence of which could have demonstrably adverse effects on the fund's business and/or reputation; (ii) implementing processes and controls to lessen the possibility that such events or circumstances occur or to mitigate the effects of such events or circumstances if they do occur; and (iii) creating and maintaining a system designed to evaluate continuously business and market conditions in order to facilitate the identification and implementation processes described in (i) and (ii) above. Because the day-to-day operations and activities of the fund are carried out by or through FMR, its affiliates and other service providers, the fund's exposure to risks is mitigated but not eliminated by the processes overseen by the Trustees. While each of the Board's committees has responsibility for overseeing different aspects of the fund's activities, oversight is exercised primarily through the Operations, Audit, and Compliance Committees. In addition, the Independent Trustees have worked with FMR to enhance the Board's oversight of investment and financial risks, legal and regulatory risks, technology risks, and operational risks, including the development of additional risk reporting to the Board. For example, a working group comprised of Independent Trustees and FMR has worked and continues to work to review the Fidelity funds' valuation-related activities, reporting and risk management. Appropriate personnel, including but not limited to the fund's Chief Compliance Officer (CCO), FMR's internal auditor, the independent accountants, the fund's Treasurer and portfolio management personnel, make periodic reports to the Board's committees, as appropriate, including an annual review of FMR's risk management program for the Fidelity funds. The responsibilities of each standing committee, including their oversight responsibilities, are described further under "Standing Committees of the Fund's Trustees."
Annual Report
The fund's Statement of Additional Information (SAI) includes more information about the Trustees. To request a free copy, call Fidelity at 1-877-208-0098.
Interested Trustees*:
Correspondence intended for each Trustee who is an interested person may be sent to Fidelity Investments, 245 Summer Street, Boston, Massachusetts 02210.
Name, Year of Birth; Principal Occupations and Other Relevant Experience+ | |
James C. Curvey (1935) | |
Year of Election or Appointment: 2007 Trustee Chairman of the Board of Trustees | |
| Mr. Curvey also serves as Trustee of other Fidelity funds. Mr. Curvey is a Director of Fidelity Investments Money Management, Inc. (2009-present), Director of Fidelity Research & Analysis Co. (2009-present) and Director of FMR and FMR Co., Inc. (2007-present). Mr. Curvey is also Vice Chairman (2007-present) and Director of FMR LLC. In addition, Mr. Curvey serves as an Overseer for the Boston Symphony Orchestra and a member of the Trustees of Villanova University. Previously, Mr. Curvey was the Vice Chairman (2006-2007) and Director (2000-2007) of FMR Corp. |
Charles S. Morrison (1960) | |
Year of Election or Appointment: 2014 Trustee | |
| Mr. Morrison also serves as Trustee or Vice President of other funds. He serves as President, Asset Management (2014-present) and is an employee of Fidelity Investments. Previously, Mr. Morrison served as President, Fixed Income (2011-2014), Vice President of Fidelity's Money Market Funds (2005-2009), President, Money Market Group Leader of FMR (2009), and Senior Vice President, Money Market Group of FMR (2004-2009). Mr. Morrison also served as Vice President of Fidelity's Bond Funds (2002-2005), certain Balanced Funds (2002-2005), and certain Asset Allocation Funds (2002-2007), and as Senior Vice President (2002-2005) of Fidelity's Bond Division. |
* Trustees have been determined to be "Interested Trustees" by virtue of, among other things, their affiliation with the trust or various entities under common control with FMR.
+ The information above includes each Trustee's principal occupation during the last five years and other information relating to the experience, attributes, and skills relevant to each Trustee's qualifications to serve as a Trustee, which led to the conclusion that each Trustee should serve as a Trustee for the fund.
Annual Report
Independent Trustees:
Correspondence intended for each Independent Trustee (that is, the Trustees other than the Interested Trustees) may be sent to Fidelity Investments, P.O. Box 55235, Boston, Massachusetts 02205-5235.
Name, Year of Birth; Principal Occupations and Other Relevant Experience+ | |
Dennis J. Dirks (1948) | |
Year of Election or Appointment: 2005 Trustee | |
| Mr. Dirks also serves as Trustee of other Fidelity funds. Prior to his retirement in May 2003, Mr. Dirks was Chief Operating Officer and a member of the Board of The Depository Trust & Clearing Corporation (DTCC). He also served as President, Chief Operating Officer, and Board member of The Depository Trust Company (DTC) and President and Board member of the National Securities Clearing Corporation (NSCC). In addition, Mr. Dirks served as Chief Executive Officer and Board member of the Government Securities Clearing Corporation, Chief Executive Officer and Board member of the Mortgage-Backed Securities Clearing Corporation, as a Trustee and a member of the Finance Committee of Manhattan College (2005-2008), and as a Trustee and a member of the Finance Committee of AHRC of Nassau County (2006-2008). Mr. Dirks is a member of the Independent Directors Council (IDC) Governing Council (2010-present) and Board of Directors for The Brookville Center for Children's Services, Inc. (2009-present). |
Alan J. Lacy (1953) | |
Year of Election or Appointment: 2008 Trustee | |
| Mr. Lacy also serves as Trustee of other Fidelity funds. Mr. Lacy serves as Senior Adviser (2007-present) of Oak Hill Capital Partners, L.P. (private equity). Mr. Lacy also served as Chief Executive Officer (2000-2005) and Vice Chairman (2005-2006) of Sears Holdings Corporation and Sears, Roebuck and Co. (retail). In addition, Mr. Lacy serves as a member of the Board of Directors of Dave & Buster's Entertainment, Inc. (restaurant and entertainment complexes, 2010-present), Earth Fare, Inc. (retail grocery, 2012-present), The Hillman Companies, Inc. (hardware wholesalers, 2010-present), and Bristol-Myers Squibb Company (global pharmaceuticals, 2008-present). Mr. Lacy is a member of the Board of Trustees of The National Parks Conservation Association (2006-present). Previously, Mr. Lacy served as Chairman of the Board of Trustees of the National Parks Conservation Association (2008-2011) and as a member of the Board of Directors for the Western Union Company (global money transfer, 2006-2011). |
Ned C. Lautenbach (1944) | |
Year of Election or Appointment: 2000 Trustee Chairman of the Independent Trustees | |
| Mr. Lautenbach also serves as Trustee of other Fidelity funds. Mr. Lautenbach currently serves as the Lead Director of the Eaton Corporation Board of Directors (diversified industrial, 1997-present). Mr. Lautenbach is Chairman of the Board of Directors of the Philharmonic Center for the Arts in Naples, Florida (2012-present) and a member of the Council on Foreign Relations (1994-present). Previously, Mr. Lautenbach was a Partner/Advisory Partner at Clayton, Dubilier & Rice, LLC (private equity investment, 1998-2010), as well as a Director of Sony Corporation (2006-2007). |
Joseph Mauriello (1944) | |
Year of Election or Appointment: 2008 Trustee | |
| Mr. Mauriello also serves as Trustee of other Fidelity funds. Prior to his retirement in January 2006, Mr. Mauriello served in numerous senior management positions including Deputy Chairman and Chief Operating Officer (2004-2005), and Vice Chairman of Financial Services (2002-2004) of KPMG LLP US (professional services, 1965-2005). Mr. Mauriello currently serves as a member of the Board of Directors of XL Group plc. (global insurance and re-insurance, 2006-present). Previously, Mr. Mauriello served as a Director of the Hamilton Funds of the Bank of New York (2006-2007) and of Arcadia Resources Inc. (health care services and products, 2007-2012). |
Robert W. Selander (1950) | |
Year of Election or Appointment: 2011 Trustee | |
| Mr. Selander also serves as Trustee of other Fidelity funds. Previously, Mr. Selander served as a Member of the Advisory Board of other Fidelity funds (2011), and Executive Vice Chairman (2010), Chief Executive Officer (2009-2010), and President and Chief Executive Officer (1997-2009) of Mastercard, Inc. |
Cornelia M. Small (1944) | |
Year of Election or Appointment: 2005 Trustee | |
| Ms. Small also serves as Trustee of other Fidelity funds. Ms. Small is a member of the Board of Directors (2009-present) and Chair of the Investment Committee (2010-present) of the Teagle Foundation. Ms. Small also serves on the Investment Committee of the Berkshire Taconic Community Foundation (2008-present). Previously, Ms. Small served as Chairperson (2002-2008) and a member of the Investment Committee and Chairperson (2008-2012) and a member of the Board of Trustees of Smith College. In addition, Ms. Small served as Chief Investment Officer, Director of Global Equity Investments, and a member of the Board of Directors of Scudder, Stevens & Clark and Scudder Kemper Investments. |
William S. Stavropoulos (1939) | |
Year of Election or Appointment: 2002 Trustee Vice Chairman of the Independent Trustees | |
| Mr. Stavropoulos also serves as Trustee of other Fidelity funds. Mr. Stavropoulos serves as President and Founder of the Michigan Baseball Foundation, the Great Lakes Loons (2007-present). Mr. Stavropoulos is Chairman Emeritus of the Board of Directors of The Dow Chemical Company, where he previously served in numerous senior management positions, including President, CEO (1995-2000; 2002-2004), Chairman of the Executive Committee (2000-2006), and as a member of the Board of Directors (1990-2006). Currently, Mr. Stavropoulos is Chairman of the Board of Directors of Univar Inc. (global distributor of commodity and specialty chemicals), a Director of Teradata Corporation (data warehousing and technology solutions), and Maersk Inc. (industrial conglomerate), and a member of the Advisory Board for Metalmark Capital LLC (private equity investment, 2005-present). Mr. Stavropoulos is an operating advisor to Clayton, Dubilier & Rice, LLC (private equity investment). In addition, Mr. Stavropoulos is a member of the University of Notre Dame Advisory Council for the College of Science, a Trustee of the Rollin L. Gerstacker Foundation, and a Director of the Naples Philharmonic Center for the Arts. Previously, Mr. Stavropoulos served as a Director of Chemical Financial Corporation (bank holding company, 1993-2012) and Tyco International, Ltd. (multinational manufacturing and services, 2007-2012). |
David M. Thomas (1949) | |
Year of Election or Appointment: 2008 Trustee | |
| Mr. Thomas also serves as Trustee of other Fidelity funds. Mr. Thomas serves as Non-Executive Chairman of the Board of Directors of Fortune Brands Home and Security (home and security products, 2011-present), and as a member of the Board of Directors of Interpublic Group of Companies, Inc. (marketing communication, 2004-present). Previously, Mr. Thomas served as Executive Chairman (2005-2006) and Chairman and Chief Executive Officer (2000-2005) of IMS Health, Inc. (pharmaceutical and healthcare information solutions), and a Director of Fortune Brands, Inc. (consumer products, 2000-2011). |
+ The information above includes each Trustee's principal occupation during the last five years and other information relating to the experience, attributes, and skills relevant to each Trustee's qualifications to serve as a Trustee, which led to the conclusion that each Trustee should serve as a Trustee for the fund.
Advisory Board Member and Officers:
Correspondence intended for each officer and Peter S. Lynch may be sent to Fidelity Investments, 245 Summer Street, Boston, Massachusetts 02210. Officers appear below in alphabetical order.
Name, Year of Birth; Principal Occupation | |
Peter S. Lynch (1944) | |
Year of Election or Appointment: 2003 Member of the Advisory Board | |
| Mr. Lynch also serves as Member of the Advisory Board of other Fidelity funds. Mr. Lynch is Vice Chairman and a Director of FMR and FMR Co., Inc. In addition, Mr. Lynch serves as a Trustee of Boston College and as the Chairman of the Inner-City Scholarship Fund. Previously, Mr. Lynch served on the Special Olympics International Board of Directors (1997-2006). |
Elizabeth Paige Baumann (1968) | |
Year of Election or Appointment: 2012 Anti-Money Laundering (AML) Officer | |
| Ms. Baumann also serves as AML Officer of other funds. She is Chief AML Officer of FMR LLC (2012-present) and is an employee of Fidelity Investments. Previously, Ms. Baumann served as Vice President and Deputy Anti-Money Laundering Officer (2007-2012). |
William C. Coffey (1969) | |
Year of Election or Appointment: 2009 Assistant Secretary | |
| Mr. Coffey also serves as Assistant Secretary of other funds. He is Senior Vice President and Deputy General Counsel of FMR LLC (2010-present), and is an employee of Fidelity Investments. Previously, Mr. Coffey served as Vice President and Associate General Counsel of FMR LLC (2005-2009). |
Jonathan Davis (1968) | |
Year of Election or Appointment: 2010 Assistant Treasurer | |
| Mr. Davis also serves as Assistant Treasurer of other funds. Mr. Davis is an employee of Fidelity Investments. Previously, Mr. Davis served as Vice President and Associate General Counsel of FMR LLC (2003-2010). |
Adrien E. Deberghes (1967) | |
Year of Election or Appointment: 2008 Deputy Treasurer | |
| Mr. Deberghes also serves as an officer of other funds. He is an employee of Fidelity Investments (2008-present). Prior to joining Fidelity Investments, Mr. Deberghes was Senior Vice President of Mutual Fund Administration at State Street Corporation (2007-2008), Senior Director of Mutual Fund Administration at Investors Bank & Trust (2005-2007), and Director of Finance for Dunkin' Brands (2000-2005). |
Stephanie J. Dorsey (1969) | |
Year of Election or Appointment: 2010 Assistant Treasurer | |
| Ms. Dorsey also serves as an officer of other funds. She is an employee of Fidelity Investments (2008-present) and has served in other fund officer roles. Prior to joining Fidelity Investments, Ms. Dorsey served as Treasurer (2004-2008) of the JPMorgan Mutual Funds and Vice President (2004-2008) of JPMorgan Chase Bank. |
Scott C. Goebel (1968) | |
Year of Election or Appointment: 2008 Secretary and Chief Legal Officer (CLO) | |
| Mr. Goebel serves as Secretary and CLO of other funds. Mr. Goebel also serves as Secretary of Fidelity SelectCo, LLC (2013-present), Fidelity Investments Money Management, Inc. (FIMM) (2010-present) and Fidelity Research and Analysis Company (FRAC) (2010-present); General Counsel, Secretary, and Senior Vice President of FMR (2008-present) and FMR Co., Inc. (2008-present); Chief Legal Officer of Fidelity Management & Research (Hong Kong) Limited (2008-present); and Assistant Secretary of Fidelity Management & Research (Japan) Inc. (2008-present) and Fidelity Management & Research (U.K.) Inc. (2008-present). Previously, Mr. Goebel served as Secretary and CLO of other Fidelity funds (2008-2013), Assistant Secretary of FIMM (2008-2010), FRAC (2008-2010), and certain funds (2007-2008); and as Vice President and Secretary of Fidelity Distributors Corporation (FDC) (2005-2007). Mr. Goebel has been employed by FMR LLC or an affiliate since 2001. |
Joseph A. Hanlon (1968) | |
Year of Election or Appointment: 2012 Chief Compliance Officer | |
| Mr. Hanlon also serves as Chief Compliance Officer of other funds. Mr. Hanlon serves as Compliance Officer of FMR, FMR Co., Inc., Fidelity Investments Money Management, Inc. (FIMM), Fidelity Research and Analysis Company (FRAC), and Fidelity Management & Research (Hong Kong) (2009-present), as Senior Vice President of the Fidelity Asset Management Division (2009-present), and is an employee of Fidelity Investments. Previously, Mr. Hanlon served as Compliance Officer of Fidelity Management & Research (Japan) Inc. (2009-2013), Strategic Advisers, Inc. (2009-2013), and Fidelity Management & Research (U.K.) Inc. (2009-2013). |
Thomas C. Hense (1964) | |
Year of Election or Appointment: 2008/2010 Vice President | |
| Mr. Hense also serves as Vice President of other funds (High Income (2008), Small Cap (2008), and Value (2010) funds). Previously, Mr. Hense served as a portfolio manager for Fidelity's Institutional Money Management Group (Pyramis) (2003-2008). |
Brian B. Hogan (1964) | |
Year of Election or Appointment: 2009 Vice President | |
| Mr. Hogan also serves as Trustee or Vice President of other funds. Mr. Hogan serves as President of FMR's Equity Division (2009-present). Previously, Mr. Hogan served as Senior Vice President, Equity Research of FMR (2006-2009) and as a portfolio manager. |
Chris Maher (1972) | |
Year of Election or Appointment: 2013 Assistant Treasurer | |
| Mr. Maher serves as Assistant Treasurer of other funds. Mr. Maher is Vice President of Valuation Oversight and is an employee of Fidelity Investments. Previously, Mr. Maher served as Vice President of Asset Management Compliance (2013), Vice President of FMR's Program Management Group (2010-2013), and Vice President of Valuation Oversight (2008-2010). |
Christine Reynolds (1958) | |
Year of Election or Appointment: 2008 Chief Financial Officer | |
| Ms. Reynolds also serves as Chief Financial Officer of other funds. Ms. Reynolds became President of Fidelity Pricing and Cash Management Services (FPCMS) in August 2008. Ms. Reynolds served as Chief Operating Officer of FPCMS (2007-2008). Previously, Ms. Reynolds served as President, Treasurer, and Anti-Money Laundering officer of the Fidelity funds (2004-2007). |
Kenneth B. Robins (1969) | |
Year of Election or Appointment: 2008 President and Treasurer | |
| Mr. Robins also serves as an officer of other funds. Mr. Robins serves as Executive Vice President of Fidelity Investments Money Management, Inc. (FIMM) (2013-present) and is an employee of Fidelity Investments (2004-present). Previously, Mr. Robins served in other fund officer roles. |
Gary W. Ryan (1958) | |
Year of Election or Appointment: 2005 Assistant Treasurer | |
| Mr. Ryan also serves as Assistant Treasurer of other funds. Mr. Ryan is an employee of Fidelity Investments and has served in other fund officer roles. Previously, Mr. Ryan served as Vice President of Fund Reporting in Fidelity Pricing and Cash Management Services (FPCMS) (1999-2005). |
Stephen Sadoski (1971) | |
Year of Election or Appointment: 2012 Deputy Treasurer | |
| Mr. Sadoski also serves as Deputy Treasurer of other funds. He is an employee of Fidelity Investments (2012-present) and has served in another fund officer role. Prior to joining Fidelity Investments, Mr. Sadoski served as an assistant chief accountant in the Division of Investment Management of the Securities and Exchange Commission (SEC) (2009-2012) and as a senior manager at Deloitte & Touche LLP (1997-2009). |
Stacie M. Smith (1974) | |
Year of Election or Appointment: 2013 Deputy Treasurer | |
| Ms. Smith also serves as an officer of other funds. She is an employee of Fidelity Investments (2009-present) and has served in other fund officer roles. Prior to joining Fidelity Investments, Ms. Smith served as Senior Audit Manager of Ernst & Young LLP (1996-2009). |
Renee Stagnone (1975) | |
Year of Election or Appointment: 2013 Deputy Treasurer | |
| Ms. Stagnone also serves as Deputy Treasurer of other funds. Ms. Stagnone is an employee of Fidelity Investments. |
Joseph F. Zambello (1957) | |
Year of Election or Appointment: 2011 Deputy Treasurer | |
| Mr. Zambello also serves as Deputy Treasurer of other funds. Mr. Zambello is an employee of Fidelity Investments. Previously, Mr. Zambello served as Vice President of FMR's Program Management Group (2009-2011) and Vice President of the Transfer Agent Oversight Group (2005-2009). |
Annual Report
Distributions (Unaudited)
The Board of Trustees of Fidelity Advisor Mid Cap Value Fund voted to pay to shareholders of record at the opening of business on record date, the following distributions per share derived from capital gains realized from sales of portfolio securities and dividends derived from net investment income:
| Pay Date | Record Date | Dividends | Capital Gains |
Class A | 03/17/14 | 03/14/14 | $0.000 | $0.478 |
Class T | 03/17/14 | 03/14/14 | $0.000 | $0.473 |
Class B | 03/17/14 | 03/14/14 | $0.000 | $0.463 |
Class C | 03/17/14 | 03/14/14 | $0.000 | $0.465 |
The fund hereby designates as a capital gain dividend with respect to the taxable year ended January 31, 2014, $36,679,770, or, if subsequently determined to be different, the net capital gain of such year.
Class A designates 16%; Class T designates 16%; Class B designates 18%; and Class C designates 17% of the dividends during the fiscal year as qualifying for the dividends-received deduction for corporate shareholders.
Class A designates 19%; Class T designates 19%; Class B designates 21%; and Class C designates 20% of the dividends distributed during the fiscal year as amounts which may be taken into account as a dividend for purposes of the maximum rate under section 1(h)(11) of the Internal Revenue Code.
The fund will notify shareholders in January 2015 of amounts for use in preparing 2014 income tax returns.
Annual Report
Investment Adviser
Fidelity Management & Research Company
Boston, MA
Investment Sub-Advisers
FMR Co., Inc.
Fidelity Management & Research
(U.K.) Inc.
Fidelity Management & Research
(Hong Kong) Limited
Fidelity Management & Research
(Japan) Inc.
General Distributor
Fidelity Distributors Corporation
Smithfield, RI
Transfer and Service Agents
Fidelity Investments Institutional Operations Company, Inc.
Boston, MA
Fidelity Service Company, Inc.
Boston, MA
Custodian
Citibank, N.A.
New York, NY
(Fidelity Investment logo)(registered trademark)
AMCV-UANN-0314
1.838439.105
(Fidelity Investment logo)(registered trademark)
Fidelity Advisor®
Mid Cap Value
Fund - Institutional Class
Annual Report
January 31, 2014
(Fidelity Cover Art)
Institutional Class is a class of
Fidelity® Mid Cap Value Fund
Contents
Performance | How the fund has done over time. | |
Management's Discussion of Fund Performance | The Portfolio Manager's review of fund performance and strategy. | |
Shareholder Expense Example | An example of shareholder expenses. | |
Investment Changes | A summary of major shifts in the fund's investments over the past six months. | |
Investments | A complete list of the fund's investments with their market values. | |
Financial Statements | Statements of assets and liabilities, operations, and changes in net assets, as well as financial highlights. | |
Notes | Notes to the financial statements. | |
Report of Independent Registered Public Accounting Firm |
| |
Trustees and Officers |
| |
Distributions |
|
To view a fund's proxy voting guidelines and proxy voting record for the 12-month period ended June 30, visit http://www.fidelity.com/proxyvotingresults or visit the Securities and Exchange Commission's (SEC) web site at http://www.sec.gov. You may also call 1-877-208-0098 to request a free copy of the proxy voting guidelines.
Standard & Poor's, S&P and S&P 500 are registered service marks of The McGraw-Hill Companies, Inc. and have been licensed for use by Fidelity Distributors Corporation.
Other third-party marks appearing herein are the property of their respective owners.
All other marks appearing herein are registered or unregistered trademarks or service marks of FMR LLC or an affiliated company. © 2014 FMR LLC. All rights reserved.
Annual Report
This report and the financial statements contained herein are submitted for the general information of the shareholders of the fund. This report is not authorized for distribution to prospective investors in the fund unless preceded or accompanied by an effective prospectus.
A fund files its complete schedule of portfolio holdings with the SEC for the first and third quarters of each fiscal year on Form N-Q. Forms N-Q are available on the SEC's web site at http://www.sec.gov. A fund's Forms N-Q may be reviewed and copied at the SEC's Public Reference Room in Washington, DC. Information regarding the operation of the SEC's Public Reference Room may be obtained by calling 1-800-SEC-0330. For a complete list of a fund's portfolio holdings, view the most recent holdings listing, semiannual report, or annual report on Fidelity's web site at http://www.fidelity.com, http://www.advisor.fidelity.com, or http://www.401k.com, as applicable.
NOT FDIC INSURED • MAY LOSE VALUE • NO BANK GUARANTEE
Neither the fund nor Fidelity Distributors Corporation is a bank.
Annual Report
Performance: The Bottom Line
Average annual total return reflects the change in the value of an investment, assuming reinvestment of the class' distributions from dividend income and capital gains (the profits earned upon the sale of securities that have grown in value, if any) and assuming a constant rate of performance each year. The $10,000 table and the fund's returns do not reflect the deduction of taxes that a shareholder would pay on fund distributions or the redemption of fund shares. During periods of reimbursement by Fidelity, a fund's total return will be greater than it would be had the reimbursement not occurred. How a fund did yesterday is no guarantee of how it will do tomorrow.
Average Annual Total Returns
Periods ended January 31, 2014 | Past 1 | Past 5 | Past 10 |
Institutional Class A | 23.98% | 23.73% | 9.50% |
A The initial offering of Institutional Class shares took place on February 13, 2007. Returns prior to February 13, 2007 are those of Fidelity® Mid Cap Value Fund, the original class of the fund.
$10,000 Over 10 Years
Let's say hypothetically that $10,000 was invested in Fidelity Advisor® Mid Cap Value Fund - Institutional Class on January 31, 2004. The chart shows how the value of your investment would have changed, and also shows how the Russell Midcap® Value Index performed over the same period. See footnote A above for additional information regarding the performance of Institutional Class.
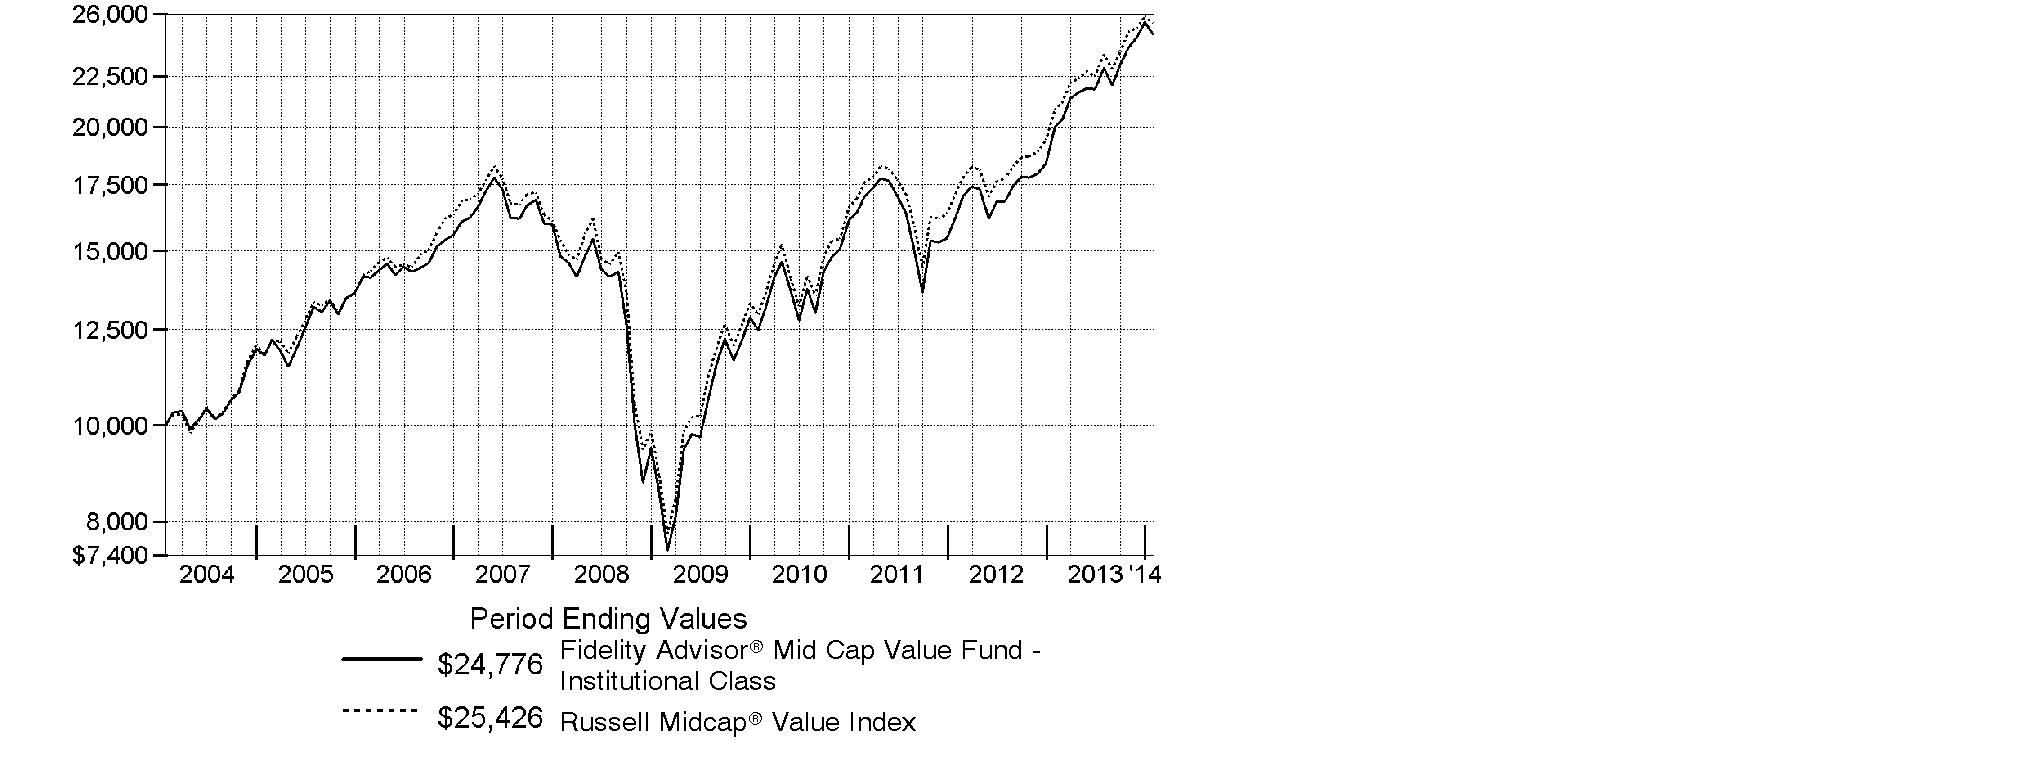
Annual Report
Management's Discussion of Fund Performance
Market Recap: Despite the worst January in years, markets finished notably higher for the 12 months ending January 31, 2014, amid a generally improving global economy and accommodative monetary policies worldwide. After achieving a series of highs in 2013, both the broad S&P 500® Index and the blue-chip Dow Jones Industrial AverageSM pulled back in the new year, bringing their 12-month returns to 21.52% and 16.07%, respectively. The growth-oriented Nasdaq Composite Index®, having run hotter in 2013 and cooled less in January, retained a loftier 32.33% result. For the period overall, smaller-cap stocks generally outperformed larger-caps, and growth outperformed value across market-cap segments. Bullish sentiment drove stocks higher through mid-May, but mixed signals from the U.S. Federal Reserve as to when it might curtail its stimulative bond-buying program, along with jitters over a potential U.S. military strike in Syria, put the markets in flux over the summer. Stocks regained their momentum in October despite a budget impasse that briefly shuttered the federal government, and volatility remained subdued heading into the holidays, allowing many markets to hit all-time highs by year-end. In January, renewed optimism for Europe and other developed markets was overrun by renewed concern about Fed tapering, the economic slowdown in China and a sell-off in emerging markets.
Comments from Court Dignan, who became Portfolio Manager of Fidelity Advisor® Mid Cap Value Fund on April 12, 2013: For the year, the fund's Institutional Class shares returned 23.98%, versus 22.14% for the Russell Midcap® Value Index. Security selection, which focused on higher- or average-quality mid-cap companies selling at average or discounted prices, was especially strong in financials. Top individual contributors included alternative asset managers Blackstone Group and Apollo Global Management, whose steep share price gains were fueled by growing appreciation of their earnings growth potential. An investment in commercial real estate investment trust (REIT) NorthStar Realty Finance soared on news that the company would spin off its asset management business. All were out-of-index positions. By contrast, stock picks in information technology hindered relative performance. Individual disappointments came from not owning semiconductor chipmaker Micron Technology, an index component whose shares took off when a fire at a competitor's facility reduced supply and pricing rose. Elsewhere, being early in buying retail REIT CBL & Associates Properties hurt, as rising interest rates and slowing mall traffic pressured its return.
The views expressed above reflect those of the portfolio manager(s) only through the end of the period as stated on the cover of this report and do not necessarily represent the views of Fidelity or any other person in the Fidelity organization. Any such views are subject to change at any time based upon market or other conditions and Fidelity disclaims any responsibility to update such views. These views may not be relied on as investment advice and, because investment decisions for a Fidelity fund are based on numerous factors, may not be relied on as an indication of trading intent on behalf of any Fidelity fund.
Annual Report
Shareholder Expense Example
As a shareholder of the Fund, you incur two types of costs: (1) transaction costs, including sales charges (loads) on purchase payments or redemption proceeds, redemption fees and (2) ongoing costs, including management fees, distribution and/or service (12b-1) fees and other Fund expenses. This Example is intended to help you understand your ongoing costs (in dollars) of investing in the Fund and to compare these costs with the ongoing costs of investing in other mutual funds.
The Example is based on an investment of $1,000 invested at the beginning of the period and held for the entire period (August 1, 2013 to January 31, 2014).
Actual Expenses
The first line of the accompanying table for each class of the Fund provides information about actual account values and actual expenses. You may use the information in this line, together with the amount you invested, to estimate the expenses that you paid over the period. Simply divide your account value by $1,000.00 (for example, an $8,600 account value divided by $1,000.00 = 8.6), then multiply the result by the number in the first line for a class of the Fund under the heading entitled "Expenses Paid During Period" to estimate the expenses you paid on your account during this period. A small balance maintenance fee of $12.00 that is charged once a year may apply for certain accounts with a value of less than $2,000. This fee is not included in the table below. If it was, the estimate of expenses you paid during the period would be higher, and your ending account value lower, by this amount. In addition, the Fund, as a shareholder in the underlying Fidelity Central Funds, will indirectly bear its pro-rata share of the fees and expenses incurred by the underlying Fidelity Central Funds. These fees and expenses are not included in the Fund's annualized expense ratio used to calculate the expense estimate in the table below.
Hypothetical Example for Comparison Purposes
The second line of the accompanying table for each class of the Fund provides information about hypothetical account values and hypothetical expenses based on a Class' actual expense ratio and an assumed rate of return of 5% per year before expenses, which is not the Class' actual return. The hypothetical account values and expenses may not be used to estimate the actual ending account balance or expenses you paid for the period. You may use this information to compare the ongoing costs of investing in the Fund and other funds. To do so, compare this 5% hypothetical example with the 5% hypothetical examples that appear in the shareholder reports of the other funds. A small balance maintenance fee of $12.00 that is charged once a year may apply for certain accounts with a value of less than $2,000. This fee is not included in the table below. If it was, the estimate of expenses you paid during the period would be higher, and your ending account value lower, by this amount. In addition, the Fund, as a shareholder in the underlying Fidelity Central Funds, will indirectly bear its pro-rata share of the fees and expenses incurred by the underlying Fidelity Central Funds. These fees and expenses are not included in the Fund's annualized expense ratio used to calculate the expense estimate in the table below.
Please note that the expenses shown in the table are meant to highlight your ongoing costs only and do not reflect any transaction costs. Therefore, the second line of the table is useful in comparing ongoing costs only, and will not help you determine the relative total costs of owning different funds. In addition, if these transactional costs were included, your costs would have been higher.
Annual Report
| Annualized | Beginning | Ending | Expenses Paid |
Class A | 1.15% |
|
|
|
Actual |
| $ 1,000.00 | $ 1,079.30 | $ 6.03 |
HypotheticalA |
| $ 1,000.00 | $ 1,019.41 | $ 5.85 |
Class T | 1.43% |
|
|
|
Actual |
| $ 1,000.00 | $ 1,077.30 | $ 7.49 |
HypotheticalA |
| $ 1,000.00 | $ 1,018.00 | $ 7.27 |
Class B | 1.92% |
|
|
|
Actual |
| $ 1,000.00 | $ 1,075.00 | $ 10.04 |
HypotheticalA |
| $ 1,000.00 | $ 1,015.53 | $ 9.75 |
Class C | 1.89% |
|
|
|
Actual |
| $ 1,000.00 | $ 1,074.90 | $ 9.88 |
HypotheticalA |
| $ 1,000.00 | $ 1,015.68 | $ 9.60 |
Mid Cap Value | .79% |
|
|
|
Actual |
| $ 1,000.00 | $ 1,080.70 | $ 4.14 |
HypotheticalA |
| $ 1,000.00 | $ 1,021.22 | $ 4.02 |
Institutional Class | .84% |
|
|
|
Actual |
| $ 1,000.00 | $ 1,080.20 | $ 4.40 |
HypotheticalA |
| $ 1,000.00 | $ 1,020.97 | $ 4.28 |
A 5% return per year before expenses
B Annualized expense ratio reflects expenses net of applicable fee waivers.
* Expenses are equal to each Class' annualized expense ratio, multiplied by the average account value over the period, multiplied by 184/365 (to reflect the one-half year period).
Annual Report
Investment Changes (Unaudited)
Top Ten Stocks as of January 31, 2014 | ||
| % of fund's | % of fund's net assets |
Edison International | 1.6 | 1.5 |
Fifth Third Bancorp | 1.6 | 1.6 |
Cigna Corp. | 1.6 | 1.5 |
SLM Corp. | 1.6 | 1.6 |
Capital One Financial Corp. | 1.5 | 0.0 |
M&T Bank Corp. | 1.5 | 1.8 |
Allstate Corp. | 1.5 | 0.0 |
Invesco Ltd. | 1.4 | 0.0 |
CF Industries Holdings, Inc. | 1.4 | 0.0 |
Hartford Financial Services Group, Inc. | 1.4 | 1.5 |
| 15.1 | |
Top Five Market Sectors as of January 31, 2014 | ||
| % of fund's | % of fund's net assets |
Financials | 31.7 | 31.6 |
Information Technology | 11.5 | 11.4 |
Industrials | 10.7 | 11.1 |
Utilities | 10.7 | 12.0 |
Health Care | 9.9 | 8.2 |
Asset Allocation (% of fund's net assets) | |||||||
As of January 31, 2014 * | As of July 31, 2013 ** | ||||||
 | Stocks 98.6% |
| | Stocks 98.9% |
| ||
 | Short-Term |
| | Short-Term |
| ||

* Foreign investments | 11.4% |
| ** Foreign investments | 6.4% |
| ||
Annual Report
Investments January 31, 2014
Showing Percentage of Net Assets
Common Stocks - 98.6% | |||
Shares | Value | ||
CONSUMER DISCRETIONARY - 8.5% | |||
Hotels, Restaurants & Leisure - 1.0% | |||
Wyndham Worldwide Corp. | 223,200 | $ 15,833,808 | |
Household Durables - 0.8% | |||
Whirlpool Corp. | 95,800 | 12,770,140 | |
Multiline Retail - 2.6% | |||
Big Lots, Inc. (a) | 377,978 | 10,126,031 | |
Kohl's Corp. | 204,800 | 10,369,024 | |
Macy's, Inc. | 360,900 | 19,199,880 | |
| 39,694,935 | ||
Specialty Retail - 3.3% | |||
AutoZone, Inc. (a) | 32,400 | 16,039,944 | |
Bed Bath & Beyond, Inc. (a) | 132,900 | 8,485,665 | |
GameStop Corp. Class A | 175,700 | 6,161,799 | |
Staples, Inc. | 1,527,000 | 20,095,320 | |
| 50,782,728 | ||
Textiles, Apparel & Luxury Goods - 0.8% | |||
Coach, Inc. | 221,000 | 10,583,690 | |
Deckers Outdoor Corp. (a)(d) | 30,900 | 2,408,655 | |
| 12,992,345 | ||
TOTAL CONSUMER DISCRETIONARY | 132,073,956 | ||
CONSUMER STAPLES - 3.3% | |||
Beverages - 0.8% | |||
Molson Coors Brewing Co. Class B | 236,100 | 12,428,304 | |
Food & Staples Retailing - 0.9% | |||
Kroger Co. | 382,800 | 13,819,080 | |
Food Products - 1.6% | |||
Bunge Ltd. | 185,700 | 14,068,632 | |
The J.M. Smucker Co. | 108,300 | 10,439,037 | |
| 24,507,669 | ||
TOTAL CONSUMER STAPLES | 50,755,053 | ||
ENERGY - 6.3% | |||
Energy Equipment & Services - 1.9% | |||
Ensco PLC Class A | 303,700 | 15,297,369 | |
National Oilwell Varco, Inc. | 189,600 | 14,221,896 | |
| 29,519,265 | ||
Common Stocks - continued | |||
Shares | Value | ||
ENERGY - continued | |||
Oil, Gas & Consumable Fuels - 4.4% | |||
Canadian Natural Resources Ltd. | 438,700 | $ 14,385,027 | |
Cimarex Energy Co. | 153,300 | 15,020,334 | |
Energen Corp. | 130,500 | 9,228,960 | |
Marathon Oil Corp. | 301,800 | 9,896,022 | |
Tesoro Corp. | 290,900 | 14,987,168 | |
Valero Energy Corp. | 76,900 | 3,929,590 | |
| 67,447,101 | ||
TOTAL ENERGY | 96,966,366 | ||
FINANCIALS - 31.7% | |||
Capital Markets - 5.4% | |||
Apollo Global Management LLC Class A | 483,700 | 15,696,065 | |
Carlyle Group LP | 171,900 | 5,983,839 | |
Invesco Ltd. | 673,500 | 22,393,875 | |
KKR & Co. LP | 760,300 | 18,330,833 | |
The Blackstone Group LP | 659,100 | 21,585,525 | |
| 83,990,137 | ||
Commercial Banks - 7.1% | |||
BB&T Corp. | 430,000 | 16,086,300 | |
Fifth Third Bancorp | 1,197,857 | 25,178,954 | |
Huntington Bancshares, Inc. | 1,655,600 | 15,016,292 | |
M&T Bank Corp. (d) | 213,000 | 23,751,630 | |
SunTrust Banks, Inc. | 433,800 | 16,059,276 | |
U.S. Bancorp | 348,100 | 13,830,013 | |
| 109,922,465 | ||
Consumer Finance - 3.1% | |||
Capital One Financial Corp. | 338,400 | 23,894,424 | |
SLM Corp. | 1,061,400 | 24,157,464 | |
| 48,051,888 | ||
Diversified Financial Services - 0.5% | |||
The NASDAQ Stock Market, Inc. | 185,400 | 7,073,010 | |
Insurance - 8.8% | |||
ACE Ltd. | 182,700 | 17,139,087 | |
Allied World Assurance Co. Holdings Ltd. | 139,500 | 14,357,340 | |
Allstate Corp. | 444,300 | 22,748,160 | |
Amtrust Financial Services, Inc. (d) | 384,600 | 12,414,888 | |
Brown & Brown, Inc. | 159,500 | 5,022,655 | |
Everest Re Group Ltd. | 120,800 | 17,487,008 | |
Common Stocks - continued | |||
Shares | Value | ||
FINANCIALS - continued | |||
Insurance - continued | |||
Fidelity National Financial, Inc. Class A | 555,500 | $ 17,520,470 | |
Hartford Financial Services Group, Inc. | 661,300 | 21,988,225 | |
Symetra Financial Corp. | 443,949 | 8,501,623 | |
| 137,179,456 | ||
Real Estate Investment Trusts - 6.8% | |||
American Capital Agency Corp. | 1,044,400 | 21,880,180 | |
CBL & Associates Properties, Inc. | 1,051,400 | 17,863,286 | |
Equity Lifestyle Properties, Inc. | 482,300 | 18,959,213 | |
MFA Financial, Inc. | 1,170,200 | 8,530,758 | |
NorthStar Realty Finance Corp. (d) | 1,062,700 | 15,504,793 | |
Pennsylvania Real Estate Investment Trust (SBI) | 664,800 | 12,398,520 | |
RLJ Lodging Trust | 405,500 | 10,129,390 | |
| 105,266,140 | ||
TOTAL FINANCIALS | 491,483,096 | ||
HEALTH CARE - 9.9% | |||
Biotechnology - 1.0% | |||
United Therapeutics Corp. (a) | 143,200 | 14,695,184 | |
Health Care Equipment & Supplies - 1.0% | |||
C.R. Bard, Inc. | 23,600 | 3,058,324 | |
St. Jude Medical, Inc. | 211,300 | 12,832,249 | |
| 15,890,573 | ||
Health Care Providers & Services - 6.1% | |||
Cardinal Health, Inc. | 197,400 | 13,427,148 | |
Cigna Corp. | 288,600 | 24,909,066 | |
Community Health Systems, Inc. (a) | 211,700 | 8,766,497 | |
DaVita HealthCare Partners, Inc. (a) | 203,900 | 13,239,227 | |
HCA Holdings, Inc. (a) | 289,100 | 14,533,057 | |
Omnicare, Inc. | 234,100 | 14,621,886 | |
VCA Antech, Inc. (a) | 171,300 | 5,471,322 | |
| 94,968,203 | ||
Pharmaceuticals - 1.8% | |||
Actavis PLC (a) | 86,900 | 16,422,362 | |
Mylan, Inc. (a) | 170,000 | 7,719,700 | |
Teva Pharmaceutical Industries Ltd. sponsored ADR | 89,800 | 4,007,774 | |
| 28,149,836 | ||
TOTAL HEALTH CARE | 153,703,796 | ||
Common Stocks - continued | |||
Shares | Value | ||
INDUSTRIALS - 10.7% | |||
Aerospace & Defense - 2.1% | |||
Esterline Technologies Corp. (a) | 138,600 | $ 14,268,870 | |
Meggitt PLC | 2,068,200 | 17,526,557 | |
| 31,795,427 | ||
Airlines - 0.6% | |||
American Airlines Group, Inc. (a)(d) | 289,200 | 9,702,660 | |
Commercial Services & Supplies - 0.8% | |||
Tetra Tech, Inc. (a) | 429,542 | 12,675,784 | |
Construction & Engineering - 1.8% | |||
AECOM Technology Corp. (a) | 496,300 | 14,228,921 | |
URS Corp. | 286,203 | 14,367,391 | |
| 28,596,312 | ||
Electrical Equipment - 1.2% | |||
EnerSys | 213,500 | 14,530,810 | |
Rockwell Automation, Inc. | 39,900 | 4,582,116 | |
| 19,112,926 | ||
Machinery - 2.0% | |||
Cummins, Inc. | 128,000 | 16,253,440 | |
Parker Hannifin Corp. | 19,200 | 2,176,704 | |
Terex Corp. | 64,500 | 2,644,500 | |
Valmont Industries, Inc. | 63,500 | 9,295,130 | |
| 30,369,774 | ||
Professional Services - 1.2% | |||
Dun & Bradstreet Corp. | 168,500 | 18,535,000 | |
Trading Companies & Distributors - 1.0% | |||
WESCO International, Inc. (a) | 186,900 | 15,505,224 | |
TOTAL INDUSTRIALS | 166,293,107 | ||
INFORMATION TECHNOLOGY - 11.5% | |||
Communications Equipment - 0.7% | |||
Plantronics, Inc. | 251,400 | 10,792,602 | |
Computers & Peripherals - 2.4% | |||
EMC Corp. | 600,400 | 14,553,696 | |
SanDisk Corp. | 160,000 | 11,128,000 | |
Western Digital Corp. | 137,200 | 11,822,524 | |
| 37,504,220 | ||
Electronic Equipment & Components - 1.7% | |||
Arrow Electronics, Inc. (a) | 193,800 | 9,957,444 | |
Common Stocks - continued | |||
Shares | Value | ||
INFORMATION TECHNOLOGY - continued | |||
Electronic Equipment & Components - continued | |||
Avnet, Inc. | 222,100 | $ 9,121,647 | |
TE Connectivity Ltd. | 135,400 | 7,651,454 | |
| 26,730,545 | ||
IT Services - 2.3% | |||
Amdocs Ltd. | 376,200 | 16,274,412 | |
EVERTEC, Inc. | 190,000 | 4,584,700 | |
Total System Services, Inc. | 478,500 | 14,297,580 | |
| 35,156,692 | ||
Semiconductors & Semiconductor Equipment - 1.7% | |||
Avago Technologies Ltd. | 82,300 | 4,496,872 | |
Broadcom Corp. Class A | 265,200 | 7,892,352 | |
Maxim Integrated Products, Inc. | 103,200 | 3,122,832 | |
Skyworks Solutions, Inc. (a) | 346,600 | 10,484,650 | |
| 25,996,706 | ||
Software - 2.7% | |||
CA Technologies, Inc. | 426,600 | 13,685,328 | |
Check Point Software Technologies Ltd. (a) | 115,500 | 7,557,165 | |
Symantec Corp. | 458,000 | 9,805,780 | |
Synopsys, Inc. (a) | 280,100 | 11,164,786 | |
| 42,213,059 | ||
TOTAL INFORMATION TECHNOLOGY | 178,393,824 | ||
MATERIALS - 6.0% | |||
Chemicals - 3.1% | |||
Cabot Corp. | 184,200 | 8,965,014 | |
CF Industries Holdings, Inc. | 95,300 | 22,000,958 | |
Eastman Chemical Co. | 216,900 | 16,909,524 | |
| 47,875,496 | ||
Containers & Packaging - 1.0% | |||
Graphic Packaging Holding Co. (a) | 1,601,400 | 15,213,300 | |
Metals & Mining - 0.9% | |||
Reliance Steel & Aluminum Co. | 211,000 | 14,759,450 | |
Paper & Forest Products - 1.0% | |||
International Paper Co. | 331,900 | 15,844,906 | |
TOTAL MATERIALS | 93,693,152 | ||
Common Stocks - continued | |||
Shares | Value | ||
UTILITIES - 10.7% | |||
Electric Utilities - 3.9% | |||
Edison International | 526,300 | $ 25,346,608 | |
Great Plains Energy, Inc. | 31,600 | 779,888 | |
IDACORP, Inc. | 295,100 | 15,560,623 | |
PNM Resources, Inc. | 250,800 | 6,182,220 | |
Xcel Energy, Inc. | 424,700 | 12,278,077 | |
| 60,147,416 | ||
Gas Utilities - 0.9% | |||
Atmos Energy Corp. | 282,200 | 13,548,422 | |
Independent Power Producers & Energy Traders - 1.0% | |||
The AES Corp. | 1,134,500 | 15,951,070 | |
Multi-Utilities - 4.9% | |||
Ameren Corp. | 562,900 | 21,300,136 | |
CMS Energy Corp. | 755,700 | 21,000,903 | |
DTE Energy Co. | 319,200 | 21,775,824 | |
NiSource, Inc. | 363,800 | 12,503,806 | |
| 76,580,669 | ||
TOTAL UTILITIES | 166,227,577 | ||
TOTAL COMMON STOCKS (Cost $1,378,474,916) |
| ||
Money Market Funds - 3.9% | |||
|
|
|
|
Fidelity Cash Central Fund, 0.10% (b) | 14,457,505 | 14,457,505 | |
Fidelity Securities Lending Cash Central Fund, 0.09% (b)(c) | 45,348,950 | 45,348,950 | |
TOTAL MONEY MARKET FUNDS (Cost $59,806,455) |
| ||
TOTAL INVESTMENT PORTFOLIO - 102.5% (Cost $1,438,281,371) | 1,589,396,382 | ||
NET OTHER ASSETS (LIABILITIES) - (2.5)% | (38,710,723) | ||
NET ASSETS - 100% | $ 1,550,685,659 | ||
Legend |
(a) Non-income producing |
(b) Affiliated fund that is generally available only to investment companies and other accounts managed by Fidelity Investments. The rate quoted is the annualized seven-day yield of the fund at period end. A complete unaudited listing of the fund's holdings as of its most recent quarter end is available upon request. In addition, each Fidelity Central Fund's financial statements, which are not covered by the Fund's Report of Independent Registered Public Accounting Firm, are available on the SEC's website or upon request. |
(c) Investment made with cash collateral received from securities on loan. |
(d) Security or a portion of the security is on loan at period end. |
Affiliated Central Funds |
Information regarding fiscal year to date income earned by the Fund from investments in Fidelity Central Funds is as follows: |
Fund | Income earned |
Fidelity Cash Central Fund | $ 23,403 |
Fidelity Securities Lending Cash Central Fund | 89,777 |
Total | $ 113,180 |
Other Information |
All investments are categorized as Level 1 under the Fair Value Hierarchy. The inputs or methodology used for valuing securities may not be an indication of the risk associated with investing in those securities. For more information on valuation inputs, please refer to the Investment Valuation section in the accompanying Notes to Financial Statements. |
Distribution of investments by country or territory of incorporation, as a percentage of total net assets, is as follows (Unaudited): |
United States of America | 88.6% |
Bermuda | 3.4% |
Switzerland | 2.5% |
United Kingdom | 2.2% |
Ireland | 1.1% |
Others (Individually Less Than 1%) | 2.2% |
| 100.0% |
See accompanying notes which are an integral part of the financial statements.
Annual Report
Financial Statements
Statement of Assets and Liabilities
| January 31, 2014 | |
|
|
|
Assets | ||
Investment in securities, at value (including securities loaned of $43,982,931) - See accompanying schedule: Unaffiliated issuers (cost $1,378,474,916) | $ 1,529,589,927 |
|
Fidelity Central Funds (cost $59,806,455) | 59,806,455 |
|
Total Investments (cost $1,438,281,371) |
| $ 1,589,396,382 |
Receivable for investments sold | 13,397,169 | |
Receivable for fund shares sold | 10,264,317 | |
Dividends receivable | 170,018 | |
Distributions receivable from Fidelity Central Funds | 33,858 | |
Prepaid expenses | 3,581 | |
Other receivables | 16,056 | |
Total assets | 1,613,281,381 | |
|
|
|
Liabilities | ||
Payable for investments purchased | $ 13,944,196 | |
Payable for fund shares redeemed | 2,178,523 | |
Accrued management fee | 735,209 | |
Distribution and service plan fees payable | 47,330 | |
Other affiliated payables | 270,564 | |
Other payables and accrued expenses | 70,950 | |
Collateral on securities loaned, at value | 45,348,950 | |
Total liabilities | 62,595,722 | |
|
|
|
Net Assets | $ 1,550,685,659 | |
Net Assets consist of: |
| |
Paid in capital | $ 1,366,380,230 | |
Undistributed net investment income | 435,958 | |
Accumulated undistributed net realized gain (loss) on investments and foreign currency transactions | 32,754,460 | |
Net unrealized appreciation (depreciation) on investments | 151,115,011 | |
Net Assets | $ 1,550,685,659 | |
See accompanying notes which are an integral part of the financial statements.
Annual Report
Financial Statements - continued
Statement of Assets and Liabilities - continued
| January 31, 2014 | |
|
|
|
Calculation of Maximum Offering Price Class A: | $ 21.78 | |
|
|
|
Maximum offering price per share (100/94.25 of $21.78) | $ 23.11 | |
Class T: | $ 21.70 | |
|
|
|
Maximum offering price per share (100/96.50 of $21.70) | $ 22.49 | |
Class B: | $ 21.48 | |
|
|
|
Class C: | $ 21.31 | |
|
|
|
Mid Cap Value: | $ 21.96 | |
|
|
|
Institutional Class: | $ 21.84 | |
A Redemption price per share is equal to net asset value less any applicable contingent deferred sales charge.
See accompanying notes which are an integral part of the financial statements.
Annual Report
Statement of Operations
| Year ended January 31, 2014 | |
|
|
|
Investment Income |
|
|
Dividends |
| $ 28,788,810 |
Interest |
| 64 |
Income from Fidelity Central Funds |
| 113,180 |
Total income |
| 28,902,054 |
|
|
|
Expenses | ||
Management fee | $ 7,073,945 | |
Performance adjustment | 60,558 | |
Transfer agent fees | 2,515,888 | |
Distribution and service plan fees | 392,671 | |
Accounting and security lending fees | 411,663 | |
Custodian fees and expenses | 89,950 | |
Independent trustees' compensation | 5,975 | |
Registration fees | 181,003 | |
Audit | 58,413 | |
Legal | 3,557 | |
Miscellaneous | 7,200 | |
Total expenses before reductions | 10,800,823 | |
Expense reductions | (76,747) | 10,724,076 |
Net investment income (loss) | 18,177,978 | |
Realized and Unrealized Gain (Loss) Net realized gain (loss) on: | ||
Investment securities: |
|
|
Unaffiliated issuers | 168,913,149 | |
Foreign currency transactions | (25,247) | |
Total net realized gain (loss) |
| 168,887,902 |
Change in net unrealized appreciation (depreciation) on investment securities | 69,583,401 | |
Net gain (loss) | 238,471,303 | |
Net increase (decrease) in net assets resulting from operations | $ 256,649,281 | |
See accompanying notes which are an integral part of the financial statements.
Annual Report
Financial Statements - continued
Statement of Changes in Net Assets
| Year ended | Year ended |
Increase (Decrease) in Net Assets |
|
|
Operations |
|
|
Net investment income (loss) | $ 18,177,978 | $ 8,506,032 |
Net realized gain (loss) | 168,887,902 | 58,044,668 |
Change in net unrealized appreciation (depreciation) | 69,583,401 | 59,980,492 |
Net increase (decrease) in net assets resulting | 256,649,281 | 126,531,192 |
Distributions to shareholders from net investment income | (15,306,348) | (8,438,509) |
Distributions to shareholders from net realized gain | (113,515,093) | - |
Total distributions | (128,821,441) | (8,438,509) |
Share transactions - net increase (decrease) | 735,344,302 | (21,044,685) |
Redemption fees | 65,786 | 8,162 |
Total increase (decrease) in net assets | 863,237,928 | 97,056,160 |
|
|
|
Net Assets | ||
Beginning of period | 687,447,731 | 590,391,571 |
End of period (including undistributed net investment income of $435,958 and $0, respectively) | $ 1,550,685,659 | $ 687,447,731 |
See accompanying notes which are an integral part of the financial statements.
Annual Report
Financial Highlights - Class A
Years ended January 31, | 2014 | 2013 | 2012 | 2011 | 2010 |
Selected Per-Share Data |
|
|
|
|
|
Net asset value, beginning of period | $ 19.24 | $ 15.87 | $ 16.16 | $ 12.35 | $ 8.53 |
Income from Investment Operations |
|
|
|
|
|
Net investment income (loss) C | .24 | .20 | .07 | - G | .07 |
Net realized and unrealized gain (loss) | 4.29 | 3.38 | (.29) | 3.85 | 3.84 |
Total from investment operations | 4.53 | 3.58 | (.22) | 3.85 | 3.91 |
Distributions from net investment income | (.19) | (.21) | (.07) | (.04) | (.09) |
Distributions from net realized gain | (1.79) | - | - | - | - |
Total distributions | (1.99) H | (.21) | (.07) | (.04) | (.09) |
Redemption fees added to paid in capital C,G | - | - | - | - | - |
Net asset value, end of period | $ 21.78 | $ 19.24 | $ 15.87 | $ 16.16 | $ 12.35 |
Total Return A,B | 23.69% | 22.73% | (1.34)% | 31.14% | 45.79% |
Ratios to Average Net Assets D,F |
|
|
|
|
|
Expenses before reductions | 1.15% | 1.15% | 1.17% | 1.17% | 1.21% |
Expenses net of fee waivers, if any | 1.15% | 1.15% | 1.17% | 1.17% | 1.21% |
Expenses net of all reductions | 1.14% | 1.12% | 1.16% | 1.17% | 1.20% |
Net investment income (loss) | 1.11% | 1.15% | .44% | .02% | .62% |
Supplemental Data |
|
|
|
|
|
Net assets, end of period (000 omitted) | $ 67,826 | $ 24,436 | $ 19,578 | $ 23,608 | $ 10,640 |
Portfolio turnover rate E | 169% | 180% | 173% | 133% | 202% |
A Total returns would have been lower if certain expenses had not been reduced during the applicable periods shown.
B Total returns do not include the effect of the sales charges.
C Calculated based on average shares outstanding during the period.
D Fees and expenses of any underlying Fidelity Central Funds are not included in the Fund's expense ratio. The Fund indirectly bears its proportionate share of the expenses of any underlying Fidelity Central Funds.
E Amount does not include the portfolio activity of any underlying Fidelity Central Funds.
F Expense ratios reflect operating expenses of the class. Expenses before reductions do not reflect amounts reimbursed by the investment adviser or reductions from brokerage service arrangements or reductions from other expense offset arrangements and do not represent the amount paid by the class during periods when reimbursements or reductions occur. Expenses net of fee waivers reflect expenses after reimbursement by the investment adviser but prior to reductions from brokerage service arrangements or other expense offset arrangements. Expenses net of all reductions represent the net expenses paid by the class.
G Amount represents less than $.01 per share.
H Total distributions of $1.99 per share is comprised of distributions from net investment income of $.193 and distributions from net realized gain of $1.793 per share.
See accompanying notes which are an integral part of the financial statements.
Annual Report
Financial Highlights - Class T
Years ended January 31, | 2014 | 2013 | 2012 | 2011 | 2010 |
Selected Per-Share Data |
|
|
|
|
|
Net asset value, beginning of period | $ 19.21 | $ 15.84 | $ 16.14 | $ 12.34 | $ 8.53 |
Income from Investment Operations |
|
|
|
|
|
Net investment income (loss) C | .18 | .15 | .03 | (.03) | .04 |
Net realized and unrealized gain (loss) | 4.27 | 3.38 | (.29) | 3.83 | 3.84 |
Total from investment operations | 4.45 | 3.53 | (.26) | 3.80 | 3.88 |
Distributions from net investment income | (.17) | (.16) | (.04) | - | (.07) |
Distributions from net realized gain | (1.79) | - | - | - | - |
Total distributions | (1.96) | (.16) | (.04) | - | (.07) |
Redemption fees added to paid in capital C,G | - | - | - | - | - |
Net asset value, end of period | $ 21.70 | $ 19.21 | $ 15.84 | $ 16.14 | $ 12.34 |
Total Return A,B | 23.32% | 22.42% | (1.59)% | 30.79% | 45.44% |
Ratios to Average Net Assets D,F |
|
|
|
|
|
Expenses before reductions | 1.42% | 1.42% | 1.43% | 1.43% | 1.47% |
Expenses net of fee waivers, if any | 1.42% | 1.42% | 1.43% | 1.43% | 1.47% |
Expenses net of all reductions | 1.41% | 1.38% | 1.42% | 1.43% | 1.46% |
Net investment income (loss) | .84% | .89% | .18% | (.24)% | .36% |
Supplemental Data |
|
|
|
|
|
Net assets, end of period (000 omitted) | $ 24,136 | $ 8,358 | $ 6,823 | $ 6,993 | $ 4,010 |
Portfolio turnover rate E | 169% | 180% | 173% | 133% | 202% |
A Total returns would have been lower if certain expenses had not been reduced during the applicable periods shown.
B Total returns do not include the effect of the sales charges.
C Calculated based on average shares outstanding during the period.
D Fees and expenses of any underlying Fidelity Central Funds are not included in the Fund's expense ratio. The Fund indirectly bears its proportionate share of the expenses of any underlying Fidelity Central Funds.
E Amount does not include the portfolio activity of any underlying Fidelity Central Funds.
F Expense ratios reflect operating expenses of the class. Expenses before reductions do not reflect amounts reimbursed by the investment adviser or reductions from brokerage service arrangements or reductions from other expense offset arrangements and do not represent the amount paid by the class during periods when reimbursements or reductions occur. Expenses net of fee waivers reflect expenses after reimbursement by the investment adviser but prior to reductions from brokerage service arrangements or other expense offset arrangements. Expenses net of all reductions represent the net expenses paid by the class.
G Amount represents less than $.01 per share.
See accompanying notes which are an integral part of the financial statements.
Annual Report
Financial Highlights - Class B
Years ended January 31, | 2014 | 2013 | 2012 | 2011 | 2010 |
Selected Per-Share Data |
|
|
|
|
|
Net asset value, beginning of period | $ 19.03 | $ 15.71 | $ 16.04 | $ 12.32 | $ 8.53 |
Income from Investment Operations |
|
|
|
|
|
Net investment income (loss) C | .07 | .07 | (.05) | (.10) | (.01) |
Net realized and unrealized gain (loss) | 4.22 | 3.34 | (.28) | 3.82 | 3.82 |
Total from investment operations | 4.29 | 3.41 | (.33) | 3.72 | 3.81 |
Distributions from net investment income | (.05) | (.09) | - | - | (.02) |
Distributions from net realized gain | (1.79) | - | - | - | - |
Total distributions | (1.84) | (.09) | - | - | (.02) |
Redemption fees added to paid in capital C,G | - | - | - | - | - |
Net asset value, end of period | $ 21.48 | $ 19.03 | $ 15.71 | $ 16.04 | $ 12.32 |
Total Return A,B | 22.70% | 21.79% | (2.06)% | 30.19% | 44.61% |
Ratios to Average Net Assets D,F |
|
|
|
|
|
Expenses before reductions | 1.91% | 1.91% | 1.92% | 1.93% | 1.97% |
Expenses net of fee waivers, if any | 1.91% | 1.91% | 1.92% | 1.93% | 1.97% |
Expenses net of all reductions | 1.91% | 1.87% | 1.91% | 1.92% | 1.96% |
Net investment income (loss) | .34% | .40% | (.31)% | (.74)% | (.14)% |
Supplemental Data |
|
|
|
|
|
Net assets, end of period (000 omitted) | $ 2,302 | $ 1,533 | $ 1,376 | $ 1,793 | $ 1,154 |
Portfolio turnover rate E | 169% | 180% | 173% | 133% | 202% |
A Total returns would have been lower if certain expenses had not been reduced during the applicable periods shown.
B Total returns do not include the effect of the contingent deferred sales charge.
C Calculated based on average shares outstanding during the period.
D Fees and expenses of any underlying Fidelity Central Funds are not included in the Fund's expense ratio. The Fund indirectly bears its proportionate share of the expenses of any underlying Fidelity Central Funds.
E Amount does not include the portfolio activity of any underlying Fidelity Central Funds.
F Expense ratios reflect operating expenses of the class. Expenses before reductions do not reflect amounts reimbursed by the investment adviser or reductions from brokerage service arrangements or reductions from other expense offset arrangements and do not represent the amount paid by the class during periods when reimbursements or reductions occur. Expenses net of fee waivers reflect expenses after reimbursement by the investment adviser but prior to reductions from brokerage service arrangements or other expense offset arrangements. Expenses net of all reductions represent the net expenses paid by the class.
G Amount represents less than $.01 per share.
See accompanying notes which are an integral part of the financial statements.
Annual Report
Financial Highlights - Class C
Years ended January 31, | 2014 | 2013 | 2012 | 2011 | 2010 |
Selected Per-Share Data |
|
|
|
|
|
Net asset value, beginning of period | $ 18.93 | $ 15.65 | $ 15.98 | $ 12.27 | $ 8.50 |
Income from Investment Operations |
|
|
|
|
|
Net investment income (loss) C | .08 | .07 | (.05) | (.10) | (.01) |
Net realized and unrealized gain (loss) | 4.20 | 3.32 | (.28) | 3.81 | 3.80 |
Total from investment operations | 4.28 | 3.39 | (.33) | 3.71 | 3.79 |
Distributions from net investment income | (.11) | (.11) | - | - | (.02) |
Distributions from net realized gain | (1.79) | - | - | - | - |
Total distributions | (1.90) | (.11) | - | - | (.02) |
Redemption fees added to paid in capital C,G | - | - | - | - | - |
Net asset value, end of period | $ 21.31 | $ 18.93 | $ 15.65 | $ 15.98 | $ 12.27 |
Total Return A,B | 22.77% | 21.73% | (2.07)% | 30.24% | 44.56% |
Ratios to Average Net Assets D,F |
|
|
|
|
|
Expenses before reductions | 1.89% | 1.91% | 1.92% | 1.93% | 1.96% |
Expenses net of fee waivers, if any | 1.89% | 1.91% | 1.92% | 1.93% | 1.96% |
Expenses net of all reductions | 1.89% | 1.87% | 1.91% | 1.92% | 1.95% |
Net investment income (loss) | .36% | .40% | (.31)% | (.73)% | (.13)% |
Supplemental Data |
|
|
|
|
|
Net assets, end of period (000 omitted) | $ 25,177 | $ 6,820 | $ 5,000 | $ 5,309 | $ 2,293 |
Portfolio turnover rate E | 169% | 180% | 173% | 133% | 202% |
A Total returns would have been lower if certain expenses had not been reduced during the applicable periods shown.
B Total returns do not include the effect of the contingent deferred sales charge.
C Calculated based on average shares outstanding during the period.
D Fees and expenses of any underlying Fidelity Central Funds are not included in the Fund's expense ratio. The Fund indirectly bears its proportionate share of the expenses of any underlying Fidelity Central Funds.
E Amount does not include the portfolio activity of any underlying Fidelity Central Funds.
F Expense ratios reflect operating expenses of the class. Expenses before reductions do not reflect amounts reimbursed by the investment adviser or reductions from brokerage service arrangements or reductions from other expense offset arrangements and do not represent the amount paid by the class during periods when reimbursements or reductions occur. Expenses net of fee waivers reflect expenses after reimbursement by the investment adviser but prior to reductions from brokerage service arrangements or other expense offset arrangements. Expenses net of all reductions represent the net expenses paid by the class.
G Amount represents less than $.01 per share.
See accompanying notes which are an integral part of the financial statements.
Annual Report
Financial Highlights - Mid Cap Value
Years ended January 31, | 2014 | 2013 | 2012 | 2011 | 2010 |
Selected Per-Share Data |
|
|
|
|
|
Net asset value, beginning of period | $ 19.37 | $ 15.97 | $ 16.26 | $ 12.41 | $ 8.57 |
Income from Investment Operations |
|
|
|
|
|
Net investment income (loss) B | .32 | .25 | .12 | .04 | .09 |
Net realized and unrealized gain (loss) | 4.31 | 3.41 | (.30) | 3.87 | 3.86 |
Total from investment operations | 4.63 | 3.66 | (.18) | 3.91 | 3.95 |
Distributions from net investment income | (.25) | (.26) | (.11) | (.06) | (.11) |
Distributions from net realized gain | (1.79) | - | - | - | - |
Total distributions | (2.04) | (.26) | (.11) | (.06) | (.11) |
Redemption fees added to paid in capital B,F | - | - | - | - | - |
Net asset value, end of period | $ 21.96 | $ 19.37 | $ 15.97 | $ 16.26 | $ 12.41 |
Total Return A | 24.08% | 23.07% | (1.04)% | 31.51% | 46.06% |
Ratios to Average Net Assets C,E |
|
|
|
|
|
Expenses before reductions | .80% | .85% | .88% | .91% | .95% |
Expenses net of fee waivers, if any | .80% | .85% | .88% | .91% | .95% |
Expenses net of all reductions | .80% | .81% | .87% | .90% | .94% |
Net investment income (loss) | 1.45% | 1.46% | .73% | .28% | .88% |
Supplemental Data |
|
|
|
|
|
Net assets, end of period (000 omitted) | $ 1,404,968 | $ 638,425 | $ 553,947 | $ 666,277 | $ 469,476 |
Portfolio turnover rate D | 169% | 180% | 173% | 133% | 202% |
A Total returns would have been lower if certain expenses had not been reduced during the applicable periods shown.
B Calculated based on average shares outstanding during the period.
C Fees and expenses of any underlying Fidelity Central Funds are not included in the Fund's expense ratio. The Fund indirectly bears its proportionate share of the expenses of any underlying Fidelity Central Funds.
D Amount does not include the portfolio activity of any underlying Fidelity Central Funds.
E Expense ratios reflect operating expenses of the class. Expenses before reductions do not reflect amounts reimbursed by the investment adviser or reductions from brokerage service arrangements or reductions from other expense offset arrangements and do not represent the amount paid by the class during periods when reimbursements or reductions occur. Expenses net of fee waivers reflect expenses after reimbursement by the investment adviser but prior to reductions from brokerage service arrangements or other expense offset arrangements. Expenses net of all reductions represent the net expenses paid by the class.
F Amount represents less than $.01 per share.
See accompanying notes which are an integral part of the financial statements.
Annual Report
Financial Highlights - Institutional Class
Years ended January 31, | 2014 | 2013 | 2012 | 2011 | 2010 |
Selected Per-Share Data |
|
|
|
|
|
Net asset value, beginning of period | $ 19.29 | $ 15.91 | $ 16.20 | $ 12.36 | $ 8.54 |
Income from Investment Operations |
|
|
|
|
|
Net investment income (loss) B | .31 | .24 | .11 | .04 | .10 |
Net realized and unrealized gain (loss) | 4.28 | 3.40 | (.29) | 3.85 | 3.84 |
Total from investment operations | 4.59 | 3.64 | (.18) | 3.89 | 3.94 |
Distributions from net investment income | (.25) | (.26) | (.11) | (.05) | (.12) |
Distributions from net realized gain | (1.79) | - | - | - | - |
Total distributions | (2.04) | (.26) | (.11) | (.05) | (.12) |
Redemption fees added to paid in capital B,F | - | - | - | - | - |
Net asset value, end of period | $ 21.84 | $ 19.29 | $ 15.91 | $ 16.20 | $ 12.36 |
Total Return A | 23.98% | 23.05% | (1.07)% | 31.51% | 46.12% |
Ratios to Average Net Assets C,E |
|
|
|
|
|
Expenses before reductions | .85% | .89% | .91% | .92% | .96% |
Expenses net of fee waivers, if any | .85% | .89% | .91% | .92% | .96% |
Expenses net of all reductions | .85% | .85% | .90% | .92% | .95% |
Net investment income (loss) | 1.40% | 1.42% | .71% | .27% | .87% |
Supplemental Data |
|
|
|
|
|
Net assets, end of period (000 omitted) | $ 26,277 | $ 7,875 | $ 3,667 | $ 3,507 | $ 3,162 |
Portfolio turnover rate D | 169% | 180% | 173% | 133% | 202% |
A Total returns would have been lower if certain expenses had not been reduced during the applicable periods shown.
B Calculated based on average shares outstanding during the period.
C Fees and expenses of any underlying Fidelity Central Funds are not included in the Fund's expense ratio. The Fund indirectly bears its proportionate share of the expenses of any underlying Fidelity Central Funds.
D Amount does not include the portfolio activity of any underlying Fidelity Central Funds.
E Expense ratios reflect operating expenses of the class. Expenses before reductions do not reflect amounts reimbursed by the investment adviser or reductions from brokerage service arrangements or reductions from other expense offset arrangements and do not represent the amount paid by the class during periods when reimbursements or reductions occur. Expenses net of fee waivers reflect expenses after reimbursement by the investment adviser but prior to reductions from brokerage service arrangements or other expense offset arrangements. Expenses net of all reductions represent the net expenses paid by the class.
F Amount represents less than $.01 per share.
See accompanying notes which are an integral part of the financial statements.
Annual Report
Notes to Financial Statements
For the period ended January 31, 2014
1. Organization.
Fidelity Mid Cap Value Fund (the Fund) is a fund of Fidelity Devonshire Trust (the Trust) and is authorized to issue an unlimited number of shares. The Trust is registered under the Investment Company Act of 1940, as amended (the 1940 Act), as an open-end management investment company organized as a Massachusetts business trust. The Fund offers Class A, Class T, Class C, Mid Cap Value and Institutional Class shares, each of which, along with Class B shares, has equal rights as to assets and voting privileges. Class B shares are closed to new accounts and additional purchases, except for exchanges and reinvestments. Each class has exclusive voting rights with respect to matters that affect that class. Class B shares will automatically convert to Class A shares after a holding period of seven years from the initial date of purchase.
2. Investments in Fidelity Central Funds.
The Fund invests in Fidelity Central Funds, which are open-end investment companies generally available only to other investment companies and accounts managed by the investment adviser and its affiliates. The Fund's Schedule of Investments lists each of the Fidelity Central Funds held as of period end, if any, as an investment of the Fund, but does not include the underlying holdings of each Fidelity Central Fund. As an Investing Fund, the Fund indirectly bears its proportionate share of the expenses of the underlying Fidelity Central Funds.
The Money Market Central Funds seek preservation of capital and current income and are managed by Fidelity Investments Money Management, Inc. (FIMM), an affiliate of the investment adviser. Annualized expenses of the Money Market Central Funds as of their most recent shareholder report date are less than .01%.
A complete unaudited list of holdings for each Fidelity Central Fund is available upon request or at the Securities and Exchange Commission (the SEC) website at www.sec.gov. In addition, the financial statements of the Fidelity Central Funds, which are not covered by the Fund's Report of Independent Registered Public Accounting Firm, are available on the SEC website or upon request.
3. Significant Accounting Policies.
The financial statements have been prepared in conformity with accounting principles generally accepted in the United States of America (GAAP), which require management to make certain estimates and assumptions at the date of the financial statements. Actual results could differ from those estimates. Subsequent events, if any, through the date that the financial statements were issued have been evaluated in the preparation of the financial statements. The following summarizes the significant accounting policies of the Fund:
Annual Report
3. Significant Accounting Policies - continued
Investment Valuation. Investments are valued as of 4:00 p.m. Eastern time on the last calendar day of the period. In accordance with valuation policies and procedures approved by the Board of Trustees (the Board), the Fund attempts to obtain prices from one or more third party pricing vendors or brokers to value its investments. When current market prices, quotations or currency exchange rates are not readily available or reliable, investments will be fair valued in good faith by the Fidelity Management & Research Company (FMR) Fair Value Committee (the Committee), in accordance with procedures adopted by the Board. Factors used in determining fair value vary by investment type and may include market or investment specific events. The frequency with which these procedures are used cannot be predicted and they may be utilized to a significant extent. The Committee oversees the Fund's valuation policies and procedures and is responsible for approving and reporting to the Board all fair value determinations.
The Fund categorizes the inputs to valuation techniques used to value its investments into a disclosure hierarchy consisting of three levels as shown below:
Level 1 - quoted prices in active markets for identical investments
Level 2 - other significant observable inputs (including quoted prices for similar investments, interest rates, prepayment speeds, etc.)
Level 3 - unobservable inputs (including the Fund's own assumptions based on the best information available)
Valuation techniques used to value the Fund's investments by major category are as follows:
Equity securities, including restricted securities, for which market quotations are readily available, are valued at the last reported sale price or official closing price as reported by a third party pricing vendor on the primary market or exchange on which they are traded and are categorized as Level 1 in the hierarchy. In the event there were no sales during the day or closing prices are not available, securities are valued at the last quoted bid price or may be valued using the last available price and are generally categorized as Level 2 in the hierarchy. For foreign equity securities, when market or security specific events arise, comparisons to the valuation of American Depositary Receipts (ADRs), futures contracts, Exchange-Traded Funds (ETFs) and certain indexes as well as quoted prices for similar securities may be used and would be categorized as Level 2 in the hierarchy. Utilizing these techniques may result in transfers between Level 1 and Level 2. For equity securities, including restricted securities, where observable inputs are limited, assumptions about market activity and risk are used and these securities may be categorized as Level 3 in the hierarchy.
Annual Report
Notes to Financial Statements - continued
3. Significant Accounting Policies - continued
Investment Valuation - continued
Investments in open-end mutual funds, including the Fidelity Central Funds, are valued at their closing net asset value (NAV) each business day and are categorized as Level 1 in the hierarchy.
Changes in valuation techniques may result in transfers in or out of an assigned level within the disclosure hierarchy.
Foreign Currency. The Fund may use foreign currency contracts to facilitate transactions in foreign-denominated securities. Gains and losses from these transactions may arise from changes in the value of the foreign currency or if the counterparties do not perform under the contracts' terms.
Foreign-denominated assets, including investment securities, and liabilities are translated into U.S. dollars at the exchange rates at period end. Purchases and sales of investment securities, income and dividends received and expenses denominated in foreign currencies are translated into U.S. dollars at the exchange rate in effect on the transaction date.
The effects of exchange rate fluctuations on investments are included with the net realized and unrealized gain (loss) on investment securities. Other foreign currency transactions resulting in realized and unrealized gain (loss) are disclosed separately.
Investment Transactions and Income. For financial reporting purposes, the Fund's investment holdings and NAV include trades executed through the end of the last business day of the period. The NAV per share for processing shareholder transactions is calculated as of the close of business of the New York Stock Exchange (NYSE), normally 4:00 p.m. Eastern time and includes trades executed through the end of the prior business day. Gains and losses on securities sold are determined on the basis of identified cost and may include proceeds received from litigation. Dividend income is recorded on the ex-dividend date, except for certain dividends from foreign securities where the ex-dividend date may have passed, which are recorded as soon as the Fund is informed of the ex-dividend date. Non-cash dividends included in dividend income, if any, are recorded at the fair market value of the securities received. Distributions received on securities that represent a return of capital or capital gain are recorded as a reduction of cost of investments and/or as a realized gain. Subsequent to ex-dividend date the Fund determines the components of these distributions, based upon receipt of tax filings or other correspondence relating to the underlying investment. Interest income and distributions from the Fidelity Central Funds are accrued as earned. Interest income includes coupon interest and amortization of premium and accretion of discount on debt securities. Investment income is recorded net of foreign taxes withheld where recovery of such taxes is uncertain.
Annual Report
3. Significant Accounting Policies - continued
Class Allocations and Expenses. Investment income, realized and unrealized capital gains and losses, common expenses of the Fund, and certain fund-level expense reductions, if any, are allocated daily on a pro-rata basis to each class based on the relative net assets of each class to the total net assets of the Fund. Each class differs with respect to transfer agent and distribution and service plan fees incurred. Certain expense reductions may also differ by class. For the reporting period, the allocated portion of income and expenses to each class as a percent of its average net assets may vary due to the timing of recording these transactions in relation to fluctuating net assets of the classes. Expenses directly attributable to a fund are charged to that fund. Expenses attributable to more than one fund are allocated among the respective funds on the basis of relative net assets or other appropriate methods. Expense estimates are accrued in the period to which they relate and adjustments are made when actual amounts are known.
Income Tax Information and Distributions to Shareholders. Each year, the Fund intends to qualify as a regulated investment company under Subchapter M of the Internal Revenue Code, including distributing substantially all of its taxable income and realized gains. As a result, no provision for U.S. Federal income taxes is required. As of January 31, 2014, the Fund did not have any unrecognized tax benefits in the financial statements; nor is the Fund aware of any tax positions for which it is reasonably possible that the total amounts of unrecognized tax benefits will significantly change in the next twelve months. The Fund files a U.S. federal tax return, in addition to state and local tax returns as required. The Fund's federal income tax returns are subject to examination by the Internal Revenue Service (IRS) for a period of three fiscal years after they are filed. State and local tax returns may be subject to examination for an additional fiscal year depending on the jurisdiction. Foreign taxes are provided for based on the Fund's understanding of the tax rules and rates that exist in the foreign markets in which it invests.
Distributions are declared and recorded on the ex-dividend date. Income dividends and capital gain distributions are declared separately for each class. Income and capital gain distributions are determined in accordance with income tax regulations, which may differ from GAAP. In addition, the Fund claimed a portion of the payment made to redeeming shareholders as a distribution for income tax purposes.
Capital accounts within the financial statements are adjusted for permanent book-tax differences. These adjustments have no impact on net assets or the results of operations. Capital accounts are not adjusted for temporary book-tax differences which will reverse in a subsequent period.
Book-tax differences are primarily due to partnerships, foreign currency transactions, capital loss carryforwards and losses deferred due to wash sales and excise tax regulations.
Annual Report
Notes to Financial Statements - continued
3. Significant Accounting Policies - continued
Income Tax Information and Distributions to Shareholders - continued
The federal tax cost of investment securities and unrealized appreciation (depreciation) as of period end were as follows:
Gross unrealized appreciation | $ 184,053,049 |
Gross unrealized depreciation | (33,814,413) |
Net unrealized appreciation (depreciation) on securities and other investments | $ 150,238,636 |
|
|
Tax Cost | $ 1,439,157,746 |
The tax-based components of distributable earnings as of period end were as follows:
Undistributed ordinary income | $ 29,168,718 |
Undistributed long-term capital gain | $ 4,898,076 |
Net unrealized appreciation (depreciation) | $ 150,238,636 |
The tax character of distributions paid was as follows:
| January 31, 2014 | January 31, 2013 |
Ordinary Income | $ 97,039,748 | $ 8,438,509 |
Long-term Capital Gains | 31,781,693 | - |
Total | $ 128,821,441 | $ 8,438,509 |
Short-Term Trading (Redemption) Fees. Shares held by investors in the Fund less than 30 days may have been subject to a redemption fee equal to .75% of the NAV of shares redeemed. All redemption fees, which reduce the proceeds of the shareholder redemption, are retained by the Fund and accounted for as an addition to paid in capital.
4. Purchases and Sales of Investments.
Purchases and sales of securities, other than short-term securities, aggregated $2,712,269,364 and $2,096,788,012, respectively.
5. Fees and Other Transactions with Affiliates.
Management Fee. Fidelity Management & Research Company (the investment adviser) and its affiliates provide the Fund with investment management related services for which the Fund pays a monthly management fee. The management fee is the sum of an individual fund fee rate that is based on an annual rate of .30% of the Fund's average net assets and an annualized group fee rate that averaged .25% during the period. The group fee rate is based upon the average net assets of all the mutual funds
Annual Report
5. Fees and Other Transactions with Affiliates - continued
Management Fee - continued
advised by the investment adviser, including any mutual funds previously advised by the investment adviser that are currently advised by Fidelity SelectCo, LLC, an affiliate of the investment adviser. The group fee rate decreases as assets under management increase and increases as assets under management decrease. In addition, the management fee is subject to a performance adjustment (up to a maximum of ± .20% of the Fund's average net assets over a 36 month performance period). The upward or downward adjustment to the management fee is based on the relative investment performance of Mid Cap Value as compared to its benchmark index, the Russell Midcap Value Index, over the same 36 month performance period. For the reporting period, the total annual management fee rate, including the performance adjustment, was .56% of the Fund's average net assets. The performance adjustment included in the management fee rate may be higher or lower than the maximum performance adjustment rate due to the difference between the average net assets for the reporting and performance periods.
Distribution and Service Plan Fees. In accordance with Rule 12b-1 of the 1940 Act, the Fund has adopted separate Distribution and Service Plans for each class of shares. Certain classes pay Fidelity Distributors Corporation (FDC), an affiliate of the investment adviser, separate Distribution and Service Fees, each of which is based on an annual percentage of each class' average net assets. In addition, FDC may pay financial intermediaries for selling shares of the Fund and providing shareholder support services. For the period, the Distribution and Service Fee rates, total fees and amounts retained by FDC were as follows:
| Distribution | Service | Total Fees | Retained |
Class A | -% | .25% | $ 128,923 | $ 11,198 |
Class T | .25% | .25% | 81,928 | 6,010 |
Class B | .75% | .25% | 19,848 | 15,164 |
Class C | .75% | .25% | 161,972 | 55,405 |
|
|
| $ 392,671 | $ 87,777 |
Sales Load. FDC may receive a front-end sales charge of up to 5.75% for selling Class A shares and 3.50% for selling Class T shares, some of which is paid to financial intermediaries for selling shares of the Fund. Depending on the holding period, FDC may receive contingent deferred sales charges levied on Class A, Class T, Class B, and Class C redemptions. The deferred sales charges range from 5.00% to 1.00% for Class B shares, 1.00% for Class C shares, 1.00% for certain purchases of Class A shares and .25% for certain purchases of Class T shares.
Annual Report
Notes to Financial Statements - continued
5. Fees and Other Transactions with Affiliates - continued
Sales Load - continued
For the period, sales charge amounts retained by FDC were as follows:
| Retained |
Class A | $ 77,911 |
Class T | 15,473 |
Class B* | 2,172 |
Class C* | 2,495 |
| $ 98,051 |
* When Class B and Class C shares are initially sold, FDC pays commissions from its own resources to financial intermediaries through which the sales are made.
Transfer Agent Fees. Fidelity Investments Institutional Operations Company, Inc., (FIIOC), an affiliate of the investment adviser, is the transfer, dividend disbursing and shareholder servicing agent for each class of the Fund. FIIOC receives account fees and asset-based fees that vary according to the account size and type of account of the shareholders of the respective classes of the Fund. FIIOC pays for typesetting, printing and mailing of shareholder reports, except proxy statements. For the period, transfer agent fees for each class were as follows:
| Amount | % of |
Class A | $ 148,427 | .29 |
Class T | 50,447 | .31 |
Class B | 6,015 | .30 |
Class C | 46,001 | .28 |
Mid Cap Value | 2,226,404 | .19 |
Institutional Class | 38,594 | .24 |
| $ 2,515,888 |
|
Accounting and Security Lending Fees. Fidelity Service Company, Inc. (FSC), an affiliate of the investment adviser, maintains the Fund's accounting records. The accounting fee is based on the level of average net assets for each month. Under a separate contract, FSC administers the security lending program. The security lending fee is based on the number and duration of lending transactions.
Brokerage Commissions. The Fund placed a portion of its portfolio transactions with brokerage firms which are affiliates of the investment adviser. Brokerage commissions are included in net realized gain (loss) and change in net unrealized appreciation (depreciation) in the Statement of Operations. The commissions paid to these affiliated firms were $84,397 for the period.
Annual Report
6. Committed Line of Credit.
The Fund participates with other funds managed by the investment adviser or an affiliate in a $4.25 billion credit facility (the "line of credit") to be utilized for temporary or emergency purposes to fund shareholder redemptions or for other short-term liquidity purposes. The Fund has agreed to pay commitment fees on its pro-rata portion of the line of credit, which amounted to $1,644 and is reflected in Miscellaneous expenses on the Statement of Operations. During the period, there were no borrowings on this line of credit.
7. Security Lending.
The Fund lends portfolio securities through a lending agent from time to time in order to earn additional income. For equity securities, a lending agent is used and may loan securities to certain qualified borrowers, including Fidelity Capital Markets (FCM), a broker-dealer affiliated with the Fund. On the settlement date of the loan, the Fund receives collateral (in the form of U.S. Treasury obligations, letters of credit and/or cash) against the loaned securities and maintains collateral in an amount not less than 100% of the market value of the loaned securities during the period of the loan. The market value of the loaned securities is determined at the close of business of the Fund and any additional required collateral is delivered to the Fund on the next business day. If the borrower defaults on its obligation to return the securities loaned because of insolvency or other reasons, the Fund may apply collateral received from the borrower against the obligation. The Fund may experience delays and costs in recovering the securities loaned. Any cash collateral received is invested in the Fidelity Securities Lending Cash Central Fund. The value of loaned securities and cash collateral at period end are disclosed on the Fund's Statement of Assets and Liabilities. At period end, there were no security loans outstanding with FCM. Security lending income represents the income earned on investing cash collateral, less rebates paid to borrowers and any lending agent fees associated with the loan, plus any premium payments received for lending certain types of securities. Security lending income is presented in the Statement of Operations as a component of income from Fidelity Central Funds. Total security lending income during the period amounted to $89,777, including $12,095 from securities loaned to FCM.
8. Expense Reductions.
Commissions paid to certain brokers with whom the investment adviser, or its affiliates, places trades on behalf of the Fund include an amount in addition to trade execution, which may be rebated back to the Fund to offset certain expenses. This amount totaled $61,188 for the period. Through arrangements with the Fund's custodian, credits realized as a result of uninvested cash balances were used to reduce the Fund's expenses. During the period, these credits reduced the Fund's custody expenses by $42.
In addition, the investment adviser reimbursed a portion of the Fund's operating expenses during the period in the amount of $15,517.
Annual Report
Notes to Financial Statements - continued
9. Distributions to Shareholders.
Distributions to shareholders of each class were as follows:
Years ended January 31, | 2014 | 2013 |
From net investment income |
|
|
Class A | $ 530,640 | $ 253,117 |
Class T | 161,696 | 66,091 |
Class B | 4,861 | 7,351 |
Class C | 110,531 | 38,428 |
Mid Cap Value | 14,250,519 | 7,992,338 |
Institutional Class | 248,101 | 81,184 |
Total | $ 15,306,348 | $ 8,438,509 |
From net realized gain |
|
|
Class A | $ 4,929,724 | $ - |
Class T | 1,757,088 | - |
Class B | 177,882 | - |
Class C | 1,834,950 | - |
Mid Cap Value | 103,028,925 | - |
Institutional Class | 1,786,524 | - |
Total | $ 113,515,093 | $ - |
10. Share Transactions.
Transactions for each class of shares were as follows:
| Shares | Dollars | ||
Years ended January 31, | 2014 | 2013 | 2014 | 2013 |
Class A |
|
|
|
|
Shares sold | 2,457,916 | 457,731 | $ 52,076,305 | $ 7,879,366 |
Reinvestment of distributions | 241,636 | 13,590 | 5,178,254 | 235,643 |
Shares redeemed | (854,915) | (434,657) | (18,574,514) | (7,246,773) |
Net increase (decrease) | 1,844,637 | 36,664 | $ 38,680,045 | $ 868,236 |
Class T |
|
|
|
|
Shares sold | 800,279 | 155,888 | $ 17,075,459 | $ 2,678,394 |
Reinvestment of distributions | 89,099 | 3,790 | 1,903,163 | 65,644 |
Shares redeemed | (212,274) | (155,220) | (4,598,389) | (2,624,883) |
Net increase (decrease) | 677,104 | 4,458 | $ 14,380,233 | $ 119,155 |
Class B |
|
|
|
|
Shares sold | 43,830 | 10,295 | $ 911,529 | $ 177,345 |
Reinvestment of distributions | 8,260 | 397 | 174,775 | 6,824 |
Shares redeemed | (25,492) | (17,720) | (538,771) | (295,503) |
Net increase (decrease) | 26,598 | (7,028) | $ 547,533 | $ (111,334) |
Annual Report
10. Share Transactions - continued
| Shares | Dollars | ||
Years ended January 31, | 2014 | 2013 | 2014 | 2013 |
Class C |
|
|
|
|
Shares sold | 893,750 | 137,133 | $ 18,935,706 | $ 2,295,740 |
Reinvestment of distributions | 88,255 | 2,090 | 1,852,478 | 35,705 |
Shares redeemed | (160,748) | (98,602) | (3,440,149) | (1,645,075) |
Net increase (decrease) | 821,257 | 40,621 | $ 17,348,035 | $ 686,370 |
Mid Cap Value |
|
|
|
|
Shares sold | 42,202,723 | 6,300,912 | $ 892,720,042 | $ 110,558,662 |
Reinvestment of distributions | 5,185,864 | 443,673 | 112,014,623 | 7,742,097 |
Shares redeemed | (16,376,666) | (8,477,007) | (357,731,128) | (144,053,750) |
Net increase (decrease) | 31,011,921 | (1,732,422) | $ 647,003,537 | $ (25,752,991) |
Institutional Class |
|
|
|
|
Shares sold | 942,589 | 281,696 | $ 20,627,562 | $ 4,930,560 |
Reinvestment of distributions | 87,006 | 4,459 | 1,869,755 | 77,497 |
Shares redeemed | (234,974) | (108,318) | (5,112,398) | (1,862,178) |
Net increase (decrease) | 794,621 | 177,837 | $ 17,384,919 | $ 3,145,879 |
11. Other.
The Fund's organizational documents provide former and current trustees and officers with a limited indemnification against liabilities arising in connection with the performance of their duties to the Fund. In the normal course of business, the Fund may also enter into contracts that provide general indemnifications. The Fund's maximum exposure under these arrangements is unknown as this would be dependent on future claims that may be made against the Fund. The risk of material loss from such claims is considered remote.
Annual Report
Report of Independent Registered Public Accounting Firm
To the Trustees of Fidelity Devonshire Trust and the Shareholders of Fidelity Mid Cap Value Fund:
In our opinion, the accompanying statement of assets and liabilities, including the schedule of investments, and the related statements of operations and of changes in net assets and the financial highlights present fairly, in all material respects, the financial position of Fidelity Mid Cap Value Fund (a fund of Fidelity Devonshire Trust) at January 31, 2014, the results of its operations for the year then ended, the changes in its net assets for each of the two years in the period then ended and the financial highlights for each of the five years in the period then ended, in conformity with accounting principles generally accepted in the United States of America. These financial statements and financial highlights (hereafter referred to as "financial statements") are the responsibility of the Fidelity Mid Cap Value Fund's management. Our responsibility is to express an opinion on these financial statements based on our audits. We conducted our audits of these financial statements in accordance with the standards of the Public Company Accounting Oversight Board (United States). Those standards require that we plan and perform the audit to obtain reasonable assurance about whether the financial statements are free of material misstatement. An audit includes examining, on a test basis, evidence supporting the amounts and disclosures in the financial statements, assessing the accounting principles used and significant estimates made by management, and evaluating the overall financial statement presentation. We believe that our audits, which included confirmation of securities at January 31, 2014 by correspondence with the custodian and brokers, provide a reasonable basis for our opinion.
PricewaterhouseCoopers LLP
Boston, Massachusetts
March 14, 2014
Annual Report
Trustees and Officers
The Trustees, Member of the Advisory Board, and officers of the trust and fund, as applicable, are listed below. The Board of Trustees governs the fund and is responsible for protecting the interests of shareholders. The Trustees are experienced executives who meet periodically throughout the year to oversee the fund's activities, review contractual arrangements with companies that provide services to the fund, oversee management of the risks associated with such activities and contractual arrangements, and review the fund's performance. Except for James C. Curvey, Ned C. Lautenbach, and William S. Stavropoulos, each of the Trustees oversees 173 funds. Mr. Curvey oversees 396 funds. Mr. Lautenbach and Mr. Stavropoulos each oversees 247 funds.
The Trustees hold office without limit in time except that (a) any Trustee may resign; (b) any Trustee may be removed by written instrument, signed by at least two-thirds of the number of Trustees prior to such removal; (c) any Trustee who requests to be retired or who has become incapacitated by illness or injury may be retired by written instrument signed by a majority of the other Trustees; and (d) any Trustee may be removed at any special meeting of shareholders by a two-thirds vote of the outstanding voting securities of the trust. Each Trustee who is not an interested person (as defined in the 1940 Act) of the trust and the fund (Independent Trustee), shall retire not later than the last day of the calendar year in which his or her 75th birthday occurs. The Independent Trustees may waive this mandatory retirement age policy with respect to individual Trustees. The officers and Advisory Board Member hold office without limit in time, except that any officer and Advisory Board Member may resign or may be removed by a vote of a majority of the Trustees at any regular meeting or any special meeting of the Trustees. Except as indicated, each individual has held the office shown or other offices in the same company for the past five years.
Experience, Skills, Attributes, and Qualifications of the Fund's Trustees. The Governance and Nominating Committee has adopted a statement of policy that describes the experience, qualifications, attributes, and skills that are necessary and desirable for potential Independent Trustee candidates (Statement of Policy). The Board believes that each Trustee satisfied at the time he or she was initially elected or appointed a Trustee, and continues to satisfy, the standards contemplated by the Statement of Policy. The Governance and Nominating Committee also engages professional search firms to help identify potential Independent Trustee candidates who have the experience, qualifications, attributes, and skills consistent with the Statement of Policy. From time to time, additional criteria based on the composition and skills of the current Independent Trustees, as well as experience or skills that may be appropriate in light of future changes to board composition, business conditions, and regulatory or other developments, have also been considered by the professional search firms and the Governance and Nominating Committee. In addition, the Board takes into account the Trustees' commitment and participation in Board and committee meetings, as well as their leadership of standing and ad hoc committees throughout their tenure.
Annual Report
Trustees and Officers - continued
In determining that a particular Trustee was and continues to be qualified to serve as a Trustee, the Board has considered a variety of criteria, none of which, in isolation, was controlling. The Board believes that, collectively, the Trustees have balanced and diverse experience, qualifications, attributes, and skills, which allow the Board to operate effectively in governing the fund and protecting the interests of shareholders. Information about the specific experience, skills, attributes, and qualifications of each Trustee, which in each case led to the Board's conclusion that the Trustee should serve (or continue to serve) as a trustee of the fund, is provided below.
Board Structure and Oversight Function. James C. Curvey is an interested person (as defined in the 1940 Act) and currently serves as Chairman. The Trustees have determined that an interested Chairman is appropriate and benefits shareholders because an interested Chairman has a personal and professional stake in the quality and continuity of services provided to the fund. Independent Trustees exercise their informed business judgment to appoint an individual of their choosing to serve as Chairman, regardless of whether the Trustee happens to be independent or a member of management. The Independent Trustees have determined that they can act independently and effectively without having an Independent Trustee serve as Chairman and that a key structural component for assuring that they are in a position to do so is for the Independent Trustees to constitute a substantial majority for the Board. The Independent Trustees also regularly meet in executive session. Ned C. Lautenbach serves as Chairman of the Independent Trustees and as such (i) acts as a liaison between the Independent Trustees and management with respect to matters important to the Independent Trustees and (ii) with management prepares agendas for Board meetings.
Fidelity funds are overseen by different Boards of Trustees. The fund's Board oversees Fidelity's equity and high income funds and another Board oversees Fidelity's investment-grade bond, money market, and asset allocation funds. The asset allocation funds may invest in Fidelity funds overseen by the fund's Board. The use of separate Boards, each with its own committee structure, allows the Trustees of each group of Fidelity funds to focus on the unique issues of the funds they oversee, including common research, investment, and operational issues. On occasion, the separate Boards establish joint committees to address issues of overlapping consequences for the Fidelity funds overseen by each Board.
The Trustees operate using a system of committees to facilitate the timely and efficient consideration of all matters of importance to the Trustees, the fund, and fund shareholders and to facilitate compliance with legal and regulatory requirements and oversight of the fund's activities and associated risks. The Board, acting through its committees, has charged FMR and its affiliates with (i) identifying events or circumstances the occurrence of which could have demonstrably adverse effects on the fund's business and/or reputation; (ii) implementing processes and controls to lessen the possibility that such events or circumstances occur or to mitigate the effects of such events or circumstances if they do occur; and (iii) creating and maintaining a system designed to evaluate continuously business and market conditions in order to facilitate the identification and implementation processes described in (i) and (ii) above. Because the day-to-day operations and activities of the fund are carried out by or through FMR, its affiliates and other service providers, the fund's exposure to risks is mitigated but not eliminated by the processes overseen by the Trustees. While each of the Board's committees has responsibility for overseeing different aspects of the fund's activities, oversight is exercised primarily through the Operations, Audit, and Compliance Committees. In addition, the Independent Trustees have worked with FMR to enhance the Board's oversight of investment and financial risks, legal and regulatory risks, technology risks, and operational risks, including the development of additional risk reporting to the Board. For example, a working group comprised of Independent Trustees and FMR has worked and continues to work to review the Fidelity funds' valuation-related activities, reporting and risk management. Appropriate personnel, including but not limited to the fund's Chief Compliance Officer (CCO), FMR's internal auditor, the independent accountants, the fund's Treasurer and portfolio management personnel, make periodic reports to the Board's committees, as appropriate, including an annual review of FMR's risk management program for the Fidelity funds. The responsibilities of each standing committee, including their oversight responsibilities, are described further under "Standing Committees of the Fund's Trustees."
Annual Report
The fund's Statement of Additional Information (SAI) includes more information about the Trustees. To request a free copy, call Fidelity at 1-877-208-0098.
Interested Trustees*:
Correspondence intended for each Trustee who is an interested person may be sent to Fidelity Investments, 245 Summer Street, Boston, Massachusetts 02210.
Name, Year of Birth; Principal Occupations and Other Relevant Experience+ | |
James C. Curvey (1935) | |
Year of Election or Appointment: 2007 Trustee Chairman of the Board of Trustees | |
| Mr. Curvey also serves as Trustee of other Fidelity funds. Mr. Curvey is a Director of Fidelity Investments Money Management, Inc. (2009-present), Director of Fidelity Research & Analysis Co. (2009-present) and Director of FMR and FMR Co., Inc. (2007-present). Mr. Curvey is also Vice Chairman (2007-present) and Director of FMR LLC. In addition, Mr. Curvey serves as an Overseer for the Boston Symphony Orchestra and a member of the Trustees of Villanova University. Previously, Mr. Curvey was the Vice Chairman (2006-2007) and Director (2000-2007) of FMR Corp. |
Charles S. Morrison (1960) | |
Year of Election or Appointment: 2014 Trustee | |
| Mr. Morrison also serves as Trustee or Vice President of other funds. He serves as President, Asset Management (2014-present) and is an employee of Fidelity Investments. Previously, Mr. Morrison served as President, Fixed Income (2011-2014), Vice President of Fidelity's Money Market Funds (2005-2009), President, Money Market Group Leader of FMR (2009), and Senior Vice President, Money Market Group of FMR (2004-2009). Mr. Morrison also served as Vice President of Fidelity's Bond Funds (2002-2005), certain Balanced Funds (2002-2005), and certain Asset Allocation Funds (2002-2007), and as Senior Vice President (2002-2005) of Fidelity's Bond Division. |
* Trustees have been determined to be "Interested Trustees" by virtue of, among other things, their affiliation with the trust or various entities under common control with FMR.
+ The information above includes each Trustee's principal occupation during the last five years and other information relating to the experience, attributes, and skills relevant to each Trustee's qualifications to serve as a Trustee, which led to the conclusion that each Trustee should serve as a Trustee for the fund.
Annual Report
Independent Trustees:
Correspondence intended for each Independent Trustee (that is, the Trustees other than the Interested Trustees) may be sent to Fidelity Investments, P.O. Box 55235, Boston, Massachusetts 02205-5235.
Name, Year of Birth; Principal Occupations and Other Relevant Experience+ | |
Dennis J. Dirks (1948) | |
Year of Election or Appointment: 2005 Trustee | |
| Mr. Dirks also serves as Trustee of other Fidelity funds. Prior to his retirement in May 2003, Mr. Dirks was Chief Operating Officer and a member of the Board of The Depository Trust & Clearing Corporation (DTCC). He also served as President, Chief Operating Officer, and Board member of The Depository Trust Company (DTC) and President and Board member of the National Securities Clearing Corporation (NSCC). In addition, Mr. Dirks served as Chief Executive Officer and Board member of the Government Securities Clearing Corporation, Chief Executive Officer and Board member of the Mortgage-Backed Securities Clearing Corporation, as a Trustee and a member of the Finance Committee of Manhattan College (2005-2008), and as a Trustee and a member of the Finance Committee of AHRC of Nassau County (2006-2008). Mr. Dirks is a member of the Independent Directors Council (IDC) Governing Council (2010-present) and Board of Directors for The Brookville Center for Children's Services, Inc. (2009-present). |
Alan J. Lacy (1953) | |
Year of Election or Appointment: 2008 Trustee | |
| Mr. Lacy also serves as Trustee of other Fidelity funds. Mr. Lacy serves as Senior Adviser (2007-present) of Oak Hill Capital Partners, L.P. (private equity). Mr. Lacy also served as Chief Executive Officer (2000-2005) and Vice Chairman (2005-2006) of Sears Holdings Corporation and Sears, Roebuck and Co. (retail). In addition, Mr. Lacy serves as a member of the Board of Directors of Dave & Buster's Entertainment, Inc. (restaurant and entertainment complexes, 2010-present), Earth Fare, Inc. (retail grocery, 2012-present), The Hillman Companies, Inc. (hardware wholesalers, 2010-present), and Bristol-Myers Squibb Company (global pharmaceuticals, 2008-present). Mr. Lacy is a member of the Board of Trustees of The National Parks Conservation Association (2006-present). Previously, Mr. Lacy served as Chairman of the Board of Trustees of the National Parks Conservation Association (2008-2011) and as a member of the Board of Directors for the Western Union Company (global money transfer, 2006-2011). |
Ned C. Lautenbach (1944) | |
Year of Election or Appointment: 2000 Trustee Chairman of the Independent Trustees | |
| Mr. Lautenbach also serves as Trustee of other Fidelity funds. Mr. Lautenbach currently serves as the Lead Director of the Eaton Corporation Board of Directors (diversified industrial, 1997-present). Mr. Lautenbach is Chairman of the Board of Directors of the Philharmonic Center for the Arts in Naples, Florida (2012-present) and a member of the Council on Foreign Relations (1994-present). Previously, Mr. Lautenbach was a Partner/Advisory Partner at Clayton, Dubilier & Rice, LLC (private equity investment, 1998-2010), as well as a Director of Sony Corporation (2006-2007). |
Joseph Mauriello (1944) | |
Year of Election or Appointment: 2008 Trustee | |
| Mr. Mauriello also serves as Trustee of other Fidelity funds. Prior to his retirement in January 2006, Mr. Mauriello served in numerous senior management positions including Deputy Chairman and Chief Operating Officer (2004-2005), and Vice Chairman of Financial Services (2002-2004) of KPMG LLP US (professional services, 1965-2005). Mr. Mauriello currently serves as a member of the Board of Directors of XL Group plc. (global insurance and re-insurance, 2006-present). Previously, Mr. Mauriello served as a Director of the Hamilton Funds of the Bank of New York (2006-2007) and of Arcadia Resources Inc. (health care services and products, 2007-2012). |
Robert W. Selander (1950) | |
Year of Election or Appointment: 2011 Trustee | |
| Mr. Selander also serves as Trustee of other Fidelity funds. Previously, Mr. Selander served as a Member of the Advisory Board of other Fidelity funds (2011), and Executive Vice Chairman (2010), Chief Executive Officer (2009-2010), and President and Chief Executive Officer (1997-2009) of Mastercard, Inc. |
Cornelia M. Small (1944) | |
Year of Election or Appointment: 2005 Trustee | |
| Ms. Small also serves as Trustee of other Fidelity funds. Ms. Small is a member of the Board of Directors (2009-present) and Chair of the Investment Committee (2010-present) of the Teagle Foundation. Ms. Small also serves on the Investment Committee of the Berkshire Taconic Community Foundation (2008-present). Previously, Ms. Small served as Chairperson (2002-2008) and a member of the Investment Committee and Chairperson (2008-2012) and a member of the Board of Trustees of Smith College. In addition, Ms. Small served as Chief Investment Officer, Director of Global Equity Investments, and a member of the Board of Directors of Scudder, Stevens & Clark and Scudder Kemper Investments. |
William S. Stavropoulos (1939) | |
Year of Election or Appointment: 2002 Trustee Vice Chairman of the Independent Trustees | |
| Mr. Stavropoulos also serves as Trustee of other Fidelity funds. Mr. Stavropoulos serves as President and Founder of the Michigan Baseball Foundation, the Great Lakes Loons (2007-present). Mr. Stavropoulos is Chairman Emeritus of the Board of Directors of The Dow Chemical Company, where he previously served in numerous senior management positions, including President, CEO (1995-2000; 2002-2004), Chairman of the Executive Committee (2000-2006), and as a member of the Board of Directors (1990-2006). Currently, Mr. Stavropoulos is Chairman of the Board of Directors of Univar Inc. (global distributor of commodity and specialty chemicals), a Director of Teradata Corporation (data warehousing and technology solutions), and Maersk Inc. (industrial conglomerate), and a member of the Advisory Board for Metalmark Capital LLC (private equity investment, 2005-present). Mr. Stavropoulos is an operating advisor to Clayton, Dubilier & Rice, LLC (private equity investment). In addition, Mr. Stavropoulos is a member of the University of Notre Dame Advisory Council for the College of Science, a Trustee of the Rollin L. Gerstacker Foundation, and a Director of the Naples Philharmonic Center for the Arts. Previously, Mr. Stavropoulos served as a Director of Chemical Financial Corporation (bank holding company, 1993-2012) and Tyco International, Ltd. (multinational manufacturing and services, 2007-2012). |
David M. Thomas (1949) | |
Year of Election or Appointment: 2008 Trustee | |
| Mr. Thomas also serves as Trustee of other Fidelity funds. Mr. Thomas serves as Non-Executive Chairman of the Board of Directors of Fortune Brands Home and Security (home and security products, 2011-present), and as a member of the Board of Directors of Interpublic Group of Companies, Inc. (marketing communication, 2004-present). Previously, Mr. Thomas served as Executive Chairman (2005-2006) and Chairman and Chief Executive Officer (2000-2005) of IMS Health, Inc. (pharmaceutical and healthcare information solutions), and a Director of Fortune Brands, Inc. (consumer products, 2000-2011). |
+ The information above includes each Trustee's principal occupation during the last five years and other information relating to the experience, attributes, and skills relevant to each Trustee's qualifications to serve as a Trustee, which led to the conclusion that each Trustee should serve as a Trustee for the fund.
Advisory Board Member and Officers:
Correspondence intended for each officer and Peter S. Lynch may be sent to Fidelity Investments, 245 Summer Street, Boston, Massachusetts 02210. Officers appear below in alphabetical order.
Name, Year of Birth; Principal Occupation | |
Peter S. Lynch (1944) | |
Year of Election or Appointment: 2003 Member of the Advisory Board | |
| Mr. Lynch also serves as Member of the Advisory Board of other Fidelity funds. Mr. Lynch is Vice Chairman and a Director of FMR and FMR Co., Inc. In addition, Mr. Lynch serves as a Trustee of Boston College and as the Chairman of the Inner-City Scholarship Fund. Previously, Mr. Lynch served on the Special Olympics International Board of Directors (1997-2006). |
Elizabeth Paige Baumann (1968) | |
Year of Election or Appointment: 2012 Anti-Money Laundering (AML) Officer | |
| Ms. Baumann also serves as AML Officer of other funds. She is Chief AML Officer of FMR LLC (2012-present) and is an employee of Fidelity Investments. Previously, Ms. Baumann served as Vice President and Deputy Anti-Money Laundering Officer (2007-2012). |
William C. Coffey (1969) | |
Year of Election or Appointment: 2009 Assistant Secretary | |
| Mr. Coffey also serves as Assistant Secretary of other funds. He is Senior Vice President and Deputy General Counsel of FMR LLC (2010-present), and is an employee of Fidelity Investments. Previously, Mr. Coffey served as Vice President and Associate General Counsel of FMR LLC (2005-2009). |
Jonathan Davis (1968) | |
Year of Election or Appointment: 2010 Assistant Treasurer | |
| Mr. Davis also serves as Assistant Treasurer of other funds. Mr. Davis is an employee of Fidelity Investments. Previously, Mr. Davis served as Vice President and Associate General Counsel of FMR LLC (2003-2010). |
Adrien E. Deberghes (1967) | |
Year of Election or Appointment: 2008 Deputy Treasurer | |
| Mr. Deberghes also serves as an officer of other funds. He is an employee of Fidelity Investments (2008-present). Prior to joining Fidelity Investments, Mr. Deberghes was Senior Vice President of Mutual Fund Administration at State Street Corporation (2007-2008), Senior Director of Mutual Fund Administration at Investors Bank & Trust (2005-2007), and Director of Finance for Dunkin' Brands (2000-2005). |
Stephanie J. Dorsey (1969) | |
Year of Election or Appointment: 2010 Assistant Treasurer | |
| Ms. Dorsey also serves as an officer of other funds. She is an employee of Fidelity Investments (2008-present) and has served in other fund officer roles. Prior to joining Fidelity Investments, Ms. Dorsey served as Treasurer (2004-2008) of the JPMorgan Mutual Funds and Vice President (2004-2008) of JPMorgan Chase Bank. |
Scott C. Goebel (1968) | |
Year of Election or Appointment: 2008 Secretary and Chief Legal Officer (CLO) | |
| Mr. Goebel serves as Secretary and CLO of other funds. Mr. Goebel also serves as Secretary of Fidelity SelectCo, LLC (2013-present), Fidelity Investments Money Management, Inc. (FIMM) (2010-present) and Fidelity Research and Analysis Company (FRAC) (2010-present); General Counsel, Secretary, and Senior Vice President of FMR (2008-present) and FMR Co., Inc. (2008-present); Chief Legal Officer of Fidelity Management & Research (Hong Kong) Limited (2008-present); and Assistant Secretary of Fidelity Management & Research (Japan) Inc. (2008-present) and Fidelity Management & Research (U.K.) Inc. (2008-present). Previously, Mr. Goebel served as Secretary and CLO of other Fidelity funds (2008-2013), Assistant Secretary of FIMM (2008-2010), FRAC (2008-2010), and certain funds (2007-2008); and as Vice President and Secretary of Fidelity Distributors Corporation (FDC) (2005-2007). Mr. Goebel has been employed by FMR LLC or an affiliate since 2001. |
Joseph A. Hanlon (1968) | |
Year of Election or Appointment: 2012 Chief Compliance Officer | |
| Mr. Hanlon also serves as Chief Compliance Officer of other funds. Mr. Hanlon serves as Compliance Officer of FMR, FMR Co., Inc., Fidelity Investments Money Management, Inc. (FIMM), Fidelity Research and Analysis Company (FRAC), and Fidelity Management & Research (Hong Kong) (2009-present), as Senior Vice President of the Fidelity Asset Management Division (2009-present), and is an employee of Fidelity Investments. Previously, Mr. Hanlon served as Compliance Officer of Fidelity Management & Research (Japan) Inc. (2009-2013), Strategic Advisers, Inc. (2009-2013), and Fidelity Management & Research (U.K.) Inc. (2009-2013). |
Thomas C. Hense (1964) | |
Year of Election or Appointment: 2008/2010 Vice President | |
| Mr. Hense also serves as Vice President of other funds (High Income (2008), Small Cap (2008), and Value (2010) funds). Previously, Mr. Hense served as a portfolio manager for Fidelity's Institutional Money Management Group (Pyramis) (2003-2008). |
Brian B. Hogan (1964) | |
Year of Election or Appointment: 2009 Vice President | |
| Mr. Hogan also serves as Trustee or Vice President of other funds. Mr. Hogan serves as President of FMR's Equity Division (2009-present). Previously, Mr. Hogan served as Senior Vice President, Equity Research of FMR (2006-2009) and as a portfolio manager. |
Chris Maher (1972) | |
Year of Election or Appointment: 2013 Assistant Treasurer | |
| Mr. Maher serves as Assistant Treasurer of other funds. Mr. Maher is Vice President of Valuation Oversight and is an employee of Fidelity Investments. Previously, Mr. Maher served as Vice President of Asset Management Compliance (2013), Vice President of FMR's Program Management Group (2010-2013), and Vice President of Valuation Oversight (2008-2010). |
Christine Reynolds (1958) | |
Year of Election or Appointment: 2008 Chief Financial Officer | |
| Ms. Reynolds also serves as Chief Financial Officer of other funds. Ms. Reynolds became President of Fidelity Pricing and Cash Management Services (FPCMS) in August 2008. Ms. Reynolds served as Chief Operating Officer of FPCMS (2007-2008). Previously, Ms. Reynolds served as President, Treasurer, and Anti-Money Laundering officer of the Fidelity funds (2004-2007). |
Kenneth B. Robins (1969) | |
Year of Election or Appointment: 2008 President and Treasurer | |
| Mr. Robins also serves as an officer of other funds. Mr. Robins serves as Executive Vice President of Fidelity Investments Money Management, Inc. (FIMM) (2013-present) and is an employee of Fidelity Investments (2004-present). Previously, Mr. Robins served in other fund officer roles. |
Gary W. Ryan (1958) | |
Year of Election or Appointment: 2005 Assistant Treasurer | |
| Mr. Ryan also serves as Assistant Treasurer of other funds. Mr. Ryan is an employee of Fidelity Investments and has served in other fund officer roles. Previously, Mr. Ryan served as Vice President of Fund Reporting in Fidelity Pricing and Cash Management Services (FPCMS) (1999-2005). |
Stephen Sadoski (1971) | |
Year of Election or Appointment: 2012 Deputy Treasurer | |
| Mr. Sadoski also serves as Deputy Treasurer of other funds. He is an employee of Fidelity Investments (2012-present) and has served in another fund officer role. Prior to joining Fidelity Investments, Mr. Sadoski served as an assistant chief accountant in the Division of Investment Management of the Securities and Exchange Commission (SEC) (2009-2012) and as a senior manager at Deloitte & Touche LLP (1997-2009). |
Stacie M. Smith (1974) | |
Year of Election or Appointment: 2013 Deputy Treasurer | |
| Ms. Smith also serves as an officer of other funds. She is an employee of Fidelity Investments (2009-present) and has served in other fund officer roles. Prior to joining Fidelity Investments, Ms. Smith served as Senior Audit Manager of Ernst & Young LLP (1996-2009). |
Renee Stagnone (1975) | |
Year of Election or Appointment: 2013 Deputy Treasurer | |
| Ms. Stagnone also serves as Deputy Treasurer of other funds. Ms. Stagnone is an employee of Fidelity Investments. |
Joseph F. Zambello (1957) | |
Year of Election or Appointment: 2011 Deputy Treasurer | |
| Mr. Zambello also serves as Deputy Treasurer of other funds. Mr. Zambello is an employee of Fidelity Investments. Previously, Mr. Zambello served as Vice President of FMR's Program Management Group (2009-2011) and Vice President of the Transfer Agent Oversight Group (2005-2009). |
Annual Report
Distributions (Unaudited)
The Board of Trustees of Fidelity Advisor Mid Cap Value Fund voted to pay to shareholders of record at the opening of business on record date, the following distributions per share derived from capital gains realized from sales of portfolio securities and dividends derived from net investment income:
| Pay Date | Record Date | Dividends | Capital Gains |
Institutional Class | 03/17/14 | 03/14/14 | $0.006 | $0.478 |
The fund hereby designates as a capital gain dividend with respect to the taxable year ended January 31, 2014, $36,679,770, or, if subsequently determined to be different, the net capital gain of such year.
Institutional Class designates 15% of the dividends distributed during the fiscal year as qualifying for the dividends-received deduction for corporate shareholders.
Institutional Class designates 18% of the dividends distributed during the fiscal year as amounts which may be taken into account as a dividend for purposes of the maximum rate under section 1(h)(11) of the Internal Revenue Code.
The fund will notify shareholders in January 2015 of amounts for use in preparing 2014 income tax returns.
Annual Report
Investment Adviser
Fidelity Management & Research Company
Boston, MA
Investment Sub-Advisers
FMR Co., Inc.
Fidelity Management & Research
(U.K.) Inc.
Fidelity Management & Research
(Hong Kong) Limited
Fidelity Management & Research
(Japan) Inc.
General Distributor
Fidelity Distributors Corporation
Smithfield, RI
Transfer and Service Agents
Fidelity Investments Institutional Operations Company, Inc.
Boston, MA
Fidelity Service Company, Inc.
Boston, MA
Custodian
Citibank, N.A.
New York, NY
(Fidelity Investment logo)(registered trademark)
AMCVI-UANN-0314
1.838432.104
Fidelity®
Mid Cap Value
Fund
Annual Report
January 31, 2014
(Fidelity Cover Art)
Contents
Performance | How the fund has done over time. | |
Management's Discussion of Fund Performance | The Portfolio Manager's review of fund performance and strategy. | |
Shareholder Expense Example | An example of shareholder expenses. | |
Investment Changes | A summary of major shifts in the fund's investments over the past six months. | |
Investments | A complete list of the fund's investments with their market values. | |
Financial Statements | Statements of assets and liabilities, operations, and changes in net assets, as well as financial highlights. | |
Notes | Notes to the financial statements. | |
Report of Independent Registered Public Accounting Firm |
| |
Trustees and Officers |
| |
Distributions |
|
To view a fund's proxy voting guidelines and proxy voting record for the 12-month period ended June 30, visit http://www.fidelity.com/proxyvotingresults or visit the Securities and Exchange Commission's (SEC) web site at http://www.sec.gov. You may also call 1-800-544-8544 to request a free copy of the proxy voting guidelines.
Standard & Poor's, S&P and S&P 500 are registered service marks of The McGraw-Hill Companies, Inc. and have been licensed for use by Fidelity Distributors Corporation.
Other third-party marks appearing herein are the property of their respective owners.
All other marks appearing herein are registered or unregistered trademarks or service marks of FMR LLC or an affiliated company. © 2014 FMR LLC. All rights reserved.
This report and the financial statements contained herein are submitted for the general information of the shareholders of the fund. This report is not authorized for distribution to prospective investors in the fund unless preceded or accompanied by an effective prospectus.
A fund files its complete schedule of portfolio holdings with the SEC for the first and third quarters of each fiscal year on Form N-Q. Forms N-Q are available on the SEC's web site at http://www.sec.gov. A fund's Forms N-Q may be reviewed and copied at the SEC's Public Reference Room in Washington, DC. Information regarding the operation of the SEC's Public Reference Room may be obtained by calling 1-800-SEC-0330. For a complete list of a fund's portfolio holdings, view the most recent holdings listing, semiannual report, or annual report on Fidelity's web site at http://www.fidelity.com, http://www.advisor.fidelity.com, or http://www.401k.com, as applicable.
NOT FDIC INSURED • MAY LOSE VALUE • NO BANK GUARANTEE
Neither the fund nor Fidelity Distributors Corporation is a bank.
Annual Report
Performance: The Bottom Line
Average annual total return reflects the change in the value of an investment, assuming reinvestment of the class' distributions from dividend income and capital gains (the profits earned upon the sale of securities that have grown in value, if any) and assuming a constant rate of performance each year. The $10,000 table and the fund's returns do not reflect the deduction of taxes that a shareholder would pay on fund distributions or the redemption of fund shares. During periods of reimbursement by Fidelity, a fund's total return will be greater than it would be had the reimbursement not occurred. How a fund did yesterday is no guarantee of how it will do tomorrow.
Average Annual Total Returns
Periods ended January 31, 2014 | Past 1 | Past 5 | Past 10 |
Fidelity® Mid Cap Value Fund | 24.08% | 23.76% | 9.52% |
$10,000 Over 10 Years
Let's say hypothetically that $10,000 was invested in Fidelity® Mid Cap Value Fund, a class of the fund, on January 31, 2004. The chart shows how the value of your investment would have changed, and also shows how the Russell Midcap® Value Index performed over the same period.
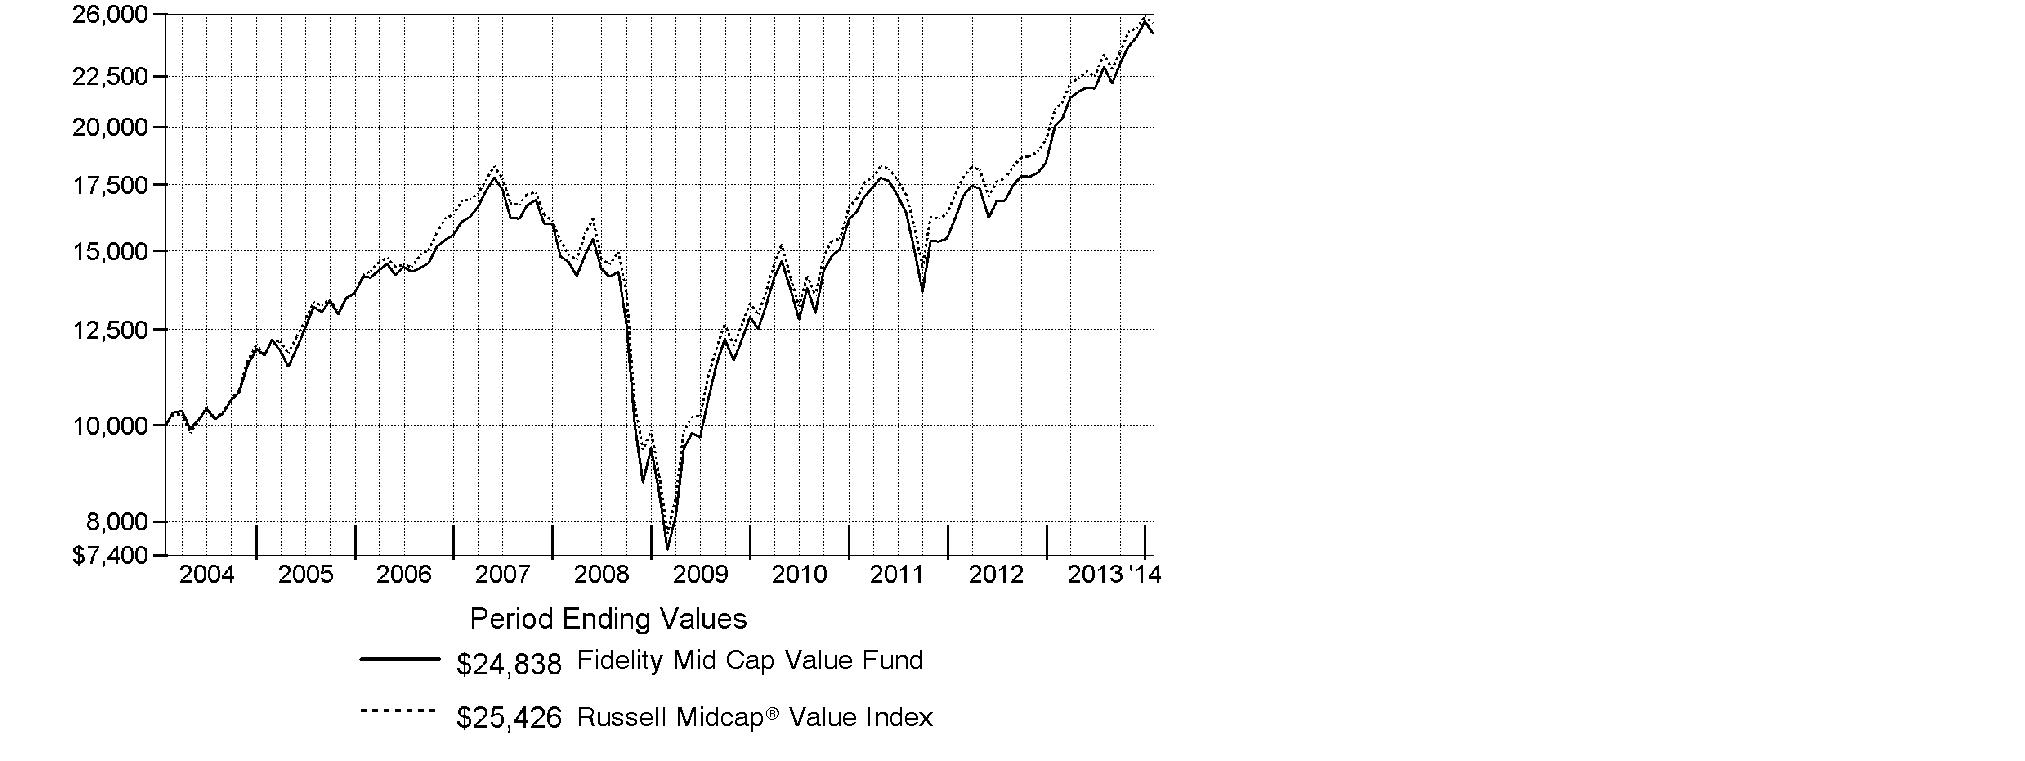
Annual Report
Management's Discussion of Fund Performance
Market Recap: Despite the worst January in years, markets finished notably higher for the 12 months ending January 31, 2014, amid a generally improving global economy and accommodative monetary policies worldwide. After achieving a series of highs in 2013, both the broad S&P 500® Index and the blue-chip Dow Jones Industrial AverageSM pulled back in the new year, bringing their 12-month returns to 21.52% and 16.07%, respectively. The growth-oriented Nasdaq Composite Index®, having run hotter in 2013 and cooled less in January, retained a loftier 32.33% result. For the period overall, smaller-cap stocks generally outperformed larger-caps, and growth outperformed value across market-cap segments. Bullish sentiment drove stocks higher through mid-May, but mixed signals from the U.S. Federal Reserve as to when it might curtail its stimulative bond-buying program, along with jitters over a potential U.S. military strike in Syria, put the markets in flux over the summer. Stocks regained their momentum in October despite a budget impasse that briefly shuttered the federal government, and volatility remained subdued heading into the holidays, allowing many markets to hit all-time highs by year-end. In January, renewed optimism for Europe and other developed markets was overrun by renewed concern about Fed tapering, the economic slowdown in China and a sell-off in emerging markets.
Comments from Court Dignan, who became Portfolio Manager of Fidelity® Mid Cap Value Fund on April 12, 2013: For the year, the fund's Retail Class shares returned 24.08%, versus 22.14% for the Russell Midcap® Value Index. Security selection, which focused on higher- or average-quality mid-cap companies selling at average or discounted prices, was especially strong in financials. Top individual contributors included alternative asset managers Blackstone Group and Apollo Global Management, whose steep share price gains were fueled by growing appreciation of their earnings growth potential. An investment in commercial real estate investment trust (REIT) NorthStar Realty Finance soared on news that the company would spin off its asset management business. All were out-of-index positions. By contrast, stock picks in information technology hindered relative performance. Individual disappointments came from not owning semiconductor chipmaker Micron Technology, an index component whose shares took off when a fire at a competitor's facility reduced supply and pricing rose. Elsewhere, being early in buying retail REIT CBL & Associates Properties hurt, as rising interest rates and slowing mall traffic pressured its return.
The views expressed above reflect those of the portfolio manager(s) only through the end of the period as stated on the cover of this report and do not necessarily represent the views of Fidelity or any other person in the Fidelity organization. Any such views are subject to change at any time based upon market or other conditions and Fidelity disclaims any responsibility to update such views. These views may not be relied on as investment advice and, because investment decisions for a Fidelity fund are based on numerous factors, may not be relied on as an indication of trading intent on behalf of any Fidelity fund.
Annual Report
Shareholder Expense Example
As a shareholder of the Fund, you incur two types of costs: (1) transaction costs, including sales charges (loads) on purchase payments or redemption proceeds, redemption fees and (2) ongoing costs, including management fees, distribution and/or service (12b-1) fees and other Fund expenses. This Example is intended to help you understand your ongoing costs (in dollars) of investing in the Fund and to compare these costs with the ongoing costs of investing in other mutual funds.
The Example is based on an investment of $1,000 invested at the beginning of the period and held for the entire period (August 1, 2013 to January 31, 2014).
Actual Expenses
The first line of the accompanying table for each class of the Fund provides information about actual account values and actual expenses. You may use the information in this line, together with the amount you invested, to estimate the expenses that you paid over the period. Simply divide your account value by $1,000.00 (for example, an $8,600 account value divided by $1,000.00 = 8.6), then multiply the result by the number in the first line for a class of the Fund under the heading entitled "Expenses Paid During Period" to estimate the expenses you paid on your account during this period. A small balance maintenance fee of $12.00 that is charged once a year may apply for certain accounts with a value of less than $2,000. This fee is not included in the table below. If it was, the estimate of expenses you paid during the period would be higher, and your ending account value lower, by this amount. In addition, the Fund, as a shareholder in the underlying Fidelity Central Funds, will indirectly bear its pro-rata share of the fees and expenses incurred by the underlying Fidelity Central Funds. These fees and expenses are not included in the Fund's annualized expense ratio used to calculate the expense estimate in the table below.
Hypothetical Example for Comparison Purposes
The second line of the accompanying table for each class of the Fund provides information about hypothetical account values and hypothetical expenses based on a Class' actual expense ratio and an assumed rate of return of 5% per year before expenses, which is not the Class' actual return. The hypothetical account values and expenses may not be used to estimate the actual ending account balance or expenses you paid for the period. You may use this information to compare the ongoing costs of investing in the Fund and other funds. To do so, compare this 5% hypothetical example with the 5% hypothetical examples that appear in the shareholder reports of the other funds. A small balance maintenance fee of $12.00 that is charged once a year may apply for certain accounts with a value of less than $2,000. This fee is not included in the table below. If it was, the estimate of expenses you paid during the period would be higher, and your ending account value lower, by this amount. In addition, the Fund, as a shareholder in the underlying Fidelity Central Funds, will indirectly bear its pro-rata share of the fees and expenses incurred by the underlying Fidelity Central Funds. These fees and expenses are not included in the Fund's annualized expense ratio used to calculate the expense estimate in the table below.
Please note that the expenses shown in the table are meant to highlight your ongoing costs only and do not reflect any transaction costs. Therefore, the second line of the table is useful in comparing ongoing costs only, and will not help you determine the relative total costs of owning different funds. In addition, if these transactional costs were included, your costs would have been higher.
Annual Report
Shareholder Expense Example - continued
| Annualized | Beginning | Ending | Expenses Paid |
Class A | 1.15% |
|
|
|
Actual |
| $ 1,000.00 | $ 1,079.30 | $ 6.03 |
HypotheticalA |
| $ 1,000.00 | $ 1,019.41 | $ 5.85 |
Class T | 1.43% |
|
|
|
Actual |
| $ 1,000.00 | $ 1,077.30 | $ 7.49 |
HypotheticalA |
| $ 1,000.00 | $ 1,018.00 | $ 7.27 |
Class B | 1.92% |
|
|
|
Actual |
| $ 1,000.00 | $ 1,075.00 | $ 10.04 |
HypotheticalA |
| $ 1,000.00 | $ 1,015.53 | $ 9.75 |
Class C | 1.89% |
|
|
|
Actual |
| $ 1,000.00 | $ 1,074.90 | $ 9.88 |
HypotheticalA |
| $ 1,000.00 | $ 1,015.68 | $ 9.60 |
Mid Cap Value | .79% |
|
|
|
Actual |
| $ 1,000.00 | $ 1,080.70 | $ 4.14 |
HypotheticalA |
| $ 1,000.00 | $ 1,021.22 | $ 4.02 |
Institutional Class | .84% |
|
|
|
Actual |
| $ 1,000.00 | $ 1,080.20 | $ 4.40 |
HypotheticalA |
| $ 1,000.00 | $ 1,020.97 | $ 4.28 |
A 5% return per year before expenses
B Annualized expense ratio reflects expenses net of applicable fee waivers.
* Expenses are equal to each Class' annualized expense ratio, multiplied by the average account value over the period, multiplied by 184/365 (to reflect the one-half year period).
Annual Report
Investment Changes (Unaudited)
Top Ten Stocks as of January 31, 2014 | ||
| % of fund's | % of fund's net assets |
Edison International | 1.6 | 1.5 |
Fifth Third Bancorp | 1.6 | 1.6 |
Cigna Corp. | 1.6 | 1.5 |
SLM Corp. | 1.6 | 1.6 |
Capital One Financial Corp. | 1.5 | 0.0 |
M&T Bank Corp. | 1.5 | 1.8 |
Allstate Corp. | 1.5 | 0.0 |
Invesco Ltd. | 1.4 | 0.0 |
CF Industries Holdings, Inc. | 1.4 | 0.0 |
Hartford Financial Services Group, Inc. | 1.4 | 1.5 |
| 15.1 | |
Top Five Market Sectors as of January 31, 2014 | ||
| % of fund's | % of fund's net assets |
Financials | 31.7 | 31.6 |
Information Technology | 11.5 | 11.4 |
Industrials | 10.7 | 11.1 |
Utilities | 10.7 | 12.0 |
Health Care | 9.9 | 8.2 |
Asset Allocation (% of fund's net assets) | |||||||
As of January 31, 2014 * | As of July 31, 2013 ** | ||||||
 | Stocks 98.6% |
| | Stocks 98.9% |
| ||
 | Short-Term |
| | Short-Term |
| ||

* Foreign investments | 11.4% |
| ** Foreign investments | 6.4% |
| ||
Annual Report
Investments January 31, 2014
Showing Percentage of Net Assets
Common Stocks - 98.6% | |||
Shares | Value | ||
CONSUMER DISCRETIONARY - 8.5% | |||
Hotels, Restaurants & Leisure - 1.0% | |||
Wyndham Worldwide Corp. | 223,200 | $ 15,833,808 | |
Household Durables - 0.8% | |||
Whirlpool Corp. | 95,800 | 12,770,140 | |
Multiline Retail - 2.6% | |||
Big Lots, Inc. (a) | 377,978 | 10,126,031 | |
Kohl's Corp. | 204,800 | 10,369,024 | |
Macy's, Inc. | 360,900 | 19,199,880 | |
| 39,694,935 | ||
Specialty Retail - 3.3% | |||
AutoZone, Inc. (a) | 32,400 | 16,039,944 | |
Bed Bath & Beyond, Inc. (a) | 132,900 | 8,485,665 | |
GameStop Corp. Class A | 175,700 | 6,161,799 | |
Staples, Inc. | 1,527,000 | 20,095,320 | |
| 50,782,728 | ||
Textiles, Apparel & Luxury Goods - 0.8% | |||
Coach, Inc. | 221,000 | 10,583,690 | |
Deckers Outdoor Corp. (a)(d) | 30,900 | 2,408,655 | |
| 12,992,345 | ||
TOTAL CONSUMER DISCRETIONARY | 132,073,956 | ||
CONSUMER STAPLES - 3.3% | |||
Beverages - 0.8% | |||
Molson Coors Brewing Co. Class B | 236,100 | 12,428,304 | |
Food & Staples Retailing - 0.9% | |||
Kroger Co. | 382,800 | 13,819,080 | |
Food Products - 1.6% | |||
Bunge Ltd. | 185,700 | 14,068,632 | |
The J.M. Smucker Co. | 108,300 | 10,439,037 | |
| 24,507,669 | ||
TOTAL CONSUMER STAPLES | 50,755,053 | ||
ENERGY - 6.3% | |||
Energy Equipment & Services - 1.9% | |||
Ensco PLC Class A | 303,700 | 15,297,369 | |
National Oilwell Varco, Inc. | 189,600 | 14,221,896 | |
| 29,519,265 | ||
Common Stocks - continued | |||
Shares | Value | ||
ENERGY - continued | |||
Oil, Gas & Consumable Fuels - 4.4% | |||
Canadian Natural Resources Ltd. | 438,700 | $ 14,385,027 | |
Cimarex Energy Co. | 153,300 | 15,020,334 | |
Energen Corp. | 130,500 | 9,228,960 | |
Marathon Oil Corp. | 301,800 | 9,896,022 | |
Tesoro Corp. | 290,900 | 14,987,168 | |
Valero Energy Corp. | 76,900 | 3,929,590 | |
| 67,447,101 | ||
TOTAL ENERGY | 96,966,366 | ||
FINANCIALS - 31.7% | |||
Capital Markets - 5.4% | |||
Apollo Global Management LLC Class A | 483,700 | 15,696,065 | |
Carlyle Group LP | 171,900 | 5,983,839 | |
Invesco Ltd. | 673,500 | 22,393,875 | |
KKR & Co. LP | 760,300 | 18,330,833 | |
The Blackstone Group LP | 659,100 | 21,585,525 | |
| 83,990,137 | ||
Commercial Banks - 7.1% | |||
BB&T Corp. | 430,000 | 16,086,300 | |
Fifth Third Bancorp | 1,197,857 | 25,178,954 | |
Huntington Bancshares, Inc. | 1,655,600 | 15,016,292 | |
M&T Bank Corp. (d) | 213,000 | 23,751,630 | |
SunTrust Banks, Inc. | 433,800 | 16,059,276 | |
U.S. Bancorp | 348,100 | 13,830,013 | |
| 109,922,465 | ||
Consumer Finance - 3.1% | |||
Capital One Financial Corp. | 338,400 | 23,894,424 | |
SLM Corp. | 1,061,400 | 24,157,464 | |
| 48,051,888 | ||
Diversified Financial Services - 0.5% | |||
The NASDAQ Stock Market, Inc. | 185,400 | 7,073,010 | |
Insurance - 8.8% | |||
ACE Ltd. | 182,700 | 17,139,087 | |
Allied World Assurance Co. Holdings Ltd. | 139,500 | 14,357,340 | |
Allstate Corp. | 444,300 | 22,748,160 | |
Amtrust Financial Services, Inc. (d) | 384,600 | 12,414,888 | |
Brown & Brown, Inc. | 159,500 | 5,022,655 | |
Everest Re Group Ltd. | 120,800 | 17,487,008 | |
Common Stocks - continued | |||
Shares | Value | ||
FINANCIALS - continued | |||
Insurance - continued | |||
Fidelity National Financial, Inc. Class A | 555,500 | $ 17,520,470 | |
Hartford Financial Services Group, Inc. | 661,300 | 21,988,225 | |
Symetra Financial Corp. | 443,949 | 8,501,623 | |
| 137,179,456 | ||
Real Estate Investment Trusts - 6.8% | |||
American Capital Agency Corp. | 1,044,400 | 21,880,180 | |
CBL & Associates Properties, Inc. | 1,051,400 | 17,863,286 | |
Equity Lifestyle Properties, Inc. | 482,300 | 18,959,213 | |
MFA Financial, Inc. | 1,170,200 | 8,530,758 | |
NorthStar Realty Finance Corp. (d) | 1,062,700 | 15,504,793 | |
Pennsylvania Real Estate Investment Trust (SBI) | 664,800 | 12,398,520 | |
RLJ Lodging Trust | 405,500 | 10,129,390 | |
| 105,266,140 | ||
TOTAL FINANCIALS | 491,483,096 | ||
HEALTH CARE - 9.9% | |||
Biotechnology - 1.0% | |||
United Therapeutics Corp. (a) | 143,200 | 14,695,184 | |
Health Care Equipment & Supplies - 1.0% | |||
C.R. Bard, Inc. | 23,600 | 3,058,324 | |
St. Jude Medical, Inc. | 211,300 | 12,832,249 | |
| 15,890,573 | ||
Health Care Providers & Services - 6.1% | |||
Cardinal Health, Inc. | 197,400 | 13,427,148 | |
Cigna Corp. | 288,600 | 24,909,066 | |
Community Health Systems, Inc. (a) | 211,700 | 8,766,497 | |
DaVita HealthCare Partners, Inc. (a) | 203,900 | 13,239,227 | |
HCA Holdings, Inc. (a) | 289,100 | 14,533,057 | |
Omnicare, Inc. | 234,100 | 14,621,886 | |
VCA Antech, Inc. (a) | 171,300 | 5,471,322 | |
| 94,968,203 | ||
Pharmaceuticals - 1.8% | |||
Actavis PLC (a) | 86,900 | 16,422,362 | |
Mylan, Inc. (a) | 170,000 | 7,719,700 | |
Teva Pharmaceutical Industries Ltd. sponsored ADR | 89,800 | 4,007,774 | |
| 28,149,836 | ||
TOTAL HEALTH CARE | 153,703,796 | ||
Common Stocks - continued | |||
Shares | Value | ||
INDUSTRIALS - 10.7% | |||
Aerospace & Defense - 2.1% | |||
Esterline Technologies Corp. (a) | 138,600 | $ 14,268,870 | |
Meggitt PLC | 2,068,200 | 17,526,557 | |
| 31,795,427 | ||
Airlines - 0.6% | |||
American Airlines Group, Inc. (a)(d) | 289,200 | 9,702,660 | |
Commercial Services & Supplies - 0.8% | |||
Tetra Tech, Inc. (a) | 429,542 | 12,675,784 | |
Construction & Engineering - 1.8% | |||
AECOM Technology Corp. (a) | 496,300 | 14,228,921 | |
URS Corp. | 286,203 | 14,367,391 | |
| 28,596,312 | ||
Electrical Equipment - 1.2% | |||
EnerSys | 213,500 | 14,530,810 | |
Rockwell Automation, Inc. | 39,900 | 4,582,116 | |
| 19,112,926 | ||
Machinery - 2.0% | |||
Cummins, Inc. | 128,000 | 16,253,440 | |
Parker Hannifin Corp. | 19,200 | 2,176,704 | |
Terex Corp. | 64,500 | 2,644,500 | |
Valmont Industries, Inc. | 63,500 | 9,295,130 | |
| 30,369,774 | ||
Professional Services - 1.2% | |||
Dun & Bradstreet Corp. | 168,500 | 18,535,000 | |
Trading Companies & Distributors - 1.0% | |||
WESCO International, Inc. (a) | 186,900 | 15,505,224 | |
TOTAL INDUSTRIALS | 166,293,107 | ||
INFORMATION TECHNOLOGY - 11.5% | |||
Communications Equipment - 0.7% | |||
Plantronics, Inc. | 251,400 | 10,792,602 | |
Computers & Peripherals - 2.4% | |||
EMC Corp. | 600,400 | 14,553,696 | |
SanDisk Corp. | 160,000 | 11,128,000 | |
Western Digital Corp. | 137,200 | 11,822,524 | |
| 37,504,220 | ||
Electronic Equipment & Components - 1.7% | |||
Arrow Electronics, Inc. (a) | 193,800 | 9,957,444 | |
Common Stocks - continued | |||
Shares | Value | ||
INFORMATION TECHNOLOGY - continued | |||
Electronic Equipment & Components - continued | |||
Avnet, Inc. | 222,100 | $ 9,121,647 | |
TE Connectivity Ltd. | 135,400 | 7,651,454 | |
| 26,730,545 | ||
IT Services - 2.3% | |||
Amdocs Ltd. | 376,200 | 16,274,412 | |
EVERTEC, Inc. | 190,000 | 4,584,700 | |
Total System Services, Inc. | 478,500 | 14,297,580 | |
| 35,156,692 | ||
Semiconductors & Semiconductor Equipment - 1.7% | |||
Avago Technologies Ltd. | 82,300 | 4,496,872 | |
Broadcom Corp. Class A | 265,200 | 7,892,352 | |
Maxim Integrated Products, Inc. | 103,200 | 3,122,832 | |
Skyworks Solutions, Inc. (a) | 346,600 | 10,484,650 | |
| 25,996,706 | ||
Software - 2.7% | |||
CA Technologies, Inc. | 426,600 | 13,685,328 | |
Check Point Software Technologies Ltd. (a) | 115,500 | 7,557,165 | |
Symantec Corp. | 458,000 | 9,805,780 | |
Synopsys, Inc. (a) | 280,100 | 11,164,786 | |
| 42,213,059 | ||
TOTAL INFORMATION TECHNOLOGY | 178,393,824 | ||
MATERIALS - 6.0% | |||
Chemicals - 3.1% | |||
Cabot Corp. | 184,200 | 8,965,014 | |
CF Industries Holdings, Inc. | 95,300 | 22,000,958 | |
Eastman Chemical Co. | 216,900 | 16,909,524 | |
| 47,875,496 | ||
Containers & Packaging - 1.0% | |||
Graphic Packaging Holding Co. (a) | 1,601,400 | 15,213,300 | |
Metals & Mining - 0.9% | |||
Reliance Steel & Aluminum Co. | 211,000 | 14,759,450 | |
Paper & Forest Products - 1.0% | |||
International Paper Co. | 331,900 | 15,844,906 | |
TOTAL MATERIALS | 93,693,152 | ||
Common Stocks - continued | |||
Shares | Value | ||
UTILITIES - 10.7% | |||
Electric Utilities - 3.9% | |||
Edison International | 526,300 | $ 25,346,608 | |
Great Plains Energy, Inc. | 31,600 | 779,888 | |
IDACORP, Inc. | 295,100 | 15,560,623 | |
PNM Resources, Inc. | 250,800 | 6,182,220 | |
Xcel Energy, Inc. | 424,700 | 12,278,077 | |
| 60,147,416 | ||
Gas Utilities - 0.9% | |||
Atmos Energy Corp. | 282,200 | 13,548,422 | |
Independent Power Producers & Energy Traders - 1.0% | |||
The AES Corp. | 1,134,500 | 15,951,070 | |
Multi-Utilities - 4.9% | |||
Ameren Corp. | 562,900 | 21,300,136 | |
CMS Energy Corp. | 755,700 | 21,000,903 | |
DTE Energy Co. | 319,200 | 21,775,824 | |
NiSource, Inc. | 363,800 | 12,503,806 | |
| 76,580,669 | ||
TOTAL UTILITIES | 166,227,577 | ||
TOTAL COMMON STOCKS (Cost $1,378,474,916) |
| ||
Money Market Funds - 3.9% | |||
|
|
|
|
Fidelity Cash Central Fund, 0.10% (b) | 14,457,505 | 14,457,505 | |
Fidelity Securities Lending Cash Central Fund, 0.09% (b)(c) | 45,348,950 | 45,348,950 | |
TOTAL MONEY MARKET FUNDS (Cost $59,806,455) |
| ||
TOTAL INVESTMENT PORTFOLIO - 102.5% (Cost $1,438,281,371) | 1,589,396,382 | ||
NET OTHER ASSETS (LIABILITIES) - (2.5)% | (38,710,723) | ||
NET ASSETS - 100% | $ 1,550,685,659 | ||
Legend |
(a) Non-income producing |
(b) Affiliated fund that is generally available only to investment companies and other accounts managed by Fidelity Investments. The rate quoted is the annualized seven-day yield of the fund at period end. A complete unaudited listing of the fund's holdings as of its most recent quarter end is available upon request. In addition, each Fidelity Central Fund's financial statements, which are not covered by the Fund's Report of Independent Registered Public Accounting Firm, are available on the SEC's website or upon request. |
(c) Investment made with cash collateral received from securities on loan. |
(d) Security or a portion of the security is on loan at period end. |
Affiliated Central Funds |
Information regarding fiscal year to date income earned by the Fund from investments in Fidelity Central Funds is as follows: |
Fund | Income earned |
Fidelity Cash Central Fund | $ 23,403 |
Fidelity Securities Lending Cash Central Fund | 89,777 |
Total | $ 113,180 |
Other Information |
All investments are categorized as Level 1 under the Fair Value Hierarchy. The inputs or methodology used for valuing securities may not be an indication of the risk associated with investing in those securities. For more information on valuation inputs, please refer to the Investment Valuation section in the accompanying Notes to Financial Statements. |
Distribution of investments by country or territory of incorporation, as a percentage of total net assets, is as follows (Unaudited): |
United States of America | 88.6% |
Bermuda | 3.4% |
Switzerland | 2.5% |
United Kingdom | 2.2% |
Ireland | 1.1% |
Others (Individually Less Than 1%) | 2.2% |
| 100.0% |
See accompanying notes which are an integral part of the financial statements.
Annual Report
Financial Statements
Statement of Assets and Liabilities
| January 31, 2014 | |
|
|
|
Assets | ||
Investment in securities, at value (including securities loaned of $43,982,931) - See accompanying schedule: Unaffiliated issuers (cost $1,378,474,916) | $ 1,529,589,927 |
|
Fidelity Central Funds (cost $59,806,455) | 59,806,455 |
|
Total Investments (cost $1,438,281,371) |
| $ 1,589,396,382 |
Receivable for investments sold | 13,397,169 | |
Receivable for fund shares sold | 10,264,317 | |
Dividends receivable | 170,018 | |
Distributions receivable from Fidelity Central Funds | 33,858 | |
Prepaid expenses | 3,581 | |
Other receivables | 16,056 | |
Total assets | 1,613,281,381 | |
|
|
|
Liabilities | ||
Payable for investments purchased | $ 13,944,196 | |
Payable for fund shares redeemed | 2,178,523 | |
Accrued management fee | 735,209 | |
Distribution and service plan fees payable | 47,330 | |
Other affiliated payables | 270,564 | |
Other payables and accrued expenses | 70,950 | |
Collateral on securities loaned, at value | 45,348,950 | |
Total liabilities | 62,595,722 | |
|
|
|
Net Assets | $ 1,550,685,659 | |
Net Assets consist of: |
| |
Paid in capital | $ 1,366,380,230 | |
Undistributed net investment income | 435,958 | |
Accumulated undistributed net realized gain (loss) on investments and foreign currency transactions | 32,754,460 | |
Net unrealized appreciation (depreciation) on investments | 151,115,011 | |
Net Assets | $ 1,550,685,659 | |
See accompanying notes which are an integral part of the financial statements.
Annual Report
Statement of Assets and Liabilities - continued
| January 31, 2014 | |
|
|
|
Calculation of Maximum Offering Price Class A: | $ 21.78 | |
|
|
|
Maximum offering price per share (100/94.25 of $21.78) | $ 23.11 | |
Class T: | $ 21.70 | |
|
|
|
Maximum offering price per share (100/96.50 of $21.70) | $ 22.49 | |
Class B: | $ 21.48 | |
|
|
|
Class C: | $ 21.31 | |
|
|
|
Mid Cap Value: | $ 21.96 | |
|
|
|
Institutional Class: | $ 21.84 | |
A Redemption price per share is equal to net asset value less any applicable contingent deferred sales charge.
See accompanying notes which are an integral part of the financial statements.
Annual Report
Financial Statements - continued
Statement of Operations
| Year ended January 31, 2014 | |
|
|
|
Investment Income |
|
|
Dividends |
| $ 28,788,810 |
Interest |
| 64 |
Income from Fidelity Central Funds |
| 113,180 |
Total income |
| 28,902,054 |
|
|
|
Expenses | ||
Management fee | $ 7,073,945 | |
Performance adjustment | 60,558 | |
Transfer agent fees | 2,515,888 | |
Distribution and service plan fees | 392,671 | |
Accounting and security lending fees | 411,663 | |
Custodian fees and expenses | 89,950 | |
Independent trustees' compensation | 5,975 | |
Registration fees | 181,003 | |
Audit | 58,413 | |
Legal | 3,557 | |
Miscellaneous | 7,200 | |
Total expenses before reductions | 10,800,823 | |
Expense reductions | (76,747) | 10,724,076 |
Net investment income (loss) | 18,177,978 | |
Realized and Unrealized Gain (Loss) Net realized gain (loss) on: | ||
Investment securities: |
|
|
Unaffiliated issuers | 168,913,149 | |
Foreign currency transactions | (25,247) | |
Total net realized gain (loss) |
| 168,887,902 |
Change in net unrealized appreciation (depreciation) on investment securities | 69,583,401 | |
Net gain (loss) | 238,471,303 | |
Net increase (decrease) in net assets resulting from operations | $ 256,649,281 | |
See accompanying notes which are an integral part of the financial statements.
Annual Report
Statement of Changes in Net Assets
| Year ended | Year ended |
Increase (Decrease) in Net Assets |
|
|
Operations |
|
|
Net investment income (loss) | $ 18,177,978 | $ 8,506,032 |
Net realized gain (loss) | 168,887,902 | 58,044,668 |
Change in net unrealized appreciation (depreciation) | 69,583,401 | 59,980,492 |
Net increase (decrease) in net assets resulting | 256,649,281 | 126,531,192 |
Distributions to shareholders from net investment income | (15,306,348) | (8,438,509) |
Distributions to shareholders from net realized gain | (113,515,093) | - |
Total distributions | (128,821,441) | (8,438,509) |
Share transactions - net increase (decrease) | 735,344,302 | (21,044,685) |
Redemption fees | 65,786 | 8,162 |
Total increase (decrease) in net assets | 863,237,928 | 97,056,160 |
|
|
|
Net Assets | ||
Beginning of period | 687,447,731 | 590,391,571 |
End of period (including undistributed net investment income of $435,958 and $0, respectively) | $ 1,550,685,659 | $ 687,447,731 |
See accompanying notes which are an integral part of the financial statements.
Annual Report
Financial Highlights - Class A
Years ended January 31, | 2014 | 2013 | 2012 | 2011 | 2010 |
Selected Per-Share Data |
|
|
|
|
|
Net asset value, beginning of period | $ 19.24 | $ 15.87 | $ 16.16 | $ 12.35 | $ 8.53 |
Income from Investment Operations |
|
|
|
|
|
Net investment income (loss) C | .24 | .20 | .07 | - G | .07 |
Net realized and unrealized gain (loss) | 4.29 | 3.38 | (.29) | 3.85 | 3.84 |
Total from investment operations | 4.53 | 3.58 | (.22) | 3.85 | 3.91 |
Distributions from net investment income | (.19) | (.21) | (.07) | (.04) | (.09) |
Distributions from net realized gain | (1.79) | - | - | - | - |
Total distributions | (1.99) H | (.21) | (.07) | (.04) | (.09) |
Redemption fees added to paid in capital C,G | - | - | - | - | - |
Net asset value, end of period | $ 21.78 | $ 19.24 | $ 15.87 | $ 16.16 | $ 12.35 |
Total Return A,B | 23.69% | 22.73% | (1.34)% | 31.14% | 45.79% |
Ratios to Average Net Assets D,F |
|
|
|
|
|
Expenses before reductions | 1.15% | 1.15% | 1.17% | 1.17% | 1.21% |
Expenses net of fee waivers, if any | 1.15% | 1.15% | 1.17% | 1.17% | 1.21% |
Expenses net of all reductions | 1.14% | 1.12% | 1.16% | 1.17% | 1.20% |
Net investment income (loss) | 1.11% | 1.15% | .44% | .02% | .62% |
Supplemental Data |
|
|
|
|
|
Net assets, end of period (000 omitted) | $ 67,826 | $ 24,436 | $ 19,578 | $ 23,608 | $ 10,640 |
Portfolio turnover rate E | 169% | 180% | 173% | 133% | 202% |
A Total returns would have been lower if certain expenses had not been reduced during the applicable periods shown.
B Total returns do not include the effect of the sales charges.
C Calculated based on average shares outstanding during the period.
D Fees and expenses of any underlying Fidelity Central Funds are not included in the Fund's expense ratio. The Fund indirectly bears its proportionate share of the expenses of any underlying Fidelity Central Funds.
E Amount does not include the portfolio activity of any underlying Fidelity Central Funds.
F Expense ratios reflect operating expenses of the class. Expenses before reductions do not reflect amounts reimbursed by the investment adviser or reductions from brokerage service arrangements or reductions from other expense offset arrangements and do not represent the amount paid by the class during periods when reimbursements or reductions occur. Expenses net of fee waivers reflect expenses after reimbursement by the investment adviser but prior to reductions from brokerage service arrangements or other expense offset arrangements. Expenses net of all reductions represent the net expenses paid by the class.
G Amount represents less than $.01 per share.
H Total distributions of $1.99 per share is comprised of distributions from net investment income of $.193 and distributions from net realized gain of $1.793 per share.
See accompanying notes which are an integral part of the financial statements.
Annual Report
Financial Highlights - Class T
Years ended January 31, | 2014 | 2013 | 2012 | 2011 | 2010 |
Selected Per-Share Data |
|
|
|
|
|
Net asset value, beginning of period | $ 19.21 | $ 15.84 | $ 16.14 | $ 12.34 | $ 8.53 |
Income from Investment Operations |
|
|
|
|
|
Net investment income (loss) C | .18 | .15 | .03 | (.03) | .04 |
Net realized and unrealized gain (loss) | 4.27 | 3.38 | (.29) | 3.83 | 3.84 |
Total from investment operations | 4.45 | 3.53 | (.26) | 3.80 | 3.88 |
Distributions from net investment income | (.17) | (.16) | (.04) | - | (.07) |
Distributions from net realized gain | (1.79) | - | - | - | - |
Total distributions | (1.96) | (.16) | (.04) | - | (.07) |
Redemption fees added to paid in capital C,G | - | - | - | - | - |
Net asset value, end of period | $ 21.70 | $ 19.21 | $ 15.84 | $ 16.14 | $ 12.34 |
Total Return A,B | 23.32% | 22.42% | (1.59)% | 30.79% | 45.44% |
Ratios to Average Net Assets D,F |
|
|
|
|
|
Expenses before reductions | 1.42% | 1.42% | 1.43% | 1.43% | 1.47% |
Expenses net of fee waivers, if any | 1.42% | 1.42% | 1.43% | 1.43% | 1.47% |
Expenses net of all reductions | 1.41% | 1.38% | 1.42% | 1.43% | 1.46% |
Net investment income (loss) | .84% | .89% | .18% | (.24)% | .36% |
Supplemental Data |
|
|
|
|
|
Net assets, end of period (000 omitted) | $ 24,136 | $ 8,358 | $ 6,823 | $ 6,993 | $ 4,010 |
Portfolio turnover rate E | 169% | 180% | 173% | 133% | 202% |
A Total returns would have been lower if certain expenses had not been reduced during the applicable periods shown.
B Total returns do not include the effect of the sales charges.
C Calculated based on average shares outstanding during the period.
D Fees and expenses of any underlying Fidelity Central Funds are not included in the Fund's expense ratio. The Fund indirectly bears its proportionate share of the expenses of any underlying Fidelity Central Funds.
E Amount does not include the portfolio activity of any underlying Fidelity Central Funds.
F Expense ratios reflect operating expenses of the class. Expenses before reductions do not reflect amounts reimbursed by the investment adviser or reductions from brokerage service arrangements or reductions from other expense offset arrangements and do not represent the amount paid by the class during periods when reimbursements or reductions occur. Expenses net of fee waivers reflect expenses after reimbursement by the investment adviser but prior to reductions from brokerage service arrangements or other expense offset arrangements. Expenses net of all reductions represent the net expenses paid by the class.
G Amount represents less than $.01 per share.
See accompanying notes which are an integral part of the financial statements.
Annual Report
Financial Highlights - Class B
Years ended January 31, | 2014 | 2013 | 2012 | 2011 | 2010 |
Selected Per-Share Data |
|
|
|
|
|
Net asset value, beginning of period | $ 19.03 | $ 15.71 | $ 16.04 | $ 12.32 | $ 8.53 |
Income from Investment Operations |
|
|
|
|
|
Net investment income (loss) C | .07 | .07 | (.05) | (.10) | (.01) |
Net realized and unrealized gain (loss) | 4.22 | 3.34 | (.28) | 3.82 | 3.82 |
Total from investment operations | 4.29 | 3.41 | (.33) | 3.72 | 3.81 |
Distributions from net investment income | (.05) | (.09) | - | - | (.02) |
Distributions from net realized gain | (1.79) | - | - | - | - |
Total distributions | (1.84) | (.09) | - | - | (.02) |
Redemption fees added to paid in capital C,G | - | - | - | - | - |
Net asset value, end of period | $ 21.48 | $ 19.03 | $ 15.71 | $ 16.04 | $ 12.32 |
Total Return A,B | 22.70% | 21.79% | (2.06)% | 30.19% | 44.61% |
Ratios to Average Net Assets D,F |
|
|
|
|
|
Expenses before reductions | 1.91% | 1.91% | 1.92% | 1.93% | 1.97% |
Expenses net of fee waivers, if any | 1.91% | 1.91% | 1.92% | 1.93% | 1.97% |
Expenses net of all reductions | 1.91% | 1.87% | 1.91% | 1.92% | 1.96% |
Net investment income (loss) | .34% | .40% | (.31)% | (.74)% | (.14)% |
Supplemental Data |
|
|
|
|
|
Net assets, end of period (000 omitted) | $ 2,302 | $ 1,533 | $ 1,376 | $ 1,793 | $ 1,154 |
Portfolio turnover rate E | 169% | 180% | 173% | 133% | 202% |
A Total returns would have been lower if certain expenses had not been reduced during the applicable periods shown.
B Total returns do not include the effect of the contingent deferred sales charge.
C Calculated based on average shares outstanding during the period.
D Fees and expenses of any underlying Fidelity Central Funds are not included in the Fund's expense ratio. The Fund indirectly bears its proportionate share of the expenses of any underlying Fidelity Central Funds.
E Amount does not include the portfolio activity of any underlying Fidelity Central Funds.
F Expense ratios reflect operating expenses of the class. Expenses before reductions do not reflect amounts reimbursed by the investment adviser or reductions from brokerage service arrangements or reductions from other expense offset arrangements and do not represent the amount paid by the class during periods when reimbursements or reductions occur. Expenses net of fee waivers reflect expenses after reimbursement by the investment adviser but prior to reductions from brokerage service arrangements or other expense offset arrangements. Expenses net of all reductions represent the net expenses paid by the class.
G Amount represents less than $.01 per share.
See accompanying notes which are an integral part of the financial statements.
Annual Report
Financial Highlights - Class C
Years ended January 31, | 2014 | 2013 | 2012 | 2011 | 2010 |
Selected Per-Share Data |
|
|
|
|
|
Net asset value, beginning of period | $ 18.93 | $ 15.65 | $ 15.98 | $ 12.27 | $ 8.50 |
Income from Investment Operations |
|
|
|
|
|
Net investment income (loss) C | .08 | .07 | (.05) | (.10) | (.01) |
Net realized and unrealized gain (loss) | 4.20 | 3.32 | (.28) | 3.81 | 3.80 |
Total from investment operations | 4.28 | 3.39 | (.33) | 3.71 | 3.79 |
Distributions from net investment income | (.11) | (.11) | - | - | (.02) |
Distributions from net realized gain | (1.79) | - | - | - | - |
Total distributions | (1.90) | (.11) | - | - | (.02) |
Redemption fees added to paid in capital C,G | - | - | - | - | - |
Net asset value, end of period | $ 21.31 | $ 18.93 | $ 15.65 | $ 15.98 | $ 12.27 |
Total Return A,B | 22.77% | 21.73% | (2.07)% | 30.24% | 44.56% |
Ratios to Average Net Assets D,F |
|
|
|
|
|
Expenses before reductions | 1.89% | 1.91% | 1.92% | 1.93% | 1.96% |
Expenses net of fee waivers, if any | 1.89% | 1.91% | 1.92% | 1.93% | 1.96% |
Expenses net of all reductions | 1.89% | 1.87% | 1.91% | 1.92% | 1.95% |
Net investment income (loss) | .36% | .40% | (.31)% | (.73)% | (.13)% |
Supplemental Data |
|
|
|
|
|
Net assets, end of period (000 omitted) | $ 25,177 | $ 6,820 | $ 5,000 | $ 5,309 | $ 2,293 |
Portfolio turnover rate E | 169% | 180% | 173% | 133% | 202% |
A Total returns would have been lower if certain expenses had not been reduced during the applicable periods shown.
B Total returns do not include the effect of the contingent deferred sales charge.
C Calculated based on average shares outstanding during the period.
D Fees and expenses of any underlying Fidelity Central Funds are not included in the Fund's expense ratio. The Fund indirectly bears its proportionate share of the expenses of any underlying Fidelity Central Funds.
E Amount does not include the portfolio activity of any underlying Fidelity Central Funds.
F Expense ratios reflect operating expenses of the class. Expenses before reductions do not reflect amounts reimbursed by the investment adviser or reductions from brokerage service arrangements or reductions from other expense offset arrangements and do not represent the amount paid by the class during periods when reimbursements or reductions occur. Expenses net of fee waivers reflect expenses after reimbursement by the investment adviser but prior to reductions from brokerage service arrangements or other expense offset arrangements. Expenses net of all reductions represent the net expenses paid by the class.
G Amount represents less than $.01 per share.
See accompanying notes which are an integral part of the financial statements.
Annual Report
Financial Highlights - Mid Cap Value
Years ended January 31, | 2014 | 2013 | 2012 | 2011 | 2010 |
Selected Per-Share Data |
|
|
|
|
|
Net asset value, beginning of period | $ 19.37 | $ 15.97 | $ 16.26 | $ 12.41 | $ 8.57 |
Income from Investment Operations |
|
|
|
|
|
Net investment income (loss) B | .32 | .25 | .12 | .04 | .09 |
Net realized and unrealized gain (loss) | 4.31 | 3.41 | (.30) | 3.87 | 3.86 |
Total from investment operations | 4.63 | 3.66 | (.18) | 3.91 | 3.95 |
Distributions from net investment income | (.25) | (.26) | (.11) | (.06) | (.11) |
Distributions from net realized gain | (1.79) | - | - | - | - |
Total distributions | (2.04) | (.26) | (.11) | (.06) | (.11) |
Redemption fees added to paid in capital B,F | - | - | - | - | - |
Net asset value, end of period | $ 21.96 | $ 19.37 | $ 15.97 | $ 16.26 | $ 12.41 |
Total Return A | 24.08% | 23.07% | (1.04)% | 31.51% | 46.06% |
Ratios to Average Net Assets C,E |
|
|
|
|
|
Expenses before reductions | .80% | .85% | .88% | .91% | .95% |
Expenses net of fee waivers, if any | .80% | .85% | .88% | .91% | .95% |
Expenses net of all reductions | .80% | .81% | .87% | .90% | .94% |
Net investment income (loss) | 1.45% | 1.46% | .73% | .28% | .88% |
Supplemental Data |
|
|
|
|
|
Net assets, end of period (000 omitted) | $ 1,404,968 | $ 638,425 | $ 553,947 | $ 666,277 | $ 469,476 |
Portfolio turnover rate D | 169% | 180% | 173% | 133% | 202% |
A Total returns would have been lower if certain expenses had not been reduced during the applicable periods shown.
B Calculated based on average shares outstanding during the period.
C Fees and expenses of any underlying Fidelity Central Funds are not included in the Fund's expense ratio. The Fund indirectly bears its proportionate share of the expenses of any underlying Fidelity Central Funds.
D Amount does not include the portfolio activity of any underlying Fidelity Central Funds.
E Expense ratios reflect operating expenses of the class. Expenses before reductions do not reflect amounts reimbursed by the investment adviser or reductions from brokerage service arrangements or reductions from other expense offset arrangements and do not represent the amount paid by the class during periods when reimbursements or reductions occur. Expenses net of fee waivers reflect expenses after reimbursement by the investment adviser but prior to reductions from brokerage service arrangements or other expense offset arrangements. Expenses net of all reductions represent the net expenses paid by the class.
F Amount represents less than $.01 per share.
See accompanying notes which are an integral part of the financial statements.
Annual Report
Financial Highlights - Institutional Class
Years ended January 31, | 2014 | 2013 | 2012 | 2011 | 2010 |
Selected Per-Share Data |
|
|
|
|
|
Net asset value, beginning of period | $ 19.29 | $ 15.91 | $ 16.20 | $ 12.36 | $ 8.54 |
Income from Investment Operations |
|
|
|
|
|
Net investment income (loss) B | .31 | .24 | .11 | .04 | .10 |
Net realized and unrealized gain (loss) | 4.28 | 3.40 | (.29) | 3.85 | 3.84 |
Total from investment operations | 4.59 | 3.64 | (.18) | 3.89 | 3.94 |
Distributions from net investment income | (.25) | (.26) | (.11) | (.05) | (.12) |
Distributions from net realized gain | (1.79) | - | - | - | - |
Total distributions | (2.04) | (.26) | (.11) | (.05) | (.12) |
Redemption fees added to paid in capital B,F | - | - | - | - | - |
Net asset value, end of period | $ 21.84 | $ 19.29 | $ 15.91 | $ 16.20 | $ 12.36 |
Total Return A | 23.98% | 23.05% | (1.07)% | 31.51% | 46.12% |
Ratios to Average Net Assets C,E |
|
|
|
|
|
Expenses before reductions | .85% | .89% | .91% | .92% | .96% |
Expenses net of fee waivers, if any | .85% | .89% | .91% | .92% | .96% |
Expenses net of all reductions | .85% | .85% | .90% | .92% | .95% |
Net investment income (loss) | 1.40% | 1.42% | .71% | .27% | .87% |
Supplemental Data |
|
|
|
|
|
Net assets, end of period (000 omitted) | $ 26,277 | $ 7,875 | $ 3,667 | $ 3,507 | $ 3,162 |
Portfolio turnover rate D | 169% | 180% | 173% | 133% | 202% |
A Total returns would have been lower if certain expenses had not been reduced during the applicable periods shown.
B Calculated based on average shares outstanding during the period.
C Fees and expenses of any underlying Fidelity Central Funds are not included in the Fund's expense ratio. The Fund indirectly bears its proportionate share of the expenses of any underlying Fidelity Central Funds.
D Amount does not include the portfolio activity of any underlying Fidelity Central Funds.
E Expense ratios reflect operating expenses of the class. Expenses before reductions do not reflect amounts reimbursed by the investment adviser or reductions from brokerage service arrangements or reductions from other expense offset arrangements and do not represent the amount paid by the class during periods when reimbursements or reductions occur. Expenses net of fee waivers reflect expenses after reimbursement by the investment adviser but prior to reductions from brokerage service arrangements or other expense offset arrangements. Expenses net of all reductions represent the net expenses paid by the class.
F Amount represents less than $.01 per share.
See accompanying notes which are an integral part of the financial statements.
Annual Report
Notes to Financial Statements
For the period ended January 31, 2014
1. Organization.
Fidelity Mid Cap Value Fund (the Fund) is a fund of Fidelity Devonshire Trust (the Trust) and is authorized to issue an unlimited number of shares. The Trust is registered under the Investment Company Act of 1940, as amended (the 1940 Act), as an open-end management investment company organized as a Massachusetts business trust. The Fund offers Class A, Class T, Class C, Mid Cap Value and Institutional Class shares, each of which, along with Class B shares, has equal rights as to assets and voting privileges. Class B shares are closed to new accounts and additional purchases, except for exchanges and reinvestments. Each class has exclusive voting rights with respect to matters that affect that class. Class B shares will automatically convert to Class A shares after a holding period of seven years from the initial date of purchase.
2. Investments in Fidelity Central Funds.
The Fund invests in Fidelity Central Funds, which are open-end investment companies generally available only to other investment companies and accounts managed by the investment adviser and its affiliates. The Fund's Schedule of Investments lists each of the Fidelity Central Funds held as of period end, if any, as an investment of the Fund, but does not include the underlying holdings of each Fidelity Central Fund. As an Investing Fund, the Fund indirectly bears its proportionate share of the expenses of the underlying Fidelity Central Funds.
The Money Market Central Funds seek preservation of capital and current income and are managed by Fidelity Investments Money Management, Inc. (FIMM), an affiliate of the investment adviser. Annualized expenses of the Money Market Central Funds as of their most recent shareholder report date are less than .01%.
A complete unaudited list of holdings for each Fidelity Central Fund is available upon request or at the Securities and Exchange Commission (the SEC) website at www.sec.gov. In addition, the financial statements of the Fidelity Central Funds, which are not covered by the Fund's Report of Independent Registered Public Accounting Firm, are available on the SEC website or upon request.
3. Significant Accounting Policies.
The financial statements have been prepared in conformity with accounting principles generally accepted in the United States of America (GAAP), which require management to make certain estimates and assumptions at the date of the financial statements. Actual results could differ from those estimates. Subsequent events, if any, through the date that the financial statements were issued have been evaluated in the preparation of the financial statements. The following summarizes the significant accounting policies of the Fund:
Annual Report
Notes to Financial Statements - continued
3. Significant Accounting Policies - continued
Investment Valuation. Investments are valued as of 4:00 p.m. Eastern time on the last calendar day of the period. In accordance with valuation policies and procedures approved by the Board of Trustees (the Board), the Fund attempts to obtain prices from one or more third party pricing vendors or brokers to value its investments. When current market prices, quotations or currency exchange rates are not readily available or reliable, investments will be fair valued in good faith by the Fidelity Management & Research Company (FMR) Fair Value Committee (the Committee), in accordance with procedures adopted by the Board. Factors used in determining fair value vary by investment type and may include market or investment specific events. The frequency with which these procedures are used cannot be predicted and they may be utilized to a significant extent. The Committee oversees the Fund's valuation policies and procedures and is responsible for approving and reporting to the Board all fair value determinations.
The Fund categorizes the inputs to valuation techniques used to value its investments into a disclosure hierarchy consisting of three levels as shown below:
Level 1 - quoted prices in active markets for identical investments
Level 2 - other significant observable inputs (including quoted prices for similar investments, interest rates, prepayment speeds, etc.)
Level 3 - unobservable inputs (including the Fund's own assumptions based on the best information available)
Valuation techniques used to value the Fund's investments by major category are as follows:
Equity securities, including restricted securities, for which market quotations are readily available, are valued at the last reported sale price or official closing price as reported by a third party pricing vendor on the primary market or exchange on which they are traded and are categorized as Level 1 in the hierarchy. In the event there were no sales during the day or closing prices are not available, securities are valued at the last quoted bid price or may be valued using the last available price and are generally categorized as Level 2 in the hierarchy. For foreign equity securities, when market or security specific events arise, comparisons to the valuation of American Depositary Receipts (ADRs), futures contracts, Exchange-Traded Funds (ETFs) and certain indexes as well as quoted prices for similar securities may be used and would be categorized as Level 2 in the hierarchy. Utilizing these techniques may result in transfers between Level 1 and Level 2. For equity securities, including restricted securities, where observable inputs are limited, assumptions about market activity and risk are used and these securities may be categorized as Level 3 in the hierarchy.
Annual Report
3. Significant Accounting Policies - continued
Investment Valuation - continued
Investments in open-end mutual funds, including the Fidelity Central Funds, are valued at their closing net asset value (NAV) each business day and are categorized as Level 1 in the hierarchy.
Changes in valuation techniques may result in transfers in or out of an assigned level within the disclosure hierarchy.
Foreign Currency. The Fund may use foreign currency contracts to facilitate transactions in foreign-denominated securities. Gains and losses from these transactions may arise from changes in the value of the foreign currency or if the counterparties do not perform under the contracts' terms.
Foreign-denominated assets, including investment securities, and liabilities are translated into U.S. dollars at the exchange rates at period end. Purchases and sales of investment securities, income and dividends received and expenses denominated in foreign currencies are translated into U.S. dollars at the exchange rate in effect on the transaction date.
The effects of exchange rate fluctuations on investments are included with the net realized and unrealized gain (loss) on investment securities. Other foreign currency transactions resulting in realized and unrealized gain (loss) are disclosed separately.
Investment Transactions and Income. For financial reporting purposes, the Fund's investment holdings and NAV include trades executed through the end of the last business day of the period. The NAV per share for processing shareholder transactions is calculated as of the close of business of the New York Stock Exchange (NYSE), normally 4:00 p.m. Eastern time and includes trades executed through the end of the prior business day. Gains and losses on securities sold are determined on the basis of identified cost and may include proceeds received from litigation. Dividend income is recorded on the ex-dividend date, except for certain dividends from foreign securities where the ex-dividend date may have passed, which are recorded as soon as the Fund is informed of the ex-dividend date. Non-cash dividends included in dividend income, if any, are recorded at the fair market value of the securities received. Distributions received on securities that represent a return of capital or capital gain are recorded as a reduction of cost of investments and/or as a realized gain. Subsequent to ex-dividend date the Fund determines the components of these distributions, based upon receipt of tax filings or other correspondence relating to the underlying investment. Interest income and distributions from the Fidelity Central Funds are accrued as earned. Interest income includes coupon interest and amortization of premium and accretion of discount on debt securities. Investment income is recorded net of foreign taxes withheld where recovery of such taxes is uncertain.
Annual Report
Notes to Financial Statements - continued
3. Significant Accounting Policies - continued
Class Allocations and Expenses. Investment income, realized and unrealized capital gains and losses, common expenses of the Fund, and certain fund-level expense reductions, if any, are allocated daily on a pro-rata basis to each class based on the relative net assets of each class to the total net assets of the Fund. Each class differs with respect to transfer agent and distribution and service plan fees incurred. Certain expense reductions may also differ by class. For the reporting period, the allocated portion of income and expenses to each class as a percent of its average net assets may vary due to the timing of recording these transactions in relation to fluctuating net assets of the classes. Expenses directly attributable to a fund are charged to that fund. Expenses attributable to more than one fund are allocated among the respective funds on the basis of relative net assets or other appropriate methods. Expense estimates are accrued in the period to which they relate and adjustments are made when actual amounts are known.
Income Tax Information and Distributions to Shareholders. Each year, the Fund intends to qualify as a regulated investment company under Subchapter M of the Internal Revenue Code, including distributing substantially all of its taxable income and realized gains. As a result, no provision for U.S. Federal income taxes is required. As of January 31, 2014, the Fund did not have any unrecognized tax benefits in the financial statements; nor is the Fund aware of any tax positions for which it is reasonably possible that the total amounts of unrecognized tax benefits will significantly change in the next twelve months. The Fund files a U.S. federal tax return, in addition to state and local tax returns as required. The Fund's federal income tax returns are subject to examination by the Internal Revenue Service (IRS) for a period of three fiscal years after they are filed. State and local tax returns may be subject to examination for an additional fiscal year depending on the jurisdiction. Foreign taxes are provided for based on the Fund's understanding of the tax rules and rates that exist in the foreign markets in which it invests.
Distributions are declared and recorded on the ex-dividend date. Income dividends and capital gain distributions are declared separately for each class. Income and capital gain distributions are determined in accordance with income tax regulations, which may differ from GAAP. In addition, the Fund claimed a portion of the payment made to redeeming shareholders as a distribution for income tax purposes.
Capital accounts within the financial statements are adjusted for permanent book-tax differences. These adjustments have no impact on net assets or the results of operations. Capital accounts are not adjusted for temporary book-tax differences which will reverse in a subsequent period.
Book-tax differences are primarily due to partnerships, foreign currency transactions, capital loss carryforwards and losses deferred due to wash sales and excise tax regulations.
Annual Report
3. Significant Accounting Policies - continued
Income Tax Information and Distributions to Shareholders - continued
The federal tax cost of investment securities and unrealized appreciation (depreciation) as of period end were as follows:
Gross unrealized appreciation | $ 184,053,049 |
Gross unrealized depreciation | (33,814,413) |
Net unrealized appreciation (depreciation) on securities and other investments | $ 150,238,636 |
|
|
Tax Cost | $ 1,439,157,746 |
The tax-based components of distributable earnings as of period end were as follows:
Undistributed ordinary income | $ 29,168,718 |
Undistributed long-term capital gain | $ 4,898,076 |
Net unrealized appreciation (depreciation) | $ 150,238,636 |
The tax character of distributions paid was as follows:
| January 31, 2014 | January 31, 2013 |
Ordinary Income | $ 97,039,748 | $ 8,438,509 |
Long-term Capital Gains | 31,781,693 | - |
Total | $ 128,821,441 | $ 8,438,509 |
Short-Term Trading (Redemption) Fees. Shares held by investors in the Fund less than 30 days may have been subject to a redemption fee equal to .75% of the NAV of shares redeemed. All redemption fees, which reduce the proceeds of the shareholder redemption, are retained by the Fund and accounted for as an addition to paid in capital.
4. Purchases and Sales of Investments.
Purchases and sales of securities, other than short-term securities, aggregated $2,712,269,364 and $2,096,788,012, respectively.
5. Fees and Other Transactions with Affiliates.
Management Fee. Fidelity Management & Research Company (the investment adviser) and its affiliates provide the Fund with investment management related services for which the Fund pays a monthly management fee. The management fee is the sum of an individual fund fee rate that is based on an annual rate of .30% of the Fund's average net assets and an annualized group fee rate that averaged .25% during the period. The group fee rate is based upon the average net assets of all the mutual funds
Annual Report
Notes to Financial Statements - continued
5. Fees and Other Transactions with Affiliates - continued
Management Fee - continued
advised by the investment adviser, including any mutual funds previously advised by the investment adviser that are currently advised by Fidelity SelectCo, LLC, an affiliate of the investment adviser. The group fee rate decreases as assets under management increase and increases as assets under management decrease. In addition, the management fee is subject to a performance adjustment (up to a maximum of ± .20% of the Fund's average net assets over a 36 month performance period). The upward or downward adjustment to the management fee is based on the relative investment performance of Mid Cap Value as compared to its benchmark index, the Russell Midcap Value Index, over the same 36 month performance period. For the reporting period, the total annual management fee rate, including the performance adjustment, was .56% of the Fund's average net assets. The performance adjustment included in the management fee rate may be higher or lower than the maximum performance adjustment rate due to the difference between the average net assets for the reporting and performance periods.
Distribution and Service Plan Fees. In accordance with Rule 12b-1 of the 1940 Act, the Fund has adopted separate Distribution and Service Plans for each class of shares. Certain classes pay Fidelity Distributors Corporation (FDC), an affiliate of the investment adviser, separate Distribution and Service Fees, each of which is based on an annual percentage of each class' average net assets. In addition, FDC may pay financial intermediaries for selling shares of the Fund and providing shareholder support services. For the period, the Distribution and Service Fee rates, total fees and amounts retained by FDC were as follows:
| Distribution | Service | Total Fees | Retained |
Class A | -% | .25% | $ 128,923 | $ 11,198 |
Class T | .25% | .25% | 81,928 | 6,010 |
Class B | .75% | .25% | 19,848 | 15,164 |
Class C | .75% | .25% | 161,972 | 55,405 |
|
|
| $ 392,671 | $ 87,777 |
Sales Load. FDC may receive a front-end sales charge of up to 5.75% for selling Class A shares and 3.50% for selling Class T shares, some of which is paid to financial intermediaries for selling shares of the Fund. Depending on the holding period, FDC may receive contingent deferred sales charges levied on Class A, Class T, Class B, and Class C redemptions. The deferred sales charges range from 5.00% to 1.00% for Class B shares, 1.00% for Class C shares, 1.00% for certain purchases of Class A shares and .25% for certain purchases of Class T shares.
Annual Report
5. Fees and Other Transactions with Affiliates - continued
Sales Load - continued
For the period, sales charge amounts retained by FDC were as follows:
| Retained |
Class A | $ 77,911 |
Class T | 15,473 |
Class B* | 2,172 |
Class C* | 2,495 |
| $ 98,051 |
* When Class B and Class C shares are initially sold, FDC pays commissions from its own resources to financial intermediaries through which the sales are made.
Transfer Agent Fees. Fidelity Investments Institutional Operations Company, Inc., (FIIOC), an affiliate of the investment adviser, is the transfer, dividend disbursing and shareholder servicing agent for each class of the Fund. FIIOC receives account fees and asset-based fees that vary according to the account size and type of account of the shareholders of the respective classes of the Fund. FIIOC pays for typesetting, printing and mailing of shareholder reports, except proxy statements. For the period, transfer agent fees for each class were as follows:
| Amount | % of |
Class A | $ 148,427 | .29 |
Class T | 50,447 | .31 |
Class B | 6,015 | .30 |
Class C | 46,001 | .28 |
Mid Cap Value | 2,226,404 | .19 |
Institutional Class | 38,594 | .24 |
| $ 2,515,888 |
|
Accounting and Security Lending Fees. Fidelity Service Company, Inc. (FSC), an affiliate of the investment adviser, maintains the Fund's accounting records. The accounting fee is based on the level of average net assets for each month. Under a separate contract, FSC administers the security lending program. The security lending fee is based on the number and duration of lending transactions.
Brokerage Commissions. The Fund placed a portion of its portfolio transactions with brokerage firms which are affiliates of the investment adviser. Brokerage commissions are included in net realized gain (loss) and change in net unrealized appreciation (depreciation) in the Statement of Operations. The commissions paid to these affiliated firms were $84,397 for the period.
Annual Report
Notes to Financial Statements - continued
6. Committed Line of Credit.
The Fund participates with other funds managed by the investment adviser or an affiliate in a $4.25 billion credit facility (the "line of credit") to be utilized for temporary or emergency purposes to fund shareholder redemptions or for other short-term liquidity purposes. The Fund has agreed to pay commitment fees on its pro-rata portion of the line of credit, which amounted to $1,644 and is reflected in Miscellaneous expenses on the Statement of Operations. During the period, there were no borrowings on this line of credit.
7. Security Lending.
The Fund lends portfolio securities through a lending agent from time to time in order to earn additional income. For equity securities, a lending agent is used and may loan securities to certain qualified borrowers, including Fidelity Capital Markets (FCM), a broker-dealer affiliated with the Fund. On the settlement date of the loan, the Fund receives collateral (in the form of U.S. Treasury obligations, letters of credit and/or cash) against the loaned securities and maintains collateral in an amount not less than 100% of the market value of the loaned securities during the period of the loan. The market value of the loaned securities is determined at the close of business of the Fund and any additional required collateral is delivered to the Fund on the next business day. If the borrower defaults on its obligation to return the securities loaned because of insolvency or other reasons, the Fund may apply collateral received from the borrower against the obligation. The Fund may experience delays and costs in recovering the securities loaned. Any cash collateral received is invested in the Fidelity Securities Lending Cash Central Fund. The value of loaned securities and cash collateral at period end are disclosed on the Fund's Statement of Assets and Liabilities. At period end, there were no security loans outstanding with FCM. Security lending income represents the income earned on investing cash collateral, less rebates paid to borrowers and any lending agent fees associated with the loan, plus any premium payments received for lending certain types of securities. Security lending income is presented in the Statement of Operations as a component of income from Fidelity Central Funds. Total security lending income during the period amounted to $89,777, including $12,095 from securities loaned to FCM.
8. Expense Reductions.
Commissions paid to certain brokers with whom the investment adviser, or its affiliates, places trades on behalf of the Fund include an amount in addition to trade execution, which may be rebated back to the Fund to offset certain expenses. This amount totaled $61,188 for the period. Through arrangements with the Fund's custodian, credits realized as a result of uninvested cash balances were used to reduce the Fund's expenses. During the period, these credits reduced the Fund's custody expenses by $42.
In addition, the investment adviser reimbursed a portion of the Fund's operating expenses during the period in the amount of $15,517.
Annual Report
9. Distributions to Shareholders.
Distributions to shareholders of each class were as follows:
Years ended January 31, | 2014 | 2013 |
From net investment income |
|
|
Class A | $ 530,640 | $ 253,117 |
Class T | 161,696 | 66,091 |
Class B | 4,861 | 7,351 |
Class C | 110,531 | 38,428 |
Mid Cap Value | 14,250,519 | 7,992,338 |
Institutional Class | 248,101 | 81,184 |
Total | $ 15,306,348 | $ 8,438,509 |
From net realized gain |
|
|
Class A | $ 4,929,724 | $ - |
Class T | 1,757,088 | - |
Class B | 177,882 | - |
Class C | 1,834,950 | - |
Mid Cap Value | 103,028,925 | - |
Institutional Class | 1,786,524 | - |
Total | $ 113,515,093 | $ - |
10. Share Transactions.
Transactions for each class of shares were as follows:
| Shares | Dollars | ||
Years ended January 31, | 2014 | 2013 | 2014 | 2013 |
Class A |
|
|
|
|
Shares sold | 2,457,916 | 457,731 | $ 52,076,305 | $ 7,879,366 |
Reinvestment of distributions | 241,636 | 13,590 | 5,178,254 | 235,643 |
Shares redeemed | (854,915) | (434,657) | (18,574,514) | (7,246,773) |
Net increase (decrease) | 1,844,637 | 36,664 | $ 38,680,045 | $ 868,236 |
Class T |
|
|
|
|
Shares sold | 800,279 | 155,888 | $ 17,075,459 | $ 2,678,394 |
Reinvestment of distributions | 89,099 | 3,790 | 1,903,163 | 65,644 |
Shares redeemed | (212,274) | (155,220) | (4,598,389) | (2,624,883) |
Net increase (decrease) | 677,104 | 4,458 | $ 14,380,233 | $ 119,155 |
Class B |
|
|
|
|
Shares sold | 43,830 | 10,295 | $ 911,529 | $ 177,345 |
Reinvestment of distributions | 8,260 | 397 | 174,775 | 6,824 |
Shares redeemed | (25,492) | (17,720) | (538,771) | (295,503) |
Net increase (decrease) | 26,598 | (7,028) | $ 547,533 | $ (111,334) |
Annual Report
Notes to Financial Statements - continued
10. Share Transactions - continued
| Shares | Dollars | ||
Years ended January 31, | 2014 | 2013 | 2014 | 2013 |
Class C |
|
|
|
|
Shares sold | 893,750 | 137,133 | $ 18,935,706 | $ 2,295,740 |
Reinvestment of distributions | 88,255 | 2,090 | 1,852,478 | 35,705 |
Shares redeemed | (160,748) | (98,602) | (3,440,149) | (1,645,075) |
Net increase (decrease) | 821,257 | 40,621 | $ 17,348,035 | $ 686,370 |
Mid Cap Value |
|
|
|
|
Shares sold | 42,202,723 | 6,300,912 | $ 892,720,042 | $ 110,558,662 |
Reinvestment of distributions | 5,185,864 | 443,673 | 112,014,623 | 7,742,097 |
Shares redeemed | (16,376,666) | (8,477,007) | (357,731,128) | (144,053,750) |
Net increase (decrease) | 31,011,921 | (1,732,422) | $ 647,003,537 | $ (25,752,991) |
Institutional Class |
|
|
|
|
Shares sold | 942,589 | 281,696 | $ 20,627,562 | $ 4,930,560 |
Reinvestment of distributions | 87,006 | 4,459 | 1,869,755 | 77,497 |
Shares redeemed | (234,974) | (108,318) | (5,112,398) | (1,862,178) |
Net increase (decrease) | 794,621 | 177,837 | $ 17,384,919 | $ 3,145,879 |
11. Other.
The Fund's organizational documents provide former and current trustees and officers with a limited indemnification against liabilities arising in connection with the performance of their duties to the Fund. In the normal course of business, the Fund may also enter into contracts that provide general indemnifications. The Fund's maximum exposure under these arrangements is unknown as this would be dependent on future claims that may be made against the Fund. The risk of material loss from such claims is considered remote.
Annual Report
Report of Independent Registered Public Accounting Firm
To the Trustees of Fidelity Devonshire Trust and the Shareholders of Fidelity Mid Cap Value Fund:
In our opinion, the accompanying statement of assets and liabilities, including the schedule of investments, and the related statements of operations and of changes in net assets and the financial highlights present fairly, in all material respects, the financial position of Fidelity Mid Cap Value Fund (a fund of Fidelity Devonshire Trust) at January 31, 2014, the results of its operations for the year then ended, the changes in its net assets for each of the two years in the period then ended and the financial highlights for each of the five years in the period then ended, in conformity with accounting principles generally accepted in the United States of America. These financial statements and financial highlights (hereafter referred to as "financial statements") are the responsibility of the Fidelity Mid Cap Value Fund's management. Our responsibility is to express an opinion on these financial statements based on our audits. We conducted our audits of these financial statements in accordance with the standards of the Public Company Accounting Oversight Board (United States). Those standards require that we plan and perform the audit to obtain reasonable assurance about whether the financial statements are free of material misstatement. An audit includes examining, on a test basis, evidence supporting the amounts and disclosures in the financial statements, assessing the accounting principles used and significant estimates made by management, and evaluating the overall financial statement presentation. We believe that our audits, which included confirmation of securities at January 31, 2014 by correspondence with the custodian and brokers, provide a reasonable basis for our opinion.
PricewaterhouseCoopers LLP
Boston, Massachusetts
March 14, 2014
Annual Report
Trustees and Officers
The Trustees, Member of the Advisory Board, and officers of the trust and fund, as applicable, are listed below. The Board of Trustees governs the fund and is responsible for protecting the interests of shareholders. The Trustees are experienced executives who meet periodically throughout the year to oversee the fund's activities, review contractual arrangements with companies that provide services to the fund, oversee management of the risks associated with such activities and contractual arrangements, and review the fund's performance. Except for James C. Curvey, Ned C. Lautenbach, and William S. Stavropoulos, each of the Trustees oversees 173 funds. Mr. Curvey oversees 396 funds. Mr. Lautenbach and Mr. Stavropoulos each oversees 247 funds.
The Trustees hold office without limit in time except that (a) any Trustee may resign; (b) any Trustee may be removed by written instrument, signed by at least two-thirds of the number of Trustees prior to such removal; (c) any Trustee who requests to be retired or who has become incapacitated by illness or injury may be retired by written instrument signed by a majority of the other Trustees; and (d) any Trustee may be removed at any special meeting of shareholders by a two-thirds vote of the outstanding voting securities of the trust. Each Trustee who is not an interested person (as defined in the 1940 Act) of the trust and the fund (Independent Trustee), shall retire not later than the last day of the calendar year in which his or her 75th birthday occurs. The Independent Trustees may waive this mandatory retirement age policy with respect to individual Trustees. The officers and Advisory Board Member hold office without limit in time, except that any officer and Advisory Board Member may resign or may be removed by a vote of a majority of the Trustees at any regular meeting or any special meeting of the Trustees. Except as indicated, each individual has held the office shown or other offices in the same company for the past five years.
Experience, Skills, Attributes, and Qualifications of the Fund's Trustees. The Governance and Nominating Committee has adopted a statement of policy that describes the experience, qualifications, attributes, and skills that are necessary and desirable for potential Independent Trustee candidates (Statement of Policy). The Board believes that each Trustee satisfied at the time he or she was initially elected or appointed a Trustee, and continues to satisfy, the standards contemplated by the Statement of Policy. The Governance and Nominating Committee also engages professional search firms to help identify potential Independent Trustee candidates who have the experience, qualifications, attributes, and skills consistent with the Statement of Policy. From time to time, additional criteria based on the composition and skills of the current Independent Trustees, as well as experience or skills that may be appropriate in light of future changes to board composition, business conditions, and regulatory or other developments, have also been considered by the professional search firms and the Governance and Nominating Committee. In addition, the Board takes into account the Trustees' commitment and participation in Board and committee meetings, as well as their leadership of standing and ad hoc committees throughout their tenure.
Annual Report
In determining that a particular Trustee was and continues to be qualified to serve as a Trustee, the Board has considered a variety of criteria, none of which, in isolation, was controlling. The Board believes that, collectively, the Trustees have balanced and diverse experience, qualifications, attributes, and skills, which allow the Board to operate effectively in governing the fund and protecting the interests of shareholders. Information about the specific experience, skills, attributes, and qualifications of each Trustee, which in each case led to the Board's conclusion that the Trustee should serve (or continue to serve) as a trustee of the fund, is provided below.
Board Structure and Oversight Function. James C. Curvey is an interested person (as defined in the 1940 Act) and currently serves as Chairman. The Trustees have determined that an interested Chairman is appropriate and benefits shareholders because an interested Chairman has a personal and professional stake in the quality and continuity of services provided to the fund. Independent Trustees exercise their informed business judgment to appoint an individual of their choosing to serve as Chairman, regardless of whether the Trustee happens to be independent or a member of management. The Independent Trustees have determined that they can act independently and effectively without having an Independent Trustee serve as Chairman and that a key structural component for assuring that they are in a position to do so is for the Independent Trustees to constitute a substantial majority for the Board. The Independent Trustees also regularly meet in executive session. Ned C. Lautenbach serves as Chairman of the Independent Trustees and as such (i) acts as a liaison between the Independent Trustees and management with respect to matters important to the Independent Trustees and (ii) with management prepares agendas for Board meetings.
Fidelity funds are overseen by different Boards of Trustees. The fund's Board oversees Fidelity's equity and high income funds and another Board oversees Fidelity's investment-grade bond, money market, and asset allocation funds. The asset allocation funds may invest in Fidelity funds overseen by the fund's Board. The use of separate Boards, each with its own committee structure, allows the Trustees of each group of Fidelity funds to focus on the unique issues of the funds they oversee, including common research, investment, and operational issues. On occasion, the separate Boards establish joint committees to address issues of overlapping consequences for the Fidelity funds overseen by each Board.
The Trustees operate using a system of committees to facilitate the timely and efficient consideration of all matters of importance to the Trustees, the fund, and fund shareholders and to facilitate compliance with legal and regulatory requirements and oversight of the fund's activities and associated risks. The Board, acting through its committees, has charged FMR and its affiliates with (i) identifying events or circumstances the occurrence of which could have demonstrably adverse effects on the fund's business and/or reputation; (ii) implementing processes and controls to lessen the possibility that such events or circumstances occur or to mitigate the effects of such events or circumstances if they do occur; and (iii) creating and maintaining a system designed to evaluate continuously business and market conditions in order to facilitate the identification and implementation processes described in (i) and (ii) above. Because the day-to-day operations and activities of the fund are carried out by or through FMR, its affiliates and other service providers, the fund's exposure to risks is mitigated but not eliminated by the processes overseen by the Trustees. While each of the Board's committees has responsibility for overseeing different aspects of the fund's activities, oversight is exercised primarily through the Operations, Audit, and Compliance Committees. In addition, the Independent Trustees have worked with FMR to enhance the Board's oversight of investment and financial risks, legal and regulatory risks, technology risks, and operational risks, including the development of additional risk reporting to the Board. For example, a working group comprised of Independent Trustees and FMR has worked and continues to work to review the Fidelity funds' valuation-related activities, reporting and risk management. Appropriate personnel, including but not limited to the fund's Chief Compliance Officer (CCO), FMR's internal auditor, the independent accountants, the fund's Treasurer and portfolio management personnel, make periodic reports to the Board's committees, as appropriate, including an annual review of FMR's risk management program for the Fidelity funds. The responsibilities of each standing committee, including their oversight responsibilities, are described further under "Standing Committees of the Fund's Trustees."
Annual Report
Trustees and Officers - continued
The fund's Statement of Additional Information (SAI) includes more information about the Trustees. To request a free copy, call Fidelity at 1-800-544-8544.
Interested Trustees*:
Correspondence intended for each Trustee who is an interested person may be sent to Fidelity Investments, 245 Summer Street, Boston, Massachusetts 02210.
Name, Year of Birth; Principal Occupations and Other Relevant Experience+ | |
James C. Curvey (1935) | |
Year of Election or Appointment: 2007 Trustee Chairman of the Board of Trustees | |
| Mr. Curvey also serves as Trustee of other Fidelity funds. Mr. Curvey is a Director of Fidelity Investments Money Management, Inc. (2009-present), Director of Fidelity Research & Analysis Co. (2009-present) and Director of FMR and FMR Co., Inc. (2007-present). Mr. Curvey is also Vice Chairman (2007-present) and Director of FMR LLC. In addition, Mr. Curvey serves as an Overseer for the Boston Symphony Orchestra and a member of the Trustees of Villanova University. Previously, Mr. Curvey was the Vice Chairman (2006-2007) and Director (2000-2007) of FMR Corp. |
Charles S. Morrison (1960) | |
Year of Election or Appointment: 2014 Trustee | |
| Mr. Morrison also serves as Trustee or Vice President of other funds. He serves as President, Asset Management (2014-present) and is an employee of Fidelity Investments. Previously, Mr. Morrison served as President, Fixed Income (2011-2014), Vice President of Fidelity's Money Market Funds (2005-2009), President, Money Market Group Leader of FMR (2009), and Senior Vice President, Money Market Group of FMR (2004-2009). Mr. Morrison also served as Vice President of Fidelity's Bond Funds (2002-2005), certain Balanced Funds (2002-2005), and certain Asset Allocation Funds (2002-2007), and as Senior Vice President (2002-2005) of Fidelity's Bond Division. |
* Trustees have been determined to be "Interested Trustees" by virtue of, among other things, their affiliation with the trust or various entities under common control with FMR.
+ The information above includes each Trustee's principal occupation during the last five years and other information relating to the experience, attributes, and skills relevant to each Trustee's qualifications to serve as a Trustee, which led to the conclusion that each Trustee should serve as a Trustee for the fund.
Annual Report
Trustees and Officers - continued
Independent Trustees:
Correspondence intended for each Independent Trustee (that is, the Trustees other than the Interested Trustees) may be sent to Fidelity Investments, P.O. Box 55235, Boston, Massachusetts 02205-5235.
Name, Year of Birth; Principal Occupations and Other Relevant Experience+ | |
Dennis J. Dirks (1948) | |
Year of Election or Appointment: 2005 Trustee | |
| Mr. Dirks also serves as Trustee of other Fidelity funds. Prior to his retirement in May 2003, Mr. Dirks was Chief Operating Officer and a member of the Board of The Depository Trust & Clearing Corporation (DTCC). He also served as President, Chief Operating Officer, and Board member of The Depository Trust Company (DTC) and President and Board member of the National Securities Clearing Corporation (NSCC). In addition, Mr. Dirks served as Chief Executive Officer and Board member of the Government Securities Clearing Corporation, Chief Executive Officer and Board member of the Mortgage-Backed Securities Clearing Corporation, as a Trustee and a member of the Finance Committee of Manhattan College (2005-2008), and as a Trustee and a member of the Finance Committee of AHRC of Nassau County (2006-2008). Mr. Dirks is a member of the Independent Directors Council (IDC) Governing Council (2010-present) and Board of Directors for The Brookville Center for Children's Services, Inc. (2009-present). |
Alan J. Lacy (1953) | |
Year of Election or Appointment: 2008 Trustee | |
| Mr. Lacy also serves as Trustee of other Fidelity funds. Mr. Lacy serves as Senior Adviser (2007-present) of Oak Hill Capital Partners, L.P. (private equity). Mr. Lacy also served as Chief Executive Officer (2000-2005) and Vice Chairman (2005-2006) of Sears Holdings Corporation and Sears, Roebuck and Co. (retail). In addition, Mr. Lacy serves as a member of the Board of Directors of Dave & Buster's Entertainment, Inc. (restaurant and entertainment complexes, 2010-present), Earth Fare, Inc. (retail grocery, 2012-present), The Hillman Companies, Inc. (hardware wholesalers, 2010-present), and Bristol-Myers Squibb Company (global pharmaceuticals, 2008-present). Mr. Lacy is a member of the Board of Trustees of The National Parks Conservation Association (2006-present). Previously, Mr. Lacy served as Chairman of the Board of Trustees of the National Parks Conservation Association (2008-2011) and as a member of the Board of Directors for the Western Union Company (global money transfer, 2006-2011). |
Ned C. Lautenbach (1944) | |
Year of Election or Appointment: 2000 Trustee Chairman of the Independent Trustees | |
| Mr. Lautenbach also serves as Trustee of other Fidelity funds. Mr. Lautenbach currently serves as the Lead Director of the Eaton Corporation Board of Directors (diversified industrial, 1997-present). Mr. Lautenbach is Chairman of the Board of Directors of the Philharmonic Center for the Arts in Naples, Florida (2012-present) and a member of the Council on Foreign Relations (1994-present). Previously, Mr. Lautenbach was a Partner/Advisory Partner at Clayton, Dubilier & Rice, LLC (private equity investment, 1998-2010), as well as a Director of Sony Corporation (2006-2007). |
Joseph Mauriello (1944) | |
Year of Election or Appointment: 2008 Trustee | |
| Mr. Mauriello also serves as Trustee of other Fidelity funds. Prior to his retirement in January 2006, Mr. Mauriello served in numerous senior management positions including Deputy Chairman and Chief Operating Officer (2004-2005), and Vice Chairman of Financial Services (2002-2004) of KPMG LLP US (professional services, 1965-2005). Mr. Mauriello currently serves as a member of the Board of Directors of XL Group plc. (global insurance and re-insurance, 2006-present). Previously, Mr. Mauriello served as a Director of the Hamilton Funds of the Bank of New York (2006-2007) and of Arcadia Resources Inc. (health care services and products, 2007-2012). |
Robert W. Selander (1950) | |
Year of Election or Appointment: 2011 Trustee | |
| Mr. Selander also serves as Trustee of other Fidelity funds. Previously, Mr. Selander served as a Member of the Advisory Board of other Fidelity funds (2011), and Executive Vice Chairman (2010), Chief Executive Officer (2009-2010), and President and Chief Executive Officer (1997-2009) of Mastercard, Inc. |
Cornelia M. Small (1944) | |
Year of Election or Appointment: 2005 Trustee | |
| Ms. Small also serves as Trustee of other Fidelity funds. Ms. Small is a member of the Board of Directors (2009-present) and Chair of the Investment Committee (2010-present) of the Teagle Foundation. Ms. Small also serves on the Investment Committee of the Berkshire Taconic Community Foundation (2008-present). Previously, Ms. Small served as Chairperson (2002-2008) and a member of the Investment Committee and Chairperson (2008-2012) and a member of the Board of Trustees of Smith College. In addition, Ms. Small served as Chief Investment Officer, Director of Global Equity Investments, and a member of the Board of Directors of Scudder, Stevens & Clark and Scudder Kemper Investments. |
William S. Stavropoulos (1939) | |
Year of Election or Appointment: 2002 Trustee Vice Chairman of the Independent Trustees | |
| Mr. Stavropoulos also serves as Trustee of other Fidelity funds. Mr. Stavropoulos serves as President and Founder of the Michigan Baseball Foundation, the Great Lakes Loons (2007-present). Mr. Stavropoulos is Chairman Emeritus of the Board of Directors of The Dow Chemical Company, where he previously served in numerous senior management positions, including President, CEO (1995-2000; 2002-2004), Chairman of the Executive Committee (2000-2006), and as a member of the Board of Directors (1990-2006). Currently, Mr. Stavropoulos is Chairman of the Board of Directors of Univar Inc. (global distributor of commodity and specialty chemicals), a Director of Teradata Corporation (data warehousing and technology solutions), and Maersk Inc. (industrial conglomerate), and a member of the Advisory Board for Metalmark Capital LLC (private equity investment, 2005-present). Mr. Stavropoulos is an operating advisor to Clayton, Dubilier & Rice, LLC (private equity investment). In addition, Mr. Stavropoulos is a member of the University of Notre Dame Advisory Council for the College of Science, a Trustee of the Rollin L. Gerstacker Foundation, and a Director of the Naples Philharmonic Center for the Arts. Previously, Mr. Stavropoulos served as a Director of Chemical Financial Corporation (bank holding company, 1993-2012) and Tyco International, Ltd. (multinational manufacturing and services, 2007-2012). |
David M. Thomas (1949) | |
Year of Election or Appointment: 2008 Trustee | |
| Mr. Thomas also serves as Trustee of other Fidelity funds. Mr. Thomas serves as Non-Executive Chairman of the Board of Directors of Fortune Brands Home and Security (home and security products, 2011-present), and as a member of the Board of Directors of Interpublic Group of Companies, Inc. (marketing communication, 2004-present). Previously, Mr. Thomas served as Executive Chairman (2005-2006) and Chairman and Chief Executive Officer (2000-2005) of IMS Health, Inc. (pharmaceutical and healthcare information solutions), and a Director of Fortune Brands, Inc. (consumer products, 2000-2011). |
+ The information above includes each Trustee's principal occupation during the last five years and other information relating to the experience, attributes, and skills relevant to each Trustee's qualifications to serve as a Trustee, which led to the conclusion that each Trustee should serve as a Trustee for the fund.
Advisory Board Member and Officers:
Correspondence intended for each officer and Peter S. Lynch may be sent to Fidelity Investments, 245 Summer Street, Boston, Massachusetts 02210. Officers appear below in alphabetical order.
Name, Year of Birth; Principal Occupation | |
Peter S. Lynch (1944) | |
Year of Election or Appointment: 2003 Member of the Advisory Board | |
| Mr. Lynch also serves as Member of the Advisory Board of other Fidelity funds. Mr. Lynch is Vice Chairman and a Director of FMR and FMR Co., Inc. In addition, Mr. Lynch serves as a Trustee of Boston College and as the Chairman of the Inner-City Scholarship Fund. Previously, Mr. Lynch served on the Special Olympics International Board of Directors (1997-2006). |
Elizabeth Paige Baumann (1968) | |
Year of Election or Appointment: 2012 Anti-Money Laundering (AML) Officer | |
| Ms. Baumann also serves as AML Officer of other funds. She is Chief AML Officer of FMR LLC (2012-present) and is an employee of Fidelity Investments. Previously, Ms. Baumann served as Vice President and Deputy Anti-Money Laundering Officer (2007-2012). |
William C. Coffey (1969) | |
Year of Election or Appointment: 2009 Assistant Secretary | |
| Mr. Coffey also serves as Assistant Secretary of other funds. He is Senior Vice President and Deputy General Counsel of FMR LLC (2010-present), and is an employee of Fidelity Investments. Previously, Mr. Coffey served as Vice President and Associate General Counsel of FMR LLC (2005-2009). |
Jonathan Davis (1968) | |
Year of Election or Appointment: 2010 Assistant Treasurer | |
| Mr. Davis also serves as Assistant Treasurer of other funds. Mr. Davis is an employee of Fidelity Investments. Previously, Mr. Davis served as Vice President and Associate General Counsel of FMR LLC (2003-2010). |
Adrien E. Deberghes (1967) | |
Year of Election or Appointment: 2008 Deputy Treasurer | |
| Mr. Deberghes also serves as an officer of other funds. He is an employee of Fidelity Investments (2008-present). Prior to joining Fidelity Investments, Mr. Deberghes was Senior Vice President of Mutual Fund Administration at State Street Corporation (2007-2008), Senior Director of Mutual Fund Administration at Investors Bank & Trust (2005-2007), and Director of Finance for Dunkin' Brands (2000-2005). |
Stephanie J. Dorsey (1969) | |
Year of Election or Appointment: 2010 Assistant Treasurer | |
| Ms. Dorsey also serves as an officer of other funds. She is an employee of Fidelity Investments (2008-present) and has served in other fund officer roles. Prior to joining Fidelity Investments, Ms. Dorsey served as Treasurer (2004-2008) of the JPMorgan Mutual Funds and Vice President (2004-2008) of JPMorgan Chase Bank. |
Scott C. Goebel (1968) | |
Year of Election or Appointment: 2008 Secretary and Chief Legal Officer (CLO) | |
| Mr. Goebel serves as Secretary and CLO of other funds. Mr. Goebel also serves as Secretary of Fidelity SelectCo, LLC (2013-present), Fidelity Investments Money Management, Inc. (FIMM) (2010-present) and Fidelity Research and Analysis Company (FRAC) (2010-present); General Counsel, Secretary, and Senior Vice President of FMR (2008-present) and FMR Co., Inc. (2008-present); Chief Legal Officer of Fidelity Management & Research (Hong Kong) Limited (2008-present); and Assistant Secretary of Fidelity Management & Research (Japan) Inc. (2008-present) and Fidelity Management & Research (U.K.) Inc. (2008-present). Previously, Mr. Goebel served as Secretary and CLO of other Fidelity funds (2008-2013), Assistant Secretary of FIMM (2008-2010), FRAC (2008-2010), and certain funds (2007-2008); and as Vice President and Secretary of Fidelity Distributors Corporation (FDC) (2005-2007). Mr. Goebel has been employed by FMR LLC or an affiliate since 2001. |
Joseph A. Hanlon (1968) | |
Year of Election or Appointment: 2012 Chief Compliance Officer | |
| Mr. Hanlon also serves as Chief Compliance Officer of other funds. Mr. Hanlon serves as Compliance Officer of FMR, FMR Co., Inc., Fidelity Investments Money Management, Inc. (FIMM), Fidelity Research and Analysis Company (FRAC), and Fidelity Management & Research (Hong Kong) (2009-present), as Senior Vice President of the Fidelity Asset Management Division (2009-present), and is an employee of Fidelity Investments. Previously, Mr. Hanlon served as Compliance Officer of Fidelity Management & Research (Japan) Inc. (2009-2013), Strategic Advisers, Inc. (2009-2013), and Fidelity Management & Research (U.K.) Inc. (2009-2013). |
Thomas C. Hense (1964) | |
Year of Election or Appointment: 2008/2010 Vice President | |
| Mr. Hense also serves as Vice President of other funds (High Income (2008), Small Cap (2008), and Value (2010) funds). Previously, Mr. Hense served as a portfolio manager for Fidelity's Institutional Money Management Group (Pyramis) (2003-2008). |
Brian B. Hogan (1964) | |
Year of Election or Appointment: 2009 Vice President | |
| Mr. Hogan also serves as Trustee or Vice President of other funds. Mr. Hogan serves as President of FMR's Equity Division (2009-present). Previously, Mr. Hogan served as Senior Vice President, Equity Research of FMR (2006-2009) and as a portfolio manager. |
Chris Maher (1972) | |
Year of Election or Appointment: 2013 Assistant Treasurer | |
| Mr. Maher serves as Assistant Treasurer of other funds. Mr. Maher is Vice President of Valuation Oversight and is an employee of Fidelity Investments. Previously, Mr. Maher served as Vice President of Asset Management Compliance (2013), Vice President of FMR's Program Management Group (2010-2013), and Vice President of Valuation Oversight (2008-2010). |
Christine Reynolds (1958) | |
Year of Election or Appointment: 2008 Chief Financial Officer | |
| Ms. Reynolds also serves as Chief Financial Officer of other funds. Ms. Reynolds became President of Fidelity Pricing and Cash Management Services (FPCMS) in August 2008. Ms. Reynolds served as Chief Operating Officer of FPCMS (2007-2008). Previously, Ms. Reynolds served as President, Treasurer, and Anti-Money Laundering officer of the Fidelity funds (2004-2007). |
Kenneth B. Robins (1969) | |
Year of Election or Appointment: 2008 President and Treasurer | |
| Mr. Robins also serves as an officer of other funds. Mr. Robins serves as Executive Vice President of Fidelity Investments Money Management, Inc. (FIMM) (2013-present) and is an employee of Fidelity Investments (2004-present). Previously, Mr. Robins served in other fund officer roles. |
Gary W. Ryan (1958) | |
Year of Election or Appointment: 2005 Assistant Treasurer | |
| Mr. Ryan also serves as Assistant Treasurer of other funds. Mr. Ryan is an employee of Fidelity Investments and has served in other fund officer roles. Previously, Mr. Ryan served as Vice President of Fund Reporting in Fidelity Pricing and Cash Management Services (FPCMS) (1999-2005). |
Stephen Sadoski (1971) | |
Year of Election or Appointment: 2012 Deputy Treasurer | |
| Mr. Sadoski also serves as Deputy Treasurer of other funds. He is an employee of Fidelity Investments (2012-present) and has served in another fund officer role. Prior to joining Fidelity Investments, Mr. Sadoski served as an assistant chief accountant in the Division of Investment Management of the Securities and Exchange Commission (SEC) (2009-2012) and as a senior manager at Deloitte & Touche LLP (1997-2009). |
Stacie M. Smith (1974) | |
Year of Election or Appointment: 2013 Deputy Treasurer | |
| Ms. Smith also serves as an officer of other funds. She is an employee of Fidelity Investments (2009-present) and has served in other fund officer roles. Prior to joining Fidelity Investments, Ms. Smith served as Senior Audit Manager of Ernst & Young LLP (1996-2009). |
Renee Stagnone (1975) | |
Year of Election or Appointment: 2013 Deputy Treasurer | |
| Ms. Stagnone also serves as Deputy Treasurer of other funds. Ms. Stagnone is an employee of Fidelity Investments. |
Joseph F. Zambello (1957) | |
Year of Election or Appointment: 2011 Deputy Treasurer | |
| Mr. Zambello also serves as Deputy Treasurer of other funds. Mr. Zambello is an employee of Fidelity Investments. Previously, Mr. Zambello served as Vice President of FMR's Program Management Group (2009-2011) and Vice President of the Transfer Agent Oversight Group (2005-2009). |
Annual Report
Distributions (Unaudited)
The Board of Trustees of Fidelity Mid Cap Value Fund voted to pay to shareholders of record at the opening of business on record date, the following distributions per share derived from capital gains realized from sales of portfolio securities, and dividends derived from net investment income:
| Pay Date | Record Date | Dividends | Capital Gains |
Mid Cap Value | 03/17/14 | 03/14/14 | $0.007 | $0.478 |
The fund hereby designates as a capital gain dividend with respect to the taxable year ended January 31, 2014, $36,679,770, or, if subsequently determined to be different, the net capital gain of such year.
Mid Cap Value designates 15% of the dividends distributed during the fiscal year as qualifying for the dividends-received deduction for corporate shareholders.
Mid Cap Value designates 18% of the dividends distributed in during the fiscal year as amounts which may be taken into account as a dividend for purposes of the maximum rate under section 1(h)(11) of the Internal Revenue Code.
The fund will notify shareholders in January 2015 of amounts for use in preparing 2014 income tax returns.
Annual Report
Investment Adviser
Fidelity Management & Research Company
Boston, MA
Investment Sub-Advisers
FMR Co., Inc.
Fidelity Management & Research
(U.K.) Inc.
Fidelity Management & Research
(Hong Kong) Limited
Fidelity Management & Research
(Japan) Inc.
General Distributor
Fidelity Distributors Corporation
Smithfield, RI
Transfer and Service Agents
Fidelity Investments Institutional
Operations Company, Inc.
Boston, MA
Fidelity Service Company, Inc.
Boston, MA
Custodian
Citibank, N.A.
New York, NY
The Fidelity Telephone Connection
Mutual Fund 24-Hour Service
Exchanges/Redemptions
and Account Assistance 1-800-544-6666
Product Information 1-800-544-6666
Retirement Accounts 1-800-544-4774
(8 a.m. - 9 p.m.)
TDD Service 1-800-544-0118
for the deaf and hearing impaired
(9 a.m. - 9 p.m. Eastern time)
Fidelity Automated Service
Telephone (FAST®)
1-800-544-5555

Automated line for quickest service
(Fidelity Investment logo)(registered trademark)
Corporate Headquarters
245 Summer St., Boston, MA 02210
www.fidelity.com
MCV-UANN-0314
1.900179.104
Fidelity®
Series All-Sector Equity Fund
Fidelity
Series Equity-Income Fund
and
Fidelity
Series Stock Selector Large Cap Value Fund
Fidelity Series All-Sector Equity Fund
Fidelity Series Equity-Income Fund
Fidelity Series Stock
Selector Large Cap
Value Fund
Class F
Annual Report
January 31, 2014
(Fidelity Cover Art)
Contents
Performance | How the fund has done over time. | |
Management's Discussion of Fund Performance | The Portfolio Manager's review of fund performance and strategy. | |
Shareholder Expense Example | An example of shareholder expenses. | |
Fidelity® Series All-Sector Equity Fund | ||
Investment Changes | A summary of major shifts in the fund's investments over the past six months. | |
Investments | A complete list of the fund's investments with their market values. | |
Financial Statements | Statements of assets and liabilities, operations, and changes in net assets, as well as financial highlights. | |
Fidelity Series Equity-Income Fund | ||
Investment Changes | A summary of major shifts in the fund's investments over the past six months. | |
Investments | A complete list of the fund's investments with their market values. | |
Financial Statements | Statements of assets and liabilities, operations, and changes in net assets, as well as financial highlights. | |
Fidelity Series Stock Selector Large Cap Value Fund | ||
Investment Changes | A summary of major shifts in the fund's investments over the past six months. | |
Investments | A complete list of the fund's investments with their market values. | |
Financial Statements | Statements of assets and liabilities, operations, and changes in net assets, as well as financial highlights. | |
Notes | Notes to the Financial Statements. | |
Report of Independent Registered Public Accounting Firm |
| |
Trustees and Officers |
| |
Distributions |
| |
To view a fund's proxy voting guidelines and proxy voting record for the 12-month period ended June 30, visit http://www.fidelity.com/proxyvotingresults or visit the Securities and Exchange Commission's (SEC) web site at http://www.sec.gov. You may also call 1-800-544-8544 for Fidelity Series All-Sector Equity Fund, Fidelity Series Equity-Income Fund, and Fidelity Series Stock Selector Large Cap Value Fund or 1-800-835-5092 for Class F of each fund to request a free copy of the proxy voting guidelines.
Annual Report
Standard & Poor's, S&P and S&P 500 are registered service marks of The McGraw-Hill Companies, Inc. and have been licensed for use by Fidelity Distributors Corporation.
Other third-party marks appearing herein are the property of their respective owners.
All other marks appearing herein are registered or unregistered trademarks or service marks of FMR LLC or an affiliated company. © 2014 FMR LLC. All rights reserved.
This report and the financial statements contained herein are submitted for the general information of the shareholders of the funds. This report is not authorized for distribution to prospective investors in the funds unless preceded or accompanied by an effective prospectus.
A fund files its complete schedule of portfolio holdings with the SEC for the first and third quarters of each fiscal year on Form N-Q. Forms N-Q are available on the SEC's web site at http://www.sec.gov. A fund's Forms N-Q may be reviewed and copied at the SEC's Public Reference Room in Washington, DC. Information regarding the operation of the SEC's Public Reference Room may be obtained by calling 1-800-SEC-0330. For a complete list of a fund's portfolio holdings, view the most recent holdings listing, semiannual report, or annual report on Fidelity's web site at http://www.fidelity.com, http://www.advisor.fidelity.com, or http://www.401k.com, as applicable.
NOT FDIC INSURED • MAY LOSE VALUE • NO BANK GUARANTEE
Neither the funds nor Fidelity Distributors Corporation is a bank.
Annual Report
Fidelity® Series All-Sector Equity Fund
Performance: The Bottom Line
Average annual total return reflects the change in the value of an investment, assuming reinvestment of the class' distributions from dividend income and capital gains (the profits earned upon the sale of securities that have grown in value, if any) and assuming a constant rate of performance each year. The $10,000 table and the fund's returns do not reflect the deduction of taxes that a shareholder would pay on fund distributions or the redemption of fund shares. During periods of reimbursement by Fidelity, a fund's total return will be greater than it would be had the reimbursement not occurred. How a fund did yesterday is no guarantee of how it will do tomorrow.
Average Annual Total Returns
Periods ended January 31, 2014 | Past 1 | Past 5 | Life of |
Fidelity ® Series All-Sector Equity Fund | 24.13% | 20.06% | 15.28% |
Class F B | 24.37% | 20.28% | 15.48% |
A From October 17, 2008.
B The initial offering of Class F shares took place on June 26, 2009. Returns prior to June 26, 2009, are those of Fidelity Series All-Sector Equity Fund, the original class of the fund.
Annual Report
$10,000 Over Life of Fund
Let's say hypothetically that $10,000 was invested in Fidelity® Series All-Sector Equity Fund, a class of the fund, on October 17, 2008, when the fund started. The chart shows how the value of your investment would have changed, and also shows how the S&P 500® Index and the Russell 1000® Index performed over the same period.
Effective April 1, 2013, Fidelity Series All-Sector Equity Fund began comparing its performance to the Russell 1000® Index rather than the S&P 500® Index because the Russell 1000 Index provides a more appropriate performance comparison for the fund.
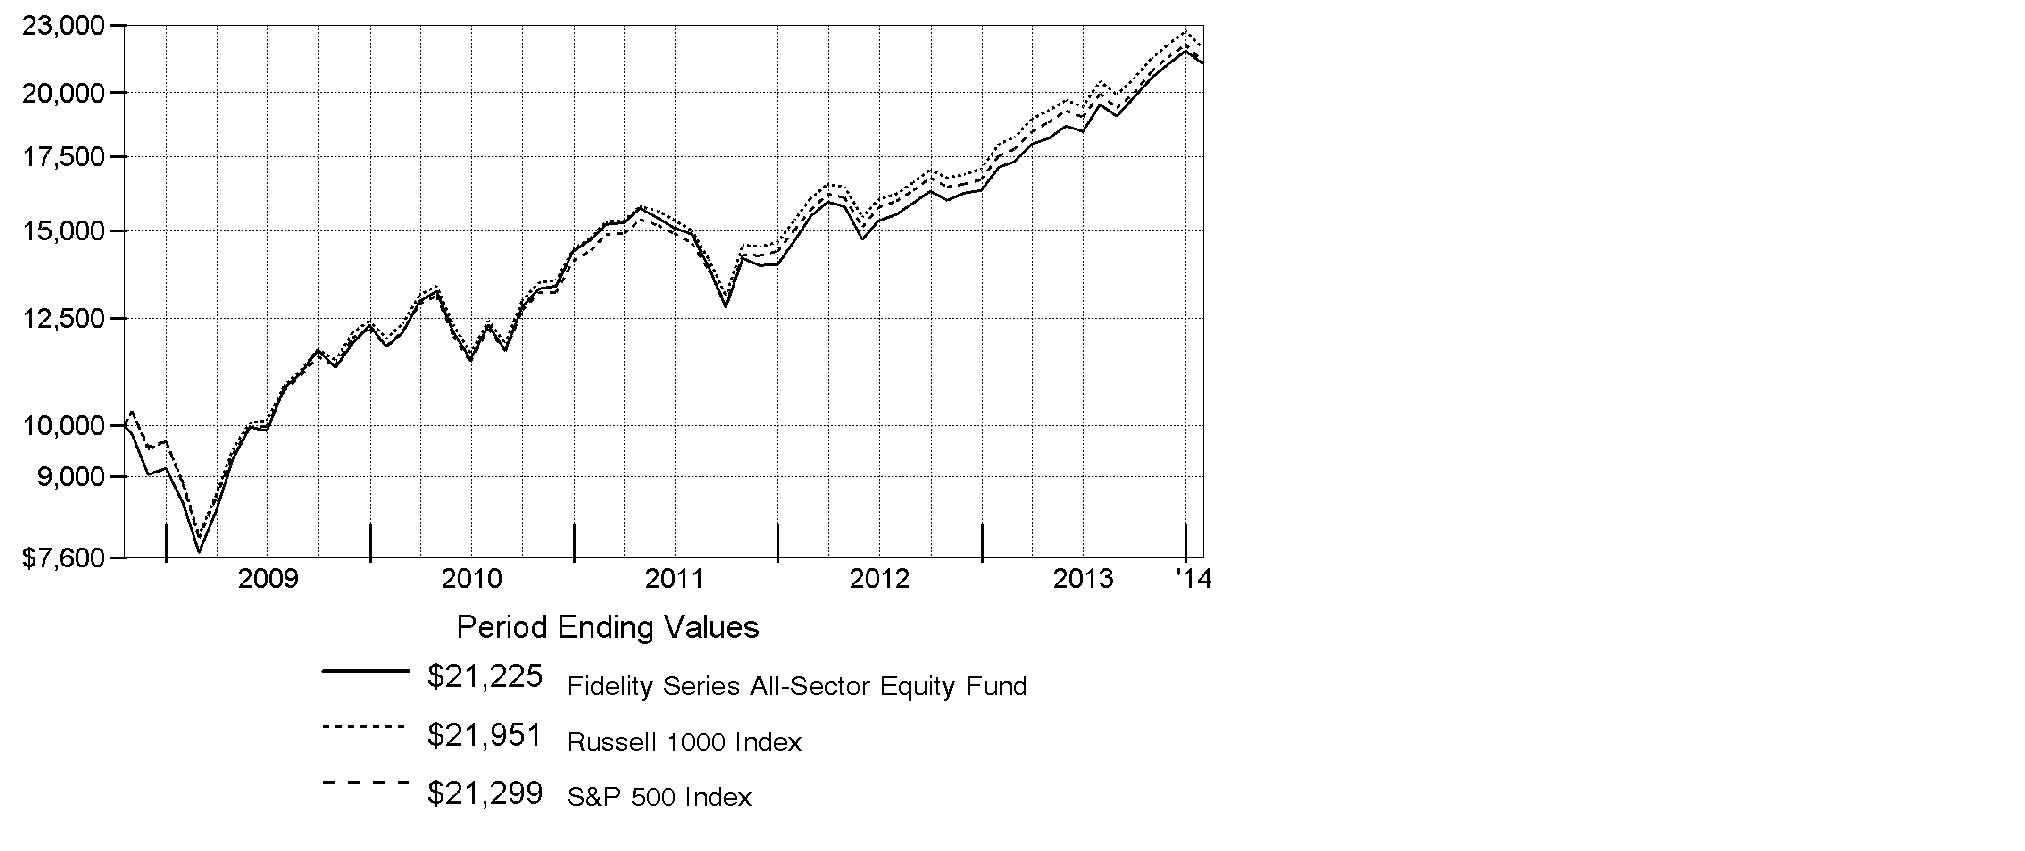
Annual Report
Fidelity Series Equity-Income Fund
Performance: The Bottom Line
Average annual total return reflects the change in the value of an investment, assuming reinvestment of the fund's distributions from dividend income and capital gains (the profits earned upon the sale of securities that have grown in value, if any) and assuming a constant rate of performance each year. The $10,000 table and the fund's returns do not reflect the deduction of taxes that a shareholder would pay on fund distributions or the redemption of fund shares. During periods of reimbursement by Fidelity, a fund's total return will be greater than it would be had the reimbursement not occurred. How a fund did yesterday is no guarantee of how it will do tomorrow.
Average Annual Total Returns
Periods ended January 31, 2014 | Past 1 | Life of |
Fidelity Series Equity-Income Fund | 16.57% | 20.03% |
Class F | 16.75% | 20.20% |
A From December 6, 2012.
$10,000 Over Life of Fund
Let's say hypothetically that $10,000 was invested in Fidelity Series Equity-Income Fund, a class of the fund, on December 6, 2012, when the fund started. The chart shows how the value of your investment would have changed, and also shows how the Russell 3000® Value Index performed over the same period.
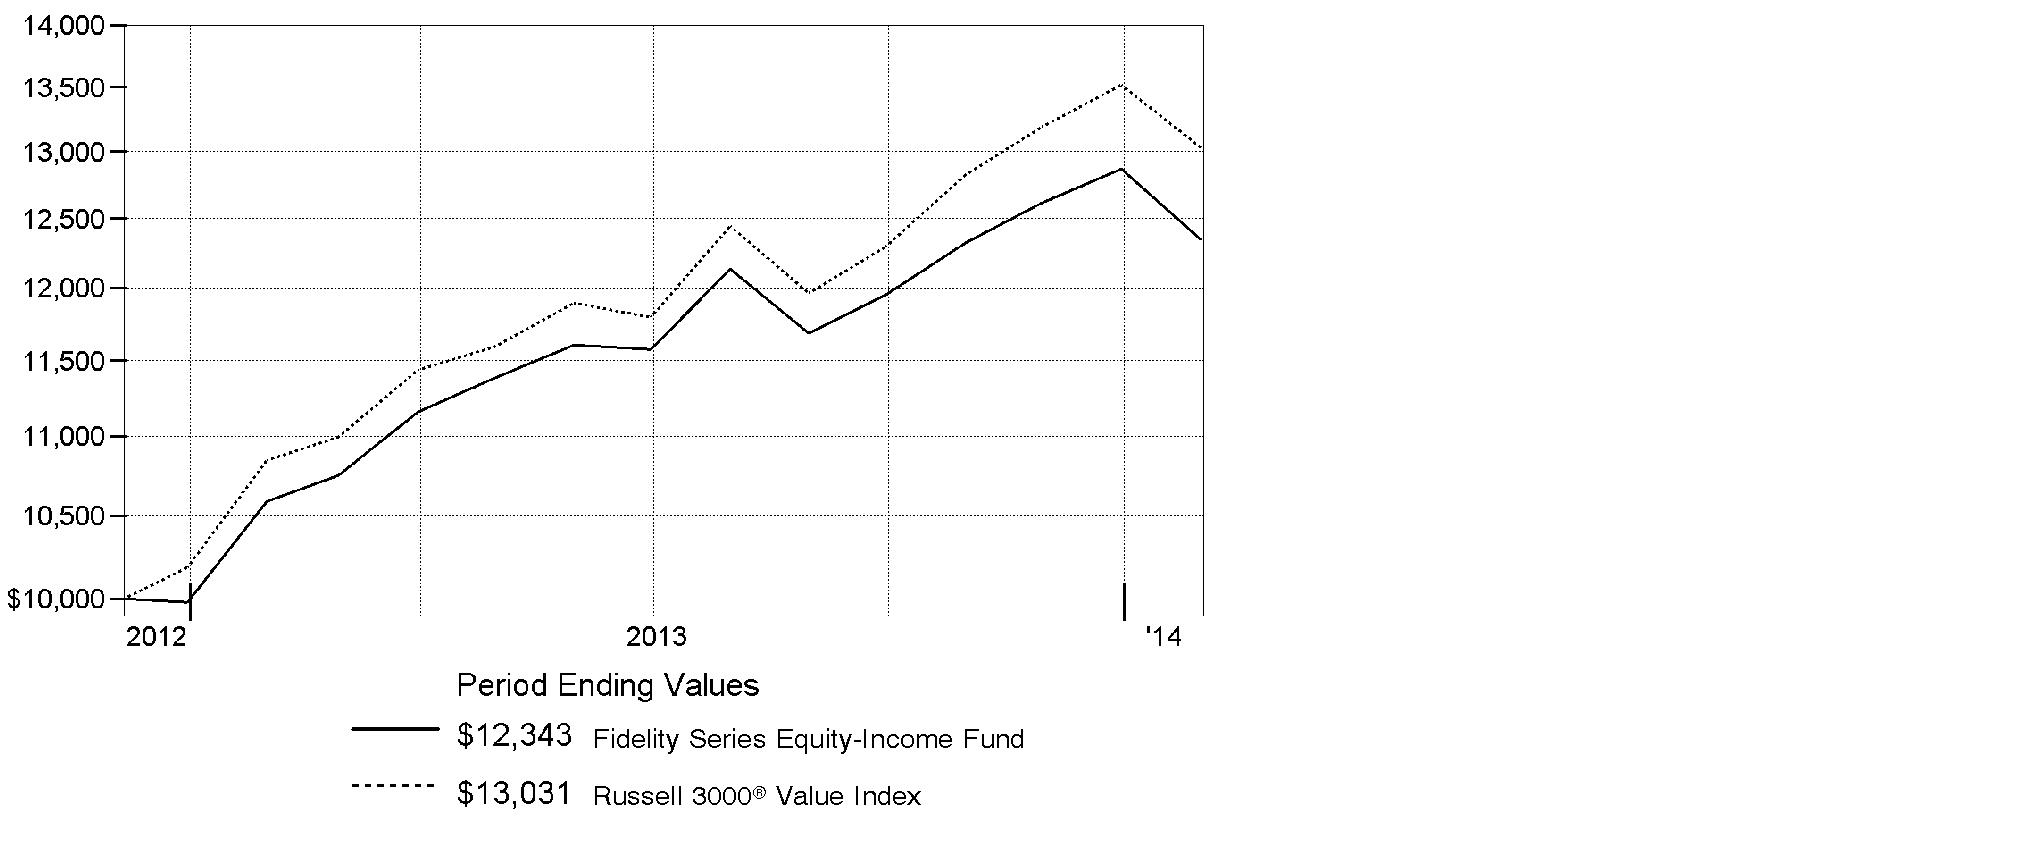
Annual Report
Fidelity Series Stock Selector Large Cap Value Fund
Performance: The Bottom Line
Average annual total return reflects the change in the value of an investment, assuming reinvestment of the fund's distributions from dividend income and capital gains (the profits earned upon the sale of securities that have grown in value, if any) and assuming a constant rate of performance each year. The $10,000 table and the fund's returns do not reflect the deduction of taxes that a shareholder would pay on fund distributions or the redemption of fund shares. During periods of reimbursement by Fidelity, a fund's total return will be greater than it would be had the reimbursement not occurred. How a fund did yesterday is no guarantee of how it will do tomorrow.
Average Annual Total Returns
Periods ended January 31, 2014 | Past 1 | Life of |
Fidelity Series Stock Selector Large Cap Value Fund | 18.81% | 23.41% |
Class F | 19.09% | 23.67% |
A From December 6, 2012.
$10,000 Over Life of Fund
Let's say hypothetically that $10,000 was invested in Fidelity Series Stock Selector Large Cap Value Fund, a class of the fund, on December 6, 2012, when the fund started. The chart shows how the value of your investment would have changed, and also shows how the Russell 1000® Value Index performed over the same period.
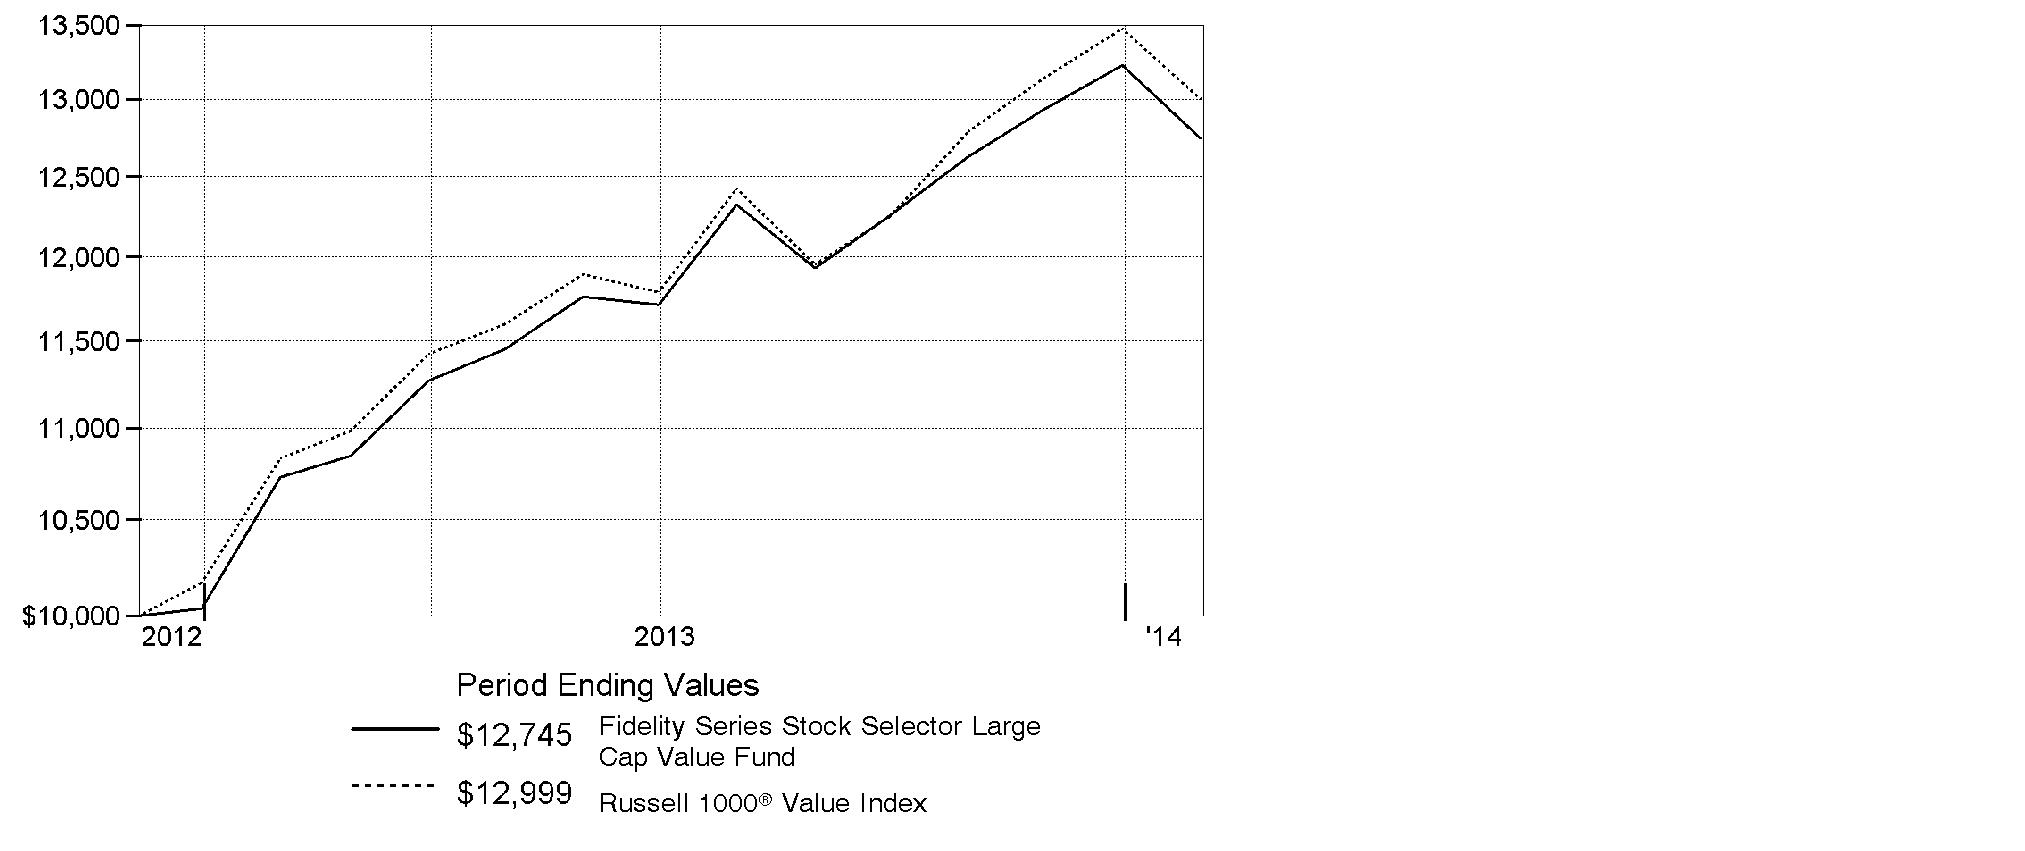
Annual Report
Fidelity Series All-Sector Equity Fund
Management's Discussion of Fund Performance
Market Recap: Despite the worst January in years, markets finished notably higher for the 12 months ending January 31, 2014, amid a generally improving global economy and accommodative monetary policies worldwide. After achieving a series of highs in 2013, both the broad S&P 500® Index and the blue-chip Dow Jones Industrial AverageSM pulled back in the new year, bringing their 12-month returns to 21.52% and 16.07%, respectively. The growth-oriented Nasdaq Composite Index®, having run hotter in 2013 and cooled less in January, retained a loftier 32.33% result. For the period overall, smaller-cap stocks generally outperformed larger-caps, and growth outperformed value across market-cap segments. Bullish sentiment drove stocks higher through mid-May, but mixed signals from the U.S. Federal Reserve as to when it might curtail its stimulative bond-buying program, along with jitters over a potential U.S. military strike in Syria, put the markets in flux over the summer. Stocks regained their momentum in October despite a budget impasse that briefly shuttered the federal government, and volatility remained subdued heading into the holidays, allowing many markets to hit all-time highs by year-end. In January, renewed optimism for Europe and other developed markets was overrun by renewed concern about Fed tapering, the economic slowdown in China and a sell-off in emerging markets.
Comments from Co-Portfolio Manager Robert Stansky, Head of FMR's Stock Selector Large Cap Group, which manages Fidelity® Series All-Sector Equity Fund: For the year, the fund's Series All-Sector Equity and Class F shares gained 24.13% and 24.37%, respectively, compared with 21.52% for the S&P 500® Index, 22.23% for the Russell 1000® Index and 22.12% for the custom linked index specific to this fund. The linked index is a combination of the S&P 500®, the fund's primary benchmark through March 31, and the Russell 1000® Index, with which the fund was compared for the final 10 months of the period. Relative to the index, performance was boosted by picks in biotechnology and software & services. We successfully avoided computer services provider and lagging index component IBM, which we felt faced increased pressure from competitors. I'll also highlight semiconductor firm Micron Technology, which benefited from higher prices for DRAM, a type of digital memory. Conversely, we missed with our timing on tech titan Microsoft. We avoided the stock early on, thinking its valuation reflected the software maker's near-term outlook amid a dearth of growth in personal computers. We established a position in May, but it still detracted because our exposure was below that of the benchmark, on average.
The views expressed above reflect those of the portfolio manager(s) only through the end of the period as stated on the cover of this report and do not necessarily represent the views of Fidelity or any other person in the Fidelity organization. Any such views are subject to change at any time based upon market or other conditions and Fidelity disclaims any responsibility to update such views. These views may not be relied on as investment advice and, because investment decisions for a Fidelity fund are based on numerous factors, may not be relied on as an indication of trading intent on behalf of any Fidelity fund.
Annual Report
Fidelity Series Equity-Income Fund
Management's Discussion of Fund Performance
Market Recap: Despite the worst January in years, markets finished notably higher for the 12 months ending January 31, 2014, amid a generally improving global economy and accommodative monetary policies worldwide. After achieving a series of highs in 2013, both the broad S&P 500® Index and the blue-chip Dow Jones Industrial AverageSM pulled back in the new year, bringing their 12-month returns to 21.52% and 16.07%, respectively. The growth-oriented Nasdaq Composite Index®, having run hotter in 2013 and cooled less in January, retained a loftier 32.33% result. For the period overall, smaller-cap stocks generally outperformed larger-caps, and growth outperformed value across market-cap segments. Bullish sentiment drove stocks higher through mid-May, but mixed signals from the U.S. Federal Reserve as to when it might curtail its stimulative bond-buying program, along with jitters over a potential U.S. military strike in Syria, put the markets in flux over the summer. Stocks regained their momentum in October despite a budget impasse that briefly shuttered the federal government, and volatility remained subdued heading into the holidays, allowing many markets to hit all-time highs by year-end. In January, renewed optimism for Europe and other developed markets was overrun by renewed concern about Fed tapering, the economic slowdown in China and a sell-off in emerging markets.
Comments from James Morrow, Portfolio Manager of Fidelity® Series Equity-Income Fund: For the year, the fund's Series Equity-Income and Class F shares gained 16.57% and 16.75%, respectively, trailing the Russell 3000® Value Index, which rose 20.18%. Compared with the index, stock picking in information technology and industrials was detrimental. The fund's average cash allocation of about 5% also detracted in a rising market. On the positive side, the fund benefited from favorable allocations in several sectors, especially software & services within information technology. Nevertheless, the fund's biggest individual detractor - IBM, a diversified technology services company not held in the benchmark - came from this group. Steady growers like IBM were somewhat out of favor in a market environment rewarding faster-growing stocks. Another source of underperformance was Bank of America, a benchmark component that I held only intermittently during the 12 months, and not at period end. On the positive side, media company and cable service provider Comcast was the top relative contributor. As Comcast's shares continued rising, I gradually reduced my holding. Another notable contributor was Paychex, a provider of payroll and human resources services whose shares rose along with an improving employment market as well as higher interest rates.
The views expressed above reflect those of the portfolio manager(s) only through the end of the period as stated on the cover of this report and do not necessarily represent the views of Fidelity or any other person in the Fidelity organization. Any such views are subject to change at any time based upon market or other conditions and Fidelity disclaims any responsibility to update such views. These views may not be relied on as investment advice and, because investment decisions for a Fidelity fund are based on numerous factors, may not be relied on as an indication of trading intent on behalf of any Fidelity fund.
Annual Report
Fidelity Series Stock Selector Large Cap Value Fund
Management's Discussion of Fund Performance
Market Recap: Despite the worst January in years, markets finished notably higher for the 12 months ending January 31, 2014, amid a generally improving global economy and accommodative monetary policies worldwide. After achieving a series of highs in 2013, both the broad S&P 500® Index and the blue-chip Dow Jones Industrial AverageSM pulled back in the new year, bringing their 12-month returns to 21.52% and 16.07%, respectively. The growth-oriented Nasdaq Composite Index®, having run hotter in 2013 and cooled less in January, retained a loftier 32.33% result. For the period overall, smaller-cap stocks generally outperformed larger-caps, and growth outperformed value across market-cap segments. Bullish sentiment drove stocks higher through mid-May, but mixed signals from the U.S. Federal Reserve as to when it might curtail its stimulative bond-buying program, along with jitters over a potential U.S. military strike in Syria, put the markets in flux over the summer. Stocks regained their momentum in October despite a budget impasse that briefly shuttered the federal government, and volatility remained subdued heading into the holidays, allowing many markets to hit all-time highs by year-end. In January, renewed optimism for Europe and other developed markets was overrun by renewed concern about Fed tapering, the economic slowdown in China and a sell-off in emerging markets.
Comments from Matthew Friedman, Lead Portfolio Manager of Fidelity® Series Stock Selector Large Cap Value Fund: For the year, the fund's Series Stock Selector Large Cap Value and Class F shares rose 18.81% and 19.09%, respectively, modestly underperforming the 20.02% return of the Russell 1000® Value Index. The fund's performance versus the benchmark during the past year primarily resulted from strong stock choices in health care, consumer discretionary and utilities, which were offset by some stock-specific mistakes, most notably in energy and industrials. A modest cash stake in a rising market also dampened relative performance. Among individual stock, Ireland-based Jazz Pharmaceuticals was the fund's biggest relative contributor during the reporting period. Shares of the specialty pharma firm surged at the end of the calendar year after the company announced a definitive agreement to acquire smaller-cap Italian orphan drug firm Gentium. Timely ownership of Juniper Networks was another plus. We added the stock of the networking equipment manufacturer to the fund during the past year and it rallied toward the end of the period after the firm announced better-than-expected earnings and revenue. We sold the stock prior to period end. Conversely, overweighting two energy names and index components were detrimental: integrated energy firm Chevron and oil/gas exploration & production company Occidental Petroleum. Chevron - which we added to the fund during the period - and Occidental were both hurt buy falling crude oil prices. Additionally, Chevron had a volatile run during the past year, including consecutive quarters of weaker-than-expected financial results.
The views expressed above reflect those of the portfolio manager(s) only through the end of the period as stated on the cover of this report and do not necessarily represent the views of Fidelity or any other person in the Fidelity organization. Any such views are subject to change at any time based upon market or other conditions and Fidelity disclaims any responsibility to update such views. These views may not be relied on as investment advice and, because investment decisions for a Fidelity fund are based on numerous factors, may not be relied on as an indication of trading intent on behalf of any Fidelity fund.
Annual Report
Shareholder Expense Example
As a shareholder of a Fund, you incur two types of costs: (1) transaction costs and (2) ongoing costs, including management fees and other Fund expenses. This Example is intended to help you understand your ongoing costs (in dollars) of investing in the Funds and to compare these costs with the ongoing costs of investing in other mutual funds.
The Example is based on an investment of $1,000 invested at the beginning of the period and held for the entire period (August 1, 2013 to January 31, 2014).
Actual Expenses
The first line of the accompanying table for each class of each fund provides information about actual account values and actual expenses. You may use the information in this line, together with the amount you invested, to estimate the expenses that you paid over the period. Simply divide your account value by $1,000.00 (for example, an $8,600 account value divided by $1,000.00 = 8.6), then multiply the result by the number in the first line for a class of the fund under the heading entitled "Expenses Paid During Period" to estimate the expenses you paid on your account during this period. In addition, each Fund, as a shareholder in the underlying Fidelity Central Funds, will indirectly bear its pro-rata share of the fees and expenses incurred by the underlying Fidelity Central Funds. These fees and expenses are not included in the Fund's annualized expense ratio used to calculate the expense estimate in the table below.
Hypothetical Example for Comparison Purposes
The second line of the accompanying table for each class of each fund provides information about hypothetical account values and hypothetical expenses based on a Class' actual expense ratio and an assumed rate of return of 5% per year before expenses, which is not the Class' actual return. The hypothetical account values and expenses may not be used to estimate the actual ending account balance or expenses you paid for the period. You may use this information to compare the ongoing costs of investing in the Fund and other funds. To do so, compare this 5% hypothetical example with the 5% hypothetical examples that appear in the shareholder reports of the other funds. In addition, each Fund, as a shareholder in the underlying Fidelity Central Funds, will indirectly bear its pro-rata share of the fees and expenses incurred by the underlying Fidelity Central Funds. These fees and expenses are not included in the Fund's annualized expense ratio used to calculate the expense estimate in the table below.
Please note that the expenses shown in the table are meant to highlight your ongoing costs only and do not reflect any transaction costs. Therefore, the second line of the table is useful in comparing ongoing costs only, and will not help you determine the relative total costs of owning different funds.
Annual Report
| Annualized | Beginning | Ending | Expenses Paid |
Fidelity Series All-Sector Equity Fund |
|
|
|
|
Series All-Sector Equity | .65% |
|
|
|
Actual |
| $ 1,000.00 | $ 1,088.60 | $ 3.42 |
HypotheticalA |
| $ 1,000.00 | $ 1,021.93 | $ 3.31 |
Class F | .48% |
|
|
|
Actual |
| $ 1,000.00 | $ 1,089.70 | $ 2.53 |
HypotheticalA |
| $ 1,000.00 | $ 1,022.79 | $ 2.45 |
Fidelity Series Equity-Income Fund |
|
|
|
|
Series Equity-Income | .65% |
|
|
|
Actual |
| $ 1,000.00 | $ 1,017.50 | $ 3.31 |
HypotheticalA |
| $ 1,000.00 | $ 1,021.93 | $ 3.31 |
Class F | .47% |
|
|
|
Actual |
| $ 1,000.00 | $ 1,017.40 | $ 2.39 |
HypotheticalA |
| $ 1,000.00 | $ 1,022.84 | $ 2.40 |
Fidelity Series Stock Selector Large Cap Value Fund |
|
|
|
|
Series Stock Selector Large Cap Value | .74% |
|
|
|
Actual |
| $ 1,000.00 | $ 1,034.20 | $ 3.79 |
HypotheticalA |
| $ 1,000.00 | $ 1,021.48 | $ 3.77 |
Class F | .57% |
|
|
|
Actual |
| $ 1,000.00 | $ 1,035.60 | $ 2.92 |
HypotheticalA |
| $ 1,000.00 | $ 1,022.33 | $ 2.91 |
A 5% return per year before expenses
B Annualized expense ratio reflects expenses net of applicable fee waivers.
* Expenses are equal to each Class' annualized expense ratio, multiplied by the average account value over the period, multiplied by 184 / 365 (to reflect the one-half year period).
Annual Report
Fidelity Series All-Sector Equity Fund
Investment Changes (Unaudited)
Top Ten Stocks as of January 31, 2014 | ||
| % of fund's | % of fund's net assets |
Google, Inc. Class A | 2.8 | 1.6 |
Apple, Inc. | 2.8 | 3.2 |
JPMorgan Chase & Co. | 2.2 | 1.9 |
Capital One Financial Corp. | 1.9 | 2.2 |
Bank of America Corp. | 1.9 | 1.6 |
Microsoft Corp. | 1.7 | 0.8 |
Philip Morris International, Inc. | 1.5 | 1.7 |
U.S. Bancorp | 1.5 | 1.6 |
The Coca-Cola Co. | 1.4 | 1.5 |
Yahoo!, Inc. | 1.3 | 0.3 |
| 19.0 | |
Top Five Market Sectors as of January 31, 2014 | ||
| % of fund's | % of fund's net assets |
Information Technology | 18.0 | 17.0 |
Financials | 16.3 | 17.3 |
Health Care | 13.1 | 12.5 |
Consumer Discretionary | 12.7 | 12.5 |
Industrials | 11.3 | 10.8 |
Asset Allocation (% of fund's net assets) | |||||||
As of January 31, 2014 * | As of July 31, 2013 ** | ||||||
 | Stocks and |
| | Stocks and |
| ||
 | Short-Term |
| | Short-Term |
| ||
* Foreign investments | 4.5% |
| ** Foreign investments | 3.9% |
| ||

Annual Report
Fidelity Series All-Sector Equity Fund
Investments January 31, 2014
Showing Percentage of Net Assets
Common Stocks - 98.0% | |||
Shares | Value | ||
CONSUMER DISCRETIONARY - 12.7% | |||
Automobiles - 0.2% | |||
Tesla Motors, Inc. (a) | 126,100 | $ 22,875,801 | |
Hotels, Restaurants & Leisure - 2.0% | |||
McDonald's Corp. | 546,500 | 51,463,905 | |
Wynn Resorts Ltd. | 274,000 | 59,573,080 | |
Yum! Brands, Inc. | 1,349,407 | 90,612,680 | |
| 201,649,665 | ||
Internet & Catalog Retail - 0.8% | |||
Liberty Interactive Corp. Series A (a) | 3,208,225 | 85,691,690 | |
Media - 5.3% | |||
DIRECTV (a) | 1,224,806 | 85,038,281 | |
Legend Pictures LLC (a)(f)(g) | 3,706 | 6,681,918 | |
Liberty Global PLC Class A (a) | 272,100 | 21,748,953 | |
Liberty Media Corp. Class A (a) | 253,300 | 33,331,747 | |
The Madison Square Garden Co. Class A (a) | 530,725 | 30,797,972 | |
The Walt Disney Co. | 1,370,400 | 99,504,744 | |
Time Warner, Inc. | 1,459,000 | 91,668,970 | |
Twenty-First Century Fox, Inc. Class A | 3,629,753 | 115,498,740 | |
Viacom, Inc. Class B (non-vtg.) | 731,000 | 60,015,100 | |
| 544,286,425 | ||
Multiline Retail - 1.9% | |||
Dollar General Corp. (a) | 1,679,711 | 94,601,324 | |
Target Corp. | 1,724,700 | 97,687,008 | |
| 192,288,332 | ||
Specialty Retail - 1.6% | |||
Lowe's Companies, Inc. | 1,418,574 | 65,665,790 | |
TJX Companies, Inc. | 1,765,590 | 101,274,242 | |
| 166,940,032 | ||
Textiles, Apparel & Luxury Goods - 0.9% | |||
Fossil Group, Inc. (a) | 383,800 | 42,920,354 | |
PVH Corp. | 370,476 | 44,779,434 | |
| 87,699,788 | ||
TOTAL CONSUMER DISCRETIONARY | 1,301,431,733 | ||
CONSUMER STAPLES - 8.5% | |||
Beverages - 2.0% | |||
Brown-Forman Corp. Class B (non-vtg.) | 160,350 | 12,346,950 | |
Constellation Brands, Inc. Class A (sub. vtg.) (a) | 316,804 | 24,289,363 | |
Common Stocks - continued | |||
Shares | Value | ||
CONSUMER STAPLES - continued | |||
Beverages - continued | |||
Molson Coors Brewing Co. Class B | 389,424 | $ 20,499,279 | |
Monster Beverage Corp. (a) | 187,200 | 12,710,880 | |
The Coca-Cola Co. | 3,740,792 | 141,476,753 | |
| 211,323,225 | ||
Food & Staples Retailing - 2.1% | |||
CVS Caremark Corp. | 1,211,281 | 82,027,949 | |
Kroger Co. | 1,597,700 | 57,676,970 | |
Walgreen Co. | 1,280,982 | 73,464,318 | |
| 213,169,237 | ||
Food Products - 0.9% | |||
Bunge Ltd. | 311,252 | 23,580,452 | |
Green Mountain Coffee Roasters, Inc. | 203,680 | 16,498,080 | |
Mead Johnson Nutrition Co. Class A | 687,300 | 52,846,497 | |
| 92,925,029 | ||
Household Products - 1.1% | |||
Colgate-Palmolive Co. | 1,636,584 | 100,208,038 | |
Energizer Holdings, Inc. | 131,500 | 12,426,750 | |
| 112,634,788 | ||
Tobacco - 2.4% | |||
Altria Group, Inc. | 2,607,930 | 91,851,295 | |
Philip Morris International, Inc. | 2,013,998 | 157,373,804 | |
| 249,225,099 | ||
TOTAL CONSUMER STAPLES | 879,277,378 | ||
ENERGY - 9.1% | |||
Energy Equipment & Services - 1.5% | |||
Cameron International Corp. (a) | 605,182 | 36,292,765 | |
FMC Technologies, Inc. (a) | 441,500 | 21,827,760 | |
Halliburton Co. | 1,115,340 | 54,662,813 | |
Oceaneering International, Inc. | 313,200 | 21,344,580 | |
Rowan Companies PLC (a) | 547,283 | 17,168,268 | |
| 151,296,186 | ||
Oil, Gas & Consumable Fuels - 7.6% | |||
Anadarko Petroleum Corp. | 892,681 | 72,030,430 | |
Cabot Oil & Gas Corp. | 1,235,400 | 49,391,292 | |
Chevron Corp. | 843,329 | 94,140,816 | |
Cimarex Energy Co. | 208,300 | 20,409,234 | |
Cobalt International Energy, Inc. (a) | 497,500 | 8,144,075 | |
Common Stocks - continued | |||
Shares | Value | ||
ENERGY - continued | |||
Oil, Gas & Consumable Fuels - continued | |||
Concho Resources, Inc. (a) | 58,431 | $ 5,713,967 | |
ConocoPhillips Co. | 1,541,000 | 100,087,950 | |
Continental Resources, Inc. (a) | 267,194 | 29,444,779 | |
EOG Resources, Inc. | 297,400 | 49,142,376 | |
Exxon Mobil Corp. | 1,288,524 | 118,750,372 | |
Marathon Oil Corp. | 1,386,489 | 45,462,974 | |
Noble Energy, Inc. | 662,124 | 41,270,189 | |
Occidental Petroleum Corp. | 162,025 | 14,188,529 | |
Phillips 66 Co. | 859,200 | 62,798,928 | |
Spectra Energy Corp. | 653,835 | 23,505,368 | |
Teekay Corp. | 224,846 | 12,179,908 | |
The Williams Companies, Inc. | 408,700 | 16,548,263 | |
Whiting Petroleum Corp. (a) | 316,600 | 18,483,108 | |
| 781,692,558 | ||
TOTAL ENERGY | 932,988,744 | ||
FINANCIALS - 16.3% | |||
Capital Markets - 2.3% | |||
Ameriprise Financial, Inc. | 434,400 | 45,890,016 | |
BlackRock, Inc. Class A | 219,018 | 65,808,338 | |
E*TRADE Financial Corp. (a) | 1,447,252 | 28,973,985 | |
Invesco Ltd. | 1,104,900 | 36,737,925 | |
Morgan Stanley | 1,223,500 | 36,105,485 | |
Northern Trust Corp. | 317,800 | 19,137,916 | |
| 232,653,665 | ||
Commercial Banks - 2.5% | |||
Huntington Bancshares, Inc. | 3,756,457 | 34,071,065 | |
M&T Bank Corp. | 446,400 | 49,778,064 | |
Synovus Financial Corp. | 3,829,360 | 12,828,356 | |
U.S. Bancorp | 3,939,778 | 156,527,380 | |
| 253,204,865 | ||
Consumer Finance - 2.7% | |||
Capital One Financial Corp. | 2,803,980 | 197,989,028 | |
Discover Financial Services | 448,932 | 24,085,202 | |
SLM Corp. | 2,522,646 | 57,415,423 | |
| 279,489,653 | ||
Diversified Financial Services - 5.6% | |||
Bank of America Corp. | 11,810,187 | 197,820,632 | |
Common Stocks - continued | |||
Shares | Value | ||
FINANCIALS - continued | |||
Diversified Financial Services - continued | |||
Berkshire Hathaway, Inc.: | |||
Class A (a) | 161 | $ 27,291,416 | |
Class B (a) | 97,403 | 10,870,175 | |
Citigroup, Inc. | 1,997,384 | 94,735,923 | |
IntercontinentalExchange Group, Inc. | 107,700 | 22,486,683 | |
JPMorgan Chase & Co. | 3,992,434 | 221,021,146 | |
| 574,225,975 | ||
Insurance - 1.7% | |||
ACE Ltd. | 283,631 | 26,607,424 | |
Marsh & McLennan Companies, Inc. | 941,500 | 43,035,965 | |
MetLife, Inc. | 1,356,141 | 66,518,716 | |
The Travelers Companies, Inc. | 304,773 | 24,771,949 | |
Validus Holdings Ltd. | 341,961 | 12,283,239 | |
| 173,217,293 | ||
Real Estate Investment Trusts - 1.2% | |||
Camden Property Trust (SBI) | 182,542 | 11,284,746 | |
CBL & Associates Properties, Inc. | 675,200 | 11,471,648 | |
Cousins Properties, Inc. | 1,463,600 | 15,733,700 | |
DDR Corp. | 900,600 | 14,112,402 | |
Equity Lifestyle Properties, Inc. | 995,300 | 39,125,243 | |
Prologis, Inc. | 638,400 | 24,744,384 | |
The Macerich Co. | 232,118 | 13,137,879 | |
| 129,610,002 | ||
Real Estate Management & Development - 0.3% | |||
CBRE Group, Inc. (a) | 1,295,700 | 34,387,878 | |
TOTAL FINANCIALS | 1,676,789,331 | ||
HEALTH CARE - 13.1% | |||
Biotechnology - 3.3% | |||
Alexion Pharmaceuticals, Inc. (a) | 332,000 | 52,698,360 | |
Amgen, Inc. | 728,565 | 86,662,807 | |
ARIAD Pharmaceuticals, Inc. (a) | 1,053,200 | 7,783,148 | |
Biogen Idec, Inc. (a) | 249,524 | 78,011,183 | |
Gilead Sciences, Inc. (a) | 1,354,092 | 109,207,520 | |
| 334,363,018 | ||
Health Care Equipment & Supplies - 1.8% | |||
Boston Scientific Corp. (a) | 4,389,400 | 59,388,582 | |
Common Stocks - continued | |||
Shares | Value | ||
HEALTH CARE - continued | |||
Health Care Equipment & Supplies - continued | |||
Covidien PLC | 806,851 | $ 55,059,512 | |
Edwards Lifesciences Corp. (a) | 175,700 | 11,441,584 | |
Stryker Corp. | 430,600 | 33,414,560 | |
The Cooper Companies, Inc. | 247,015 | 30,699,024 | |
| 190,003,262 | ||
Health Care Providers & Services - 1.9% | |||
Cigna Corp. | 726,034 | 62,663,995 | |
HCA Holdings, Inc. (a) | 203,100 | 10,209,837 | |
Henry Schein, Inc. (a) | 349,087 | 40,106,605 | |
McKesson Corp. | 353,454 | 61,645,912 | |
MEDNAX, Inc. (a) | 426,300 | 23,719,332 | |
| 198,345,681 | ||
Health Care Technology - 0.4% | |||
Cerner Corp. (a) | 660,500 | 37,575,845 | |
Life Sciences Tools & Services - 1.1% | |||
Illumina, Inc. (a) | 357,400 | 54,324,800 | |
Thermo Fisher Scientific, Inc. | 555,000 | 63,902,700 | |
| 118,227,500 | ||
Pharmaceuticals - 4.6% | |||
AbbVie, Inc. | 1,504,400 | 74,061,612 | |
Actavis PLC (a) | 319,500 | 60,379,110 | |
Bristol-Myers Squibb Co. | 1,452,800 | 72,596,416 | |
Merck & Co., Inc. | 400,146 | 21,195,734 | |
Mylan, Inc. (a) | 320,100 | 14,535,741 | |
Perrigo Co. PLC | 296,700 | 46,184,322 | |
Pfizer, Inc. | 4,005,109 | 121,755,314 | |
Salix Pharmaceuticals Ltd. (a) | 280,500 | 27,303,870 | |
Zoetis, Inc. Class A | 1,145,035 | 34,763,263 | |
| 472,775,382 | ||
TOTAL HEALTH CARE | 1,351,290,688 | ||
INDUSTRIALS - 11.3% | |||
Aerospace & Defense - 1.8% | |||
Honeywell International, Inc. | 856,205 | 78,111,582 | |
United Technologies Corp. | 937,248 | 106,865,017 | |
| 184,976,599 | ||
Common Stocks - continued | |||
Shares | Value | ||
INDUSTRIALS - continued | |||
Air Freight & Logistics - 0.6% | |||
FedEx Corp. | 439,300 | $ 58,567,476 | |
Commercial Services & Supplies - 0.3% | |||
Waste Connections, Inc. | 739,305 | 30,222,788 | |
Construction & Engineering - 0.3% | |||
URS Corp. | 687,200 | 34,497,440 | |
Electrical Equipment - 1.5% | |||
Eaton Corp. PLC | 656,600 | 47,990,894 | |
Hubbell, Inc. Class B | 441,300 | 51,512,949 | |
Rockwell Automation, Inc. | 442,100 | 50,770,764 | |
| 150,274,607 | ||
Industrial Conglomerates - 0.8% | |||
Danaher Corp. | 1,102,796 | 82,036,994 | |
Machinery - 3.5% | |||
Caterpillar, Inc. | 842,900 | 79,156,739 | |
Cummins, Inc. | 431,982 | 54,853,074 | |
Manitowoc Co., Inc. | 1,689,900 | 48,077,655 | |
Pall Corp. | 495,227 | 39,667,683 | |
Parker Hannifin Corp. | 422,700 | 47,921,499 | |
Valmont Industries, Inc. (d) | 290,494 | 42,522,512 | |
Wabtec Corp. | 614,000 | 45,319,340 | |
| 357,518,502 | ||
Professional Services - 1.4% | |||
Nielsen Holdings B.V. | 1,287,100 | 54,431,459 | |
Towers Watson & Co. | 399,248 | 46,680,076 | |
Verisk Analytics, Inc. (a) | 674,700 | 43,086,342 | |
| 144,197,877 | ||
Road & Rail - 1.1% | |||
J.B. Hunt Transport Services, Inc. | 712,950 | 53,506,898 | |
Union Pacific Corp. | 357,500 | 62,290,800 | |
| 115,797,698 | ||
TOTAL INDUSTRIALS | 1,158,089,981 | ||
INFORMATION TECHNOLOGY - 18.0% | |||
Communications Equipment - 2.1% | |||
Cisco Systems, Inc. | 3,334,500 | 73,058,895 | |
F5 Networks, Inc. (a) | 152,200 | 16,285,400 | |
Juniper Networks, Inc. (a) | 1,835,400 | 48,839,994 | |
Common Stocks - continued | |||
Shares | Value | ||
INFORMATION TECHNOLOGY - continued | |||
Communications Equipment - continued | |||
Polycom, Inc. (a) | 712,600 | $ 8,501,318 | |
QUALCOMM, Inc. | 785,000 | 58,262,700 | |
Riverbed Technology, Inc. (a) | 235,500 | 4,644,060 | |
| 209,592,367 | ||
Computers & Peripherals - 3.8% | |||
Apple, Inc. | 564,706 | 282,691,824 | |
EMC Corp. | 821,400 | 19,910,736 | |
NCR Corp. (a) | 2,449,951 | 86,213,776 | |
| 388,816,336 | ||
Internet Software & Services - 5.0% | |||
Facebook, Inc. Class A (a) | 1,535,000 | 96,044,950 | |
Google, Inc. Class A (a) | 244,200 | 288,392,876 | |
Yahoo!, Inc. (a) | 3,590,700 | 129,337,014 | |
| 513,774,840 | ||
IT Services - 2.4% | |||
Cognizant Technology Solutions Corp. Class A (a) | 555,100 | 53,800,292 | |
Fidelity National Information Services, Inc. | 840,300 | 42,603,210 | |
Fiserv, Inc. (a) | 645,100 | 36,157,855 | |
FleetCor Technologies, Inc. (a) | 128,400 | 13,651,488 | |
Global Payments, Inc. | 169,300 | 11,189,037 | |
Visa, Inc. Class A | 418,400 | 90,135,912 | |
| 247,537,794 | ||
Semiconductors & Semiconductor Equipment - 0.1% | |||
Micron Technology, Inc. (a) | 606,500 | 13,973,760 | |
Software - 4.6% | |||
Activision Blizzard, Inc. | 475,582 | 8,146,720 | |
Adobe Systems, Inc. (a) | 797,600 | 47,209,944 | |
Concur Technologies, Inc. (a) | 295,600 | 35,868,104 | |
Electronic Arts, Inc. (a) | 2,654,651 | 70,082,786 | |
Microsoft Corp. | 4,731,800 | 179,098,630 | |
NetSuite, Inc. (a) | 98,200 | 10,328,676 | |
Oracle Corp. | 2,239,300 | 82,630,170 | |
salesforce.com, Inc. (a) | 698,104 | 42,256,235 | |
| 475,621,265 | ||
TOTAL INFORMATION TECHNOLOGY | 1,849,316,362 | ||
Common Stocks - continued | |||
Shares | Value | ||
MATERIALS - 3.7% | |||
Chemicals - 2.9% | |||
Airgas, Inc. | 249,200 | $ 25,727,408 | |
Cabot Corp. | 322,524 | 15,697,243 | |
Eastman Chemical Co. | 448,003 | 34,926,314 | |
FMC Corp. | 519,600 | 36,699,348 | |
LyondellBasell Industries NV Class A | 572,179 | 45,064,818 | |
Monsanto Co. | 473,300 | 50,430,115 | |
Sigma Aldrich Corp. | 323,400 | 30,066,498 | |
The Mosaic Co. | 664,200 | 29,663,172 | |
W.R. Grace & Co. (a) | 286,700 | 27,041,544 | |
| 295,316,460 | ||
Construction Materials - 0.3% | |||
Vulcan Materials Co. | 574,100 | 35,439,193 | |
Containers & Packaging - 0.3% | |||
Rock-Tenn Co. Class A | 285,830 | 29,006,028 | |
Metals & Mining - 0.2% | |||
Carpenter Technology Corp. | 313,400 | 18,211,674 | |
TOTAL MATERIALS | 377,973,355 | ||
TELECOMMUNICATION SERVICES - 2.2% | |||
Diversified Telecommunication Services - 1.3% | |||
Altice S.A. (a) | 57,200 | 2,204,822 | |
Level 3 Communications, Inc. (a) | 469,700 | 15,077,370 | |
TW Telecom, Inc. (a) | 165,300 | 4,869,738 | |
Verizon Communications, Inc. | 2,411,593 | 115,804,696 | |
| 137,956,626 | ||
Wireless Telecommunication Services - 0.9% | |||
SBA Communications Corp. Class A (a) | 705,600 | 65,444,400 | |
T-Mobile U.S., Inc. (a) | 602,163 | 18,408,123 | |
Telephone & Data Systems, Inc. | 226,008 | 6,106,736 | |
| 89,959,259 | ||
TOTAL TELECOMMUNICATION SERVICES | 227,915,885 | ||
UTILITIES - 3.1% | |||
Electric Utilities - 1.2% | |||
American Electric Power Co., Inc. | 552,772 | 26,980,801 | |
Duke Energy Corp. | 367,031 | 25,919,729 | |
Edison International | 397,873 | 19,161,564 | |
NextEra Energy, Inc. | 511,900 | 47,058,967 | |
Common Stocks - continued | |||
Shares | Value | ||
UTILITIES - continued | |||
Electric Utilities - continued | |||
OGE Energy Corp. | 120,885 | $ 4,118,552 | |
PPL Corp. | 158,600 | 4,848,402 | |
| 128,088,015 | ||
Gas Utilities - 0.2% | |||
ONEOK, Inc. | 236,139 | 16,173,160 | |
Independent Power Producers & Energy Traders - 0.4% | |||
NRG Energy, Inc. | 1,092,618 | 30,429,411 | |
The AES Corp. | 831,964 | 11,697,414 | |
| 42,126,825 | ||
Multi-Utilities - 1.3% | |||
Ameren Corp. | 132,500 | 5,013,800 | |
CenterPoint Energy, Inc. | 1,267,964 | 29,670,358 | |
Dominion Resources, Inc. | 321,600 | 21,839,856 | |
NiSource, Inc. | 454,236 | 15,612,091 | |
PG&E Corp. | 406,467 | 17,132,584 | |
Sempra Energy | 448,344 | 41,565,972 | |
| 130,834,661 | ||
TOTAL UTILITIES | 317,222,661 | ||
TOTAL COMMON STOCKS (Cost $7,875,642,542) |
| ||
U.S. Treasury Obligations - 0.1% | ||||
| Principal |
| ||
U.S. Treasury Bills, yield at date of purchase 0.02% to 0.05% 2/6/14 to 4/17/14 (e) | $ 4,970,000 |
| ||
Money Market Funds - 2.1% | |||
Shares | Value | ||
Fidelity Cash Central Fund, 0.10% (b) | 217,234,019 | $ 217,234,019 | |
Fidelity Securities Lending Cash Central Fund, 0.09% (b)(c) | 3,331,575 | 3,331,575 | |
TOTAL MONEY MARKET FUNDS (Cost $220,565,594) |
| ||
TOTAL INVESTMENT PORTFOLIO - 100.2% (Cost $8,101,177,888) | 10,297,831,572 | ||
NET OTHER ASSETS (LIABILITIES) - (0.2)% | (15,783,692) | ||
NET ASSETS - 100% | $ 10,282,047,880 | ||
Futures Contracts | |||||
Expiration | Underlying | Unrealized | |||
Purchased | |||||
Equity Index Contracts | |||||
683 CME E-mini S&P 500 Index Contracts (United States) | March 2014 | $ 60,670,890 | $ (125,455) | ||
|
The face value of futures purchased as a percentage of net assets is 0.6% |
Legend |
(a) Non-income producing |
(b) Affiliated fund that is generally available only to investment companies and other accounts managed by Fidelity Investments. The rate quoted is the annualized seven-day yield of the fund at period end. A complete unaudited listing of the fund's holdings as of its most recent quarter end is available upon request. In addition, each Fidelity Central Fund's financial statements, which are not covered by the Fund's Report of Independent Registered Public Accounting Firm, are available on the SEC's website or upon request. |
(c) Investment made with cash collateral received from securities on loan. |
(d) Security or a portion of the security is on loan at period end. |
(e) Security or a portion of the security was pledged to cover margin requirements for futures contracts. At period end, the value of securities pledged amounted to $4,969,860. |
(f) Investment is owned by an entity that is treated as a corporation for U.S. tax purposes and is owned by the Fund. |
(g) Restricted securities - Investment in securities not registered under the Securities Act of 1933 (excluding 144A issues). At the end of the period, the value of restricted securities (excluding 144A issues) amounted to $6,681,918 or 0.1% of net assets. |
Additional information on each restricted holding is as follows: |
Security | Acquisition | Acquisition |
Legend Pictures LLC | 9/23/10 | $ 2,779,500 |
Affiliated Central Funds |
Information regarding fiscal year to date income earned by the Fund from investments in Fidelity Central Funds is as follows: |
Fund | Income earned |
Fidelity Cash Central Fund | $ 211,528 |
Fidelity Securities Lending Cash Central Fund | 76,901 |
Total | $ 288,429 |
Other Information |
The following is a summary of the inputs used, as of January 31, 2014, involving the Fund's assets and liabilities carried at fair value. The inputs or methodology used for valuing securities may not be an indication of the risk associated with investing in those securities. For more information on valuation inputs, and their aggregation into the levels used in the table below, please refer to the Investment Valuation section in the accompanying Notes to Financial Statements. |
Valuation Inputs at Reporting Date: | ||||
Description | Total | Level 1 | Level 2 | Level 3 |
Investments in Securities: | ||||
Equities: | ||||
Consumer Discretionary | $ 1,301,431,733 | $ 1,294,749,815 | $ - | $ 6,681,918 |
Consumer Staples | 879,277,378 | 879,277,378 | - | - |
Energy | 932,988,744 | 932,988,744 | - | - |
Financials | 1,676,789,331 | 1,676,789,331 | - | - |
Health Care | 1,351,290,688 | 1,351,290,688 | - | - |
Industrials | 1,158,089,981 | 1,158,089,981 | - | - |
Information Technology | 1,849,316,362 | 1,849,316,362 | - | - |
Materials | 377,973,355 | 377,973,355 | - | - |
Telecommunication Services | 227,915,885 | 227,915,885 | - | - |
Utilities | 317,222,661 | 317,222,661 | - | - |
U.S. Government and Government Agency Obligations | 4,969,860 | - | 4,969,860 | - |
Money Market Funds | 220,565,594 | 220,565,594 | - | - |
Total Investments in Securities: | $ 10,297,831,572 | $ 10,286,179,794 | $ 4,969,860 | $ 6,681,918 |
Derivative Instruments: | ||||
Liabilities | ||||
Futures Contracts | $ (125,455) | $ (125,455) | $ - | $ - |
Value of Derivative Instruments |
The following table is a summary of the Fund's value of derivative instruments by primary risk exposure as of January 31, 2014. For additional information on derivative instruments, please refer to the Derivative Instruments section in the accompanying Notes to Financial Statements. |
Primary Risk Exposure / | Value | |
| Asset | Liability |
Equity Risk | ||
Futures Contracts (a) | $ - | $ (125,455) |
Total Value of Derivatives | $ - | $ (125,455) |
(a) Reflects gross cumulative appreciation (depreciation) on futures contracts as presented in the Schedule of Investments. Only the period end receivable or payable for daily variation margin and net unrealized appreciation (depreciation) are presented in the Statement of Assets and Liabilities. |
See accompanying notes which are an integral part of the financial statements.
Annual Report
Fidelity Series All-Sector Equity Fund
Financial Statements
Statement of Assets and Liabilities
| January 31, 2014 | |
|
|
|
Assets | ||
Investment in securities, at value (including securities loaned of $3,234,998) - See accompanying schedule: Unaffiliated issuers (cost $7,880,612,294) | $ 10,077,265,978 |
|
Fidelity Central Funds (cost $220,565,594) | 220,565,594 |
|
Total Investments (cost $8,101,177,888) |
| $ 10,297,831,572 |
Cash |
| 289,572 |
Receivable for investments sold | 169,773,120 | |
Receivable for fund shares sold | 1,253,529 | |
Dividends receivable | 5,808,154 | |
Distributions receivable from Fidelity Central Funds | 9,239 | |
Prepaid expenses | 18,469 | |
Other receivables | 240,581 | |
Total assets | 10,475,224,236 | |
|
|
|
Liabilities | ||
Payable for investments purchased | $ 148,424,412 | |
Payable for fund shares redeemed | 36,320,818 | |
Accrued management fee | 3,928,034 | |
Payable for daily variation margin for derivative instruments | 224,923 | |
Other affiliated payables | 851,958 | |
Other payables and accrued expenses | 94,636 | |
Collateral on securities loaned, at value | 3,331,575 | |
Total liabilities | 193,176,356 | |
|
|
|
Net Assets | $ 10,282,047,880 | |
Net Assets consist of: |
| |
Paid in capital | $ 7,770,236,960 | |
Undistributed net investment income | 2,324,228 | |
Accumulated undistributed net realized gain (loss) on investments and foreign currency transactions | 313,006,683 | |
Net unrealized appreciation (depreciation) on investments and assets and liabilities in foreign currencies | 2,196,480,009 | |
Net Assets | $ 10,282,047,880 | |
See accompanying notes which are an integral part of the financial statements.
Annual Report
Fidelity Series All-Sector Equity Fund
Financial Statements - continued
Statement of Assets and Liabilities - continued
| January 31, 2014 | |
|
|
|
Series All-Sector Equity: | $ 13.89 | |
|
|
|
Class F: | $ 13.88 | |
See accompanying notes which are an integral part of the financial statements.
Annual Report
Statement of Operations
| Year ended January 31, 2014 | |
|
|
|
Investment Income |
|
|
Dividends |
| $ 160,947,934 |
Interest |
| 3,360 |
Income from Fidelity Central Funds |
| 288,429 |
Total income |
| 161,239,723 |
|
|
|
Expenses | ||
Management fee | $ 57,944,006 | |
Performance adjustment | (10,365,403) | |
Transfer agent fees | 9,707,865 | |
Accounting and security lending fees | 1,312,390 | |
Custodian fees and expenses | 192,230 | |
Independent trustees' compensation | 53,342 | |
Audit | 88,336 | |
Legal | 34,629 | |
Interest | 568 | |
Miscellaneous | 111,519 | |
Total expenses before reductions | 59,079,482 | |
Expense reductions | (307,707) | 58,771,775 |
Net investment income (loss) | 102,467,948 | |
Realized and Unrealized Gain (Loss) Net realized gain (loss) on: | ||
Investment securities: |
|
|
Unaffiliated issuers | 1,146,172,815 | |
Redemption in-kind with affiliated entities | 145,619,946 | |
Foreign currency transactions | 7,656 | |
Futures contracts | 15,766,207 | |
Total net realized gain (loss) |
| 1,307,566,624 |
Change in net unrealized appreciation (depreciation) on: Investment securities | 874,346,074 | |
Assets and liabilities in foreign currencies | (25,976) | |
Futures contracts | (2,330,613) | |
Total change in net unrealized appreciation (depreciation) |
| 871,989,485 |
Net gain (loss) | 2,179,556,109 | |
Net increase (decrease) in net assets resulting from operations | $ 2,282,024,057 | |
See accompanying notes which are an integral part of the financial statements.
Annual Report
Fidelity Series All-Sector Equity Fund
Financial Statements - continued
Statement of Changes in Net Assets
| Year ended | Year ended |
Increase (Decrease) in Net Assets |
|
|
Operations |
|
|
Net investment income (loss) | $ 102,467,948 | $ 163,098,693 |
Net realized gain (loss) | 1,307,566,624 | 2,114,719,246 |
Change in net unrealized appreciation (depreciation) | 871,989,485 | (492,436,742) |
Net increase (decrease) in net assets resulting | 2,282,024,057 | 1,785,381,197 |
Distributions to shareholders from net investment income | (106,039,462) | (157,359,845) |
Distributions to shareholders from net realized gain | (1,086,007,967) | (657,260,030) |
Total distributions | (1,192,047,429) | (814,619,875) |
Share transactions - net increase (decrease) | (590,388,512) | (2,796,069,213) |
Total increase (decrease) in net assets | 499,588,116 | (1,825,307,891) |
|
|
|
Net Assets | ||
Beginning of period | 9,782,459,764 | 11,607,767,655 |
End of period (including undistributed net investment income of $2,324,228 and undistributed net investment income of $5,334,648, respectively) | $ 10,282,047,880 | $ 9,782,459,764 |
See accompanying notes which are an integral part of the financial statements.
Annual Report
Financial Highlights - Series All-Sector Equity
Years ended January 31, | 2014 | 2013 | 2012 | 2011 | 2010 |
Selected Per-Share Data |
|
|
|
| |
Net asset value, beginning of period | $ 12.57 | $ 11.82 | $ 12.98 | $ 11.32 | $ 8.48 |
Income from Investment Operations |
|
|
|
|
|
Net investment income (loss) B | .12 | .16 | .10 | .09 | .09 |
Net realized and unrealized gain (loss) | 2.86 | 1.72 | (.15) | 2.63 | 3.18 |
Total from investment operations | 2.98 | 1.88 | (.05) | 2.72 | 3.27 |
Distributions from net investment income | (.14) | (.21) | (.10) | (.08) | (.08) |
Distributions from net realized gain | (1.52) | (.92) | (1.01) | (.98) | (.35) |
Total distributions | (1.66) | (1.13) | (1.11) | (1.06) | (.43) |
Net asset value, end of period | $ 13.89 | $ 12.57 | $ 11.82 | $ 12.98 | $ 11.32 |
Total Return A | 24.13% | 16.32% | (.12)% | 24.87% | 38.51% |
Ratios to Average Net Assets C, E |
|
|
|
| |
Expenses before reductions | .65% | .73% | .89% | .91% | .90% |
Expenses net of fee waivers, if any | .65% | .73% | .89% | .91% | .90% |
Expenses net of all reductions | .65% | .71% | .87% | .89% | .88% |
Net investment income (loss) | .89% | 1.25% | .81% | .79% | .88% |
Supplemental Data |
|
|
|
| |
Net assets, end of period (000 omitted) | $ 5,164,386 | $ 5,293,761 | $ 7,338,658 | $ 8,937,188 | $ 7,142,899 |
Portfolio turnover rate D | 72% | 124% | 135% | 117% | 144% |
A Total returns would have been lower if certain expenses had not been reduced during the applicable periods shown.
B Calculated based on average shares outstanding during the period.
C Fees and expenses of any underlying Fidelity Central Funds are not included in the Fund's expense ratio. The Fund indirectly bears its proportionate share of the expenses of any underlying Fidelity Central Funds.
D Amount does not include the portfolio activity of any underlying Fidelity Central Funds.
E Expense ratios reflect operating expenses of the class. Expenses before reductions do not reflect amounts reimbursed by the investment adviser or reductions from brokerage service arrangements or reductions from other expense offset arrangements and do not represent the amount paid by the class during periods when reimbursements or reductions occur. Expenses net of fee waivers reflect expenses after reimbursement by the investment adviser but prior to reductions from brokerage service arrangements or other expense offset arrangements. Expenses net of all reductions represent the net expenses paid by the class.
See accompanying notes which are an integral part of the financial statements.
Annual Report
Financial Highlights - Class F
Years ended January 31, | 2014 | 2013 | 2012 | 2011 | 2010 G |
Selected Per-Share Data |
|
|
|
| |
Net asset value, beginning of period | $ 12.56 | $ 11.82 | $ 12.98 | $ 11.32 | $ 9.84 |
Income from Investment Operations |
|
|
|
|
|
Net investment income (loss) D | .15 | .18 | .12 | .12 | .04 |
Net realized and unrealized gain (loss) | 2.86 | 1.72 | (.14) | 2.63 | 1.89 |
Total from investment operations | 3.01 | 1.90 | (.02) | 2.75 | 1.93 |
Distributions from net investment income | (.17) | (.24) | (.13) | (.11) | (.10) |
Distributions from net realized gain | (1.52) | (.92) | (1.01) | (.98) | (.35) |
Total distributions | (1.69) | (1.16) | (1.14) | (1.09) | (.45) |
Net asset value, end of period | $ 13.88 | $ 12.56 | $ 11.82 | $ 12.98 | $ 11.32 |
Total Return B, C | 24.37% | 16.54% | .10% | 25.12% | 19.49% |
Ratios to Average Net Assets E, H |
|
|
|
| |
Expenses before reductions | .47% | .53% | .68% | .69% | .63% A |
Expenses net of fee waivers, if any | .47% | .53% | .68% | .69% | .63% A |
Expenses net of all reductions | .47% | .51% | .67% | .67% | .61% A |
Net investment income (loss) | 1.07% | 1.44% | 1.01% | 1.01% | .62% A |
Supplemental Data |
|
|
|
|
|
Net assets, end of period (000 omitted) | $ 5,117,662 | $ 4,488,699 | $ 4,269,110 | $ 2,364,419 | $ 400,571 |
Portfolio turnover rate F | 72% | 124% | 135% | 117% | 144% |
A Annualized
B Total returns for periods of less than one year are not annualized.
C Total returns would have been lower if certain expenses had not been reduced during the applicable periods shown.
D Calculated based on average shares outstanding during the period.
E Fees and expenses of any underlying Fidelity Central Funds are not included in the Fund's expense ratio. The Fund indirectly bears its proportionate share of the expenses of any underlying Fidelity Central Funds.
F Amount does not include the portfolio activity of any underlying Fidelity Central Funds.
G For the period June 26, 2009 (commencement of sale of shares) to January 31, 2010.
H Expense ratios reflect operating expenses of the class. Expenses before reductions do not reflect amounts reimbursed by the investment adviser or reductions from brokerage service arrangements or reductions from other expense offset arrangements and do not represent the amount paid by the class during periods when reimbursements or reductions occur. Expense ratios before reductions for start-up periods may not be representative of longer-term operating periods. Expenses net of fee waivers reflect expenses after reimbursement by the investment adviser but prior to reductions from brokerage service arrangements or other expense offset arrangements. Expenses net of all reductions represent the net expenses paid by the class.
See accompanying notes which are an integral part of the financial statements.
Annual Report
Fidelity Series Equity-Income Fund
Investment Changes (Unaudited)
Top Ten Stocks as of January 31, 2014 | ||
| % of fund's | % of fund's net assets |
JPMorgan Chase & Co.* | 4.2 | 4.1 |
Chevron Corp. | 4.1 | 4.4 |
Exxon Mobil Corp.* | 3.9 | 3.8 |
General Electric Co. | 3.1 | 3.1 |
MetLife, Inc.* | 3.1 | 2.9 |
Wells Fargo & Co. | 2.9 | 4.2 |
Cisco Systems, Inc. | 2.7 | 2.6 |
Procter & Gamble Co. | 2.5 | 2.5 |
Johnson & Johnson | 2.3 | 2.6 |
Merck & Co., Inc.* | 2.2 | 2.2 |
| 31.0 | |
* Security or a portion of the security is pledged as collateral for call options written.
Top Five Market Sectors as of January 31, 2014 | ||
| % of fund's | % of fund's net assets |
Financials | 22.7 | 25.4 |
Energy | 14.7 | 14.5 |
Information Technology | 12.0 | 10.1 |
Consumer Staples | 11.7 | 9.6 |
Health Care | 9.3 | 11.5 |
Asset Allocation (% of fund's net assets) | |||||||
As of January 31, 2014 * | As of July 31, 2013 ** | ||||||
| Stocks 96.8% |
| | Stocks 96.1% |
| ||
| Short-Term |
| | Short-Term |
| ||
* Foreign investments | 3.6% |
| ** Foreign investments | 3.4% |
| ||
* Written options | (0.1)% |
| ** Written options | 0.0% |
| ||

Annual Report
Fidelity Series Equity-Income Fund
Investments January 31, 2014
Showing Percentage of Net Assets
Common Stocks - 96.8% | |||
Shares | Value | ||
CONSUMER DISCRETIONARY - 7.9% | |||
Auto Components - 0.3% | |||
Gentex Corp. | 1,062,335 | $ 34,409,031 | |
Hotels, Restaurants & Leisure - 1.9% | |||
Darden Restaurants, Inc. | 332,458 | 16,436,724 | |
McDonald's Corp. | 1,223,769 | 115,242,327 | |
Texas Roadhouse, Inc. Class A | 668,972 | 16,222,571 | |
Yum! Brands, Inc. | 967,733 | 64,983,271 | |
| 212,884,893 | ||
Media - 2.6% | |||
Comcast Corp. Class A | 2,992,203 | 162,925,453 | |
Sinclair Broadcast Group, Inc. Class A | 520,400 | 16,350,968 | |
Time Warner, Inc. (e) | 1,775,690 | 111,566,603 | |
| 290,843,024 | ||
Multiline Retail - 2.3% | |||
Kohl's Corp. | 1,729,100 | 87,544,333 | |
Target Corp. | 3,047,594 | 172,615,724 | |
| 260,160,057 | ||
Specialty Retail - 0.8% | |||
Abercrombie & Fitch Co. Class A | 649,405 | 22,975,949 | |
Foot Locker, Inc. | 868,800 | 33,535,680 | |
Staples, Inc. | 2,008,800 | 26,435,808 | |
| 82,947,437 | ||
TOTAL CONSUMER DISCRETIONARY | 881,244,442 | ||
CONSUMER STAPLES - 11.7% | |||
Beverages - 1.7% | |||
Molson Coors Brewing Co. Class B | 925,400 | 48,713,056 | |
The Coca-Cola Co. | 3,673,807 | 138,943,381 | |
| 187,656,437 | ||
Food & Staples Retailing - 2.5% | |||
CVS Caremark Corp. | 942,043 | 63,795,152 | |
Wal-Mart Stores, Inc. | 678,800 | 50,692,784 | |
Walgreen Co. | 2,944,868 | 168,888,180 | |
| 283,376,116 | ||
Food Products - 1.3% | |||
B&G Foods, Inc. Class A | 216,094 | 7,081,400 | |
Kellogg Co. | 2,472,697 | 143,366,972 | |
| 150,448,372 | ||
Common Stocks - continued | |||
Shares | Value | ||
CONSUMER STAPLES - continued | |||
Household Products - 2.5% | |||
Procter & Gamble Co. | 3,561,000 | $ 272,843,820 | |
Tobacco - 3.7% | |||
Altria Group, Inc. (e) | 3,932,280 | 138,494,902 | |
Lorillard, Inc. | 2,542,124 | 125,123,343 | |
Philip Morris International, Inc. | 1,126,433 | 88,019,475 | |
Reynolds American, Inc. | 1,188,500 | 57,642,250 | |
| 409,279,970 | ||
TOTAL CONSUMER STAPLES | 1,303,604,715 | ||
ENERGY - 14.7% | |||
Energy Equipment & Services - 1.4% | |||
Ensco PLC Class A | 620,600 | 31,259,622 | |
Halliburton Co. | 92,603 | 4,538,473 | |
National Oilwell Varco, Inc. | 743,665 | 55,782,312 | |
Noble Corp. | 1,255,705 | 38,964,526 | |
Schlumberger Ltd. | 286,400 | 25,080,048 | |
| 155,624,981 | ||
Oil, Gas & Consumable Fuels - 13.3% | |||
Access Midstream Partners LP | 247,494 | 13,872,039 | |
Apache Corp. | 1,210,541 | 97,158,021 | |
Chevron Corp. | 4,122,703 | 460,217,336 | |
CONSOL Energy, Inc. | 1,016,801 | 37,977,517 | |
EV Energy Partners LP | 1,283,574 | 46,131,650 | |
Exxon Mobil Corp. (e) | 4,638,797 | 427,511,532 | |
Hess Corp. | 572,700 | 43,233,123 | |
Holly Energy Partners LP | 553,100 | 17,898,316 | |
HollyFrontier Corp. | 169,006 | 7,824,978 | |
Legacy Reserves LP | 387,700 | 10,111,216 | |
Markwest Energy Partners LP | 803,395 | 56,390,295 | |
Occidental Petroleum Corp. | 1,110,832 | 97,275,558 | |
Scorpio Tankers, Inc. | 422,250 | 4,222,500 | |
The Williams Companies, Inc. | 3,618,733 | 146,522,499 | |
Williams Partners LP | 196,000 | 9,819,600 | |
| 1,476,166,180 | ||
TOTAL ENERGY | 1,631,791,161 | ||
Common Stocks - continued | |||
Shares | Value | ||
FINANCIALS - 22.7% | |||
Capital Markets - 3.6% | |||
Apollo Global Management LLC Class A | 357,891 | $ 11,613,563 | |
Apollo Investment Corp. | 5,551,813 | 46,857,302 | |
Ares Capital Corp. | 498,725 | 8,832,420 | |
BlackRock, Inc. Class A (e) | 70,402 | 21,153,689 | |
Carlyle Group LP | 292,300 | 10,174,963 | |
Charles Schwab Corp. | 2,268,607 | 56,306,826 | |
Greenhill & Co., Inc. | 198,700 | 10,322,465 | |
Invesco Ltd. | 505,200 | 16,797,900 | |
KKR & Co. LP | 2,467,879 | 59,500,563 | |
Morgan Stanley | 2,818,000 | 83,159,180 | |
The Blackstone Group LP | 2,353,339 | 77,071,852 | |
| 401,790,723 | ||
Commercial Banks - 5.9% | |||
CIT Group, Inc. (e) | 202,000 | 9,403,100 | |
Comerica, Inc. | 1,267,300 | 58,042,340 | |
M&T Bank Corp. | 1,063,900 | 118,635,489 | |
PNC Financial Services Group, Inc. | 266,500 | 21,288,020 | |
U.S. Bancorp | 2,931,600 | 116,472,468 | |
Wells Fargo & Co. | 7,223,100 | 327,495,354 | |
| 651,336,771 | ||
Diversified Financial Services - 4.8% | |||
JPMorgan Chase & Co. (e) | 8,448,330 | 467,699,543 | |
KKR Financial Holdings LLC | 5,849,100 | 70,774,110 | |
| 538,473,653 | ||
Insurance - 5.5% | |||
ACE Ltd. | 993,518 | 93,201,924 | |
AFLAC, Inc. | 328,537 | 20,625,553 | |
MetLife, Inc. (e) | 6,908,600 | 338,866,830 | |
Prudential Financial, Inc. | 1,012,709 | 85,462,513 | |
The Travelers Companies, Inc. | 331,557 | 26,948,953 | |
Validus Holdings Ltd. | 1,358,046 | 48,781,012 | |
| 613,886,785 | ||
Real Estate Investment Trusts - 2.8% | |||
American Capital Agency Corp. | 3,288,525 | 68,894,599 | |
Annaly Capital Management, Inc. | 5,824,204 | 62,726,677 | |
CBL & Associates Properties, Inc. | 1,284,400 | 21,821,956 | |
Coresite Realty Corp. | 305,455 | 9,371,359 | |
First Potomac Realty Trust | 1,666,132 | 21,759,684 | |
Home Properties, Inc. | 707,076 | 39,419,487 | |
Common Stocks - continued | |||
Shares | Value | ||
FINANCIALS - continued | |||
Real Estate Investment Trusts - continued | |||
Piedmont Office Realty Trust, Inc. Class A | 692,437 | $ 11,542,925 | |
Rayonier, Inc. | 561,700 | 24,860,842 | |
Retail Properties America, Inc. | 1,025,850 | 13,530,962 | |
Two Harbors Investment Corp. | 2,525,869 | 24,829,292 | |
Ventas, Inc. | 154,100 | 9,614,299 | |
| 308,372,082 | ||
Thrifts & Mortgage Finance - 0.1% | |||
Radian Group, Inc. | 818,392 | 12,177,673 | |
TOTAL FINANCIALS | 2,526,037,687 | ||
HEALTH CARE - 9.3% | |||
Biotechnology - 0.2% | |||
Amgen, Inc. | 205,177 | 24,405,804 | |
Health Care Equipment & Supplies - 0.9% | |||
Baxter International, Inc. | 749,476 | 51,189,211 | |
Covidien PLC | 447,600 | 30,544,224 | |
St. Jude Medical, Inc. | 347,900 | 21,127,967 | |
| 102,861,402 | ||
Health Care Providers & Services - 1.4% | |||
Aetna, Inc. | 284,614 | 19,447,675 | |
Quest Diagnostics, Inc. | 623,916 | 32,755,590 | |
UnitedHealth Group, Inc. | 975,163 | 70,484,782 | |
WellPoint, Inc. | 306,332 | 26,344,552 | |
| 149,032,599 | ||
Pharmaceuticals - 6.8% | |||
AbbVie, Inc. | 483,631 | 23,809,154 | |
Actavis PLC (a) | 255,601 | 48,303,477 | |
Eli Lilly & Co. | 842,643 | 45,511,148 | |
Johnson & Johnson | 2,835,100 | 250,821,297 | |
Merck & Co., Inc. (e) | 4,671,624 | 247,455,923 | |
Pfizer, Inc. | 4,519,677 | 137,398,181 | |
| 753,299,180 | ||
TOTAL HEALTH CARE | 1,029,598,985 | ||
Common Stocks - continued | |||
Shares | Value | ||
INDUSTRIALS - 9.0% | |||
Aerospace & Defense - 0.7% | |||
United Technologies Corp. (e) | 673,900 | $ 76,838,078 | |
Air Freight & Logistics - 2.2% | |||
C.H. Robinson Worldwide, Inc. | 1,279,872 | 74,923,707 | |
United Parcel Service, Inc. Class B | 1,758,200 | 167,433,386 | |
| 242,357,093 | ||
Commercial Services & Supplies - 0.9% | |||
Republic Services, Inc. | 3,129,907 | 100,250,921 | |
Electrical Equipment - 0.6% | |||
Eaton Corp. PLC | 238,000 | 17,395,420 | |
Emerson Electric Co. | 371,740 | 24,512,536 | |
Hubbell, Inc. Class B | 183,181 | 21,382,718 | |
| 63,290,674 | ||
Industrial Conglomerates - 3.1% | |||
General Electric Co. | 13,707,377 | 344,466,384 | |
Machinery - 1.0% | |||
Cummins, Inc. | 288,635 | 36,650,872 | |
Stanley Black & Decker, Inc. (e) | 962,353 | 74,486,122 | |
| 111,136,994 | ||
Professional Services - 0.1% | |||
Acacia Research Corp. | 593,894 | 8,207,615 | |
Road & Rail - 0.4% | |||
CSX Corp. | 1,885,000 | 50,725,350 | |
TOTAL INDUSTRIALS | 997,273,109 | ||
INFORMATION TECHNOLOGY - 12.0% | |||
Communications Equipment - 3.1% | |||
Cisco Systems, Inc. | 13,693,649 | 300,027,850 | |
QUALCOMM, Inc. | 614,280 | 45,591,862 | |
| 345,619,712 | ||
Computers & Peripherals - 0.4% | |||
Apple, Inc. | 100,307 | 50,213,684 | |
Electronic Equipment & Components - 0.4% | |||
TE Connectivity Ltd. | 758,008 | 42,835,032 | |
IT Services - 3.7% | |||
IBM Corp. | 1,254,945 | 221,723,683 | |
Paychex, Inc. | 4,446,642 | 185,958,568 | |
| 407,682,251 | ||
Common Stocks - continued | |||
Shares | Value | ||
INFORMATION TECHNOLOGY - continued | |||
Office Electronics - 0.2% | |||
Xerox Corp. | 1,992,201 | $ 21,615,381 | |
Semiconductors & Semiconductor Equipment - 2.2% | |||
Applied Materials, Inc. | 6,499,571 | 109,322,784 | |
Broadcom Corp. Class A | 3,661,272 | 108,959,455 | |
Maxim Integrated Products, Inc. | 805,353 | 24,369,982 | |
| 242,652,221 | ||
Software - 2.0% | |||
CA Technologies, Inc. | 1,566,600 | 50,256,528 | |
Microsoft Corp. | 4,594,700 | 173,909,395 | |
| 224,165,923 | ||
TOTAL INFORMATION TECHNOLOGY | 1,334,784,204 | ||
MATERIALS - 0.6% | |||
Chemicals - 0.3% | |||
RPM International, Inc. | 681,947 | 27,052,837 | |
Tronox Ltd. Class A | 167,000 | 3,667,320 | |
| 30,720,157 | ||
Metals & Mining - 0.3% | |||
Commercial Metals Co. | 1,495,661 | 28,507,299 | |
Freeport-McMoRan Copper & Gold, Inc. | 90,600 | 2,936,346 | |
| 31,443,645 | ||
TOTAL MATERIALS | 62,163,802 | ||
TELECOMMUNICATION SERVICES - 3.9% | |||
Diversified Telecommunication Services - 3.9% | |||
AT&T, Inc. | 4,910,408 | 163,614,795 | |
CenturyLink, Inc. | 2,349,800 | 67,815,228 | |
Verizon Communications, Inc. | 4,298,552 | 206,416,467 | |
| 437,846,490 | ||
UTILITIES - 5.0% | |||
Electric Utilities - 4.6% | |||
American Electric Power Co., Inc. | 753,501 | 36,778,384 | |
Duke Energy Corp. | 722,760 | 51,041,311 | |
Exelon Corp. | 642,639 | 18,636,531 | |
FirstEnergy Corp. | 1,511,567 | 47,599,245 | |
Hawaiian Electric Industries, Inc. (d) | 1,138,602 | 29,626,424 | |
Common Stocks - continued | |||
Shares | Value | ||
UTILITIES - continued | |||
Electric Utilities - continued | |||
NextEra Energy, Inc. | 699,575 | $ 64,311,930 | |
Northeast Utilities | 305,109 | 13,363,774 | |
PPL Corp. | 3,160,520 | 96,617,096 | |
Southern Co. | 2,962,838 | 122,187,439 | |
Xcel Energy, Inc. | 1,191,747 | 34,453,406 | |
| 514,615,540 | ||
Multi-Utilities - 0.4% | |||
CenterPoint Energy, Inc. | 156,073 | 3,652,108 | |
Sempra Energy | 399,002 | 36,991,475 | |
| 40,643,583 | ||
TOTAL UTILITIES | 555,259,123 | ||
TOTAL COMMON STOCKS (Cost $10,068,634,221) |
| ||
Money Market Funds - 3.8% | |||
|
|
|
|
Fidelity Cash Central Fund, 0.10% (b) | 416,267,364 | 416,267,364 | |
Fidelity Securities Lending Cash Central Fund, 0.09% (b)(c) | 9,849,600 | 9,849,600 | |
TOTAL MONEY MARKET FUNDS (Cost $426,116,964) |
| ||
TOTAL INVESTMENT PORTFOLIO - 100.6% (Cost $10,494,751,185) | 11,185,720,682 | ||
NET OTHER ASSETS (LIABILITIES) - (0.6)% | (63,331,630) | ||
NET ASSETS - 100% | $ 11,122,389,052 | ||
Written Options | |||||||
Expiration | Number of | Premium | Value | ||||
Call Options | |||||||
Altria Group, Inc. | 3/22/14 - | 10,964 | $ 421,018 | $ (93,194) | |||
BlackRock, Inc. Class A | 3/22/14 - | 176 | 33,862 | (33,440) | |||
CIT Group, Inc. | 4/19/14 - | 1,010 | 93,969 | (67,670) | |||
Exxon Mobil Corp. | 4/19/14 - | 11,597 | 967,190 | (434,888) | |||
JPMorgan Chase & Co. | 4/19/14 - | 16,897 | 880,825 | (1,081,408) | |||
Merck & Co., Inc. | 3/22/14 - | 15,416 | 2,646,950 | (2,481,976) | |||
MetLife, Inc. | 4/19/14 - | 22,798 | 761,909 | (957,516) | |||
Stanley Black & Decker, Inc. | 4/19/14 - | 3,176 | 166,422 | (174,680) | |||
Time Warner, Inc. | 3/22/14 - | 5,860 | 290,070 | (307,650) | |||
United Technologies Corp. | 3/22/14 - | 2,224 | 479,050 | (494,840) | |||
TOTAL WRITTEN OPTIONS |
| $ 6,741,265 | $ (6,127,262) | ||||
Legend |
(a) Non-income producing |
(b) Affiliated fund that is generally available only to investment companies and other accounts managed by Fidelity Investments. The rate quoted is the annualized seven-day yield of the fund at period end. A complete unaudited listing of the fund's holdings as of its most recent quarter end is available upon request. In addition, each Fidelity Central Fund's financial statements, which are not covered by the Fund's Report of Independent Registered Public Accounting Firm, are available on the SEC's website or upon request. |
(c) Investment made with cash collateral received from securities on loan. |
(d) Security or a portion of the security is on loan at period end. |
(e) Security or a portion of the security is pledged as collateral for call options written. At period end, the value of securities pledged amounted to $529,266,184. |
Affiliated Central Funds |
Information regarding fiscal year to date income earned by the Fund from investments in Fidelity Central Funds is as follows: |
Fund | Income earned |
Fidelity Cash Central Fund | $ 303,759 |
Fidelity Securities Lending Cash Central Fund | 97,157 |
Total | $ 400,916 |
Other Information |
All investments and derivative instruments are categorized as Level 1 under the Fair Value Hierarchy. The inputs or methodology used for valuing securities may not be an indication of the risk associated with investing in those securities. For more information on valuation inputs, please refer to the Investment Valuation section in the accompanying Notes to Financial Statements. |
Value of Derivative Instruments |
The following table is a summary of the Fund's value of derivative instruments by primary risk exposure as of January 31, 2014. For additional information on derivative instruments, please refer to the Derivative Instruments section in the accompanying Notes to Financial Statements. |
Primary Risk Exposure / | Value | |
| Asset | Liability |
Equity Risk | ||
Written Options (a) | $ - | $ (6,127,262) |
Total Value of Derivatives | $ - | $ (6,127,262) |
(a) Gross value is presented in the Statement of Assets and Liabilities in the written options, at value line-item. |
See accompanying notes which are an integral part of the financial statements.
Annual Report
Fidelity Series Equity-Income Fund
Financial Statements
Statement of Assets and Liabilities
| January 31, 2014 | |
|
|
|
Assets | ||
Investment in securities, at value (including securities loaned of $9,492,096) - See accompanying schedule: Unaffiliated issuers (cost $10,068,634,221) | $ 10,759,603,718 |
|
Fidelity Central Funds (cost $426,116,964) | 426,116,964 |
|
Total Investments (cost $10,494,751,185) |
| $ 11,185,720,682 |
Cash |
| 629,641 |
Receivable for fund shares sold | 1,579,915 | |
Dividends receivable | 11,828,166 | |
Distributions receivable from Fidelity Central Funds | 18,992 | |
Prepaid expenses | 18,835 | |
Other affiliated receivables | 120,792 | |
Other receivables | 32,426 | |
Total assets | 11,199,949,449 | |
|
|
|
Liabilities | ||
Payable for investments purchased | $ 13,748,525 | |
Payable for fund shares redeemed | 42,641,411 | |
Accrued management fee | 4,291,693 | |
Written options, at value (premium received $6,741,265) | 6,127,262 | |
Other affiliated payables | 810,027 | |
Other payables and accrued expenses | 91,879 | |
Collateral on securities loaned, at value | 9,849,600 | |
Total liabilities | 77,560,397 | |
|
|
|
Net Assets | $ 11,122,389,052 | |
Net Assets consist of: |
| |
Paid in capital | $ 10,390,993,132 | |
Undistributed net investment income | 12,351,091 | |
Accumulated undistributed net realized gain (loss) on investments and foreign currency transactions | 27,461,329 | |
Net unrealized appreciation (depreciation) on investments | 691,583,500 | |
Net Assets | $ 11,122,389,052 | |
See accompanying notes which are an integral part of the financial statements.
Annual Report
Statement of Assets and Liabilities - continued
| January 31, 2014 | |
|
|
|
Series Equity-Income: | $ 11.80 | |
|
|
|
Class F: | $ 11.80 | |
See accompanying notes which are an integral part of the financial statements.
Annual Report
Fidelity Series Equity-Income Fund
Financial Statements - continued
Statement of Operations
| Year ended January 31, 2014 | |
|
|
|
Investment Income |
|
|
Dividends |
| $ 201,584,287 |
Interest |
| 365 |
Income from Fidelity Central Funds |
| 400,916 |
Total income |
| 201,985,568 |
|
|
|
Expenses | ||
Management fee | $ 32,450,103 | |
Transfer agent fees | 5,738,270 | |
Accounting and security lending fees | 1,173,366 | |
Custodian fees and expenses | 103,389 | |
Independent trustees' compensation | 32,913 | |
Audit | 69,850 | |
Legal | 18,799 | |
Miscellaneous | 27,492 | |
Total expenses before reductions | 39,614,182 | |
Expense reductions | (125,754) | 39,488,428 |
Net investment income (loss) | 162,497,140 | |
Realized and Unrealized Gain (Loss) Net realized gain (loss) on: | ||
Investment securities: |
|
|
Unaffiliated issuers | 257,596,297 | |
Foreign currency transactions | (3,000) | |
Written options | 3,967,311 | |
Total net realized gain (loss) |
| 261,560,608 |
Change in net unrealized appreciation (depreciation) on: Investment securities | 422,843,008 | |
Assets and liabilities in foreign currencies | (1,565) | |
Written options | 614,003 | |
Total change in net unrealized appreciation (depreciation) |
| 423,455,446 |
Net gain (loss) | 685,016,054 | |
Net increase (decrease) in net assets resulting from operations | $ 847,513,194 | |
See accompanying notes which are an integral part of the financial statements.
Annual Report
Statement of Changes in Net Assets
| Year ended | For the period |
Increase (Decrease) in Net Assets |
|
|
Operations |
|
|
Net investment income (loss) | $ 162,497,140 | $ 16,933,335 |
Net realized gain (loss) | 261,560,608 | 9,608,052 |
Change in net unrealized appreciation (depreciation) | 423,455,446 | 268,128,054 |
Net increase (decrease) in net assets resulting | 847,513,194 | 294,669,441 |
Distributions to shareholders from net investment income | (154,987,690) | (9,328,125) |
Distributions to shareholders from net realized gain | (246,470,898) | - |
Total distributions | (401,458,588) | (9,328,125) |
Share transactions - net increase (decrease) | 5,430,962,653 | 4,960,030,477 |
Total increase (decrease) in net assets | 5,877,017,259 | 5,245,371,793 |
|
|
|
Net Assets | ||
Beginning of period | 5,245,371,793 | - |
End of period (including undistributed net investment income of $12,351,091 and undistributed net investment income of $7,360,901, respectively) | $ 11,122,389,052 | $ 5,245,371,793 |
See accompanying notes which are an integral part of the financial statements.
Annual Report
Financial Highlights - Series Equity-Income
Years ended January 31, | 2014 | 2013 G |
Selected Per-Share Data |
|
|
Net asset value, beginning of period | $ 10.57 | $ 10.00 |
Income from Investment Operations |
|
|
Net investment income (loss) D | .25 | .03 |
Net realized and unrealized gain (loss) | 1.50 | .56 |
Total from investment operations | 1.75 | .59 |
Distributions from net investment income | (.24) | (.02) |
Distributions from net realized gain | (.28) | - |
Total distributions | (.52) | (.02) |
Net asset value, end of period | $ 11.80 | $ 10.57 |
Total Return B, C | 16.57% | 5.89% |
Ratios to Average Net Assets E, H |
|
|
Expenses before reductions | .65% | .68% A |
Expenses net of fee waivers, if any | .65% | .68% A |
Expenses net of all reductions | .65% | .59% A |
Net investment income (loss) | 2.17% | 2.17% A |
Supplemental Data |
|
|
Net assets, end of period (000 omitted) | $ 4,826,469 | $ 2,493,356 |
Portfolio turnover rate F | 42% | 47% I |
A Annualized
B Total returns for periods of less than one year are not annualized.
C Total returns would have been lower if certain expenses had not been reduced during the applicable periods shown.
D Calculated based on average shares outstanding during the period.
E Fees and expenses of any underlying Fidelity Central Funds are not included in the Fund's expense ratio. The Fund indirectly bears its proportionate share of the expenses of any underlying Fidelity Central Funds.
F Amount does not include the portfolio activity of any underlying Fidelity Central Funds.
G For the period December 6, 2012 (commencement of operations) to January 31, 2013.
H Expense ratios reflect operating expenses of the class. Expenses before reductions do not reflect amounts reimbursed by the investment adviser or reductions from brokerage service arrangements or reductions from other expense offset arrangements and do not represent the amount paid by the class during periods when reimbursements or reductions occur. Expense ratios before reductions for start-up periods may not be representative of longer-term operating periods. Expenses net of fee waivers reflect expenses after reimbursement by the investment adviser but prior to reductions from brokerage service arrangements or other expense offset arrangements. Expenses net of all reductions represent the net expenses paid by the class.
I Amount not annualized.
See accompanying notes which are an integral part of the financial statements.
Annual Report
Financial Highlights - Class F
Years ended January 31, | 2014 | 2013 G |
Selected Per-Share Data |
|
|
Net asset value, beginning of period | $ 10.57 | $ 10.00 |
Income from Investment Operations |
|
|
Net investment income (loss) D | .28 | .04 |
Net realized and unrealized gain (loss) | 1.48 | .55 |
Total from investment operations | 1.76 | .59 |
Distributions from net investment income | (.26) | (.02) |
Distributions from net realized gain | (.28) | - |
Total distributions | (.53) I | (.02) |
Net asset value, end of period | $ 11.80 | $ 10.57 |
Total Return B, C | 16.75% | 5.90% |
Ratios to Average Net Assets E, H |
|
|
Expenses before reductions | .47% | .49% A |
Expenses net of fee waivers, if any | .47% | .49% A |
Expenses net of all reductions | .47% | .40% A |
Net investment income (loss) | 2.35% | 2.35% A |
Supplemental Data |
|
|
Net assets, end of period (000 omitted) | $ 6,295,920 | $ 2,752,016 |
Portfolio turnover rate F | 42% | 47% J |
A Annualized
B Total returns for periods of less than one year are not annualized.
C Total returns would have been lower if certain expenses had not been reduced during the applicable periods shown.
D Calculated based on average shares outstanding during the period.
E Fees and expenses of any underlying Fidelity Central Funds are not included in the Fund's expense ratio. The Fund indirectly bears its proportionate share of the expenses of any underlying Fidelity Central Funds.
F Amount does not include the portfolio activity of any underlying Fidelity Central Funds.
G For the period December 6, 2012 (commencement of operations) to January 31, 2013.
H Expense ratios reflect operating expenses of the class. Expenses before reductions do not reflect amounts reimbursed by the investment adviser or reductions from brokerage service arrangements or reductions from other expense offset arrangements and do not represent the amount paid by the class during periods when reimbursements or reductions occur. Expense ratios before reductions for start-up periods may not be representative of longer-term operating periods. Expenses net of fee waivers reflect expenses after reimbursement by the investment adviser but prior to reductions from brokerage service arrangements or other expense offset arrangements. Expenses net of all reductions represent the net expenses paid by the class.
I Total distributions of $.53 per share is comprised of distributions from net investment income of $.257 and distributions from net realized gain of $.276 per share.
J Amount not annualized.
See accompanying notes which are an integral part of the financial statements.
Annual Report
Fidelity Series Stock Selector Large Cap Value Fund
Investment Changes (Unaudited)
Top Ten Stocks as of January 31, 2014 | ||
| % of fund's | % of fund's net assets |
Chevron Corp. | 4.8 | 6.2 |
Wells Fargo & Co. | 3.4 | 3.8 |
Berkshire Hathaway, Inc. Class B | 3.3 | 3.6 |
General Electric Co. | 3.2 | 2.9 |
Occidental Petroleum Corp. | 2.5 | 2.7 |
Merck & Co., Inc. | 2.1 | 3.2 |
Goldman Sachs Group, Inc. | 2.0 | 0.0 |
U.S. Bancorp | 1.9 | 2.0 |
Cisco Systems, Inc. | 1.9 | 1.2 |
Apple, Inc. | 1.7 | 1.6 |
| 26.8 | |
Top Five Market Sectors as of January 31, 2014 | ||
| % of fund's | % of fund's net assets |
Financials | 26.8 | 28.9 |
Energy | 14.0 | 14.6 |
Health Care | 13.2 | 12.8 |
Industrials | 9.3 | 9.2 |
Information Technology | 8.9 | 8.9 |
Asset Allocation (% of fund's net assets) | |||||||
As of January 31, 2014 * | As of July 31, 2013 ** | ||||||
| Stocks and |
| | Stocks and |
| ||
| Short-Term |
| | Short-Term |
| ||
* Foreign investments | 6.7% |
| ** Foreign investments | 4.9% |
| ||

Annual Report
Fidelity Series Stock Selector Large Cap Value Fund
Investments January 31, 2014
Showing Percentage of Net Assets
Common Stocks - 95.4% | |||
Shares | Value | ||
CONSUMER DISCRETIONARY - 6.3% | |||
Auto Components - 1.5% | |||
Delphi Automotive PLC | 783,149 | $ 47,685,943 | |
TRW Automotive Holdings Corp. (a) | 824,825 | 61,160,774 | |
| 108,846,717 | ||
Internet & Catalog Retail - 0.4% | |||
Liberty Interactive Corp. Series A (a) | 1,084,470 | 28,966,194 | |
Media - 2.2% | |||
Comcast Corp. Class A | 1,186,173 | 64,587,120 | |
Omnicom Group, Inc. | 388,200 | 28,175,556 | |
Twenty-First Century Fox, Inc. Class A | 2,197,340 | 69,919,359 | |
| 162,682,035 | ||
Multiline Retail - 1.5% | |||
Macy's, Inc. | 885,489 | 47,108,015 | |
Target Corp. | 1,080,009 | 61,171,710 | |
| 108,279,725 | ||
Specialty Retail - 0.7% | |||
Staples, Inc. | 4,183,674 | 55,057,150 | |
TOTAL CONSUMER DISCRETIONARY | 463,831,821 | ||
CONSUMER STAPLES - 5.7% | |||
Beverages - 0.3% | |||
Molson Coors Brewing Co. Class B | 470,347 | 24,759,066 | |
Food & Staples Retailing - 1.4% | |||
Wal-Mart Stores, Inc. | 778,369 | 58,128,597 | |
Walgreen Co. | 723,625 | 41,499,894 | |
| 99,628,491 | ||
Food Products - 1.9% | |||
Bunge Ltd. | 592,899 | 44,918,028 | |
Mondelez International, Inc. | 1,709,637 | 55,990,612 | |
The J.M. Smucker Co. | 423,442 | 40,815,574 | |
| 141,724,214 | ||
Household Products - 1.6% | |||
Procter & Gamble Co. | 1,501,015 | 115,007,769 | |
Personal Products - 0.5% | |||
Coty, Inc. Class A | 2,776,490 | 37,454,850 | |
TOTAL CONSUMER STAPLES | 418,574,390 | ||
Common Stocks - continued | |||
Shares | Value | ||
ENERGY - 14.0% | |||
Energy Equipment & Services - 2.5% | |||
Cameron International Corp. (a) | 1,086,520 | $ 65,158,604 | |
National Oilwell Varco, Inc. | 1,282,484 | 96,199,125 | |
Rowan Companies PLC (a) | 743,800 | 23,333,006 | |
| 184,690,735 | ||
Oil, Gas & Consumable Fuels - 11.5% | |||
Anadarko Petroleum Corp. | 1,123,500 | 90,655,215 | |
Apache Corp. | 710,908 | 57,057,476 | |
Chevron Corp. | 3,189,614 | 356,056,610 | |
Energen Corp. | 692,000 | 48,938,240 | |
Marathon Petroleum Corp. | 1,326,500 | 115,471,825 | |
Occidental Petroleum Corp. | 2,091,118 | 183,119,203 | |
| 851,298,569 | ||
TOTAL ENERGY | 1,035,989,304 | ||
FINANCIALS - 26.8% | |||
Capital Markets - 4.3% | |||
BlackRock, Inc. Class A | 325,181 | 97,707,135 | |
Goldman Sachs Group, Inc. | 906,978 | 148,853,229 | |
State Street Corp. | 1,071,146 | 71,713,225 | |
| 318,273,589 | ||
Commercial Banks - 8.1% | |||
CIT Group, Inc. | 1,437,600 | 66,920,280 | |
PNC Financial Services Group, Inc. | 1,414,900 | 113,022,212 | |
Popular, Inc. (a) | 1,111,243 | 29,336,815 | |
U.S. Bancorp | 3,586,592 | 142,495,300 | |
Wells Fargo & Co. | 5,507,825 | 249,724,786 | |
| 601,499,393 | ||
Consumer Finance - 1.6% | |||
Capital One Financial Corp. | 1,667,614 | 117,750,225 | |
Diversified Financial Services - 4.2% | |||
Berkshire Hathaway, Inc. Class B (a) | 2,197,261 | 245,214,328 | |
The NASDAQ Stock Market, Inc. | 1,739,399 | 66,358,072 | |
| 311,572,400 | ||
Insurance - 6.3% | |||
ACE Ltd. | 1,016,980 | 95,402,894 | |
AFLAC, Inc. | 1,088,900 | 68,361,142 | |
Axis Capital Holdings Ltd. | 1,533,065 | 69,018,586 | |
Common Stocks - continued | |||
Shares | Value | ||
FINANCIALS - continued | |||
Insurance - continued | |||
MetLife, Inc. | 1,667,449 | $ 81,788,373 | |
Reinsurance Group of America, Inc. | 887,500 | 66,269,625 | |
The Travelers Companies, Inc. | 990,700 | 80,524,096 | |
| 461,364,716 | ||
Real Estate Investment Trusts - 1.4% | |||
Annaly Capital Management, Inc. | 1,364,800 | 14,698,896 | |
General Growth Properties, Inc. | 1,466,859 | 29,542,540 | |
The Macerich Co. | 480,221 | 27,180,509 | |
Vornado Realty Trust | 346,898 | 31,855,643 | |
| 103,277,588 | ||
Real Estate Management & Development - 0.9% | |||
CBRE Group, Inc. (a) | 2,390,129 | 63,434,024 | |
TOTAL FINANCIALS | 1,977,171,935 | ||
HEALTH CARE - 13.2% | |||
Biotechnology - 1.0% | |||
Amgen, Inc. | 224,462 | 26,699,755 | |
Cubist Pharmaceuticals, Inc. (a) | 714,602 | 52,230,260 | |
| 78,930,015 | ||
Health Care Equipment & Supplies - 1.4% | |||
Covidien PLC | 878,117 | 59,922,704 | |
St. Jude Medical, Inc. | 686,231 | 41,674,809 | |
| 101,597,513 | ||
Health Care Providers & Services - 4.7% | |||
Express Scripts Holding Co. (a) | 564,363 | 42,152,272 | |
HCA Holdings, Inc. (a) | 1,368,900 | 68,814,603 | |
McKesson Corp. | 291,661 | 50,868,595 | |
Quest Diagnostics, Inc. | 515,407 | 27,058,868 | |
Team Health Holdings, Inc. (a) | 337,385 | 14,561,537 | |
UnitedHealth Group, Inc. | 1,560,600 | 112,800,168 | |
WellPoint, Inc. | 337,353 | 29,012,358 | |
| 345,268,401 | ||
Pharmaceuticals - 6.1% | |||
Endo Health Solutions, Inc. (a)(d) | 575,713 | 37,927,972 | |
Jazz Pharmaceuticals PLC (a) | 580,176 | 87,989,492 | |
Johnson & Johnson | 1,343,359 | 118,846,971 | |
Common Stocks - continued | |||
Shares | Value | ||
HEALTH CARE - continued | |||
Pharmaceuticals - continued | |||
Merck & Co., Inc. | 2,896,100 | $ 153,406,417 | |
Pfizer, Inc. | 1,716,598 | 52,184,579 | |
| 450,355,431 | ||
TOTAL HEALTH CARE | 976,151,360 | ||
INDUSTRIALS - 9.3% | |||
Aerospace & Defense - 0.6% | |||
Textron, Inc. | 1,179,900 | 41,886,450 | |
Air Freight & Logistics - 1.3% | |||
FedEx Corp. | 716,437 | 95,515,381 | |
Commercial Services & Supplies - 0.6% | |||
Waste Management, Inc. | 1,031,105 | 43,079,567 | |
Construction & Engineering - 1.8% | |||
AECOM Technology Corp. (a) | 2,234,003 | 64,048,866 | |
URS Corp. | 1,462,058 | 73,395,312 | |
| 137,444,178 | ||
Electrical Equipment - 0.7% | |||
Babcock & Wilcox Co. | 1,442,829 | 49,460,178 | |
Industrial Conglomerates - 3.2% | |||
General Electric Co. | 9,588,570 | 240,960,764 | |
Machinery - 0.4% | |||
Caterpillar, Inc. | 157,307 | 14,772,700 | |
Terex Corp. | 331,459 | 13,589,819 | |
| 28,362,519 | ||
Road & Rail - 0.7% | |||
CSX Corp. | 1,914,524 | 51,519,841 | |
TOTAL INDUSTRIALS | 688,228,878 | ||
INFORMATION TECHNOLOGY - 8.9% | |||
Communications Equipment - 1.9% | |||
Cisco Systems, Inc. | 6,395,735 | 140,130,554 | |
Computers & Peripherals - 3.1% | |||
Apple, Inc. | 249,042 | 124,670,425 | |
EMC Corp. | 4,353,197 | 105,521,495 | |
| 230,191,920 | ||
Electronic Equipment & Components - 0.5% | |||
Jabil Circuit, Inc. | 1,993,679 | 35,826,412 | |
Common Stocks - continued | |||
Shares | Value | ||
INFORMATION TECHNOLOGY - continued | |||
Internet Software & Services - 0.6% | |||
Yahoo!, Inc. (a) | 1,289,225 | $ 46,437,885 | |
IT Services - 0.4% | |||
Total System Services, Inc. | 1,050,196 | 31,379,856 | |
Semiconductors & Semiconductor Equipment - 1.4% | |||
Broadcom Corp. Class A | 3,502,151 | 104,224,014 | |
Software - 1.0% | |||
Oracle Corp. | 1,346,269 | 49,677,326 | |
Symantec Corp. | 901,005 | 19,290,517 | |
| 68,967,843 | ||
TOTAL INFORMATION TECHNOLOGY | 657,158,484 | ||
MATERIALS - 2.4% | |||
Chemicals - 1.8% | |||
Ashland, Inc. | 310,100 | 28,780,381 | |
Axiall Corp. | 496,506 | 19,810,589 | |
Chemtura Corp. (a) | 564,095 | 14,147,503 | |
Eastman Chemical Co. | 541,500 | 42,215,340 | |
LyondellBasell Industries NV Class A | 379,800 | 29,913,048 | |
| 134,866,861 | ||
Metals & Mining - 0.6% | |||
Freeport-McMoRan Copper & Gold, Inc. | 1,387,512 | 44,969,264 | |
TOTAL MATERIALS | 179,836,125 | ||
TELECOMMUNICATION SERVICES - 2.5% | |||
Diversified Telecommunication Services - 2.2% | |||
AT&T, Inc. | 3,064,595 | 102,112,305 | |
CenturyLink, Inc. | 1,492,097 | 43,061,919 | |
Frontier Communications Corp. (d) | 3,082,387 | 14,487,219 | |
| 159,661,443 | ||
Wireless Telecommunication Services - 0.3% | |||
NII Holdings, Inc. (a)(d) | 2,667,599 | 8,029,473 | |
T-Mobile U.S., Inc. (a) | 429,600 | 13,132,872 | |
| 21,162,345 | ||
TOTAL TELECOMMUNICATION SERVICES | 180,823,788 | ||
Common Stocks - continued | |||
Shares | Value | ||
UTILITIES - 6.3% | |||
Electric Utilities - 2.8% | |||
Edison International | 834,000 | $ 40,165,440 | |
ITC Holdings Corp. | 542,630 | 56,162,205 | |
NextEra Energy, Inc. | 804,200 | 73,930,106 | |
Xcel Energy, Inc. | 1,228,500 | 35,515,935 | |
| 205,773,686 | ||
Gas Utilities - 1.0% | |||
Atmos Energy Corp. | 805,431 | 38,668,742 | |
National Fuel Gas Co. | 461,800 | 34,801,248 | |
| 73,469,990 | ||
Multi-Utilities - 2.5% | |||
Ameren Corp. | 1,013,100 | 38,335,704 | |
CMS Energy Corp. | 1,282,500 | 35,640,675 | |
NiSource, Inc. | 1,534,700 | 52,747,639 | |
Sempra Energy | 636,568 | 59,016,219 | |
| 185,740,237 | ||
TOTAL UTILITIES | 464,983,913 | ||
TOTAL COMMON STOCKS (Cost $6,234,441,997) |
| ||
U.S. Treasury Obligations - 0.0% | ||||
| Principal |
| ||
U.S. Treasury Bills, yield at date of purchase 0.04% to 0.05% 2/6/14 to 4/17/14 (e) | $ 3,445,000 |
| ||
Money Market Funds - 6.8% | |||
Shares | Value | ||
Fidelity Cash Central Fund, 0.10% (b) | 449,004,566 | $ 449,004,566 | |
Fidelity Securities Lending Cash Central Fund, 0.09% (b)(c) | 54,377,750 | 54,377,750 | |
TOTAL MONEY MARKET FUNDS (Cost $503,382,316) |
| ||
TOTAL INVESTMENT PORTFOLIO - 102.2% (Cost $6,741,269,167) | 7,549,577,224 | ||
NET OTHER ASSETS (LIABILITIES) - (2.2)% | (164,331,470) | ||
NET ASSETS - 100% | $ 7,385,245,754 | ||
Futures Contracts | |||||
Expiration | Underlying | Unrealized | |||
Purchased | |||||
Equity Index Contracts | |||||
938 ICE Russell 1000 Value Index Contracts (United States) | March 2014 | $ 83,435,100 | $ (151,892) | ||
|
The face value of futures purchased as a percentage of net assets is 1.1% |
Legend |
(a) Non-income producing |
(b) Affiliated fund that is generally available only to investment companies and other accounts managed by Fidelity Investments. The rate quoted is the annualized seven-day yield of the fund at period end. A complete unaudited listing of the fund's holdings as of its most recent quarter end is available upon request. In addition, each Fidelity Central Fund's financial statements, which are not covered by the Fund's Report of Independent Registered Public Accounting Firm, are available on the SEC's website or upon request. |
(c) Investment made with cash collateral received from securities on loan. |
(d) Security or a portion of the security is on loan at period end. |
(e) Security or a portion of the security was pledged to cover margin requirements for futures contracts. At period end, the value of securities pledged amounted to $2,534,911. |
Affiliated Central Funds |
Information regarding fiscal year to date income earned by the Fund from investments in Fidelity Central Funds is as follows: |
Fund | Income earned |
Fidelity Cash Central Fund | $ 232,244 |
Fidelity Securities Lending Cash Central Fund | 219,430 |
Total | $ 451,674 |
Other Information |
The following is a summary of the inputs used, as of January 31, 2014, involving the Fund's assets and liabilities carried at fair value. The inputs or methodology used for valuing securities may not be an indication of the risk associated with investing in those securities. For more information on valuation inputs, and their aggregation into the levels used in the table below, please refer to the Investment Valuation section in the accompanying Notes to Financial Statements. |
Valuation Inputs at Reporting Date: | ||||
Description | Total | Level 1 | Level 2 | Level 3 |
Investments in Securities: | ||||
Equities: | ||||
Consumer Discretionary | $ 463,831,821 | $ 463,831,821 | $ - | $ - |
Consumer Staples | 418,574,390 | 418,574,390 | - | - |
Energy | 1,035,989,304 | 1,035,989,304 | - | - |
Financials | 1,977,171,935 | 1,977,171,935 | - | - |
Health Care | 976,151,360 | 976,151,360 | - | - |
Industrials | 688,228,878 | 688,228,878 | - | - |
Information Technology | 657,158,484 | 657,158,484 | - | - |
Materials | 179,836,125 | 179,836,125 | - | - |
Telecommunication Services | 180,823,788 | 180,823,788 | - | - |
Utilities | 464,983,913 | 464,983,913 | - | - |
U.S. Government and Government Agency Obligations | 3,444,910 | - | 3,444,910 | - |
Money Market Funds | 503,382,316 | 503,382,316 | - | - |
Total Investments in Securities: | $ 7,549,577,224 | $ 7,546,132,314 | $ 3,444,910 | $ - |
Derivative Instruments: | ||||
Liabilities | ||||
Futures Contracts | $ (151,892) | $ (151,892) | $ - | $ - |
Value of Derivative Instruments |
The following table is a summary of the Fund's value of derivative instruments by primary risk exposure as of January 31, 2014. For additional information on derivative instruments, please refer to the Derivative Instruments section in the accompanying Notes to Financial Statements. |
Primary Risk Exposure / | Value | |
| Asset | Liability |
Equity Risk | ||
Futures Contracts (a) | $ - | $ (151,892) |
Total Value of Derivatives | $ - | $ (151,892) |
(a) Reflects gross cumulative appreciation (depreciation) on futures contracts as presented in the Schedule of Investments. Only the period end receivable or payable for daily variation margin and net unrealized appreciation (depreciation) are presented in the Statement of Assets and Liabilities. |
See accompanying notes which are an integral part of the financial statements.
Annual Report
Fidelity Series Stock Selector Large Cap Value Fund
Financial Statements
Statement of Assets and Liabilities
| January 31, 2014 | |
|
|
|
Assets | ||
Investment in securities, at value (including securities loaned of $52,467,636) - See accompanying schedule: Unaffiliated issuers (cost $6,237,886,851) | $ 7,046,194,908 |
|
Fidelity Central Funds (cost $503,382,316) | 503,382,316 |
|
Total Investments (cost $6,741,269,167) |
| $ 7,549,577,224 |
Cash |
| 6 |
Receivable for investments sold | 41,621,830 | |
Receivable for fund shares sold | 1,056,884 | |
Dividends receivable | 4,065,141 | |
Distributions receivable from Fidelity Central Funds | 45,327 | |
Prepaid expenses | 18,041 | |
Other receivables | 25,547 | |
Total assets | 7,596,410,000 | |
|
|
|
Liabilities | ||
Payable for investments purchased | $ 123,678,226 | |
Payable for fund shares redeemed | 28,246,975 | |
Accrued management fee | 3,359,036 | |
Payable for daily variation margin for derivative instruments | 884,667 | |
Other affiliated payables | 542,579 | |
Other payables and accrued expenses | 75,013 | |
Collateral on securities loaned, at value | 54,377,750 | |
Total liabilities | 211,164,246 | |
|
|
|
Net Assets | $ 7,385,245,754 | |
Net Assets consist of: |
| |
Paid in capital | $ 6,495,855,284 | |
Undistributed net investment income | 21,716 | |
Accumulated undistributed net realized gain (loss) on investments and foreign currency transactions | 81,212,589 | |
Net unrealized appreciation (depreciation) on investments | 808,156,165 | |
Net Assets | $ 7,385,245,754 | |
See accompanying notes which are an integral part of the financial statements.
Annual Report
Statement of Assets and Liabilities - continued
| January 31, 2014 | |
|
|
|
Series Stock Selector Large Cap Value: | $ 11.96 | |
|
|
|
Class F: | $ 11.97 | |
See accompanying notes which are an integral part of the financial statements.
Annual Report
Fidelity Series Stock Selector Large Cap Value Fund
Financial Statements - continued
Statement of Operations
| Year ended January 31, 2014 | |
|
|
|
Investment Income |
|
|
Dividends |
| $ 118,327,310 |
Interest |
| 1,143 |
Income from Fidelity Central Funds |
| 451,674 |
Total income |
| 118,780,127 |
|
|
|
Expenses | ||
Management fee | $ 33,107,152 | |
Performance adjustment | (131,721) | |
Transfer agent fees | 4,808,484 | |
Accounting and security lending fees | 1,125,253 | |
Custodian fees and expenses | 123,680 | |
Independent trustees' compensation | 29,513 | |
Audit | 60,779 | |
Legal | 18,443 | |
Miscellaneous | 25,601 | |
Total expenses before reductions | 39,167,184 | |
Expense reductions | (110,076) | 39,057,108 |
Net investment income (loss) | 79,723,019 | |
Realized and Unrealized Gain (Loss) Net realized gain (loss) on: | ||
Investment securities: |
|
|
Unaffiliated issuers | 418,758,076 | |
Foreign currency transactions | (430) | |
Futures contracts | 5,060,143 | |
Total net realized gain (loss) |
| 423,817,789 |
Change in net unrealized appreciation (depreciation) on: Investment securities | 478,268,625 | |
Futures contracts | (151,892) | |
Total change in net unrealized appreciation (depreciation) |
| 478,116,733 |
Net gain (loss) | 901,934,522 | |
Net increase (decrease) in net assets resulting from operations | $ 981,657,541 | |
See accompanying notes which are an integral part of the financial statements.
Annual Report
Statement of Changes in Net Assets
| Year ended | For the period |
Increase (Decrease) in Net Assets |
|
|
Operations |
|
|
Net investment income (loss) | $ 79,723,019 | $ 11,210,042 |
Net realized gain (loss) | 423,817,789 | 19,342,161 |
Change in net unrealized appreciation (depreciation) | 478,116,733 | 330,039,432 |
Net increase (decrease) in net assets resulting | 981,657,541 | 360,591,635 |
Distributions to shareholders from net investment income | (82,501,751) | (8,312,592) |
Distributions to shareholders from net realized gain | (362,044,361) | - |
Total distributions | (444,546,112) | (8,312,592) |
Share transactions - net increase (decrease) | 1,545,098,314 | 4,950,756,968 |
Total increase (decrease) in net assets | 2,082,209,743 | 5,303,036,011 |
|
|
|
Net Assets | ||
Beginning of period | 5,303,036,011 | - |
End of period (including undistributed net investment income of $21,716 and undistributed net investment income of $2,921,615, respectively) | $ 7,385,245,754 | $ 5,303,036,011 |
See accompanying notes which are an integral part of the financial statements.
Annual Report
Financial Highlights - Series Stock Selector Large Cap Value
Years ended January 31, | 2014 | 2013 G |
Selected Per-Share Data |
|
|
Net asset value, beginning of period | $ 10.71 | $ 10.00 |
Income from Investment Operations |
|
|
Net investment income (loss) D | .15 | .02 |
Net realized and unrealized gain (loss) | 1.87 | .71 |
Total from investment operations | 2.02 | .73 |
Distributions from net investment income | (.13) | (.02) |
Distributions from net realized gain | (.64) | - |
Total distributions | (.77) | (.02) |
Net asset value, end of period | $ 11.96 | $ 10.71 |
Total Return B, C | 18.81% | 7.27% |
Ratios to Average Net Assets E, H |
|
|
Expenses before reductions | .75% | .78% A |
Expenses net of fee waivers, if any | .75% | .78% A |
Expenses net of all reductions | .75% | .70% A |
Net investment income (loss) | 1.23% | 1.39% A |
Supplemental Data |
|
|
Net assets, end of period (000 omitted) | $ 3,208,521 | $ 2,520,689 |
Portfolio turnover rate F | 66% | 44% I |
A Annualized
B Total returns for periods of less than one year are not annualized.
C Total returns would have been lower if certain expenses had not been reduced during the applicable periods shown.
D Calculated based on average shares outstanding during the period.
E Fees and expenses of any underlying Fidelity Central Funds are not included in the Fund's expense ratio. The Fund indirectly bears its proportionate share of the expenses of any underlying Fidelity Central Funds.
F Amount does not include the portfolio activity of any underlying Fidelity Central Funds.
G For the period December 6, 2012 (commencement of operations) to January 31, 2013.
H Expense ratios reflect operating expenses of the class. Expenses before reductions do not reflect amounts reimbursed by the investment adviser or reductions from brokerage service arrangements or reductions from other expense offset arrangements and do not represent the amount paid by the class during periods when reimbursements or reductions occur. Expense ratios before reductions for start-up periods may not be representative of longer-term operating periods. Expenses net of fee waivers reflect expenses after reimbursement by the investment adviser but prior to reductions from brokerage service arrangements or other expense offset arrangements. Expenses net of all reductions represent the net expenses paid by the class.
I Amount not annualized.
See accompanying notes which are an integral part of the financial statements.
Annual Report
Financial Highlights - Class F
Years ended January 31, | 2014 | 2013 G |
Selected Per-Share Data |
|
|
Net asset value, beginning of period | $ 10.71 | $ 10.00 |
Income from Investment Operations |
|
|
Net investment income (loss) D | .17 | .02 |
Net realized and unrealized gain (loss) | 1.88 | .71 |
Total from investment operations | 2.05 | .73 |
Distributions from net investment income | (.15) | (.02) |
Distributions from net realized gain | (.64) | - |
Total distributions | (.79) | (.02) |
Net asset value, end of period | $ 11.97 | $ 10.71 |
Total Return B, C | 19.09% | 7.28% |
Ratios to Average Net Assets E, H |
|
|
Expenses before reductions | .57% | .59% A |
Expenses net of fee waivers, if any | .57% | .59% A |
Expenses net of all reductions | .57% | .51% A |
Net investment income (loss) | 1.41% | 1.58% A |
Supplemental Data |
|
|
Net assets, end of period (000 omitted) | $ 4,176,725 | $ 2,782,347 |
Portfolio turnover rate F | 66% | 44% I |
A Annualized
B Total returns for periods of less than one year are not annualized.
C Total returns would have been lower if certain expenses had not been reduced during the applicable periods shown.
D Calculated based on average shares outstanding during the period.
E Fees and expenses of any underlying Fidelity Central Funds are not included in the Fund's expense ratio. The Fund indirectly bears its proportionate share of the expenses of any underlying Fidelity Central Funds.
F Amount does not include the portfolio activity of any underlying Fidelity Central Funds.
G For the period December 6, 2012 (commencement of operations) to January 31, 2013.
H Expense ratios reflect operating expenses of the class. Expenses before reductions do not reflect amounts reimbursed by the investment adviser or reductions from brokerage service arrangements or reductions from other expense offset arrangements and do not represent the amount paid by the class during periods when reimbursements or reductions occur. Expense ratios before reductions for start-up periods may not be representative of longer-term operating periods. Expenses net of fee waivers reflect expenses after reimbursement by the investment adviser but prior to reductions from brokerage service arrangements or other expense offset arrangements. Expenses net of all reductions represent the net expenses paid by the class.
I Amount not annualized.
See accompanying notes which are an integral part of the financial statements.
Annual Report
Notes to Financial Statements
For the period ended January 31, 2014
1. Organization.
Fidelity Series All-Sector Equity Fund, Fidelity Series Equity-Income Fund and Fidelity Series Stock Selector Large Cap Value Fund (the Funds) are funds of Fidelity Devonshire Trust (the Trust). The Trust is registered under the Investment Company Act of 1940, as amended (the 1940 Act), as an open-end management investment company organized as a Massachusetts business trust. Each Fund is authorized to issue an unlimited number of shares. Shares of the Funds are only available for purchase by mutual funds for which Fidelity Management & Research Company (FMR) or an affiliate serves as an investment manager. Fidelity Series All-Sector Equity Fund offers Series All-Sector Equity shares and Class F shares. Fidelity Series Equity-Income Fund offers Series Equity-Income shares and Class F shares. Fidelity Series Stock Selector Large Cap Value Fund offers Series Stock Selector Large Cap Value shares and Class F shares. All classes have equal rights as to assets and voting privileges. Each class has exclusive voting rights with respect to matters that affect that class.
2. Investments in Fidelity Central Funds.
The Funds invest in Fidelity Central Funds, which are open-end investment companies generally available only to other investment companies and accounts managed by the investment adviser and its affiliates. The Funds' Schedules of Investments list each of the Fidelity Central Funds held as of period end, if any, as an investment of each Fund, but do not include the underlying holdings of each Fidelity Central Fund. As an Investing Fund, each Fund indirectly bears its proportionate share of the expenses of the underlying Fidelity Central Funds.
The Money Market Central Funds seek preservation of capital and current income and are managed by Fidelity Investments Money Management, Inc. (FIMM), an affiliate of the investment adviser. Annualized expenses of the Money Market Central Funds as of their most recent shareholder report date are less than .01%.
A complete unaudited list of holdings for each Fidelity Central Fund is available upon request or at the Securities and Exchange Commission (the SEC) website at www.sec.gov. In addition, the financial statements of the Fidelity Central Funds, which are not covered by the Funds' Report of Independent Registered Public Accounting Firm, are available on the SEC website or upon request.
3. Significant Accounting Policies.
The financial statements have been prepared in conformity with accounting principles generally accepted in the United States of America (GAAP), which require management to make certain estimates and assumptions at the date of the financial statements. Actual results could differ from those estimates. Subsequent events, if any, through the
Annual Report
Notes to Financial Statements - continued
3. Significant Accounting Policies - continued
date that the financial statements were issued have been evaluated in the preparation of the financial statements. The following summarizes the significant accounting policies of the Funds:
Investment Valuation. Investments are valued as of 4:00 p.m. Eastern time on the last calendar day of the period. In accordance with valuation policies and procedures approved by the Board of Trustees (the Board), each Fund attempts to obtain prices from one or more third party pricing vendors or brokers to value its investments. When current market prices, quotations or currency exchange rates are not readily available or reliable, investments will be fair valued in good faith by the FMR Fair Value Committee (the Committee), in accordance with procedures adopted by the Board. Factors used in determining fair value vary by investment type and may include market or investment specific events, changes in interest rates and credit quality. The frequency with which these procedures are used cannot be predicted and they may be utilized to a significant extent. The Committee oversees each Fund's valuation policies and procedures and is responsible for approving and reporting to the Board all fair value determinations.
Each Fund categorizes the inputs to valuation techniques used to value their investments into a disclosure hierarchy consisting of three levels as shown below:
Level 1 - quoted prices in active markets for identical investments
Level 2 - other significant observable inputs (including quoted prices for similar investments, interest rates, prepayment speeds, etc.)
Level 3 - unobservable inputs (including the Fund's own assumptions based on the best information available)
Valuation techniques used to value each Fund's investments by major category are as follows:
Equity securities, including restricted securities, for which market quotations are readily available, are valued at the last reported sale price or official closing price as reported by a third party pricing vendor on the primary market or exchange on which they are traded and are categorized as Level 1 in the hierarchy. In the event there were no sales during the day or closing prices are not available, securities are valued at the last quoted bid price or may be valued using the last available price and are generally categorized as Level 2 in the hierarchy. For foreign equity securities, when market or security specific events arise, comparisons to the valuation of American Depositary Receipts (ADRs), futures contracts, Exchange-Traded Funds (ETFs) and certain indexes as well as quoted prices for similar securities may be used and would be categorized as Level 2 in the hierarchy. Utilizing these techniques may result in transfers between Level 1 and Level 2. For equity securities, including restricted securities, where observable inputs are
Annual Report
3. Significant Accounting Policies - continued
Investment Valuation - continued
limited, assumptions about market activity and risk are used and these securities may be categorized as Level 3 in the hierarchy.
Debt securities, including restricted securities, are valued based on evaluated prices received from third party pricing vendors or from brokers who make markets in such securities. U.S. government and government agency obligations are valued by pricing vendors who utilize matrix pricing which considers yield or price of bonds of comparable quality, coupon, maturity and type or by broker-supplied prices. When independent prices are unavailable or unreliable, debt securities may be valued utilizing pricing methodologies which consider similar factors that would be used by third party pricing vendors. Debt securities are generally categorized as Level 2 in the hierarchy but may be Level 3 depending on the circumstances.
Futures contracts are valued at the settlement price established each day by the board of trade or exchange on which they are traded and are categorized as Level 1 in the hierarchy. Exchange-traded options are valued using the last sale price or, in the absence of a sale, the last offering price and are categorized as Level 1 in the hierarchy. Investments in open-end mutual funds, including the Fidelity Central Funds, are valued at their closing net asset value (NAV) each business day and are categorized as Level 1 in the hierarchy.
Changes in valuation techniques may result in transfers in or out of an assigned level within the disclosure hierarchy. The aggregate value of investments by input level, as of January 31, 2014, is included at the end of each applicable Fund's Schedule of Investments.
Foreign Currency. The Funds may use foreign currency contracts to facilitate transactions in foreign-denominated securities. Gains and losses from these transactions may arise from changes in the value of the foreign currency or if the counterparties do not perform under the contracts' terms.
Foreign-denominated assets, including investment securities, and liabilities are translated into U.S. dollars at the exchange rates at period end. Purchases and sales of investment securities, income and dividends received and expenses denominated in foreign currencies are translated into U.S. dollars at the exchange rate in effect on the transaction date.
The effects of exchange rate fluctuations on investments are included with the net realized and unrealized gain (loss) on investment securities. Other foreign currency transactions resulting in realized and unrealized gain (loss) are disclosed separately.
Annual Report
Notes to Financial Statements - continued
3. Significant Accounting Policies - continued
Investment Transactions and Income. For financial reporting purposes, the Funds' investment holdings and NAV include trades executed through the end of the last business day of the period. The NAV per share for processing shareholder transactions is calculated as of the close of business of the New York Stock Exchange (NYSE), normally 4:00 p.m. Eastern time and includes trades executed through the end of the prior business day. Gains and losses on securities sold are determined on the basis of identified cost and may include proceeds received from litigation. Dividend income is recorded on the ex-dividend date, except for certain dividends from foreign securities where the ex-dividend date may have passed, which are recorded as soon as the Funds are informed of the ex-dividend date. Non-cash dividends included in dividend income, if any, are recorded at the fair market value of the securities received. Distributions received on securities that represent a return of capital or capital gain are recorded as a reduction of cost of investments and/or as a realized gain. Subsequent to ex-dividend date the Funds determine the components of these distributions, based upon receipt of tax filings or other correspondence relating to the underlying investment. Interest income and distributions from the Fidelity Central Funds are accrued as earned. Interest income includes coupon interest and amortization of premium and accretion of discount on debt securities. Investment income is recorded net of foreign taxes withheld where recovery of such taxes is uncertain.
Class Allocations and Expenses. Investment income, realized and unrealized capital gains and losses, common expenses of each Fund, and certain fund-level expense reductions, if any, are allocated daily on a pro-rata basis to each class based on the relative net assets of each class to the total net assets of each Fund. Each class differs with respect to transfer agent fees incurred. Certain expense reductions may also differ by class. For the reporting period, the allocated portion of income and expenses to each class as a percent of its average net assets may vary due to the timing of recording these transactions in relation to fluctuating net assets of the classes. Expenses directly attributable to a fund are charged to that fund. Expenses attributable to more than one fund are allocated among the respective funds on the basis of relative net assets or other appropriate methods. Expense estimates are accrued in the period to which they relate and adjustments are made when actual amounts are known.
Income Tax Information and Distributions to Shareholders. Each year, each Fund intends to qualify as a regulated investment company under Subchapter M of the Internal Revenue Code, including distributing substantially all of its taxable income and realized gains. As a result, no provision for U.S. Federal income taxes is required. As of January 31, 2014, each Fund did not have any unrecognized tax benefits in the financial statements; nor is each Fund aware of any tax positions for which it is reasonably possible that the total amounts of unrecognized tax benefits will significantly change in the next
Annual Report
3. Significant Accounting Policies - continued
Income Tax Information and Distributions to Shareholders - continued
twelve months. Each Fund files a U.S. federal tax return, in addition to state and local tax returns as required. The Fund's federal income tax returns are subject to examination by the Internal Revenue Service (IRS) for a period of three fiscal years after they are filed. State and local tax returns may be subject to examination for an additional fiscal year depending on the jurisdiction. Foreign taxes are provided for based on each Fund's understanding of the tax rules and rates that exist in the foreign markets in which it invests.
Distributions are declared and recorded on the ex-dividend date. Income dividends and capital gain distributions are declared separately for each class. Income and capital gain distributions are determined in accordance with income tax regulations, which may differ from GAAP.
Capital accounts within the financial statements are adjusted for permanent book-tax differences. These adjustments have no impact on net assets or the results of operations. Capital accounts are not adjusted for temporary book-tax differences which will reverse in a subsequent period.
Book-tax differences are primarily due to futures contracts, foreign currency transactions, market discount, partnerships, equity-debt classifications, redemptions in kind and losses deferred due to wash sales.
The federal tax cost of investment securities and unrealized appreciation (depreciation) as of period end were as follows for each Fund:
| Tax cost | Gross unrealized | Gross unrealized | Net unrealized |
Fidelity Series All-Sector Equity Fund | $ 8,116,135,473 | $ 2,267,243,965 | $ (85,547,866) | $ 2,181,696,099 |
Fidelity Series Equity-Income Fund | 10,499,133,738 | 974,458,467 | (287,871,523) | 686,586,944 |
Fidelity Series Stock Selector Large Cap Value Fund | 6,742,926,541 | 947,138,049 | (140,487,366) | 806,650,683 |
Annual Report
Notes to Financial Statements - continued
3. Significant Accounting Policies - continued
Income Tax Information and Distributions to Shareholders - continued
The tax-based components of distributable earnings as of period end were as follows for each Fund:
| Undistributed | Undistributed | Net unrealized |
Fidelity Series All-Sector Equity Fund | $ 160,597,703 | $ 169,565,338 | $ 2,181,647,879 |
Fidelity Series Equity-Income Fund | 29,247,448 | 14,947,524 | 687,200,947 |
Fidelity Series Stock Selector Large Cap Value Fund | 61,749,609 | 20,990,178 | 806,650,683 |
The tax character of distributions paid was as follows:
January 31, 2014 |
|
|
|
| Ordinary Income | Long-term | Total |
Fidelity Series All-Sector Equity Fund | $ 510,728,338 | $ 681,319,091 | $ 1,192,047,429 |
Fidelity Series Equity-Income Fund | 401,458,588 | - | 401,458,588 |
Fidelity Series Stock Selector Large Cap Value Fund | 441,104,706 | 3,441,406 | 444,546,112 |
January 31, 2013 |
|
|
|
| Ordinary Income | Long-term | Total |
Fidelity Series All-Sector Equity Fund | $ 157,359,845 | $ 657,260,030 | $ 814,619,875 |
Fidelity Series Equity-Income Fund | 9,328,125 | - | 9,328,125 |
Fidelity Series Stock Selector Large Cap Value Fund | 8,312,592 | - | 8,312,592 |
Restricted Securities. The Funds may invest in securities that are subject to legal or contractual restrictions on resale. These securities generally may be resold in transactions exempt from registration or to the public if the securities are registered. Disposal of these securities may involve time-consuming negotiations and expense, and prompt sale at an acceptable price may be difficult. Information regarding restricted securities is included at the end of each applicable Fund's Schedule of Investments.
Annual Report
4. Derivative Instruments.
Risk Exposures and the Use of Derivative Instruments. The Funds' investment objective allows the Funds to enter into various types of derivative contracts, including futures contracts and options. Derivatives are investments whose value is primarily derived from underlying assets, indices or reference rates and may be transacted on an exchange or over-the-counter (OTC). Derivatives may involve a future commitment to buy or sell a specified asset based on specified terms, to exchange future cash flows at periodic intervals based on a notional principal amount, or for one party to make one or more payments upon the occurrence of specified events in exchange for periodic payments from the other party.
The Funds used derivatives to increase returns and to manage exposure to certain risks as defined below. The success of any strategy involving derivatives depends on analysis of numerous economic factors, and if the strategies for investment do not work as intended, the Funds may not achieve their objectives.
The Funds' use of derivatives increased or decreased their exposure to the following risks:
Equity Risk | Equity risk relates to the fluctuations in the value of financial instruments as a result of changes in market prices (other than those arising from interest rate risk or foreign exchange risk), whether caused by factors specific to an individual investment, its issuer, or all factors affecting all instruments traded in a market or market segment. |
The Funds are also exposed to additional risks from investing in derivatives, such as liquidity risk and counterparty credit risk. Liquidity risk is the risk that the Funds will be unable to close out the derivative in the open market in a timely manner. Counterparty credit risk is the risk that the counterparty will not be able to fulfill its obligation to the Funds. Counterparty credit risk related to exchange-traded futures contracts and exchange-traded options may be mitigated by the protection provided by the exchange on which they trade.
Investing in derivatives may involve greater risks than investing in the underlying assets directly and, to varying degrees, may involve risk of loss in excess of any initial investment and collateral received and amounts recognized in the Statement of Assets and Liabilities. In addition, there may be the risk that the change in value of the derivative contract does not correspond to the change in value of the underlying instrument.
Annual Report
Notes to Financial Statements - continued
4. Derivative Instruments - continued
Net Realized Gain (Loss) and Change in Net Unrealized Appreciation (Depreciation) on Derivatives. The table below, which reflects the impacts of derivatives on the financial performance of the Funds, summarizes the net realized gain (loss) and change in net unrealized appreciation (depreciation) for derivatives during the period as presented in the Statement of Operations.
Primary Risk Exposure / Derivative Type | Net Realized Gain | Change in Net |
Fidelity Series All-Sector Equity Fund |
|
|
Equity Risk |
|
|
Futures Contracts (a) | $ 15,766,207 | $ (2,330,613) |
Fidelity Series Equity-Income Fund |
|
|
Equity Risk |
|
|
Written Options (a) | $ 3,967,311 | $ 614,003 |
Fidelity Series Stock Selector Large Cap Value Fund |
|
|
Equity Risk |
|
|
Futures Contracts (a) | $ 5,060,143 | $ (151,892) |
(a) A summary of the value of derivatives by primary risk exposure as of period end at the end of the Schedule of Investments.
Futures Contracts. A futures contract is an agreement between two parties to buy or sell a specified underlying instrument for a fixed price at a specified future date. Fidelity Series All-Sector Equity Fund and Fidelity Series Stock Selector Large Cap Value Fund used futures contracts to manage their exposure to the stock market.
Upon entering into a futures contract, a fund is required to deposit either cash or securities (initial margin) with a clearing broker in an amount equal to a certain percentage of the face value of the contract. Futures contracts are marked-to-market daily and subsequent daily payments (variation margin) are made or received by a fund depending on the daily fluctuations in the value of the futures contracts and are recorded as unrealized appreciation or (depreciation). This receivable and/or payable, if any, is included in daily variation margin for derivative instruments in the Statement of Assets and Liabilities. Realized gain or (loss) is recorded upon the expiration or closing of a futures contract. The net realized gain (loss) and change in net unrealized appreciation (depreciation) on futures contracts during the period is included in the Statement of Operations.
Any open futures contracts at period end are presented in the Schedule of Investments under the caption "Futures Contracts." The underlying face amount at value reflects each contract's exposure to the underlying instrument or index at period end and is representative of volume of activity during the period. Securities deposited to meet initial margin requirements are identified in the Schedule of Investments.
Annual Report
4. Derivative Instruments - continued
Options. Options give the purchaser the right, but not the obligation, to buy (call) or sell (put) an underlying security or financial instrument at an agreed exercise or strike price between or on certain dates. Options obligate the seller (writer) to buy (put) or sell (call) an underlying instrument at the exercise or strike price or cash settle an underlying derivative instrument if the holder exercises the option on or before the expiration date.
Fidelity Series Equity-Income Fund (the Fund) used exchange-traded written covered call options to manage its exposure to the market. When the Fund writes a covered call option, the Fund holds the underlying instrument which must be delivered to the holder upon the exercise of the option.
Upon entering into a written options contract, the Fund will receive a premium. Premiums received are reflected as a liability on the Statement of Assets and Liabilities. Options are valued daily and any unrealized appreciation (depreciation) is reflected on the Statement of Assets and Liabilities. When a written option is exercised, the premium is added to the proceeds from the sale of the underlying instrument in determining the gain or loss realized on that investment. When an option is closed the Fund will realize a gain or loss depending on whether the proceeds or amount paid for the closing sale transaction are greater or less than the premium received. When an option expires, gains and losses are realized to the extent of premiums received. The net realized gain (loss) on closed and expired written options and the change in net unrealized appreciation (depreciation) on written options are reflected separately on the Statement of Operations.
Writing call options tends to decrease exposure to the underlying instrument and risk of loss is the change in value in excess of the premium received.
Any open options at period end are presented in the Schedule of Investments under the caption "Written Options" and are representative of volume of activity during the period.
The following is a summary of the Fund's written options activity:
Written Options | Number of | Amount of |
Outstanding at beginning of period | - | $ - |
Options Opened | 244,644 | 16,975,570 |
Options Exercised | (97,293) | (5,916,178) |
Options Closed | (36,916) | (2,017,759) |
Options Expired | (20,317) | (2,300,368) |
Outstanding at end of period | 90,118 | $ 6,741,265 |
Annual Report
Notes to Financial Statements - continued
5. Purchases and Sales of Investments.
Purchases and sales of securities including in-kind transactions, other than short-term securities, are noted in the table below.
| Purchases ($) | Sales ($) |
Fidelity Series All-Sector Equity Fund | 7,386,512,212 | 8,999,756,012 |
Fidelity Series Equity-Income Fund | 7,842,495,903 | 2,926,492,279 |
Fidelity Series Stock Selector Large Cap Value Fund | 4,703,334,204 | 3,806,747,012 |
6. Fees and Other Transactions with Affiliates.
Management Fee. Fidelity Management & Research Company (the investment adviser) and its affiliates provide the Funds with investment management related services for which the Funds pay a monthly management fee. The management fee is the sum of an individual fund fee rate and an annualized group fee rate. The individual fund fee rate is applied to each Fund's average net assets. The group fee rate is based upon the average net assets of all the mutual funds advised by the investment adviser, including any mutual funds previously advised by the investment adviser that are currently advised by Fidelity SelectCo, LLC, an affiliate of the investment adviser. The group fee rate decreases as assets under management increase and increases as assets under management decrease. In addition, the management fee for Fidelity Series All-Sector Equity Fund and Fidelity Series Stock Selector Large Cap Value Fund is subject to a performance adjustment (up to a maximum of ± .20% of each applicable Fund's average net assets over a 36 month performance period). The upward or downward adjustment to the management fee is based on relative investment performance of Series All-Sector Equity as compared to its benchmark index and Series Stock Selector Large Cap Value as compared to its benchmark index over the same 36 month performance period. Fidelity Series Stock Selector Large Cap Value Fund's performance adjustment took effect in December 2013. Subsequent months will be added until the performance period includes 36 months. For the reporting period, each Fund's annual management fee rate expressed as a percentage of each Fund's average net assets, including the performance adjustment, if applicable was as follows. The performance adjustment included in the management fee rate may be higher or lower than the maximum performance adjustment rate due to the difference between the average net asset for the reporting and performance periods.
| Individual Rate | Group Rate | Total |
Fidelity Series All-Sector Equity Fund | .30% | .25% | .45% |
Fidelity Series Equity-Income Fund | .20% | .25% | .45% |
Fidelity Series Stock Selector Large Cap Value Fund | .30% | .25% | .55% |
Annual Report
6. Fees and Other Transactions with Affiliates - continued
Management Fee - continued
| Performance Benchmark |
Fidelity Series All-Sector Equity Fund | Russell 1000 Index |
Fidelity Series Stock Selector Large Cap Value Fund | Russell 1000 Value Index |
Transfer Agent Fees. Fidelity Investments Institutional Operations Company, Inc., (FIIOC), an affiliate of the investment adviser, is the transfer, dividend disbursing and shareholder servicing agent for each class of the Funds. FIIOC receives account fees and asset-based fees that vary according to the account size and type of account of the shareholders of the respective classes of each Fund except for Class F. FIIOC receives no fees for providing transfer agency services to Class F. FIIOC pays for typesetting, printing and mailing of shareholder reports, except proxy statements. For the period, transfer agent fees for each applicable class were as follows:
Fidelity Series All-Sector Equity Fund | Amount | % of |
Series All-Sector Equity | $ 9,707,865 | .18 |
Fidelity Series Equity-Income Fund |
|
|
Series Equity-Income | $ 5,738,270 | .18 |
Fidelity Series Stock Selector Large Cap Value Fund |
|
|
Series Stock Selector Large Cap Value | $ 4,808,484 | .18 |
Accounting and Security Lending Fees. Fidelity Service Company, Inc. (FSC), an affiliate of the investment adviser, maintains each Fund's accounting records. The accounting fee is based on the level of average net assets for each month. Under a separate contract, FSC administers the security lending program. The security lending fee is based on the number and duration of lending transactions.
Brokerage Commissions. Certain Funds placed a portion of their portfolio transactions with brokerage firms which are affiliates of the investment adviser. Brokerage commissions are included in net realized gain (loss) and change in net unrealized appreciation (depreciation) in the Statement of Operations. The commissions paid to these affiliated firms were as follows:
| Amount |
Fidelity Series All-Sector Equity Fund | $ 182,412 |
Fidelity Series Equity-Income Fund | 85,430 |
Fidelity Series Stock Selector Large Cap Value Fund | 111,009 |
Interfund Lending Program. Pursuant to an Exemptive Order issued by the SEC, the Funds, along with other registered investment companies having management contracts with FMR or other affiliated entities of FMR, may participate in an interfund lending
Annual Report
Notes to Financial Statements - continued
6. Fees and Other Transactions with Affiliates - continued
Interfund Lending Program - continued
program. This program provides an alternative credit facility allowing the funds to borrow from, or lend money to, other participating affiliated funds. At period end, there were no interfund loans outstanding. Each applicable fund's activity in this program during the period for which loans were outstanding was as follows:
| Borrower or | Average Loan | Weighted | Interest Expense |
Fidelity Series All-Sector Equity Fund | Borrower | $ 69,321,000 | .30% | $ 568 |
Redemptions In-Kind. During the period, 34,118,466 shares of Fidelity Series All-Sector Equity Fund held by affiliated entities were redeemed for investments with a value of $503,021,065. The net realized gain of $145,619,946 on investments delivered through in-kind redemptions is included in the accompanying Statement of Operations. The amount of in-kind redemptions is included in share transactions in the accompanying Statement of Changes in Net Assets as well as Note 11: Share Transactions. Fidelity Series All-Sector Equity Fund recognized no gain or loss for federal income tax purposes.
Exchanges In-Kind. During the period, certain investment companies managed by the investment adviser or its affiliates (Investing Funds) completed exchanges in-kind with Fidelity Series Equity-Income Fund. The Investing Funds delivered securities and other assets, including accrued interest, valued at $2,209,433,173 in exchange for 180,279,244 shares of Fidelity Series Equity-Income Fund. The amount of in-kind exchanges is included in share transactions in the accompanying Statement of Changes in Net Assets as well as Note 11: Share Transactions. Fidelity Series Equity-Income Fund recognized no gain or loss for federal income tax purposes.
7. Committed Line of Credit.
Certain Funds participate with other funds managed by the investment adviser or an affiliate in a $4.25 billion credit facility (the "line of credit") to be utilized for temporary or emergency purposes to fund shareholder redemptions or for other short-term liquidity purposes. The participating funds have agreed to pay commitment fees on their pro-rata portion of the line of credit, which are reflected in Miscellaneous expenses on the Statement of Operations, and are as follows:
Fidelity Series All-Sector Equity Fund | $ 20,763 |
Fidelity Series Equity-Income Fund | 10,099 |
Fidelity Series Stock Selector Large Cap Value Fund | 8,694 |
During the period, there were no borrowings on this line of credit.
Annual Report
8. Security Lending.
Certain Funds lend portfolio securities through a lending agent from time to time in order to earn additional income. For equity securities, a lending agent is used and may loan securities to certain qualified borrowers, including Fidelity Capital Markets (FCM), a broker-dealer affiliated with the Funds. On the settlement date of the loan, each applicable Fund receives collateral (in the form of U.S. Treasury obligations, letters of credit and/or cash) against the loaned securities and maintains collateral in an amount not less than 100% of the market value of the loaned securities during the period of the loan. The market value of the loaned securities is determined at the close of business of the Funds and any additional required collateral is delivered to the Funds on the next business day. If the borrower defaults on its obligation to return the securities loaned because of insolvency or other reasons, the Funds may apply collateral received from the borrower against the obligation. The Funds may experience delays and costs in recovering the securities loaned. Any cash collateral received is invested in the Fidelity Securities Lending Cash Central Fund. The value of loaned securities and cash collateral at period end are disclosed on each applicable Fund's Statement of Assets and Liabilities. Security lending income represents the income earned on investing cash collateral, less rebates paid to borrowers and any lending agent fees associated with the loan, plus any premium payments received for lending certain types of securities. Security lending income is presented on each applicable Fund's Statement of Operations as a component of income from Fidelity Central Funds. Security lending activity was as follows:
| Total Security | Security Lending | Value of |
Fidelity Series All-Sector Equity Fund | $ 76,901 | $ - | $ - |
Fidelity Series Equity-Income Fund | $ 97,157 | $ - | $ - |
Fidelity Series Stock Selector Large Cap Value Fund | $ 219,430 | $ 60,450 | $ 13,885,657 |
9. Expense Reductions.
Commissions paid to certain brokers with whom the investment adviser, or its affiliates, places trades on behalf of Certain Funds include an amount in addition to trade execution, which may be rebated back to the Funds to offset certain expenses. In addition, through arrangements with each applicable Fund's custodian, credits realized as a result
Annual Report
Notes to Financial Statements - continued
9. Expense Reductions - continued
of uninvested cash balances were used to reduce the Fund's expenses. All of the applicable expense reductions are noted in the table below.
| Brokerage Service | Custody expense |
|
|
|
Fidelity Series All-Sector Equity Fund | $ 307,680 | $ 27 |
Fidelity Series Equity-Income Fund | 125,613 | 141 |
Fidelity Series Stock Selector Large Cap Value Fund | 110,076 | - |
10. Distributions to Shareholders.
Distributions to shareholders of each class were as follows:
Years ended January 31, | 2014 | 2013 A |
Fidelity Series All-Sector Equity Fund |
|
|
From net investment income |
|
|
Series All-Sector Equity | $ 48,647,558 | $ 80,702,951 |
Class F | 57,391,904 | 76,656,894 |
Total | $ 106,039,462 | $ 157,359,845 |
From net realized gain |
|
|
Series All-Sector Equity | $ 552,024,140 | $ 362,179,097 |
Class F | 533,983,827 | 295,080,933 |
Total | $ 1,086,007,967 | $ 657,260,030 |
Fidelity Series Equity-Income Fund |
|
|
From net investment income |
|
|
Series Equity-Income | $ 65,874,338 | $ 4,406,929 |
Class F | 89,113,352 | 4,921,196 |
Total | $ 154,987,690 | $ 9,328,125 |
From net realized gain |
|
|
Series Equity-Income | $ 107,495,385 | $ - |
Class F | 138,975,513 | - |
Total | $ 246,470,898 | $ - |
Annual Report
10. Distributions to Shareholders - continued
Years ended January 31, | 2014 | 2013 A |
Fidelity Series Stock Selector Large Cap Value Fund |
|
|
From net investment income |
|
|
Series Stock Selector Large Cap Value | $ 33,429,904 | $ 3,913,471 |
Class F | 49,071,847 | 4,399,121 |
Total | $ 82,501,751 | $ 8,312,592 |
From net realized gain |
|
|
Series Stock Selector Large Cap Value | $ 158,527,420 | $ - |
Class F | 203,516,941 | - |
Total | $ 362,044,361 | $ - |
A Distributions for Fidelity Series Equity-Income Fund and Fidelity Series Stock Selector Large Cap Value Fund are for the period December 6, 2012 (commencement of operations) to January 31, 2013.
11. Share Transactions.
Transactions for each class of shares were as follows:
| Shares | Dollars | ||
Years ended January 31, | 2014 | 2013 A | 2014 | 2013 A |
Fidelity Series All-Sector Equity Fund |
|
|
|
|
Series All-Sector Equity |
|
|
|
|
Shares sold | 19,399,773 | 77,659,097 | $ 261,863,480 | $ 960,279,546 |
Reinvestment of distributions | 43,913,549 | 36,937,619 | 600,671,698 | 442,882,048 |
Shares redeemed | (112,673,547) B | (314,519,747) D | (1,572,324,471) B | (4,035,138,002) D |
Net increase (decrease) | (49,360,225) | (199,923,031) | $ (709,789,293) | $ (2,631,976,408) |
Class F |
|
|
|
|
Shares sold | 42,782,304 | 164,922,173 | $ 572,224,791 | $ 2,056,892,808 |
Reinvestment of distributions | 43,166,126 | 31,029,869 | 591,375,731 | 371,737,827 |
Shares redeemed | (74,598,856) B | (199,902,700) D | (1,044,199,741) B | (2,592,723,440) D |
Net increase (decrease) | 11,349,574 | (3,950,658) | $ 119,400,781 | $ (164,092,805) |
Annual Report
Notes to Financial Statements - continued
11. Share Transactions - continued
| Shares | Dollars | ||
Years ended January 31, | 2014 | 2013 A | 2014 | 2013 A |
Fidelity Series Equity-Income Fund |
|
|
|
|
Series Equity-Income |
|
|
|
|
Shares sold | 224,570,748 C | 244,923,244 E | $ 2,732,729,652 C | $ 2,449,276,441 E |
Reinvestment of distributions | 14,564,447 | 439,813 | 173,369,723 | 4,406,929 |
Shares redeemed | (65,886,531) | (9,487,619) | (783,556,231) | (98,169,070) |
Net increase (decrease) | 173,248,664 | 235,875,438 | $ 2,122,543,144 | $ 2,355,514,300 |
Class F |
|
|
|
|
Shares sold | 315,974,446 C | 263,502,861 E | $ 3,831,489,685 C | $ 2,636,943,798 E |
Reinvestment of distributions | 19,151,858 | 491,137 | 228,088,865 | 4,921,196 |
Shares redeemed | (61,984,506) | (3,694,500) | (751,159,041) | (37,348,817) |
Net increase (decrease) | 273,141,798 | 260,299,498 | $ 3,308,419,509 | $ 2,604,516,177 |
Fidelity Series Stock Selector Large Cap Value Fund |
|
|
|
|
Series Stock Selector Large Cap Value |
|
|
|
|
Shares sold | 78,624,047 | 244,684,738 E | $ 980,090,023 | $ 2,446,901,557 E |
Reinvestment of distributions | 15,843,263 | 389,400 | 191,957,324 | 3,913,471 |
Shares redeemed | (61,711,221) | (9,606,914) | (735,015,382) | (100,362,070) |
Net increase (decrease) | 32,756,089 | 235,467,224 | $ 437,031,965 | $ 2,350,452,958 |
Class F |
|
|
|
|
Shares sold | 121,639,880 | 263,241,693 E | $ 1,500,283,228 | $ 2,634,811,908 E |
Reinvestment of distributions | 20,837,002 | 437,723 | 252,588,788 | 4,399,121 |
Shares redeemed | (53,345,750) | (3,815,418) | (644,805,667) | (38,907,019) |
Net increase (decrease) | 89,131,132 | 259,863,998 | $ 1,108,066,349 | $ 2,600,304,010 |
A Share transactions for Fidelity Series Equity-Income Fund and Fidelity Series Stock Selector Large Cap Value Fund are for the period December 6, 2012 (commencement of operations) to January 31, 2013.
B Amount includes in-kind redemptions (see Note 6: Redemptions In-Kind).
C Amount includes in-kind exchanges (see Note 6: Exchanges In-Kind).
D Amount includes in-kind redemptions.
E Amount includes in-kind exchanges.
Annual Report
12. Other.
The Funds' organizational documents provide former and current trustees and officers with a limited indemnification against liabilities arising in connection with the performance of their duties to the Funds. In the normal course of business, the Funds may also enter into contracts that provide general indemnifications. The Funds' maximum exposure under these arrangements is unknown as this would be dependent on future claims that may be made against the Funds. The risk of material loss from such claims is considered remote.
At the end of the period, mutual funds managed by the investment adviser or its affiliates were the owners of record of all of the outstanding shares of the Funds.
Annual Report
Report of Independent Registered Public Accounting Firm
To the Trustees of Fidelity Devonshire Trust and the Shareholders of Fidelity Series Stock Selector Large Cap Value Fund:
In our opinion, the accompanying statement of assets and liabilities, including the schedule of investments, and the related statements of operations and of changes in net assets and the financial highlights present fairly, in all material respects, the financial position of Fidelity Series Stock Selector Large Cap Value Fund (a fund of Fidelity Devonshire Trust) at January 31, 2014, the results of its operations for the year then ended, the changes in its net assets for each of the periods indicated and the financial highlights for each of the periods indicated, in conformity with accounting principles generally accepted in the United States of America. These financial statements and financial highlights (hereafter referred to as "financial statements") are the responsibility of the Fidelity Series Stock Selector Large Cap Value Fund's management. Our responsibility is to express an opinion on these financial statements based on our audits. We conducted our audits of these financial statements in accordance with the standards of the Public Company Accounting Oversight Board (United States). Those standards require that we plan and perform the audit to obtain reasonable assurance about whether the financial statements are free of material misstatement. An audit includes examining, on a test basis, evidence supporting the amounts and disclosures in the financial statements, assessing the accounting principles used and significant estimates made by management, and evaluating the overall financial statement presentation. We believe that our audits, which included confirmation of securities at January 31, 2014 by correspondence with the custodian and brokers, provide a reasonable basis for our opinion.
PricewaterhouseCoopers LLP
Boston, Massachusetts
March 17, 2014
Annual Report
Report of Independent Registered Public Accounting Firm
To the Trustees of Fidelity Devonshire Trust and the Shareholders of Fidelity Series All-Sector Equity Fund and Fidelity Series Equity-Income Fund:
We have audited the accompanying statements of assets and liabilities of Fidelity Series Equity-Income Fund and Fidelity Series All-Sector Equity Fund (the Funds), each a fund of Fidelity Devonshire Trust, including the schedules of investments, as of January 31, 2014, and the related statements of operations for the year then ended, and statements of changes in net assets and the financial highlights for each of the periods presented. These financial statements and financial highlights are the responsibility of the Funds' management. Our responsibility is to express an opinion on these financial statements and financial highlights based on our audits.
We conducted our audits in accordance with the standards of the Public Company Accounting Oversight Board (United States). Those standards require that we plan and perform the audit to obtain reasonable assurance about whether the financial statements and financial highlights are free of material misstatement. The Funds are not required to have, nor were we engaged to perform, an audit of their internal control over financial reporting. As a basis for designing audit procedures that are appropriate in the circumstances, but not for the purpose of expressing an opinion on the effectiveness of the Funds' internal control over financial reporting. Accordingly, we express no such opinion. An audit also includes examining, on a test basis, evidence supporting the amounts and disclosures in the financial statements, assessing the accounting principles used and significant estimates made by management, as well as evaluating the overall financial statement presentation. Our procedures included confirmation of securities owned as of January 31, 2014, by correspondence with the custodians and brokers; where replies were not received from brokers, we performed other auditing procedures. We believe that our audits provide a reasonable basis for our opinion.
In our opinion, the financial statements and financial highlights referred to above present fairly, in all material respects, the financial positions of Fidelity Series Equity-Income Fund and Fidelity Series All-Sector Equity Fund as of January 31, 2014, the results of their operations for the year then ended, and the changes in their net assets and the financial highlights for each of the periods presented, in conformity with accounting principles generally accepted in the United States of America.
DELOITTE & TOUCHE LLP
Boston, Massachusetts
March 17, 2014
Annual Report
Trustees and Officers
The Trustees, Member of the Advisory Board, and officers of the trust and funds, as applicable, are listed below. The Board of Trustees governs each fund and is responsible for protecting the interests of shareholders. The Trustees are experienced executives who meet periodically throughout the year to oversee each fund's activities, review contractual arrangements with companies that provide services to each fund, oversee management of the risks associated with such activities and contractual arrangements, and review each fund's performance. Except for James C. Curvey, Ned C. Lautenbach, and William S. Stavropoulos, each of the Trustees oversees 173 funds. Mr. Curvey oversees 396 funds. Mr. Lautenbach and Mr. Stavropoulos each oversee 247 funds.
The Trustees hold office without limit in time except that (a) any Trustee may resign; (b) any Trustee may be removed by written instrument, signed by at least two-thirds of the number of Trustees prior to such removal; (c) any Trustee who requests to be retired or who has become incapacitated by illness or injury may be retired by written instrument signed by a majority of the other Trustees; and (d) any Trustee may be removed at any special meeting of shareholders by a two-thirds vote of the outstanding voting securities of the trust. Each Trustee who is not an interested person (as defined in the 1940 Act) of the trust and the funds (Independent Trustee), shall retire not later than the last day of the calendar year in which his or her 75th birthday occurs. The Independent Trustees may waive this mandatory retirement age policy with respect to individual Trustees. The officers and Advisory Board Member hold office without limit in time, except that any officer and Advisory Board Member may resign or may be removed by a vote of a majority of the Trustees at any regular meeting or any special meeting of the Trustees. Except as indicated, each individual has held the office shown or other offices in the same company for the past five years.
Experience, Skills, Attributes, and Qualifications of the Funds' Trustees. The Governance and Nominating Committee has adopted a statement of policy that describes the experience, qualifications, attributes, and skills that are necessary and desirable for potential Independent Trustee candidates (Statement of Policy). The Board believes that each Trustee satisfied at the time he or she was initially elected or appointed a Trustee, and continues to satisfy, the standards contemplated by the Statement of Policy. The Governance and Nominating Committee also engages professional search firms to help identify potential Independent Trustee candidates who have the experience, qualifications, attributes, and skills consistent with the Statement of Policy. From time to time, additional criteria based on the composition and skills of the current Independent Trustees, as well as experience or skills that may be appropriate in light of future changes to board composition, business conditions, and regulatory or other developments, have also been considered by the professional search firms and the Governance and Nominating Committee. In addition, the Board takes into account the Trustees' commitment and participation in Board and committee meetings, as well as their leadership of standing and ad hoc committees throughout their tenure.
In determining that a particular Trustee was and continues to be qualified to serve as a Trustee, the Board has considered a variety of criteria, none of which, in isolation, was controlling. The Board believes that, collectively, the Trustees have balanced and diverse experience, qualifications, attributes, and skills, which allow the Board to operate effectively in governing each fund and protecting the interests of shareholders. Information about the specific experience, skills, attributes, and qualifications of each Trustee, which in each case led to the Board's conclusion that the Trustee should serve (or continue to serve) as a trustee of the funds, is provided below.
Annual Report
Board Structure and Oversight Function. James C. Curvey is an interested person (as defined in the 1940 Act) and currently serves as Chairman. The Trustees have determined that an interested Chairman is appropriate and benefits shareholders because an interested Chairman has a personal and professional stake in the quality and continuity of services provided to the funds. Independent Trustees exercise their informed business judgment to appoint an individual of their choosing to serve as Chairman, regardless of whether the Trustee happens to be independent or a member of management. The Independent Trustees have determined that they can act independently and effectively without having an Independent Trustee serve as Chairman and that a key structural component for assuring that they are in a position to do so is for the Independent Trustees to constitute a substantial majority for the Board. The Independent Trustees also regularly meet in executive session. Ned C. Lautenbach serves as Chairman of the Independent Trustees and as such (i) acts as a liaison between the Independent Trustees and management with respect to matters important to the Independent Trustees and (ii) with management prepares agendas for Board meetings.
Fidelity funds are overseen by different Boards of Trustees. The funds' Board oversees Fidelity's equity and high income funds and another Board oversees Fidelity's investment-grade bond, money market, and asset allocation funds. The asset allocation funds may invest in Fidelity funds overseen by the funds' Board. The use of separate Boards, each with its own committee structure, allows the Trustees of each group of Fidelity funds to focus on the unique issues of the funds they oversee, including common research, investment, and operational issues. On occasion, the separate Boards establish joint committees to address issues of overlapping consequences for the Fidelity funds overseen by each Board.
The Trustees operate using a system of committees to facilitate the timely and efficient consideration of all matters of importance to the Trustees, each fund, and fund shareholders and to facilitate compliance with legal and regulatory requirements and oversight of the funds' activities and associated risks. The Board, acting through its committees, has charged FMR and its affiliates with (i) identifying events or circumstances the occurrence of which could have demonstrably adverse effects on the funds' business and/or reputation; (ii) implementing processes and controls to lessen the possibility that such events or circumstances occur or to mitigate the effects of such events or circumstances if they do occur; and (iii) creating and maintaining a system designed to evaluate continuously business and market conditions in order to facilitate the identification and implementation processes described in (i) and (ii) above. Because the day-to-day operations and activities of the funds are carried out by or through FMR, its affiliates and other service providers, the funds' exposure to risks is mitigated but not eliminated by the processes overseen by the Trustees. While each of the Board's committees has responsibility for overseeing different aspects of the funds' activities, oversight is exercised primarily through the Operations, Audit, and Compliance Committees. In addition, the Independent Trustees have worked with FMR to enhance the Board's oversight of investment and financial risks, legal and regulatory risks, technology risks, and operational risks, including the development of additional risk reporting to the Board. For example, a working group comprised of Independent Trustees and FMR has worked and continues to work to review the Fidelity funds' valuation-related activities, reporting and risk management. Appropriate personnel, including but not limited to the funds' Chief Compliance Officer (CCO), FMR's internal auditor, the independent accountants, the funds' Treasurer and portfolio management personnel, make periodic reports to the Board's committees, as appropriate, including an annual review of FMR's risk management program for the Fidelity funds. The responsibilities of each standing committee, including their oversight responsibilities, are described further under "Standing Committees of the Funds' Trustees."
Annual Report
Trustees and Officers - continued
The funds' Statements of Additional Information (SAIs) includes more information about the Trustees. To request a free copy, call Fidelity at 1-800-544-8544 for Fidelity Series All-Sector Equity Fund, Fideltiy Series Equity-Income Fund, and Fidelity Series Stock Selector Large Cap Value Fund or 1-800-835-5092 for Class F.
Interested Trustees*:
Correspondence intended for each Trustee who is an interested person may be sent to Fidelity Investments, 245 Summer Street, Boston, Massachusetts 02210.
Name, Year of Birth; Principal Occupations and Other Relevant Experience+ | |
James C. Curvey (1935) | |
Year of Election or Appointment: 2007 Trustee Chairman of the Board of Trustees | |
| Mr. Curvey also serves as Trustee of other Fidelity funds. Mr. Curvey is a Director of Fidelity Investments Money Management, Inc. (2009-present), Director of Fidelity Research & Analysis Co. (2009-present) and Director of FMR and FMR Co., Inc. (2007-present). Mr. Curvey is also Vice Chairman (2007-present) and Director of FMR LLC. In addition, Mr. Curvey serves as an Overseer for the Boston Symphony Orchestra and a member of the Trustees of Villanova University. Previously, Mr. Curvey was the Vice Chairman (2006-2007) and Director (2000-2007) of FMR Corp. |
Charles S. Morrison (1960) | |
Year of Election or Appointment: 2014 Trustee | |
| Mr. Morrison also serves as Trustee or Vice President of other funds. He serves as President, Asset Management (2014-present) and is an employee of Fidelity Investments. Previously, Mr. Morrison served as President, Fixed Income (2011-2014), Vice President of Fidelity's Money Market Funds (2005-2009), President, Money Market Group Leader of FMR (2009), and Senior Vice President, Money Market Group of FMR (2004-2009). Mr. Morrison also served as Vice President of Fidelity's Bond Funds (2002-2005), certain Balanced Funds (2002-2005), and certain Asset Allocation Funds (2002-2007), and as Senior Vice President (2002-2005) of Fidelity's Bond Division. |
* Trustees have been determined to be "Interested Trustees" by virtue of, among other things, their affiliation with the trust or various entities under common control with FMR.
+ The information above includes each Trustee's principal occupation during the last five years and other information relating to the experience, attributes, and skills relevant to each Trustee's qualifications to serve as a Trustee, which led to the conclusion that each Trustee should serve as a Trustee for each fund.
Annual Report
Trustees and Officers - continued
Independent Trustees:
Correspondence intended for each Independent Trustee (that is, the Trustees other than the Interested Trustees) may be sent to Fidelity Investments, P.O. Box 55235, Boston, Massachusetts 02205-5235.
Name, Year of Birth; Principal Occupations and Other Relevant Experience+ | |
Dennis J. Dirks (1948) | |
Year of Election or Appointment: 2005 Trustee | |
| Mr. Dirks also serves as Trustee of other Fidelity funds. Prior to his retirement in May 2003, Mr. Dirks was Chief Operating Officer and a member of the Board of The Depository Trust & Clearing Corporation (DTCC). He also served as President, Chief Operating Officer, and Board member of The Depository Trust Company (DTC) and President and Board member of the National Securities Clearing Corporation (NSCC). In addition, Mr. Dirks served as Chief Executive Officer and Board member of the Government Securities Clearing Corporation, Chief Executive Officer and Board member of the Mortgage-Backed Securities Clearing Corporation, as a Trustee and a member of the Finance Committee of Manhattan College (2005-2008), and as a Trustee and a member of the Finance Committee of AHRC of Nassau County (2006-2008). Mr. Dirks is a member of the Independent Directors Council (IDC) Governing Council (2010-present) and Board of Directors for The Brookville Center for Children's Services, Inc. (2009-present). |
Alan J. Lacy (1953) | |
Year of Election or Appointment: 2008 Trustee | |
| Mr. Lacy also serves as Trustee of other Fidelity funds. Mr. Lacy serves as Senior Adviser (2007-present) of Oak Hill Capital Partners, L.P. (private equity). Mr. Lacy also served as Chief Executive Officer (2000-2005) and Vice Chairman (2005-2006) of Sears Holdings Corporation and Sears, Roebuck and Co. (retail). In addition, Mr. Lacy serves as a member of the Board of Directors of Dave & Buster's Entertainment, Inc. (restaurant and entertainment complexes, 2010-present), Earth Fare, Inc. (retail grocery, 2012-present), The Hillman Companies, Inc. (hardware wholesalers, 2010-present), and Bristol-Myers Squibb Company (global pharmaceuticals, 2008-present). Mr. Lacy is a member of the Board of Trustees of The National Parks Conservation Association (2006-present). Previously, Mr. Lacy served as Chairman of the Board of Trustees of the National Parks Conservation Association (2008-2011) and as a member of the Board of Directors for the Western Union Company (global money transfer, 2006-2011). |
Ned C. Lautenbach (1944) | |
Year of Election or Appointment: 2000 Trustee Chairman of the Independent Trustees | |
| Mr. Lautenbach also serves as Trustee of other Fidelity funds. Mr. Lautenbach currently serves as the Lead Director of the Eaton Corporation Board of Directors (diversified industrial, 1997-present). Mr. Lautenbach is Chairman of the Board of Directors of the Philharmonic Center for the Arts in Naples, Florida (2012-present) and a member of the Council on Foreign Relations (1994-present). Previously, Mr. Lautenbach was a Partner/Advisory Partner at Clayton, Dubilier & Rice, LLC (private equity investment, 1998-2010), as well as a Director of Sony Corporation (2006-2007). |
Joseph Mauriello (1944) | |
Year of Election or Appointment: 2008 Trustee | |
| Mr. Mauriello also serves as Trustee of other Fidelity funds. Prior to his retirement in January 2006, Mr. Mauriello served in numerous senior management positions including Deputy Chairman and Chief Operating Officer (2004-2005), and Vice Chairman of Financial Services (2002-2004) of KPMG LLP US (professional services, 1965-2005). Mr. Mauriello currently serves as a member of the Board of Directors of XL Group plc. (global insurance and re-insurance, 2006-present). Previously, Mr. Mauriello served as a Director of the Hamilton Funds of the Bank of New York (2006-2007) and of Arcadia Resources Inc. (health care services and products, 2007-2012). |
Robert W. Selander (1950) | |
Year of Election or Appointment: 2011 Trustee | |
| Mr. Selander also serves as Trustee of other Fidelity funds. Previously, Mr. Selander served as a Member of the Advisory Board of other Fidelity funds (2011), and Executive Vice Chairman (2010), Chief Executive Officer (2009-2010), and President and Chief Executive Officer (1997-2009) of Mastercard, Inc. |
Cornelia M. Small (1944) | |
Year of Election or Appointment: 2005 Trustee | |
| Ms. Small also serves as Trustee of other Fidelity funds. Ms. Small is a member of the Board of Directors (2009-present) and Chair of the Investment Committee (2010-present) of the Teagle Foundation. Ms. Small also serves on the Investment Committee of the Berkshire Taconic Community Foundation (2008-present). Previously, Ms. Small served as Chairperson (2002-2008) and a member of the Investment Committee and Chairperson (2008-2012) and a member of the Board of Trustees of Smith College. In addition, Ms. Small served as Chief Investment Officer, Director of Global Equity Investments, and a member of the Board of Directors of Scudder, Stevens & Clark and Scudder Kemper Investments. |
William S. Stavropoulos (1939) | |
Year of Election or Appointment: 2002 Trustee Vice Chairman of the Independent Trustees | |
| Mr. Stavropoulos also serves as Trustee of other Fidelity funds. Mr. Stavropoulos serves as President and Founder of the Michigan Baseball Foundation, the Great Lakes Loons (2007-present). Mr. Stavropoulos is Chairman Emeritus of the Board of Directors of The Dow Chemical Company, where he previously served in numerous senior management positions, including President, CEO (1995-2000; 2002-2004), Chairman of the Executive Committee (2000-2006), and as a member of the Board of Directors (1990-2006). Currently, Mr. Stavropoulos is Chairman of the Board of Directors of Univar Inc. (global distributor of commodity and specialty chemicals), a Director of Teradata Corporation (data warehousing and technology solutions), and Maersk Inc. (industrial conglomerate), and a member of the Advisory Board for Metalmark Capital LLC (private equity investment, 2005-present). Mr. Stavropoulos is an operating advisor to Clayton, Dubilier & Rice, LLC (private equity investment). In addition, Mr. Stavropoulos is a member of the University of Notre Dame Advisory Council for the College of Science, a Trustee of the Rollin L. Gerstacker Foundation, and a Director of the Naples Philharmonic Center for the Arts. Previously, Mr. Stavropoulos served as a Director of Chemical Financial Corporation (bank holding company, 1993-2012) and Tyco International, Ltd. (multinational manufacturing and services, 2007-2012). |
David M. Thomas (1949) | |
Year of Election or Appointment: 2008 Trustee | |
| Mr. Thomas also serves as Trustee of other Fidelity funds. Mr. Thomas serves as Non-Executive Chairman of the Board of Directors of Fortune Brands Home and Security (home and security products, 2011-present), and as a member of the Board of Directors of Interpublic Group of Companies, Inc. (marketing communication, 2004-present). Previously, Mr. Thomas served as Executive Chairman (2005-2006) and Chairman and Chief Executive Officer (2000-2005) of IMS Health, Inc. (pharmaceutical and healthcare information solutions), and a Director of Fortune Brands, Inc. (consumer products, 2000-2011). |
+ The information above includes each Trustee's principal occupation during the last five years and other information relating to the experience, attributes, and skills relevant to each Trustee's qualifications to serve as a Trustee, which led to the conclusion that each Trustee should serve as a Trustee for each fund.
Advisory Board Member and Officers:
Correspondence intended for each officer and Peter S. Lynch may be sent to Fidelity Investments, 245 Summer Street, Boston, Massachusetts 02210. Officers appear below in alphabetical order.
Name, Year of Birth; Principal Occupation | |
Peter S. Lynch (1944) | |
Year of Election or Appointment: 2003 Member of the Advisory Board | |
| Mr. Lynch also serves as Member of the Advisory Board of other Fidelity funds. Mr. Lynch is Vice Chairman and a Director of FMR and FMR Co., Inc. In addition, Mr. Lynch serves as a Trustee of Boston College and as the Chairman of the Inner-City Scholarship Fund. Previously, Mr. Lynch served on the Special Olympics International Board of Directors (1997-2006). |
Elizabeth Paige Baumann (1968) | |
Year of Election or Appointment: 2012 Anti-Money Laundering (AML) Officer | |
| Ms. Baumann also serves as AML Officer of other funds. She is Chief AML Officer of FMR LLC (2012-present) and is an employee of Fidelity Investments. Previously, Ms. Baumann served as Vice President and Deputy Anti-Money Laundering Officer (2007-2012). |
William C. Coffey (1969) | |
Year of Election or Appointment: 2009 Assistant Secretary | |
| Mr. Coffey also serves as Assistant Secretary of other funds. He is Senior Vice President and Deputy General Counsel of FMR LLC (2010-present), and is an employee of Fidelity Investments. Previously, Mr. Coffey served as Vice President and Associate General Counsel of FMR LLC (2005-2009). |
Jonathan Davis (1968) | |
Year of Election or Appointment: 2010 Assistant Treasurer | |
| Mr. Davis also serves as Assistant Treasurer of other funds. Mr. Davis is an employee of Fidelity Investments. Previously, Mr. Davis served as Vice President and Associate General Counsel of FMR LLC (2003-2010). |
Adrien E. Deberghes (1967) | |
Year of Election or Appointment: 2008 Deputy Treasurer | |
| Mr. Deberghes also serves as an officer of other funds. He is an employee of Fidelity Investments (2008-present). Prior to joining Fidelity Investments, Mr. Deberghes was Senior Vice President of Mutual Fund Administration at State Street Corporation (2007-2008), Senior Director of Mutual Fund Administration at Investors Bank & Trust (2005-2007), and Director of Finance for Dunkin' Brands (2000-2005). |
Stephanie J. Dorsey (1969) | |
Year of Election or Appointment: 2010 Assistant Treasurer | |
| Ms. Dorsey also serves as an officer of other funds. She is an employee of Fidelity Investments (2008-present) and has served in other fund officer roles. Prior to joining Fidelity Investments, Ms. Dorsey served as Treasurer (2004-2008) of the JPMorgan Mutual Funds and Vice President (2004-2008) of JPMorgan Chase Bank. |
Scott C. Goebel (1968) | |
Year of Election or Appointment: 2008 Secretary and Chief Legal Officer (CLO) | |
| Mr. Goebel serves as Secretary and CLO of other funds. Mr. Goebel also serves as Secretary of Fidelity SelectCo, LLC (2013-present), Fidelity Investments Money Management, Inc. (FIMM) (2010-present) and Fidelity Research and Analysis Company (FRAC) (2010-present); General Counsel, Secretary, and Senior Vice President of FMR (2008-present) and FMR Co., Inc. (2008-present); Chief Legal Officer of Fidelity Management & Research (Hong Kong) Limited (2008-present); and Assistant Secretary of Fidelity Management & Research (Japan) Inc. (2008-present) and Fidelity Management & Research (U.K.) Inc. (2008-present). Previously, Mr. Goebel served as Secretary and CLO of other Fidelity funds (2008-2013), Assistant Secretary of FIMM (2008-2010), FRAC (2008-2010), and certain funds (2007-2008); and as Vice President and Secretary of Fidelity Distributors Corporation (FDC) (2005-2007). Mr. Goebel has been employed by FMR LLC or an affiliate since 2001. |
Joseph A. Hanlon (1968) | |
Year of Election or Appointment: 2012 Chief Compliance Officer | |
| Mr. Hanlon also serves as Chief Compliance Officer of other funds. Mr. Hanlon serves as Compliance Officer of FMR, FMR Co., Inc., Fidelity Investments Money Management, Inc. (FIMM), Fidelity Research and Analysis Company (FRAC), and Fidelity Management & Research (Hong Kong) (2009-present), as Senior Vice President of the Fidelity Asset Management Division (2009-present), and is an employee of Fidelity Investments. Previously, Mr. Hanlon served as Compliance Officer of Fidelity Management & Research (Japan) Inc. (2009-2013), Strategic Advisers, Inc. (2009-2013), and Fidelity Management & Research (U.K.) Inc. (2009-2013). |
Thomas C. Hense (1964) | |
Year of Election or Appointment: 2008/2010 Vice President | |
| Mr. Hense also serves as Vice President of other funds (High Income (2008), Small Cap (2008), and Value (2010) funds). Previously, Mr. Hense served as a portfolio manager for Fidelity's Institutional Money Management Group (Pyramis) (2003-2008). |
Bruce T. Herring (1965) | |
Year of Election or Appointment: 2006 Vice President of certain Equity Funds | |
| Mr. Herring also serves as Vice President of other funds. He serves as Chief Investment Officer of Fidelity Global Asset Allocation (GAA) (2013-present), Group Chief Investment Officer of FMR, and President of Fidelity Research & Analysis Company (2010-present). Previously, Mr. Herring served as Chief Investment Officer and Director of Fidelity Management & Research (U.K.) Inc. (2010-2013), Vice President (2005-2006) and Senior Vice President (2006-2007) of Fidelity Management & Research Company, Vice President of FMR Co., Inc. (2001-2007), and as a portfolio manager for Fidelity U.S. Equity Funds. |
Brian B. Hogan (1964) | |
Year of Election or Appointment: 2009 Vice President | |
| Mr. Hogan also serves as Trustee or Vice President of other funds. Mr. Hogan serves as President of FMR's Equity Division (2009-present). Previously, Mr. Hogan served as Senior Vice President, Equity Research of FMR (2006-2009) and as a portfolio manager. |
Chris Maher (1972) | |
Year of Election or Appointment: 2013 Assistant Treasurer | |
| Mr. Maher serves as Assistant Treasurer of other funds. Mr. Maher is Vice President of Valuation Oversight and is an employee of Fidelity Investments. Previously, Mr. Maher served as Vice President of Asset Management Compliance (2013), Vice President of FMR's Program Management Group (2010-2013), and Vice President of Valuation Oversight (2008-2010). |
Christine Reynolds (1958) | |
Year of Election or Appointment: 2008 Chief Financial Officer | |
| Ms. Reynolds also serves as Chief Financial Officer of other funds. Ms. Reynolds became President of Fidelity Pricing and Cash Management Services (FPCMS) in August 2008. Ms. Reynolds served as Chief Operating Officer of FPCMS (2007-2008). Previously, Ms. Reynolds served as President, Treasurer, and Anti-Money Laundering officer of the Fidelity funds (2004-2007). |
Kenneth B. Robins (1969) | |
Year of Election or Appointment: 2008 President and Treasurer | |
| Mr. Robins also serves as an officer of other funds. Mr. Robins serves as Executive Vice President of Fidelity Investments Money Management, Inc. (FIMM) (2013-present) and is an employee of Fidelity Investments (2004-present). Previously, Mr. Robins served in other fund officer roles. |
Gary W. Ryan (1958) | |
Year of Election or Appointment: 2005 Assistant Treasurer | |
| Mr. Ryan also serves as Assistant Treasurer of other funds. Mr. Ryan is an employee of Fidelity Investments and has served in other fund officer roles. Previously, Mr. Ryan served as Vice President of Fund Reporting in Fidelity Pricing and Cash Management Services (FPCMS) (1999-2005). |
Stephen Sadoski (1971) | |
Year of Election or Appointment: 2012 Deputy Treasurer | |
| Mr. Sadoski also serves as Deputy Treasurer of other funds. He is an employee of Fidelity Investments (2012-present) and has served in another fund officer role. Prior to joining Fidelity Investments, Mr. Sadoski served as an assistant chief accountant in the Division of Investment Management of the Securities and Exchange Commission (SEC) (2009-2012) and as a senior manager at Deloitte & Touche LLP (1997-2009). |
Stacie M. Smith (1974) | |
Year of Election or Appointment: 2013 Deputy Treasurer | |
| Ms. Smith also serves as an officer of other funds. She is an employee of Fidelity Investments (2009-present) and has served in other fund officer roles. Prior to joining Fidelity Investments, Ms. Smith served as Senior Audit Manager of Ernst & Young LLP (1996-2009). |
Renee Stagnone (1975) | |
Year of Election or Appointment: 2013 Deputy Treasurer | |
| Ms. Stagnone also serves as Deputy Treasurer of other funds. Ms. Stagnone is an employee of Fidelity Investments. |
Joseph F. Zambello (1957) | |
Year of Election or Appointment: 2011 Deputy Treasurer | |
| Mr. Zambello also serves as Deputy Treasurer of other funds. Mr. Zambello is an employee of Fidelity Investments. Previously, Mr. Zambello served as Vice President of FMR's Program Management Group (2009-2011) and Vice President of the Transfer Agent Oversight Group (2005-2009). |
Annual Report
Distributions (Unaudited)
The Board of Trustees of each voted to pay to shareholders of record at the opening of business on record date, the following distributions per share derived from capital gains realized from sales of portfolio securities and dividends derived from net investment income:
Fidelity Series All-Sector Equity Fund | Pay Date | Record Date | Dividends | Capital Gains |
Series All-Sector Equity | 03/17/14 | 03/14/14 | $0.002 | $0.449 |
Class F | 03/17/14 | 03/14/14 | $0.004 | $0.449 |
Fidelity Series Equity-Income Fund | Pay Date | Record Date | Dividends | Capital Gains |
Series Equity-Income | 03/17/14 | 03/14/14 | $0.000 | $0.035 |
Class F | 03/17/14 | 03/14/14 | $0.000 | $0.035 |
Fidelity Series Stock Selector Large Cap Value Fund | Pay Date | Record Date | Dividends | Capital Gains |
Series Stock Selector Large Cap Value | 03/17/14 | 03/14/14 | $0.000 | $0.134 |
Class F | 03/17/14 | 03/14/14 | $0.000 | $0.136 |
The funds hereby designate as capital gain dividend the amounts noted below for the taxable year ended January 31, 2014, or, if subsequently determined to be different, the net capital gain of such year.
Fidelity Series All-Sector Equity Fund | $591,766,817 |
Fidelity Series Equity-Income Fund | $14,947,525 |
Fidelity Series Stock Selector Large Cap Value Fund | $24,419,630 |
A percentage of the dividends distributed during the fiscal year for the following funds was derived from interest on U.S. Government securities which is generally exempt from state income tax:
Fidelity Series Equity-Income Fund |
|
Series Equity-Income | 0.05% |
Class F | 0.05% |
A percentage of the dividends distributed during the fiscal year for the following funds qualifies for the dividends-received deduction for corporate shareholders:
| March | April | July | October | December |
Fidelity Series All-Sector Equity Fund |
|
|
|
|
|
Series All-Sector Equity | 91% | - | - | - | 29% |
Class F | 81% | - | - | - | 28% |
| March | April | July | October | December |
Fidelity Series Equity-Income Fund |
|
|
|
|
|
Series Equity-Income | 50% | 44% | 43% | 43% | 41% |
Class F | 50% | 42% | 39% | 39% | 41% |
Fidelity Series Stock Selector Large Cap Value Fund |
|
|
|
|
|
Series Stock Selector Large Cap Value | 25% | - | - | - | 25% |
Class F | 24% | - | - | - | 25% |
A percentage of the dividends distributed during the fiscal year for the following funds may be taken into account as a dividend for purposes of a maximum rate under 1(h) (11) of the Internal Revenue Code.
| March | April | July | October | December |
Fidelity |
|
|
|
|
|
Series All-Sector Equity Fund |
|
|
|
|
|
Series All-Sector Equity | 95% | - | - | - | 31% |
Class F | 85% | - | - | - | 30% |
Fidelity Series Equity-Income Fund |
|
|
|
|
|
Series Equity-Income | 49% | 46% | 45% | 45% | 43% |
Class F | 49% | 43% | 41% | 42% | 43% |
Fidelity Series Stock Selector Large Cap Value Fund |
|
|
|
|
|
Series Stock Selector Large Cap Value | 20% | - | - | - | 27% |
Class F | 19% | - | - | - | 27% |
The fund will notify shareholders in January 2015 of amounts for use in preparing 2014 income tax returns.
Annual Report
Investment Adviser
Fidelity Management & Research Company
Boston, MA
Investment Sub-Advisers
FMR Co., Inc.
Fidelity Management & Research (U.K.) Inc.
Fidelity Management & Research (Hong Kong) Limited
Fidelity Management & Research (Japan) Inc.
General Distributor
Fidelity Distributors Corporation
Smithfield, RI
Transfer and Service Agents
Fidelity Investments Institutional Operations Company, Inc.
Boston, MA
Fidelity Service Company, Inc.
Boston, MA
Custodians
The Northern Trust Company
Chicago, IL
Fidelity Series All-Sector Equity Fund and Fidelity Series Equity-Income Fund
State Street Bank & Trust Company
Quincy, MA
Fidelity Series Stock Selector Large Cap Value Fund
(Fidelity Investment logo)(registered trademark)
Corporate Headquarters
245 Summer St., Boston, MA 02210
www.fidelity.com
EDT-LDT-ANN-0314
1.956971.101
(Fidelity Investment logo)(registered trademark)
Fidelity Advisor®
Stock Selector
Large Cap Value
Fund - Class A, Class T, Class B
and Class C
Annual Report
January 31, 2014
(Fidelity Cover Art)
Class A, Class T, Class B,
and Class C are classes of
Fidelity® Stock Selector Large
Cap Value Fund
Contents
Performance | How the fund has done over time. | |
Management's Discussion of Fund Performance | The Portfolio Manager's review of fund performance and strategy. | |
Shareholder Expense Example | An example of shareholder expenses. | |
Investment Changes | A summary of major shifts in the fund's investments over the past six months. | |
Investments | A complete list of the fund's investments with their market values. | |
Financial Statements | Statements of assets and liabilities, operations, and changes in net assets, as well as financial highlights. | |
Notes | Notes to the financial statements. | |
Report of Independent Registered Public Accounting Firm |
| |
Trustees and Officers |
| |
Distributions |
|
To view a fund's proxy voting guidelines and proxy voting record for the 12-month period ended June 30, visit http://www.fidelity.com/proxyvotingresults or visit the Securities and Exchange Commission's (SEC) web site at http://www.sec.gov. You may also call 1-877-208-0098 to request a free copy of the proxy voting guidelines.
Standard & Poor's, S&P and S&P 500 are registered service marks of The McGraw-Hill Companies, Inc. and have been licensed for use by Fidelity Distributors Corporation.
Other third-party marks appearing herein are the property of their respective owners.
All other marks appearing herein are registered or unregistered trademarks or service marks of FMR LLC or an affiliated company. © 2014 FMR LLC. All rights reserved.
This report and the financial statements contained herein are submitted for the general information of the shareholders of the fund. This report is not authorized for distribution to prospective investors in the fund unless preceded or accompanied by an effective prospectus.
A fund files its complete schedule of portfolio holdings with the SEC for the first and third quarters of each fiscal year on Form N-Q. Forms N-Q are available on the SEC's web site at http://www.sec.gov. A fund's Forms N-Q may be reviewed and copied at the SEC's Public Reference Room in Washington, DC. Information regarding the operation of the SEC's Public Reference Room may be obtained by calling 1-800-SEC-0330. For a complete list of a fund's portfolio holdings, view the most recent holdings listing, semiannual report, or annual report on Fidelity's web site at http://www.fidelity.com, http://www.advisor.fidelity.com, or http://www.401k.com, as applicable.
NOT FDIC INSURED • MAY LOSE VALUE • NO BANK GUARANTEE
Neither the fund nor Fidelity Distributors Corporation is a bank.
Annual Report
Performance: The Bottom Line
Average annual total return reflects the change in the value of an investment, assuming reinvestment of the class' distributions from dividend income and capital gains (the profits earned upon the sale of securities that have grown in value, if any) and assuming a constant rate of performance each year. The $10,000 table and the fund's returns do not reflect the deduction of taxes that a shareholder would pay on fund distributions or the redemption of fund shares. During periods of reimbursement by Fidelity, a fund's total return will be greater than it would be had the reimbursement not occurred. How a fund did yesterday is no guarantee of how it will do tomorrow.
Average Annual Total Returns
Periods ended January 31, 2014 | Past 1 | Past 5 | Past 10 |
Class A (incl. 5.75% sales charge) A | 13.11% | 14.60% | 5.12% |
Class T (incl. 3.50% sales charge) B | 15.36% | 14.79% | 5.14% |
Class B (incl. contingent deferred | 13.94% | 14.83% | 5.15% |
Class C (incl. contingent deferred | 17.94% | 15.09% | 5.19% |
A Class A shares bear a 0.25% 12b-1 fee. The initial offering of Class A shares took place on February 13, 2007. Returns prior to February 13, 2007 are those of Fidelity® Stock Selector Large Cap Value Fund, the original class of the fund, which has no 12b-1 fee. Had Class A shares' 12b-1 fee been reflected, returns prior to February 13, 2007 would have been lower.
B Class T shares bear a 0.50% 12b-1 fee. The initial offering of Class T shares took place on February 13, 2007. Returns prior to February 13, 2007 are those of Fidelity® Stock Selector Large Cap Value Fund, the original class of the fund, which has no 12b-1 fee. Had Class T shares' 12b-1 fee been reflected, returns prior to February 13, 2007 would have been lower.
C Class B shares bear a 1.00% 12b-1 fee. The initial offering of Class B shares took place on February 13, 2007. Returns prior to February 13, 2007 are those of Fidelity Stock Selector Large Cap Value Fund, the original class of the fund, which has no 12b-1 fee. Had Class B shares' 12b-1 fee been reflected, returns prior to February 13, 2007 would have been lower. Class B shares' contingent deferred sales charge included in the past one year, past five years, and past ten years total return figures are 5%, 2%, and 0%, respectively.
D Class C shares bear a 1.00% 12b-1 fee. The initial offering of Class C shares took place on February 13, 2007. Returns prior to February 13, 2007 are those of Fidelity Stock Selector Large Cap Value Fund, the original class of the fund, which has no 12b-1 fee. Had Class C shares' 12b-1 fee been reflected, returns prior to February 13, 2007 would have been lower. Class C shares' contingent deferred sales charge included in the past one year, past five years, and past ten years total return figures are 1%, 0%, and 0%, respectively.
Annual Report
$10,000 Over 10 Years
Let's say hypothetically that $10,000 was invested in Fidelity Advisor® Stock Selector Large Cap Value Fund - Class A on January 31, 2004. The chart shows how the value of your investment would have changed, and also shows how the Russell 1000® Value Index performed over the same period. The initial offering of Class A took place on February 13, 2007. See the previous page for additional information regarding the performance of Class A.
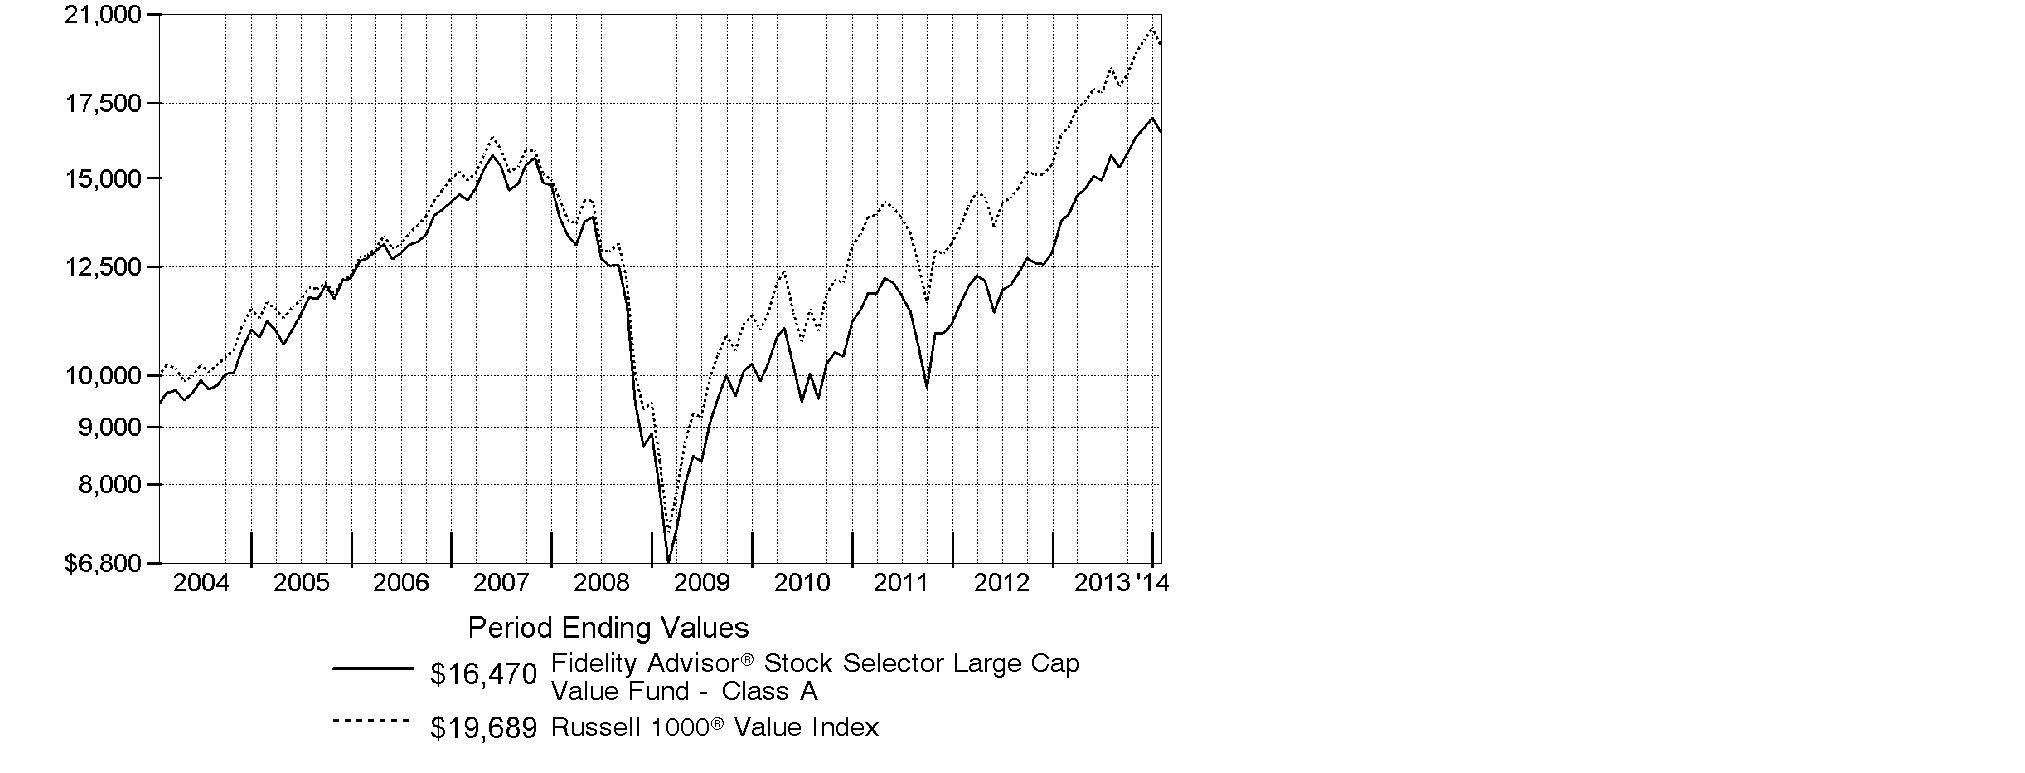
Annual Report
Management's Discussion of Fund Performance
Market Recap: Despite the worst January in years, markets finished notably higher for the 12 months ending January 31, 2014, amid a generally improving global economy and accommodative monetary policies worldwide. After achieving a series of highs in 2013, both the broad S&P 500® Index and the blue-chip Dow Jones Industrial AverageSM pulled back in the new year, bringing their 12-month returns to 21.52% and 16.07%, respectively. The growth-oriented Nasdaq Composite Index®, having run hotter in 2013 and cooled less in January, retained a loftier 32.33% result. For the period overall, smaller-cap stocks generally outperformed larger-caps, and growth outperformed value across market-cap segments. Bullish sentiment drove stocks higher through mid-May, but mixed signals from the U.S. Federal Reserve as to when it might curtail its stimulative bond-buying program, along with jitters over a potential U.S. military strike in Syria, put the markets in flux over the summer. Stocks regained their momentum in October despite a budget impasse that briefly shuttered the federal government, and volatility remained subdued heading into the holidays, allowing many markets to hit all-time highs by year-end. In January, renewed optimism for Europe and other developed markets was overrun by renewed concern about Fed tapering, the economic slowdown in China and a sell-off in emerging markets.
Comments from Matthew Friedman, Lead Portfolio Manager of Fidelity Advisor® Stock Selector Large Cap Value Fund: For the year, the fund's Class A, Class T, Class B and Class C shares rose 20.01%, 19.54%, 18.94% and 18.94%, respectively (excluding sales charges), straddling both the 20.02% return of the Russell 1000® Value Index. The fund's performance versus the index primarily resulted from strong stock choices in health care, financials, consumer discretionary and utilities, which were partially offset by some stock-specific mistakes, most notably in energy. Among individual contributors, two real estate names - Kennedy-Wilson Holdings and Greece-based Eurobank Properties Real Estate Investment - were big relative contributors. The firms' exposure to the strong-performing U.K. and Greek real estate markets, respectively, helped propel both stocks. Conversely, not owning diversified financials firm Bank of America was the fund's biggest individual detractor. The stock flourished along with the diversified financials industry overall. Owning EZCORP also hurt. The company provides a variety of short-term consumer loans and sells merchandise via its pawn-lending operations business. The firm reported consecutive quarters of disappointing financial results, which turned investors away from the stock. Of note, the fund's modest cash position hurt in an up market. Many of the names I've mentioned were out-of-index holdings.
The views expressed above reflect those of the portfolio manager(s) only through the end of the period as stated on the cover of this report and do not necessarily represent the views of Fidelity or any other person in the Fidelity organization. Any such views are subject to change at any time based upon market or other conditions and Fidelity disclaims any responsibility to update such views. These views may not be relied on as investment advice and, because investment decisions for a Fidelity fund are based on numerous factors, may not be relied on as an indication of trading intent on behalf of any Fidelity fund.
Annual Report
Shareholder Expense Example
As a shareholder of the Fund, you incur two types of costs: (1) transaction costs, including sales charges (loads) on purchase payments or redemption proceeds, and (2) ongoing costs, including management fees, distribution and/or service (12b-1) fees and other Fund expenses. This Example is intended to help you understand your ongoing costs (in dollars) of investing in the Fund and to compare these costs with the ongoing costs of investing in other mutual funds.
The Example is based on an investment of $1,000 invested at the beginning of the period and held for the entire period (August 1, 2013 to January 31, 2014).
Actual Expenses
The first line of the accompanying table for each class of the Fund provides information about actual account values and actual expenses. You may use the information in this line, together with the amount you invested, to estimate the expenses that you paid over the period. Simply divide your account value by $1,000.00 (for example, an $8,600 account value divided by $1,000.00 = 8.6), then multiply the result by the number in the first line for a class of the Fund under the heading entitled "Expenses Paid During Period" to estimate the expenses you paid on your account during this period. A small balance maintenance fee of $12.00 that is charged once a year may apply for certain accounts with a value of less than $2,000. This fee is not included in the table below. If it was, the estimate of expenses you paid during the period would be higher, and your ending account value lower, by this amount. In addition, the Fund, as a shareholder in the underlying Fidelity Central Funds, will indirectly bear its pro-rata share of the fees and expenses incurred by the underlying Fidelity Central Funds. These fees and expenses are not included in the Fund's annualized expense ratio used to calculate the expense estimate in the table below.
Hypothetical Example for Comparison Purposes
The second line of the accompanying table for each class of the Fund provides information about hypothetical account values and hypothetical expenses based on a Class' actual expense ratio and an assumed rate of return of 5% per year before expenses, which is not the Class' actual return. The hypothetical account values and expenses may not be used to estimate the actual ending account balance or expenses you paid for the period. You may use this information to compare the ongoing costs of investing in the Fund and other funds. To do so, compare this 5% hypothetical example with the 5% hypothetical examples that appear in the shareholder reports of the other funds. A small balance maintenance fee of $12.00 that is charged once a year may apply for certain accounts with a value of less than $2,000. This fee is not included in the table below. If it was, the estimate of expenses you paid during the period would be higher, and your ending account value lower, by this amount. In addition, the Fund, as a shareholder in the underlying Fidelity Central Funds, will indirectly bear its pro-rata share of the fees and expenses incurred by the underlying Fidelity Central Funds. These fees and expenses are not included in the Fund's annualized expense ratio used to calculate the expense estimate in the table below.
Please note that the expenses shown in the table are meant to highlight your ongoing costs only and do not reflect any transaction costs. Therefore, the second line of the table is useful in comparing ongoing costs only, and will not help you determine the relative total costs of owning different funds. In addition, if these transactional costs were included, your costs would have been higher.
Annual Report
| Annualized | Beginning | Ending | Expenses Paid |
Class A | 1.05% |
|
|
|
Actual |
| $ 1,000.00 | $ 1,048.30 | $ 5.42 |
HypotheticalA |
| $ 1,000.00 | $ 1,019.91 | $ 5.35 |
Class T | 1.37% |
|
|
|
Actual |
| $ 1,000.00 | $ 1,046.00 | $ 7.07 |
HypotheticalA |
| $ 1,000.00 | $ 1,018.30 | $ 6.97 |
Class B | 1.87% |
|
|
|
Actual |
| $ 1,000.00 | $ 1,043.50 | $ 9.63 |
HypotheticalA |
| $ 1,000.00 | $ 1,015.78 | $ 9.50 |
Class C | 1.86% |
|
|
|
Actual |
| $ 1,000.00 | $ 1,043.50 | $ 9.58 |
HypotheticalA |
| $ 1,000.00 | $ 1,015.83 | $ 9.45 |
Stock Selector Large Cap Value | .77% |
|
|
|
Actual |
| $ 1,000.00 | $ 1,049.40 | $ 3.98 |
HypotheticalA |
| $ 1,000.00 | $ 1,021.32 | $ 3.92 |
Institutional Class | .77% |
|
|
|
Actual |
| $ 1,000.00 | $ 1,049.00 | $ 3.98 |
HypotheticalA |
| $ 1,000.00 | $ 1,021.32 | $ 3.92 |
A 5% return per year before expenses
B Annualized expense ratio reflects expenses net of applicable fee waivers.
* Expenses are equal to each Class' annualized expense ratio, multiplied by the average account value over the period, multiplied by 184/365 (to reflect the one-half year period).
Annual Report
Investment Changes (Unaudited)
Top Ten Stocks as of January 31, 2014 | ||
| % of fund's | % of fund's net assets |
Wells Fargo & Co. | 3.4 | 3.3 |
General Electric Co. | 3.1 | 2.8 |
Berkshire Hathaway, Inc. Class B | 2.9 | 3.1 |
Merck & Co., Inc. | 2.4 | 2.9 |
Chevron Corp. | 2.3 | 2.8 |
Occidental Petroleum Corp. | 2.1 | 2.3 |
Cisco Systems, Inc. | 1.9 | 1.2 |
Suncor Energy, Inc. | 1.9 | 1.9 |
Canadian Natural Resources Ltd. | 1.8 | 1.8 |
Apple, Inc. | 1.6 | 1.6 |
| 23.4 | |
Top Five Market Sectors as of January 31, 2014 | ||
| % of fund's | % of fund's net assets |
Financials | 27.5 | 27.5 |
Energy | 14.0 | 14.6 |
Health Care | 14.0 | 12.5 |
Industrials | 9.2 | 9.0 |
Information Technology | 8.8 | 8.8 |
Asset Allocation (% of fund's net assets) | |||||||
As of January 31, 2014* | As of July 31, 2013** | ||||||
 | Stocks and |
| | Stocks and |
| ||
 | Other Investments 0.1% |
|  | Other Investments 0.0% |
| ||
 | Short-Term |
| | Short-Term |
| ||
* Foreign investments | 14.5% |
| ** Foreign investments | 11.2% |
| ||

Annual Report
Investments January 31, 2014
Showing Percentage of Net Assets
Common Stocks - 95.7% | |||
Shares | Value | ||
CONSUMER DISCRETIONARY - 6.2% | |||
Auto Components - 1.5% | |||
Delphi Automotive PLC | 59,000 | $ 3,592,510 | |
TRW Automotive Holdings Corp. (a) | 62,098 | 4,604,567 | |
| 8,197,077 | ||
Internet & Catalog Retail - 0.4% | |||
Liberty Interactive Corp. Series A (a) | 81,644 | 2,180,711 | |
Media - 2.2% | |||
Comcast Corp. Class A | 89,378 | 4,866,632 | |
Omnicom Group, Inc. | 29,600 | 2,148,368 | |
Twenty-First Century Fox, Inc. Class A | 165,500 | 5,266,210 | |
| 12,281,210 | ||
Multiline Retail - 1.4% | |||
Macy's, Inc. | 66,650 | 3,545,780 | |
Target Corp. | 81,334 | 4,606,758 | |
| 8,152,538 | ||
Specialty Retail - 0.7% | |||
Staples, Inc. | 315,065 | 4,146,255 | |
TOTAL CONSUMER DISCRETIONARY | 34,957,791 | ||
CONSUMER STAPLES - 5.6% | |||
Beverages - 0.3% | |||
Molson Coors Brewing Co. Class B | 35,500 | 1,868,720 | |
Food & Staples Retailing - 1.3% | |||
Wal-Mart Stores, Inc. | 58,745 | 4,387,077 | |
Walgreen Co. | 54,640 | 3,133,604 | |
| 7,520,681 | ||
Food Products - 1.9% | |||
Bunge Ltd. | 44,735 | 3,389,124 | |
Mondelez International, Inc. | 129,010 | 4,225,078 | |
The J.M. Smucker Co. | 31,942 | 3,078,889 | |
| 10,693,091 | ||
Household Products - 1.6% | |||
Procter & Gamble Co. | 113,280 | 8,679,514 | |
Personal Products - 0.5% | |||
Coty, Inc. Class A | 209,500 | 2,826,155 | |
TOTAL CONSUMER STAPLES | 31,588,161 | ||
Common Stocks - continued | |||
Shares | Value | ||
ENERGY - 14.0% | |||
Energy Equipment & Services - 0.9% | |||
National Oilwell Varco, Inc. | 65,600 | $ 4,920,656 | |
Oil, Gas & Consumable Fuels - 13.1% | |||
Anadarko Petroleum Corp. | 89,920 | 7,255,645 | |
Apache Corp. | 59,800 | 4,799,548 | |
BG Group PLC | 168,400 | 2,829,231 | |
Canadian Natural Resources Ltd. | 313,800 | 10,289,541 | |
Chevron Corp. | 117,200 | 13,083,036 | |
Marathon Petroleum Corp. | 89,800 | 7,817,090 | |
Noble Energy, Inc. | 84,160 | 5,245,693 | |
Occidental Petroleum Corp. | 137,078 | 12,003,920 | |
Suncor Energy, Inc. | 319,300 | 10,489,955 | |
| 73,813,659 | ||
TOTAL ENERGY | 78,734,315 | ||
FINANCIALS - 26.9% | |||
Capital Markets - 2.8% | |||
Bank of New York Mellon Corp. | 158,000 | 5,049,680 | |
Goldman Sachs Group, Inc. | 10,000 | 1,641,200 | |
Invesco Ltd. | 85,800 | 2,852,850 | |
Morgan Stanley | 153,700 | 4,535,687 | |
SWS Group, Inc. (a) | 201,000 | 1,543,680 | |
| 15,623,097 | ||
Commercial Banks - 8.2% | |||
CIT Group, Inc. | 95,900 | 4,464,145 | |
First Citizen Bancshares, Inc. | 27,200 | 6,017,728 | |
PNC Financial Services Group, Inc. | 92,100 | 7,356,948 | |
Popular, Inc. (a) | 98,280 | 2,594,592 | |
U.S. Bancorp | 164,100 | 6,519,693 | |
Wells Fargo & Co. | 421,300 | 19,101,739 | |
| 46,054,845 | ||
Consumer Finance - 1.0% | |||
Cash America International, Inc. | 45,000 | 1,652,850 | |
EZCORP, Inc. (non-vtg.) Class A (a) | 174,700 | 1,918,206 | |
SLM Corp. | 99,500 | 2,264,620 | |
| 5,835,676 | ||
Common Stocks - continued | |||
Shares | Value | ||
FINANCIALS - continued | |||
Diversified Financial Services - 4.1% | |||
Berkshire Hathaway, Inc. Class B (a) | 145,457 | $ 16,233,001 | |
Interactive Brokers Group, Inc. | 320,900 | 6,803,080 | |
| 23,036,081 | ||
Insurance - 5.3% | |||
ACE Ltd. | 64,500 | 6,050,745 | |
AFLAC, Inc. | 58,450 | 3,669,491 | |
Donegal Group, Inc. Class A | 90,500 | 1,322,205 | |
Fairfax Financial Holdings Ltd. (sub. vtg.) | 7,650 | 2,943,919 | |
MetLife, Inc. | 97,700 | 4,792,185 | |
National Western Life Insurance Co. Class A | 8,850 | 1,930,628 | |
Old Republic International Corp. | 173,700 | 2,713,194 | |
StanCorp Financial Group, Inc. | 30,500 | 1,959,625 | |
Torchmark Corp. | 56,350 | 4,234,703 | |
| 29,616,695 | ||
Real Estate Investment Trusts - 2.4% | |||
American Tower Corp. | 34,200 | 2,766,096 | |
Ares Commercial Real Estate Corp. | 10,000 | 133,300 | |
Boston Properties, Inc. | 7,400 | 799,866 | |
CyrusOne, Inc. | 69,000 | 1,491,090 | |
Eurobank Properties Real Estate Investment Co. (a) | 517,920 | 5,273,816 | |
Hibernia (REIT) PLC | 693,800 | 1,057,373 | |
New Residential Investment Corp. | 110,000 | 698,500 | |
Newcastle Investment Corp. | 110,000 | 598,400 | |
RAIT Financial Trust | 40,000 | 337,600 | |
| 13,156,041 | ||
Real Estate Management & Development - 1.8% | |||
Consolidated-Tomoka Land Co. | 35,150 | 1,235,523 | |
Kennedy-Wilson Holdings, Inc. (a) | 365,500 | 8,779,310 | |
| 10,014,833 | ||
Thrifts & Mortgage Finance - 1.3% | |||
Beneficial Mutual Bancorp, Inc. (a) | 210,000 | 2,494,800 | |
HF Financial Corp. | 1,500 | 19,785 | |
Meridian Interstate Bancorp, Inc. (a) | 210,000 | 4,943,400 | |
| 7,457,985 | ||
TOTAL FINANCIALS | 150,795,253 | ||
Common Stocks - continued | |||
Shares | Value | ||
HEALTH CARE - 14.0% | |||
Biotechnology - 0.4% | |||
Amgen, Inc. | 16,900 | $ 2,010,255 | |
Health Care Equipment & Supplies - 0.6% | |||
St. Jude Medical, Inc. | 57,600 | 3,498,048 | |
Health Care Providers & Services - 3.8% | |||
Express Scripts Holding Co. (a) | 49,800 | 3,719,562 | |
HCA Holdings, Inc. (a) | 99,200 | 4,986,784 | |
Team Health Holdings, Inc. (a) | 49,300 | 2,127,788 | |
UnitedHealth Group, Inc. | 123,000 | 8,890,440 | |
WellPoint, Inc. | 17,101 | 1,470,686 | |
| 21,195,260 | ||
Pharmaceuticals - 9.2% | |||
AbbVie, Inc. | 33,400 | 1,644,282 | |
Actavis PLC (a) | 25,800 | 4,875,684 | |
Endo Health Solutions, Inc. (a)(d) | 41,100 | 2,707,668 | |
Jazz Pharmaceuticals PLC (a) | 43,900 | 6,657,874 | |
Johnson & Johnson | 102,100 | 9,032,787 | |
Merck & Co., Inc. | 255,200 | 13,517,944 | |
Pfizer, Inc. | 152,900 | 4,648,160 | |
Teva Pharmaceutical Industries Ltd. sponsored ADR | 82,400 | 3,677,512 | |
Valeant Pharmaceuticals International (Canada) (a) | 35,800 | 4,857,871 | |
| 51,619,782 | ||
TOTAL HEALTH CARE | 78,323,345 | ||
INDUSTRIALS - 9.2% | |||
Aerospace & Defense - 0.5% | |||
Textron, Inc. | 87,800 | 3,116,900 | |
Air Freight & Logistics - 1.3% | |||
FedEx Corp. | 54,000 | 7,199,280 | |
Commercial Services & Supplies - 0.6% | |||
Waste Management, Inc. | 77,201 | 3,225,458 | |
Construction & Engineering - 1.9% | |||
AECOM Technology Corp. (a) | 194,600 | 5,579,182 | |
URS Corp. | 101,100 | 5,075,220 | |
| 10,654,402 | ||
Electrical Equipment - 0.7% | |||
Babcock & Wilcox Co. | 107,400 | 3,681,672 | |
Industrial Conglomerates - 3.1% | |||
General Electric Co. | 704,600 | 17,706,598 | |
Common Stocks - continued | |||
Shares | Value | ||
INDUSTRIALS - continued | |||
Machinery - 0.4% | |||
Caterpillar, Inc. | 11,600 | $ 1,089,356 | |
Terex Corp. | 25,000 | 1,025,000 | |
| 2,114,356 | ||
Road & Rail - 0.7% | |||
CSX Corp. | 145,700 | 3,920,787 | |
TOTAL INDUSTRIALS | 51,619,453 | ||
INFORMATION TECHNOLOGY - 8.8% | |||
Communications Equipment - 1.9% | |||
Cisco Systems, Inc. | 479,500 | 10,505,845 | |
Computers & Peripherals - 3.0% | |||
Apple, Inc. | 18,350 | 9,186,010 | |
EMC Corp. | 325,000 | 7,878,000 | |
| 17,064,010 | ||
Electronic Equipment & Components - 0.5% | |||
Jabil Circuit, Inc. | 155,948 | 2,802,386 | |
Semiconductors & Semiconductor Equipment - 2.1% | |||
Broadcom Corp. Class A | 266,300 | 7,925,088 | |
Samsung Electronics Co. Ltd. | 3,166 | 3,711,203 | |
| 11,636,291 | ||
Software - 1.3% | |||
Oracle Corp. | 130,100 | 4,800,690 | |
Symantec Corp. | 124,100 | 2,656,981 | |
| 7,457,671 | ||
TOTAL INFORMATION TECHNOLOGY | 49,466,203 | ||
MATERIALS - 2.4% | |||
Chemicals - 2.1% | |||
Ashland, Inc. | 28,300 | 2,626,523 | |
Axiall Corp. | 39,900 | 1,592,010 | |
Chemtura Corp. (a) | 69,100 | 1,733,028 | |
Eastman Chemical Co. | 46,300 | 3,609,548 | |
LyondellBasell Industries NV Class A | 29,520 | 2,324,995 | |
| 11,886,104 | ||
Common Stocks - continued | |||
Shares | Value | ||
MATERIALS - continued | |||
Metals & Mining - 0.3% | |||
Freeport-McMoRan Copper & Gold, Inc. | 55,700 | $ 1,805,237 | |
TOTAL MATERIALS | 13,691,341 | ||
TELECOMMUNICATION SERVICES - 2.3% | |||
Diversified Telecommunication Services - 2.1% | |||
AT&T, Inc. | 226,100 | 7,533,652 | |
CenturyLink, Inc. | 102,914 | 2,970,098 | |
Frontier Communications Corp. (d) | 235,200 | 1,105,440 | |
| 11,609,190 | ||
Wireless Telecommunication Services - 0.2% | |||
NII Holdings, Inc. (a)(d) | 367,400 | 1,105,874 | |
TOTAL TELECOMMUNICATION SERVICES | 12,715,064 | ||
UTILITIES - 6.3% | |||
Electric Utilities - 3.1% | |||
Edison International | 78,600 | 3,785,376 | |
ITC Holdings Corp. | 49,100 | 5,081,850 | |
NextEra Energy, Inc. | 58,410 | 5,369,631 | |
Xcel Energy, Inc. | 100,200 | 2,896,782 | |
| 17,133,639 | ||
Gas Utilities - 0.9% | |||
Atmos Energy Corp. | 66,700 | 3,202,267 | |
National Fuel Gas Co. | 24,800 | 1,868,928 | |
| 5,071,195 | ||
Multi-Utilities - 2.3% | |||
Alliant Energy Corp. | 35,900 | 1,865,364 | |
Ameren Corp. | 47,700 | 1,804,968 | |
NiSource, Inc. | 116,400 | 4,000,668 | |
Sempra Energy | 56,950 | 5,279,835 | |
| 12,950,835 | ||
TOTAL UTILITIES | 35,155,669 | ||
TOTAL COMMON STOCKS (Cost $472,260,044) |
| ||
Nonconvertible Preferred Stocks - 0.5% | |||
Shares | Value | ||
FINANCIALS - 0.5% | |||
Commercial Banks - 0.5% | |||
Itau Unibanco Holding SA sponsored ADR | 217,580 | $ 2,663,179 | |
Real Estate Investment Trusts - 0.0% | |||
Eagle Hospitality Properties Trust, Inc. 8.25% (a) | 47,000 | 47 | |
Equity Lifestyle Properties, Inc. Series C, 6.75% | 16,134 | 374,147 | |
| 374,194 | ||
TOTAL NONCONVERTIBLE PREFERRED STOCKS (Cost $4,836,790) |
| ||
U.S. Treasury Obligations - 0.0% | ||||
| Principal Amount |
| ||
U.S. Treasury Bills, yield at date of purchase 0.01% to 0.04% 2/27/14 to 5/1/14 (g) | $ 125,000 |
| ||
Preferred Securities - 0.1% | |||
|
|
|
|
FINANCIALS - 0.1% | |||
Diversified Financial Services - 0.1% | |||
Baggot Securities Ltd. 10.24% (e)(f) (Cost $353,254) | 230,000 |
| |
Money Market Funds - 4.0% | |||
Shares |
| ||
Fidelity Cash Central Fund, 0.10% (b) | 20,064,480 | 20,064,480 | |
Fidelity Securities Lending Cash Central Fund, 0.09% (b)(c) | 2,132,550 | 2,132,550 | |
TOTAL MONEY MARKET FUNDS (Cost $22,197,030) |
| ||
TOTAL INVESTMENT PORTFOLIO - 100.3% (Cost $499,772,114) | 562,767,269 | ||
NET OTHER ASSETS (LIABILITIES) - (0.3)% | (1,749,617) | ||
NET ASSETS - 100% | $ 561,017,652 | ||
Futures Contracts | |||||
Expiration Date | Underlying Face Amount at Value | Unrealized Appreciation/ | |||
Purchased | |||||
Equity Index Contracts | |||||
58 ICE Russell 1000 Value Index Contracts (United States) | March 2014 | $ 5,159,100 | $ (148,245) | ||
The face value of futures purchased as a percentage of net assets is 0.9% |
Currency Abbreviations | ||
EUR | - | European Monetary Unit |
Legend |
(a) Non-income producing |
(b) Affiliated fund that is generally available only to investment companies and other accounts managed by Fidelity Investments. The rate quoted is the annualized seven-day yield of the fund at period end. A complete unaudited listing of the fund's holdings as of its most recent quarter end is available upon request. In addition, each Fidelity Central Fund's financial statements, which are not covered by the Fund's Report of Independent Registered Public Accounting Firm, are available on the SEC's website or upon request. |
(c) Investment made with cash collateral received from securities on loan. |
(d) Security or a portion of the security is on loan at period end. |
(e) Security exempt from registration under Rule 144A of the Securities Act of 1933. These securities may be resold in transactions exempt from registration, normally to qualified institutional buyers. At the end of the period, the value of these securities amounted to $361,275 or 0.1% of net assets. |
(f) Security is perpetual in nature with no stated maturity date. |
(g) Security or a portion of the security was pledged to cover margin requirements for futures contracts. At period end, the value of securities pledged amounted to $124,996. |
Affiliated Central Funds |
Information regarding fiscal year to date income earned by the Fund from investments in Fidelity Central Funds is as follows: |
Fund | Income earned |
Fidelity Cash Central Fund | $ 19,669 |
Fidelity Securities Lending Cash Central Fund | 47,322 |
Total | $ 66,991 |
Other Information |
The following is a summary of the inputs used, as of January 31, 2014, involving the Fund's assets and liabilities carried at fair value. The inputs or methodology used for valuing securities may not be an indication of the risk associated with investing in those securities. For more information on valuation inputs, and their aggregation into the levels used in the table below, please refer to the Investment Valuation section in the accompanying Notes to Financial Statements. |
Valuation Inputs at Reporting Date: | ||||
Description | Total | Level 1 | Level 2 | Level 3 |
Investments in Securities: | ||||
Equities: | ||||
Consumer Discretionary | $ 34,957,791 | $ 34,957,791 | $ - | $ - |
Consumer Staples | 31,588,161 | 31,588,161 | - | - |
Energy | 78,734,315 | 78,734,315 | - | - |
Financials | 153,832,626 | 153,832,579 | - | 47 |
Health Care | 78,323,345 | 78,323,345 | - | - |
Industrials | 51,619,453 | 51,619,453 | - | - |
Information Technology | 49,466,203 | 45,755,000 | 3,711,203 | - |
Materials | 13,691,341 | 13,691,341 | - | - |
Telecommunication Services | 12,715,064 | 12,715,064 | - | - |
Utilities | 35,155,669 | 35,155,669 | - | - |
U.S. Government and Government Agency Obligations | 124,996 | - | 124,996 | - |
Preferred Securities | 361,275 | - | 361,275 | - |
Money Market Funds | 22,197,030 | 22,197,030 | - | - |
Total Investments in Securities: | $ 562,767,269 | $ 558,569,748 | $ 4,197,474 | $ 47 |
Derivative Instruments: | ||||
Liabilities | ||||
Futures Contracts | $ (148,245) | $ (148,245) | $ - | $ - |
Value of Derivative Instruments |
The following table is a summary of the Fund's value of derivative instruments by primary risk exposure as of January 31, 2014. For additional information on derivative instruments, please refer to the Derivative Instruments section in the accompanying Notes to Financial Statements. |
Primary Risk Exposure / | Value | |
| Asset | Liability |
Equity Risk | ||
Futures Contracts (a) | $ - | $ (148,245) |
Total Value of Derivatives | $ - | $ (148,245) |
(a) Reflects gross cumulative appreciation (depreciation) on futures contracts as presented in the Schedule of Investments. Only the period end receivable or payable for daily variation margin and net unrealized appreciation (depreciation) are presented in the Statement of Assets and Liabilities. |
Distribution of investments by country or territory of incorporation, as a percentage of total net assets, is as follows (Unaudited): |
United States of America | 85.5% |
Canada | 5.1% |
Ireland | 2.4% |
Bermuda | 1.1% |
Switzerland | 1.1% |
Others (Individually Less Than 1%) | 4.8% |
| 100.0% |
See accompanying notes which are an integral part of the financial statements.
Annual Report
Financial Statements
Statement of Assets and Liabilities
| January 31, 2014 | |
|
|
|
Assets | ||
Investment in securities, at value (including securities loaned of $2,048,037) - See accompanying schedule: Unaffiliated issuers (cost $477,575,084) | $ 540,570,239 |
|
Fidelity Central Funds (cost $22,197,030) | 22,197,030 |
|
Total Investments (cost $499,772,114) |
| $ 562,767,269 |
Receivable for investments sold | 5,929,565 | |
Receivable for fund shares sold | 552,977 | |
Dividends receivable | 353,518 | |
Distributions receivable from Fidelity Central Funds | 9,313 | |
Prepaid expenses | 1,123 | |
Other receivables | 6,597 | |
Total assets | 569,620,362 | |
|
|
|
Liabilities | ||
Payable to custodian bank | $ 105,997 | |
Payable for investments purchased | 4,695,548 | |
Payable for fund shares redeemed | 1,197,395 | |
Accrued management fee | 241,268 | |
Distribution and service plan fees payable | 16,062 | |
Payable for daily variation margin for derivative instruments | 44,080 | |
Other affiliated payables | 114,213 | |
Other payables and accrued expenses | 55,597 | |
Collateral on securities loaned, at value | 2,132,550 | |
Total liabilities | 8,602,710 | |
|
|
|
Net Assets | $ 561,017,652 | |
Net Assets consist of: |
| |
Paid in capital | $ 791,086,240 | |
Accumulated undistributed net realized gain (loss) on investments and foreign currency transactions | (292,914,584) | |
Net unrealized appreciation (depreciation) on investments and assets and liabilities in foreign currencies | 62,845,996 | |
Net Assets | $ 561,017,652 | |
See accompanying notes which are an integral part of the financial statements.
Annual Report
Statement of Assets and Liabilities - continued
| January 31, 2014 | |
|
|
|
Calculation of Maximum Offering Price Class A: | $ 14.72 | |
|
|
|
Maximum offering price per share (100/94.25 of $14.72) | $ 15.62 | |
Class T: | $ 14.71 | |
|
|
|
Maximum offering price per share (100/96.50 of $14.71) | $ 15.24 | |
Class B: | $ 14.72 | |
|
|
|
Class C: | $ 14.53 | |
|
|
|
Stock Selector Large Cap Value: | $ 14.81 | |
|
|
|
Institutional Class: | $ 14.74 | |
A Redemption price per share is equal to net asset value less any applicable contingent deferred sales charge.
See accompanying notes which are an integral part of the financial statements.
Annual Report
Financial Statements - continued
Statement of Operations
| Year ended January 31, 2014 | |
|
|
|
Investment Income |
|
|
Dividends |
| $ 10,508,965 |
Interest |
| 383 |
Income from Fidelity Central Funds |
| 66,991 |
Total income |
| 10,576,339 |
|
|
|
Expenses | ||
Management fee | $ 3,003,251 | |
Performance adjustment | (664,858) | |
Transfer agent fees | 1,175,937 | |
Distribution and service plan fees | 177,227 | |
Accounting and security lending fees | 206,936 | |
Custodian fees and expenses | 37,404 | |
Independent trustees' compensation | 2,737 | |
Registration fees | 93,237 | |
Audit | 57,311 | |
Legal | 2,105 | |
Miscellaneous | 3,894 | |
Total expenses before reductions | 4,095,181 | |
Expense reductions | (22,191) | 4,072,990 |
Net investment income (loss) | 6,503,349 | |
Realized and Unrealized Gain (Loss) Net realized gain (loss) on: | ||
Investment securities: |
|
|
Unaffiliated issuers | 58,186,576 | |
Foreign currency transactions | (8,422) | |
Futures contracts | 1,432,461 | |
Total net realized gain (loss) |
| 59,610,615 |
Change in net unrealized appreciation (depreciation) on: Investment securities | 32,608,267 | |
Assets and liabilities in foreign currencies | (220) | |
Futures contracts | (477,467) | |
Total change in net unrealized appreciation (depreciation) |
| 32,130,580 |
Net gain (loss) | 91,741,195 | |
Net increase (decrease) in net assets resulting from operations | $ 98,244,544 | |
See accompanying notes which are an integral part of the financial statements.
Annual Report
Statement of Changes in Net Assets
| Year ended | Year ended |
Increase (Decrease) in Net Assets |
|
|
Operations |
|
|
Net investment income (loss) | $ 6,503,349 | $ 9,916,334 |
Net realized gain (loss) | 59,610,615 | 29,669,811 |
Change in net unrealized appreciation (depreciation) | 32,130,580 | 43,960,221 |
Net increase (decrease) in net assets resulting | 98,244,544 | 83,546,366 |
Distributions to shareholders from net investment income | (7,028,513) | (9,512,706) |
Distributions to shareholders from net realized gain | (1,781,878) | - |
Total distributions | (8,810,391) | (9,512,706) |
Share transactions - net increase (decrease) | (28,375,927) | (89,844,793) |
Total increase (decrease) in net assets | 61,058,226 | (15,811,133) |
|
|
|
Net Assets | ||
Beginning of period | 499,959,426 | 515,770,559 |
End of period (including undistributed net investment income of $0 and undistributed net investment income of $393,853, respectively) | $ 561,017,652 | $ 499,959,426 |
See accompanying notes which are an integral part of the financial statements.
Annual Report
Financial Highlights - Class A
Years ended January 31, | 2014 | 2013 | 2012 | 2011 | 2010 |
Selected Per-Share Data |
|
|
|
|
|
Net asset value, beginning of period | $ 12.43 | $ 10.71 | $ 10.72 | $ 9.35 | $ 7.53 |
Income from Investment Operations |
|
|
|
|
|
Net investment income (loss) C | .13 | .20 | .14 | .09 | .09 |
Net realized and unrealized gain (loss) | 2.35 | 1.73 | .02 | 1.38 | 1.85 |
Total from investment operations | 2.48 | 1.93 | .16 | 1.47 | 1.94 |
Distributions from net investment income | (.15) | (.21) | (.17) | (.10) | (.12) |
Distributions from net realized gain | (.05) | - | - | - | - |
Total distributions | (.19) G | (.21) | (.17) | (.10) | (.12) |
Net asset value, end of period | $ 14.72 | $ 12.43 | $ 10.71 | $ 10.72 | $ 9.35 |
Total Return A,B | 20.01% | 18.15% | 1.58% | 15.79% | 25.74% |
Ratios to Average Net Assets D,F |
|
|
|
|
|
Expenses before reductions | 1.00% | .87% | .87% | 1.00% | 1.15% |
Expenses net of fee waivers, if any | 1.00% | .87% | .87% | 1.00% | 1.15% |
Expenses net of all reductions | 1.00% | .85% | .86% | 1.00% | 1.13% |
Net investment income (loss) | .95% | 1.74% | 1.38% | .87% | 1.08% |
Supplemental Data |
|
|
|
|
|
Net assets, end of period (000 omitted) | $ 21,266 | $ 18,234 | $ 18,900 | $ 20,815 | $ 23,778 |
Portfolio turnover rate E | 64% | 63% | 128% | 120% | 171% |
A Total returns would have been lower if certain expenses had not been reduced during the applicable periods shown.
B Total returns do not include the effect of the sales charges.
C Calculated based on average shares outstanding during the period.
D Fees and expenses of any underlying Fidelity Central Funds are not included in the Fund's expense ratio. The Fund indirectly bears its proportionate share of the expenses of any underlying Fidelity Central Funds.
E Amount does not include the portfolio activity of any underlying Fidelity Central Funds.
F Expense ratios reflect operating expenses of the class. Expenses before reductions do not reflect amounts reimbursed by the investment adviser or reductions from brokerage service arrangements or reductions from other expense offset arrangements and do not represent the amount paid by the class during periods when reimbursements or reductions occur. Expenses net of fee waivers reflect expenses after reimbursement by the investment adviser but prior to reductions from brokerage service arrangements or other expense offset arrangements. Expenses net of all reductions represent the net expenses paid by the class.
G Total distributions of $.19 per share is comprised of distributions from net investment income of $.147 and distributions from net realized gain of $.047 per share.
See accompanying notes which are an integral part of the financial statements.
Annual Report
Financial Highlights - Class T
Years ended January 31, | 2014 | 2013 | 2012 | 2011 | 2010 |
Selected Per-Share Data |
|
|
|
|
|
Net asset value, beginning of period | $ 12.44 | $ 10.72 | $ 10.74 | $ 9.36 | $ 7.54 |
Income from Investment Operations |
|
|
|
|
|
Net investment income (loss) C | .09 | .17 | .12 | .06 | .07 |
Net realized and unrealized gain (loss) | 2.34 | 1.73 | .01 | 1.39 | 1.84 |
Total from investment operations | 2.43 | 1.90 | .13 | 1.45 | 1.91 |
Distributions from net investment income | (.11) | (.18) | (.15) | (.07) | (.09) |
Distributions from net realized gain | (.05) | - | - | - | - |
Total distributions | (.16) | (.18) | (.15) | (.07) | (.09) |
Net asset value, end of period | $ 14.71 | $ 12.44 | $ 10.72 | $ 10.74 | $ 9.36 |
Total Return A,B | 19.54% | 17.88% | 1.26% | 15.50% | 25.30% |
Ratios to Average Net Assets D,F |
|
|
|
|
|
Expenses before reductions | 1.32% | 1.14% | 1.14% | 1.29% | 1.45% |
Expenses net of fee waivers, if any | 1.32% | 1.14% | 1.14% | 1.29% | 1.45% |
Expenses net of all reductions | 1.31% | 1.12% | 1.13% | 1.28% | 1.44% |
Net investment income (loss) | .63% | 1.48% | 1.11% | .59% | .78% |
Supplemental Data |
|
|
|
|
|
Net assets, end of period (000 omitted) | $ 8,244 | $ 6,544 | $ 5,603 | $ 5,625 | $ 9,101 |
Portfolio turnover rate E | 64% | 63% | 128% | 120% | 171% |
A Total returns would have been lower if certain expenses had not been reduced during the applicable periods shown.
B Total returns do not include the effect of the sales charges.
C Calculated based on average shares outstanding during the period.
D Fees and expenses of any underlying Fidelity Central Funds are not included in the Fund's expense ratio. The Fund indirectly bears its proportionate share of the expenses of any underlying Fidelity Central Funds.
E Amount does not include the portfolio activity of any underlying Fidelity Central Funds.
F Expense ratios reflect operating expenses of the class. Expenses before reductions do not reflect amounts reimbursed by the investment adviser or reductions from brokerage service arrangements or reductions from other expense offset arrangements and do not represent the amount paid by the class during periods when reimbursements or reductions occur. Expenses net of fee waivers reflect expenses after reimbursement by the investment adviser but prior to reductions from brokerage service arrangements or other expense offset arrangements. Expenses net of all reductions represent the net expenses paid by the class.
See accompanying notes which are an integral part of the financial statements.
Annual Report
Financial Highlights - Class B
Years ended January 31, | 2014 | 2013 | 2012 | 2011 | 2010 |
Selected Per-Share Data |
|
|
|
|
|
Net asset value, beginning of period | $ 12.44 | $ 10.72 | $ 10.72 | $ 9.35 | $ 7.53 |
Income from Investment Operations |
|
|
|
|
|
Net investment income (loss) C | .02 | .11 | .07 | .01 | .02 |
Net realized and unrealized gain (loss) | 2.34 | 1.73 | .02 | 1.38 | 1.85 |
Total from investment operations | 2.36 | 1.84 | .09 | 1.39 | 1.87 |
Distributions from net investment income | (.03) | (.12) | (.09) | (.02) | (.05) |
Distributions from net realized gain | (.05) | - | - | - | - |
Total distributions | (.08) | (.12) | (.09) | (.02) | (.05) |
Net asset value, end of period | $ 14.72 | $ 12.44 | $ 10.72 | $ 10.72 | $ 9.35 |
Total Return A,B | 18.94% | 17.24% | .86% | 14.87% | 24.79% |
Ratios to Average Net Assets D,F |
|
|
|
|
|
Expenses before reductions | 1.81% | 1.63% | 1.62% | 1.80% | 1.98% |
Expenses net of fee waivers, if any | 1.80% | 1.63% | 1.62% | 1.80% | 1.98% |
Expenses net of all reductions | 1.80% | 1.60% | 1.62% | 1.79% | 1.97% |
Net investment income (loss) | .14% | .99% | .63% | .08% | .24% |
Supplemental Data |
|
|
|
|
|
Net assets, end of period (000 omitted) | $ 1,632 | $ 1,645 | $ 1,819 | $ 2,274 | $ 2,711 |
Portfolio turnover rate E | 64% | 63% | 128% | 120% | 171% |
A Total returns would have been lower if certain expenses had not been reduced during the applicable periods shown.
B Total returns do not include the effect of the contingent deferred sales charge.
C Calculated based on average shares outstanding during the period.
D Fees and expenses of any underlying Fidelity Central Funds are not included in the Fund's expense ratio. The Fund indirectly bears its proportionate share of the expenses of any underlying Fidelity Central Funds.
E Amount does not include the portfolio activity of any underlying Fidelity Central Funds.
F Expense ratios reflect operating expenses of the class. Expenses before reductions do not reflect amounts reimbursed by the investment adviser or reductions from brokerage service arrangements or reductions from other expense offset arrangements and do not represent the amount paid by the class during periods when reimbursements or reductions occur. Expenses net of fee waivers reflect expenses after reimbursement by the investment adviser but prior to reductions from brokerage service arrangements or other expense offset arrangements. Expenses net of all reductions represent the net expenses paid by the class.
See accompanying notes which are an integral part of the financial statements.
Annual Report
Financial Highlights - Class C
Years ended January 31, | 2014 | 2013 | 2012 | 2011 | 2010 |
Selected Per-Share Data |
|
|
|
|
|
Net asset value, beginning of period | $ 12.30 | $ 10.61 | $ 10.63 | $ 9.30 | $ 7.49 |
Income from Investment Operations |
|
|
|
|
|
Net investment income (loss) C | .02 | .11 | .07 | .01 | .03 |
Net realized and unrealized gain (loss) | 2.31 | 1.72 | .01 | 1.36 | 1.84 |
Total from investment operations | 2.33 | 1.83 | .08 | 1.37 | 1.87 |
Distributions from net investment income | (.05) | (.14) | (.10) | (.04) | (.06) |
Distributions from net realized gain | (.05) | - | - | - | - |
Total distributions | (.10) | (.14) | (.10) | (.04) | (.06) |
Net asset value, end of period | $ 14.53 | $ 12.30 | $ 10.61 | $ 10.63 | $ 9.30 |
Total Return A,B | 18.94% | 17.32% | .85% | 14.79% | 24.97% |
Ratios to Average Net Assets D,F |
|
|
|
|
|
Expenses before reductions | 1.81% | 1.63% | 1.62% | 1.75% | 1.89% |
Expenses net of fee waivers, if any | 1.80% | 1.63% | 1.62% | 1.75% | 1.89% |
Expenses net of all reductions | 1.80% | 1.61% | 1.61% | 1.74% | 1.88% |
Net investment income (loss) | .14% | .99% | .63% | .13% | .34% |
Supplemental Data |
|
|
|
|
|
Net assets, end of period (000 omitted) | $ 7,789 | $ 5,839 | $ 4,979 | $ 3,959 | $ 3,491 |
Portfolio turnover rate E | 64% | 63% | 128% | 120% | 171% |
A Total returns would have been lower if certain expenses had not been reduced during the applicable periods shown.
B Total returns do not include the effect of the contingent deferred sales charge.
C Calculated based on average shares outstanding during the period.
D Fees and expenses of any underlying Fidelity Central Funds are not included in the Fund's expense ratio. The Fund indirectly bears its proportionate share of the expenses of any underlying Fidelity Central Funds.
E Amount does not include the portfolio activity of any underlying Fidelity Central Funds.
F Expense ratios reflect operating expenses of the class. Expenses before reductions do not reflect amounts reimbursed by the investment adviser or reductions from brokerage service arrangements or reductions from other expense offset arrangements and do not represent the amount paid by the class during periods when reimbursements or reductions occur. Expenses net of fee waivers reflect expenses after reimbursement by the investment adviser but prior to reductions from brokerage service arrangements or other expense offset arrangements. Expenses net of all reductions represent the net expenses paid by the class.
See accompanying notes which are an integral part of the financial statements.
Annual Report
Financial Highlights - Stock Selector Large Cap Value
Years ended January 31, | 2014 | 2013 | 2012 | 2011 | 2010 |
Selected Per-Share Data |
|
|
|
|
|
Net asset value, beginning of period | $ 12.51 | $ 10.77 | $ 10.78 | $ 9.40 | $ 7.56 |
Income from Investment Operations |
|
|
|
|
|
Net investment income (loss) B | .17 | .23 | .18 | .11 | .12 |
Net realized and unrealized gain (loss) | 2.37 | 1.75 | .01 | 1.40 | 1.86 |
Total from investment operations | 2.54 | 1.98 | .19 | 1.51 | 1.98 |
Distributions from net investment income | (.19) | (.24) | (.20) | (.13) | (.14) |
Distributions from net realized gain | (.05) | - | - | - | - |
Total distributions | (.24) | (.24) | (.20) | (.13) | (.14) |
Net asset value, end of period | $ 14.81 | $ 12.51 | $ 10.77 | $ 10.78 | $ 9.40 |
Total Return A | 20.31% | 18.55% | 1.85% | 16.09% | 26.21% |
Ratios to Average Net Assets C,E |
|
|
|
|
|
Expenses before reductions | .72% | .57% | .57% | .73% | .85% |
Expenses net of fee waivers, if any | .72% | .57% | .57% | .73% | .85% |
Expenses net of all reductions | .71% | .55% | .56% | .72% | .84% |
Net investment income (loss) | 1.23% | 2.05% | 1.68% | 1.15% | 1.38% |
Supplemental Data |
|
|
|
|
|
Net assets, end of period (000 omitted) | $ 518,206 | $ 465,702 | $ 482,950 | $ 803,009 | $ 914,828 |
Portfolio turnover rate D | 64% | 63% | 128% | 120% | 171% |
A Total returns would have been lower if certain expenses had not been reduced during the applicable periods shown.
B Calculated based on average shares outstanding during the period.
C Fees and expenses of any underlying Fidelity Central Funds are not included in the Fund's expense ratio. The Fund indirectly bears its proportionate share of the expenses of any underlying Fidelity Central Funds.
D Amount does not include the portfolio activity of any underlying Fidelity Central Funds.
E Expense ratios reflect operating expenses of the class. Expenses before reductions do not reflect amounts reimbursed by the investment adviser or reductions from brokerage service arrangements or reductions from other expense offset arrangements and do not represent the amount paid by the class during periods when reimbursements or reductions occur. Expenses net of fee waivers reflect expenses after reimbursement by the investment adviser but prior to reductions from brokerage service arrangements or other expense offset arrangements. Expenses net of all reductions represent the net expenses paid by the class.
See accompanying notes which are an integral part of the financial statements.
Annual Report
Financial Highlights - Institutional Class
Years ended January 31, | 2014 | 2013 | 2012 | 2011 | 2010 |
Selected Per-Share Data |
|
|
|
|
|
Net asset value, beginning of period | $ 12.46 | $ 10.74 | $ 10.74 | $ 9.37 | $ 7.54 |
Income from Investment Operations |
|
|
|
|
|
Net investment income (loss) B | .17 | .23 | .17 | .11 | .12 |
Net realized and unrealized gain (loss) | 2.35 | 1.73 | .02 | 1.39 | 1.85 |
Total from investment operations | 2.52 | 1.96 | .19 | 1.50 | 1.97 |
Distributions from net investment income | (.19) | (.24) | (.19) | (.13) | (.14) |
Distributions from net realized gain | (.05) | - | - | - | - |
Total distributions | (.24) | (.24) | (.19) | (.13) | (.14) |
Net asset value, end of period | $ 14.74 | $ 12.46 | $ 10.74 | $ 10.74 | $ 9.37 |
Total Return A | 20.25% | 18.42% | 1.92% | 16.04% | 26.18% |
Ratios to Average Net Assets C,E |
|
|
|
|
|
Expenses before reductions | .73% | .61% | .60% | .74% | .87% |
Expenses net of fee waivers, if any | .73% | .61% | .60% | .74% | .87% |
Expenses net of all reductions | .73% | .58% | .60% | .73% | .86% |
Net investment income (loss) | 1.22% | 2.01% | 1.65% | 1.14% | 1.36% |
Supplemental Data |
|
|
|
|
|
Net assets, end of period (000 omitted) | $ 3,881 | $ 1,995 | $ 1,519 | $ 1,876 | $ 2,279 |
Portfolio turnover rate D | 64% | 63% | 128% | 120% | 171% |
A Total returns would have been lower if certain expenses had not been reduced during the applicable periods shown.
B Calculated based on average shares outstanding during the period.
C Fees and expenses of any underlying Fidelity Central Funds are not included in the Fund's expense ratio. The Fund indirectly bears its proportionate share of the expenses of any underlying Fidelity Central Funds.
D Amount does not include the portfolio activity of any underlying Fidelity Central Funds.
E Expense ratios reflect operating expenses of the class. Expenses before reductions do not reflect amounts reimbursed by the investment adviser or reductions from brokerage service arrangements or reductions from other expense offset arrangements and do not represent the amount paid by the class during periods when reimbursements or reductions occur. Expenses net of fee waivers reflect expenses after reimbursement by the investment adviser but prior to reductions from brokerage service arrangements or other expense offset arrangements. Expenses net of all reductions represent the net expenses paid by the class.
See accompanying notes which are an integral part of the financial statements.
Annual Report
Notes to Financial Statements
For the period ended January 31, 2014
1. Organization.
Fidelity Stock Selector Large Cap Value Fund (the Fund) is a fund of Fidelity Devonshire Trust (the Trust) and is authorized to issue an unlimited number of shares. The Trust is registered under the Investment Company Act of 1940, as amended (the 1940 Act), as an open-end management investment company organized as a Massachusetts business trust. The Fund offers Class A, Class T, Class C, Stock Selector Large Cap Value and Institutional Class shares, each of which, along with Class B shares, has equal rights as to assets and voting privileges. Class B shares are closed to new accounts and additional purchases, except for exchanges and reinvestments. Each class has exclusive voting rights with respect to matters that affect that class. Class B shares will automatically convert to Class A shares after a holding period of seven years from the initial date of purchase.
2. Investments in Fidelity Central Funds.
The Fund invests in Fidelity Central Funds, which are open-end investment companies generally available only to other investment companies and accounts managed by the investment adviser and its affiliates. The Fund's Schedule of Investments lists each of the Fidelity Central Funds held as of period end, if any, as an investment of the Fund, but does not include the underlying holdings of each Fidelity Central Fund. As an Investing Fund, the Fund indirectly bears its proportionate share of the expenses of the underlying Fidelity Central Funds.
The Money Market Central Funds seek preservation of capital and current income and are managed by Fidelity Investments Money Management, Inc. (FIMM), an affiliate of the investment adviser. Annualized expenses of the Money Market Central Funds as of their most recent shareholder report date are less than .01%.
A complete unaudited list of holdings for each Fidelity Central Fund is available upon request or at the Securities and Exchange Commission (the SEC) website at www.sec.gov. In addition, the financial statements of the Fidelity Central Funds, which are not covered by the Fund's Report of Independent Registered Public Accounting Firm, are available on the SEC website or upon request.
3. Significant Accounting Policies.
The financial statements have been prepared in conformity with accounting principles generally accepted in the United States of America (GAAP), which require management to make certain estimates and assumptions at the date of the financial statements. Actual results could differ from those estimates. Subsequent events, if any, through the date that the financial statements were issued have been evaluated in the preparation of
Annual Report
3. Significant Accounting Policies - continued
the financial statements. The following summarizes the significant accounting policies of the Fund:
Investment Valuation. Investments are valued as of 4:00 p.m. Eastern time on the last calendar day of the period. In accordance with valuation policies and procedures approved by the Board of Trustees (the Board), the Fund attempts to obtain prices from one or more third party pricing vendors or brokers to value its investments. When current market prices, quotations or currency exchange rates are not readily available or reliable, investments will be fair valued in good faith by the Fidelity Management & Research Company (FMR) Fair Value Committee (the Committee), in accordance with procedures adopted by the Board. Factors used in determining fair value vary by investment type and may include market or investment specific events, changes in interest rates and credit quality. The frequency with which these procedures are used cannot be predicted and they may be utilized to a significant extent. The Committee oversees the Fund's valuation policies and procedures and is responsible for approving and reporting to the Board all fair value determinations.
The Fund categorizes the inputs to valuation techniques used to value its investments into a disclosure hierarchy consisting of three levels as shown below:
Level 1 - quoted prices in active markets for identical investments
Level 2 - other significant observable inputs (including quoted prices for similar investments, interest rates, prepayment speeds, etc.)
Level 3 - unobservable inputs (including the Fund's own assumptions based on the best information available)
Valuation techniques used to value the Fund's investments by major category are as follows:
Equity securities, including restricted securities, for which market quotations are readily available, are valued at the last reported sale price or official closing price as reported by a third party pricing vendor on the primary market or exchange on which they are traded and are categorized as Level 1 in the hierarchy. In the event there were no sales during the day or closing prices are not available, securities are valued at the last quoted bid price or may be valued using the last available price and are generally categorized as Level 2 in the hierarchy. For foreign equity securities, when market or security specific events arise, comparisons to the valuation of American Depositary Receipts (ADRs), futures contracts, Exchange-Traded Funds (ETFs) and certain indexes as well as quoted prices for similar securities may be used and would be categorized as Level 2 in the hierarchy. Utilizing these techniques may result in transfers between Level 1 and Level 2. For equity securities, including restricted securities, where observable inputs are
Annual Report
Notes to Financial Statements - continued
3. Significant Accounting Policies - continued
Investment Valuation - continued
limited, assumptions about market activity and risk are used and these securities may be categorized as Level 3 in the hierarchy.
Debt securities, including restricted securities, are valued based on evaluated prices received from third party pricing vendors or from brokers who make markets in such securities. Preferred securities and U.S. government and government agency obligations are valued by pricing vendors who utilize matrix pricing which considers yield or price of bonds of comparable quality, coupon, maturity and type or by broker-supplied prices. When independent prices are unavailable or unreliable, debt securities may be valued utilizing pricing methodologies which consider similar factors that would be used by third party pricing vendors. Debt securities are generally categorized as Level 2 in the hierarchy but may be Level 3 depending on the circumstances.
Futures contracts are valued at the settlement price established each day by the board of trade or exchange on which they are traded and are categorized as Level 1 in the hierarchy. Investments in open-end mutual funds, including the Fidelity Central Funds, are valued at their closing net asset value (NAV) each business day and are categorized as Level 1 in the hierarchy.
Changes in valuation techniques may result in transfers in or out of an assigned level within the disclosure hierarchy. The aggregate value of investments by input level, as of January 31, 2014 is included at the end of the Fund's Schedule of Investments.
Foreign Currency. The Fund may use foreign currency contracts to facilitate transactions in foreign-denominated securities. Gains and losses from these transactions may arise from changes in the value of the foreign currency or if the counterparties do not perform under the contracts' terms.
Foreign-denominated assets, including investment securities, and liabilities are translated into U.S. dollars at the exchange rates at period end. Purchases and sales of investment securities, income and dividends received and expenses denominated in foreign currencies are translated into U.S. dollars at the exchange rate in effect on the transaction date.
The effects of exchange rate fluctuations on investments are included with the net realized and unrealized gain (loss) on investment securities. Other foreign currency transactions resulting in realized and unrealized gain (loss) are disclosed separately.
Investment Transactions and Income. For financial reporting purposes, the Fund's investment holdings and NAV include trades executed through the end of the last business day of the period. The NAV per share for processing shareholder transactions is calculated as of the close of business of the New York Stock Exchange (NYSE), normally
Annual Report
3. Significant Accounting Policies - continued
Investment Transactions and Income - continued
4:00 p.m. Eastern time and includes trades executed through the end of the prior business day. Gains and losses on securities sold are determined on the basis of identified cost and may include proceeds received from litigation. Dividend income is recorded on the ex-dividend date, except for certain dividends from foreign securities where the ex-dividend date may have passed, which are recorded as soon as the Fund is informed of the ex-dividend date. Non-cash dividends included in dividend income, if any, are recorded at the fair market value of the securities received. Distributions received on securities that represent a return of capital or capital gain are recorded as a reduction of cost of investments and/or as a realized gain. Subsequent to ex-dividend date the Fund determines the components of these distributions, based upon receipt of tax filings or other correspondence relating to the underlying investment. Interest income and distributions from the Fidelity Central Funds are accrued as earned. Interest income includes coupon interest and amortization of premium and accretion of discount on debt securities. Investment income is recorded net of foreign taxes withheld where recovery of such taxes is uncertain.
Class Allocations and Expenses. Investment income, realized and unrealized capital gains and losses, common expenses of the Fund, and certain fund-level expense reductions, if any, are allocated daily on a pro-rata basis to each class based on the relative net assets of each class to the total net assets of the Fund. Each class differs with respect to transfer agent and distribution and service plan fees incurred. Certain expense reductions may also differ by class. For the reporting period, the allocated portion of income and expenses to each class as a percent of its average net assets may vary due to the timing of recording these transactions in relation to fluctuating net assets of the classes. Expenses directly attributable to a fund are charged to that fund. Expenses attributable to more than one fund are allocated among the respective funds on the basis of relative net assets or other appropriate methods. Expense estimates are accrued in the period to which they relate and adjustments are made when actual amounts are known.
Income Tax Information and Distributions to Shareholders. Each year, the Fund intends to qualify as a regulated investment company under Subchapter M of the Internal Revenue Code, including distributing substantially all of its taxable income and realized gains. As a result, no provision for U.S. Federal income taxes is required. As of January 31, 2014, the Fund did not have any unrecognized tax benefits in the financial statements; nor is the Fund aware of any tax positions for which it is reasonably possible that the total amounts of unrecognized tax benefits will significantly change in the next twelve months. The Fund files a U.S. federal tax return, in addition to state and local tax returns as required. The Fund's federal income tax returns are subject to examination by the Internal Revenue Service (IRS) for a period of three fiscal years after they are filed.
Annual Report
Notes to Financial Statements - continued
3. Significant Accounting Policies - continued
Income Tax Information and Distributions to Shareholders - continued
State and local tax returns may be subject to examination for an additional fiscal year depending on the jurisdiction. Foreign taxes are provided for based on the Fund's understanding of the tax rules and rates that exist in the foreign markets in which it invests.
Distributions are declared and recorded on the ex-dividend date. Income dividends and capital gain distributions are declared separately for each class. Income and capital gain distributions are determined in accordance with income tax regulations, which may differ from GAAP.
Capital accounts within the financial statements are adjusted for permanent book-tax differences. These adjustments have no impact on net assets or the results of operations. Capital accounts are not adjusted for temporary book-tax differences which will reverse in a subsequent period.
Book-tax differences are primarily due to futures transactions, foreign currency transactions, passive foreign investment companies (PFIC), capital loss carryforwards and losses deferred due to wash sales.
The federal tax cost of investment securities and unrealized appreciation (depreciation) as of period end were as follows:
Gross unrealized appreciation | $ 88,759,455 |
Gross unrealized depreciation | (31,676,236) |
Net unrealized appreciation (depreciation) on securities and other investments | $ 57,083,219 |
|
|
Tax Cost | $ 505,684,050 |
The tax-based components of distributable earnings as of period end were as follows:
Capital loss carryforward | $ (287,150,893) |
Net unrealized appreciation (depreciation) | $ 57,082,305 |
Capital loss carryforwards are only available to offset future capital gains of the Fund to the extent provided by regulations and may be limited. Under the Regulated Investment Company Modernization Act of 2010 (the Act), the Fund is permitted to carry forward capital losses incurred in taxable years beginning after December 22, 2010 for an unlimited period and such capital losses are required to be used prior to any losses that expire.
Annual Report
3. Significant Accounting Policies - continued
Income Tax Information and Distributions to Shareholders - continued
The capital loss carryforward information presented below, including any applicable limitation, is estimated as of fiscal period end and is subject to adjustment.
Fiscal year of expiration |
|
2017 | $ (99,046,054) |
2018 | (188,104,839) |
Total with expiration | $ (287,150,893) |
The tax character of distributions paid was as follows:
| January 31, 2014 | January 31, 2013 |
Ordinary Income | $ 8,810,391 | $ 9,512,706 |
Restricted Securities. The Fund may invest in securities that are subject to legal or contractual restrictions on resale. These securities generally may be resold in transactions exempt from registration or to the public if the securities are registered. Disposal of these securities may involve time-consuming negotiations and expense, and prompt sale at an acceptable price may be difficult. Information regarding restricted securities is included at the end of the Fund's Schedule of Investments.
4. Derivative Instruments.
Risk Exposures and the Use of Derivative Instruments. The Fund's investment objective allows the Fund to enter into various types of derivative contracts, including futures contracts. Derivatives are investments whose value is primarily derived from underlying assets, indices or reference rates and may be transacted on an exchange or over-the-counter (OTC). Derivatives may involve a future commitment to buy or sell a specified asset based on specified terms, to exchange future cash flows at periodic intervals based on a notional principal amount, or for one party to make one or more payments upon the occurrence of specified events in exchange for periodic payments from the other party.
The Fund used derivatives to increase returns and to manage exposure to certain risks as defined below. The success of any strategy involving derivatives depends on analysis of numerous economic factors, and if the strategies for investment do not work as intended, the Fund may not achieve its objectives.
Annual Report
Notes to Financial Statements - continued
4. Derivative Instruments - continued
Risk Exposures and the Use of Derivative Instruments - continued
The Fund's use of derivatives increased or decreased its exposure to the following risk:
Equity Risk | Equity risk relates to the fluctuations in the value of financial instruments as a result of changes in market prices (other than those arising from interest rate risk or foreign exchange risk), whether caused by factors specific to an individual investment, its issuer, or all factors affecting all instruments traded in a market or market segment. |
The Fund is also exposed to additional risks from investing in derivatives, such as liquidity risk and counterparty credit risk. Liquidity risk is the risk that the Fund will be unable to close out the derivative in the open market in a timely manner. Counterparty credit risk is the risk that the counterparty will not be able to fulfill its obligation to the Fund. Counterparty credit risk related to exchange-traded futures contracts may be mitigated by the protection provided by the exchange on which they trade.
Investing in derivatives may involve greater risks than investing in the underlying assets directly and, to varying degrees, may involve risk of loss in excess of any initial investment and collateral received and amounts recognized in the Statement of Assets and Liabilities. In addition, there may be the risk that the change in value of the derivative contract does not correspond to the change in value of the underlying instrument.
Futures Contracts. A futures contract is an agreement between two parties to buy or sell a specified underlying instrument for a fixed price at a specified future date. The Fund used futures contracts to manage its exposure to the stock market.
Upon entering into a futures contract, a fund is required to deposit either cash or securities (initial margin) with a clearing broker in an amount equal to a certain percentage of the face value of the contract. Futures contracts are marked-to-market daily and subsequent daily payments (variation margin) are made or received by a fund depending on the daily fluctuations in the value of the futures contracts and are recorded as unrealized appreciation or (depreciation). This receivable and/or payable, if any, is included in daily variation margin for derivative instruments in the Statement of Assets and Liabilities. Realized gain or (loss) is recorded upon the expiration or closing of a futures contract.
Any open futures contracts at period end are presented in the Schedule of Investments under the caption "Futures Contracts." The underlying face amount at value reflects each contract's exposure to the underlying instrument or index at period end and is representative of volume of activity during the period. Securities deposited to meet initial margin requirements are identified in the Schedule of Investments.
Annual Report
4. Derivative Instruments - continued
Futures Contracts - continued
During the period the Fund recognized net realized gain (loss) of $1,432,461 and a change in net unrealized appreciation (depreciation) of ($477,467) related to its investment in futures contracts. These amounts are included in the Statement of Operations.
5. Purchases and Sales of Investments.
Purchases and sales of securities, other than short-term securities, aggregated $331,992,356 and $368,182,272, respectively.
6. Fees and Other Transactions with Affiliates.
Management Fee. Fidelity Management & Research Company (the investment adviser) and its affiliates provide the Fund with investment management related services for which the Fund pays a monthly management fee. The management fee is the sum of an individual fund fee rate that is based on an annual rate of .30% of the Fund's average net assets and an annualized group fee rate that averaged .25% during the period. The group fee rate is based upon the average net assets of all the mutual funds advised by the investment adviser, including any mutual funds previously advised by the investment adviser that are currently advised by Fidelity SelectCo, LLC, an affiliate of the investment adviser. The group fee rate decreases as assets under management increase and increases as assets under management decrease. In addition, the management fee is subject to a performance adjustment (up to a maximum of ± .20% of the Fund's average net assets over a 36 month performance period). The upward or downward adjustment to the management fee is based on the relative investment performance of Stock Selector Large Cap Value as compared to its benchmark index, the Russell 1000® Value Index, over the same 36 month performance period. For the reporting period, the total annual management fee rate, including the performance adjustment, was .43% of the Fund's average net assets. The performance adjustment included in the management fee rate may be higher or lower than the maximum performance adjustment rate due to the difference between the average net assets for the reporting and performance periods.
Distribution and Service Plan Fees. In accordance with Rule 12b-1 of the 1940 Act, the Fund has adopted separate Distribution and Service Plans for each class of shares. Certain classes pay Fidelity Distributors Corporation (FDC), an affiliate of the investment adviser, separate Distribution and Service Fees, each of which is based on an annual percentage of each class' average net assets. In addition, FDC may pay financial intermediaries for selling shares of the Fund and providing shareholder support services.
Annual Report
Notes to Financial Statements - continued
6. Fees and Other Transactions with Affiliates - continued
Distribution and Service Plan Fees - continued
For the period, the Distribution and Service Fee rates, total fees and amounts retained by FDC were as follows:
| Distribution | Service | Total Fees | Retained |
Class A | -% | .25% | $ 52,892 | $ 3,031 |
Class T | .25% | .25% | 38,660 | 912 |
Class B | .75% | .25% | 16,720 | 12,663 |
Class C | .75% | .25% | 68,955 | 14,236 |
|
|
| $ 177,227 | $ 30,842 |
Sales Load. FDC may receive a front-end sales charge of up to 5.75% for selling Class A shares and 3.50% for selling Class T shares, some of which is paid to financial intermediaries for selling shares of the Fund. Depending on the holding period, FDC may receive contingent deferred sales charges levied on Class A, Class T, Class B, and Class C redemptions. The deferred sales charges range from 5.00% to 1.00% for Class B shares, 1.00% for Class C shares, 1.00% for certain purchases of Class A shares and .25% for certain purchases of Class T shares.
For the period, sales charge amounts retained by FDC were as follows:
| Retained |
Class A | $ 9,148 |
Class T | 2,674 |
Class B* | 2,798 |
Class C* | 2,278 |
| $ 16,898 |
* When Class B and Class C shares are initially sold, FDC pays commissions from its own resources to financial intermediaries through which the sales are made.
Transfer Agent Fees. Fidelity Investments Institutional Operations Company, Inc., (FIIOC), an affiliate of the investment adviser, is the transfer, dividend disbursing and shareholder servicing agent for each class of the Fund. FIIOC receives account fees and asset-based fees that vary according to the account size and type of account of the shareholders of the respective classes of the Fund. FIIOC pays for typesetting, printing and mailing of shareholder reports, except proxy statements.
Annual Report
6. Fees and Other Transactions with Affiliates - continued
Transfer Agent Fees - continued
For the period, transfer agent fees for each class were as follows:
| Amount | % of |
Class A | $ 52,844 | .25 |
Class T | 24,258 | .31 |
Class B | 5,042 | .30 |
Class C | 20,908 | .30 |
Stock Selector Large Cap Value | 1,065,839 | .21 |
Institutional Class | 7,046 | .23 |
| $ 1,175,937 |
|
Accounting and Security Lending Fees. Fidelity Service Company, Inc. (FSC), an affiliate of the investment adviser, maintains the Fund's accounting records. The accounting fee is based on the level of average net assets for each month. Under a separate contract, FSC administers the security lending program. The security lending fee is based on the number and duration of lending transactions.
Brokerage Commissions. The Fund placed a portion of its portfolio transactions with brokerage firms which are affiliates of the investment adviser. Brokerage commissions are included in net realized gain (loss) and change in net unrealized appreciation (depreciation) in the Statement of Operations. The commissions paid to these affiliated firms were $10,422 for the period.
7. Committed Line of Credit.
The Fund participates with other funds managed by the investment adviser or an affiliate in a $4.25 billion credit facility (the "line of credit") to be utilized for temporary or emergency purposes to fund shareholder redemptions or for other short-term liquidity purposes. The Fund has agreed to pay commitment fees on its pro-rata portion of the line of credit, which amounted to $821 and is reflected in Miscellaneous expenses on the Statement of Operations. During the period, there were no borrowings on this line of credit.
8. Security Lending.
The Fund lends portfolio securities through a lending agent from time to time in order to earn additional income. For equity securities, a lending agent is used and may loan securities to certain qualified borrowers, including Fidelity Capital Markets (FCM), a
Annual Report
Notes to Financial Statements - continued
8. Security Lending - continued
broker-dealer affiliated with the Fund. On the settlement date of the loan, the Fund receives collateral (in the form of U.S. Treasury obligations, letters of credit and/or cash) against the loaned securities and maintains collateral in an amount not less than 100% of the market value of the loaned securities during the period of the loan. The market value of the loaned securities is determined at the close of business of the Fund and any additional required collateral is delivered to the Fund on the next business day. If the borrower defaults on its obligation to return the securities loaned because of insolvency or other reasons, the Fund may apply collateral received from the borrower against the obligation. The Fund may experience delays and costs in recovering the securities loaned. Any cash collateral received is invested the Fidelity Securities Lending Cash Central Fund. The value of loaned securities and cash collateral at period end are disclosed on the Fund's Statement of Assets and Liabilities. The value of securities loaned to FCM at period end was $320,276. Security lending income represents the income earned on investing cash collateral, less rebates paid to borrowers and any lending agent fees associated with the loan, plus any premium payments received for lending certain types of securities. Security lending income is presented in the Statement of Operations as a component of income from Fidelity Central Funds. Total security lending income during the period amounted to $47,322, including $2,017 from securities loaned to FCM.
9. Expense Reductions.
Commissions paid to certain brokers with whom the investment adviser, or its affiliates, places trades on behalf of the Fund include an amount in addition to trade execution, which may be rebated back to the Fund to offset certain expenses. This amount totaled $13,415 for the period.
In addition, the investment adviser reimbursed a portion of the Fund's operating expenses during the period in the amount of $8,776.
10. Distributions to Shareholders.
Distributions to shareholders of each class were as follows:
Years ended January 31, | 2014 | 2013 |
From net investment income |
|
|
Class A | $ 211,924 | $ 304,000 |
Class T | 63,275 | 93,858 |
Class B | 3,263 | 16,188 |
Class C | 27,297 | 63,927 |
Stock Selector Large Cap Value | 6,677,131 | 8,993,963 |
Institutional Class | 45,623 | 40,770 |
Total | $ 7,028,513 | $ 9,512,706 |
Annual Report
10. Distributions to Shareholders - continued
Years ended January 31, | 2014 | 2013 |
From net realized gain |
|
|
Class A | $ 67,665 | $ - |
Class T | 26,666 | - |
Class B | 5,288 | - |
Class C | 24,673 | - |
Stock Selector Large Cap Value | 1,646,206 | - |
Institutional Class | 11,380 | - |
Total | $ 1,781,878 | $ - |
11. Share Transactions.
Transactions for each class of shares were as follows:
| Shares | Dollars | ||
Years ended January 31, | 2014 | 2013 | 2014 | 2013 |
Class A |
|
|
|
|
Shares sold | 453,976 | 251,269 | $ 6,296,444 | $ 2,848,724 |
Reinvestment of distributions | 17,878 | 24,461 | 258,884 | 281,542 |
Shares redeemed | (493,396) | (573,384) | (7,077,208) | (6,434,025) |
Net increase (decrease) | (21,542) | (297,654) | $ (521,880) | $ (3,303,759) |
Class T |
|
|
|
|
Shares sold | 162,162 | 131,721 | $ 2,245,109 | $ 1,501,274 |
Reinvestment of distributions | 6,114 | 8,058 | 88,742 | 92,826 |
Shares redeemed | (134,046) | (136,167) | (1,877,963) | (1,544,492) |
Net increase (decrease) | 34,230 | 3,612 | $ 455,888 | $ 49,608 |
Class B |
|
|
|
|
Shares sold | 3,348 | 1,157 | $ 45,970 | $ 13,142 |
Reinvestment of distributions | 509 | 1,236 | 7,427 | 14,255 |
Shares redeemed | (25,299) | (39,897) | (347,355) | (452,422) |
Net increase (decrease) | (21,442) | (37,504) | $ (293,958) | $ (425,025) |
Class C |
|
|
|
|
Shares sold | 146,694 | 162,948 | $ 2,029,290 | $ 1,812,867 |
Reinvestment of distributions | 3,139 | 4,869 | 45,227 | 55,503 |
Shares redeemed | (88,666) | (162,163) | (1,208,921) | (1,799,733) |
Net increase (decrease) | 61,167 | 5,654 | $ 865,596 | $ 68,637 |
Annual Report
Notes to Financial Statements - continued
11. Share Transactions - continued
| Shares | Dollars | ||
Years ended January 31, | 2014 | 2013 | 2014 | 2013 |
Stock Selector Large Cap Value |
|
|
|
|
Shares sold | 7,167,684 | 3,974,459 | $ 100,838,739 | $ 45,488,310 |
Reinvestment of distributions | 556,371 | 757,439 | 8,100,157 | 8,771,144 |
Shares redeemed | (9,956,522) | (12,329,354) | (139,235,813) | (140,694,347) |
Net increase (decrease) | (2,232,467) | (7,597,456) | $ (30,296,917) | $ (86,434,893) |
Institutional Class |
|
|
|
|
Shares sold | 206,722 | 54,716 | $ 2,877,195 | $ 619,947 |
Reinvestment of distributions | 3,795 | 3,536 | 55,110 | 40,770 |
Shares redeemed | (107,442) | (39,612) | (1,516,961) | (460,078) |
Net increase (decrease) | 103,075 | 18,640 | $ 1,415,344 | $ 200,639 |
12. Other.
The Fund's organizational documents provide former and current trustees and officers with a limited indemnification against liabilities arising in connection with the performance of their duties to the Fund. In the normal course of business, the Fund may also enter into contracts that provide general indemnifications. The Fund's maximum exposure under these arrangements is unknown as this would be dependent on future claims that may be made against the Fund. The risk of material loss from such claims is considered remote.
Annual Report
Report of Independent Registered Public Accounting Firm
To the Trustees of Fidelity Devonshire Trust and the Shareholders of Fidelity Stock Selector Large Cap Value Fund:
In our opinion, the accompanying statement of assets and liabilities, including the schedule of investments, and the related statements of operations and of changes in net assets and the financial highlights present fairly, in all material respects, the financial position of Fidelity Stock Selector Large Cap Value Fund (a fund of Fidelity Devonshire Trust) at January 31, 2014, the results of its operations for the year then ended, the changes in its net assets for each of the two years in the period then ended and the financial highlights for each of the five years in the period then ended, in conformity with accounting principles generally accepted in the United States of America. These financial statements and financial highlights (hereafter referred to as "financial statements") are the responsibility of the Fidelity Stock Selector Large Cap Value Fund's management. Our responsibility is to express an opinion on these financial statements based on our audits. We conducted our audits of these financial statements in accordance with the standards of the Public Company Accounting Oversight Board (United States). Those standards require that we plan and perform the audit to obtain reasonable assurance about whether the financial statements are free of material misstatement. An audit includes examining, on a test basis, evidence supporting the amounts and disclosures in the financial statements, assessing the accounting principles used and significant estimates made by management, and evaluating the overall financial statement presentation. We believe that our audits, which included confirmation of securities at January 31, 2014 by correspondence with the custodian and brokers, provide a reasonable basis for our opinion.
PricewaterhouseCoopers LLP
Boston, Massachusetts
March 14, 2014
Annual Report
Trustees and Officers
The Trustees, Members of the Advisory Board, and officers of the trust and fund, as applicable, are listed below. The Board of Trustees governs the fund and is responsible for protecting the interests of shareholders. The Trustees are experienced executives who meet periodically throughout the year to oversee the fund's activities, review contractual arrangements with companies that provide services to the fund, oversee management of the risks associated with such activities and contractual arrangements, and review the fund's performance. Except for James C. Curvey, Ned C. Lautenbach, and William S. Stavropoulos, each of the Trustees oversees 173 funds. Mr. Curvey oversees 396 funds. Mr. Lautenbach and Mr. Stavropoulos each oversees 247 funds.
The Trustees hold office without limit in time except that (a) any Trustee may resign; (b) any Trustee may be removed by written instrument, signed by at least two-thirds of the number of Trustees prior to such removal; (c) any Trustee who requests to be retired or who has become incapacitated by illness or injury may be retired by written instrument signed by a majority of the other Trustees; and (d) any Trustee may be removed at any special meeting of shareholders by a two-thirds vote of the outstanding voting securities of the trust. Each Trustee who is not an interested person (as defined in the 1940 Act) of the trust and the fund (Independent Trustee), shall retire not later than the last day of the calendar year in which his or her 75th birthday occurs. The Independent Trustees may waive this mandatory retirement age policy with respect to individual Trustees. The officers and Advisory Board Member hold office without limit in time, except that any officer and Advisory Board Member may resign or may be removed by a vote of a majority of the Trustees at any regular meeting or any special meeting of the Trustees. Except as indicated, each individual has held the office shown or other offices in the same company for the past five years.
Experience, Skills, Attributes, and Qualifications of the Fund's Trustees. The Governance and Nominating Committee has adopted a statement of policy that describes the experience, qualifications, attributes, and skills that are necessary and desirable for potential Independent Trustee candidates (Statement of Policy). The Board believes that each Trustee satisfied at the time he or she was initially elected or appointed a Trustee, and continues to satisfy, the standards contemplated by the Statement of Policy. The Governance and Nominating Committee also engages professional search firms to help identify potential Independent Trustee candidates who have the experience, qualifications, attributes, and skills consistent with the Statement of Policy. From time to time, additional criteria based on the composition and skills of the current Independent Trustees, as well as experience or skills that may be appropriate in light of future changes to board composition, business conditions, and regulatory or other developments, have also been considered by the professional search firms and the Governance and Nominating Committee. In addition, the Board takes into account the Trustees' commitment and participation in Board and committee meetings, as well as their leadership of standing and ad hoc committees throughout their tenure.
Annual Report
Trustees and Officers - continued
In determining that a particular Trustee was and continues to be qualified to serve as a Trustee, the Board has considered a variety of criteria, none of which, in isolation, was controlling. The Board believes that, collectively, the Trustees have balanced and diverse experience, qualifications, attributes, and skills, which allow the Board to operate effectively in governing the fund and protecting the interests of shareholders. Information about the specific experience, skills, attributes, and qualifications of each Trustee, which in each case led to the Board's conclusion that the Trustee should serve (or continue to serve) as a trustee of the fund, is provided below.
Board Structure and Oversight Function. James C. Curvey is an interested person (as defined in the 1940 Act) and currently serves as Chairman. The Trustees have determined that an interested Chairman is appropriate and benefits shareholders because an interested Chairman has a personal and professional stake in the quality and continuity of services provided to the fund. Independent Trustees exercise their informed business judgment to appoint an individual of their choosing to serve as Chairman, regardless of whether the Trustee happens to be independent or a member of management. The Independent Trustees have determined that they can act independently and effectively without having an Independent Trustee serve as Chairman and that a key structural component for assuring that they are in a position to do so is for the Independent Trustees to constitute a substantial majority for the Board. The Independent Trustees also regularly meet in executive session. Ned C. Lautenbach serves as Chairman of the Independent Trustees and as such (i) acts as a liaison between the Independent Trustees and management with respect to matters important to the Independent Trustees and (ii) with management prepares agendas for Board meetings.
Fidelity funds are overseen by different Boards of Trustees. The fund's Board oversees Fidelity's equity and high income funds and another Board oversees Fidelity's investment-grade bond, money market, and asset allocation funds. The asset allocation funds may invest in Fidelity funds overseen by the fund's Board. The use of separate Boards, each with its own committee structure, allows the Trustees of each group of Fidelity funds to focus on the unique issues of the funds they oversee, including common research, investment, and operational issues. On occasion, the separate Boards establish joint committees to address issues of overlapping consequences for the Fidelity funds overseen by each Board.
The Trustees operate using a system of committees to facilitate the timely and efficient consideration of all matters of importance to the Trustees, the fund, and fund shareholders and to facilitate compliance with legal and regulatory requirements and oversight of the fund's activities and associated risks. The Board, acting through its committees, has charged FMR and its affiliates with (i) identifying events or circumstances the occurrence of which could have demonstrably adverse effects on the fund's business and/or reputation; (ii) implementing processes and controls to lessen the possibility that such events or circumstances occur or to mitigate the effects of such events or circumstances if they do occur; and (iii) creating and maintaining a system designed to evaluate continuously business and market conditions in order to facilitate the identification and implementation processes described in (i) and (ii) above. Because the day-to-day operations and activities of the fund are carried out by or through FMR, its affiliates and other service providers, the fund's exposure to risks is mitigated but not eliminated by the processes overseen by the Trustees. While each of the Board's committees has responsibility for overseeing different aspects of the fund's activities, oversight is exercised primarily through the Operations, Audit, and Compliance Committees. In addition, the Independent Trustees have worked with FMR to enhance the Board's oversight of investment and financial risks, legal and regulatory risks, technology risks, and operational risks, including the development of additional risk reporting to the Board. For example, a working group comprised of Independent Trustees and FMR has worked and continues to work to review the Fidelity funds' valuation-related activities, reporting and risk management. Appropriate personnel, including but not limited to the fund's Chief Compliance Officer (CCO), FMR's internal auditor, the independent accountants, the fund's Treasurer and portfolio management personnel, make periodic reports to the Board's committees, as appropriate, including an annual review of FMR's risk management program for the Fidelity funds. The responsibilities of each standing committee, including their oversight responsibilities, are described further under "Standing Committees of the Fund's Trustees."
Annual Report
The fund's Statement of Additional Information (SAI) includes more information about the Trustees. To request a free copy call 1-877-208-0098.
Interested Trustees*:
Correspondence intended for each Trustee who is an interested person may be sent to Fidelity Investments, 245 Summer Street, Boston, Massachusetts 02210.
Name, Year of Birth; Principal Occupations and Other Relevant Experience+ | |
James C. Curvey (1935) | |
Year of Election or Appointment: 2007 Trustee Chairman of the Board of Trustees | |
| Mr. Curvey also serves as Trustee of other Fidelity funds. Mr. Curvey is a Director of Fidelity Investments Money Management, Inc. (2009-present), Director of Fidelity Research & Analysis Co. (2009-present) and Director of FMR and FMR Co., Inc. (2007-present). Mr. Curvey is also Vice Chairman (2007-present) and Director of FMR LLC. In addition, Mr. Curvey serves as an Overseer for the Boston Symphony Orchestra and a member of the Trustees of Villanova University. Previously, Mr. Curvey was the Vice Chairman (2006-2007) and Director (2000-2007) of FMR Corp. |
Charles S. Morrison (1960) | |
Year of Election or Appointment: 2014 Trustee | |
| Mr. Morrison also serves as Trustee or Vice President of other funds. He serves as President, Asset Management (2014-present) and is an employee of Fidelity Investments. Previously, Mr. Morrison served as President, Fixed Income (2011-2014), Vice President of Fidelity's Money Market Funds (2005-2009), President, Money Market Group Leader of FMR (2009), and Senior Vice President, Money Market Group of FMR (2004-2009). Mr. Morrison also served as Vice President of Fidelity's Bond Funds (2002-2005), certain Balanced Funds (2002-2005), and certain Asset Allocation Funds (2002-2007), and as Senior Vice President (2002-2005) of Fidelity's Bond Division. |
* Trustees have been determined to be "Interested Trustee" by virtue of, among other things, their affiliation with the trust or various entities under common control with FMR.
+ The information above includes each Trustee's principal occupation during the last five years and other information relating to the experience, attributes, and skills relevant to each Trustee's qualifications to serve as a Trustee, which led to the conclusion that each Trustee should serve as a Trustee for the fund.
Annual Report
Independent Trustees:
Correspondence intended for each Independent Trustee (that is, the Trustees other than the Interested Trustees) may be sent to Fidelity Investments, P.O. Box 55235, Boston, Massachusetts 02205-5235.
Name, Year of Birth; Principal Occupations and Other Relevant Experience+ | |
Dennis J. Dirks (1948) | |
Year of Election or Appointment: 2005 Trustee | |
| Mr. Dirks also serves as Trustee of other Fidelity funds. Prior to his retirement in May 2003, Mr. Dirks was Chief Operating Officer and a member of the Board of The Depository Trust & Clearing Corporation (DTCC). He also served as President, Chief Operating Officer, and Board member of The Depository Trust Company (DTC) and President and Board member of the National Securities Clearing Corporation (NSCC). In addition, Mr. Dirks served as Chief Executive Officer and Board member of the Government Securities Clearing Corporation, Chief Executive Officer and Board member of the Mortgage-Backed Securities Clearing Corporation, as a Trustee and a member of the Finance Committee of Manhattan College (2005-2008), and as a Trustee and a member of the Finance Committee of AHRC of Nassau County (2006-2008). Mr. Dirks is a member of the Independent Directors Council (IDC) Governing Council (2010-present) and Board of Directors for The Brookville Center for Children's Services, Inc. (2009-present). |
Alan J. Lacy (1953) | |
Year of Election or Appointment: 2008 Trustee | |
| Mr. Lacy also serves as Trustee of other Fidelity funds. Mr. Lacy serves as Senior Adviser (2007-present) of Oak Hill Capital Partners, L.P. (private equity). Mr. Lacy also served as Chief Executive Officer (2000-2005) and Vice Chairman (2005-2006) of Sears Holdings Corporation and Sears, Roebuck and Co. (retail). In addition, Mr. Lacy serves as a member of the Board of Directors of Dave & Buster's Entertainment, Inc. (restaurant and entertainment complexes, 2010-present), Earth Fare, Inc. (retail grocery, 2012-present), The Hillman Companies, Inc. (hardware wholesalers, 2010-present), and Bristol-Myers Squibb Company (global pharmaceuticals, 2008-present). Mr. Lacy is a member of the Board of Trustees of The National Parks Conservation Association (2006-present). Previously, Mr. Lacy served as Chairman of the Board of Trustees of the National Parks Conservation Association (2008-2011) and as a member of the Board of Directors for the Western Union Company (global money transfer, 2006-2011). |
Ned C. Lautenbach (1944) | |
Year of Election or Appointment: 2000 Trustee Chairman of the Independent Trustees | |
| Mr. Lautenbach also serves as Trustee of other Fidelity funds. Mr. Lautenbach currently serves as the Lead Director of the Eaton Corporation Board of Directors (diversified industrial, 1997-present). Mr. Lautenbach is Chairman of the Board of Directors of the Philharmonic Center for the Arts in Naples, Florida (2012-present) and a member of the Council on Foreign Relations (1994-present). Previously, Mr. Lautenbach was a Partner/Advisory Partner at Clayton, Dubilier & Rice, LLC (private equity investment, 1998-2010), as well as a Director of Sony Corporation (2006-2007). |
Joseph Mauriello (1944) | |
Year of Election or Appointment: 2008 Trustee | |
| Mr. Mauriello also serves as Trustee of other Fidelity funds. Prior to his retirement in January 2006, Mr. Mauriello served in numerous senior management positions including Deputy Chairman and Chief Operating Officer (2004-2005), and Vice Chairman of Financial Services (2002-2004) of KPMG LLP US (professional services, 1965-2005). Mr. Mauriello currently serves as a member of the Board of Directors of XL Group plc. (global insurance and re-insurance, 2006-present). Previously, Mr. Mauriello served as a Director of the Hamilton Funds of the Bank of New York (2006-2007) and of Arcadia Resources Inc. (health care services and products, 2007-2012). |
Robert W. Selander (1950) | |
Year of Election or Appointment: 2011 Trustee | |
| Mr. Selander also serves as Trustee of other Fidelity funds. Previously, Mr. Selander served as a Member of the Advisory Board of other Fidelity funds (2011), and Executive Vice Chairman (2010), Chief Executive Officer (2009-2010), and President and Chief Executive Officer (1997-2009) of Mastercard, Inc. |
Cornelia M. Small (1944) | |
Year of Election or Appointment: 2005 Trustee | |
| Ms. Small also serves as Trustee of other Fidelity funds. Ms. Small is a member of the Board of Directors (2009-present) and Chair of the Investment Committee (2010-present) of the Teagle Foundation. Ms. Small also serves on the Investment Committee of the Berkshire Taconic Community Foundation (2008-present). Previously, Ms. Small served as Chairperson (2002-2008) and a member of the Investment Committee and Chairperson (2008-2012) and a member of the Board of Trustees of Smith College. In addition, Ms. Small served as Chief Investment Officer, Director of Global Equity Investments, and a member of the Board of Directors of Scudder, Stevens & Clark and Scudder Kemper Investments. |
William S. Stavropoulos (1939) | |
Year of Election or Appointment: 2002 Trustee Vice Chairman of the Independent Trustees | |
| Mr. Stavropoulos also serves as Trustee of other Fidelity funds. Mr. Stavropoulos serves as President and Founder of the Michigan Baseball Foundation, the Great Lakes Loons (2007-present). Mr. Stavropoulos is Chairman Emeritus of the Board of Directors of The Dow Chemical Company, where he previously served in numerous senior management positions, including President, CEO (1995-2000; 2002-2004), Chairman of the Executive Committee (2000-2006), and as a member of the Board of Directors (1990-2006). Currently, Mr. Stavropoulos is Chairman of the Board of Directors of Univar Inc. (global distributor of commodity and specialty chemicals), a Director of Teradata Corporation (data warehousing and technology solutions), and Maersk Inc. (industrial conglomerate), and a member of the Advisory Board for Metalmark Capital LLC (private equity investment, 2005-present). Mr. Stavropoulos is an operating advisor to Clayton, Dubilier & Rice, LLC (private equity investment). In addition, Mr. Stavropoulos is a member of the University of Notre Dame Advisory Council for the College of Science, a Trustee of the Rollin L. Gerstacker Foundation, and a Director of the Naples Philharmonic Center for the Arts. Previously, Mr. Stavropoulos served as a Director of Chemical Financial Corporation (bank holding company, 1993-2012) and Tyco International, Ltd. (multinational manufacturing and services, 2007-2012). |
David M. Thomas (1949) | |
Year of Election or Appointment: 2008 Trustee | |
| Mr. Thomas also serves as Trustee of other Fidelity funds. Mr. Thomas serves as Non-Executive Chairman of the Board of Directors of Fortune Brands Home and Security (home and security products, 2011-present), and as a member of the Board of Directors of Interpublic Group of Companies, Inc. (marketing communication, 2004-present). Previously, Mr. Thomas served as Executive Chairman (2005-2006) and Chairman and Chief Executive Officer (2000-2005) of IMS Health, Inc. (pharmaceutical and healthcare information solutions), and a Director of Fortune Brands, Inc. (consumer products, 2000-2011). |
+ The information above includes each Trustee's principal occupation during the last five years and other information relating to the experience, attributes, and skills relevant to each Trustee's qualifications to serve as a Trustee, which led to the conclusion that each Trustee should serve as a Trustee for the fund.
Advisory Board Member and Officers:
Correspondence intended for each officer and Peter S. Lynch may be sent to Fidelity Investments, 245 Summer Street, Boston, Massachusetts 02210. Officers appear below in alphabetical order.
Name, Year of Birth; Principal Occupation | |
Peter S. Lynch (1944) | |
Year of Election or Appointment: 2003 Member of the Advisory Board | |
| Mr. Lynch also serves as Member of the Advisory Board of other Fidelity funds. Mr. Lynch is Vice Chairman and a Director of FMR and FMR Co., Inc. In addition, Mr. Lynch serves as a Trustee of Boston College and as the Chairman of the Inner-City Scholarship Fund. Previously, Mr. Lynch served on the Special Olympics International Board of Directors (1997-2006). |
Elizabeth Paige Baumann (1968) | |
Year of Election or Appointment: 2012 Anti-Money Laundering (AML) Officer | |
| Ms. Baumann also serves as AML Officer of other funds. She is Chief AML Officer of FMR LLC (2012-present) and is an employee of Fidelity Investments. Previously, Ms. Baumann served as Vice President and Deputy Anti-Money Laundering Officer (2007-2012). |
William C. Coffey (1969) | |
Year of Election or Appointment: 2009 Assistant Secretary | |
| Mr. Coffey also serves as Assistant Secretary of other funds. He is Senior Vice President and Deputy General Counsel of FMR LLC (2010-present), and is an employee of Fidelity Investments. Previously, Mr. Coffey served as Vice President and Associate General Counsel of FMR LLC (2005-2009). |
Jonathan Davis (1968) | |
Year of Election or Appointment: 2010 Assistant Treasurer | |
| Mr. Davis also serves as Assistant Treasurer of other funds. Mr. Davis is an employee of Fidelity Investments. Previously, Mr. Davis served as Vice President and Associate General Counsel of FMR LLC (2003-2010). |
Adrien E. Deberghes (1967) | |
Year of Election or Appointment: 2008 Deputy Treasurer | |
| Mr. Deberghes also serves as an officer of other funds. He is an employee of Fidelity Investments (2008-present). Prior to joining Fidelity Investments, Mr. Deberghes was Senior Vice President of Mutual Fund Administration at State Street Corporation (2007-2008), Senior Director of Mutual Fund Administration at Investors Bank & Trust (2005-2007), and Director of Finance for Dunkin' Brands (2000-2005). |
Stephanie J. Dorsey (1969) | |
Year of Election or Appointment: 2010 Assistant Treasurer | |
| Ms. Dorsey also serves as an officer of other funds. She is an employee of Fidelity Investments (2008-present) and has served in other fund officer roles. Prior to joining Fidelity Investments, Ms. Dorsey served as Treasurer (2004-2008) of the JPMorgan Mutual Funds and Vice President (2004-2008) of JPMorgan Chase Bank. |
Scott C. Goebel (1968) | |
Year of Election or Appointment: 2008 Secretary and Chief Legal Officer (CLO) | |
| Mr. Goebel serves as Secretary and CLO of other funds. Mr. Goebel also serves as Secretary of Fidelity SelectCo, LLC (2013-present), Fidelity Investments Money Management, Inc. (FIMM) (2010-present) and Fidelity Research and Analysis Company (FRAC) (2010-present); General Counsel, Secretary, and Senior Vice President of FMR (2008-present) and FMR Co., Inc. (2008-present); Chief Legal Officer of Fidelity Management & Research (Hong Kong) Limited (2008-present); and Assistant Secretary of Fidelity Management & Research (Japan) Inc. (2008-present) and Fidelity Management & Research (U.K.) Inc. (2008-present). Previously, Mr. Goebel served as Secretary and CLO of other Fidelity funds (2008-2013), Assistant Secretary of FIMM (2008-2010), FRAC (2008-2010), and certain funds (2007-2008); and as Vice President and Secretary of Fidelity Distributors Corporation (FDC) (2005-2007). Mr. Goebel has been employed by FMR LLC or an affiliate since 2001. |
Joseph A. Hanlon (1968) | |
Year of Election or Appointment: 2012 Chief Compliance Officer | |
| Mr. Hanlon also serves as Chief Compliance Officer of other funds. Mr. Hanlon serves as Compliance Officer of FMR, FMR Co., Inc., Fidelity Investments Money Management, Inc. (FIMM), Fidelity Research and Analysis Company (FRAC), and Fidelity Management & Research (Hong Kong) (2009-present), as Senior Vice President of the Fidelity Asset Management Division (2009-present), and is an employee of Fidelity Investments. Previously, Mr. Hanlon served as Compliance Officer of Fidelity Management & Research (Japan) Inc. (2009-2013), Strategic Advisers, Inc. (2009-2013), and Fidelity Management & Research (U.K.) Inc. (2009-2013). |
Thomas C. Hense (1964) | |
Year of Election or Appointment: 2008/2010 Vice President | |
| Mr. Hense also serves as Vice President of other funds (High Income (2008), Small Cap (2008), and Value (2010) funds). Previously, Mr. Hense served as a portfolio manager for Fidelity's Institutional Money Management Group (Pyramis) (2003-2008). |
Brian B. Hogan (1964) | |
Year of Election or Appointment: 2009 Vice President | |
| Mr. Hogan also serves as Trustee or Vice President of other funds. Mr. Hogan serves as President of FMR's Equity Division (2009-present). Previously, Mr. Hogan served as Senior Vice President, Equity Research of FMR (2006-2009) and as a portfolio manager. |
Chris Maher (1972) | |
Year of Election or Appointment: 2013 Assistant Treasurer | |
| Mr. Maher serves as Assistant Treasurer of other funds. Mr. Maher is Vice President of Valuation Oversight and is an employee of Fidelity Investments. Previously, Mr. Maher served as Vice President of Asset Management Compliance (2013), Vice President of FMR's Program Management Group (2010-2013), and Vice President of Valuation Oversight (2008-2010). |
Christine Reynolds (1958) | |
Year of Election or Appointment: 2008 Chief Financial Officer | |
| Ms. Reynolds also serves as Chief Financial Officer of other funds. Ms. Reynolds became President of Fidelity Pricing and Cash Management Services (FPCMS) in August 2008. Ms. Reynolds served as Chief Operating Officer of FPCMS (2007-2008). Previously, Ms. Reynolds served as President, Treasurer, and Anti-Money Laundering officer of the Fidelity funds (2004-2007). |
Kenneth B. Robins (1969) | |
Year of Election or Appointment: 2008 President and Treasurer | |
| Mr. Robins also serves as an officer of other funds. Mr. Robins serves as Executive Vice President of Fidelity Investments Money Management, Inc. (FIMM) (2013-present) and is an employee of Fidelity Investments (2004-present). Previously, Mr. Robins served in other fund officer roles. |
Gary W. Ryan (1958) | |
Year of Election or Appointment: 2005 Assistant Treasurer | |
| Mr. Ryan also serves as Assistant Treasurer of other funds. Mr. Ryan is an employee of Fidelity Investments and has served in other fund officer roles. Previously, Mr. Ryan served as Vice President of Fund Reporting in Fidelity Pricing and Cash Management Services (FPCMS) (1999-2005). |
Stephen Sadoski (1971) | |
Year of Election or Appointment: 2012 Deputy Treasurer | |
| Mr. Sadoski also serves as Deputy Treasurer of other funds. He is an employee of Fidelity Investments (2012-present) and has served in another fund officer role. Prior to joining Fidelity Investments, Mr. Sadoski served as an assistant chief accountant in the Division of Investment Management of the Securities and Exchange Commission (SEC) (2009-2012) and as a senior manager at Deloitte & Touche LLP (1997-2009). |
Stacie M. Smith (1974) | |
Year of Election or Appointment: 2013 Deputy Treasurer | |
| Ms. Smith also serves as an officer of other funds. She is an employee of Fidelity Investments (2009-present) and has served in other fund officer roles. Prior to joining Fidelity Investments, Ms. Smith served as Senior Audit Manager of Ernst & Young LLP (1996-2009). |
Renee Stagnone (1975) | |
Year of Election or Appointment: 2013 Deputy Treasurer | |
| Ms. Stagnone also serves as Deputy Treasurer of other funds. Ms. Stagnone is an employee of Fidelity Investments. |
Joseph F. Zambello (1957) | |
Year of Election or Appointment: 2011 Deputy Treasurer | |
| Mr. Zambello also serves as Deputy Treasurer of other funds. Mr. Zambello is an employee of Fidelity Investments. Previously, Mr. Zambello served as Vice President of FMR's Program Management Group (2009-2011) and Vice President of the Transfer Agent Oversight Group (2005-2009). |
Annual Report
Distributions (Unaudited)
Class A, Class T, Class B and Class C designates 100% of the dividends distributed during the fiscal year as qualifying for the dividends-received deduction for corporate shareholders.
Class A, Class T, Class B and Class C designates 100% of the dividends distributed during the fiscal year as amounts which may be taken into account as a dividend for purposes of the maximum rate under section 1(h)(11) of the Internal Revenue Code.
The fund will notify shareholders in January 2015 of amounts for use in preparing 2014 income tax returns.
Annual Report
Investment Adviser
Fidelity Management & Research Company
Boston, MA
Investment Sub-Advisers
FMR Co., Inc.
Fidelity Management & Research
(U.K.) Inc.
Fidelity Management & Research
(Hong Kong) Limited
Fidelity Management & Research
(Japan) Inc.
General Distributor
Fidelity Distributors Corporation
Smithfield, RI
Transfer and Service Agents
Fidelity Investments Institutional Operations Company, Inc.
Boston, MA
Fidelity Service Company, Inc.
Boston, MA
Custodian
Citibank, N.A.
New York, NY
(Fidelity Investment logo)(registered trademark)
ALCV-UANN-0314
1.838393.104
(Fidelity Investment logo)(registered trademark)
Fidelity Advisor®
Stock Selector
Large Cap Value
Fund - Institutional Class
Annual Report
January 31, 2014
(Fidelity Cover Art)
Institutional Class is a class of
Fidelity® Stock Selector Large Cap
Value Fund
Contents
Performance | How the fund has done over time. | |
Management's Discussion of Fund Performance | The Portfolio Manager's review of fund performance and strategy. | |
Shareholder Expense Example | An example of shareholder expenses. | |
Investment Changes | A summary of major shifts in the fund's investments over the past six months. | |
Investments | A complete list of the fund's investments with their market values. | |
Financial Statements | Statements of assets and liabilities, operations, and changes in net assets, as well as financial highlights. | |
Notes | Notes to the financial statements. | |
Report of Independent Registered Public Accounting Firm |
| |
Trustees and Officers |
| |
Distributions |
|
To view a fund's proxy voting guidelines and proxy voting record for the 12-month period ended June 30, visit http://www.fidelity.com/proxyvotingresults or visit the Securities and Exchange Commission's (SEC) web site at http://www.sec.gov. You may also call 1-877-208-0098 to request a free copy of the proxy voting guidelines.
Standard & Poor's, S&P and S&P 500 are registered service marks of The McGraw-Hill Companies, Inc. and have been licensed for use by Fidelity Distributors Corporation.
Other third-party marks appearing herein are the property of their respective owners.
All other marks appearing herein are registered or unregistered trademarks or service marks of FMR LLC or an affiliated company. © 2014 FMR LLC. All rights reserved.
This report and the financial statements contained herein are submitted for the general information of the shareholders of the fund. This report is not authorized for distribution to prospective investors in the fund unless preceded or accompanied by an effective prospectus.
A fund files its complete schedule of portfolio holdings with the SEC for the first and third quarters of each fiscal year on Form N-Q. Forms N-Q are available on the SEC's web site at http://www.sec.gov. A fund's Forms N-Q may be reviewed and copied at the SEC's Public Reference Room in Washington, DC. Information regarding the operation of the SEC's Public Reference Room may be obtained by calling 1-800-SEC-0330. For a complete list of a fund's portfolio holdings, view the most recent holdings listing, semiannual report, or annual report on Fidelity's web site at http://www.fidelity.com, http://www.advisor.fidelity.com, or http://www.401k.com, as applicable.
NOT FDIC INSURED • MAY LOSE VALUE • NO BANK GUARANTEE
Neither the fund nor Fidelity Distributors Corporation is a bank.
Annual Report
Performance: The Bottom Line
Average annual total return reflects the change in the value of an investment, assuming reinvestment of the class' distributions from dividend income and capital gains (the profits earned upon the sale of securities that have grown in value, if any) and assuming a constant rate of performance each year. The $10,000 table and the fund's returns do not reflect the deduction of taxes that a shareholder would pay on fund distributions or the redemption of fund shares. During periods of reimbursement by Fidelity, a fund's total return will be greater than it would be had the reimbursement not occurred. How a fund did yesterday is no guarantee of how it will do tomorrow.
Average Annual Total Returns
Periods ended January 31, 2014 | Past 1 | Past 5 | Past 10 |
Institutional Class A | 20.25% | 16.27% | 5.94% |
A The initial offering of Institutional Class shares took place on February 13, 2007. Returns prior to February 13, 2007 are those of Fidelity® Stock Selector Large Cap Value Fund, the original class of the fund.
$10,000 Over 10 Years
Let's say hypothetically that $10,000 was invested in Fidelity Advisor® Stock Selector Large Cap Value Fund - Institutional Class on January 31, 2004. The chart shows how the value of your investment would have changed, and also shows how the Russell 1000® Value Index performed over the same period. The initial offering of Institutional Class took place on February 13, 2007. See above for additional information regarding the performance of Institutional Class.
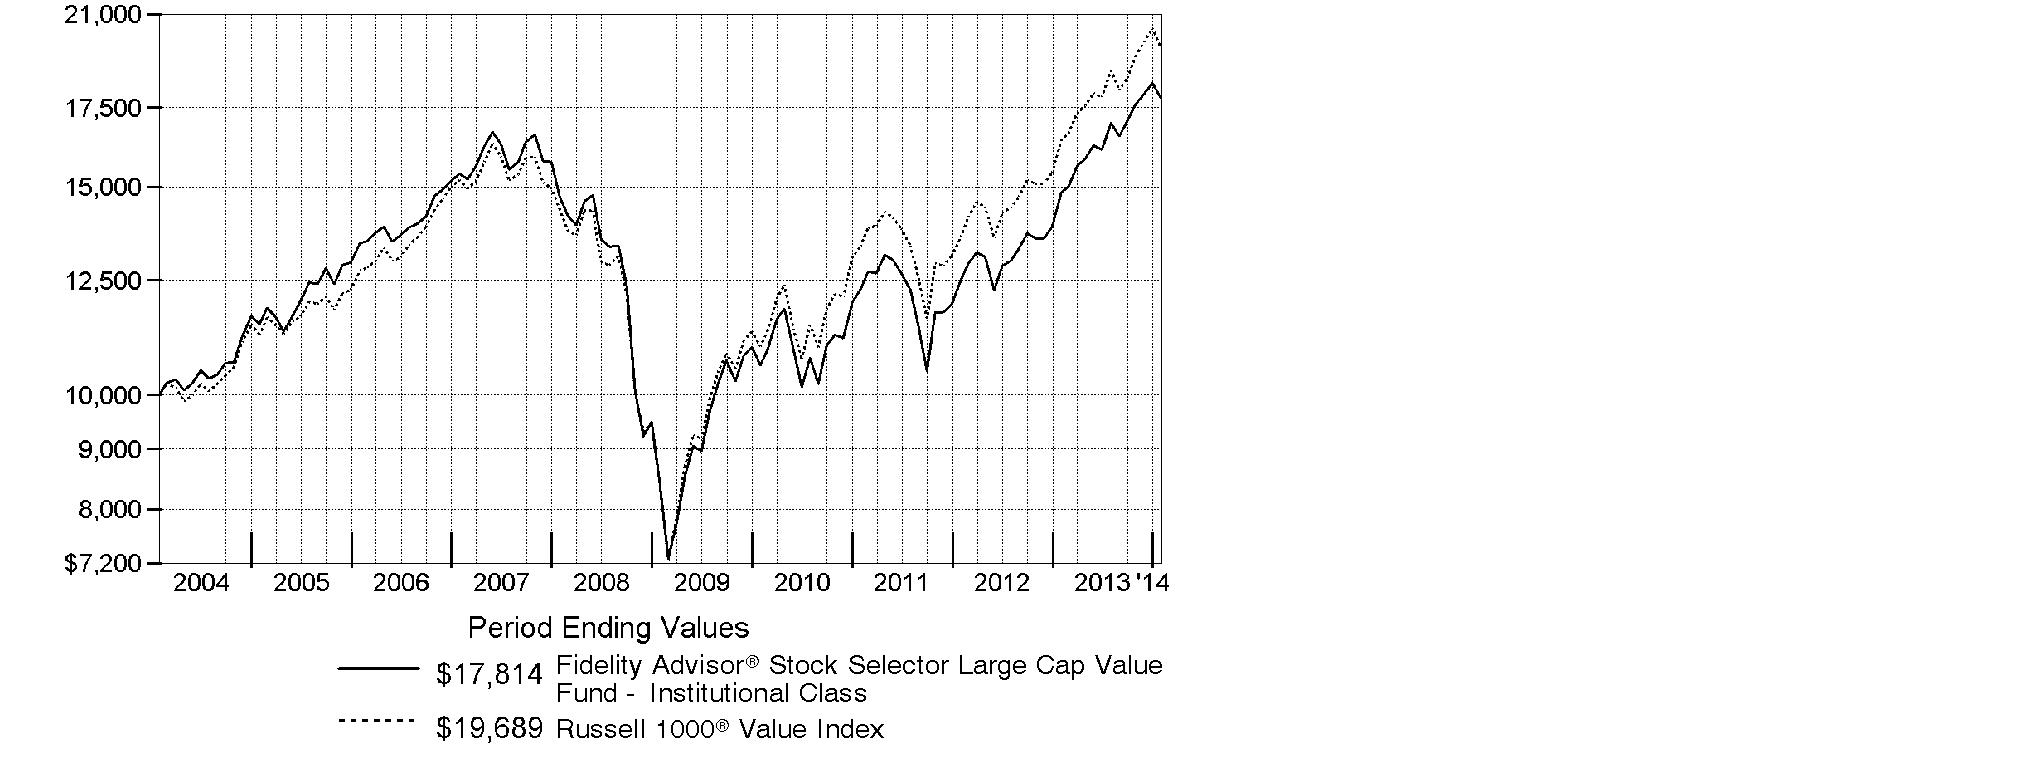
Annual Report
Management's Discussion of Fund Performance
Market Recap: Despite the worst January in years, markets finished notably higher for the 12 months ending January 31, 2014, amid a generally improving global economy and accommodative monetary policies worldwide. After achieving a series of highs in 2013, both the broad S&P 500® Index and the blue-chip Dow Jones Industrial AverageSM pulled back in the new year, bringing their 12-month returns to 21.52% and 16.07%, respectively. The growth-oriented Nasdaq Composite Index®, having run hotter in 2013 and cooled less in January, retained a loftier 32.33% result. For the period overall, smaller-cap stocks generally outperformed larger-caps, and growth outperformed value across market-cap segments. Bullish sentiment drove stocks higher through mid-May, but mixed signals from the U.S. Federal Reserve as to when it might curtail its stimulative bond-buying program, along with jitters over a potential U.S. military strike in Syria, put the markets in flux over the summer. Stocks regained their momentum in October despite a budget impasse that briefly shuttered the federal government, and volatility remained subdued heading into the holidays, allowing many markets to hit all-time highs by year-end. In January, renewed optimism for Europe and other developed markets was overrun by renewed concern about Fed tapering, the economic slowdown in China and a sell-off in emerging markets.
Comments from Matthew Friedman, Lead Portfolio Manager of Fidelity Advisor® Stock Selector Large Cap Value Fund: For the year, the fund's Institutional Class shares rose 20.25%, about in line with the 20.02% return of the Russell 1000® Value Index. The fund's performance versus the index primarily resulted from strong stock choices in health care, financials, consumer discretionary and utilities, which were partially offset by some stock-specific mistakes, most notably in energy. Among individual contributors, two real estate names - Kennedy-Wilson Holdings and Greece-based Eurobank Properties Real Estate Investment - were big relative contributors. The firm's exposure to the strong-performing U.K. and Greek real estate markets, respectively, helped propel both stocks. Conversely, not owning diversified financials firm Bank of America was the fund's biggest individual detractor. The stock flourished along with the diversified financials industry overall. Owning EZCORP also hurt. The company provides a variety of short-term consumer loans and sells merchandise via its pawn-lending operations business. The firm reported consecutive quarters of disappointing financial results, which turned investors away from the stock. Of note, the fund's modest cash position hurt in an up market. Many of the names I've mentioned were out-of-index holdings.
The views expressed above reflect those of the portfolio manager(s) only through the end of the period as stated on the cover of this report and do not necessarily represent the views of Fidelity or any other person in the Fidelity organization. Any such views are subject to change at any time based upon market or other conditions and Fidelity disclaims any responsibility to update such views. These views may not be relied on as investment advice and, because investment decisions for a Fidelity fund are based on numerous factors, may not be relied on as an indication of trading intent on behalf of any Fidelity fund.
Annual Report
Shareholder Expense Example
As a shareholder of the Fund, you incur two types of costs: (1) transaction costs, including sales charges (loads) on purchase payments or redemption proceeds, and (2) ongoing costs, including management fees, distribution and/or service (12b-1) fees and other Fund expenses. This Example is intended to help you understand your ongoing costs (in dollars) of investing in the Fund and to compare these costs with the ongoing costs of investing in other mutual funds.
The Example is based on an investment of $1,000 invested at the beginning of the period and held for the entire period (August 1, 2013 to January 31, 2014).
Actual Expenses
The first line of the accompanying table for each class of the Fund provides information about actual account values and actual expenses. You may use the information in this line, together with the amount you invested, to estimate the expenses that you paid over the period. Simply divide your account value by $1,000.00 (for example, an $8,600 account value divided by $1,000.00 = 8.6), then multiply the result by the number in the first line for a class of the Fund under the heading entitled "Expenses Paid During Period" to estimate the expenses you paid on your account during this period. A small balance maintenance fee of $12.00 that is charged once a year may apply for certain accounts with a value of less than $2,000. This fee is not included in the table below. If it was, the estimate of expenses you paid during the period would be higher, and your ending account value lower, by this amount. In addition, the Fund, as a shareholder in the underlying Fidelity Central Funds, will indirectly bear its pro-rata share of the fees and expenses incurred by the underlying Fidelity Central Funds. These fees and expenses are not included in the Fund's annualized expense ratio used to calculate the expense estimate in the table below.
Hypothetical Example for Comparison Purposes
The second line of the accompanying table for each class of the Fund provides information about hypothetical account values and hypothetical expenses based on a Class' actual expense ratio and an assumed rate of return of 5% per year before expenses, which is not the Class' actual return. The hypothetical account values and expenses may not be used to estimate the actual ending account balance or expenses you paid for the period. You may use this information to compare the ongoing costs of investing in the Fund and other funds. To do so, compare this 5% hypothetical example with the 5% hypothetical examples that appear in the shareholder reports of the other funds. A small balance maintenance fee of $12.00 that is charged once a year may apply for certain accounts with a value of less than $2,000. This fee is not included in the table below. If it was, the estimate of expenses you paid during the period would be higher, and your ending account value lower, by this amount. In addition, the Fund, as a shareholder in the underlying Fidelity Central Funds, will indirectly bear its pro-rata share of the fees and expenses incurred by the underlying Fidelity Central Funds. These fees and expenses are not included in the Fund's annualized expense ratio used to calculate the expense estimate in the table below.
Please note that the expenses shown in the table are meant to highlight your ongoing costs only and do not reflect any transaction costs. Therefore, the second line of the table is useful in comparing ongoing costs only, and will not help you determine the relative total costs of owning different funds. In addition, if these transactional costs were included, your costs would have been higher.
Annual Report
| Annualized | Beginning | Ending | Expenses Paid |
Class A | 1.05% |
|
|
|
Actual |
| $ 1,000.00 | $ 1,048.30 | $ 5.42 |
HypotheticalA |
| $ 1,000.00 | $ 1,019.91 | $ 5.35 |
Class T | 1.37% |
|
|
|
Actual |
| $ 1,000.00 | $ 1,046.00 | $ 7.07 |
HypotheticalA |
| $ 1,000.00 | $ 1,018.30 | $ 6.97 |
Class B | 1.87% |
|
|
|
Actual |
| $ 1,000.00 | $ 1,043.50 | $ 9.63 |
HypotheticalA |
| $ 1,000.00 | $ 1,015.78 | $ 9.50 |
Class C | 1.86% |
|
|
|
Actual |
| $ 1,000.00 | $ 1,043.50 | $ 9.58 |
HypotheticalA |
| $ 1,000.00 | $ 1,015.83 | $ 9.45 |
Stock Selector Large Cap Value | .77% |
|
|
|
Actual |
| $ 1,000.00 | $ 1,049.40 | $ 3.98 |
HypotheticalA |
| $ 1,000.00 | $ 1,021.32 | $ 3.92 |
Institutional Class | .77% |
|
|
|
Actual |
| $ 1,000.00 | $ 1,049.00 | $ 3.98 |
HypotheticalA |
| $ 1,000.00 | $ 1,021.32 | $ 3.92 |
A 5% return per year before expenses
B Annualized expense ratio reflects expenses net of applicable fee waivers.
* Expenses are equal to each Class' annualized expense ratio, multiplied by the average account value over the period, multiplied by 184/365 (to reflect the one-half year period).
Annual Report
Investment Changes (Unaudited)
Top Ten Stocks as of January 31, 2014 | ||
| % of fund's | % of fund's net assets |
Wells Fargo & Co. | 3.4 | 3.3 |
General Electric Co. | 3.1 | 2.8 |
Berkshire Hathaway, Inc. Class B | 2.9 | 3.1 |
Merck & Co., Inc. | 2.4 | 2.9 |
Chevron Corp. | 2.3 | 2.8 |
Occidental Petroleum Corp. | 2.1 | 2.3 |
Cisco Systems, Inc. | 1.9 | 1.2 |
Suncor Energy, Inc. | 1.9 | 1.9 |
Canadian Natural Resources Ltd. | 1.8 | 1.8 |
Apple, Inc. | 1.6 | 1.6 |
| 23.4 | |
Top Five Market Sectors as of January 31, 2014 | ||
| % of fund's | % of fund's net assets |
Financials | 27.5 | 27.5 |
Energy | 14.0 | 14.6 |
Health Care | 14.0 | 12.5 |
Industrials | 9.2 | 9.0 |
Information Technology | 8.8 | 8.8 |
Asset Allocation (% of fund's net assets) | |||||||
As of January 31, 2014* | As of July 31, 2013** | ||||||
 | Stocks and |
| | Stocks and |
| ||
 | Other Investments 0.1% |
|  | Other Investments 0.0% |
| ||
 | Short-Term |
| | Short-Term |
| ||
* Foreign investments | 14.5% |
| ** Foreign investments | 11.2% |
| ||

Annual Report
Investments January 31, 2014
Showing Percentage of Net Assets
Common Stocks - 95.7% | |||
Shares | Value | ||
CONSUMER DISCRETIONARY - 6.2% | |||
Auto Components - 1.5% | |||
Delphi Automotive PLC | 59,000 | $ 3,592,510 | |
TRW Automotive Holdings Corp. (a) | 62,098 | 4,604,567 | |
| 8,197,077 | ||
Internet & Catalog Retail - 0.4% | |||
Liberty Interactive Corp. Series A (a) | 81,644 | 2,180,711 | |
Media - 2.2% | |||
Comcast Corp. Class A | 89,378 | 4,866,632 | |
Omnicom Group, Inc. | 29,600 | 2,148,368 | |
Twenty-First Century Fox, Inc. Class A | 165,500 | 5,266,210 | |
| 12,281,210 | ||
Multiline Retail - 1.4% | |||
Macy's, Inc. | 66,650 | 3,545,780 | |
Target Corp. | 81,334 | 4,606,758 | |
| 8,152,538 | ||
Specialty Retail - 0.7% | |||
Staples, Inc. | 315,065 | 4,146,255 | |
TOTAL CONSUMER DISCRETIONARY | 34,957,791 | ||
CONSUMER STAPLES - 5.6% | |||
Beverages - 0.3% | |||
Molson Coors Brewing Co. Class B | 35,500 | 1,868,720 | |
Food & Staples Retailing - 1.3% | |||
Wal-Mart Stores, Inc. | 58,745 | 4,387,077 | |
Walgreen Co. | 54,640 | 3,133,604 | |
| 7,520,681 | ||
Food Products - 1.9% | |||
Bunge Ltd. | 44,735 | 3,389,124 | |
Mondelez International, Inc. | 129,010 | 4,225,078 | |
The J.M. Smucker Co. | 31,942 | 3,078,889 | |
| 10,693,091 | ||
Household Products - 1.6% | |||
Procter & Gamble Co. | 113,280 | 8,679,514 | |
Personal Products - 0.5% | |||
Coty, Inc. Class A | 209,500 | 2,826,155 | |
TOTAL CONSUMER STAPLES | 31,588,161 | ||
Common Stocks - continued | |||
Shares | Value | ||
ENERGY - 14.0% | |||
Energy Equipment & Services - 0.9% | |||
National Oilwell Varco, Inc. | 65,600 | $ 4,920,656 | |
Oil, Gas & Consumable Fuels - 13.1% | |||
Anadarko Petroleum Corp. | 89,920 | 7,255,645 | |
Apache Corp. | 59,800 | 4,799,548 | |
BG Group PLC | 168,400 | 2,829,231 | |
Canadian Natural Resources Ltd. | 313,800 | 10,289,541 | |
Chevron Corp. | 117,200 | 13,083,036 | |
Marathon Petroleum Corp. | 89,800 | 7,817,090 | |
Noble Energy, Inc. | 84,160 | 5,245,693 | |
Occidental Petroleum Corp. | 137,078 | 12,003,920 | |
Suncor Energy, Inc. | 319,300 | 10,489,955 | |
| 73,813,659 | ||
TOTAL ENERGY | 78,734,315 | ||
FINANCIALS - 26.9% | |||
Capital Markets - 2.8% | |||
Bank of New York Mellon Corp. | 158,000 | 5,049,680 | |
Goldman Sachs Group, Inc. | 10,000 | 1,641,200 | |
Invesco Ltd. | 85,800 | 2,852,850 | |
Morgan Stanley | 153,700 | 4,535,687 | |
SWS Group, Inc. (a) | 201,000 | 1,543,680 | |
| 15,623,097 | ||
Commercial Banks - 8.2% | |||
CIT Group, Inc. | 95,900 | 4,464,145 | |
First Citizen Bancshares, Inc. | 27,200 | 6,017,728 | |
PNC Financial Services Group, Inc. | 92,100 | 7,356,948 | |
Popular, Inc. (a) | 98,280 | 2,594,592 | |
U.S. Bancorp | 164,100 | 6,519,693 | |
Wells Fargo & Co. | 421,300 | 19,101,739 | |
| 46,054,845 | ||
Consumer Finance - 1.0% | |||
Cash America International, Inc. | 45,000 | 1,652,850 | |
EZCORP, Inc. (non-vtg.) Class A (a) | 174,700 | 1,918,206 | |
SLM Corp. | 99,500 | 2,264,620 | |
| 5,835,676 | ||
Common Stocks - continued | |||
Shares | Value | ||
FINANCIALS - continued | |||
Diversified Financial Services - 4.1% | |||
Berkshire Hathaway, Inc. Class B (a) | 145,457 | $ 16,233,001 | |
Interactive Brokers Group, Inc. | 320,900 | 6,803,080 | |
| 23,036,081 | ||
Insurance - 5.3% | |||
ACE Ltd. | 64,500 | 6,050,745 | |
AFLAC, Inc. | 58,450 | 3,669,491 | |
Donegal Group, Inc. Class A | 90,500 | 1,322,205 | |
Fairfax Financial Holdings Ltd. (sub. vtg.) | 7,650 | 2,943,919 | |
MetLife, Inc. | 97,700 | 4,792,185 | |
National Western Life Insurance Co. Class A | 8,850 | 1,930,628 | |
Old Republic International Corp. | 173,700 | 2,713,194 | |
StanCorp Financial Group, Inc. | 30,500 | 1,959,625 | |
Torchmark Corp. | 56,350 | 4,234,703 | |
| 29,616,695 | ||
Real Estate Investment Trusts - 2.4% | |||
American Tower Corp. | 34,200 | 2,766,096 | |
Ares Commercial Real Estate Corp. | 10,000 | 133,300 | |
Boston Properties, Inc. | 7,400 | 799,866 | |
CyrusOne, Inc. | 69,000 | 1,491,090 | |
Eurobank Properties Real Estate Investment Co. (a) | 517,920 | 5,273,816 | |
Hibernia (REIT) PLC | 693,800 | 1,057,373 | |
New Residential Investment Corp. | 110,000 | 698,500 | |
Newcastle Investment Corp. | 110,000 | 598,400 | |
RAIT Financial Trust | 40,000 | 337,600 | |
| 13,156,041 | ||
Real Estate Management & Development - 1.8% | |||
Consolidated-Tomoka Land Co. | 35,150 | 1,235,523 | |
Kennedy-Wilson Holdings, Inc. (a) | 365,500 | 8,779,310 | |
| 10,014,833 | ||
Thrifts & Mortgage Finance - 1.3% | |||
Beneficial Mutual Bancorp, Inc. (a) | 210,000 | 2,494,800 | |
HF Financial Corp. | 1,500 | 19,785 | |
Meridian Interstate Bancorp, Inc. (a) | 210,000 | 4,943,400 | |
| 7,457,985 | ||
TOTAL FINANCIALS | 150,795,253 | ||
Common Stocks - continued | |||
Shares | Value | ||
HEALTH CARE - 14.0% | |||
Biotechnology - 0.4% | |||
Amgen, Inc. | 16,900 | $ 2,010,255 | |
Health Care Equipment & Supplies - 0.6% | |||
St. Jude Medical, Inc. | 57,600 | 3,498,048 | |
Health Care Providers & Services - 3.8% | |||
Express Scripts Holding Co. (a) | 49,800 | 3,719,562 | |
HCA Holdings, Inc. (a) | 99,200 | 4,986,784 | |
Team Health Holdings, Inc. (a) | 49,300 | 2,127,788 | |
UnitedHealth Group, Inc. | 123,000 | 8,890,440 | |
WellPoint, Inc. | 17,101 | 1,470,686 | |
| 21,195,260 | ||
Pharmaceuticals - 9.2% | |||
AbbVie, Inc. | 33,400 | 1,644,282 | |
Actavis PLC (a) | 25,800 | 4,875,684 | |
Endo Health Solutions, Inc. (a)(d) | 41,100 | 2,707,668 | |
Jazz Pharmaceuticals PLC (a) | 43,900 | 6,657,874 | |
Johnson & Johnson | 102,100 | 9,032,787 | |
Merck & Co., Inc. | 255,200 | 13,517,944 | |
Pfizer, Inc. | 152,900 | 4,648,160 | |
Teva Pharmaceutical Industries Ltd. sponsored ADR | 82,400 | 3,677,512 | |
Valeant Pharmaceuticals International (Canada) (a) | 35,800 | 4,857,871 | |
| 51,619,782 | ||
TOTAL HEALTH CARE | 78,323,345 | ||
INDUSTRIALS - 9.2% | |||
Aerospace & Defense - 0.5% | |||
Textron, Inc. | 87,800 | 3,116,900 | |
Air Freight & Logistics - 1.3% | |||
FedEx Corp. | 54,000 | 7,199,280 | |
Commercial Services & Supplies - 0.6% | |||
Waste Management, Inc. | 77,201 | 3,225,458 | |
Construction & Engineering - 1.9% | |||
AECOM Technology Corp. (a) | 194,600 | 5,579,182 | |
URS Corp. | 101,100 | 5,075,220 | |
| 10,654,402 | ||
Electrical Equipment - 0.7% | |||
Babcock & Wilcox Co. | 107,400 | 3,681,672 | |
Industrial Conglomerates - 3.1% | |||
General Electric Co. | 704,600 | 17,706,598 | |
Common Stocks - continued | |||
Shares | Value | ||
INDUSTRIALS - continued | |||
Machinery - 0.4% | |||
Caterpillar, Inc. | 11,600 | $ 1,089,356 | |
Terex Corp. | 25,000 | 1,025,000 | |
| 2,114,356 | ||
Road & Rail - 0.7% | |||
CSX Corp. | 145,700 | 3,920,787 | |
TOTAL INDUSTRIALS | 51,619,453 | ||
INFORMATION TECHNOLOGY - 8.8% | |||
Communications Equipment - 1.9% | |||
Cisco Systems, Inc. | 479,500 | 10,505,845 | |
Computers & Peripherals - 3.0% | |||
Apple, Inc. | 18,350 | 9,186,010 | |
EMC Corp. | 325,000 | 7,878,000 | |
| 17,064,010 | ||
Electronic Equipment & Components - 0.5% | |||
Jabil Circuit, Inc. | 155,948 | 2,802,386 | |
Semiconductors & Semiconductor Equipment - 2.1% | |||
Broadcom Corp. Class A | 266,300 | 7,925,088 | |
Samsung Electronics Co. Ltd. | 3,166 | 3,711,203 | |
| 11,636,291 | ||
Software - 1.3% | |||
Oracle Corp. | 130,100 | 4,800,690 | |
Symantec Corp. | 124,100 | 2,656,981 | |
| 7,457,671 | ||
TOTAL INFORMATION TECHNOLOGY | 49,466,203 | ||
MATERIALS - 2.4% | |||
Chemicals - 2.1% | |||
Ashland, Inc. | 28,300 | 2,626,523 | |
Axiall Corp. | 39,900 | 1,592,010 | |
Chemtura Corp. (a) | 69,100 | 1,733,028 | |
Eastman Chemical Co. | 46,300 | 3,609,548 | |
LyondellBasell Industries NV Class A | 29,520 | 2,324,995 | |
| 11,886,104 | ||
Common Stocks - continued | |||
Shares | Value | ||
MATERIALS - continued | |||
Metals & Mining - 0.3% | |||
Freeport-McMoRan Copper & Gold, Inc. | 55,700 | $ 1,805,237 | |
TOTAL MATERIALS | 13,691,341 | ||
TELECOMMUNICATION SERVICES - 2.3% | |||
Diversified Telecommunication Services - 2.1% | |||
AT&T, Inc. | 226,100 | 7,533,652 | |
CenturyLink, Inc. | 102,914 | 2,970,098 | |
Frontier Communications Corp. (d) | 235,200 | 1,105,440 | |
| 11,609,190 | ||
Wireless Telecommunication Services - 0.2% | |||
NII Holdings, Inc. (a)(d) | 367,400 | 1,105,874 | |
TOTAL TELECOMMUNICATION SERVICES | 12,715,064 | ||
UTILITIES - 6.3% | |||
Electric Utilities - 3.1% | |||
Edison International | 78,600 | 3,785,376 | |
ITC Holdings Corp. | 49,100 | 5,081,850 | |
NextEra Energy, Inc. | 58,410 | 5,369,631 | |
Xcel Energy, Inc. | 100,200 | 2,896,782 | |
| 17,133,639 | ||
Gas Utilities - 0.9% | |||
Atmos Energy Corp. | 66,700 | 3,202,267 | |
National Fuel Gas Co. | 24,800 | 1,868,928 | |
| 5,071,195 | ||
Multi-Utilities - 2.3% | |||
Alliant Energy Corp. | 35,900 | 1,865,364 | |
Ameren Corp. | 47,700 | 1,804,968 | |
NiSource, Inc. | 116,400 | 4,000,668 | |
Sempra Energy | 56,950 | 5,279,835 | |
| 12,950,835 | ||
TOTAL UTILITIES | 35,155,669 | ||
TOTAL COMMON STOCKS (Cost $472,260,044) |
| ||
Nonconvertible Preferred Stocks - 0.5% | |||
Shares | Value | ||
FINANCIALS - 0.5% | |||
Commercial Banks - 0.5% | |||
Itau Unibanco Holding SA sponsored ADR | 217,580 | $ 2,663,179 | |
Real Estate Investment Trusts - 0.0% | |||
Eagle Hospitality Properties Trust, Inc. 8.25% (a) | 47,000 | 47 | |
Equity Lifestyle Properties, Inc. Series C, 6.75% | 16,134 | 374,147 | |
| 374,194 | ||
TOTAL NONCONVERTIBLE PREFERRED STOCKS (Cost $4,836,790) |
| ||
U.S. Treasury Obligations - 0.0% | ||||
| Principal Amount |
| ||
U.S. Treasury Bills, yield at date of purchase 0.01% to 0.04% 2/27/14 to 5/1/14 (g) | $ 125,000 |
| ||
Preferred Securities - 0.1% | |||
|
|
|
|
FINANCIALS - 0.1% | |||
Diversified Financial Services - 0.1% | |||
Baggot Securities Ltd. 10.24% (e)(f) (Cost $353,254) | 230,000 |
| |
Money Market Funds - 4.0% | |||
Shares |
| ||
Fidelity Cash Central Fund, 0.10% (b) | 20,064,480 | 20,064,480 | |
Fidelity Securities Lending Cash Central Fund, 0.09% (b)(c) | 2,132,550 | 2,132,550 | |
TOTAL MONEY MARKET FUNDS (Cost $22,197,030) |
| ||
TOTAL INVESTMENT PORTFOLIO - 100.3% (Cost $499,772,114) | 562,767,269 | ||
NET OTHER ASSETS (LIABILITIES) - (0.3)% | (1,749,617) | ||
NET ASSETS - 100% | $ 561,017,652 | ||
Futures Contracts | |||||
Expiration Date | Underlying Face Amount at Value | Unrealized Appreciation/ | |||
Purchased | |||||
Equity Index Contracts | |||||
58 ICE Russell 1000 Value Index Contracts (United States) | March 2014 | $ 5,159,100 | $ (148,245) | ||
The face value of futures purchased as a percentage of net assets is 0.9% |
Currency Abbreviations | ||
EUR | - | European Monetary Unit |
Legend |
(a) Non-income producing |
(b) Affiliated fund that is generally available only to investment companies and other accounts managed by Fidelity Investments. The rate quoted is the annualized seven-day yield of the fund at period end. A complete unaudited listing of the fund's holdings as of its most recent quarter end is available upon request. In addition, each Fidelity Central Fund's financial statements, which are not covered by the Fund's Report of Independent Registered Public Accounting Firm, are available on the SEC's website or upon request. |
(c) Investment made with cash collateral received from securities on loan. |
(d) Security or a portion of the security is on loan at period end. |
(e) Security exempt from registration under Rule 144A of the Securities Act of 1933. These securities may be resold in transactions exempt from registration, normally to qualified institutional buyers. At the end of the period, the value of these securities amounted to $361,275 or 0.1% of net assets. |
(f) Security is perpetual in nature with no stated maturity date. |
(g) Security or a portion of the security was pledged to cover margin requirements for futures contracts. At period end, the value of securities pledged amounted to $124,996. |
Affiliated Central Funds |
Information regarding fiscal year to date income earned by the Fund from investments in Fidelity Central Funds is as follows: |
Fund | Income earned |
Fidelity Cash Central Fund | $ 19,669 |
Fidelity Securities Lending Cash Central Fund | 47,322 |
Total | $ 66,991 |
Other Information |
The following is a summary of the inputs used, as of January 31, 2014, involving the Fund's assets and liabilities carried at fair value. The inputs or methodology used for valuing securities may not be an indication of the risk associated with investing in those securities. For more information on valuation inputs, and their aggregation into the levels used in the table below, please refer to the Investment Valuation section in the accompanying Notes to Financial Statements. |
Valuation Inputs at Reporting Date: | ||||
Description | Total | Level 1 | Level 2 | Level 3 |
Investments in Securities: | ||||
Equities: | ||||
Consumer Discretionary | $ 34,957,791 | $ 34,957,791 | $ - | $ - |
Consumer Staples | 31,588,161 | 31,588,161 | - | - |
Energy | 78,734,315 | 78,734,315 | - | - |
Financials | 153,832,626 | 153,832,579 | - | 47 |
Health Care | 78,323,345 | 78,323,345 | - | - |
Industrials | 51,619,453 | 51,619,453 | - | - |
Information Technology | 49,466,203 | 45,755,000 | 3,711,203 | - |
Materials | 13,691,341 | 13,691,341 | - | - |
Telecommunication Services | 12,715,064 | 12,715,064 | - | - |
Utilities | 35,155,669 | 35,155,669 | - | - |
U.S. Government and Government Agency Obligations | 124,996 | - | 124,996 | - |
Preferred Securities | 361,275 | - | 361,275 | - |
Money Market Funds | 22,197,030 | 22,197,030 | - | - |
Total Investments in Securities: | $ 562,767,269 | $ 558,569,748 | $ 4,197,474 | $ 47 |
Derivative Instruments: | ||||
Liabilities | ||||
Futures Contracts | $ (148,245) | $ (148,245) | $ - | $ - |
Value of Derivative Instruments |
The following table is a summary of the Fund's value of derivative instruments by primary risk exposure as of January 31, 2014. For additional information on derivative instruments, please refer to the Derivative Instruments section in the accompanying Notes to Financial Statements. |
Primary Risk Exposure / | Value | |
| Asset | Liability |
Equity Risk | ||
Futures Contracts (a) | $ - | $ (148,245) |
Total Value of Derivatives | $ - | $ (148,245) |
(a) Reflects gross cumulative appreciation (depreciation) on futures contracts as presented in the Schedule of Investments. Only the period end receivable or payable for daily variation margin and net unrealized appreciation (depreciation) are presented in the Statement of Assets and Liabilities. |
Distribution of investments by country or territory of incorporation, as a percentage of total net assets, is as follows (Unaudited): |
United States of America | 85.5% |
Canada | 5.1% |
Ireland | 2.4% |
Bermuda | 1.1% |
Switzerland | 1.1% |
Others (Individually Less Than 1%) | 4.8% |
| 100.0% |
See accompanying notes which are an integral part of the financial statements.
Annual Report
Financial Statements
Statement of Assets and Liabilities
| January 31, 2014 | |
|
|
|
Assets | ||
Investment in securities, at value (including securities loaned of $2,048,037) - See accompanying schedule: Unaffiliated issuers (cost $477,575,084) | $ 540,570,239 |
|
Fidelity Central Funds (cost $22,197,030) | 22,197,030 |
|
Total Investments (cost $499,772,114) |
| $ 562,767,269 |
Receivable for investments sold | 5,929,565 | |
Receivable for fund shares sold | 552,977 | |
Dividends receivable | 353,518 | |
Distributions receivable from Fidelity Central Funds | 9,313 | |
Prepaid expenses | 1,123 | |
Other receivables | 6,597 | |
Total assets | 569,620,362 | |
|
|
|
Liabilities | ||
Payable to custodian bank | $ 105,997 | |
Payable for investments purchased | 4,695,548 | |
Payable for fund shares redeemed | 1,197,395 | |
Accrued management fee | 241,268 | |
Distribution and service plan fees payable | 16,062 | |
Payable for daily variation margin for derivative instruments | 44,080 | |
Other affiliated payables | 114,213 | |
Other payables and accrued expenses | 55,597 | |
Collateral on securities loaned, at value | 2,132,550 | |
Total liabilities | 8,602,710 | |
|
|
|
Net Assets | $ 561,017,652 | |
Net Assets consist of: |
| |
Paid in capital | $ 791,086,240 | |
Accumulated undistributed net realized gain (loss) on investments and foreign currency transactions | (292,914,584) | |
Net unrealized appreciation (depreciation) on investments and assets and liabilities in foreign currencies | 62,845,996 | |
Net Assets | $ 561,017,652 | |
See accompanying notes which are an integral part of the financial statements.
Annual Report
Statement of Assets and Liabilities - continued
| January 31, 2014 | |
|
|
|
Calculation of Maximum Offering Price Class A: | $ 14.72 | |
|
|
|
Maximum offering price per share (100/94.25 of $14.72) | $ 15.62 | |
Class T: | $ 14.71 | |
|
|
|
Maximum offering price per share (100/96.50 of $14.71) | $ 15.24 | |
Class B: | $ 14.72 | |
|
|
|
Class C: | $ 14.53 | |
|
|
|
Stock Selector Large Cap Value: | $ 14.81 | |
|
|
|
Institutional Class: | $ 14.74 | |
A Redemption price per share is equal to net asset value less any applicable contingent deferred sales charge.
See accompanying notes which are an integral part of the financial statements.
Annual Report
Financial Statements - continued
Statement of Operations
| Year ended January 31, 2014 | |
|
|
|
Investment Income |
|
|
Dividends |
| $ 10,508,965 |
Interest |
| 383 |
Income from Fidelity Central Funds |
| 66,991 |
Total income |
| 10,576,339 |
|
|
|
Expenses | ||
Management fee | $ 3,003,251 | |
Performance adjustment | (664,858) | |
Transfer agent fees | 1,175,937 | |
Distribution and service plan fees | 177,227 | |
Accounting and security lending fees | 206,936 | |
Custodian fees and expenses | 37,404 | |
Independent trustees' compensation | 2,737 | |
Registration fees | 93,237 | |
Audit | 57,311 | |
Legal | 2,105 | |
Miscellaneous | 3,894 | |
Total expenses before reductions | 4,095,181 | |
Expense reductions | (22,191) | 4,072,990 |
Net investment income (loss) | 6,503,349 | |
Realized and Unrealized Gain (Loss) Net realized gain (loss) on: | ||
Investment securities: |
|
|
Unaffiliated issuers | 58,186,576 | |
Foreign currency transactions | (8,422) | |
Futures contracts | 1,432,461 | |
Total net realized gain (loss) |
| 59,610,615 |
Change in net unrealized appreciation (depreciation) on: Investment securities | 32,608,267 | |
Assets and liabilities in foreign currencies | (220) | |
Futures contracts | (477,467) | |
Total change in net unrealized appreciation (depreciation) |
| 32,130,580 |
Net gain (loss) | 91,741,195 | |
Net increase (decrease) in net assets resulting from operations | $ 98,244,544 | |
See accompanying notes which are an integral part of the financial statements.
Annual Report
Statement of Changes in Net Assets
| Year ended | Year ended |
Increase (Decrease) in Net Assets |
|
|
Operations |
|
|
Net investment income (loss) | $ 6,503,349 | $ 9,916,334 |
Net realized gain (loss) | 59,610,615 | 29,669,811 |
Change in net unrealized appreciation (depreciation) | 32,130,580 | 43,960,221 |
Net increase (decrease) in net assets resulting | 98,244,544 | 83,546,366 |
Distributions to shareholders from net investment income | (7,028,513) | (9,512,706) |
Distributions to shareholders from net realized gain | (1,781,878) | - |
Total distributions | (8,810,391) | (9,512,706) |
Share transactions - net increase (decrease) | (28,375,927) | (89,844,793) |
Total increase (decrease) in net assets | 61,058,226 | (15,811,133) |
|
|
|
Net Assets | ||
Beginning of period | 499,959,426 | 515,770,559 |
End of period (including undistributed net investment income of $0 and undistributed net investment income of $393,853, respectively) | $ 561,017,652 | $ 499,959,426 |
See accompanying notes which are an integral part of the financial statements.
Annual Report
Financial Highlights - Class A
Years ended January 31, | 2014 | 2013 | 2012 | 2011 | 2010 |
Selected Per-Share Data |
|
|
|
|
|
Net asset value, beginning of period | $ 12.43 | $ 10.71 | $ 10.72 | $ 9.35 | $ 7.53 |
Income from Investment Operations |
|
|
|
|
|
Net investment income (loss) C | .13 | .20 | .14 | .09 | .09 |
Net realized and unrealized gain (loss) | 2.35 | 1.73 | .02 | 1.38 | 1.85 |
Total from investment operations | 2.48 | 1.93 | .16 | 1.47 | 1.94 |
Distributions from net investment income | (.15) | (.21) | (.17) | (.10) | (.12) |
Distributions from net realized gain | (.05) | - | - | - | - |
Total distributions | (.19) G | (.21) | (.17) | (.10) | (.12) |
Net asset value, end of period | $ 14.72 | $ 12.43 | $ 10.71 | $ 10.72 | $ 9.35 |
Total Return A,B | 20.01% | 18.15% | 1.58% | 15.79% | 25.74% |
Ratios to Average Net Assets D,F |
|
|
|
|
|
Expenses before reductions | 1.00% | .87% | .87% | 1.00% | 1.15% |
Expenses net of fee waivers, if any | 1.00% | .87% | .87% | 1.00% | 1.15% |
Expenses net of all reductions | 1.00% | .85% | .86% | 1.00% | 1.13% |
Net investment income (loss) | .95% | 1.74% | 1.38% | .87% | 1.08% |
Supplemental Data |
|
|
|
|
|
Net assets, end of period (000 omitted) | $ 21,266 | $ 18,234 | $ 18,900 | $ 20,815 | $ 23,778 |
Portfolio turnover rate E | 64% | 63% | 128% | 120% | 171% |
A Total returns would have been lower if certain expenses had not been reduced during the applicable periods shown.
B Total returns do not include the effect of the sales charges.
C Calculated based on average shares outstanding during the period.
D Fees and expenses of any underlying Fidelity Central Funds are not included in the Fund's expense ratio. The Fund indirectly bears its proportionate share of the expenses of any underlying Fidelity Central Funds.
E Amount does not include the portfolio activity of any underlying Fidelity Central Funds.
F Expense ratios reflect operating expenses of the class. Expenses before reductions do not reflect amounts reimbursed by the investment adviser or reductions from brokerage service arrangements or reductions from other expense offset arrangements and do not represent the amount paid by the class during periods when reimbursements or reductions occur. Expenses net of fee waivers reflect expenses after reimbursement by the investment adviser but prior to reductions from brokerage service arrangements or other expense offset arrangements. Expenses net of all reductions represent the net expenses paid by the class.
G Total distributions of $.19 per share is comprised of distributions from net investment income of $.147 and distributions from net realized gain of $.047 per share.
See accompanying notes which are an integral part of the financial statements.
Annual Report
Financial Highlights - Class T
Years ended January 31, | 2014 | 2013 | 2012 | 2011 | 2010 |
Selected Per-Share Data |
|
|
|
|
|
Net asset value, beginning of period | $ 12.44 | $ 10.72 | $ 10.74 | $ 9.36 | $ 7.54 |
Income from Investment Operations |
|
|
|
|
|
Net investment income (loss) C | .09 | .17 | .12 | .06 | .07 |
Net realized and unrealized gain (loss) | 2.34 | 1.73 | .01 | 1.39 | 1.84 |
Total from investment operations | 2.43 | 1.90 | .13 | 1.45 | 1.91 |
Distributions from net investment income | (.11) | (.18) | (.15) | (.07) | (.09) |
Distributions from net realized gain | (.05) | - | - | - | - |
Total distributions | (.16) | (.18) | (.15) | (.07) | (.09) |
Net asset value, end of period | $ 14.71 | $ 12.44 | $ 10.72 | $ 10.74 | $ 9.36 |
Total Return A,B | 19.54% | 17.88% | 1.26% | 15.50% | 25.30% |
Ratios to Average Net Assets D,F |
|
|
|
|
|
Expenses before reductions | 1.32% | 1.14% | 1.14% | 1.29% | 1.45% |
Expenses net of fee waivers, if any | 1.32% | 1.14% | 1.14% | 1.29% | 1.45% |
Expenses net of all reductions | 1.31% | 1.12% | 1.13% | 1.28% | 1.44% |
Net investment income (loss) | .63% | 1.48% | 1.11% | .59% | .78% |
Supplemental Data |
|
|
|
|
|
Net assets, end of period (000 omitted) | $ 8,244 | $ 6,544 | $ 5,603 | $ 5,625 | $ 9,101 |
Portfolio turnover rate E | 64% | 63% | 128% | 120% | 171% |
A Total returns would have been lower if certain expenses had not been reduced during the applicable periods shown.
B Total returns do not include the effect of the sales charges.
C Calculated based on average shares outstanding during the period.
D Fees and expenses of any underlying Fidelity Central Funds are not included in the Fund's expense ratio. The Fund indirectly bears its proportionate share of the expenses of any underlying Fidelity Central Funds.
E Amount does not include the portfolio activity of any underlying Fidelity Central Funds.
F Expense ratios reflect operating expenses of the class. Expenses before reductions do not reflect amounts reimbursed by the investment adviser or reductions from brokerage service arrangements or reductions from other expense offset arrangements and do not represent the amount paid by the class during periods when reimbursements or reductions occur. Expenses net of fee waivers reflect expenses after reimbursement by the investment adviser but prior to reductions from brokerage service arrangements or other expense offset arrangements. Expenses net of all reductions represent the net expenses paid by the class.
See accompanying notes which are an integral part of the financial statements.
Annual Report
Financial Highlights - Class B
Years ended January 31, | 2014 | 2013 | 2012 | 2011 | 2010 |
Selected Per-Share Data |
|
|
|
|
|
Net asset value, beginning of period | $ 12.44 | $ 10.72 | $ 10.72 | $ 9.35 | $ 7.53 |
Income from Investment Operations |
|
|
|
|
|
Net investment income (loss) C | .02 | .11 | .07 | .01 | .02 |
Net realized and unrealized gain (loss) | 2.34 | 1.73 | .02 | 1.38 | 1.85 |
Total from investment operations | 2.36 | 1.84 | .09 | 1.39 | 1.87 |
Distributions from net investment income | (.03) | (.12) | (.09) | (.02) | (.05) |
Distributions from net realized gain | (.05) | - | - | - | - |
Total distributions | (.08) | (.12) | (.09) | (.02) | (.05) |
Net asset value, end of period | $ 14.72 | $ 12.44 | $ 10.72 | $ 10.72 | $ 9.35 |
Total Return A,B | 18.94% | 17.24% | .86% | 14.87% | 24.79% |
Ratios to Average Net Assets D,F |
|
|
|
|
|
Expenses before reductions | 1.81% | 1.63% | 1.62% | 1.80% | 1.98% |
Expenses net of fee waivers, if any | 1.80% | 1.63% | 1.62% | 1.80% | 1.98% |
Expenses net of all reductions | 1.80% | 1.60% | 1.62% | 1.79% | 1.97% |
Net investment income (loss) | .14% | .99% | .63% | .08% | .24% |
Supplemental Data |
|
|
|
|
|
Net assets, end of period (000 omitted) | $ 1,632 | $ 1,645 | $ 1,819 | $ 2,274 | $ 2,711 |
Portfolio turnover rate E | 64% | 63% | 128% | 120% | 171% |
A Total returns would have been lower if certain expenses had not been reduced during the applicable periods shown.
B Total returns do not include the effect of the contingent deferred sales charge.
C Calculated based on average shares outstanding during the period.
D Fees and expenses of any underlying Fidelity Central Funds are not included in the Fund's expense ratio. The Fund indirectly bears its proportionate share of the expenses of any underlying Fidelity Central Funds.
E Amount does not include the portfolio activity of any underlying Fidelity Central Funds.
F Expense ratios reflect operating expenses of the class. Expenses before reductions do not reflect amounts reimbursed by the investment adviser or reductions from brokerage service arrangements or reductions from other expense offset arrangements and do not represent the amount paid by the class during periods when reimbursements or reductions occur. Expenses net of fee waivers reflect expenses after reimbursement by the investment adviser but prior to reductions from brokerage service arrangements or other expense offset arrangements. Expenses net of all reductions represent the net expenses paid by the class.
See accompanying notes which are an integral part of the financial statements.
Annual Report
Financial Highlights - Class C
Years ended January 31, | 2014 | 2013 | 2012 | 2011 | 2010 |
Selected Per-Share Data |
|
|
|
|
|
Net asset value, beginning of period | $ 12.30 | $ 10.61 | $ 10.63 | $ 9.30 | $ 7.49 |
Income from Investment Operations |
|
|
|
|
|
Net investment income (loss) C | .02 | .11 | .07 | .01 | .03 |
Net realized and unrealized gain (loss) | 2.31 | 1.72 | .01 | 1.36 | 1.84 |
Total from investment operations | 2.33 | 1.83 | .08 | 1.37 | 1.87 |
Distributions from net investment income | (.05) | (.14) | (.10) | (.04) | (.06) |
Distributions from net realized gain | (.05) | - | - | - | - |
Total distributions | (.10) | (.14) | (.10) | (.04) | (.06) |
Net asset value, end of period | $ 14.53 | $ 12.30 | $ 10.61 | $ 10.63 | $ 9.30 |
Total Return A,B | 18.94% | 17.32% | .85% | 14.79% | 24.97% |
Ratios to Average Net Assets D,F |
|
|
|
|
|
Expenses before reductions | 1.81% | 1.63% | 1.62% | 1.75% | 1.89% |
Expenses net of fee waivers, if any | 1.80% | 1.63% | 1.62% | 1.75% | 1.89% |
Expenses net of all reductions | 1.80% | 1.61% | 1.61% | 1.74% | 1.88% |
Net investment income (loss) | .14% | .99% | .63% | .13% | .34% |
Supplemental Data |
|
|
|
|
|
Net assets, end of period (000 omitted) | $ 7,789 | $ 5,839 | $ 4,979 | $ 3,959 | $ 3,491 |
Portfolio turnover rate E | 64% | 63% | 128% | 120% | 171% |
A Total returns would have been lower if certain expenses had not been reduced during the applicable periods shown.
B Total returns do not include the effect of the contingent deferred sales charge.
C Calculated based on average shares outstanding during the period.
D Fees and expenses of any underlying Fidelity Central Funds are not included in the Fund's expense ratio. The Fund indirectly bears its proportionate share of the expenses of any underlying Fidelity Central Funds.
E Amount does not include the portfolio activity of any underlying Fidelity Central Funds.
F Expense ratios reflect operating expenses of the class. Expenses before reductions do not reflect amounts reimbursed by the investment adviser or reductions from brokerage service arrangements or reductions from other expense offset arrangements and do not represent the amount paid by the class during periods when reimbursements or reductions occur. Expenses net of fee waivers reflect expenses after reimbursement by the investment adviser but prior to reductions from brokerage service arrangements or other expense offset arrangements. Expenses net of all reductions represent the net expenses paid by the class.
See accompanying notes which are an integral part of the financial statements.
Annual Report
Financial Highlights - Stock Selector Large Cap Value
Years ended January 31, | 2014 | 2013 | 2012 | 2011 | 2010 |
Selected Per-Share Data |
|
|
|
|
|
Net asset value, beginning of period | $ 12.51 | $ 10.77 | $ 10.78 | $ 9.40 | $ 7.56 |
Income from Investment Operations |
|
|
|
|
|
Net investment income (loss) B | .17 | .23 | .18 | .11 | .12 |
Net realized and unrealized gain (loss) | 2.37 | 1.75 | .01 | 1.40 | 1.86 |
Total from investment operations | 2.54 | 1.98 | .19 | 1.51 | 1.98 |
Distributions from net investment income | (.19) | (.24) | (.20) | (.13) | (.14) |
Distributions from net realized gain | (.05) | - | - | - | - |
Total distributions | (.24) | (.24) | (.20) | (.13) | (.14) |
Net asset value, end of period | $ 14.81 | $ 12.51 | $ 10.77 | $ 10.78 | $ 9.40 |
Total Return A | 20.31% | 18.55% | 1.85% | 16.09% | 26.21% |
Ratios to Average Net Assets C,E |
|
|
|
|
|
Expenses before reductions | .72% | .57% | .57% | .73% | .85% |
Expenses net of fee waivers, if any | .72% | .57% | .57% | .73% | .85% |
Expenses net of all reductions | .71% | .55% | .56% | .72% | .84% |
Net investment income (loss) | 1.23% | 2.05% | 1.68% | 1.15% | 1.38% |
Supplemental Data |
|
|
|
|
|
Net assets, end of period (000 omitted) | $ 518,206 | $ 465,702 | $ 482,950 | $ 803,009 | $ 914,828 |
Portfolio turnover rate D | 64% | 63% | 128% | 120% | 171% |
A Total returns would have been lower if certain expenses had not been reduced during the applicable periods shown.
B Calculated based on average shares outstanding during the period.
C Fees and expenses of any underlying Fidelity Central Funds are not included in the Fund's expense ratio. The Fund indirectly bears its proportionate share of the expenses of any underlying Fidelity Central Funds.
D Amount does not include the portfolio activity of any underlying Fidelity Central Funds.
E Expense ratios reflect operating expenses of the class. Expenses before reductions do not reflect amounts reimbursed by the investment adviser or reductions from brokerage service arrangements or reductions from other expense offset arrangements and do not represent the amount paid by the class during periods when reimbursements or reductions occur. Expenses net of fee waivers reflect expenses after reimbursement by the investment adviser but prior to reductions from brokerage service arrangements or other expense offset arrangements. Expenses net of all reductions represent the net expenses paid by the class.
See accompanying notes which are an integral part of the financial statements.
Annual Report
Financial Highlights - Institutional Class
Years ended January 31, | 2014 | 2013 | 2012 | 2011 | 2010 |
Selected Per-Share Data |
|
|
|
|
|
Net asset value, beginning of period | $ 12.46 | $ 10.74 | $ 10.74 | $ 9.37 | $ 7.54 |
Income from Investment Operations |
|
|
|
|
|
Net investment income (loss) B | .17 | .23 | .17 | .11 | .12 |
Net realized and unrealized gain (loss) | 2.35 | 1.73 | .02 | 1.39 | 1.85 |
Total from investment operations | 2.52 | 1.96 | .19 | 1.50 | 1.97 |
Distributions from net investment income | (.19) | (.24) | (.19) | (.13) | (.14) |
Distributions from net realized gain | (.05) | - | - | - | - |
Total distributions | (.24) | (.24) | (.19) | (.13) | (.14) |
Net asset value, end of period | $ 14.74 | $ 12.46 | $ 10.74 | $ 10.74 | $ 9.37 |
Total Return A | 20.25% | 18.42% | 1.92% | 16.04% | 26.18% |
Ratios to Average Net Assets C,E |
|
|
|
|
|
Expenses before reductions | .73% | .61% | .60% | .74% | .87% |
Expenses net of fee waivers, if any | .73% | .61% | .60% | .74% | .87% |
Expenses net of all reductions | .73% | .58% | .60% | .73% | .86% |
Net investment income (loss) | 1.22% | 2.01% | 1.65% | 1.14% | 1.36% |
Supplemental Data |
|
|
|
|
|
Net assets, end of period (000 omitted) | $ 3,881 | $ 1,995 | $ 1,519 | $ 1,876 | $ 2,279 |
Portfolio turnover rate D | 64% | 63% | 128% | 120% | 171% |
A Total returns would have been lower if certain expenses had not been reduced during the applicable periods shown.
B Calculated based on average shares outstanding during the period.
C Fees and expenses of any underlying Fidelity Central Funds are not included in the Fund's expense ratio. The Fund indirectly bears its proportionate share of the expenses of any underlying Fidelity Central Funds.
D Amount does not include the portfolio activity of any underlying Fidelity Central Funds.
E Expense ratios reflect operating expenses of the class. Expenses before reductions do not reflect amounts reimbursed by the investment adviser or reductions from brokerage service arrangements or reductions from other expense offset arrangements and do not represent the amount paid by the class during periods when reimbursements or reductions occur. Expenses net of fee waivers reflect expenses after reimbursement by the investment adviser but prior to reductions from brokerage service arrangements or other expense offset arrangements. Expenses net of all reductions represent the net expenses paid by the class.
See accompanying notes which are an integral part of the financial statements.
Annual Report
Notes to Financial Statements
For the period ended January 31, 2014
1. Organization.
Fidelity Stock Selector Large Cap Value Fund (the Fund) is a fund of Fidelity Devonshire Trust (the Trust) and is authorized to issue an unlimited number of shares. The Trust is registered under the Investment Company Act of 1940, as amended (the 1940 Act), as an open-end management investment company organized as a Massachusetts business trust. The Fund offers Class A, Class T, Class C, Stock Selector Large Cap Value and Institutional Class shares, each of which, along with Class B shares, has equal rights as to assets and voting privileges. Class B shares are closed to new accounts and additional purchases, except for exchanges and reinvestments. Each class has exclusive voting rights with respect to matters that affect that class. Class B shares will automatically convert to Class A shares after a holding period of seven years from the initial date of purchase.
2. Investments in Fidelity Central Funds.
The Fund invests in Fidelity Central Funds, which are open-end investment companies generally available only to other investment companies and accounts managed by the investment adviser and its affiliates. The Fund's Schedule of Investments lists each of the Fidelity Central Funds held as of period end, if any, as an investment of the Fund, but does not include the underlying holdings of each Fidelity Central Fund. As an Investing Fund, the Fund indirectly bears its proportionate share of the expenses of the underlying Fidelity Central Funds.
The Money Market Central Funds seek preservation of capital and current income and are managed by Fidelity Investments Money Management, Inc. (FIMM), an affiliate of the investment adviser. Annualized expenses of the Money Market Central Funds as of their most recent shareholder report date are less than .01%.
A complete unaudited list of holdings for each Fidelity Central Fund is available upon request or at the Securities and Exchange Commission (the SEC) website at www.sec.gov. In addition, the financial statements of the Fidelity Central Funds, which are not covered by the Fund's Report of Independent Registered Public Accounting Firm, are available on the SEC website or upon request.
3. Significant Accounting Policies.
The financial statements have been prepared in conformity with accounting principles generally accepted in the United States of America (GAAP), which require management to make certain estimates and assumptions at the date of the financial statements. Actual results could differ from those estimates. Subsequent events, if any, through the date that the financial statements were issued have been evaluated in the preparation of
Annual Report
3. Significant Accounting Policies - continued
the financial statements. The following summarizes the significant accounting policies of the Fund:
Investment Valuation. Investments are valued as of 4:00 p.m. Eastern time on the last calendar day of the period. In accordance with valuation policies and procedures approved by the Board of Trustees (the Board), the Fund attempts to obtain prices from one or more third party pricing vendors or brokers to value its investments. When current market prices, quotations or currency exchange rates are not readily available or reliable, investments will be fair valued in good faith by the Fidelity Management & Research Company (FMR) Fair Value Committee (the Committee), in accordance with procedures adopted by the Board. Factors used in determining fair value vary by investment type and may include market or investment specific events, changes in interest rates and credit quality. The frequency with which these procedures are used cannot be predicted and they may be utilized to a significant extent. The Committee oversees the Fund's valuation policies and procedures and is responsible for approving and reporting to the Board all fair value determinations.
The Fund categorizes the inputs to valuation techniques used to value its investments into a disclosure hierarchy consisting of three levels as shown below:
Level 1 - quoted prices in active markets for identical investments
Level 2 - other significant observable inputs (including quoted prices for similar investments, interest rates, prepayment speeds, etc.)
Level 3 - unobservable inputs (including the Fund's own assumptions based on the best information available)
Valuation techniques used to value the Fund's investments by major category are as follows:
Equity securities, including restricted securities, for which market quotations are readily available, are valued at the last reported sale price or official closing price as reported by a third party pricing vendor on the primary market or exchange on which they are traded and are categorized as Level 1 in the hierarchy. In the event there were no sales during the day or closing prices are not available, securities are valued at the last quoted bid price or may be valued using the last available price and are generally categorized as Level 2 in the hierarchy. For foreign equity securities, when market or security specific events arise, comparisons to the valuation of American Depositary Receipts (ADRs), futures contracts, Exchange-Traded Funds (ETFs) and certain indexes as well as quoted prices for similar securities may be used and would be categorized as Level 2 in the hierarchy. Utilizing these techniques may result in transfers between Level 1 and Level 2. For equity securities, including restricted securities, where observable inputs are
Annual Report
Notes to Financial Statements - continued
3. Significant Accounting Policies - continued
Investment Valuation - continued
limited, assumptions about market activity and risk are used and these securities may be categorized as Level 3 in the hierarchy.
Debt securities, including restricted securities, are valued based on evaluated prices received from third party pricing vendors or from brokers who make markets in such securities. Preferred securities and U.S. government and government agency obligations are valued by pricing vendors who utilize matrix pricing which considers yield or price of bonds of comparable quality, coupon, maturity and type or by broker-supplied prices. When independent prices are unavailable or unreliable, debt securities may be valued utilizing pricing methodologies which consider similar factors that would be used by third party pricing vendors. Debt securities are generally categorized as Level 2 in the hierarchy but may be Level 3 depending on the circumstances.
Futures contracts are valued at the settlement price established each day by the board of trade or exchange on which they are traded and are categorized as Level 1 in the hierarchy. Investments in open-end mutual funds, including the Fidelity Central Funds, are valued at their closing net asset value (NAV) each business day and are categorized as Level 1 in the hierarchy.
Changes in valuation techniques may result in transfers in or out of an assigned level within the disclosure hierarchy. The aggregate value of investments by input level, as of January 31, 2014 is included at the end of the Fund's Schedule of Investments.
Foreign Currency. The Fund may use foreign currency contracts to facilitate transactions in foreign-denominated securities. Gains and losses from these transactions may arise from changes in the value of the foreign currency or if the counterparties do not perform under the contracts' terms.
Foreign-denominated assets, including investment securities, and liabilities are translated into U.S. dollars at the exchange rates at period end. Purchases and sales of investment securities, income and dividends received and expenses denominated in foreign currencies are translated into U.S. dollars at the exchange rate in effect on the transaction date.
The effects of exchange rate fluctuations on investments are included with the net realized and unrealized gain (loss) on investment securities. Other foreign currency transactions resulting in realized and unrealized gain (loss) are disclosed separately.
Investment Transactions and Income. For financial reporting purposes, the Fund's investment holdings and NAV include trades executed through the end of the last business day of the period. The NAV per share for processing shareholder transactions is calculated as of the close of business of the New York Stock Exchange (NYSE), normally
Annual Report
3. Significant Accounting Policies - continued
Investment Transactions and Income - continued
4:00 p.m. Eastern time and includes trades executed through the end of the prior business day. Gains and losses on securities sold are determined on the basis of identified cost and may include proceeds received from litigation. Dividend income is recorded on the ex-dividend date, except for certain dividends from foreign securities where the ex-dividend date may have passed, which are recorded as soon as the Fund is informed of the ex-dividend date. Non-cash dividends included in dividend income, if any, are recorded at the fair market value of the securities received. Distributions received on securities that represent a return of capital or capital gain are recorded as a reduction of cost of investments and/or as a realized gain. Subsequent to ex-dividend date the Fund determines the components of these distributions, based upon receipt of tax filings or other correspondence relating to the underlying investment. Interest income and distributions from the Fidelity Central Funds are accrued as earned. Interest income includes coupon interest and amortization of premium and accretion of discount on debt securities. Investment income is recorded net of foreign taxes withheld where recovery of such taxes is uncertain.
Class Allocations and Expenses. Investment income, realized and unrealized capital gains and losses, common expenses of the Fund, and certain fund-level expense reductions, if any, are allocated daily on a pro-rata basis to each class based on the relative net assets of each class to the total net assets of the Fund. Each class differs with respect to transfer agent and distribution and service plan fees incurred. Certain expense reductions may also differ by class. For the reporting period, the allocated portion of income and expenses to each class as a percent of its average net assets may vary due to the timing of recording these transactions in relation to fluctuating net assets of the classes. Expenses directly attributable to a fund are charged to that fund. Expenses attributable to more than one fund are allocated among the respective funds on the basis of relative net assets or other appropriate methods. Expense estimates are accrued in the period to which they relate and adjustments are made when actual amounts are known.
Income Tax Information and Distributions to Shareholders. Each year, the Fund intends to qualify as a regulated investment company under Subchapter M of the Internal Revenue Code, including distributing substantially all of its taxable income and realized gains. As a result, no provision for U.S. Federal income taxes is required. As of January 31, 2014, the Fund did not have any unrecognized tax benefits in the financial statements; nor is the Fund aware of any tax positions for which it is reasonably possible that the total amounts of unrecognized tax benefits will significantly change in the next twelve months. The Fund files a U.S. federal tax return, in addition to state and local tax returns as required. The Fund's federal income tax returns are subject to examination by the Internal Revenue Service (IRS) for a period of three fiscal years after they are filed.
Annual Report
Notes to Financial Statements - continued
3. Significant Accounting Policies - continued
Income Tax Information and Distributions to Shareholders - continued
State and local tax returns may be subject to examination for an additional fiscal year depending on the jurisdiction. Foreign taxes are provided for based on the Fund's understanding of the tax rules and rates that exist in the foreign markets in which it invests.
Distributions are declared and recorded on the ex-dividend date. Income dividends and capital gain distributions are declared separately for each class. Income and capital gain distributions are determined in accordance with income tax regulations, which may differ from GAAP.
Capital accounts within the financial statements are adjusted for permanent book-tax differences. These adjustments have no impact on net assets or the results of operations. Capital accounts are not adjusted for temporary book-tax differences which will reverse in a subsequent period.
Book-tax differences are primarily due to futures transactions, foreign currency transactions, passive foreign investment companies (PFIC), capital loss carryforwards and losses deferred due to wash sales.
The federal tax cost of investment securities and unrealized appreciation (depreciation) as of period end were as follows:
Gross unrealized appreciation | $ 88,759,455 |
Gross unrealized depreciation | (31,676,236) |
Net unrealized appreciation (depreciation) on securities and other investments | $ 57,083,219 |
|
|
Tax Cost | $ 505,684,050 |
The tax-based components of distributable earnings as of period end were as follows:
Capital loss carryforward | $ (287,150,893) |
Net unrealized appreciation (depreciation) | $ 57,082,305 |
Capital loss carryforwards are only available to offset future capital gains of the Fund to the extent provided by regulations and may be limited. Under the Regulated Investment Company Modernization Act of 2010 (the Act), the Fund is permitted to carry forward capital losses incurred in taxable years beginning after December 22, 2010 for an unlimited period and such capital losses are required to be used prior to any losses that expire.
Annual Report
3. Significant Accounting Policies - continued
Income Tax Information and Distributions to Shareholders - continued
The capital loss carryforward information presented below, including any applicable limitation, is estimated as of fiscal period end and is subject to adjustment.
Fiscal year of expiration |
|
2017 | $ (99,046,054) |
2018 | (188,104,839) |
Total with expiration | $ (287,150,893) |
The tax character of distributions paid was as follows:
| January 31, 2014 | January 31, 2013 |
Ordinary Income | $ 8,810,391 | $ 9,512,706 |
Restricted Securities. The Fund may invest in securities that are subject to legal or contractual restrictions on resale. These securities generally may be resold in transactions exempt from registration or to the public if the securities are registered. Disposal of these securities may involve time-consuming negotiations and expense, and prompt sale at an acceptable price may be difficult. Information regarding restricted securities is included at the end of the Fund's Schedule of Investments.
4. Derivative Instruments.
Risk Exposures and the Use of Derivative Instruments. The Fund's investment objective allows the Fund to enter into various types of derivative contracts, including futures contracts. Derivatives are investments whose value is primarily derived from underlying assets, indices or reference rates and may be transacted on an exchange or over-the-counter (OTC). Derivatives may involve a future commitment to buy or sell a specified asset based on specified terms, to exchange future cash flows at periodic intervals based on a notional principal amount, or for one party to make one or more payments upon the occurrence of specified events in exchange for periodic payments from the other party.
The Fund used derivatives to increase returns and to manage exposure to certain risks as defined below. The success of any strategy involving derivatives depends on analysis of numerous economic factors, and if the strategies for investment do not work as intended, the Fund may not achieve its objectives.
Annual Report
Notes to Financial Statements - continued
4. Derivative Instruments - continued
Risk Exposures and the Use of Derivative Instruments - continued
The Fund's use of derivatives increased or decreased its exposure to the following risk:
Equity Risk | Equity risk relates to the fluctuations in the value of financial instruments as a result of changes in market prices (other than those arising from interest rate risk or foreign exchange risk), whether caused by factors specific to an individual investment, its issuer, or all factors affecting all instruments traded in a market or market segment. |
The Fund is also exposed to additional risks from investing in derivatives, such as liquidity risk and counterparty credit risk. Liquidity risk is the risk that the Fund will be unable to close out the derivative in the open market in a timely manner. Counterparty credit risk is the risk that the counterparty will not be able to fulfill its obligation to the Fund. Counterparty credit risk related to exchange-traded futures contracts may be mitigated by the protection provided by the exchange on which they trade.
Investing in derivatives may involve greater risks than investing in the underlying assets directly and, to varying degrees, may involve risk of loss in excess of any initial investment and collateral received and amounts recognized in the Statement of Assets and Liabilities. In addition, there may be the risk that the change in value of the derivative contract does not correspond to the change in value of the underlying instrument.
Futures Contracts. A futures contract is an agreement between two parties to buy or sell a specified underlying instrument for a fixed price at a specified future date. The Fund used futures contracts to manage its exposure to the stock market.
Upon entering into a futures contract, a fund is required to deposit either cash or securities (initial margin) with a clearing broker in an amount equal to a certain percentage of the face value of the contract. Futures contracts are marked-to-market daily and subsequent daily payments (variation margin) are made or received by a fund depending on the daily fluctuations in the value of the futures contracts and are recorded as unrealized appreciation or (depreciation). This receivable and/or payable, if any, is included in daily variation margin for derivative instruments in the Statement of Assets and Liabilities. Realized gain or (loss) is recorded upon the expiration or closing of a futures contract.
Any open futures contracts at period end are presented in the Schedule of Investments under the caption "Futures Contracts." The underlying face amount at value reflects each contract's exposure to the underlying instrument or index at period end and is representative of volume of activity during the period. Securities deposited to meet initial margin requirements are identified in the Schedule of Investments.
Annual Report
4. Derivative Instruments - continued
Futures Contracts - continued
During the period the Fund recognized net realized gain (loss) of $1,432,461 and a change in net unrealized appreciation (depreciation) of ($477,467) related to its investment in futures contracts. These amounts are included in the Statement of Operations.
5. Purchases and Sales of Investments.
Purchases and sales of securities, other than short-term securities, aggregated $331,992,356 and $368,182,272, respectively.
6. Fees and Other Transactions with Affiliates.
Management Fee. Fidelity Management & Research Company (the investment adviser) and its affiliates provide the Fund with investment management related services for which the Fund pays a monthly management fee. The management fee is the sum of an individual fund fee rate that is based on an annual rate of .30% of the Fund's average net assets and an annualized group fee rate that averaged .25% during the period. The group fee rate is based upon the average net assets of all the mutual funds advised by the investment adviser, including any mutual funds previously advised by the investment adviser that are currently advised by Fidelity SelectCo, LLC, an affiliate of the investment adviser. The group fee rate decreases as assets under management increase and increases as assets under management decrease. In addition, the management fee is subject to a performance adjustment (up to a maximum of ± .20% of the Fund's average net assets over a 36 month performance period). The upward or downward adjustment to the management fee is based on the relative investment performance of Stock Selector Large Cap Value as compared to its benchmark index, the Russell 1000® Value Index, over the same 36 month performance period. For the reporting period, the total annual management fee rate, including the performance adjustment, was .43% of the Fund's average net assets. The performance adjustment included in the management fee rate may be higher or lower than the maximum performance adjustment rate due to the difference between the average net assets for the reporting and performance periods.
Distribution and Service Plan Fees. In accordance with Rule 12b-1 of the 1940 Act, the Fund has adopted separate Distribution and Service Plans for each class of shares. Certain classes pay Fidelity Distributors Corporation (FDC), an affiliate of the investment adviser, separate Distribution and Service Fees, each of which is based on an annual percentage of each class' average net assets. In addition, FDC may pay financial intermediaries for selling shares of the Fund and providing shareholder support services.
Annual Report
Notes to Financial Statements - continued
6. Fees and Other Transactions with Affiliates - continued
Distribution and Service Plan Fees - continued
For the period, the Distribution and Service Fee rates, total fees and amounts retained by FDC were as follows:
| Distribution | Service | Total Fees | Retained |
Class A | -% | .25% | $ 52,892 | $ 3,031 |
Class T | .25% | .25% | 38,660 | 912 |
Class B | .75% | .25% | 16,720 | 12,663 |
Class C | .75% | .25% | 68,955 | 14,236 |
|
|
| $ 177,227 | $ 30,842 |
Sales Load. FDC may receive a front-end sales charge of up to 5.75% for selling Class A shares and 3.50% for selling Class T shares, some of which is paid to financial intermediaries for selling shares of the Fund. Depending on the holding period, FDC may receive contingent deferred sales charges levied on Class A, Class T, Class B, and Class C redemptions. The deferred sales charges range from 5.00% to 1.00% for Class B shares, 1.00% for Class C shares, 1.00% for certain purchases of Class A shares and .25% for certain purchases of Class T shares.
For the period, sales charge amounts retained by FDC were as follows:
| Retained |
Class A | $ 9,148 |
Class T | 2,674 |
Class B* | 2,798 |
Class C* | 2,278 |
| $ 16,898 |
* When Class B and Class C shares are initially sold, FDC pays commissions from its own resources to financial intermediaries through which the sales are made.
Transfer Agent Fees. Fidelity Investments Institutional Operations Company, Inc., (FIIOC), an affiliate of the investment adviser, is the transfer, dividend disbursing and shareholder servicing agent for each class of the Fund. FIIOC receives account fees and asset-based fees that vary according to the account size and type of account of the shareholders of the respective classes of the Fund. FIIOC pays for typesetting, printing and mailing of shareholder reports, except proxy statements.
Annual Report
6. Fees and Other Transactions with Affiliates - continued
Transfer Agent Fees - continued
For the period, transfer agent fees for each class were as follows:
| Amount | % of |
Class A | $ 52,844 | .25 |
Class T | 24,258 | .31 |
Class B | 5,042 | .30 |
Class C | 20,908 | .30 |
Stock Selector Large Cap Value | 1,065,839 | .21 |
Institutional Class | 7,046 | .23 |
| $ 1,175,937 |
|
Accounting and Security Lending Fees. Fidelity Service Company, Inc. (FSC), an affiliate of the investment adviser, maintains the Fund's accounting records. The accounting fee is based on the level of average net assets for each month. Under a separate contract, FSC administers the security lending program. The security lending fee is based on the number and duration of lending transactions.
Brokerage Commissions. The Fund placed a portion of its portfolio transactions with brokerage firms which are affiliates of the investment adviser. Brokerage commissions are included in net realized gain (loss) and change in net unrealized appreciation (depreciation) in the Statement of Operations. The commissions paid to these affiliated firms were $10,422 for the period.
7. Committed Line of Credit.
The Fund participates with other funds managed by the investment adviser or an affiliate in a $4.25 billion credit facility (the "line of credit") to be utilized for temporary or emergency purposes to fund shareholder redemptions or for other short-term liquidity purposes. The Fund has agreed to pay commitment fees on its pro-rata portion of the line of credit, which amounted to $821 and is reflected in Miscellaneous expenses on the Statement of Operations. During the period, there were no borrowings on this line of credit.
8. Security Lending.
The Fund lends portfolio securities through a lending agent from time to time in order to earn additional income. For equity securities, a lending agent is used and may loan securities to certain qualified borrowers, including Fidelity Capital Markets (FCM), a
Annual Report
Notes to Financial Statements - continued
8. Security Lending - continued
broker-dealer affiliated with the Fund. On the settlement date of the loan, the Fund receives collateral (in the form of U.S. Treasury obligations, letters of credit and/or cash) against the loaned securities and maintains collateral in an amount not less than 100% of the market value of the loaned securities during the period of the loan. The market value of the loaned securities is determined at the close of business of the Fund and any additional required collateral is delivered to the Fund on the next business day. If the borrower defaults on its obligation to return the securities loaned because of insolvency or other reasons, the Fund may apply collateral received from the borrower against the obligation. The Fund may experience delays and costs in recovering the securities loaned. Any cash collateral received is invested the Fidelity Securities Lending Cash Central Fund. The value of loaned securities and cash collateral at period end are disclosed on the Fund's Statement of Assets and Liabilities. The value of securities loaned to FCM at period end was $320,276. Security lending income represents the income earned on investing cash collateral, less rebates paid to borrowers and any lending agent fees associated with the loan, plus any premium payments received for lending certain types of securities. Security lending income is presented in the Statement of Operations as a component of income from Fidelity Central Funds. Total security lending income during the period amounted to $47,322, including $2,017 from securities loaned to FCM.
9. Expense Reductions.
Commissions paid to certain brokers with whom the investment adviser, or its affiliates, places trades on behalf of the Fund include an amount in addition to trade execution, which may be rebated back to the Fund to offset certain expenses. This amount totaled $13,415 for the period.
In addition, the investment adviser reimbursed a portion of the Fund's operating expenses during the period in the amount of $8,776.
10. Distributions to Shareholders.
Distributions to shareholders of each class were as follows:
Years ended January 31, | 2014 | 2013 |
From net investment income |
|
|
Class A | $ 211,924 | $ 304,000 |
Class T | 63,275 | 93,858 |
Class B | 3,263 | 16,188 |
Class C | 27,297 | 63,927 |
Stock Selector Large Cap Value | 6,677,131 | 8,993,963 |
Institutional Class | 45,623 | 40,770 |
Total | $ 7,028,513 | $ 9,512,706 |
Annual Report
10. Distributions to Shareholders - continued
Years ended January 31, | 2014 | 2013 |
From net realized gain |
|
|
Class A | $ 67,665 | $ - |
Class T | 26,666 | - |
Class B | 5,288 | - |
Class C | 24,673 | - |
Stock Selector Large Cap Value | 1,646,206 | - |
Institutional Class | 11,380 | - |
Total | $ 1,781,878 | $ - |
11. Share Transactions.
Transactions for each class of shares were as follows:
| Shares | Dollars | ||
Years ended January 31, | 2014 | 2013 | 2014 | 2013 |
Class A |
|
|
|
|
Shares sold | 453,976 | 251,269 | $ 6,296,444 | $ 2,848,724 |
Reinvestment of distributions | 17,878 | 24,461 | 258,884 | 281,542 |
Shares redeemed | (493,396) | (573,384) | (7,077,208) | (6,434,025) |
Net increase (decrease) | (21,542) | (297,654) | $ (521,880) | $ (3,303,759) |
Class T |
|
|
|
|
Shares sold | 162,162 | 131,721 | $ 2,245,109 | $ 1,501,274 |
Reinvestment of distributions | 6,114 | 8,058 | 88,742 | 92,826 |
Shares redeemed | (134,046) | (136,167) | (1,877,963) | (1,544,492) |
Net increase (decrease) | 34,230 | 3,612 | $ 455,888 | $ 49,608 |
Class B |
|
|
|
|
Shares sold | 3,348 | 1,157 | $ 45,970 | $ 13,142 |
Reinvestment of distributions | 509 | 1,236 | 7,427 | 14,255 |
Shares redeemed | (25,299) | (39,897) | (347,355) | (452,422) |
Net increase (decrease) | (21,442) | (37,504) | $ (293,958) | $ (425,025) |
Class C |
|
|
|
|
Shares sold | 146,694 | 162,948 | $ 2,029,290 | $ 1,812,867 |
Reinvestment of distributions | 3,139 | 4,869 | 45,227 | 55,503 |
Shares redeemed | (88,666) | (162,163) | (1,208,921) | (1,799,733) |
Net increase (decrease) | 61,167 | 5,654 | $ 865,596 | $ 68,637 |
Annual Report
Notes to Financial Statements - continued
11. Share Transactions - continued
| Shares | Dollars | ||
Years ended January 31, | 2014 | 2013 | 2014 | 2013 |
Stock Selector Large Cap Value |
|
|
|
|
Shares sold | 7,167,684 | 3,974,459 | $ 100,838,739 | $ 45,488,310 |
Reinvestment of distributions | 556,371 | 757,439 | 8,100,157 | 8,771,144 |
Shares redeemed | (9,956,522) | (12,329,354) | (139,235,813) | (140,694,347) |
Net increase (decrease) | (2,232,467) | (7,597,456) | $ (30,296,917) | $ (86,434,893) |
Institutional Class |
|
|
|
|
Shares sold | 206,722 | 54,716 | $ 2,877,195 | $ 619,947 |
Reinvestment of distributions | 3,795 | 3,536 | 55,110 | 40,770 |
Shares redeemed | (107,442) | (39,612) | (1,516,961) | (460,078) |
Net increase (decrease) | 103,075 | 18,640 | $ 1,415,344 | $ 200,639 |
12. Other.
The Fund's organizational documents provide former and current trustees and officers with a limited indemnification against liabilities arising in connection with the performance of their duties to the Fund. In the normal course of business, the Fund may also enter into contracts that provide general indemnifications. The Fund's maximum exposure under these arrangements is unknown as this would be dependent on future claims that may be made against the Fund. The risk of material loss from such claims is considered remote.
Annual Report
Report of Independent Registered Public Accounting Firm
To the Trustees of Fidelity Devonshire Trust and the Shareholders of Fidelity Stock Selector Large Cap Value Fund:
In our opinion, the accompanying statement of assets and liabilities, including the schedule of investments, and the related statements of operations and of changes in net assets and the financial highlights present fairly, in all material respects, the financial position of Fidelity Stock Selector Large Cap Value Fund (a fund of Fidelity Devonshire Trust) at January 31, 2014, the results of its operations for the year then ended, the changes in its net assets for each of the two years in the period then ended and the financial highlights for each of the five years in the period then ended, in conformity with accounting principles generally accepted in the United States of America. These financial statements and financial highlights (hereafter referred to as "financial statements") are the responsibility of the Fidelity Stock Selector Large Cap Value Fund's management. Our responsibility is to express an opinion on these financial statements based on our audits. We conducted our audits of these financial statements in accordance with the standards of the Public Company Accounting Oversight Board (United States). Those standards require that we plan and perform the audit to obtain reasonable assurance about whether the financial statements are free of material misstatement. An audit includes examining, on a test basis, evidence supporting the amounts and disclosures in the financial statements, assessing the accounting principles used and significant estimates made by management, and evaluating the overall financial statement presentation. We believe that our audits, which included confirmation of securities at January 31, 2014 by correspondence with the custodian and brokers, provide a reasonable basis for our opinion.
PricewaterhouseCoopers LLP
Boston, Massachusetts
March 14, 2014
Annual Report
Trustees and Officers
The Trustees, Members of the Advisory Board, and officers of the trust and fund, as applicable, are listed below. The Board of Trustees governs the fund and is responsible for protecting the interests of shareholders. The Trustees are experienced executives who meet periodically throughout the year to oversee the fund's activities, review contractual arrangements with companies that provide services to the fund, oversee management of the risks associated with such activities and contractual arrangements, and review the fund's performance. Except for James C. Curvey, Ned C. Lautenbach, and William S. Stavropoulos, each of the Trustees oversees 173 funds. Mr. Curvey oversees 396 funds. Mr. Lautenbach and Mr. Stavropoulos each oversees 247 funds.
The Trustees hold office without limit in time except that (a) any Trustee may resign; (b) any Trustee may be removed by written instrument, signed by at least two-thirds of the number of Trustees prior to such removal; (c) any Trustee who requests to be retired or who has become incapacitated by illness or injury may be retired by written instrument signed by a majority of the other Trustees; and (d) any Trustee may be removed at any special meeting of shareholders by a two-thirds vote of the outstanding voting securities of the trust. Each Trustee who is not an interested person (as defined in the 1940 Act) of the trust and the fund (Independent Trustee), shall retire not later than the last day of the calendar year in which his or her 75th birthday occurs. The Independent Trustees may waive this mandatory retirement age policy with respect to individual Trustees. The officers and Advisory Board Member hold office without limit in time, except that any officer and Advisory Board Member may resign or may be removed by a vote of a majority of the Trustees at any regular meeting or any special meeting of the Trustees. Except as indicated, each individual has held the office shown or other offices in the same company for the past five years.
Experience, Skills, Attributes, and Qualifications of the Fund's Trustees. The Governance and Nominating Committee has adopted a statement of policy that describes the experience, qualifications, attributes, and skills that are necessary and desirable for potential Independent Trustee candidates (Statement of Policy). The Board believes that each Trustee satisfied at the time he or she was initially elected or appointed a Trustee, and continues to satisfy, the standards contemplated by the Statement of Policy. The Governance and Nominating Committee also engages professional search firms to help identify potential Independent Trustee candidates who have the experience, qualifications, attributes, and skills consistent with the Statement of Policy. From time to time, additional criteria based on the composition and skills of the current Independent Trustees, as well as experience or skills that may be appropriate in light of future changes to board composition, business conditions, and regulatory or other developments, have also been considered by the professional search firms and the Governance and Nominating Committee. In addition, the Board takes into account the Trustees' commitment and participation in Board and committee meetings, as well as their leadership of standing and ad hoc committees throughout their tenure.
Annual Report
Trustees and Officers - continued
In determining that a particular Trustee was and continues to be qualified to serve as a Trustee, the Board has considered a variety of criteria, none of which, in isolation, was controlling. The Board believes that, collectively, the Trustees have balanced and diverse experience, qualifications, attributes, and skills, which allow the Board to operate effectively in governing the fund and protecting the interests of shareholders. Information about the specific experience, skills, attributes, and qualifications of each Trustee, which in each case led to the Board's conclusion that the Trustee should serve (or continue to serve) as a trustee of the fund, is provided below.
Board Structure and Oversight Function. James C. Curvey is an interested person (as defined in the 1940 Act) and currently serves as Chairman. The Trustees have determined that an interested Chairman is appropriate and benefits shareholders because an interested Chairman has a personal and professional stake in the quality and continuity of services provided to the fund. Independent Trustees exercise their informed business judgment to appoint an individual of their choosing to serve as Chairman, regardless of whether the Trustee happens to be independent or a member of management. The Independent Trustees have determined that they can act independently and effectively without having an Independent Trustee serve as Chairman and that a key structural component for assuring that they are in a position to do so is for the Independent Trustees to constitute a substantial majority for the Board. The Independent Trustees also regularly meet in executive session. Ned C. Lautenbach serves as Chairman of the Independent Trustees and as such (i) acts as a liaison between the Independent Trustees and management with respect to matters important to the Independent Trustees and (ii) with management prepares agendas for Board meetings.
Fidelity funds are overseen by different Boards of Trustees. The fund's Board oversees Fidelity's equity and high income funds and another Board oversees Fidelity's investment-grade bond, money market, and asset allocation funds. The asset allocation funds may invest in Fidelity funds overseen by the fund's Board. The use of separate Boards, each with its own committee structure, allows the Trustees of each group of Fidelity funds to focus on the unique issues of the funds they oversee, including common research, investment, and operational issues. On occasion, the separate Boards establish joint committees to address issues of overlapping consequences for the Fidelity funds overseen by each Board.
The Trustees operate using a system of committees to facilitate the timely and efficient consideration of all matters of importance to the Trustees, the fund, and fund shareholders and to facilitate compliance with legal and regulatory requirements and oversight of the fund's activities and associated risks. The Board, acting through its committees, has charged FMR and its affiliates with (i) identifying events or circumstances the occurrence of which could have demonstrably adverse effects on the fund's business and/or reputation; (ii) implementing processes and controls to lessen the possibility that such events or circumstances occur or to mitigate the effects of such events or circumstances if they do occur; and (iii) creating and maintaining a system designed to evaluate continuously business and market conditions in order to facilitate the identification and implementation processes described in (i) and (ii) above. Because the day-to-day operations and activities of the fund are carried out by or through FMR, its affiliates and other service providers, the fund's exposure to risks is mitigated but not eliminated by the processes overseen by the Trustees. While each of the Board's committees has responsibility for overseeing different aspects of the fund's activities, oversight is exercised primarily through the Operations, Audit, and Compliance Committees. In addition, the Independent Trustees have worked with FMR to enhance the Board's oversight of investment and financial risks, legal and regulatory risks, technology risks, and operational risks, including the development of additional risk reporting to the Board. For example, a working group comprised of Independent Trustees and FMR has worked and continues to work to review the Fidelity funds' valuation-related activities, reporting and risk management. Appropriate personnel, including but not limited to the fund's Chief Compliance Officer (CCO), FMR's internal auditor, the independent accountants, the fund's Treasurer and portfolio management personnel, make periodic reports to the Board's committees, as appropriate, including an annual review of FMR's risk management program for the Fidelity funds. The responsibilities of each standing committee, including their oversight responsibilities, are described further under "Standing Committees of the Fund's Trustees."
Annual Report
The fund's Statement of Additional Information (SAI) includes more information about the Trustees. To request a free copy call 1-877-208-0098.
Interested Trustees*:
Correspondence intended for each Trustee who is an interested person may be sent to Fidelity Investments, 245 Summer Street, Boston, Massachusetts 02210.
Name, Year of Birth; Principal Occupations and Other Relevant Experience+ | |
James C. Curvey (1935) | |
Year of Election or Appointment: 2007 Trustee Chairman of the Board of Trustees | |
| Mr. Curvey also serves as Trustee of other Fidelity funds. Mr. Curvey is a Director of Fidelity Investments Money Management, Inc. (2009-present), Director of Fidelity Research & Analysis Co. (2009-present) and Director of FMR and FMR Co., Inc. (2007-present). Mr. Curvey is also Vice Chairman (2007-present) and Director of FMR LLC. In addition, Mr. Curvey serves as an Overseer for the Boston Symphony Orchestra and a member of the Trustees of Villanova University. Previously, Mr. Curvey was the Vice Chairman (2006-2007) and Director (2000-2007) of FMR Corp. |
Charles S. Morrison (1960) | |
Year of Election or Appointment: 2014 Trustee | |
| Mr. Morrison also serves as Trustee or Vice President of other funds. He serves as President, Asset Management (2014-present) and is an employee of Fidelity Investments. Previously, Mr. Morrison served as President, Fixed Income (2011-2014), Vice President of Fidelity's Money Market Funds (2005-2009), President, Money Market Group Leader of FMR (2009), and Senior Vice President, Money Market Group of FMR (2004-2009). Mr. Morrison also served as Vice President of Fidelity's Bond Funds (2002-2005), certain Balanced Funds (2002-2005), and certain Asset Allocation Funds (2002-2007), and as Senior Vice President (2002-2005) of Fidelity's Bond Division. |
* Trustees have been determined to be "Interested Trustee" by virtue of, among other things, their affiliation with the trust or various entities under common control with FMR.
+ The information above includes each Trustee's principal occupation during the last five years and other information relating to the experience, attributes, and skills relevant to each Trustee's qualifications to serve as a Trustee, which led to the conclusion that each Trustee should serve as a Trustee for the fund.
Annual Report
Independent Trustees:
Correspondence intended for each Independent Trustee (that is, the Trustees other than the Interested Trustees) may be sent to Fidelity Investments, P.O. Box 55235, Boston, Massachusetts 02205-5235.
Name, Year of Birth; Principal Occupations and Other Relevant Experience+ | |
Dennis J. Dirks (1948) | |
Year of Election or Appointment: 2005 Trustee | |
| Mr. Dirks also serves as Trustee of other Fidelity funds. Prior to his retirement in May 2003, Mr. Dirks was Chief Operating Officer and a member of the Board of The Depository Trust & Clearing Corporation (DTCC). He also served as President, Chief Operating Officer, and Board member of The Depository Trust Company (DTC) and President and Board member of the National Securities Clearing Corporation (NSCC). In addition, Mr. Dirks served as Chief Executive Officer and Board member of the Government Securities Clearing Corporation, Chief Executive Officer and Board member of the Mortgage-Backed Securities Clearing Corporation, as a Trustee and a member of the Finance Committee of Manhattan College (2005-2008), and as a Trustee and a member of the Finance Committee of AHRC of Nassau County (2006-2008). Mr. Dirks is a member of the Independent Directors Council (IDC) Governing Council (2010-present) and Board of Directors for The Brookville Center for Children's Services, Inc. (2009-present). |
Alan J. Lacy (1953) | |
Year of Election or Appointment: 2008 Trustee | |
| Mr. Lacy also serves as Trustee of other Fidelity funds. Mr. Lacy serves as Senior Adviser (2007-present) of Oak Hill Capital Partners, L.P. (private equity). Mr. Lacy also served as Chief Executive Officer (2000-2005) and Vice Chairman (2005-2006) of Sears Holdings Corporation and Sears, Roebuck and Co. (retail). In addition, Mr. Lacy serves as a member of the Board of Directors of Dave & Buster's Entertainment, Inc. (restaurant and entertainment complexes, 2010-present), Earth Fare, Inc. (retail grocery, 2012-present), The Hillman Companies, Inc. (hardware wholesalers, 2010-present), and Bristol-Myers Squibb Company (global pharmaceuticals, 2008-present). Mr. Lacy is a member of the Board of Trustees of The National Parks Conservation Association (2006-present). Previously, Mr. Lacy served as Chairman of the Board of Trustees of the National Parks Conservation Association (2008-2011) and as a member of the Board of Directors for the Western Union Company (global money transfer, 2006-2011). |
Ned C. Lautenbach (1944) | |
Year of Election or Appointment: 2000 Trustee Chairman of the Independent Trustees | |
| Mr. Lautenbach also serves as Trustee of other Fidelity funds. Mr. Lautenbach currently serves as the Lead Director of the Eaton Corporation Board of Directors (diversified industrial, 1997-present). Mr. Lautenbach is Chairman of the Board of Directors of the Philharmonic Center for the Arts in Naples, Florida (2012-present) and a member of the Council on Foreign Relations (1994-present). Previously, Mr. Lautenbach was a Partner/Advisory Partner at Clayton, Dubilier & Rice, LLC (private equity investment, 1998-2010), as well as a Director of Sony Corporation (2006-2007). |
Joseph Mauriello (1944) | |
Year of Election or Appointment: 2008 Trustee | |
| Mr. Mauriello also serves as Trustee of other Fidelity funds. Prior to his retirement in January 2006, Mr. Mauriello served in numerous senior management positions including Deputy Chairman and Chief Operating Officer (2004-2005), and Vice Chairman of Financial Services (2002-2004) of KPMG LLP US (professional services, 1965-2005). Mr. Mauriello currently serves as a member of the Board of Directors of XL Group plc. (global insurance and re-insurance, 2006-present). Previously, Mr. Mauriello served as a Director of the Hamilton Funds of the Bank of New York (2006-2007) and of Arcadia Resources Inc. (health care services and products, 2007-2012). |
Robert W. Selander (1950) | |
Year of Election or Appointment: 2011 Trustee | |
| Mr. Selander also serves as Trustee of other Fidelity funds. Previously, Mr. Selander served as a Member of the Advisory Board of other Fidelity funds (2011), and Executive Vice Chairman (2010), Chief Executive Officer (2009-2010), and President and Chief Executive Officer (1997-2009) of Mastercard, Inc. |
Cornelia M. Small (1944) | |
Year of Election or Appointment: 2005 Trustee | |
| Ms. Small also serves as Trustee of other Fidelity funds. Ms. Small is a member of the Board of Directors (2009-present) and Chair of the Investment Committee (2010-present) of the Teagle Foundation. Ms. Small also serves on the Investment Committee of the Berkshire Taconic Community Foundation (2008-present). Previously, Ms. Small served as Chairperson (2002-2008) and a member of the Investment Committee and Chairperson (2008-2012) and a member of the Board of Trustees of Smith College. In addition, Ms. Small served as Chief Investment Officer, Director of Global Equity Investments, and a member of the Board of Directors of Scudder, Stevens & Clark and Scudder Kemper Investments. |
William S. Stavropoulos (1939) | |
Year of Election or Appointment: 2002 Trustee Vice Chairman of the Independent Trustees | |
| Mr. Stavropoulos also serves as Trustee of other Fidelity funds. Mr. Stavropoulos serves as President and Founder of the Michigan Baseball Foundation, the Great Lakes Loons (2007-present). Mr. Stavropoulos is Chairman Emeritus of the Board of Directors of The Dow Chemical Company, where he previously served in numerous senior management positions, including President, CEO (1995-2000; 2002-2004), Chairman of the Executive Committee (2000-2006), and as a member of the Board of Directors (1990-2006). Currently, Mr. Stavropoulos is Chairman of the Board of Directors of Univar Inc. (global distributor of commodity and specialty chemicals), a Director of Teradata Corporation (data warehousing and technology solutions), and Maersk Inc. (industrial conglomerate), and a member of the Advisory Board for Metalmark Capital LLC (private equity investment, 2005-present). Mr. Stavropoulos is an operating advisor to Clayton, Dubilier & Rice, LLC (private equity investment). In addition, Mr. Stavropoulos is a member of the University of Notre Dame Advisory Council for the College of Science, a Trustee of the Rollin L. Gerstacker Foundation, and a Director of the Naples Philharmonic Center for the Arts. Previously, Mr. Stavropoulos served as a Director of Chemical Financial Corporation (bank holding company, 1993-2012) and Tyco International, Ltd. (multinational manufacturing and services, 2007-2012). |
David M. Thomas (1949) | |
Year of Election or Appointment: 2008 Trustee | |
| Mr. Thomas also serves as Trustee of other Fidelity funds. Mr. Thomas serves as Non-Executive Chairman of the Board of Directors of Fortune Brands Home and Security (home and security products, 2011-present), and as a member of the Board of Directors of Interpublic Group of Companies, Inc. (marketing communication, 2004-present). Previously, Mr. Thomas served as Executive Chairman (2005-2006) and Chairman and Chief Executive Officer (2000-2005) of IMS Health, Inc. (pharmaceutical and healthcare information solutions), and a Director of Fortune Brands, Inc. (consumer products, 2000-2011). |
+ The information above includes each Trustee's principal occupation during the last five years and other information relating to the experience, attributes, and skills relevant to each Trustee's qualifications to serve as a Trustee, which led to the conclusion that each Trustee should serve as a Trustee for the fund.
Advisory Board Member and Officers:
Correspondence intended for each officer and Peter S. Lynch may be sent to Fidelity Investments, 245 Summer Street, Boston, Massachusetts 02210. Officers appear below in alphabetical order.
Name, Year of Birth; Principal Occupation | |
Peter S. Lynch (1944) | |
Year of Election or Appointment: 2003 Member of the Advisory Board | |
| Mr. Lynch also serves as Member of the Advisory Board of other Fidelity funds. Mr. Lynch is Vice Chairman and a Director of FMR and FMR Co., Inc. In addition, Mr. Lynch serves as a Trustee of Boston College and as the Chairman of the Inner-City Scholarship Fund. Previously, Mr. Lynch served on the Special Olympics International Board of Directors (1997-2006). |
Elizabeth Paige Baumann (1968) | |
Year of Election or Appointment: 2012 Anti-Money Laundering (AML) Officer | |
| Ms. Baumann also serves as AML Officer of other funds. She is Chief AML Officer of FMR LLC (2012-present) and is an employee of Fidelity Investments. Previously, Ms. Baumann served as Vice President and Deputy Anti-Money Laundering Officer (2007-2012). |
William C. Coffey (1969) | |
Year of Election or Appointment: 2009 Assistant Secretary | |
| Mr. Coffey also serves as Assistant Secretary of other funds. He is Senior Vice President and Deputy General Counsel of FMR LLC (2010-present), and is an employee of Fidelity Investments. Previously, Mr. Coffey served as Vice President and Associate General Counsel of FMR LLC (2005-2009). |
Jonathan Davis (1968) | |
Year of Election or Appointment: 2010 Assistant Treasurer | |
| Mr. Davis also serves as Assistant Treasurer of other funds. Mr. Davis is an employee of Fidelity Investments. Previously, Mr. Davis served as Vice President and Associate General Counsel of FMR LLC (2003-2010). |
Adrien E. Deberghes (1967) | |
Year of Election or Appointment: 2008 Deputy Treasurer | |
| Mr. Deberghes also serves as an officer of other funds. He is an employee of Fidelity Investments (2008-present). Prior to joining Fidelity Investments, Mr. Deberghes was Senior Vice President of Mutual Fund Administration at State Street Corporation (2007-2008), Senior Director of Mutual Fund Administration at Investors Bank & Trust (2005-2007), and Director of Finance for Dunkin' Brands (2000-2005). |
Stephanie J. Dorsey (1969) | |
Year of Election or Appointment: 2010 Assistant Treasurer | |
| Ms. Dorsey also serves as an officer of other funds. She is an employee of Fidelity Investments (2008-present) and has served in other fund officer roles. Prior to joining Fidelity Investments, Ms. Dorsey served as Treasurer (2004-2008) of the JPMorgan Mutual Funds and Vice President (2004-2008) of JPMorgan Chase Bank. |
Scott C. Goebel (1968) | |
Year of Election or Appointment: 2008 Secretary and Chief Legal Officer (CLO) | |
| Mr. Goebel serves as Secretary and CLO of other funds. Mr. Goebel also serves as Secretary of Fidelity SelectCo, LLC (2013-present), Fidelity Investments Money Management, Inc. (FIMM) (2010-present) and Fidelity Research and Analysis Company (FRAC) (2010-present); General Counsel, Secretary, and Senior Vice President of FMR (2008-present) and FMR Co., Inc. (2008-present); Chief Legal Officer of Fidelity Management & Research (Hong Kong) Limited (2008-present); and Assistant Secretary of Fidelity Management & Research (Japan) Inc. (2008-present) and Fidelity Management & Research (U.K.) Inc. (2008-present). Previously, Mr. Goebel served as Secretary and CLO of other Fidelity funds (2008-2013), Assistant Secretary of FIMM (2008-2010), FRAC (2008-2010), and certain funds (2007-2008); and as Vice President and Secretary of Fidelity Distributors Corporation (FDC) (2005-2007). Mr. Goebel has been employed by FMR LLC or an affiliate since 2001. |
Joseph A. Hanlon (1968) | |
Year of Election or Appointment: 2012 Chief Compliance Officer | |
| Mr. Hanlon also serves as Chief Compliance Officer of other funds. Mr. Hanlon serves as Compliance Officer of FMR, FMR Co., Inc., Fidelity Investments Money Management, Inc. (FIMM), Fidelity Research and Analysis Company (FRAC), and Fidelity Management & Research (Hong Kong) (2009-present), as Senior Vice President of the Fidelity Asset Management Division (2009-present), and is an employee of Fidelity Investments. Previously, Mr. Hanlon served as Compliance Officer of Fidelity Management & Research (Japan) Inc. (2009-2013), Strategic Advisers, Inc. (2009-2013), and Fidelity Management & Research (U.K.) Inc. (2009-2013). |
Thomas C. Hense (1964) | |
Year of Election or Appointment: 2008/2010 Vice President | |
| Mr. Hense also serves as Vice President of other funds (High Income (2008), Small Cap (2008), and Value (2010) funds). Previously, Mr. Hense served as a portfolio manager for Fidelity's Institutional Money Management Group (Pyramis) (2003-2008). |
Brian B. Hogan (1964) | |
Year of Election or Appointment: 2009 Vice President | |
| Mr. Hogan also serves as Trustee or Vice President of other funds. Mr. Hogan serves as President of FMR's Equity Division (2009-present). Previously, Mr. Hogan served as Senior Vice President, Equity Research of FMR (2006-2009) and as a portfolio manager. |
Chris Maher (1972) | |
Year of Election or Appointment: 2013 Assistant Treasurer | |
| Mr. Maher serves as Assistant Treasurer of other funds. Mr. Maher is Vice President of Valuation Oversight and is an employee of Fidelity Investments. Previously, Mr. Maher served as Vice President of Asset Management Compliance (2013), Vice President of FMR's Program Management Group (2010-2013), and Vice President of Valuation Oversight (2008-2010). |
Christine Reynolds (1958) | |
Year of Election or Appointment: 2008 Chief Financial Officer | |
| Ms. Reynolds also serves as Chief Financial Officer of other funds. Ms. Reynolds became President of Fidelity Pricing and Cash Management Services (FPCMS) in August 2008. Ms. Reynolds served as Chief Operating Officer of FPCMS (2007-2008). Previously, Ms. Reynolds served as President, Treasurer, and Anti-Money Laundering officer of the Fidelity funds (2004-2007). |
Kenneth B. Robins (1969) | |
Year of Election or Appointment: 2008 President and Treasurer | |
| Mr. Robins also serves as an officer of other funds. Mr. Robins serves as Executive Vice President of Fidelity Investments Money Management, Inc. (FIMM) (2013-present) and is an employee of Fidelity Investments (2004-present). Previously, Mr. Robins served in other fund officer roles. |
Gary W. Ryan (1958) | |
Year of Election or Appointment: 2005 Assistant Treasurer | |
| Mr. Ryan also serves as Assistant Treasurer of other funds. Mr. Ryan is an employee of Fidelity Investments and has served in other fund officer roles. Previously, Mr. Ryan served as Vice President of Fund Reporting in Fidelity Pricing and Cash Management Services (FPCMS) (1999-2005). |
Stephen Sadoski (1971) | |
Year of Election or Appointment: 2012 Deputy Treasurer | |
| Mr. Sadoski also serves as Deputy Treasurer of other funds. He is an employee of Fidelity Investments (2012-present) and has served in another fund officer role. Prior to joining Fidelity Investments, Mr. Sadoski served as an assistant chief accountant in the Division of Investment Management of the Securities and Exchange Commission (SEC) (2009-2012) and as a senior manager at Deloitte & Touche LLP (1997-2009). |
Stacie M. Smith (1974) | |
Year of Election or Appointment: 2013 Deputy Treasurer | |
| Ms. Smith also serves as an officer of other funds. She is an employee of Fidelity Investments (2009-present) and has served in other fund officer roles. Prior to joining Fidelity Investments, Ms. Smith served as Senior Audit Manager of Ernst & Young LLP (1996-2009). |
Renee Stagnone (1975) | |
Year of Election or Appointment: 2013 Deputy Treasurer | |
| Ms. Stagnone also serves as Deputy Treasurer of other funds. Ms. Stagnone is an employee of Fidelity Investments. |
Joseph F. Zambello (1957) | |
Year of Election or Appointment: 2011 Deputy Treasurer | |
| Mr. Zambello also serves as Deputy Treasurer of other funds. Mr. Zambello is an employee of Fidelity Investments. Previously, Mr. Zambello served as Vice President of FMR's Program Management Group (2009-2011) and Vice President of the Transfer Agent Oversight Group (2005-2009). |
Annual Report
Distributions (Unaudited)
Institutional Class designates 100% of the dividends distributed during the fiscal year as qualifying for the dividends-received deduction for corporate shareholders.
Institutional Class designates 100% of the dividends distributed during the fiscal year as amounts which may be taken into account as a dividend for purposes of the maximum rate under section 1(h)(11) of the Internal Revenue Code.
The fund will notify shareholders in January 2015 of amounts for use in preparing 2014 income tax returns.
Annual Report
Investment Adviser
Fidelity Management & Research Company
Boston, MA
Investment Sub-Advisers
FMR Co., Inc.
Fidelity Management & Research
(U.K.) Inc.
Fidelity Management & Research
(Hong Kong) Limited
Fidelity Management & Research
(Japan) Inc.
General Distributor
Fidelity Distributors Corporation
Smithfield, RI
Transfer and Service Agents
Fidelity Investments Institutional Operations Company, Inc.
Boston, MA
Fidelity Service Company, Inc.
Boston, MA
Custodian
Citibank, N.A.
New York, NY
(Fidelity Investment logo)(registered trademark)
ALCVI-UANN-0314
1.838383.104
Fidelity®
Stock Selector Large Cap Value
Fund
Annual Report
January 31, 2014
(Fidelity Cover Art)
Contents
Performance | How the fund has done over time. | |
Management's Discussion of Fund Performance | The Portfolio Manager's review of fund performance and strategy. | |
Shareholder Expense Example | An example of shareholder expenses. | |
Investment Changes | A summary of major shifts in the fund's investments over the past six months. | |
Investments | A complete list of the fund's investments with their market values. | |
Financial Statements | Statements of assets and liabilities, operations, and changes in net assets, as well as financial highlights. | |
Notes | Notes to the financial statements. | |
Report of Independent Registered Public Accounting Firm |
| |
Trustees and Officers |
| |
Distributions |
|
To view a fund's proxy voting guidelines and proxy voting record for the 12-month period ended June 30, visit http://www.fidelity.com/proxyvotingresults or visit the Securities and Exchange Commission's (SEC) web site at http://www.sec.gov. You may also call 1-800-544-8544 to request a free copy of the proxy voting guidelines.
Standard & Poor's, S&P and S&P 500 are registered service marks of The McGraw-Hill Companies, Inc. and have been licensed for use by Fidelity Distributors Corporation.
Other third-party marks appearing herein are the property of their respective owners.
All other marks appearing herein are registered or unregistered trademarks or service marks of FMR LLC or an affiliated company. © 2014 FMR LLC. All rights reserved.
This report and the financial statements contained herein are submitted for the general information of the shareholders of the fund. This report is not authorized for distribution to prospective investors in the fund unless preceded or accompanied by an effective prospectus.
A fund files its complete schedule of portfolio holdings with the SEC for the first and third quarters of each fiscal year on Form N-Q. Forms N-Q are available on the SEC's web site at http://www.sec.gov. A fund's Forms N-Q may be reviewed and copied at the SEC's Public Reference Room in Washington, DC. Information regarding the operation of the SEC's Public Reference Room may be obtained by calling 1-800-SEC-0330. For a complete list of a fund's portfolio holdings, view the most recent holdings listing, semiannual report, or annual report on Fidelity's web site at http://www.fidelity.com, http://www.advisor.fidelity.com, or http://www.401k.com, as applicable.
NOT FDIC INSURED • MAY LOSE VALUE • NO BANK GUARANTEE
Neither the fund nor Fidelity Distributors Corporation is a bank.
Annual Report
Performance: The Bottom Line
Average annual total return reflects the change in the value of an investment, assuming reinvestment of the class' distributions from dividend income and capital gains (the profits earned upon the sale of securities that have grown in value, if any) and assuming a constant rate of performance each year. The $10,000 table and the fund's returns do not reflect the deduction of taxes that a shareholder would pay on fund distributions or the redemption of fund shares. During periods of reimbursement by Fidelity, a fund's total return will be greater than it would be had the reimbursement not occurred. How a fund did yesterday is no guarantee of how it will do tomorrow.
Average Annual Total Returns
Periods ended January 31, 2014 | Past 1 | Past 5 | Past 10 |
Fidelity® Stock Selector Large Cap Value Fund | 20.31% | 16.31% | 5.96% |
$10,000 Over 10 Years
Let's say hypothetically that $10,000 was invested in Fidelity® Stock Selector Large Cap Value Fund, a class of the fund, on January 31, 2004. The chart shows how the value of your investment would have changed, and also shows how the Russell 1000® Value Index performed over the same period.
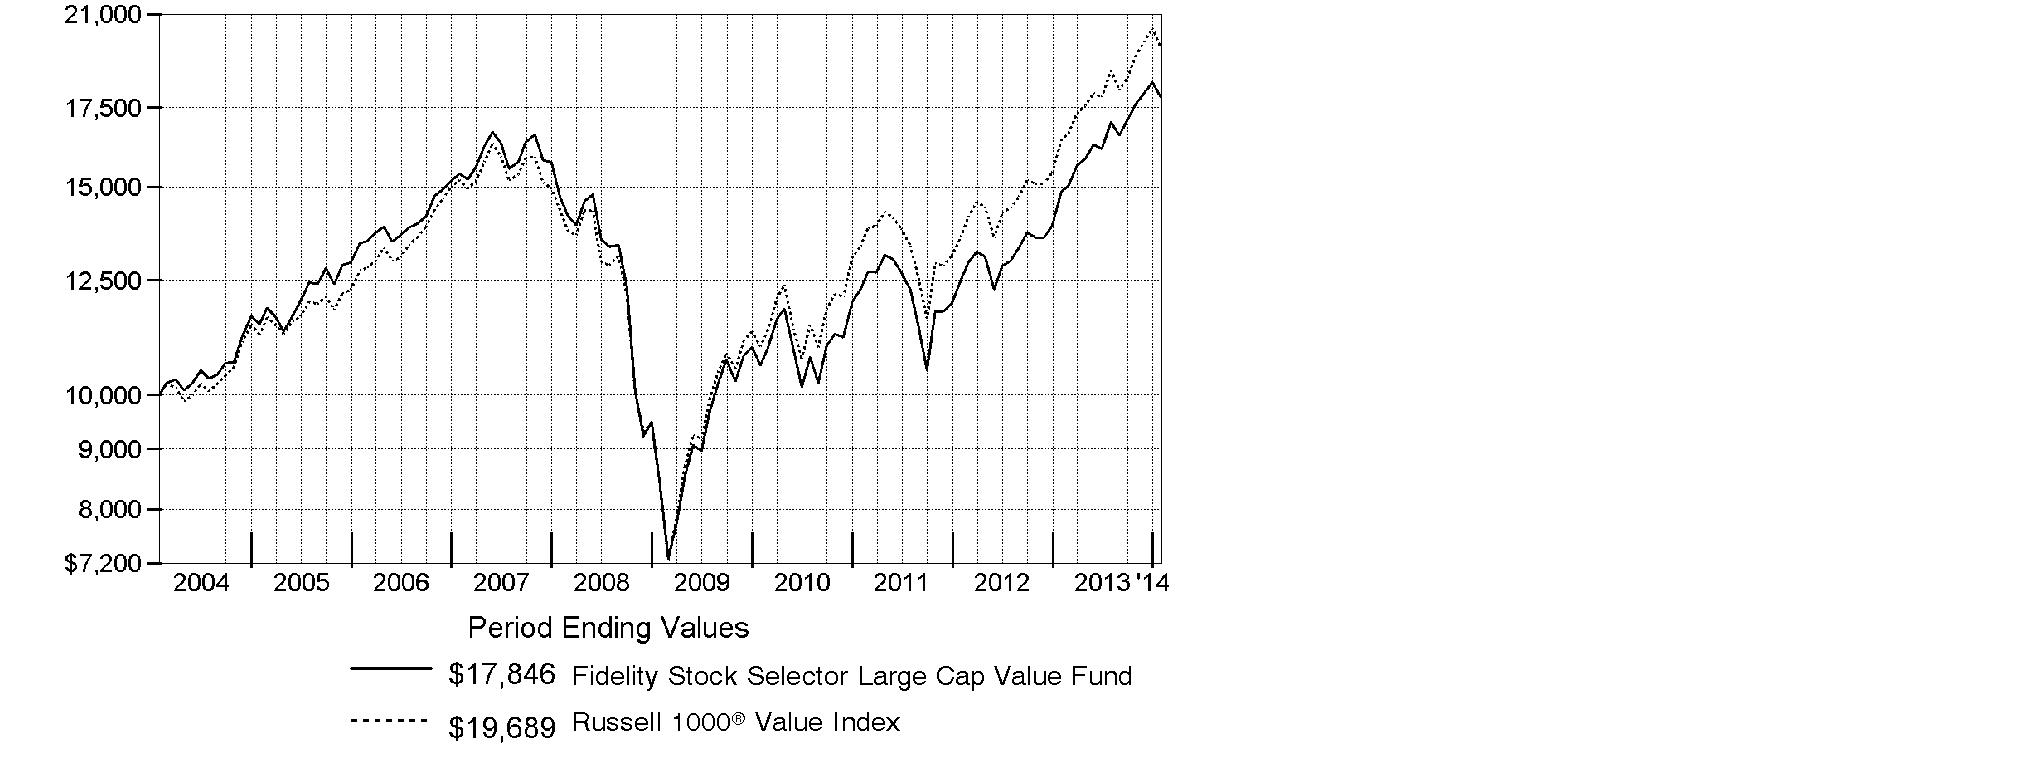
Annual Report
Management's Discussion of Fund Performance
Market Recap: Despite the worst January in years, markets finished notably higher for the 12 months ending January 31, 2014, amid a generally improving global economy and accommodative monetary policies worldwide. After achieving a series of highs in 2013, both the broad S&P 500® Index and the blue-chip Dow Jones Industrial AverageSM pulled back in the new year, bringing their 12-month returns to 21.52% and 16.07%, respectively. The growth-oriented Nasdaq Composite Index®, having run hotter in 2013 and cooled less in January, retained a loftier 32.33% result. For the period overall, smaller-cap stocks generally outperformed larger-caps, and growth outperformed value across market-cap segments. Bullish sentiment drove stocks higher through mid-May, but mixed signals from the U.S. Federal Reserve as to when it might curtail its stimulative bond-buying program, along with jitters over a potential U.S. military strike in Syria, put the markets in flux over the summer. Stocks regained their momentum in October despite a budget impasse that briefly shuttered the federal government, and volatility remained subdued heading into the holidays, allowing many markets to hit all-time highs by year-end. In January, renewed optimism for Europe and other developed markets was overrun by renewed concern about Fed tapering, the economic slowdown in China and a sell-off in emerging markets.
Comments from Matthew Friedman, Lead Portfolio Manager of Fidelity® Stock Selector Large Cap Value Fund: For the year, the fund's Retail Class shares rose 20.31%, roughly in line with the 20.02% return of the Russell 1000® Value Index. The fund's performance versus the index primarily resulted from strong stock choices in health care, financials, consumer discretionary and utilities, which were partially offset by some stock-specific mistakes, most notably in energy. Among individual contributors, two real estate names - Kennedy-Wilson Holdings and Greece-based Eurobank Properties Real Estate Investment - were big relative contributors. The firms' exposure to the strong-performing U.K. and Greek real estate markets, respectively, helped propel both stocks. Conversely, not owning diversified financials firm Bank of America was the fund's biggest individual detractor. The stock flourished along with the diversified financials industry overall. Owning EZCORP also hurt. The company provides a variety of short-term consumer loans and sells merchandise via its pawn-lending operations business. The firm reported consecutive quarters of disappointing financial results, which turned investors away from the stock. Of note, the fund's modest cash position hurt in an up market. Many of the names I've mentioned were out-of-index holdings.
The views expressed above reflect those of the portfolio manager(s) only through the end of the period as stated on the cover of this report and do not necessarily represent the views of Fidelity or any other person in the Fidelity organization. Any such views are subject to change at any time based upon market or other conditions and Fidelity disclaims any responsibility to update such views. These views may not be relied on as investment advice and, because investment decisions for a Fidelity fund are based on numerous factors, may not be relied on as an indication of trading intent on behalf of any Fidelity fund.
Annual Report
Shareholder Expense Example
As a shareholder of the Fund, you incur two types of costs: (1) transaction costs, including sales charges (loads) on purchase payments or redemption proceeds, and (2) ongoing costs, including management fees, distribution and/or service (12b-1) fees and other Fund expenses. This Example is intended to help you understand your ongoing costs (in dollars) of investing in the Fund and to compare these costs with the ongoing costs of investing in other mutual funds.
The Example is based on an investment of $1,000 invested at the beginning of the period and held for the entire period (August 1, 2013 to January 31, 2014).
Actual Expenses
The first line of the accompanying table for each class of the Fund provides information about actual account values and actual expenses. You may use the information in this line, together with the amount you invested, to estimate the expenses that you paid over the period. Simply divide your account value by $1,000.00 (for example, an $8,600 account value divided by $1,000.00 = 8.6), then multiply the result by the number in the first line for a class of the Fund under the heading entitled "Expenses Paid During Period" to estimate the expenses you paid on your account during this period. A small balance maintenance fee of $12.00 that is charged once a year may apply for certain accounts with a value of less than $2,000. This fee is not included in the table below. If it was, the estimate of expenses you paid during the period would be higher, and your ending account value lower, by this amount. In addition, the Fund, as a shareholder in the underlying Fidelity Central Funds, will indirectly bear its pro-rata share of the fees and expenses incurred by the underlying Fidelity Central Funds. These fees and expenses are not included in the Fund's annualized expense ratio used to calculate the expense estimate in the table below.
Hypothetical Example for Comparison Purposes
The second line of the accompanying table for each class of the Fund provides information about hypothetical account values and hypothetical expenses based on a Class' actual expense ratio and an assumed rate of return of 5% per year before expenses, which is not the Class' actual return. The hypothetical account values and expenses may not be used to estimate the actual ending account balance or expenses you paid for the period. You may use this information to compare the ongoing costs of investing in the Fund and other funds. To do so, compare this 5% hypothetical example with the 5% hypothetical examples that appear in the shareholder reports of the other funds. A small balance maintenance fee of $12.00 that is charged once a year may apply for certain accounts with a value of less than $2,000. This fee is not included in the table below. If it was, the estimate of expenses you paid during the period would be higher, and your ending account value lower, by this amount. In addition, the Fund, as a shareholder in the underlying Fidelity Central Funds, will indirectly bear its pro-rata share of the fees and expenses incurred by the underlying Fidelity Central Funds. These fees and expenses are not included in the Fund's annualized expense ratio used to calculate the expense estimate in the table below.
Please note that the expenses shown in the table are meant to highlight your ongoing costs only and do not reflect any transaction costs. Therefore, the second line of the table is useful in comparing ongoing costs only, and will not help you determine the relative total costs of owning different funds. In addition, if these transactional costs were included, your costs would have been higher.
Annual Report
Shareholder Expense Example - continued
| Annualized | Beginning | Ending | Expenses Paid |
Class A | 1.05% |
|
|
|
Actual |
| $ 1,000.00 | $ 1,048.30 | $ 5.42 |
HypotheticalA |
| $ 1,000.00 | $ 1,019.91 | $ 5.35 |
Class T | 1.37% |
|
|
|
Actual |
| $ 1,000.00 | $ 1,046.00 | $ 7.07 |
HypotheticalA |
| $ 1,000.00 | $ 1,018.30 | $ 6.97 |
Class B | 1.87% |
|
|
|
Actual |
| $ 1,000.00 | $ 1,043.50 | $ 9.63 |
HypotheticalA |
| $ 1,000.00 | $ 1,015.78 | $ 9.50 |
Class C | 1.86% |
|
|
|
Actual |
| $ 1,000.00 | $ 1,043.50 | $ 9.58 |
HypotheticalA |
| $ 1,000.00 | $ 1,015.83 | $ 9.45 |
Stock Selector Large Cap Value | .77% |
|
|
|
Actual |
| $ 1,000.00 | $ 1,049.40 | $ 3.98 |
HypotheticalA |
| $ 1,000.00 | $ 1,021.32 | $ 3.92 |
Institutional Class | .77% |
|
|
|
Actual |
| $ 1,000.00 | $ 1,049.00 | $ 3.98 |
HypotheticalA |
| $ 1,000.00 | $ 1,021.32 | $ 3.92 |
A 5% return per year before expenses
B Annualized expense ratio reflects expenses net of applicable fee waivers.
* Expenses are equal to each Class' annualized expense ratio, multiplied by the average account value over the period, multiplied by 184/365 (to reflect the one-half year period).
Annual Report
Investment Changes (Unaudited)
Top Ten Stocks as of January 31, 2014 | ||
| % of fund's | % of fund's net assets |
Wells Fargo & Co. | 3.4 | 3.3 |
General Electric Co. | 3.1 | 2.8 |
Berkshire Hathaway, Inc. Class B | 2.9 | 3.1 |
Merck & Co., Inc. | 2.4 | 2.9 |
Chevron Corp. | 2.3 | 2.8 |
Occidental Petroleum Corp. | 2.1 | 2.3 |
Cisco Systems, Inc. | 1.9 | 1.2 |
Suncor Energy, Inc. | 1.9 | 1.9 |
Canadian Natural Resources Ltd. | 1.8 | 1.8 |
Apple, Inc. | 1.6 | 1.6 |
| 23.4 | |
Top Five Market Sectors as of January 31, 2014 | ||
| % of fund's | % of fund's net assets |
Financials | 27.5 | 27.5 |
Energy | 14.0 | 14.6 |
Health Care | 14.0 | 12.5 |
Industrials | 9.2 | 9.0 |
Information Technology | 8.8 | 8.8 |
Asset Allocation (% of fund's net assets) | |||||||
As of January 31, 2014* | As of July 31, 2013** | ||||||
 | Stocks and |
| | Stocks and |
| ||
 | Other Investments 0.1% |
|  | Other Investments 0.0% |
| ||
 | Short-Term |
| | Short-Term |
| ||
* Foreign investments | 14.5% |
| ** Foreign investments | 11.2% |
| ||

Annual Report
Investments January 31, 2014
Showing Percentage of Net Assets
Common Stocks - 95.7% | |||
Shares | Value | ||
CONSUMER DISCRETIONARY - 6.2% | |||
Auto Components - 1.5% | |||
Delphi Automotive PLC | 59,000 | $ 3,592,510 | |
TRW Automotive Holdings Corp. (a) | 62,098 | 4,604,567 | |
| 8,197,077 | ||
Internet & Catalog Retail - 0.4% | |||
Liberty Interactive Corp. Series A (a) | 81,644 | 2,180,711 | |
Media - 2.2% | |||
Comcast Corp. Class A | 89,378 | 4,866,632 | |
Omnicom Group, Inc. | 29,600 | 2,148,368 | |
Twenty-First Century Fox, Inc. Class A | 165,500 | 5,266,210 | |
| 12,281,210 | ||
Multiline Retail - 1.4% | |||
Macy's, Inc. | 66,650 | 3,545,780 | |
Target Corp. | 81,334 | 4,606,758 | |
| 8,152,538 | ||
Specialty Retail - 0.7% | |||
Staples, Inc. | 315,065 | 4,146,255 | |
TOTAL CONSUMER DISCRETIONARY | 34,957,791 | ||
CONSUMER STAPLES - 5.6% | |||
Beverages - 0.3% | |||
Molson Coors Brewing Co. Class B | 35,500 | 1,868,720 | |
Food & Staples Retailing - 1.3% | |||
Wal-Mart Stores, Inc. | 58,745 | 4,387,077 | |
Walgreen Co. | 54,640 | 3,133,604 | |
| 7,520,681 | ||
Food Products - 1.9% | |||
Bunge Ltd. | 44,735 | 3,389,124 | |
Mondelez International, Inc. | 129,010 | 4,225,078 | |
The J.M. Smucker Co. | 31,942 | 3,078,889 | |
| 10,693,091 | ||
Household Products - 1.6% | |||
Procter & Gamble Co. | 113,280 | 8,679,514 | |
Personal Products - 0.5% | |||
Coty, Inc. Class A | 209,500 | 2,826,155 | |
TOTAL CONSUMER STAPLES | 31,588,161 | ||
Common Stocks - continued | |||
Shares | Value | ||
ENERGY - 14.0% | |||
Energy Equipment & Services - 0.9% | |||
National Oilwell Varco, Inc. | 65,600 | $ 4,920,656 | |
Oil, Gas & Consumable Fuels - 13.1% | |||
Anadarko Petroleum Corp. | 89,920 | 7,255,645 | |
Apache Corp. | 59,800 | 4,799,548 | |
BG Group PLC | 168,400 | 2,829,231 | |
Canadian Natural Resources Ltd. | 313,800 | 10,289,541 | |
Chevron Corp. | 117,200 | 13,083,036 | |
Marathon Petroleum Corp. | 89,800 | 7,817,090 | |
Noble Energy, Inc. | 84,160 | 5,245,693 | |
Occidental Petroleum Corp. | 137,078 | 12,003,920 | |
Suncor Energy, Inc. | 319,300 | 10,489,955 | |
| 73,813,659 | ||
TOTAL ENERGY | 78,734,315 | ||
FINANCIALS - 26.9% | |||
Capital Markets - 2.8% | |||
Bank of New York Mellon Corp. | 158,000 | 5,049,680 | |
Goldman Sachs Group, Inc. | 10,000 | 1,641,200 | |
Invesco Ltd. | 85,800 | 2,852,850 | |
Morgan Stanley | 153,700 | 4,535,687 | |
SWS Group, Inc. (a) | 201,000 | 1,543,680 | |
| 15,623,097 | ||
Commercial Banks - 8.2% | |||
CIT Group, Inc. | 95,900 | 4,464,145 | |
First Citizen Bancshares, Inc. | 27,200 | 6,017,728 | |
PNC Financial Services Group, Inc. | 92,100 | 7,356,948 | |
Popular, Inc. (a) | 98,280 | 2,594,592 | |
U.S. Bancorp | 164,100 | 6,519,693 | |
Wells Fargo & Co. | 421,300 | 19,101,739 | |
| 46,054,845 | ||
Consumer Finance - 1.0% | |||
Cash America International, Inc. | 45,000 | 1,652,850 | |
EZCORP, Inc. (non-vtg.) Class A (a) | 174,700 | 1,918,206 | |
SLM Corp. | 99,500 | 2,264,620 | |
| 5,835,676 | ||
Common Stocks - continued | |||
Shares | Value | ||
FINANCIALS - continued | |||
Diversified Financial Services - 4.1% | |||
Berkshire Hathaway, Inc. Class B (a) | 145,457 | $ 16,233,001 | |
Interactive Brokers Group, Inc. | 320,900 | 6,803,080 | |
| 23,036,081 | ||
Insurance - 5.3% | |||
ACE Ltd. | 64,500 | 6,050,745 | |
AFLAC, Inc. | 58,450 | 3,669,491 | |
Donegal Group, Inc. Class A | 90,500 | 1,322,205 | |
Fairfax Financial Holdings Ltd. (sub. vtg.) | 7,650 | 2,943,919 | |
MetLife, Inc. | 97,700 | 4,792,185 | |
National Western Life Insurance Co. Class A | 8,850 | 1,930,628 | |
Old Republic International Corp. | 173,700 | 2,713,194 | |
StanCorp Financial Group, Inc. | 30,500 | 1,959,625 | |
Torchmark Corp. | 56,350 | 4,234,703 | |
| 29,616,695 | ||
Real Estate Investment Trusts - 2.4% | |||
American Tower Corp. | 34,200 | 2,766,096 | |
Ares Commercial Real Estate Corp. | 10,000 | 133,300 | |
Boston Properties, Inc. | 7,400 | 799,866 | |
CyrusOne, Inc. | 69,000 | 1,491,090 | |
Eurobank Properties Real Estate Investment Co. (a) | 517,920 | 5,273,816 | |
Hibernia (REIT) PLC | 693,800 | 1,057,373 | |
New Residential Investment Corp. | 110,000 | 698,500 | |
Newcastle Investment Corp. | 110,000 | 598,400 | |
RAIT Financial Trust | 40,000 | 337,600 | |
| 13,156,041 | ||
Real Estate Management & Development - 1.8% | |||
Consolidated-Tomoka Land Co. | 35,150 | 1,235,523 | |
Kennedy-Wilson Holdings, Inc. (a) | 365,500 | 8,779,310 | |
| 10,014,833 | ||
Thrifts & Mortgage Finance - 1.3% | |||
Beneficial Mutual Bancorp, Inc. (a) | 210,000 | 2,494,800 | |
HF Financial Corp. | 1,500 | 19,785 | |
Meridian Interstate Bancorp, Inc. (a) | 210,000 | 4,943,400 | |
| 7,457,985 | ||
TOTAL FINANCIALS | 150,795,253 | ||
Common Stocks - continued | |||
Shares | Value | ||
HEALTH CARE - 14.0% | |||
Biotechnology - 0.4% | |||
Amgen, Inc. | 16,900 | $ 2,010,255 | |
Health Care Equipment & Supplies - 0.6% | |||
St. Jude Medical, Inc. | 57,600 | 3,498,048 | |
Health Care Providers & Services - 3.8% | |||
Express Scripts Holding Co. (a) | 49,800 | 3,719,562 | |
HCA Holdings, Inc. (a) | 99,200 | 4,986,784 | |
Team Health Holdings, Inc. (a) | 49,300 | 2,127,788 | |
UnitedHealth Group, Inc. | 123,000 | 8,890,440 | |
WellPoint, Inc. | 17,101 | 1,470,686 | |
| 21,195,260 | ||
Pharmaceuticals - 9.2% | |||
AbbVie, Inc. | 33,400 | 1,644,282 | |
Actavis PLC (a) | 25,800 | 4,875,684 | |
Endo Health Solutions, Inc. (a)(d) | 41,100 | 2,707,668 | |
Jazz Pharmaceuticals PLC (a) | 43,900 | 6,657,874 | |
Johnson & Johnson | 102,100 | 9,032,787 | |
Merck & Co., Inc. | 255,200 | 13,517,944 | |
Pfizer, Inc. | 152,900 | 4,648,160 | |
Teva Pharmaceutical Industries Ltd. sponsored ADR | 82,400 | 3,677,512 | |
Valeant Pharmaceuticals International (Canada) (a) | 35,800 | 4,857,871 | |
| 51,619,782 | ||
TOTAL HEALTH CARE | 78,323,345 | ||
INDUSTRIALS - 9.2% | |||
Aerospace & Defense - 0.5% | |||
Textron, Inc. | 87,800 | 3,116,900 | |
Air Freight & Logistics - 1.3% | |||
FedEx Corp. | 54,000 | 7,199,280 | |
Commercial Services & Supplies - 0.6% | |||
Waste Management, Inc. | 77,201 | 3,225,458 | |
Construction & Engineering - 1.9% | |||
AECOM Technology Corp. (a) | 194,600 | 5,579,182 | |
URS Corp. | 101,100 | 5,075,220 | |
| 10,654,402 | ||
Electrical Equipment - 0.7% | |||
Babcock & Wilcox Co. | 107,400 | 3,681,672 | |
Industrial Conglomerates - 3.1% | |||
General Electric Co. | 704,600 | 17,706,598 | |
Common Stocks - continued | |||
Shares | Value | ||
INDUSTRIALS - continued | |||
Machinery - 0.4% | |||
Caterpillar, Inc. | 11,600 | $ 1,089,356 | |
Terex Corp. | 25,000 | 1,025,000 | |
| 2,114,356 | ||
Road & Rail - 0.7% | |||
CSX Corp. | 145,700 | 3,920,787 | |
TOTAL INDUSTRIALS | 51,619,453 | ||
INFORMATION TECHNOLOGY - 8.8% | |||
Communications Equipment - 1.9% | |||
Cisco Systems, Inc. | 479,500 | 10,505,845 | |
Computers & Peripherals - 3.0% | |||
Apple, Inc. | 18,350 | 9,186,010 | |
EMC Corp. | 325,000 | 7,878,000 | |
| 17,064,010 | ||
Electronic Equipment & Components - 0.5% | |||
Jabil Circuit, Inc. | 155,948 | 2,802,386 | |
Semiconductors & Semiconductor Equipment - 2.1% | |||
Broadcom Corp. Class A | 266,300 | 7,925,088 | |
Samsung Electronics Co. Ltd. | 3,166 | 3,711,203 | |
| 11,636,291 | ||
Software - 1.3% | |||
Oracle Corp. | 130,100 | 4,800,690 | |
Symantec Corp. | 124,100 | 2,656,981 | |
| 7,457,671 | ||
TOTAL INFORMATION TECHNOLOGY | 49,466,203 | ||
MATERIALS - 2.4% | |||
Chemicals - 2.1% | |||
Ashland, Inc. | 28,300 | 2,626,523 | |
Axiall Corp. | 39,900 | 1,592,010 | |
Chemtura Corp. (a) | 69,100 | 1,733,028 | |
Eastman Chemical Co. | 46,300 | 3,609,548 | |
LyondellBasell Industries NV Class A | 29,520 | 2,324,995 | |
| 11,886,104 | ||
Common Stocks - continued | |||
Shares | Value | ||
MATERIALS - continued | |||
Metals & Mining - 0.3% | |||
Freeport-McMoRan Copper & Gold, Inc. | 55,700 | $ 1,805,237 | |
TOTAL MATERIALS | 13,691,341 | ||
TELECOMMUNICATION SERVICES - 2.3% | |||
Diversified Telecommunication Services - 2.1% | |||
AT&T, Inc. | 226,100 | 7,533,652 | |
CenturyLink, Inc. | 102,914 | 2,970,098 | |
Frontier Communications Corp. (d) | 235,200 | 1,105,440 | |
| 11,609,190 | ||
Wireless Telecommunication Services - 0.2% | |||
NII Holdings, Inc. (a)(d) | 367,400 | 1,105,874 | |
TOTAL TELECOMMUNICATION SERVICES | 12,715,064 | ||
UTILITIES - 6.3% | |||
Electric Utilities - 3.1% | |||
Edison International | 78,600 | 3,785,376 | |
ITC Holdings Corp. | 49,100 | 5,081,850 | |
NextEra Energy, Inc. | 58,410 | 5,369,631 | |
Xcel Energy, Inc. | 100,200 | 2,896,782 | |
| 17,133,639 | ||
Gas Utilities - 0.9% | |||
Atmos Energy Corp. | 66,700 | 3,202,267 | |
National Fuel Gas Co. | 24,800 | 1,868,928 | |
| 5,071,195 | ||
Multi-Utilities - 2.3% | |||
Alliant Energy Corp. | 35,900 | 1,865,364 | |
Ameren Corp. | 47,700 | 1,804,968 | |
NiSource, Inc. | 116,400 | 4,000,668 | |
Sempra Energy | 56,950 | 5,279,835 | |
| 12,950,835 | ||
TOTAL UTILITIES | 35,155,669 | ||
TOTAL COMMON STOCKS (Cost $472,260,044) |
| ||
Nonconvertible Preferred Stocks - 0.5% | |||
Shares | Value | ||
FINANCIALS - 0.5% | |||
Commercial Banks - 0.5% | |||
Itau Unibanco Holding SA sponsored ADR | 217,580 | $ 2,663,179 | |
Real Estate Investment Trusts - 0.0% | |||
Eagle Hospitality Properties Trust, Inc. 8.25% (a) | 47,000 | 47 | |
Equity Lifestyle Properties, Inc. Series C, 6.75% | 16,134 | 374,147 | |
| 374,194 | ||
TOTAL NONCONVERTIBLE PREFERRED STOCKS (Cost $4,836,790) |
| ||
U.S. Treasury Obligations - 0.0% | ||||
| Principal Amount |
| ||
U.S. Treasury Bills, yield at date of purchase 0.01% to 0.04% 2/27/14 to 5/1/14 (g) | $ 125,000 |
| ||
Preferred Securities - 0.1% | |||
|
|
|
|
FINANCIALS - 0.1% | |||
Diversified Financial Services - 0.1% | |||
Baggot Securities Ltd. 10.24% (e)(f) (Cost $353,254) | 230,000 |
| |
Money Market Funds - 4.0% | |||
Shares |
| ||
Fidelity Cash Central Fund, 0.10% (b) | 20,064,480 | 20,064,480 | |
Fidelity Securities Lending Cash Central Fund, 0.09% (b)(c) | 2,132,550 | 2,132,550 | |
TOTAL MONEY MARKET FUNDS (Cost $22,197,030) |
| ||
TOTAL INVESTMENT PORTFOLIO - 100.3% (Cost $499,772,114) | 562,767,269 | ||
NET OTHER ASSETS (LIABILITIES) - (0.3)% | (1,749,617) | ||
NET ASSETS - 100% | $ 561,017,652 | ||
Futures Contracts | |||||
Expiration Date | Underlying Face Amount at Value | Unrealized Appreciation/ | |||
Purchased | |||||
Equity Index Contracts | |||||
58 ICE Russell 1000 Value Index Contracts (United States) | March 2014 | $ 5,159,100 | $ (148,245) | ||
The face value of futures purchased as a percentage of net assets is 0.9% |
Currency Abbreviations | ||
EUR | - | European Monetary Unit |
Legend |
(a) Non-income producing |
(b) Affiliated fund that is generally available only to investment companies and other accounts managed by Fidelity Investments. The rate quoted is the annualized seven-day yield of the fund at period end. A complete unaudited listing of the fund's holdings as of its most recent quarter end is available upon request. In addition, each Fidelity Central Fund's financial statements, which are not covered by the Fund's Report of Independent Registered Public Accounting Firm, are available on the SEC's website or upon request. |
(c) Investment made with cash collateral received from securities on loan. |
(d) Security or a portion of the security is on loan at period end. |
(e) Security exempt from registration under Rule 144A of the Securities Act of 1933. These securities may be resold in transactions exempt from registration, normally to qualified institutional buyers. At the end of the period, the value of these securities amounted to $361,275 or 0.1% of net assets. |
(f) Security is perpetual in nature with no stated maturity date. |
(g) Security or a portion of the security was pledged to cover margin requirements for futures contracts. At period end, the value of securities pledged amounted to $124,996. |
Affiliated Central Funds |
Information regarding fiscal year to date income earned by the Fund from investments in Fidelity Central Funds is as follows: |
Fund | Income earned |
Fidelity Cash Central Fund | $ 19,669 |
Fidelity Securities Lending Cash Central Fund | 47,322 |
Total | $ 66,991 |
Other Information |
The following is a summary of the inputs used, as of January 31, 2014, involving the Fund's assets and liabilities carried at fair value. The inputs or methodology used for valuing securities may not be an indication of the risk associated with investing in those securities. For more information on valuation inputs, and their aggregation into the levels used in the table below, please refer to the Investment Valuation section in the accompanying Notes to Financial Statements. |
Valuation Inputs at Reporting Date: | ||||
Description | Total | Level 1 | Level 2 | Level 3 |
Investments in Securities: | ||||
Equities: | ||||
Consumer Discretionary | $ 34,957,791 | $ 34,957,791 | $ - | $ - |
Consumer Staples | 31,588,161 | 31,588,161 | - | - |
Energy | 78,734,315 | 78,734,315 | - | - |
Financials | 153,832,626 | 153,832,579 | - | 47 |
Health Care | 78,323,345 | 78,323,345 | - | - |
Industrials | 51,619,453 | 51,619,453 | - | - |
Information Technology | 49,466,203 | 45,755,000 | 3,711,203 | - |
Materials | 13,691,341 | 13,691,341 | - | - |
Telecommunication Services | 12,715,064 | 12,715,064 | - | - |
Utilities | 35,155,669 | 35,155,669 | - | - |
U.S. Government and Government Agency Obligations | 124,996 | - | 124,996 | - |
Preferred Securities | 361,275 | - | 361,275 | - |
Money Market Funds | 22,197,030 | 22,197,030 | - | - |
Total Investments in Securities: | $ 562,767,269 | $ 558,569,748 | $ 4,197,474 | $ 47 |
Derivative Instruments: | ||||
Liabilities | ||||
Futures Contracts | $ (148,245) | $ (148,245) | $ - | $ - |
Value of Derivative Instruments |
The following table is a summary of the Fund's value of derivative instruments by primary risk exposure as of January 31, 2014. For additional information on derivative instruments, please refer to the Derivative Instruments section in the accompanying Notes to Financial Statements. |
Primary Risk Exposure / | Value | |
| Asset | Liability |
Equity Risk | ||
Futures Contracts (a) | $ - | $ (148,245) |
Total Value of Derivatives | $ - | $ (148,245) |
(a) Reflects gross cumulative appreciation (depreciation) on futures contracts as presented in the Schedule of Investments. Only the period end receivable or payable for daily variation margin and net unrealized appreciation (depreciation) are presented in the Statement of Assets and Liabilities. |
Distribution of investments by country or territory of incorporation, as a percentage of total net assets, is as follows (Unaudited): |
United States of America | 85.5% |
Canada | 5.1% |
Ireland | 2.4% |
Bermuda | 1.1% |
Switzerland | 1.1% |
Others (Individually Less Than 1%) | 4.8% |
| 100.0% |
See accompanying notes which are an integral part of the financial statements.
Annual Report
Financial Statements
Statement of Assets and Liabilities
| January 31, 2014 | |
|
|
|
Assets | ||
Investment in securities, at value (including securities loaned of $2,048,037) - See accompanying schedule: Unaffiliated issuers (cost $477,575,084) | $ 540,570,239 |
|
Fidelity Central Funds (cost $22,197,030) | 22,197,030 |
|
Total Investments (cost $499,772,114) |
| $ 562,767,269 |
Receivable for investments sold | 5,929,565 | |
Receivable for fund shares sold | 552,977 | |
Dividends receivable | 353,518 | |
Distributions receivable from Fidelity Central Funds | 9,313 | |
Prepaid expenses | 1,123 | |
Other receivables | 6,597 | |
Total assets | 569,620,362 | |
|
|
|
Liabilities | ||
Payable to custodian bank | $ 105,997 | |
Payable for investments purchased | 4,695,548 | |
Payable for fund shares redeemed | 1,197,395 | |
Accrued management fee | 241,268 | |
Distribution and service plan fees payable | 16,062 | |
Payable for daily variation margin for derivative instruments | 44,080 | |
Other affiliated payables | 114,213 | |
Other payables and accrued expenses | 55,597 | |
Collateral on securities loaned, at value | 2,132,550 | |
Total liabilities | 8,602,710 | |
|
|
|
Net Assets | $ 561,017,652 | |
Net Assets consist of: |
| |
Paid in capital | $ 791,086,240 | |
Accumulated undistributed net realized gain (loss) on investments and foreign currency transactions | (292,914,584) | |
Net unrealized appreciation (depreciation) on investments and assets and liabilities in foreign currencies | 62,845,996 | |
Net Assets | $ 561,017,652 | |
See accompanying notes which are an integral part of the financial statements.
Annual Report
Financial Statements - continued
Statement of Assets and Liabilities - continued
| January 31, 2014 | |
|
|
|
Calculation of Maximum Offering Price Class A: | $ 14.72 | |
|
|
|
Maximum offering price per share (100/94.25 of $14.72) | $ 15.62 | |
Class T: | $ 14.71 | |
|
|
|
Maximum offering price per share (100/96.50 of $14.71) | $ 15.24 | |
Class B: | $ 14.72 | |
|
|
|
Class C: | $ 14.53 | |
|
|
|
Stock Selector Large Cap Value: | $ 14.81 | |
|
|
|
Institutional Class: | $ 14.74 | |
A Redemption price per share is equal to net asset value less any applicable contingent deferred sales charge.
See accompanying notes which are an integral part of the financial statements.
Annual Report
Statement of Operations
| Year ended January 31, 2014 | |
|
|
|
Investment Income |
|
|
Dividends |
| $ 10,508,965 |
Interest |
| 383 |
Income from Fidelity Central Funds |
| 66,991 |
Total income |
| 10,576,339 |
|
|
|
Expenses | ||
Management fee | $ 3,003,251 | |
Performance adjustment | (664,858) | |
Transfer agent fees | 1,175,937 | |
Distribution and service plan fees | 177,227 | |
Accounting and security lending fees | 206,936 | |
Custodian fees and expenses | 37,404 | |
Independent trustees' compensation | 2,737 | |
Registration fees | 93,237 | |
Audit | 57,311 | |
Legal | 2,105 | |
Miscellaneous | 3,894 | |
Total expenses before reductions | 4,095,181 | |
Expense reductions | (22,191) | 4,072,990 |
Net investment income (loss) | 6,503,349 | |
Realized and Unrealized Gain (Loss) Net realized gain (loss) on: | ||
Investment securities: |
|
|
Unaffiliated issuers | 58,186,576 | |
Foreign currency transactions | (8,422) | |
Futures contracts | 1,432,461 | |
Total net realized gain (loss) |
| 59,610,615 |
Change in net unrealized appreciation (depreciation) on: Investment securities | 32,608,267 | |
Assets and liabilities in foreign currencies | (220) | |
Futures contracts | (477,467) | |
Total change in net unrealized appreciation (depreciation) |
| 32,130,580 |
Net gain (loss) | 91,741,195 | |
Net increase (decrease) in net assets resulting from operations | $ 98,244,544 | |
See accompanying notes which are an integral part of the financial statements.
Annual Report
Financial Statements - continued
Statement of Changes in Net Assets
| Year ended | Year ended |
Increase (Decrease) in Net Assets |
|
|
Operations |
|
|
Net investment income (loss) | $ 6,503,349 | $ 9,916,334 |
Net realized gain (loss) | 59,610,615 | 29,669,811 |
Change in net unrealized appreciation (depreciation) | 32,130,580 | 43,960,221 |
Net increase (decrease) in net assets resulting | 98,244,544 | 83,546,366 |
Distributions to shareholders from net investment income | (7,028,513) | (9,512,706) |
Distributions to shareholders from net realized gain | (1,781,878) | - |
Total distributions | (8,810,391) | (9,512,706) |
Share transactions - net increase (decrease) | (28,375,927) | (89,844,793) |
Total increase (decrease) in net assets | 61,058,226 | (15,811,133) |
|
|
|
Net Assets | ||
Beginning of period | 499,959,426 | 515,770,559 |
End of period (including undistributed net investment income of $0 and undistributed net investment income of $393,853, respectively) | $ 561,017,652 | $ 499,959,426 |
See accompanying notes which are an integral part of the financial statements.
Annual Report
Financial Highlights - Class A
Years ended January 31, | 2014 | 2013 | 2012 | 2011 | 2010 |
Selected Per-Share Data |
|
|
|
|
|
Net asset value, beginning of period | $ 12.43 | $ 10.71 | $ 10.72 | $ 9.35 | $ 7.53 |
Income from Investment Operations |
|
|
|
|
|
Net investment income (loss) C | .13 | .20 | .14 | .09 | .09 |
Net realized and unrealized gain (loss) | 2.35 | 1.73 | .02 | 1.38 | 1.85 |
Total from investment operations | 2.48 | 1.93 | .16 | 1.47 | 1.94 |
Distributions from net investment income | (.15) | (.21) | (.17) | (.10) | (.12) |
Distributions from net realized gain | (.05) | - | - | - | - |
Total distributions | (.19) G | (.21) | (.17) | (.10) | (.12) |
Net asset value, end of period | $ 14.72 | $ 12.43 | $ 10.71 | $ 10.72 | $ 9.35 |
Total Return A,B | 20.01% | 18.15% | 1.58% | 15.79% | 25.74% |
Ratios to Average Net Assets D,F |
|
|
|
|
|
Expenses before reductions | 1.00% | .87% | .87% | 1.00% | 1.15% |
Expenses net of fee waivers, if any | 1.00% | .87% | .87% | 1.00% | 1.15% |
Expenses net of all reductions | 1.00% | .85% | .86% | 1.00% | 1.13% |
Net investment income (loss) | .95% | 1.74% | 1.38% | .87% | 1.08% |
Supplemental Data |
|
|
|
|
|
Net assets, end of period (000 omitted) | $ 21,266 | $ 18,234 | $ 18,900 | $ 20,815 | $ 23,778 |
Portfolio turnover rate E | 64% | 63% | 128% | 120% | 171% |
A Total returns would have been lower if certain expenses had not been reduced during the applicable periods shown.
B Total returns do not include the effect of the sales charges.
C Calculated based on average shares outstanding during the period.
D Fees and expenses of any underlying Fidelity Central Funds are not included in the Fund's expense ratio. The Fund indirectly bears its proportionate share of the expenses of any underlying Fidelity Central Funds.
E Amount does not include the portfolio activity of any underlying Fidelity Central Funds.
F Expense ratios reflect operating expenses of the class. Expenses before reductions do not reflect amounts reimbursed by the investment adviser or reductions from brokerage service arrangements or reductions from other expense offset arrangements and do not represent the amount paid by the class during periods when reimbursements or reductions occur. Expenses net of fee waivers reflect expenses after reimbursement by the investment adviser but prior to reductions from brokerage service arrangements or other expense offset arrangements. Expenses net of all reductions represent the net expenses paid by the class.
G Total distributions of $.19 per share is comprised of distributions from net investment income of $.147 and distributions from net realized gain of $.047 per share.
See accompanying notes which are an integral part of the financial statements.
Annual Report
Financial Highlights - Class T
Years ended January 31, | 2014 | 2013 | 2012 | 2011 | 2010 |
Selected Per-Share Data |
|
|
|
|
|
Net asset value, beginning of period | $ 12.44 | $ 10.72 | $ 10.74 | $ 9.36 | $ 7.54 |
Income from Investment Operations |
|
|
|
|
|
Net investment income (loss) C | .09 | .17 | .12 | .06 | .07 |
Net realized and unrealized gain (loss) | 2.34 | 1.73 | .01 | 1.39 | 1.84 |
Total from investment operations | 2.43 | 1.90 | .13 | 1.45 | 1.91 |
Distributions from net investment income | (.11) | (.18) | (.15) | (.07) | (.09) |
Distributions from net realized gain | (.05) | - | - | - | - |
Total distributions | (.16) | (.18) | (.15) | (.07) | (.09) |
Net asset value, end of period | $ 14.71 | $ 12.44 | $ 10.72 | $ 10.74 | $ 9.36 |
Total Return A,B | 19.54% | 17.88% | 1.26% | 15.50% | 25.30% |
Ratios to Average Net Assets D,F |
|
|
|
|
|
Expenses before reductions | 1.32% | 1.14% | 1.14% | 1.29% | 1.45% |
Expenses net of fee waivers, if any | 1.32% | 1.14% | 1.14% | 1.29% | 1.45% |
Expenses net of all reductions | 1.31% | 1.12% | 1.13% | 1.28% | 1.44% |
Net investment income (loss) | .63% | 1.48% | 1.11% | .59% | .78% |
Supplemental Data |
|
|
|
|
|
Net assets, end of period (000 omitted) | $ 8,244 | $ 6,544 | $ 5,603 | $ 5,625 | $ 9,101 |
Portfolio turnover rate E | 64% | 63% | 128% | 120% | 171% |
A Total returns would have been lower if certain expenses had not been reduced during the applicable periods shown.
B Total returns do not include the effect of the sales charges.
C Calculated based on average shares outstanding during the period.
D Fees and expenses of any underlying Fidelity Central Funds are not included in the Fund's expense ratio. The Fund indirectly bears its proportionate share of the expenses of any underlying Fidelity Central Funds.
E Amount does not include the portfolio activity of any underlying Fidelity Central Funds.
F Expense ratios reflect operating expenses of the class. Expenses before reductions do not reflect amounts reimbursed by the investment adviser or reductions from brokerage service arrangements or reductions from other expense offset arrangements and do not represent the amount paid by the class during periods when reimbursements or reductions occur. Expenses net of fee waivers reflect expenses after reimbursement by the investment adviser but prior to reductions from brokerage service arrangements or other expense offset arrangements. Expenses net of all reductions represent the net expenses paid by the class.
See accompanying notes which are an integral part of the financial statements.
Annual Report
Financial Highlights - Class B
Years ended January 31, | 2014 | 2013 | 2012 | 2011 | 2010 |
Selected Per-Share Data |
|
|
|
|
|
Net asset value, beginning of period | $ 12.44 | $ 10.72 | $ 10.72 | $ 9.35 | $ 7.53 |
Income from Investment Operations |
|
|
|
|
|
Net investment income (loss) C | .02 | .11 | .07 | .01 | .02 |
Net realized and unrealized gain (loss) | 2.34 | 1.73 | .02 | 1.38 | 1.85 |
Total from investment operations | 2.36 | 1.84 | .09 | 1.39 | 1.87 |
Distributions from net investment income | (.03) | (.12) | (.09) | (.02) | (.05) |
Distributions from net realized gain | (.05) | - | - | - | - |
Total distributions | (.08) | (.12) | (.09) | (.02) | (.05) |
Net asset value, end of period | $ 14.72 | $ 12.44 | $ 10.72 | $ 10.72 | $ 9.35 |
Total Return A,B | 18.94% | 17.24% | .86% | 14.87% | 24.79% |
Ratios to Average Net Assets D,F |
|
|
|
|
|
Expenses before reductions | 1.81% | 1.63% | 1.62% | 1.80% | 1.98% |
Expenses net of fee waivers, if any | 1.80% | 1.63% | 1.62% | 1.80% | 1.98% |
Expenses net of all reductions | 1.80% | 1.60% | 1.62% | 1.79% | 1.97% |
Net investment income (loss) | .14% | .99% | .63% | .08% | .24% |
Supplemental Data |
|
|
|
|
|
Net assets, end of period (000 omitted) | $ 1,632 | $ 1,645 | $ 1,819 | $ 2,274 | $ 2,711 |
Portfolio turnover rate E | 64% | 63% | 128% | 120% | 171% |
A Total returns would have been lower if certain expenses had not been reduced during the applicable periods shown.
B Total returns do not include the effect of the contingent deferred sales charge.
C Calculated based on average shares outstanding during the period.
D Fees and expenses of any underlying Fidelity Central Funds are not included in the Fund's expense ratio. The Fund indirectly bears its proportionate share of the expenses of any underlying Fidelity Central Funds.
E Amount does not include the portfolio activity of any underlying Fidelity Central Funds.
F Expense ratios reflect operating expenses of the class. Expenses before reductions do not reflect amounts reimbursed by the investment adviser or reductions from brokerage service arrangements or reductions from other expense offset arrangements and do not represent the amount paid by the class during periods when reimbursements or reductions occur. Expenses net of fee waivers reflect expenses after reimbursement by the investment adviser but prior to reductions from brokerage service arrangements or other expense offset arrangements. Expenses net of all reductions represent the net expenses paid by the class.
See accompanying notes which are an integral part of the financial statements.
Annual Report
Financial Highlights - Class C
Years ended January 31, | 2014 | 2013 | 2012 | 2011 | 2010 |
Selected Per-Share Data |
|
|
|
|
|
Net asset value, beginning of period | $ 12.30 | $ 10.61 | $ 10.63 | $ 9.30 | $ 7.49 |
Income from Investment Operations |
|
|
|
|
|
Net investment income (loss) C | .02 | .11 | .07 | .01 | .03 |
Net realized and unrealized gain (loss) | 2.31 | 1.72 | .01 | 1.36 | 1.84 |
Total from investment operations | 2.33 | 1.83 | .08 | 1.37 | 1.87 |
Distributions from net investment income | (.05) | (.14) | (.10) | (.04) | (.06) |
Distributions from net realized gain | (.05) | - | - | - | - |
Total distributions | (.10) | (.14) | (.10) | (.04) | (.06) |
Net asset value, end of period | $ 14.53 | $ 12.30 | $ 10.61 | $ 10.63 | $ 9.30 |
Total Return A,B | 18.94% | 17.32% | .85% | 14.79% | 24.97% |
Ratios to Average Net Assets D,F |
|
|
|
|
|
Expenses before reductions | 1.81% | 1.63% | 1.62% | 1.75% | 1.89% |
Expenses net of fee waivers, if any | 1.80% | 1.63% | 1.62% | 1.75% | 1.89% |
Expenses net of all reductions | 1.80% | 1.61% | 1.61% | 1.74% | 1.88% |
Net investment income (loss) | .14% | .99% | .63% | .13% | .34% |
Supplemental Data |
|
|
|
|
|
Net assets, end of period (000 omitted) | $ 7,789 | $ 5,839 | $ 4,979 | $ 3,959 | $ 3,491 |
Portfolio turnover rate E | 64% | 63% | 128% | 120% | 171% |
A Total returns would have been lower if certain expenses had not been reduced during the applicable periods shown.
B Total returns do not include the effect of the contingent deferred sales charge.
C Calculated based on average shares outstanding during the period.
D Fees and expenses of any underlying Fidelity Central Funds are not included in the Fund's expense ratio. The Fund indirectly bears its proportionate share of the expenses of any underlying Fidelity Central Funds.
E Amount does not include the portfolio activity of any underlying Fidelity Central Funds.
F Expense ratios reflect operating expenses of the class. Expenses before reductions do not reflect amounts reimbursed by the investment adviser or reductions from brokerage service arrangements or reductions from other expense offset arrangements and do not represent the amount paid by the class during periods when reimbursements or reductions occur. Expenses net of fee waivers reflect expenses after reimbursement by the investment adviser but prior to reductions from brokerage service arrangements or other expense offset arrangements. Expenses net of all reductions represent the net expenses paid by the class.
See accompanying notes which are an integral part of the financial statements.
Annual Report
Financial Highlights - Stock Selector Large Cap Value
Years ended January 31, | 2014 | 2013 | 2012 | 2011 | 2010 |
Selected Per-Share Data |
|
|
|
|
|
Net asset value, beginning of period | $ 12.51 | $ 10.77 | $ 10.78 | $ 9.40 | $ 7.56 |
Income from Investment Operations |
|
|
|
|
|
Net investment income (loss) B | .17 | .23 | .18 | .11 | .12 |
Net realized and unrealized gain (loss) | 2.37 | 1.75 | .01 | 1.40 | 1.86 |
Total from investment operations | 2.54 | 1.98 | .19 | 1.51 | 1.98 |
Distributions from net investment income | (.19) | (.24) | (.20) | (.13) | (.14) |
Distributions from net realized gain | (.05) | - | - | - | - |
Total distributions | (.24) | (.24) | (.20) | (.13) | (.14) |
Net asset value, end of period | $ 14.81 | $ 12.51 | $ 10.77 | $ 10.78 | $ 9.40 |
Total Return A | 20.31% | 18.55% | 1.85% | 16.09% | 26.21% |
Ratios to Average Net Assets C,E |
|
|
|
|
|
Expenses before reductions | .72% | .57% | .57% | .73% | .85% |
Expenses net of fee waivers, if any | .72% | .57% | .57% | .73% | .85% |
Expenses net of all reductions | .71% | .55% | .56% | .72% | .84% |
Net investment income (loss) | 1.23% | 2.05% | 1.68% | 1.15% | 1.38% |
Supplemental Data |
|
|
|
|
|
Net assets, end of period (000 omitted) | $ 518,206 | $ 465,702 | $ 482,950 | $ 803,009 | $ 914,828 |
Portfolio turnover rate D | 64% | 63% | 128% | 120% | 171% |
A Total returns would have been lower if certain expenses had not been reduced during the applicable periods shown.
B Calculated based on average shares outstanding during the period.
C Fees and expenses of any underlying Fidelity Central Funds are not included in the Fund's expense ratio. The Fund indirectly bears its proportionate share of the expenses of any underlying Fidelity Central Funds.
D Amount does not include the portfolio activity of any underlying Fidelity Central Funds.
E Expense ratios reflect operating expenses of the class. Expenses before reductions do not reflect amounts reimbursed by the investment adviser or reductions from brokerage service arrangements or reductions from other expense offset arrangements and do not represent the amount paid by the class during periods when reimbursements or reductions occur. Expenses net of fee waivers reflect expenses after reimbursement by the investment adviser but prior to reductions from brokerage service arrangements or other expense offset arrangements. Expenses net of all reductions represent the net expenses paid by the class.
See accompanying notes which are an integral part of the financial statements.
Annual Report
Financial Highlights - Institutional Class
Years ended January 31, | 2014 | 2013 | 2012 | 2011 | 2010 |
Selected Per-Share Data |
|
|
|
|
|
Net asset value, beginning of period | $ 12.46 | $ 10.74 | $ 10.74 | $ 9.37 | $ 7.54 |
Income from Investment Operations |
|
|
|
|
|
Net investment income (loss) B | .17 | .23 | .17 | .11 | .12 |
Net realized and unrealized gain (loss) | 2.35 | 1.73 | .02 | 1.39 | 1.85 |
Total from investment operations | 2.52 | 1.96 | .19 | 1.50 | 1.97 |
Distributions from net investment income | (.19) | (.24) | (.19) | (.13) | (.14) |
Distributions from net realized gain | (.05) | - | - | - | - |
Total distributions | (.24) | (.24) | (.19) | (.13) | (.14) |
Net asset value, end of period | $ 14.74 | $ 12.46 | $ 10.74 | $ 10.74 | $ 9.37 |
Total Return A | 20.25% | 18.42% | 1.92% | 16.04% | 26.18% |
Ratios to Average Net Assets C,E |
|
|
|
|
|
Expenses before reductions | .73% | .61% | .60% | .74% | .87% |
Expenses net of fee waivers, if any | .73% | .61% | .60% | .74% | .87% |
Expenses net of all reductions | .73% | .58% | .60% | .73% | .86% |
Net investment income (loss) | 1.22% | 2.01% | 1.65% | 1.14% | 1.36% |
Supplemental Data |
|
|
|
|
|
Net assets, end of period (000 omitted) | $ 3,881 | $ 1,995 | $ 1,519 | $ 1,876 | $ 2,279 |
Portfolio turnover rate D | 64% | 63% | 128% | 120% | 171% |
A Total returns would have been lower if certain expenses had not been reduced during the applicable periods shown.
B Calculated based on average shares outstanding during the period.
C Fees and expenses of any underlying Fidelity Central Funds are not included in the Fund's expense ratio. The Fund indirectly bears its proportionate share of the expenses of any underlying Fidelity Central Funds.
D Amount does not include the portfolio activity of any underlying Fidelity Central Funds.
E Expense ratios reflect operating expenses of the class. Expenses before reductions do not reflect amounts reimbursed by the investment adviser or reductions from brokerage service arrangements or reductions from other expense offset arrangements and do not represent the amount paid by the class during periods when reimbursements or reductions occur. Expenses net of fee waivers reflect expenses after reimbursement by the investment adviser but prior to reductions from brokerage service arrangements or other expense offset arrangements. Expenses net of all reductions represent the net expenses paid by the class.
See accompanying notes which are an integral part of the financial statements.
Annual Report
Notes to Financial Statements
For the period ended January 31, 2014
1. Organization.
Fidelity Stock Selector Large Cap Value Fund (the Fund) is a fund of Fidelity Devonshire Trust (the Trust) and is authorized to issue an unlimited number of shares. The Trust is registered under the Investment Company Act of 1940, as amended (the 1940 Act), as an open-end management investment company organized as a Massachusetts business trust. The Fund offers Class A, Class T, Class C, Stock Selector Large Cap Value and Institutional Class shares, each of which, along with Class B shares, has equal rights as to assets and voting privileges. Class B shares are closed to new accounts and additional purchases, except for exchanges and reinvestments. Each class has exclusive voting rights with respect to matters that affect that class. Class B shares will automatically convert to Class A shares after a holding period of seven years from the initial date of purchase.
2. Investments in Fidelity Central Funds.
The Fund invests in Fidelity Central Funds, which are open-end investment companies generally available only to other investment companies and accounts managed by the investment adviser and its affiliates. The Fund's Schedule of Investments lists each of the Fidelity Central Funds held as of period end, if any, as an investment of the Fund, but does not include the underlying holdings of each Fidelity Central Fund. As an Investing Fund, the Fund indirectly bears its proportionate share of the expenses of the underlying Fidelity Central Funds.
The Money Market Central Funds seek preservation of capital and current income and are managed by Fidelity Investments Money Management, Inc. (FIMM), an affiliate of the investment adviser. Annualized expenses of the Money Market Central Funds as of their most recent shareholder report date are less than .01%.
A complete unaudited list of holdings for each Fidelity Central Fund is available upon request or at the Securities and Exchange Commission (the SEC) website at www.sec.gov. In addition, the financial statements of the Fidelity Central Funds, which are not covered by the Fund's Report of Independent Registered Public Accounting Firm, are available on the SEC website or upon request.
3. Significant Accounting Policies.
The financial statements have been prepared in conformity with accounting principles generally accepted in the United States of America (GAAP), which require management to make certain estimates and assumptions at the date of the financial statements. Actual results could differ from those estimates. Subsequent events, if any, through the date that the financial statements were issued have been evaluated in the preparation of
Annual Report
3. Significant Accounting Policies - continued
the financial statements. The following summarizes the significant accounting policies of the Fund:
Investment Valuation. Investments are valued as of 4:00 p.m. Eastern time on the last calendar day of the period. In accordance with valuation policies and procedures approved by the Board of Trustees (the Board), the Fund attempts to obtain prices from one or more third party pricing vendors or brokers to value its investments. When current market prices, quotations or currency exchange rates are not readily available or reliable, investments will be fair valued in good faith by the Fidelity Management & Research Company (FMR) Fair Value Committee (the Committee), in accordance with procedures adopted by the Board. Factors used in determining fair value vary by investment type and may include market or investment specific events, changes in interest rates and credit quality. The frequency with which these procedures are used cannot be predicted and they may be utilized to a significant extent. The Committee oversees the Fund's valuation policies and procedures and is responsible for approving and reporting to the Board all fair value determinations.
The Fund categorizes the inputs to valuation techniques used to value its investments into a disclosure hierarchy consisting of three levels as shown below:
Level 1 - quoted prices in active markets for identical investments
Level 2 - other significant observable inputs (including quoted prices for similar investments, interest rates, prepayment speeds, etc.)
Level 3 - unobservable inputs (including the Fund's own assumptions based on the best information available)
Valuation techniques used to value the Fund's investments by major category are as follows:
Equity securities, including restricted securities, for which market quotations are readily available, are valued at the last reported sale price or official closing price as reported by a third party pricing vendor on the primary market or exchange on which they are traded and are categorized as Level 1 in the hierarchy. In the event there were no sales during the day or closing prices are not available, securities are valued at the last quoted bid price or may be valued using the last available price and are generally categorized as Level 2 in the hierarchy. For foreign equity securities, when market or security specific events arise, comparisons to the valuation of American Depositary Receipts (ADRs), futures contracts, Exchange-Traded Funds (ETFs) and certain indexes as well as quoted prices for similar securities may be used and would be categorized as Level 2 in the hierarchy. Utilizing these techniques may result in transfers between Level 1 and Level 2. For equity securities, including restricted securities, where observable inputs are
Annual Report
Notes to Financial Statements - continued
3. Significant Accounting Policies - continued
Investment Valuation - continued
limited, assumptions about market activity and risk are used and these securities may be categorized as Level 3 in the hierarchy.
Debt securities, including restricted securities, are valued based on evaluated prices received from third party pricing vendors or from brokers who make markets in such securities. Preferred securities and U.S. government and government agency obligations are valued by pricing vendors who utilize matrix pricing which considers yield or price of bonds of comparable quality, coupon, maturity and type or by broker-supplied prices. When independent prices are unavailable or unreliable, debt securities may be valued utilizing pricing methodologies which consider similar factors that would be used by third party pricing vendors. Debt securities are generally categorized as Level 2 in the hierarchy but may be Level 3 depending on the circumstances.
Futures contracts are valued at the settlement price established each day by the board of trade or exchange on which they are traded and are categorized as Level 1 in the hierarchy. Investments in open-end mutual funds, including the Fidelity Central Funds, are valued at their closing net asset value (NAV) each business day and are categorized as Level 1 in the hierarchy.
Changes in valuation techniques may result in transfers in or out of an assigned level within the disclosure hierarchy. The aggregate value of investments by input level, as of January 31, 2014 is included at the end of the Fund's Schedule of Investments.
Foreign Currency. The Fund may use foreign currency contracts to facilitate transactions in foreign-denominated securities. Gains and losses from these transactions may arise from changes in the value of the foreign currency or if the counterparties do not perform under the contracts' terms.
Foreign-denominated assets, including investment securities, and liabilities are translated into U.S. dollars at the exchange rates at period end. Purchases and sales of investment securities, income and dividends received and expenses denominated in foreign currencies are translated into U.S. dollars at the exchange rate in effect on the transaction date.
The effects of exchange rate fluctuations on investments are included with the net realized and unrealized gain (loss) on investment securities. Other foreign currency transactions resulting in realized and unrealized gain (loss) are disclosed separately.
Investment Transactions and Income. For financial reporting purposes, the Fund's investment holdings and NAV include trades executed through the end of the last business day of the period. The NAV per share for processing shareholder transactions is calculated as of the close of business of the New York Stock Exchange (NYSE), normally
Annual Report
3. Significant Accounting Policies - continued
Investment Transactions and Income - continued
4:00 p.m. Eastern time and includes trades executed through the end of the prior business day. Gains and losses on securities sold are determined on the basis of identified cost and may include proceeds received from litigation. Dividend income is recorded on the ex-dividend date, except for certain dividends from foreign securities where the ex-dividend date may have passed, which are recorded as soon as the Fund is informed of the ex-dividend date. Non-cash dividends included in dividend income, if any, are recorded at the fair market value of the securities received. Distributions received on securities that represent a return of capital or capital gain are recorded as a reduction of cost of investments and/or as a realized gain. Subsequent to ex-dividend date the Fund determines the components of these distributions, based upon receipt of tax filings or other correspondence relating to the underlying investment. Interest income and distributions from the Fidelity Central Funds are accrued as earned. Interest income includes coupon interest and amortization of premium and accretion of discount on debt securities. Investment income is recorded net of foreign taxes withheld where recovery of such taxes is uncertain.
Class Allocations and Expenses. Investment income, realized and unrealized capital gains and losses, common expenses of the Fund, and certain fund-level expense reductions, if any, are allocated daily on a pro-rata basis to each class based on the relative net assets of each class to the total net assets of the Fund. Each class differs with respect to transfer agent and distribution and service plan fees incurred. Certain expense reductions may also differ by class. For the reporting period, the allocated portion of income and expenses to each class as a percent of its average net assets may vary due to the timing of recording these transactions in relation to fluctuating net assets of the classes. Expenses directly attributable to a fund are charged to that fund. Expenses attributable to more than one fund are allocated among the respective funds on the basis of relative net assets or other appropriate methods. Expense estimates are accrued in the period to which they relate and adjustments are made when actual amounts are known.
Income Tax Information and Distributions to Shareholders. Each year, the Fund intends to qualify as a regulated investment company under Subchapter M of the Internal Revenue Code, including distributing substantially all of its taxable income and realized gains. As a result, no provision for U.S. Federal income taxes is required. As of January 31, 2014, the Fund did not have any unrecognized tax benefits in the financial statements; nor is the Fund aware of any tax positions for which it is reasonably possible that the total amounts of unrecognized tax benefits will significantly change in the next twelve months. The Fund files a U.S. federal tax return, in addition to state and local tax returns as required. The Fund's federal income tax returns are subject to examination by the Internal Revenue Service (IRS) for a period of three fiscal years after they are filed.
Annual Report
Notes to Financial Statements - continued
3. Significant Accounting Policies - continued
Income Tax Information and Distributions to Shareholders - continued
State and local tax returns may be subject to examination for an additional fiscal year depending on the jurisdiction. Foreign taxes are provided for based on the Fund's understanding of the tax rules and rates that exist in the foreign markets in which it invests.
Distributions are declared and recorded on the ex-dividend date. Income dividends and capital gain distributions are declared separately for each class. Income and capital gain distributions are determined in accordance with income tax regulations, which may differ from GAAP.
Capital accounts within the financial statements are adjusted for permanent book-tax differences. These adjustments have no impact on net assets or the results of operations. Capital accounts are not adjusted for temporary book-tax differences which will reverse in a subsequent period.
Book-tax differences are primarily due to futures transactions, foreign currency transactions, passive foreign investment companies (PFIC), capital loss carryforwards and losses deferred due to wash sales.
The federal tax cost of investment securities and unrealized appreciation (depreciation) as of period end were as follows:
Gross unrealized appreciation | $ 88,759,455 |
Gross unrealized depreciation | (31,676,236) |
Net unrealized appreciation (depreciation) on securities and other investments | $ 57,083,219 |
|
|
Tax Cost | $ 505,684,050 |
The tax-based components of distributable earnings as of period end were as follows:
Capital loss carryforward | $ (287,150,893) |
Net unrealized appreciation (depreciation) | $ 57,082,305 |
Capital loss carryforwards are only available to offset future capital gains of the Fund to the extent provided by regulations and may be limited. Under the Regulated Investment Company Modernization Act of 2010 (the Act), the Fund is permitted to carry forward capital losses incurred in taxable years beginning after December 22, 2010 for an unlimited period and such capital losses are required to be used prior to any losses that expire.
Annual Report
3. Significant Accounting Policies - continued
Income Tax Information and Distributions to Shareholders - continued
The capital loss carryforward information presented below, including any applicable limitation, is estimated as of fiscal period end and is subject to adjustment.
Fiscal year of expiration |
|
2017 | $ (99,046,054) |
2018 | (188,104,839) |
Total with expiration | $ (287,150,893) |
The tax character of distributions paid was as follows:
| January 31, 2014 | January 31, 2013 |
Ordinary Income | $ 8,810,391 | $ 9,512,706 |
Restricted Securities. The Fund may invest in securities that are subject to legal or contractual restrictions on resale. These securities generally may be resold in transactions exempt from registration or to the public if the securities are registered. Disposal of these securities may involve time-consuming negotiations and expense, and prompt sale at an acceptable price may be difficult. Information regarding restricted securities is included at the end of the Fund's Schedule of Investments.
4. Derivative Instruments.
Risk Exposures and the Use of Derivative Instruments. The Fund's investment objective allows the Fund to enter into various types of derivative contracts, including futures contracts. Derivatives are investments whose value is primarily derived from underlying assets, indices or reference rates and may be transacted on an exchange or over-the-counter (OTC). Derivatives may involve a future commitment to buy or sell a specified asset based on specified terms, to exchange future cash flows at periodic intervals based on a notional principal amount, or for one party to make one or more payments upon the occurrence of specified events in exchange for periodic payments from the other party.
The Fund used derivatives to increase returns and to manage exposure to certain risks as defined below. The success of any strategy involving derivatives depends on analysis of numerous economic factors, and if the strategies for investment do not work as intended, the Fund may not achieve its objectives.
Annual Report
Notes to Financial Statements - continued
4. Derivative Instruments - continued
Risk Exposures and the Use of Derivative Instruments - continued
The Fund's use of derivatives increased or decreased its exposure to the following risk:
Equity Risk | Equity risk relates to the fluctuations in the value of financial instruments as a result of changes in market prices (other than those arising from interest rate risk or foreign exchange risk), whether caused by factors specific to an individual investment, its issuer, or all factors affecting all instruments traded in a market or market segment. |
The Fund is also exposed to additional risks from investing in derivatives, such as liquidity risk and counterparty credit risk. Liquidity risk is the risk that the Fund will be unable to close out the derivative in the open market in a timely manner. Counterparty credit risk is the risk that the counterparty will not be able to fulfill its obligation to the Fund. Counterparty credit risk related to exchange-traded futures contracts may be mitigated by the protection provided by the exchange on which they trade.
Investing in derivatives may involve greater risks than investing in the underlying assets directly and, to varying degrees, may involve risk of loss in excess of any initial investment and collateral received and amounts recognized in the Statement of Assets and Liabilities. In addition, there may be the risk that the change in value of the derivative contract does not correspond to the change in value of the underlying instrument.
Futures Contracts. A futures contract is an agreement between two parties to buy or sell a specified underlying instrument for a fixed price at a specified future date. The Fund used futures contracts to manage its exposure to the stock market.
Upon entering into a futures contract, a fund is required to deposit either cash or securities (initial margin) with a clearing broker in an amount equal to a certain percentage of the face value of the contract. Futures contracts are marked-to-market daily and subsequent daily payments (variation margin) are made or received by a fund depending on the daily fluctuations in the value of the futures contracts and are recorded as unrealized appreciation or (depreciation). This receivable and/or payable, if any, is included in daily variation margin for derivative instruments in the Statement of Assets and Liabilities. Realized gain or (loss) is recorded upon the expiration or closing of a futures contract.
Any open futures contracts at period end are presented in the Schedule of Investments under the caption "Futures Contracts." The underlying face amount at value reflects each contract's exposure to the underlying instrument or index at period end and is representative of volume of activity during the period. Securities deposited to meet initial margin requirements are identified in the Schedule of Investments.
Annual Report
4. Derivative Instruments - continued
Futures Contracts - continued
During the period the Fund recognized net realized gain (loss) of $1,432,461 and a change in net unrealized appreciation (depreciation) of ($477,467) related to its investment in futures contracts. These amounts are included in the Statement of Operations.
5. Purchases and Sales of Investments.
Purchases and sales of securities, other than short-term securities, aggregated $331,992,356 and $368,182,272, respectively.
6. Fees and Other Transactions with Affiliates.
Management Fee. Fidelity Management & Research Company (the investment adviser) and its affiliates provide the Fund with investment management related services for which the Fund pays a monthly management fee. The management fee is the sum of an individual fund fee rate that is based on an annual rate of .30% of the Fund's average net assets and an annualized group fee rate that averaged .25% during the period. The group fee rate is based upon the average net assets of all the mutual funds advised by the investment adviser, including any mutual funds previously advised by the investment adviser that are currently advised by Fidelity SelectCo, LLC, an affiliate of the investment adviser. The group fee rate decreases as assets under management increase and increases as assets under management decrease. In addition, the management fee is subject to a performance adjustment (up to a maximum of ± .20% of the Fund's average net assets over a 36 month performance period). The upward or downward adjustment to the management fee is based on the relative investment performance of Stock Selector Large Cap Value as compared to its benchmark index, the Russell 1000® Value Index, over the same 36 month performance period. For the reporting period, the total annual management fee rate, including the performance adjustment, was .43% of the Fund's average net assets. The performance adjustment included in the management fee rate may be higher or lower than the maximum performance adjustment rate due to the difference between the average net assets for the reporting and performance periods.
Distribution and Service Plan Fees. In accordance with Rule 12b-1 of the 1940 Act, the Fund has adopted separate Distribution and Service Plans for each class of shares. Certain classes pay Fidelity Distributors Corporation (FDC), an affiliate of the investment adviser, separate Distribution and Service Fees, each of which is based on an annual percentage of each class' average net assets. In addition, FDC may pay financial intermediaries for selling shares of the Fund and providing shareholder support services.
Annual Report
Notes to Financial Statements - continued
6. Fees and Other Transactions with Affiliates - continued
Distribution and Service Plan Fees - continued
For the period, the Distribution and Service Fee rates, total fees and amounts retained by FDC were as follows:
| Distribution | Service | Total Fees | Retained |
Class A | -% | .25% | $ 52,892 | $ 3,031 |
Class T | .25% | .25% | 38,660 | 912 |
Class B | .75% | .25% | 16,720 | 12,663 |
Class C | .75% | .25% | 68,955 | 14,236 |
|
|
| $ 177,227 | $ 30,842 |
Sales Load. FDC may receive a front-end sales charge of up to 5.75% for selling Class A shares and 3.50% for selling Class T shares, some of which is paid to financial intermediaries for selling shares of the Fund. Depending on the holding period, FDC may receive contingent deferred sales charges levied on Class A, Class T, Class B, and Class C redemptions. The deferred sales charges range from 5.00% to 1.00% for Class B shares, 1.00% for Class C shares, 1.00% for certain purchases of Class A shares and .25% for certain purchases of Class T shares.
For the period, sales charge amounts retained by FDC were as follows:
| Retained |
Class A | $ 9,148 |
Class T | 2,674 |
Class B* | 2,798 |
Class C* | 2,278 |
| $ 16,898 |
* When Class B and Class C shares are initially sold, FDC pays commissions from its own resources to financial intermediaries through which the sales are made.
Transfer Agent Fees. Fidelity Investments Institutional Operations Company, Inc., (FIIOC), an affiliate of the investment adviser, is the transfer, dividend disbursing and shareholder servicing agent for each class of the Fund. FIIOC receives account fees and asset-based fees that vary according to the account size and type of account of the shareholders of the respective classes of the Fund. FIIOC pays for typesetting, printing and mailing of shareholder reports, except proxy statements.
Annual Report
6. Fees and Other Transactions with Affiliates - continued
Transfer Agent Fees - continued
For the period, transfer agent fees for each class were as follows:
| Amount | % of |
Class A | $ 52,844 | .25 |
Class T | 24,258 | .31 |
Class B | 5,042 | .30 |
Class C | 20,908 | .30 |
Stock Selector Large Cap Value | 1,065,839 | .21 |
Institutional Class | 7,046 | .23 |
| $ 1,175,937 |
|
Accounting and Security Lending Fees. Fidelity Service Company, Inc. (FSC), an affiliate of the investment adviser, maintains the Fund's accounting records. The accounting fee is based on the level of average net assets for each month. Under a separate contract, FSC administers the security lending program. The security lending fee is based on the number and duration of lending transactions.
Brokerage Commissions. The Fund placed a portion of its portfolio transactions with brokerage firms which are affiliates of the investment adviser. Brokerage commissions are included in net realized gain (loss) and change in net unrealized appreciation (depreciation) in the Statement of Operations. The commissions paid to these affiliated firms were $10,422 for the period.
7. Committed Line of Credit.
The Fund participates with other funds managed by the investment adviser or an affiliate in a $4.25 billion credit facility (the "line of credit") to be utilized for temporary or emergency purposes to fund shareholder redemptions or for other short-term liquidity purposes. The Fund has agreed to pay commitment fees on its pro-rata portion of the line of credit, which amounted to $821 and is reflected in Miscellaneous expenses on the Statement of Operations. During the period, there were no borrowings on this line of credit.
8. Security Lending.
The Fund lends portfolio securities through a lending agent from time to time in order to earn additional income. For equity securities, a lending agent is used and may loan securities to certain qualified borrowers, including Fidelity Capital Markets (FCM), a
Annual Report
Notes to Financial Statements - continued
8. Security Lending - continued
broker-dealer affiliated with the Fund. On the settlement date of the loan, the Fund receives collateral (in the form of U.S. Treasury obligations, letters of credit and/or cash) against the loaned securities and maintains collateral in an amount not less than 100% of the market value of the loaned securities during the period of the loan. The market value of the loaned securities is determined at the close of business of the Fund and any additional required collateral is delivered to the Fund on the next business day. If the borrower defaults on its obligation to return the securities loaned because of insolvency or other reasons, the Fund may apply collateral received from the borrower against the obligation. The Fund may experience delays and costs in recovering the securities loaned. Any cash collateral received is invested the Fidelity Securities Lending Cash Central Fund. The value of loaned securities and cash collateral at period end are disclosed on the Fund's Statement of Assets and Liabilities. The value of securities loaned to FCM at period end was $320,276. Security lending income represents the income earned on investing cash collateral, less rebates paid to borrowers and any lending agent fees associated with the loan, plus any premium payments received for lending certain types of securities. Security lending income is presented in the Statement of Operations as a component of income from Fidelity Central Funds. Total security lending income during the period amounted to $47,322, including $2,017 from securities loaned to FCM.
9. Expense Reductions.
Commissions paid to certain brokers with whom the investment adviser, or its affiliates, places trades on behalf of the Fund include an amount in addition to trade execution, which may be rebated back to the Fund to offset certain expenses. This amount totaled $13,415 for the period.
In addition, the investment adviser reimbursed a portion of the Fund's operating expenses during the period in the amount of $8,776.
10. Distributions to Shareholders.
Distributions to shareholders of each class were as follows:
Years ended January 31, | 2014 | 2013 |
From net investment income |
|
|
Class A | $ 211,924 | $ 304,000 |
Class T | 63,275 | 93,858 |
Class B | 3,263 | 16,188 |
Class C | 27,297 | 63,927 |
Stock Selector Large Cap Value | 6,677,131 | 8,993,963 |
Institutional Class | 45,623 | 40,770 |
Total | $ 7,028,513 | $ 9,512,706 |
Annual Report
10. Distributions to Shareholders - continued
Years ended January 31, | 2014 | 2013 |
From net realized gain |
|
|
Class A | $ 67,665 | $ - |
Class T | 26,666 | - |
Class B | 5,288 | - |
Class C | 24,673 | - |
Stock Selector Large Cap Value | 1,646,206 | - |
Institutional Class | 11,380 | - |
Total | $ 1,781,878 | $ - |
11. Share Transactions.
Transactions for each class of shares were as follows:
| Shares | Dollars | ||
Years ended January 31, | 2014 | 2013 | 2014 | 2013 |
Class A |
|
|
|
|
Shares sold | 453,976 | 251,269 | $ 6,296,444 | $ 2,848,724 |
Reinvestment of distributions | 17,878 | 24,461 | 258,884 | 281,542 |
Shares redeemed | (493,396) | (573,384) | (7,077,208) | (6,434,025) |
Net increase (decrease) | (21,542) | (297,654) | $ (521,880) | $ (3,303,759) |
Class T |
|
|
|
|
Shares sold | 162,162 | 131,721 | $ 2,245,109 | $ 1,501,274 |
Reinvestment of distributions | 6,114 | 8,058 | 88,742 | 92,826 |
Shares redeemed | (134,046) | (136,167) | (1,877,963) | (1,544,492) |
Net increase (decrease) | 34,230 | 3,612 | $ 455,888 | $ 49,608 |
Class B |
|
|
|
|
Shares sold | 3,348 | 1,157 | $ 45,970 | $ 13,142 |
Reinvestment of distributions | 509 | 1,236 | 7,427 | 14,255 |
Shares redeemed | (25,299) | (39,897) | (347,355) | (452,422) |
Net increase (decrease) | (21,442) | (37,504) | $ (293,958) | $ (425,025) |
Class C |
|
|
|
|
Shares sold | 146,694 | 162,948 | $ 2,029,290 | $ 1,812,867 |
Reinvestment of distributions | 3,139 | 4,869 | 45,227 | 55,503 |
Shares redeemed | (88,666) | (162,163) | (1,208,921) | (1,799,733) |
Net increase (decrease) | 61,167 | 5,654 | $ 865,596 | $ 68,637 |
Annual Report
Notes to Financial Statements - continued
11. Share Transactions - continued
| Shares | Dollars | ||
Years ended January 31, | 2014 | 2013 | 2014 | 2013 |
Stock Selector Large Cap Value |
|
|
|
|
Shares sold | 7,167,684 | 3,974,459 | $ 100,838,739 | $ 45,488,310 |
Reinvestment of distributions | 556,371 | 757,439 | 8,100,157 | 8,771,144 |
Shares redeemed | (9,956,522) | (12,329,354) | (139,235,813) | (140,694,347) |
Net increase (decrease) | (2,232,467) | (7,597,456) | $ (30,296,917) | $ (86,434,893) |
Institutional Class |
|
|
|
|
Shares sold | 206,722 | 54,716 | $ 2,877,195 | $ 619,947 |
Reinvestment of distributions | 3,795 | 3,536 | 55,110 | 40,770 |
Shares redeemed | (107,442) | (39,612) | (1,516,961) | (460,078) |
Net increase (decrease) | 103,075 | 18,640 | $ 1,415,344 | $ 200,639 |
12. Other.
The Fund's organizational documents provide former and current trustees and officers with a limited indemnification against liabilities arising in connection with the performance of their duties to the Fund. In the normal course of business, the Fund may also enter into contracts that provide general indemnifications. The Fund's maximum exposure under these arrangements is unknown as this would be dependent on future claims that may be made against the Fund. The risk of material loss from such claims is considered remote.
Annual Report
Report of Independent Registered Public Accounting Firm
To the Trustees of Fidelity Devonshire Trust and the Shareholders of Fidelity Stock Selector Large Cap Value Fund:
In our opinion, the accompanying statement of assets and liabilities, including the schedule of investments, and the related statements of operations and of changes in net assets and the financial highlights present fairly, in all material respects, the financial position of Fidelity Stock Selector Large Cap Value Fund (a fund of Fidelity Devonshire Trust) at January 31, 2014, the results of its operations for the year then ended, the changes in its net assets for each of the two years in the period then ended and the financial highlights for each of the five years in the period then ended, in conformity with accounting principles generally accepted in the United States of America. These financial statements and financial highlights (hereafter referred to as "financial statements") are the responsibility of the Fidelity Stock Selector Large Cap Value Fund's management. Our responsibility is to express an opinion on these financial statements based on our audits. We conducted our audits of these financial statements in accordance with the standards of the Public Company Accounting Oversight Board (United States). Those standards require that we plan and perform the audit to obtain reasonable assurance about whether the financial statements are free of material misstatement. An audit includes examining, on a test basis, evidence supporting the amounts and disclosures in the financial statements, assessing the accounting principles used and significant estimates made by management, and evaluating the overall financial statement presentation. We believe that our audits, which included confirmation of securities at January 31, 2014 by correspondence with the custodian and brokers, provide a reasonable basis for our opinion.
PricewaterhouseCoopers LLP
Boston, Massachusetts
March 14, 2014
Annual Report
Trustees and Officers
The Trustees, Member of the Advisory Board, and officers of the trust and fund, as applicable, are listed below. The Board of Trustees governs the fund and is responsible for protecting the interests of shareholders. The Trustees are experienced executives who meet periodically throughout the year to oversee the fund's activities, review contractual arrangements with companies that provide services to the fund, oversee management of the risks associated with such activities and contractual arrangements, and review the fund's performance. Except for James C. Curvey, Ned C. Lautenbach, and William S. Stavropoulos, each of the Trustees oversees 173 funds. Mr. Curvey oversees 396 funds. Mr. Lautenbach and Mr. Stavropoulos each oversees 247 funds.
The Trustees hold office without limit in time except that (a) any Trustee may resign; (b) any Trustee may be removed by written instrument, signed by at least two-thirds of the number of Trustees prior to such removal; (c) any Trustee who requests to be retired or who has become incapacitated by illness or injury may be retired by written instrument signed by a majority of the other Trustees; and (d) any Trustee may be removed at any special meeting of shareholders by a two-thirds vote of the outstanding voting securities of the trust. Each Trustee who is not an interested person (as defined in the 1940 Act) of the trust and the fund (Independent Trustee), shall retire not later than the last day of the calendar year in which his or her 75th birthday occurs. The Independent Trustees may waive this mandatory retirement age policy with respect to individual Trustees. The officers and Advisory Board Member hold office without limit in time, except that any officer and Advisory Board Member may resign or may be removed by a vote of a majority of the Trustees at any regular meeting or any special meeting of the Trustees. Except as indicated, each individual has held the office shown or other offices in the same company for the past five years.
Experience, Skills, Attributes, and Qualifications of the Fund's Trustees. The Governance and Nominating Committee has adopted a statement of policy that describes the experience, qualifications, attributes, and skills that are necessary and desirable for potential Independent Trustee candidates (Statement of Policy). The Board believes that each Trustee satisfied at the time he or she was initially elected or appointed a Trustee, and continues to satisfy, the standards contemplated by the Statement of Policy. The Governance and Nominating Committee also engages professional search firms to help identify potential Independent Trustee candidates who have the experience, qualifications, attributes, and skills consistent with the Statement of Policy. From time to time, additional criteria based on the composition and skills of the current Independent Trustees, as well as experience or skills that may be appropriate in light of future changes to board composition, business conditions, and regulatory or other developments, have also been considered by the professional search firms and the Governance and Nominating Committee. In addition, the Board takes into account the Trustees' commitment and participation in Board and committee meetings, as well as their leadership of standing and ad hoc committees throughout their tenure.
Annual Report
Trustees and Officers - continued
In determining that a particular Trustee was and continues to be qualified to serve as a Trustee, the Board has considered a variety of criteria, none of which, in isolation, was controlling. The Board believes that, collectively, the Trustees have balanced and diverse experience, qualifications, attributes, and skills, which allow the Board to operate effectively in governing the fund and protecting the interests of shareholders. Information about the specific experience, skills, attributes, and qualifications of each Trustee, which in each case led to the Board's conclusion that the Trustee should serve (or continue to serve) as a trustee of the fund, is provided below.
Board Structure and Oversight Function. James C. Curvey is an interested person (as defined in the 1940 Act) and currently serves as Chairman. The Trustees have determined that an interested Chairman is appropriate and benefits shareholders because an interested Chairman has a personal and professional stake in the quality and continuity of services provided to the fund. Independent Trustees exercise their informed business judgment to appoint an individual of their choosing to serve as Chairman, regardless of whether the Trustee happens to be independent or a member of management. The Independent Trustees have determined that they can act independently and effectively without having an Independent Trustee serve as Chairman and that a key structural component for assuring that they are in a position to do so is for the Independent Trustees to constitute a substantial majority for the Board. The Independent Trustees also regularly meet in executive session. Ned C. Lautenbach serves as Chairman of the Independent Trustees and as such (i) acts as a liaison between the Independent Trustees and management with respect to matters important to the Independent Trustees and (ii) with management prepares agendas for Board meetings.
Fidelity funds are overseen by different Boards of Trustees. The fund's Board oversees Fidelity's equity and high income funds and another Board oversees Fidelity's investment-grade bond, money market, and asset allocation funds. The asset allocation funds may invest in Fidelity funds overseen by the fund's Board. The use of separate Boards, each with its own committee structure, allows the Trustees of each group of Fidelity funds to focus on the unique issues of the funds they oversee, including common research, investment, and operational issues. On occasion, the separate Boards establish joint committees to address issues of overlapping consequences for the Fidelity funds overseen by each Board.
The Trustees operate using a system of committees to facilitate the timely and efficient consideration of all matters of importance to the Trustees, the fund, and fund shareholders and to facilitate compliance with legal and regulatory requirements and oversight of the fund's activities and associated risks. The Board, acting through its committees, has charged FMR and its affiliates with (i) identifying events or circumstances the occurrence of which could have demonstrably adverse effects on the fund's business and/or reputation; (ii) implementing processes and controls to lessen the possibility that such events or circumstances occur or to mitigate the effects of such events or circumstances if they do occur; and (iii) creating and maintaining a system designed to evaluate continuously business and market conditions in order to facilitate the identification and implementation processes described in (i) and (ii) above. Because the day-to-day operations and activities of the fund are carried out by or through FMR, its affiliates and other service providers, the fund's exposure to risks is mitigated but not eliminated by the processes overseen by the Trustees. While each of the Board's committees has responsibility for overseeing different aspects of the fund's activities, oversight is exercised primarily through the Operations, Audit, and Compliance Committees. In addition, the Independent Trustees have worked with FMR to enhance the Board's oversight of investment and financial risks, legal and regulatory risks, technology risks, and operational risks, including the development of additional risk reporting to the Board. For example, a working group comprised of Independent Trustees and FMR has worked and continues to work to review the Fidelity funds' valuation-related activities, reporting and risk management. Appropriate personnel, including but not limited to the fund's Chief Compliance Officer (CCO), FMR's internal auditor, the independent accountants, the fund's Treasurer and portfolio management personnel, make periodic reports to the Board's committees, as appropriate, including an annual review of FMR's risk management program for the Fidelity funds. The responsibilities of each standing committee, including their oversight responsibilities, are described further under "Standing Committees of the Fund's Trustees."
Annual Report
The fund's Statement of Additional Information (SAI) includes more information about the Trustees. To request a free copy, call Fidelity at 1-800-544-8544.
Interested Trustees*:
Correspondence intended for each Trustee who is an interested person may be sent to Fidelity Investments, 245 Summer Street, Boston, Massachusetts 02210.
Name, Year of Birth; Principal Occupations and Other Relevant Experience+ | |
James C. Curvey (1935) | |
Year of Election or Appointment: 2007 Trustee Chairman of the Board of Trustees | |
| Mr. Curvey also serves as Trustee of other Fidelity funds. Mr. Curvey is a Director of Fidelity Investments Money Management, Inc. (2009-present), Director of Fidelity Research & Analysis Co. (2009-present) and Director of FMR and FMR Co., Inc. (2007-present). Mr. Curvey is also Vice Chairman (2007-present) and Director of FMR LLC. In addition, Mr. Curvey serves as an Overseer for the Boston Symphony Orchestra and a member of the Trustees of Villanova University. Previously, Mr. Curvey was the Vice Chairman (2006-2007) and Director (2000-2007) of FMR Corp. |
Charles S. Morrison (1960) | |
Year of Election or Appointment: 2014 Trustee | |
| Mr. Morrison also serves as Trustee or Vice President of other funds. He serves as President, Asset Management (2014-present) and is an employee of Fidelity Investments. Previously, Mr. Morrison served as President, Fixed Income (2011-2014), Vice President of Fidelity's Money Market Funds (2005-2009), President, Money Market Group Leader of FMR (2009), and Senior Vice President, Money Market Group of FMR (2004-2009). Mr. Morrison also served as Vice President of Fidelity's Bond Funds (2002-2005), certain Balanced Funds (2002-2005), and certain Asset Allocation Funds (2002-2007), and as Senior Vice President (2002-2005) of Fidelity's Bond Division. |
* Trustees have been determined to be "Interested Trustees" by virtue of, among other things, their affiliation with the trust or various entities under common control with FMR.
+ The information above includes each Trustee's principal occupation during the last five years and other information relating to the experience, attributes, and skills relevant to each Trustee's qualifications to serve as a Trustee, which led to the conclusion that each Trustee should serve as a Trustee for the fund.
Annual Report
Independent Trustees:
Correspondence intended for each Independent Trustee (that is, the Trustees other than the Interested Trustees) may be sent to Fidelity Investments, P.O. Box 55235, Boston, Massachusetts 02205-5235.
Name, Year of Birth; Principal Occupations and Other Relevant Experience+ | |
Dennis J. Dirks (1948) | |
Year of Election or Appointment: 2005 Trustee | |
| Mr. Dirks also serves as Trustee of other Fidelity funds. Prior to his retirement in May 2003, Mr. Dirks was Chief Operating Officer and a member of the Board of The Depository Trust & Clearing Corporation (DTCC). He also served as President, Chief Operating Officer, and Board member of The Depository Trust Company (DTC) and President and Board member of the National Securities Clearing Corporation (NSCC). In addition, Mr. Dirks served as Chief Executive Officer and Board member of the Government Securities Clearing Corporation, Chief Executive Officer and Board member of the Mortgage-Backed Securities Clearing Corporation, as a Trustee and a member of the Finance Committee of Manhattan College (2005-2008), and as a Trustee and a member of the Finance Committee of AHRC of Nassau County (2006-2008). Mr. Dirks is a member of the Independent Directors Council (IDC) Governing Council (2010-present) and Board of Directors for The Brookville Center for Children's Services, Inc. (2009-present). |
Alan J. Lacy (1953) | |
Year of Election or Appointment: 2008 Trustee | |
| Mr. Lacy also serves as Trustee of other Fidelity funds. Mr. Lacy serves as Senior Adviser (2007-present) of Oak Hill Capital Partners, L.P. (private equity). Mr. Lacy also served as Chief Executive Officer (2000-2005) and Vice Chairman (2005-2006) of Sears Holdings Corporation and Sears, Roebuck and Co. (retail). In addition, Mr. Lacy serves as a member of the Board of Directors of Dave & Buster's Entertainment, Inc. (restaurant and entertainment complexes, 2010-present), Earth Fare, Inc. (retail grocery, 2012-present), The Hillman Companies, Inc. (hardware wholesalers, 2010-present), and Bristol-Myers Squibb Company (global pharmaceuticals, 2008-present). Mr. Lacy is a member of the Board of Trustees of The National Parks Conservation Association (2006-present). Previously, Mr. Lacy served as Chairman of the Board of Trustees of the National Parks Conservation Association (2008-2011) and as a member of the Board of Directors for the Western Union Company (global money transfer, 2006-2011). |
Ned C. Lautenbach (1944) | |
Year of Election or Appointment: 2000 Trustee Chairman of the Independent Trustees | |
| Mr. Lautenbach also serves as Trustee of other Fidelity funds. Mr. Lautenbach currently serves as the Lead Director of the Eaton Corporation Board of Directors (diversified industrial, 1997-present). Mr. Lautenbach is Chairman of the Board of Directors of the Philharmonic Center for the Arts in Naples, Florida (2012-present) and a member of the Council on Foreign Relations (1994-present). Previously, Mr. Lautenbach was a Partner/Advisory Partner at Clayton, Dubilier & Rice, LLC (private equity investment, 1998-2010), as well as a Director of Sony Corporation (2006-2007). |
Joseph Mauriello (1944) | |
Year of Election or Appointment: 2008 Trustee | |
| Mr. Mauriello also serves as Trustee of other Fidelity funds. Prior to his retirement in January 2006, Mr. Mauriello served in numerous senior management positions including Deputy Chairman and Chief Operating Officer (2004-2005), and Vice Chairman of Financial Services (2002-2004) of KPMG LLP US (professional services, 1965-2005). Mr. Mauriello currently serves as a member of the Board of Directors of XL Group plc. (global insurance and re-insurance, 2006-present). Previously, Mr. Mauriello served as a Director of the Hamilton Funds of the Bank of New York (2006-2007) and of Arcadia Resources Inc. (health care services and products, 2007-2012). |
Robert W. Selander (1950) | |
Year of Election or Appointment: 2011 Trustee | |
| Mr. Selander also serves as Trustee of other Fidelity funds. Previously, Mr. Selander served as a Member of the Advisory Board of other Fidelity funds (2011), and Executive Vice Chairman (2010), Chief Executive Officer (2009-2010), and President and Chief Executive Officer (1997-2009) of Mastercard, Inc. |
Cornelia M. Small (1944) | |
Year of Election or Appointment: 2005 Trustee | |
| Ms. Small also serves as Trustee of other Fidelity funds. Ms. Small is a member of the Board of Directors (2009-present) and Chair of the Investment Committee (2010-present) of the Teagle Foundation. Ms. Small also serves on the Investment Committee of the Berkshire Taconic Community Foundation (2008-present). Previously, Ms. Small served as Chairperson (2002-2008) and a member of the Investment Committee and Chairperson (2008-2012) and a member of the Board of Trustees of Smith College. In addition, Ms. Small served as Chief Investment Officer, Director of Global Equity Investments, and a member of the Board of Directors of Scudder, Stevens & Clark and Scudder Kemper Investments. |
William S. Stavropoulos (1939) | |
Year of Election or Appointment: 2002 Trustee Vice Chairman of the Independent Trustees | |
| Mr. Stavropoulos also serves as Trustee of other Fidelity funds. Mr. Stavropoulos serves as President and Founder of the Michigan Baseball Foundation, the Great Lakes Loons (2007-present). Mr. Stavropoulos is Chairman Emeritus of the Board of Directors of The Dow Chemical Company, where he previously served in numerous senior management positions, including President, CEO (1995-2000; 2002-2004), Chairman of the Executive Committee (2000-2006), and as a member of the Board of Directors (1990-2006). Currently, Mr. Stavropoulos is Chairman of the Board of Directors of Univar Inc. (global distributor of commodity and specialty chemicals), a Director of Teradata Corporation (data warehousing and technology solutions), and Maersk Inc. (industrial conglomerate), and a member of the Advisory Board for Metalmark Capital LLC (private equity investment, 2005-present). Mr. Stavropoulos is an operating advisor to Clayton, Dubilier & Rice, LLC (private equity investment). In addition, Mr. Stavropoulos is a member of the University of Notre Dame Advisory Council for the College of Science, a Trustee of the Rollin L. Gerstacker Foundation, and a Director of the Naples Philharmonic Center for the Arts. Previously, Mr. Stavropoulos served as a Director of Chemical Financial Corporation (bank holding company, 1993-2012) and Tyco International, Ltd. (multinational manufacturing and services, 2007-2012). |
David M. Thomas (1949) | |
Year of Election or Appointment: 2008 Trustee | |
| Mr. Thomas also serves as Trustee of other Fidelity funds. Mr. Thomas serves as Non-Executive Chairman of the Board of Directors of Fortune Brands Home and Security (home and security products, 2011-present), and as a member of the Board of Directors of Interpublic Group of Companies, Inc. (marketing communication, 2004-present). Previously, Mr. Thomas served as Executive Chairman (2005-2006) and Chairman and Chief Executive Officer (2000-2005) of IMS Health, Inc. (pharmaceutical and healthcare information solutions), and a Director of Fortune Brands, Inc. (consumer products, 2000-2011). |
+ The information above includes each Trustee's principal occupation during the last five years and other information relating to the experience, attributes, and skills relevant to each Trustee's qualifications to serve as a Trustee, which led to the conclusion that each Trustee should serve as a Trustee for the fund.
Advisory Board Member and Officers:
Correspondence intended for each officer and Peter S. Lynch may be sent to Fidelity Investments, 245 Summer Street, Boston, Massachusetts 02210. Officers appear below in alphabetical order.
Name, Year of Birth; Principal Occupation | |
Peter S. Lynch (1944) | |
Year of Election or Appointment: 2003 Member of the Advisory Board | |
| Mr. Lynch also serves as Member of the Advisory Board of other Fidelity funds. Mr. Lynch is Vice Chairman and a Director of FMR and FMR Co., Inc. In addition, Mr. Lynch serves as a Trustee of Boston College and as the Chairman of the Inner-City Scholarship Fund. Previously, Mr. Lynch served on the Special Olympics International Board of Directors (1997-2006). |
Elizabeth Paige Baumann (1968) | |
Year of Election or Appointment: 2012 Anti-Money Laundering (AML) Officer | |
| Ms. Baumann also serves as AML Officer of other funds. She is Chief AML Officer of FMR LLC (2012-present) and is an employee of Fidelity Investments. Previously, Ms. Baumann served as Vice President and Deputy Anti-Money Laundering Officer (2007-2012). |
William C. Coffey (1969) | |
Year of Election or Appointment: 2009 Assistant Secretary | |
| Mr. Coffey also serves as Assistant Secretary of other funds. He is Senior Vice President and Deputy General Counsel of FMR LLC (2010-present), and is an employee of Fidelity Investments. Previously, Mr. Coffey served as Vice President and Associate General Counsel of FMR LLC (2005-2009). |
Jonathan Davis (1968) | |
Year of Election or Appointment: 2010 Assistant Treasurer | |
| Mr. Davis also serves as Assistant Treasurer of other funds. Mr. Davis is an employee of Fidelity Investments. Previously, Mr. Davis served as Vice President and Associate General Counsel of FMR LLC (2003-2010). |
Adrien E. Deberghes (1967) | |
Year of Election or Appointment: 2008 Deputy Treasurer | |
| Mr. Deberghes also serves as an officer of other funds. He is an employee of Fidelity Investments (2008-present). Prior to joining Fidelity Investments, Mr. Deberghes was Senior Vice President of Mutual Fund Administration at State Street Corporation (2007-2008), Senior Director of Mutual Fund Administration at Investors Bank & Trust (2005-2007), and Director of Finance for Dunkin' Brands (2000-2005). |
Stephanie J. Dorsey (1969) | |
Year of Election or Appointment: 2010 Assistant Treasurer | |
| Ms. Dorsey also serves as an officer of other funds. She is an employee of Fidelity Investments (2008-present) and has served in other fund officer roles. Prior to joining Fidelity Investments, Ms. Dorsey served as Treasurer (2004-2008) of the JPMorgan Mutual Funds and Vice President (2004-2008) of JPMorgan Chase Bank. |
Scott C. Goebel (1968) | |
Year of Election or Appointment: 2008 Secretary and Chief Legal Officer (CLO) | |
| Mr. Goebel serves as Secretary and CLO of other funds. Mr. Goebel also serves as Secretary of Fidelity SelectCo, LLC (2013-present), Fidelity Investments Money Management, Inc. (FIMM) (2010-present) and Fidelity Research and Analysis Company (FRAC) (2010-present); General Counsel, Secretary, and Senior Vice President of FMR (2008-present) and FMR Co., Inc. (2008-present); Chief Legal Officer of Fidelity Management & Research (Hong Kong) Limited (2008-present); and Assistant Secretary of Fidelity Management & Research (Japan) Inc. (2008-present) and Fidelity Management & Research (U.K.) Inc. (2008-present). Previously, Mr. Goebel served as Secretary and CLO of other Fidelity funds (2008-2013), Assistant Secretary of FIMM (2008-2010), FRAC (2008-2010), and certain funds (2007-2008); and as Vice President and Secretary of Fidelity Distributors Corporation (FDC) (2005-2007). Mr. Goebel has been employed by FMR LLC or an affiliate since 2001. |
Joseph A. Hanlon (1968) | |
Year of Election or Appointment: 2012 Chief Compliance Officer | |
| Mr. Hanlon also serves as Chief Compliance Officer of other funds. Mr. Hanlon serves as Compliance Officer of FMR, FMR Co., Inc., Fidelity Investments Money Management, Inc. (FIMM), Fidelity Research and Analysis Company (FRAC), and Fidelity Management & Research (Hong Kong) (2009-present), as Senior Vice President of the Fidelity Asset Management Division (2009-present), and is an employee of Fidelity Investments. Previously, Mr. Hanlon served as Compliance Officer of Fidelity Management & Research (Japan) Inc. (2009-2013), Strategic Advisers, Inc. (2009-2013), and Fidelity Management & Research (U.K.) Inc. (2009-2013). |
Thomas C. Hense (1964) | |
Year of Election or Appointment: 2008/2010 Vice President | |
| Mr. Hense also serves as Vice President of other funds (High Income (2008), Small Cap (2008), and Value (2010) funds). Previously, Mr. Hense served as a portfolio manager for Fidelity's Institutional Money Management Group (Pyramis) (2003-2008). |
Brian B. Hogan (1964) | |
Year of Election or Appointment: 2009 Vice President | |
| Mr. Hogan also serves as Trustee or Vice President of other funds. Mr. Hogan serves as President of FMR's Equity Division (2009-present). Previously, Mr. Hogan served as Senior Vice President, Equity Research of FMR (2006-2009) and as a portfolio manager. |
Chris Maher (1972) | |
Year of Election or Appointment: 2013 Assistant Treasurer | |
| Mr. Maher serves as Assistant Treasurer of other funds. Mr. Maher is Vice President of Valuation Oversight and is an employee of Fidelity Investments. Previously, Mr. Maher served as Vice President of Asset Management Compliance (2013), Vice President of FMR's Program Management Group (2010-2013), and Vice President of Valuation Oversight (2008-2010). |
Christine Reynolds (1958) | |
Year of Election or Appointment: 2008 Chief Financial Officer | |
| Ms. Reynolds also serves as Chief Financial Officer of other funds. Ms. Reynolds became President of Fidelity Pricing and Cash Management Services (FPCMS) in August 2008. Ms. Reynolds served as Chief Operating Officer of FPCMS (2007-2008). Previously, Ms. Reynolds served as President, Treasurer, and Anti-Money Laundering officer of the Fidelity funds (2004-2007). |
Kenneth B. Robins (1969) | |
Year of Election or Appointment: 2008 President and Treasurer | |
| Mr. Robins also serves as an officer of other funds. Mr. Robins serves as Executive Vice President of Fidelity Investments Money Management, Inc. (FIMM) (2013-present) and is an employee of Fidelity Investments (2004-present). Previously, Mr. Robins served in other fund officer roles. |
Gary W. Ryan (1958) | |
Year of Election or Appointment: 2005 Assistant Treasurer | |
| Mr. Ryan also serves as Assistant Treasurer of other funds. Mr. Ryan is an employee of Fidelity Investments and has served in other fund officer roles. Previously, Mr. Ryan served as Vice President of Fund Reporting in Fidelity Pricing and Cash Management Services (FPCMS) (1999-2005). |
Stephen Sadoski (1971) | |
Year of Election or Appointment: 2012 Deputy Treasurer | |
| Mr. Sadoski also serves as Deputy Treasurer of other funds. He is an employee of Fidelity Investments (2012-present) and has served in another fund officer role. Prior to joining Fidelity Investments, Mr. Sadoski served as an assistant chief accountant in the Division of Investment Management of the Securities and Exchange Commission (SEC) (2009-2012) and as a senior manager at Deloitte & Touche LLP (1997-2009). |
Stacie M. Smith (1974) | |
Year of Election or Appointment: 2013 Deputy Treasurer | |
| Ms. Smith also serves as an officer of other funds. She is an employee of Fidelity Investments (2009-present) and has served in other fund officer roles. Prior to joining Fidelity Investments, Ms. Smith served as Senior Audit Manager of Ernst & Young LLP (1996-2009). |
Renee Stagnone (1975) | |
Year of Election or Appointment: 2013 Deputy Treasurer | |
| Ms. Stagnone also serves as Deputy Treasurer of other funds. Ms. Stagnone is an employee of Fidelity Investments. |
Joseph F. Zambello (1957) | |
Year of Election or Appointment: 2011 Deputy Treasurer | |
| Mr. Zambello also serves as Deputy Treasurer of other funds. Mr. Zambello is an employee of Fidelity Investments. Previously, Mr. Zambello served as Vice President of FMR's Program Management Group (2009-2011) and Vice President of the Transfer Agent Oversight Group (2005-2009). |
Annual Report
Distributions (Unaudited)
Stock Selector Large Cap Value designates 100% of the dividends distributed during the fiscal year as qualifying for the dividends-received deduction for corporate shareholders.
Stock Selector Large Cap Value designates 100% of the dividends distributed during the fiscal year as amounts which may be taken into account as a dividend for purposes of the maximum rate under section 1(h)(11) of the Internal Revenue Code.
The fund will notify shareholders in January 2015 of amounts for use in preparing 2014 income tax returns.
Annual Report
Investment Adviser
Fidelity Management & Research Company
Boston, MA
Investment Sub-Advisers
FMR Co., Inc.
Fidelity Management & Research
(U.K.) Inc.
Fidelity Management & Research
(Hong Kong) Limited
Fidelity Management & Research
(Japan) Inc.
General Distributor
Fidelity Distributors Corporation
Smithfield, RI
Transfer and Service Agents
Fidelity Investments Institutional
Operations Company, Inc.
Boston, MA
Fidelity Service Company, Inc.
Boston, MA
Custodian
Citibank, N.A.
New York, NY
The Fidelity Telephone Connection
Mutual Fund 24-Hour Service
Exchanges/Redemptions
and Account Assistance 1-800-544-6666
Product Information 1-800-544-6666
Retirement Accounts 1-800-544-4774
(8 a.m. - 9 p.m.)
TDD Service 1-800-544-0118
for the deaf and hearing impaired
(9 a.m. - 9 p.m. Eastern time)
Fidelity Automated Service
Telephone (FAST®)
1-800-544-5555
Automated line for quickest service
(Fidelity Investment logo)(registered trademark)
Corporate Headquarters
245 Summer St., Boston, MA 02210
www.fidelity.com
LCV-UANN-0314
1.900193.104
Item 2. Code of Ethics
As of the end of the period, January 31, 2014, Fidelity Devonshire Trust (the trust) has adopted a code of ethics, as defined in Item 2 of Form N-CSR, that applies to its President and Treasurer and its Chief Financial Officer. A copy of the code of ethics is filed as an exhibit to this Form N-CSR.
Item 3. Audit Committee Financial Expert
The Board of Trustees of the trust has determined that Joseph Mauriello is an audit committee financial expert, as defined in Item 3 of Form N-CSR. Mr. Mauriello is independent for purposes of Item 3 of Form N-CSR.
Item 4. Principal Accountant Fees and Services
Fees and Services
The following table presents fees billed by Deloitte & Touche LLP, the member firms of Deloitte Touche Tohmatsu, and their respective affiliates (collectively, "Deloitte Entities") in each of the last two fiscal years for services rendered to Fidelity Advisor Series Equity-Income Fund, Fidelity Series All-Sector Equity Fund, and Fidelity Series Equity-Income Fund (the "Funds"):
Services Billed by Deloitte Entities
January 31, 2014 FeesA
| Audit Fees | Audit-Related Fees | Tax Fees | All Other Fees |
Fidelity Advisor Series Equity-Income Fund | $47,000 | $- | $6,300 | $700 |
Fidelity Series All-Sector Equity Fund | $51,000 | $- | $5,000 | $2,600 |
Fidelity Series Equity-Income Fund | $48,000 | $- | $6,300 | $1,900 |
January 31, 2013 FeesA,B
| Audit Fees | Audit-Related Fees | Tax Fees | All Other Fees |
Fidelity Advisor Series Equity-Income Fund | $35,000 | $- | $5,800 | $- |
Fidelity Series All-Sector Equity Fund | $43,000 | $- | $4,700 | $2,100 |
Fidelity Series Equity-Income Fund | $35,000 | $- | $5,800 | $100 |
A Amounts may reflect rounding.
B Fidelity Advisor Series Equity-Income Fund and Fidelity Series Equity-Income Fund commenced operations on December 6, 2012.
The following table presents fees billed by PricewaterhouseCoopers LLP ("PwC") in each of the last two fiscal years for services rendered to Fidelity Advisor Series Stock Selector Large Cap Value Fund, Fidelity Equity-Income Fund, Fidelity Mid Cap Value Fund, Fidelity Series Stock Selector Large Cap Value Fund and Fidelity Stock Selector Large Cap Value Fund (the "Funds"):
Services Billed by PwC
January 31, 2014 FeesA
| Audit Fees | Audit-Related Fees | Tax Fees | All Other Fees |
Fidelity Advisor Series Stock Selector Large Cap Value Fund | $44,000 | $- | $2,700 | $1,800 |
Fidelity Equity-Income Fund | $122,000 | $- | $4,400 | $4,900 |
Fidelity Mid Cap Value Fund | $52,000 | $- | $3,300 | $1,900 |
Fidelity Series Stock Selector Large Cap Value Fund | $53,000 | $- | $2,700 | $3,600 |
Fidelity Stock Selector Large Cap Value Fund | $51,000 | $- | $3,300 | $1,700 |
January 31, 2013 FeesA,B
| Audit Fees | Audit-Related Fees | Tax Fees | All Other Fees |
Fidelity Advisor Series Stock Selector Large Cap Value Fund | $30,000 | $- | $2,700 | $200 |
Fidelity Equity-Income Fund | $146,000 | $- | $4,400 | $5,000 |
Fidelity Mid Cap Value Fund | $50,000 | $- | $3,300 | $1,700 |
Fidelity Series Stock Selector Large Cap Value Fund | $32,000 | $- | $2,700 | $300 |
Fidelity Stock Selector Large Cap Value Fund | $50,000 | $- | $3,300 | $1,700 |
A Amounts may reflect rounding.
B Fidelity Advisor Series Stock Selector Large Cap Value Fund and Fidelity Series Stock Selector Large Cap Value Fund commenced operations on December 6, 2012.
The following table presents fees billed by PwC and Deloitte Entities that were required to be approved by the Audit Committee for services that relate directly to the operations and financial reporting of the Funds and that are rendered on behalf of Fidelity Management & Research Company ("FMR") and entities controlling, controlled by, or under common control with FMR (not including any sub-adviser whose role is primarily portfolio management and is subcontracted with or overseen by another investment adviser) that provide ongoing services to the Funds ("Fund Service Providers"):
Services Billed by Deloitte Entities
| January 31, 2014A | January 31, 2013A,B |
Audit-Related Fees | $765,000 | $910,000 |
Tax Fees | $- | $- |
All Other Fees | $795,000 | $735,000 |
A Amounts may reflect rounding.
B May include amounts billed prior to the Fidelity Advisor Series Equity-Income Fund and Fidelity Series Equity-Income Fund's commencement of operations.
Services Billed by PwC
| January 31, 2014A | January 31, 2013A,B |
Audit-Related Fees | $4,920,000 | $4,755,000 |
Tax Fees | $- | $- |
All Other Fees | $50,000 | $- |
A Amounts may reflect rounding.
B May include amounts billed prior to the Fidelity Advisor Series Stock Selector Large Cap Value Fund and Fidelity Series Stock Selector Large Cap Value Fund's commencement of operations.
"Audit-Related Fees" represent fees billed for assurance and related services that are reasonably related to the performance of the fund audit or the review of the fund's financial statements and that are not reported under Audit Fees.
"Tax Fees" represent fees billed for tax compliance, tax advice or tax planning that relate directly to the operations and financial reporting of the fund.
"All Other Fees" represent fees billed for services provided to the fund or Fund Service Provider, a significant portion of which are assurance related, that relate directly to the operations and financial reporting of the fund, excluding those services that are reported under Audit Fees, Audit-Related Fees or Tax Fees.
Assurance services must be performed by an independent public accountant.
* * *
The aggregate non-audit fees billed by PwC and Deloitte Entities for services rendered to the Funds, FMR (not including any sub-adviser whose role is primarily portfolio management and is subcontracted with or overseen by another investment adviser), and any Fund Service Provider for each of the last two fiscal years of the Funds are as follows:
Billed By | January 31, 2014 A | January 31, 2013 A,B,C |
PwC | $5,465,000 | $5,590,000 |
Deloitte Entities | $1,710,000 | $1,690,000 |
A Amounts may reflect rounding
B Reflects current period presentation
C May include amounts billed prior to the Fidelity Advisor Series Equity-Income Fund and Fidelity Series Equity-Income Fund's commencement of operations and may include amounts billed prior to the Fidelity Advisor Series Stock Selector Large Cap Value Fund and Fidelity Series Stock Selector Large Cap Value Fund's commencement of operations.
The trust's Audit Committee has considered non-audit services that were not pre-approved that were provided by PwC and Deloitte Entities to Fund Service Providers to be compatible with maintaining the independence of PwC and Deloitte Entities in their audits of the Funds, taking into account representations from PwC and Deloitte Entities, in accordance with Public Company Accounting Oversight Board rules, regarding their independence from the Funds and their related entities and FMR's review of the appropriateness and permissibility under applicable law of such non-audit services prior to their provision to the Fund Service Providers.
Audit Committee Pre-Approval Policies and Procedures
The trust's Audit Committee must pre-approve all audit and non-audit services provided by a fund's independent registered public accounting firm relating to the operations or financial reporting of the fund. Prior to the commencement of any audit or non-audit services to a fund, the Audit Committee reviews the services to determine whether they are appropriate and permissible under applicable law.
The Audit Committee has adopted policies and procedures to, among other purposes, provide a framework for the Committee's consideration of non-audit services by the audit firms that audit the Fidelity funds. The policies and procedures require that any non-audit service provided by a fund audit firm to a Fidelity fund and any non-audit service provided by a fund auditor to a Fund Service Provider that relates directly to the operations and financial reporting of a Fidelity fund ("Covered Service") are subject to approval by the Audit Committee before such service is provided.
All Covered Services must be approved in advance of provision of the service either: (i) by formal resolution of the Audit Committee, or (ii) by oral or written approval of the service by the Chair of the Audit Committee (or if the Chair is unavailable, such other member of the Audit Committee as may be designated by the Chair to act in the Chair's absence). The approval contemplated by (ii) above is permitted where the Treasurer determines that action on such an engagement is necessary before the next meeting of the Audit Committee.
Non-audit services provided by a fund audit firm to a Fund Service Provider that do not relate directly to the operations and financial reporting of a Fidelity fund are reported to the Audit Committee on a periodic basis.
Non-Audit Services Approved Pursuant to Rule 2-01(c)(7)(i)(C) and (ii) of Regulation S-X ("De Minimis Exception")
There were no non-audit services approved or required to be approved by the Audit Committee pursuant to the De Minimis Exception during the Funds' last two fiscal years relating to services provided to (i) the Funds or (ii) any Fund Service Provider that relate directly to the operations and financial reporting of the Funds.
Item 5. Audit Committee of Listed Registrants
Not applicable.
Item 6. Investments
(a) Not applicable.
(b) Not applicable
Item 7. Disclosure of Proxy Voting Policies and Procedures for Closed-End Management Investment Companies
Not applicable.
Item 8. Portfolio Managers of Closed-End Management Investment Companies
Not applicable.
Item 9. Purchase of Equity Securities by Closed-End Management Investment Company and Affiliated Purchasers
Not applicable.
Item 10. Submission of Matters to a Vote of Security Holders
There were no material changes to the procedures by which shareholders may recommend nominees to the trust's Board of Trustees.
Item 11. Controls and Procedures
(a)(i) The President and Treasurer and the Chief Financial Officer have concluded that the trust's disclosure controls and procedures (as defined in Rule 30a-3(c) under the Investment Company Act) provide reasonable assurances that material information relating to the trust is made known to them by the appropriate persons, based on their evaluation of these controls and procedures as of a date within 90 days of the filing date of this report.
(a)(ii) There was no change in the trust's internal control over financial reporting (as defined in Rule 30a-3(d) under the Investment Company Act) that occurred during the second fiscal quarter of the period covered by this report that has materially affected, or is reasonably likely to materially affect, the trust's internal control over financial reporting.
Item 12. Exhibits
(a) | (1) | Code of Ethics pursuant to Item 2 of Form N-CSR is filed and attached hereto as EX-99.CODE ETH. |
(a) | (2) | Certification pursuant to Rule 30a-2(a) under the Investment Company Act of 1940 (17 CFR 270.30a-2(a)) is filed and attached hereto as Exhibit 99.CERT. |
(a) | (3) | Not applicable. |
(b) |
| Certification pursuant to Rule 30a-2(b) under the Investment Company Act of 1940 (17 CFR 270.30a-2(b)) is furnished and attached hereto as Exhibit 99.906CERT. |
SIGNATURES
Pursuant to the requirements of the Securities Exchange Act of 1934 and the Investment Company Act of 1940, the registrant has duly caused this report to be signed on its behalf by the undersigned, thereunto duly authorized.
Fidelity Devonshire Trust
By: | /s/Kenneth B. Robins |
| Kenneth B. Robins |
| President and Treasurer |
|
|
Date: | March 28, 2014 |
Pursuant to the requirements of the Securities Exchange Act of 1934 and the Investment Company Act of 1940, this report has been signed below by the following persons on behalf of the registrant and in the capacities and on the dates indicated.
By: | /s/Kenneth B. Robins |
| Kenneth B. Robins |
| President and Treasurer |
|
|
Date: | March 28, 2014 |
By: | /s/Christine Reynolds |
| Christine Reynolds |
| Chief Financial Officer |
|
|
Date: | March 28, 2014 |