UNITED STATES
SECURITIES AND EXCHANGE COMMISSION
Washington, D.C. 20549
FORM N-CSR
CERTIFIED SHAREHOLDER REPORT OF REGISTERED
MANAGEMENT INVESTMENT COMPANIES
Investment Company Act file number 811-1352
Fidelity Devonshire Trust
(Exact name of registrant as specified in charter)
245 Summer St., Boston, Massachusetts 02210
(Address of principal executive offices) (Zip code)
Scott C. Goebel, Secretary
245 Summer St.
Boston, Massachusetts 02210
(Name and address of agent for service)
Registrant's telephone number, including area code: 617-563-7000
Date of fiscal year end: | January 31 |
| |
Date of reporting period: | January 31, 2013 |
Item 1. Reports to Stockholders
Fidelity®
Equity-Income
Fund
Annual Report
January 31, 2013
(Fidelity Cover Art)
Contents
Performance | (Click Here) | How the fund has done over time. |
Management's Discussion of Fund Performance | (Click Here) | The Portfolio Manager's review of fund performance and strategy. |
Shareholder Expense Example | (Click Here) | An example of shareholder expenses. |
Investment Changes | (Click Here) | A summary of major shifts in the fund's investments over the past six months. |
Investments | (Click Here) | A complete list of the fund's investments with their market values. |
Financial Statements | (Click Here) | Statements of assets and liabilities, operations, and changes in net assets, as well as financial highlights. |
Notes | (Click Here) | Notes to the financial statements. |
Report of Independent Registered Public Accounting Firm | (Click Here) | |
Trustees and Officers | (Click Here) | |
Distributions | (Click Here) | |
To view a fund's proxy voting guidelines and proxy voting record for the 12-month period ended June 30, visit http://www.fidelity.com/proxyvotingresults or visit the Securities and Exchange Commission's (SEC) web site at http://www.sec.gov. You may also call 1-800-544-8544 to request a free copy of the proxy voting guidelines.
Standard & Poor's, S&P and S&P 500 are registered service marks of The McGraw-Hill Companies, Inc. and have been licensed for use by Fidelity Distributors Corporation.
Other third-party marks appearing herein are the property of their respective owners.
All other marks appearing herein are registered or unregistered trademarks or service marks of FMR LLC or an affiliated company. © 2013 FMR LLC. All rights reserved.
Annual Report
This report and the financial statements contained herein are submitted for the general information of the shareholders of the fund. This report is not authorized for distribution to prospective investors in the fund unless preceded or accompanied by an effective prospectus.
A fund files its complete schedule of portfolio holdings with the SEC for the first and third quarters of each fiscal year on Form N-Q. Forms N-Q are available on the SEC's web site at http://www.sec.gov. A fund's Forms N-Q may be reviewed and copied at the SEC's Public Reference Room in Washington, DC. Information regarding the operation of the SEC's Public Reference Room may be obtained by calling 1-800-SEC-0330. For a complete list of a fund's portfolio holdings, view the most recent holdings listing, semiannual report, or annual report on Fidelity's web site at http://www.fidelity.com, http://www.advisor.fidelity.com, or http://www.401k.com, as applicable.
NOT FDIC INSURED • MAY LOSE VALUE • NO BANK GUARANTEE
Neither the fund nor Fidelity Distributors Corporation is a bank.
Annual Report
Average annual total return reflects the change in the value of an investment, assuming reinvestment of the class' distributions from dividend income and capital gains (the profits earned upon the sale of securities that have grown in value, if any) and assuming a constant rate of performance each year. The $10,000 table and the fund's returns do not reflect the deduction of taxes that a shareholder would pay on fund distributions or the redemption of fund shares. During periods of reimbursement by Fidelity, a fund's total return will be greater than it would be had the reimbursement not occurred. How a fund did yesterday is no guarantee of how it will do tomorrow.
Average Annual Total Returns
Periods ended January 31, 2013 | Past 1
year | Past 5
years | Past 10
years |
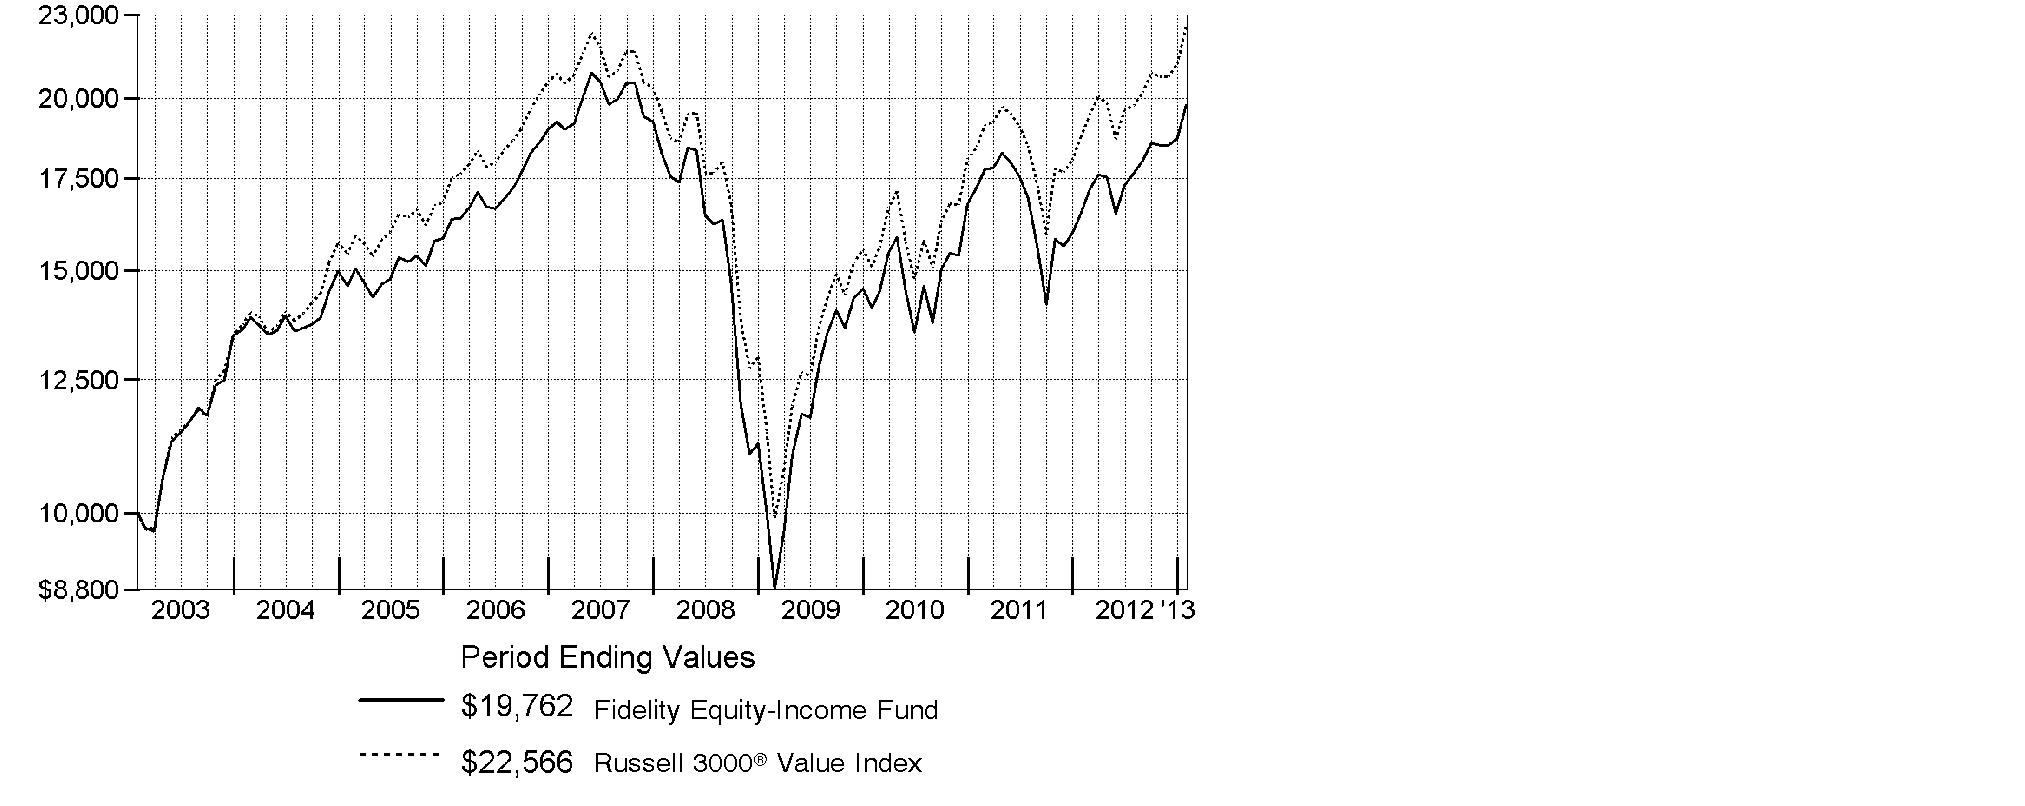
Fidelity® Equity-Income Fund | 19.63% | 1.64% | 7.05% |
$10,000 Over 10 Years
Let's say hypothetically that $10,000 was invested in Fidelity® Equity-Income Fund, a class of the fund, on January 31, 2003. The chart shows how the value of your investment would have changed, and also shows how the Russell 3000® Value Index performed over the same period.
Annual Report
Market Recap: Improvement in the U.S. economy helped lift equity benchmarks to double-digit gains for the year ending January 31, 2013, overcoming moments of volatility driven by sovereign debt woes in Europe, slower economic growth in China and gridlock in Congress. Major U.S. benchmarks hit multiyear highs during the period, encouraged by a rebounding domestic housing market and solid corporate earnings reports. The broad-based S&P 500® Index rose 16.78% for the year, crossing the milestone 1,500 mark near period end. The technology-heavy Nasdaq Composite Index® added 13.13%, and the blue-chip-laden Dow Jones Industrial AverageSM gained 12.75%. Early in the period, stocks rose on positive U.S. economic news and proposed bailouts in Europe. Although fear resurfaced in April and May, equities rebounded in June on central bank stimulus and new life in the housing market. In September, pre-election jitters and the looming "fiscal cliff" of tax hikes and federal spending cuts fueled some profit-taking, followed by a brief post-election sell-off. But stocks proved resilient, as investors continued to pile into riskier assets. Gains were broad-based, with eight of the 10 sectors in the S&P 500® posting double-digit returns. Despite eurozone turmoil, foreign developed-markets stocks rose strongly, with the MSCI® EAFE® Index adding 17.41%.
Comments from James Morrow, Lead Portfolio Manager of Fidelity® Equity-Income Fund: For the year, the fund's Retail Class shares gained 19.63%, lagging the Russell 3000® Value Index, which rose 20.32%. Weak stock selection in the software/services industry hurt, though overweighting that strong-performing group tempered the decline. Security selection among energy names - especially Royal Dutch Shell and Penn West Petroleum, based in the Netherlands and Canada, respectively - as well as in diversified financials and telecommunication services further detracted. A small average cash stake also hurt in an up market. On the positive side, the fund's materials and utilities underweightings added value. The fund's high yield/convertible securities and global equity subportfolios were additional sources of outperformance. On an individual basis, the fund was hampered by limited exposure to financial firm Bank of America, whose shares sharply increased. Some untimely trades involving telecommunications provider Verizon Communications also detracted from returns. On the positive side, Comcast, a leading cable service provider and media company, continued to generate strong financial results, while in the financials sector, JPMorgan Chase was helpful. Underweightings in two weak-performing energy stocks, Occidental Petroleum and Exxon Mobil also contributed.
The views expressed above reflect those of the portfolio manager(s) only through the end of the period as stated on the cover of this report and do not necessarily represent the views of Fidelity or any other person in the Fidelity organization. Any such views are subject to change at any time based upon market or other conditions and Fidelity disclaims any responsibility to update such views. These views may not be relied on as investment advice and, because investment decisions for a Fidelity fund are based on numerous factors, may not be relied on as an indication of trading intent on behalf of any Fidelity fund.
Annual Report
Shareholder Expense Example
As a shareholder of the Fund, you incur two types of costs: (1) transaction costs, and (2) ongoing costs, including management fees and other Fund expenses. This Example is intended to help you understand your ongoing costs (in dollars) of investing in the Fund and to compare these costs with the ongoing costs of investing in other mutual funds.
The Example is based on an investment of $1,000 invested at the beginning of the period and held for the entire period (August 1, 2012 to January 31, 2013).
Actual Expenses
The first line of the accompanying table for each class of the Fund provides information about actual account values and actual expenses. You may use the information in this line, together with the amount you invested, to estimate the expenses that you paid over the period. Simply divide your account value by $1,000.00 (for example, an $8,600 account value divided by $1,000.00 = 8.6), then multiply the result by the number in the first line for a class of the Fund under the heading entitled "Expenses Paid During Period" to estimate the expenses you paid on your account during this period. A small balance maintenance fee of $12.00 that is charged once a year may apply for certain accounts with a value of less than $2,000. This fee is not included in the table below. If it was, the estimate of expenses you paid during the period would be higher, and your ending account value lower, by this amount. In addition, the Fund, as a shareholder in the underlying Fidelity Central Funds, will indirectly bear its pro-rata share of the fees and expenses incurred by the underlying Fidelity Central Funds. These fees and expenses are not included in the Fund's annualized expense ratio used to calculate the expense estimate in the table below.
Hypothetical Example for Comparison Purposes
The second line of the accompanying table for each class of the Fund provides information about hypothetical account values and hypothetical expenses based on a Class' actual expense ratio and an assumed rate of return of 5% per year before expenses, which is not the Class' actual return. The hypothetical account values and expenses may not be used to estimate the actual ending account balance or expenses you paid for the period. You may use this information to compare the ongoing costs of investing in the Fund and other funds. To do so, compare this 5% hypothetical example with the 5% hypothetical examples that appear in the shareholder reports of the other funds. A small balance maintenance fee of $12.00 that is charged once a year may apply for certain accounts with a value of less than $2,000. This fee is not included in the table below. If it was, the estimate of expenses you paid during the period would be higher, and your ending account value lower, by this amount. In addition, the Fund, as a shareholder in the underlying Fidelity Central Funds, will indirectly bear its pro-rata share of the fees and expenses incurred by the underlying Fidelity Central Funds. These fees and expenses are not included in the Fund's annualized expense ratio used to calculate the expense estimate in the table below.
Please note that the expenses shown in the table are meant to highlight your ongoing costs only and do not reflect any transaction costs. Therefore, the second line of the table is useful in comparing ongoing costs only, and will not help you determine the relative total costs of owning different funds.
Annual Report
Shareholder Expense Example - continued
| Annualized
Expense Ratio | Beginning
Account Value
August 1, 2012 | Ending
Account Value
January 31, 2013 | Expenses Paid
During Period*
August 1, 2012
to January 31, 2013 |
Equity-Income | .66% | | | |
Actual | | $ 1,000.00 | $ 1,119.00 | $ 3.52 |
HypotheticalA | | $ 1,000.00 | $ 1,021.82 | $ 3.35 |
Class K | .53% | | | |
Actual | | $ 1,000.00 | $ 1,119.60 | $ 2.82 |
HypotheticalA | | $ 1,000.00 | $ 1,022.47 | $ 2.69 |
A 5% return per year before expenses
* Expenses are equal to each Class' annualized expense ratio, multiplied by the average account value over the period, multiplied by 184/366 (to reflect the one-half year period).
Annual Report
Investment Changes (Unaudited)
Top Ten Stocks as of January 31, 2013 |
| % of fund's
net assets | % of fund's net assets
6 months ago |
JPMorgan Chase & Co. | 3.7 | 3.6 |
Chevron Corp. | 2.8 | 3.6 |
Procter & Gamble Co. | 2.8 | 2.6 |
Comcast Corp. Class A | 2.8 | 2.8 |
Wells Fargo & Co. | 2.5 | 3.0 |
Pfizer, Inc. | 2.2 | 2.3 |
Johnson & Johnson | 2.2 | 2.1 |
General Electric Co. | 2.2 | 2.1 |
Royal Dutch Shell PLC Class A | 2.1 | 1.9 |
Paychex, Inc. | 1.9 | 2.0 |
| 25.2 | |
Top Five Market Sectors as of January 31, 2013 |
| % of fund's
net assets | % of fund's net assets
6 months ago |
Financials | 20.3 | 18.5 |
Energy | 13.8 | 14.0 |
Health Care | 13.4 | 12.8 |
Industrials | 10.5 | 9.9 |
Consumer Staples | 10.3 | 11.0 |
Asset Allocation (% of fund's net assets) |
As of January 31, 2013 * | As of July 31, 2012 ** |
 | Stocks 92.2% | | | Stocks 91.5% | |
 | Bonds 0.2% | | | Bonds 1.0% | |
 | Convertible
Securities 5.1% | | | Convertible
Securities 3.7% | |
 | Other Investments 0.4% | | | Other Investments 0.2% | |
 | Short-Term
Investments and
Net Other Assets
(Liabilities) 2.1% | | | Short-Term
Investments and
Net Other Assets
(Liabilities) 3.6% | |
* Foreign investments | 14.1% | | ** Foreign investments | 14.6% | |

Annual Report
Investments January 31, 2013
Showing Percentage of Net Assets
Common Stocks - 91.7% |
| Shares | | Value (000s) |
CONSUMER DISCRETIONARY - 8.6% |
Auto Components - 0.2% |
Gentex Corp. | 740,772 | | $ 14,171 |
Diversified Consumer Services - 0.1% |
Strayer Education, Inc. (e) | 214,950 | | 12,231 |
Hotels, Restaurants & Leisure - 1.3% |
CEC Entertainment, Inc. | 287,300 | | 9,469 |
Cedar Fair LP (depositary unit) | 193,119 | | 7,246 |
McDonald's Corp. | 695,436 | | 66,268 |
Texas Roadhouse, Inc. Class A | 794,752 | | 13,980 |
The Restaurant Group PLC | 269,853 | | 1,612 |
Yum! Brands, Inc. | 178,417 | | 11,586 |
| | 110,161 |
Household Durables - 0.0% |
Coway Co. Ltd. | 48,500 | | 2,108 |
Media - 4.5% |
Comcast Corp. Class A | 6,393,479 | | 243,464 |
Informa PLC | 356,524 | | 2,708 |
Ipsos SA | 61,477 | | 2,450 |
McGraw-Hill Companies, Inc. | 24,800 | | 1,426 |
PT Media Nusantara Citra Tbk | 6,784,000 | | 1,661 |
Time Warner, Inc. | 2,772,153 | | 140,049 |
| | 391,758 |
Multiline Retail - 1.5% |
Kohl's Corp. | 380,238 | | 17,601 |
Target Corp. | 1,920,549 | | 116,020 |
| | 133,621 |
Specialty Retail - 0.9% |
Dunelm Group PLC | 135,200 | | 1,630 |
Limited Brands, Inc. | 40,300 | | 1,935 |
Lowe's Companies, Inc. | 1,321,192 | | 50,456 |
Staples, Inc. | 1,209,804 | | 16,308 |
USS Co. Ltd. | 12,160 | | 1,364 |
WH Smith PLC | 336,292 | | 3,552 |
Workman Co. Ltd. | 1,700 | | 48 |
| | 75,293 |
Common Stocks - continued |
| Shares | | Value (000s) |
CONSUMER DISCRETIONARY - continued |
Textiles, Apparel & Luxury Goods - 0.1% |
Hugo Boss AG | 23,400 | | $ 2,754 |
VF Corp. | 23,500 | | 3,468 |
| | 6,222 |
TOTAL CONSUMER DISCRETIONARY | | 745,565 |
CONSUMER STAPLES - 10.3% |
Beverages - 2.1% |
Anheuser-Busch InBev SA NV | 243,122 | | 21,392 |
Companhia de Bebidas das Americas (AmBev) (PN) sponsored ADR | 41,883 | | 1,971 |
Dr. Pepper Snapple Group, Inc. | 79,431 | | 3,580 |
Molson Coors Brewing Co. Class B | 438,595 | | 19,816 |
PepsiCo, Inc. | 1,178,887 | | 85,882 |
The Coca-Cola Co. | 1,352,146 | | 50,354 |
| | 182,995 |
Food & Staples Retailing - 2.4% |
Clicks Group Ltd. | 386,354 | | 2,592 |
Rami Levi Chain Stores Hashikma Marketing 2006 Ltd. | 64,504 | | 2,351 |
Safeway, Inc. | 3,398,019 | | 65,412 |
Sysco Corp. | 658,975 | | 20,936 |
Wal-Mart Stores, Inc. | 551,791 | | 38,598 |
Walgreen Co. | 2,050,381 | | 81,933 |
| | 211,822 |
Food Products - 0.9% |
Astral Foods Ltd. | 143,654 | | 1,417 |
Hilton Food Group PLC | 500,312 | | 2,504 |
Kellogg Co. | 1,237,491 | | 72,393 |
Nestle Foods Nigeria PLC | 194,336 | | 1,039 |
| | 77,353 |
Household Products - 3.2% |
Kimberly-Clark Corp. | 282,004 | | 25,242 |
Procter & Gamble Co. | 3,262,729 | | 245,227 |
Reckitt Benckiser Group PLC | 83,111 | | 5,539 |
| | 276,008 |
Tobacco - 1.7% |
Altria Group, Inc. | 1,745,139 | | 58,776 |
British American Tobacco PLC: | | | |
(United Kingdom) | 124,400 | | 6,465 |
Common Stocks - continued |
| Shares | | Value (000s) |
CONSUMER STAPLES - continued |
Tobacco - continued |
British American Tobacco PLC: - continued | | | |
sponsored ADR | 195,572 | | $ 20,320 |
Japan Tobacco, Inc. | 102,900 | | 3,204 |
KT&G Corp. | 29,980 | | 2,091 |
Lorillard, Inc. | 594,621 | | 23,232 |
Philip Morris International, Inc. | 268,078 | | 23,634 |
Swedish Match Co. AB | 148,600 | | 5,577 |
| | 143,299 |
TOTAL CONSUMER STAPLES | | 891,477 |
ENERGY - 12.9% |
Energy Equipment & Services - 1.4% |
Ensco PLC Class A | 259,871 | | 16,520 |
Exterran Partners LP | 436,706 | | 10,254 |
Halliburton Co. | 883,070 | | 35,923 |
National Oilwell Varco, Inc. | 222,639 | | 16,506 |
Noble Corp. | 825,302 | | 33,425 |
Trinidad Drilling Ltd. | 1,688,100 | | 12,186 |
| | 124,814 |
Oil, Gas & Consumable Fuels - 11.5% |
Apache Corp. | 600,103 | | 50,265 |
BG Group PLC | 232,000 | | 4,121 |
BP PLC | 484,875 | | 3,589 |
BP PLC sponsored ADR | 1,501,565 | | 66,850 |
Buckeye Partners LP | 200,230 | | 10,540 |
Canadian Natural Resources Ltd. | 1,135,200 | | 34,281 |
Chevron Corp. | 2,142,872 | | 246,752 |
ENI SpA | 189,600 | | 4,736 |
EV Energy Partners LP | 480,797 | | 28,271 |
Exxon Mobil Corp. | 1,782,584 | | 160,379 |
Holly Energy Partners LP | 232,744 | | 8,367 |
HollyFrontier Corp. | 429,241 | | 22,415 |
Inergy Midstream LP | 12,619 | | 299 |
Legacy Reserves LP | 415,700 | | 10,455 |
Markwest Energy Partners LP | 456,859 | | 25,228 |
Occidental Petroleum Corp. | 201,700 | | 17,804 |
Penn West Petroleum Ltd. (e) | 1,453,945 | | 14,709 |
Pioneer Southwest Energy Partners LP | 346,953 | | 8,806 |
Common Stocks - continued |
| Shares | | Value (000s) |
ENERGY - continued |
Oil, Gas & Consumable Fuels - continued |
Royal Dutch Shell PLC: | | | |
Class A (United Kingdom) | 176,664 | | $ 6,263 |
Class A sponsored ADR | 2,469,100 | | 174,121 |
Southcross Energy Partners LP | 197,500 | | 4,645 |
Suncor Energy, Inc. | 906,600 | | 30,814 |
Tesoro Logistics LP | 21,200 | | 933 |
The Williams Companies, Inc. | 1,510,025 | | 52,926 |
Western Gas Equity Partners LP | 136,620 | | 4,612 |
Western Gas Partners LP | 35,800 | | 1,882 |
| | 994,063 |
TOTAL ENERGY | | 1,118,877 |
FINANCIALS - 19.4% |
Capital Markets - 3.3% |
Apollo Investment Corp. | 1,720,753 | | 15,487 |
Ashmore Group PLC | 3,343,732 | | 18,938 |
AURELIUS AG | 22,434 | | 1,413 |
BlackRock, Inc. Class A | 157,900 | | 37,309 |
Charles Schwab Corp. | 2,721,166 | | 44,981 |
ICAP PLC | 485,000 | | 2,509 |
KKR & Co. LP | 3,275,200 | | 55,285 |
Manning & Napier, Inc. (i) | 679,190 | | 9,577 |
Morgan Stanley | 1,721,471 | | 39,336 |
The Blackstone Group LP | 3,146,635 | | 58,213 |
UBS AG | 153,154 | | 2,660 |
| | 285,708 |
Commercial Banks - 5.0% |
Aozora Bank Ltd. | 355,000 | | 998 |
Banco Santander Chile | 12,730,039 | | 971 |
Barclays PLC | 602,782 | | 2,894 |
Comerica, Inc. | 470,000 | | 16,149 |
Cullen/Frost Bankers, Inc. | 362,697 | | 21,359 |
DGB Financial Group Co. Ltd. | 94,370 | | 1,266 |
Guaranty Trust Bank PLC | 7,800,000 | | 1,220 |
HSBC Holdings PLC (United Kingdom) | 1 | | 0 |
Itau Unibanco Holding SA sponsored ADR | 160,000 | | 2,757 |
M&T Bank Corp. | 307,800 | | 31,608 |
National Penn Bancshares, Inc. | 188,300 | | 1,836 |
Seven Bank Ltd. | 605,700 | | 1,464 |
Common Stocks - continued |
| Shares | | Value (000s) |
FINANCIALS - continued |
Commercial Banks - continued |
Standard Chartered PLC (United Kingdom) | 1,108,181 | | $ 29,483 |
SunTrust Banks, Inc. | 866,119 | | 24,572 |
Svenska Handelsbanken AB (A Shares) | 128,000 | | 5,234 |
U.S. Bancorp | 2,201,202 | | 72,860 |
Wells Fargo & Co. | 6,267,150 | | 218,285 |
| | 432,956 |
Diversified Financial Services - 4.7% |
Bank of America Corp. | 1,587,800 | | 17,974 |
Citigroup, Inc. | 255,000 | | 10,751 |
Inversiones La Construccion SA | 46,228 | | 907 |
JPMorgan Chase & Co. | 6,837,302 | | 321,694 |
KKR Financial Holdings LLC | 4,735,345 | | 52,041 |
London Stock Exchange Group PLC | 112,900 | | 2,156 |
| | 405,523 |
Insurance - 4.5% |
ACE Ltd. | 771,959 | | 65,871 |
AFLAC, Inc. | 569,000 | | 30,191 |
Assured Guaranty Ltd. | 942,580 | | 17,089 |
Berkshire Hathaway, Inc. Class B (a) | 217,644 | | 21,096 |
Euler Hermes SA | 26,423 | | 2,359 |
Fairfax Financial Holdings Ltd. (sub. vtg.) | 4,500 | | 1,615 |
FBD Holdings PLC | 126,280 | | 1,869 |
Hanover Insurance Group, Inc. | 402,598 | | 16,732 |
MetLife, Inc. | 3,921,469 | | 146,428 |
MetLife, Inc. unit | 477,100 | | 23,225 |
Prudential Financial, Inc. | 396,300 | | 22,938 |
Resolution Ltd. | 446,800 | | 1,860 |
Validus Holdings Ltd. | 1,011,791 | | 36,839 |
| | 388,112 |
Real Estate Investment Trusts - 1.8% |
American Capital Agency Corp. | 892,402 | | 28,227 |
American Tower Corp. | 39,300 | | 2,993 |
Annaly Capital Management, Inc. | 1,260,900 | | 18,750 |
Coresite Realty Corp. | 77,703 | | 2,292 |
DCT Industrial Trust, Inc. | 665,600 | | 4,699 |
First Potomac Realty Trust | 60,219 | | 825 |
Home Properties, Inc. | 195,500 | | 12,017 |
Japan Retail Fund Investment Corp. | 1,308 | | 2,477 |
Lexington Corporate Properties Trust | 458,400 | | 5,042 |
LTC Properties, Inc. | 223,381 | | 8,319 |
Common Stocks - continued |
| Shares | | Value (000s) |
FINANCIALS - continued |
Real Estate Investment Trusts - continued |
Rayonier, Inc. | 568,261 | | $ 30,595 |
Retail Properties America, Inc. | 1,591,950 | | 20,600 |
Two Harbors Investment Corp. | 699,778 | | 8,691 |
Ventas, Inc. | 152,903 | | 10,136 |
| | 155,663 |
Real Estate Management & Development - 0.1% |
Beazer Pre-Owned Rental Homes, Inc. (j) | 393,400 | | 7,868 |
Daito Trust Construction Co. Ltd. | 26,100 | | 2,574 |
Relo Holdings Corp. | 47,200 | | 1,739 |
| | 12,181 |
TOTAL FINANCIALS | | 1,680,143 |
HEALTH CARE - 12.7% |
Biotechnology - 0.4% |
Amgen, Inc. | 208,325 | | 17,803 |
Grifols SA ADR | 113,945 | | 3,032 |
PDL BioPharma, Inc. (e) | 2,196,326 | | 15,111 |
| | 35,946 |
Health Care Equipment & Supplies - 0.8% |
Abbott Laboratories | 404,244 | | 13,696 |
Baxter International, Inc. | 147,000 | | 9,972 |
Covidien PLC | 447,200 | | 27,878 |
St. Jude Medical, Inc. | 389,238 | | 15,842 |
| | 67,388 |
Health Care Providers & Services - 1.9% |
Aetna, Inc. | 723,600 | | 34,899 |
Cardinal Health, Inc. | 452,000 | | 19,802 |
McKesson Corp. | 126,840 | | 13,347 |
Psychemedics Corp. | 113,100 | | 1,349 |
UnitedHealth Group, Inc. | 384,100 | | 21,206 |
WellPoint, Inc. | 1,138,672 | | 73,809 |
| | 164,412 |
Health Care Technology - 0.1% |
Quality Systems, Inc. | 411,108 | | 7,499 |
Pharmaceuticals - 9.5% |
AbbVie, Inc. | 1,366,644 | | 50,142 |
AstraZeneca PLC sponsored ADR | 991,800 | | 47,785 |
Eli Lilly & Co. | 1,048,541 | | 56,296 |
Common Stocks - continued |
| Shares | | Value (000s) |
HEALTH CARE - continued |
Pharmaceuticals - continued |
GlaxoSmithKline PLC | 258,500 | | $ 5,913 |
Johnson & Johnson | 2,536,879 | | 187,526 |
Merck & Co., Inc. | 3,728,846 | | 161,273 |
Pfizer, Inc. | 7,176,901 | | 195,786 |
Roche Holding AG (participation certificate) | 25,549 | | 5,654 |
Sanofi SA | 531,928 | | 51,856 |
Teva Pharmaceutical Industries Ltd. sponsored ADR | 901,180 | | 34,236 |
Warner Chilcott PLC | 1,759,600 | | 24,934 |
Zoetis, Inc. Class A | 71,500 | | 1,859 |
| | 823,260 |
TOTAL HEALTH CARE | | 1,098,505 |
INDUSTRIALS - 9.8% |
Aerospace & Defense - 1.7% |
Raytheon Co. | 893,346 | | 47,061 |
Rockwell Collins, Inc. | 274,380 | | 16,155 |
United Technologies Corp. | 944,615 | | 82,720 |
| | 145,936 |
Air Freight & Logistics - 1.7% |
C.H. Robinson Worldwide, Inc. | 698,700 | | 46,219 |
United Parcel Service, Inc. Class B | 1,309,965 | | 103,867 |
| | 150,086 |
Airlines - 0.0% |
Copa Holdings SA Class A | 40,900 | | 4,483 |
Commercial Services & Supplies - 1.4% |
Intrum Justitia AB | 1,238,600 | | 20,066 |
Multiplus SA | 38,300 | | 823 |
Pitney Bowes, Inc. (e) | 848,200 | | 12,223 |
Republic Services, Inc. | 2,642,874 | | 84,281 |
| | 117,393 |
Electrical Equipment - 0.4% |
Eaton Corp. PLC | 192,500 | | 10,963 |
Emerson Electric Co. | 224,128 | | 12,831 |
Hubbell, Inc. Class B | 105,928 | | 9,645 |
| | 33,439 |
Common Stocks - continued |
| Shares | | Value (000s) |
INDUSTRIALS - continued |
Industrial Conglomerates - 2.2% |
General Electric Co. | 8,398,810 | | $ 187,125 |
Koninklijke Philips Electronics NV | 144,257 | | 4,493 |
| | 191,618 |
Machinery - 1.5% |
Briggs & Stratton Corp. | 1,283,085 | | 30,448 |
Cummins, Inc. | 173,090 | | 19,876 |
Douglas Dynamics, Inc. | 848,483 | | 11,183 |
Harsco Corp. | 376,207 | | 9,590 |
Illinois Tool Works, Inc. | 295,513 | | 18,567 |
Muehlbauer Holding AG & Co. | 43,045 | | 1,383 |
Stanley Black & Decker, Inc. | 545,797 | | 41,934 |
| | 132,981 |
Marine - 0.0% |
Irish Continental Group PLC unit | 62,900 | | 1,693 |
Professional Services - 0.3% |
Michael Page International PLC | 3,902,783 | | 25,205 |
Road & Rail - 0.3% |
Union Pacific Corp. | 166,700 | | 21,914 |
Trading Companies & Distributors - 0.3% |
Watsco, Inc. | 265,885 | | 20,034 |
Wolseley PLC | 40,336 | | 1,884 |
| | 21,918 |
TOTAL INDUSTRIALS | | 846,666 |
INFORMATION TECHNOLOGY - 8.6% |
Communications Equipment - 1.5% |
Cisco Systems, Inc. | 6,533,326 | | 134,391 |
Computers & Peripherals - 0.6% |
Apple, Inc. | 51,910 | | 23,635 |
Dell, Inc. | 1,627,573 | | 21,549 |
Lexmark International, Inc. Class A (e) | 248,038 | | 5,968 |
| | 51,152 |
IT Services - 4.6% |
Accenture PLC Class A | 818,133 | | 58,816 |
Cognizant Technology Solutions Corp. Class A (a) | 694,618 | | 54,305 |
Fidelity National Information Services, Inc. | 143,032 | | 5,308 |
IBM Corp. | 526,892 | | 106,996 |
Common Stocks - continued |
| Shares | | Value (000s) |
INFORMATION TECHNOLOGY - continued |
IT Services - continued |
Paychex, Inc. | 5,081,946 | | $ 165,824 |
The Western Union Co. | 577,400 | | 8,216 |
| | 399,465 |
Semiconductors & Semiconductor Equipment - 1.0% |
Analog Devices, Inc. | 74,600 | | 3,256 |
Applied Materials, Inc. | 3,392,600 | | 43,798 |
Chipbond Technology Corp. | 558,000 | | 1,149 |
KLA-Tencor Corp. | 322,535 | | 17,710 |
Siliconware Precision Industries Co. Ltd. sponsored ADR | 3,574,448 | | 18,337 |
Taiwan Semiconductor Manufacturing Co. Ltd. | 1,078,000 | | 3,694 |
| | 87,944 |
Software - 0.9% |
CA Technologies, Inc. | 568,600 | | 14,113 |
Microsoft Corp. | 2,182,703 | | 59,959 |
| | 74,072 |
TOTAL INFORMATION TECHNOLOGY | | 747,024 |
MATERIALS - 0.8% |
Chemicals - 0.4% |
Akzo Nobel NV | 37,140 | | 2,541 |
Arkema SA | 22,400 | | 2,555 |
Clariant AG (Reg.) | 129,712 | | 1,777 |
Eastman Chemical Co. | 286,800 | | 20,406 |
Israel Chemicals Ltd. | 172,200 | | 2,281 |
LyondellBasell Industries NV Class A | 62,100 | | 3,938 |
Monsanto Co. | 21,954 | | 2,225 |
| | 35,723 |
Metals & Mining - 0.4% |
ArcelorMittal SA Class A unit (e) | 364,700 | | 6,258 |
Commercial Metals Co. | 1,099,817 | | 18,312 |
Nucor Corp. | 276,200 | | 12,708 |
| | 37,278 |
TOTAL MATERIALS | | 73,001 |
Common Stocks - continued |
| Shares | | Value (000s) |
TELECOMMUNICATION SERVICES - 4.0% |
Diversified Telecommunication Services - 3.1% |
AT&T, Inc. | 2,598,909 | | $ 90,416 |
CenturyLink, Inc. | 476,571 | | 19,277 |
HKT Trust / HKT Ltd. unit | 3,960,000 | | 3,692 |
LG Telecom Ltd. | 240,610 | | 1,800 |
Nippon Telegraph & Telephone Corp. | 41,000 | | 1,717 |
Telenor ASA | 176,200 | | 3,887 |
Telstra Corp. Ltd. | 422,275 | | 2,026 |
Verizon Communications, Inc. | 3,345,692 | | 145,906 |
| | 268,721 |
Wireless Telecommunication Services - 0.9% |
Empresa Nacional de Telecomunicaciones SA (ENTEL) | 41,142 | | 895 |
Far EasTone Telecommunications Co. Ltd. | 579,000 | | 1,472 |
Mobile TeleSystems OJSC (a) | 132,700 | | 1,134 |
Vodafone Group PLC | 27,939,799 | | 76,252 |
| | 79,753 |
TOTAL TELECOMMUNICATION SERVICES | | 348,474 |
UTILITIES - 4.6% |
Electric Utilities - 3.2% |
Duke Energy Corp. | 516,079 | | 35,475 |
Edison International | 193,700 | | 9,334 |
FirstEnergy Corp. | 950,730 | | 38,495 |
ITC Holdings Corp. | 28,693 | | 2,324 |
NextEra Energy, Inc. | 662,028 | | 47,699 |
Northeast Utilities | 504,835 | | 20,562 |
PPL Corp. | 2,798,390 | | 84,763 |
Southern Co. | 769,025 | | 34,014 |
SP AusNet unit | 1,397,908 | | 1,676 |
Spark Infrastructure Group unit | 996,438 | | 1,824 |
| | 276,166 |
Gas Utilities - 0.0% |
YESCO Co. Ltd. | 39,470 | | 1,085 |
Multi-Utilities - 1.4% |
CMS Energy Corp. | 174,400 | | 4,482 |
GDF Suez | 476,400 | | 9,774 |
National Grid PLC | 2,569,541 | | 28,136 |
Common Stocks - continued |
| Shares | | Value (000s) |
UTILITIES - continued |
Multi-Utilities - continued |
PG&E Corp. | 689,910 | | $ 29,418 |
Sempra Energy | 698,053 | | 52,389 |
| | 124,199 |
Water Utilities - 0.0% |
Aguas Andinas SA | 1,089,814 | | 807 |
Companhia de Saneamento Basico do Estado de Sao Paulo (SABESP) sponsored ADR | 32,600 | | 1,451 |
| | 2,258 |
TOTAL UTILITIES | | 403,708 |
TOTAL COMMON STOCKS (Cost $6,773,445) |
7,953,440
|
Preferred Stocks - 2.1% |
| | | |
Convertible Preferred Stocks - 1.6% |
CONSUMER DISCRETIONARY - 0.3% |
Automobiles - 0.2% |
General Motors Co. 4.75% | 398,816 | | 17,277 |
Media - 0.1% |
Interpublic Group of Companies, Inc. 5.25% | 7,300 | | 8,231 |
TOTAL CONSUMER DISCRETIONARY | | 25,508 |
FINANCIALS - 0.3% |
Commercial Banks - 0.2% |
Huntington Bancshares, Inc. 8.50% | 14,900 | | 18,923 |
Real Estate Investment Trusts - 0.1% |
Health Care REIT, Inc. Series I, 6.50% | 162,100 | | 9,498 |
TOTAL FINANCIALS | | 28,421 |
HEALTH CARE - 0.2% |
Health Care Equipment & Supplies - 0.1% |
Alere, Inc. 3.00% | 41,700 | | 8,493 |
Preferred Stocks - continued |
| Shares | | Value (000s) |
Convertible Preferred Stocks - continued |
HEALTH CARE - continued |
Health Care Providers & Services - 0.1% |
HealthSouth Corp. Series A 6.50% | 12,600 | | $ 14,018 |
TOTAL HEALTH CARE | | 22,511 |
INDUSTRIALS - 0.3% |
Aerospace & Defense - 0.2% |
United Technologies Corp. 7.50% | 341,300 | | 19,434 |
Professional Services - 0.1% |
Nielsen Holdings B.V. 6.25% | 149,500 | | 8,705 |
TOTAL INDUSTRIALS | | 28,139 |
MATERIALS - 0.1% |
Metals & Mining - 0.1% |
ArcelorMittal SA 6.00% (a) | 300,500 | | 7,774 |
UTILITIES - 0.4% |
Electric Utilities - 0.4% |
NextEra Energy, Inc.: | | | |
5.889% | 203,449 | | 10,461 |
Series E, 5.599% | 221,000 | | 11,526 |
PPL Corp. 8.75% | 168,700 | | 9,243 |
| | 31,230 |
TOTAL CONVERTIBLE PREFERRED STOCKS | | 143,583 |
Nonconvertible Preferred Stocks - 0.5% |
CONSUMER DISCRETIONARY - 0.1% |
Automobiles - 0.1% |
Volkswagen AG | 43,309 | | 10,711 |
FINANCIALS - 0.4% |
Consumer Finance - 0.4% |
Ally Financial, Inc. 7.00% (f) | 28,901 | | 28,034 |
Preferred Stocks - continued |
| Shares | | Value (000s) |
Nonconvertible Preferred Stocks - continued |
FINANCIALS - continued |
Diversified Financial Services - 0.0% |
GMAC Capital Trust I Series 2, 8.125% | 43,349 | | $ 1,156 |
TOTAL FINANCIALS | | 29,190 |
TOTAL NONCONVERTIBLE PREFERRED STOCKS | | 39,901 |
TOTAL PREFERRED STOCKS (Cost $167,273) |
183,484
|
Corporate Bonds - 3.7% |
| Principal Amount (000s) | | |
Convertible Bonds - 3.5% |
CONSUMER DISCRETIONARY - 0.2% |
Automobiles - 0.2% |
Volkswagen International Finance NV 5.5% 11/9/15 (f) | EUR | 9,200 | | 14,422 |
Hotels, Restaurants & Leisure - 0.0% |
MGM Mirage, Inc. 4.25% 4/15/15 | | $ 4,330 | | 4,706 |
TOTAL CONSUMER DISCRETIONARY | | 19,128 |
ENERGY - 0.5% |
Oil, Gas & Consumable Fuels - 0.5% |
Amyris, Inc. 3% 2/27/17 | | 2,101 | | 1,459 |
Chesapeake Energy Corp. 2.5% 5/15/37 | | 10,430 | | 10,073 |
Massey Energy Co. 3.25% 8/1/15 | | 12,090 | | 11,606 |
Peabody Energy Corp. 4.75% 12/15/66 | | 8,776 | | 8,365 |
Ship Finance International Ltd. 3.25% 2/1/18 | | 4,710 | | 4,747 |
Western Refining, Inc. 5.75% 6/15/14 | | 1,780 | | 6,188 |
| | 42,438 |
FINANCIALS - 0.1% |
Thrifts & Mortgage Finance - 0.1% |
MGIC Investment Corp. 9% 4/1/63 (d)(f) | | 17,382 | | 7,453 |
HEALTH CARE - 0.5% |
Health Care Equipment & Supplies - 0.1% |
Teleflex, Inc. 3.875% 8/1/17 | | 6,640 | | 8,791 |
Corporate Bonds - continued |
| Principal Amount (000s) | | Value (000s) |
Convertible Bonds - continued |
HEALTH CARE - continued |
Health Care Providers & Services - 0.4% |
WellPoint, Inc. 2.75% 10/15/42 (f) | | $ 28,610 | | $ 31,438 |
TOTAL HEALTH CARE | | 40,229 |
INDUSTRIALS - 0.4% |
Commercial Services & Supplies - 0.2% |
Covanta Holding Corp. 3.25% 6/1/14 | | 16,680 | | 21,289 |
Construction & Engineering - 0.2% |
MasTec, Inc.: | | | | |
4% 6/15/14 | | 5,860 | | 10,698 |
4.25% 12/15/14 | | 2,180 | | 4,097 |
| | 14,795 |
TOTAL INDUSTRIALS | | 36,084 |
INFORMATION TECHNOLOGY - 1.5% |
Communications Equipment - 0.1% |
InterDigital, Inc. 2.5% 3/15/16 | | 11,920 | | 12,963 |
Computers & Peripherals - 0.3% |
EMC Corp. 1.75% 12/1/13 | | 4,760 | | 7,364 |
SanDisk Corp. 1.5% 8/15/17 | | 12,890 | | 16,024 |
| | 23,388 |
Internet Software & Services - 0.1% |
VeriSign, Inc. 3.25% 8/15/37 | | 6,990 | | 9,707 |
IT Services - 0.1% |
CACI International, Inc. 2.125% 5/1/14 | | 4,900 | | 5,384 |
Semiconductors & Semiconductor Equipment - 0.6% |
GT Advanced Technologies, Inc. 3% 10/1/17 | | 15,060 | | 11,427 |
Intel Corp. 3.25% 8/1/39 | | 11,240 | | 13,432 |
Microchip Technology, Inc. 2.125% 12/15/37 | | 4,500 | | 5,828 |
Micron Technology, Inc. 3.125% 5/1/32 (f) | | 12,070 | | 13,119 |
Novellus Systems, Inc. 2.625% 5/15/41 | | 3,780 | | 5,268 |
| | 49,074 |
Software - 0.3% |
Nuance Communications, Inc. 2.75% 11/1/31 | | 26,800 | | 29,899 |
TOTAL INFORMATION TECHNOLOGY | | 130,415 |
Corporate Bonds - continued |
| Principal Amount (000s) | | Value (000s) |
Convertible Bonds - continued |
MATERIALS - 0.1% |
Metals & Mining - 0.1% |
Goldcorp, Inc. 2% 8/1/14 | | $ 4,090 | | $ 4,402 |
Newmont Mining Corp. 1.25% 7/15/14 | | 6,510 | | 7,283 |
| | 11,685 |
TELECOMMUNICATION SERVICES - 0.2% |
Wireless Telecommunication Services - 0.2% |
Clearwire Communications LLC/Clearwire Finance, Inc. 8.25% 12/1/40 (f) | | 12,670 | | 13,747 |
TOTAL CONVERTIBLE BONDS | | 301,179 |
Nonconvertible Bonds - 0.2% |
FINANCIALS - 0.1% |
Consumer Finance - 0.0% |
GMAC LLC 8% 11/1/31 | | 2,370 | | 2,992 |
Diversified Financial Services - 0.1% |
Goldman Sachs Capital II 4% (g)(h) | | 11,520 | | 9,389 |
TOTAL FINANCIALS | | 12,381 |
MATERIALS - 0.1% |
Paper & Forest Products - 0.1% |
AbitibiBowater, Inc. 10.25% 10/15/18 | | 4,229 | | 4,874 |
TELECOMMUNICATION SERVICES - 0.0% |
Wireless Telecommunication Services - 0.0% |
Clearwire Communications LLC/Clearwire Finance, Inc. 12% 12/1/15 (f) | | 1,895 | | 2,054 |
TOTAL NONCONVERTIBLE BONDS | | 19,309 |
TOTAL CORPORATE BONDS (Cost $307,804) |
320,488
|
Floating Rate Loans - 0.0% |
| Principal Amount (000s) | | Value (000s) |
FINANCIALS - 0.0% |
Insurance - 0.0% |
Asurion Corp. Tranche 2LN, term loan 9% 5/24/19 (h) | | $ 3,906 | | $ 4,013 |
TOTAL FLOATING RATE LOANS (Cost $3,898) |
4,013
|
Other - 0.4% |
ENERGY - 0.4% |
Oil, Gas & Consumable Fuels - 0.4% |
EQTY ER Holdings, LLC 12% 1/28/18 (i)(j)(k) | | 22,667 | | 22,667 |
| | Shares | | |
EQTY ER Holdings, LLC (i)(j)(k) | | 11,333,334 | | 11,333 |
TOTAL OTHER (Cost $34,000) |
34,000
|
Money Market Funds - 2.2% |
| | | |
Fidelity Cash Central Fund, 0.16% (b) | 150,406,839 | | 150,407 |
Fidelity Securities Lending Cash Central Fund, 0.15% (b)(c) | 37,338,250 | | 37,338 |
TOTAL MONEY MARKET FUNDS (Cost $187,745) |
187,745
|
TOTAL INVESTMENT PORTFOLIO - 100.1% (Cost $7,474,165) | | 8,683,170 |
NET OTHER ASSETS (LIABILITIES) - (0.1)% | | (5,745) |
NET ASSETS - 100% | $ 8,677,425 |
Currency Abbreviations |
EUR | - | European Monetary Unit |
Legend |
(a) Non-income producing |
(b) Affiliated fund that is available only to investment companies and other accounts managed by Fidelity Investments. The rate quoted is the annualized seven-day yield of the fund at period end. A complete unaudited listing of the fund's holdings as of its most recent quarter end is available upon request. In addition, each Fidelity Central Fund's financial statements, which are not covered by the Fund's Report of Independent Registered Public Accounting Firm, are available on the SEC's website or upon request. |
(c) Investment made with cash collateral received from securities on loan. |
(d) Non-income producing - Security is in default. |
(e) Security or a portion of the security is on loan at period end. |
(f) Security exempt from registration under Rule 144A of the Securities Act of 1933. These securities may be resold in transactions exempt from registration, normally to qualified institutional buyers. At the end of the period, the value of these securities amounted to $110,267,000 or 1.3% of net assets. |
(g) Security is perpetual in nature with no stated maturity date. |
(h) Coupon rates for floating and adjustable rate securities reflect the rates in effect at period end. |
(i) Affiliated company |
(j) Restricted securities - Investment in securities not registered under the Securities Act of 1933 (excluding 144A issues). At the end of the period, the value of restricted securities (excluding 144A issues) amounted to $41,868,000 or 0.5% of net assets. |
Additional information on each restricted holding is as follows: |
Security | Acquisition Date | Acquisition Cost (000s) |
Beazer Pre-Owned Rental Homes, Inc. | 5/3/12 - 10/23/12 | $ 7,868 |
EQTY ER Holdings, LLC 12% 1/28/18 | 1/29/13 | $ 22,667 |
EQTY ER Holdings, LLC | 1/29/13 | $ 11,333 |
(k) Investments represent a non-operating interest in oil and gas wells through an entity owned by the fund that is treated as a corporation for U.S. tax purposes. |
Affiliated Central Funds |
Information regarding fiscal year to date income earned by the Fund from investments in Fidelity Central Funds is as follows: |
Fund | Income earned
(Amounts in thousands) |
Fidelity Cash Central Fund | $ 344 |
Fidelity Securities Lending Cash Central Fund | 1,955 |
Total | $ 2,299 |
Other Affiliated Issuers |
An affiliated company is a company in which the Fund has ownership of at least 5% of the voting securities. Fiscal year to date transactions with companies which are or were affiliates are as follows: |
Affiliate
(Amounts in thousands) | Value,
beginning of
period | Purchases | Sales
Proceeds | Dividend
Income | Value,
end of
period |
EQTY ER Holdings, LLC 12% 1/28/18 | $ - | $ 22,667 | $ - | $ - | $ 22,667 |
EQTY ER Holdings, LLC | - | 11,333 | - | - | 11,333 |
Manning & Napier, Inc. | 6,642 | 2,456 | - | 435 | 9,577 |
Total | $ 6,642 | $ 36,456 | $ - | $ 435 | $ 43,577 |
Other Information |
The following is a summary of the inputs used, as of January 31, 2013, involving the Fund's assets and liabilities carried at fair value. The inputs or methodology used for valuing securities may not be an indication of the risk associated with investing in those securities. For more information on valuation inputs, and their aggregation into the levels used in the table below, please refer to the Investment Valuation section in the accompanying Notes to Financial Statements. |
Valuation Inputs at Reporting Date: |
Description
(Amounts in thousands) | Total | Level 1 | Level 2 | Level 3 |
Investments in Securities: | | | | |
Equities: | | | | |
Consumer Discretionary | $ 781,784 | $ 773,553 | $ 8,231 | $ - |
Consumer Staples | 891,477 | 863,620 | 27,857 | - |
Energy | 1,118,877 | 1,104,289 | 14,588 | - |
Financials | 1,737,754 | 1,663,575 | 66,311 | 7,868 |
Health Care | 1,121,016 | 1,049,229 | 71,787 | - |
Industrials | 874,805 | 861,607 | 13,198 | - |
Information Technology | 747,024 | 743,330 | 3,694 | - |
Materials | 80,775 | 73,001 | 7,774 | - |
Telecommunication Services | 348,474 | 270,505 | 77,969 | - |
Utilities | 434,938 | 375,572 | 59,366 | - |
Corporate Bonds | 320,488 | - | 320,488 | - |
Floating Rate Loans | 4,013 | - | 4,013 | - |
Other/Energy | 34,000 | - | - | 34,000 |
Money Market Funds | 187,745 | 187,745 | - | - |
Total Investments in Securities: | $ 8,683,170 | $ 7,966,026 | $ 675,276 | $ 41,868 |
Distribution of investments by country or territory of incorporation, as a percentage of total net assets, is as follows. (Unaudited) |
United States of America | 85.9% |
United Kingdom | 6.4% |
Ireland | 1.4% |
Switzerland | 1.3% |
Canada | 1.1% |
Others (Individually Less Than 1%) | 3.9% |
| 100.0% |
See accompanying notes which are an integral part of the financial statements.
Annual Report
Statement of Assets and Liabilities
Amounts in thousands (except per-share amounts) | January 31, 2013 |
| | |
Assets | | |
Investment in securities, at value (including securities loaned of $38,085) - See accompanying schedule: Unaffiliated issuers (cost $7,243,843) | $ 8,451,848 | |
Fidelity Central Funds (cost $187,745) | 187,745 | |
Other affiliated issuers (cost $42,577) | 43,577 | |
Total Investments (cost $7,474,165) | | $ 8,683,170 |
Cash | | 52 |
Foreign currency held at value (cost $99) | | 99 |
Receivable for investments sold | | 58,904 |
Receivable for fund shares sold | | 3,872 |
Dividends receivable | | 14,307 |
Interest receivable | | 2,590 |
Distributions receivable from Fidelity Central Funds | | 59 |
Prepaid expenses | | 15 |
Other receivables | | 1,216 |
Total assets | | 8,764,284 |
| | |
Liabilities | | |
Payable for investments purchased | $ 27,490 | |
Payable for fund shares redeemed | 16,761 | |
Accrued management fee | 3,258 | |
Other affiliated payables | 1,160 | |
Other payables and accrued expenses | 852 | |
Collateral on securities loaned, at value | 37,338 | |
Total liabilities | | 86,859 |
| | |
Net Assets | | $ 8,677,425 |
Net Assets consist of: | | |
Paid in capital | | $ 8,509,845 |
Undistributed net investment income | | 8,523 |
Accumulated undistributed net realized gain (loss) on investments and foreign currency transactions | | (1,049,973) |
Net unrealized appreciation (depreciation) on investments and assets and liabilities in foreign currencies | | 1,209,030 |
Net Assets | | $ 8,677,425 |
See accompanying notes which are an integral part of the financial statements.
Annual Report
Statement of Assets and Liabilities - continued
Amounts in thousands (except per-share amounts) | January 31, 2013 |
| | |
Equity-Income:
Net Asset Value, offering price and redemption price per share ($6,400,965 ÷ 128,741 shares) | | $ 49.72 |
| | |
Class K:
Net Asset Value, offering price and redemption price per share ($2,276,460 ÷ 45,801 shares) | | $ 49.70 |
See accompanying notes which are an integral part of the financial statements.
Annual Report
Financial Statements - continued
Statement of Operations
Amounts in thousands | Year ended January 31, 2013 |
| | |
Investment Income | | |
Dividends (including $435 earned from other affiliated issuers) | | $ 287,646 |
Interest | | 16,251 |
Income from Fidelity Central Funds | | 2,299 |
Total income | | 306,196 |
| | |
Expenses | | |
Management fee | $ 39,400 | |
Transfer agent fees | 13,369 | |
Accounting and security lending fees | 1,239 | |
Custodian fees and expenses | 206 | |
Independent trustees' compensation | 59 | |
Appreciation in deferred trustee compensation account | 1 | |
Registration fees | 108 | |
Audit | 192 | |
Legal | 41 | |
Miscellaneous | 97 | |
Total expenses before reductions | 54,712 | |
Expense reductions | (950) | 53,762 |
Net investment income (loss) | | 252,434 |
Realized and Unrealized Gain (Loss) Net realized gain (loss) on: | | |
Investment securities: | | |
Unaffiliated issuers | 813,737 | |
Foreign currency transactions | 116 | |
Total net realized gain (loss) | | 813,853 |
Change in net unrealized appreciation (depreciation) on: Investment securities | 485,587 | |
Assets and liabilities in foreign currencies | (59) | |
Total change in net unrealized appreciation (depreciation) | | 485,528 |
Net gain (loss) | | 1,299,381 |
Net increase (decrease) in net assets resulting from operations | | $ 1,551,815 |
See accompanying notes which are an integral part of the financial statements.
Annual Report
Statement of Changes in Net Assets
Amounts in thousands | Year ended
January 31,
2013 | Year ended
January 31,
2012 |
Increase (Decrease) in Net Assets | | |
Operations | | |
Net investment income (loss) | $ 252,434 | $ 224,295 |
Net realized gain (loss) | 813,853 | 1,670,941 |
Change in net unrealized appreciation (depreciation) | 485,528 | (2,536,097) |
Net increase (decrease) in net assets resulting
from operations | 1,551,815 | (640,861) |
Distributions to shareholders from net investment income | (248,423) | (215,914) |
Share transactions - net increase (decrease) | (1,576,112) | (2,800,870) |
Total increase (decrease) in net assets | (272,720) | (3,657,645) |
| | |
Net Assets | | |
Beginning of period | 8,950,145 | 12,607,790 |
End of period (including undistributed net investment income of $8,523 and undistributed net investment income of $8,394, respectively) | $ 8,677,425 | $ 8,950,145 |
See accompanying notes which are an integral part of the financial statements.
Annual Report
Financial Highlights - Equity-Income
Years ended January 31, | 2013 | 2012 | 2011 | 2010 | 2009 |
Selected Per-Share Data | | | | | |
Net asset value, beginning of period | $ 42.77 | $ 45.57 | $ 37.93 | $ 27.48 | $ 52.25 |
Income from Investment Operations | | | | | |
Net investment income (loss) B | 1.32 | .89 | .66 | .63 | 1.00 |
Net realized and unrealized gain (loss) | 6.95 | (2.80) | 7.72 | 10.51 | (23.96) |
Total from investment operations | 8.27 | (1.91) | 8.38 | 11.14 | (22.96) |
Distributions from net investment income | (1.32) | (.89) | (.74) | (.69) | (.96) |
Distributions from net realized gain | - | - | - | - | (.85) |
Total distributions | (1.32) | (.89) | (.74) | (.69) | (1.81) |
Net asset value, end of period | $ 49.72 | $ 42.77 | $ 45.57 | $ 37.93 | $ 27.48 |
Total Return A | 19.63% | (4.15)% | 22.32% | 41.02% | (45.16)% |
Ratios to Average Net Assets C, E | | | | | |
Expenses before reductions | .67% | .68% | .69% | .74% | .71% |
Expenses net of fee waivers, if any | .67% | .68% | .69% | .74% | .71% |
Expenses net of all reductions | .66% | .67% | .68% | .74% | .71% |
Net investment income (loss) | 2.89% | 2.04% | 1.62% | 1.87% | 2.38% |
Supplemental Data | | | | | |
Net assets, end of period (in millions) | $ 6,401 | $ 6,844 | $ 10,049 | $ 15,061 | $ 15,070 |
Portfolio turnover rate D | 43% | 80% | 28% | 30% | 33% |
A Total returns would have been lower if certain expenses had not been reduced during the applicable periods shown.
B Calculated based on average shares outstanding during the period.
C Fees and expenses of any underlying Fidelity Central Funds are not included in the Fund's expense ratio. The Fund indirectly bears its proportionate share of the expenses of any underlying Fidelity Central Funds.
D Amount does not include the portfolio activity of any underlying Fidelity Central Funds.
E Expense ratios reflect operating expenses of the class. Expenses before reductions do not reflect amounts reimbursed by the investment adviser or reductions from brokerage service arrangements or reductions from other expense offset arrangements and do not represent the amount paid by the class during periods when reimbursements or reductions occur. Expenses net of fee waivers reflect expenses after reimbursement by the investment adviser but prior to reductions from brokerage service arrangements or other expense offset arrangements. Expenses net of all reductions represent the net expenses paid by the class.
See accompanying notes which are an integral part of the financial statements.
Annual Report
Financial Highlights - Class K
Years ended January 31, | 2013 | 2012 | 2011 | 2010 | 2009 G |
Selected Per-Share Data | | | | | |
Net asset value, beginning of period | $ 42.76 | $ 45.56 | $ 37.93 | $ 27.48 | $ 51.47 |
Income from Investment Operations | | | | | |
Net investment income (loss) D | 1.38 | .95 | .72 | .72 | .61 |
Net realized and unrealized gain (loss) | 6.95 | (2.79) | 7.72 | 10.48 | (23.80) |
Total from investment operations | 8.33 | (1.84) | 8.44 | 11.20 | (23.19) |
Distributions from net investment income | (1.39) | (.96) | (.81) | (.75) | (.80) |
Net asset value, end of period | $ 49.70 | $ 42.76 | $ 45.56 | $ 37.93 | $ 27.48 |
Total Return B, C | 19.78% | (4.00)% | 22.50% | 41.30% | (45.45)% |
Ratios to Average Net Assets E, H | | | | | |
Expenses before reductions | .53% | .53% | .53% | .54% | .53% A |
Expenses net of fee waivers, if any | .53% | .53% | .53% | .54% | .53% A |
Expenses net of all reductions | .52% | .52% | .53% | .54% | .53% A |
Net investment income (loss) | 3.03% | 2.19% | 1.78% | 2.07% | 2.89% A |
Supplemental Data | | | | | |
Net assets, end of period (in millions) | $ 2,276 | $ 2,106 | $ 2,559 | $ 2,017 | $ 711 |
Portfolio turnover rate F | 43% | 80% | 28% | 30% | 33% |
A Annualized
B Total returns for periods of less than one year are not annualized.
C Total returns would have been lower if certain expenses had not been reduced during the applicable periods shown.
D Calculated based on average shares outstanding during the period.
E Fees and expenses of any underlying Fidelity Central Funds are not included in the Fund's expense ratio. The Fund indirectly bears its proportionate share of the expenses of any underlying Fidelity Central Funds.
F Amount does not include the portfolio activity of any underlying Fidelity Central Funds.
G For the period May 9, 2008 (commencement of sale of shares) to January 31, 2009.
H Expense ratios reflect operating expenses of the class. Expenses before reductions do not reflect amounts reimbursed by the investment adviser or reductions from brokerage service arrangements or reductions from other expense offset arrangements and do not represent the amount paid by the class during periods when reimbursements or reductions occur. Expense ratios before reductions for start-up periods may not be representative of longer-term operating periods. Expenses net of fee waivers reflect expenses after reimbursement by the investment adviser but prior to reductions from brokerage service arrangements or other expense offset arrangements. Expenses net of all reductions represent the net expenses paid by the class.
See accompanying notes which are an integral part of the financial statements.
Annual Report
Notes to Financial Statements
For the period ended January 31, 2013
(Amounts in thousands except percentages)
1. Organization.
Fidelity Equity-Income Fund (the Fund) is a fund of Fidelity Devonshire Trust (the Trust) and is authorized to issue an unlimited number of shares. The Trust is registered under the Investment Company Act of 1940, as amended (the 1940 Act), as an open-end management investment company organized as a Massachusetts business trust. The Fund offers Equity-Income and Class K shares, each of which has equal rights as to assets and voting privileges. Each class has exclusive voting rights with respect to matters that affect that class. Investment income, realized and unrealized capital gains and losses, the common expenses of the Fund, and certain fund-level expense reductions, if any, are allocated on a pro-rata basis to each class based on the relative net assets of each class to the total net assets of the Fund. Each class differs with respect to transfer agent fees incurred. Certain expense reductions may also differ by class.
2. Investments in Fidelity Central Funds.
The Fund invests in Fidelity Central Funds, which are open-end investment companies available only to other investment companies and accounts managed by Fidelity Management & Research Company (FMR) and its affiliates. The Fund's Schedule of Investments lists each of the Fidelity Central Funds held as of period end, if any, as an investment of the Fund, but does not include the underlying holdings of each Fidelity Central Fund. As an Investing Fund, the Fund indirectly bears its proportionate share of the expenses of the underlying Fidelity Central Funds.
The Money Market Central Funds seek preservation of capital and current income and are managed by Fidelity Investments Money Management, Inc. (FIMM), an affiliate of FMR.
A complete unaudited list of holdings for each Fidelity Central Fund is available upon request or at the Securities and Exchange Commission (the SEC) website at www.sec.gov. In addition, the financial statements of the Fidelity Central Funds, which are not covered by the Fund's Report of Independent Registered Public Accounting Firm, are available on the SEC website or upon request.
3. Significant Accounting Policies.
The financial statements have been prepared in conformity with accounting principles generally accepted in the United States of America (GAAP), which require management to make certain estimates and assumptions at the date of the financial statements. Actual results could differ from those estimates. Subsequent events, if any, through the date that the financial statements were issued have been evaluated in the preparation of the financial statements. The following summarizes the significant accounting policies of the Fund:
Annual Report
Notes to Financial Statements - continued
(Amounts in thousands except percentages)
3. Significant Accounting Policies - continued
Investment Valuation. Investments are valued as of 4:00 p.m. Eastern time on the last calendar day of the period. In accordance with valuation policies and procedures approved by the Board of Trustees (the Board), the Fund attempts to obtain prices from one or more third party pricing vendors or brokers to value its investments. When current market prices, quotations or currency exchange rates are not readily available or reliable, investments will be fair valued in good faith by the FMR Fair Value Committee (the Committee), in accordance with procedures adopted by the Fund's Board. Factors used in determining fair value vary by investment type and may include market or investment specific events, changes in interest rates and credit quality. The frequency with which these procedures are used cannot be predicted and they may be utilized to a significant extent. The Committee oversees the Fund's valuation policies and procedures and is responsible for approving and reporting to the Board all fair value determinations.
The Fund categorizes the inputs to valuation techniques used to value its investments into a disclosure hierarchy consisting of three levels as shown below:
Level 1 - quoted prices in active markets for identical investments
Level 2 - other significant observable inputs (including quoted prices for similar investments, interest rates, prepayment speeds, etc.)
Level 3 - unobservable inputs (including the Fund's own assumptions based on the best information available)
Valuation techniques used to value the Fund's investments by major category are as follows:
Equity securities, including restricted securities, for which market quotations are readily available, are valued at the last reported sale price or official closing price as reported by a third party pricing vendor on the primary market or exchange on which they are traded and are categorized as Level 1 in the hierarchy. In the event there were no sales during the day or closing prices are not available, securities are valued at the last quoted bid price or may be valued using the last available price and are generally categorized as Level 2 in the hierarchy. For foreign equity securities, when significant market or security specific events arise, comparisons to the valuation of American Depositary Receipts (ADRs), futures contracts, Exchange-Traded Funds (ETFs) and certain indexes as well as quoted prices for similar securities are used and are categorized as Level 2 in the hierarchy. Utilizing these techniques may result in transfers between Level 1 and Level 2. For restricted equity securities and private placements where observable inputs are limited, assumptions about market activity and risk are used and these securities are generally categorized as Level 3 in the hierarchy.
Annual Report
3. Significant Accounting Policies - continued
Investment Valuation - continued
Debt securities, including restricted securities, are valued based on evaluated prices received from third party pricing vendors or from brokers who make markets in such securities. For corporate bonds and floating rate loans, pricing vendors utilize matrix pricing which considers yield or price of bonds of comparable quality, coupon, maturity and type as well as broker-supplied prices. When independent prices are unavailable or unreliable, debt securities may be valued utilizing pricing methodologies which consider similar factors that would be used by third party pricing vendors. Debt Securities are generally categorized as Level 2 in the hierarchy but may be Level 3 depending on the circumstances.
Investments in open-end mutual funds, including the Fidelity Central Funds, are valued at their closing net asset value (NAV) each business day and are categorized as Level 1 in the hierarchy.
Changes in valuation techniques may result in transfers in or out of an assigned level within the disclosure hierarchy. The aggregate value of investments by input level, as of January 31, 2013, is included at the end of the Fund's Schedule of Investments.
Foreign Currency. The Fund may use foreign currency contracts to facilitate transactions in foreign-denominated securities. Gains and losses from these transactions may arise from changes in the value of the foreign currency or if the counterparties do not perform under the contracts' terms.
Foreign-denominated assets, including investment securities, and liabilities are translated into U.S. dollars at the exchange rates at period end. Purchases and sales of investment securities, income and dividends received and expenses denominated in foreign currencies are translated into U.S. dollars at the exchange rate in effect on the transaction date.
The effects of exchange rate fluctuations on investments are included with the net realized and unrealized gain (loss) on investment securities. Other foreign currency transactions resulting in realized and unrealized gain (loss) are disclosed separately.
Investment Transactions and Income. For financial reporting purposes, the Fund's investment holdings and NAV include trades executed through the end of the last business day of the period. The NAV per share for processing shareholder transactions is calculated as of the close of business of the New York Stock Exchange (NYSE), normally 4:00 p.m. Eastern time and includes trades executed through the end of the prior business day. Gains and losses on securities sold are determined on the basis of identified cost and may include proceeds received from litigation. Dividend income is recorded on the ex-dividend date, except for certain dividends from foreign securities where the
Annual Report
Notes to Financial Statements - continued
(Amounts in thousands except percentages)
3. Significant Accounting Policies - continued
Investment Transactions and Income - continued
ex-dividend date may have passed, which are recorded as soon as the Fund is informed of the ex-dividend date. Non-cash dividends included in dividend income, if any, are recorded at the fair market value of the securities received. Distributions received on securities that represent a return of capital or capital gain are recorded as a reduction of cost of investments and/or as a realized gain. The Fund estimates the components of distributions received that may be considered return of capital distributions or capital gain distributions. Interest income and distributions from the Fidelity Central Funds are accrued as earned. Interest income includes coupon interest and amortization of premium and accretion of discount on debt securities. Investment income is recorded net of foreign taxes withheld where recovery of such taxes is uncertain. Debt obligations may be placed on non-accrual status and related interest income may be reduced by ceasing current accruals and writing off interest receivables when the collection of all or a portion of interest has become doubtful based on consistently applied procedures. A debt obligation is removed from non-accrual status when the issuer resumes interest payments or when collectability of interest is reasonably assured.
Expenses. Expenses directly attributable to a fund are charged to that fund. Expenses attributable to more than one fund are allocated among the respective funds on the basis of relative net assets or other appropriate methods. Expense estimates are accrued in the period to which they relate and adjustments are made when actual amounts are known.
Deferred Trustee Compensation. Under a Deferred Compensation Plan (the Plan), independent Trustees may elect to defer receipt of a portion of their annual compensation. Deferred amounts are invested in a cross-section of Fidelity funds, are marked-to-market and remain in the Fund until distributed in accordance with the Plan. The investment of deferred amounts and the offsetting payable to the Trustees are included in the accompanying Statement of Assets and Liabilities.
Income Tax Information and Distributions to Shareholders. Each year, the Fund intends to qualify as a regulated investment company under Subchapter M of the Internal Revenue Code, including distributing substantially all of its taxable income and realized gains. As a result, no provision for income taxes is required. As of January 31, 2013, the Fund did not have any unrecognized tax benefits in the financial statements; nor is the Fund aware of any tax positions for which it is reasonably possible that the total amounts of unrecognized tax benefits will significantly change in the next twelve months. The Fund files a U.S. federal tax return, in addition to state and local tax returns as required. A fund's federal income tax returns are subject to examination by the Internal Revenue Service (IRS) for a period of three fiscal years after they are filed. State and local tax returns may be subject to examination for an additional fiscal year depending on the jurisdiction. Foreign taxes are provided for based on the Fund's
Annual Report
3. Significant Accounting Policies - continued
Income Tax Information and Distributions to Shareholders - continued
understanding of the tax rules and rates that exist in the foreign markets in which it invests.
Distributions are declared and recorded on the ex-dividend date. Income dividends and capital gain distributions are declared separately for each class. Income and capital gain distributions are determined in accordance with income tax regulations, which may differ from GAAP.
Capital accounts within the financial statements are adjusted for permanent book-tax differences. These adjustments have no impact on net assets or the results of operations. Temporary book-tax differences will reverse in a subsequent period.
Book-tax differences are primarily due to equity-debt classifications, foreign currency transactions, passive foreign investment companies (PFIC), market discount, partnerships, deferred trustees compensation, capital loss carryforwards and losses deferred due to wash sales and excise tax regulations.
The federal tax cost of investment securities and unrealized appreciation (depreciation) as of period end were as follows:
Gross unrealized appreciation | $ 1,343,864 |
Gross unrealized depreciation | (158,217) |
Net unrealized appreciation (depreciation) on securities and other investments | $ 1,185,647 |
| |
Tax Cost | $ 7,497,523 |
The tax-based components of distributable earnings as of period end were as follows:
Undistributed ordinary income | $ 9,375 |
Capital loss carryforward | $ (1,029,110) |
Net unrealized appreciation (depreciation) | $ 1,185,673 |
Capital loss carryforwards are only available to offset future capital gains of the Fund to the extent provided by regulations and may be limited. Under the Regulated Investment Company Modernization Act of 2010 (the Act), the Fund is permitted to carry forward capital losses incurred in taxable years beginning after December 22, 2010 for an unlimited period and such capital losses are required to be used prior to any losses that expire. Capital loss carryforwards were as follows:
Fiscal year of expiration | |
2018 | $ (1,029,110) |
Annual Report
Notes to Financial Statements - continued
(Amounts in thousands except percentages)
3. Significant Accounting Policies - continued
Income Tax Information and Distributions to Shareholders - continued
The tax character of distributions paid was as follows:
| January 31, 2013 | January 31, 2012 |
Ordinary Income | $ 248,423 | $ 215,914 |
Restricted Securities. The Fund may invest in securities that are subject to legal or contractual restrictions on resale. These securities generally may be resold in transactions exempt from registration or to the public if the securities are registered. Disposal of these securities may involve time-consuming negotiations and expense, and prompt sale at an acceptable price may be difficult. Information regarding restricted securities is included at the end of the Fund's Schedule of Investments.
Loans and Other Direct Debt Instruments. The Fund invests in direct debt instruments which are interests in amounts owed to lenders by corporate or other borrowers. These instruments may be in the form of loans, trade claims or other receivables and may include standby financing commitments such as revolving credit facilities that obligate the Fund to supply additional cash to the borrower on demand. Loans may be acquired through assignment or participation, or may be made directly to a borrower. The Fund may be contractually obligated to receive approval from the agent bank and/or borrower prior to the sale of these loans.
4. Purchases and Sales of Investments.
Purchases and sales of securities, other than short-term securities, aggregated $3,564,054 and $5,001,121, respectively.
5. Fees and Other Transactions with Affiliates.
Management Fee. FMR and its affiliates provide the Fund with investment management related services for which the Fund pays a monthly management fee. The management fee is the sum of an individual fund fee rate that is based on an annual rate of .20% of the Fund's average net assets and an annualized group fee rate that averaged .26% during the period. The group fee rate is based upon the average net assets of all the mutual funds advised by FMR. The group fee rate decreases as assets under management increase and increases as assets under management decrease. For the period, the total annual management fee rate was .46% of the Fund's average net assets.
Transfer Agent Fees. Fidelity Investments Institutional Operations Company, Inc. (FIIOC), an affiliate of FMR, is the transfer, dividend disbursing and shareholder servicing agent for each class of the Fund. FIIOC receives account fees and asset-based fees that vary according to the account size and type of account of the shareholders of
Annual Report
5. Fees and Other Transactions with Affiliates - continued
Transfer Agent Fees - continued
Equity-Income. FIIOC receives an asset-based fee of Class K's average net assets. FIIOC pays for typesetting, printing and mailing of shareholder reports, except proxy statements. For the period, transfer agent fees for each class were as follows:
| Amount | % of
Average
Net Assets |
Equity-Income | $ 12,318 | .19 |
Class K | 1,051 | .05 |
| $ 13,369 | |
Accounting and Security Lending Fees. Fidelity Service Company, Inc. (FSC), an affiliate of FMR, maintains the Fund's accounting records. The accounting fee is based on the level of average net assets for each month. Under a separate contract, FSC administers the security lending program. The security lending fee is based on the number and duration of lending transactions.
Brokerage Commissions. The Fund placed a portion of its portfolio transactions with brokerage firms which are affiliates of the investment adviser. The commissions paid to these affiliated firms were $57 for the period.
6. Committed Line of Credit.
The Fund participates with other funds managed by FMR or an affiliate in a $4.25 billion credit facility (the "line of credit") to be utilized for temporary or emergency purposes to fund shareholder redemptions or for other short-term liquidity purposes. The Fund has agreed to pay commitment fees on its pro-rata portion of the line of credit, which amounted to $23 and is reflected in Miscellaneous expenses on the Statement of Operations. During the period, there were no borrowings on this line of credit.
7. Security Lending.
The Fund lends portfolio securities through a lending agent from time to time in order to earn additional income. For equity securities, a lending agent is used and may loan securities to certain qualified borrowers, including Fidelity Capital Markets (FCM), a broker-dealer affiliated with the Fund. On the settlement date of the loan, the Fund receives collateral (in the form of U.S. Treasury obligations, letters of credit and/or cash) against the loaned securities and maintains collateral in an amount not less than 100% of the market value of the loaned securities during the period of the loan. The market value of the loaned securities is determined at the close of business of the Fund and any additional required collateral is delivered to the Fund on the next business day. If the
Annual Report
Notes to Financial Statements - continued
(Amounts in thousands except percentages)
7. Security Lending - continued
borrower defaults on its obligation to return the securities loaned because of insolvency or other reasons, a fund could experience delays and costs in recovering the securities loaned or in gaining access to the collateral. Any cash collateral received is invested in the Fidelity Securities Lending Cash Central Fund. The value of loaned securities and cash collateral at period end are disclosed on the Fund's Statement of Assets and Liabilities. The value of securities loaned to FCM at period end was $1,092. Security lending income represents the income earned on investing cash collateral, less rebates paid to borrowers and any lending agent fees associated with the loan, plus any premium payments received for lending certain types of securities. Security lending income is presented in the Statement of Operations as a component of income from Fidelity Central Funds. Total security lending income during the period amounted to $1,955, including $14 from securities loaned to FCM.
8. Expense Reductions.
Many of the brokers with whom FMR places trades on behalf of the Fund provided services to the Fund in addition to trade execution. These services included payments of certain expenses on behalf of the Fund totaling $948 for the period. In addition, through arrangements with the Fund's custodian, credits realized as a result of uninvested cash balances were used to reduce the Fund's expenses. During the period, these credits reduced the Fund's custody accounting expenses by $2.
9. Distributions to Shareholders.
Distributions to shareholders of each class were as follows:
Years ended January 31, | 2013 | 2012 |
From net investment income | | |
Equity-Income | $ 184,959 | $ 168,293 |
Class K | 63,464 | 47,621 |
Total | $ 248,423 | $ 215,914 |
10. Share Transactions.
Transactions for each class of shares were as follows:
| Shares | Dollars |
Years ended January 31, | 2013 | 2012 | 2013 | 2012 |
Equity-Income | | | | |
Shares sold | 14,447 | 17,424 | $ 652,997 | $ 768,861 |
Reinvestment of distributions | 3,847 | 3,805 | 176,234 | 161,431 |
Shares redeemed | (49,571) | (81,714) | (2,252,887) | (3,452,168) |
Net increase (decrease) | (31,277) | (60,485) | $ (1,423,656) | $ (2,521,876) |
Annual Report
10. Share Transactions - continued
| Shares | Dollars |
Years ended January 31, | 2013 | 2012 | 2013 | 2012 |
Class K | | | | |
Shares sold | 14,463 | 20,736 | $ 662,159 | $ 882,621 |
Reinvestment of distributions | 1,385 | 1,117 | 63,464 | 47,621 |
Shares redeemed | (19,293) | (28,765) | (878,079) | (1,209,236) |
Net increase (decrease) | (3,445) | (6,912) | $ (152,456) | $ (278,994) |
11. Other.
The Fund's organizational documents provide former and current trustees and officers with a limited indemnification against liabilities arising in connection with the performance of their duties to the Fund. In the normal course of business, the Fund may also enter into contracts that provide general indemnifications. The Fund's maximum exposure under these arrangements is unknown as this would be dependent on future claims that may be made against the Fund. The risk of material loss from such claims is considered remote.
Annual Report
To the Trustees of Fidelity Devonshire Trust and the Shareholders of Fidelity Equity-Income Fund:
In our opinion, the accompanying statement of assets and liabilities, including the schedule of investments, and the related statements of operations and of changes in net assets and the financial highlights present fairly, in all material respects, the financial position of Fidelity Equity-Income Fund (a fund of Fidelity Devonshire Trust) at January 31, 2013, the results of its operations for the year then ended, the changes in its net assets for each of the two years in the period then ended and the financial highlights for each of the periods indicated, in conformity with accounting principles generally accepted in the United States of America. These financial statements and financial highlights (hereafter referred to as "financial statements") are the responsibility of the Fidelity Equity-Income Fund's management. Our responsibility is to express an opinion on these financial statements based on our audits. We conducted our audits of these financial statements in accordance with the standards of the Public Company Accounting Oversight Board (United States). Those standards require that we plan and perform the audit to obtain reasonable assurance about whether the financial statements are free of material misstatement. An audit includes examining, on a test basis, evidence supporting the amounts and disclosures in the financial statements, assessing the accounting principles used and significant estimates made by management, and evaluating the overall financial statement presentation. We believe that our audits, which included confirmation of securities at January 31, 2013 by correspondence with the custodian, agent banks and brokers, provide a reasonable basis for our opinion.
PricewaterhouseCoopers LLP
Boston, Massachusetts
March 13, 2013
Annual Report
The Trustees, Members of the Advisory Board, and executive officers of the trust and fund, as applicable, are listed below. The Board of Trustees governs the fund and is responsible for protecting the interests of shareholders. The Trustees are experienced executives who meet periodically throughout the year to oversee the fund's activities, review contractual arrangements with companies that provide services to the fund, oversee management of the risks associated with such activities and contractual arrangements, and review the fund's performance. Except for James C. Curvey, each of the Trustees oversees 234 Fidelity funds. Mr. Curvey oversees 453 Fidelity funds.
The Trustees hold office without limit in time except that (a) any Trustee may resign; (b) any Trustee may be removed by written instrument, signed by at least two-thirds of the number of Trustees prior to such removal; (c) any Trustee who requests to be retired or who has become incapacitated by illness or injury may be retired by written instrument signed by a majority of the other Trustees; and (d) any Trustee may be removed at any special meeting of shareholders by a two-thirds vote of the outstanding voting securities of the trust. Each Trustee who is not an interested person (as defined in the 1940 Act) (Independent Trustee), shall retire not later than the last day of the calendar year in which his or her 75th birthday occurs. The Independent Trustees may waive this mandatory retirement age policy with respect to individual Trustees. The executive officers and Advisory Board Members hold office without limit in time, except that any officer and Advisory Board Member may resign or may be removed by a vote of a majority of the Trustees at any regular meeting or any special meeting of the Trustees. Except as indicated, each individual has held the office shown or other offices in the same company for the past five years.
Experience, Skills, Attributes, and Qualifications of the Fund's Trustees. The Governance and Nominating Committee has adopted a statement of policy that describes the experience, qualifications, attributes, and skills that are necessary and desirable for potential Independent Trustee candidates (Statement of Policy). The Board believes that each Trustee satisfied at the time he or she was initially elected or appointed a Trustee, and continues to satisfy, the standards contemplated by the Statement of Policy. The Governance and Nominating Committee also engages professional search firms to help identify potential Independent Trustee candidates who have the experience, qualifications, attributes, and skills consistent with the Statement of Policy. From time to time, additional criteria based on the composition and skills of the current Independent Trustees, as well as experience or skills that may be appropriate in light of future changes to board composition, business conditions, and regulatory or other developments, have also been considered by the professional search firms and the Governance and Nominating Committee. In addition, the Board takes into account the Trustees' commitment and participation in Board and committee meetings, as well as their leadership of standing and ad hoc committees throughout their tenure.
In determining that a particular Trustee was and continues to be qualified to serve as a Trustee, the Board has considered a variety of criteria, none of which, in isolation, was controlling. The Board believes that, collectively, the Trustees have balanced and diverse experience, qualifications, attributes, and skills, which allow the Board to operate effectively in governing the fund and protecting the interests of shareholders. Information about the specific experience, skills, attributes, and qualifications of each Trustee, which in each case led to the Board's conclusion that the Trustee should serve (or continue to serve) as a trustee of the fund, is provided below.
Annual Report
Board Structure and Oversight Function. James C. Curvey is an interested person (as defined in the 1940 Act) and currently serves as Chairman. The Trustees have determined that an interested Chairman is appropriate and benefits shareholders because an interested Chairman has a personal and professional stake in the quality and continuity of services provided to the fund. Independent Trustees exercise their informed business judgment to appoint an individual of their choosing to serve as Chairman, regardless of whether the Trustee happens to be independent or a member of management. The Independent Trustees have determined that they can act independently and effectively without having an Independent Trustee serve as Chairman and that a key structural component for assuring that they are in a position to do so is for the Independent Trustees to constitute a substantial majority for the Board. The Independent Trustees also regularly meet in executive session. Ned C. Lautenbach serves as Chairman of the Independent Trustees and as such (i) acts as a liaison between the Independent Trustees and management with respect to matters important to the Independent Trustees and (ii) with management prepares agendas for Board meetings.
Fidelity funds are overseen by different Boards of Trustees. The fund's Board oversees Fidelity's equity and high income funds and another Board oversees Fidelity's investment-grade bond, money market, and asset allocation funds. The asset allocation funds may invest in Fidelity funds overseen by the fund's Board. The use of separate Boards, each with its own committee structure, allows the Trustees of each group of Fidelity funds to focus on the unique issues of the funds they oversee, including common research, investment, and operational issues. On occasion, the separate Boards establish joint committees to address issues of overlapping consequences for the Fidelity funds overseen by each Board.
The Trustees operate using a system of committees to facilitate the timely and efficient consideration of all matters of importance to the Trustees, the fund, and fund shareholders and to facilitate compliance with legal and regulatory requirements and oversight of the fund's activities and associated risks. The Board, acting through its committees, has charged FMR and its affiliates with (i) identifying events or circumstances the occurrence of which could have demonstrably adverse effects on the fund's business and/or reputation; (ii) implementing processes and controls to lessen the possibility that such events or circumstances occur or to mitigate the effects of such events or circumstances if they do occur; and (iii) creating and maintaining a system designed to evaluate continuously business and market conditions in order to facilitate the identification and implementation processes described in (i) and (ii) above. Because the day-to-day operations and activities of the fund are carried out by or through FMR, its affiliates and other service providers, the fund's exposure to risks is mitigated but not eliminated by the processes overseen by the Trustees. While each of the Board's committees has responsibility for overseeing different aspects of the fund's activities, oversight is exercised primarily through the Operations, Audit, and Compliance Committees. In addition, the Independent Trustees have worked with FMR to enhance the Board's oversight of investment and financial risks, legal and regulatory risks, technology risks, and operational risks, including the development of additional risk reporting to the Board. For example, a working group comprised of Independent Trustees and FMR has worked and continues to work to review the Fidelity funds' valuation-related activities, reporting and risk management. Appropriate personnel, including but not limited to the fund's Chief Compliance Officer (CCO), FMR's internal auditor, the independent accountants, the fund's Treasurer and portfolio management personnel, make periodic reports to the Board's committees, as appropriate, including an annual review of FMR's risk management program for the Fidelity funds. The responsibilities of each standing committee, including their oversight responsibilities, are described further under "Standing Committees of the Fund's Trustees."
Annual Report
Trustees and Officers - continued
The fund's Statement of Additional Information (SAI) includes more information about the Trustees. To request a free copy, call Fidelity at 1-800-544-8544.
Interested Trustees*:
Correspondence intended for each Trustee who is an interested person may be sent to Fidelity Investments, 245 Summer Street, Boston, Massachusetts 02210.
Name, Age; Principal Occupations and Other Relevant Experience+ |
James C. Curvey (77) |
| Year of Election or Appointment: 2007 Mr. Curvey is Trustee and Chairman of the Board of Trustees of certain Trusts. Mr. Curvey also serves as Trustee (2007-present) of other investment companies advised by FMR. Mr. Curvey is a Director of Fidelity Investments Money Management, Inc. (2009-present), Director of Fidelity Research & Analysis Co. (2009-present) and Director of FMR and FMR Co., Inc. (2007-present). Mr. Curvey is also Vice Chairman (2007-present) and Director of FMR LLC. In addition, Mr. Curvey serves as an Overseer for the Boston Symphony Orchestra and a member of the Trustees of Villanova University. Previously, Mr. Curvey was the Vice Chairman (2006-2007) and Director (2000-2007) of FMR Corp. |
Ronald P. O'Hanley (55) |
| Year of Election or Appointment: 2011 Mr. O'Hanley is Director of FMR Co., Inc. (2010-present), Director of Fidelity Investments Money Management, Inc. (2010-present), Director of Fidelity Research & Analysis Company (2010-present), President of Fidelity Asset Management and Corporate Services and a member of Fidelity's Executive Committee (2010-present). Previously, Mr. O'Hanley served as President and Chief Executive Officer of BNY Mellon Asset Management (2007-2010). Mr. O'Hanley also served as Vice Chairman of Bank New York Mellon Corp. and a member of that firm's Executive Committee. Prior to the 2007 merger of The Bank of New York and Mellon Financial Corporation, he was Vice Chairman of Mellon Financial Corporation and President and Chief Executive Officer of Mellon Asset Management. He joined Mellon in February 1997. Mr. O'Hanley currently serves as Chairman of the Boston Public Library Foundation Board of Directors and sits on the Board of Directors of Beth Israel Deaconess Medical Center, the Board of Trustees of the Marine Biological Laboratory and the Advisory Board of the Maxwell School of Citizenship and Public Administration at Syracuse University. Mr. O'Hanley also chairs the Council on Asset Management for the Financial Services Roundtable and is a member of the Board of Directors of Institutional Investor's U.S. Institute. |
* Trustees have been determined to be "Interested Trustees" by virtue of, among other things, their affiliation with the trust or various entities under common control with FMR.
+ The information above includes each Trustee's principal occupation during the last five years and other information relating to the experience, attributes, and skills relevant to each Trustee's qualifications to serve as a Trustee, which led to the conclusion that each Trustee should serve as a Trustee for the fund.
Annual Report
Trustees and Officers - continued
Independent Trustees:
Correspondence intended for each Independent Trustee (that is, the Trustees other than the Interested Trustees) may be sent to Fidelity Investments, P.O. Box 55235, Boston, Massachusetts 02205-5235.
Name, Age; Principal Occupations and Other Relevant Experience+ |
Dennis J. Dirks (64) |
| Year of Election or Appointment: 2005 Prior to his retirement in May 2003, Mr. Dirks was Chief Operating Officer and a member of the Board of The Depository Trust & Clearing Corporation (DTCC). He also served as President, Chief Operating Officer, and Board member of The Depository Trust Company (DTC) and President and Board member of the National Securities Clearing Corporation (NSCC). In addition, Mr. Dirks served as Chief Executive Officer and Board member of the Government Securities Clearing Corporation, Chief Executive Officer and Board member of the Mortgage-Backed Securities Clearing Corporation, as a Trustee and a member of the Finance Committee of Manhattan College (2005-2008), and as a Trustee and a member of the Finance Committee of AHRC of Nassau County (2006-2008). Mr. Dirks is a member of the Independent Directors Council (IDC) Governing Council (2010-present) and Board of Directors for The Brookville Center for Children's Services, Inc. (2009-present). |
Alan J. Lacy (59) |
| Year of Election or Appointment: 2008 Mr. Lacy serves as Senior Adviser (2007-present) of Oak Hill Capital Partners, L.P. (private equity). Mr. Lacy also served as Chief Executive Officer (2000-2005) and Vice Chairman (2005-2006) of Sears Holdings Corporation and Sears, Roebuck and Co. (retail). In addition, Mr. Lacy serves as a member of the Board of Directors of Dave & Buster's Entertainment, Inc. (restaurant and entertainment complexes, 2010-present), Earth Fare, Inc. (retail grocery, 2012-present), The Hillman Companies, Inc. (hardware wholesalers, 2010-present), and Bristol-Myers Squibb Company (global pharmaceuticals, 2008-present). Mr. Lacy is a member of the Board of Trustees of The National Parks Conservation Association (2006-present). Previously, Mr. Lacy served as Chairman of the Board of Trustees of the National Parks Conservation Association (2008-2011) and as a member of the Board of Directors for the Western Union Company (global money transfer, 2006-2011). |
Ned C. Lautenbach (68) |
| Year of Election or Appointment: 2000 Mr. Lautenbach is Chairman of the Independent Trustees of the Equity and High Income Funds (2006-present). Mr. Lautenbach currently serves as the Lead Director of the Eaton Corporation Board of Directors (diversified industrial, 1997-present). Mr. Lautenbach is Chairman of the Board of Directors of the Philharmonic Center for the Arts in Naples, Florida (2012-present) and a member of the Council on Foreign Relations (1994-present). Previously, Mr. Lautenbach was a Partner/Advisory Partner at Clayton, Dubilier & Rice, LLC (private equity investment, 1998-2010), as well as a Director of Sony Corporation (2006-2007). |
Joseph Mauriello (68) |
| Year of Election or Appointment: 2008 Prior to his retirement in January 2006, Mr. Mauriello served in numerous senior management positions including Deputy Chairman and Chief Operating Officer (2004-2005), and Vice Chairman of Financial Services (2002-2004) of KPMG LLP US (professional services, 1965-2005). Mr. Mauriello currently serves as a member of the Board of Directors of XL Group plc. (global insurance and re-insurance, 2006-present). Previously, Mr. Mauriello served as a Director of the Hamilton Funds of the Bank of New York (2006-2007) and of Arcadia Resources Inc. (health care services and products, 2007-2012). |
Robert W. Selander (62) |
| Year of Election or Appointment: 2011 Previously, Mr. Selander served as a Member of the Advisory Board of Fidelity's Equity and High Income Funds (2011), Executive Vice Chairman (2010), Chief Executive Officer (2009-2010), and President and Chief Executive Officer (1997-2009) of Mastercard, Inc. |
Cornelia M. Small (68) |
| Year of Election or Appointment: 2005 Ms. Small is a member of the Board of Directors (2009-present) and Chair of the Investment Committee (2010-present) of the Teagle Foundation. Ms. Small also serves on the Investment Committee of the Berkshire Taconic Community Foundation (2008-present). Previously, Ms. Small served as Chairperson (2002-2008) and a member of the Investment Committee and Chairperson (2008-2012) and a member of the Board of Trustees of Smith College. In addition, Ms. Small served as Chief Investment Officer, Director of Global Equity Investments, and a member of the Board of Directors of Scudder, Stevens & Clark and Scudder Kemper Investments. |
William S. Stavropoulos (73) |
| Year of Election or Appointment: 2002 Mr. Stavropoulos is Vice Chairman of the Independent Trustees of the Equity and High Income Funds (2006-present). Mr. Stavropoulos serves as President and Founder of the Michigan Baseball Foundation, the Great Lakes Loons (2007-present). Mr. Stavropoulos is Chairman Emeritus of the Board of Directors of The Dow Chemical Company, where he previously served in numerous senior management positions, including President, CEO (1995-2000; 2002-2004), Chairman of the Executive Committee (2000-2006), and as a member of the Board of Directors (1990-2006). Currently, Mr. Stavropoulos is a Director of Univar Inc. (global distributor of commodity and specialty chemicals, Chairman from 2010-May 2012 and Lead Director from May 2012-present), Teradata Corporation (data warehousing and technology solutions, 2008-present), Maersk Inc. (industrial conglomerate), and Tyco International, Ltd. (multinational manufacturing and services, 2007-present), and a member of the Advisory Board for Metalmark Capital LLC (private equity investment, 2005-present). Mr. Stavropoulos is an operating advisor to Clayton, Dubilier & Rice, LLC (private equity investment). In addition, Mr. Stavropoulos is a member of the University of Notre Dame Advisory Council for the College of Science, a Trustee of the Rollin L. Gerstacker Foundation, and a Director of the Naples Philharmonic Center for the Arts. Previously, Mr. Stavropoulos served as a Director of Chemical Financial Corporation (bank holding company, 1993-2012). |
David M. Thomas (63) |
| Year of Election or Appointment: 2008 Previously, Mr. Thomas served as Executive Chairman (2005-2006) and Chairman and Chief Executive Officer (2000-2005) of IMS Health, Inc. (pharmaceutical and healthcare information solutions), and a Director of Fortune Brands, Inc. (consumer products, 2000-2011). In addition, Mr. Thomas serves as Non-Executive Chairman of the Board of Directors of Fortune Brands Home and Security (home and security products, 2011-present), and as a member of the Board of Directors of Interpublic Group of Companies, Inc. (marketing communication, 2004-present). |
Michael E. Wiley (62) |
| Year of Election or Appointment: 2008 Mr. Wiley also serves as a Director of Asia Pacific Exploration Consolidated (international oil and gas exploration and production, 2008-present). Mr. Wiley serves as a Director of Tesoro Corporation (independent oil refiner and marketer, 2005-present), and a Director of Bill Barrett Corporation (exploration and production, 2005-present). In addition, Mr. Wiley also serves as a Director of Post Oak Bank (privately-held bank, 2004-present). Previously, Mr. Wiley served as a member of the Board of Trustees of the University of Tulsa (2000-2006; 2007-2010), as a Senior Energy Advisor of Katzenbach Partners, LLC (consulting, 2006-2007), as an Advisory Director of Riverstone Holdings (private investment), Chairman, President, and CEO of Baker Hughes, Inc. (oilfield services, 2000-2004), and as Director of Spinnaker Exploration Company (exploration and production, 2001-2005). |
+ The information above includes each Trustee's principal occupation during the last five years and other information relating to the experience, attributes, and skills relevant to each Trustee's qualifications to serve as a Trustee, which led to the conclusion that each Trustee should serve as a Trustee for the fund.
Advisory Board Members and Executive Officers:
Correspondence intended for David A. Rosow and Garnett A. Smith may be sent to Fidelity Investments, P.O. Box 55235, Boston, Massachusetts 02205-5235. Correspondence intended for each executive officer and Peter S. Lynch may be sent to Fidelity Investments, 245 Summer Street, Boston, Massachusetts 02210.
Name, Age; Principal Occupation |
Peter S. Lynch (69) |
| Year of Election or Appointment: 2003 Member of the Advisory Board of Fidelity's Equity and High Income Funds. Mr. Lynch is Vice Chairman and a Director of FMR and FMR Co., Inc. In addition, Mr. Lynch serves as a Trustee of Boston College and as the Chairman of the Inner-City Scholarship Fund. Previously, Mr. Lynch served on the Special Olympics International Board of Directors (1997-2006). |
David A. Rosow (70) |
| Year of Election or Appointment: 2012 Member of the Advisory Board of Fidelity's Equity and High Income Funds. Chairman and Chief Executive Officer of International Golf Group, Inc. (golf course development, 1989-present). Previously, Mr. Rosow served as Chairman and Chief Executive Officer of Rosow & Company, Inc. (private investment company, 1989-2011), a Lead Director of Hudson United Bancorp (2001-2006) and as a Director of TD Banknorth (1996-2006). In addition, Mr. Rosow is a member (2008-present) and President (2009-present) of the Town Council of Palm Beach, Florida. |
Garnett A. Smith (65) |
| Year of Election or Appointment: 2012 Member of the Advisory Board of Fidelity's Equity and High Income Funds. Prior to Mr. Smith's retirement, he served as Chairman and Chief Executive Officer of Inbrand Corp. (manufacturer of personal absorbent products, 1990-1997). He also served as President (1986-1990) of Inbrand Corp. Prior to his employment with Inbrand Corp., he was employed by a retail fabric chain and North Carolina National Bank. In addition, Mr. Smith is a board member of the Jackson Hole Land Trust (2009-present). |
Kenneth B. Robins (43) |
| Year of Election or Appointment: 2008 President and Treasurer of Fidelity's Equity and High Income Funds. Mr. Robins also serves as President and Treasurer (2010-present) and Assistant Treasurer (2009-present) of other Fidelity funds and is an employee of Fidelity Investments (2004-present). Previously, Mr. Robins served as Deputy Treasurer of the Fidelity funds (2005-2008) and Treasurer and Chief Financial Officer of The North Carolina Capital Management Trust: Cash and Term Portfolios (2006-2008). |
Bruce T. Herring (47) |
| Year of Election or Appointment: 2006 Vice President of certain Equity Funds. Mr. Herring also serves as Chief Investment Officer of Fidelity Global Asset Allocation (GAA) (2013-present), Chief Investment Officer and Director of Fidelity Management & Research (U.K.) Inc. (2010-present), Group Chief Investment Officer of FMR, and President of Fidelity Research & Analysis Company (2010-present). Previously, Mr. Herring served as Vice President (2005-2006) and Senior Vice President (2006-2007) of Fidelity Management & Research Company, Vice President of FMR Co., Inc. (2001-2007) and as a portfolio manager for Fidelity U.S. Equity Funds. |
Brian B. Hogan (48) |
| Year of Election or Appointment: 2009 Vice President of Equity and High Income Funds. Mr. Hogan also serves as President of FMR's Equity Division (2009-present). Previously, Mr. Hogan served as Senior Vice President, Equity Research of FMR (2006-2009) and as a portfolio manager. |
Scott C. Goebel (45) |
| Year of Election or Appointment: 2008 Secretary and Chief Legal Officer (CLO) of the Fidelity funds. Mr. Goebel also serves as Secretary of Fidelity Investments Money Management, Inc. (FIMM) (2010-present) and Fidelity Research and Analysis Company (FRAC) (2010-present); Secretary and CLO of The North Carolina Capital Management Trust: Cash and Term Portfolios (2008-present); General Counsel, Secretary, and Senior Vice President of FMR (2008-present) and FMR Co., Inc. (2008-present); employed by FMR LLC or an affiliate (2001-present); Chief Legal Officer of Fidelity Management & Research (Hong Kong) Limited (2008-present) and Assistant Secretary of Fidelity Management & Research (Japan) Inc. (2008-present), and Fidelity Management & Research (U.K.) Inc. (2008-present). Previously, Mr. Goebel served as Assistant Secretary of FIMM (2008-2010), FRAC (2008-2010), and the Funds (2007-2008) and as Vice President and Secretary of Fidelity Distributors Corporation (FDC) (2005-2007). |
William C. Coffey (43) |
| Year of Election or Appointment: 2009 Assistant Secretary of Fidelity's Equity and High Income Funds. Mr. Coffey also serves as Senior Vice President and Deputy General Counsel of FMR LLC (2010-present), and is an employee of Fidelity Investments. Previously, Mr. Coffey served as Vice President and Associate General Counsel of FMR LLC (2005-2009). |
Elizabeth Paige Baumann (44) |
| Year of Election or Appointment: 2012 Anti-Money Laundering (AML) Officer of the Fidelity funds. Ms. Baumann also serves as AML Officer of The North Carolina Capital Management Trust: Cash and Term Portfolios (2012-present), Chief AML Officer of FMR LLC (2012-present), and is an employee of Fidelity Investments. Previously, Ms. Baumann served as Vice President and Deputy Anti-Money Laundering Officer (2007-2012). |
Christine Reynolds (54) |
| Year of Election or Appointment: 2008 Chief Financial Officer of the Fidelity funds. Ms. Reynolds became President of Fidelity Pricing and Cash Management Services (FPCMS) in August 2008. Ms. Reynolds served as Chief Operating Officer of FPCMS (2007-2008). Previously, Ms. Reynolds served as President, Treasurer, and Anti-Money Laundering officer of the Fidelity funds (2004-2007). |
Joseph A. Hanlon (44) |
| Year of Election or Appointment: 2012 Chief Compliance Officer of Fidelity's Equity and High Income Funds. Mr. Hanlon serves as Compliance Officer of FMR, FMR Co., Inc., Fidelity Investments Money Management, Inc. (FIMM), Fidelity Research and Analysis Company (FRAC), Fidelity Management & Research (Japan) Inc., Fidelity Management & Research (U.K.) Inc., Fidelity Management & Research (Hong Kong), and Strategic Advisers, Inc. (2009-present), as Senior Vice President of the Fidelity Asset Management Division (2009-present), and is an employee of Fidelity Investments. |
Joseph F. Zambello (55) |
| Year of Election or Appointment: 2011 Deputy Treasurer of the Fidelity funds. Mr. Zambello is an employee of Fidelity Investments. Previously, Mr. Zambello served as Vice President of FMR's Program Management Group (2009-2011) and Vice President of the Transfer Agent Oversight Group (2005-2009). |
Adrien E. Deberghes (45) |
| Year of Election or Appointment: 2008 Deputy Treasurer of Fidelity's Equity and High Income Funds. Mr. Deberghes also serves as Vice President (2011-present) and Assistant Treasurer (2010-present) of other Fidelity funds, and is an employee of Fidelity Investments (2008-present). Previously, Mr. Deberghes served as Senior Vice President of Mutual Fund Administration at State Street Corporation (2007-2008), Senior Director of Mutual Fund Administration at Investors Bank & Trust (2005-2007), and Director of Finance for Dunkin' Brands (2000-2005). |
Stephen Sadoski (41) |
| Year of Election or Appointment: 2012 Deputy Treasurer of Fidelity's Equity and High Income Funds. Mr. Sadoski also serves as Deputy Treasurer of other Fidelity funds (2013-present) and is an employee of Fidelity Investments (2012-present). Previously, Mr. Sadoski served as Assistant Treasurer of Fidelity's Fixed Income and Asset Allocation Funds (2012-2013), an assistant chief accountant in the Division of Investment Management of the Securities and Exchange Commission (SEC) (2009-2012) and as a senior manager at Deloitte & Touche (1997-2009). |
Stacie Smith (38) |
| Year of Election or Appointment: 2013 Deputy Treasurer of Fidelity's Equity and High Income Funds. Ms. Smith is an employee of Fidelity Investments (2009-present). Previously, Ms. Smith served as Senior Audit Manager of Ernst & Young LLP (1996-2009). |
Stephanie J. Dorsey (43) |
| Year of Election or Appointment: 2010 Assistant Treasurer of Fidelity's Equity and High Income Funds. Ms. Dorsey also serves as President and Treasurer (2013-present) and Assistant Treasurer (2012-present) of other Fidelity funds and is an employee of Fidelity Investments (2008-present). Previously, Ms. Dorsey served as Deputy Treasurer of Fidelity's Fixed Income and Asset Allocation Funds (2008-2013), Treasurer (2004-2008) of the JPMorgan Mutual Funds and Vice President (2004-2008) of JPMorgan Chase Bank. |
John R. Hebble (54) |
| Year of Election or Appointment: 2009 Assistant Treasurer of Fidelity's Equity and High Income Funds. Mr. Hebble also serves as President (2011-present), Treasurer, and Chief Financial Officer of The North Carolina Capital Management Trust: Cash and Term Portfolios (2008-present) and is an employee of Fidelity Investments. Previously, Mr. Hebble served as President and Treasurer of Fidelity's Fixed Income and Asset Allocation Funds (2008-2013). |
Gary W. Ryan (54) |
| Year of Election or Appointment: 2005 Assistant Treasurer of the Fidelity funds. Mr. Ryan is an employee of Fidelity Investments. Previously, Mr. Ryan served as Vice President of Fund Reporting in Fidelity Pricing and Cash Management Services (FPCMS) (1999-2005). |
Jonathan Davis (44) |
| Year of Election or Appointment: 2010 Assistant Treasurer of the Fidelity funds. Mr. Davis is also Assistant Treasurer of Fidelity Rutland Square Trust II and Fidelity Commonwealth Trust II. Mr. Davis is an employee of Fidelity Investments. Previously, Mr. Davis served as Vice President and Associate General Counsel of FMR LLC (2003-2010). |
Annual Report
A total of 0.03% of the dividends distributed during the fiscal year was derived from interest on U.S. Government securities which is generally exempt from state income tax.
Equity-Income designates 82%, 79%, 79% and 78% of the dividends distributed in April, July, October and December 2012, respectively during the fiscal year as qualifying for the dividends-received deduction for corporate shareholders.
Equity-Income designates 96%, 95%, 95% and 95% of the dividends distributed in April, July, October and December 2012, respectively during the fiscal year as amounts which may be taken into account as a dividend for the purposes of the maximum rate under section 1(h)(11) of the Internal Revenue Code.
The fund will notify shareholders in January 2014 of amounts for use in preparing 2013 income tax returns.
Annual Report
Investment Adviser
Fidelity Management & Research Company
Boston, MA
Investment Sub-Advisers
FMR Co., Inc.
Fidelity Management & Research
(U.K.) Inc.
Fidelity Management & Research
(Japan) Inc.
Fidelity Management & Research
(Hong Kong) Limited
General Distributor
Fidelity Distributors Corporation
Smithfield, RI
Transfer and Service Agents
Fidelity Investments Institutional
Operations Company, Inc.
Boston, MA
Fidelity Service Company, Inc.
Boston, MA
Custodian
The Northern Trust Company
Chicago, IL
The Fidelity Telephone Connection
Mutual Fund 24-Hour Service
Exchanges/Redemptions
and Account Assistance 1-800-544-6666
Product Information 1-800-544-6666
Retirement Accounts 1-800-544-4774
(8 a.m. - 9 p.m.)
TDD Service 1-800-544-0118
for the deaf and hearing impaired
(9 a.m. - 9 p.m. Eastern time)
Fidelity Automated Service
Telephone (FAST®)
1-800-544-5555
Automated line for quickest service
(Fidelity Investment logo)(registered trademark)
Corporate Headquarters
245 Summer St., Boston, MA 02210
www.fidelity.com
EQU-UANN-0313
1.789253.111
Fidelity®
Equity-Income
Fund -
Class K
Annual Report
January 31, 2013
(Fidelity Cover Art)
Contents
Performance | (Click Here) | How the fund has done over time. |
Management's Discussion of Fund Performance | (Click Here) | The Portfolio Manager's review of fund performance and strategy. |
Shareholder Expense Example | (Click Here) | An example of shareholder expenses. |
Investment Changes | (Click Here) | A summary of major shifts in the fund's investments over the past six months. |
Investments | (Click Here) | A complete list of the fund's investments with their market values. |
Financial Statements | (Click Here) | Statements of assets and liabilities, operations, and changes in net assets, as well as financial highlights. |
Notes | (Click Here) | Notes to the financial statements. |
Report of Independent Registered Public Accounting Firm | (Click Here) | |
Trustees and Officers | (Click Here) | |
Distributions | (Click Here) | |
To view a fund's proxy voting guidelines and proxy voting record for the 12-month period ended June 30, visit http://www.fidelity.com/proxyvotingresults or visit the Securities and Exchange Commission's (SEC) web site at http://www.sec.gov. You may also call 1-800-835-5092 to request a free copy of the proxy voting guidelines.
Standard & Poor's, S&P and S&P 500 are registered service marks of The McGraw-Hill Companies, Inc. and have been licensed for use by Fidelity Distributors Corporation.
Other third-party marks appearing herein are the property of their respective owners.
All other marks appearing herein are registered or unregistered trademarks or service marks of FMR LLC or an affiliated company. © 2013 FMR LLC. All rights reserved.
Annual Report
This report and the financial statements contained herein are submitted for the general information of the shareholders of the fund. This report is not authorized for distribution to prospective investors in the fund unless preceded or accompanied by an effective prospectus.
A fund files its complete schedule of portfolio holdings with the SEC for the first and third quarters of each fiscal year on Form N-Q. Forms N-Q are available on the SEC's web site at http://www.sec.gov. A fund's Forms N-Q may be reviewed and copied at the SEC's Public Reference Room in Washington, DC. Information regarding the operation of the SEC's Public Reference Room may be obtained by calling 1-800-SEC-0330. For a complete list of a fund's portfolio holdings, view the most recent holdings listing, semiannual report, or annual report on Fidelity's web site at http://www.fidelity.com, http://www.advisor.fidelity.com, or http://www.401k.com, as applicable.
NOT FDIC INSURED • MAY LOSE VALUE • NO BANK GUARANTEE
Neither the fund nor Fidelity Distributors Corporation is a bank.
Annual Report
Average annual total return reflects the change in the value of an investment, assuming reinvestment of the class' distributions from dividend income and capital gains (the profits earned upon the sale of securities that have grown in value, if any) and assuming a constant rate of performance each year. The $10,000 table and the fund's returns do not reflect the deduction of taxes that a shareholder would pay on fund distributions or the redemption of fund shares. During periods of reimbursement by Fidelity, a fund's total return will be greater than it would be had the reimbursement not occurred. How a fund did yesterday is no guarantee of how it will do tomorrow.
Average Annual Total Returns
Periods ended January 31, 2013 | Past 1
year | Past 5
years | Past 10
years |
Class KA | 19.78% | 1.80% | 7.13% |
A The initial offering of Class K shares took place on May 9, 2008. Returns prior to May 9, 2008, are those of Fidelity® Equity-Income Fund, the original class of the fund.
$10,000 Over 10 Years
Let's say hypothetically that $10,000 was invested in Fidelity® Equity-Income Fund - Class K on January 31, 2003. The chart shows how the value of your investment would have changed, and also shows how the Russell 3000® Value Index performed over the same period. The initial offering of Class K took place on May 9, 2008. See above for additional information regarding the performance of Class K.

Annual Report
Market Recap: Improvement in the U.S. economy helped lift equity benchmarks to double-digit gains for the year ending January 31, 2013, overcoming moments of volatility driven by sovereign debt woes in Europe, slower economic growth in China and gridlock in Congress. Major U.S. benchmarks hit multiyear highs during the period, encouraged by a rebounding domestic housing market and solid corporate earnings reports. The broad-based S&P 500® Index rose 16.78% for the year, crossing the milestone 1,500 mark near period end. The technology-heavy Nasdaq Composite Index® added 13.13%, and the blue-chip-laden Dow Jones Industrial AverageSM gained 12.75%. Early in the period, stocks rose on positive U.S. economic news and proposed bailouts in Europe. Although fear resurfaced in April and May, equities rebounded in June on central bank stimulus and new life in the housing market. In September, pre-election jitters and the looming "fiscal cliff" of tax hikes and federal spending cuts fueled some profit-taking, followed by a brief post-election sell-off. But stocks proved resilient, as investors continued to pile into riskier assets. Gains were broad-based, with eight of the 10 sectors in the S&P 500® posting double-digit returns. Despite eurozone turmoil, foreign developed-markets stocks rose strongly, with the MSCI® EAFE® Index adding 17.41%.
Comments from James Morrow, Lead Portfolio Manager of Fidelity® Equity-Income Fund: For the year, the fund's Class K shares gained 19.78%, lagging the Russell 3000® Value Index, which rose 20.32%. Weak stock selection in the software/services industry hurt, though overweighting that strong-performing group tempered the decline. Security selection among energy names - especially Royal Dutch Shell and Penn West Petroleum, based in the Netherlands and Canada, respectively - as well as in diversified financials and telecommunication services further detracted. A small average cash stake also hurt in an up market. On the positive side, the fund's materials and utilities underweightings added value. The fund's high yield/convertible securities and global equity subportfolios were additional sources of outperformance. On an individual basis, the fund was hampered by limited exposure to financial firm Bank of America, whose shares sharply increased. Some untimely trades involving telecommunications provider Verizon Communications also detracted from returns. On the positive side, Comcast, a leading cable service provider and media company, continued to generate strong financial results, while in the financials sector, JPMorgan Chase was helpful. Underweightings in two weak-performing energy stocks, Occidental Petroleum and Exxon Mobil also contributed.
The views expressed above reflect those of the portfolio manager(s) only through the end of the period as stated on the cover of this report and do not necessarily represent the views of Fidelity or any other person in the Fidelity organization. Any such views are subject to change at any time based upon market or other conditions and Fidelity disclaims any responsibility to update such views. These views may not be relied on as investment advice and, because investment decisions for a Fidelity fund are based on numerous factors, may not be relied on as an indication of trading intent on behalf of any Fidelity fund.
Annual Report
Shareholder Expense Example
As a shareholder of the Fund, you incur two types of costs: (1) transaction costs, and (2) ongoing costs, including management fees and other Fund expenses. This Example is intended to help you understand your ongoing costs (in dollars) of investing in the Fund and to compare these costs with the ongoing costs of investing in other mutual funds.
The Example is based on an investment of $1,000 invested at the beginning of the period and held for the entire period (August 1, 2012 to January 31, 2013).
Actual Expenses
The first line of the accompanying table for each class of the Fund provides information about actual account values and actual expenses. You may use the information in this line, together with the amount you invested, to estimate the expenses that you paid over the period. Simply divide your account value by $1,000.00 (for example, an $8,600 account value divided by $1,000.00 = 8.6), then multiply the result by the number in the first line for a class of the Fund under the heading entitled "Expenses Paid During Period" to estimate the expenses you paid on your account during this period. A small balance maintenance fee of $12.00 that is charged once a year may apply for certain accounts with a value of less than $2,000. This fee is not included in the table below. If it was, the estimate of expenses you paid during the period would be higher, and your ending account value lower, by this amount. In addition, the Fund, as a shareholder in the underlying Fidelity Central Funds, will indirectly bear its pro-rata share of the fees and expenses incurred by the underlying Fidelity Central Funds. These fees and expenses are not included in the Fund's annualized expense ratio used to calculate the expense estimate in the table below.
Hypothetical Example for Comparison Purposes
The second line of the accompanying table for each class of the Fund provides information about hypothetical account values and hypothetical expenses based on a Class' actual expense ratio and an assumed rate of return of 5% per year before expenses, which is not the Class' actual return. The hypothetical account values and expenses may not be used to estimate the actual ending account balance or expenses you paid for the period. You may use this information to compare the ongoing costs of investing in the Fund and other funds. To do so, compare this 5% hypothetical example with the 5% hypothetical examples that appear in the shareholder reports of the other funds. A small balance maintenance fee of $12.00 that is charged once a year may apply for certain accounts with a value of less than $2,000. This fee is not included in the table below. If it was, the estimate of expenses you paid during the period would be higher, and your ending account value lower, by this amount. In addition, the Fund, as a shareholder in the underlying Fidelity Central Funds, will indirectly bear its pro-rata share of the fees and expenses incurred by the underlying Fidelity Central Funds. These fees and expenses are not included in the Fund's annualized expense ratio used to calculate the expense estimate in the table below.
Please note that the expenses shown in the table are meant to highlight your ongoing costs only and do not reflect any transaction costs. Therefore, the second line of the table is useful in comparing ongoing costs only, and will not help you determine the relative total costs of owning different funds.
Annual Report
| Annualized
Expense Ratio | Beginning
Account Value
August 1, 2012 | Ending
Account Value
January 31, 2013 | Expenses Paid
During Period*
August 1, 2012
to January 31, 2013 |
Equity-Income | .66% | | | |
Actual | | $ 1,000.00 | $ 1,119.00 | $ 3.52 |
HypotheticalA | | $ 1,000.00 | $ 1,021.82 | $ 3.35 |
Class K | .53% | | | |
Actual | | $ 1,000.00 | $ 1,119.60 | $ 2.82 |
HypotheticalA | | $ 1,000.00 | $ 1,022.47 | $ 2.69 |
A 5% return per year before expenses
* Expenses are equal to each Class' annualized expense ratio, multiplied by the average account value over the period, multiplied by 184/366 (to reflect the one-half year period).
Annual Report
Investment Changes (Unaudited)
Top Ten Stocks as of January 31, 2013 |
| % of fund's
net assets | % of fund's net assets
6 months ago |
JPMorgan Chase & Co. | 3.7 | 3.6 |
Chevron Corp. | 2.8 | 3.6 |
Procter & Gamble Co. | 2.8 | 2.6 |
Comcast Corp. Class A | 2.8 | 2.8 |
Wells Fargo & Co. | 2.5 | 3.0 |
Pfizer, Inc. | 2.2 | 2.3 |
Johnson & Johnson | 2.2 | 2.1 |
General Electric Co. | 2.2 | 2.1 |
Royal Dutch Shell PLC Class A | 2.1 | 1.9 |
Paychex, Inc. | 1.9 | 2.0 |
| 25.2 | |
Top Five Market Sectors as of January 31, 2013 |
| % of fund's
net assets | % of fund's net assets
6 months ago |
Financials | 20.3 | 18.5 |
Energy | 13.8 | 14.0 |
Health Care | 13.4 | 12.8 |
Industrials | 10.5 | 9.9 |
Consumer Staples | 10.3 | 11.0 |
Asset Allocation (% of fund's net assets) |
As of January 31, 2013 * | As of July 31, 2012 ** |
| Stocks 92.2% | | | Stocks 91.5% | |
| Bonds 0.2% | | | Bonds 1.0% | |
| Convertible
Securities 5.1% | | | Convertible
Securities 3.7% | |
| Other Investments 0.4% | | | Other Investments 0.2% | |
| Short-Term
Investments and
Net Other Assets
(Liabilities) 2.1% | | | Short-Term
Investments and
Net Other Assets
(Liabilities) 3.6% | |
* Foreign investments | 14.1% | | ** Foreign investments | 14.6% | |

Annual Report
Investments January 31, 2013
Showing Percentage of Net Assets
Common Stocks - 91.7% |
| Shares | | Value (000s) |
CONSUMER DISCRETIONARY - 8.6% |
Auto Components - 0.2% |
Gentex Corp. | 740,772 | | $ 14,171 |
Diversified Consumer Services - 0.1% |
Strayer Education, Inc. (e) | 214,950 | | 12,231 |
Hotels, Restaurants & Leisure - 1.3% |
CEC Entertainment, Inc. | 287,300 | | 9,469 |
Cedar Fair LP (depositary unit) | 193,119 | | 7,246 |
McDonald's Corp. | 695,436 | | 66,268 |
Texas Roadhouse, Inc. Class A | 794,752 | | 13,980 |
The Restaurant Group PLC | 269,853 | | 1,612 |
Yum! Brands, Inc. | 178,417 | | 11,586 |
| | 110,161 |
Household Durables - 0.0% |
Coway Co. Ltd. | 48,500 | | 2,108 |
Media - 4.5% |
Comcast Corp. Class A | 6,393,479 | | 243,464 |
Informa PLC | 356,524 | | 2,708 |
Ipsos SA | 61,477 | | 2,450 |
McGraw-Hill Companies, Inc. | 24,800 | | 1,426 |
PT Media Nusantara Citra Tbk | 6,784,000 | | 1,661 |
Time Warner, Inc. | 2,772,153 | | 140,049 |
| | 391,758 |
Multiline Retail - 1.5% |
Kohl's Corp. | 380,238 | | 17,601 |
Target Corp. | 1,920,549 | | 116,020 |
| | 133,621 |
Specialty Retail - 0.9% |
Dunelm Group PLC | 135,200 | | 1,630 |
Limited Brands, Inc. | 40,300 | | 1,935 |
Lowe's Companies, Inc. | 1,321,192 | | 50,456 |
Staples, Inc. | 1,209,804 | | 16,308 |
USS Co. Ltd. | 12,160 | | 1,364 |
WH Smith PLC | 336,292 | | 3,552 |
Workman Co. Ltd. | 1,700 | | 48 |
| | 75,293 |
Common Stocks - continued |
| Shares | | Value (000s) |
CONSUMER DISCRETIONARY - continued |
Textiles, Apparel & Luxury Goods - 0.1% |
Hugo Boss AG | 23,400 | | $ 2,754 |
VF Corp. | 23,500 | | 3,468 |
| | 6,222 |
TOTAL CONSUMER DISCRETIONARY | | 745,565 |
CONSUMER STAPLES - 10.3% |
Beverages - 2.1% |
Anheuser-Busch InBev SA NV | 243,122 | | 21,392 |
Companhia de Bebidas das Americas (AmBev) (PN) sponsored ADR | 41,883 | | 1,971 |
Dr. Pepper Snapple Group, Inc. | 79,431 | | 3,580 |
Molson Coors Brewing Co. Class B | 438,595 | | 19,816 |
PepsiCo, Inc. | 1,178,887 | | 85,882 |
The Coca-Cola Co. | 1,352,146 | | 50,354 |
| | 182,995 |
Food & Staples Retailing - 2.4% |
Clicks Group Ltd. | 386,354 | | 2,592 |
Rami Levi Chain Stores Hashikma Marketing 2006 Ltd. | 64,504 | | 2,351 |
Safeway, Inc. | 3,398,019 | | 65,412 |
Sysco Corp. | 658,975 | | 20,936 |
Wal-Mart Stores, Inc. | 551,791 | | 38,598 |
Walgreen Co. | 2,050,381 | | 81,933 |
| | 211,822 |
Food Products - 0.9% |
Astral Foods Ltd. | 143,654 | | 1,417 |
Hilton Food Group PLC | 500,312 | | 2,504 |
Kellogg Co. | 1,237,491 | | 72,393 |
Nestle Foods Nigeria PLC | 194,336 | | 1,039 |
| | 77,353 |
Household Products - 3.2% |
Kimberly-Clark Corp. | 282,004 | | 25,242 |
Procter & Gamble Co. | 3,262,729 | | 245,227 |
Reckitt Benckiser Group PLC | 83,111 | | 5,539 |
| | 276,008 |
Tobacco - 1.7% |
Altria Group, Inc. | 1,745,139 | | 58,776 |
British American Tobacco PLC: | | | |
(United Kingdom) | 124,400 | | 6,465 |
Common Stocks - continued |
| Shares | | Value (000s) |
CONSUMER STAPLES - continued |
Tobacco - continued |
British American Tobacco PLC: - continued | | | |
sponsored ADR | 195,572 | | $ 20,320 |
Japan Tobacco, Inc. | 102,900 | | 3,204 |
KT&G Corp. | 29,980 | | 2,091 |
Lorillard, Inc. | 594,621 | | 23,232 |
Philip Morris International, Inc. | 268,078 | | 23,634 |
Swedish Match Co. AB | 148,600 | | 5,577 |
| | 143,299 |
TOTAL CONSUMER STAPLES | | 891,477 |
ENERGY - 12.9% |
Energy Equipment & Services - 1.4% |
Ensco PLC Class A | 259,871 | | 16,520 |
Exterran Partners LP | 436,706 | | 10,254 |
Halliburton Co. | 883,070 | | 35,923 |
National Oilwell Varco, Inc. | 222,639 | | 16,506 |
Noble Corp. | 825,302 | | 33,425 |
Trinidad Drilling Ltd. | 1,688,100 | | 12,186 |
| | 124,814 |
Oil, Gas & Consumable Fuels - 11.5% |
Apache Corp. | 600,103 | | 50,265 |
BG Group PLC | 232,000 | | 4,121 |
BP PLC | 484,875 | | 3,589 |
BP PLC sponsored ADR | 1,501,565 | | 66,850 |
Buckeye Partners LP | 200,230 | | 10,540 |
Canadian Natural Resources Ltd. | 1,135,200 | | 34,281 |
Chevron Corp. | 2,142,872 | | 246,752 |
ENI SpA | 189,600 | | 4,736 |
EV Energy Partners LP | 480,797 | | 28,271 |
Exxon Mobil Corp. | 1,782,584 | | 160,379 |
Holly Energy Partners LP | 232,744 | | 8,367 |
HollyFrontier Corp. | 429,241 | | 22,415 |
Inergy Midstream LP | 12,619 | | 299 |
Legacy Reserves LP | 415,700 | | 10,455 |
Markwest Energy Partners LP | 456,859 | | 25,228 |
Occidental Petroleum Corp. | 201,700 | | 17,804 |
Penn West Petroleum Ltd. (e) | 1,453,945 | | 14,709 |
Pioneer Southwest Energy Partners LP | 346,953 | | 8,806 |
Common Stocks - continued |
| Shares | | Value (000s) |
ENERGY - continued |
Oil, Gas & Consumable Fuels - continued |
Royal Dutch Shell PLC: | | | |
Class A (United Kingdom) | 176,664 | | $ 6,263 |
Class A sponsored ADR | 2,469,100 | | 174,121 |
Southcross Energy Partners LP | 197,500 | | 4,645 |
Suncor Energy, Inc. | 906,600 | | 30,814 |
Tesoro Logistics LP | 21,200 | | 933 |
The Williams Companies, Inc. | 1,510,025 | | 52,926 |
Western Gas Equity Partners LP | 136,620 | | 4,612 |
Western Gas Partners LP | 35,800 | | 1,882 |
| | 994,063 |
TOTAL ENERGY | | 1,118,877 |
FINANCIALS - 19.4% |
Capital Markets - 3.3% |
Apollo Investment Corp. | 1,720,753 | | 15,487 |
Ashmore Group PLC | 3,343,732 | | 18,938 |
AURELIUS AG | 22,434 | | 1,413 |
BlackRock, Inc. Class A | 157,900 | | 37,309 |
Charles Schwab Corp. | 2,721,166 | | 44,981 |
ICAP PLC | 485,000 | | 2,509 |
KKR & Co. LP | 3,275,200 | | 55,285 |
Manning & Napier, Inc. (i) | 679,190 | | 9,577 |
Morgan Stanley | 1,721,471 | | 39,336 |
The Blackstone Group LP | 3,146,635 | | 58,213 |
UBS AG | 153,154 | | 2,660 |
| | 285,708 |
Commercial Banks - 5.0% |
Aozora Bank Ltd. | 355,000 | | 998 |
Banco Santander Chile | 12,730,039 | | 971 |
Barclays PLC | 602,782 | | 2,894 |
Comerica, Inc. | 470,000 | | 16,149 |
Cullen/Frost Bankers, Inc. | 362,697 | | 21,359 |
DGB Financial Group Co. Ltd. | 94,370 | | 1,266 |
Guaranty Trust Bank PLC | 7,800,000 | | 1,220 |
HSBC Holdings PLC (United Kingdom) | 1 | | 0 |
Itau Unibanco Holding SA sponsored ADR | 160,000 | | 2,757 |
M&T Bank Corp. | 307,800 | | 31,608 |
National Penn Bancshares, Inc. | 188,300 | | 1,836 |
Seven Bank Ltd. | 605,700 | | 1,464 |
Common Stocks - continued |
| Shares | | Value (000s) |
FINANCIALS - continued |
Commercial Banks - continued |
Standard Chartered PLC (United Kingdom) | 1,108,181 | | $ 29,483 |
SunTrust Banks, Inc. | 866,119 | | 24,572 |
Svenska Handelsbanken AB (A Shares) | 128,000 | | 5,234 |
U.S. Bancorp | 2,201,202 | | 72,860 |
Wells Fargo & Co. | 6,267,150 | | 218,285 |
| | 432,956 |
Diversified Financial Services - 4.7% |
Bank of America Corp. | 1,587,800 | | 17,974 |
Citigroup, Inc. | 255,000 | | 10,751 |
Inversiones La Construccion SA | 46,228 | | 907 |
JPMorgan Chase & Co. | 6,837,302 | | 321,694 |
KKR Financial Holdings LLC | 4,735,345 | | 52,041 |
London Stock Exchange Group PLC | 112,900 | | 2,156 |
| | 405,523 |
Insurance - 4.5% |
ACE Ltd. | 771,959 | | 65,871 |
AFLAC, Inc. | 569,000 | | 30,191 |
Assured Guaranty Ltd. | 942,580 | | 17,089 |
Berkshire Hathaway, Inc. Class B (a) | 217,644 | | 21,096 |
Euler Hermes SA | 26,423 | | 2,359 |
Fairfax Financial Holdings Ltd. (sub. vtg.) | 4,500 | | 1,615 |
FBD Holdings PLC | 126,280 | | 1,869 |
Hanover Insurance Group, Inc. | 402,598 | | 16,732 |
MetLife, Inc. | 3,921,469 | | 146,428 |
MetLife, Inc. unit | 477,100 | | 23,225 |
Prudential Financial, Inc. | 396,300 | | 22,938 |
Resolution Ltd. | 446,800 | | 1,860 |
Validus Holdings Ltd. | 1,011,791 | | 36,839 |
| | 388,112 |
Real Estate Investment Trusts - 1.8% |
American Capital Agency Corp. | 892,402 | | 28,227 |
American Tower Corp. | 39,300 | | 2,993 |
Annaly Capital Management, Inc. | 1,260,900 | | 18,750 |
Coresite Realty Corp. | 77,703 | | 2,292 |
DCT Industrial Trust, Inc. | 665,600 | | 4,699 |
First Potomac Realty Trust | 60,219 | | 825 |
Home Properties, Inc. | 195,500 | | 12,017 |
Japan Retail Fund Investment Corp. | 1,308 | | 2,477 |
Lexington Corporate Properties Trust | 458,400 | | 5,042 |
LTC Properties, Inc. | 223,381 | | 8,319 |
Common Stocks - continued |
| Shares | | Value (000s) |
FINANCIALS - continued |
Real Estate Investment Trusts - continued |
Rayonier, Inc. | 568,261 | | $ 30,595 |
Retail Properties America, Inc. | 1,591,950 | | 20,600 |
Two Harbors Investment Corp. | 699,778 | | 8,691 |
Ventas, Inc. | 152,903 | | 10,136 |
| | 155,663 |
Real Estate Management & Development - 0.1% |
Beazer Pre-Owned Rental Homes, Inc. (j) | 393,400 | | 7,868 |
Daito Trust Construction Co. Ltd. | 26,100 | | 2,574 |
Relo Holdings Corp. | 47,200 | | 1,739 |
| | 12,181 |
TOTAL FINANCIALS | | 1,680,143 |
HEALTH CARE - 12.7% |
Biotechnology - 0.4% |
Amgen, Inc. | 208,325 | | 17,803 |
Grifols SA ADR | 113,945 | | 3,032 |
PDL BioPharma, Inc. (e) | 2,196,326 | | 15,111 |
| | 35,946 |
Health Care Equipment & Supplies - 0.8% |
Abbott Laboratories | 404,244 | | 13,696 |
Baxter International, Inc. | 147,000 | | 9,972 |
Covidien PLC | 447,200 | | 27,878 |
St. Jude Medical, Inc. | 389,238 | | 15,842 |
| | 67,388 |
Health Care Providers & Services - 1.9% |
Aetna, Inc. | 723,600 | | 34,899 |
Cardinal Health, Inc. | 452,000 | | 19,802 |
McKesson Corp. | 126,840 | | 13,347 |
Psychemedics Corp. | 113,100 | | 1,349 |
UnitedHealth Group, Inc. | 384,100 | | 21,206 |
WellPoint, Inc. | 1,138,672 | | 73,809 |
| | 164,412 |
Health Care Technology - 0.1% |
Quality Systems, Inc. | 411,108 | | 7,499 |
Pharmaceuticals - 9.5% |
AbbVie, Inc. | 1,366,644 | | 50,142 |
AstraZeneca PLC sponsored ADR | 991,800 | | 47,785 |
Eli Lilly & Co. | 1,048,541 | | 56,296 |
Common Stocks - continued |
| Shares | | Value (000s) |
HEALTH CARE - continued |
Pharmaceuticals - continued |
GlaxoSmithKline PLC | 258,500 | | $ 5,913 |
Johnson & Johnson | 2,536,879 | | 187,526 |
Merck & Co., Inc. | 3,728,846 | | 161,273 |
Pfizer, Inc. | 7,176,901 | | 195,786 |
Roche Holding AG (participation certificate) | 25,549 | | 5,654 |
Sanofi SA | 531,928 | | 51,856 |
Teva Pharmaceutical Industries Ltd. sponsored ADR | 901,180 | | 34,236 |
Warner Chilcott PLC | 1,759,600 | | 24,934 |
Zoetis, Inc. Class A | 71,500 | | 1,859 |
| | 823,260 |
TOTAL HEALTH CARE | | 1,098,505 |
INDUSTRIALS - 9.8% |
Aerospace & Defense - 1.7% |
Raytheon Co. | 893,346 | | 47,061 |
Rockwell Collins, Inc. | 274,380 | | 16,155 |
United Technologies Corp. | 944,615 | | 82,720 |
| | 145,936 |
Air Freight & Logistics - 1.7% |
C.H. Robinson Worldwide, Inc. | 698,700 | | 46,219 |
United Parcel Service, Inc. Class B | 1,309,965 | | 103,867 |
| | 150,086 |
Airlines - 0.0% |
Copa Holdings SA Class A | 40,900 | | 4,483 |
Commercial Services & Supplies - 1.4% |
Intrum Justitia AB | 1,238,600 | | 20,066 |
Multiplus SA | 38,300 | | 823 |
Pitney Bowes, Inc. (e) | 848,200 | | 12,223 |
Republic Services, Inc. | 2,642,874 | | 84,281 |
| | 117,393 |
Electrical Equipment - 0.4% |
Eaton Corp. PLC | 192,500 | | 10,963 |
Emerson Electric Co. | 224,128 | | 12,831 |
Hubbell, Inc. Class B | 105,928 | | 9,645 |
| | 33,439 |
Common Stocks - continued |
| Shares | | Value (000s) |
INDUSTRIALS - continued |
Industrial Conglomerates - 2.2% |
General Electric Co. | 8,398,810 | | $ 187,125 |
Koninklijke Philips Electronics NV | 144,257 | | 4,493 |
| | 191,618 |
Machinery - 1.5% |
Briggs & Stratton Corp. | 1,283,085 | | 30,448 |
Cummins, Inc. | 173,090 | | 19,876 |
Douglas Dynamics, Inc. | 848,483 | | 11,183 |
Harsco Corp. | 376,207 | | 9,590 |
Illinois Tool Works, Inc. | 295,513 | | 18,567 |
Muehlbauer Holding AG & Co. | 43,045 | | 1,383 |
Stanley Black & Decker, Inc. | 545,797 | | 41,934 |
| | 132,981 |
Marine - 0.0% |
Irish Continental Group PLC unit | 62,900 | | 1,693 |
Professional Services - 0.3% |
Michael Page International PLC | 3,902,783 | | 25,205 |
Road & Rail - 0.3% |
Union Pacific Corp. | 166,700 | | 21,914 |
Trading Companies & Distributors - 0.3% |
Watsco, Inc. | 265,885 | | 20,034 |
Wolseley PLC | 40,336 | | 1,884 |
| | 21,918 |
TOTAL INDUSTRIALS | | 846,666 |
INFORMATION TECHNOLOGY - 8.6% |
Communications Equipment - 1.5% |
Cisco Systems, Inc. | 6,533,326 | | 134,391 |
Computers & Peripherals - 0.6% |
Apple, Inc. | 51,910 | | 23,635 |
Dell, Inc. | 1,627,573 | | 21,549 |
Lexmark International, Inc. Class A (e) | 248,038 | | 5,968 |
| | 51,152 |
IT Services - 4.6% |
Accenture PLC Class A | 818,133 | | 58,816 |
Cognizant Technology Solutions Corp. Class A (a) | 694,618 | | 54,305 |
Fidelity National Information Services, Inc. | 143,032 | | 5,308 |
IBM Corp. | 526,892 | | 106,996 |
Common Stocks - continued |
| Shares | | Value (000s) |
INFORMATION TECHNOLOGY - continued |
IT Services - continued |
Paychex, Inc. | 5,081,946 | | $ 165,824 |
The Western Union Co. | 577,400 | | 8,216 |
| | 399,465 |
Semiconductors & Semiconductor Equipment - 1.0% |
Analog Devices, Inc. | 74,600 | | 3,256 |
Applied Materials, Inc. | 3,392,600 | | 43,798 |
Chipbond Technology Corp. | 558,000 | | 1,149 |
KLA-Tencor Corp. | 322,535 | | 17,710 |
Siliconware Precision Industries Co. Ltd. sponsored ADR | 3,574,448 | | 18,337 |
Taiwan Semiconductor Manufacturing Co. Ltd. | 1,078,000 | | 3,694 |
| | 87,944 |
Software - 0.9% |
CA Technologies, Inc. | 568,600 | | 14,113 |
Microsoft Corp. | 2,182,703 | | 59,959 |
| | 74,072 |
TOTAL INFORMATION TECHNOLOGY | | 747,024 |
MATERIALS - 0.8% |
Chemicals - 0.4% |
Akzo Nobel NV | 37,140 | | 2,541 |
Arkema SA | 22,400 | | 2,555 |
Clariant AG (Reg.) | 129,712 | | 1,777 |
Eastman Chemical Co. | 286,800 | | 20,406 |
Israel Chemicals Ltd. | 172,200 | | 2,281 |
LyondellBasell Industries NV Class A | 62,100 | | 3,938 |
Monsanto Co. | 21,954 | | 2,225 |
| | 35,723 |
Metals & Mining - 0.4% |
ArcelorMittal SA Class A unit (e) | 364,700 | | 6,258 |
Commercial Metals Co. | 1,099,817 | | 18,312 |
Nucor Corp. | 276,200 | | 12,708 |
| | 37,278 |
TOTAL MATERIALS | | 73,001 |
Common Stocks - continued |
| Shares | | Value (000s) |
TELECOMMUNICATION SERVICES - 4.0% |
Diversified Telecommunication Services - 3.1% |
AT&T, Inc. | 2,598,909 | | $ 90,416 |
CenturyLink, Inc. | 476,571 | | 19,277 |
HKT Trust / HKT Ltd. unit | 3,960,000 | | 3,692 |
LG Telecom Ltd. | 240,610 | | 1,800 |
Nippon Telegraph & Telephone Corp. | 41,000 | | 1,717 |
Telenor ASA | 176,200 | | 3,887 |
Telstra Corp. Ltd. | 422,275 | | 2,026 |
Verizon Communications, Inc. | 3,345,692 | | 145,906 |
| | 268,721 |
Wireless Telecommunication Services - 0.9% |
Empresa Nacional de Telecomunicaciones SA (ENTEL) | 41,142 | | 895 |
Far EasTone Telecommunications Co. Ltd. | 579,000 | | 1,472 |
Mobile TeleSystems OJSC (a) | 132,700 | | 1,134 |
Vodafone Group PLC | 27,939,799 | | 76,252 |
| | 79,753 |
TOTAL TELECOMMUNICATION SERVICES | | 348,474 |
UTILITIES - 4.6% |
Electric Utilities - 3.2% |
Duke Energy Corp. | 516,079 | | 35,475 |
Edison International | 193,700 | | 9,334 |
FirstEnergy Corp. | 950,730 | | 38,495 |
ITC Holdings Corp. | 28,693 | | 2,324 |
NextEra Energy, Inc. | 662,028 | | 47,699 |
Northeast Utilities | 504,835 | | 20,562 |
PPL Corp. | 2,798,390 | | 84,763 |
Southern Co. | 769,025 | | 34,014 |
SP AusNet unit | 1,397,908 | | 1,676 |
Spark Infrastructure Group unit | 996,438 | | 1,824 |
| | 276,166 |
Gas Utilities - 0.0% |
YESCO Co. Ltd. | 39,470 | | 1,085 |
Multi-Utilities - 1.4% |
CMS Energy Corp. | 174,400 | | 4,482 |
GDF Suez | 476,400 | | 9,774 |
National Grid PLC | 2,569,541 | | 28,136 |
Common Stocks - continued |
| Shares | | Value (000s) |
UTILITIES - continued |
Multi-Utilities - continued |
PG&E Corp. | 689,910 | | $ 29,418 |
Sempra Energy | 698,053 | | 52,389 |
| | 124,199 |
Water Utilities - 0.0% |
Aguas Andinas SA | 1,089,814 | | 807 |
Companhia de Saneamento Basico do Estado de Sao Paulo (SABESP) sponsored ADR | 32,600 | | 1,451 |
| | 2,258 |
TOTAL UTILITIES | | 403,708 |
TOTAL COMMON STOCKS (Cost $6,773,445) |
7,953,440
|
Preferred Stocks - 2.1% |
| | | |
Convertible Preferred Stocks - 1.6% |
CONSUMER DISCRETIONARY - 0.3% |
Automobiles - 0.2% |
General Motors Co. 4.75% | 398,816 | | 17,277 |
Media - 0.1% |
Interpublic Group of Companies, Inc. 5.25% | 7,300 | | 8,231 |
TOTAL CONSUMER DISCRETIONARY | | 25,508 |
FINANCIALS - 0.3% |
Commercial Banks - 0.2% |
Huntington Bancshares, Inc. 8.50% | 14,900 | | 18,923 |
Real Estate Investment Trusts - 0.1% |
Health Care REIT, Inc. Series I, 6.50% | 162,100 | | 9,498 |
TOTAL FINANCIALS | | 28,421 |
HEALTH CARE - 0.2% |
Health Care Equipment & Supplies - 0.1% |
Alere, Inc. 3.00% | 41,700 | | 8,493 |
Preferred Stocks - continued |
| Shares | | Value (000s) |
Convertible Preferred Stocks - continued |
HEALTH CARE - continued |
Health Care Providers & Services - 0.1% |
HealthSouth Corp. Series A 6.50% | 12,600 | | $ 14,018 |
TOTAL HEALTH CARE | | 22,511 |
INDUSTRIALS - 0.3% |
Aerospace & Defense - 0.2% |
United Technologies Corp. 7.50% | 341,300 | | 19,434 |
Professional Services - 0.1% |
Nielsen Holdings B.V. 6.25% | 149,500 | | 8,705 |
TOTAL INDUSTRIALS | | 28,139 |
MATERIALS - 0.1% |
Metals & Mining - 0.1% |
ArcelorMittal SA 6.00% (a) | 300,500 | | 7,774 |
UTILITIES - 0.4% |
Electric Utilities - 0.4% |
NextEra Energy, Inc.: | | | |
5.889% | 203,449 | | 10,461 |
Series E, 5.599% | 221,000 | | 11,526 |
PPL Corp. 8.75% | 168,700 | | 9,243 |
| | 31,230 |
TOTAL CONVERTIBLE PREFERRED STOCKS | | 143,583 |
Nonconvertible Preferred Stocks - 0.5% |
CONSUMER DISCRETIONARY - 0.1% |
Automobiles - 0.1% |
Volkswagen AG | 43,309 | | 10,711 |
FINANCIALS - 0.4% |
Consumer Finance - 0.4% |
Ally Financial, Inc. 7.00% (f) | 28,901 | | 28,034 |
Preferred Stocks - continued |
| Shares | | Value (000s) |
Nonconvertible Preferred Stocks - continued |
FINANCIALS - continued |
Diversified Financial Services - 0.0% |
GMAC Capital Trust I Series 2, 8.125% | 43,349 | | $ 1,156 |
TOTAL FINANCIALS | | 29,190 |
TOTAL NONCONVERTIBLE PREFERRED STOCKS | | 39,901 |
TOTAL PREFERRED STOCKS (Cost $167,273) |
183,484
|
Corporate Bonds - 3.7% |
| Principal Amount (000s) | | |
Convertible Bonds - 3.5% |
CONSUMER DISCRETIONARY - 0.2% |
Automobiles - 0.2% |
Volkswagen International Finance NV 5.5% 11/9/15 (f) | EUR | 9,200 | | 14,422 |
Hotels, Restaurants & Leisure - 0.0% |
MGM Mirage, Inc. 4.25% 4/15/15 | | $ 4,330 | | 4,706 |
TOTAL CONSUMER DISCRETIONARY | | 19,128 |
ENERGY - 0.5% |
Oil, Gas & Consumable Fuels - 0.5% |
Amyris, Inc. 3% 2/27/17 | | 2,101 | | 1,459 |
Chesapeake Energy Corp. 2.5% 5/15/37 | | 10,430 | | 10,073 |
Massey Energy Co. 3.25% 8/1/15 | | 12,090 | | 11,606 |
Peabody Energy Corp. 4.75% 12/15/66 | | 8,776 | | 8,365 |
Ship Finance International Ltd. 3.25% 2/1/18 | | 4,710 | | 4,747 |
Western Refining, Inc. 5.75% 6/15/14 | | 1,780 | | 6,188 |
| | 42,438 |
FINANCIALS - 0.1% |
Thrifts & Mortgage Finance - 0.1% |
MGIC Investment Corp. 9% 4/1/63 (d)(f) | | 17,382 | | 7,453 |
HEALTH CARE - 0.5% |
Health Care Equipment & Supplies - 0.1% |
Teleflex, Inc. 3.875% 8/1/17 | | 6,640 | | 8,791 |
Corporate Bonds - continued |
| Principal Amount (000s) | | Value (000s) |
Convertible Bonds - continued |
HEALTH CARE - continued |
Health Care Providers & Services - 0.4% |
WellPoint, Inc. 2.75% 10/15/42 (f) | | $ 28,610 | | $ 31,438 |
TOTAL HEALTH CARE | | 40,229 |
INDUSTRIALS - 0.4% |
Commercial Services & Supplies - 0.2% |
Covanta Holding Corp. 3.25% 6/1/14 | | 16,680 | | 21,289 |
Construction & Engineering - 0.2% |
MasTec, Inc.: | | | | |
4% 6/15/14 | | 5,860 | | 10,698 |
4.25% 12/15/14 | | 2,180 | | 4,097 |
| | 14,795 |
TOTAL INDUSTRIALS | | 36,084 |
INFORMATION TECHNOLOGY - 1.5% |
Communications Equipment - 0.1% |
InterDigital, Inc. 2.5% 3/15/16 | | 11,920 | | 12,963 |
Computers & Peripherals - 0.3% |
EMC Corp. 1.75% 12/1/13 | | 4,760 | | 7,364 |
SanDisk Corp. 1.5% 8/15/17 | | 12,890 | | 16,024 |
| | 23,388 |
Internet Software & Services - 0.1% |
VeriSign, Inc. 3.25% 8/15/37 | | 6,990 | | 9,707 |
IT Services - 0.1% |
CACI International, Inc. 2.125% 5/1/14 | | 4,900 | | 5,384 |
Semiconductors & Semiconductor Equipment - 0.6% |
GT Advanced Technologies, Inc. 3% 10/1/17 | | 15,060 | | 11,427 |
Intel Corp. 3.25% 8/1/39 | | 11,240 | | 13,432 |
Microchip Technology, Inc. 2.125% 12/15/37 | | 4,500 | | 5,828 |
Micron Technology, Inc. 3.125% 5/1/32 (f) | | 12,070 | | 13,119 |
Novellus Systems, Inc. 2.625% 5/15/41 | | 3,780 | | 5,268 |
| | 49,074 |
Software - 0.3% |
Nuance Communications, Inc. 2.75% 11/1/31 | | 26,800 | | 29,899 |
TOTAL INFORMATION TECHNOLOGY | | 130,415 |
Corporate Bonds - continued |
| Principal Amount (000s) | | Value (000s) |
Convertible Bonds - continued |
MATERIALS - 0.1% |
Metals & Mining - 0.1% |
Goldcorp, Inc. 2% 8/1/14 | | $ 4,090 | | $ 4,402 |
Newmont Mining Corp. 1.25% 7/15/14 | | 6,510 | | 7,283 |
| | 11,685 |
TELECOMMUNICATION SERVICES - 0.2% |
Wireless Telecommunication Services - 0.2% |
Clearwire Communications LLC/Clearwire Finance, Inc. 8.25% 12/1/40 (f) | | 12,670 | | 13,747 |
TOTAL CONVERTIBLE BONDS | | 301,179 |
Nonconvertible Bonds - 0.2% |
FINANCIALS - 0.1% |
Consumer Finance - 0.0% |
GMAC LLC 8% 11/1/31 | | 2,370 | | 2,992 |
Diversified Financial Services - 0.1% |
Goldman Sachs Capital II 4% (g)(h) | | 11,520 | | 9,389 |
TOTAL FINANCIALS | | 12,381 |
MATERIALS - 0.1% |
Paper & Forest Products - 0.1% |
AbitibiBowater, Inc. 10.25% 10/15/18 | | 4,229 | | 4,874 |
TELECOMMUNICATION SERVICES - 0.0% |
Wireless Telecommunication Services - 0.0% |
Clearwire Communications LLC/Clearwire Finance, Inc. 12% 12/1/15 (f) | | 1,895 | | 2,054 |
TOTAL NONCONVERTIBLE BONDS | | 19,309 |
TOTAL CORPORATE BONDS (Cost $307,804) |
320,488
|
Floating Rate Loans - 0.0% |
| Principal Amount (000s) | | Value (000s) |
FINANCIALS - 0.0% |
Insurance - 0.0% |
Asurion Corp. Tranche 2LN, term loan 9% 5/24/19 (h) | | $ 3,906 | | $ 4,013 |
TOTAL FLOATING RATE LOANS (Cost $3,898) |
4,013
|
Other - 0.4% |
ENERGY - 0.4% |
Oil, Gas & Consumable Fuels - 0.4% |
EQTY ER Holdings, LLC 12% 1/28/18 (i)(j)(k) | | 22,667 | | 22,667 |
| | Shares | | |
EQTY ER Holdings, LLC (i)(j)(k) | | 11,333,334 | | 11,333 |
TOTAL OTHER (Cost $34,000) |
34,000
|
Money Market Funds - 2.2% |
| | | |
Fidelity Cash Central Fund, 0.16% (b) | 150,406,839 | | 150,407 |
Fidelity Securities Lending Cash Central Fund, 0.15% (b)(c) | 37,338,250 | | 37,338 |
TOTAL MONEY MARKET FUNDS (Cost $187,745) |
187,745
|
TOTAL INVESTMENT PORTFOLIO - 100.1% (Cost $7,474,165) | | 8,683,170 |
NET OTHER ASSETS (LIABILITIES) - (0.1)% | | (5,745) |
NET ASSETS - 100% | $ 8,677,425 |
Currency Abbreviations |
EUR | - | European Monetary Unit |
Legend |
(a) Non-income producing |
(b) Affiliated fund that is available only to investment companies and other accounts managed by Fidelity Investments. The rate quoted is the annualized seven-day yield of the fund at period end. A complete unaudited listing of the fund's holdings as of its most recent quarter end is available upon request. In addition, each Fidelity Central Fund's financial statements, which are not covered by the Fund's Report of Independent Registered Public Accounting Firm, are available on the SEC's website or upon request. |
(c) Investment made with cash collateral received from securities on loan. |
(d) Non-income producing - Security is in default. |
(e) Security or a portion of the security is on loan at period end. |
(f) Security exempt from registration under Rule 144A of the Securities Act of 1933. These securities may be resold in transactions exempt from registration, normally to qualified institutional buyers. At the end of the period, the value of these securities amounted to $110,267,000 or 1.3% of net assets. |
(g) Security is perpetual in nature with no stated maturity date. |
(h) Coupon rates for floating and adjustable rate securities reflect the rates in effect at period end. |
(i) Affiliated company |
(j) Restricted securities - Investment in securities not registered under the Securities Act of 1933 (excluding 144A issues). At the end of the period, the value of restricted securities (excluding 144A issues) amounted to $41,868,000 or 0.5% of net assets. |
Additional information on each restricted holding is as follows: |
Security | Acquisition Date | Acquisition Cost (000s) |
Beazer Pre-Owned Rental Homes, Inc. | 5/3/12 - 10/23/12 | $ 7,868 |
EQTY ER Holdings, LLC 12% 1/28/18 | 1/29/13 | $ 22,667 |
EQTY ER Holdings, LLC | 1/29/13 | $ 11,333 |
(k) Investments represent a non-operating interest in oil and gas wells through an entity owned by the fund that is treated as a corporation for U.S. tax purposes. |
Affiliated Central Funds |
Information regarding fiscal year to date income earned by the Fund from investments in Fidelity Central Funds is as follows: |
Fund | Income earned
(Amounts in thousands) |
Fidelity Cash Central Fund | $ 344 |
Fidelity Securities Lending Cash Central Fund | 1,955 |
Total | $ 2,299 |
Other Affiliated Issuers |
An affiliated company is a company in which the Fund has ownership of at least 5% of the voting securities. Fiscal year to date transactions with companies which are or were affiliates are as follows: |
Affiliate
(Amounts in thousands) | Value,
beginning of
period | Purchases | Sales
Proceeds | Dividend
Income | Value,
end of
period |
EQTY ER Holdings, LLC 12% 1/28/18 | $ - | $ 22,667 | $ - | $ - | $ 22,667 |
EQTY ER Holdings, LLC | - | 11,333 | - | - | 11,333 |
Manning & Napier, Inc. | 6,642 | 2,456 | - | 435 | 9,577 |
Total | $ 6,642 | $ 36,456 | $ - | $ 435 | $ 43,577 |
Other Information |
The following is a summary of the inputs used, as of January 31, 2013, involving the Fund's assets and liabilities carried at fair value. The inputs or methodology used for valuing securities may not be an indication of the risk associated with investing in those securities. For more information on valuation inputs, and their aggregation into the levels used in the table below, please refer to the Investment Valuation section in the accompanying Notes to Financial Statements. |
Valuation Inputs at Reporting Date: |
Description
(Amounts in thousands) | Total | Level 1 | Level 2 | Level 3 |
Investments in Securities: | | | | |
Equities: | | | | |
Consumer Discretionary | $ 781,784 | $ 773,553 | $ 8,231 | $ - |
Consumer Staples | 891,477 | 863,620 | 27,857 | - |
Energy | 1,118,877 | 1,104,289 | 14,588 | - |
Financials | 1,737,754 | 1,663,575 | 66,311 | 7,868 |
Health Care | 1,121,016 | 1,049,229 | 71,787 | - |
Industrials | 874,805 | 861,607 | 13,198 | - |
Information Technology | 747,024 | 743,330 | 3,694 | - |
Materials | 80,775 | 73,001 | 7,774 | - |
Telecommunication Services | 348,474 | 270,505 | 77,969 | - |
Utilities | 434,938 | 375,572 | 59,366 | - |
Corporate Bonds | 320,488 | - | 320,488 | - |
Floating Rate Loans | 4,013 | - | 4,013 | - |
Other/Energy | 34,000 | - | - | 34,000 |
Money Market Funds | 187,745 | 187,745 | - | - |
Total Investments in Securities: | $ 8,683,170 | $ 7,966,026 | $ 675,276 | $ 41,868 |
Distribution of investments by country or territory of incorporation, as a percentage of total net assets, is as follows. (Unaudited) |
United States of America | 85.9% |
United Kingdom | 6.4% |
Ireland | 1.4% |
Switzerland | 1.3% |
Canada | 1.1% |
Others (Individually Less Than 1%) | 3.9% |
| 100.0% |
See accompanying notes which are an integral part of the financial statements.
Annual Report
Statement of Assets and Liabilities
Amounts in thousands (except per-share amounts) | January 31, 2013 |
| | |
Assets | | |
Investment in securities, at value (including securities loaned of $38,085) - See accompanying schedule: Unaffiliated issuers (cost $7,243,843) | $ 8,451,848 | |
Fidelity Central Funds (cost $187,745) | 187,745 | |
Other affiliated issuers (cost $42,577) | 43,577 | |
Total Investments (cost $7,474,165) | | $ 8,683,170 |
Cash | | 52 |
Foreign currency held at value (cost $99) | | 99 |
Receivable for investments sold | | 58,904 |
Receivable for fund shares sold | | 3,872 |
Dividends receivable | | 14,307 |
Interest receivable | | 2,590 |
Distributions receivable from Fidelity Central Funds | | 59 |
Prepaid expenses | | 15 |
Other receivables | | 1,216 |
Total assets | | 8,764,284 |
| | |
Liabilities | | |
Payable for investments purchased | $ 27,490 | |
Payable for fund shares redeemed | 16,761 | |
Accrued management fee | 3,258 | |
Other affiliated payables | 1,160 | |
Other payables and accrued expenses | 852 | |
Collateral on securities loaned, at value | 37,338 | |
Total liabilities | | 86,859 |
| | |
Net Assets | | $ 8,677,425 |
Net Assets consist of: | | |
Paid in capital | | $ 8,509,845 |
Undistributed net investment income | | 8,523 |
Accumulated undistributed net realized gain (loss) on investments and foreign currency transactions | | (1,049,973) |
Net unrealized appreciation (depreciation) on investments and assets and liabilities in foreign currencies | | 1,209,030 |
Net Assets | | $ 8,677,425 |
See accompanying notes which are an integral part of the financial statements.
Annual Report
Financial Statements - continued
Statement of Assets and Liabilities - continued
Amounts in thousands (except per-share amounts) | January 31, 2013 |
| | |
Equity-Income:
Net Asset Value, offering price and redemption price per share ($6,400,965 ÷ 128,741 shares) | | $ 49.72 |
| | |
Class K:
Net Asset Value, offering price and redemption price per share ($2,276,460 ÷ 45,801 shares) | | $ 49.70 |
See accompanying notes which are an integral part of the financial statements.
Annual Report
Statement of Operations
Amounts in thousands | Year ended January 31, 2013 |
| | |
Investment Income | | |
Dividends (including $435 earned from other affiliated issuers) | | $ 287,646 |
Interest | | 16,251 |
Income from Fidelity Central Funds | | 2,299 |
Total income | | 306,196 |
| | |
Expenses | | |
Management fee | $ 39,400 | |
Transfer agent fees | 13,369 | |
Accounting and security lending fees | 1,239 | |
Custodian fees and expenses | 206 | |
Independent trustees' compensation | 59 | |
Appreciation in deferred trustee compensation account | 1 | |
Registration fees | 108 | |
Audit | 192 | |
Legal | 41 | |
Miscellaneous | 97 | |
Total expenses before reductions | 54,712 | |
Expense reductions | (950) | 53,762 |
Net investment income (loss) | | 252,434 |
Realized and Unrealized Gain (Loss) Net realized gain (loss) on: | | |
Investment securities: | | |
Unaffiliated issuers | 813,737 | |
Foreign currency transactions | 116 | |
Total net realized gain (loss) | | 813,853 |
Change in net unrealized appreciation (depreciation) on: Investment securities | 485,587 | |
Assets and liabilities in foreign currencies | (59) | |
Total change in net unrealized appreciation (depreciation) | | 485,528 |
Net gain (loss) | | 1,299,381 |
Net increase (decrease) in net assets resulting from operations | | $ 1,551,815 |
See accompanying notes which are an integral part of the financial statements.
Annual Report
Financial Statements - continued
Statement of Changes in Net Assets
Amounts in thousands | Year ended
January 31,
2013 | Year ended
January 31,
2012 |
Increase (Decrease) in Net Assets | | |
Operations | | |
Net investment income (loss) | $ 252,434 | $ 224,295 |
Net realized gain (loss) | 813,853 | 1,670,941 |
Change in net unrealized appreciation (depreciation) | 485,528 | (2,536,097) |
Net increase (decrease) in net assets resulting
from operations | 1,551,815 | (640,861) |
Distributions to shareholders from net investment income | (248,423) | (215,914) |
Share transactions - net increase (decrease) | (1,576,112) | (2,800,870) |
Total increase (decrease) in net assets | (272,720) | (3,657,645) |
| | |
Net Assets | | |
Beginning of period | 8,950,145 | 12,607,790 |
End of period (including undistributed net investment income of $8,523 and undistributed net investment income of $8,394, respectively) | $ 8,677,425 | $ 8,950,145 |
See accompanying notes which are an integral part of the financial statements.
Annual Report
Financial Highlights - Equity-Income
Years ended January 31, | 2013 | 2012 | 2011 | 2010 | 2009 |
Selected Per-Share Data | | | | | |
Net asset value, beginning of period | $ 42.77 | $ 45.57 | $ 37.93 | $ 27.48 | $ 52.25 |
Income from Investment Operations | | | | | |
Net investment income (loss) B | 1.32 | .89 | .66 | .63 | 1.00 |
Net realized and unrealized gain (loss) | 6.95 | (2.80) | 7.72 | 10.51 | (23.96) |
Total from investment operations | 8.27 | (1.91) | 8.38 | 11.14 | (22.96) |
Distributions from net investment income | (1.32) | (.89) | (.74) | (.69) | (.96) |
Distributions from net realized gain | - | - | - | - | (.85) |
Total distributions | (1.32) | (.89) | (.74) | (.69) | (1.81) |
Net asset value, end of period | $ 49.72 | $ 42.77 | $ 45.57 | $ 37.93 | $ 27.48 |
Total Return A | 19.63% | (4.15)% | 22.32% | 41.02% | (45.16)% |
Ratios to Average Net Assets C, E | | | | | |
Expenses before reductions | .67% | .68% | .69% | .74% | .71% |
Expenses net of fee waivers, if any | .67% | .68% | .69% | .74% | .71% |
Expenses net of all reductions | .66% | .67% | .68% | .74% | .71% |
Net investment income (loss) | 2.89% | 2.04% | 1.62% | 1.87% | 2.38% |
Supplemental Data | | | | | |
Net assets, end of period (in millions) | $ 6,401 | $ 6,844 | $ 10,049 | $ 15,061 | $ 15,070 |
Portfolio turnover rate D | 43% | 80% | 28% | 30% | 33% |
A Total returns would have been lower if certain expenses had not been reduced during the applicable periods shown.
B Calculated based on average shares outstanding during the period.
C Fees and expenses of any underlying Fidelity Central Funds are not included in the Fund's expense ratio. The Fund indirectly bears its proportionate share of the expenses of any underlying Fidelity Central Funds.
D Amount does not include the portfolio activity of any underlying Fidelity Central Funds.
E Expense ratios reflect operating expenses of the class. Expenses before reductions do not reflect amounts reimbursed by the investment adviser or reductions from brokerage service arrangements or reductions from other expense offset arrangements and do not represent the amount paid by the class during periods when reimbursements or reductions occur. Expenses net of fee waivers reflect expenses after reimbursement by the investment adviser but prior to reductions from brokerage service arrangements or other expense offset arrangements. Expenses net of all reductions represent the net expenses paid by the class.
See accompanying notes which are an integral part of the financial statements.
Annual Report
Financial Highlights - Class K
Years ended January 31, | 2013 | 2012 | 2011 | 2010 | 2009 G |
Selected Per-Share Data | | | | | |
Net asset value, beginning of period | $ 42.76 | $ 45.56 | $ 37.93 | $ 27.48 | $ 51.47 |
Income from Investment Operations | | | | | |
Net investment income (loss) D | 1.38 | .95 | .72 | .72 | .61 |
Net realized and unrealized gain (loss) | 6.95 | (2.79) | 7.72 | 10.48 | (23.80) |
Total from investment operations | 8.33 | (1.84) | 8.44 | 11.20 | (23.19) |
Distributions from net investment income | (1.39) | (.96) | (.81) | (.75) | (.80) |
Net asset value, end of period | $ 49.70 | $ 42.76 | $ 45.56 | $ 37.93 | $ 27.48 |
Total Return B, C | 19.78% | (4.00)% | 22.50% | 41.30% | (45.45)% |
Ratios to Average Net Assets E, H | | | | | |
Expenses before reductions | .53% | .53% | .53% | .54% | .53% A |
Expenses net of fee waivers, if any | .53% | .53% | .53% | .54% | .53% A |
Expenses net of all reductions | .52% | .52% | .53% | .54% | .53% A |
Net investment income (loss) | 3.03% | 2.19% | 1.78% | 2.07% | 2.89% A |
Supplemental Data | | | | | |
Net assets, end of period (in millions) | $ 2,276 | $ 2,106 | $ 2,559 | $ 2,017 | $ 711 |
Portfolio turnover rate F | 43% | 80% | 28% | 30% | 33% |
A Annualized
B Total returns for periods of less than one year are not annualized.
C Total returns would have been lower if certain expenses had not been reduced during the applicable periods shown.
D Calculated based on average shares outstanding during the period.
E Fees and expenses of any underlying Fidelity Central Funds are not included in the Fund's expense ratio. The Fund indirectly bears its proportionate share of the expenses of any underlying Fidelity Central Funds.
F Amount does not include the portfolio activity of any underlying Fidelity Central Funds.
G For the period May 9, 2008 (commencement of sale of shares) to January 31, 2009.
H Expense ratios reflect operating expenses of the class. Expenses before reductions do not reflect amounts reimbursed by the investment adviser or reductions from brokerage service arrangements or reductions from other expense offset arrangements and do not represent the amount paid by the class during periods when reimbursements or reductions occur. Expense ratios before reductions for start-up periods may not be representative of longer-term operating periods. Expenses net of fee waivers reflect expenses after reimbursement by the investment adviser but prior to reductions from brokerage service arrangements or other expense offset arrangements. Expenses net of all reductions represent the net expenses paid by the class.
See accompanying notes which are an integral part of the financial statements.
Annual Report
Notes to Financial Statements
For the period ended January 31, 2013
(Amounts in thousands except percentages)
1. Organization.
Fidelity Equity-Income Fund (the Fund) is a fund of Fidelity Devonshire Trust (the Trust) and is authorized to issue an unlimited number of shares. The Trust is registered under the Investment Company Act of 1940, as amended (the 1940 Act), as an open-end management investment company organized as a Massachusetts business trust. The Fund offers Equity-Income and Class K shares, each of which has equal rights as to assets and voting privileges. Each class has exclusive voting rights with respect to matters that affect that class. Investment income, realized and unrealized capital gains and losses, the common expenses of the Fund, and certain fund-level expense reductions, if any, are allocated on a pro-rata basis to each class based on the relative net assets of each class to the total net assets of the Fund. Each class differs with respect to transfer agent fees incurred. Certain expense reductions may also differ by class.
2. Investments in Fidelity Central Funds.
The Fund invests in Fidelity Central Funds, which are open-end investment companies available only to other investment companies and accounts managed by Fidelity Management & Research Company (FMR) and its affiliates. The Fund's Schedule of Investments lists each of the Fidelity Central Funds held as of period end, if any, as an investment of the Fund, but does not include the underlying holdings of each Fidelity Central Fund. As an Investing Fund, the Fund indirectly bears its proportionate share of the expenses of the underlying Fidelity Central Funds.
The Money Market Central Funds seek preservation of capital and current income and are managed by Fidelity Investments Money Management, Inc. (FIMM), an affiliate of FMR.
A complete unaudited list of holdings for each Fidelity Central Fund is available upon request or at the Securities and Exchange Commission (the SEC) website at www.sec.gov. In addition, the financial statements of the Fidelity Central Funds, which are not covered by the Fund's Report of Independent Registered Public Accounting Firm, are available on the SEC website or upon request.
3. Significant Accounting Policies.
The financial statements have been prepared in conformity with accounting principles generally accepted in the United States of America (GAAP), which require management to make certain estimates and assumptions at the date of the financial statements. Actual results could differ from those estimates. Subsequent events, if any, through the date that the financial statements were issued have been evaluated in the preparation of the financial statements. The following summarizes the significant accounting policies of the Fund:
Annual Report
Notes to Financial Statements - continued
(Amounts in thousands except percentages)
3. Significant Accounting Policies - continued
Investment Valuation. Investments are valued as of 4:00 p.m. Eastern time on the last calendar day of the period. In accordance with valuation policies and procedures approved by the Board of Trustees (the Board), the Fund attempts to obtain prices from one or more third party pricing vendors or brokers to value its investments. When current market prices, quotations or currency exchange rates are not readily available or reliable, investments will be fair valued in good faith by the FMR Fair Value Committee (the Committee), in accordance with procedures adopted by the Fund's Board. Factors used in determining fair value vary by investment type and may include market or investment specific events, changes in interest rates and credit quality. The frequency with which these procedures are used cannot be predicted and they may be utilized to a significant extent. The Committee oversees the Fund's valuation policies and procedures and is responsible for approving and reporting to the Board all fair value determinations.
The Fund categorizes the inputs to valuation techniques used to value its investments into a disclosure hierarchy consisting of three levels as shown below:
Level 1 - quoted prices in active markets for identical investments
Level 2 - other significant observable inputs (including quoted prices for similar investments, interest rates, prepayment speeds, etc.)
Level 3 - unobservable inputs (including the Fund's own assumptions based on the best information available)
Valuation techniques used to value the Fund's investments by major category are as follows:
Equity securities, including restricted securities, for which market quotations are readily available, are valued at the last reported sale price or official closing price as reported by a third party pricing vendor on the primary market or exchange on which they are traded and are categorized as Level 1 in the hierarchy. In the event there were no sales during the day or closing prices are not available, securities are valued at the last quoted bid price or may be valued using the last available price and are generally categorized as Level 2 in the hierarchy. For foreign equity securities, when significant market or security specific events arise, comparisons to the valuation of American Depositary Receipts (ADRs), futures contracts, Exchange-Traded Funds (ETFs) and certain indexes as well as quoted prices for similar securities are used and are categorized as Level 2 in the hierarchy. Utilizing these techniques may result in transfers between Level 1 and Level 2. For restricted equity securities and private placements where observable inputs are limited, assumptions about market activity and risk are used and these securities are generally categorized as Level 3 in the hierarchy.
Annual Report
3. Significant Accounting Policies - continued
Investment Valuation - continued
Debt securities, including restricted securities, are valued based on evaluated prices received from third party pricing vendors or from brokers who make markets in such securities. For corporate bonds and floating rate loans, pricing vendors utilize matrix pricing which considers yield or price of bonds of comparable quality, coupon, maturity and type as well as broker-supplied prices. When independent prices are unavailable or unreliable, debt securities may be valued utilizing pricing methodologies which consider similar factors that would be used by third party pricing vendors. Debt Securities are generally categorized as Level 2 in the hierarchy but may be Level 3 depending on the circumstances.
Investments in open-end mutual funds, including the Fidelity Central Funds, are valued at their closing net asset value (NAV) each business day and are categorized as Level 1 in the hierarchy.
Changes in valuation techniques may result in transfers in or out of an assigned level within the disclosure hierarchy. The aggregate value of investments by input level, as of January 31, 2013, is included at the end of the Fund's Schedule of Investments.
Foreign Currency. The Fund may use foreign currency contracts to facilitate transactions in foreign-denominated securities. Gains and losses from these transactions may arise from changes in the value of the foreign currency or if the counterparties do not perform under the contracts' terms.
Foreign-denominated assets, including investment securities, and liabilities are translated into U.S. dollars at the exchange rates at period end. Purchases and sales of investment securities, income and dividends received and expenses denominated in foreign currencies are translated into U.S. dollars at the exchange rate in effect on the transaction date.
The effects of exchange rate fluctuations on investments are included with the net realized and unrealized gain (loss) on investment securities. Other foreign currency transactions resulting in realized and unrealized gain (loss) are disclosed separately.
Investment Transactions and Income. For financial reporting purposes, the Fund's investment holdings and NAV include trades executed through the end of the last business day of the period. The NAV per share for processing shareholder transactions is calculated as of the close of business of the New York Stock Exchange (NYSE), normally 4:00 p.m. Eastern time and includes trades executed through the end of the prior business day. Gains and losses on securities sold are determined on the basis of identified cost and may include proceeds received from litigation. Dividend income is recorded on the ex-dividend date, except for certain dividends from foreign securities where the
Annual Report
Notes to Financial Statements - continued
(Amounts in thousands except percentages)
3. Significant Accounting Policies - continued
Investment Transactions and Income - continued
ex-dividend date may have passed, which are recorded as soon as the Fund is informed of the ex-dividend date. Non-cash dividends included in dividend income, if any, are recorded at the fair market value of the securities received. Distributions received on securities that represent a return of capital or capital gain are recorded as a reduction of cost of investments and/or as a realized gain. The Fund estimates the components of distributions received that may be considered return of capital distributions or capital gain distributions. Interest income and distributions from the Fidelity Central Funds are accrued as earned. Interest income includes coupon interest and amortization of premium and accretion of discount on debt securities. Investment income is recorded net of foreign taxes withheld where recovery of such taxes is uncertain. Debt obligations may be placed on non-accrual status and related interest income may be reduced by ceasing current accruals and writing off interest receivables when the collection of all or a portion of interest has become doubtful based on consistently applied procedures. A debt obligation is removed from non-accrual status when the issuer resumes interest payments or when collectability of interest is reasonably assured.
Expenses. Expenses directly attributable to a fund are charged to that fund. Expenses attributable to more than one fund are allocated among the respective funds on the basis of relative net assets or other appropriate methods. Expense estimates are accrued in the period to which they relate and adjustments are made when actual amounts are known.
Deferred Trustee Compensation. Under a Deferred Compensation Plan (the Plan), independent Trustees may elect to defer receipt of a portion of their annual compensation. Deferred amounts are invested in a cross-section of Fidelity funds, are marked-to-market and remain in the Fund until distributed in accordance with the Plan. The investment of deferred amounts and the offsetting payable to the Trustees are included in the accompanying Statement of Assets and Liabilities.
Income Tax Information and Distributions to Shareholders. Each year, the Fund intends to qualify as a regulated investment company under Subchapter M of the Internal Revenue Code, including distributing substantially all of its taxable income and realized gains. As a result, no provision for income taxes is required. As of January 31, 2013, the Fund did not have any unrecognized tax benefits in the financial statements; nor is the Fund aware of any tax positions for which it is reasonably possible that the total amounts of unrecognized tax benefits will significantly change in the next twelve months. The Fund files a U.S. federal tax return, in addition to state and local tax returns as required. A fund's federal income tax returns are subject to examination by the Internal Revenue Service (IRS) for a period of three fiscal years after they are filed. State and local tax returns may be subject to examination for an additional fiscal year depending on the jurisdiction. Foreign taxes are provided for based on the Fund's
Annual Report
3. Significant Accounting Policies - continued
Income Tax Information and Distributions to Shareholders - continued
understanding of the tax rules and rates that exist in the foreign markets in which it invests.
Distributions are declared and recorded on the ex-dividend date. Income dividends and capital gain distributions are declared separately for each class. Income and capital gain distributions are determined in accordance with income tax regulations, which may differ from GAAP.
Capital accounts within the financial statements are adjusted for permanent book-tax differences. These adjustments have no impact on net assets or the results of operations. Temporary book-tax differences will reverse in a subsequent period.
Book-tax differences are primarily due to equity-debt classifications, foreign currency transactions, passive foreign investment companies (PFIC), market discount, partnerships, deferred trustees compensation, capital loss carryforwards and losses deferred due to wash sales and excise tax regulations.
The federal tax cost of investment securities and unrealized appreciation (depreciation) as of period end were as follows:
Gross unrealized appreciation | $ 1,343,864 |
Gross unrealized depreciation | (158,217) |
Net unrealized appreciation (depreciation) on securities and other investments | $ 1,185,647 |
| |
Tax Cost | $ 7,497,523 |
The tax-based components of distributable earnings as of period end were as follows:
Undistributed ordinary income | $ 9,375 |
Capital loss carryforward | $ (1,029,110) |
Net unrealized appreciation (depreciation) | $ 1,185,673 |
Capital loss carryforwards are only available to offset future capital gains of the Fund to the extent provided by regulations and may be limited. Under the Regulated Investment Company Modernization Act of 2010 (the Act), the Fund is permitted to carry forward capital losses incurred in taxable years beginning after December 22, 2010 for an unlimited period and such capital losses are required to be used prior to any losses that expire. Capital loss carryforwards were as follows:
Fiscal year of expiration | |
2018 | $ (1,029,110) |
Annual Report
Notes to Financial Statements - continued
(Amounts in thousands except percentages)
3. Significant Accounting Policies - continued
Income Tax Information and Distributions to Shareholders - continued
The tax character of distributions paid was as follows:
| January 31, 2013 | January 31, 2012 |
Ordinary Income | $ 248,423 | $ 215,914 |
Restricted Securities. The Fund may invest in securities that are subject to legal or contractual restrictions on resale. These securities generally may be resold in transactions exempt from registration or to the public if the securities are registered. Disposal of these securities may involve time-consuming negotiations and expense, and prompt sale at an acceptable price may be difficult. Information regarding restricted securities is included at the end of the Fund's Schedule of Investments.
Loans and Other Direct Debt Instruments. The Fund invests in direct debt instruments which are interests in amounts owed to lenders by corporate or other borrowers. These instruments may be in the form of loans, trade claims or other receivables and may include standby financing commitments such as revolving credit facilities that obligate the Fund to supply additional cash to the borrower on demand. Loans may be acquired through assignment or participation, or may be made directly to a borrower. The Fund may be contractually obligated to receive approval from the agent bank and/or borrower prior to the sale of these loans.
4. Purchases and Sales of Investments.
Purchases and sales of securities, other than short-term securities, aggregated $3,564,054 and $5,001,121, respectively.
5. Fees and Other Transactions with Affiliates.
Management Fee. FMR and its affiliates provide the Fund with investment management related services for which the Fund pays a monthly management fee. The management fee is the sum of an individual fund fee rate that is based on an annual rate of .20% of the Fund's average net assets and an annualized group fee rate that averaged .26% during the period. The group fee rate is based upon the average net assets of all the mutual funds advised by FMR. The group fee rate decreases as assets under management increase and increases as assets under management decrease. For the period, the total annual management fee rate was .46% of the Fund's average net assets.
Transfer Agent Fees. Fidelity Investments Institutional Operations Company, Inc. (FIIOC), an affiliate of FMR, is the transfer, dividend disbursing and shareholder servicing agent for each class of the Fund. FIIOC receives account fees and asset-based fees that vary according to the account size and type of account of the shareholders of
Annual Report
5. Fees and Other Transactions with Affiliates - continued
Transfer Agent Fees - continued
Equity-Income. FIIOC receives an asset-based fee of Class K's average net assets. FIIOC pays for typesetting, printing and mailing of shareholder reports, except proxy statements. For the period, transfer agent fees for each class were as follows:
| Amount | % of
Average
Net Assets |
Equity-Income | $ 12,318 | .19 |
Class K | 1,051 | .05 |
| $ 13,369 | |
Accounting and Security Lending Fees. Fidelity Service Company, Inc. (FSC), an affiliate of FMR, maintains the Fund's accounting records. The accounting fee is based on the level of average net assets for each month. Under a separate contract, FSC administers the security lending program. The security lending fee is based on the number and duration of lending transactions.
Brokerage Commissions. The Fund placed a portion of its portfolio transactions with brokerage firms which are affiliates of the investment adviser. The commissions paid to these affiliated firms were $57 for the period.
6. Committed Line of Credit.
The Fund participates with other funds managed by FMR or an affiliate in a $4.25 billion credit facility (the "line of credit") to be utilized for temporary or emergency purposes to fund shareholder redemptions or for other short-term liquidity purposes. The Fund has agreed to pay commitment fees on its pro-rata portion of the line of credit, which amounted to $23 and is reflected in Miscellaneous expenses on the Statement of Operations. During the period, there were no borrowings on this line of credit.
7. Security Lending.
The Fund lends portfolio securities through a lending agent from time to time in order to earn additional income. For equity securities, a lending agent is used and may loan securities to certain qualified borrowers, including Fidelity Capital Markets (FCM), a broker-dealer affiliated with the Fund. On the settlement date of the loan, the Fund receives collateral (in the form of U.S. Treasury obligations, letters of credit and/or cash) against the loaned securities and maintains collateral in an amount not less than 100% of the market value of the loaned securities during the period of the loan. The market value of the loaned securities is determined at the close of business of the Fund and any additional required collateral is delivered to the Fund on the next business day. If the
Annual Report
Notes to Financial Statements - continued
(Amounts in thousands except percentages)
7. Security Lending - continued
borrower defaults on its obligation to return the securities loaned because of insolvency or other reasons, a fund could experience delays and costs in recovering the securities loaned or in gaining access to the collateral. Any cash collateral received is invested in the Fidelity Securities Lending Cash Central Fund. The value of loaned securities and cash collateral at period end are disclosed on the Fund's Statement of Assets and Liabilities. The value of securities loaned to FCM at period end was $1,092. Security lending income represents the income earned on investing cash collateral, less rebates paid to borrowers and any lending agent fees associated with the loan, plus any premium payments received for lending certain types of securities. Security lending income is presented in the Statement of Operations as a component of income from Fidelity Central Funds. Total security lending income during the period amounted to $1,955, including $14 from securities loaned to FCM.
8. Expense Reductions.
Many of the brokers with whom FMR places trades on behalf of the Fund provided services to the Fund in addition to trade execution. These services included payments of certain expenses on behalf of the Fund totaling $948 for the period. In addition, through arrangements with the Fund's custodian, credits realized as a result of uninvested cash balances were used to reduce the Fund's expenses. During the period, these credits reduced the Fund's custody accounting expenses by $2.
9. Distributions to Shareholders.
Distributions to shareholders of each class were as follows:
Years ended January 31, | 2013 | 2012 |
From net investment income | | |
Equity-Income | $ 184,959 | $ 168,293 |
Class K | 63,464 | 47,621 |
Total | $ 248,423 | $ 215,914 |
10. Share Transactions.
Transactions for each class of shares were as follows:
| Shares | Dollars |
Years ended January 31, | 2013 | 2012 | 2013 | 2012 |
Equity-Income | | | | |
Shares sold | 14,447 | 17,424 | $ 652,997 | $ 768,861 |
Reinvestment of distributions | 3,847 | 3,805 | 176,234 | 161,431 |
Shares redeemed | (49,571) | (81,714) | (2,252,887) | (3,452,168) |
Net increase (decrease) | (31,277) | (60,485) | $ (1,423,656) | $ (2,521,876) |
Annual Report
10. Share Transactions - continued
| Shares | Dollars |
Years ended January 31, | 2013 | 2012 | 2013 | 2012 |
Class K | | | | |
Shares sold | 14,463 | 20,736 | $ 662,159 | $ 882,621 |
Reinvestment of distributions | 1,385 | 1,117 | 63,464 | 47,621 |
Shares redeemed | (19,293) | (28,765) | (878,079) | (1,209,236) |
Net increase (decrease) | (3,445) | (6,912) | $ (152,456) | $ (278,994) |
11. Other.
The Fund's organizational documents provide former and current trustees and officers with a limited indemnification against liabilities arising in connection with the performance of their duties to the Fund. In the normal course of business, the Fund may also enter into contracts that provide general indemnifications. The Fund's maximum exposure under these arrangements is unknown as this would be dependent on future claims that may be made against the Fund. The risk of material loss from such claims is considered remote.
Annual Report
To the Trustees of Fidelity Devonshire Trust and the Shareholders of Fidelity Equity-Income Fund:
In our opinion, the accompanying statement of assets and liabilities, including the schedule of investments, and the related statements of operations and of changes in net assets and the financial highlights present fairly, in all material respects, the financial position of Fidelity Equity-Income Fund (a fund of Fidelity Devonshire Trust) at January 31, 2013, the results of its operations for the year then ended, the changes in its net assets for each of the two years in the period then ended and the financial highlights for each of the periods indicated, in conformity with accounting principles generally accepted in the United States of America. These financial statements and financial highlights (hereafter referred to as "financial statements") are the responsibility of the Fidelity Equity-Income Fund's management. Our responsibility is to express an opinion on these financial statements based on our audits. We conducted our audits of these financial statements in accordance with the standards of the Public Company Accounting Oversight Board (United States). Those standards require that we plan and perform the audit to obtain reasonable assurance about whether the financial statements are free of material misstatement. An audit includes examining, on a test basis, evidence supporting the amounts and disclosures in the financial statements, assessing the accounting principles used and significant estimates made by management, and evaluating the overall financial statement presentation. We believe that our audits, which included confirmation of securities at January 31, 2013 by correspondence with the custodian, agent banks and brokers, provide a reasonable basis for our opinion.
PricewaterhouseCoopers LLP
Boston, Massachusetts
March 13, 2013
Annual Report
The Trustees, Members of the Advisory Board, and executive officers of the trust and fund, as applicable, are listed below. The Board of Trustees governs the fund and is responsible for protecting the interests of shareholders. The Trustees are experienced executives who meet periodically throughout the year to oversee the fund's activities, review contractual arrangements with companies that provide services to the fund, oversee management of the risks associated with such activities and contractual arrangements, and review the fund's performance. Except for James C. Curvey, each of the Trustees oversees 234 Fidelity funds. Mr. Curvey oversees 453 Fidelity funds.
The Trustees hold office without limit in time except that (a) any Trustee may resign; (b) any Trustee may be removed by written instrument, signed by at least two-thirds of the number of Trustees prior to such removal; (c) any Trustee who requests to be retired or who has become incapacitated by illness or injury may be retired by written instrument signed by a majority of the other Trustees; and (d) any Trustee may be removed at any special meeting of shareholders by a two-thirds vote of the outstanding voting securities of the trust. Each Trustee who is not an interested person (as defined in the 1940 Act) (Independent Trustee), shall retire not later than the last day of the calendar year in which his or her 75th birthday occurs. The Independent Trustees may waive this mandatory retirement age policy with respect to individual Trustees. The executive officers and Advisory Board Members hold office without limit in time, except that any officer and Advisory Board Member may resign or may be removed by a vote of a majority of the Trustees at any regular meeting or any special meeting of the Trustees. Except as indicated, each individual has held the office shown or other offices in the same company for the past five years.
Experience, Skills, Attributes, and Qualifications of the Fund's Trustees. The Governance and Nominating Committee has adopted a statement of policy that describes the experience, qualifications, attributes, and skills that are necessary and desirable for potential Independent Trustee candidates (Statement of Policy). The Board believes that each Trustee satisfied at the time he or she was initially elected or appointed a Trustee, and continues to satisfy, the standards contemplated by the Statement of Policy. The Governance and Nominating Committee also engages professional search firms to help identify potential Independent Trustee candidates who have the experience, qualifications, attributes, and skills consistent with the Statement of Policy. From time to time, additional criteria based on the composition and skills of the current Independent Trustees, as well as experience or skills that may be appropriate in light of future changes to board composition, business conditions, and regulatory or other developments, have also been considered by the professional search firms and the Governance and Nominating Committee. In addition, the Board takes into account the Trustees' commitment and participation in Board and committee meetings, as well as their leadership of standing and ad hoc committees throughout their tenure.
In determining that a particular Trustee was and continues to be qualified to serve as a Trustee, the Board has considered a variety of criteria, none of which, in isolation, was controlling. The Board believes that, collectively, the Trustees have balanced and diverse experience, qualifications, attributes, and skills, which allow the Board to operate effectively in governing the fund and protecting the interests of shareholders. Information about the specific experience, skills, attributes, and qualifications of each Trustee, which in each case led to the Board's conclusion that the Trustee should serve (or continue to serve) as a trustee of the fund, is provided below.
Annual Report
Board Structure and Oversight Function. James C. Curvey is an interested person (as defined in the 1940 Act) and currently serves as Chairman. The Trustees have determined that an interested Chairman is appropriate and benefits shareholders because an interested Chairman has a personal and professional stake in the quality and continuity of services provided to the fund. Independent Trustees exercise their informed business judgment to appoint an individual of their choosing to serve as Chairman, regardless of whether the Trustee happens to be independent or a member of management. The Independent Trustees have determined that they can act independently and effectively without having an Independent Trustee serve as Chairman and that a key structural component for assuring that they are in a position to do so is for the Independent Trustees to constitute a substantial majority for the Board. The Independent Trustees also regularly meet in executive session. Ned C. Lautenbach serves as Chairman of the Independent Trustees and as such (i) acts as a liaison between the Independent Trustees and management with respect to matters important to the Independent Trustees and (ii) with management prepares agendas for Board meetings.
Fidelity funds are overseen by different Boards of Trustees. The fund's Board oversees Fidelity's equity and high income funds and another Board oversees Fidelity's investment-grade bond, money market, and asset allocation funds. The asset allocation funds may invest in Fidelity funds overseen by the fund's Board. The use of separate Boards, each with its own committee structure, allows the Trustees of each group of Fidelity funds to focus on the unique issues of the funds they oversee, including common research, investment, and operational issues. On occasion, the separate Boards establish joint committees to address issues of overlapping consequences for the Fidelity funds overseen by each Board.
The Trustees operate using a system of committees to facilitate the timely and efficient consideration of all matters of importance to the Trustees, the fund, and fund shareholders and to facilitate compliance with legal and regulatory requirements and oversight of the fund's activities and associated risks. The Board, acting through its committees, has charged FMR and its affiliates with (i) identifying events or circumstances the occurrence of which could have demonstrably adverse effects on the fund's business and/or reputation; (ii) implementing processes and controls to lessen the possibility that such events or circumstances occur or to mitigate the effects of such events or circumstances if they do occur; and (iii) creating and maintaining a system designed to evaluate continuously business and market conditions in order to facilitate the identification and implementation processes described in (i) and (ii) above. Because the day-to-day operations and activities of the fund are carried out by or through FMR, its affiliates and other service providers, the fund's exposure to risks is mitigated but not eliminated by the processes overseen by the Trustees. While each of the Board's committees has responsibility for overseeing different aspects of the fund's activities, oversight is exercised primarily through the Operations, Audit, and Compliance Committees. In addition, the Independent Trustees have worked with FMR to enhance the Board's oversight of investment and financial risks, legal and regulatory risks, technology risks, and operational risks, including the development of additional risk reporting to the Board. For example, a working group comprised of Independent Trustees and FMR has worked and continues to work to review the Fidelity funds' valuation-related activities, reporting and risk management. Appropriate personnel, including but not limited to the fund's Chief Compliance Officer (CCO), FMR's internal auditor, the independent accountants, the fund's Treasurer and portfolio management personnel, make periodic reports to the Board's committees, as appropriate, including an annual review of FMR's risk management program for the Fidelity funds. The responsibilities of each standing committee, including their oversight responsibilities, are described further under "Standing Committees of the Fund's Trustees."
Annual Report
Trustees and Officers - continued
The fund's Statement of Additional Information (SAI) includes more information about the Trustees. To request a free copy, call Fidelity at 1-800-835-5092.
Interested Trustees*:
Correspondence intended for each Trustee who is an interested person may be sent to Fidelity Investments, 245 Summer Street, Boston, Massachusetts 02210.
Name, Age; Principal Occupations and Other Relevant Experience+ |
James C. Curvey (77) |
| Year of Election or Appointment: 2007 Mr. Curvey is Trustee and Chairman of the Board of Trustees of certain Trusts. Mr. Curvey also serves as Trustee (2007-present) of other investment companies advised by FMR. Mr. Curvey is a Director of Fidelity Investments Money Management, Inc. (2009-present), Director of Fidelity Research & Analysis Co. (2009-present) and Director of FMR and FMR Co., Inc. (2007-present). Mr. Curvey is also Vice Chairman (2007-present) and Director of FMR LLC. In addition, Mr. Curvey serves as an Overseer for the Boston Symphony Orchestra and a member of the Trustees of Villanova University. Previously, Mr. Curvey was the Vice Chairman (2006-2007) and Director (2000-2007) of FMR Corp. |
Ronald P. O'Hanley (55) |
| Year of Election or Appointment: 2011 Mr. O'Hanley is Director of FMR Co., Inc. (2010-present), Director of Fidelity Investments Money Management, Inc. (2010-present), Director of Fidelity Research & Analysis Company (2010-present), President of Fidelity Asset Management and Corporate Services and a member of Fidelity's Executive Committee (2010-present). Previously, Mr. O'Hanley served as President and Chief Executive Officer of BNY Mellon Asset Management (2007-2010). Mr. O'Hanley also served as Vice Chairman of Bank New York Mellon Corp. and a member of that firm's Executive Committee. Prior to the 2007 merger of The Bank of New York and Mellon Financial Corporation, he was Vice Chairman of Mellon Financial Corporation and President and Chief Executive Officer of Mellon Asset Management. He joined Mellon in February 1997. Mr. O'Hanley currently serves as Chairman of the Boston Public Library Foundation Board of Directors and sits on the Board of Directors of Beth Israel Deaconess Medical Center, the Board of Trustees of the Marine Biological Laboratory and the Advisory Board of the Maxwell School of Citizenship and Public Administration at Syracuse University. Mr. O'Hanley also chairs the Council on Asset Management for the Financial Services Roundtable and is a member of the Board of Directors of Institutional Investor's U.S. Institute. |
* Trustees have been determined to be "Interested Trustees" by virtue of, among other things, their affiliation with the trust or various entities under common control with FMR.
+ The information above includes each Trustee's principal occupation during the last five years and other information relating to the experience, attributes, and skills relevant to each Trustee's qualifications to serve as a Trustee, which led to the conclusion that each Trustee should serve as a Trustee for the fund.
Annual Report
Trustees and Officers - continued
Independent Trustees:
Correspondence intended for each Independent Trustee (that is, the Trustees other than the Interested Trustees) may be sent to Fidelity Investments, P.O. Box 55235, Boston, Massachusetts 02205-5235.
Name, Age; Principal Occupations and Other Relevant Experience+ |
Dennis J. Dirks (64) |
| Year of Election or Appointment: 2005 Prior to his retirement in May 2003, Mr. Dirks was Chief Operating Officer and a member of the Board of The Depository Trust & Clearing Corporation (DTCC). He also served as President, Chief Operating Officer, and Board member of The Depository Trust Company (DTC) and President and Board member of the National Securities Clearing Corporation (NSCC). In addition, Mr. Dirks served as Chief Executive Officer and Board member of the Government Securities Clearing Corporation, Chief Executive Officer and Board member of the Mortgage-Backed Securities Clearing Corporation, as a Trustee and a member of the Finance Committee of Manhattan College (2005-2008), and as a Trustee and a member of the Finance Committee of AHRC of Nassau County (2006-2008). Mr. Dirks is a member of the Independent Directors Council (IDC) Governing Council (2010-present) and Board of Directors for The Brookville Center for Children's Services, Inc. (2009-present). |
Alan J. Lacy (59) |
| Year of Election or Appointment: 2008 Mr. Lacy serves as Senior Adviser (2007-present) of Oak Hill Capital Partners, L.P. (private equity). Mr. Lacy also served as Chief Executive Officer (2000-2005) and Vice Chairman (2005-2006) of Sears Holdings Corporation and Sears, Roebuck and Co. (retail). In addition, Mr. Lacy serves as a member of the Board of Directors of Dave & Buster's Entertainment, Inc. (restaurant and entertainment complexes, 2010-present), Earth Fare, Inc. (retail grocery, 2012-present), The Hillman Companies, Inc. (hardware wholesalers, 2010-present), and Bristol-Myers Squibb Company (global pharmaceuticals, 2008-present). Mr. Lacy is a member of the Board of Trustees of The National Parks Conservation Association (2006-present). Previously, Mr. Lacy served as Chairman of the Board of Trustees of the National Parks Conservation Association (2008-2011) and as a member of the Board of Directors for the Western Union Company (global money transfer, 2006-2011). |
Ned C. Lautenbach (68) |
| Year of Election or Appointment: 2000 Mr. Lautenbach is Chairman of the Independent Trustees of the Equity and High Income Funds (2006-present). Mr. Lautenbach currently serves as the Lead Director of the Eaton Corporation Board of Directors (diversified industrial, 1997-present). Mr. Lautenbach is Chairman of the Board of Directors of the Philharmonic Center for the Arts in Naples, Florida (2012-present) and a member of the Council on Foreign Relations (1994-present). Previously, Mr. Lautenbach was a Partner/Advisory Partner at Clayton, Dubilier & Rice, LLC (private equity investment, 1998-2010), as well as a Director of Sony Corporation (2006-2007). |
Joseph Mauriello (68) |
| Year of Election or Appointment: 2008 Prior to his retirement in January 2006, Mr. Mauriello served in numerous senior management positions including Deputy Chairman and Chief Operating Officer (2004-2005), and Vice Chairman of Financial Services (2002-2004) of KPMG LLP US (professional services, 1965-2005). Mr. Mauriello currently serves as a member of the Board of Directors of XL Group plc. (global insurance and re-insurance, 2006-present). Previously, Mr. Mauriello served as a Director of the Hamilton Funds of the Bank of New York (2006-2007) and of Arcadia Resources Inc. (health care services and products, 2007-2012). |
Robert W. Selander (62) |
| Year of Election or Appointment: 2011 Previously, Mr. Selander served as a Member of the Advisory Board of Fidelity's Equity and High Income Funds (2011), Executive Vice Chairman (2010), Chief Executive Officer (2009-2010), and President and Chief Executive Officer (1997-2009) of Mastercard, Inc. |
Cornelia M. Small (68) |
| Year of Election or Appointment: 2005 Ms. Small is a member of the Board of Directors (2009-present) and Chair of the Investment Committee (2010-present) of the Teagle Foundation. Ms. Small also serves on the Investment Committee of the Berkshire Taconic Community Foundation (2008-present). Previously, Ms. Small served as Chairperson (2002-2008) and a member of the Investment Committee and Chairperson (2008-2012) and a member of the Board of Trustees of Smith College. In addition, Ms. Small served as Chief Investment Officer, Director of Global Equity Investments, and a member of the Board of Directors of Scudder, Stevens & Clark and Scudder Kemper Investments. |
William S. Stavropoulos (73) |
| Year of Election or Appointment: 2002 Mr. Stavropoulos is Vice Chairman of the Independent Trustees of the Equity and High Income Funds (2006-present). Mr. Stavropoulos serves as President and Founder of the Michigan Baseball Foundation, the Great Lakes Loons (2007-present). Mr. Stavropoulos is Chairman Emeritus of the Board of Directors of The Dow Chemical Company, where he previously served in numerous senior management positions, including President, CEO (1995-2000; 2002-2004), Chairman of the Executive Committee (2000-2006), and as a member of the Board of Directors (1990-2006). Currently, Mr. Stavropoulos is a Director of Univar Inc. (global distributor of commodity and specialty chemicals, Chairman from 2010-May 2012 and Lead Director from May 2012-present), Teradata Corporation (data warehousing and technology solutions, 2008-present), Maersk Inc. (industrial conglomerate), and Tyco International, Ltd. (multinational manufacturing and services, 2007-present), and a member of the Advisory Board for Metalmark Capital LLC (private equity investment, 2005-present). Mr. Stavropoulos is an operating advisor to Clayton, Dubilier & Rice, LLC (private equity investment). In addition, Mr. Stavropoulos is a member of the University of Notre Dame Advisory Council for the College of Science, a Trustee of the Rollin L. Gerstacker Foundation, and a Director of the Naples Philharmonic Center for the Arts. Previously, Mr. Stavropoulos served as a Director of Chemical Financial Corporation (bank holding company, 1993-2012). |
David M. Thomas (63) |
| Year of Election or Appointment: 2008 Previously, Mr. Thomas served as Executive Chairman (2005-2006) and Chairman and Chief Executive Officer (2000-2005) of IMS Health, Inc. (pharmaceutical and healthcare information solutions), and a Director of Fortune Brands, Inc. (consumer products, 2000-2011). In addition, Mr. Thomas serves as Non-Executive Chairman of the Board of Directors of Fortune Brands Home and Security (home and security products, 2011-present), and as a member of the Board of Directors of Interpublic Group of Companies, Inc. (marketing communication, 2004-present). |
Michael E. Wiley (62) |
| Year of Election or Appointment: 2008 Mr. Wiley also serves as a Director of Asia Pacific Exploration Consolidated (international oil and gas exploration and production, 2008-present). Mr. Wiley serves as a Director of Tesoro Corporation (independent oil refiner and marketer, 2005-present), and a Director of Bill Barrett Corporation (exploration and production, 2005-present). In addition, Mr. Wiley also serves as a Director of Post Oak Bank (privately-held bank, 2004-present). Previously, Mr. Wiley served as a member of the Board of Trustees of the University of Tulsa (2000-2006; 2007-2010), as a Senior Energy Advisor of Katzenbach Partners, LLC (consulting, 2006-2007), as an Advisory Director of Riverstone Holdings (private investment), Chairman, President, and CEO of Baker Hughes, Inc. (oilfield services, 2000-2004), and as Director of Spinnaker Exploration Company (exploration and production, 2001-2005). |
+ The information above includes each Trustee's principal occupation during the last five years and other information relating to the experience, attributes, and skills relevant to each Trustee's qualifications to serve as a Trustee, which led to the conclusion that each Trustee should serve as a Trustee for the fund.
Advisory Board Members and Executive Officers:
Correspondence intended for David A. Rosow and Garnett A. Smith may be sent to Fidelity Investments, P.O. Box 55235, Boston, Massachusetts 02205-5235. Correspondence intended for each executive officer and Peter S. Lynch may be sent to Fidelity Investments, 245 Summer Street, Boston, Massachusetts 02210.
Name, Age; Principal Occupation |
Peter S. Lynch (69) |
| Year of Election or Appointment: 2003 Member of the Advisory Board of Fidelity's Equity and High Income Funds. Mr. Lynch is Vice Chairman and a Director of FMR and FMR Co., Inc. In addition, Mr. Lynch serves as a Trustee of Boston College and as the Chairman of the Inner-City Scholarship Fund. Previously, Mr. Lynch served on the Special Olympics International Board of Directors (1997-2006). |
David A. Rosow (70) |
| Year of Election or Appointment: 2012 Member of the Advisory Board of Fidelity's Equity and High Income Funds. Chairman and Chief Executive Officer of International Golf Group, Inc. (golf course development, 1989-present). Previously, Mr. Rosow served as Chairman and Chief Executive Officer of Rosow & Company, Inc. (private investment company, 1989-2011), a Lead Director of Hudson United Bancorp (2001-2006) and as a Director of TD Banknorth (1996-2006). In addition, Mr. Rosow is a member (2008-present) and President (2009-present) of the Town Council of Palm Beach, Florida. |
Garnett A. Smith (65) |
| Year of Election or Appointment: 2012 Member of the Advisory Board of Fidelity's Equity and High Income Funds. Prior to Mr. Smith's retirement, he served as Chairman and Chief Executive Officer of Inbrand Corp. (manufacturer of personal absorbent products, 1990-1997). He also served as President (1986-1990) of Inbrand Corp. Prior to his employment with Inbrand Corp., he was employed by a retail fabric chain and North Carolina National Bank. In addition, Mr. Smith is a board member of the Jackson Hole Land Trust (2009-present). |
Kenneth B. Robins (43) |
| Year of Election or Appointment: 2008 President and Treasurer of Fidelity's Equity and High Income Funds. Mr. Robins also serves as President and Treasurer (2010-present) and Assistant Treasurer (2009-present) of other Fidelity funds and is an employee of Fidelity Investments (2004-present). Previously, Mr. Robins served as Deputy Treasurer of the Fidelity funds (2005-2008) and Treasurer and Chief Financial Officer of The North Carolina Capital Management Trust: Cash and Term Portfolios (2006-2008). |
Bruce T. Herring (47) |
| Year of Election or Appointment: 2006 Vice President of certain Equity Funds. Mr. Herring also serves as Chief Investment Officer of Fidelity Global Asset Allocation (GAA) (2013-present), Chief Investment Officer and Director of Fidelity Management & Research (U.K.) Inc. (2010-present), Group Chief Investment Officer of FMR, and President of Fidelity Research & Analysis Company (2010-present). Previously, Mr. Herring served as Vice President (2005-2006) and Senior Vice President (2006-2007) of Fidelity Management & Research Company, Vice President of FMR Co., Inc. (2001-2007) and as a portfolio manager for Fidelity U.S. Equity Funds. |
Brian B. Hogan (48) |
| Year of Election or Appointment: 2009 Vice President of Equity and High Income Funds. Mr. Hogan also serves as President of FMR's Equity Division (2009-present). Previously, Mr. Hogan served as Senior Vice President, Equity Research of FMR (2006-2009) and as a portfolio manager. |
Scott C. Goebel (45) |
| Year of Election or Appointment: 2008 Secretary and Chief Legal Officer (CLO) of the Fidelity funds. Mr. Goebel also serves as Secretary of Fidelity Investments Money Management, Inc. (FIMM) (2010-present) and Fidelity Research and Analysis Company (FRAC) (2010-present); Secretary and CLO of The North Carolina Capital Management Trust: Cash and Term Portfolios (2008-present); General Counsel, Secretary, and Senior Vice President of FMR (2008-present) and FMR Co., Inc. (2008-present); employed by FMR LLC or an affiliate (2001-present); Chief Legal Officer of Fidelity Management & Research (Hong Kong) Limited (2008-present) and Assistant Secretary of Fidelity Management & Research (Japan) Inc. (2008-present), and Fidelity Management & Research (U.K.) Inc. (2008-present). Previously, Mr. Goebel served as Assistant Secretary of FIMM (2008-2010), FRAC (2008-2010), and the Funds (2007-2008) and as Vice President and Secretary of Fidelity Distributors Corporation (FDC) (2005-2007). |
William C. Coffey (43) |
| Year of Election or Appointment: 2009 Assistant Secretary of Fidelity's Equity and High Income Funds. Mr. Coffey also serves as Senior Vice President and Deputy General Counsel of FMR LLC (2010-present), and is an employee of Fidelity Investments. Previously, Mr. Coffey served as Vice President and Associate General Counsel of FMR LLC (2005-2009). |
Elizabeth Paige Baumann (44) |
| Year of Election or Appointment: 2012 Anti-Money Laundering (AML) Officer of the Fidelity funds. Ms. Baumann also serves as AML Officer of The North Carolina Capital Management Trust: Cash and Term Portfolios (2012-present), Chief AML Officer of FMR LLC (2012-present), and is an employee of Fidelity Investments. Previously, Ms. Baumann served as Vice President and Deputy Anti-Money Laundering Officer (2007-2012). |
Christine Reynolds (54) |
| Year of Election or Appointment: 2008 Chief Financial Officer of the Fidelity funds. Ms. Reynolds became President of Fidelity Pricing and Cash Management Services (FPCMS) in August 2008. Ms. Reynolds served as Chief Operating Officer of FPCMS (2007-2008). Previously, Ms. Reynolds served as President, Treasurer, and Anti-Money Laundering officer of the Fidelity funds (2004-2007). |
Joseph A. Hanlon (44) |
| Year of Election or Appointment: 2012 Chief Compliance Officer of Fidelity's Equity and High Income Funds. Mr. Hanlon serves as Compliance Officer of FMR, FMR Co., Inc., Fidelity Investments Money Management, Inc. (FIMM), Fidelity Research and Analysis Company (FRAC), Fidelity Management & Research (Japan) Inc., Fidelity Management & Research (U.K.) Inc., Fidelity Management & Research (Hong Kong), and Strategic Advisers, Inc. (2009-present), as Senior Vice President of the Fidelity Asset Management Division (2009-present), and is an employee of Fidelity Investments. |
Joseph F. Zambello (55) |
| Year of Election or Appointment: 2011 Deputy Treasurer of the Fidelity funds. Mr. Zambello is an employee of Fidelity Investments. Previously, Mr. Zambello served as Vice President of FMR's Program Management Group (2009-2011) and Vice President of the Transfer Agent Oversight Group (2005-2009). |
Adrien E. Deberghes (45) |
| Year of Election or Appointment: 2008 Deputy Treasurer of Fidelity's Equity and High Income Funds. Mr. Deberghes also serves as Vice President (2011-present) and Assistant Treasurer (2010-present) of other Fidelity funds, and is an employee of Fidelity Investments (2008-present). Previously, Mr. Deberghes served as Senior Vice President of Mutual Fund Administration at State Street Corporation (2007-2008), Senior Director of Mutual Fund Administration at Investors Bank & Trust (2005-2007), and Director of Finance for Dunkin' Brands (2000-2005). |
Stephen Sadoski (41) |
| Year of Election or Appointment: 2012 Deputy Treasurer of Fidelity's Equity and High Income Funds. Mr. Sadoski also serves as Deputy Treasurer of other Fidelity funds (2013-present) and is an employee of Fidelity Investments (2012-present). Previously, Mr. Sadoski served as Assistant Treasurer of Fidelity's Fixed Income and Asset Allocation Funds (2012-2013), an assistant chief accountant in the Division of Investment Management of the Securities and Exchange Commission (SEC) (2009-2012) and as a senior manager at Deloitte & Touche (1997-2009). |
Stacie Smith (38) |
| Year of Election or Appointment: 2013 Deputy Treasurer of Fidelity's Equity and High Income Funds. Ms. Smith is an employee of Fidelity Investments (2009-present). Previously, Ms. Smith served as Senior Audit Manager of Ernst & Young LLP (1996-2009). |
Stephanie J. Dorsey (43) |
| Year of Election or Appointment: 2010 Assistant Treasurer of Fidelity's Equity and High Income Funds. Ms. Dorsey also serves as President and Treasurer (2013-present) and Assistant Treasurer (2012-present) of other Fidelity funds and is an employee of Fidelity Investments (2008-present). Previously, Ms. Dorsey served as Deputy Treasurer of Fidelity's Fixed Income and Asset Allocation Funds (2008-2013), Treasurer (2004-2008) of the JPMorgan Mutual Funds and Vice President (2004-2008) of JPMorgan Chase Bank. |
John R. Hebble (54) |
| Year of Election or Appointment: 2009 Assistant Treasurer of Fidelity's Equity and High Income Funds. Mr. Hebble also serves as President (2011-present), Treasurer, and Chief Financial Officer of The North Carolina Capital Management Trust: Cash and Term Portfolios (2008-present) and is an employee of Fidelity Investments. Previously, Mr. Hebble served as President and Treasurer of Fidelity's Fixed Income and Asset Allocation Funds (2008-2013). |
Gary W. Ryan (54) |
| Year of Election or Appointment: 2005 Assistant Treasurer of the Fidelity funds. Mr. Ryan is an employee of Fidelity Investments. Previously, Mr. Ryan served as Vice President of Fund Reporting in Fidelity Pricing and Cash Management Services (FPCMS) (1999-2005). |
Jonathan Davis (44) |
| Year of Election or Appointment: 2010 Assistant Treasurer of the Fidelity funds. Mr. Davis is also Assistant Treasurer of Fidelity Rutland Square Trust II and Fidelity Commonwealth Trust II. Mr. Davis is an employee of Fidelity Investments. Previously, Mr. Davis served as Vice President and Associate General Counsel of FMR LLC (2003-2010). |
Annual Report
A total of 0.03% of the dividends distributed during the fiscal year was derived from interest on U.S. Government securities which is generally exempt from state income tax.
Class K designates 77%, 75%, 75% and 75% of the dividends distributed in April, July, October and December 2012, respectively during the fiscal year as qualifying for the dividends-received deduction for corporate shareholders.
Class K designates 91%, 91%, 90% and 91% of the dividends distributed in April, July, October and December 2012, respectively during the fiscal year as amounts which may be taken into account as a dividend for the purposes of the maximum rate under section 1(h)(11) of the Internal Revenue Code.
The fund will notify shareholders in January 2014 of amounts for use in preparing 2013 income tax returns.
Annual Report
Investment Adviser
Fidelity Management & Research Company
Boston, MA
Investment Sub-Advisers
FMR Co., Inc.
Fidelity Management & Research
(U.K.) Inc.
Fidelity Management & Research
(Hong Kong) Limited
Fidelity Management & Research
(Japan) Inc.
General Distributor
Fidelity Distributors Corporation
Smithfield, RI
Transfer and Service Agents
Fidelity Investments Institutional
Operations Company, Inc.
Boston, MA
Fidelity Service Company, Inc.
Boston, MA
Custodian
The Northern Trust Company
Chicago, IL
(Fidelity Investment logo)(registered trademark)
Corporate Headquarters
245 Summer St., Boston, MA 02210
www.fidelity.com
EQU-K-UANN-0313
1.863281.104
(Fidelity Investment logo)(registered trademark)
Fidelity Advisor®
Stock Selector
Large Cap Value
Fund - Institutional Class
Annual Report
January 31, 2013
(Fidelity Cover Art)
Institutional Class is a class of
Fidelity® Stock Selector Large Cap
Value Fund
Contents
Performance | (Click Here) | How the fund has done over time. |
Management's Discussion of Fund Performance | (Click Here) | The Portfolio Manager's review of fund performance and strategy. |
Shareholder Expense Example | (Click Here) | An example of shareholder expenses. |
Investment Changes | (Click Here) | A summary of major shifts in the fund's investments over the past six months. |
Investments | (Click Here) | A complete list of the fund's investments with their market values. |
Financial Statements | (Click Here) | Statements of assets and liabilities, operations, and changes in net assets, as well as financial highlights. |
Notes | (Click Here) | Notes to the financial statements. |
Report of Independent Registered Public Accounting Firm | (Click Here) | |
Trustees and Officers | (Click Here) | |
Distributions | (Click Here) | |
To view a fund's proxy voting guidelines and proxy voting record for the 12-month period ended June 30, visit http://www.fidelity.com/proxyvotingresults or visit the Securities and Exchange Commission's (SEC) web site at http://www.sec.gov. You may also call 1-877-208-0098 to request a free copy of the proxy voting guidelines.
Standard & Poor's, S&P and S&P 500 are registered service marks of The McGraw-Hill Companies, Inc. and have been licensed for use by Fidelity Distributors Corporation.
Other third-party marks appearing herein are the property of their respective owners.
All other marks appearing herein are registered or unregistered trademarks or service marks of FMR LLC or an affiliated company. © 2013 FMR LLC. All rights reserved.
This report and the financial statements contained herein are submitted for the general information of the shareholders of the fund. This report is not authorized for distribution to prospective investors in the fund unless preceded or accompanied by an effective prospectus.
A fund files its complete schedule of portfolio holdings with the SEC for the first and third quarters of each fiscal year on Form N-Q. Forms N-Q are available on the SEC's web site at http://www.sec.gov. A fund's Forms N-Q may be reviewed and copied at the SEC's Public Reference Room in Washington, DC. Information regarding the operation of the SEC's Public Reference Room may be obtained by calling 1-800-SEC-0330. For a complete list of a fund's portfolio holdings, view the most recent holdings listing, semiannual report, or annual report on Fidelity's web site at http://www.fidelity.com, http://www.advisor.fidelity.com, or http://www.401k.com, as applicable.
NOT FDIC INSURED • MAY LOSE VALUE • NO BANK GUARANTEE
Neither the fund nor Fidelity Distributors Corporation is a bank.
Annual Report
Average annual total return reflects the change in the value of an investment, assuming reinvestment of the class' distributions from dividend income and capital gains (the profits earned upon the sale of securities that have grown in value, if any) and assuming a constant rate of performance each year. The $10,000 table and the fund's returns do not reflect the deduction of taxes that a shareholder would pay on fund distributions or the redemption of fund shares. During periods of reimbursement by Fidelity, a fund's total return will be greater than it would be had the reimbursement not occurred. How a fund did yesterday is no guarantee of how it will do tomorrow.
Average Annual Total Returns
Periods ended January 31, 2013 | Past 1
year | Past 5
years | Past 10
years |
Institutional Class A | 18.42% | 0.14% | 6.89% |
A The initial offering of Institutional Class shares took place on February 13, 2007. Returns prior to February 13, 2007 are those of Fidelity® Stock Selector Large Cap Value Fund, the original class of the fund.
$10,000 Over 10 Years
Let's say hypothetically that $10,000 was invested in Fidelity Advisor® Stock Selector Large Cap Value Fund - Institutional Class on January 31, 2003. The chart shows how the value of your investment would have changed, and also shows how the Russell 1000® Value Index performed over the same period. The initial offering of Institutional Class took place on February 13, 2007. See above for additional information regarding the performance of Institutional Class.
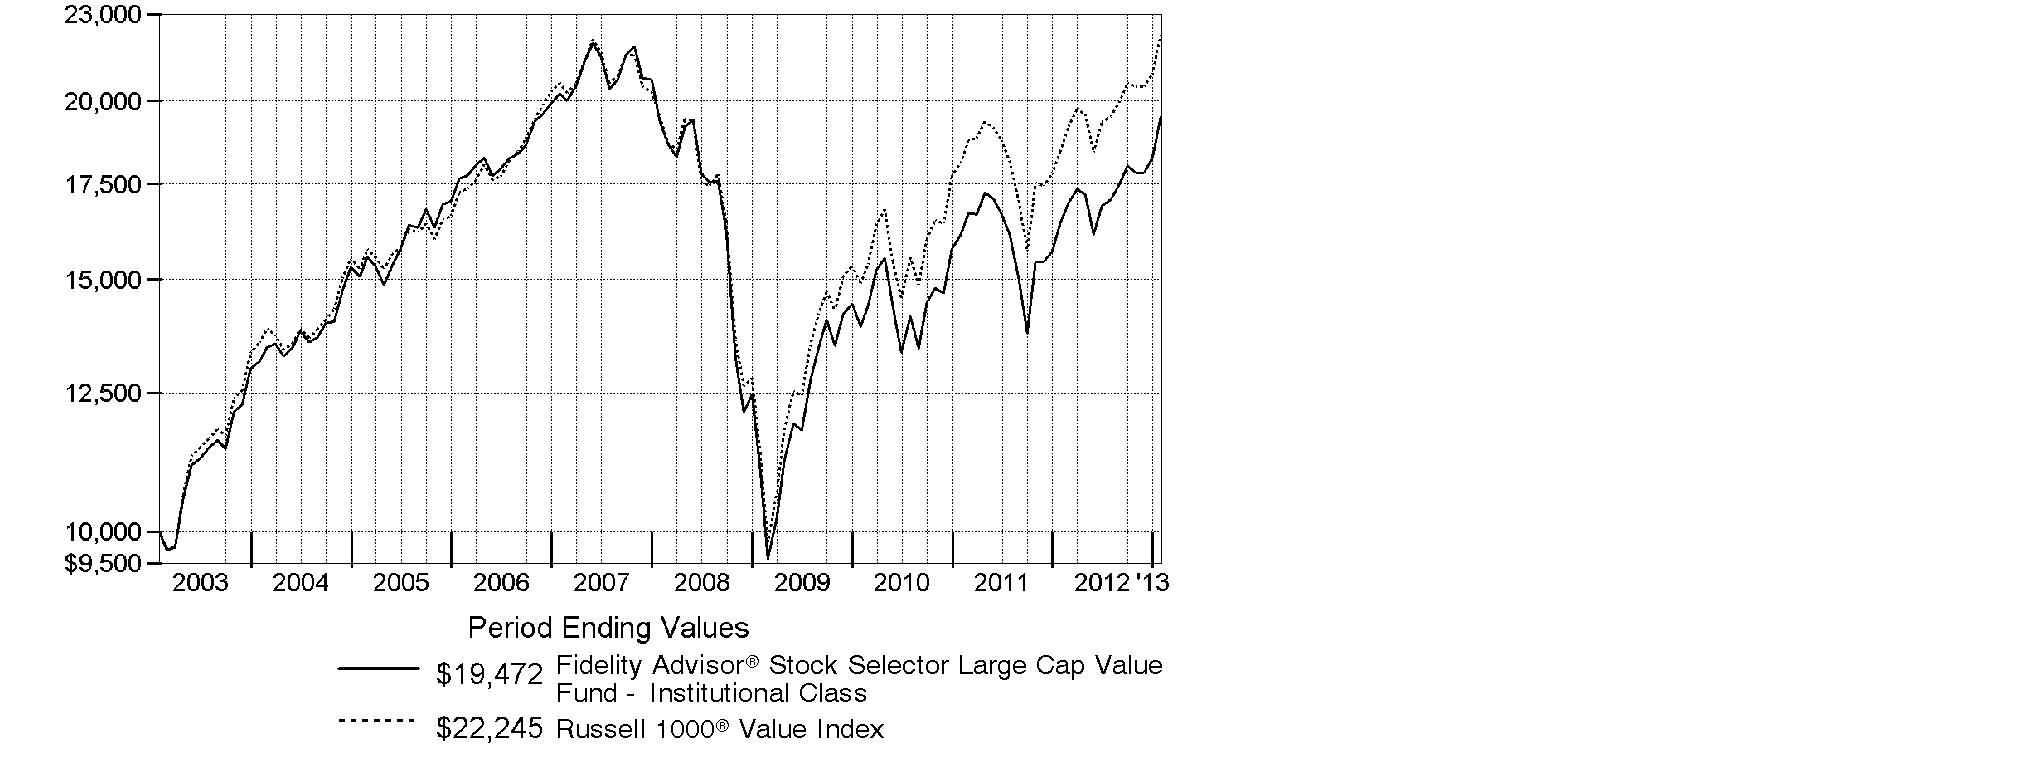
Annual Report
Market Recap: Improvement in the U.S. economy helped lift equity benchmarks to double-digit gains for the year ending January 31, 2013, overcoming moments of volatility driven by sovereign debt woes in Europe, slower economic growth in China and gridlock in Congress. Major U.S. benchmarks hit multiyear highs during the period, encouraged by a rebounding domestic housing market and solid corporate earnings reports. The broad-based S&P 500® Index rose 16.78% for the year, crossing the milestone 1,500 mark near period end. The technology-heavy Nasdaq Composite Index® added 13.13%, and the blue-chip-laden Dow Jones Industrial AverageSM gained 12.75%. Early in the period, stocks rose on positive U.S. economic news and proposed bailouts in Europe. Although fear resurfaced in April and May, equities rebounded in June on central bank stimulus and new life in the housing market. In September, pre-election jitters and the looming "fiscal cliff" of tax hikes and federal spending cuts fueled some profit-taking, followed by a brief post-election sell-off. But stocks proved resilient, as investors continued to pile into riskier assets. Gains were broad-based, with eight of the 10 sectors in the S&P 500® posting double-digit returns. Despite eurozone turmoil, foreign developed-markets stocks rose strongly, with the MSCI® EAFE® Index adding 17.41%.
Comments from Bruce Dirks, Group Leader of Fidelity's Stock Selector Large Cap Value Team, which manages Fidelity Advisor® Stock Selector Large Cap Value Fund: For the year, the fund's Institutional Class shares returned 18.42%, trailing the 20.58% gain of the Russell 1000® Value Index. Unfavorable security selection and industry positioning in information technology, weak stock picking in telecommunication services and energy, and underweighting diversified financials were the primary reasons the fund lagged the index. On the plus side, stock choices in materials, utilities and industrials aided relative performance. The biggest relative detractors included: NII Holdings, which provides mobile communications services for business customers in Latin America under the Nextel brand name; technology manufacturer Hewlett-Packard; not holding index component and diversified financial services giant Bank of America; and semiconductor maker Marvell Technology Group. The top individual contributors were an out-of-benchmark position in GEO Group, which manages correctional, detention, mental health and residential treatment facilities, Puerto Rico-based bank holding company Popular and oil refiner Marathon Petroleum. GEO Group was sold from the fund during the period.
The views expressed above reflect those of the portfolio manager(s) only through the end of the period as stated on the cover of this report and do not necessarily represent the views of Fidelity or any other person in the Fidelity organization. Any such views are subject to change at any time based upon market or other conditions and Fidelity disclaims any responsibility to update such views. These views may not be relied on as investment advice and, because investment decisions for a Fidelity fund are based on numerous factors, may not be relied on as an indication of trading intent on behalf of any Fidelity fund.
Annual Report
Shareholder Expense Example
As a shareholder of the Fund, you incur two types of costs: (1) transaction costs, including sales charges (loads) on purchase payments or redemption proceeds, and (2) ongoing costs, including management fees, distribution and/or service (12b-1) fees and other Fund expenses. This Example is intended to help you understand your ongoing costs (in dollars) of investing in the Fund and to compare these costs with the ongoing costs of investing in other mutual funds.
The Example is based on an investment of $1,000 invested at the beginning of the period and held for the entire period (August 1, 2012 to January 31, 2013).
Actual Expenses
The first line of the accompanying table for each class of the Fund provides information about actual account values and actual expenses. You may use the information in this line, together with the amount you invested, to estimate the expenses that you paid over the period. Simply divide your account value by $1,000.00 (for example, an $8,600 account value divided by $1,000.00 = 8.6), then multiply the result by the number in the first line for a class of the Fund under the heading entitled "Expenses Paid During Period" to estimate the expenses you paid on your account during this period. A small balance maintenance fee of $12.00 that is charged once a year may apply for certain accounts with a value of less than $2,000. This fee is not included in the table below. If it was, the estimate of expenses you paid during the period would be higher, and your ending account value lower, by this amount. In addition, the Fund, as a shareholder in the underlying Fidelity Central Funds, will indirectly bear its pro-rata share of the fees and expenses incurred by the underlying Fidelity Central Funds. These fees and expenses are not included in the Fund's annualized expense ratio used to calculate the expense estimate in the table below.
Hypothetical Example for Comparison Purposes
The second line of the accompanying table for each class of the Fund provides information about hypothetical account values and hypothetical expenses based on a Class' actual expense ratio and an assumed rate of return of 5% per year before expenses, which is not the Class' actual return. The hypothetical account values and expenses may not be used to estimate the actual ending account balance or expenses you paid for the period. You may use this information to compare the ongoing costs of investing in the Fund and other funds. To do so, compare this 5% hypothetical example with the 5% hypothetical examples that appear in the shareholder reports of the other funds. A small balance maintenance fee of $12.00 that is charged once a year may apply for certain accounts with a value of less than $2,000. This fee is not included in the table below. If it was, the estimate of expenses you paid during the period would be higher, and your ending account value lower, by this amount. In addition, the Fund, as a shareholder in the underlying Fidelity Central Funds, will indirectly bear its pro-rata share of the fees and expenses incurred by the underlying Fidelity Central Funds. These fees and expenses are not included in the Fund's annualized expense ratio used to calculate the expense estimate in the table below.
Please note that the expenses shown in the table are meant to highlight your ongoing costs only and do not reflect any transaction costs. Therefore, the second line of the table is useful in comparing ongoing costs only, and will not help you determine the relative total costs of owning different funds. In addition, if these transactional costs were included, your costs would have been higher.
Annual Report
| Annualized
Expense Ratio | Beginning
Account Value
August 1, 2012 | Ending
Account Value
January 31, 2013 | Expenses Paid
During Period*
August 1, 2012
to January 31, 2013 |
Class A | .88% | | | |
Actual | | $ 1,000.00 | $ 1,140.00 | $ 4.73 |
HypotheticalA | | $ 1,000.00 | $ 1,020.71 | $ 4.47 |
Class T | 1.15% | | | |
Actual | | $ 1,000.00 | $ 1,138.40 | $ 6.18 |
HypotheticalA | | $ 1,000.00 | $ 1,019.36 | $ 5.84 |
Class B | 1.64% | | | |
Actual | | $ 1,000.00 | $ 1,136.40 | $ 8.81 |
HypotheticalA | | $ 1,000.00 | $ 1,016.89 | $ 8.31 |
Class C | 1.64% | | | |
Actual | | $ 1,000.00 | $ 1,135.70 | $ 8.80 |
HypotheticalA | | $ 1,000.00 | $ 1,016.89 | $ 8.31 |
Stock Selector Large Cap Value | .58% | | | |
Actual | | $ 1,000.00 | $ 1,142.10 | $ 3.12 |
HypotheticalA | | $ 1,000.00 | $ 1,022.22 | $ 2.95 |
Institutional Class | .61% | | | |
Actual | | $ 1,000.00 | $ 1,141.70 | $ 3.28 |
HypotheticalA | | $ 1,000.00 | $ 1,022.07 | $ 3.10 |
A 5% return per year before expenses
* Expenses are equal to each Class' annualized expense ratio, multiplied by the average account value over the period, multiplied by 184/366 (to reflect the one-half year period).
Annual Report
Investment Changes (Unaudited)
Top Ten Stocks as of January 31, 2013 |
| % of fund's
net assets | % of fund's net assets
6 months ago |
General Electric Co. | 3.2 | 3.2 |
Berkshire Hathaway, Inc. Class B | 2.9 | 3.0 |
Wells Fargo & Co. | 2.9 | 3.3 |
Occidental Petroleum Corp. | 2.5 | 2.4 |
Merck & Co., Inc. | 2.4 | 2.2 |
Johnson & Johnson | 2.3 | 2.2 |
Kennedy-Wilson Holdings, Inc. | 2.2 | 2.2 |
Exxon Mobil Corp. | 2.0 | 0.0 |
Pfizer, Inc. | 2.0 | 2.9 |
Suncor Energy, Inc. | 1.6 | 1.8 |
| 24.0 | |
Top Five Market Sectors as of January 31, 2013 |
| % of fund's
net assets | % of fund's net assets
6 months ago |
Financials | 25.8 | 25.7 |
Energy | 16.3 | 16.9 |
Health Care | 11.1 | 11.1 |
Industrials | 10.1 | 8.7 |
Consumer Discretionary | 7.3 | 7.2 |
Asset Allocation (% of fund's net assets) |
As of January 31, 2013* | As of July 31, 2012** |
| Stocks and Equity
Futures 99.9% | | | Stocks and Equity
Futures 99.6% | |
| Short-Term
Investments and
Net Other Assets (Liabilities) 0.1% | | | Short-Term
Investments and
Net Other Assets (Liabilities) 0.4% | |
* Foreign investments | 13.6% | | ** Foreign investments | 13.1% | |

Annual Report
Investments January 31, 2013
Showing Percentage of Net Assets
Common Stocks - 97.4% |
| Shares | | Value |
CONSUMER DISCRETIONARY - 7.3% |
Auto Components - 0.6% |
Delphi Automotive PLC (a) | 83,200 | | $ 3,216,512 |
Household Durables - 1.2% |
Jarden Corp. | 42,495 | | 2,500,406 |
Whirlpool Corp. | 31,500 | | 3,634,470 |
| | 6,134,876 |
Media - 2.6% |
Comcast Corp. Class A | 142,575 | | 5,429,256 |
News Corp. Class A | 186,900 | | 5,184,606 |
Omnicom Group, Inc. | 44,300 | | 2,404,604 |
| | 13,018,466 |
Multiline Retail - 1.7% |
Macy's, Inc. | 80,450 | | 3,178,580 |
Target Corp. | 83,434 | | 5,040,248 |
| | 8,218,828 |
Specialty Retail - 1.2% |
Lowe's Companies, Inc. | 112,063 | | 4,279,686 |
Staples, Inc. | 115,000 | | 1,550,200 |
| | 5,829,886 |
TOTAL CONSUMER DISCRETIONARY | | 36,418,568 |
CONSUMER STAPLES - 7.3% |
Beverages - 1.2% |
Dr. Pepper Snapple Group, Inc. | 58,400 | | 2,632,088 |
Molson Coors Brewing Co. Class B | 72,900 | | 3,293,622 |
| | 5,925,710 |
Food & Staples Retailing - 0.9% |
Walgreen Co. | 114,940 | | 4,593,002 |
Food Products - 2.8% |
Archer Daniels Midland Co. | 92,000 | | 2,624,760 |
ConAgra Foods, Inc. | 92,410 | | 3,020,883 |
Mondelez International, Inc. | 184,790 | | 5,135,314 |
The J.M. Smucker Co. | 35,720 | | 3,165,864 |
| | 13,946,821 |
Household Products - 1.9% |
Procter & Gamble Co. | 91,880 | | 6,905,701 |
Reckitt Benckiser Group PLC | 41,400 | | 2,759,050 |
| | 9,664,751 |
Common Stocks - continued |
| Shares | | Value |
CONSUMER STAPLES - continued |
Tobacco - 0.5% |
Lorillard, Inc. | 57,500 | | $ 2,246,525 |
TOTAL CONSUMER STAPLES | | 36,376,809 |
ENERGY - 16.3% |
Energy Equipment & Services - 1.6% |
Cameron International Corp. (a) | 60,200 | | 3,811,262 |
National Oilwell Varco, Inc. | 58,400 | | 4,329,776 |
| | 8,141,038 |
Oil, Gas & Consumable Fuels - 14.7% |
Anadarko Petroleum Corp. | 96,720 | | 7,739,534 |
BP PLC sponsored ADR | 126,423 | | 5,628,352 |
Canadian Natural Resources Ltd. | 213,400 | | 6,444,363 |
Exxon Mobil Corp. | 113,300 | | 10,193,601 |
Marathon Petroleum Corp. | 63,800 | | 4,734,598 |
Noble Energy, Inc. | 39,680 | | 4,277,107 |
Occidental Petroleum Corp. | 138,978 | | 12,267,588 |
Phillips 66 | 33,100 | | 2,004,867 |
Royal Dutch Shell PLC Class A sponsored ADR | 109,957 | | 7,754,168 |
Suncor Energy, Inc. | 240,100 | | 8,160,608 |
The Williams Companies, Inc. | 115,898 | | 4,062,225 |
| | 73,267,011 |
TOTAL ENERGY | | 81,408,049 |
FINANCIALS - 25.8% |
Capital Markets - 4.0% |
Bank of New York Mellon Corp. | 198,000 | | 5,377,680 |
Invesco Ltd. | 165,800 | | 4,518,050 |
Morgan Stanley | 153,700 | | 3,512,045 |
State Street Corp. | 97,000 | | 5,398,050 |
SWS Group, Inc. (a) | 196,000 | | 1,291,640 |
| | 20,097,465 |
Commercial Banks - 8.5% |
CIT Group, Inc. (a) | 95,900 | | 4,061,365 |
First Citizen Bancshares, Inc. | 18,200 | | 3,173,352 |
First Citizen Bancshares, Inc. (f) | 10,000 | | 1,569,240 |
Itau Unibanco Holding SA sponsored ADR | 197,800 | | 3,408,094 |
PNC Financial Services Group, Inc. | 92,100 | | 5,691,780 |
Popular, Inc. (a) | 193,280 | | 5,187,635 |
Common Stocks - continued |
| Shares | | Value |
FINANCIALS - continued |
Commercial Banks - continued |
U.S. Bancorp | 149,100 | | $ 4,935,210 |
Wells Fargo & Co. | 416,300 | | 14,499,729 |
| | 42,526,405 |
Consumer Finance - 1.1% |
EZCORP, Inc. (non-vtg.) Class A (a) | 44,623 | | 990,631 |
SLM Corp. | 264,500 | | 4,467,405 |
| | 5,458,036 |
Insurance - 8.4% |
ACE Ltd. | 64,500 | | 5,503,785 |
AFLAC, Inc. | 63,450 | | 3,366,657 |
Berkshire Hathaway, Inc. Class B (a) | 150,457 | | 14,583,797 |
Fairfax Financial Holdings Ltd. (sub. vtg.) | 7,500 | | 2,691,999 |
MetLife, Inc. | 107,700 | | 4,021,518 |
National Western Life Insurance Co. Class A | 14,750 | | 2,410,150 |
Old Republic International Corp. | 338,700 | | 3,861,180 |
StanCorp Financial Group, Inc. | 55,000 | | 2,138,950 |
Torchmark Corp. | 58,350 | | 3,250,679 |
| | 41,828,715 |
Real Estate Investment Trusts - 1.2% |
American Tower Corp. | 34,200 | | 2,604,330 |
Boston Properties, Inc. | 27,400 | | 2,884,672 |
Equity Lifestyle Properties, Inc. | 7,500 | | 537,000 |
Eurobank Properties Real Estate Investment Co. | 7,000 | | 51,420 |
| | 6,077,422 |
Real Estate Management & Development - 2.4% |
Consolidated-Tomoka Land Co. | 34,900 | | 1,256,051 |
Kennedy-Wilson Holdings, Inc. | 720,800 | | 10,804,792 |
| | 12,060,843 |
Thrifts & Mortgage Finance - 0.2% |
People's United Financial, Inc. | 82,300 | | 1,013,113 |
TOTAL FINANCIALS | | 129,061,999 |
HEALTH CARE - 11.1% |
Health Care Equipment & Supplies - 0.6% |
Alere, Inc. (a) | 6,650 | | 141,379 |
Baxter International, Inc. | 7,800 | | 529,152 |
Covidien PLC | 18,000 | | 1,122,120 |
Common Stocks - continued |
| Shares | | Value |
HEALTH CARE - continued |
Health Care Equipment & Supplies - continued |
St. Jude Medical, Inc. | 17,900 | | $ 728,530 |
Teleflex, Inc. | 6,200 | | 465,000 |
| | 2,986,181 |
Health Care Providers & Services - 2.2% |
Quest Diagnostics, Inc. | 19,300 | | 1,118,435 |
UnitedHealth Group, Inc. | 110,900 | | 6,122,789 |
WellPoint, Inc. | 55,801 | | 3,617,021 |
| | 10,858,245 |
Health Care Technology - 0.1% |
Allscripts Healthcare Solutions, Inc. (a) | 61,700 | | 683,636 |
Life Sciences Tools & Services - 0.7% |
QIAGEN NV (a) | 29,000 | | 609,000 |
Thermo Fisher Scientific, Inc. | 38,742 | | 2,794,848 |
| | 3,403,848 |
Pharmaceuticals - 7.5% |
AbbVie, Inc. | 29,700 | | 1,089,693 |
Eli Lilly & Co. | 18,400 | | 987,896 |
Endo Pharmaceuticals Holdings, Inc. (a) | 24,900 | | 788,334 |
Jazz Pharmaceuticals PLC (a) | 9,800 | | 552,622 |
Johnson & Johnson | 154,800 | | 11,442,816 |
Merck & Co., Inc. | 275,600 | | 11,919,700 |
Pfizer, Inc. | 371,700 | | 10,139,976 |
Warner Chilcott PLC | 40,100 | | 568,217 |
Zoetis, Inc. Class A | 4,300 | | 111,800 |
| | 37,601,054 |
TOTAL HEALTH CARE | | 55,532,964 |
INDUSTRIALS - 10.1% |
Aerospace & Defense - 1.4% |
General Dynamics Corp. | 73,300 | | 4,859,790 |
United Technologies Corp. | 25,800 | | 2,259,306 |
| | 7,119,096 |
Air Freight & Logistics - 0.7% |
FedEx Corp. | 35,800 | | 3,631,910 |
Commercial Services & Supplies - 1.8% |
Corrections Corp. of America | 43,800 | | 1,659,582 |
CyrusOne, Inc. | 69,000 | | 1,460,730 |
Common Stocks - continued |
| Shares | | Value |
INDUSTRIALS - continued |
Commercial Services & Supplies - continued |
Republic Services, Inc. | 81,700 | | $ 2,605,413 |
Waste Management, Inc. | 84,200 | | 3,063,196 |
| | 8,788,921 |
Construction & Engineering - 1.5% |
AECOM Technology Corp. (a) | 205,200 | | 5,246,964 |
Foster Wheeler AG (a) | 85,500 | | 2,232,405 |
| | 7,479,369 |
Industrial Conglomerates - 3.2% |
General Electric Co. | 711,800 | | 15,858,900 |
Machinery - 0.5% |
Stanley Black & Decker, Inc. | 30,917 | | 2,375,353 |
Professional Services - 0.6% |
Towers Watson & Co. | 50,900 | | 3,108,972 |
Road & Rail - 0.4% |
Union Pacific Corp. | 15,300 | | 2,011,338 |
TOTAL INDUSTRIALS | | 50,373,859 |
INFORMATION TECHNOLOGY - 5.7% |
Communications Equipment - 1.5% |
Brocade Communications Systems, Inc. (a) | 165,900 | | 948,948 |
Cisco Systems, Inc. | 314,900 | | 6,477,493 |
| | 7,426,441 |
Computers & Peripherals - 0.9% |
Hewlett-Packard Co. | 271,027 | | 4,474,656 |
Electronic Equipment & Components - 0.9% |
Corning, Inc. | 190,798 | | 2,289,576 |
Jabil Circuit, Inc. | 127,348 | | 2,408,151 |
| | 4,697,727 |
Semiconductors & Semiconductor Equipment - 2.0% |
Broadcom Corp. Class A | 68,500 | | 2,222,825 |
Freescale Semiconductor Holdings I Ltd. (a)(d) | 146,559 | | 2,117,778 |
Intersil Corp. Class A | 253,868 | | 2,195,958 |
Marvell Technology Group Ltd. | 192,164 | | 1,777,517 |
ON Semiconductor Corp. (a) | 213,500 | | 1,675,975 |
| | 9,990,053 |
Common Stocks - continued |
| Shares | | Value |
INFORMATION TECHNOLOGY - continued |
Software - 0.4% |
Symantec Corp. (a) | 97,000 | | $ 2,111,690 |
TOTAL INFORMATION TECHNOLOGY | | 28,700,567 |
MATERIALS - 4.5% |
Chemicals - 3.3% |
Air Products & Chemicals, Inc. | 48,450 | | 4,235,984 |
Ashland, Inc. | 48,300 | | 3,792,033 |
Eastman Chemical Co. | 52,400 | | 3,728,260 |
LyondellBasell Industries NV Class A | 75,220 | | 4,770,452 |
| | 16,526,729 |
Containers & Packaging - 0.8% |
Rock-Tenn Co. Class A | 49,070 | | 3,874,077 |
Metals & Mining - 0.4% |
Freeport-McMoRan Copper & Gold, Inc. | 52,600 | | 1,854,150 |
TOTAL MATERIALS | | 22,254,956 |
TELECOMMUNICATION SERVICES - 2.8% |
Diversified Telecommunication Services - 2.4% |
AT&T, Inc. | 225,800 | | 7,855,582 |
CenturyLink, Inc. | 74,714 | | 3,022,181 |
Frontier Communications Corp. (d) | 236,700 | | 1,081,719 |
| | 11,959,482 |
Wireless Telecommunication Services - 0.4% |
NII Holdings, Inc. (a)(d) | 319,500 | | 2,236,500 |
TOTAL TELECOMMUNICATION SERVICES | | 14,195,982 |
UTILITIES - 6.5% |
Electric Utilities - 4.1% |
Edison International | 94,300 | | 4,544,317 |
Hawaiian Electric Industries, Inc. | 15,100 | | 407,247 |
ITC Holdings Corp. | 41,100 | | 3,329,100 |
NextEra Energy, Inc. | 50,410 | | 3,632,041 |
Northeast Utilities | 128,600 | | 5,237,878 |
OGE Energy Corp. | 55,540 | | 3,260,753 |
| | 20,411,336 |
Common Stocks - continued |
| Shares | | Value |
UTILITIES - continued |
Gas Utilities - 0.4% |
ONEOK, Inc. | 25,100 | | $ 1,179,951 |
Questar Corp. | 29,700 | | 689,931 |
| | 1,869,882 |
Independent Power Producers & Energy Traders - 0.4% |
The AES Corp. | 179,590 | | 1,946,756 |
Multi-Utilities - 1.6% |
NiSource, Inc. | 122,600 | | 3,313,878 |
Sempra Energy | 66,650 | | 5,002,083 |
| | 8,315,961 |
TOTAL UTILITIES | | 32,543,935 |
TOTAL COMMON STOCKS (Cost $456,339,619) |
486,867,688
|
Nonconvertible Preferred Stocks - 0.0% |
| | | |
FINANCIALS - 0.0% |
Real Estate Investment Trusts - 0.0% |
Eagle Hospitality Properties Trust, Inc. 8.25% (a) (Cost $141,235) | 47,000 | |
47
|
U.S. Treasury Obligations - 0.0% |
| Principal Amount | | |
U.S. Treasury Bills, yield at date of purchase 0.06% to 0.08% 2/14/13 to 4/18/13 (e)
(Cost $349,985) | | $ 350,000 | |
349,992
|
Money Market Funds - 3.4% |
| Shares | | Value |
Fidelity Cash Central Fund, 0.16% (b) | 14,449,093 | | $ 14,449,093 |
Fidelity Securities Lending Cash Central Fund, 0.15% (b)(c) | 2,495,750 | | 2,495,750 |
TOTAL MONEY MARKET FUNDS (Cost $16,944,843) |
16,944,843
|
TOTAL INVESTMENT PORTFOLIO - 100.8% (Cost $473,775,682) | | 504,162,570 |
NET OTHER ASSETS (LIABILITIES) - (0.8)% | | (4,203,144) |
NET ASSETS - 100% | $ 499,959,426 |
Futures Contracts |
| Expiration Date | | Underlying Face Amount at Value | | Unrealized Appreciation/(Depreciation) |
Purchased |
Equity Index Contracts |
162 ICE Russell 1000 Value Index Contracts | March 2013 | | $ 12,315,240 | | $ 329,222 |
|
The face value of futures purchased as a percentage of net assets is 2.5% |
Legend |
(a) Non-income producing |
(b) Affiliated fund that is available only to investment companies and other accounts managed by Fidelity Investments. The rate quoted is the annualized seven-day yield of the fund at period end. A complete unaudited listing of the fund's holdings as of its most recent quarter end is available upon request. In addition, each Fidelity Central Fund's financial statements, which are not covered by the Fund's Report of Independent Registered Public Accounting Firm, are available on the SEC's website or upon request. |
(c) Investment made with cash collateral received from securities on loan. |
(d) Security or a portion of the security is on loan at period end. |
(e) Security or a portion of the security was pledged to cover margin requirements for futures contracts. At the period end, the value of securities pledged amounted to $349,992. |
(f) Restricted securities - Investment in securities not registered under the Securities Act of 1933 (excluding 144A issues). At the end of the period, the value of restricted securities (excluding 144A issues) amounted to $1,569,240 or 0.3% of net assets. |
Additional information on each restricted holding is as follows: |
Security | Acquisition Date | Acquisition Cost |
First Citizen Bancshares, Inc. | 12/21/12 | $ 1,400,000 |
Affiliated Central Funds |
Information regarding fiscal year to date income earned by the Fund from investments in Fidelity Central Funds is as follows: |
Fund | Income earned |
Fidelity Cash Central Fund | $ 14,628 |
Fidelity Securities Lending Cash Central Fund | 83,364 |
Total | $ 97,992 |
Other Information |
The following is a summary of the inputs used, as of January 31, 2013, involving the Fund's assets and liabilities carried at fair value. The inputs or methodology used for valuing securities may not be an indication of the risk associated with investing in those securities. For more information on valuation inputs, and their aggregation into the levels used in the table below, please refer to the Investment Valuation section in the accompanying Notes to Financial Statements. |
Valuation Inputs at Reporting Date: |
Description | Total | Level 1 | Level 2 | Level 3 |
Investments in Securities: | | | | |
Equities: | | | | |
Consumer Discretionary | $ 36,418,568 | $ 36,418,568 | $ - | $ - |
Consumer Staples | 36,376,809 | 36,376,809 | - | - |
Energy | 81,408,049 | 81,408,049 | - | - |
Financials | 129,062,046 | 127,492,806 | 1,569,240 | - |
Health Care | 55,532,964 | 55,532,964 | - | - |
Industrials | 50,373,859 | 50,373,859 | - | - |
Information Technology | 28,700,567 | 28,700,567 | - | - |
Valuation Inputs at Reporting Date: |
Description | Total | Level 1 | Level 2 | Level 3 |
Investments in Securities: | | | | |
Equities: | | | | |
Materials | $ 22,254,956 | $ 22,254,956 | $ - | $ - |
Telecommunication Services | 14,195,982 | 14,195,982 | - | - |
Utilities | 32,543,935 | 32,543,935 | - | - |
U.S. Government and Government Agency Obligations | 349,992 | - | 349,992 | - |
Money Market Funds | 16,944,843 | 16,944,843 | - | - |
Total Investments in Securities: | $ 504,162,570 | $ 502,243,338 | $ 1,919,232 | $ - |
Derivative Instruments: | | | | |
Assets | | | | |
Futures Contracts | $ 329,222 | $ 329,222 | $ - | $ - |
Value of Derivative Instruments |
The following table is a summary of the Fund's value of derivative instruments by primary risk exposure as of January 31, 2013. For additional information on derivative instruments, please refer to the Derivative Instruments section in the accompanying Notes to Financial Statements. |
Primary Risk Exposure /
Derivative Type | Value |
| Asset | Liability |
Equity Risk | | |
Futures Contracts (a) | $ 329,222 | $ - |
Total Value of Derivatives | $ 329,222 | $ - |
(a) Reflects cumulative appreciation/(depreciation) on futures contracts as disclosed on the Schedule of Investments. Only the period end variation margin is separately disclosed on the Statement of Assets and Liabilities. |
Distribution of investments by country or territory of incorporation, as a percentage of total net assets, is as follows. (Unaudited) |
United States of America | 86.4% |
Canada | 3.4% |
United Kingdom | 3.2% |
Bermuda | 1.7% |
Switzerland | 1.5% |
Netherlands | 1.1% |
Puerto Rico | 1.0% |
Others (Individually Less Than 1%) | 1.7% |
| 100.0% |
See accompanying notes which are an integral part of the financial statements.
Annual Report
Statement of Assets and Liabilities
| January 31, 2013 |
| | |
Assets | | |
Investment in securities, at value (including securities loaned of $2,427,252) - See accompanying schedule: Unaffiliated issuers (cost $456,830,839) | $ 487,217,727 | |
Fidelity Central Funds (cost $16,944,843) | 16,944,843 | |
Total Investments (cost $473,775,682) | | $ 504,162,570 |
Cash | | 80,975 |
Receivable for investments sold | | 11,296,000 |
Receivable for fund shares sold | | 704,709 |
Dividends receivable | | 576,214 |
Distributions receivable from Fidelity Central Funds | | 9,803 |
Prepaid expenses | | 953 |
Other receivables | | 66,048 |
Total assets | | 516,897,272 |
| | |
Liabilities | | |
Payable for investments purchased | $ 12,573,953 | |
Payable for fund shares redeemed | 1,551,844 | |
Accrued management fee | 122,882 | |
Distribution and service plan fees payable | 12,492 | |
Payable for daily variation margin on futures contracts | 17,820 | |
Other affiliated payables | 111,610 | |
Other payables and accrued expenses | 51,495 | |
Collateral on securities loaned, at value | 2,495,750 | |
Total liabilities | | 16,937,846 |
| | |
Net Assets | | $ 499,959,426 |
Net Assets consist of: | | |
Paid in capital | | $ 819,564,735 |
Undistributed net investment income | | 393,853 |
Accumulated undistributed net realized gain (loss) on investments and foreign currency transactions | | (350,714,578) |
Net unrealized appreciation (depreciation) on investments and assets and liabilities in foreign currencies | | 30,715,416 |
Net Assets | | $ 499,959,426 |
See accompanying notes which are an integral part of the financial statements.
Annual Report
Financial Statements - continued
Statement of Assets and Liabilities - continued
| January 31, 2013 |
| | |
Calculation of Maximum Offering Price Class A:
Net Asset Value and redemption price per share ($18,234,003 ÷ 1,466,542 shares) | | $ 12.43 |
| | |
Maximum offering price per share (100/94.25 of $12.43) | | $ 13.19 |
Class T:
Net Asset Value and redemption price per share ($6,544,090 ÷ 526,045 shares) | | $ 12.44 |
| | |
Maximum offering price per share (100/96.50 of $12.44) | | $ 12.89 |
Class B:
Net Asset Value and offering price per share ($1,645,104 ÷ 132,267 shares)A | | $ 12.44 |
| | |
Class C:
Net Asset Value and offering price per share ($5,838,546 ÷ 474,748 shares)A | | $ 12.30 |
| | |
| | |
Stock Selector Large Cap Value:
Net Asset Value, offering price and redemption price per share ($465,702,312 ÷ 37,229,744 shares) | | $ 12.51 |
| | |
Institutional Class:
Net Asset Value, offering price and redemption price per share ($1,995,371 ÷ 160,151 shares) | | $ 12.46 |
A Redemption price per share is equal to net asset value less any applicable contingent deferred sales charge.
See accompanying notes which are an integral part of the financial statements.
Annual Report
Statement of Operations
| Year ended January 31, 2013 |
| | |
Investment Income | | |
Dividends | | $ 12,667,163 |
Interest | | 322 |
Income from Fidelity Central Funds | | 97,992 |
Total income | | 12,765,477 |
| | |
Expenses | | |
Management fee
Basic fee | $ 2,743,221 | |
Performance adjustment | (1,495,660) | |
Transfer agent fees | 1,224,930 | |
Distribution and service plan fees | 140,831 | |
Accounting and security lending fees | 191,707 | |
Custodian fees and expenses | 29,588 | |
Independent trustees' compensation | 3,240 | |
Registration fees | 78,048 | |
Audit | 55,888 | |
Legal | 2,369 | |
Miscellaneous | 5,245 | |
Total expenses before reductions | 2,979,407 | |
Expense reductions | (130,264) | 2,849,143 |
Net investment income (loss) | | 9,916,334 |
Realized and Unrealized Gain (Loss) Net realized gain (loss) on: | | |
Investment securities: | | |
Unaffiliated issuers | 28,785,348 | |
Foreign currency transactions | 30,679 | |
Futures contracts | 853,784 | |
Total net realized gain (loss) | | 29,669,811 |
Change in net unrealized appreciation (depreciation) on: Investment securities | 43,634,270 | |
Assets and liabilities in foreign currencies | (694) | |
Futures contracts | 326,645 | |
Total change in net unrealized appreciation (depreciation) | | 43,960,221 |
Net gain (loss) | | 73,630,032 |
Net increase (decrease) in net assets resulting from operations | | $ 83,546,366 |
See accompanying notes which are an integral part of the financial statements.
Annual Report
Financial Statements - continued
Statement of Changes in Net Assets
| Year ended
January 31,
2013 | Year ended
January 31,
2012 |
Increase (Decrease) in Net Assets | | |
Operations | | |
Net investment income (loss) | $ 9,916,334 | $ 10,198,233 |
Net realized gain (loss) | 29,669,811 | 82,077,771 |
Change in net unrealized appreciation (depreciation) | 43,960,221 | (80,818,055) |
Net increase (decrease) in net assets resulting
from operations | 83,546,366 | 11,457,949 |
Distributions to shareholders from net investment income | (9,512,706) | (10,179,715) |
Share transactions - net increase (decrease) | (89,844,793) | (323,065,032) |
Total increase (decrease) in net assets | (15,811,133) | (321,786,798) |
| | |
Net Assets | | |
Beginning of period | 515,770,559 | 837,557,357 |
End of period (including undistributed net investment income of $393,853 and distributions in excess of net investment income of $41,141, respectively) | $ 499,959,426 | $ 515,770,559 |
See accompanying notes which are an integral part of the financial statements.
Annual Report
Financial Highlights - Class A
Years ended January 31, | 2013 | 2012 | 2011 | 2010 | 2009 |
Selected Per-Share Data | | | | | |
Net asset value, beginning of period | $ 10.71 | $ 10.72 | $ 9.35 | $ 7.53 | $ 13.54 |
Income from Investment Operations | | | | | |
Net investment income (loss) C | .20 | .14 | .09 | .09 | .16 |
Net realized and unrealized gain (loss) | 1.73 | .02 | 1.38 | 1.85 | (6.00) |
Total from investment operations | 1.93 | .16 | 1.47 | 1.94 | (5.84) |
Distributions from net investment income | (.21) | (.17) | (.10) | (.12) | (.17) |
Net asset value, end of period | $ 12.43 | $ 10.71 | $ 10.72 | $ 9.35 | $ 7.53 |
Total Return A, B | 18.15% | 1.58% | 15.79% | 25.74% | (43.20)% |
Ratios to Average Net Assets D, F | | | | | |
Expenses before reductions | .87% | .87% | 1.00% | 1.15% | 1.17% |
Expenses net of fee waivers, if any | .87% | .87% | 1.00% | 1.15% | 1.17% |
Expenses net of all reductions | .85% | .86% | 1.00% | 1.13% | 1.17% |
Net investment income (loss) | 1.74% | 1.38% | .87% | 1.08% | 1.47% |
Supplemental Data | | | | | |
Net assets, end of period (000 omitted) | $ 18,234 | $ 18,900 | $ 20,815 | $ 23,778 | $ 22,577 |
Portfolio turnover rate E | 63% | 128% | 120% | 171% | 243% |
A Total returns would have been lower if certain expenses had not been reduced during the applicable periods shown.
B Total returns do not include the effect of the sales charges.
C Calculated based on average shares outstanding during the period.
D Fees and expenses of any underlying Fidelity Central Funds are not included in the Fund's expense ratio. The Fund indirectly bears its proportionate share of the expenses of any underlying Fidelity Central Funds.
E Amount does not include the portfolio activity of any underlying Fidelity Central Funds.
F Expense ratios reflect operating expenses of the class. Expenses before reductions do not reflect amounts reimbursed by the investment adviser or reductions from brokerage service arrangements or reductions from other expense offset arrangements and do not represent the amount paid by the class during periods when reimbursements or reductions occur. Expenses net of fee waivers reflect expenses after reimbursement by the investment adviser but prior to reductions from brokerage service arrangements or other expense offset arrangements. Expenses net of all reductions represent the net expenses paid by the class.
See accompanying notes which are an integral part of the financial statements.
Annual Report
Financial Highlights - Class T
Years ended January 31, | 2013 | 2012 | 2011 | 2010 | 2009 |
Selected Per-Share Data | | | | | |
Net asset value, beginning of period | $ 10.72 | $ 10.74 | $ 9.36 | $ 7.54 | $ 13.53 |
Income from Investment Operations | | | | | |
Net investment income (loss) C | .17 | .12 | .06 | .07 | .12 |
Net realized and unrealized gain (loss) | 1.73 | .01 | 1.39 | 1.84 | (5.97) |
Total from investment operations | 1.90 | .13 | 1.45 | 1.91 | (5.85) |
Distributions from net investment income | (.18) | (.15) | (.07) | (.09) | (.14) |
Net asset value, end of period | $ 12.44 | $ 10.72 | $ 10.74 | $ 9.36 | $ 7.54 |
Total Return A, B | 17.88% | 1.26% | 15.50% | 25.30% | (43.34)% |
Ratios to Average Net Assets D, F | | | | | |
Expenses before reductions | 1.14% | 1.14% | 1.29% | 1.45% | 1.49% |
Expenses net of fee waivers, if any | 1.14% | 1.14% | 1.29% | 1.45% | 1.49% |
Expenses net of all reductions | 1.12% | 1.13% | 1.28% | 1.44% | 1.49% |
Net investment income (loss) | 1.48% | 1.11% | .59% | .78% | 1.15% |
Supplemental Data | | | | | |
Net assets, end of period (000 omitted) | $ 6,544 | $ 5,603 | $ 5,625 | $ 9,101 | $ 9,792 |
Portfolio turnover rate E | 63% | 128% | 120% | 171% | 243% |
A Total returns would have been lower if certain expenses had not been reduced during the applicable periods shown.
B Total returns do not include the effect of the sales charges.
C Calculated based on average shares outstanding during the period.
D Fees and expenses of any underlying Fidelity Central Funds are not included in the Fund's expense ratio. The Fund indirectly bears its proportionate share of the expenses of any underlying Fidelity Central Funds.
E Amount does not include the portfolio activity of any underlying Fidelity Central Funds.
F Expense ratios reflect operating expenses of the class. Expenses before reductions do not reflect amounts reimbursed by the investment adviser or reductions from brokerage service arrangements or reductions from other expense offset arrangements and do not represent the amount paid by the class during periods when reimbursements or reductions occur. Expenses net of fee waivers reflect expenses after reimbursement by the investment adviser but prior to reductions from brokerage service arrangements or other expense offset arrangements. Expenses net of all reductions represent the net expenses paid by the class.
See accompanying notes which are an integral part of the financial statements.
Annual Report
Financial Highlights - Class B
Years ended January 31, | 2013 | 2012 | 2011 | 2010 | 2009 |
Selected Per-Share Data | | | | | |
Net asset value, beginning of period | $ 10.72 | $ 10.72 | $ 9.35 | $ 7.53 | $ 13.54 |
Income from Investment Operations | | | | | |
Net investment income (loss) C | .11 | .07 | .01 | .02 | .07 |
Net realized and unrealized gain (loss) | 1.73 | .02 | 1.38 | 1.85 | (5.98) |
Total from investment operations | 1.84 | .09 | 1.39 | 1.87 | (5.91) |
Distributions from net investment income | (.12) | (.09) | (.02) | (.05) | (.10) |
Net asset value, end of period | $ 12.44 | $ 10.72 | $ 10.72 | $ 9.35 | $ 7.53 |
Total Return A, B | 17.24% | .86% | 14.87% | 24.79% | (43.71)% |
Ratios to Average Net Assets D, F | | | | | |
Expenses before reductions | 1.63% | 1.62% | 1.80% | 1.98% | 2.07% |
Expenses net of fee waivers, if any | 1.63% | 1.62% | 1.80% | 1.98% | 2.00% |
Expenses net of all reductions | 1.60% | 1.62% | 1.79% | 1.97% | 2.00% |
Net investment income (loss) | .99% | .63% | .08% | .24% | .64% |
Supplemental Data | | | | | |
Net assets, end of period (000 omitted) | $ 1,645 | $ 1,819 | $ 2,274 | $ 2,711 | $ 2,600 |
Portfolio turnover rate E | 63% | 128% | 120% | 171% | 243% |
A Total returns would have been lower if certain expenses had not been reduced during the applicable periods shown.
B Total returns do not include the effect of the contingent deferred sales charge.
C Calculated based on average shares outstanding during the period.
D Fees and expenses of any underlying Fidelity Central Funds are not included in the Fund's expense ratio. The Fund indirectly bears its proportionate share of the expenses of any underlying Fidelity Central Funds.
E Amount does not include the portfolio activity of any underlying Fidelity Central Funds.
F Expense ratios reflect operating expenses of the class. Expenses before reductions do not reflect amounts reimbursed by the investment adviser or reductions from brokerage service arrangements or reductions from other expense offset arrangements and do not represent the amount paid by the class during periods when reimbursements or reductions occur. Expenses net of fee waivers reflect expenses after reimbursement by the investment adviser but prior to reductions from brokerage service arrangements or other expense offset arrangements. Expenses net of all reductions represent the net expenses paid by the class.
See accompanying notes which are an integral part of the financial statements.
Annual Report
Financial Highlights - Class C
Years ended January 31, | 2013 | 2012 | 2011 | 2010 | 2009 |
Selected Per-Share Data | | | | | |
Net asset value, beginning of period | $ 10.61 | $ 10.63 | $ 9.30 | $ 7.49 | $ 13.52 |
Income from Investment Operations | | | | | |
Net investment income (loss) C | .11 | .07 | .01 | .03 | .08 |
Net realized and unrealized gain (loss) | 1.72 | .01 | 1.36 | 1.84 | (5.97) |
Total from investment operations | 1.83 | .08 | 1.37 | 1.87 | (5.89) |
Distributions from net investment income | (.14) | (.10) | (.04) | (.06) | (.14) |
Net asset value, end of period | $ 12.30 | $ 10.61 | $ 10.63 | $ 9.30 | $ 7.49 |
Total Return A, B | 17.32% | .85% | 14.79% | 24.97% | (43.65)% |
Ratios to Average Net Assets D, F | | | | | |
Expenses before reductions | 1.63% | 1.62% | 1.75% | 1.89% | 1.91% |
Expenses net of fee waivers, if any | 1.63% | 1.62% | 1.75% | 1.89% | 1.91% |
Expenses net of all reductions | 1.61% | 1.61% | 1.74% | 1.88% | 1.91% |
Net investment income (loss) | .99% | .63% | .13% | .34% | .73% |
Supplemental Data | | | | | |
Net assets, end of period (000 omitted) | $ 5,839 | $ 4,979 | $ 3,959 | $ 3,491 | $ 2,352 |
Portfolio turnover rate E | 63% | 128% | 120% | 171% | 243% |
A Total returns would have been lower if certain expenses had not been reduced during the applicable periods shown.
B Total returns do not include the effect of the contingent deferred sales charge.
C Calculated based on average shares outstanding during the period.
D Fees and expenses of any underlying Fidelity Central Funds are not included in the Fund's expense ratio. The Fund indirectly bears its proportionate share of the expenses of any underlying Fidelity Central Funds.
E Amount does not include the portfolio activity of any underlying Fidelity Central Funds.
F Expense ratios reflect operating expenses of the class. Expenses before reductions do not reflect amounts reimbursed by the investment adviser or reductions from brokerage service arrangements or reductions from other expense offset arrangements and do not represent the amount paid by the class during periods when reimbursements or reductions occur. Expenses net of fee waivers reflect expenses after reimbursement by the investment adviser but prior to reductions from brokerage service arrangements or other expense offset arrangements. Expenses net of all reductions represent the net expenses paid by the class.
See accompanying notes which are an integral part of the financial statements.
Annual Report
Financial Highlights - Stock Selector Large Cap Value
Years ended January 31, | 2013 | 2012 | 2011 | 2010 | 2009 |
Selected Per-Share Data | | | | | |
Net asset value, beginning of period | $ 10.77 | $ 10.78 | $ 9.40 | $ 7.56 | $ 13.57 |
Income from Investment Operations | | | | | |
Net investment income (loss) B | .23 | .18 | .11 | .12 | .20 |
Net realized and unrealized gain (loss) | 1.75 | .01 | 1.40 | 1.86 | (6.02) |
Total from investment operations | 1.98 | .19 | 1.51 | 1.98 | (5.82) |
Distributions from net investment income | (.24) | (.20) | (.13) | (.14) | (.19) |
Net asset value, end of period | $ 12.51 | $ 10.77 | $ 10.78 | $ 9.40 | $ 7.56 |
Total Return A | 18.55% | 1.85% | 16.09% | 26.21% | (43.03)% |
Ratios to Average Net Assets C, E | | | | | |
Expenses before reductions | .57% | .57% | .73% | .85% | .86% |
Expenses net of fee waivers, if any | .57% | .57% | .73% | .85% | .86% |
Expenses net of all reductions | .55% | .56% | .72% | .84% | .86% |
Net investment income (loss) | 2.05% | 1.68% | 1.15% | 1.38% | 1.78% |
Supplemental Data | | | | | |
Net assets, end of period (000 omitted) | $ 465,702 | $ 482,950 | $ 803,009 | $ 914,828 | $ 916,490 |
Portfolio turnover rate D | 63% | 128% | 120% | 171% | 243% |
A Total returns would have been lower if certain expenses had not been reduced during the applicable periods shown.
B Calculated based on average shares outstanding during the period.
C Fees and expenses of any underlying Fidelity Central Funds are not included in the Fund's expense ratio. The Fund indirectly bears its proportionate share of the expenses of any underlying Fidelity Central Funds.
D Amount does not include the portfolio activity of any underlying Fidelity Central Funds.
E Expense ratios reflect operating expenses of the class. Expenses before reductions do not reflect amounts reimbursed by the investment adviser or reductions from brokerage service arrangements or reductions from other expense offset arrangements and do not represent the amount paid by the class during periods when reimbursements or reductions occur. Expenses net of fee waivers reflect expenses after reimbursement by the investment adviser but prior to reductions from brokerage service arrangements or other expense offset arrangements. Expenses net of all reductions represent the net expenses paid by the class.
See accompanying notes which are an integral part of the financial statements.
Annual Report
Financial Highlights - Institutional Class
Years ended January 31, | 2013 | 2012 | 2011 | 2010 | 2009 |
Selected Per-Share Data | | | | | |
Net asset value, beginning of period | $ 10.74 | $ 10.74 | $ 9.37 | $ 7.54 | $ 13.54 |
Income from Investment Operations | | | | | |
Net investment income (loss) B | .23 | .17 | .11 | .12 | .20 |
Net realized and unrealized gain (loss) | 1.73 | .02 | 1.39 | 1.85 | (6.01) |
Total from investment operations | 1.96 | .19 | 1.50 | 1.97 | (5.81) |
Distributions from net investment income | (.24) | (.19) | (.13) | (.14) | (.19) |
Net asset value, end of period | $ 12.46 | $ 10.74 | $ 10.74 | $ 9.37 | $ 7.54 |
Total Return A | 18.42% | 1.92% | 16.04% | 26.18% | (43.00)% |
Ratios to Average Net Assets C, E | | | | | |
Expenses before reductions | .61% | .60% | .74% | .87% | .85% |
Expenses net of fee waivers, if any | .61% | .60% | .74% | .87% | .85% |
Expenses net of all reductions | .58% | .60% | .73% | .86% | .85% |
Net investment income (loss) | 2.01% | 1.65% | 1.14% | 1.36% | 1.79% |
Supplemental Data | | | | | |
Net assets, end of period (000 omitted) | $ 1,995 | $ 1,519 | $ 1,876 | $ 2,279 | $ 1,304 |
Portfolio turnover rate D | 63% | 128% | 120% | 171% | 243% |
A Total returns would have been lower if certain expenses had not been reduced during the applicable periods shown.
B Calculated based on average shares outstanding during the period.
C Fees and expenses of any underlying Fidelity Central Funds are not included in the Fund's expense ratio. The Fund indirectly bears its proportionate share of the expenses of any underlying Fidelity Central Funds.
D Amount does not include the portfolio activity of any underlying Fidelity Central Funds.
E Expense ratios reflect operating expenses of the class. Expenses before reductions do not reflect amounts reimbursed by the investment adviser or reductions from brokerage service arrangements or reductions from other expense offset arrangements and do not represent the amount paid by the class during periods when reimbursements or reductions occur. Expenses net of fee waivers reflect expenses after reimbursement by the investment adviser but prior to reductions from brokerage service arrangements or other expense offset arrangements. Expenses net of all reductions represent the net expenses paid by the class.
See accompanying notes which are an integral part of the financial statements.
Annual Report
Notes to Financial Statements
For the period ended January 31, 2013
1. Organization.
Fidelity Stock Selector Large Cap Value Fund (the Fund) is a fund of Fidelity Devonshire Trust (the Trust) and is authorized to issue an unlimited number of shares. The Trust is registered under the Investment Company Act of 1940, as amended (the 1940 Act), as an open-end management investment company organized as a Massachusetts business trust. The Fund offers Class A, Class T, Class C, Stock Selector Large Cap Value and Institutional Class shares, each of which, along with Class B shares, has equal rights as to assets and voting privileges. Class B shares are closed to new accounts and additional purchases, except for exchanges and reinvestments. Each class has exclusive voting rights with respect to matters that affect that class. Class B shares will automatically convert to Class A shares after a holding period of seven years from the initial date of purchase. Investment income, realized and unrealized capital gains and losses, the common expenses of the Fund, and certain fund-level expense reductions, if any, are allocated on a pro-rata basis to each class based on the relative net assets of each class to the total net assets of the Fund. Each class differs with respect to transfer agent and distribution and service plan fees incurred. Certain expense reductions may also differ by class.
2. Investments in Fidelity Central Funds.
The Fund invests in Fidelity Central Funds, which are open-end investment companies available only to other investment companies and accounts managed by Fidelity Management & Research Company (FMR) and its affiliates. The Fund's Schedule of Investments lists each of the Fidelity Central Funds held as of period end, if any, as an investment of the Fund, but does not include the underlying holdings of each Fidelity Central Fund. As an Investing Fund, the Fund indirectly bears its proportionate share of the expenses of the underlying Fidelity Central Funds.
The Money Market Central Funds seek preservation of capital and current income and are managed by Fidelity Investments Money Management, Inc. (FIMM), an affiliate of FMR.
A complete unaudited list of holdings for each Fidelity Central Fund is available upon request or at the Securities and Exchange Commission (the SEC) website at www.sec.gov. In addition, the financial statements of the Fidelity Central Funds, which are not covered by the Fund's Report of Independent Registered Public Accounting Firm, are available on the SEC website or upon request.
3. Significant Accounting Policies.
The financial statements have been prepared in conformity with accounting principles generally accepted in the United States of America (GAAP), which require management to make certain estimates and assumptions at the date of the financial statements.
Annual Report
3. Significant Accounting Policies - continued
Actual results could differ from those estimates. Subsequent events, if any, through the date that the financial statements were issued have been evaluated in the preparation of the financial statements. The following summarizes the significant accounting policies of the Fund:
Investment Valuation. Investments are valued as of 4:00 p.m. Eastern time on the last calendar day of the period. In accordance with valuation policies and procedures approved by the Board of Trustees (the Board), the Fund attempts to obtain prices from one or more third party pricing vendors or brokers to value its investments. When current market prices, quotations or currency exchange rates are not readily available or reliable, investments will be fair valued in good faith by the FMR Fair Value Committee (the Committee), in accordance with procedures adopted by the Fund's Board. Factors used in determining fair value vary by investment type and may include market or investment specific events, changes in interest rates and credit quality. The frequency with which these procedures are used cannot be predicted and they may be utilized to a significant extent. The Committee oversees the Fund's valuation policies and procedures and is responsible for approving and reporting to the Board all fair value determinations.
The Fund categorizes the inputs to valuation techniques used to value its investments into a disclosure hierarchy consisting of three levels as shown below:
Level 1 - quoted prices in active markets for identical investments
Level 2 - other significant observable inputs (including quoted prices for similar investments, interest rates, prepayment speeds, etc.)
Level 3 - unobservable inputs (including the Fund's own assumptions based on the best information available)
Valuation techniques used to value the Fund's investments by major category are as follows:
Equity securities, including restricted securities, for which market quotations are readily available, are valued at the last reported sale price or official closing price as reported by a third party pricing vendor on the primary market or exchange on which they are traded and are categorized as Level 1 in the hierarchy. In the event there were no sales during the day or closing prices are not available, securities are valued at the last quoted bid price or may be valued using the last available price and are generally categorized as Level 2 in the hierarchy. For foreign equity securities, when significant market or security specific events arise, comparisons to the valuation of American Depositary Receipts (ADRs), futures contracts, Exchange-Traded Funds (ETFs) and certain indexes as well as quoted prices for similar securities are used and are categorized as Level 2 in the hierarchy. Utilizing these techniques may result in transfers between Level 1 and Level 2.
Annual Report
Notes to Financial Statements - continued
3. Significant Accounting Policies - continued
Investment Valuation - continued
For restricted equity securities and private placements where observable inputs are limited, assumptions about market activity and risk are used and these securities are generally categorized as Level 3 in the hierarchy.
Debt securities, including restricted securities, are valued based on evaluated prices received from third party pricing vendors or from brokers who make markets in such securities. For U.S. government and government agency obligations, pricing vendors utilize matrix pricing which considers yield or price of bonds of comparable quality, coupon, maturity and type as well as broker-supplied prices. When independent prices are unavailable or unreliable, debt securities may be valued utilizing pricing methodologies which consider similar factors that would be used by third party pricing vendors. Debt securities are generally categorized as Level 2 in the hierarchy but may be Level 3 depending on the circumstances.
Futures contracts are valued at the settlement price established each day by the board of trade or exchange on which they are traded and are categorized as Level 1 in the hierarchy. Investments in open-end mutual funds, including the Fidelity Central Funds, are valued at their closing net asset value (NAV) each business day and are categorized as Level 1 in the hierarchy.
Changes in valuation techniques may result in transfers in or out of an assigned level within the disclosure hierarchy. The aggregate value of investments by input level, as of January 31, 2013, is included at the end of the Fund's Schedule of Investments.
Foreign Currency. The Fund may use foreign currency contracts to facilitate transactions in foreign-denominated securities. Gains and losses from these transactions may arise from changes in the value of the foreign currency or if the counterparties do not perform under the contracts' terms.
Foreign-denominated assets, including investment securities, and liabilities are translated into U.S. dollars at the exchange rates at period end. Purchases and sales of investment securities, income and dividends received and expenses denominated in foreign currencies are translated into U.S. dollars at the exchange rate in effect on the transaction date.
The effects of exchange rate fluctuations on investments are included with the net realized and unrealized gain (loss) on investment securities. Other foreign currency transactions resulting in realized and unrealized gain (loss) are disclosed separately.
Investment Transactions and Income. For financial reporting purposes, the Fund's investment holdings and NAV include trades executed through the end of the last business day of the period. The NAV per share for processing shareholder transactions is
Annual Report
3. Significant Accounting Policies - continued
Investment Transactions and Income - continued
calculated as of the close of business of the New York Stock Exchange (NYSE), normally 4:00 p.m. Eastern time and includes trades executed through the end of the prior business day. Gains and losses on securities sold are determined on the basis of identified cost and may include proceeds received from litigation. Dividend income is recorded on the ex-dividend date, except for certain dividends from foreign securities where the ex-dividend date may have passed, which are recorded as soon as the Fund is informed of the ex-dividend date. Non-cash dividends included in dividend income, if any, are recorded at the fair market value of the securities received. Distributions received on securities that represent a return of capital or capital gain are recorded as a reduction of cost of investments and/or as a realized gain. The Fund estimates the components of distributions received that may be considered return of capital distributions or capital gain distributions. Interest income and distributions from the Fidelity Central Funds are accrued as earned. Interest income includes coupon interest and amortization of premium and accretion of discount on debt securities. Investment income is recorded net of foreign taxes withheld where recovery of such taxes is uncertain.
Expenses. Expenses directly attributable to a fund are charged to that fund. Expenses attributable to more than one fund are allocated among the respective funds on the basis of relative net assets or other appropriate methods. Expense estimates are accrued in the period to which they relate and adjustments are made when actual amounts are known.
Income Tax Information and Distributions to Shareholders. Each year, the Fund intends to qualify as a regulated investment company under Subchapter M of the Internal Revenue Code, including distributing substantially all of its taxable income and realized gains. As a result, no provision for income taxes is required. As of January 31, 2013, the Fund did not have any unrecognized tax benefits in the financial statements; nor is the Fund aware of any tax positions for which it is reasonably possible that the total amounts of unrecognized tax benefits will significantly change in the next twelve months. The Fund files a U.S. federal tax return, in addition to state and local tax returns as required. A fund's federal income tax returns are subject to examination by the Internal Revenue Service (IRS) for a period of three fiscal years after they are filed. State and local tax returns may be subject to examination for an additional fiscal year depending on the jurisdiction. Foreign taxes are provided for based on the Fund's understanding of the tax rules and rates that exist in the foreign markets in which it invests.
Distributions are declared and recorded on the ex-dividend date. Income dividends and capital gain distributions are declared separately for each class. Income and capital gain distributions are determined in accordance with income tax regulations, which may differ from GAAP.
Annual Report
Notes to Financial Statements - continued
3. Significant Accounting Policies - continued
Income Tax Information and Distributions to Shareholders - continued
Capital accounts within the financial statements are adjusted for permanent book-tax differences. These adjustments have no impact on net assets or the results of operations. Temporary book-tax differences will reverse in a subsequent period.
Book-tax differences are primarily due to futures contracts, foreign currency transactions, passive foreign investment companies (PFIC), capital loss carryforwards and losses deferred due to wash sales and excise tax regulations.
The federal tax cost of investment securities and unrealized appreciation (depreciation) as of period end were as follows:
Gross unrealized appreciation | $ 60,553,324 |
Gross unrealized depreciation | (36,375,847) |
Net unrealized appreciation (depreciation) on securities and other investments | $ 24,177,477 |
| |
Tax Cost | $ 479,985,093 |
The tax-based components of distributable earnings as of period end were as follows:
Undistributed ordinary income | $ 393,853 |
Capital loss carryforward | $ (344,175,945) |
Net unrealized appreciation (depreciation) | $ 24,506,005 |
Capital loss carryforwards are only available to offset future capital gains of the Fund to the extent provided by regulations and may be limited. Under the Regulated Investment Company Modernization Act of 2010 (the Act), the Fund is permitted to carry forward capital losses incurred in taxable years beginning after December 22, 2010 for an unlimited period and such capital losses are required to be used prior to any losses that expire. Capital loss carryforwards were as follows:
Fiscal year of expiration | |
| |
2017 | $ (156,071,106) |
2018 | (188,104,839) |
Total with expiration | $ (344,175,945) |
The tax character of distributions paid was as follows:
| January 31, 2013 | January 31, 2012 |
Ordinary Income | $ 9,512,706 | $ 10,179,715 |
Annual Report
3. Significant Accounting Policies - continued
Restricted Securities. The Fund may invest in securities that are subject to legal or contractual restrictions on resale. These securities generally may be resold in transactions exempt from registration or to the public if the securities are registered. Disposal of these securities may involve time-consuming negotiations and expense, and prompt sale at an acceptable price may be difficult. Information regarding restricted securities is included at the end of the Fund's Schedule of Investments.
New Accounting Pronouncement. In December 2011, the Financial Accounting Standards Board issued Accounting Standard Update No. 2011-11, Disclosures about Offsetting Assets and Liabilities. The update creates new disclosure requirements requiring entities to disclose both gross and net information for derivatives and other financial instruments that are either offset in the Statement of Assets and Liabilities or subject to an enforceable master netting arrangement or similar agreement. The disclosure requirements are effective for annual reporting periods beginning on or after January 1, 2013, and interim periods within those annual periods. Management is currently evaluating the impact of the update's adoption on the Fund's financial statement disclosures.
4. Derivative Instruments.
Risk Exposures and the Use of Derivative Instruments. The Fund's investment objective allows the Fund to enter into various types of derivative contracts, including futures contracts. Derivatives are investments whose value is primarily derived from underlying assets, indices or reference rates and may be transacted on an exchange or over-the-counter (OTC). Derivatives may involve a future commitment to buy or sell a specified asset based on specified terms, to exchange future cash flows at periodic intervals based on a notional principal amount, or for one party to make one or more payments upon the occurrence of specified events in exchange for periodic payments from the other party.
The Fund used derivatives to increase returns and to manage exposure to certain risks as defined below. The success of any strategy involving derivatives depends on analysis of numerous economic factors, and if the strategies for investment do not work as intended, the Fund may not achieve its objectives.
The Fund's use of derivatives increased or decreased its exposure to the following risk:
Equity Risk | Equity risk relates to the fluctuations in the value of financial instruments as a result of changes in market prices (other than those arising from interest rate risk or foreign exchange risk), whether caused by factors specific to an individual investment, its issuer, or all factors affecting all instruments traded in a market or market segment. |
Annual Report
Notes to Financial Statements - continued
4. Derivative Instruments - continued
Risk Exposures and the Use of Derivative Instruments - continued
The Fund is also exposed to additional risks from investing in derivatives, such as liquidity risk and counterparty credit risk. Liquidity risk is the risk that the Fund will be unable to close out the derivative in the open market in a timely manner. Counterparty credit risk is the risk that the counterparty will not be able to fulfill its obligation to the Fund. Counterparty credit risk related to exchange-traded futures contracts is mitigated by the protection provided by the exchange on which they trade.
Investing in derivatives may involve greater risks than investing in the underlying assets directly and, to varying degrees, may involve risk of loss in excess of any initial investment and collateral received and amounts recognized in the Statement of Assets and Liabilities. In addition, there may be the risk that the change in value of the derivative contract does not correspond to the change in value of the underlying instrument.
Futures Contracts. A futures contract is an agreement between two parties to buy or sell a specified underlying instrument for a fixed price at a specified future date. The Fund used futures contracts to manage its exposure to the stock market.
Upon entering into a futures contract, a fund is required to deposit either cash or securities (initial margin) with a clearing broker in an amount equal to a certain percentage of the face value of the contract. Futures contracts are marked-to-market daily and subsequent payments (variation margin) are made or received by a fund depending on the daily fluctuations in the value of the futures contracts and are recorded as unrealized appreciation or (depreciation). This receivable and/or payable, if any, is included in daily variation margin on futures contracts in the Statement of Assets and Liabilities. Realized gain or (loss) is recorded upon the expiration or closing of a futures contract.
Any open futures contracts at period end are presented in the Schedule of Investments under the caption "Futures Contracts." The underlying face amount at value reflects each contract's exposure to the underlying instrument or index at period end and is representative of activity for the period. Securities deposited to meet initial margin requirements are identified in the Schedule of Investments.
During the period the Fund recognized net realized gain (loss) of $853,784 and a change in net unrealized appreciation (depreciation) of $326,645 related to its investment in futures contracts. These amounts are included in the Statement of Operations.
5. Purchases and Sales of Investments.
Purchases and sales of securities, other than short-term securities, aggregated $304,000,483 and $399,010,186, respectively.
Annual Report
6. Fees and Other Transactions with Affiliates.
Management Fee. FMR and its affiliates provide the Fund with investment management related services for which the Fund pays a monthly management fee. The management fee is the sum of an individual fund fee rate that is based on an annual rate of .30% of the Fund's average net assets and an annualized group fee rate that averaged .26% during the period. The group fee rate is based upon the average net assets of all the mutual funds advised by FMR. The group fee rate decreases as assets under management increase and increases as assets under management decrease. In addition, the management fee is subject to a performance adjustment (up to a maximum of ± .20% of the Fund's average net assets over a 36 month performance period). The upward or downward adjustment to the management fee is based on the relative investment performance of Stock Selector Large Cap Value as compared to an appropriate benchmark index. For the period, the total annual management fee rate, including the performance adjustment, was .25% of the Fund's average net assets.
Distribution and Service Plan Fees. In accordance with Rule 12b-1 of the 1940 Act, the Fund has adopted separate Distribution and Service Plans for each class of shares. Certain classes pay Fidelity Distributors Corporation (FDC), an affiliate of FMR, separate Distribution and Service Fees, each of which is based on an annual percentage of each class' average net assets. In addition, FDC may pay financial intermediaries for selling shares of the Fund and providing shareholder support services. For the period, the Distribution and Service Fee rates, total fees and amounts retained by FDC were as follows:
| Distribution
Fee | Service
Fee | Total Fees | Retained
by FDC |
Class A | -% | .25% | $ 43,754 | $ 490 |
Class T | .25% | .25% | 29,408 | 168 |
Class B | .75% | .25% | 16,748 | 12,625 |
Class C | .75% | .25% | 50,921 | 14,959 |
| | | $ 140,831 | $ 28,242 |
Sales Load. FDC may receive a front-end sales charge of up to 5.75% for selling Class A shares and 3.50% for selling Class T shares, some of which is paid to financial intermediaries for selling shares of the Fund. Depending on the holding period, FDC may receive contingent deferred sales charges levied on Class A, Class T, Class B, and Class C redemptions. The deferred sales charges range from 5.00% to 1.00% for Class B shares, 1.00% for Class C shares, 1.00% for certain purchases of Class A shares and .25% for certain purchases of Class T shares.
Annual Report
Notes to Financial Statements - continued
6. Fees and Other Transactions with Affiliates - continued
Sales Load - continued
For the period, sales charge amounts retained by FDC were as follows:
| Retained
by FDC |
Class A | $ 6,859 |
Class T | 1,851 |
Class B* | 3,265 |
Class C* | 1,973 |
| $ 13,948 |
* When Class B and Class C shares are initially sold, FDC pays commissions from its own resources to financial intermediaries through which the sales are made.
Transfer Agent Fees. Fidelity Investments Institutional Operations Company, Inc. (FIIOC), an affiliate of FMR, is the transfer, dividend disbursing and shareholder servicing agent for each class of the Fund. FIIOC receives account fees and asset-based fees that vary according to the account size and type of account of the shareholders of the respective classes of the Fund. FIIOC pays for typesetting, printing and mailing of shareholder reports, except proxy statements. For the period, transfer agent fees for each class were as follows:
| Amount | % of
Average
Net Assets |
Class A | $ 51,877 | .30 |
Class T | 18,539 | .32 |
Class B | 5,041 | .30 |
Class C | 15,483 | .30 |
Stock Selector Large Cap Value | 1,128,822 | .25 |
Institutional Class | 5,168 | .28 |
| $ 1,224,930 | |
Accounting and Security Lending Fees. Fidelity Service Company, Inc. (FSC), an affiliate of FMR, maintains the Fund's accounting records. The accounting fee is based on the level of average net assets for each month. Under a separate contract, FSC administers the security lending program. The security lending fee is based on the number and duration of lending transactions.
Brokerage Commissions. The Fund placed a portion of its portfolio transactions with brokerage firms which are affiliates of the investment adviser. The commissions paid to these affiliated firms were $10,379 for the period.
Annual Report
7. Committed Line of Credit.
The Fund participates with other funds managed by FMR or an affiliate in a $4.25 billion credit facility (the "line of credit") to be utilized for temporary or emergency purposes to fund shareholder redemptions or for other short-term liquidity purposes. The Fund has agreed to pay commitment fees on its pro-rata portion of the line of credit, which amounted to $1,322 and is reflected in Miscellaneous expenses on the Statement of Operations. During the period, there were no borrowings on this line of credit.
8. Security Lending.
The Fund lends portfolio securities through a lending agent from time to time in order to earn additional income. For equity securities, a lending agent is used and may loan securities to certain qualified borrowers, including Fidelity Capital Markets (FCM), a broker-dealer affiliated with the Fund. On the settlement date of the loan, the Fund receives collateral (in the form of U.S. Treasury obligations, letters of credit and/or cash) against the loaned securities and maintains collateral in an amount not less than 100% of the market value of the loaned securities during the period of the loan. The market value of the loaned securities is determined at the close of business of the Fund and any additional required collateral is delivered to the Fund on the next business day. If the borrower defaults on its obligation to return the securities loaned because of insolvency or other reasons, a fund could experience delays and costs in recovering the securities loaned or in gaining access to the collateral. Any cash collateral received is invested in the Fidelity Securities Lending Cash Central Fund. The value of loaned securities and cash collateral at period end are disclosed on the Fund's Statement of Assets and Liabilities. The value of securities loaned to FCM at period end was $1,445,000. Security lending income represents the income earned on investing cash collateral, less rebates paid to borrowers and any lending agent fees associated with the loan, plus any premium payments received for lending certain types of securities. Security lending income is presented in the Statement of Operations as a component of income from Fidelity Central Funds. Total security lending income during the period amounted to $83,364, including $3,501 from securities loaned to FCM.
9. Expense Reductions.
Many of the brokers with whom FMR places trades on behalf of the Fund provided services to the Fund in addition to trade execution. These services included payments of certain expenses on behalf of the Fund totaling $130,264 for the period.
Annual Report
Notes to Financial Statements - continued
10. Distributions to Shareholders.
Distributions to shareholders of each class were as follows:
Years ended January 31, | 2013 | 2012 |
From net investment income | | |
Class A | $ 304,000 | $ 291,163 |
Class T | 93,858 | 76,828 |
Class B | 16,188 | 14,902 |
Class C | 63,927 | 43,527 |
Stock Selector Large Cap Value | 8,993,963 | 9,726,457 |
Institutional Class | 40,770 | 26,838 |
Total | $ 9,512,706 | $ 10,179,715 |
11. Share Transactions.
Transactions for each class of shares were as follows:
| Shares | Dollars |
Years ended January 31, | 2013 | 2012 | 2013 | 2012 |
Class A | | | | |
Shares sold | 251,269 | 537,296 | $ 2,848,724 | $ 5,591,381 |
Reinvestment of distributions | 24,461 | 26,981 | 281,542 | 272,774 |
Shares redeemed | (573,384) | (742,040) | (6,434,025) | (7,769,301) |
Net increase (decrease) | (297,654) | (177,763) | $ (3,303,759) | $ (1,905,146) |
Class T | | | | |
Shares sold | 131,721 | 164,778 | $ 1,501,274 | $ 1,752,467 |
Reinvestment of distributions | 8,058 | 7,415 | 92,826 | 75,038 |
Shares redeemed | (136,167) | (173,682) | (1,544,492) | (1,851,245) |
Net increase (decrease) | 3,612 | (1,489) | $ 49,608 | $ (23,740) |
Class B | | | | |
Shares sold | 1,157 | 9,062 | $ 13,142 | $ 86,884 |
Reinvestment of distributions | 1,236 | 1,307 | 14,255 | 13,227 |
Shares redeemed | (39,897) | (52,766) | (452,422) | (549,800) |
Net increase (decrease) | (37,504) | (42,397) | $ (425,025) | $ (449,689) |
Class C | | | | |
Shares sold | 162,948 | 201,797 | $ 1,812,867 | $ 2,080,198 |
Reinvestment of distributions | 4,869 | 3,605 | 55,503 | 36,155 |
Shares redeemed | (162,163) | (108,651) | (1,799,733) | (1,106,480) |
Net increase (decrease) | 5,654 | 96,751 | $ 68,637 | $ 1,009,873 |
Annual Report
11. Share Transactions - continued
| Shares | Dollars |
Years ended January 31, | 2013 | 2012 | 2013 | 2012 |
Stock Selector Large Cap Value | | | | |
Shares sold | 3,974,459 | 6,854,527 | $ 45,488,310 | $ 72,065,849 |
Reinvestment of distributions | 757,439 | 935,043 | 8,771,144 | 9,500,032 |
Shares redeemed | (12,329,354) | (37,479,739) | (140,694,347) | (402,880,177) |
Net increase (decrease) | (7,597,456) | (29,690,169) | $ (86,434,893) | $ (321,314,296) |
Institutional Class | | | | |
Shares sold | 54,716 | 58,013 | $ 619,947 | $ 608,335 |
Reinvestment of distributions | 3,536 | 2,632 | 40,770 | 26,662 |
Shares redeemed | (39,612) | (93,801) | (460,078) | (1,017,031) |
Net increase (decrease) | 18,640 | (33,156) | $ 200,639 | $ (382,034) |
12. Other.
The Fund's organizational documents provide former and current trustees and officers with a limited indemnification against liabilities arising in connection with the performance of their duties to the Fund. In the normal course of business, the Fund may also enter into contracts that provide general indemnifications. The Fund's maximum exposure under these arrangements is unknown as this would be dependent on future claims that may be made against the Fund. The risk of material loss from such claims is considered remote.
Annual Report
To the Trustees of Fidelity Devonshire Trust and the Shareholders of Fidelity Stock Selector Large Cap Value Fund:
In our opinion, the accompanying statement of assets and liabilities, including the schedule of investments, and the related statements of operations and of changes in net assets and the financial highlights present fairly, in all material respects, the financial position of Fidelity Stock Selector Large Cap Value Fund (a fund of Fidelity Devonshire Trust) at January 31, 2013, the results of its operations for the year then ended, the changes in its net assets for each of the two years in the period then ended and the financial highlights for each of the five years in the period then ended, in conformity with accounting principles generally accepted in the United States of America. These financial statements and financial highlights (hereafter referred to as "financial statements") are the responsibility of the Fidelity Stock Selector Large Cap Value Fund's management. Our responsibility is to express an opinion on these financial statements based on our audits. We conducted our audits of these financial statements in accordance with the standards of the Public Company Accounting Oversight Board (United States). Those standards require that we plan and perform the audit to obtain reasonable assurance about whether the financial statements are free of material misstatement. An audit includes examining, on a test basis, evidence supporting the amounts and disclosures in the financial statements, assessing the accounting principles used and significant estimates made by management, and evaluating the overall financial statement presentation. We believe that our audits, which included confirmation of securities at January 31, 2013 by correspondence with the custodian and brokers, provide a reasonable basis for our opinion.
PricewaterhouseCoopers LLP
Boston, Massachusetts
March 13, 2013
Annual Report
The Trustees, Members of the Advisory Board, and executive officers of the trust and fund, as applicable, are listed below. The Board of Trustees governs the fund and is responsible for protecting the interests of shareholders. The Trustees are experienced executives who meet periodically throughout the year to oversee the fund's activities, review contractual arrangements with companies that provide services to the fund, oversee management of the risks associated with such activities and contractual arrangements, and review the fund's performance. Except for James C. Curvey, each of the Trustees oversees 234 Fidelity funds. Mr. Curvey oversees 453 Fidelity funds.
The Trustees hold office without limit in time except that (a) any Trustee may resign; (b) any Trustee may be removed by written instrument, signed by at least two-thirds of the number of Trustees prior to such removal; (c) any Trustee who requests to be retired or who has become incapacitated by illness or injury may be retired by written instrument signed by a majority of the other Trustees; and (d) any Trustee may be removed at any special meeting of shareholders by a two-thirds vote of the outstanding voting securities of the trust. Each Trustee who is not an interested person (as defined in the 1940 Act) (Independent Trustee), shall retire not later than the last day of the calendar year in which his or her 75th birthday occurs. The Independent Trustees may waive this mandatory retirement age policy with respect to individual Trustees. The executive officers and Advisory Board Members hold office without limit in time, except that any officer and Advisory Board Member may resign or may be removed by a vote of a majority of the Trustees at any regular meeting or any special meeting of the Trustees. Except as indicated, each individual has held the office shown or other offices in the same company for the past five years.
Experience, Skills, Attributes, and Qualifications of the Fund's Trustees. The Governance and Nominating Committee has adopted a statement of policy that describes the experience, qualifications, attributes, and skills that are necessary and desirable for potential Independent Trustee candidates (Statement of Policy). The Board believes that each Trustee satisfied at the time he or she was initially elected or appointed a Trustee, and continues to satisfy, the standards contemplated by the Statement of Policy. The Governance and Nominating Committee also engages professional search firms to help identify potential Independent Trustee candidates who have the experience, qualifications, attributes, and skills consistent with the Statement of Policy. From time to time, additional criteria based on the composition and skills of the current Independent Trustees, as well as experience or skills that may be appropriate in light of future changes to board composition, business conditions, and regulatory or other developments, have also been considered by the professional search firms and the Governance and Nominating Committee. In addition, the Board takes into account the Trustees' commitment and participation in Board and committee meetings, as well as their leadership of standing and ad hoc committees throughout their tenure.
In determining that a particular Trustee was and continues to be qualified to serve as a Trustee, the Board has considered a variety of criteria, none of which, in isolation, was controlling. The Board believes that, collectively, the Trustees have balanced and diverse experience, qualifications, attributes, and skills, which allow the Board to operate effectively in governing the fund and protecting the interests of shareholders. Information about the specific experience, skills, attributes, and qualifications of each Trustee, which in each case led to the Board's conclusion that the Trustee should serve (or continue to serve) as a trustee of the fund, is provided below.
Annual Report
Board Structure and Oversight Function. James C. Curvey is an interested person (as defined in the 1940 Act) and currently serves as Chairman. The Trustees have determined that an interested Chairman is appropriate and benefits shareholders because an interested Chairman has a personal and professional stake in the quality and continuity of services provided to the fund. Independent Trustees exercise their informed business judgment to appoint an individual of their choosing to serve as Chairman, regardless of whether the Trustee happens to be independent or a member of management. The Independent Trustees have determined that they can act independently and effectively without having an Independent Trustee serve as Chairman and that a key structural component for assuring that they are in a position to do so is for the Independent Trustees to constitute a substantial majority for the Board. The Independent Trustees also regularly meet in executive session. Ned C. Lautenbach serves as Chairman of the Independent Trustees and as such (i) acts as a liaison between the Independent Trustees and management with respect to matters important to the Independent Trustees and (ii) with management prepares agendas for Board meetings.
Fidelity funds are overseen by different Boards of Trustees. The fund's Board oversees Fidelity's equity and high income funds and another Board oversees Fidelity's investment-grade bond, money market, and asset allocation funds. The asset allocation funds may invest in Fidelity funds overseen by the fund's Board. The use of separate Boards, each with its own committee structure, allows the Trustees of each group of Fidelity funds to focus on the unique issues of the funds they oversee, including common research, investment, and operational issues. On occasion, the separate Boards establish joint committees to address issues of overlapping consequences for the Fidelity funds overseen by each Board.
The Trustees operate using a system of committees to facilitate the timely and efficient consideration of all matters of importance to the Trustees, the fund, and fund shareholders and to facilitate compliance with legal and regulatory requirements and oversight of the fund's activities and associated risks. The Board, acting through its committees, has charged FMR and its affiliates with (i) identifying events or circumstances the occurrence of which could have demonstrably adverse effects on the fund's business and/or reputation; (ii) implementing processes and controls to lessen the possibility that such events or circumstances occur or to mitigate the effects of such events or circumstances if they do occur; and (iii) creating and maintaining a system designed to evaluate continuously business and market conditions in order to facilitate the identification and implementation processes described in (i) and (ii) above. Because the day-to-day operations and activities of the fund are carried out by or through FMR, its affiliates and other service providers, the fund's exposure to risks is mitigated but not eliminated by the processes overseen by the Trustees. While each of the Board's committees has responsibility for overseeing different aspects of the fund's activities, oversight is exercised primarily through the Operations, Audit, and Compliance Committees. In addition, the Independent Trustees have worked with FMR to enhance the Board's oversight of investment and financial risks, legal and regulatory risks, technology risks, and operational risks, including the development of additional risk reporting to the Board. For example, a working group comprised of Independent Trustees and FMR has worked and continues to work to review the Fidelity funds' valuation-related activities, reporting and risk management. Appropriate personnel, including but not limited to the fund's Chief Compliance Officer (CCO), FMR's internal auditor, the independent accountants, the fund's Treasurer and portfolio management personnel, make periodic reports to the Board's committees, as appropriate, including an annual review of FMR's risk management program for the Fidelity funds. The responsibilities of each standing committee, including their oversight responsibilities, are described further under "Standing Committees of the Fund's Trustees."
Annual Report
Trustees and Officers - continued
The fund's Statement of Additional Information (SAI) includes more information about the Trustees. To request a free copy, call Fidelity at 1-877-208-0098.
Interested Trustees*:
Correspondence intended for each Trustee who is an interested person may be sent to Fidelity Investments, 245 Summer Street, Boston, Massachusetts 02210.
Name, Age; Principal Occupations and Other Relevant Experience+ |
James C. Curvey (77) |
| Year of Election or Appointment: 2007 Mr. Curvey is Trustee and Chairman of the Board of Trustees of certain Trusts. Mr. Curvey also serves as Trustee (2007-present) of other investment companies advised by FMR. Mr. Curvey is a Director of Fidelity Investments Money Management, Inc. (2009-present), Director of Fidelity Research & Analysis Co. (2009-present) and Director of FMR and FMR Co., Inc. (2007-present). Mr. Curvey is also Vice Chairman (2007-present) and Director of FMR LLC. In addition, Mr. Curvey serves as an Overseer for the Boston Symphony Orchestra and a member of the Trustees of Villanova University. Previously, Mr. Curvey was the Vice Chairman (2006-2007) and Director (2000-2007) of FMR Corp. |
Ronald P. O'Hanley (55) |
| Year of Election or Appointment: 2011 Mr. O'Hanley is Director of FMR Co., Inc. (2010-present), Director of Fidelity Investments Money Management, Inc. (2010-present), Director of Fidelity Research & Analysis Company (2010-present), President of Fidelity Asset Management and Corporate Services and a member of Fidelity's Executive Committee (2010-present). Previously, Mr. O'Hanley served as President and Chief Executive Officer of BNY Mellon Asset Management (2007-2010). Mr. O'Hanley also served as Vice Chairman of Bank New York Mellon Corp. and a member of that firm's Executive Committee. Prior to the 2007 merger of The Bank of New York and Mellon Financial Corporation, he was Vice Chairman of Mellon Financial Corporation and President and Chief Executive Officer of Mellon Asset Management. He joined Mellon in February 1997. Mr. O'Hanley currently serves as Chairman of the Boston Public Library Foundation Board of Directors and sits on the Board of Directors of Beth Israel Deaconess Medical Center, the Board of Trustees of the Marine Biological Laboratory and the Advisory Board of the Maxwell School of Citizenship and Public Administration at Syracuse University. Mr. O'Hanley also chairs the Council on Asset Management for the Financial Services Roundtable and is a member of the Board of Directors of Institutional Investor's U.S. Institute. |
* Trustees have been determined to be "Interested Trustees" by virtue of, among other things, their affiliation with the trust or various entities under common control with FMR.
+ The information above includes each Trustee's principal occupation during the last five years and other information relating to the experience, attributes, and skills relevant to each Trustee's qualifications to serve as a Trustee, which led to the conclusion that each Trustee should serve as a Trustee for the fund.
Annual Report
Trustees and Officers - continued
Independent Trustees:
Correspondence intended for each Independent Trustee (that is, the Trustees other than the Interested Trustees) may be sent to Fidelity Investments, P.O. Box 55235, Boston, Massachusetts 02205-5235.
Name, Age; Principal Occupations and Other Relevant Experience+ |
Dennis J. Dirks (64) |
| Year of Election or Appointment: 2005 Prior to his retirement in May 2003, Mr. Dirks was Chief Operating Officer and a member of the Board of The Depository Trust & Clearing Corporation (DTCC). He also served as President, Chief Operating Officer, and Board member of The Depository Trust Company (DTC) and President and Board member of the National Securities Clearing Corporation (NSCC). In addition, Mr. Dirks served as Chief Executive Officer and Board member of the Government Securities Clearing Corporation, Chief Executive Officer and Board member of the Mortgage-Backed Securities Clearing Corporation, as a Trustee and a member of the Finance Committee of Manhattan College (2005-2008), and as a Trustee and a member of the Finance Committee of AHRC of Nassau County (2006-2008). Mr. Dirks is a member of the Independent Directors Council (IDC) Governing Council (2010-present) and Board of Directors for The Brookville Center for Children's Services, Inc. (2009-present). |
Alan J. Lacy (59) |
| Year of Election or Appointment: 2008 Mr. Lacy serves as Senior Adviser (2007-present) of Oak Hill Capital Partners, L.P. (private equity). Mr. Lacy also served as Chief Executive Officer (2000-2005) and Vice Chairman (2005-2006) of Sears Holdings Corporation and Sears, Roebuck and Co. (retail). In addition, Mr. Lacy serves as a member of the Board of Directors of Dave & Buster's Entertainment, Inc. (restaurant and entertainment complexes, 2010-present), Earth Fare, Inc. (retail grocery, 2012-present), The Hillman Companies, Inc. (hardware wholesalers, 2010-present), and Bristol-Myers Squibb Company (global pharmaceuticals, 2008-present). Mr. Lacy is a member of the Board of Trustees of The National Parks Conservation Association (2006-present). Previously, Mr. Lacy served as Chairman of the Board of Trustees of the National Parks Conservation Association (2008-2011) and as a member of the Board of Directors for the Western Union Company (global money transfer, 2006-2011). |
Ned C. Lautenbach (68) |
| Year of Election or Appointment: 2000 Mr. Lautenbach is Chairman of the Independent Trustees of the Equity and High Income Funds (2006-present). Mr. Lautenbach currently serves as the Lead Director of the Eaton Corporation Board of Directors (diversified industrial, 1997-present). Mr. Lautenbach is Chairman of the Board of Directors of the Philharmonic Center for the Arts in Naples, Florida (2012-present) and a member of the Council on Foreign Relations (1994-present). Previously, Mr. Lautenbach was a Partner/Advisory Partner at Clayton, Dubilier & Rice, LLC (private equity investment, 1998-2010), as well as a Director of Sony Corporation (2006-2007). |
Joseph Mauriello (68) |
| Year of Election or Appointment: 2008 Prior to his retirement in January 2006, Mr. Mauriello served in numerous senior management positions including Deputy Chairman and Chief Operating Officer (2004-2005), and Vice Chairman of Financial Services (2002-2004) of KPMG LLP US (professional services, 1965-2005). Mr. Mauriello currently serves as a member of the Board of Directors of XL Group plc. (global insurance and re-insurance, 2006-present). Previously, Mr. Mauriello served as a Director of the Hamilton Funds of the Bank of New York (2006-2007) and of Arcadia Resources Inc. (health care services and products, 2007-2012). |
Robert W. Selander (62) |
| Year of Election or Appointment: 2011 Previously, Mr. Selander served as a Member of the Advisory Board of Fidelity's Equity and High Income Funds (2011), Executive Vice Chairman (2010), Chief Executive Officer (2009-2010), and President and Chief Executive Officer (1997-2009) of Mastercard, Inc. |
Cornelia M. Small (68) |
| Year of Election or Appointment: 2005 Ms. Small is a member of the Board of Directors (2009-present) and Chair of the Investment Committee (2010-present) of the Teagle Foundation. Ms. Small also serves on the Investment Committee of the Berkshire Taconic Community Foundation (2008-present). Previously, Ms. Small served as Chairperson (2002-2008) and a member of the Investment Committee and Chairperson (2008-2012) and a member of the Board of Trustees of Smith College. In addition, Ms. Small served as Chief Investment Officer, Director of Global Equity Investments, and a member of the Board of Directors of Scudder, Stevens & Clark and Scudder Kemper Investments. |
William S. Stavropoulos (73) |
| Year of Election or Appointment: 2002 Mr. Stavropoulos is Vice Chairman of the Independent Trustees of the Equity and High Income Funds (2006-present). Mr. Stavropoulos serves as President and Founder of the Michigan Baseball Foundation, the Great Lakes Loons (2007-present). Mr. Stavropoulos is Chairman Emeritus of the Board of Directors of The Dow Chemical Company, where he previously served in numerous senior management positions, including President, CEO (1995-2000; 2002-2004), Chairman of the Executive Committee (2000-2006), and as a member of the Board of Directors (1990-2006). Currently, Mr. Stavropoulos is a Director of Univar Inc. (global distributor of commodity and specialty chemicals, Chairman from 2010-May 2012 and Lead Director from May 2012-present), Teradata Corporation (data warehousing and technology solutions, 2008-present), Maersk Inc. (industrial conglomerate), and Tyco International, Ltd. (multinational manufacturing and services, 2007-present), and a member of the Advisory Board for Metalmark Capital LLC (private equity investment, 2005-present). Mr. Stavropoulos is an operating advisor to Clayton, Dubilier & Rice, LLC (private equity investment). In addition, Mr. Stavropoulos is a member of the University of Notre Dame Advisory Council for the College of Science, a Trustee of the Rollin L. Gerstacker Foundation, and a Director of the Naples Philharmonic Center for the Arts. Previously, Mr. Stavropoulos served as a Director of Chemical Financial Corporation (bank holding company, 1993-2012). |
David M. Thomas (63) |
| Year of Election or Appointment: 2008 Previously, Mr. Thomas served as Executive Chairman (2005-2006) and Chairman and Chief Executive Officer (2000-2005) of IMS Health, Inc. (pharmaceutical and healthcare information solutions), and a Director of Fortune Brands, Inc. (consumer products, 2000-2011). In addition, Mr. Thomas serves as Non-Executive Chairman of the Board of Directors of Fortune Brands Home and Security (home and security products, 2011-present), and as a member of the Board of Directors of Interpublic Group of Companies, Inc. (marketing communication, 2004-present). |
Michael E. Wiley (62) |
| Year of Election or Appointment: 2008 Mr. Wiley also serves as a Director of Asia Pacific Exploration Consolidated (international oil and gas exploration and production, 2008-present). Mr. Wiley serves as a Director of Tesoro Corporation (independent oil refiner and marketer, 2005-present), and a Director of Bill Barrett Corporation (exploration and production, 2005-present). In addition, Mr. Wiley also serves as a Director of Post Oak Bank (privately-held bank, 2004-present). Previously, Mr. Wiley served as a member of the Board of Trustees of the University of Tulsa (2000-2006; 2007-2010), as a Senior Energy Advisor of Katzenbach Partners, LLC (consulting, 2006-2007), as an Advisory Director of Riverstone Holdings (private investment), Chairman, President, and CEO of Baker Hughes, Inc. (oilfield services, 2000-2004), and as Director of Spinnaker Exploration Company (exploration and production, 2001-2005). |
+ The information above includes each Trustee's principal occupation during the last five years and other information relating to the experience, attributes, and skills relevant to each Trustee's qualifications to serve as a Trustee, which led to the conclusion that each Trustee should serve as a Trustee for the fund.
Advisory Board Members and Executive Officers:
Correspondence intended for David A. Rosow and Garnett A. Smith may be sent to Fidelity Investments, P.O. Box 55235, Boston, Massachusetts 02205-5235. Correspondence intended for each executive officer and Peter S. Lynch may be sent to Fidelity Investments, 245 Summer Street, Boston, Massachusetts 02210.
Name, Age; Principal Occupation |
Peter S. Lynch (69) |
| Year of Election or Appointment: 2003 Member of the Advisory Board of Fidelity's Equity and High Income Funds. Mr. Lynch is Vice Chairman and a Director of FMR and FMR Co., Inc. In addition, Mr. Lynch serves as a Trustee of Boston College and as the Chairman of the Inner-City Scholarship Fund. Previously, Mr. Lynch served on the Special Olympics International Board of Directors (1997-2006). |
David A. Rosow (70) |
| Year of Election or Appointment: 2012 Member of the Advisory Board of Fidelity's Equity and High Income Funds. Chairman and Chief Executive Officer of International Golf Group, Inc. (golf course development, 1989-present). Previously, Mr. Rosow served as Chairman and Chief Executive Officer of Rosow & Company, Inc. (private investment company, 1989-2011), a Lead Director of Hudson United Bancorp (2001-2006) and as a Director of TD Banknorth (1996-2006). In addition, Mr. Rosow is a member (2008-present) and President (2009-present) of the Town Council of Palm Beach, Florida. |
Garnett A. Smith (65) |
| Year of Election or Appointment: 2012 Member of the Advisory Board of Fidelity's Equity and High Income Funds. Prior to Mr. Smith's retirement, he served as Chairman and Chief Executive Officer of Inbrand Corp. (manufacturer of personal absorbent products, 1990-1997). He also served as President (1986-1990) of Inbrand Corp. Prior to his employment with Inbrand Corp., he was employed by a retail fabric chain and North Carolina National Bank. In addition, Mr. Smith is a board member of the Jackson Hole Land Trust (2009-present). |
Kenneth B. Robins (43) |
| Year of Election or Appointment: 2008 President and Treasurer of Fidelity's Equity and High Income Funds. Mr. Robins also serves as President and Treasurer (2010-present) and Assistant Treasurer (2009-present) of other Fidelity funds and is an employee of Fidelity Investments (2004-present). Previously, Mr. Robins served as Deputy Treasurer of the Fidelity funds (2005-2008) and Treasurer and Chief Financial Officer of The North Carolina Capital Management Trust: Cash and Term Portfolios (2006-2008). |
Brian B. Hogan (48) |
| Year of Election or Appointment: 2009 Vice President of Equity and High Income Funds. Mr. Hogan also serves as President of FMR's Equity Division (2009-present). Previously, Mr. Hogan served as Senior Vice President, Equity Research of FMR (2006-2009) and as a portfolio manager. |
Thomas C. Hense (49) |
| Year of Election or Appointment: 2008 or 2010 Vice President of Fidelity's High Income (2008), Small Cap (2008), and Value (2010) Funds. Previously, Mr. Hense served as a portfolio manager for Fidelity's Institutional Money Management Group (Pyramis) (2003-2008). |
Scott C. Goebel (45) |
| Year of Election or Appointment: 2008 Secretary and Chief Legal Officer (CLO) of the Fidelity funds. Mr. Goebel also serves as Secretary of Fidelity Investments Money Management, Inc. (FIMM) (2010-present) and Fidelity Research and Analysis Company (FRAC) (2010-present); Secretary and CLO of The North Carolina Capital Management Trust: Cash and Term Portfolios (2008-present); General Counsel, Secretary, and Senior Vice President of FMR (2008-present) and FMR Co., Inc. (2008-present); employed by FMR LLC or an affiliate (2001-present); Chief Legal Officer of Fidelity Management & Research (Hong Kong) Limited (2008-present) and Assistant Secretary of Fidelity Management & Research (Japan) Inc. (2008-present), and Fidelity Management & Research (U.K.) Inc. (2008-present). Previously, Mr. Goebel served as Assistant Secretary of FIMM (2008-2010), FRAC (2008-2010), and the Funds (2007-2008) and as Vice President and Secretary of Fidelity Distributors Corporation (FDC) (2005-2007). |
William C. Coffey (43) |
| Year of Election or Appointment: 2009 Assistant Secretary of Fidelity's Equity and High Income Funds. Mr. Coffey also serves as Senior Vice President and Deputy General Counsel of FMR LLC (2010-present), and is an employee of Fidelity Investments. Previously, Mr. Coffey served as Vice President and Associate General Counsel of FMR LLC (2005-2009). |
Elizabeth Paige Baumann (44) |
| Year of Election or Appointment: 2012 Anti-Money Laundering (AML) Officer of the Fidelity funds. Ms. Baumann also serves as AML Officer of The North Carolina Capital Management Trust: Cash and Term Portfolios (2012-present), Chief AML Officer of FMR LLC (2012-present), and is an employee of Fidelity Investments. Previously, Ms. Baumann served as Vice President and Deputy Anti-Money Laundering Officer (2007-2012). |
Christine Reynolds (54) |
| Year of Election or Appointment: 2008 Chief Financial Officer of the Fidelity funds. Ms. Reynolds became President of Fidelity Pricing and Cash Management Services (FPCMS) in August 2008. Ms. Reynolds served as Chief Operating Officer of FPCMS (2007-2008). Previously, Ms. Reynolds served as President, Treasurer, and Anti-Money Laundering officer of the Fidelity funds (2004-2007). |
Joseph A. Hanlon (44) |
| Year of Election or Appointment: 2012 Chief Compliance Officer of Fidelity's Equity and High Income Funds. Mr. Hanlon serves as Compliance Officer of FMR, FMR Co., Inc., Fidelity Investments Money Management, Inc. (FIMM), Fidelity Research and Analysis Company (FRAC), Fidelity Management & Research (Japan) Inc., Fidelity Management & Research (U.K.) Inc., Fidelity Management & Research (Hong Kong), and Strategic Advisers, Inc. (2009-present), as Senior Vice President of the Fidelity Asset Management Division (2009-present), and is an employee of Fidelity Investments. |
Joseph F. Zambello (55) |
| Year of Election or Appointment: 2011 Deputy Treasurer of the Fidelity funds. Mr. Zambello is an employee of Fidelity Investments. Previously, Mr. Zambello served as Vice President of FMR's Program Management Group (2009-2011) and Vice President of the Transfer Agent Oversight Group (2005-2009). |
Adrien E. Deberghes (45) |
| Year of Election or Appointment: 2008 Deputy Treasurer of Fidelity's Equity and High Income Funds. Mr. Deberghes also serves as Vice President (2011-present) and Assistant Treasurer (2010-present) of other Fidelity funds, and is an employee of Fidelity Investments (2008-present). Previously, Mr. Deberghes served as Senior Vice President of Mutual Fund Administration at State Street Corporation (2007-2008), Senior Director of Mutual Fund Administration at Investors Bank & Trust (2005-2007), and Director of Finance for Dunkin' Brands (2000-2005). |
Stephen Sadoski (41) |
| Year of Election or Appointment: 2012 Deputy Treasurer of Fidelity's Equity and High Income Funds. Mr. Sadoski also serves as Deputy Treasurer of other Fidelity funds (2013-present) and is an employee of Fidelity Investments (2012-present). Previously, Mr. Sadoski served as Assistant Treasurer of Fidelity's Fixed Income and Asset Allocation Funds (2012-2013), an assistant chief accountant in the Division of Investment Management of the Securities and Exchange Commission (SEC) (2009-2012) and as a senior manager at Deloitte & Touche (1997-2009). |
Stacie Smith (38) |
| Year of Election or Appointment: 2013 Deputy Treasurer of Fidelity's Equity and High Income Funds. Ms. Smith is an employee of Fidelity Investments (2009-present). Previously, Ms. Smith served as Senior Audit Manager of Ernst & Young LLP (1996-2009). |
Stephanie J. Dorsey (43) |
| Year of Election or Appointment: 2010 Assistant Treasurer of Fidelity's Equity and High Income Funds. Ms. Dorsey also serves as President and Treasurer (2013-present) and Assistant Treasurer (2012-present) of other Fidelity funds and is an employee of Fidelity Investments (2008-present). Previously, Ms. Dorsey served as Deputy Treasurer of Fidelity's Fixed Income and Asset Allocation Funds (2008-2013), Treasurer (2004-2008) of the JPMorgan Mutual Funds and Vice President (2004-2008) of JPMorgan Chase Bank. |
John R. Hebble (54) |
| Year of Election or Appointment: 2009 Assistant Treasurer of Fidelity's Equity and High Income Funds. Mr. Hebble also serves as President (2011-present), Treasurer, and Chief Financial Officer of The North Carolina Capital Management Trust: Cash and Term Portfolios (2008-present) and is an employee of Fidelity Investments. Previously, Mr. Hebble served as President and Treasurer of Fidelity's Fixed Income and Asset Allocation Funds (2008-2013). |
Gary W. Ryan (54) |
| Year of Election or Appointment: 2005 Assistant Treasurer of the Fidelity funds. Mr. Ryan is an employee of Fidelity Investments. Previously, Mr. Ryan served as Vice President of Fund Reporting in Fidelity Pricing and Cash Management Services (FPCMS) (1999-2005). |
Jonathan Davis (44) |
| Year of Election or Appointment: 2010 Assistant Treasurer of the Fidelity funds. Mr. Davis is also Assistant Treasurer of Fidelity Rutland Square Trust II and Fidelity Commonwealth Trust II. Mr. Davis is an employee of Fidelity Investments. Previously, Mr. Davis served as Vice President and Associate General Counsel of FMR LLC (2003-2010). |
Annual Report
Institutional Class designates 100% of the dividends distributed during the fiscal year as qualifying for the dividends-received deduction for corporate shareholders.
Institutional Class designates 100% of the dividends distributed during the fiscal year as amounts which may be taken into account as a dividend for purposes of the maximum rate under section 1(h)(11) of the Internal Revenue Code.
The fund will notify shareholders in January 2014 of amounts for use in preparing 2013 income tax returns.
Annual Report
Investment Adviser
Fidelity Management & Research Company
Boston, MA
Investment Sub-Advisers
FMR Co., Inc.
Fidelity Management & Research
(U.K.) Inc.
Fidelity Management & Research
(Hong Kong) Limited
Fidelity Management & Research
(Japan) Inc.
General Distributor
Fidelity Distributors Corporation
Smithfield, RI
Transfer and Service Agents
Fidelity Investments Institutional Operations Company, Inc.
Boston, MA
Fidelity Service Company, Inc.
Boston, MA
Custodian
Citibank, N.A.
New York, NY
(Fidelity Investment logo)(registered trademark)
ALCVI-UANN-0313
1.838383.103
(Fidelity Investment logo)(registered trademark)
Fidelity Advisor®
Stock Selector
Large Cap Value
Fund - Class A, Class T, Class B
and Class C
Annual Report
January 31, 2013
(Fidelity Cover Art)
Class A, Class T, Class B,
and Class C are classes of
Fidelity® Stock Selector Large
Cap Value Fund
Contents
Performance | (Click Here) | How the fund has done over time. |
Management's Discussion of Fund Performance | (Click Here) | The Portfolio Manager's review of fund performance and strategy. |
Shareholder Expense Example | (Click Here) | An example of shareholder expenses. |
Investment Changes | (Click Here) | A summary of major shifts in the fund's investments over the past six months. |
Investments | (Click Here) | A complete list of the fund's investments with their market values. |
Financial Statements | (Click Here) | Statements of assets and liabilities, operations, and changes in net assets, as well as financial highlights. |
Notes | (Click Here) | Notes to the financial statements. |
Report of Independent Registered Public Accounting Firm | (Click Here) | |
Trustees and Officers | (Click Here) | |
Distributions | (Click Here) | |
To view a fund's proxy voting guidelines and proxy voting record for the 12-month period ended June 30, visit http://www.fidelity.com/proxyvotingresults or visit the Securities and Exchange Commission's (SEC) web site at http://www.sec.gov. You may also call 1-877-208-0098 to request a free copy of the proxy voting guidelines.
Standard & Poor's, S&P and S&P 500 are registered service marks of The McGraw-Hill Companies, Inc. and have been licensed for use by Fidelity Distributors Corporation.
Other third-party marks appearing herein are the property of their respective owners.
All other marks appearing herein are registered or unregistered trademarks or service marks of FMR LLC or an affiliated company. © 2013 FMR LLC. All rights reserved.
Annual Report
This report and the financial statements contained herein are submitted for the general information of the shareholders of the fund. This report is not authorized for distribution to prospective investors in the fund unless preceded or accompanied by an effective prospectus.
A fund files its complete schedule of portfolio holdings with the SEC for the first and third quarters of each fiscal year on Form N-Q. Forms N-Q are available on the SEC's web site at http://www.sec.gov. A fund's Forms N-Q may be reviewed and copied at the SEC's Public Reference Room in Washington, DC. Information regarding the operation of the SEC's Public Reference Room may be obtained by calling 1-800-SEC-0330. For a complete list of a fund's portfolio holdings, view the most recent holdings listing, semiannual report, or annual report on Fidelity's web site at http://www.fidelity.com, http://www.advisor.fidelity.com, or http://www.401k.com, as applicable.
NOT FDIC INSURED • MAY LOSE VALUE • NO BANK GUARANTEE
Neither the fund nor Fidelity Distributors Corporation is a bank.
Annual Report
Average annual total return reflects the change in the value of an investment, assuming reinvestment of the class' distributions from dividend income and capital gains (the profits earned upon the sale of securities that have grown in value, if any) and assuming a constant rate of performance each year. The $10,000 table and the fund's returns do not reflect the deduction of taxes that a shareholder would pay on fund distributions or the redemption of fund shares. During periods of reimbursement by Fidelity, a fund's total return will be greater than it would be had the reimbursement not occurred. How a fund did yesterday is no guarantee of how it will do tomorrow.
Average Annual Total Returns
Periods ended January 31, 2013 | Past 1
year | Past 5
years | Past 10
years |
Class A (incl. 5.75% sales charge) A | 11.35% | -1.33% | 6.08% |
Class T (incl. 3.50% sales charge) B | 13.75% | -1.14% | 6.15% |
Class B (incl. contingent deferred
sales charge) C | 12.24% | -1.32% | 6.21% |
Class C (incl. contingent deferred
sales charge) D | 16.32% | -0.89% | 6.25% |
A Class A shares bear a 0.25% 12b-1 fee. The initial offering of Class A shares took place on February 13, 2007. Returns prior to February 13, 2007 are those of Fidelity® Stock Selector Large Cap Value Fund, the original class of the fund, which has no 12b-1 fee. Had Class A shares' 12b-1 fee been reflected, returns prior to February 13, 2007 would have been lower.
B Class T shares bear a 0.50% 12b-1 fee. The initial offering of Class T shares took place on February 13, 2007. Returns prior to February 13, 2007 are those of Fidelity® Stock Selector Large Cap Value Fund, the original class of the fund, which has no 12b-1 fee. Had Class T shares' 12b-1 fee been reflected, returns prior to February 13, 2007 would have been lower.
C Class B shares bear a 1.00% 12b-1 fee. The initial offering of Class B shares took place on February 13, 2007. Returns prior to February 13, 2007 are those of Fidelity Stock Selector Large Cap Value Fund, the original class of the fund, which has no 12b-1 fee. Had Class B shares' 12b-1 fee been reflected, returns prior to February 13, 2007 would have been lower. Class B shares' contingent deferred sales charge included in the past one year, past five years, and past ten years total return figures are 5%, 2%, and 0%, respectively.
D Class C shares bear a 1.00% 12b-1 fee. The initial offering of Class C shares took place on February 13, 2007. Returns prior to February 13, 2007 are those of Fidelity Stock Selector Large Cap Value Fund, the original class of the fund, which has no 12b-1 fee. Had Class C shares' 12b-1 fee been reflected, returns prior to February 13, 2007 would have been lower. Class C shares' contingent deferred sales charge included in the past one year, past five years, and past ten years total return figures are 1%, 0%, and 0%, respectively.
Annual Report
$10,000 Over 10 Years
Let's say hypothetically that $10,000 was invested in Fidelity Advisor® Stock Selector Large Cap Value Fund - Class A on January 31, 2003. The chart shows how the value of your investment would have changed, and also shows how the Russell 1000® Value Index performed over the same period. The initial offering of Class A took place on February 13, 2007. See the previous page for additional information regarding the performance of Class A.
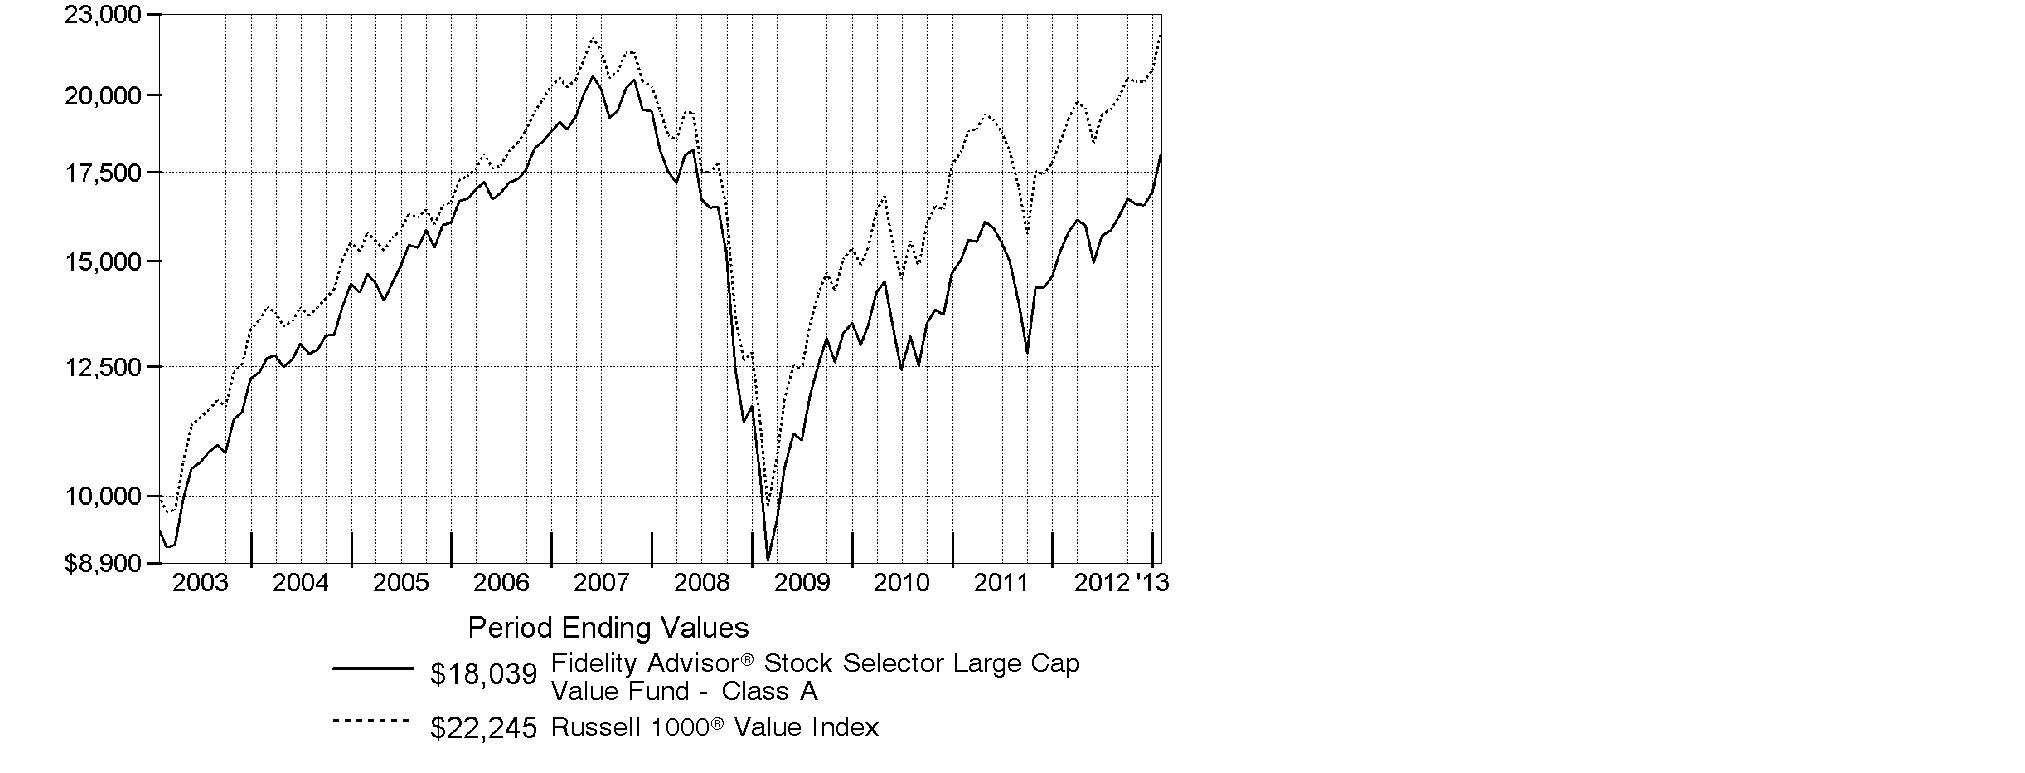
Annual Report
Market Recap: Improvement in the U.S. economy helped lift equity benchmarks to double-digit gains for the year ending January 31, 2013, overcoming moments of volatility driven by sovereign debt woes in Europe, slower economic growth in China and gridlock in Congress. Major U.S. benchmarks hit multiyear highs during the period, encouraged by a rebounding domestic housing market and solid corporate earnings reports. The broad-based S&P 500® Index rose 16.78% for the year, crossing the milestone 1,500 mark near period end. The technology-heavy Nasdaq Composite Index® added 13.13%, and the blue-chip-laden Dow Jones Industrial AverageSM gained 12.75%. Early in the period, stocks rose on positive U.S. economic news and proposed bailouts in Europe. Although fear resurfaced in April and May, equities rebounded in June on central bank stimulus and new life in the housing market. In September, pre-election jitters and the looming "fiscal cliff" of tax hikes and federal spending cuts fueled some profit-taking, followed by a brief post-election sell-off. But stocks proved resilient, as investors continued to pile into riskier assets. Gains were broad-based, with eight of the 10 sectors in the S&P 500® posting double-digit returns. Despite eurozone turmoil, foreign developed-markets stocks rose strongly, with the MSCI® EAFE® Index adding 17.41%.
Comments from Bruce Dirks, Group Leader of Fidelity's Stock Selector Large Cap Value Team, which manages Fidelity Advisor® Stock Selector Large Cap Value Fund: For the year, the fund's Class A, Class T, Class B and Class C shares returned 18.15%, 17.88%, 17.24% and 17.32%, respectively (excluding sales charges), trailing the 20.58% gain of the Russell 1000® Value Index. Unfavorable security selection and industry positioning in information technology, weak stock picking in telecommunication services and energy, and underweighting diversified financials were the primary reasons the fund lagged the index. On the plus side, stock choices in materials, utilities and industrials aided relative performance. The biggest relative detractors included: NII Holdings, which provides mobile communications services for business customers in Latin America under the Nextel brand name; technology manufacturer Hewlett-Packard; not holding index component and diversified financial services giant Bank of America; and semiconductor maker Marvell Technology Group. The top individual contributors were an out-of-benchmark position in GEO Group, which manages correctional, detention, mental health and residential treatment facilities, Puerto Rico-based bank holding company Popular and oil refiner Marathon Petroleum. GEO Group was sold from the fund during the period.
The views expressed above reflect those of the portfolio manager(s) only through the end of the period as stated on the cover of this report and do not necessarily represent the views of Fidelity or any other person in the Fidelity organization. Any such views are subject to change at any time based upon market or other conditions and Fidelity disclaims any responsibility to update such views. These views may not be relied on as investment advice and, because investment decisions for a Fidelity fund are based on numerous factors, may not be relied on as an indication of trading intent on behalf of any Fidelity fund.
Annual Report
Shareholder Expense Example
As a shareholder of the Fund, you incur two types of costs: (1) transaction costs, including sales charges (loads) on purchase payments or redemption proceeds, and (2) ongoing costs, including management fees, distribution and/or service (12b-1) fees and other Fund expenses. This Example is intended to help you understand your ongoing costs (in dollars) of investing in the Fund and to compare these costs with the ongoing costs of investing in other mutual funds.
The Example is based on an investment of $1,000 invested at the beginning of the period and held for the entire period (August 1, 2012 to January 31, 2013).
Actual Expenses
The first line of the accompanying table for each class of the Fund provides information about actual account values and actual expenses. You may use the information in this line, together with the amount you invested, to estimate the expenses that you paid over the period. Simply divide your account value by $1,000.00 (for example, an $8,600 account value divided by $1,000.00 = 8.6), then multiply the result by the number in the first line for a class of the Fund under the heading entitled "Expenses Paid During Period" to estimate the expenses you paid on your account during this period. A small balance maintenance fee of $12.00 that is charged once a year may apply for certain accounts with a value of less than $2,000. This fee is not included in the table below. If it was, the estimate of expenses you paid during the period would be higher, and your ending account value lower, by this amount. In addition, the Fund, as a shareholder in the underlying Fidelity Central Funds, will indirectly bear its pro-rata share of the fees and expenses incurred by the underlying Fidelity Central Funds. These fees and expenses are not included in the Fund's annualized expense ratio used to calculate the expense estimate in the table below.
Hypothetical Example for Comparison Purposes
The second line of the accompanying table for each class of the Fund provides information about hypothetical account values and hypothetical expenses based on a Class' actual expense ratio and an assumed rate of return of 5% per year before expenses, which is not the Class' actual return. The hypothetical account values and expenses may not be used to estimate the actual ending account balance or expenses you paid for the period. You may use this information to compare the ongoing costs of investing in the Fund and other funds. To do so, compare this 5% hypothetical example with the 5% hypothetical examples that appear in the shareholder reports of the other funds. A small balance maintenance fee of $12.00 that is charged once a year may apply for certain accounts with a value of less than $2,000. This fee is not included in the table below. If it was, the estimate of expenses you paid during the period would be higher, and your ending account value lower, by this amount. In addition, the Fund, as a shareholder in the underlying Fidelity Central Funds, will indirectly bear its pro-rata share of the fees and expenses incurred by the underlying Fidelity Central Funds. These fees and expenses are not included in the Fund's annualized expense ratio used to calculate the expense estimate in the table below.
Please note that the expenses shown in the table are meant to highlight your ongoing costs only and do not reflect any transaction costs. Therefore, the second line of the table is useful in comparing ongoing costs only, and will not help you determine the relative total costs of owning different funds. In addition, if these transactional costs were included, your costs would have been higher.
Annual Report
| Annualized
Expense Ratio | Beginning
Account Value
August 1, 2012 | Ending
Account Value
January 31, 2013 | Expenses Paid
During Period*
August 1, 2012
to January 31, 2013 |
Class A | .88% | | | |
Actual | | $ 1,000.00 | $ 1,140.00 | $ 4.73 |
HypotheticalA | | $ 1,000.00 | $ 1,020.71 | $ 4.47 |
Class T | 1.15% | | | |
Actual | | $ 1,000.00 | $ 1,138.40 | $ 6.18 |
HypotheticalA | | $ 1,000.00 | $ 1,019.36 | $ 5.84 |
Class B | 1.64% | | | |
Actual | | $ 1,000.00 | $ 1,136.40 | $ 8.81 |
HypotheticalA | | $ 1,000.00 | $ 1,016.89 | $ 8.31 |
Class C | 1.64% | | | |
Actual | | $ 1,000.00 | $ 1,135.70 | $ 8.80 |
HypotheticalA | | $ 1,000.00 | $ 1,016.89 | $ 8.31 |
Stock Selector Large Cap Value | .58% | | | |
Actual | | $ 1,000.00 | $ 1,142.10 | $ 3.12 |
HypotheticalA | | $ 1,000.00 | $ 1,022.22 | $ 2.95 |
Institutional Class | .61% | | | |
Actual | | $ 1,000.00 | $ 1,141.70 | $ 3.28 |
HypotheticalA | | $ 1,000.00 | $ 1,022.07 | $ 3.10 |
A 5% return per year before expenses
* Expenses are equal to each Class' annualized expense ratio, multiplied by the average account value over the period, multiplied by 184/366 (to reflect the one-half year period).
Annual Report
Investment Changes (Unaudited)
Top Ten Stocks as of January 31, 2013 |
| % of fund's
net assets | % of fund's net assets
6 months ago |
General Electric Co. | 3.2 | 3.2 |
Berkshire Hathaway, Inc. Class B | 2.9 | 3.0 |
Wells Fargo & Co. | 2.9 | 3.3 |
Occidental Petroleum Corp. | 2.5 | 2.4 |
Merck & Co., Inc. | 2.4 | 2.2 |
Johnson & Johnson | 2.3 | 2.2 |
Kennedy-Wilson Holdings, Inc. | 2.2 | 2.2 |
Exxon Mobil Corp. | 2.0 | 0.0 |
Pfizer, Inc. | 2.0 | 2.9 |
Suncor Energy, Inc. | 1.6 | 1.8 |
| 24.0 | |
Top Five Market Sectors as of January 31, 2013 |
| % of fund's
net assets | % of fund's net assets
6 months ago |
Financials | 25.8 | 25.7 |
Energy | 16.3 | 16.9 |
Health Care | 11.1 | 11.1 |
Industrials | 10.1 | 8.7 |
Consumer Discretionary | 7.3 | 7.2 |
Asset Allocation (% of fund's net assets) |
As of January 31, 2013* | As of July 31, 2012** |
| Stocks and Equity
Futures 99.9% | | | Stocks and Equity
Futures 99.6% | |
| Short-Term
Investments and
Net Other Assets (Liabilities) 0.1% | | | Short-Term
Investments and
Net Other Assets (Liabilities) 0.4% | |
* Foreign investments | 13.6% | | ** Foreign investments | 13.1% | |

Annual Report
Investments January 31, 2013
Showing Percentage of Net Assets
Common Stocks - 97.4% |
| Shares | | Value |
CONSUMER DISCRETIONARY - 7.3% |
Auto Components - 0.6% |
Delphi Automotive PLC (a) | 83,200 | | $ 3,216,512 |
Household Durables - 1.2% |
Jarden Corp. | 42,495 | | 2,500,406 |
Whirlpool Corp. | 31,500 | | 3,634,470 |
| | 6,134,876 |
Media - 2.6% |
Comcast Corp. Class A | 142,575 | | 5,429,256 |
News Corp. Class A | 186,900 | | 5,184,606 |
Omnicom Group, Inc. | 44,300 | | 2,404,604 |
| | 13,018,466 |
Multiline Retail - 1.7% |
Macy's, Inc. | 80,450 | | 3,178,580 |
Target Corp. | 83,434 | | 5,040,248 |
| | 8,218,828 |
Specialty Retail - 1.2% |
Lowe's Companies, Inc. | 112,063 | | 4,279,686 |
Staples, Inc. | 115,000 | | 1,550,200 |
| | 5,829,886 |
TOTAL CONSUMER DISCRETIONARY | | 36,418,568 |
CONSUMER STAPLES - 7.3% |
Beverages - 1.2% |
Dr. Pepper Snapple Group, Inc. | 58,400 | | 2,632,088 |
Molson Coors Brewing Co. Class B | 72,900 | | 3,293,622 |
| | 5,925,710 |
Food & Staples Retailing - 0.9% |
Walgreen Co. | 114,940 | | 4,593,002 |
Food Products - 2.8% |
Archer Daniels Midland Co. | 92,000 | | 2,624,760 |
ConAgra Foods, Inc. | 92,410 | | 3,020,883 |
Mondelez International, Inc. | 184,790 | | 5,135,314 |
The J.M. Smucker Co. | 35,720 | | 3,165,864 |
| | 13,946,821 |
Household Products - 1.9% |
Procter & Gamble Co. | 91,880 | | 6,905,701 |
Reckitt Benckiser Group PLC | 41,400 | | 2,759,050 |
| | 9,664,751 |
Common Stocks - continued |
| Shares | | Value |
CONSUMER STAPLES - continued |
Tobacco - 0.5% |
Lorillard, Inc. | 57,500 | | $ 2,246,525 |
TOTAL CONSUMER STAPLES | | 36,376,809 |
ENERGY - 16.3% |
Energy Equipment & Services - 1.6% |
Cameron International Corp. (a) | 60,200 | | 3,811,262 |
National Oilwell Varco, Inc. | 58,400 | | 4,329,776 |
| | 8,141,038 |
Oil, Gas & Consumable Fuels - 14.7% |
Anadarko Petroleum Corp. | 96,720 | | 7,739,534 |
BP PLC sponsored ADR | 126,423 | | 5,628,352 |
Canadian Natural Resources Ltd. | 213,400 | | 6,444,363 |
Exxon Mobil Corp. | 113,300 | | 10,193,601 |
Marathon Petroleum Corp. | 63,800 | | 4,734,598 |
Noble Energy, Inc. | 39,680 | | 4,277,107 |
Occidental Petroleum Corp. | 138,978 | | 12,267,588 |
Phillips 66 | 33,100 | | 2,004,867 |
Royal Dutch Shell PLC Class A sponsored ADR | 109,957 | | 7,754,168 |
Suncor Energy, Inc. | 240,100 | | 8,160,608 |
The Williams Companies, Inc. | 115,898 | | 4,062,225 |
| | 73,267,011 |
TOTAL ENERGY | | 81,408,049 |
FINANCIALS - 25.8% |
Capital Markets - 4.0% |
Bank of New York Mellon Corp. | 198,000 | | 5,377,680 |
Invesco Ltd. | 165,800 | | 4,518,050 |
Morgan Stanley | 153,700 | | 3,512,045 |
State Street Corp. | 97,000 | | 5,398,050 |
SWS Group, Inc. (a) | 196,000 | | 1,291,640 |
| | 20,097,465 |
Commercial Banks - 8.5% |
CIT Group, Inc. (a) | 95,900 | | 4,061,365 |
First Citizen Bancshares, Inc. | 18,200 | | 3,173,352 |
First Citizen Bancshares, Inc. (f) | 10,000 | | 1,569,240 |
Itau Unibanco Holding SA sponsored ADR | 197,800 | | 3,408,094 |
PNC Financial Services Group, Inc. | 92,100 | | 5,691,780 |
Popular, Inc. (a) | 193,280 | | 5,187,635 |
Common Stocks - continued |
| Shares | | Value |
FINANCIALS - continued |
Commercial Banks - continued |
U.S. Bancorp | 149,100 | | $ 4,935,210 |
Wells Fargo & Co. | 416,300 | | 14,499,729 |
| | 42,526,405 |
Consumer Finance - 1.1% |
EZCORP, Inc. (non-vtg.) Class A (a) | 44,623 | | 990,631 |
SLM Corp. | 264,500 | | 4,467,405 |
| | 5,458,036 |
Insurance - 8.4% |
ACE Ltd. | 64,500 | | 5,503,785 |
AFLAC, Inc. | 63,450 | | 3,366,657 |
Berkshire Hathaway, Inc. Class B (a) | 150,457 | | 14,583,797 |
Fairfax Financial Holdings Ltd. (sub. vtg.) | 7,500 | | 2,691,999 |
MetLife, Inc. | 107,700 | | 4,021,518 |
National Western Life Insurance Co. Class A | 14,750 | | 2,410,150 |
Old Republic International Corp. | 338,700 | | 3,861,180 |
StanCorp Financial Group, Inc. | 55,000 | | 2,138,950 |
Torchmark Corp. | 58,350 | | 3,250,679 |
| | 41,828,715 |
Real Estate Investment Trusts - 1.2% |
American Tower Corp. | 34,200 | | 2,604,330 |
Boston Properties, Inc. | 27,400 | | 2,884,672 |
Equity Lifestyle Properties, Inc. | 7,500 | | 537,000 |
Eurobank Properties Real Estate Investment Co. | 7,000 | | 51,420 |
| | 6,077,422 |
Real Estate Management & Development - 2.4% |
Consolidated-Tomoka Land Co. | 34,900 | | 1,256,051 |
Kennedy-Wilson Holdings, Inc. | 720,800 | | 10,804,792 |
| | 12,060,843 |
Thrifts & Mortgage Finance - 0.2% |
People's United Financial, Inc. | 82,300 | | 1,013,113 |
TOTAL FINANCIALS | | 129,061,999 |
HEALTH CARE - 11.1% |
Health Care Equipment & Supplies - 0.6% |
Alere, Inc. (a) | 6,650 | | 141,379 |
Baxter International, Inc. | 7,800 | | 529,152 |
Covidien PLC | 18,000 | | 1,122,120 |
Common Stocks - continued |
| Shares | | Value |
HEALTH CARE - continued |
Health Care Equipment & Supplies - continued |
St. Jude Medical, Inc. | 17,900 | | $ 728,530 |
Teleflex, Inc. | 6,200 | | 465,000 |
| | 2,986,181 |
Health Care Providers & Services - 2.2% |
Quest Diagnostics, Inc. | 19,300 | | 1,118,435 |
UnitedHealth Group, Inc. | 110,900 | | 6,122,789 |
WellPoint, Inc. | 55,801 | | 3,617,021 |
| | 10,858,245 |
Health Care Technology - 0.1% |
Allscripts Healthcare Solutions, Inc. (a) | 61,700 | | 683,636 |
Life Sciences Tools & Services - 0.7% |
QIAGEN NV (a) | 29,000 | | 609,000 |
Thermo Fisher Scientific, Inc. | 38,742 | | 2,794,848 |
| | 3,403,848 |
Pharmaceuticals - 7.5% |
AbbVie, Inc. | 29,700 | | 1,089,693 |
Eli Lilly & Co. | 18,400 | | 987,896 |
Endo Pharmaceuticals Holdings, Inc. (a) | 24,900 | | 788,334 |
Jazz Pharmaceuticals PLC (a) | 9,800 | | 552,622 |
Johnson & Johnson | 154,800 | | 11,442,816 |
Merck & Co., Inc. | 275,600 | | 11,919,700 |
Pfizer, Inc. | 371,700 | | 10,139,976 |
Warner Chilcott PLC | 40,100 | | 568,217 |
Zoetis, Inc. Class A | 4,300 | | 111,800 |
| | 37,601,054 |
TOTAL HEALTH CARE | | 55,532,964 |
INDUSTRIALS - 10.1% |
Aerospace & Defense - 1.4% |
General Dynamics Corp. | 73,300 | | 4,859,790 |
United Technologies Corp. | 25,800 | | 2,259,306 |
| | 7,119,096 |
Air Freight & Logistics - 0.7% |
FedEx Corp. | 35,800 | | 3,631,910 |
Commercial Services & Supplies - 1.8% |
Corrections Corp. of America | 43,800 | | 1,659,582 |
CyrusOne, Inc. | 69,000 | | 1,460,730 |
Common Stocks - continued |
| Shares | | Value |
INDUSTRIALS - continued |
Commercial Services & Supplies - continued |
Republic Services, Inc. | 81,700 | | $ 2,605,413 |
Waste Management, Inc. | 84,200 | | 3,063,196 |
| | 8,788,921 |
Construction & Engineering - 1.5% |
AECOM Technology Corp. (a) | 205,200 | | 5,246,964 |
Foster Wheeler AG (a) | 85,500 | | 2,232,405 |
| | 7,479,369 |
Industrial Conglomerates - 3.2% |
General Electric Co. | 711,800 | | 15,858,900 |
Machinery - 0.5% |
Stanley Black & Decker, Inc. | 30,917 | | 2,375,353 |
Professional Services - 0.6% |
Towers Watson & Co. | 50,900 | | 3,108,972 |
Road & Rail - 0.4% |
Union Pacific Corp. | 15,300 | | 2,011,338 |
TOTAL INDUSTRIALS | | 50,373,859 |
INFORMATION TECHNOLOGY - 5.7% |
Communications Equipment - 1.5% |
Brocade Communications Systems, Inc. (a) | 165,900 | | 948,948 |
Cisco Systems, Inc. | 314,900 | | 6,477,493 |
| | 7,426,441 |
Computers & Peripherals - 0.9% |
Hewlett-Packard Co. | 271,027 | | 4,474,656 |
Electronic Equipment & Components - 0.9% |
Corning, Inc. | 190,798 | | 2,289,576 |
Jabil Circuit, Inc. | 127,348 | | 2,408,151 |
| | 4,697,727 |
Semiconductors & Semiconductor Equipment - 2.0% |
Broadcom Corp. Class A | 68,500 | | 2,222,825 |
Freescale Semiconductor Holdings I Ltd. (a)(d) | 146,559 | | 2,117,778 |
Intersil Corp. Class A | 253,868 | | 2,195,958 |
Marvell Technology Group Ltd. | 192,164 | | 1,777,517 |
ON Semiconductor Corp. (a) | 213,500 | | 1,675,975 |
| | 9,990,053 |
Common Stocks - continued |
| Shares | | Value |
INFORMATION TECHNOLOGY - continued |
Software - 0.4% |
Symantec Corp. (a) | 97,000 | | $ 2,111,690 |
TOTAL INFORMATION TECHNOLOGY | | 28,700,567 |
MATERIALS - 4.5% |
Chemicals - 3.3% |
Air Products & Chemicals, Inc. | 48,450 | | 4,235,984 |
Ashland, Inc. | 48,300 | | 3,792,033 |
Eastman Chemical Co. | 52,400 | | 3,728,260 |
LyondellBasell Industries NV Class A | 75,220 | | 4,770,452 |
| | 16,526,729 |
Containers & Packaging - 0.8% |
Rock-Tenn Co. Class A | 49,070 | | 3,874,077 |
Metals & Mining - 0.4% |
Freeport-McMoRan Copper & Gold, Inc. | 52,600 | | 1,854,150 |
TOTAL MATERIALS | | 22,254,956 |
TELECOMMUNICATION SERVICES - 2.8% |
Diversified Telecommunication Services - 2.4% |
AT&T, Inc. | 225,800 | | 7,855,582 |
CenturyLink, Inc. | 74,714 | | 3,022,181 |
Frontier Communications Corp. (d) | 236,700 | | 1,081,719 |
| | 11,959,482 |
Wireless Telecommunication Services - 0.4% |
NII Holdings, Inc. (a)(d) | 319,500 | | 2,236,500 |
TOTAL TELECOMMUNICATION SERVICES | | 14,195,982 |
UTILITIES - 6.5% |
Electric Utilities - 4.1% |
Edison International | 94,300 | | 4,544,317 |
Hawaiian Electric Industries, Inc. | 15,100 | | 407,247 |
ITC Holdings Corp. | 41,100 | | 3,329,100 |
NextEra Energy, Inc. | 50,410 | | 3,632,041 |
Northeast Utilities | 128,600 | | 5,237,878 |
OGE Energy Corp. | 55,540 | | 3,260,753 |
| | 20,411,336 |
Common Stocks - continued |
| Shares | | Value |
UTILITIES - continued |
Gas Utilities - 0.4% |
ONEOK, Inc. | 25,100 | | $ 1,179,951 |
Questar Corp. | 29,700 | | 689,931 |
| | 1,869,882 |
Independent Power Producers & Energy Traders - 0.4% |
The AES Corp. | 179,590 | | 1,946,756 |
Multi-Utilities - 1.6% |
NiSource, Inc. | 122,600 | | 3,313,878 |
Sempra Energy | 66,650 | | 5,002,083 |
| | 8,315,961 |
TOTAL UTILITIES | | 32,543,935 |
TOTAL COMMON STOCKS (Cost $456,339,619) |
486,867,688
|
Nonconvertible Preferred Stocks - 0.0% |
| | | |
FINANCIALS - 0.0% |
Real Estate Investment Trusts - 0.0% |
Eagle Hospitality Properties Trust, Inc. 8.25% (a) (Cost $141,235) | 47,000 | |
47
|
U.S. Treasury Obligations - 0.0% |
| Principal Amount | | |
U.S. Treasury Bills, yield at date of purchase 0.06% to 0.08% 2/14/13 to 4/18/13 (e)
(Cost $349,985) | | $ 350,000 | |
349,992
|
Money Market Funds - 3.4% |
| Shares | | Value |
Fidelity Cash Central Fund, 0.16% (b) | 14,449,093 | | $ 14,449,093 |
Fidelity Securities Lending Cash Central Fund, 0.15% (b)(c) | 2,495,750 | | 2,495,750 |
TOTAL MONEY MARKET FUNDS (Cost $16,944,843) |
16,944,843
|
TOTAL INVESTMENT PORTFOLIO - 100.8% (Cost $473,775,682) | | 504,162,570 |
NET OTHER ASSETS (LIABILITIES) - (0.8)% | | (4,203,144) |
NET ASSETS - 100% | $ 499,959,426 |
Futures Contracts |
| Expiration Date | | Underlying Face Amount at Value | | Unrealized Appreciation/(Depreciation) |
Purchased |
Equity Index Contracts |
162 ICE Russell 1000 Value Index Contracts | March 2013 | | $ 12,315,240 | | $ 329,222 |
|
The face value of futures purchased as a percentage of net assets is 2.5% |
Legend |
(a) Non-income producing |
(b) Affiliated fund that is available only to investment companies and other accounts managed by Fidelity Investments. The rate quoted is the annualized seven-day yield of the fund at period end. A complete unaudited listing of the fund's holdings as of its most recent quarter end is available upon request. In addition, each Fidelity Central Fund's financial statements, which are not covered by the Fund's Report of Independent Registered Public Accounting Firm, are available on the SEC's website or upon request. |
(c) Investment made with cash collateral received from securities on loan. |
(d) Security or a portion of the security is on loan at period end. |
(e) Security or a portion of the security was pledged to cover margin requirements for futures contracts. At the period end, the value of securities pledged amounted to $349,992. |
(f) Restricted securities - Investment in securities not registered under the Securities Act of 1933 (excluding 144A issues). At the end of the period, the value of restricted securities (excluding 144A issues) amounted to $1,569,240 or 0.3% of net assets. |
Additional information on each restricted holding is as follows: |
Security | Acquisition Date | Acquisition Cost |
First Citizen Bancshares, Inc. | 12/21/12 | $ 1,400,000 |
Affiliated Central Funds |
Information regarding fiscal year to date income earned by the Fund from investments in Fidelity Central Funds is as follows: |
Fund | Income earned |
Fidelity Cash Central Fund | $ 14,628 |
Fidelity Securities Lending Cash Central Fund | 83,364 |
Total | $ 97,992 |
Other Information |
The following is a summary of the inputs used, as of January 31, 2013, involving the Fund's assets and liabilities carried at fair value. The inputs or methodology used for valuing securities may not be an indication of the risk associated with investing in those securities. For more information on valuation inputs, and their aggregation into the levels used in the table below, please refer to the Investment Valuation section in the accompanying Notes to Financial Statements. |
Valuation Inputs at Reporting Date: |
Description | Total | Level 1 | Level 2 | Level 3 |
Investments in Securities: | | | | |
Equities: | | | | |
Consumer Discretionary | $ 36,418,568 | $ 36,418,568 | $ - | $ - |
Consumer Staples | 36,376,809 | 36,376,809 | - | - |
Energy | 81,408,049 | 81,408,049 | - | - |
Financials | 129,062,046 | 127,492,806 | 1,569,240 | - |
Health Care | 55,532,964 | 55,532,964 | - | - |
Industrials | 50,373,859 | 50,373,859 | - | - |
Information Technology | 28,700,567 | 28,700,567 | - | - |
Valuation Inputs at Reporting Date: |
Description | Total | Level 1 | Level 2 | Level 3 |
Investments in Securities: | | | | |
Equities: | | | | |
Materials | $ 22,254,956 | $ 22,254,956 | $ - | $ - |
Telecommunication Services | 14,195,982 | 14,195,982 | - | - |
Utilities | 32,543,935 | 32,543,935 | - | - |
U.S. Government and Government Agency Obligations | 349,992 | - | 349,992 | - |
Money Market Funds | 16,944,843 | 16,944,843 | - | - |
Total Investments in Securities: | $ 504,162,570 | $ 502,243,338 | $ 1,919,232 | $ - |
Derivative Instruments: | | | | |
Assets | | | | |
Futures Contracts | $ 329,222 | $ 329,222 | $ - | $ - |
Value of Derivative Instruments |
The following table is a summary of the Fund's value of derivative instruments by primary risk exposure as of January 31, 2013. For additional information on derivative instruments, please refer to the Derivative Instruments section in the accompanying Notes to Financial Statements. |
Primary Risk Exposure /
Derivative Type | Value |
| Asset | Liability |
Equity Risk | | |
Futures Contracts (a) | $ 329,222 | $ - |
Total Value of Derivatives | $ 329,222 | $ - |
(a) Reflects cumulative appreciation/(depreciation) on futures contracts as disclosed on the Schedule of Investments. Only the period end variation margin is separately disclosed on the Statement of Assets and Liabilities. |
Distribution of investments by country or territory of incorporation, as a percentage of total net assets, is as follows. (Unaudited) |
United States of America | 86.4% |
Canada | 3.4% |
United Kingdom | 3.2% |
Bermuda | 1.7% |
Switzerland | 1.5% |
Netherlands | 1.1% |
Puerto Rico | 1.0% |
Others (Individually Less Than 1%) | 1.7% |
| 100.0% |
See accompanying notes which are an integral part of the financial statements.
Annual Report
Statement of Assets and Liabilities
| January 31, 2013 |
| | |
Assets | | |
Investment in securities, at value (including securities loaned of $2,427,252) - See accompanying schedule: Unaffiliated issuers (cost $456,830,839) | $ 487,217,727 | |
Fidelity Central Funds (cost $16,944,843) | 16,944,843 | |
Total Investments (cost $473,775,682) | | $ 504,162,570 |
Cash | | 80,975 |
Receivable for investments sold | | 11,296,000 |
Receivable for fund shares sold | | 704,709 |
Dividends receivable | | 576,214 |
Distributions receivable from Fidelity Central Funds | | 9,803 |
Prepaid expenses | | 953 |
Other receivables | | 66,048 |
Total assets | | 516,897,272 |
| | |
Liabilities | | |
Payable for investments purchased | $ 12,573,953 | |
Payable for fund shares redeemed | 1,551,844 | |
Accrued management fee | 122,882 | |
Distribution and service plan fees payable | 12,492 | |
Payable for daily variation margin on futures contracts | 17,820 | |
Other affiliated payables | 111,610 | |
Other payables and accrued expenses | 51,495 | |
Collateral on securities loaned, at value | 2,495,750 | |
Total liabilities | | 16,937,846 |
| | |
Net Assets | | $ 499,959,426 |
Net Assets consist of: | | |
Paid in capital | | $ 819,564,735 |
Undistributed net investment income | | 393,853 |
Accumulated undistributed net realized gain (loss) on investments and foreign currency transactions | | (350,714,578) |
Net unrealized appreciation (depreciation) on investments and assets and liabilities in foreign currencies | | 30,715,416 |
Net Assets | | $ 499,959,426 |
See accompanying notes which are an integral part of the financial statements.
Annual Report
Financial Statements - continued
Statement of Assets and Liabilities - continued
| January 31, 2013 |
| | |
Calculation of Maximum Offering Price Class A:
Net Asset Value and redemption price per share ($18,234,003 ÷ 1,466,542 shares) | | $ 12.43 |
| | |
Maximum offering price per share (100/94.25 of $12.43) | | $ 13.19 |
Class T:
Net Asset Value and redemption price per share ($6,544,090 ÷ 526,045 shares) | | $ 12.44 |
| | |
Maximum offering price per share (100/96.50 of $12.44) | | $ 12.89 |
Class B:
Net Asset Value and offering price per share ($1,645,104 ÷ 132,267 shares)A | | $ 12.44 |
| | |
Class C:
Net Asset Value and offering price per share ($5,838,546 ÷ 474,748 shares)A | | $ 12.30 |
| | |
| | |
Stock Selector Large Cap Value:
Net Asset Value, offering price and redemption price per share ($465,702,312 ÷ 37,229,744 shares) | | $ 12.51 |
| | |
Institutional Class:
Net Asset Value, offering price and redemption price per share ($1,995,371 ÷ 160,151 shares) | | $ 12.46 |
A Redemption price per share is equal to net asset value less any applicable contingent deferred sales charge.
See accompanying notes which are an integral part of the financial statements.
Annual Report
Statement of Operations
| Year ended January 31, 2013 |
| | |
Investment Income | | |
Dividends | | $ 12,667,163 |
Interest | | 322 |
Income from Fidelity Central Funds | | 97,992 |
Total income | | 12,765,477 |
| | |
Expenses | | |
Management fee
Basic fee | $ 2,743,221 | |
Performance adjustment | (1,495,660) | |
Transfer agent fees | 1,224,930 | |
Distribution and service plan fees | 140,831 | |
Accounting and security lending fees | 191,707 | |
Custodian fees and expenses | 29,588 | |
Independent trustees' compensation | 3,240 | |
Registration fees | 78,048 | |
Audit | 55,888 | |
Legal | 2,369 | |
Miscellaneous | 5,245 | |
Total expenses before reductions | 2,979,407 | |
Expense reductions | (130,264) | 2,849,143 |
Net investment income (loss) | | 9,916,334 |
Realized and Unrealized Gain (Loss) Net realized gain (loss) on: | | |
Investment securities: | | |
Unaffiliated issuers | 28,785,348 | |
Foreign currency transactions | 30,679 | |
Futures contracts | 853,784 | |
Total net realized gain (loss) | | 29,669,811 |
Change in net unrealized appreciation (depreciation) on: Investment securities | 43,634,270 | |
Assets and liabilities in foreign currencies | (694) | |
Futures contracts | 326,645 | |
Total change in net unrealized appreciation (depreciation) | | 43,960,221 |
Net gain (loss) | | 73,630,032 |
Net increase (decrease) in net assets resulting from operations | | $ 83,546,366 |
See accompanying notes which are an integral part of the financial statements.
Annual Report
Financial Statements - continued
Statement of Changes in Net Assets
| Year ended
January 31,
2013 | Year ended
January 31,
2012 |
Increase (Decrease) in Net Assets | | |
Operations | | |
Net investment income (loss) | $ 9,916,334 | $ 10,198,233 |
Net realized gain (loss) | 29,669,811 | 82,077,771 |
Change in net unrealized appreciation (depreciation) | 43,960,221 | (80,818,055) |
Net increase (decrease) in net assets resulting
from operations | 83,546,366 | 11,457,949 |
Distributions to shareholders from net investment income | (9,512,706) | (10,179,715) |
Share transactions - net increase (decrease) | (89,844,793) | (323,065,032) |
Total increase (decrease) in net assets | (15,811,133) | (321,786,798) |
| | |
Net Assets | | |
Beginning of period | 515,770,559 | 837,557,357 |
End of period (including undistributed net investment income of $393,853 and distributions in excess of net investment income of $41,141, respectively) | $ 499,959,426 | $ 515,770,559 |
See accompanying notes which are an integral part of the financial statements.
Annual Report
Financial Highlights - Class A
Years ended January 31, | 2013 | 2012 | 2011 | 2010 | 2009 |
Selected Per-Share Data | | | | | |
Net asset value, beginning of period | $ 10.71 | $ 10.72 | $ 9.35 | $ 7.53 | $ 13.54 |
Income from Investment Operations | | | | | |
Net investment income (loss) C | .20 | .14 | .09 | .09 | .16 |
Net realized and unrealized gain (loss) | 1.73 | .02 | 1.38 | 1.85 | (6.00) |
Total from investment operations | 1.93 | .16 | 1.47 | 1.94 | (5.84) |
Distributions from net investment income | (.21) | (.17) | (.10) | (.12) | (.17) |
Net asset value, end of period | $ 12.43 | $ 10.71 | $ 10.72 | $ 9.35 | $ 7.53 |
Total Return A, B | 18.15% | 1.58% | 15.79% | 25.74% | (43.20)% |
Ratios to Average Net Assets D, F | | | | | |
Expenses before reductions | .87% | .87% | 1.00% | 1.15% | 1.17% |
Expenses net of fee waivers, if any | .87% | .87% | 1.00% | 1.15% | 1.17% |
Expenses net of all reductions | .85% | .86% | 1.00% | 1.13% | 1.17% |
Net investment income (loss) | 1.74% | 1.38% | .87% | 1.08% | 1.47% |
Supplemental Data | | | | | |
Net assets, end of period (000 omitted) | $ 18,234 | $ 18,900 | $ 20,815 | $ 23,778 | $ 22,577 |
Portfolio turnover rate E | 63% | 128% | 120% | 171% | 243% |
A Total returns would have been lower if certain expenses had not been reduced during the applicable periods shown.
B Total returns do not include the effect of the sales charges.
C Calculated based on average shares outstanding during the period.
D Fees and expenses of any underlying Fidelity Central Funds are not included in the Fund's expense ratio. The Fund indirectly bears its proportionate share of the expenses of any underlying Fidelity Central Funds.
E Amount does not include the portfolio activity of any underlying Fidelity Central Funds.
F Expense ratios reflect operating expenses of the class. Expenses before reductions do not reflect amounts reimbursed by the investment adviser or reductions from brokerage service arrangements or reductions from other expense offset arrangements and do not represent the amount paid by the class during periods when reimbursements or reductions occur. Expenses net of fee waivers reflect expenses after reimbursement by the investment adviser but prior to reductions from brokerage service arrangements or other expense offset arrangements. Expenses net of all reductions represent the net expenses paid by the class.
See accompanying notes which are an integral part of the financial statements.
Annual Report
Financial Highlights - Class T
Years ended January 31, | 2013 | 2012 | 2011 | 2010 | 2009 |
Selected Per-Share Data | | | | | |
Net asset value, beginning of period | $ 10.72 | $ 10.74 | $ 9.36 | $ 7.54 | $ 13.53 |
Income from Investment Operations | | | | | |
Net investment income (loss) C | .17 | .12 | .06 | .07 | .12 |
Net realized and unrealized gain (loss) | 1.73 | .01 | 1.39 | 1.84 | (5.97) |
Total from investment operations | 1.90 | .13 | 1.45 | 1.91 | (5.85) |
Distributions from net investment income | (.18) | (.15) | (.07) | (.09) | (.14) |
Net asset value, end of period | $ 12.44 | $ 10.72 | $ 10.74 | $ 9.36 | $ 7.54 |
Total Return A, B | 17.88% | 1.26% | 15.50% | 25.30% | (43.34)% |
Ratios to Average Net Assets D, F | | | | | |
Expenses before reductions | 1.14% | 1.14% | 1.29% | 1.45% | 1.49% |
Expenses net of fee waivers, if any | 1.14% | 1.14% | 1.29% | 1.45% | 1.49% |
Expenses net of all reductions | 1.12% | 1.13% | 1.28% | 1.44% | 1.49% |
Net investment income (loss) | 1.48% | 1.11% | .59% | .78% | 1.15% |
Supplemental Data | | | | | |
Net assets, end of period (000 omitted) | $ 6,544 | $ 5,603 | $ 5,625 | $ 9,101 | $ 9,792 |
Portfolio turnover rate E | 63% | 128% | 120% | 171% | 243% |
A Total returns would have been lower if certain expenses had not been reduced during the applicable periods shown.
B Total returns do not include the effect of the sales charges.
C Calculated based on average shares outstanding during the period.
D Fees and expenses of any underlying Fidelity Central Funds are not included in the Fund's expense ratio. The Fund indirectly bears its proportionate share of the expenses of any underlying Fidelity Central Funds.
E Amount does not include the portfolio activity of any underlying Fidelity Central Funds.
F Expense ratios reflect operating expenses of the class. Expenses before reductions do not reflect amounts reimbursed by the investment adviser or reductions from brokerage service arrangements or reductions from other expense offset arrangements and do not represent the amount paid by the class during periods when reimbursements or reductions occur. Expenses net of fee waivers reflect expenses after reimbursement by the investment adviser but prior to reductions from brokerage service arrangements or other expense offset arrangements. Expenses net of all reductions represent the net expenses paid by the class.
See accompanying notes which are an integral part of the financial statements.
Annual Report
Financial Highlights - Class B
Years ended January 31, | 2013 | 2012 | 2011 | 2010 | 2009 |
Selected Per-Share Data | | | | | |
Net asset value, beginning of period | $ 10.72 | $ 10.72 | $ 9.35 | $ 7.53 | $ 13.54 |
Income from Investment Operations | | | | | |
Net investment income (loss) C | .11 | .07 | .01 | .02 | .07 |
Net realized and unrealized gain (loss) | 1.73 | .02 | 1.38 | 1.85 | (5.98) |
Total from investment operations | 1.84 | .09 | 1.39 | 1.87 | (5.91) |
Distributions from net investment income | (.12) | (.09) | (.02) | (.05) | (.10) |
Net asset value, end of period | $ 12.44 | $ 10.72 | $ 10.72 | $ 9.35 | $ 7.53 |
Total Return A, B | 17.24% | .86% | 14.87% | 24.79% | (43.71)% |
Ratios to Average Net Assets D, F | | | | | |
Expenses before reductions | 1.63% | 1.62% | 1.80% | 1.98% | 2.07% |
Expenses net of fee waivers, if any | 1.63% | 1.62% | 1.80% | 1.98% | 2.00% |
Expenses net of all reductions | 1.60% | 1.62% | 1.79% | 1.97% | 2.00% |
Net investment income (loss) | .99% | .63% | .08% | .24% | .64% |
Supplemental Data | | | | | |
Net assets, end of period (000 omitted) | $ 1,645 | $ 1,819 | $ 2,274 | $ 2,711 | $ 2,600 |
Portfolio turnover rate E | 63% | 128% | 120% | 171% | 243% |
A Total returns would have been lower if certain expenses had not been reduced during the applicable periods shown.
B Total returns do not include the effect of the contingent deferred sales charge.
C Calculated based on average shares outstanding during the period.
D Fees and expenses of any underlying Fidelity Central Funds are not included in the Fund's expense ratio. The Fund indirectly bears its proportionate share of the expenses of any underlying Fidelity Central Funds.
E Amount does not include the portfolio activity of any underlying Fidelity Central Funds.
F Expense ratios reflect operating expenses of the class. Expenses before reductions do not reflect amounts reimbursed by the investment adviser or reductions from brokerage service arrangements or reductions from other expense offset arrangements and do not represent the amount paid by the class during periods when reimbursements or reductions occur. Expenses net of fee waivers reflect expenses after reimbursement by the investment adviser but prior to reductions from brokerage service arrangements or other expense offset arrangements. Expenses net of all reductions represent the net expenses paid by the class.
See accompanying notes which are an integral part of the financial statements.
Annual Report
Financial Highlights - Class C
Years ended January 31, | 2013 | 2012 | 2011 | 2010 | 2009 |
Selected Per-Share Data | | | | | |
Net asset value, beginning of period | $ 10.61 | $ 10.63 | $ 9.30 | $ 7.49 | $ 13.52 |
Income from Investment Operations | | | | | |
Net investment income (loss) C | .11 | .07 | .01 | .03 | .08 |
Net realized and unrealized gain (loss) | 1.72 | .01 | 1.36 | 1.84 | (5.97) |
Total from investment operations | 1.83 | .08 | 1.37 | 1.87 | (5.89) |
Distributions from net investment income | (.14) | (.10) | (.04) | (.06) | (.14) |
Net asset value, end of period | $ 12.30 | $ 10.61 | $ 10.63 | $ 9.30 | $ 7.49 |
Total Return A, B | 17.32% | .85% | 14.79% | 24.97% | (43.65)% |
Ratios to Average Net Assets D, F | | | | | |
Expenses before reductions | 1.63% | 1.62% | 1.75% | 1.89% | 1.91% |
Expenses net of fee waivers, if any | 1.63% | 1.62% | 1.75% | 1.89% | 1.91% |
Expenses net of all reductions | 1.61% | 1.61% | 1.74% | 1.88% | 1.91% |
Net investment income (loss) | .99% | .63% | .13% | .34% | .73% |
Supplemental Data | | | | | |
Net assets, end of period (000 omitted) | $ 5,839 | $ 4,979 | $ 3,959 | $ 3,491 | $ 2,352 |
Portfolio turnover rate E | 63% | 128% | 120% | 171% | 243% |
A Total returns would have been lower if certain expenses had not been reduced during the applicable periods shown.
B Total returns do not include the effect of the contingent deferred sales charge.
C Calculated based on average shares outstanding during the period.
D Fees and expenses of any underlying Fidelity Central Funds are not included in the Fund's expense ratio. The Fund indirectly bears its proportionate share of the expenses of any underlying Fidelity Central Funds.
E Amount does not include the portfolio activity of any underlying Fidelity Central Funds.
F Expense ratios reflect operating expenses of the class. Expenses before reductions do not reflect amounts reimbursed by the investment adviser or reductions from brokerage service arrangements or reductions from other expense offset arrangements and do not represent the amount paid by the class during periods when reimbursements or reductions occur. Expenses net of fee waivers reflect expenses after reimbursement by the investment adviser but prior to reductions from brokerage service arrangements or other expense offset arrangements. Expenses net of all reductions represent the net expenses paid by the class.
See accompanying notes which are an integral part of the financial statements.
Annual Report
Financial Highlights - Stock Selector Large Cap Value
Years ended January 31, | 2013 | 2012 | 2011 | 2010 | 2009 |
Selected Per-Share Data | | | | | |
Net asset value, beginning of period | $ 10.77 | $ 10.78 | $ 9.40 | $ 7.56 | $ 13.57 |
Income from Investment Operations | | | | | |
Net investment income (loss) B | .23 | .18 | .11 | .12 | .20 |
Net realized and unrealized gain (loss) | 1.75 | .01 | 1.40 | 1.86 | (6.02) |
Total from investment operations | 1.98 | .19 | 1.51 | 1.98 | (5.82) |
Distributions from net investment income | (.24) | (.20) | (.13) | (.14) | (.19) |
Net asset value, end of period | $ 12.51 | $ 10.77 | $ 10.78 | $ 9.40 | $ 7.56 |
Total Return A | 18.55% | 1.85% | 16.09% | 26.21% | (43.03)% |
Ratios to Average Net Assets C, E | | | | | |
Expenses before reductions | .57% | .57% | .73% | .85% | .86% |
Expenses net of fee waivers, if any | .57% | .57% | .73% | .85% | .86% |
Expenses net of all reductions | .55% | .56% | .72% | .84% | .86% |
Net investment income (loss) | 2.05% | 1.68% | 1.15% | 1.38% | 1.78% |
Supplemental Data | | | | | |
Net assets, end of period (000 omitted) | $ 465,702 | $ 482,950 | $ 803,009 | $ 914,828 | $ 916,490 |
Portfolio turnover rate D | 63% | 128% | 120% | 171% | 243% |
A Total returns would have been lower if certain expenses had not been reduced during the applicable periods shown.
B Calculated based on average shares outstanding during the period.
C Fees and expenses of any underlying Fidelity Central Funds are not included in the Fund's expense ratio. The Fund indirectly bears its proportionate share of the expenses of any underlying Fidelity Central Funds.
D Amount does not include the portfolio activity of any underlying Fidelity Central Funds.
E Expense ratios reflect operating expenses of the class. Expenses before reductions do not reflect amounts reimbursed by the investment adviser or reductions from brokerage service arrangements or reductions from other expense offset arrangements and do not represent the amount paid by the class during periods when reimbursements or reductions occur. Expenses net of fee waivers reflect expenses after reimbursement by the investment adviser but prior to reductions from brokerage service arrangements or other expense offset arrangements. Expenses net of all reductions represent the net expenses paid by the class.
See accompanying notes which are an integral part of the financial statements.
Annual Report
Financial Highlights - Institutional Class
Years ended January 31, | 2013 | 2012 | 2011 | 2010 | 2009 |
Selected Per-Share Data | | | | | |
Net asset value, beginning of period | $ 10.74 | $ 10.74 | $ 9.37 | $ 7.54 | $ 13.54 |
Income from Investment Operations | | | | | |
Net investment income (loss) B | .23 | .17 | .11 | .12 | .20 |
Net realized and unrealized gain (loss) | 1.73 | .02 | 1.39 | 1.85 | (6.01) |
Total from investment operations | 1.96 | .19 | 1.50 | 1.97 | (5.81) |
Distributions from net investment income | (.24) | (.19) | (.13) | (.14) | (.19) |
Net asset value, end of period | $ 12.46 | $ 10.74 | $ 10.74 | $ 9.37 | $ 7.54 |
Total Return A | 18.42% | 1.92% | 16.04% | 26.18% | (43.00)% |
Ratios to Average Net Assets C, E | | | | | |
Expenses before reductions | .61% | .60% | .74% | .87% | .85% |
Expenses net of fee waivers, if any | .61% | .60% | .74% | .87% | .85% |
Expenses net of all reductions | .58% | .60% | .73% | .86% | .85% |
Net investment income (loss) | 2.01% | 1.65% | 1.14% | 1.36% | 1.79% |
Supplemental Data | | | | | |
Net assets, end of period (000 omitted) | $ 1,995 | $ 1,519 | $ 1,876 | $ 2,279 | $ 1,304 |
Portfolio turnover rate D | 63% | 128% | 120% | 171% | 243% |
A Total returns would have been lower if certain expenses had not been reduced during the applicable periods shown.
B Calculated based on average shares outstanding during the period.
C Fees and expenses of any underlying Fidelity Central Funds are not included in the Fund's expense ratio. The Fund indirectly bears its proportionate share of the expenses of any underlying Fidelity Central Funds.
D Amount does not include the portfolio activity of any underlying Fidelity Central Funds.
E Expense ratios reflect operating expenses of the class. Expenses before reductions do not reflect amounts reimbursed by the investment adviser or reductions from brokerage service arrangements or reductions from other expense offset arrangements and do not represent the amount paid by the class during periods when reimbursements or reductions occur. Expenses net of fee waivers reflect expenses after reimbursement by the investment adviser but prior to reductions from brokerage service arrangements or other expense offset arrangements. Expenses net of all reductions represent the net expenses paid by the class.
See accompanying notes which are an integral part of the financial statements.
Annual Report
Notes to Financial Statements
For the period ended January 31, 2013
1. Organization.
Fidelity Stock Selector Large Cap Value Fund (the Fund) is a fund of Fidelity Devonshire Trust (the Trust) and is authorized to issue an unlimited number of shares. The Trust is registered under the Investment Company Act of 1940, as amended (the 1940 Act), as an open-end management investment company organized as a Massachusetts business trust. The Fund offers Class A, Class T, Class C, Stock Selector Large Cap Value and Institutional Class shares, each of which, along with Class B shares, has equal rights as to assets and voting privileges. Class B shares are closed to new accounts and additional purchases, except for exchanges and reinvestments. Each class has exclusive voting rights with respect to matters that affect that class. Class B shares will automatically convert to Class A shares after a holding period of seven years from the initial date of purchase. Investment income, realized and unrealized capital gains and losses, the common expenses of the Fund, and certain fund-level expense reductions, if any, are allocated on a pro-rata basis to each class based on the relative net assets of each class to the total net assets of the Fund. Each class differs with respect to transfer agent and distribution and service plan fees incurred. Certain expense reductions may also differ by class.
2. Investments in Fidelity Central Funds.
The Fund invests in Fidelity Central Funds, which are open-end investment companies available only to other investment companies and accounts managed by Fidelity Management & Research Company (FMR) and its affiliates. The Fund's Schedule of Investments lists each of the Fidelity Central Funds held as of period end, if any, as an investment of the Fund, but does not include the underlying holdings of each Fidelity Central Fund. As an Investing Fund, the Fund indirectly bears its proportionate share of the expenses of the underlying Fidelity Central Funds.
The Money Market Central Funds seek preservation of capital and current income and are managed by Fidelity Investments Money Management, Inc. (FIMM), an affiliate of FMR.
A complete unaudited list of holdings for each Fidelity Central Fund is available upon request or at the Securities and Exchange Commission (the SEC) website at www.sec.gov. In addition, the financial statements of the Fidelity Central Funds, which are not covered by the Fund's Report of Independent Registered Public Accounting Firm, are available on the SEC website or upon request.
3. Significant Accounting Policies.
The financial statements have been prepared in conformity with accounting principles generally accepted in the United States of America (GAAP), which require management to make certain estimates and assumptions at the date of the financial statements.
Annual Report
3. Significant Accounting Policies - continued
Actual results could differ from those estimates. Subsequent events, if any, through the date that the financial statements were issued have been evaluated in the preparation of the financial statements. The following summarizes the significant accounting policies of the Fund:
Investment Valuation. Investments are valued as of 4:00 p.m. Eastern time on the last calendar day of the period. In accordance with valuation policies and procedures approved by the Board of Trustees (the Board), the Fund attempts to obtain prices from one or more third party pricing vendors or brokers to value its investments. When current market prices, quotations or currency exchange rates are not readily available or reliable, investments will be fair valued in good faith by the FMR Fair Value Committee (the Committee), in accordance with procedures adopted by the Fund's Board. Factors used in determining fair value vary by investment type and may include market or investment specific events, changes in interest rates and credit quality. The frequency with which these procedures are used cannot be predicted and they may be utilized to a significant extent. The Committee oversees the Fund's valuation policies and procedures and is responsible for approving and reporting to the Board all fair value determinations.
The Fund categorizes the inputs to valuation techniques used to value its investments into a disclosure hierarchy consisting of three levels as shown below:
Level 1 - quoted prices in active markets for identical investments
Level 2 - other significant observable inputs (including quoted prices for similar investments, interest rates, prepayment speeds, etc.)
Level 3 - unobservable inputs (including the Fund's own assumptions based on the best information available)
Valuation techniques used to value the Fund's investments by major category are as follows:
Equity securities, including restricted securities, for which market quotations are readily available, are valued at the last reported sale price or official closing price as reported by a third party pricing vendor on the primary market or exchange on which they are traded and are categorized as Level 1 in the hierarchy. In the event there were no sales during the day or closing prices are not available, securities are valued at the last quoted bid price or may be valued using the last available price and are generally categorized as Level 2 in the hierarchy. For foreign equity securities, when significant market or security specific events arise, comparisons to the valuation of American Depositary Receipts (ADRs), futures contracts, Exchange-Traded Funds (ETFs) and certain indexes as well as quoted prices for similar securities are used and are categorized as Level 2 in the hierarchy. Utilizing these techniques may result in transfers between Level 1 and Level 2.
Annual Report
Notes to Financial Statements - continued
3. Significant Accounting Policies - continued
Investment Valuation - continued
For restricted equity securities and private placements where observable inputs are limited, assumptions about market activity and risk are used and these securities are generally categorized as Level 3 in the hierarchy.
Debt securities, including restricted securities, are valued based on evaluated prices received from third party pricing vendors or from brokers who make markets in such securities. For U.S. government and government agency obligations, pricing vendors utilize matrix pricing which considers yield or price of bonds of comparable quality, coupon, maturity and type as well as broker-supplied prices. When independent prices are unavailable or unreliable, debt securities may be valued utilizing pricing methodologies which consider similar factors that would be used by third party pricing vendors. Debt securities are generally categorized as Level 2 in the hierarchy but may be Level 3 depending on the circumstances.
Futures contracts are valued at the settlement price established each day by the board of trade or exchange on which they are traded and are categorized as Level 1 in the hierarchy. Investments in open-end mutual funds, including the Fidelity Central Funds, are valued at their closing net asset value (NAV) each business day and are categorized as Level 1 in the hierarchy.
Changes in valuation techniques may result in transfers in or out of an assigned level within the disclosure hierarchy. The aggregate value of investments by input level, as of January 31, 2013, is included at the end of the Fund's Schedule of Investments.
Foreign Currency. The Fund may use foreign currency contracts to facilitate transactions in foreign-denominated securities. Gains and losses from these transactions may arise from changes in the value of the foreign currency or if the counterparties do not perform under the contracts' terms.
Foreign-denominated assets, including investment securities, and liabilities are translated into U.S. dollars at the exchange rates at period end. Purchases and sales of investment securities, income and dividends received and expenses denominated in foreign currencies are translated into U.S. dollars at the exchange rate in effect on the transaction date.
The effects of exchange rate fluctuations on investments are included with the net realized and unrealized gain (loss) on investment securities. Other foreign currency transactions resulting in realized and unrealized gain (loss) are disclosed separately.
Investment Transactions and Income. For financial reporting purposes, the Fund's investment holdings and NAV include trades executed through the end of the last business day of the period. The NAV per share for processing shareholder transactions is
Annual Report
3. Significant Accounting Policies - continued
Investment Transactions and Income - continued
calculated as of the close of business of the New York Stock Exchange (NYSE), normally 4:00 p.m. Eastern time and includes trades executed through the end of the prior business day. Gains and losses on securities sold are determined on the basis of identified cost and may include proceeds received from litigation. Dividend income is recorded on the ex-dividend date, except for certain dividends from foreign securities where the ex-dividend date may have passed, which are recorded as soon as the Fund is informed of the ex-dividend date. Non-cash dividends included in dividend income, if any, are recorded at the fair market value of the securities received. Distributions received on securities that represent a return of capital or capital gain are recorded as a reduction of cost of investments and/or as a realized gain. The Fund estimates the components of distributions received that may be considered return of capital distributions or capital gain distributions. Interest income and distributions from the Fidelity Central Funds are accrued as earned. Interest income includes coupon interest and amortization of premium and accretion of discount on debt securities. Investment income is recorded net of foreign taxes withheld where recovery of such taxes is uncertain.
Expenses. Expenses directly attributable to a fund are charged to that fund. Expenses attributable to more than one fund are allocated among the respective funds on the basis of relative net assets or other appropriate methods. Expense estimates are accrued in the period to which they relate and adjustments are made when actual amounts are known.
Income Tax Information and Distributions to Shareholders. Each year, the Fund intends to qualify as a regulated investment company under Subchapter M of the Internal Revenue Code, including distributing substantially all of its taxable income and realized gains. As a result, no provision for income taxes is required. As of January 31, 2013, the Fund did not have any unrecognized tax benefits in the financial statements; nor is the Fund aware of any tax positions for which it is reasonably possible that the total amounts of unrecognized tax benefits will significantly change in the next twelve months. The Fund files a U.S. federal tax return, in addition to state and local tax returns as required. A fund's federal income tax returns are subject to examination by the Internal Revenue Service (IRS) for a period of three fiscal years after they are filed. State and local tax returns may be subject to examination for an additional fiscal year depending on the jurisdiction. Foreign taxes are provided for based on the Fund's understanding of the tax rules and rates that exist in the foreign markets in which it invests.
Distributions are declared and recorded on the ex-dividend date. Income dividends and capital gain distributions are declared separately for each class. Income and capital gain distributions are determined in accordance with income tax regulations, which may differ from GAAP.
Annual Report
Notes to Financial Statements - continued
3. Significant Accounting Policies - continued
Income Tax Information and Distributions to Shareholders - continued
Capital accounts within the financial statements are adjusted for permanent book-tax differences. These adjustments have no impact on net assets or the results of operations. Temporary book-tax differences will reverse in a subsequent period.
Book-tax differences are primarily due to futures contracts, foreign currency transactions, passive foreign investment companies (PFIC), capital loss carryforwards and losses deferred due to wash sales and excise tax regulations.
The federal tax cost of investment securities and unrealized appreciation (depreciation) as of period end were as follows:
Gross unrealized appreciation | $ 60,553,324 |
Gross unrealized depreciation | (36,375,847) |
Net unrealized appreciation (depreciation) on securities and other investments | $ 24,177,477 |
| |
Tax Cost | $ 479,985,093 |
The tax-based components of distributable earnings as of period end were as follows:
Undistributed ordinary income | $ 393,853 |
Capital loss carryforward | $ (344,175,945) |
Net unrealized appreciation (depreciation) | $ 24,506,005 |
Capital loss carryforwards are only available to offset future capital gains of the Fund to the extent provided by regulations and may be limited. Under the Regulated Investment Company Modernization Act of 2010 (the Act), the Fund is permitted to carry forward capital losses incurred in taxable years beginning after December 22, 2010 for an unlimited period and such capital losses are required to be used prior to any losses that expire. Capital loss carryforwards were as follows:
Fiscal year of expiration | |
| |
2017 | $ (156,071,106) |
2018 | (188,104,839) |
Total with expiration | $ (344,175,945) |
The tax character of distributions paid was as follows:
| January 31, 2013 | January 31, 2012 |
Ordinary Income | $ 9,512,706 | $ 10,179,715 |
Annual Report
3. Significant Accounting Policies - continued
Restricted Securities. The Fund may invest in securities that are subject to legal or contractual restrictions on resale. These securities generally may be resold in transactions exempt from registration or to the public if the securities are registered. Disposal of these securities may involve time-consuming negotiations and expense, and prompt sale at an acceptable price may be difficult. Information regarding restricted securities is included at the end of the Fund's Schedule of Investments.
New Accounting Pronouncement. In December 2011, the Financial Accounting Standards Board issued Accounting Standard Update No. 2011-11, Disclosures about Offsetting Assets and Liabilities. The update creates new disclosure requirements requiring entities to disclose both gross and net information for derivatives and other financial instruments that are either offset in the Statement of Assets and Liabilities or subject to an enforceable master netting arrangement or similar agreement. The disclosure requirements are effective for annual reporting periods beginning on or after January 1, 2013, and interim periods within those annual periods. Management is currently evaluating the impact of the update's adoption on the Fund's financial statement disclosures.
4. Derivative Instruments.
Risk Exposures and the Use of Derivative Instruments. The Fund's investment objective allows the Fund to enter into various types of derivative contracts, including futures contracts. Derivatives are investments whose value is primarily derived from underlying assets, indices or reference rates and may be transacted on an exchange or over-the-counter (OTC). Derivatives may involve a future commitment to buy or sell a specified asset based on specified terms, to exchange future cash flows at periodic intervals based on a notional principal amount, or for one party to make one or more payments upon the occurrence of specified events in exchange for periodic payments from the other party.
The Fund used derivatives to increase returns and to manage exposure to certain risks as defined below. The success of any strategy involving derivatives depends on analysis of numerous economic factors, and if the strategies for investment do not work as intended, the Fund may not achieve its objectives.
The Fund's use of derivatives increased or decreased its exposure to the following risk:
Equity Risk | Equity risk relates to the fluctuations in the value of financial instruments as a result of changes in market prices (other than those arising from interest rate risk or foreign exchange risk), whether caused by factors specific to an individual investment, its issuer, or all factors affecting all instruments traded in a market or market segment. |
Annual Report
Notes to Financial Statements - continued
4. Derivative Instruments - continued
Risk Exposures and the Use of Derivative Instruments - continued
The Fund is also exposed to additional risks from investing in derivatives, such as liquidity risk and counterparty credit risk. Liquidity risk is the risk that the Fund will be unable to close out the derivative in the open market in a timely manner. Counterparty credit risk is the risk that the counterparty will not be able to fulfill its obligation to the Fund. Counterparty credit risk related to exchange-traded futures contracts is mitigated by the protection provided by the exchange on which they trade.
Investing in derivatives may involve greater risks than investing in the underlying assets directly and, to varying degrees, may involve risk of loss in excess of any initial investment and collateral received and amounts recognized in the Statement of Assets and Liabilities. In addition, there may be the risk that the change in value of the derivative contract does not correspond to the change in value of the underlying instrument.
Futures Contracts. A futures contract is an agreement between two parties to buy or sell a specified underlying instrument for a fixed price at a specified future date. The Fund used futures contracts to manage its exposure to the stock market.
Upon entering into a futures contract, a fund is required to deposit either cash or securities (initial margin) with a clearing broker in an amount equal to a certain percentage of the face value of the contract. Futures contracts are marked-to-market daily and subsequent payments (variation margin) are made or received by a fund depending on the daily fluctuations in the value of the futures contracts and are recorded as unrealized appreciation or (depreciation). This receivable and/or payable, if any, is included in daily variation margin on futures contracts in the Statement of Assets and Liabilities. Realized gain or (loss) is recorded upon the expiration or closing of a futures contract.
Any open futures contracts at period end are presented in the Schedule of Investments under the caption "Futures Contracts." The underlying face amount at value reflects each contract's exposure to the underlying instrument or index at period end and is representative of activity for the period. Securities deposited to meet initial margin requirements are identified in the Schedule of Investments.
During the period the Fund recognized net realized gain (loss) of $853,784 and a change in net unrealized appreciation (depreciation) of $326,645 related to its investment in futures contracts. These amounts are included in the Statement of Operations.
5. Purchases and Sales of Investments.
Purchases and sales of securities, other than short-term securities, aggregated $304,000,483 and $399,010,186, respectively.
Annual Report
6. Fees and Other Transactions with Affiliates.
Management Fee. FMR and its affiliates provide the Fund with investment management related services for which the Fund pays a monthly management fee. The management fee is the sum of an individual fund fee rate that is based on an annual rate of .30% of the Fund's average net assets and an annualized group fee rate that averaged .26% during the period. The group fee rate is based upon the average net assets of all the mutual funds advised by FMR. The group fee rate decreases as assets under management increase and increases as assets under management decrease. In addition, the management fee is subject to a performance adjustment (up to a maximum of ± .20% of the Fund's average net assets over a 36 month performance period). The upward or downward adjustment to the management fee is based on the relative investment performance of Stock Selector Large Cap Value as compared to an appropriate benchmark index. For the period, the total annual management fee rate, including the performance adjustment, was .25% of the Fund's average net assets.
Distribution and Service Plan Fees. In accordance with Rule 12b-1 of the 1940 Act, the Fund has adopted separate Distribution and Service Plans for each class of shares. Certain classes pay Fidelity Distributors Corporation (FDC), an affiliate of FMR, separate Distribution and Service Fees, each of which is based on an annual percentage of each class' average net assets. In addition, FDC may pay financial intermediaries for selling shares of the Fund and providing shareholder support services. For the period, the Distribution and Service Fee rates, total fees and amounts retained by FDC were as follows:
| Distribution
Fee | Service
Fee | Total Fees | Retained
by FDC |
Class A | -% | .25% | $ 43,754 | $ 490 |
Class T | .25% | .25% | 29,408 | 168 |
Class B | .75% | .25% | 16,748 | 12,625 |
Class C | .75% | .25% | 50,921 | 14,959 |
| | | $ 140,831 | $ 28,242 |
Sales Load. FDC may receive a front-end sales charge of up to 5.75% for selling Class A shares and 3.50% for selling Class T shares, some of which is paid to financial intermediaries for selling shares of the Fund. Depending on the holding period, FDC may receive contingent deferred sales charges levied on Class A, Class T, Class B, and Class C redemptions. The deferred sales charges range from 5.00% to 1.00% for Class B shares, 1.00% for Class C shares, 1.00% for certain purchases of Class A shares and .25% for certain purchases of Class T shares.
Annual Report
Notes to Financial Statements - continued
6. Fees and Other Transactions with Affiliates - continued
Sales Load - continued
For the period, sales charge amounts retained by FDC were as follows:
| Retained
by FDC |
Class A | $ 6,859 |
Class T | 1,851 |
Class B* | 3,265 |
Class C* | 1,973 |
| $ 13,948 |
* When Class B and Class C shares are initially sold, FDC pays commissions from its own resources to financial intermediaries through which the sales are made.
Transfer Agent Fees. Fidelity Investments Institutional Operations Company, Inc. (FIIOC), an affiliate of FMR, is the transfer, dividend disbursing and shareholder servicing agent for each class of the Fund. FIIOC receives account fees and asset-based fees that vary according to the account size and type of account of the shareholders of the respective classes of the Fund. FIIOC pays for typesetting, printing and mailing of shareholder reports, except proxy statements. For the period, transfer agent fees for each class were as follows:
| Amount | % of
Average
Net Assets |
Class A | $ 51,877 | .30 |
Class T | 18,539 | .32 |
Class B | 5,041 | .30 |
Class C | 15,483 | .30 |
Stock Selector Large Cap Value | 1,128,822 | .25 |
Institutional Class | 5,168 | .28 |
| $ 1,224,930 | |
Accounting and Security Lending Fees. Fidelity Service Company, Inc. (FSC), an affiliate of FMR, maintains the Fund's accounting records. The accounting fee is based on the level of average net assets for each month. Under a separate contract, FSC administers the security lending program. The security lending fee is based on the number and duration of lending transactions.
Brokerage Commissions. The Fund placed a portion of its portfolio transactions with brokerage firms which are affiliates of the investment adviser. The commissions paid to these affiliated firms were $10,379 for the period.
Annual Report
7. Committed Line of Credit.
The Fund participates with other funds managed by FMR or an affiliate in a $4.25 billion credit facility (the "line of credit") to be utilized for temporary or emergency purposes to fund shareholder redemptions or for other short-term liquidity purposes. The Fund has agreed to pay commitment fees on its pro-rata portion of the line of credit, which amounted to $1,322 and is reflected in Miscellaneous expenses on the Statement of Operations. During the period, there were no borrowings on this line of credit.
8. Security Lending.
The Fund lends portfolio securities through a lending agent from time to time in order to earn additional income. For equity securities, a lending agent is used and may loan securities to certain qualified borrowers, including Fidelity Capital Markets (FCM), a broker-dealer affiliated with the Fund. On the settlement date of the loan, the Fund receives collateral (in the form of U.S. Treasury obligations, letters of credit and/or cash) against the loaned securities and maintains collateral in an amount not less than 100% of the market value of the loaned securities during the period of the loan. The market value of the loaned securities is determined at the close of business of the Fund and any additional required collateral is delivered to the Fund on the next business day. If the borrower defaults on its obligation to return the securities loaned because of insolvency or other reasons, a fund could experience delays and costs in recovering the securities loaned or in gaining access to the collateral. Any cash collateral received is invested in the Fidelity Securities Lending Cash Central Fund. The value of loaned securities and cash collateral at period end are disclosed on the Fund's Statement of Assets and Liabilities. The value of securities loaned to FCM at period end was $1,445,000. Security lending income represents the income earned on investing cash collateral, less rebates paid to borrowers and any lending agent fees associated with the loan, plus any premium payments received for lending certain types of securities. Security lending income is presented in the Statement of Operations as a component of income from Fidelity Central Funds. Total security lending income during the period amounted to $83,364, including $3,501 from securities loaned to FCM.
9. Expense Reductions.
Many of the brokers with whom FMR places trades on behalf of the Fund provided services to the Fund in addition to trade execution. These services included payments of certain expenses on behalf of the Fund totaling $130,264 for the period.
Annual Report
Notes to Financial Statements - continued
10. Distributions to Shareholders.
Distributions to shareholders of each class were as follows:
Years ended January 31, | 2013 | 2012 |
From net investment income | | |
Class A | $ 304,000 | $ 291,163 |
Class T | 93,858 | 76,828 |
Class B | 16,188 | 14,902 |
Class C | 63,927 | 43,527 |
Stock Selector Large Cap Value | 8,993,963 | 9,726,457 |
Institutional Class | 40,770 | 26,838 |
Total | $ 9,512,706 | $ 10,179,715 |
11. Share Transactions.
Transactions for each class of shares were as follows:
| Shares | Dollars |
Years ended January 31, | 2013 | 2012 | 2013 | 2012 |
Class A | | | | |
Shares sold | 251,269 | 537,296 | $ 2,848,724 | $ 5,591,381 |
Reinvestment of distributions | 24,461 | 26,981 | 281,542 | 272,774 |
Shares redeemed | (573,384) | (742,040) | (6,434,025) | (7,769,301) |
Net increase (decrease) | (297,654) | (177,763) | $ (3,303,759) | $ (1,905,146) |
Class T | | | | |
Shares sold | 131,721 | 164,778 | $ 1,501,274 | $ 1,752,467 |
Reinvestment of distributions | 8,058 | 7,415 | 92,826 | 75,038 |
Shares redeemed | (136,167) | (173,682) | (1,544,492) | (1,851,245) |
Net increase (decrease) | 3,612 | (1,489) | $ 49,608 | $ (23,740) |
Class B | | | | |
Shares sold | 1,157 | 9,062 | $ 13,142 | $ 86,884 |
Reinvestment of distributions | 1,236 | 1,307 | 14,255 | 13,227 |
Shares redeemed | (39,897) | (52,766) | (452,422) | (549,800) |
Net increase (decrease) | (37,504) | (42,397) | $ (425,025) | $ (449,689) |
Class C | | | | |
Shares sold | 162,948 | 201,797 | $ 1,812,867 | $ 2,080,198 |
Reinvestment of distributions | 4,869 | 3,605 | 55,503 | 36,155 |
Shares redeemed | (162,163) | (108,651) | (1,799,733) | (1,106,480) |
Net increase (decrease) | 5,654 | 96,751 | $ 68,637 | $ 1,009,873 |
Annual Report
11. Share Transactions - continued
| Shares | Dollars |
Years ended January 31, | 2013 | 2012 | 2013 | 2012 |
Stock Selector Large Cap Value | | | | |
Shares sold | 3,974,459 | 6,854,527 | $ 45,488,310 | $ 72,065,849 |
Reinvestment of distributions | 757,439 | 935,043 | 8,771,144 | 9,500,032 |
Shares redeemed | (12,329,354) | (37,479,739) | (140,694,347) | (402,880,177) |
Net increase (decrease) | (7,597,456) | (29,690,169) | $ (86,434,893) | $ (321,314,296) |
Institutional Class | | | | |
Shares sold | 54,716 | 58,013 | $ 619,947 | $ 608,335 |
Reinvestment of distributions | 3,536 | 2,632 | 40,770 | 26,662 |
Shares redeemed | (39,612) | (93,801) | (460,078) | (1,017,031) |
Net increase (decrease) | 18,640 | (33,156) | $ 200,639 | $ (382,034) |
12. Other.
The Fund's organizational documents provide former and current trustees and officers with a limited indemnification against liabilities arising in connection with the performance of their duties to the Fund. In the normal course of business, the Fund may also enter into contracts that provide general indemnifications. The Fund's maximum exposure under these arrangements is unknown as this would be dependent on future claims that may be made against the Fund. The risk of material loss from such claims is considered remote.
Annual Report
To the Trustees of Fidelity Devonshire Trust and the Shareholders of Fidelity Stock Selector Large Cap Value Fund:
In our opinion, the accompanying statement of assets and liabilities, including the schedule of investments, and the related statements of operations and of changes in net assets and the financial highlights present fairly, in all material respects, the financial position of Fidelity Stock Selector Large Cap Value Fund (a fund of Fidelity Devonshire Trust) at January 31, 2013, the results of its operations for the year then ended, the changes in its net assets for each of the two years in the period then ended and the financial highlights for each of the five years in the period then ended, in conformity with accounting principles generally accepted in the United States of America. These financial statements and financial highlights (hereafter referred to as "financial statements") are the responsibility of the Fidelity Stock Selector Large Cap Value Fund's management. Our responsibility is to express an opinion on these financial statements based on our audits. We conducted our audits of these financial statements in accordance with the standards of the Public Company Accounting Oversight Board (United States). Those standards require that we plan and perform the audit to obtain reasonable assurance about whether the financial statements are free of material misstatement. An audit includes examining, on a test basis, evidence supporting the amounts and disclosures in the financial statements, assessing the accounting principles used and significant estimates made by management, and evaluating the overall financial statement presentation. We believe that our audits, which included confirmation of securities at January 31, 2013 by correspondence with the custodian and brokers, provide a reasonable basis for our opinion.
PricewaterhouseCoopers LLP
Boston, Massachusetts
March 13, 2013
Annual Report
The Trustees, Members of the Advisory Board, and executive officers of the trust and fund, as applicable, are listed below. The Board of Trustees governs the fund and is responsible for protecting the interests of shareholders. The Trustees are experienced executives who meet periodically throughout the year to oversee the fund's activities, review contractual arrangements with companies that provide services to the fund, oversee management of the risks associated with such activities and contractual arrangements, and review the fund's performance. Except for James C. Curvey, each of the Trustees oversees 234 Fidelity funds. Mr. Curvey oversees 453 Fidelity funds.
The Trustees hold office without limit in time except that (a) any Trustee may resign; (b) any Trustee may be removed by written instrument, signed by at least two-thirds of the number of Trustees prior to such removal; (c) any Trustee who requests to be retired or who has become incapacitated by illness or injury may be retired by written instrument signed by a majority of the other Trustees; and (d) any Trustee may be removed at any special meeting of shareholders by a two-thirds vote of the outstanding voting securities of the trust. Each Trustee who is not an interested person (as defined in the 1940 Act) (Independent Trustee), shall retire not later than the last day of the calendar year in which his or her 75th birthday occurs. The Independent Trustees may waive this mandatory retirement age policy with respect to individual Trustees. The executive officers and Advisory Board Members hold office without limit in time, except that any officer and Advisory Board Member may resign or may be removed by a vote of a majority of the Trustees at any regular meeting or any special meeting of the Trustees. Except as indicated, each individual has held the office shown or other offices in the same company for the past five years.
Experience, Skills, Attributes, and Qualifications of the Fund's Trustees. The Governance and Nominating Committee has adopted a statement of policy that describes the experience, qualifications, attributes, and skills that are necessary and desirable for potential Independent Trustee candidates (Statement of Policy). The Board believes that each Trustee satisfied at the time he or she was initially elected or appointed a Trustee, and continues to satisfy, the standards contemplated by the Statement of Policy. The Governance and Nominating Committee also engages professional search firms to help identify potential Independent Trustee candidates who have the experience, qualifications, attributes, and skills consistent with the Statement of Policy. From time to time, additional criteria based on the composition and skills of the current Independent Trustees, as well as experience or skills that may be appropriate in light of future changes to board composition, business conditions, and regulatory or other developments, have also been considered by the professional search firms and the Governance and Nominating Committee. In addition, the Board takes into account the Trustees' commitment and participation in Board and committee meetings, as well as their leadership of standing and ad hoc committees throughout their tenure.
In determining that a particular Trustee was and continues to be qualified to serve as a Trustee, the Board has considered a variety of criteria, none of which, in isolation, was controlling. The Board believes that, collectively, the Trustees have balanced and diverse experience, qualifications, attributes, and skills, which allow the Board to operate effectively in governing the fund and protecting the interests of shareholders. Information about the specific experience, skills, attributes, and qualifications of each Trustee, which in each case led to the Board's conclusion that the Trustee should serve (or continue to serve) as a trustee of the fund, is provided below.
Annual Report
Board Structure and Oversight Function. James C. Curvey is an interested person (as defined in the 1940 Act) and currently serves as Chairman. The Trustees have determined that an interested Chairman is appropriate and benefits shareholders because an interested Chairman has a personal and professional stake in the quality and continuity of services provided to the fund. Independent Trustees exercise their informed business judgment to appoint an individual of their choosing to serve as Chairman, regardless of whether the Trustee happens to be independent or a member of management. The Independent Trustees have determined that they can act independently and effectively without having an Independent Trustee serve as Chairman and that a key structural component for assuring that they are in a position to do so is for the Independent Trustees to constitute a substantial majority for the Board. The Independent Trustees also regularly meet in executive session. Ned C. Lautenbach serves as Chairman of the Independent Trustees and as such (i) acts as a liaison between the Independent Trustees and management with respect to matters important to the Independent Trustees and (ii) with management prepares agendas for Board meetings.
Fidelity funds are overseen by different Boards of Trustees. The fund's Board oversees Fidelity's equity and high income funds and another Board oversees Fidelity's investment-grade bond, money market, and asset allocation funds. The asset allocation funds may invest in Fidelity funds overseen by the fund's Board. The use of separate Boards, each with its own committee structure, allows the Trustees of each group of Fidelity funds to focus on the unique issues of the funds they oversee, including common research, investment, and operational issues. On occasion, the separate Boards establish joint committees to address issues of overlapping consequences for the Fidelity funds overseen by each Board.
The Trustees operate using a system of committees to facilitate the timely and efficient consideration of all matters of importance to the Trustees, the fund, and fund shareholders and to facilitate compliance with legal and regulatory requirements and oversight of the fund's activities and associated risks. The Board, acting through its committees, has charged FMR and its affiliates with (i) identifying events or circumstances the occurrence of which could have demonstrably adverse effects on the fund's business and/or reputation; (ii) implementing processes and controls to lessen the possibility that such events or circumstances occur or to mitigate the effects of such events or circumstances if they do occur; and (iii) creating and maintaining a system designed to evaluate continuously business and market conditions in order to facilitate the identification and implementation processes described in (i) and (ii) above. Because the day-to-day operations and activities of the fund are carried out by or through FMR, its affiliates and other service providers, the fund's exposure to risks is mitigated but not eliminated by the processes overseen by the Trustees. While each of the Board's committees has responsibility for overseeing different aspects of the fund's activities, oversight is exercised primarily through the Operations, Audit, and Compliance Committees. In addition, the Independent Trustees have worked with FMR to enhance the Board's oversight of investment and financial risks, legal and regulatory risks, technology risks, and operational risks, including the development of additional risk reporting to the Board. For example, a working group comprised of Independent Trustees and FMR has worked and continues to work to review the Fidelity funds' valuation-related activities, reporting and risk management. Appropriate personnel, including but not limited to the fund's Chief Compliance Officer (CCO), FMR's internal auditor, the independent accountants, the fund's Treasurer and portfolio management personnel, make periodic reports to the Board's committees, as appropriate, including an annual review of FMR's risk management program for the Fidelity funds. The responsibilities of each standing committee, including their oversight responsibilities, are described further under "Standing Committees of the Fund's Trustees."
Annual Report
Trustees and Officers - continued
The fund's Statement of Additional Information (SAI) includes more information about the Trustees. To request a free copy, call Fidelity at 1-877-208-0098.
Interested Trustees*:
Correspondence intended for each Trustee who is an interested person may be sent to Fidelity Investments, 245 Summer Street, Boston, Massachusetts 02210.
Name, Age; Principal Occupations and Other Relevant Experience+ |
James C. Curvey (77) |
| Year of Election or Appointment: 2007 Mr. Curvey is Trustee and Chairman of the Board of Trustees of certain Trusts. Mr. Curvey also serves as Trustee (2007-present) of other investment companies advised by FMR. Mr. Curvey is a Director of Fidelity Investments Money Management, Inc. (2009-present), Director of Fidelity Research & Analysis Co. (2009-present) and Director of FMR and FMR Co., Inc. (2007-present). Mr. Curvey is also Vice Chairman (2007-present) and Director of FMR LLC. In addition, Mr. Curvey serves as an Overseer for the Boston Symphony Orchestra and a member of the Trustees of Villanova University. Previously, Mr. Curvey was the Vice Chairman (2006-2007) and Director (2000-2007) of FMR Corp. |
Ronald P. O'Hanley (55) |
| Year of Election or Appointment: 2011 Mr. O'Hanley is Director of FMR Co., Inc. (2010-present), Director of Fidelity Investments Money Management, Inc. (2010-present), Director of Fidelity Research & Analysis Company (2010-present), President of Fidelity Asset Management and Corporate Services and a member of Fidelity's Executive Committee (2010-present). Previously, Mr. O'Hanley served as President and Chief Executive Officer of BNY Mellon Asset Management (2007-2010). Mr. O'Hanley also served as Vice Chairman of Bank New York Mellon Corp. and a member of that firm's Executive Committee. Prior to the 2007 merger of The Bank of New York and Mellon Financial Corporation, he was Vice Chairman of Mellon Financial Corporation and President and Chief Executive Officer of Mellon Asset Management. He joined Mellon in February 1997. Mr. O'Hanley currently serves as Chairman of the Boston Public Library Foundation Board of Directors and sits on the Board of Directors of Beth Israel Deaconess Medical Center, the Board of Trustees of the Marine Biological Laboratory and the Advisory Board of the Maxwell School of Citizenship and Public Administration at Syracuse University. Mr. O'Hanley also chairs the Council on Asset Management for the Financial Services Roundtable and is a member of the Board of Directors of Institutional Investor's U.S. Institute. |
* Trustees have been determined to be "Interested Trustees" by virtue of, among other things, their affiliation with the trust or various entities under common control with FMR.
+ The information above includes each Trustee's principal occupation during the last five years and other information relating to the experience, attributes, and skills relevant to each Trustee's qualifications to serve as a Trustee, which led to the conclusion that each Trustee should serve as a Trustee for the fund.
Annual Report
Trustees and Officers - continued
Independent Trustees:
Correspondence intended for each Independent Trustee (that is, the Trustees other than the Interested Trustees) may be sent to Fidelity Investments, P.O. Box 55235, Boston, Massachusetts 02205-5235.
Name, Age; Principal Occupations and Other Relevant Experience+ |
Dennis J. Dirks (64) |
| Year of Election or Appointment: 2005 Prior to his retirement in May 2003, Mr. Dirks was Chief Operating Officer and a member of the Board of The Depository Trust & Clearing Corporation (DTCC). He also served as President, Chief Operating Officer, and Board member of The Depository Trust Company (DTC) and President and Board member of the National Securities Clearing Corporation (NSCC). In addition, Mr. Dirks served as Chief Executive Officer and Board member of the Government Securities Clearing Corporation, Chief Executive Officer and Board member of the Mortgage-Backed Securities Clearing Corporation, as a Trustee and a member of the Finance Committee of Manhattan College (2005-2008), and as a Trustee and a member of the Finance Committee of AHRC of Nassau County (2006-2008). Mr. Dirks is a member of the Independent Directors Council (IDC) Governing Council (2010-present) and Board of Directors for The Brookville Center for Children's Services, Inc. (2009-present). |
Alan J. Lacy (59) |
| Year of Election or Appointment: 2008 Mr. Lacy serves as Senior Adviser (2007-present) of Oak Hill Capital Partners, L.P. (private equity). Mr. Lacy also served as Chief Executive Officer (2000-2005) and Vice Chairman (2005-2006) of Sears Holdings Corporation and Sears, Roebuck and Co. (retail). In addition, Mr. Lacy serves as a member of the Board of Directors of Dave & Buster's Entertainment, Inc. (restaurant and entertainment complexes, 2010-present), Earth Fare, Inc. (retail grocery, 2012-present), The Hillman Companies, Inc. (hardware wholesalers, 2010-present), and Bristol-Myers Squibb Company (global pharmaceuticals, 2008-present). Mr. Lacy is a member of the Board of Trustees of The National Parks Conservation Association (2006-present). Previously, Mr. Lacy served as Chairman of the Board of Trustees of the National Parks Conservation Association (2008-2011) and as a member of the Board of Directors for the Western Union Company (global money transfer, 2006-2011). |
Ned C. Lautenbach (68) |
| Year of Election or Appointment: 2000 Mr. Lautenbach is Chairman of the Independent Trustees of the Equity and High Income Funds (2006-present). Mr. Lautenbach currently serves as the Lead Director of the Eaton Corporation Board of Directors (diversified industrial, 1997-present). Mr. Lautenbach is Chairman of the Board of Directors of the Philharmonic Center for the Arts in Naples, Florida (2012-present) and a member of the Council on Foreign Relations (1994-present). Previously, Mr. Lautenbach was a Partner/Advisory Partner at Clayton, Dubilier & Rice, LLC (private equity investment, 1998-2010), as well as a Director of Sony Corporation (2006-2007). |
Joseph Mauriello (68) |
| Year of Election or Appointment: 2008 Prior to his retirement in January 2006, Mr. Mauriello served in numerous senior management positions including Deputy Chairman and Chief Operating Officer (2004-2005), and Vice Chairman of Financial Services (2002-2004) of KPMG LLP US (professional services, 1965-2005). Mr. Mauriello currently serves as a member of the Board of Directors of XL Group plc. (global insurance and re-insurance, 2006-present). Previously, Mr. Mauriello served as a Director of the Hamilton Funds of the Bank of New York (2006-2007) and of Arcadia Resources Inc. (health care services and products, 2007-2012). |
Robert W. Selander (62) |
| Year of Election or Appointment: 2011 Previously, Mr. Selander served as a Member of the Advisory Board of Fidelity's Equity and High Income Funds (2011), Executive Vice Chairman (2010), Chief Executive Officer (2009-2010), and President and Chief Executive Officer (1997-2009) of Mastercard, Inc. |
Cornelia M. Small (68) |
| Year of Election or Appointment: 2005 Ms. Small is a member of the Board of Directors (2009-present) and Chair of the Investment Committee (2010-present) of the Teagle Foundation. Ms. Small also serves on the Investment Committee of the Berkshire Taconic Community Foundation (2008-present). Previously, Ms. Small served as Chairperson (2002-2008) and a member of the Investment Committee and Chairperson (2008-2012) and a member of the Board of Trustees of Smith College. In addition, Ms. Small served as Chief Investment Officer, Director of Global Equity Investments, and a member of the Board of Directors of Scudder, Stevens & Clark and Scudder Kemper Investments. |
William S. Stavropoulos (73) |
| Year of Election or Appointment: 2002 Mr. Stavropoulos is Vice Chairman of the Independent Trustees of the Equity and High Income Funds (2006-present). Mr. Stavropoulos serves as President and Founder of the Michigan Baseball Foundation, the Great Lakes Loons (2007-present). Mr. Stavropoulos is Chairman Emeritus of the Board of Directors of The Dow Chemical Company, where he previously served in numerous senior management positions, including President, CEO (1995-2000; 2002-2004), Chairman of the Executive Committee (2000-2006), and as a member of the Board of Directors (1990-2006). Currently, Mr. Stavropoulos is a Director of Univar Inc. (global distributor of commodity and specialty chemicals, Chairman from 2010-May 2012 and Lead Director from May 2012-present), Teradata Corporation (data warehousing and technology solutions, 2008-present), Maersk Inc. (industrial conglomerate), and Tyco International, Ltd. (multinational manufacturing and services, 2007-present), and a member of the Advisory Board for Metalmark Capital LLC (private equity investment, 2005-present). Mr. Stavropoulos is an operating advisor to Clayton, Dubilier & Rice, LLC (private equity investment). In addition, Mr. Stavropoulos is a member of the University of Notre Dame Advisory Council for the College of Science, a Trustee of the Rollin L. Gerstacker Foundation, and a Director of the Naples Philharmonic Center for the Arts. Previously, Mr. Stavropoulos served as a Director of Chemical Financial Corporation (bank holding company, 1993-2012). |
David M. Thomas (63) |
| Year of Election or Appointment: 2008 Previously, Mr. Thomas served as Executive Chairman (2005-2006) and Chairman and Chief Executive Officer (2000-2005) of IMS Health, Inc. (pharmaceutical and healthcare information solutions), and a Director of Fortune Brands, Inc. (consumer products, 2000-2011). In addition, Mr. Thomas serves as Non-Executive Chairman of the Board of Directors of Fortune Brands Home and Security (home and security products, 2011-present), and as a member of the Board of Directors of Interpublic Group of Companies, Inc. (marketing communication, 2004-present). |
Michael E. Wiley (62) |
| Year of Election or Appointment: 2008 Mr. Wiley also serves as a Director of Asia Pacific Exploration Consolidated (international oil and gas exploration and production, 2008-present). Mr. Wiley serves as a Director of Tesoro Corporation (independent oil refiner and marketer, 2005-present), and a Director of Bill Barrett Corporation (exploration and production, 2005-present). In addition, Mr. Wiley also serves as a Director of Post Oak Bank (privately-held bank, 2004-present). Previously, Mr. Wiley served as a member of the Board of Trustees of the University of Tulsa (2000-2006; 2007-2010), as a Senior Energy Advisor of Katzenbach Partners, LLC (consulting, 2006-2007), as an Advisory Director of Riverstone Holdings (private investment), Chairman, President, and CEO of Baker Hughes, Inc. (oilfield services, 2000-2004), and as Director of Spinnaker Exploration Company (exploration and production, 2001-2005). |
+ The information above includes each Trustee's principal occupation during the last five years and other information relating to the experience, attributes, and skills relevant to each Trustee's qualifications to serve as a Trustee, which led to the conclusion that each Trustee should serve as a Trustee for the fund.
Advisory Board Members and Executive Officers:
Correspondence intended for David A. Rosow and Garnett A. Smith may be sent to Fidelity Investments, P.O. Box 55235, Boston, Massachusetts 02205-5235. Correspondence intended for each executive officer and Peter S. Lynch may be sent to Fidelity Investments, 245 Summer Street, Boston, Massachusetts 02210.
Name, Age; Principal Occupation |
Peter S. Lynch (69) |
| Year of Election or Appointment: 2003 Member of the Advisory Board of Fidelity's Equity and High Income Funds. Mr. Lynch is Vice Chairman and a Director of FMR and FMR Co., Inc. In addition, Mr. Lynch serves as a Trustee of Boston College and as the Chairman of the Inner-City Scholarship Fund. Previously, Mr. Lynch served on the Special Olympics International Board of Directors (1997-2006). |
David A. Rosow (70) |
| Year of Election or Appointment: 2012 Member of the Advisory Board of Fidelity's Equity and High Income Funds. Chairman and Chief Executive Officer of International Golf Group, Inc. (golf course development, 1989-present). Previously, Mr. Rosow served as Chairman and Chief Executive Officer of Rosow & Company, Inc. (private investment company, 1989-2011), a Lead Director of Hudson United Bancorp (2001-2006) and as a Director of TD Banknorth (1996-2006). In addition, Mr. Rosow is a member (2008-present) and President (2009-present) of the Town Council of Palm Beach, Florida. |
Garnett A. Smith (65) |
| Year of Election or Appointment: 2012 Member of the Advisory Board of Fidelity's Equity and High Income Funds. Prior to Mr. Smith's retirement, he served as Chairman and Chief Executive Officer of Inbrand Corp. (manufacturer of personal absorbent products, 1990-1997). He also served as President (1986-1990) of Inbrand Corp. Prior to his employment with Inbrand Corp., he was employed by a retail fabric chain and North Carolina National Bank. In addition, Mr. Smith is a board member of the Jackson Hole Land Trust (2009-present). |
Kenneth B. Robins (43) |
| Year of Election or Appointment: 2008 President and Treasurer of Fidelity's Equity and High Income Funds. Mr. Robins also serves as President and Treasurer (2010-present) and Assistant Treasurer (2009-present) of other Fidelity funds and is an employee of Fidelity Investments (2004-present). Previously, Mr. Robins served as Deputy Treasurer of the Fidelity funds (2005-2008) and Treasurer and Chief Financial Officer of The North Carolina Capital Management Trust: Cash and Term Portfolios (2006-2008). |
Brian B. Hogan (48) |
| Year of Election or Appointment: 2009 Vice President of Equity and High Income Funds. Mr. Hogan also serves as President of FMR's Equity Division (2009-present). Previously, Mr. Hogan served as Senior Vice President, Equity Research of FMR (2006-2009) and as a portfolio manager. |
Thomas C. Hense (49) |
| Year of Election or Appointment: 2008 or 2010 Vice President of Fidelity's High Income (2008), Small Cap (2008), and Value (2010) Funds. Previously, Mr. Hense served as a portfolio manager for Fidelity's Institutional Money Management Group (Pyramis) (2003-2008). |
Scott C. Goebel (45) |
| Year of Election or Appointment: 2008 Secretary and Chief Legal Officer (CLO) of the Fidelity funds. Mr. Goebel also serves as Secretary of Fidelity Investments Money Management, Inc. (FIMM) (2010-present) and Fidelity Research and Analysis Company (FRAC) (2010-present); Secretary and CLO of The North Carolina Capital Management Trust: Cash and Term Portfolios (2008-present); General Counsel, Secretary, and Senior Vice President of FMR (2008-present) and FMR Co., Inc. (2008-present); employed by FMR LLC or an affiliate (2001-present); Chief Legal Officer of Fidelity Management & Research (Hong Kong) Limited (2008-present) and Assistant Secretary of Fidelity Management & Research (Japan) Inc. (2008-present), and Fidelity Management & Research (U.K.) Inc. (2008-present). Previously, Mr. Goebel served as Assistant Secretary of FIMM (2008-2010), FRAC (2008-2010), and the Funds (2007-2008) and as Vice President and Secretary of Fidelity Distributors Corporation (FDC) (2005-2007). |
William C. Coffey (43) |
| Year of Election or Appointment: 2009 Assistant Secretary of Fidelity's Equity and High Income Funds. Mr. Coffey also serves as Senior Vice President and Deputy General Counsel of FMR LLC (2010-present), and is an employee of Fidelity Investments. Previously, Mr. Coffey served as Vice President and Associate General Counsel of FMR LLC (2005-2009). |
Elizabeth Paige Baumann (44) |
| Year of Election or Appointment: 2012 Anti-Money Laundering (AML) Officer of the Fidelity funds. Ms. Baumann also serves as AML Officer of The North Carolina Capital Management Trust: Cash and Term Portfolios (2012-present), Chief AML Officer of FMR LLC (2012-present), and is an employee of Fidelity Investments. Previously, Ms. Baumann served as Vice President and Deputy Anti-Money Laundering Officer (2007-2012). |
Christine Reynolds (54) |
| Year of Election or Appointment: 2008 Chief Financial Officer of the Fidelity funds. Ms. Reynolds became President of Fidelity Pricing and Cash Management Services (FPCMS) in August 2008. Ms. Reynolds served as Chief Operating Officer of FPCMS (2007-2008). Previously, Ms. Reynolds served as President, Treasurer, and Anti-Money Laundering officer of the Fidelity funds (2004-2007). |
Joseph A. Hanlon (44) |
| Year of Election or Appointment: 2012 Chief Compliance Officer of Fidelity's Equity and High Income Funds. Mr. Hanlon serves as Compliance Officer of FMR, FMR Co., Inc., Fidelity Investments Money Management, Inc. (FIMM), Fidelity Research and Analysis Company (FRAC), Fidelity Management & Research (Japan) Inc., Fidelity Management & Research (U.K.) Inc., Fidelity Management & Research (Hong Kong), and Strategic Advisers, Inc. (2009-present), as Senior Vice President of the Fidelity Asset Management Division (2009-present), and is an employee of Fidelity Investments. |
Joseph F. Zambello (55) |
| Year of Election or Appointment: 2011 Deputy Treasurer of the Fidelity funds. Mr. Zambello is an employee of Fidelity Investments. Previously, Mr. Zambello served as Vice President of FMR's Program Management Group (2009-2011) and Vice President of the Transfer Agent Oversight Group (2005-2009). |
Adrien E. Deberghes (45) |
| Year of Election or Appointment: 2008 Deputy Treasurer of Fidelity's Equity and High Income Funds. Mr. Deberghes also serves as Vice President (2011-present) and Assistant Treasurer (2010-present) of other Fidelity funds, and is an employee of Fidelity Investments (2008-present). Previously, Mr. Deberghes served as Senior Vice President of Mutual Fund Administration at State Street Corporation (2007-2008), Senior Director of Mutual Fund Administration at Investors Bank & Trust (2005-2007), and Director of Finance for Dunkin' Brands (2000-2005). |
Stephen Sadoski (41) |
| Year of Election or Appointment: 2012 Deputy Treasurer of Fidelity's Equity and High Income Funds. Mr. Sadoski also serves as Deputy Treasurer of other Fidelity funds (2013-present) and is an employee of Fidelity Investments (2012-present). Previously, Mr. Sadoski served as Assistant Treasurer of Fidelity's Fixed Income and Asset Allocation Funds (2012-2013), an assistant chief accountant in the Division of Investment Management of the Securities and Exchange Commission (SEC) (2009-2012) and as a senior manager at Deloitte & Touche (1997-2009). |
Stacie Smith (38) |
| Year of Election or Appointment: 2013 Deputy Treasurer of Fidelity's Equity and High Income Funds. Ms. Smith is an employee of Fidelity Investments (2009-present). Previously, Ms. Smith served as Senior Audit Manager of Ernst & Young LLP (1996-2009). |
Stephanie J. Dorsey (43) |
| Year of Election or Appointment: 2010 Assistant Treasurer of Fidelity's Equity and High Income Funds. Ms. Dorsey also serves as President and Treasurer (2013-present) and Assistant Treasurer (2012-present) of other Fidelity funds and is an employee of Fidelity Investments (2008-present). Previously, Ms. Dorsey served as Deputy Treasurer of Fidelity's Fixed Income and Asset Allocation Funds (2008-2013), Treasurer (2004-2008) of the JPMorgan Mutual Funds and Vice President (2004-2008) of JPMorgan Chase Bank. |
John R. Hebble (54) |
| Year of Election or Appointment: 2009 Assistant Treasurer of Fidelity's Equity and High Income Funds. Mr. Hebble also serves as President (2011-present), Treasurer, and Chief Financial Officer of The North Carolina Capital Management Trust: Cash and Term Portfolios (2008-present) and is an employee of Fidelity Investments. Previously, Mr. Hebble served as President and Treasurer of Fidelity's Fixed Income and Asset Allocation Funds (2008-2013). |
Gary W. Ryan (54) |
| Year of Election or Appointment: 2005 Assistant Treasurer of the Fidelity funds. Mr. Ryan is an employee of Fidelity Investments. Previously, Mr. Ryan served as Vice President of Fund Reporting in Fidelity Pricing and Cash Management Services (FPCMS) (1999-2005). |
Jonathan Davis (44) |
| Year of Election or Appointment: 2010 Assistant Treasurer of the Fidelity funds. Mr. Davis is also Assistant Treasurer of Fidelity Rutland Square Trust II and Fidelity Commonwealth Trust II. Mr. Davis is an employee of Fidelity Investments. Previously, Mr. Davis served as Vice President and Associate General Counsel of FMR LLC (2003-2010). |
Annual Report
Class A, Class T, Class B and Class C designates 100% of the dividends distributed during the fiscal year as qualifying for the dividends-received deduction for corporate shareholders.
Class A, Class T, Class B and Class C designates 100% of the dividends distributed during the fiscal year as amounts which may be taken into account as a dividend for purposes of the maximum rate under section 1(h)(11) of the Internal Revenue Code.
The fund will notify shareholders in January 2014 of amounts for use in preparing 2013 income tax returns.
Annual Report
Investment Adviser
Fidelity Management & Research Company
Boston, MA
Investment Sub-Advisers
FMR Co., Inc.
Fidelity Management & Research
(U.K.) Inc.
Fidelity Management & Research
(Hong Kong) Limited
Fidelity Management & Research
(Japan) Inc.
General Distributor
Fidelity Distributors Corporation
Smithfield, RI
Transfer and Service Agents
Fidelity Investments Institutional Operations Company, Inc.
Boston, MA
Fidelity Service Company, Inc.
Boston, MA
Custodian
Citibank, N.A.
New York, NY
(Fidelity Investment logo)(registered trademark)
ALCV-UANN-0313
1.838393.103
Fidelity®
Stock Selector Large Cap Value
Fund
Annual Report
January 31, 2013
(Fidelity Cover Art)
Contents
Performance | (Click Here) | How the fund has done over time. |
Management's Discussion of Fund Performance | (Click Here) | The Portfolio Manager's review of fund performance and strategy. |
Shareholder Expense Example | (Click Here) | An example of shareholder expenses. |
Investment Changes | (Click Here) | A summary of major shifts in the fund's investments over the past six months. |
Investments | (Click Here) | A complete list of the fund's investments with their market values. |
Financial Statements | (Click Here) | Statements of assets and liabilities, operations, and changes in net assets, as well as financial highlights. |
Notes | (Click Here) | Notes to the financial statements. |
Report of Independent Registered Public Accounting Firm | (Click Here) | |
Trustees and Officers | (Click Here) | |
Distributions | (Click Here) | |
To view a fund's proxy voting guidelines and proxy voting record for the 12-month period ended June 30, visit http://www.fidelity.com/proxyvotingresults or visit the Securities and Exchange Commission's (SEC) web site at http://www.sec.gov. You may also call 1-800-544-8544 to request a free copy of the proxy voting guidelines.
Standard & Poor's, S&P and S&P 500 are registered service marks of The McGraw-Hill Companies, Inc. and have been licensed for use by Fidelity Distributors Corporation.
Other third-party marks appearing herein are the property of their respective owners.
All other marks appearing herein are registered or unregistered trademarks or service marks of FMR LLC or an affiliated company. © 2013 FMR LLC. All rights reserved.
This report and the financial statements contained herein are submitted for the general information of the shareholders of the fund. This report is not authorized for distribution to prospective investors in the fund unless preceded or accompanied by an effective prospectus.
A fund files its complete schedule of portfolio holdings with the SEC for the first and third quarters of each fiscal year on Form N-Q. Forms N-Q are available on the SEC's web site at http://www.sec.gov. A fund's Forms N-Q may be reviewed and copied at the SEC's Public Reference Room in Washington, DC. Information regarding the operation of the SEC's Public Reference Room may be obtained by calling 1-800-SEC-0330. For a complete list of a fund's portfolio holdings, view the most recent holdings listing, semiannual report, or annual report on Fidelity's web site at http://www.fidelity.com, http://www.advisor.fidelity.com, or http://www.401k.com, as applicable.
NOT FDIC INSURED • MAY LOSE VALUE • NO BANK GUARANTEE
Neither the fund nor Fidelity Distributors Corporation is a bank.
Annual Report
Average annual total return reflects the change in the value of an investment, assuming reinvestment of the class' distributions from dividend income and capital gains (the profits earned upon the sale of securities that have grown in value, if any) and assuming a constant rate of performance each year. The $10,000 table and the fund's returns do not reflect the deduction of taxes that a shareholder would pay on fund distributions or the redemption of fund shares. During periods of reimbursement by Fidelity, a fund's total return will be greater than it would be had the reimbursement not occurred. How a fund did yesterday is no guarantee of how it will do tomorrow.
Average Annual Total Returns
Periods ended January 31, 2013 | Past 1
year | Past 5
years | Past 10
years |
Fidelity® Stock Selector Large Cap Value Fund | 18.55% | 0.16% | 6.90% |
$10,000 Over 10 Years
Let's say hypothetically that $10,000 was invested in Fidelity® Stock Selector Large Cap Value Fund, a class of the fund, on January 31, 2003. The chart shows how the value of your investment would have changed, and also shows how the Russell 1000® Value Index performed over the same period.
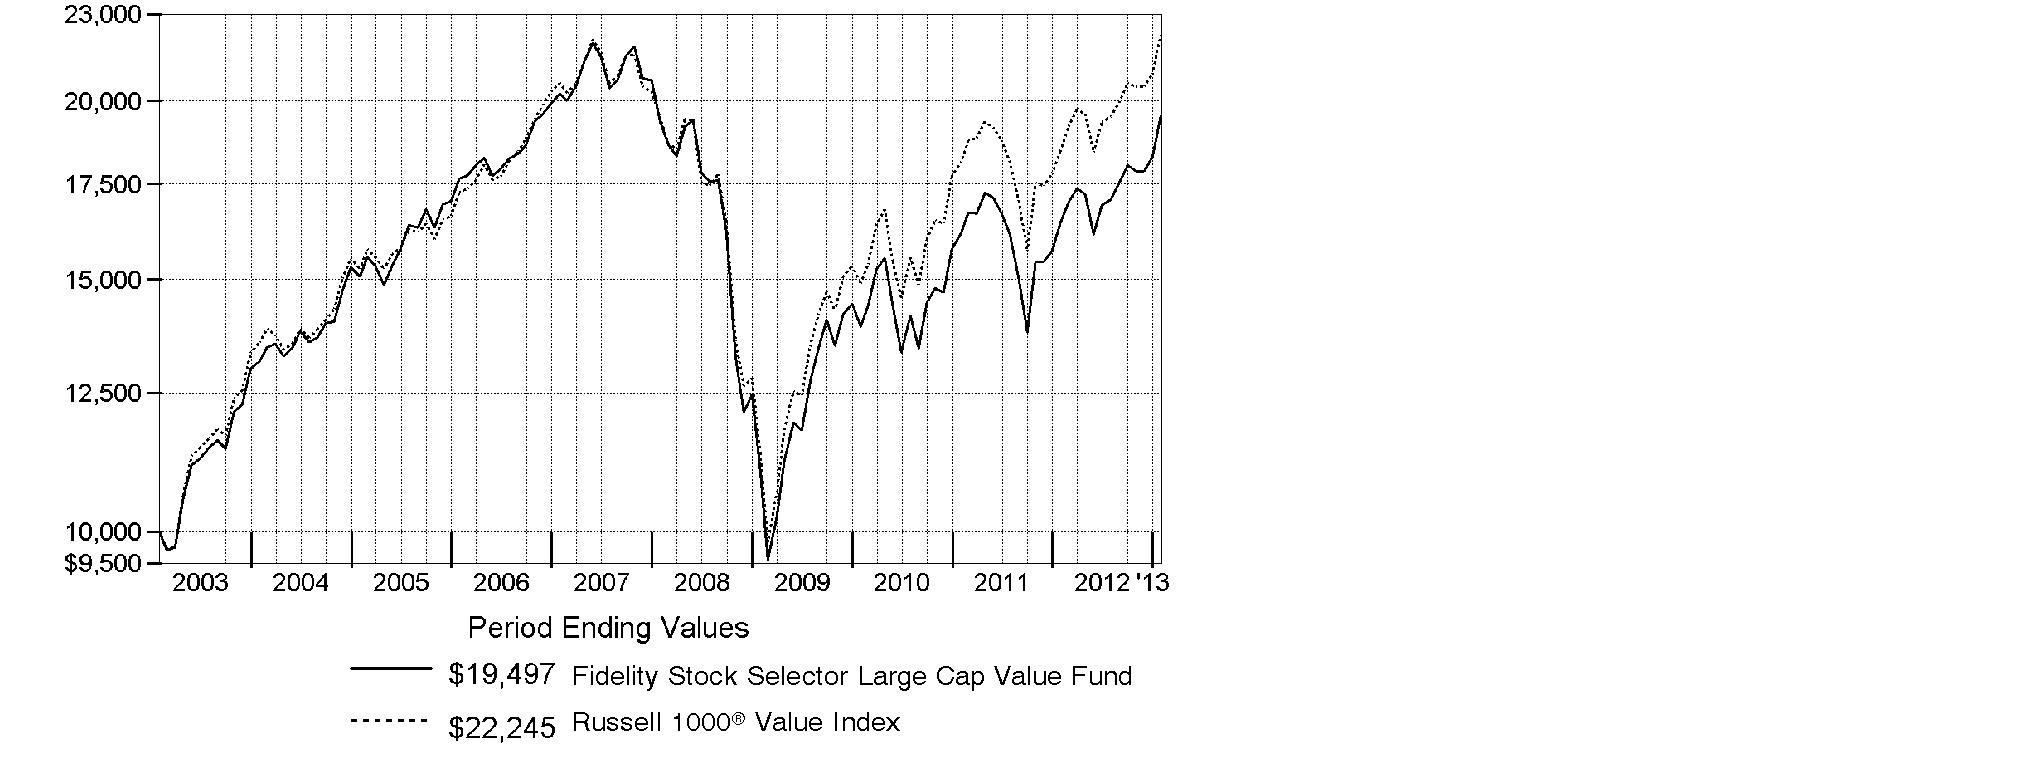
Annual Report
Market Recap: Improvement in the U.S. economy helped lift equity benchmarks to double-digit gains for the year ending January 31, 2013, overcoming moments of volatility driven by sovereign debt woes in Europe, slower economic growth in China and gridlock in Congress. Major U.S. benchmarks hit multiyear highs during the period, encouraged by a rebounding domestic housing market and solid corporate earnings reports. The broad-based S&P 500® Index rose 16.78% for the year, crossing the milestone 1,500 mark near period end. The technology-heavy Nasdaq Composite Index® added 13.13%, and the blue-chip-laden Dow Jones Industrial AverageSM gained 12.75%. Early in the period, stocks rose on positive U.S. economic news and proposed bailouts in Europe. Although fear resurfaced in April and May, equities rebounded in June on central bank stimulus and new life in the housing market. In September, pre-election jitters and the looming "fiscal cliff" of tax hikes and federal spending cuts fueled some profit-taking, followed by a brief post-election sell-off. But stocks proved resilient, as investors continued to pile into riskier assets. Gains were broad-based, with eight of the 10 sectors in the S&P 500® posting double-digit returns. Despite eurozone turmoil, foreign developed-markets stocks rose strongly, with the MSCI® EAFE® Index adding 17.41%.
Comments from Bruce Dirks, Group Leader of Fidelity's Stock Selector Large Cap Value Team, which manages Fidelity® Stock Selector Large Cap Value Fund: For the year, the fund's Retail Class shares returned 18.55%, trailing the 20.58% gain of the Russell 1000® Value Index. Unfavorable security selection and industry positioning in information technology, weak stock picking in telecommunication services and energy, and underweighting diversified financials were the primary reasons the fund lagged the index. On the plus side, stock choices in materials, utilities and industrials aided relative performance. The biggest relative detractors included: NII Holdings, which provides mobile communications services for business customers in Latin America under the Nextel brand name; technology manufacturer Hewlett-Packard; not holding index component and diversified financial services giant Bank of America; and semiconductor maker Marvell Technology Group. The top individual contributors were an out-of-benchmark position in GEO Group, which manages correctional, detention, mental health and residential treatment facilities, Puerto Rico-based bank holding company Popular and oil refiner Marathon Petroleum. GEO Group was sold from the fund during the period.
The views expressed above reflect those of the portfolio manager(s) only through the end of the period as stated on the cover of this report and do not necessarily represent the views of Fidelity or any other person in the Fidelity organization. Any such views are subject to change at any time based upon market or other conditions and Fidelity disclaims any responsibility to update such views. These views may not be relied on as investment advice and, because investment decisions for a Fidelity fund are based on numerous factors, may not be relied on as an indication of trading intent on behalf of any Fidelity fund.
Annual Report
Shareholder Expense Example
As a shareholder of the Fund, you incur two types of costs: (1) transaction costs, including sales charges (loads) on purchase payments or redemption proceeds, and (2) ongoing costs, including management fees, distribution and/or service (12b-1) fees and other Fund expenses. This Example is intended to help you understand your ongoing costs (in dollars) of investing in the Fund and to compare these costs with the ongoing costs of investing in other mutual funds.
The Example is based on an investment of $1,000 invested at the beginning of the period and held for the entire period (August 1, 2012 to January 31, 2013).
Actual Expenses
The first line of the accompanying table for each class of the Fund provides information about actual account values and actual expenses. You may use the information in this line, together with the amount you invested, to estimate the expenses that you paid over the period. Simply divide your account value by $1,000.00 (for example, an $8,600 account value divided by $1,000.00 = 8.6), then multiply the result by the number in the first line for a class of the Fund under the heading entitled "Expenses Paid During Period" to estimate the expenses you paid on your account during this period. A small balance maintenance fee of $12.00 that is charged once a year may apply for certain accounts with a value of less than $2,000. This fee is not included in the table below. If it was, the estimate of expenses you paid during the period would be higher, and your ending account value lower, by this amount. In addition, the Fund, as a shareholder in the underlying Fidelity Central Funds, will indirectly bear its pro-rata share of the fees and expenses incurred by the underlying Fidelity Central Funds. These fees and expenses are not included in the Fund's annualized expense ratio used to calculate the expense estimate in the table below.
Hypothetical Example for Comparison Purposes
The second line of the accompanying table for each class of the Fund provides information about hypothetical account values and hypothetical expenses based on a Class' actual expense ratio and an assumed rate of return of 5% per year before expenses, which is not the Class' actual return. The hypothetical account values and expenses may not be used to estimate the actual ending account balance or expenses you paid for the period. You may use this information to compare the ongoing costs of investing in the Fund and other funds. To do so, compare this 5% hypothetical example with the 5% hypothetical examples that appear in the shareholder reports of the other funds. A small balance maintenance fee of $12.00 that is charged once a year may apply for certain accounts with a value of less than $2,000. This fee is not included in the table below. If it was, the estimate of expenses you paid during the period would be higher, and your ending account value lower, by this amount. In addition, the Fund, as a shareholder in the underlying Fidelity Central Funds, will indirectly bear its pro-rata share of the fees and expenses incurred by the underlying Fidelity Central Funds. These fees and expenses are not included in the Fund's annualized expense ratio used to calculate the expense estimate in the table below.
Please note that the expenses shown in the table are meant to highlight your ongoing costs only and do not reflect any transaction costs. Therefore, the second line of the table is useful in comparing ongoing costs only, and will not help you determine the relative total costs of owning different funds. In addition, if these transactional costs were included, your costs would have been higher.
Annual Report
Shareholder Expense Example - continued
| Annualized
Expense Ratio | Beginning
Account Value
August 1, 2012 | Ending
Account Value
January 31, 2013 | Expenses Paid
During Period*
August 1, 2012
to January 31, 2013 |
Class A | .88% | | | |
Actual | | $ 1,000.00 | $ 1,140.00 | $ 4.73 |
HypotheticalA | | $ 1,000.00 | $ 1,020.71 | $ 4.47 |
Class T | 1.15% | | | |
Actual | | $ 1,000.00 | $ 1,138.40 | $ 6.18 |
HypotheticalA | | $ 1,000.00 | $ 1,019.36 | $ 5.84 |
Class B | 1.64% | | | |
Actual | | $ 1,000.00 | $ 1,136.40 | $ 8.81 |
HypotheticalA | | $ 1,000.00 | $ 1,016.89 | $ 8.31 |
Class C | 1.64% | | | |
Actual | | $ 1,000.00 | $ 1,135.70 | $ 8.80 |
HypotheticalA | | $ 1,000.00 | $ 1,016.89 | $ 8.31 |
Stock Selector Large Cap Value | .58% | | | |
Actual | | $ 1,000.00 | $ 1,142.10 | $ 3.12 |
HypotheticalA | | $ 1,000.00 | $ 1,022.22 | $ 2.95 |
Institutional Class | .61% | | | |
Actual | | $ 1,000.00 | $ 1,141.70 | $ 3.28 |
HypotheticalA | | $ 1,000.00 | $ 1,022.07 | $ 3.10 |
A 5% return per year before expenses
* Expenses are equal to each Class' annualized expense ratio, multiplied by the average account value over the period, multiplied by 184/366 (to reflect the one-half year period).
Annual Report
Investment Changes (Unaudited)
Top Ten Stocks as of January 31, 2013 |
| % of fund's
net assets | % of fund's net assets
6 months ago |
General Electric Co. | 3.2 | 3.2 |
Berkshire Hathaway, Inc. Class B | 2.9 | 3.0 |
Wells Fargo & Co. | 2.9 | 3.3 |
Occidental Petroleum Corp. | 2.5 | 2.4 |
Merck & Co., Inc. | 2.4 | 2.2 |
Johnson & Johnson | 2.3 | 2.2 |
Kennedy-Wilson Holdings, Inc. | 2.2 | 2.2 |
Exxon Mobil Corp. | 2.0 | 0.0 |
Pfizer, Inc. | 2.0 | 2.9 |
Suncor Energy, Inc. | 1.6 | 1.8 |
| 24.0 | |
Top Five Market Sectors as of January 31, 2013 |
| % of fund's
net assets | % of fund's net assets
6 months ago |
Financials | 25.8 | 25.7 |
Energy | 16.3 | 16.9 |
Health Care | 11.1 | 11.1 |
Industrials | 10.1 | 8.7 |
Consumer Discretionary | 7.3 | 7.2 |
Asset Allocation (% of fund's net assets) |
As of January 31, 2013* | As of July 31, 2012** |
| Stocks and Equity
Futures 99.9% | | | Stocks and Equity
Futures 99.6% | |
| Short-Term
Investments and
Net Other Assets (Liabilities) 0.1% | | | Short-Term
Investments and
Net Other Assets (Liabilities) 0.4% | |
* Foreign investments | 13.6% | | ** Foreign investments | 13.1% | |

Annual Report
Investments January 31, 2013
Showing Percentage of Net Assets
Common Stocks - 97.4% |
| Shares | | Value |
CONSUMER DISCRETIONARY - 7.3% |
Auto Components - 0.6% |
Delphi Automotive PLC (a) | 83,200 | | $ 3,216,512 |
Household Durables - 1.2% |
Jarden Corp. | 42,495 | | 2,500,406 |
Whirlpool Corp. | 31,500 | | 3,634,470 |
| | 6,134,876 |
Media - 2.6% |
Comcast Corp. Class A | 142,575 | | 5,429,256 |
News Corp. Class A | 186,900 | | 5,184,606 |
Omnicom Group, Inc. | 44,300 | | 2,404,604 |
| | 13,018,466 |
Multiline Retail - 1.7% |
Macy's, Inc. | 80,450 | | 3,178,580 |
Target Corp. | 83,434 | | 5,040,248 |
| | 8,218,828 |
Specialty Retail - 1.2% |
Lowe's Companies, Inc. | 112,063 | | 4,279,686 |
Staples, Inc. | 115,000 | | 1,550,200 |
| | 5,829,886 |
TOTAL CONSUMER DISCRETIONARY | | 36,418,568 |
CONSUMER STAPLES - 7.3% |
Beverages - 1.2% |
Dr. Pepper Snapple Group, Inc. | 58,400 | | 2,632,088 |
Molson Coors Brewing Co. Class B | 72,900 | | 3,293,622 |
| | 5,925,710 |
Food & Staples Retailing - 0.9% |
Walgreen Co. | 114,940 | | 4,593,002 |
Food Products - 2.8% |
Archer Daniels Midland Co. | 92,000 | | 2,624,760 |
ConAgra Foods, Inc. | 92,410 | | 3,020,883 |
Mondelez International, Inc. | 184,790 | | 5,135,314 |
The J.M. Smucker Co. | 35,720 | | 3,165,864 |
| | 13,946,821 |
Household Products - 1.9% |
Procter & Gamble Co. | 91,880 | | 6,905,701 |
Reckitt Benckiser Group PLC | 41,400 | | 2,759,050 |
| | 9,664,751 |
Common Stocks - continued |
| Shares | | Value |
CONSUMER STAPLES - continued |
Tobacco - 0.5% |
Lorillard, Inc. | 57,500 | | $ 2,246,525 |
TOTAL CONSUMER STAPLES | | 36,376,809 |
ENERGY - 16.3% |
Energy Equipment & Services - 1.6% |
Cameron International Corp. (a) | 60,200 | | 3,811,262 |
National Oilwell Varco, Inc. | 58,400 | | 4,329,776 |
| | 8,141,038 |
Oil, Gas & Consumable Fuels - 14.7% |
Anadarko Petroleum Corp. | 96,720 | | 7,739,534 |
BP PLC sponsored ADR | 126,423 | | 5,628,352 |
Canadian Natural Resources Ltd. | 213,400 | | 6,444,363 |
Exxon Mobil Corp. | 113,300 | | 10,193,601 |
Marathon Petroleum Corp. | 63,800 | | 4,734,598 |
Noble Energy, Inc. | 39,680 | | 4,277,107 |
Occidental Petroleum Corp. | 138,978 | | 12,267,588 |
Phillips 66 | 33,100 | | 2,004,867 |
Royal Dutch Shell PLC Class A sponsored ADR | 109,957 | | 7,754,168 |
Suncor Energy, Inc. | 240,100 | | 8,160,608 |
The Williams Companies, Inc. | 115,898 | | 4,062,225 |
| | 73,267,011 |
TOTAL ENERGY | | 81,408,049 |
FINANCIALS - 25.8% |
Capital Markets - 4.0% |
Bank of New York Mellon Corp. | 198,000 | | 5,377,680 |
Invesco Ltd. | 165,800 | | 4,518,050 |
Morgan Stanley | 153,700 | | 3,512,045 |
State Street Corp. | 97,000 | | 5,398,050 |
SWS Group, Inc. (a) | 196,000 | | 1,291,640 |
| | 20,097,465 |
Commercial Banks - 8.5% |
CIT Group, Inc. (a) | 95,900 | | 4,061,365 |
First Citizen Bancshares, Inc. | 18,200 | | 3,173,352 |
First Citizen Bancshares, Inc. (f) | 10,000 | | 1,569,240 |
Itau Unibanco Holding SA sponsored ADR | 197,800 | | 3,408,094 |
PNC Financial Services Group, Inc. | 92,100 | | 5,691,780 |
Popular, Inc. (a) | 193,280 | | 5,187,635 |
Common Stocks - continued |
| Shares | | Value |
FINANCIALS - continued |
Commercial Banks - continued |
U.S. Bancorp | 149,100 | | $ 4,935,210 |
Wells Fargo & Co. | 416,300 | | 14,499,729 |
| | 42,526,405 |
Consumer Finance - 1.1% |
EZCORP, Inc. (non-vtg.) Class A (a) | 44,623 | | 990,631 |
SLM Corp. | 264,500 | | 4,467,405 |
| | 5,458,036 |
Insurance - 8.4% |
ACE Ltd. | 64,500 | | 5,503,785 |
AFLAC, Inc. | 63,450 | | 3,366,657 |
Berkshire Hathaway, Inc. Class B (a) | 150,457 | | 14,583,797 |
Fairfax Financial Holdings Ltd. (sub. vtg.) | 7,500 | | 2,691,999 |
MetLife, Inc. | 107,700 | | 4,021,518 |
National Western Life Insurance Co. Class A | 14,750 | | 2,410,150 |
Old Republic International Corp. | 338,700 | | 3,861,180 |
StanCorp Financial Group, Inc. | 55,000 | | 2,138,950 |
Torchmark Corp. | 58,350 | | 3,250,679 |
| | 41,828,715 |
Real Estate Investment Trusts - 1.2% |
American Tower Corp. | 34,200 | | 2,604,330 |
Boston Properties, Inc. | 27,400 | | 2,884,672 |
Equity Lifestyle Properties, Inc. | 7,500 | | 537,000 |
Eurobank Properties Real Estate Investment Co. | 7,000 | | 51,420 |
| | 6,077,422 |
Real Estate Management & Development - 2.4% |
Consolidated-Tomoka Land Co. | 34,900 | | 1,256,051 |
Kennedy-Wilson Holdings, Inc. | 720,800 | | 10,804,792 |
| | 12,060,843 |
Thrifts & Mortgage Finance - 0.2% |
People's United Financial, Inc. | 82,300 | | 1,013,113 |
TOTAL FINANCIALS | | 129,061,999 |
HEALTH CARE - 11.1% |
Health Care Equipment & Supplies - 0.6% |
Alere, Inc. (a) | 6,650 | | 141,379 |
Baxter International, Inc. | 7,800 | | 529,152 |
Covidien PLC | 18,000 | | 1,122,120 |
Common Stocks - continued |
| Shares | | Value |
HEALTH CARE - continued |
Health Care Equipment & Supplies - continued |
St. Jude Medical, Inc. | 17,900 | | $ 728,530 |
Teleflex, Inc. | 6,200 | | 465,000 |
| | 2,986,181 |
Health Care Providers & Services - 2.2% |
Quest Diagnostics, Inc. | 19,300 | | 1,118,435 |
UnitedHealth Group, Inc. | 110,900 | | 6,122,789 |
WellPoint, Inc. | 55,801 | | 3,617,021 |
| | 10,858,245 |
Health Care Technology - 0.1% |
Allscripts Healthcare Solutions, Inc. (a) | 61,700 | | 683,636 |
Life Sciences Tools & Services - 0.7% |
QIAGEN NV (a) | 29,000 | | 609,000 |
Thermo Fisher Scientific, Inc. | 38,742 | | 2,794,848 |
| | 3,403,848 |
Pharmaceuticals - 7.5% |
AbbVie, Inc. | 29,700 | | 1,089,693 |
Eli Lilly & Co. | 18,400 | | 987,896 |
Endo Pharmaceuticals Holdings, Inc. (a) | 24,900 | | 788,334 |
Jazz Pharmaceuticals PLC (a) | 9,800 | | 552,622 |
Johnson & Johnson | 154,800 | | 11,442,816 |
Merck & Co., Inc. | 275,600 | | 11,919,700 |
Pfizer, Inc. | 371,700 | | 10,139,976 |
Warner Chilcott PLC | 40,100 | | 568,217 |
Zoetis, Inc. Class A | 4,300 | | 111,800 |
| | 37,601,054 |
TOTAL HEALTH CARE | | 55,532,964 |
INDUSTRIALS - 10.1% |
Aerospace & Defense - 1.4% |
General Dynamics Corp. | 73,300 | | 4,859,790 |
United Technologies Corp. | 25,800 | | 2,259,306 |
| | 7,119,096 |
Air Freight & Logistics - 0.7% |
FedEx Corp. | 35,800 | | 3,631,910 |
Commercial Services & Supplies - 1.8% |
Corrections Corp. of America | 43,800 | | 1,659,582 |
CyrusOne, Inc. | 69,000 | | 1,460,730 |
Common Stocks - continued |
| Shares | | Value |
INDUSTRIALS - continued |
Commercial Services & Supplies - continued |
Republic Services, Inc. | 81,700 | | $ 2,605,413 |
Waste Management, Inc. | 84,200 | | 3,063,196 |
| | 8,788,921 |
Construction & Engineering - 1.5% |
AECOM Technology Corp. (a) | 205,200 | | 5,246,964 |
Foster Wheeler AG (a) | 85,500 | | 2,232,405 |
| | 7,479,369 |
Industrial Conglomerates - 3.2% |
General Electric Co. | 711,800 | | 15,858,900 |
Machinery - 0.5% |
Stanley Black & Decker, Inc. | 30,917 | | 2,375,353 |
Professional Services - 0.6% |
Towers Watson & Co. | 50,900 | | 3,108,972 |
Road & Rail - 0.4% |
Union Pacific Corp. | 15,300 | | 2,011,338 |
TOTAL INDUSTRIALS | | 50,373,859 |
INFORMATION TECHNOLOGY - 5.7% |
Communications Equipment - 1.5% |
Brocade Communications Systems, Inc. (a) | 165,900 | | 948,948 |
Cisco Systems, Inc. | 314,900 | | 6,477,493 |
| | 7,426,441 |
Computers & Peripherals - 0.9% |
Hewlett-Packard Co. | 271,027 | | 4,474,656 |
Electronic Equipment & Components - 0.9% |
Corning, Inc. | 190,798 | | 2,289,576 |
Jabil Circuit, Inc. | 127,348 | | 2,408,151 |
| | 4,697,727 |
Semiconductors & Semiconductor Equipment - 2.0% |
Broadcom Corp. Class A | 68,500 | | 2,222,825 |
Freescale Semiconductor Holdings I Ltd. (a)(d) | 146,559 | | 2,117,778 |
Intersil Corp. Class A | 253,868 | | 2,195,958 |
Marvell Technology Group Ltd. | 192,164 | | 1,777,517 |
ON Semiconductor Corp. (a) | 213,500 | | 1,675,975 |
| | 9,990,053 |
Common Stocks - continued |
| Shares | | Value |
INFORMATION TECHNOLOGY - continued |
Software - 0.4% |
Symantec Corp. (a) | 97,000 | | $ 2,111,690 |
TOTAL INFORMATION TECHNOLOGY | | 28,700,567 |
MATERIALS - 4.5% |
Chemicals - 3.3% |
Air Products & Chemicals, Inc. | 48,450 | | 4,235,984 |
Ashland, Inc. | 48,300 | | 3,792,033 |
Eastman Chemical Co. | 52,400 | | 3,728,260 |
LyondellBasell Industries NV Class A | 75,220 | | 4,770,452 |
| | 16,526,729 |
Containers & Packaging - 0.8% |
Rock-Tenn Co. Class A | 49,070 | | 3,874,077 |
Metals & Mining - 0.4% |
Freeport-McMoRan Copper & Gold, Inc. | 52,600 | | 1,854,150 |
TOTAL MATERIALS | | 22,254,956 |
TELECOMMUNICATION SERVICES - 2.8% |
Diversified Telecommunication Services - 2.4% |
AT&T, Inc. | 225,800 | | 7,855,582 |
CenturyLink, Inc. | 74,714 | | 3,022,181 |
Frontier Communications Corp. (d) | 236,700 | | 1,081,719 |
| | 11,959,482 |
Wireless Telecommunication Services - 0.4% |
NII Holdings, Inc. (a)(d) | 319,500 | | 2,236,500 |
TOTAL TELECOMMUNICATION SERVICES | | 14,195,982 |
UTILITIES - 6.5% |
Electric Utilities - 4.1% |
Edison International | 94,300 | | 4,544,317 |
Hawaiian Electric Industries, Inc. | 15,100 | | 407,247 |
ITC Holdings Corp. | 41,100 | | 3,329,100 |
NextEra Energy, Inc. | 50,410 | | 3,632,041 |
Northeast Utilities | 128,600 | | 5,237,878 |
OGE Energy Corp. | 55,540 | | 3,260,753 |
| | 20,411,336 |
Common Stocks - continued |
| Shares | | Value |
UTILITIES - continued |
Gas Utilities - 0.4% |
ONEOK, Inc. | 25,100 | | $ 1,179,951 |
Questar Corp. | 29,700 | | 689,931 |
| | 1,869,882 |
Independent Power Producers & Energy Traders - 0.4% |
The AES Corp. | 179,590 | | 1,946,756 |
Multi-Utilities - 1.6% |
NiSource, Inc. | 122,600 | | 3,313,878 |
Sempra Energy | 66,650 | | 5,002,083 |
| | 8,315,961 |
TOTAL UTILITIES | | 32,543,935 |
TOTAL COMMON STOCKS (Cost $456,339,619) |
486,867,688
|
Nonconvertible Preferred Stocks - 0.0% |
| | | |
FINANCIALS - 0.0% |
Real Estate Investment Trusts - 0.0% |
Eagle Hospitality Properties Trust, Inc. 8.25% (a) (Cost $141,235) | 47,000 | |
47
|
U.S. Treasury Obligations - 0.0% |
| Principal Amount | | |
U.S. Treasury Bills, yield at date of purchase 0.06% to 0.08% 2/14/13 to 4/18/13 (e)
(Cost $349,985) | | $ 350,000 | |
349,992
|
Money Market Funds - 3.4% |
| Shares | | Value |
Fidelity Cash Central Fund, 0.16% (b) | 14,449,093 | | $ 14,449,093 |
Fidelity Securities Lending Cash Central Fund, 0.15% (b)(c) | 2,495,750 | | 2,495,750 |
TOTAL MONEY MARKET FUNDS (Cost $16,944,843) |
16,944,843
|
TOTAL INVESTMENT PORTFOLIO - 100.8% (Cost $473,775,682) | | 504,162,570 |
NET OTHER ASSETS (LIABILITIES) - (0.8)% | | (4,203,144) |
NET ASSETS - 100% | $ 499,959,426 |
Futures Contracts |
| Expiration Date | | Underlying Face Amount at Value | | Unrealized Appreciation/(Depreciation) |
Purchased |
Equity Index Contracts |
162 ICE Russell 1000 Value Index Contracts | March 2013 | | $ 12,315,240 | | $ 329,222 |
|
The face value of futures purchased as a percentage of net assets is 2.5% |
Legend |
(a) Non-income producing |
(b) Affiliated fund that is available only to investment companies and other accounts managed by Fidelity Investments. The rate quoted is the annualized seven-day yield of the fund at period end. A complete unaudited listing of the fund's holdings as of its most recent quarter end is available upon request. In addition, each Fidelity Central Fund's financial statements, which are not covered by the Fund's Report of Independent Registered Public Accounting Firm, are available on the SEC's website or upon request. |
(c) Investment made with cash collateral received from securities on loan. |
(d) Security or a portion of the security is on loan at period end. |
(e) Security or a portion of the security was pledged to cover margin requirements for futures contracts. At the period end, the value of securities pledged amounted to $349,992. |
(f) Restricted securities - Investment in securities not registered under the Securities Act of 1933 (excluding 144A issues). At the end of the period, the value of restricted securities (excluding 144A issues) amounted to $1,569,240 or 0.3% of net assets. |
Additional information on each restricted holding is as follows: |
Security | Acquisition Date | Acquisition Cost |
First Citizen Bancshares, Inc. | 12/21/12 | $ 1,400,000 |
Affiliated Central Funds |
Information regarding fiscal year to date income earned by the Fund from investments in Fidelity Central Funds is as follows: |
Fund | Income earned |
Fidelity Cash Central Fund | $ 14,628 |
Fidelity Securities Lending Cash Central Fund | 83,364 |
Total | $ 97,992 |
Other Information |
The following is a summary of the inputs used, as of January 31, 2013, involving the Fund's assets and liabilities carried at fair value. The inputs or methodology used for valuing securities may not be an indication of the risk associated with investing in those securities. For more information on valuation inputs, and their aggregation into the levels used in the table below, please refer to the Investment Valuation section in the accompanying Notes to Financial Statements. |
Valuation Inputs at Reporting Date: |
Description | Total | Level 1 | Level 2 | Level 3 |
Investments in Securities: | | | | |
Equities: | | | | |
Consumer Discretionary | $ 36,418,568 | $ 36,418,568 | $ - | $ - |
Consumer Staples | 36,376,809 | 36,376,809 | - | - |
Energy | 81,408,049 | 81,408,049 | - | - |
Financials | 129,062,046 | 127,492,806 | 1,569,240 | - |
Health Care | 55,532,964 | 55,532,964 | - | - |
Industrials | 50,373,859 | 50,373,859 | - | - |
Information Technology | 28,700,567 | 28,700,567 | - | - |
Valuation Inputs at Reporting Date: |
Description | Total | Level 1 | Level 2 | Level 3 |
Investments in Securities: | | | | |
Equities: | | | | |
Materials | $ 22,254,956 | $ 22,254,956 | $ - | $ - |
Telecommunication Services | 14,195,982 | 14,195,982 | - | - |
Utilities | 32,543,935 | 32,543,935 | - | - |
U.S. Government and Government Agency Obligations | 349,992 | - | 349,992 | - |
Money Market Funds | 16,944,843 | 16,944,843 | - | - |
Total Investments in Securities: | $ 504,162,570 | $ 502,243,338 | $ 1,919,232 | $ - |
Derivative Instruments: | | | | |
Assets | | | | |
Futures Contracts | $ 329,222 | $ 329,222 | $ - | $ - |
Value of Derivative Instruments |
The following table is a summary of the Fund's value of derivative instruments by primary risk exposure as of January 31, 2013. For additional information on derivative instruments, please refer to the Derivative Instruments section in the accompanying Notes to Financial Statements. |
Primary Risk Exposure /
Derivative Type | Value |
| Asset | Liability |
Equity Risk | | |
Futures Contracts (a) | $ 329,222 | $ - |
Total Value of Derivatives | $ 329,222 | $ - |
(a) Reflects cumulative appreciation/(depreciation) on futures contracts as disclosed on the Schedule of Investments. Only the period end variation margin is separately disclosed on the Statement of Assets and Liabilities. |
Distribution of investments by country or territory of incorporation, as a percentage of total net assets, is as follows. (Unaudited) |
United States of America | 86.4% |
Canada | 3.4% |
United Kingdom | 3.2% |
Bermuda | 1.7% |
Switzerland | 1.5% |
Netherlands | 1.1% |
Puerto Rico | 1.0% |
Others (Individually Less Than 1%) | 1.7% |
| 100.0% |
See accompanying notes which are an integral part of the financial statements.
Annual Report
Statement of Assets and Liabilities
| January 31, 2013 |
| | |
Assets | | |
Investment in securities, at value (including securities loaned of $2,427,252) - See accompanying schedule: Unaffiliated issuers (cost $456,830,839) | $ 487,217,727 | |
Fidelity Central Funds (cost $16,944,843) | 16,944,843 | |
Total Investments (cost $473,775,682) | | $ 504,162,570 |
Cash | | 80,975 |
Receivable for investments sold | | 11,296,000 |
Receivable for fund shares sold | | 704,709 |
Dividends receivable | | 576,214 |
Distributions receivable from Fidelity Central Funds | | 9,803 |
Prepaid expenses | | 953 |
Other receivables | | 66,048 |
Total assets | | 516,897,272 |
| | |
Liabilities | | |
Payable for investments purchased | $ 12,573,953 | |
Payable for fund shares redeemed | 1,551,844 | |
Accrued management fee | 122,882 | |
Distribution and service plan fees payable | 12,492 | |
Payable for daily variation margin on futures contracts | 17,820 | |
Other affiliated payables | 111,610 | |
Other payables and accrued expenses | 51,495 | |
Collateral on securities loaned, at value | 2,495,750 | |
Total liabilities | | 16,937,846 |
| | |
Net Assets | | $ 499,959,426 |
Net Assets consist of: | | |
Paid in capital | | $ 819,564,735 |
Undistributed net investment income | | 393,853 |
Accumulated undistributed net realized gain (loss) on investments and foreign currency transactions | | (350,714,578) |
Net unrealized appreciation (depreciation) on investments and assets and liabilities in foreign currencies | | 30,715,416 |
Net Assets | | $ 499,959,426 |
See accompanying notes which are an integral part of the financial statements.
Annual Report
Statement of Assets and Liabilities - continued
| January 31, 2013 |
| | |
Calculation of Maximum Offering Price Class A:
Net Asset Value and redemption price per share ($18,234,003 ÷ 1,466,542 shares) | | $ 12.43 |
| | |
Maximum offering price per share (100/94.25 of $12.43) | | $ 13.19 |
Class T:
Net Asset Value and redemption price per share ($6,544,090 ÷ 526,045 shares) | | $ 12.44 |
| | |
Maximum offering price per share (100/96.50 of $12.44) | | $ 12.89 |
Class B:
Net Asset Value and offering price per share ($1,645,104 ÷ 132,267 shares)A | | $ 12.44 |
| | |
Class C:
Net Asset Value and offering price per share ($5,838,546 ÷ 474,748 shares)A | | $ 12.30 |
| | |
| | |
Stock Selector Large Cap Value:
Net Asset Value, offering price and redemption price per share ($465,702,312 ÷ 37,229,744 shares) | | $ 12.51 |
| | |
Institutional Class:
Net Asset Value, offering price and redemption price per share ($1,995,371 ÷ 160,151 shares) | | $ 12.46 |
A Redemption price per share is equal to net asset value less any applicable contingent deferred sales charge.
See accompanying notes which are an integral part of the financial statements.
Annual Report
Financial Statements - continued
Statement of Operations
| Year ended January 31, 2013 |
| | |
Investment Income | | |
Dividends | | $ 12,667,163 |
Interest | | 322 |
Income from Fidelity Central Funds | | 97,992 |
Total income | | 12,765,477 |
| | |
Expenses | | |
Management fee
Basic fee | $ 2,743,221 | |
Performance adjustment | (1,495,660) | |
Transfer agent fees | 1,224,930 | |
Distribution and service plan fees | 140,831 | |
Accounting and security lending fees | 191,707 | |
Custodian fees and expenses | 29,588 | |
Independent trustees' compensation | 3,240 | |
Registration fees | 78,048 | |
Audit | 55,888 | |
Legal | 2,369 | |
Miscellaneous | 5,245 | |
Total expenses before reductions | 2,979,407 | |
Expense reductions | (130,264) | 2,849,143 |
Net investment income (loss) | | 9,916,334 |
Realized and Unrealized Gain (Loss) Net realized gain (loss) on: | | |
Investment securities: | | |
Unaffiliated issuers | 28,785,348 | |
Foreign currency transactions | 30,679 | |
Futures contracts | 853,784 | |
Total net realized gain (loss) | | 29,669,811 |
Change in net unrealized appreciation (depreciation) on: Investment securities | 43,634,270 | |
Assets and liabilities in foreign currencies | (694) | |
Futures contracts | 326,645 | |
Total change in net unrealized appreciation (depreciation) | | 43,960,221 |
Net gain (loss) | | 73,630,032 |
Net increase (decrease) in net assets resulting from operations | | $ 83,546,366 |
See accompanying notes which are an integral part of the financial statements.
Annual Report
Statement of Changes in Net Assets
| Year ended
January 31,
2013 | Year ended
January 31,
2012 |
Increase (Decrease) in Net Assets | | |
Operations | | |
Net investment income (loss) | $ 9,916,334 | $ 10,198,233 |
Net realized gain (loss) | 29,669,811 | 82,077,771 |
Change in net unrealized appreciation (depreciation) | 43,960,221 | (80,818,055) |
Net increase (decrease) in net assets resulting
from operations | 83,546,366 | 11,457,949 |
Distributions to shareholders from net investment income | (9,512,706) | (10,179,715) |
Share transactions - net increase (decrease) | (89,844,793) | (323,065,032) |
Total increase (decrease) in net assets | (15,811,133) | (321,786,798) |
| | |
Net Assets | | |
Beginning of period | 515,770,559 | 837,557,357 |
End of period (including undistributed net investment income of $393,853 and distributions in excess of net investment income of $41,141, respectively) | $ 499,959,426 | $ 515,770,559 |
See accompanying notes which are an integral part of the financial statements.
Annual Report
Financial Highlights - Class A
Years ended January 31, | 2013 | 2012 | 2011 | 2010 | 2009 |
Selected Per-Share Data | | | | | |
Net asset value, beginning of period | $ 10.71 | $ 10.72 | $ 9.35 | $ 7.53 | $ 13.54 |
Income from Investment Operations | | | | | |
Net investment income (loss) C | .20 | .14 | .09 | .09 | .16 |
Net realized and unrealized gain (loss) | 1.73 | .02 | 1.38 | 1.85 | (6.00) |
Total from investment operations | 1.93 | .16 | 1.47 | 1.94 | (5.84) |
Distributions from net investment income | (.21) | (.17) | (.10) | (.12) | (.17) |
Net asset value, end of period | $ 12.43 | $ 10.71 | $ 10.72 | $ 9.35 | $ 7.53 |
Total Return A, B | 18.15% | 1.58% | 15.79% | 25.74% | (43.20)% |
Ratios to Average Net Assets D, F | | | | | |
Expenses before reductions | .87% | .87% | 1.00% | 1.15% | 1.17% |
Expenses net of fee waivers, if any | .87% | .87% | 1.00% | 1.15% | 1.17% |
Expenses net of all reductions | .85% | .86% | 1.00% | 1.13% | 1.17% |
Net investment income (loss) | 1.74% | 1.38% | .87% | 1.08% | 1.47% |
Supplemental Data | | | | | |
Net assets, end of period (000 omitted) | $ 18,234 | $ 18,900 | $ 20,815 | $ 23,778 | $ 22,577 |
Portfolio turnover rate E | 63% | 128% | 120% | 171% | 243% |
A Total returns would have been lower if certain expenses had not been reduced during the applicable periods shown.
B Total returns do not include the effect of the sales charges.
C Calculated based on average shares outstanding during the period.
D Fees and expenses of any underlying Fidelity Central Funds are not included in the Fund's expense ratio. The Fund indirectly bears its proportionate share of the expenses of any underlying Fidelity Central Funds.
E Amount does not include the portfolio activity of any underlying Fidelity Central Funds.
F Expense ratios reflect operating expenses of the class. Expenses before reductions do not reflect amounts reimbursed by the investment adviser or reductions from brokerage service arrangements or reductions from other expense offset arrangements and do not represent the amount paid by the class during periods when reimbursements or reductions occur. Expenses net of fee waivers reflect expenses after reimbursement by the investment adviser but prior to reductions from brokerage service arrangements or other expense offset arrangements. Expenses net of all reductions represent the net expenses paid by the class.
See accompanying notes which are an integral part of the financial statements.
Annual Report
Financial Highlights - Class T
Years ended January 31, | 2013 | 2012 | 2011 | 2010 | 2009 |
Selected Per-Share Data | | | | | |
Net asset value, beginning of period | $ 10.72 | $ 10.74 | $ 9.36 | $ 7.54 | $ 13.53 |
Income from Investment Operations | | | | | |
Net investment income (loss) C | .17 | .12 | .06 | .07 | .12 |
Net realized and unrealized gain (loss) | 1.73 | .01 | 1.39 | 1.84 | (5.97) |
Total from investment operations | 1.90 | .13 | 1.45 | 1.91 | (5.85) |
Distributions from net investment income | (.18) | (.15) | (.07) | (.09) | (.14) |
Net asset value, end of period | $ 12.44 | $ 10.72 | $ 10.74 | $ 9.36 | $ 7.54 |
Total Return A, B | 17.88% | 1.26% | 15.50% | 25.30% | (43.34)% |
Ratios to Average Net Assets D, F | | | | | |
Expenses before reductions | 1.14% | 1.14% | 1.29% | 1.45% | 1.49% |
Expenses net of fee waivers, if any | 1.14% | 1.14% | 1.29% | 1.45% | 1.49% |
Expenses net of all reductions | 1.12% | 1.13% | 1.28% | 1.44% | 1.49% |
Net investment income (loss) | 1.48% | 1.11% | .59% | .78% | 1.15% |
Supplemental Data | | | | | |
Net assets, end of period (000 omitted) | $ 6,544 | $ 5,603 | $ 5,625 | $ 9,101 | $ 9,792 |
Portfolio turnover rate E | 63% | 128% | 120% | 171% | 243% |
A Total returns would have been lower if certain expenses had not been reduced during the applicable periods shown.
B Total returns do not include the effect of the sales charges.
C Calculated based on average shares outstanding during the period.
D Fees and expenses of any underlying Fidelity Central Funds are not included in the Fund's expense ratio. The Fund indirectly bears its proportionate share of the expenses of any underlying Fidelity Central Funds.
E Amount does not include the portfolio activity of any underlying Fidelity Central Funds.
F Expense ratios reflect operating expenses of the class. Expenses before reductions do not reflect amounts reimbursed by the investment adviser or reductions from brokerage service arrangements or reductions from other expense offset arrangements and do not represent the amount paid by the class during periods when reimbursements or reductions occur. Expenses net of fee waivers reflect expenses after reimbursement by the investment adviser but prior to reductions from brokerage service arrangements or other expense offset arrangements. Expenses net of all reductions represent the net expenses paid by the class.
See accompanying notes which are an integral part of the financial statements.
Annual Report
Financial Highlights - Class B
Years ended January 31, | 2013 | 2012 | 2011 | 2010 | 2009 |
Selected Per-Share Data | | | | | |
Net asset value, beginning of period | $ 10.72 | $ 10.72 | $ 9.35 | $ 7.53 | $ 13.54 |
Income from Investment Operations | | | | | |
Net investment income (loss) C | .11 | .07 | .01 | .02 | .07 |
Net realized and unrealized gain (loss) | 1.73 | .02 | 1.38 | 1.85 | (5.98) |
Total from investment operations | 1.84 | .09 | 1.39 | 1.87 | (5.91) |
Distributions from net investment income | (.12) | (.09) | (.02) | (.05) | (.10) |
Net asset value, end of period | $ 12.44 | $ 10.72 | $ 10.72 | $ 9.35 | $ 7.53 |
Total Return A, B | 17.24% | .86% | 14.87% | 24.79% | (43.71)% |
Ratios to Average Net Assets D, F | | | | | |
Expenses before reductions | 1.63% | 1.62% | 1.80% | 1.98% | 2.07% |
Expenses net of fee waivers, if any | 1.63% | 1.62% | 1.80% | 1.98% | 2.00% |
Expenses net of all reductions | 1.60% | 1.62% | 1.79% | 1.97% | 2.00% |
Net investment income (loss) | .99% | .63% | .08% | .24% | .64% |
Supplemental Data | | | | | |
Net assets, end of period (000 omitted) | $ 1,645 | $ 1,819 | $ 2,274 | $ 2,711 | $ 2,600 |
Portfolio turnover rate E | 63% | 128% | 120% | 171% | 243% |
A Total returns would have been lower if certain expenses had not been reduced during the applicable periods shown.
B Total returns do not include the effect of the contingent deferred sales charge.
C Calculated based on average shares outstanding during the period.
D Fees and expenses of any underlying Fidelity Central Funds are not included in the Fund's expense ratio. The Fund indirectly bears its proportionate share of the expenses of any underlying Fidelity Central Funds.
E Amount does not include the portfolio activity of any underlying Fidelity Central Funds.
F Expense ratios reflect operating expenses of the class. Expenses before reductions do not reflect amounts reimbursed by the investment adviser or reductions from brokerage service arrangements or reductions from other expense offset arrangements and do not represent the amount paid by the class during periods when reimbursements or reductions occur. Expenses net of fee waivers reflect expenses after reimbursement by the investment adviser but prior to reductions from brokerage service arrangements or other expense offset arrangements. Expenses net of all reductions represent the net expenses paid by the class.
See accompanying notes which are an integral part of the financial statements.
Annual Report
Financial Highlights - Class C
Years ended January 31, | 2013 | 2012 | 2011 | 2010 | 2009 |
Selected Per-Share Data | | | | | |
Net asset value, beginning of period | $ 10.61 | $ 10.63 | $ 9.30 | $ 7.49 | $ 13.52 |
Income from Investment Operations | | | | | |
Net investment income (loss) C | .11 | .07 | .01 | .03 | .08 |
Net realized and unrealized gain (loss) | 1.72 | .01 | 1.36 | 1.84 | (5.97) |
Total from investment operations | 1.83 | .08 | 1.37 | 1.87 | (5.89) |
Distributions from net investment income | (.14) | (.10) | (.04) | (.06) | (.14) |
Net asset value, end of period | $ 12.30 | $ 10.61 | $ 10.63 | $ 9.30 | $ 7.49 |
Total Return A, B | 17.32% | .85% | 14.79% | 24.97% | (43.65)% |
Ratios to Average Net Assets D, F | | | | | |
Expenses before reductions | 1.63% | 1.62% | 1.75% | 1.89% | 1.91% |
Expenses net of fee waivers, if any | 1.63% | 1.62% | 1.75% | 1.89% | 1.91% |
Expenses net of all reductions | 1.61% | 1.61% | 1.74% | 1.88% | 1.91% |
Net investment income (loss) | .99% | .63% | .13% | .34% | .73% |
Supplemental Data | | | | | |
Net assets, end of period (000 omitted) | $ 5,839 | $ 4,979 | $ 3,959 | $ 3,491 | $ 2,352 |
Portfolio turnover rate E | 63% | 128% | 120% | 171% | 243% |
A Total returns would have been lower if certain expenses had not been reduced during the applicable periods shown.
B Total returns do not include the effect of the contingent deferred sales charge.
C Calculated based on average shares outstanding during the period.
D Fees and expenses of any underlying Fidelity Central Funds are not included in the Fund's expense ratio. The Fund indirectly bears its proportionate share of the expenses of any underlying Fidelity Central Funds.
E Amount does not include the portfolio activity of any underlying Fidelity Central Funds.
F Expense ratios reflect operating expenses of the class. Expenses before reductions do not reflect amounts reimbursed by the investment adviser or reductions from brokerage service arrangements or reductions from other expense offset arrangements and do not represent the amount paid by the class during periods when reimbursements or reductions occur. Expenses net of fee waivers reflect expenses after reimbursement by the investment adviser but prior to reductions from brokerage service arrangements or other expense offset arrangements. Expenses net of all reductions represent the net expenses paid by the class.
See accompanying notes which are an integral part of the financial statements.
Annual Report
Financial Highlights - Stock Selector Large Cap Value
Years ended January 31, | 2013 | 2012 | 2011 | 2010 | 2009 |
Selected Per-Share Data | | | | | |
Net asset value, beginning of period | $ 10.77 | $ 10.78 | $ 9.40 | $ 7.56 | $ 13.57 |
Income from Investment Operations | | | | | |
Net investment income (loss) B | .23 | .18 | .11 | .12 | .20 |
Net realized and unrealized gain (loss) | 1.75 | .01 | 1.40 | 1.86 | (6.02) |
Total from investment operations | 1.98 | .19 | 1.51 | 1.98 | (5.82) |
Distributions from net investment income | (.24) | (.20) | (.13) | (.14) | (.19) |
Net asset value, end of period | $ 12.51 | $ 10.77 | $ 10.78 | $ 9.40 | $ 7.56 |
Total Return A | 18.55% | 1.85% | 16.09% | 26.21% | (43.03)% |
Ratios to Average Net Assets C, E | | | | | |
Expenses before reductions | .57% | .57% | .73% | .85% | .86% |
Expenses net of fee waivers, if any | .57% | .57% | .73% | .85% | .86% |
Expenses net of all reductions | .55% | .56% | .72% | .84% | .86% |
Net investment income (loss) | 2.05% | 1.68% | 1.15% | 1.38% | 1.78% |
Supplemental Data | | | | | |
Net assets, end of period (000 omitted) | $ 465,702 | $ 482,950 | $ 803,009 | $ 914,828 | $ 916,490 |
Portfolio turnover rate D | 63% | 128% | 120% | 171% | 243% |
A Total returns would have been lower if certain expenses had not been reduced during the applicable periods shown.
B Calculated based on average shares outstanding during the period.
C Fees and expenses of any underlying Fidelity Central Funds are not included in the Fund's expense ratio. The Fund indirectly bears its proportionate share of the expenses of any underlying Fidelity Central Funds.
D Amount does not include the portfolio activity of any underlying Fidelity Central Funds.
E Expense ratios reflect operating expenses of the class. Expenses before reductions do not reflect amounts reimbursed by the investment adviser or reductions from brokerage service arrangements or reductions from other expense offset arrangements and do not represent the amount paid by the class during periods when reimbursements or reductions occur. Expenses net of fee waivers reflect expenses after reimbursement by the investment adviser but prior to reductions from brokerage service arrangements or other expense offset arrangements. Expenses net of all reductions represent the net expenses paid by the class.
See accompanying notes which are an integral part of the financial statements.
Annual Report
Financial Highlights - Institutional Class
Years ended January 31, | 2013 | 2012 | 2011 | 2010 | 2009 |
Selected Per-Share Data | | | | | |
Net asset value, beginning of period | $ 10.74 | $ 10.74 | $ 9.37 | $ 7.54 | $ 13.54 |
Income from Investment Operations | | | | | |
Net investment income (loss) B | .23 | .17 | .11 | .12 | .20 |
Net realized and unrealized gain (loss) | 1.73 | .02 | 1.39 | 1.85 | (6.01) |
Total from investment operations | 1.96 | .19 | 1.50 | 1.97 | (5.81) |
Distributions from net investment income | (.24) | (.19) | (.13) | (.14) | (.19) |
Net asset value, end of period | $ 12.46 | $ 10.74 | $ 10.74 | $ 9.37 | $ 7.54 |
Total Return A | 18.42% | 1.92% | 16.04% | 26.18% | (43.00)% |
Ratios to Average Net Assets C, E | | | | | |
Expenses before reductions | .61% | .60% | .74% | .87% | .85% |
Expenses net of fee waivers, if any | .61% | .60% | .74% | .87% | .85% |
Expenses net of all reductions | .58% | .60% | .73% | .86% | .85% |
Net investment income (loss) | 2.01% | 1.65% | 1.14% | 1.36% | 1.79% |
Supplemental Data | | | | | |
Net assets, end of period (000 omitted) | $ 1,995 | $ 1,519 | $ 1,876 | $ 2,279 | $ 1,304 |
Portfolio turnover rate D | 63% | 128% | 120% | 171% | 243% |
A Total returns would have been lower if certain expenses had not been reduced during the applicable periods shown.
B Calculated based on average shares outstanding during the period.
C Fees and expenses of any underlying Fidelity Central Funds are not included in the Fund's expense ratio. The Fund indirectly bears its proportionate share of the expenses of any underlying Fidelity Central Funds.
D Amount does not include the portfolio activity of any underlying Fidelity Central Funds.
E Expense ratios reflect operating expenses of the class. Expenses before reductions do not reflect amounts reimbursed by the investment adviser or reductions from brokerage service arrangements or reductions from other expense offset arrangements and do not represent the amount paid by the class during periods when reimbursements or reductions occur. Expenses net of fee waivers reflect expenses after reimbursement by the investment adviser but prior to reductions from brokerage service arrangements or other expense offset arrangements. Expenses net of all reductions represent the net expenses paid by the class.
See accompanying notes which are an integral part of the financial statements.
Annual Report
Notes to Financial Statements
For the period ended January 31, 2013
1. Organization.
Fidelity Stock Selector Large Cap Value Fund (the Fund) is a fund of Fidelity Devonshire Trust (the Trust) and is authorized to issue an unlimited number of shares. The Trust is registered under the Investment Company Act of 1940, as amended (the 1940 Act), as an open-end management investment company organized as a Massachusetts business trust. The Fund offers Class A, Class T, Class C, Stock Selector Large Cap Value and Institutional Class shares, each of which, along with Class B shares, has equal rights as to assets and voting privileges. Class B shares are closed to new accounts and additional purchases, except for exchanges and reinvestments. Each class has exclusive voting rights with respect to matters that affect that class. Class B shares will automatically convert to Class A shares after a holding period of seven years from the initial date of purchase. Investment income, realized and unrealized capital gains and losses, the common expenses of the Fund, and certain fund-level expense reductions, if any, are allocated on a pro-rata basis to each class based on the relative net assets of each class to the total net assets of the Fund. Each class differs with respect to transfer agent and distribution and service plan fees incurred. Certain expense reductions may also differ by class.
2. Investments in Fidelity Central Funds.
The Fund invests in Fidelity Central Funds, which are open-end investment companies available only to other investment companies and accounts managed by Fidelity Management & Research Company (FMR) and its affiliates. The Fund's Schedule of Investments lists each of the Fidelity Central Funds held as of period end, if any, as an investment of the Fund, but does not include the underlying holdings of each Fidelity Central Fund. As an Investing Fund, the Fund indirectly bears its proportionate share of the expenses of the underlying Fidelity Central Funds.
The Money Market Central Funds seek preservation of capital and current income and are managed by Fidelity Investments Money Management, Inc. (FIMM), an affiliate of FMR.
A complete unaudited list of holdings for each Fidelity Central Fund is available upon request or at the Securities and Exchange Commission (the SEC) website at www.sec.gov. In addition, the financial statements of the Fidelity Central Funds, which are not covered by the Fund's Report of Independent Registered Public Accounting Firm, are available on the SEC website or upon request.
3. Significant Accounting Policies.
The financial statements have been prepared in conformity with accounting principles generally accepted in the United States of America (GAAP), which require management to make certain estimates and assumptions at the date of the financial statements.
Annual Report
3. Significant Accounting Policies - continued
Actual results could differ from those estimates. Subsequent events, if any, through the date that the financial statements were issued have been evaluated in the preparation of the financial statements. The following summarizes the significant accounting policies of the Fund:
Investment Valuation. Investments are valued as of 4:00 p.m. Eastern time on the last calendar day of the period. In accordance with valuation policies and procedures approved by the Board of Trustees (the Board), the Fund attempts to obtain prices from one or more third party pricing vendors or brokers to value its investments. When current market prices, quotations or currency exchange rates are not readily available or reliable, investments will be fair valued in good faith by the FMR Fair Value Committee (the Committee), in accordance with procedures adopted by the Fund's Board. Factors used in determining fair value vary by investment type and may include market or investment specific events, changes in interest rates and credit quality. The frequency with which these procedures are used cannot be predicted and they may be utilized to a significant extent. The Committee oversees the Fund's valuation policies and procedures and is responsible for approving and reporting to the Board all fair value determinations.
The Fund categorizes the inputs to valuation techniques used to value its investments into a disclosure hierarchy consisting of three levels as shown below:
Level 1 - quoted prices in active markets for identical investments
Level 2 - other significant observable inputs (including quoted prices for similar investments, interest rates, prepayment speeds, etc.)
Level 3 - unobservable inputs (including the Fund's own assumptions based on the best information available)
Valuation techniques used to value the Fund's investments by major category are as follows:
Equity securities, including restricted securities, for which market quotations are readily available, are valued at the last reported sale price or official closing price as reported by a third party pricing vendor on the primary market or exchange on which they are traded and are categorized as Level 1 in the hierarchy. In the event there were no sales during the day or closing prices are not available, securities are valued at the last quoted bid price or may be valued using the last available price and are generally categorized as Level 2 in the hierarchy. For foreign equity securities, when significant market or security specific events arise, comparisons to the valuation of American Depositary Receipts (ADRs), futures contracts, Exchange-Traded Funds (ETFs) and certain indexes as well as quoted prices for similar securities are used and are categorized as Level 2 in the hierarchy. Utilizing these techniques may result in transfers between Level 1 and Level 2.
Annual Report
Notes to Financial Statements - continued
3. Significant Accounting Policies - continued
Investment Valuation - continued
For restricted equity securities and private placements where observable inputs are limited, assumptions about market activity and risk are used and these securities are generally categorized as Level 3 in the hierarchy.
Debt securities, including restricted securities, are valued based on evaluated prices received from third party pricing vendors or from brokers who make markets in such securities. For U.S. government and government agency obligations, pricing vendors utilize matrix pricing which considers yield or price of bonds of comparable quality, coupon, maturity and type as well as broker-supplied prices. When independent prices are unavailable or unreliable, debt securities may be valued utilizing pricing methodologies which consider similar factors that would be used by third party pricing vendors. Debt securities are generally categorized as Level 2 in the hierarchy but may be Level 3 depending on the circumstances.
Futures contracts are valued at the settlement price established each day by the board of trade or exchange on which they are traded and are categorized as Level 1 in the hierarchy. Investments in open-end mutual funds, including the Fidelity Central Funds, are valued at their closing net asset value (NAV) each business day and are categorized as Level 1 in the hierarchy.
Changes in valuation techniques may result in transfers in or out of an assigned level within the disclosure hierarchy. The aggregate value of investments by input level, as of January 31, 2013, is included at the end of the Fund's Schedule of Investments.
Foreign Currency. The Fund may use foreign currency contracts to facilitate transactions in foreign-denominated securities. Gains and losses from these transactions may arise from changes in the value of the foreign currency or if the counterparties do not perform under the contracts' terms.
Foreign-denominated assets, including investment securities, and liabilities are translated into U.S. dollars at the exchange rates at period end. Purchases and sales of investment securities, income and dividends received and expenses denominated in foreign currencies are translated into U.S. dollars at the exchange rate in effect on the transaction date.
The effects of exchange rate fluctuations on investments are included with the net realized and unrealized gain (loss) on investment securities. Other foreign currency transactions resulting in realized and unrealized gain (loss) are disclosed separately.
Investment Transactions and Income. For financial reporting purposes, the Fund's investment holdings and NAV include trades executed through the end of the last business day of the period. The NAV per share for processing shareholder transactions is
Annual Report
3. Significant Accounting Policies - continued
Investment Transactions and Income - continued
calculated as of the close of business of the New York Stock Exchange (NYSE), normally 4:00 p.m. Eastern time and includes trades executed through the end of the prior business day. Gains and losses on securities sold are determined on the basis of identified cost and may include proceeds received from litigation. Dividend income is recorded on the ex-dividend date, except for certain dividends from foreign securities where the ex-dividend date may have passed, which are recorded as soon as the Fund is informed of the ex-dividend date. Non-cash dividends included in dividend income, if any, are recorded at the fair market value of the securities received. Distributions received on securities that represent a return of capital or capital gain are recorded as a reduction of cost of investments and/or as a realized gain. The Fund estimates the components of distributions received that may be considered return of capital distributions or capital gain distributions. Interest income and distributions from the Fidelity Central Funds are accrued as earned. Interest income includes coupon interest and amortization of premium and accretion of discount on debt securities. Investment income is recorded net of foreign taxes withheld where recovery of such taxes is uncertain.
Expenses. Expenses directly attributable to a fund are charged to that fund. Expenses attributable to more than one fund are allocated among the respective funds on the basis of relative net assets or other appropriate methods. Expense estimates are accrued in the period to which they relate and adjustments are made when actual amounts are known.
Income Tax Information and Distributions to Shareholders. Each year, the Fund intends to qualify as a regulated investment company under Subchapter M of the Internal Revenue Code, including distributing substantially all of its taxable income and realized gains. As a result, no provision for income taxes is required. As of January 31, 2013, the Fund did not have any unrecognized tax benefits in the financial statements; nor is the Fund aware of any tax positions for which it is reasonably possible that the total amounts of unrecognized tax benefits will significantly change in the next twelve months. The Fund files a U.S. federal tax return, in addition to state and local tax returns as required. A fund's federal income tax returns are subject to examination by the Internal Revenue Service (IRS) for a period of three fiscal years after they are filed. State and local tax returns may be subject to examination for an additional fiscal year depending on the jurisdiction. Foreign taxes are provided for based on the Fund's understanding of the tax rules and rates that exist in the foreign markets in which it invests.
Distributions are declared and recorded on the ex-dividend date. Income dividends and capital gain distributions are declared separately for each class. Income and capital gain distributions are determined in accordance with income tax regulations, which may differ from GAAP.
Annual Report
Notes to Financial Statements - continued
3. Significant Accounting Policies - continued
Income Tax Information and Distributions to Shareholders - continued
Capital accounts within the financial statements are adjusted for permanent book-tax differences. These adjustments have no impact on net assets or the results of operations. Temporary book-tax differences will reverse in a subsequent period.
Book-tax differences are primarily due to futures contracts, foreign currency transactions, passive foreign investment companies (PFIC), capital loss carryforwards and losses deferred due to wash sales and excise tax regulations.
The federal tax cost of investment securities and unrealized appreciation (depreciation) as of period end were as follows:
Gross unrealized appreciation | $ 60,553,324 |
Gross unrealized depreciation | (36,375,847) |
Net unrealized appreciation (depreciation) on securities and other investments | $ 24,177,477 |
| |
Tax Cost | $ 479,985,093 |
The tax-based components of distributable earnings as of period end were as follows:
Undistributed ordinary income | $ 393,853 |
Capital loss carryforward | $ (344,175,945) |
Net unrealized appreciation (depreciation) | $ 24,506,005 |
Capital loss carryforwards are only available to offset future capital gains of the Fund to the extent provided by regulations and may be limited. Under the Regulated Investment Company Modernization Act of 2010 (the Act), the Fund is permitted to carry forward capital losses incurred in taxable years beginning after December 22, 2010 for an unlimited period and such capital losses are required to be used prior to any losses that expire. Capital loss carryforwards were as follows:
Fiscal year of expiration | |
| |
2017 | $ (156,071,106) |
2018 | (188,104,839) |
Total with expiration | $ (344,175,945) |
The tax character of distributions paid was as follows:
| January 31, 2013 | January 31, 2012 |
Ordinary Income | $ 9,512,706 | $ 10,179,715 |
Annual Report
3. Significant Accounting Policies - continued
Restricted Securities. The Fund may invest in securities that are subject to legal or contractual restrictions on resale. These securities generally may be resold in transactions exempt from registration or to the public if the securities are registered. Disposal of these securities may involve time-consuming negotiations and expense, and prompt sale at an acceptable price may be difficult. Information regarding restricted securities is included at the end of the Fund's Schedule of Investments.
New Accounting Pronouncement. In December 2011, the Financial Accounting Standards Board issued Accounting Standard Update No. 2011-11, Disclosures about Offsetting Assets and Liabilities. The update creates new disclosure requirements requiring entities to disclose both gross and net information for derivatives and other financial instruments that are either offset in the Statement of Assets and Liabilities or subject to an enforceable master netting arrangement or similar agreement. The disclosure requirements are effective for annual reporting periods beginning on or after January 1, 2013, and interim periods within those annual periods. Management is currently evaluating the impact of the update's adoption on the Fund's financial statement disclosures.
4. Derivative Instruments.
Risk Exposures and the Use of Derivative Instruments. The Fund's investment objective allows the Fund to enter into various types of derivative contracts, including futures contracts. Derivatives are investments whose value is primarily derived from underlying assets, indices or reference rates and may be transacted on an exchange or over-the-counter (OTC). Derivatives may involve a future commitment to buy or sell a specified asset based on specified terms, to exchange future cash flows at periodic intervals based on a notional principal amount, or for one party to make one or more payments upon the occurrence of specified events in exchange for periodic payments from the other party.
The Fund used derivatives to increase returns and to manage exposure to certain risks as defined below. The success of any strategy involving derivatives depends on analysis of numerous economic factors, and if the strategies for investment do not work as intended, the Fund may not achieve its objectives.
The Fund's use of derivatives increased or decreased its exposure to the following risk:
Equity Risk | Equity risk relates to the fluctuations in the value of financial instruments as a result of changes in market prices (other than those arising from interest rate risk or foreign exchange risk), whether caused by factors specific to an individual investment, its issuer, or all factors affecting all instruments traded in a market or market segment. |
Annual Report
Notes to Financial Statements - continued
4. Derivative Instruments - continued
Risk Exposures and the Use of Derivative Instruments - continued
The Fund is also exposed to additional risks from investing in derivatives, such as liquidity risk and counterparty credit risk. Liquidity risk is the risk that the Fund will be unable to close out the derivative in the open market in a timely manner. Counterparty credit risk is the risk that the counterparty will not be able to fulfill its obligation to the Fund. Counterparty credit risk related to exchange-traded futures contracts is mitigated by the protection provided by the exchange on which they trade.
Investing in derivatives may involve greater risks than investing in the underlying assets directly and, to varying degrees, may involve risk of loss in excess of any initial investment and collateral received and amounts recognized in the Statement of Assets and Liabilities. In addition, there may be the risk that the change in value of the derivative contract does not correspond to the change in value of the underlying instrument.
Futures Contracts. A futures contract is an agreement between two parties to buy or sell a specified underlying instrument for a fixed price at a specified future date. The Fund used futures contracts to manage its exposure to the stock market.
Upon entering into a futures contract, a fund is required to deposit either cash or securities (initial margin) with a clearing broker in an amount equal to a certain percentage of the face value of the contract. Futures contracts are marked-to-market daily and subsequent payments (variation margin) are made or received by a fund depending on the daily fluctuations in the value of the futures contracts and are recorded as unrealized appreciation or (depreciation). This receivable and/or payable, if any, is included in daily variation margin on futures contracts in the Statement of Assets and Liabilities. Realized gain or (loss) is recorded upon the expiration or closing of a futures contract.
Any open futures contracts at period end are presented in the Schedule of Investments under the caption "Futures Contracts." The underlying face amount at value reflects each contract's exposure to the underlying instrument or index at period end and is representative of activity for the period. Securities deposited to meet initial margin requirements are identified in the Schedule of Investments.
During the period the Fund recognized net realized gain (loss) of $853,784 and a change in net unrealized appreciation (depreciation) of $326,645 related to its investment in futures contracts. These amounts are included in the Statement of Operations.
5. Purchases and Sales of Investments.
Purchases and sales of securities, other than short-term securities, aggregated $304,000,483 and $399,010,186, respectively.
Annual Report
6. Fees and Other Transactions with Affiliates.
Management Fee. FMR and its affiliates provide the Fund with investment management related services for which the Fund pays a monthly management fee. The management fee is the sum of an individual fund fee rate that is based on an annual rate of .30% of the Fund's average net assets and an annualized group fee rate that averaged .26% during the period. The group fee rate is based upon the average net assets of all the mutual funds advised by FMR. The group fee rate decreases as assets under management increase and increases as assets under management decrease. In addition, the management fee is subject to a performance adjustment (up to a maximum of ± .20% of the Fund's average net assets over a 36 month performance period). The upward or downward adjustment to the management fee is based on the relative investment performance of Stock Selector Large Cap Value as compared to an appropriate benchmark index. For the period, the total annual management fee rate, including the performance adjustment, was .25% of the Fund's average net assets.
Distribution and Service Plan Fees. In accordance with Rule 12b-1 of the 1940 Act, the Fund has adopted separate Distribution and Service Plans for each class of shares. Certain classes pay Fidelity Distributors Corporation (FDC), an affiliate of FMR, separate Distribution and Service Fees, each of which is based on an annual percentage of each class' average net assets. In addition, FDC may pay financial intermediaries for selling shares of the Fund and providing shareholder support services. For the period, the Distribution and Service Fee rates, total fees and amounts retained by FDC were as follows:
| Distribution
Fee | Service
Fee | Total Fees | Retained
by FDC |
Class A | -% | .25% | $ 43,754 | $ 490 |
Class T | .25% | .25% | 29,408 | 168 |
Class B | .75% | .25% | 16,748 | 12,625 |
Class C | .75% | .25% | 50,921 | 14,959 |
| | | $ 140,831 | $ 28,242 |
Sales Load. FDC may receive a front-end sales charge of up to 5.75% for selling Class A shares and 3.50% for selling Class T shares, some of which is paid to financial intermediaries for selling shares of the Fund. Depending on the holding period, FDC may receive contingent deferred sales charges levied on Class A, Class T, Class B, and Class C redemptions. The deferred sales charges range from 5.00% to 1.00% for Class B shares, 1.00% for Class C shares, 1.00% for certain purchases of Class A shares and .25% for certain purchases of Class T shares.
Annual Report
Notes to Financial Statements - continued
6. Fees and Other Transactions with Affiliates - continued
Sales Load - continued
For the period, sales charge amounts retained by FDC were as follows:
| Retained
by FDC |
Class A | $ 6,859 |
Class T | 1,851 |
Class B* | 3,265 |
Class C* | 1,973 |
| $ 13,948 |
* When Class B and Class C shares are initially sold, FDC pays commissions from its own resources to financial intermediaries through which the sales are made.
Transfer Agent Fees. Fidelity Investments Institutional Operations Company, Inc. (FIIOC), an affiliate of FMR, is the transfer, dividend disbursing and shareholder servicing agent for each class of the Fund. FIIOC receives account fees and asset-based fees that vary according to the account size and type of account of the shareholders of the respective classes of the Fund. FIIOC pays for typesetting, printing and mailing of shareholder reports, except proxy statements. For the period, transfer agent fees for each class were as follows:
| Amount | % of
Average
Net Assets |
Class A | $ 51,877 | .30 |
Class T | 18,539 | .32 |
Class B | 5,041 | .30 |
Class C | 15,483 | .30 |
Stock Selector Large Cap Value | 1,128,822 | .25 |
Institutional Class | 5,168 | .28 |
| $ 1,224,930 | |
Accounting and Security Lending Fees. Fidelity Service Company, Inc. (FSC), an affiliate of FMR, maintains the Fund's accounting records. The accounting fee is based on the level of average net assets for each month. Under a separate contract, FSC administers the security lending program. The security lending fee is based on the number and duration of lending transactions.
Brokerage Commissions. The Fund placed a portion of its portfolio transactions with brokerage firms which are affiliates of the investment adviser. The commissions paid to these affiliated firms were $10,379 for the period.
Annual Report
7. Committed Line of Credit.
The Fund participates with other funds managed by FMR or an affiliate in a $4.25 billion credit facility (the "line of credit") to be utilized for temporary or emergency purposes to fund shareholder redemptions or for other short-term liquidity purposes. The Fund has agreed to pay commitment fees on its pro-rata portion of the line of credit, which amounted to $1,322 and is reflected in Miscellaneous expenses on the Statement of Operations. During the period, there were no borrowings on this line of credit.
8. Security Lending.
The Fund lends portfolio securities through a lending agent from time to time in order to earn additional income. For equity securities, a lending agent is used and may loan securities to certain qualified borrowers, including Fidelity Capital Markets (FCM), a broker-dealer affiliated with the Fund. On the settlement date of the loan, the Fund receives collateral (in the form of U.S. Treasury obligations, letters of credit and/or cash) against the loaned securities and maintains collateral in an amount not less than 100% of the market value of the loaned securities during the period of the loan. The market value of the loaned securities is determined at the close of business of the Fund and any additional required collateral is delivered to the Fund on the next business day. If the borrower defaults on its obligation to return the securities loaned because of insolvency or other reasons, a fund could experience delays and costs in recovering the securities loaned or in gaining access to the collateral. Any cash collateral received is invested in the Fidelity Securities Lending Cash Central Fund. The value of loaned securities and cash collateral at period end are disclosed on the Fund's Statement of Assets and Liabilities. The value of securities loaned to FCM at period end was $1,445,000. Security lending income represents the income earned on investing cash collateral, less rebates paid to borrowers and any lending agent fees associated with the loan, plus any premium payments received for lending certain types of securities. Security lending income is presented in the Statement of Operations as a component of income from Fidelity Central Funds. Total security lending income during the period amounted to $83,364, including $3,501 from securities loaned to FCM.
9. Expense Reductions.
Many of the brokers with whom FMR places trades on behalf of the Fund provided services to the Fund in addition to trade execution. These services included payments of certain expenses on behalf of the Fund totaling $130,264 for the period.
Annual Report
Notes to Financial Statements - continued
10. Distributions to Shareholders.
Distributions to shareholders of each class were as follows:
Years ended January 31, | 2013 | 2012 |
From net investment income | | |
Class A | $ 304,000 | $ 291,163 |
Class T | 93,858 | 76,828 |
Class B | 16,188 | 14,902 |
Class C | 63,927 | 43,527 |
Stock Selector Large Cap Value | 8,993,963 | 9,726,457 |
Institutional Class | 40,770 | 26,838 |
Total | $ 9,512,706 | $ 10,179,715 |
11. Share Transactions.
Transactions for each class of shares were as follows:
| Shares | Dollars |
Years ended January 31, | 2013 | 2012 | 2013 | 2012 |
Class A | | | | |
Shares sold | 251,269 | 537,296 | $ 2,848,724 | $ 5,591,381 |
Reinvestment of distributions | 24,461 | 26,981 | 281,542 | 272,774 |
Shares redeemed | (573,384) | (742,040) | (6,434,025) | (7,769,301) |
Net increase (decrease) | (297,654) | (177,763) | $ (3,303,759) | $ (1,905,146) |
Class T | | | | |
Shares sold | 131,721 | 164,778 | $ 1,501,274 | $ 1,752,467 |
Reinvestment of distributions | 8,058 | 7,415 | 92,826 | 75,038 |
Shares redeemed | (136,167) | (173,682) | (1,544,492) | (1,851,245) |
Net increase (decrease) | 3,612 | (1,489) | $ 49,608 | $ (23,740) |
Class B | | | | |
Shares sold | 1,157 | 9,062 | $ 13,142 | $ 86,884 |
Reinvestment of distributions | 1,236 | 1,307 | 14,255 | 13,227 |
Shares redeemed | (39,897) | (52,766) | (452,422) | (549,800) |
Net increase (decrease) | (37,504) | (42,397) | $ (425,025) | $ (449,689) |
Class C | | | | |
Shares sold | 162,948 | 201,797 | $ 1,812,867 | $ 2,080,198 |
Reinvestment of distributions | 4,869 | 3,605 | 55,503 | 36,155 |
Shares redeemed | (162,163) | (108,651) | (1,799,733) | (1,106,480) |
Net increase (decrease) | 5,654 | 96,751 | $ 68,637 | $ 1,009,873 |
Annual Report
11. Share Transactions - continued
| Shares | Dollars |
Years ended January 31, | 2013 | 2012 | 2013 | 2012 |
Stock Selector Large Cap Value | | | | |
Shares sold | 3,974,459 | 6,854,527 | $ 45,488,310 | $ 72,065,849 |
Reinvestment of distributions | 757,439 | 935,043 | 8,771,144 | 9,500,032 |
Shares redeemed | (12,329,354) | (37,479,739) | (140,694,347) | (402,880,177) |
Net increase (decrease) | (7,597,456) | (29,690,169) | $ (86,434,893) | $ (321,314,296) |
Institutional Class | | | | |
Shares sold | 54,716 | 58,013 | $ 619,947 | $ 608,335 |
Reinvestment of distributions | 3,536 | 2,632 | 40,770 | 26,662 |
Shares redeemed | (39,612) | (93,801) | (460,078) | (1,017,031) |
Net increase (decrease) | 18,640 | (33,156) | $ 200,639 | $ (382,034) |
12. Other.
The Fund's organizational documents provide former and current trustees and officers with a limited indemnification against liabilities arising in connection with the performance of their duties to the Fund. In the normal course of business, the Fund may also enter into contracts that provide general indemnifications. The Fund's maximum exposure under these arrangements is unknown as this would be dependent on future claims that may be made against the Fund. The risk of material loss from such claims is considered remote.
Annual Report
To the Trustees of Fidelity Devonshire Trust and the Shareholders of Fidelity Stock Selector Large Cap Value Fund:
In our opinion, the accompanying statement of assets and liabilities, including the schedule of investments, and the related statements of operations and of changes in net assets and the financial highlights present fairly, in all material respects, the financial position of Fidelity Stock Selector Large Cap Value Fund (a fund of Fidelity Devonshire Trust) at January 31, 2013, the results of its operations for the year then ended, the changes in its net assets for each of the two years in the period then ended and the financial highlights for each of the five years in the period then ended, in conformity with accounting principles generally accepted in the United States of America. These financial statements and financial highlights (hereafter referred to as "financial statements") are the responsibility of the Fidelity Stock Selector Large Cap Value Fund's management. Our responsibility is to express an opinion on these financial statements based on our audits. We conducted our audits of these financial statements in accordance with the standards of the Public Company Accounting Oversight Board (United States). Those standards require that we plan and perform the audit to obtain reasonable assurance about whether the financial statements are free of material misstatement. An audit includes examining, on a test basis, evidence supporting the amounts and disclosures in the financial statements, assessing the accounting principles used and significant estimates made by management, and evaluating the overall financial statement presentation. We believe that our audits, which included confirmation of securities at January 31, 2013 by correspondence with the custodian and brokers, provide a reasonable basis for our opinion.
PricewaterhouseCoopers LLP
Boston, Massachusetts
March 13, 2013
Annual Report
The Trustees, Members of the Advisory Board, and executive officers of the trust and fund, as applicable, are listed below. The Board of Trustees governs the fund and is responsible for protecting the interests of shareholders. The Trustees are experienced executives who meet periodically throughout the year to oversee the fund's activities, review contractual arrangements with companies that provide services to the fund, oversee management of the risks associated with such activities and contractual arrangements, and review the fund's performance. Except for James C. Curvey, each of the Trustees oversees 234 Fidelity funds. Mr. Curvey oversees 453 Fidelity funds.
The Trustees hold office without limit in time except that (a) any Trustee may resign; (b) any Trustee may be removed by written instrument, signed by at least two-thirds of the number of Trustees prior to such removal; (c) any Trustee who requests to be retired or who has become incapacitated by illness or injury may be retired by written instrument signed by a majority of the other Trustees; and (d) any Trustee may be removed at any special meeting of shareholders by a two-thirds vote of the outstanding voting securities of the trust. Each Trustee who is not an interested person (as defined in the 1940 Act) (Independent Trustee), shall retire not later than the last day of the calendar year in which his or her 75th birthday occurs. The Independent Trustees may waive this mandatory retirement age policy with respect to individual Trustees. The executive officers and Advisory Board Members hold office without limit in time, except that any officer and Advisory Board Member may resign or may be removed by a vote of a majority of the Trustees at any regular meeting or any special meeting of the Trustees. Except as indicated, each individual has held the office shown or other offices in the same company for the past five years.
Experience, Skills, Attributes, and Qualifications of the Fund's Trustees. The Governance and Nominating Committee has adopted a statement of policy that describes the experience, qualifications, attributes, and skills that are necessary and desirable for potential Independent Trustee candidates (Statement of Policy). The Board believes that each Trustee satisfied at the time he or she was initially elected or appointed a Trustee, and continues to satisfy, the standards contemplated by the Statement of Policy. The Governance and Nominating Committee also engages professional search firms to help identify potential Independent Trustee candidates who have the experience, qualifications, attributes, and skills consistent with the Statement of Policy. From time to time, additional criteria based on the composition and skills of the current Independent Trustees, as well as experience or skills that may be appropriate in light of future changes to board composition, business conditions, and regulatory or other developments, have also been considered by the professional search firms and the Governance and Nominating Committee. In addition, the Board takes into account the Trustees' commitment and participation in Board and committee meetings, as well as their leadership of standing and ad hoc committees throughout their tenure.
In determining that a particular Trustee was and continues to be qualified to serve as a Trustee, the Board has considered a variety of criteria, none of which, in isolation, was controlling. The Board believes that, collectively, the Trustees have balanced and diverse experience, qualifications, attributes, and skills, which allow the Board to operate effectively in governing the fund and protecting the interests of shareholders. Information about the specific experience, skills, attributes, and qualifications of each Trustee, which in each case led to the Board's conclusion that the Trustee should serve (or continue to serve) as a trustee of the fund, is provided below.
Annual Report
Board Structure and Oversight Function. James C. Curvey is an interested person (as defined in the 1940 Act) and currently serves as Chairman. The Trustees have determined that an interested Chairman is appropriate and benefits shareholders because an interested Chairman has a personal and professional stake in the quality and continuity of services provided to the fund. Independent Trustees exercise their informed business judgment to appoint an individual of their choosing to serve as Chairman, regardless of whether the Trustee happens to be independent or a member of management. The Independent Trustees have determined that they can act independently and effectively without having an Independent Trustee serve as Chairman and that a key structural component for assuring that they are in a position to do so is for the Independent Trustees to constitute a substantial majority for the Board. The Independent Trustees also regularly meet in executive session. Ned C. Lautenbach serves as Chairman of the Independent Trustees and as such (i) acts as a liaison between the Independent Trustees and management with respect to matters important to the Independent Trustees and (ii) with management prepares agendas for Board meetings.
Fidelity funds are overseen by different Boards of Trustees. The fund's Board oversees Fidelity's equity and high income funds and another Board oversees Fidelity's investment-grade bond, money market, and asset allocation funds. The asset allocation funds may invest in Fidelity funds overseen by the fund's Board. The use of separate Boards, each with its own committee structure, allows the Trustees of each group of Fidelity funds to focus on the unique issues of the funds they oversee, including common research, investment, and operational issues. On occasion, the separate Boards establish joint committees to address issues of overlapping consequences for the Fidelity funds overseen by each Board.
The Trustees operate using a system of committees to facilitate the timely and efficient consideration of all matters of importance to the Trustees, the fund, and fund shareholders and to facilitate compliance with legal and regulatory requirements and oversight of the fund's activities and associated risks. The Board, acting through its committees, has charged FMR and its affiliates with (i) identifying events or circumstances the occurrence of which could have demonstrably adverse effects on the fund's business and/or reputation; (ii) implementing processes and controls to lessen the possibility that such events or circumstances occur or to mitigate the effects of such events or circumstances if they do occur; and (iii) creating and maintaining a system designed to evaluate continuously business and market conditions in order to facilitate the identification and implementation processes described in (i) and (ii) above. Because the day-to-day operations and activities of the fund are carried out by or through FMR, its affiliates and other service providers, the fund's exposure to risks is mitigated but not eliminated by the processes overseen by the Trustees. While each of the Board's committees has responsibility for overseeing different aspects of the fund's activities, oversight is exercised primarily through the Operations, Audit, and Compliance Committees. In addition, the Independent Trustees have worked with FMR to enhance the Board's oversight of investment and financial risks, legal and regulatory risks, technology risks, and operational risks, including the development of additional risk reporting to the Board. For example, a working group comprised of Independent Trustees and FMR has worked and continues to work to review the Fidelity funds' valuation-related activities, reporting and risk management. Appropriate personnel, including but not limited to the fund's Chief Compliance Officer (CCO), FMR's internal auditor, the independent accountants, the fund's Treasurer and portfolio management personnel, make periodic reports to the Board's committees, as appropriate, including an annual review of FMR's risk management program for the Fidelity funds. The responsibilities of each standing committee, including their oversight responsibilities, are described further under "Standing Committees of the Fund's Trustees."
Annual Report
Trustees and Officers - continued
The fund's Statement of Additional Information (SAI) includes more information about the Trustees. To request a free copy, call Fidelity at 1-800-544-8544.
Interested Trustees*:
Correspondence intended for each Trustee who is an interested person may be sent to Fidelity Investments, 245 Summer Street, Boston, Massachusetts 02210.
Name, Age; Principal Occupations and Other Relevant Experience+ |
James C. Curvey (77) |
| Year of Election or Appointment: 2007 Mr. Curvey is Trustee and Chairman of the Board of Trustees of certain Trusts. Mr. Curvey also serves as Trustee (2007-present) of other investment companies advised by FMR. Mr. Curvey is a Director of Fidelity Investments Money Management, Inc. (2009-present), Director of Fidelity Research & Analysis Co. (2009-present) and Director of FMR and FMR Co., Inc. (2007-present). Mr. Curvey is also Vice Chairman (2007-present) and Director of FMR LLC. In addition, Mr. Curvey serves as an Overseer for the Boston Symphony Orchestra and a member of the Trustees of Villanova University. Previously, Mr. Curvey was the Vice Chairman (2006-2007) and Director (2000-2007) of FMR Corp. |
Ronald P. O'Hanley (55) |
| Year of Election or Appointment: 2011 Mr. O'Hanley is Director of FMR Co., Inc. (2010-present), Director of Fidelity Investments Money Management, Inc. (2010-present), Director of Fidelity Research & Analysis Company (2010-present), President of Fidelity Asset Management and Corporate Services and a member of Fidelity's Executive Committee (2010-present). Previously, Mr. O'Hanley served as President and Chief Executive Officer of BNY Mellon Asset Management (2007-2010). Mr. O'Hanley also served as Vice Chairman of Bank New York Mellon Corp. and a member of that firm's Executive Committee. Prior to the 2007 merger of The Bank of New York and Mellon Financial Corporation, he was Vice Chairman of Mellon Financial Corporation and President and Chief Executive Officer of Mellon Asset Management. He joined Mellon in February 1997. Mr. O'Hanley currently serves as Chairman of the Boston Public Library Foundation Board of Directors and sits on the Board of Directors of Beth Israel Deaconess Medical Center, the Board of Trustees of the Marine Biological Laboratory and the Advisory Board of the Maxwell School of Citizenship and Public Administration at Syracuse University. Mr. O'Hanley also chairs the Council on Asset Management for the Financial Services Roundtable and is a member of the Board of Directors of Institutional Investor's U.S. Institute. |
* Trustees have been determined to be "Interested Trustees" by virtue of, among other things, their affiliation with the trust or various entities under common control with FMR.
+ The information above includes each Trustee's principal occupation during the last five years and other information relating to the experience, attributes, and skills relevant to each Trustee's qualifications to serve as a Trustee, which led to the conclusion that each Trustee should serve as a Trustee for the fund.
Annual Report
Trustees and Officers - continued
Independent Trustees:
Correspondence intended for each Independent Trustee (that is, the Trustees other than the Interested Trustees) may be sent to Fidelity Investments, P.O. Box 55235, Boston, Massachusetts 02205-5235.
Name, Age; Principal Occupations and Other Relevant Experience+ |
Dennis J. Dirks (64) |
| Year of Election or Appointment: 2005 Prior to his retirement in May 2003, Mr. Dirks was Chief Operating Officer and a member of the Board of The Depository Trust & Clearing Corporation (DTCC). He also served as President, Chief Operating Officer, and Board member of The Depository Trust Company (DTC) and President and Board member of the National Securities Clearing Corporation (NSCC). In addition, Mr. Dirks served as Chief Executive Officer and Board member of the Government Securities Clearing Corporation, Chief Executive Officer and Board member of the Mortgage-Backed Securities Clearing Corporation, as a Trustee and a member of the Finance Committee of Manhattan College (2005-2008), and as a Trustee and a member of the Finance Committee of AHRC of Nassau County (2006-2008). Mr. Dirks is a member of the Independent Directors Council (IDC) Governing Council (2010-present) and Board of Directors for The Brookville Center for Children's Services, Inc. (2009-present). |
Alan J. Lacy (59) |
| Year of Election or Appointment: 2008 Mr. Lacy serves as Senior Adviser (2007-present) of Oak Hill Capital Partners, L.P. (private equity). Mr. Lacy also served as Chief Executive Officer (2000-2005) and Vice Chairman (2005-2006) of Sears Holdings Corporation and Sears, Roebuck and Co. (retail). In addition, Mr. Lacy serves as a member of the Board of Directors of Dave & Buster's Entertainment, Inc. (restaurant and entertainment complexes, 2010-present), Earth Fare, Inc. (retail grocery, 2012-present), The Hillman Companies, Inc. (hardware wholesalers, 2010-present), and Bristol-Myers Squibb Company (global pharmaceuticals, 2008-present). Mr. Lacy is a member of the Board of Trustees of The National Parks Conservation Association (2006-present). Previously, Mr. Lacy served as Chairman of the Board of Trustees of the National Parks Conservation Association (2008-2011) and as a member of the Board of Directors for the Western Union Company (global money transfer, 2006-2011). |
Ned C. Lautenbach (68) |
| Year of Election or Appointment: 2000 Mr. Lautenbach is Chairman of the Independent Trustees of the Equity and High Income Funds (2006-present). Mr. Lautenbach currently serves as the Lead Director of the Eaton Corporation Board of Directors (diversified industrial, 1997-present). Mr. Lautenbach is Chairman of the Board of Directors of the Philharmonic Center for the Arts in Naples, Florida (2012-present) and a member of the Council on Foreign Relations (1994-present). Previously, Mr. Lautenbach was a Partner/Advisory Partner at Clayton, Dubilier & Rice, LLC (private equity investment, 1998-2010), as well as a Director of Sony Corporation (2006-2007). |
Joseph Mauriello (68) |
| Year of Election or Appointment: 2008 Prior to his retirement in January 2006, Mr. Mauriello served in numerous senior management positions including Deputy Chairman and Chief Operating Officer (2004-2005), and Vice Chairman of Financial Services (2002-2004) of KPMG LLP US (professional services, 1965-2005). Mr. Mauriello currently serves as a member of the Board of Directors of XL Group plc. (global insurance and re-insurance, 2006-present). Previously, Mr. Mauriello served as a Director of the Hamilton Funds of the Bank of New York (2006-2007) and of Arcadia Resources Inc. (health care services and products, 2007-2012). |
Robert W. Selander (62) |
| Year of Election or Appointment: 2011 Previously, Mr. Selander served as a Member of the Advisory Board of Fidelity's Equity and High Income Funds (2011), Executive Vice Chairman (2010), Chief Executive Officer (2009-2010), and President and Chief Executive Officer (1997-2009) of Mastercard, Inc. |
Cornelia M. Small (68) |
| Year of Election or Appointment: 2005 Ms. Small is a member of the Board of Directors (2009-present) and Chair of the Investment Committee (2010-present) of the Teagle Foundation. Ms. Small also serves on the Investment Committee of the Berkshire Taconic Community Foundation (2008-present). Previously, Ms. Small served as Chairperson (2002-2008) and a member of the Investment Committee and Chairperson (2008-2012) and a member of the Board of Trustees of Smith College. In addition, Ms. Small served as Chief Investment Officer, Director of Global Equity Investments, and a member of the Board of Directors of Scudder, Stevens & Clark and Scudder Kemper Investments. |
William S. Stavropoulos (73) |
| Year of Election or Appointment: 2002 Mr. Stavropoulos is Vice Chairman of the Independent Trustees of the Equity and High Income Funds (2006-present). Mr. Stavropoulos serves as President and Founder of the Michigan Baseball Foundation, the Great Lakes Loons (2007-present). Mr. Stavropoulos is Chairman Emeritus of the Board of Directors of The Dow Chemical Company, where he previously served in numerous senior management positions, including President, CEO (1995-2000; 2002-2004), Chairman of the Executive Committee (2000-2006), and as a member of the Board of Directors (1990-2006). Currently, Mr. Stavropoulos is a Director of Univar Inc. (global distributor of commodity and specialty chemicals, Chairman from 2010-May 2012 and Lead Director from May 2012-present), Teradata Corporation (data warehousing and technology solutions, 2008-present), Maersk Inc. (industrial conglomerate), and Tyco International, Ltd. (multinational manufacturing and services, 2007-present), and a member of the Advisory Board for Metalmark Capital LLC (private equity investment, 2005-present). Mr. Stavropoulos is an operating advisor to Clayton, Dubilier & Rice, LLC (private equity investment). In addition, Mr. Stavropoulos is a member of the University of Notre Dame Advisory Council for the College of Science, a Trustee of the Rollin L. Gerstacker Foundation, and a Director of the Naples Philharmonic Center for the Arts. Previously, Mr. Stavropoulos served as a Director of Chemical Financial Corporation (bank holding company, 1993-2012). |
David M. Thomas (63) |
| Year of Election or Appointment: 2008 Previously, Mr. Thomas served as Executive Chairman (2005-2006) and Chairman and Chief Executive Officer (2000-2005) of IMS Health, Inc. (pharmaceutical and healthcare information solutions), and a Director of Fortune Brands, Inc. (consumer products, 2000-2011). In addition, Mr. Thomas serves as Non-Executive Chairman of the Board of Directors of Fortune Brands Home and Security (home and security products, 2011-present), and as a member of the Board of Directors of Interpublic Group of Companies, Inc. (marketing communication, 2004-present). |
Michael E. Wiley (62) |
| Year of Election or Appointment: 2008 Mr. Wiley also serves as a Director of Asia Pacific Exploration Consolidated (international oil and gas exploration and production, 2008-present). Mr. Wiley serves as a Director of Tesoro Corporation (independent oil refiner and marketer, 2005-present), and a Director of Bill Barrett Corporation (exploration and production, 2005-present). In addition, Mr. Wiley also serves as a Director of Post Oak Bank (privately-held bank, 2004-present). Previously, Mr. Wiley served as a member of the Board of Trustees of the University of Tulsa (2000-2006; 2007-2010), as a Senior Energy Advisor of Katzenbach Partners, LLC (consulting, 2006-2007), as an Advisory Director of Riverstone Holdings (private investment), Chairman, President, and CEO of Baker Hughes, Inc. (oilfield services, 2000-2004), and as Director of Spinnaker Exploration Company (exploration and production, 2001-2005). |
+ The information above includes each Trustee's principal occupation during the last five years and other information relating to the experience, attributes, and skills relevant to each Trustee's qualifications to serve as a Trustee, which led to the conclusion that each Trustee should serve as a Trustee for the fund.
Advisory Board Members and Executive Officers:
Correspondence intended for David A. Rosow and Garnett A. Smith may be sent to Fidelity Investments, P.O. Box 55235, Boston, Massachusetts 02205-5235. Correspondence intended for each executive officer and Peter S. Lynch may be sent to Fidelity Investments, 245 Summer Street, Boston, Massachusetts 02210.
Name, Age; Principal Occupation |
Peter S. Lynch (69) |
| Year of Election or Appointment: 2003 Member of the Advisory Board of Fidelity's Equity and High Income Funds. Mr. Lynch is Vice Chairman and a Director of FMR and FMR Co., Inc. In addition, Mr. Lynch serves as a Trustee of Boston College and as the Chairman of the Inner-City Scholarship Fund. Previously, Mr. Lynch served on the Special Olympics International Board of Directors (1997-2006). |
David A. Rosow (70) |
| Year of Election or Appointment: 2012 Member of the Advisory Board of Fidelity's Equity and High Income Funds. Chairman and Chief Executive Officer of International Golf Group, Inc. (golf course development, 1989-present). Previously, Mr. Rosow served as Chairman and Chief Executive Officer of Rosow & Company, Inc. (private investment company, 1989-2011), a Lead Director of Hudson United Bancorp (2001-2006) and as a Director of TD Banknorth (1996-2006). In addition, Mr. Rosow is a member (2008-present) and President (2009-present) of the Town Council of Palm Beach, Florida. |
Garnett A. Smith (65) |
| Year of Election or Appointment: 2012 Member of the Advisory Board of Fidelity's Equity and High Income Funds. Prior to Mr. Smith's retirement, he served as Chairman and Chief Executive Officer of Inbrand Corp. (manufacturer of personal absorbent products, 1990-1997). He also served as President (1986-1990) of Inbrand Corp. Prior to his employment with Inbrand Corp., he was employed by a retail fabric chain and North Carolina National Bank. In addition, Mr. Smith is a board member of the Jackson Hole Land Trust (2009-present). |
Kenneth B. Robins (43) |
| Year of Election or Appointment: 2008 President and Treasurer of Fidelity's Equity and High Income Funds. Mr. Robins also serves as President and Treasurer (2010-present) and Assistant Treasurer (2009-present) of other Fidelity funds and is an employee of Fidelity Investments (2004-present). Previously, Mr. Robins served as Deputy Treasurer of the Fidelity funds (2005-2008) and Treasurer and Chief Financial Officer of The North Carolina Capital Management Trust: Cash and Term Portfolios (2006-2008). |
Brian B. Hogan (48) |
| Year of Election or Appointment: 2009 Vice President of Equity and High Income Funds. Mr. Hogan also serves as President of FMR's Equity Division (2009-present). Previously, Mr. Hogan served as Senior Vice President, Equity Research of FMR (2006-2009) and as a portfolio manager. |
Thomas C. Hense (49) |
| Year of Election or Appointment: 2008 or 2010 Vice President of Fidelity's High Income (2008), Small Cap (2008), and Value (2010) Funds. Previously, Mr. Hense served as a portfolio manager for Fidelity's Institutional Money Management Group (Pyramis) (2003-2008). |
Scott C. Goebel (45) |
| Year of Election or Appointment: 2008 Secretary and Chief Legal Officer (CLO) of the Fidelity funds. Mr. Goebel also serves as Secretary of Fidelity Investments Money Management, Inc. (FIMM) (2010-present) and Fidelity Research and Analysis Company (FRAC) (2010-present); Secretary and CLO of The North Carolina Capital Management Trust: Cash and Term Portfolios (2008-present); General Counsel, Secretary, and Senior Vice President of FMR (2008-present) and FMR Co., Inc. (2008-present); employed by FMR LLC or an affiliate (2001-present); Chief Legal Officer of Fidelity Management & Research (Hong Kong) Limited (2008-present) and Assistant Secretary of Fidelity Management & Research (Japan) Inc. (2008-present), and Fidelity Management & Research (U.K.) Inc. (2008-present). Previously, Mr. Goebel served as Assistant Secretary of FIMM (2008-2010), FRAC (2008-2010), and the Funds (2007-2008) and as Vice President and Secretary of Fidelity Distributors Corporation (FDC) (2005-2007). |
William C. Coffey (43) |
| Year of Election or Appointment: 2009 Assistant Secretary of Fidelity's Equity and High Income Funds. Mr. Coffey also serves as Senior Vice President and Deputy General Counsel of FMR LLC (2010-present), and is an employee of Fidelity Investments. Previously, Mr. Coffey served as Vice President and Associate General Counsel of FMR LLC (2005-2009). |
Elizabeth Paige Baumann (44) |
| Year of Election or Appointment: 2012 Anti-Money Laundering (AML) Officer of the Fidelity funds. Ms. Baumann also serves as AML Officer of The North Carolina Capital Management Trust: Cash and Term Portfolios (2012-present), Chief AML Officer of FMR LLC (2012-present), and is an employee of Fidelity Investments. Previously, Ms. Baumann served as Vice President and Deputy Anti-Money Laundering Officer (2007-2012). |
Christine Reynolds (54) |
| Year of Election or Appointment: 2008 Chief Financial Officer of the Fidelity funds. Ms. Reynolds became President of Fidelity Pricing and Cash Management Services (FPCMS) in August 2008. Ms. Reynolds served as Chief Operating Officer of FPCMS (2007-2008). Previously, Ms. Reynolds served as President, Treasurer, and Anti-Money Laundering officer of the Fidelity funds (2004-2007). |
Joseph A. Hanlon (44) |
| Year of Election or Appointment: 2012 Chief Compliance Officer of Fidelity's Equity and High Income Funds. Mr. Hanlon serves as Compliance Officer of FMR, FMR Co., Inc., Fidelity Investments Money Management, Inc. (FIMM), Fidelity Research and Analysis Company (FRAC), Fidelity Management & Research (Japan) Inc., Fidelity Management & Research (U.K.) Inc., Fidelity Management & Research (Hong Kong), and Strategic Advisers, Inc. (2009-present), as Senior Vice President of the Fidelity Asset Management Division (2009-present), and is an employee of Fidelity Investments. |
Joseph F. Zambello (55) |
| Year of Election or Appointment: 2011 Deputy Treasurer of the Fidelity funds. Mr. Zambello is an employee of Fidelity Investments. Previously, Mr. Zambello served as Vice President of FMR's Program Management Group (2009-2011) and Vice President of the Transfer Agent Oversight Group (2005-2009). |
Adrien E. Deberghes (45) |
| Year of Election or Appointment: 2008 Deputy Treasurer of Fidelity's Equity and High Income Funds. Mr. Deberghes also serves as Vice President (2011-present) and Assistant Treasurer (2010-present) of other Fidelity funds, and is an employee of Fidelity Investments (2008-present). Previously, Mr. Deberghes served as Senior Vice President of Mutual Fund Administration at State Street Corporation (2007-2008), Senior Director of Mutual Fund Administration at Investors Bank & Trust (2005-2007), and Director of Finance for Dunkin' Brands (2000-2005). |
Stephen Sadoski (41) |
| Year of Election or Appointment: 2012 Deputy Treasurer of Fidelity's Equity and High Income Funds. Mr. Sadoski also serves as Deputy Treasurer of other Fidelity funds (2013-present) and is an employee of Fidelity Investments (2012-present). Previously, Mr. Sadoski served as Assistant Treasurer of Fidelity's Fixed Income and Asset Allocation Funds (2012-2013), an assistant chief accountant in the Division of Investment Management of the Securities and Exchange Commission (SEC) (2009-2012) and as a senior manager at Deloitte & Touche (1997-2009). |
Stacie Smith (38) |
| Year of Election or Appointment: 2013 Deputy Treasurer of Fidelity's Equity and High Income Funds. Ms. Smith is an employee of Fidelity Investments (2009-present). Previously, Ms. Smith served as Senior Audit Manager of Ernst & Young LLP (1996-2009). |
Stephanie J. Dorsey (43) |
| Year of Election or Appointment: 2010 Assistant Treasurer of Fidelity's Equity and High Income Funds. Ms. Dorsey also serves as President and Treasurer (2013-present) and Assistant Treasurer (2012-present) of other Fidelity funds and is an employee of Fidelity Investments (2008-present). Previously, Ms. Dorsey served as Deputy Treasurer of Fidelity's Fixed Income and Asset Allocation Funds (2008-2013), Treasurer (2004-2008) of the JPMorgan Mutual Funds and Vice President (2004-2008) of JPMorgan Chase Bank. |
John R. Hebble (54) |
| Year of Election or Appointment: 2009 Assistant Treasurer of Fidelity's Equity and High Income Funds. Mr. Hebble also serves as President (2011-present), Treasurer, and Chief Financial Officer of The North Carolina Capital Management Trust: Cash and Term Portfolios (2008-present) and is an employee of Fidelity Investments. Previously, Mr. Hebble served as President and Treasurer of Fidelity's Fixed Income and Asset Allocation Funds (2008-2013). |
Gary W. Ryan (54) |
| Year of Election or Appointment: 2005 Assistant Treasurer of the Fidelity funds. Mr. Ryan is an employee of Fidelity Investments. Previously, Mr. Ryan served as Vice President of Fund Reporting in Fidelity Pricing and Cash Management Services (FPCMS) (1999-2005). |
Jonathan Davis (44) |
| Year of Election or Appointment: 2010 Assistant Treasurer of the Fidelity funds. Mr. Davis is also Assistant Treasurer of Fidelity Rutland Square Trust II and Fidelity Commonwealth Trust II. Mr. Davis is an employee of Fidelity Investments. Previously, Mr. Davis served as Vice President and Associate General Counsel of FMR LLC (2003-2010). |
Annual Report
Stock Selector Large Cap Value designates 100% of the dividends distributed during the fiscal year as qualifying for the dividends-received deduction for corporate shareholders.
Stock Selector Large Cap Value designates 100% of the dividends distributed during the fiscal year as amounts which may be taken into account as a dividend for purposes of the maximum rate under section 1(h)(11) of the Internal Revenue Code.
The fund will notify shareholders in January 2014 of amounts for use in preparing 2013 income tax returns.
Annual Report
Investment Adviser
Fidelity Management & Research Company
Boston, MA
Investment Sub-Advisers
FMR Co., Inc.
Fidelity Management & Research
(U.K.) Inc.
Fidelity Management & Research
(Hong Kong) Limited
Fidelity Management & Research
(Japan) Inc.
General Distributor
Fidelity Distributors Corporation
Smithfield, RI
Transfer and Service Agents
Fidelity Investments Institutional
Operations Company, Inc.
Boston, MA
Fidelity Service Company, Inc.
Boston, MA
Custodian
Citibank, N.A.
New York, NY
The Fidelity Telephone Connection
Mutual Fund 24-Hour Service
Exchanges/Redemptions
and Account Assistance 1-800-544-6666
Product Information 1-800-544-6666
Retirement Accounts 1-800-544-4774
(8 a.m. - 9 p.m.)
TDD Service 1-800-544-0118
for the deaf and hearing impaired
(9 a.m. - 9 p.m. Eastern time)
Fidelity Automated Service
Telephone (FAST®)
1-800-544-5555
Automated line for quickest service
(Fidelity Investment logo)(registered trademark)
Corporate Headquarters
245 Summer St., Boston, MA 02210
www.fidelity.com
LCV-UANN-0313
1.900193.103
Fidelity®
Series All-Sector Equity Fund
and
Fidelity
Series Large Cap Value Fund
Fidelity Series All-Sector Equity Fund
Fidelity Series Large Cap Value Fund
Class F
Annual Report
January 31, 2013
(Fidelity Cover Art)
Contents
Notes to Shareholders | (Click Here) | Important information about the fund. |
Shareholder Expense Example | (Click Here) | An example of shareholder expenses. |
Fidelity® Series All-Sector Equity Fund |
Performance | (Click Here) | How the fund has done over time. |
Management's Discussion of Fund Performance | (Click Here) | The Portfolio Manager's review of fund performance and strategy. |
Investment Changes | (Click Here) | A summary of major shifts in the fund's investment's over the past six months. |
Investments | (Click Here) | A complete list of the fund's investments with their market values. |
Financial Statements | (Click Here) | Statements of assets and liabilities, operations, and changes in net assets, as well as financial highlights. |
Fidelity Series Large Cap Value Fund |
Performance | (Click Here) | How the fund has done over time. |
Management's Discussion of Fund Performance | (Click Here) | The Portfolio Manager's review of fund performance and strategy. |
Investment Changes | (Click Here) | A summary of major shifts in the fund's investment's over the past six months. |
Investments | (Click Here) | A complete list of the fund's investments with their market values. |
Financial Statements | (Click Here) | Statements of assets and liabilities, operations, and changes in net assets, as well as financial highlights. |
Notes | (Click Here) | Notes to the Financial Statements. |
Report of Independent Registered Public Accounting Firm | (Click Here) | |
Trustees and Officers | (Click Here) | |
Distributions | (Click Here) | |
Annual Report
To view a fund's proxy voting guidelines and proxy voting record for the 12-month period ended June 30, visit http://www.fidelity.com/proxyvotingresults or visit the Securities and Exchange Commission's (SEC) web site at http://www.sec.gov. You may also call 1-800-544-8544 for Fidelity Series All-Sector Equity Fund and Fidelity Series Large Cap Value Fund or 1-800-835-5092 for Class F of each fund to request a free copy of the proxy voting guidelines.
Standard & Poor's, S&P and S&P 500 are registered service marks of The McGraw-Hill Companies, Inc. and have been licensed for use by Fidelity Distributors Corporation.
Other third-party marks appearing herein are the property of their respective owners.
All other marks appearing herein are registered or unregistered trademarks or service marks of FMR LLC or an affiliated company. © 2013 FMR LLC. All rights reserved.
This report and the financial statements contained herein are submitted for the general information of the shareholders of the funds. This report is not authorized for distribution to prospective investors in the funds unless preceded or accompanied by an effective prospectus.
A fund files its complete schedule of portfolio holdings with the SEC for the first and third quarters of each fiscal year on Form N-Q. Forms N-Q are available on the SEC's web site at http://www.sec.gov. A fund's Forms N-Q may be reviewed and copied at the SEC's Public Reference Room in Washington, DC. Information regarding the operation of the SEC's Public Reference Room may be obtained by calling 1-800-SEC-0330. For a complete list of a fund's portfolio holdings, view the most recent holdings listing, semiannual report, or annual report on Fidelity's web site at http://www.fidelity.com, http://www.advisor.fidelity.com, or http://www.401k.com, as applicable.
NOT FDIC INSURED • MAY LOSE VALUE • NO BANK GUARANTEE
Neither the funds nor Fidelity Distributors Corporation is a bank.
Annual Report
The following applies to Fidelity® Series All-Sector Equity Fund.
The following changes were effective as of October 1, 2012:
• Monty Kori was named Co-Portfolio Manager, replacing John Avery in managing the fund's industrials sector investments.
• Brian Lempel was named Co-Portfolio Manager, replacing Adam Hetnarski in managing the fund's information technology sector investments.
Annual Report
Shareholder Expense Example
As a shareholder of a Fund, you incur two types of costs: (1) transaction costs, and (2) ongoing costs, including management fees and other Fund expenses. This Example is intended to help you understand your ongoing costs (in dollars) of investing in the Funds and to compare these costs with the ongoing costs of investing in other mutual funds.
The Example is based on an investment of $1,000 invested at the beginning of the period and held for the entire period (August 1, 2012 to January 31, 2013).
Actual Expenses
The first line of the accompanying table for each class of each fund provides information about actual account values and actual expenses. You may use the information in this line, together with the amount you invested, to estimate the expenses that you paid over the period. Simply divide your account value by $1,000.00 (for example, an $8,600 account value divided by $1,000.00 = 8.6), then multiply the result by the number in the first line for a class of the fund under the heading entitled "Expenses Paid During Period" to estimate the expenses you paid on your account during this period. In addition, each Fund, as a shareholder in the underlying Fidelity Central Funds, will indirectly bear its pro-rata share of the fees and expenses incurred by the underlying Fidelity Central Funds. These fees and expenses are not included in the Fund's annualized expense ratio used to calculate the expense estimate in the table below.
Hypothetical Example for Comparison Purposes
The second line of the accompanying table for each class of each fund provides information about hypothetical account values and hypothetical expenses based on a Class' actual expense ratio and an assumed rate of return of 5% per year before expenses, which is not the Class' actual return. The hypothetical account values and expenses may not be used to estimate the actual ending account balance or expenses you paid for the period. You may use this information to compare the ongoing costs of investing in the Fund and other funds. To do so, compare this 5% hypothetical example with the 5% hypothetical examples that appear in the shareholder reports of the other funds. In addition, each Fund, as a shareholder in the underlying Fidelity Central Funds, will indirectly bear its pro-rata share of the fees and expenses incurred by the underlying Fidelity Central Funds. These fees and expenses are not included in the Fund's annualized expense ratio used to calculate the expense estimate in the table below.
Please note that the expenses shown in the table are meant to highlight your ongoing costs only and do not reflect any transaction costs. Therefore, the second line of the table is useful in comparing ongoing costs only, and will not help you determine the relative total costs of owning different funds.
Annual Report
Shareholder Expense Example - continued
| Annualized
Expense Ratio | Beginning
Account Value
August 1, 2012 | Ending
Account Value
January 31, 2013 | Expenses Paid
During Period*
August 1, 2012 to
January 31, 2013 |
Fidelity Series Large Cap Value Fund | | | | |
Series Large Cap Value | .58% | | | |
Actual | | $ 1,000.00 | $ 1,126.30 | $ 3.10 |
HypotheticalA | | $ 1,000.00 | $ 1,022.22 | $ 2.95 |
Class F | .39% | | | |
Actual | | $ 1,000.00 | $ 1,126.70 | $ 2.08 |
HypotheticalA | | $ 1,000.00 | $ 1,023.18 | $ 1.98 |
Fidelity Series All-Sector Equity Fund | | | | |
Series All-Sector Equity | .70% | | | |
Actual | | $ 1,000.00 | $ 1,102.60 | $ 3.70 |
HypotheticalA | | $ 1,000.00 | $ 1,021.62 | $ 3.56 |
Class F | .51% | | | |
Actual | | $ 1,000.00 | $ 1,103.80 | $ 2.70 |
HypotheticalA | | $ 1,000.00 | $ 1,022.57 | $ 2.59 |
A 5% return per year before expenses
* Expenses are equal to each Class' annualized expense ratio, multiplied by the average account value over the period, multiplied by 184/ 366 (to reflect the one-half year period).
Annual Report
Fidelity Series All-Sector Equity Fund
Average annual total return reflects the change in the value of an investment, assuming reinvestment of the class' distributions from dividend income and capital gains (the profits earned upon the sale of securities that have grown in value, if any) and assuming a constant rate of performance each year. The $10,000 table and the fund's returns do not reflect the deduction of taxes that a shareholder would pay on fund distributions or the redemption of fund shares. During periods of reimbursement by Fidelity, a fund's total return will be greater than it would be had the reimbursement not occurred. How a fund did yesterday is no guarantee of how it will do tomorrow.
Average Annual Total Returns
Periods ended January 31, 2013 | Past 1
year | Life of
fund A |
Fidelity Series All-Sector Equity Fund | 16.32% | 13.31% |
Class F B | 16.54% | 13.50% |
A From October 17, 2008.
B The initial offering of Class F shares took place on June 26, 2009. Returns prior to June 26, 2009, are those of Fidelity Series All-Sector Equity Fund, the original class of the fund.
$10,000 Over Life of Fund
Let's say hypothetically that $10,000 was invested in Fidelity Series All-Sector Equity Fund, a class of the fund, on October 17, 2008, when the fund started. The chart shows how the value of your investment would have changed, and also shows how the S&P 500® Index performed over the same period.
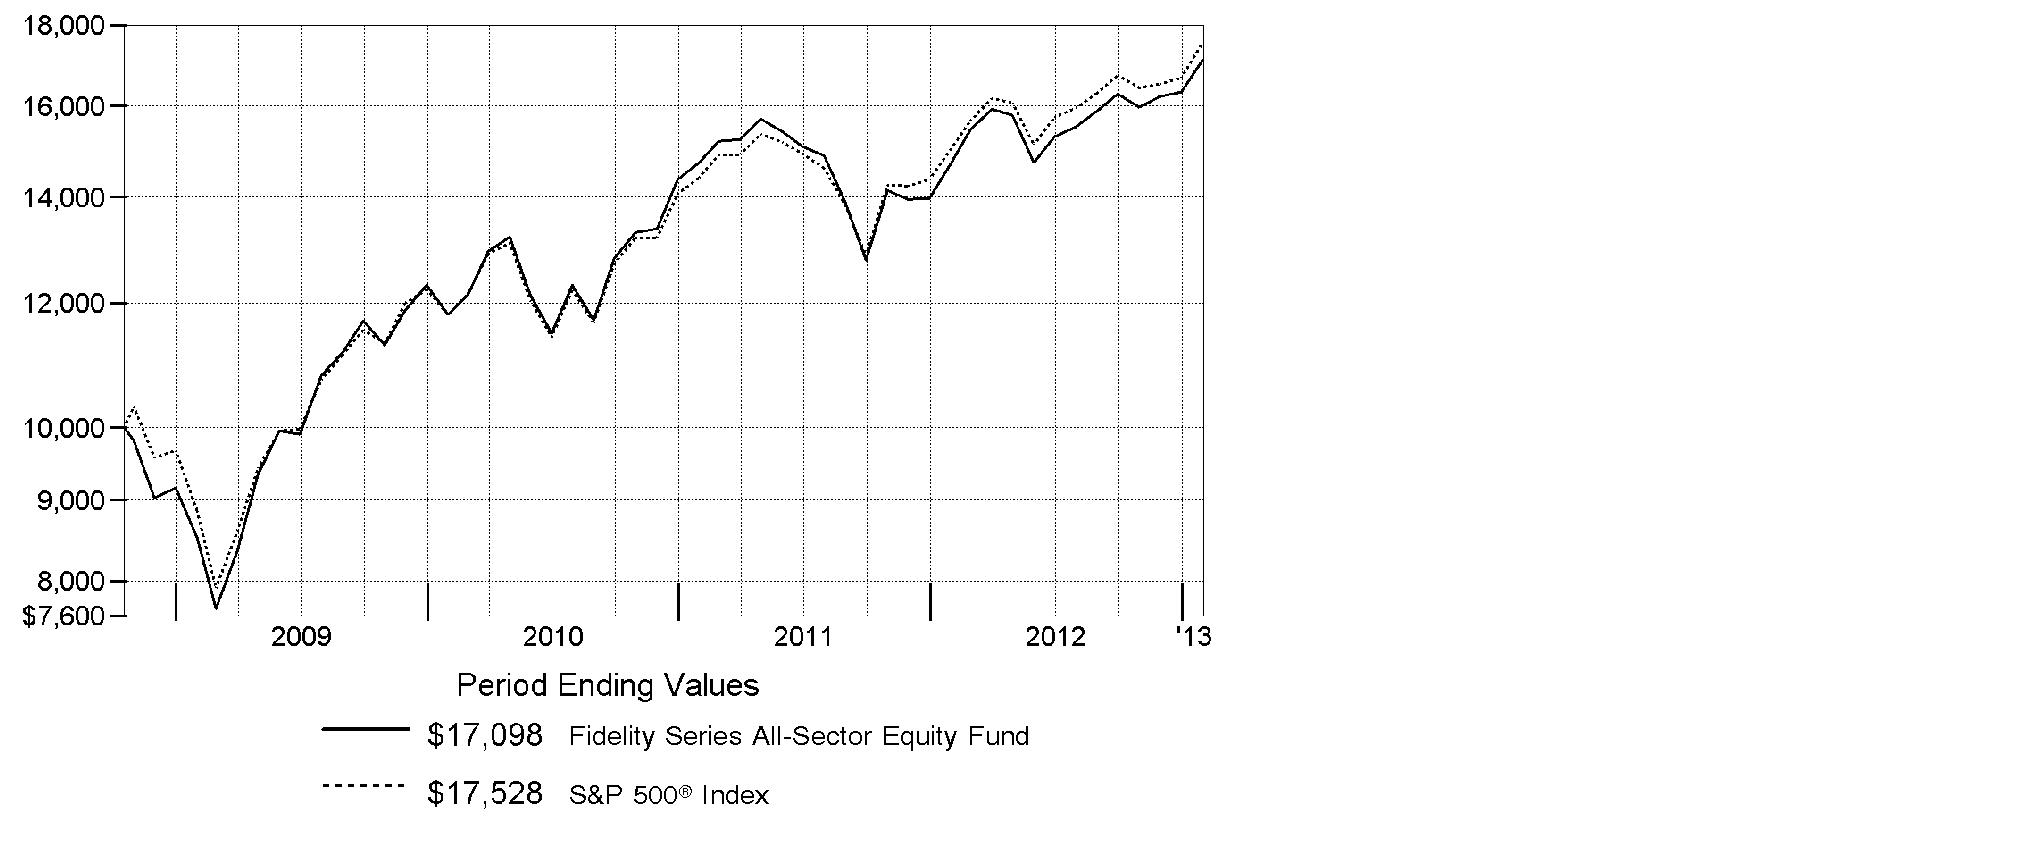
Annual Report
Fidelity Series All-Sector Equity Fund
Market Recap: Improvement in the U.S. economy helped lift equity benchmarks to double-digit gains for the year ending January 31, 2013, overcoming moments of volatility driven by sovereign debt woes in Europe, slower economic growth in China and gridlock in Congress. Major U.S. benchmarks hit multiyear highs during the period, encouraged by a rebounding domestic housing market and solid corporate earnings reports. The broad-based S&P 500® Index rose 16.78% for the year, crossing the milestone 1,500 mark near period end. The technology-heavy Nasdaq Composite Index® added 13.13%, and the blue-chip-laden Dow Jones Industrial AverageSM gained 12.75%. Early in the period, stocks rose on positive U.S. economic news and proposed bailouts in Europe. Although fear resurfaced in April and May, equities rebounded in June on central bank stimulus and new life in the housing market. In September, pre-election jitters and the looming "fiscal cliff" of tax hikes and federal spending cuts fueled some profit-taking, followed by a brief post-election sell-off. But stocks proved resilient, as investors continued to pile into riskier assets. Gains were broad-based, with eight of the 10 sectors in the S&P 500® posting double-digit returns. Despite eurozone turmoil, foreign developed-markets stocks rose strongly, with the MSCI® EAFE® Index adding 17.41%.
Comments from Co-Portfolio Manager Robert Stansky, Head of FMR's Stock Selector Large Cap Group, which manages Fidelity® Series All-Sector Equity Fund: For the year, the fund's Series All-Sector Equity and Class F shares gained 16.32% and 16.54%, respectively, trailing the S&P 500®. Versus the index, results were hurt by picks in energy, a modest cash position and an overweighting in the weak semiconductor group. Conversely, our picks in information technology helped. The biggest relative detractor was untimely positioning in QUALCOMM, a maker of semiconductors for mobile phones that saw its stock slump from April through mid-July because a supplier had production issues. We exited the position in October. We also lost ground by avoiding strong-performing home-improvement retailer and index member Home Depot, while a stake in insurance provider MetLife also detracted. Conversely, a sizable overweighting in Apple was the top individual contributor, as its iPad® tablet and iPhone® smartphone continued to define their respective categories, helping the stock maintain its run of strong performance, despite slipping since late September. Also in tech, it was a good call to not own chipmaker and index component Intel and largely avoid computer and peripherals firm Hewlett-Packard.
The views expressed above reflect those of the portfolio manager(s) only through the end of the period as stated on the cover of this report and do not necessarily represent the views of Fidelity or any other person in the Fidelity organization. Any such views are subject to change at any time based upon market or other conditions and Fidelity disclaims any responsibility to update such views. These views may not be relied on as investment advice and, because investment decisions for a Fidelity fund are based on numerous factors, may not be relied on as an indication of trading intent on behalf of any Fidelity fund.
Annual Report
Fidelity Series All-Sector Equity Fund
Investment Changes (Unaudited)
Top Ten Stocks as of January 31, 2013 |
| % of fund's
net assets | % of fund's net assets
6 months ago |
Apple, Inc. | 2.6 | 6.4 |
Exxon Mobil Corp. | 2.3 | 2.1 |
Pfizer, Inc. | 1.9 | 1.9 |
JPMorgan Chase & Co. | 1.8 | 0.9 |
Philip Morris International, Inc. | 1.7 | 0.4 |
Capital One Financial Corp. | 1.7 | 1.8 |
Google, Inc. Class A | 1.7 | 0.6 |
The Coca-Cola Co. | 1.7 | 1.9 |
U.S. Bancorp | 1.6 | 1.9 |
Comcast Corp. Class A | 1.5 | 1.7 |
| 18.5 | |
Top Five Market Sectors as of January 31, 2013 |
| % of fund's
net assets | % of fund's net assets
6 months ago |
Information Technology | 17.4 | 20.3 |
Financials | 15.5 | 14.4 |
Consumer Discretionary | 11.9 | 9.8 |
Health Care | 11.9 | 11.6 |
Industrials | 10.8 | 10.1 |
Asset Allocation (% of fund's net assets) |
As of January 31, 2013* | As of July 31, 2012** |
| Stocks and
Equity Futures 98.7% | | | Stocks and
Equity Futures 98.4% | |
| Short-Term
Investments and
Net Other Assets
(Liabilities) 1.3% | | | Short-Term
Investments and
Net Other Assets
(Liabilities) 1.6% | |
* Foreign investments | 4.5% | | ** Foreign investments | 10.4% | |

Annual Report
Fidelity Series All-Sector Equity Fund
Investments January 31, 2013
Showing Percentage of Net Assets
Common Stocks - 97.3% |
| Shares | | Value |
CONSUMER DISCRETIONARY - 11.9% |
Hotels, Restaurants & Leisure - 1.3% |
Dunkin' Brands Group, Inc. | 463,500 | | $ 16,922,385 |
Icahn Enterprises LP rights | 270,377 | | 3 |
Starbucks Corp. | 1,223,556 | | 68,665,963 |
Yum! Brands, Inc. | 653,007 | | 42,406,275 |
| | 127,994,626 |
Internet & Catalog Retail - 1.8% |
Liberty Media Corp. Interactive Series A (a) | 4,374,125 | | 92,993,898 |
priceline.com, Inc. (a) | 122,516 | | 83,981,043 |
| | 176,974,941 |
Media - 4.7% |
Comcast Corp. Class A | 3,855,721 | | 146,825,856 |
DIRECTV (a) | 1,714,506 | | 87,679,837 |
Legend Pictures LLC (a)(f)(g) | 3,706 | | 6,867,885 |
Liberty Global, Inc. Class A (a) | 165,600 | | 11,308,824 |
News Corp. Class A | 4,402,553 | | 122,126,820 |
Sirius XM Radio, Inc. (d) | 15,037,854 | | 47,218,862 |
The Walt Disney Co. | 680,450 | | 36,662,646 |
| | 458,690,730 |
Multiline Retail - 0.6% |
Dollar General Corp. (a) | 1,210,106 | | 55,931,099 |
Specialty Retail - 2.6% |
CarMax, Inc. (a) | 614,364 | | 24,218,229 |
Limited Brands, Inc. | 655,707 | | 31,487,050 |
Lowe's Companies, Inc. | 2,925,330 | | 111,718,353 |
Tiffany & Co., Inc. | 602,147 | | 39,591,165 |
TJX Companies, Inc. | 1,145,090 | | 51,735,166 |
| | 258,749,963 |
Textiles, Apparel & Luxury Goods - 0.9% |
PVH Corp. | 402,276 | | 47,818,548 |
Under Armour, Inc. Class A (sub. vtg.) (a) | 808,313 | | 41,118,882 |
| | 88,937,430 |
TOTAL CONSUMER DISCRETIONARY | | 1,167,278,789 |
CONSUMER STAPLES - 9.6% |
Beverages - 2.8% |
Brown-Forman Corp. Class B (non-vtg.) | 520,650 | | 33,686,055 |
Constellation Brands, Inc. Class A (sub. vtg.) (a) | 655,504 | | 21,212,109 |
Common Stocks - continued |
| Shares | | Value |
CONSUMER STAPLES - continued |
Beverages - continued |
Molson Coors Brewing Co. Class B | 784,424 | | $ 35,440,276 |
Monster Beverage Corp. (a) | 323,300 | | 15,486,070 |
The Coca-Cola Co. | 4,377,892 | | 163,032,698 |
| | 268,857,208 |
Food & Staples Retailing - 2.0% |
CVS Caremark Corp. | 1,811,981 | | 92,773,427 |
Kroger Co. | 2,368,500 | | 65,607,450 |
Safeway, Inc. | 204,528 | | 3,937,164 |
Walgreen Co. | 834,382 | | 33,341,905 |
| | 195,659,946 |
Food Products - 0.9% |
Bunge Ltd. | 275,752 | | 21,966,404 |
Green Mountain Coffee Roasters, Inc. (a) | 200,680 | | 9,136,960 |
Mead Johnson Nutrition Co. Class A | 784,600 | | 59,629,600 |
| | 90,732,964 |
Household Products - 0.9% |
Colgate-Palmolive Co. | 861,242 | | 92,471,554 |
Personal Products - 0.4% |
Estee Lauder Companies, Inc. Class A | 524,656 | | 31,967,290 |
Nu Skin Enterprises, Inc. Class A (d) | 112,478 | | 4,764,568 |
| | 36,731,858 |
Tobacco - 2.6% |
Altria Group, Inc. | 2,567,730 | | 86,481,146 |
Philip Morris International, Inc. | 1,952,798 | | 172,158,672 |
| | 258,639,818 |
TOTAL CONSUMER STAPLES | | 943,093,348 |
ENERGY - 10.5% |
Energy Equipment & Services - 2.3% |
Atwood Oceanics, Inc. (a) | 358,000 | | 18,891,660 |
Cameron International Corp. (a) | 598,382 | | 37,883,564 |
Halliburton Co. | 414,340 | | 16,855,351 |
National Oilwell Varco, Inc. | 560,374 | | 41,546,128 |
Oceaneering International, Inc. | 360,318 | | 22,775,701 |
Oil States International, Inc. (a) | 164,800 | | 12,785,184 |
Rowan Companies PLC (a) | 826,409 | | 28,494,582 |
Common Stocks - continued |
| Shares | | Value |
ENERGY - continued |
Energy Equipment & Services - continued |
Schlumberger Ltd. | 438,781 | | $ 34,246,857 |
Unit Corp. (a) | 244,055 | | 11,746,367 |
| | 225,225,394 |
Oil, Gas & Consumable Fuels - 8.2% |
Anadarko Petroleum Corp. | 702,581 | | 56,220,532 |
Apache Corp. | 307,091 | | 25,721,942 |
Cabot Oil & Gas Corp. | 442,400 | | 23,349,872 |
Chevron Corp. | 1,052,929 | | 121,244,774 |
Cimarex Energy Co. | 259,100 | | 16,546,126 |
Cobalt International Energy, Inc. (a) | 280,000 | | 6,778,800 |
Concho Resources, Inc. (a) | 243,831 | | 22,242,264 |
ConocoPhillips | 374,100 | | 21,697,800 |
EQT Corp. | 234,400 | | 13,925,704 |
Exxon Mobil Corp. | 2,487,420 | | 223,793,177 |
Hess Corp. | 475,221 | | 31,915,842 |
Marathon Oil Corp. | 1,231,789 | | 41,400,428 |
Marathon Petroleum Corp. | 497,815 | | 36,942,851 |
Murphy Oil Corp. | 339,395 | | 20,200,790 |
Noble Energy, Inc. | 341,912 | | 36,854,694 |
Occidental Petroleum Corp. | 396,355 | | 34,986,256 |
Phillips 66 | 496,900 | | 30,097,233 |
SM Energy Co. | 138,600 | | 8,060,976 |
The Williams Companies, Inc. | 843,800 | | 29,575,190 |
| | 801,555,251 |
TOTAL ENERGY | | 1,026,780,645 |
FINANCIALS - 15.5% |
Capital Markets - 2.0% |
Ameriprise Financial, Inc. | 565,400 | | 37,497,328 |
BlackRock, Inc. Class A | 290,018 | | 68,525,453 |
E*TRADE Financial Corp. (a) | 635,952 | | 6,747,451 |
Invesco Ltd. | 374,935 | | 10,216,979 |
Morgan Stanley | 827,112 | | 18,899,509 |
State Street Corp. | 416,300 | | 23,167,095 |
TD Ameritrade Holding Corp. | 1,331,800 | | 25,823,602 |
| | 190,877,417 |
Commercial Banks - 3.3% |
CIT Group, Inc. (a) | 406,933 | | 17,233,613 |
Common Stocks - continued |
| Shares | | Value |
FINANCIALS - continued |
Commercial Banks - continued |
Comerica, Inc. | 229,661 | | $ 7,891,152 |
First Horizon National Corp. | 974,300 | | 9,947,603 |
Huntington Bancshares, Inc. | 1,514,957 | | 10,544,101 |
M&T Bank Corp. | 218,839 | | 22,472,577 |
Synovus Financial Corp. | 3,783,560 | | 9,761,585 |
U.S. Bancorp | 4,617,178 | | 152,828,592 |
Wells Fargo & Co. | 2,656,692 | | 92,532,582 |
| | 323,211,805 |
Consumer Finance - 2.6% |
Capital One Financial Corp. | 2,964,280 | | 166,948,250 |
Discover Financial Services | 970,932 | | 37,274,079 |
SLM Corp. | 3,263,246 | | 55,116,225 |
| | 259,338,554 |
Diversified Financial Services - 4.4% |
Bank of America Corp. | 10,420,387 | | 117,958,781 |
Citigroup, Inc. | 3,128,384 | | 131,892,669 |
JPMorgan Chase & Co. | 3,826,934 | | 180,057,245 |
| | 429,908,695 |
Insurance - 2.7% |
ACE Ltd. | 457,131 | | 39,006,988 |
AFLAC, Inc. | 393,600 | | 20,884,416 |
Berkshire Hathaway, Inc.: | | | |
Class A (a) | 165 | | 24,069,375 |
Class B (a) | 414,403 | | 40,168,083 |
Hartford Financial Services Group, Inc. | 1,417,642 | | 35,157,522 |
MetLife, Inc. | 1,117,541 | | 41,728,981 |
The Travelers Companies, Inc. | 473,073 | | 37,117,308 |
Validus Holdings Ltd. | 634,761 | | 23,111,648 |
| | 261,244,321 |
Real Estate Investment Trusts - 0.5% |
Camden Property Trust (SBI) | 175,942 | | 12,208,615 |
Equity Lifestyle Properties, Inc. | 207,300 | | 14,842,680 |
The Macerich Co. | 320,018 | | 19,111,475 |
| | 46,162,770 |
TOTAL FINANCIALS | | 1,510,743,562 |
Common Stocks - continued |
| Shares | | Value |
HEALTH CARE - 11.9% |
Biotechnology - 3.0% |
Amgen, Inc. | 989,465 | | $ 84,559,679 |
Biogen Idec, Inc. (a) | 320,986 | | 50,099,495 |
BioMarin Pharmaceutical, Inc. (a) | 410,878 | | 22,553,093 |
Gilead Sciences, Inc. (a) | 2,138,892 | | 84,379,289 |
Medivation, Inc. (a) | 14,400 | | 782,784 |
Onyx Pharmaceuticals, Inc. (a) | 375,900 | | 29,139,768 |
Regeneron Pharmaceuticals, Inc. (a) | 130,400 | | 22,681,776 |
| | 294,195,884 |
Health Care Equipment & Supplies - 1.9% |
Covidien PLC | 1,040,851 | | 64,886,651 |
Edwards Lifesciences Corp. (a) | 328,448 | | 29,537,329 |
Stryker Corp. | 573,200 | | 35,910,980 |
The Cooper Companies, Inc. | 507,715 | | 51,456,915 |
| | 181,791,875 |
Health Care Providers & Services - 2.1% |
Catamaran Corp. (a) | 427,558 | | 22,185,986 |
CIGNA Corp. | 715,034 | | 41,715,084 |
HCA Holdings, Inc. | 5,700 | | 214,605 |
Henry Schein, Inc. (a) | 487,887 | | 42,124,164 |
McKesson Corp. | 359,654 | | 37,846,390 |
MEDNAX, Inc. (a) | 244,200 | | 20,893,752 |
Quest Diagnostics, Inc. | 419,600 | | 24,315,820 |
UnitedHealth Group, Inc. | 205,651 | | 11,353,992 |
| | 200,649,793 |
Health Care Technology - 0.3% |
Cerner Corp. (a) | 379,900 | | 31,360,745 |
Life Sciences Tools & Services - 0.4% |
Agilent Technologies, Inc. | 595,000 | | 26,644,100 |
Thermo Fisher Scientific, Inc. | 229,300 | | 16,541,702 |
| | 43,185,802 |
Pharmaceuticals - 4.2% |
AbbVie, Inc. | 1,776,600 | | 65,183,454 |
Allergan, Inc. | 554,613 | | 58,239,911 |
Endo Pharmaceuticals Holdings, Inc. (a) | 679,000 | | 21,497,140 |
Merck & Co., Inc. | 1,877,746 | | 81,212,515 |
Common Stocks - continued |
| Shares | | Value |
HEALTH CARE - continued |
Pharmaceuticals - continued |
Pfizer, Inc. | 6,800,683 | | $ 185,522,632 |
Zoetis, Inc. Class A | 83,700 | | 2,176,200 |
| | 413,831,852 |
TOTAL HEALTH CARE | | 1,165,015,951 |
INDUSTRIALS - 10.8% |
Aerospace & Defense - 2.4% |
BE Aerospace, Inc. (a) | 441,766 | | 22,746,531 |
Honeywell International, Inc. | 1,148,405 | | 78,367,157 |
Precision Castparts Corp. | 328,790 | | 60,300,086 |
Textron, Inc. | 1,293,927 | | 37,213,341 |
TransDigm Group, Inc. | 288,500 | | 39,074,440 |
| | 237,701,555 |
Building Products - 0.4% |
Armstrong World Industries, Inc. | 672,297 | | 36,969,612 |
Commercial Services & Supplies - 0.3% |
Republic Services, Inc. | 1,021,000 | | 32,559,690 |
Electrical Equipment - 2.7% |
AMETEK, Inc. | 1,574,400 | | 64,534,656 |
Hubbell, Inc. Class B | 661,300 | | 60,211,365 |
Regal-Beloit Corp. | 478,388 | | 35,477,254 |
Rockwell Automation, Inc. | 471,200 | | 42,026,328 |
Roper Industries, Inc. | 490,922 | | 57,658,789 |
| | 259,908,392 |
Industrial Conglomerates - 1.4% |
3M Co. | 698,100 | | 70,193,955 |
Danaher Corp. | 1,164,796 | | 69,806,224 |
| | 140,000,179 |
Machinery - 2.0% |
Cummins, Inc. | 542,082 | | 62,247,276 |
Illinois Tool Works, Inc. | 792,935 | | 49,820,106 |
Ingersoll-Rand PLC | 1,041,600 | | 53,527,824 |
WABCO Holdings, Inc. (a) | 475,100 | | 29,769,766 |
| | 195,364,972 |
Professional Services - 0.4% |
IHS, Inc. Class A (a) | 369,000 | | 37,970,100 |
Common Stocks - continued |
| Shares | | Value |
INDUSTRIALS - continued |
Road & Rail - 0.5% |
J.B. Hunt Transport Services, Inc. | 714,050 | | $ 48,034,144 |
Trading Companies & Distributors - 0.7% |
MSC Industrial Direct Co., Inc. Class A | 162,689 | | 12,871,954 |
W.W. Grainger, Inc. | 261,843 | | 57,034,642 |
| | 69,906,596 |
TOTAL INDUSTRIALS | | 1,058,415,240 |
INFORMATION TECHNOLOGY - 17.4% |
Communications Equipment - 0.4% |
Juniper Networks, Inc. (a) | 1,664,881 | | 37,260,037 |
Polycom, Inc. (a) | 133,791 | | 1,475,715 |
| | 38,735,752 |
Computers & Peripherals - 3.0% |
Apple, Inc. | 561,206 | | 255,522,703 |
Dell, Inc. | 1,348,700 | | 17,856,788 |
NCR Corp. (a) | 618,000 | | 17,161,860 |
| | 290,541,351 |
Electronic Equipment & Components - 0.7% |
Arrow Electronics, Inc. (a) | 346,000 | | 13,293,320 |
Jabil Circuit, Inc. | 2,568,965 | | 48,579,128 |
Molex, Inc. | 63,200 | | 1,716,512 |
| | 63,588,960 |
Internet Software & Services - 2.6% |
eBay, Inc. (a) | 1,598,800 | | 89,420,884 |
Google, Inc. Class A (a) | 217,900 | | 164,664,851 |
| | 254,085,735 |
IT Services - 3.4% |
Amdocs Ltd. | 1,181,157 | | 42,155,493 |
Cognizant Technology Solutions Corp. Class A (a) | 413,000 | | 32,288,340 |
Fidelity National Information Services, Inc. | 1,512,800 | | 56,140,008 |
Fiserv, Inc. (a) | 472,100 | | 37,914,351 |
Genpact Ltd. | 750,000 | | 12,562,500 |
Global Payments, Inc. | 740,400 | | 36,472,104 |
Total System Services, Inc. | 250,000 | | 5,812,500 |
Visa, Inc. Class A | 677,700 | | 107,015,607 |
| | 330,360,903 |
Common Stocks - continued |
| Shares | | Value |
INFORMATION TECHNOLOGY - continued |
Semiconductors & Semiconductor Equipment - 3.0% |
Altera Corp. | 1,173,900 | | $ 39,231,738 |
Analog Devices, Inc. | 1,343,882 | | 58,647,010 |
Avago Technologies Ltd. | 780,675 | | 27,924,745 |
Broadcom Corp. Class A | 3,231,600 | | 104,865,420 |
Freescale Semiconductor Holdings I Ltd. (a)(d) | 1,164,600 | | 16,828,470 |
Micron Technology, Inc. (a) | 1,800,000 | | 13,608,000 |
NVIDIA Corp. | 400,000 | | 4,904,000 |
Skyworks Solutions, Inc. (a) | 1,350,731 | | 32,336,500 |
| | 298,345,883 |
Software - 4.3% |
Activision Blizzard, Inc. | 1,863,300 | | 21,222,987 |
Autodesk, Inc. (a) | 550,000 | | 21,384,000 |
Compuware Corp. (a) | 3,091,000 | | 35,917,420 |
Concur Technologies, Inc. (a) | 193,800 | | 12,965,220 |
Electronic Arts, Inc. (a) | 4,594,600 | | 72,273,058 |
Nuance Communications, Inc. (a) | 1,650,200 | | 39,687,310 |
Oracle Corp. | 3,011,600 | | 106,941,916 |
salesforce.com, Inc. (a) | 208,526 | | 35,893,580 |
Symantec Corp. (a) | 890,500 | | 19,386,185 |
Synopsys, Inc. (a) | 643,900 | | 21,532,016 |
VMware, Inc. Class A (a) | 462,900 | | 35,402,592 |
| | 422,606,284 |
TOTAL INFORMATION TECHNOLOGY | | 1,698,264,868 |
MATERIALS - 3.8% |
Chemicals - 2.9% |
Air Products & Chemicals, Inc. | 229,730 | | 20,085,294 |
Albemarle Corp. | 313,305 | | 19,208,730 |
Ashland, Inc. | 225,500 | | 17,704,005 |
Eastman Chemical Co. | 444,903 | | 31,654,848 |
Ecolab, Inc. | 375,195 | | 27,164,118 |
FMC Corp. | 432,100 | | 26,561,187 |
LyondellBasell Industries NV Class A | 638,704 | | 40,506,608 |
Monsanto Co. | 524,000 | | 53,107,400 |
Sherwin-Williams Co. | 155,377 | | 25,192,827 |
Sigma Aldrich Corp. | 310,800 | | 24,034,164 |
| | 285,219,181 |
Common Stocks - continued |
| Shares | | Value |
MATERIALS - continued |
Construction Materials - 0.2% |
Vulcan Materials Co. | 337,400 | | $ 19,083,344 |
Containers & Packaging - 0.5% |
Ball Corp. | 431,477 | | 19,209,356 |
Rock-Tenn Co. Class A | 409,230 | | 32,308,709 |
| | 51,518,065 |
Metals & Mining - 0.2% |
Allied Nevada Gold Corp. (a) | 295,600 | | 7,002,764 |
Royal Gold, Inc. | 140,800 | | 10,513,536 |
| | 17,516,300 |
TOTAL MATERIALS | | 373,336,890 |
TELECOMMUNICATION SERVICES - 2.6% |
Diversified Telecommunication Services - 1.7% |
CenturyLink, Inc. | 1,083,016 | | 43,807,997 |
Level 3 Communications, Inc. (a) | 655,500 | | 15,614,010 |
Verizon Communications, Inc. | 2,538,893 | | 110,721,124 |
| | 170,143,131 |
Wireless Telecommunication Services - 0.9% |
Crown Castle International Corp. (a) | 352,312 | | 24,845,042 |
SBA Communications Corp. Class A (a) | 639,900 | | 44,575,434 |
Sprint Nextel Corp. (a) | 2,536,227 | | 14,278,958 |
| | 83,699,434 |
TOTAL TELECOMMUNICATION SERVICES | | 253,842,565 |
UTILITIES - 3.3% |
Electric Utilities - 1.9% |
American Electric Power Co., Inc. | 786,547 | | 35,622,714 |
Duke Energy Corp. | 920,131 | | 63,249,805 |
Edison International | 915,273 | | 44,107,006 |
FirstEnergy Corp. | 302,322 | | 12,241,018 |
NextEra Energy, Inc. | 392,096 | | 28,250,517 |
| | 183,471,060 |
Gas Utilities - 0.1% |
ONEOK, Inc. | 155,082 | | 7,290,405 |
Common Stocks - continued |
| Shares | | Value |
UTILITIES - continued |
Independent Power Producers & Energy Traders - 0.4% |
NRG Energy, Inc. | 914,918 | | $ 21,958,032 |
The AES Corp. | 1,921,864 | | 20,833,006 |
| | 42,791,038 |
Multi-Utilities - 0.9% |
CenterPoint Energy, Inc. | 900,356 | | 18,403,277 |
NiSource, Inc. | 476,136 | | 12,869,956 |
PG&E Corp. | 381,456 | | 16,265,284 |
Sempra Energy | 603,888 | | 45,321,794 |
| | 92,860,311 |
TOTAL UTILITIES | | 326,412,814 |
TOTAL COMMON STOCKS (Cost $8,200,877,240) |
9,523,184,672
|
U.S. Treasury Obligations - 0.1% |
| Principal Amount | | |
U.S. Treasury Bills, yield at date of purchase 0.07% to 0.08% 2/14/13 to 4/18/13 (e)
(Cost $7,724,628) | | $ 7,725,000 | |
7,724,806
|
Money Market Funds - 3.1% |
| Shares | | |
Fidelity Cash Central Fund, 0.16% (b) | 262,324,241 | | 262,324,241 |
Fidelity Securities Lending Cash Central Fund, 0.15% (b)(c) | 42,193,700 | | 42,193,700 |
TOTAL MONEY MARKET FUNDS (Cost $304,517,941) |
304,517,941
|
TOTAL INVESTMENT PORTFOLIO - 100.5% (Cost $8,513,119,809) | | 9,835,427,419 |
NET OTHER ASSETS (LIABILITIES) - (0.5)% | | (52,967,655) |
NET ASSETS - 100% | $ 9,782,459,764 |
Futures Contracts |
| Expiration Date | | Underlying
Face Amount
at Value | | Unrealized
Appreciation/
(Depreciation) |
Purchased |
Equity Index Contracts |
1,860 CME E-mini S&P 500 Index Contracts | March 2013 | | $ 138,876,900 | | $ 2,205,158 |
|
The face value of futures purchased as a percentage of net assets is 1.4% |
Legend |
(a) Non-income producing |
(b) Affiliated fund that is available only to investment companies and other accounts managed by Fidelity Investments. The rate quoted is the annualized seven-day yield of the fund at period end. A complete unaudited listing of the fund's holdings as of its most recent quarter end is available upon request. In addition, each Fidelity Central Fund's financial statements, which are not covered by the Fund's Report of Independent Registered Public Accounting Firm, are available on the SEC's website or upon request. |
(c) Investment made with cash collateral received from securities on loan. |
(d) Security or a portion of the security is on loan at period end. |
(e) Security or a portion of the security was pledged to cover margin requirements for futures contracts. At the period end, the value of securities pledged amounted to $6,299,969. |
(f) Investment is owned by an entity that is treated as a corporation for U.S. tax purposes which is owned by the Fund. |
(g) Restricted securities - Investment in securities not registered under the Securities Act of 1933 (excluding 144A issues). At the end of the period, the value of restricted securities (excluding 144A issues) amounted to $6,867,885 or 0.1% of net assets. |
Additional information on each restricted holding is as follows: |
Security | Acquisition Date | Acquisition Cost |
Legend Pictures LLC | 9/23/10 | $ 2,779,500 |
Affiliated Central Funds |
Information regarding fiscal year to date income earned by the Fund from investments in Fidelity Central Funds is as follows: |
Fund | Income earned |
Fidelity Cash Central Fund | $ 523,189 |
Fidelity Securities Lending Cash Central Fund | 1,043,451 |
Total | $ 1,566,640 |
Other Information |
The following is a summary of the inputs used, as of January 31, 2013, involving the Fund's assets and liabilities carried at fair value. The inputs or methodology used for valuing securities may not be an indication of the risk associated with investing in those securities. For more information on valuation inputs, and their aggregation into the levels used in the table below, please refer to the Investment Valuation section in the accompanying Notes to Financial Statements. |
Valuation Inputs at Reporting Date: |
Description | Total | Level 1 | Level 2 | Level 3 |
Investments in Securities: | | | | |
Equities: | | | | |
Consumer Discretionary | $ 1,167,278,789 | $ 1,160,410,901 | $ - | $ 6,867,888 |
Consumer Staples | 943,093,348 | 943,093,348 | - | - |
Energy | 1,026,780,645 | 1,026,780,645 | - | - |
Financials | 1,510,743,562 | 1,510,743,562 | - | - |
Health Care | 1,165,015,951 | 1,165,015,951 | - | - |
Industrials | 1,058,415,240 | 1,058,415,240 | - | - |
Information Technology | 1,698,264,868 | 1,698,264,868 | - | - |
Materials | 373,336,890 | 373,336,890 | - | - |
Telecommunica-
tion Services | 253,842,565 | 253,842,565 | - | - |
Utilities | 326,412,814 | 326,412,814 | - | - |
U.S. Government and Government Agency Obligations | 7,724,806 | - | 7,724,806 | - |
Money Market Funds | 304,517,941 | 304,517,941 | - | - |
Total Investments in Securities: | $ 9,835,427,419 | $ 9,820,834,725 | $ 7,724,806 | $ 6,867,888 |
Derivative Instruments: | | | | |
Assets | | | | |
Futures Contracts | $ 2,205,158 | $ 2,205,158 | $ - | $ - |
Value of Derivative Instruments |
The following table is a summary of the Fund's value of derivative instruments by primary risk exposure as of January 31, 2013. For additional information on derivative instruments, please refer to the Derivative Instruments section in the accompanying Notes to Financial Statements. |
Primary Risk Exposure /
Derivative Type | Value |
| Asset | Liability |
Equity Risk | | |
Futures Contracts (a) | $ 2,205,158 | $ - |
Total Value of Derivatives | $ 2,205,158 | $ - |
(a) Reflects cumulative appreciation/(depreciation) on futures contracts as disclosed on the Schedule of Investments. Only the period end variation margin is separately disclosed on the Statement of Assets and Liabilities. |
See accompanying notes which are an integral part of the financial statements.
Annual Report
Fidelity Series All-Sector Equity Fund
Statement of Assets and Liabilities
| January 31, 2013 |
| | |
Assets | | |
Investment in securities, at value (including securities loaned of $40,875,327) - See accompanying schedule: Unaffiliated issuers (cost $8,208,601,868) | $ 9,530,909,478 | |
Fidelity Central Funds (cost $304,517,941) | 304,517,941 | |
Total Investments (cost $8,513,119,809) | | $ 9,835,427,419 |
Cash | | 26,429 |
Foreign currency held at value (cost $199,802) | | 202,347 |
Receivable for investments sold | | 93,711,552 |
Receivable for fund shares sold | | 8,834,189 |
Dividends receivable | | 7,559,322 |
Distributions receivable from Fidelity Central Funds | | 30,147 |
Prepaid expenses | | 33,254 |
Other receivables | | 1,106,673 |
Total assets | | 9,946,931,332 |
| | |
Liabilities | | |
Payable for investments purchased | $ 113,316,517 | |
Payable for fund shares redeemed | 3,833,755 | |
Accrued management fee | 3,806,292 | |
Payable for daily variation margin on futures contracts | 178,948 | |
Other affiliated payables | 988,605 | |
Other payables and accrued expenses | 153,751 | |
Collateral on securities loaned, at value | 42,193,700 | |
Total liabilities | | 164,471,568 |
| | |
Net Assets | | $ 9,782,459,764 |
Net Assets consist of: | | |
Paid in capital | | $ 8,215,124,793 |
Undistributed net investment income | | 5,334,648 |
Accumulated undistributed net realized gain (loss) on investments and foreign currency transactions | | 237,509,799 |
Net unrealized appreciation (depreciation) on investments and assets and liabilities in foreign currencies | | 1,324,490,524 |
Net Assets | | $ 9,782,459,764 |
See accompanying notes which are an integral part of the financial statements.
Annual Report
Statement of Assets and Liabilities - continued
| January 31, 2013 |
| | |
Series All-Sector Equity:
Net Asset Value, offering price and redemption price per share ($5,293,761,236 ÷ 421,127,537 shares) | | $ 12.57 |
| | |
Class F:
Net Asset Value, offering price and redemption price per share ($4,488,698,528 ÷ 357,289,320 shares) | | $ 12.56 |
See accompanying notes which are an integral part of the financial statements.
Annual Report
Fidelity Series All-Sector Equity Fund
Financial Statements - continued
Statement of Operations
| Year ended January 31, 2013 |
| | |
Investment Income | | |
Dividends | | $ 238,523,851 |
Interest | | 13,766 |
Income from Fidelity Central Funds | | 1,566,640 |
Total income | | 240,104,257 |
| | |
Expenses | | |
Management fee
Basic fee | $ 68,268,468 | |
Performance adjustment | (5,291,566) | |
Transfer agent fees | 13,958,456 | |
Accounting and security lending fees | 1,388,627 | |
Custodian fees and expenses | 344,335 | |
Independent trustees' compensation | 81,465 | |
Audit | 78,088 | |
Legal | 49,986 | |
Miscellaneous | 120,137 | |
Total expenses before reductions | 78,997,996 | |
Expense reductions | (1,992,432) | 77,005,564 |
Net investment income (loss) | | 163,098,693 |
Realized and Unrealized Gain (Loss) Net realized gain (loss) on: | | |
Investment securities: | | |
Unaffiliated issuers | 1,076,210,082 | |
Redemption in-kind with affiliated entities | 1,028,917,514 | |
Foreign currency transactions | (500,813) | |
Futures contracts | 10,092,463 | |
Total net realized gain (loss) | | 2,114,719,246 |
Change in net unrealized appreciation (depreciation) on: Investment securities | (490,356,762) | |
Assets and liabilities in foreign currencies | 55,980 | |
Futures contracts | (2,135,960) | |
Total change in net unrealized appreciation (depreciation) | | (492,436,742) |
Net gain (loss) | | 1,622,282,504 |
Net increase (decrease) in net assets resulting from operations | | $ 1,785,381,197 |
See accompanying notes which are an integral part of the financial statements.
Annual Report
Statement of Changes in Net Assets
| Year ended
January 31,
2013 | Year ended
January 31,
2012 |
Increase (Decrease) in Net Assets | | |
Operations | | |
Net investment income (loss) | $ 163,098,693 | $ 96,315,057 |
Net realized gain (loss) | 2,114,719,246 | 477,594,589 |
Change in net unrealized appreciation (depreciation) | (492,436,742) | (566,168,414) |
Net increase (decrease) in net assets resulting
from operations | 1,785,381,197 | 7,741,232 |
Distributions to shareholders from net investment income | (157,359,845) | (100,591,386) |
Distributions to shareholders from net realized gain | (657,260,030) | (903,235,315) |
Total distributions | (814,619,875) | (1,003,826,701) |
Share transactions - net increase (decrease) | (2,796,069,213) | 1,302,246,045 |
Total increase (decrease) in net assets | (1,825,307,891) | 306,160,576 |
| | |
Net Assets | | |
Beginning of period | 11,607,767,655 | 11,301,607,079 |
End of period (including undistributed net investment income of $5,334,648 and $0, respectively) | $ 9,782,459,764 | $ 11,607,767,655 |
See accompanying notes which are an integral part of the financial statements.
Annual Report
Financial Highlights - Series All-Sector Equity
Years ended January 31, | 2013 | 2012 | 2011 | 2010 | 2009 G |
Selected Per-Share Data | | | | | |
Net asset value, beginning of period | $ 11.82 | $ 12.98 | $ 11.32 | $ 8.48 | $ 10.00 |
Income from Investment Operations | | | | | |
Net investment income (loss) D | .16 | .10 | .09 | .09 | .03 |
Net realized and unrealized gain (loss) | 1.72 | (.15) | 2.63 | 3.18 | (1.52) |
Total from investment operations | 1.88 | (.05) | 2.72 | 3.27 | (1.49) |
Distributions from net investment income | (.21) | (.10) | (.08) | (.08) | (.03) |
Distributions from net realized gain | (.92) | (1.01) | (.98) | (.35) | - |
Total distributions | (1.13) | (1.11) | (1.06) | (.43) | (.03) |
Net asset value, end of period | $ 12.57 | $ 11.82 | $ 12.98 | $ 11.32 | $ 8.48 |
Total Return B, C | 16.32% | (.12)% | 24.87% | 38.51% | (14.91)% |
Ratios to Average Net Assets E, H | | | | |
Expenses before reductions | .73% | .89% | .91% | .90% | .95% A |
Expenses net of fee waivers, if any | .73% | .89% | .91% | .90% | .95% A |
Expenses net of all reductions | .71% | .87% | .89% | .88% | .95% A |
Net investment income (loss) | 1.25% | .81% | .79% | .88% | 1.17% A |
Supplemental Data | | | | | |
Net assets, end of period (000 omitted) | $ 5,293,761 | $ 7,338,658 | $ 8,937,188 | $ 7,142,899 | $ 3,056,733 |
Portfolio turnover rate F | 124% | 135% | 117% | 144% | 98% |
A Annualized
B Total returns for periods of less than one year are not annualized.
C Total returns would have been lower if certain expenses had not been reduced during the applicable periods shown.
D Calculated based on average shares outstanding during the period.
E Fees and expenses of any underlying Fidelity Central Funds are not included in the Fund's expense ratio. The Fund indirectly bears its proportionate share of the expenses of any underlying Fidelity Central Funds.
F Amount does not include the portfolio activity of any underlying Fidelity Central Funds.
G For the period October 17, 2008 (commencement of operations) to January 31, 2009.
H Expense ratios reflect operating expenses of the class. Expenses before reductions do not reflect amounts reimbursed by the investment adviser or reductions from brokerage service arrangements or reductions from other expense offset arrangements and do not represent the amount paid by the class during periods when reimbursements or reductions occur. Expense ratios before reductions for start-up periods may not be representative of longer-term operating periods. Expenses net of fee waivers reflect expenses after reimbursement by the investment adviser but prior to reductions from brokerage service arrangements or other expense offset arrangements. Expenses net of all reductions represent the net expenses paid by the class.
See accompanying notes which are an integral part of the financial statements.
Annual Report
Financial Highlights - Class F
Years ended January 31, | 2013 | 2012 | 2011 | 2010 G |
Selected Per-Share Data | | | | |
Net asset value, beginning of period | $ 11.82 | $ 12.98 | $ 11.32 | $ 9.84 |
Income from Investment
Operations | | | | |
Net investment income (loss) D | .18 | .12 | .12 | .04 |
Net realized and unrealized gain (loss) | 1.72 | (.14) | 2.63 | 1.89 |
Total from investment operations | 1.90 | (.02) | 2.75 | 1.93 |
Distributions from net investment income | (.24) | (.13) | (.11) | (.10) |
Distributions from net realized gain | (.92) | (1.01) | (.98) | (.35) |
Total distributions | (1.16) | (1.14) | (1.09) | (.45) |
Net asset value, end of period | $ 12.56 | $ 11.82 | $ 12.98 | $ 11.32 |
Total Return B, C | 16.54% | .10% | 25.12% | 19.49% |
Ratios to Average Net Assets E, H | | | | |
Expenses before reductions | .53% | .68% | .69% | .63% A |
Expenses net of fee waivers, if any | .53% | .68% | .69% | .63% A |
Expenses net of all reductions | .51% | .67% | .67% | .61% A |
Net investment income (loss) | 1.44% | 1.01% | 1.01% | .62% A |
Supplemental Data | | | | |
Net assets, end of period (000 omitted) | $ 4,488,699 | $ 4,269,110 | $ 2,364,419 | $ 400,571 |
Portfolio turnover rate F | 124% | 135% | 117% | 144% |
A Annualized
B Total returns for periods of less than one year are not annualized.
C Total returns would have been lower if certain expenses had not been reduced during the applicable periods shown.
D Calculated based on average shares outstanding during the period.
E Fees and expenses of any underlying Fidelity Central Funds are not included in the Fund's expense ratio. The Fund indirectly bears its proportionate share of the expenses of any underlying Fidelity Central Funds.
F Amount does not include the portfolio activity of any underlying Fidelity Central Funds.
G For the period June 26, 2009 (commencement of sale of shares) to January 31, 2010.
H Expense ratios reflect operating expenses of the class. Expenses before reductions do not reflect amounts reimbursed by the investment adviser or reductions from brokerage service arrangements or reductions from other expense offset arrangements and do not represent the amount paid by the class during periods when reimbursements or reductions occur. Expense ratios before reductions for start-up periods may not be representative of longer-term operating periods. Expenses net of fee waivers reflect expenses after reimbursement by the investment adviser but prior to reductions from brokerage service arrangements or other expense offset arrangements. Expenses net of all reductions represent the net expenses paid by the class.
See accompanying notes which are an integral part of the financial statements.
Annual Report
Fidelity Series Large Cap Value Fund
Average annual total return reflects the change in the value of an investment, assuming reinvestment of the class' distributions from dividend income and capital gains (the profits earned upon the sale of securities that have grown in value, if any) and assuming a constant rate of performance each year. The $10,000 table and the fund's returns do not reflect the deduction of taxes that a shareholder would pay on fund distributions or the redemption of fund shares. During periods of reimbursement by Fidelity, a fund's total return will be greater than it would be had the reimbursement not occurred. How a fund did yesterday is no guarantee of how it will do tomorrow.
Average Annual Total Returns
Periods ended January 31, 2013 | Past 1
year | Life of
fund A |
Fidelity Series Large Cap Value Fund | 16.27% | 10.47% |
Class F B | 16.42% | 10.64% |
A From October 24, 2008.
B The initial offering of Class F shares took place on June 26, 2009. Returns prior to June 26, 2009, are those of Fidelity Series Large Cap Value Fund, the original class of the fund.
$10,000 Over Life of Fund
Let's say hypothetically that $10,000 was invested in Fidelity Series Large Cap Value Fund, a class of the fund, on October 24, 2008, when the fund started. The chart shows how the value of your investment would have changed, and also shows how the Russell 1000® Value Index performed over the same period.
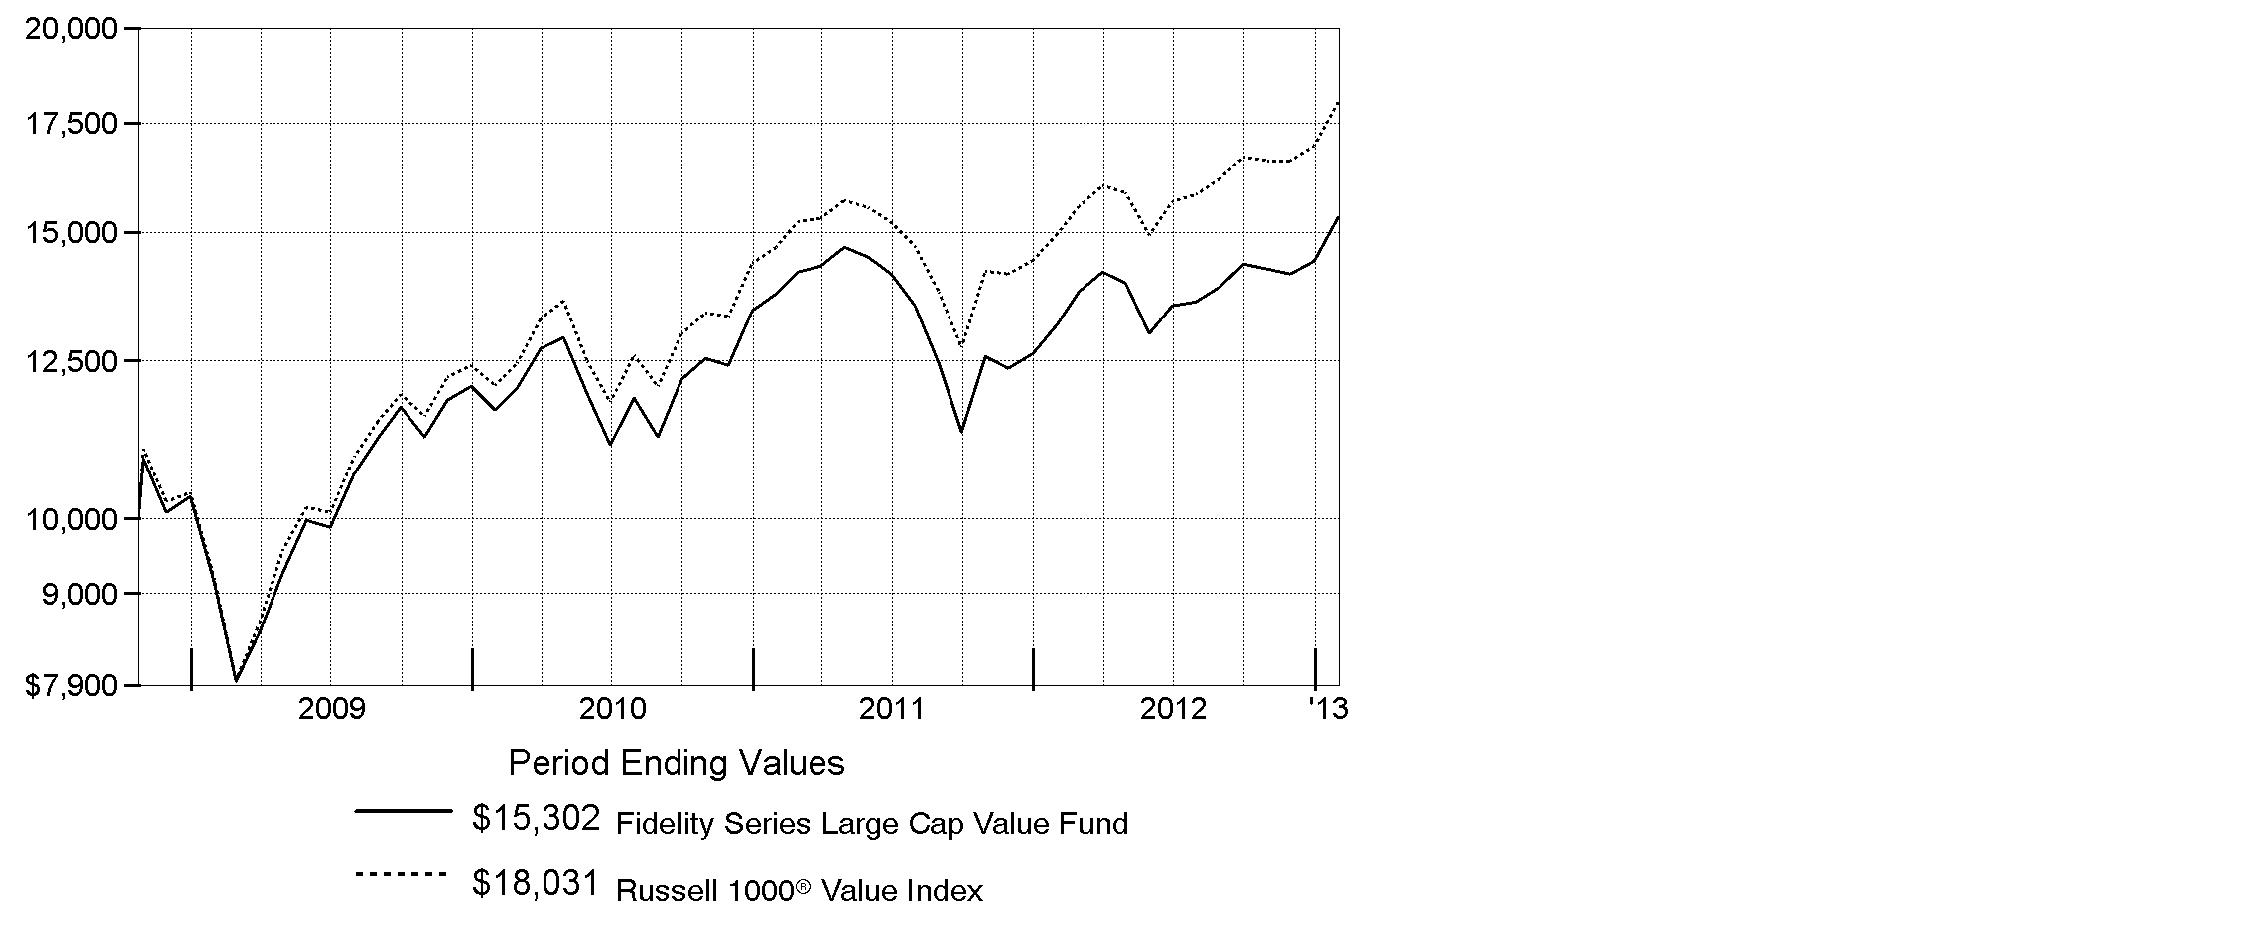
Annual Report
Fidelity Series Large Cap Value Fund
Market Recap: Improvement in the U.S. economy helped lift equity benchmarks to double-digit gains for the year ending January 31, 2013, overcoming moments of volatility driven by sovereign debt woes in Europe, slower economic growth in China and gridlock in Congress. Major U.S. benchmarks hit multiyear highs during the period, encouraged by a rebounding domestic housing market and solid corporate earnings reports. The broad-based S&P 500® Index rose 16.78% for the year, crossing the milestone 1,500 mark near period end. The technology-heavy Nasdaq Composite Index® added 13.13%, and the blue-chip-laden Dow Jones Industrial AverageSM gained 12.75%. Early in the period, stocks rose on positive U.S. economic news and proposed bailouts in Europe. Although fear resurfaced in April and May, equities rebounded in June on central bank stimulus and new life in the housing market. In September, pre-election jitters and the looming "fiscal cliff" of tax hikes and federal spending cuts fueled some profit-taking, followed by a brief post-election sell-off. But stocks proved resilient, as investors continued to pile into riskier assets. Gains were broad-based, with eight of the 10 sectors in the S&P 500® posting double-digit returns. Despite eurozone turmoil, foreign developed-markets stocks rose strongly, with the MSCI® EAFE® Index adding 17.41%.
Comments from Bruce Dirks and Michael Chren, Co-Portfolio Managers of Fidelity® Series Large Cap Value Fund: For the year, the fund's Series Large Cap Value and Class F shares returned 16.27% and 16.42%, respectively, trailing the 20.58% gain of the Russell 1000® Value Index. Adverse stock picking in information technology, along with an overweighting in the poor-performing technology hardware/equipment group and unfavorable security selection in consumer discretionary and industrials, drove the fund's underperformance. A roughly 4% average cash stake also dampened relative results. Conversely, positive security selection and favorable industry positioning in financials, consumer staples and health care helped the fund's relative return, as did stock choices in energy, utilities and materials. Individual detractors included department store operator J.C. Penney, an out-of-benchmark position in semiconductor maker Advanced Micro Devices, technology manufacturer Hewlett-Packard and an underweighting in diversified financial services giant Bank of America. The top individual contributors were Mexican brewer Grupo Modelo - not in the index and not held at period end - diversified financial services heavyweight Citigroup and health care services provider HCA Holdings.
The views expressed above reflect those of the portfolio manager(s) only through the end of the period as stated on the cover of this report and do not necessarily represent the views of Fidelity or any other person in the Fidelity organization. Any such views are subject to change at any time based upon market or other conditions and Fidelity disclaims any responsibility to update such views. These views may not be relied on as investment advice and, because investment decisions for a Fidelity fund are based on numerous factors, may not be relied on as an indication of trading intent on behalf of any Fidelity fund.
Annual Report
Fidelity Series Large Cap Value Fund
Investment Changes (Unaudited)
Top Ten Stocks as of January 31, 2013 |
| % of fund's
net assets | % of fund's net assets
6 months ago |
Exxon Mobil Corp. | 4.8 | 4.5 |
Pfizer, Inc. | 4.7 | 3.9 |
General Electric Co. | 4.4 | 3.0 |
Merck & Co., Inc. | 3.8 | 3.2 |
Chevron Corp. | 3.8 | 3.8 |
Citigroup, Inc. | 3.1 | 2.3 |
Anadarko Petroleum Corp. | 2.5 | 1.1 |
JPMorgan Chase & Co. | 2.4 | 2.1 |
Procter & Gamble Co. | 2.0 | 1.3 |
Mondelez International, Inc. | 2.0 | 0.0 |
| 33.5 | |
Top Five Market Sectors as of January 31, 2013 |
| % of fund's
net assets | % of fund's net assets
6 months ago |
Financials | 22.7 | 23.6 |
Energy | 16.4 | 16.5 |
Health Care | 11.3 | 12.8 |
Information Technology | 8.6 | 7.0 |
Industrials | 7.7 | 7.6 |
Asset Allocation (% of fund's net assets) |
As of January 31, 2013* | As of July 31, 2012** |
| Stocks 90.9% | | | Stocks and
Equity Futures 95.9% | |
| Short-Term
Investments and
Net Other Assets
(Liabilities) 9.1% | | | Short-Term
Investments and
Net Other Assets
(Liabilities) 4.1% | |
* Foreign investments | 3.6% | | ** Foreign investments | 3.5% | |

Annual Report
Fidelity Series Large Cap Value Fund
Investments January 31, 2013
Showing Percentage of Net Assets
Common Stocks - 90.9% |
| Shares | | Value |
CONSUMER DISCRETIONARY - 6.7% |
Automobiles - 0.2% |
General Motors Co. (a) | 476,100 | | $ 13,373,649 |
Diversified Consumer Services - 1.9% |
Apollo Group, Inc. Class A (non-vtg.) (a) | 3,363,421 | | 68,008,373 |
DeVry, Inc. (d) | 2,594,450 | | 65,302,307 |
| | 133,310,680 |
Household Durables - 1.1% |
Garmin Ltd. (d) | 1,487,250 | | 56,351,903 |
Jarden Corp. | 179,320 | | 10,551,189 |
Whirlpool Corp. | 109,249 | | 12,605,150 |
| | 79,508,242 |
Media - 2.2% |
Comcast Corp. Class A | 454,500 | | 17,307,360 |
DISH Network Corp. Class A | 1,387,806 | | 51,723,530 |
Washington Post Co. Class B (d) | 227,912 | | 87,901,100 |
| | 156,931,990 |
Multiline Retail - 1.0% |
J.C. Penney Co., Inc. (d) | 2,972,863 | | 60,438,305 |
Macy's, Inc. | 312,100 | | 12,331,071 |
| | 72,769,376 |
Specialty Retail - 0.3% |
Best Buy Co., Inc. | 462,100 | | 7,513,746 |
Foot Locker, Inc. | 271,200 | | 9,315,720 |
| | 16,829,466 |
TOTAL CONSUMER DISCRETIONARY | | 472,723,403 |
CONSUMER STAPLES - 7.6% |
Beverages - 0.4% |
Molson Coors Brewing Co. Class B | 213,500 | | 9,645,930 |
PepsiCo, Inc. | 189,664 | | 13,817,022 |
| | 23,462,952 |
Food & Staples Retailing - 1.7% |
CVS Caremark Corp. | 1,159,382 | | 59,360,358 |
Wal-Mart Stores, Inc. | 856,500 | | 59,912,175 |
| | 119,272,533 |
Food Products - 3.3% |
ConAgra Foods, Inc. | 252,500 | | 8,254,225 |
Kraft Foods Group, Inc. | 1,733,485 | | 80,121,677 |
Common Stocks - continued |
| Shares | | Value |
CONSUMER STAPLES - continued |
Food Products - continued |
Mondelez International, Inc. | 4,930,340 | | $ 137,014,149 |
The J.M. Smucker Co. | 86,100 | | 7,631,043 |
| | 233,021,094 |
Household Products - 2.1% |
Energizer Holdings, Inc. | 109,700 | | 9,544,997 |
Procter & Gamble Co. | 1,860,655 | | 139,846,830 |
| | 149,391,827 |
Tobacco - 0.1% |
Lorillard, Inc. | 166,000 | | 6,485,620 |
TOTAL CONSUMER STAPLES | | 531,634,026 |
ENERGY - 16.4% |
Energy Equipment & Services - 2.6% |
Cameron International Corp. (a) | 1,367,190 | | 86,556,799 |
Halliburton Co. | 2,155,352 | | 87,679,719 |
National Oilwell Varco, Inc. | 132,900 | | 9,853,206 |
| | 184,089,724 |
Oil, Gas & Consumable Fuels - 13.8% |
Anadarko Petroleum Corp. | 2,216,735 | | 177,383,135 |
Apache Corp. | 333,238 | | 27,912,015 |
Chevron Corp. | 2,286,252 | | 263,261,918 |
Exxon Mobil Corp. | 3,778,732 | | 339,972,509 |
Marathon Petroleum Corp. | 182,700 | | 13,558,167 |
Occidental Petroleum Corp. | 1,183,960 | | 104,508,149 |
Phillips 66 | 258,600 | | 15,663,402 |
The Williams Companies, Inc. | 413,178 | | 14,481,889 |
Valero Energy Corp. | 261,763 | | 11,446,896 |
| | 968,188,080 |
TOTAL ENERGY | | 1,152,277,804 |
FINANCIALS - 22.7% |
Capital Markets - 3.8% |
Bank of New York Mellon Corp. | 1,924,000 | | 52,255,840 |
E*TRADE Financial Corp. (a) | 9,679,528 | | 102,699,792 |
Goldman Sachs Group, Inc. | 269,950 | | 39,914,807 |
Common Stocks - continued |
| Shares | | Value |
FINANCIALS - continued |
Capital Markets - continued |
State Street Corp. | 1,138,399 | | $ 63,351,904 |
The Blackstone Group LP | 379,700 | | 7,024,450 |
| | 265,246,793 |
Commercial Banks - 5.6% |
Comerica, Inc. | 345,700 | | 11,878,252 |
Fifth Third Bancorp | 3,883,442 | | 63,261,270 |
KeyCorp | 11,738,524 | | 110,342,126 |
PNC Financial Services Group, Inc. | 353,897 | | 21,870,835 |
SunTrust Banks, Inc. | 452,200 | | 12,828,914 |
U.S. Bancorp | 1,204,021 | | 39,853,095 |
Wells Fargo & Co. | 3,037,245 | | 105,787,243 |
Zions Bancorporation | 1,360,152 | | 31,718,745 |
| | 397,540,480 |
Consumer Finance - 1.4% |
Capital One Financial Corp. | 1,526,724 | | 85,985,096 |
SLM Corp. | 699,400 | | 11,812,866 |
| | 97,797,962 |
Diversified Financial Services - 6.1% |
Bank of America Corp. | 3,889,332 | | 44,027,238 |
Citigroup, Inc. | 5,262,261 | | 221,856,924 |
JPMorgan Chase & Co. | 3,550,736 | | 167,062,129 |
| | 432,946,291 |
Insurance - 5.1% |
Allstate Corp. | 876,460 | | 38,476,594 |
American International Group, Inc. (a) | 256,700 | | 9,710,961 |
Assurant, Inc. | 449,470 | | 17,187,733 |
Berkshire Hathaway, Inc. Class B (a) | 154,800 | | 15,004,764 |
Everest Re Group Ltd. | 60,249 | | 6,977,437 |
Lincoln National Corp. | 405,300 | | 11,745,594 |
MetLife, Inc. | 768,621 | | 28,700,308 |
RenaissanceRe Holdings Ltd. | 745,430 | | 63,838,625 |
The Chubb Corp. | 616,461 | | 49,507,983 |
The Travelers Companies, Inc. | 111,400 | | 8,740,444 |
Validus Holdings Ltd. | 191,283 | | 6,964,614 |
XL Group PLC Class A | 3,687,619 | | 102,220,799 |
| | 359,075,856 |
Real Estate Investment Trusts - 0.7% |
American Tower Corp. | 68,800 | | 5,239,120 |
Common Stocks - continued |
| Shares | | Value |
FINANCIALS - continued |
Real Estate Investment Trusts - continued |
Ventas, Inc. | 134,900 | | $ 8,942,521 |
Weyerhaeuser Co. | 1,166,324 | | 35,129,679 |
| | 49,311,320 |
TOTAL FINANCIALS | | 1,601,918,702 |
HEALTH CARE - 11.3% |
Biotechnology - 0.1% |
Amgen, Inc. | 69,200 | | 5,913,832 |
Health Care Providers & Services - 0.4% |
CIGNA Corp. | 206,500 | | 12,047,210 |
HCA Holdings, Inc. | 470,617 | | 17,718,730 |
| | 29,765,940 |
Pharmaceuticals - 10.8% |
Bristol-Myers Squibb Co. | 705,366 | | 25,491,927 |
Eli Lilly & Co. | 505,380 | | 27,133,852 |
Johnson & Johnson | 1,382,131 | | 102,167,124 |
Merck & Co., Inc. | 6,127,382 | | 265,009,272 |
Mylan, Inc. (a) | 240,700 | | 6,804,589 |
Pfizer, Inc. | 12,236,822 | | 333,820,504 |
Zoetis, Inc. Class A | 59,700 | | 1,552,200 |
| | 761,979,468 |
TOTAL HEALTH CARE | | 797,659,240 |
INDUSTRIALS - 7.7% |
Aerospace & Defense - 2.0% |
General Dynamics Corp. | 149,600 | | 9,918,480 |
Raytheon Co. | 26,614 | | 1,402,026 |
Textron, Inc. | 4,527,833 | | 130,220,477 |
| | 141,540,983 |
Airlines - 0.1% |
Delta Air Lines, Inc. (a) | 293,800 | | 4,080,882 |
Commercial Services & Supplies - 0.1% |
Avery Dennison Corp. | 173,200 | | 6,669,932 |
Common Stocks - continued |
| Shares | | Value |
INDUSTRIALS - continued |
Construction & Engineering - 1.0% |
Jacobs Engineering Group, Inc. (a) | 1,251,119 | | $ 60,191,335 |
URS Corp. | 201,500 | | 8,358,220 |
| | 68,549,555 |
Industrial Conglomerates - 4.4% |
General Electric Co. | 13,984,271 | | 311,569,558 |
Machinery - 0.1% |
Terex Corp. (a) | 299,500 | | 9,697,810 |
TOTAL INDUSTRIALS | | 542,108,720 |
INFORMATION TECHNOLOGY - 8.6% |
Communications Equipment - 1.3% |
Cisco Systems, Inc. | 4,515,015 | | 92,873,859 |
Computers & Peripherals - 1.9% |
Dell, Inc. | 1,005,500 | | 13,312,820 |
Hewlett-Packard Co. | 7,066,121 | | 116,661,658 |
| | 129,974,478 |
Internet Software & Services - 1.5% |
Yahoo!, Inc. (a) | 5,315,800 | | 104,349,154 |
IT Services - 0.1% |
Computer Sciences Corp. | 174,200 | | 7,281,560 |
Office Electronics - 1.1% |
Xerox Corp. | 9,865,708 | | 79,024,321 |
Semiconductors & Semiconductor Equipment - 1.1% |
Advanced Micro Devices, Inc. (a)(d) | 3,098,180 | | 8,055,268 |
Broadcom Corp. Class A | 239,600 | | 7,775,020 |
Intel Corp. | 717,500 | | 15,096,200 |
Micron Technology, Inc. (a) | 6,311,268 | | 47,713,186 |
| | 78,639,674 |
Software - 1.6% |
CA Technologies, Inc. | 307,300 | | 7,627,186 |
Comverse Technology, Inc. | 5,666,931 | | 24,707,819 |
Comverse, Inc. | 667,485 | | 19,276,967 |
Microsoft Corp. | 861,850 | | 23,675,020 |
Symantec Corp. (a) | 1,539,246 | | 33,509,385 |
Synopsys, Inc. (a) | 80,138 | | 2,679,815 |
| | 111,476,192 |
TOTAL INFORMATION TECHNOLOGY | | 603,619,238 |
Common Stocks - continued |
| Shares | | Value |
MATERIALS - 3.9% |
Chemicals - 1.2% |
Ashland, Inc. | 111,605 | | $ 8,762,109 |
Eastman Chemical Co. | 75,600 | | 5,378,940 |
LyondellBasell Industries NV Class A | 176,300 | | 11,180,946 |
The Dow Chemical Co. | 1,787,803 | | 57,567,257 |
| | 82,889,252 |
Metals & Mining - 1.9% |
Freeport-McMoRan Copper & Gold, Inc. | 732,071 | | 25,805,503 |
Newmont Mining Corp. | 2,461,711 | | 105,755,105 |
Reliance Steel & Aluminum Co. | 90,500 | | 5,857,160 |
| | 137,417,768 |
Paper & Forest Products - 0.8% |
International Paper Co. | 1,380,403 | | 57,176,292 |
TOTAL MATERIALS | | 277,483,312 |
TELECOMMUNICATION SERVICES - 2.3% |
Diversified Telecommunication Services - 0.5% |
AT&T, Inc. | 937,953 | | 32,631,385 |
CenturyLink, Inc. | 106,500 | | 4,307,925 |
| | 36,939,310 |
Wireless Telecommunication Services - 1.8% |
Sprint Nextel Corp. (a) | 21,739,039 | | 122,390,790 |
TOTAL TELECOMMUNICATION SERVICES | | 159,330,100 |
UTILITIES - 3.7% |
Electric Utilities - 2.4% |
American Electric Power Co., Inc. | 210,200 | | 9,519,958 |
Edison International | 1,903,457 | | 91,727,593 |
FirstEnergy Corp. | 318,444 | | 12,893,798 |
NextEra Energy, Inc. | 614,863 | | 44,300,879 |
NV Energy, Inc. | 527,100 | | 9,978,003 |
| | 168,420,231 |
Common Stocks - continued |
| Shares | | Value |
UTILITIES - continued |
Multi-Utilities - 1.3% |
DTE Energy Co. | 165,200 | | $ 10,458,812 |
Sempra Energy | 1,091,351 | | 81,905,893 |
| | 92,364,705 |
TOTAL UTILITIES | | 260,784,936 |
TOTAL COMMON STOCKS (Cost $5,501,669,970) |
6,399,539,481
|
U.S. Treasury Obligations - 0.1% |
| Principal Amount | | |
U.S. Treasury Bills, yield at date of purchase 0.08% 2/14/13
(Cost $7,469,771) | | $ 7,470,000 | |
7,469,963
|
Money Market Funds - 9.4% |
| Shares | | |
Fidelity Cash Central Fund, 0.16% (b) | 536,776,950 | | 536,776,950 |
Fidelity Securities Lending Cash Central Fund, 0.15% (b)(c) | 126,517,828 | | 126,517,828 |
TOTAL MONEY MARKET FUNDS (Cost $663,294,778) |
663,294,778
|
TOTAL INVESTMENT PORTFOLIO - 100.4% (Cost $6,172,434,519) | | 7,070,304,222 |
NET OTHER ASSETS (LIABILITIES) - (0.4)% | | (25,939,498) |
NET ASSETS - 100% | $ 7,044,364,724 |
Legend |
(a) Non-income producing |
(b) Affiliated fund that is available only to investment companies and other accounts managed by Fidelity Investments. The rate quoted is the annualized seven-day yield of the fund at period end. A complete unaudited listing of the fund's holdings as of its most recent quarter end is available upon request. In addition, each Fidelity Central Fund's financial statements, which are not covered by the Fund's Report of Independent Registered Public Accounting Firm, are available on the SEC's website or upon request. |
(c) Investment made with cash collateral received from securities on loan. |
(d) Security or a portion of the security is on loan at period end. |
Affiliated Central Funds |
Information regarding fiscal year to date income earned by the Fund from investments in Fidelity Central Funds is as follows: |
Fund | Income earned |
Fidelity Cash Central Fund | $ 945,366 |
Fidelity Securities Lending Cash Central Fund | 1,892,610 |
Total | $ 2,837,976 |
Other Affiliated Issuers |
An affiliated company is a company in which the Fund has ownership of at least 5% of the voting securities. Fiscal year to date transactions with companies which are or were affiliates are as follows: |
Affiliate | Value,
beginning of
period | Purchases | Sales
Proceeds | Dividend
Income | Value,
end of
period |
Comverse Technology, Inc. | $ 102,161,310 | $ 7,749,418 | $ 67,517,105 | $ - | $ - |
Other Information |
The following is a summary of the inputs used, as of January 31, 2013, involving the Fund's assets and liabilities carried at fair value. The inputs or methodology used for valuing securities may not be an indication of the risk associated with investing in those securities. For more information on valuation inputs, and their aggregation into the levels used in the table below, please refer to the Investment Valuation section in the accompanying Notes to Financial Statements. |
Valuation Inputs at Reporting Date: |
Description | Total | Level 1 | Level 2 | Level 3 |
Investments in Securities: | | | | |
Equities: | | | | |
Consumer Discretionary | $ 472,723,403 | $ 472,723,403 | $ - | $ - |
Consumer Staples | 531,634,026 | 531,634,026 | - | - |
Energy | 1,152,277,804 | 1,152,277,804 | - | - |
Financials | 1,601,918,702 | 1,601,918,702 | - | - |
Health Care | 797,659,240 | 797,659,240 | - | - |
Industrials | 542,108,720 | 542,108,720 | - | - |
Information Technology | 603,619,238 | 603,619,238 | - | - |
Materials | 277,483,312 | 277,483,312 | - | - |
Telecommunica-
tion Services | 159,330,100 | 159,330,100 | - | - |
Utilities | 260,784,936 | 260,784,936 | - | - |
U.S. Government and Government Agency Obligations | 7,469,963 | - | 7,469,963 | - |
Money Market Funds | 663,294,778 | 663,294,778 | - | - |
Total Investments in Securities: | $ 7,070,304,222 | $ 7,062,834,259 | $ 7,469,963 | $ - |
See accompanying notes which are an integral part of the financial statements.
Annual Report
Fidelity Series Large Cap Value Fund
Statement of Assets and Liabilities
| January 31, 2013 |
| | |
Assets | | |
Investment in securities, at value (including securities loaned of $122,709,366) - See accompanying schedule: Unaffiliated issuers (cost $5,509,139,741) | $ 6,407,009,444 | |
Fidelity Central Funds (cost $663,294,778) | 663,294,778 | |
Total Investments (cost $6,172,434,519) | | $ 7,070,304,222 |
Cash | | 24,297 |
Foreign currency held at value (cost $1,873) | | 1,971 |
Receivable for investments sold | | 444,540,567 |
Receivable for fund shares sold | | 5,230,846 |
Dividends receivable | | 7,946,782 |
Distributions receivable from Fidelity Central Funds | | 431,424 |
Prepaid expenses | | 27,291 |
Other receivables | | 1,203,384 |
Total assets | | 7,529,710,784 |
| | |
Liabilities | | |
Payable for investments purchased | $ 353,847,737 | |
Payable for fund shares redeemed | 2,252,652 | |
Accrued management fee | 1,837,945 | |
Other affiliated payables | 772,044 | |
Other payables and accrued expenses | 117,854 | |
Collateral on securities loaned, at value | 126,517,828 | |
Total liabilities | | 485,346,060 |
| | |
Net Assets | | $ 7,044,364,724 |
Net Assets consist of: | | |
Paid in capital | | $ 5,802,880,247 |
Undistributed net investment income | | 1,813,068 |
Accumulated undistributed net realized gain (loss) on investments and foreign currency transactions | | 341,800,378 |
Net unrealized appreciation (depreciation) on investments and assets and liabilities in foreign currencies | | 897,871,031 |
Net Assets | | $ 7,044,364,724 |
See accompanying notes which are an integral part of the financial statements.
Annual Report
Fidelity Series Large Cap Value Fund
Financial Statements - continued
Statement of Assets and Liabilities - continued
| January 31, 2013 |
| | |
Series Large Cap Value:
Net Asset Value, offering price and redemption price per share ($3,709,616,194 ÷ 312,897,923 shares) | | $ 11.86 |
| | |
Class F:
Net Asset Value, offering price and redemption price per share ($3,334,748,530 ÷ 281,582,353 shares) | | $ 11.84 |
See accompanying notes which are an integral part of the financial statements.
Annual Report
Statement of Operations
| Year ended January 31, 2013 |
| | |
Investment Income | | |
Dividends | | $ 273,856,218 |
Interest | | 10,012 |
Income from Fidelity Central Funds | | 2,837,976 |
Total income | | 276,704,206 |
| | |
Expenses | | |
Management fee
Basic fee | $ 59,511,687 | |
Performance adjustment | (19,007,735) | |
Transfer agent fees | 12,208,942 | |
Accounting and security lending fees | 1,355,644 | |
Custodian fees and expenses | 195,329 | |
Independent trustees' compensation | 71,740 | |
Audit | 83,485 | |
Legal | 44,403 | |
Miscellaneous | 107,706 | |
Total expenses before reductions | 54,571,201 | |
Expense reductions | (2,491,261) | 52,079,940 |
Net investment income (loss) | | 224,624,266 |
Realized and Unrealized Gain (Loss) Net realized gain (loss) on: | | |
Investment securities: | | |
Unaffiliated issuers | 448,079,805 | |
Redemption in-kind with affiliated entities | 696,707,692 | |
Other affiliated issuers | (17,899,743) | |
Foreign currency transactions | 310,967 | |
Futures contracts | 11,920,274 | |
Total net realized gain (loss) | | 1,139,118,995 |
Change in net unrealized appreciation (depreciation) on: Investment securities | 92,980,853 | |
Assets and liabilities in foreign currencies | 994 | |
Total change in net unrealized appreciation (depreciation) | | 92,981,847 |
Net gain (loss) | | 1,232,100,842 |
Net increase (decrease) in net assets resulting from operations | | $ 1,456,725,108 |
See accompanying notes which are an integral part of the financial statements.
Annual Report
Fidelity Series Large Cap Value Fund
Financial Statements - continued
Statement of Changes in Net Assets
| Year ended
January 31,
2013 | Year ended
January 31,
2012 |
Increase (Decrease) in Net Assets | | |
Operations | | |
Net investment income (loss) | $ 224,624,266 | $ 171,067,909 |
Net realized gain (loss) | 1,139,118,995 | 438,663,655 |
Change in net unrealized appreciation (depreciation) | 92,981,847 | (1,034,890,528) |
Net increase (decrease) in net assets resulting
from operations | 1,456,725,108 | (425,158,964) |
Distributions to shareholders from net investment income | (223,687,239) | (168,634,380) |
Distributions to shareholders from net realized gain | (6,697,468) | (828,507,893) |
Total distributions | (230,384,707) | (997,142,273) |
Share transactions - net increase (decrease) | (4,702,541,342) | 1,333,251,117 |
Total increase (decrease) in net assets | (3,476,200,941) | (89,050,120) |
| | |
Net Assets | | |
Beginning of period | 10,520,565,665 | 10,609,615,785 |
End of period (including undistributed net investment income of $1,813,068 and $0, respectively) | $ 7,044,364,724 | $ 10,520,565,665 |
See accompanying notes which are an integral part of the financial statements.
Annual Report
Financial Highlights - Series Large Cap Value
Years ended January 31, | 2013 | 2012 | 2011 | 2010 | 2009 G |
Selected Per-Share Data | | | | | |
Net asset value, beginning of period | $ 10.50 | $ 12.12 | $ 11.05 | $ 9.11 | $ 10.00 |
Income from Investment
Operations | | | | |
Net investment income (loss) D | .22 | .18 | .14 | .13 | .05 |
Net realized and unrealized gain (loss) | 1.47 | (.71) | 1.80 | 2.35 | (.90) |
Total from investment operations | 1.69 | (.53) | 1.94 | 2.48 | (.85) |
Distributions from net investment income | (.32) | (.17) | (.13) | (.11) | (.04) |
Distributions from net realized gain | (.01) | (.92) | (.74) | (.43) | - |
Total distributions | (.33) | (1.09) | (.87) | (.54) | (.04) |
Net asset value, end of period | $ 11.86 | $ 10.50 | $ 12.12 | $ 11.05 | $ 9.11 |
Total Return B, C | 16.27% | (4.28)% | 18.02% | 27.43% | (8.58)% |
Ratios to Average Net Assets E, H | | | | |
Expenses before reductions | .59% | .65% | .73% | .85% | .90% A |
Expenses net of fee waivers, if any | .59% | .65% | .73% | .85% | .90% A |
Expenses net of all reductions | .57% | .64% | .72% | .84% | .90% A |
Net investment income (loss) | 2.02% | 1.61% | 1.18% | 1.24% | 1.96% A |
Supplemental Data | | | | | |
Net assets, end of period (000 omitted) | $ 3,709,616 | $ 6,677,103 | $ 8,404,097 | $ 7,388,558 | $ 2,056,896 |
Portfolio turnover rate F | 136% | 121% | 102% | 138% | 118% |
A Annualized
B Total returns for periods of less than one year are not annualized.
C Total returns would have been lower if certain expenses had not been reduced during the applicable periods shown.
D Calculated based on average shares outstanding during the period.
E Fees and expenses of any underlying Fidelity Central Funds are not included in the Fund's expense ratio. The Fund indirectly bears its proportionate share of the expenses of any underlying Fidelity Central Funds.
F Amount does not include the portfolio activity of any underlying Fidelity Central Funds.
G For the period October 24, 2008 (commencement of operations) to January 31, 2009.
H Expense ratios reflect operating expenses of the class. Expenses before reductions do not reflect amounts reimbursed by the investment adviser or reductions from brokerage service arrangements or reductions from other expense offset arrangements and do not represent the amount paid by the class during periods when reimbursements or reductions occur. Expense ratios before reductions for start-up periods may not be representative of longer-term operating periods. Expenses net of fee waivers reflect expenses after reimbursement by the investment adviser but prior to reductions from brokerage service arrangements or other expense offset arrangements. Expenses net of all reductions represent the net expenses paid by the class.
See accompanying notes which are an integral part of the financial statements.
Annual Report
Financial Highlights - Class F
Years ended January 31, | 2013 | 2012 | 2011 | 2010 G |
Selected Per-Share Data | | | | |
Net asset value, beginning of period | $ 10.50 | $ 12.12 | $ 11.05 | $ 9.72 |
Income from Investment
Operations | | | | |
Net investment income (loss) D | .25 | .20 | .16 | .05 |
Net realized and unrealized gain (loss) | 1.45 | (.70) | 1.81 | 1.77 |
Total from investment operations | 1.70 | (.50) | 1.97 | 1.82 |
Distributions from net investment income | (.35) | (.20) | (.16) | (.13) |
Distributions from net realized gain | (.01) | (.92) | (.74) | (.36) |
Total distributions | (.36) | (1.12) | (.90) | (.49) |
Net asset value, end of period | $ 11.84 | $ 10.50 | $ 12.12 | $ 11.05 |
Total Return B, C | 16.42% | (4.06)% | 18.26% | 18.56% |
Ratios to Average Net Assets E, H | | | | |
Expenses before reductions | .40% | .44% | .50% | .58% A |
Expenses net of fee waivers, if any | .40% | .44% | .50% | .58% A |
Expenses net of all reductions | .37% | .43% | .49% | .57% A |
Net investment income (loss) | 2.21% | 1.81% | 1.40% | .79% A |
Supplemental Data | | | | |
Net assets, end of period (000 omitted) | $ 3,334,749 | $ 3,843,463 | $ 2,205,519 | $ 447,080 |
Portfolio turnover rate F | 136% | 121% | 102% | 138% |
A Annualized
B Total returns for periods of less than one year are not annualized.
C Total returns would have been lower if certain expenses had not been reduced during the applicable periods shown.
D Calculated based on average shares outstanding during the period.
E Fees and expenses of any underlying Fidelity Central Funds are not included in the Fund's expense ratio. The Fund indirectly bears its proportionate share of the expenses of any underlying Fidelity Central Funds.
F Amount does not include the portfolio activity of any underlying Fidelity Central Funds.
G For the period June 26, 2009 (commencement of sale of shares) to January 31, 2010.
H Expense ratios reflect operating expenses of the class. Expenses before reductions do not reflect amounts reimbursed by the investment adviser or reductions from brokerage service arrangements or reductions from other expense offset arrangements and do not represent the amount paid by the class during periods when reimbursements or reductions occur. Expense ratios before reductions for start-up periods may not be representative of longer-term operating periods. Expenses net of fee waivers reflect expenses after reimbursement by the investment adviser but prior to reductions from brokerage service arrangements or other expense offset arrangements. Expenses net of all reductions represent the net expenses paid by the class.
See accompanying notes which are an integral part of the financial statements.
Annual Report
Notes to Financial Statements
For the period ended January 31, 2013
1. Organization.
Fidelity Series Large Cap Value Fund and Fidelity Series All-Sector Equity Fund (the Funds) are funds of Fidelity Devonshire Trust (the Trust). The Trust is registered under the Investment Company Act of 1940, as amended (the 1940 Act), as an open-end management investment company organized as a Massachusetts business trust. Each Fund is authorized to issue an unlimited number of shares. Shares of the Funds are only available for purchase by mutual funds for which Fidelity Management & Research Company (FMR) or an affiliate serves as an investment manager. Fidelity Series Large Cap Value Fund offers Series Large Cap Value shares and Class F shares. Fidelity Series All-Sector Equity Fund offers Series All-Sector Equity shares and Class F shares. All classes have equal rights as to assets and voting privileges. Each class has exclusive voting rights with respect to matters that affect that class. Investment income, realized and unrealized capital gains and losses, the common expenses of each Fund, and certain fund-level expense reductions, if any, are allocated on a pro-rata basis to each class based on the relative net assets of each class to the total net assets of each Fund. Each class differs with respect to transfer agent fees incurred and certain class-level expense reductions.
2. Investments in Fidelity Central Funds.
The Funds invest in Fidelity Central Funds, which are open-end investment companies available only to other investment companies and accounts managed by FMR and its affiliates. The Funds' Schedules of Investments list each of the Fidelity Central Funds held as of period end, if any, as an investment of each Fund, but do not include the underlying holdings of each Fidelity Central Fund. As an Investing Fund, each Fund indirectly bears its proportionate share of the expenses of the underlying Fidelity Central Funds.
The Money Market Central Funds seek preservation of capital and current income and are managed by Fidelity Investments Money Management, Inc. (FIMM), an affiliate of FMR.
A complete unaudited list of holdings for each Fidelity Central Fund is available upon request or at the Securities and Exchange Commission (the SEC) website at www.sec.gov. In addition, the financial statements of the Fidelity Central Funds, which are not covered by the Funds' Report of Independent Registered Public Accounting Firm, are available on the SEC website or upon request.
3. Significant Accounting Policies.
The financial statements have been prepared in conformity with accounting principles generally accepted in the United States of America (GAAP), which require management to make certain estimates and assumptions at the date of the financial statements.
Annual Report
3. Significant Accounting Policies - continued
Actual results could differ from those estimates. Subsequent events, if any, through the date that the financial statements were issued have been evaluated in the preparation of the financial statements. The following summarizes the significant accounting policies of the Funds:
Investment Valuation. Investments are valued as of 4:00 p.m. Eastern time on the last calendar day of the period. In accordance with valuation policies and procedures approved by the Board of Trustees (the Board), each Fund attempts to obtain prices from one or more third party pricing vendors or brokers to value its investments. When current market prices, quotations or currency exchange rates are not readily available or reliable, investments will be fair valued in good faith by the FMR Fair Value Committee (the Committee), in accordance with procedures adopted by each Fund's Board. Factors used in determining fair value vary by investment type and may include market or investment specific events, changes in interest rates and credit quality. The frequency with which these procedures are used cannot be predicted and they may be utilized to a significant extent. The Committee oversees each Fund's valuation policies and procedures and is responsible for approving and reporting to the Board all fair value determinations.
Each Fund categorizes the inputs to valuation techniques used to value their investments into a disclosure hierarchy consisting of three levels as shown below:
Level 1 - quoted prices in active markets for identical investments
Level 2 - other significant observable inputs (including quoted prices for similar investments, interest rates, prepayment speeds, etc.)
Level 3 - unobservable inputs (including the Fund's own assumptions based on the best information available)
Valuation techniques used to value each Fund's investments by major category are as follows:
Equity securities, including restricted securities, for which market quotations are readily available, are valued at the last reported sale price or official closing price as reported by a third party pricing vendor on the primary market or exchange on which they are traded and are categorized as Level 1 in the hierarchy. In the event there were no sales during the day or closing prices are not available, securities are valued at the last quoted bid price or may be valued using the last available price and are generally categorized as Level 2 in the hierarchy. For foreign equity securities, when significant market or security specific events arise, comparisons to the valuation of American Depositary Receipts (ADRs), futures contracts, Exchange-Traded Funds (ETFs) and certain indexes as well as quoted prices for similar securities are used and are categorized as Level 2 in the
Annual Report
Notes to Financial Statements - continued
3. Significant Accounting Policies - continued
Investment Valuation - continued
hierarchy. Utilizing these techniques may result in transfers between Level 1 and Level 2. For restricted equity securities and private placements where observable inputs are limited, assumptions about market activity and risk are used and these securities are generally categorized as Level 3 in the hierarchy.
Debt securities, including restricted securities, are valued based on evaluated prices received from third party pricing vendors or from brokers who make markets in such securities. For U.S. government and government agency obligations, pricing vendors utilize matrix pricing which considers yield or price of bonds of comparable quality, coupon, maturity and type as well as broker-supplied prices. When independent prices are unavailable or unreliable, debt securities may be valued utilizing pricing methodologies which consider similar factors that would be used by third party pricing vendors. Debt securities are generally categorized as Level 2 in the hierarchy but may be Level 3 depending on the circumstances.
Futures contracts are valued at the settlement price established each day by the board of trade or exchange on which they are traded and are categorized as Level 1 in the hierarchy. Investments in open-end mutual funds, including the Fidelity Central Funds, are valued at their closing net asset value (NAV) each business day and are categorized as Level 1 in the hierarchy.
Changes in valuation techniques may result in transfers in or out of an assigned level within the disclosure hierarchy. The aggregate value of investments by input level, as of January 31, 2013, is included at the end of each Fund's Schedule of Investments.
Foreign Currency. The Funds may use foreign currency contracts to facilitate transactions in foreign-denominated securities. Gains and losses from these transactions may arise from changes in the value of the foreign currency or if the counterparties do not perform under the contracts' terms.
Foreign-denominated assets, including investment securities, and liabilities are translated into U.S. dollars at the exchange rates at period end. Purchases and sales of investment securities, income and dividends received and expenses denominated in foreign currencies are translated into U.S. dollars at the exchange rate in effect on the transaction date.
The effects of exchange rate fluctuations on investments are included with the net realized and unrealized gain (loss) on investment securities. Other foreign currency transactions resulting in realized and unrealized gain (loss) are disclosed separately.
Investment Transactions and Income. For financial reporting purposes, the Funds' investment holdings and NAV include trades executed through the end of the last
Annual Report
3. Significant Accounting Policies - continued
Investment Transactions and Income - continued
business day of the period. The NAV per share for processing shareholder transactions is calculated as of the close of business of the New York Stock Exchange (NYSE), normally 4:00 p.m. Eastern time and includes trades executed through the end of the prior business day. Gains and losses on securities sold are determined on the basis of identified cost and may include proceeds received from litigation. Dividend income is recorded on the ex-dividend date, except for certain dividends from foreign securities where the ex-dividend date may have passed, which are recorded as soon as the Funds are informed of the ex-dividend date. Non-cash dividends included in dividend income, if any, are recorded at the fair market value of the securities received. Distributions received on securities that represent a return of capital or capital gain are recorded as a reduction of cost of investments and/or as a realized gain. The Funds estimate the components of distributions received that may be considered return of capital distributions or capital gain distributions. Interest income and distributions from the Fidelity Central Funds are accrued as earned. Interest income includes coupon interest and amortization of premium and accretion of discount on debt securities. Investment income is recorded net of foreign taxes withheld where recovery of such taxes is uncertain.
Expenses. Expenses directly attributable to a fund are charged to that fund. Expenses attributable to more than one fund are allocated among the respective funds on the basis of relative net assets or other appropriate methods. Expense estimates are accrued in the period to which they relate and adjustments are made when actual amounts are known.
Income Tax Information and Distributions to Shareholders. Each year, each Fund intends to qualify as a regulated investment company under Subchapter M of the Internal Revenue Code, including distributing substantially all of its taxable income and realized gains. As a result, no provision for income taxes is required. As of January 31, 2013, each Fund did not have any unrecognized tax benefits in the financial statements; nor is each Fund aware of any tax positions for which it is reasonably possible that the total amounts of unrecognized tax benefits will significantly change in the next twelve months. Each Fund files a U.S. federal tax return, in addition to state and local tax returns as required. A fund's federal income tax returns are subject to examination by the Internal Revenue Service (IRS) for a period of three fiscal years after they are filed. State and local tax returns may be subject to examination for an additional fiscal year depending on the jurisdiction. Foreign taxes are provided for based on each Fund's understanding of the tax rules and rates that exist in the foreign markets in which it invests.
Distributions are declared and recorded on the ex-dividend date. Income dividends and capital gain distributions are declared separately for each class. Income and capital gain
Annual Report
Notes to Financial Statements - continued
3. Significant Accounting Policies - continued
Income Tax Information and Distributions to Shareholders - continued
distributions are determined in accordance with income tax regulations, which may differ from GAAP.
Capital accounts within the financial statements are adjusted for permanent book-tax differences. These adjustments have no impact on net assets or the results of operations. Temporary book-tax differences will reverse in a subsequent period.
Book-tax differences are primarily due to futures contracts, foreign currency transactions, passive foreign investment companies (PFIC), market discount, partnerships, redemptions in-kind and losses deferred due to wash sales and excise tax regulations.
The federal tax cost of investment securities and unrealized appreciation (depreciation) as of period end were as follows for each Fund:
| Tax cost | Gross unrealized
appreciation | Gross unrealized
depreciation | Net unrealized
appreciation
(depreciation) on
securities and
other investments |
Fidelity Series Large Cap Value Fund | $ 6,235,291,653 | $ 984,552,481 | $ (149,539,912) | $ 835,012,569 |
Fidelity Series All-Sector Equity Fund | 8,533,075,906 | 1,364,224,618 | (61,873,105) | 1,302,351,513 |
The tax-based components of distributable earnings as of period end were as follows for each Fund:
| Undistributed
ordinary
income | Undistributed long-term
capital gain | Net unrealized
appreciation
(depreciation) |
Fidelity Series Large Cap Value Fund | $ 1,813,078 | $ 404,657,503 | $ 835,013,897 |
Fidelity Series All-Sector Equity Fund | 5,334,658 | 259,671,049 | 1,302,329,269 |
The tax character of distributions paid was as follows:
January 31, 2013 | Ordinary
Income | Long-term
Capital Gains | Total |
Fidelity Series Large Cap Value Fund | $ 223,687,239 | $ 6,697,468 | $ 230,384,707 |
Fidelity Series All-Sector Equity Fund | 157,359,845 | 657,260,030 | 814,619,875 |
January 31, 2012 | Ordinary
Income | Long-term
Capital Gains | Total |
Fidelity Series Large Cap Value Fund | $ 309,649,849 | $ 687,492,424 | $ 997,142,273 |
Fidelity Series All-Sector Equity Fund | 191,063,365 | 812,763,336 | 1,003,826,701 |
Annual Report
3. Significant Accounting Policies - continued
Restricted Securities. The Funds may invest in securities that are subject to legal or contractual restrictions on resale. These securities generally may be resold in transactions exempt from registration or to the public if the securities are registered. Disposal of these securities may involve time-consuming negotiations and expense, and prompt sale at an acceptable price may be difficult. Information regarding restricted securities is included at the end of each applicable Fund's Schedule of Investments.
New Accounting Pronouncement. In December 2011, the Financial Accounting Standards Board issued Accounting Standard Update No. 2011-11, Disclosures about Offsetting Assets and Liabilities. The update creates new disclosure requirements requiring entities to disclose both gross and net information for derivatives and other financial instruments that are either offset in the Statement of Assets and Liabilities or subject to an enforceable master netting arrangement or similar agreement. The disclosure requirements are effective for annual reporting periods beginning on or after January 1, 2013, and interim periods within those annual periods. Management is currently evaluating the impact of the update's adoption on the Fund's financial statement disclosures.
4. Derivative Instruments.
Risk Exposures and the Use of Derivative Instruments. The Funds' investment objective allows the Funds to enter into various types of derivative contracts, including futures contracts. Derivatives are investments whose value is primarily derived from underlying assets, indices or reference rates and may be transacted on an exchange or over-the-counter (OTC). Derivatives may involve a future commitment to buy or sell a specified asset based on specified terms, to exchange future cash flows at periodic intervals based on a notional principal amount, or for one party to make one or more payments upon the occurrence of specified events in exchange for periodic payments from the other party.
The Funds used derivatives to increase returns and to manage exposure to certain risks as defined below. The success of any strategy involving derivatives depends on analysis of numerous economic factors, and if the strategies for investment do not work as intended, the Funds may not achieve their objectives.
The Funds' use of derivatives increased or decreased their exposure to the following risk:
Equity Risk | Equity risk relates to the fluctuations in the value of financial instruments as a result of changes in market prices (other than those arising from interest rate risk or foreign exchange risk), whether caused by factors specific to an individual investment, its issuer, or all factors affecting all instruments traded in a market or market segment. |
Annual Report
Notes to Financial Statements - continued
4. Derivative Instruments - continued
Risk Exposures and the Use of Derivative Instruments - continued
The Funds are also exposed to additional risks from investing in derivatives, such as liquidity risk and counterparty credit risk. Liquidity risk is the risk that the Funds will be unable to close out the derivative in the open market in a timely manner. Counterparty credit risk is the risk that the counterparty will not be able to fulfill its obligation to the Funds. Counterparty credit risk related to exchange-traded futures contracts is mitigated by the protection provided by the exchange on which they trade.
Investing in derivatives may involve greater risks than investing in the underlying assets directly and, to varying degrees, may involve risk of loss in excess of any initial investment and collateral received and amounts recognized in the Statement of Assets and Liabilities. In addition, there may be the risk that the change in value of the derivative contract does not correspond to the change in value of the underlying instrument.
Net Realized Gain (Loss) and Change in Net Unrealized Appreciation (Depreciation) on Derivatives. The table below, which reflects the impacts of derivatives on the financial performance of the Funds, summarizes the net realized gain (loss) and change in net unrealized appreciation (depreciation) for derivatives during the period as presented in the Statement of Operations.
Primary Risk Exposure / Derivative Type | Net Realized Gain
(Loss) | Change in Net
Unrealized
Appreciation
(Depreciation) |
Fidelity Series Large Cap Value Fund | | |
Equity Risk | | |
Futures Contracts | $ 11,920,274 | $ - |
Fidelity Series All-Sector Equity Fund | | |
Equity Risk | | |
Futures Contracts | $ 10,092,463 | $ (2,135,960) |
Futures Contracts. A futures contract is an agreement between two parties to buy or sell a specified underlying instrument for a fixed price at a specified future date. The Funds used futures contracts to manage their exposure to the stock market.
Upon entering into a futures contract, a fund is required to deposit either cash or securities (initial margin) with a clearing broker in an amount equal to a certain percentage of the face value of the contract. Futures contracts are marked-to-market daily and subsequent payments (variation margin) are made or received by a fund depending on the daily fluctuations in the value of the futures contracts and are recorded as unrealized appreciation or (depreciation). This receivable and/or payable, if any, is included in daily variation margin on futures contracts in the Statement of Assets and Liabilities. Realized gain or (loss) is recorded upon the expiration or closing of a futures contract.
Annual Report
4. Derivative Instruments - continued
Futures Contracts - continued
Any open futures contracts at period end are presented in the Schedule of Investments under the caption "Futures Contracts." The underlying face amount at value reflects each contract's exposure to the underlying instrument or index at period end and is representative of activity for the period. Securities deposited to meet initial margin requirements are identified in the Schedule of Investments.
5. Purchases and Sales of Investments.
Purchases and sales of securities, other than short-term securities, are noted in the table below.
| Purchases ($) | Sales ($) |
Fidelity Series Large Cap Value Fund | 13,544,766,768 | 18,427,447,412 |
Fidelity Series All-Sector Equity Fund | 14,752,018,683 | 18,157,558,361 |
6. Fees and Other Transactions with Affiliates.
Management Fee. FMR and its affiliates provide the Funds with investment management related services for which the Funds pay a monthly management fee. The management fee is the sum of an individual fund fee rate and an annualized group fee rate. The individual fund fee rate is applied to each Fund's average net assets. The group fee rate is based upon the average net assets of all the mutual funds advised by FMR. The group fee rate decreases as assets under management increase and increases as assets under management decrease. In addition, the management fee for Fidelity Series Large Cap Value Fund and Fidelity Series All-Sector Equity Fund is subject to a performance adjustment (up to a maximum ± .20% of each applicable Fund's average net assets over a 36 month performance period). The upward or downward adjustment to the management fee is based on each applicable Fund's relative investment performance of the retail class as compared to an appropriate benchmark index. For the period, each Fund's annual management fee rate expressed as a percentage of each Fund's average net assets, including the performance adjustment, if applicable was as follows:
| Individual Rate | Group Rate | Total |
Fidelity Series Large Cap Value Fund | .30% | .26% | .38% |
Fidelity Series All-Sector Equity Fund | .30% | .26% | .51% |
Transfer Agent Fees. Fidelity Investments Institutional Operations Company, Inc. (FIIOC), an affiliate of FMR, is the transfer, dividend disbursing and shareholder servicing agent for each class of the Funds. FIIOC receives account fees and asset-based fees that vary according to the account size and type of account of the shareholders of the
Annual Report
Notes to Financial Statements - continued
6. Fees and Other Transactions with Affiliates - continued
Transfer Agent Fees - continued
respective classes of each Fund except for Class F. FIIOC receives no fees for providing transfer agency services to Class F. FIIOC pays for typesetting, printing and mailing of shareholder reports, except proxy statements. For the period, transfer agent fees for each class were as follows:
| Amount | % of
Average
Net Assets |
Fidelity Series Large Cap Value Fund | $ 12,208,942 | .20 |
Fidelity Series All-Sector Equity Fund | 13,958,456 | .20 |
Accounting and Security Lending Fees. Fidelity Service Company, Inc. (FSC), an affiliate of FMR, maintains each Fund's accounting records. The accounting fee is based on the level of average net assets for each month. Under a separate contract, FSC administers the security lending program. The security lending fee is based on the number and duration of lending transactions.
Brokerage Commissions. Certain Funds placed a portion of their portfolio transactions with brokerage firms which are affiliates of the investment adviser. The commissions paid to these affiliated firms were as follows:
| Amount |
Fidelity Series Large Cap Value Fund | $ 490,922 |
Fidelity Series All-Sector Equity Fund | 516,154 |
Redemptions In-Kind. During the period, 305,674,327 shares of the Fidelity Series Large Cap Value Fund held by affiliated entities were redeemed for cash and securities with a value of $3,489,151,502. The net realized gain of $696,707,692 on securities delivered through in-kind redemptions is included in the accompanying Statement of Operations. The amount of in-kind redemptions is included in share transactions in the accompanying Statement of Changes in Net Assets as well as Note 11: Share Transactions. Fidelity Series Large Cap Value Fund recognized no gain or loss for federal income tax purposes. In addition, 338,378,744 shares of the Fidelity Series All-Sector Equity Fund held by affiliated entities were redeemed for cash and securities with a value of $4,412,401,540. The net realized gain of $1,028,917,514 on securities delivered through in-kind redemptions is included in the accompanying Statement of Operations. The amount of in-kind redemptions is included in share transactions in the accompanying Statement of Changes in Net Assets as well as Note 11: Share Transactions. Fidelity Series All-Sector Equity Fund recognized no gain or loss for federal income tax purposes.
Annual Report
7. Committed Line of Credit.
Certain Funds participate with other funds managed by FMR or an affiliate in a $4.25 billion credit facility (the "line of credit") to be utilized for temporary or emergency purposes to fund shareholder redemptions or for other short-term liquidity purposes. The participating funds have agreed to pay commitment fees on their pro-rata portion of the line of credit, which are reflected in Miscellaneous expenses on the Statement of Operations, and are as follows:
Fidelity Series Large Cap Value Fund | $ 28,963 |
Fidelity Series All-Sector Equity Fund | 32,792 |
During the period, there were no borrowings on this line of credit.
8. Security Lending.
Certain Funds lend portfolio securities through a lending agent from time to time in order to earn additional income. For equity securities, a lending agent is used and may loan securities to certain qualified borrowers, including Fidelity Capital Markets (FCM), a broker-dealer affiliated with the Funds. On the settlement date of the loan, each applicable Fund receives collateral (in the form of U.S. Treasury obligations, letters of credit and/or cash) against the loaned securities and maintains collateral in an amount not less than 100% of the market value of the loaned securities during the period of the loan. The market value of the loaned securities is determined at the close of business of the Funds and any additional required collateral is delivered to the Funds on the next business day. If the borrower defaults on its obligation to return the securities loaned because of insolvency or other reasons, a fund could experience delays and costs in recovering the securities loaned or in gaining access to the collateral. Any cash collateral received is invested in the Fidelity Securities Lending Cash Central Fund. The value of loaned securities and cash collateral at period end are disclosed on each applicable Fund's Statement of Assets and Liabilities. Security lending income represents the income earned on investing cash collateral, less rebates paid to borrowers and any lending agent fees associated with the loan, plus any premium payments received for lending certain types of securities. Security lending income is presented on each applicable Fund's Statement of Operations as a component of income from Fidelity Central Funds. Security lending activity as of and during the period was as follows:
| Total Security
Lending Income | Security Lending
Income From Securities
Loaned to FCM | Value of Securities
Loaned to FCM at
Period End |
Fidelity Series Large Cap Value Fund | $ 1,892,610 | $ 575,052 | $ 21,434,184 |
Fidelity Series All-Sector Equity Fund | $ 1,043,451 | $ 3,142 | $ - |
Annual Report
Notes to Financial Statements - continued
9. Expense Reductions.
Many of the brokers with whom FMR places trades on behalf of certain Funds provided services to these Funds in addition to trade execution. These services included payments of expenses on behalf of each applicable Fund. In addition, through arrangements with each applicable Fund's custodian, credits realized as a result of uninvested cash balances were used to reduce the Fund's expenses. All of the applicable expense reductions are noted in the table below.
| Brokerage Service
reduction | Custody
expense
reduction |
Fidelity Series Large Cap Value Fund | $ 2,491,134 | $ 127 |
Fidelity Series All-Sector Equity Fund | 1,992,332 | 100 |
10. Distributions to Shareholders.
Distributions to shareholders of each class were as follows:
Years ended January 31, | 2013 | 2012 |
Fidelity Series Large Cap Value Fund | | |
From net investment income | | |
Series Large Cap Value | $ 112,830,391 | $ 108,393,071 |
Class F | 110,856,848 | 60,241,309 |
Total | $ 223,687,239 | $ 168,634,380 |
From net realized gain | | |
Series Large Cap Value | $ 3,548,126 | $ 592,235,098 |
Class F | 3,149,342 | 236,272,795 |
Total | $ 6,697,468 | $ 828,507,893 |
Fidelity Series All-Sector Equity Fund | | |
From net investment income | | |
Series All-Sector Equity | $ 80,702,951 | $ 62,319,226 |
Class F | 76,656,894 | 38,272,160 |
Total | $ 157,359,845 | $ 100,591,386 |
From net realized gain | | |
Series All-Sector Equity | $ 362,179,097 | $ 634,348,109 |
Class F | 295,080,933 | 268,887,206 |
Total | $ 657,260,030 | $ 903,235,315 |
Annual Report
11. Share Transactions.
Transactions for each class of shares were as follows:
| Shares | Dollars |
Years ended
January 31, | 2013 | 2012 | 2013 | 2012 |
Fidelity Series Large Cap Value Fund | | | | |
Series Large Cap Value | | | | |
Shares sold | 49,533,288 | 74,784,511 | $ 543,508,101 | $ 833,802,569 |
Reinvestment of distributions | 10,428,182 | 65,566,961 | 116,378,517 | 700,628,169 |
Shares redeemed | (382,691,344)(a) | (198,370,255) | (4,339,373,298)(a) | (2,184,624,803) |
Net increase (decrease) | (322,729,874) | (58,018,783) | $ (3,679,486,680) | $ (650,194,065) |
Class F | | | | |
Shares sold | 136,305,797 | 184,985,420 | $ 1,502,438,190 | $ 2,017,097,287 |
Reinvestment of distributions | 10,224,770 | 28,372,486 | 114,006,190 | 296,514,104 |
Shares redeemed | (230,847,101)(a) | (29,458,031) | (2,639,499,042)(a) | (330,166,209) |
Net increase (decrease) | (84,316,534) | 183,899,875 | $ (1,023,054,662) | $ 1,983,445,182 |
Fidelity Series All-Sector Equity Fund | | | | |
Series All-Sector Equity | | | | |
Shares sold | 77,659,097 | 73,617,124 | $ 960,279,546 | $ 905,741,088 |
Reinvestment of distributions | 36,937,619 | 59,278,225 | 442,882,048 | 696,667,335 |
Shares redeemed | (314,519,747)(a) | (200,470,026) | (4,035,138,002)(a) | (2,441,040,063) |
Net increase (decrease) | (199,923,031) | (67,574,677) | $ (2,631,976,408) | $ (838,631,640) |
Class F | | | | |
Shares sold | 164,922,173 | 182,988,272 | $ 2,056,892,808 | $ 2,210,442,127 |
Reinvestment of distributions | 31,029,869 | 26,555,861 | 371,737,827 | 307,159,366 |
Shares redeemed | (199,902,700)(a) | (30,434,525) | (2,592,723,440)(a) | (376,723,808) |
Net increase (decrease) | (3,950,658) | 179,109,608 | $ (164,092,805) | $ 2,140,877,685 |
(a) Amount includes in-kind redemptions (see Note 6: Redemptions In-Kind).
Annual Report
Notes to Financial Statements - continued
12. Other.
The Funds' organizational documents provide former and current trustees and officers with a limited indemnification against liabilities arising in connection with the performance of their duties to the Funds. In the normal course of business, the Funds may also enter into contracts that provide general indemnifications. The Funds' maximum exposure under these arrangements is unknown as this would be dependent on future claims that may be made against the Funds. The risk of material loss from such claims is considered remote.
At the end of the period, mutual funds managed by FMR or an FMR affiliate were the owners of record of all of the outstanding shares of the Funds.
Annual Report
To the Trustees of Fidelity Devonshire Trust and the Shareholders of Fidelity Series Large Cap Value Fund and Fidelity Series All-Sector Equity Fund:
We have audited the accompanying statements of assets and liabilities of Fidelity Series Large Cap Value Fund and Fidelity Series All-Sector Equity Fund (the Funds), funds of Fidelity Devonshire Trust, including the schedules of investments, as of January 31, 2013, and the related statements of operations for the year then ended, the statements of changes in net assets for each of the two years in the period then ended, and the financial highlights for each of the periods presented. These financial statements and financial highlights are the responsibility of the Funds' management. Our responsibility is to express an opinion on these financial statements and financial highlights based on our audits.
We conducted our audits in accordance with the standards of the Public Company Accounting Oversight Board (United States). Those standards require that we plan and perform the audit to obtain reasonable assurance about whether the financial statements and financial highlights are free of material misstatement. The Funds are not required to have, nor were we engaged to perform, an audit of its internal control over financial reporting. Our audits included consideration of internal control over financial reporting as a basis for designing audit procedures that are appropriate in the circumstances, but not for the purpose of expressing an opinion on the effectiveness of the Funds' internal control over financial reporting. Accordingly, we express no such opinion. An audit also includes examining, on a test basis, evidence supporting the amounts and disclosures in the financial statements, assessing the accounting principles used and significant estimates made by management, as well as evaluating the overall financial statement presentation. Our procedures included confirmation of securities owned as of January 31, 2013, by correspondence with the custodians and brokers; where replies were not received from brokers, we performed other auditing procedures. We believe that our audits provide a reasonable basis for our opinion.
In our opinion, the financial statements and financial highlights referred to above present fairly, in all material respects, the financial positions of Fidelity Series Large Cap Value Fund and Fidelity Series All-Sector Equity Fund as of January 31, 2013, the results of their operations for the year then ended, the changes in their net assets for each of the two years in the period then ended, and their financial highlights for each of the periods presented, in conformity with accounting principles generally accepted in the United States of America.
DELOITTE & TOUCHE LLP
Boston, Massachusetts
March 13, 2013
Annual Report
The Trustees, Members of the Advisory Board, and executive officers of the trust and funds, as applicable, are listed below. The Board of Trustees governs each fund and is responsible for protecting the interests of shareholders. The Trustees are experienced executives who meet periodically throughout the year to oversee each fund's activities, review contractual arrangements with companies that provide services to each fund, oversee management of the risks associated with such activities and contractual arrangements, and review each fund's performance. Except for James C. Curvey, each of the Trustees oversees 234 Fidelity funds. Mr. Curvey oversees 453 Fidelity funds.
The Trustees hold office without limit in time except that (a) any Trustee may resign; (b) any Trustee may be removed by written instrument, signed by at least two-thirds of the number of Trustees prior to such removal; (c) any Trustee who requests to be retired or who has become incapacitated by illness or injury may be retired by written instrument signed by a majority of the other Trustees; and (d) any Trustee may be removed at any special meeting of shareholders by a two-thirds vote of the outstanding voting securities of the trust. Each Trustee who is not an interested person (as defined in the 1940 Act) (Independent Trustee), shall retire not later than the last day of the calendar year in which his or her 75th birthday occurs. The Independent Trustees may waive this mandatory retirement age policy with respect to individual Trustees. The executive officers and Advisory Board Members hold office without limit in time, except that any officer and Advisory Board Member may resign or may be removed by a vote of a majority of the Trustees at any regular meeting or any special meeting of the Trustees. Except as indicated, each individual has held the office shown or other offices in the same company for the past five years.
Experience, Skills, Attributes, and Qualifications of the Funds' Trustees. The Governance and Nominating Committee has adopted a statement of policy that describes the experience, qualifications, attributes, and skills that are necessary and desirable for potential Independent Trustee candidates (Statement of Policy). The Board believes that each Trustee satisfied at the time he or she was initially elected or appointed a Trustee, and continues to satisfy, the standards contemplated by the Statement of Policy. The Governance and Nominating Committee also engages professional search firms to help identify potential Independent Trustee candidates who have the experience, qualifications, attributes, and skills consistent with the Statement of Policy. From time to time, additional criteria based on the composition and skills of the current Independent Trustees, as well as experience or skills that may be appropriate in light of future changes to board composition, business conditions, and regulatory or other developments, have also been considered by the professional search firms and the Governance and Nominating Committee. In addition, the Board takes into account the Trustees' commitment and participation in Board and committee meetings, as well as their leadership of standing and ad hoc committees throughout their tenure.
In determining that a particular Trustee was and continues to be qualified to serve as a Trustee, the Board has considered a variety of criteria, none of which, in isolation, was controlling. The Board believes that, collectively, the Trustees have balanced and diverse experience, qualifications, attributes, and skills, which allow the Board to operate effectively in governing each fund and protecting the interests of shareholders. Information about the specific experience, skills, attributes, and qualifications of each Trustee, which in each case led to the Board's conclusion that the Trustee should serve (or continue to serve) as a trustee of the funds, is provided below.
Annual Report
Trustees and Officers - continued
Board Structure and Oversight Function. James C. Curvey is an interested person (as defined in the 1940 Act) and currently serves as Chairman. The Trustees have determined that an interested Chairman is appropriate and benefits shareholders because an interested Chairman has a personal and professional stake in the quality and continuity of services provided to the funds. Independent Trustees exercise their informed business judgment to appoint an individual of their choosing to serve as Chairman, regardless of whether the Trustee happens to be independent or a member of management. The Independent Trustees have determined that they can act independently and effectively without having an Independent Trustee serve as Chairman and that a key structural component for assuring that they are in a position to do so is for the Independent Trustees to constitute a substantial majority for the Board. The Independent Trustees also regularly meet in executive session. Ned C. Lautenbach serves as Chairman of the Independent Trustees and as such (i) acts as a liaison between the Independent Trustees and management with respect to matters important to the Independent Trustees and (ii) with management prepares agendas for Board meetings.
Fidelity funds are overseen by different Boards of Trustees. The funds' Board oversees Fidelity's equity and high income funds and another Board oversees Fidelity's investment-grade bond, money market, and asset allocation funds. The asset allocation funds may invest in Fidelity funds overseen by the funds' Board. The use of separate Boards, each with its own committee structure, allows the Trustees of each group of Fidelity funds to focus on the unique issues of the funds they oversee, including common research, investment, and operational issues. On occasion, the separate Boards establish joint committees to address issues of overlapping consequences for the Fidelity funds overseen by each Board.
The Trustees operate using a system of committees to facilitate the timely and efficient consideration of all matters of importance to the Trustees, each fund, and fund shareholders and to facilitate compliance with legal and regulatory requirements and oversight of the funds' activities and associated risks. The Board, acting through its committees, has charged FMR and its affiliates with (i) identifying events or circumstances the occurrence of which could have demonstrably adverse effects on the funds' business and/or reputation; (ii) implementing processes and controls to lessen the possibility that such events or circumstances occur or to mitigate the effects of such events or circumstances if they do occur; and (iii) creating and maintaining a system designed to evaluate continuously business and market conditions in order to facilitate the identification and implementation processes described in (i) and (ii) above. Because the day-to-day operations and activities of the funds are carried out by or through FMR, its affiliates and other service providers, the funds' exposure to risks is mitigated but not eliminated by the processes overseen by the Trustees. While each of the Board's committees has responsibility for overseeing different aspects of the funds' activities, oversight is exercised primarily through the Operations, Audit, and Compliance Committees. In addition, the Independent Trustees have worked with FMR to enhance the Board's oversight of investment and financial risks, legal and regulatory risks, technology risks, and operational risks, including the development of additional risk reporting to the Board. For example, a working group comprised of Independent Trustees and FMR has worked and continues to work to review the Fidelity funds' valuation-related activities, reporting and risk management. Appropriate personnel, including but not limited to the funds' Chief Compliance Officer (CCO), FMR's internal auditor, the independent accountants, the funds' Treasurer and portfolio management personnel, make periodic reports to the Board's committees, as appropriate, including an annual review of FMR's risk management program for the Fidelity funds. The responsibilities of each standing committee, including their oversight responsibilities, are described further under "Standing Committees of the Funds' Trustees."
Annual Report
The funds' Statement of Additional Information (SAI) includes more information about the Trustees. To request a free copy, call Fidelity at 1-800-544-8544 for Fidelity Series All-Sector Equity Fund and Fidelity Series Large Cap Value Fund or 1-800-835-5092 for Class F.
Interested Trustees*:
Correspondence intended for each Trustee who is an interested person may be sent to Fidelity Investments, 245 Summer Street, Boston, Massachusetts 02210.
Name, Age; Principal Occupations and Other Relevant Experience+ |
James C. Curvey (77) |
| Year of Election or Appointment: 2007 Mr. Curvey is Trustee and Chairman of the Board of Trustees of certain Trusts. Mr. Curvey also serves as Trustee (2007-present) of other investment companies advised by FMR. Mr. Curvey is a Director of Fidelity Investments Money Management, Inc. (2009-present), Director of Fidelity Research & Analysis Co. (2009-present) and Director of FMR and FMR Co., Inc. (2007-present). Mr. Curvey is also Vice Chairman (2007-present) and Director of FMR LLC. In addition, Mr. Curvey serves as an Overseer for the Boston Symphony Orchestra and a member of the Trustees of Villanova University. Previously, Mr. Curvey was the Vice Chairman (2006-2007) and Director (2000-2007) of FMR Corp. |
Ronald P. O'Hanley (55) |
| Year of Election or Appointment: 2011 Mr. O'Hanley is Director of FMR Co., Inc. (2010-present), Director of Fidelity Investments Money Management, Inc. (2010-present), Director of Fidelity Research & Analysis Company (2010-present), President of Fidelity Asset Management and Corporate Services and a member of Fidelity's Executive Committee (2010-present). Previously, Mr. O'Hanley served as President and Chief Executive Officer of BNY Mellon Asset Management (2007-2010). Mr. O'Hanley also served as Vice Chairman of Bank New York Mellon Corp. and a member of that firm's Executive Committee. Prior to the 2007 merger of The Bank of New York and Mellon Financial Corporation, he was Vice Chairman of Mellon Financial Corporation and President and Chief Executive Officer of Mellon Asset Management. He joined Mellon in February 1997. Mr. O'Hanley currently serves as Chairman of the Boston Public Library Foundation Board of Directors and sits on the Board of Directors of Beth Israel Deaconess Medical Center, the Board of Trustees of the Marine Biological Laboratory and the Advisory Board of the Maxwell School of Citizenship and Public Administration at Syracuse University. Mr. O'Hanley also chairs the Council on Asset Management for the Financial Services Roundtable and is a member of the Board of Directors of Institutional Investor's U.S. Institute. |
* Trustees have been determined to be "Interested Trustees" by virtue of, among other things, their affiliation with the trust or various entities under common control with FMR.
+ The information above includes each Trustee's principal occupation during the last five years and other information relating to the experience, attributes, and skills relevant to each Trustee's qualifications to serve as a Trustee, which led to the conclusion that each Trustee should serve as a Trustee for each fund.
Annual Report
Independent Trustees:
Correspondence intended for each Independent Trustee (that is, the Trustees other than the Interested Trustees) may be sent to Fidelity Investments, P.O. Box 55235, Boston, Massachusetts 02205-5235.
Name, Age; Principal Occupations and Other Relevant Experience+ |
Dennis J. Dirks (64) |
| Year of Election or Appointment: 2005 Prior to his retirement in May 2003, Mr. Dirks was Chief Operating Officer and a member of the Board of The Depository Trust & Clearing Corporation (DTCC). He also served as President, Chief Operating Officer, and Board member of The Depository Trust Company (DTC) and President and Board member of the National Securities Clearing Corporation (NSCC). In addition, Mr. Dirks served as Chief Executive Officer and Board member of the Government Securities Clearing Corporation, Chief Executive Officer and Board member of the Mortgage-Backed Securities Clearing Corporation, as a Trustee and a member of the Finance Committee of Manhattan College (2005-2008), and as a Trustee and a member of the Finance Committee of AHRC of Nassau County (2006-2008). Mr. Dirks is a member of the Independent Directors Council (IDC) Governing Council (2010-present) and Board of Directors for The Brookville Center for Children's Services, Inc. (2009-present). |
Alan J. Lacy (59) |
| Year of Election or Appointment: 2008 Mr. Lacy serves as Senior Adviser (2007-present) of Oak Hill Capital Partners, L.P. (private equity). Mr. Lacy also served as Chief Executive Officer (2000-2005) and Vice Chairman (2005-2006) of Sears Holdings Corporation and Sears, Roebuck and Co. (retail). In addition, Mr. Lacy serves as a member of the Board of Directors of Dave & Buster's Entertainment, Inc. (restaurant and entertainment complexes, 2010-present), Earth Fare, Inc. (retail grocery, 2012-present), The Hillman Companies, Inc. (hardware wholesalers, 2010-present), and Bristol-Myers Squibb Company (global pharmaceuticals, 2008-present). Mr. Lacy is a member of the Board of Trustees of The National Parks Conservation Association (2006-present). Previously, Mr. Lacy served as Chairman of the Board of Trustees of the National Parks Conservation Association (2008-2011) and as a member of the Board of Directors for the Western Union Company (global money transfer, 2006-2011). |
Ned C. Lautenbach (68) |
| Year of Election or Appointment: 2000 Mr. Lautenbach is Chairman of the Independent Trustees of the Equity and High Income Funds (2006-present). Mr. Lautenbach currently serves as the Lead Director of the Eaton Corporation Board of Directors (diversified industrial, 1997-present). Mr. Lautenbach is Chairman of the Board of Directors of the Philharmonic Center for the Arts in Naples, Florida (2012-present) and a member of the Council on Foreign Relations (1994-present). Previously, Mr. Lautenbach was a Partner/Advisory Partner at Clayton, Dubilier & Rice, LLC (private equity investment, 1998-2010), as well as a Director of Sony Corporation (2006-2007). |
Joseph Mauriello (68) |
| Year of Election or Appointment: 2008 Prior to his retirement in January 2006, Mr. Mauriello served in numerous senior management positions including Deputy Chairman and Chief Operating Officer (2004-2005), and Vice Chairman of Financial Services (2002-2004) of KPMG LLP US (professional services, 1965-2005). Mr. Mauriello currently serves as a member of the Board of Directors of XL Group plc. (global insurance and re-insurance, 2006-present). Previously, Mr. Mauriello served as a Director of the Hamilton Funds of the Bank of New York (2006-2007) and of Arcadia Resources Inc. (health care services and products, 2007-2012). |
Robert W. Selander (62) |
| Year of Election or Appointment: 2011 Previously, Mr. Selander served as a Member of the Advisory Board of Fidelity's Equity and High Income Funds (2011), Executive Vice Chairman (2010), Chief Executive Officer (2009-2010), and President and Chief Executive Officer (1997-2009) of Mastercard, Inc. |
Cornelia M. Small (68) |
| Year of Election or Appointment: 2005 Ms. Small is a member of the Board of Directors (2009-present) and Chair of the Investment Committee (2010-present) of the Teagle Foundation. Ms. Small also serves on the Investment Committee of the Berkshire Taconic Community Foundation (2008-present). Previously, Ms. Small served as Chairperson (2002-2008) and a member of the Investment Committee and Chairperson (2008-2012) and a member of the Board of Trustees of Smith College. In addition, Ms. Small served as Chief Investment Officer, Director of Global Equity Investments, and a member of the Board of Directors of Scudder, Stevens & Clark and Scudder Kemper Investments. |
William S. Stavropoulos (73) |
| Year of Election or Appointment: 2002 Mr. Stavropoulos is Vice Chairman of the Independent Trustees of the Equity and High Income Funds (2006-present). Mr. Stavropoulos serves as President and Founder of the Michigan Baseball Foundation, the Great Lakes Loons (2007-present). Mr. Stavropoulos is Chairman Emeritus of the Board of Directors of The Dow Chemical Company, where he previously served in numerous senior management positions, including President, CEO (1995-2000; 2002-2004), Chairman of the Executive Committee (2000-2006), and as a member of the Board of Directors (1990-2006). Currently, Mr. Stavropoulos is a Director of Univar Inc. (global distributor of commodity and specialty chemicals, Chairman from 2010-May 2012 and Lead Director from May 2012-present), Teradata Corporation (data warehousing and technology solutions, 2008-present), Maersk Inc. (industrial conglomerate), and Tyco International, Ltd. (multinational manufacturing and services, 2007-present), and a member of the Advisory Board for Metalmark Capital LLC (private equity investment, 2005-present). Mr. Stavropoulos is an operating advisor to Clayton, Dubilier & Rice, LLC (private equity investment). In addition, Mr. Stavropoulos is a member of the University of Notre Dame Advisory Council for the College of Science, a Trustee of the Rollin L. Gerstacker Foundation, and a Director of the Naples Philharmonic Center for the Arts. Previously, Mr. Stavropoulos served as a Director of Chemical Financial Corporation (bank holding company, 1993-2012). |
David M. Thomas (63) |
| Year of Election or Appointment: 2008 Previously, Mr. Thomas served as Executive Chairman (2005-2006) and Chairman and Chief Executive Officer (2000-2005) of IMS Health, Inc. (pharmaceutical and healthcare information solutions), and a Director of Fortune Brands, Inc. (consumer products, 2000-2011). In addition, Mr. Thomas serves as Non-Executive Chairman of the Board of Directors of Fortune Brands Home and Security (home and security products, 2011-present), and as a member of the Board of Directors of Interpublic Group of Companies, Inc. (marketing communication, 2004-present). |
Michael E. Wiley (62) |
| Year of Election or Appointment: 2008 Mr. Wiley also serves as a Director of Asia Pacific Exploration Consolidated (international oil and gas exploration and production, 2008-present). Mr. Wiley serves as a Director of Tesoro Corporation (independent oil refiner and marketer, 2005-present), and a Director of Bill Barrett Corporation (exploration and production, 2005-present). In addition, Mr. Wiley also serves as a Director of Post Oak Bank (privately-held bank, 2004-present). Previously, Mr. Wiley served as a member of the Board of Trustees of the University of Tulsa (2000-2006; 2007-2010), as a Senior Energy Advisor of Katzenbach Partners, LLC (consulting, 2006-2007), as an Advisory Director of Riverstone Holdings (private investment), Chairman, President, and CEO of Baker Hughes, Inc. (oilfield services, 2000-2004), and as Director of Spinnaker Exploration Company (exploration and production, 2001-2005). |
+ The information above includes each Trustee's principal occupation during the last five years and other information relating to the experience, attributes, and skills relevant to each Trustee's qualifications to serve as a Trustee, which led to the conclusion that each Trustee should serve as a Trustee for each fund.
Advisory Board Members and Executive Officers:
Correspondence intended for David A. Rosow and Garnett A. Smith may be sent to Fidelity Investments, P.O. Box 55235, Boston, Massachusetts 02205-5235. Correspondence intended for each executive officer and Peter S. Lynch may be sent to Fidelity Investments, 245 Summer Street, Boston, Massachusetts 02210.
Name, Age; Principal Occupation |
Peter S. Lynch (69) |
| Year of Election or Appointment: 2003 Member of the Advisory Board of Fidelity's Equity and High Income Funds. Mr. Lynch is Vice Chairman and a Director of FMR and FMR Co., Inc. In addition, Mr. Lynch serves as a Trustee of Boston College and as the Chairman of the Inner-City Scholarship Fund. Previously, Mr. Lynch served on the Special Olympics International Board of Directors (1997-2006). |
David A. Rosow (70) |
| Year of Election or Appointment: 2012 Member of the Advisory Board of Fidelity's Equity and High Income Funds. Chairman and Chief Executive Officer of International Golf Group, Inc. (golf course development, 1989-present). Previously, Mr. Rosow served as Chairman and Chief Executive Officer of Rosow & Company, Inc. (private investment company, 1989-2011), a Lead Director of Hudson United Bancorp (2001-2006) and as a Director of TD Banknorth (1996-2006). In addition, Mr. Rosow is a member (2008-present) and President (2009-present) of the Town Council of Palm Beach, Florida. |
Garnett A. Smith (65) |
| Year of Election or Appointment: 2012 Member of the Advisory Board of Fidelity's Equity and High Income Funds. Prior to Mr. Smith's retirement, he served as Chairman and Chief Executive Officer of Inbrand Corp. (manufacturer of personal absorbent products, 1990-1997). He also served as President (1986-1990) of Inbrand Corp. Prior to his employment with Inbrand Corp., he was employed by a retail fabric chain and North Carolina National Bank. In addition, Mr. Smith is a board member of the Jackson Hole Land Trust (2009-present). |
Kenneth B. Robins (43) |
| Year of Election or Appointment: 2008 President and Treasurer of Fidelity's Equity and High Income Funds. Mr. Robins also serves as President and Treasurer (2010-present) and Assistant Treasurer (2009-present) of other Fidelity funds and is an employee of Fidelity Investments (2004-present). Previously, Mr. Robins served as Deputy Treasurer of the Fidelity funds (2005-2008) and Treasurer and Chief Financial Officer of The North Carolina Capital Management Trust: Cash and Term Portfolios (2006-2008). |
Bruce T. Herring (47) |
| Year of Election or Appointment: 2006 Vice President of certain Equity Funds. Mr. Herring also serves as Chief Investment Officer of Fidelity Global Asset Allocation (GAA) (2013-present), Chief Investment Officer and Director of Fidelity Management & Research (U.K.) Inc. (2010-present), Group Chief Investment Officer of FMR, and President of Fidelity Research & Analysis Company (2010-present). Previously, Mr. Herring served as Vice President (2005-2006) and Senior Vice President (2006-2007) of Fidelity Management & Research Company, Vice President of FMR Co., Inc. (2001-2007) and as a portfolio manager for Fidelity U.S. Equity Funds. |
Brian B. Hogan (48) |
| Year of Election or Appointment: 2009 Vice President of Equity and High Income Funds. Mr. Hogan also serves as President of FMR's Equity Division (2009-present). Previously, Mr. Hogan served as Senior Vice President, Equity Research of FMR (2006-2009) and as a portfolio manager. |
Thomas C. Hense (49) |
| Year of Election or Appointment: 2008 or 2010 Vice President of Fidelity's High Income (2008), Small Cap (2008), and Value (2010) Funds. Previously, Mr. Hense served as a portfolio manager for Fidelity's Institutional Money Management Group (Pyramis) (2003-2008). |
Scott C. Goebel (45) |
| Year of Election or Appointment: 2008 Secretary and Chief Legal Officer (CLO) of the Fidelity funds. Mr. Goebel also serves as Secretary of Fidelity Investments Money Management, Inc. (FIMM) (2010-present) and Fidelity Research and Analysis Company (FRAC) (2010-present); Secretary and CLO of The North Carolina Capital Management Trust: Cash and Term Portfolios (2008-present); General Counsel, Secretary, and Senior Vice President of FMR (2008-present) and FMR Co., Inc. (2008-present); employed by FMR LLC or an affiliate (2001-present); Chief Legal Officer of Fidelity Management & Research (Hong Kong) Limited (2008-present) and Assistant Secretary of Fidelity Management & Research (Japan) Inc. (2008-present), and Fidelity Management & Research (U.K.) Inc. (2008-present). Previously, Mr. Goebel served as Assistant Secretary of FIMM (2008-2010), FRAC (2008-2010), and the Funds (2007-2008) and as Vice President and Secretary of Fidelity Distributors Corporation (FDC) (2005-2007). |
William C. Coffey (43) |
| Year of Election or Appointment: 2009 Assistant Secretary of Fidelity's Equity and High Income Funds. Mr. Coffey also serves as Senior Vice President and Deputy General Counsel of FMR LLC (2010-present), and is an employee of Fidelity Investments. Previously, Mr. Coffey served as Vice President and Associate General Counsel of FMR LLC (2005-2009). |
Elizabeth Paige Baumann (44) |
| Year of Election or Appointment: 2012 Anti-Money Laundering (AML) Officer of the Fidelity funds. Ms. Baumann also serves as AML Officer of The North Carolina Capital Management Trust: Cash and Term Portfolios (2012-present), Chief AML Officer of FMR LLC (2012-present), and is an employee of Fidelity Investments. Previously, Ms. Baumann served as Vice President and Deputy Anti-Money Laundering Officer (2007-2012). |
Christine Reynolds (54) |
| Year of Election or Appointment: 2008 Chief Financial Officer of the Fidelity funds. Ms. Reynolds became President of Fidelity Pricing and Cash Management Services (FPCMS) in August 2008. Ms. Reynolds served as Chief Operating Officer of FPCMS (2007-2008). Previously, Ms. Reynolds served as President, Treasurer, and Anti-Money Laundering officer of the Fidelity funds (2004-2007). |
Joseph A. Hanlon (44) |
| Year of Election or Appointment: 2012 Chief Compliance Officer of Fidelity's Equity and High Income Funds. Mr. Hanlon serves as Compliance Officer of FMR, FMR Co., Inc., Fidelity Investments Money Management, Inc. (FIMM), Fidelity Research and Analysis Company (FRAC), Fidelity Management & Research (Japan) Inc., Fidelity Management & Research (U.K.) Inc., Fidelity Management & Research (Hong Kong), and Strategic Advisers, Inc. (2009-present), as Senior Vice President of the Fidelity Asset Management Division (2009-present), and is an employee of Fidelity Investments. |
Joseph F. Zambello (55) |
| Year of Election or Appointment: 2011 Deputy Treasurer of the Fidelity funds. Mr. Zambello is an employee of Fidelity Investments. Previously, Mr. Zambello served as Vice President of FMR's Program Management Group (2009-2011) and Vice President of the Transfer Agent Oversight Group (2005-2009). |
Adrien E. Deberghes (45) |
| Year of Election or Appointment: 2008 Deputy Treasurer of Fidelity's Equity and High Income Funds. Mr. Deberghes also serves as Vice President (2011-present) and Assistant Treasurer (2010-present) of other Fidelity funds, and is an employee of Fidelity Investments (2008-present). Previously, Mr. Deberghes served as Senior Vice President of Mutual Fund Administration at State Street Corporation (2007-2008), Senior Director of Mutual Fund Administration at Investors Bank & Trust (2005-2007), and Director of Finance for Dunkin' Brands (2000-2005). |
Stephen Sadoski (41) |
| Year of Election or Appointment: 2012 Deputy Treasurer of Fidelity's Equity and High Income Funds. Mr. Sadoski also serves as Deputy Treasurer of other Fidelity funds (2013-present) and is an employee of Fidelity Investments (2012-present). Previously, Mr. Sadoski served as Assistant Treasurer of Fidelity's Fixed Income and Asset Allocation Funds (2012-2013), an assistant chief accountant in the Division of Investment Management of the Securities and Exchange Commission (SEC) (2009-2012) and as a senior manager at Deloitte & Touche (1997-2009). |
Stacie Smith (38) |
| Year of Election or Appointment: 2013 Deputy Treasurer of Fidelity's Equity and High Income Funds. Ms. Smith is an employee of Fidelity Investments (2009-present). Previously, Ms. Smith served as Senior Audit Manager of Ernst & Young LLP (1996-2009). |
Stephanie J. Dorsey (43) |
| Year of Election or Appointment: 2010 Assistant Treasurer of Fidelity's Equity and High Income Funds. Ms. Dorsey also serves as President and Treasurer (2013-present) and Assistant Treasurer (2012-present) of other Fidelity funds and is an employee of Fidelity Investments (2008-present). Previously, Ms. Dorsey served as Deputy Treasurer of Fidelity's Fixed Income and Asset Allocation Funds (2008-2013), Treasurer (2004-2008) of the JPMorgan Mutual Funds and Vice President (2004-2008) of JPMorgan Chase Bank. |
John R. Hebble (54) |
| Year of Election or Appointment: 2009 Assistant Treasurer of Fidelity's Equity and High Income Funds. Mr. Hebble also serves as President (2011-present), Treasurer, and Chief Financial Officer of The North Carolina Capital Management Trust: Cash and Term Portfolios (2008-present) and is an employee of Fidelity Investments. Previously, Mr. Hebble served as President and Treasurer of Fidelity's Fixed Income and Asset Allocation Funds (2008-2013). |
Gary W. Ryan (54) |
| Year of Election or Appointment: 2005 Assistant Treasurer of the Fidelity funds. Mr. Ryan is an employee of Fidelity Investments. Previously, Mr. Ryan served as Vice President of Fund Reporting in Fidelity Pricing and Cash Management Services (FPCMS) (1999-2005). |
Jonathan Davis (44) |
| Year of Election or Appointment: 2010 Assistant Treasurer of the Fidelity funds. Mr. Davis is also Assistant Treasurer of Fidelity Rutland Square Trust II and Fidelity Commonwealth Trust II. Mr. Davis is an employee of Fidelity Investments. Previously, Mr. Davis served as Vice President and Associate General Counsel of FMR LLC (2003-2010). |
Annual Report
The Board of Trustees of each fund voted to pay to shareholders of record at the opening of business on record date, the following distributions per share derived from capital gains realized from sales of portfolio securities and dividends derived from net investment income:
Fidelity Series Large
Cap Value Fund | Pay Date | Record Date | Dividends | Capital Gains |
Series Large Cap Value | 03/11/13 | 03/08/13 | $0.006 | $0.818 |
Class F | 03/11/13 | 03/08/13 | $0.007 | $0.818 |
Fidelity Series All-
Sector Equity Fund | Pay Date | Record Date | Dividends | Capital Gains |
Series All-Sector Equity | 03/11/13 | 03/08/13 | $0.008 | $0.332 |
Class F | 03/11/13 | 03/08/13 | $0.009 | $0.332 |
The funds hereby designate as a capital gain dividend the amounts noted below for the taxable year ended January 31, 2013, or, if subsequently determined to be different, the net capital gain of such year.
Fidelity Series Large Cap Value Fund | $411,354,971 |
Fidelity Series All-Sector Equity Fund | $916,931,079 |
A percentage of the dividends distributed during the fiscal year for the following funds qualifies for the dividends-received deduction for corporate shareholders:
Fidelity Series Large Cap Value Fund | December |
Series Large Cap Value | 100% |
Class F | 100% |
Fidelity Series All-Sector Equity Fund | |
Series All-Sector Equity | 100% |
Class F | 100% |
A percentage of the dividends distributed during the fiscal year for the following funds may be taken into account as a dividend for purposes of the maximum rate under section 1(h) (11) of the Internal Revenue Code.
Fidelity Series Large Cap Value Fund | December |
Series Large Cap Value | 100% |
Class F | 100% |
Fidelity Series All-Sector Equity Fund | |
Series All-Sector Equity | 100% |
Class F | 100% |
The fund will notify shareholders in January 2014 of amounts for use in preparing 2013 income tax returns.
Annual Report
Investment Adviser
Fidelity Management & Research Company
Boston, MA
Investment Sub-Advisers
FMR Co., Inc.
Fidelity Management & Research (U.K.) Inc.
Fidelity Management & Research (Hong Kong) Limited
Fidelity Management & Research (Japan) Inc.
General Distributor
Fidelity Distributors Corporation
Smithfield, RI
Transfer and Service Agents
Fidelity Investments Institutional Operations Company, Inc.
Boston, MA
Fidelity Service Company, Inc.
Boston, MA
Custodian
The Northern Trust Company
Chicago, IL
Fidelity Series All-Sector Equity Fund
JPMorgan Chase Bank
New York, NY
Fidelity Series Large Cap Value Fund
(Fidelity Investment logo)(registered trademark)
Corporate Headquarters
245 Summer St., Boston, MA 02210
www.fidelity.com
DLF-ANN-0313
1.873097.104
Fidelity®
Mid Cap Value
Fund
Annual Report
January 31, 2013
(Fidelity Cover Art)
Contents
Performance | (Click Here) | How the fund has done over time. |
Management's Discussion of Fund Performance | (Click Here) | The Portfolio Manager's review of fund performance and strategy. |
Shareholder Expense Example | (Click Here) | An example of shareholder expenses. |
Investment Changes | (Click Here) | A summary of major shifts in the fund's investments over the past six months. |
Investments | (Click Here) | A complete list of the fund's investments with their market values. |
Financial Statements | (Click Here) | Statements of assets and liabilities, operations, and changes in net assets, as well as financial highlights. |
Notes | (Click Here) | Notes to the financial statements. |
Report of Independent Registered Public Accounting Firm | (Click Here) | |
Trustees and Officers | (Click Here) | |
Distributions | (Click Here) | |
To view a fund's proxy voting guidelines and proxy voting record for the 12-month period ended June 30, visit http://www.fidelity.com/proxyvotingresults or visit the Securities and Exchange Commission's (SEC) web site at http://www.sec.gov. You may also call 1-800-544-8544 to request a free copy of the proxy voting guidelines.
Standard & Poor's, S&P and S&P 500 are registered service marks of The McGraw-Hill Companies, Inc. and have been licensed for use by Fidelity Distributors Corporation.
Other third-party marks appearing herein are the property of their respective owners.
All other marks appearing herein are registered or unregistered trademarks or service marks of FMR LLC or an affiliated company. © 2013 FMR LLC. All rights reserved.
This report and the financial statements contained herein are submitted for the general information of the shareholders of the fund. This report is not authorized for distribution to prospective investors in the fund unless preceded or accompanied by an effective prospectus.
A fund files its complete schedule of portfolio holdings with the SEC for the first and third quarters of each fiscal year on Form N-Q. Forms N-Q are available on the SEC's web site at http://www.sec.gov. A fund's Forms N-Q may be reviewed and copied at the SEC's Public Reference Room in Washington, DC. Information regarding the operation of the SEC's Public Reference Room may be obtained by calling 1-800-SEC-0330. For a complete list of a fund's portfolio holdings, view the most recent holdings listing, semiannual report, or annual report on Fidelity's web site at http://www.fidelity.com, http://www.advisor.fidelity.com, or http://www.401k.com, as applicable.
NOT FDIC INSURED • MAY LOSE VALUE • NO BANK GUARANTEE
Neither the fund nor Fidelity Distributors Corporation is a bank.
Annual Report
Average annual total return reflects the change in the value of an investment, assuming reinvestment of the class' distributions from dividend income and capital gains (the profits earned upon the sale of securities that have grown in value, if any) and assuming a constant rate of performance each year. The $10,000 table and the fund's returns do not reflect the deduction of taxes that a shareholder would pay on fund distributions or the redemption of fund shares. During periods of reimbursement by Fidelity, a fund's total return will be greater than it would be had the reimbursement not occurred. How a fund did yesterday is no guarantee of how it will do tomorrow.
Average Annual Total Returns
Periods ended January 31, 2013 | Past 1
year | Past 5
years | Past 10
years |
Fidelity® Mid Cap Value Fund | 23.07% | 6.22% | 10.83% |
$10,000 Over 10 Years
Let's say hypothetically that $10,000 was invested in Fidelity® Mid Cap Value Fund, a class of the fund, on January 31, 2003. The chart shows how the value of your investment would have changed, and also shows how the Russell Midcap® Value Index performed over the same period.
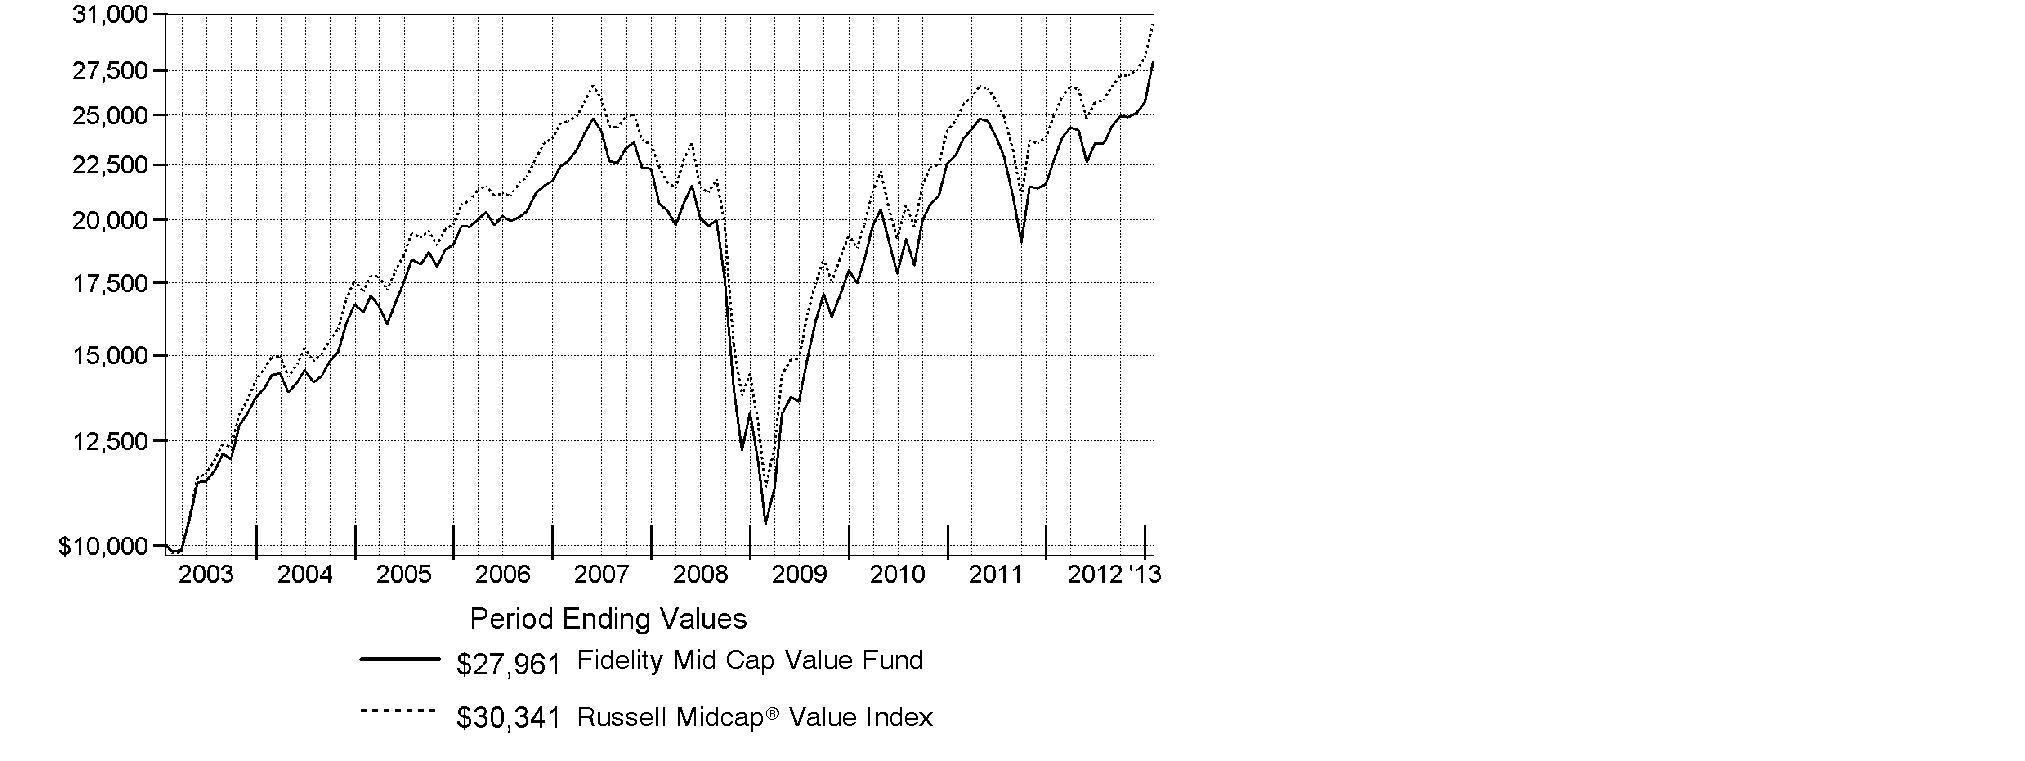
Annual Report
Market Recap: Improvement in the U.S. economy helped lift equity benchmarks to double-digit gains for the year ending January 31, 2013, overcoming moments of volatility driven by sovereign debt woes in Europe, slower economic growth in China and gridlock in Congress. Major U.S. benchmarks hit multiyear highs during the period, encouraged by a rebounding domestic housing market and solid corporate earnings reports. The broad-based S&P 500® Index rose 16.78% for the year, crossing the milestone 1,500 mark near period end. The technology-heavy Nasdaq Composite Index® added 13.13%, and the blue-chip-laden Dow Jones Industrial AverageSM gained 12.75%. Early in the period, stocks rose on positive U.S. economic news and proposed bailouts in Europe. Although fear resurfaced in April and May, equities rebounded in June on central bank stimulus and new life in the housing market. In September, pre-election jitters and the looming "fiscal cliff" of tax hikes and federal spending cuts fueled some profit-taking, followed by a brief post-election sell-off. But stocks proved resilient, as investors continued to pile into riskier assets. Gains were broad-based, with eight of the 10 sectors in the S&P 500® posting double-digit returns. Despite eurozone turmoil, foreign developed-markets stocks rose strongly, with the MSCI® EAFE® Index adding 17.41%.
Comments from Bruce Dirks, Portfolio Manager of Fidelity® Mid Cap Value Fund: For the year, the fund's Retail Class shares returned 23.07%, outpacing the 21.34% gain of the Russell Midcap® Value Index. Strong security selection in financials, energy, consumer discretionary, materials and health care fueled the fund's solid relative return. On the downside, adverse stock picking and industry positioning in information technology, industrials and, to a lesser extent, telecommunication services hampered results. The top individual contributors included hospital operator Community Health Systems, oil refiners Valero Energy and Marathon Petroleum, appliance manufacturer Whirlpool, credit card issuer Discover Financial Services and utility Sempra Energy. The primary individual detractors were semiconductor makers Marvell Technology Group and Advanced Micro Devices - the latter being an out-of-benchmark investment - Timken, a maker of specialty steel products, trucking and logistics provider Con-way and flash memory storage developer SanDisk. Most of the stocks mentioned were sold from the fund during the period.
The views expressed above reflect those of the portfolio manager(s) only through the end of the period as stated on the cover of this report and do not necessarily represent the views of Fidelity or any other person in the Fidelity organization. Any such views are subject to change at any time based upon market or other conditions and Fidelity disclaims any responsibility to update such views. These views may not be relied on as investment advice and, because investment decisions for a Fidelity fund are based on numerous factors, may not be relied on as an indication of trading intent on behalf of any Fidelity fund.
Annual Report
Shareholder Expense Example
As a shareholder of the Fund, you incur two types of costs: (1) transaction costs including sales charges (loads) on purchase payments or redemption proceeds, redemption fees and (2) ongoing costs, including management fees, distribution and/or service (12b-1) fees and other Fund expenses. This Example is intended to help you understand your ongoing costs (in dollars) of investing in the Fund and to compare these costs with the ongoing costs of investing in other mutual funds.
The Example is based on an investment of $1,000 invested at the beginning of the period and held for the entire period (August 1, 2012 to January 31, 2013).
Actual Expenses
The first line of the accompanying table for each class of the Fund provides information about actual account values and actual expenses. You may use the information in this line, together with the amount you invested, to estimate the expenses that you paid over the period. Simply divide your account value by $1,000.00 (for example, an $8,600 account value divided by $1,000.00 = 8.6), then multiply the result by the number in the first line for a class of the Fund under the heading entitled "Expenses Paid During Period" to estimate the expenses you paid on your account during this period. A small balance maintenance fee of $12.00 that is charged once a year may apply for certain accounts with a value of less than $2,000. This fee is not included in the table below. If it was, the estimate of expenses you paid during the period would be higher, and your ending account value lower, by this amount. In addition, the Fund, as a shareholder in the underlying Fidelity Central Funds, will indirectly bear its pro-rata share of the fees and expenses incurred by the underlying Fidelity Central Funds. These fees and expenses are not included in the Fund's annualized expense ratio used to calculate the expense estimate in the table below.
Hypothetical Example for Comparison Purposes
The second line of the accompanying table for each class of the Fund provides information about hypothetical account values and hypothetical expenses based on a Class' actual expense ratio and an assumed rate of return of 5% per year before expenses, which is not the Class' actual return. The hypothetical account values and expenses may not be used to estimate the actual ending account balance or expenses you paid for the period. You may use this information to compare the ongoing costs of investing in the Fund and other funds. To do so, compare this 5% hypothetical example with the 5% hypothetical examples that appear in the shareholder reports of the other funds. A small balance maintenance fee of $12.00 that is charged once a year may apply for certain accounts with a value of less than $2,000. This fee is not included in the table below. If it was, the estimate of expenses you paid during the period would be higher, and your ending account value lower, by this amount. In addition, the Fund, as a shareholder in the underlying Fidelity Central Funds, will indirectly bear its pro-rata share of the fees and expenses incurred by the underlying Fidelity Central Funds. These fees and expenses are not included in the Fund's annualized expense ratio used to calculate the expense estimate in the table below.
Please note that the expenses shown in the table are meant to highlight your ongoing costs only and do not reflect any transaction costs. Therefore, the second line of the table is useful in comparing ongoing costs only, and will not help you determine the relative total costs of owning different funds. In addition, if these transactional costs were included, your costs would have been higher.
Annual Report
Shareholder Expense Example - continued
| Annualized
Expense Ratio | Beginning
Account Value
August 1, 2012 | Ending
Account Value
January 31, 2013 | Expenses Paid
During Period*
August 1, 2012
to January 31, 2013 |
Class A | 1.13% | | | |
Actual | | $ 1,000.00 | $ 1,185.50 | $ 6.21 |
HypotheticalA | | $ 1,000.00 | $ 1,019.46 | $ 5.74 |
Class T | 1.39% | | | |
Actual | | $ 1,000.00 | $ 1,184.60 | $ 7.63 |
HypotheticalA | | $ 1,000.00 | $ 1,018.15 | $ 7.05 |
Class B | 1.88% | | | |
Actual | | $ 1,000.00 | $ 1,181.80 | $ 10.31 |
HypotheticalA | | $ 1,000.00 | $ 1,015.69 | $ 9.53 |
Class C | 1.89% | | | |
Actual | | $ 1,000.00 | $ 1,181.10 | $ 10.36 |
HypotheticalA | | $ 1,000.00 | $ 1,015.63 | $ 9.58 |
Mid Cap Value | .81% | | | |
Actual | | $ 1,000.00 | $ 1,187.60 | $ 4.45 |
HypotheticalA | | $ 1,000.00 | $ 1,021.06 | $ 4.12 |
Institutional Class | .86% | | | |
Actual | | $ 1,000.00 | $ 1,188.00 | $ 4.73 |
HypotheticalA | | $ 1,000.00 | $ 1,020.81 | $ 4.37 |
A 5% return per year before expenses
* Expenses are equal to each Class' annualized expense ratio, multiplied by the average account value over the period, multiplied by 184/366 (to reflect the one-half year period).
Annual Report
Investment Changes (Unaudited)
Top Ten Stocks as of January 31, 2013 |
| % of fund's
net assets | % of fund's net assets
6 months ago |
Valero Energy Corp. | 1.8 | 1.6 |
Marathon Petroleum Corp. | 1.8 | 1.5 |
International Paper Co. | 1.7 | 1.7 |
CIGNA Corp. | 1.6 | 1.1 |
Edison International | 1.6 | 0.0 |
Symantec Corp. | 1.5 | 0.0 |
Fifth Third Bancorp | 1.5 | 1.3 |
Ventas, Inc. | 1.5 | 1.4 |
SunTrust Banks, Inc. | 1.5 | 1.4 |
PPL Corp. | 1.4 | 1.8 |
| 15.9 | |
Top Five Market Sectors as of January 31, 2013 |
| % of fund's
net assets | % of fund's net assets
6 months ago |
Financials | 29.2 | 30.1 |
Industrials | 11.3 | 10.2 |
Information Technology | 10.0 | 10.1 |
Energy | 9.7 | 9.5 |
Utilities | 9.6 | 11.6 |
Asset Allocation (% of fund's net assets) |
As of January 31, 2013* | As of July 31, 2012** |
 | Stocks 98.6% | | | Stocks 99.5% | |
 | Short-Term
Investments and
Net Other Assets
(Liabilities) 1.4% | | | Short-Term
Investments and
Net Other Assets
(Liabilities) 0.5% | |
* Foreign investments | 3.7% | | ** Foreign investments | 5.2% | |

Annual Report
Investments January 31, 2013
Showing Percentage of Net Assets
Common Stocks - 98.6% |
| Shares | | Value |
CONSUMER DISCRETIONARY - 9.2% |
Diversified Consumer Services - 0.8% |
DeVry, Inc. | 223,100 | | $ 5,615,427 |
Household Durables - 2.5% |
Jarden Corp. | 126,200 | | 7,425,608 |
Whirlpool Corp. | 82,500 | | 9,518,850 |
| | 16,944,458 |
Media - 1.1% |
Gannett Co., Inc. | 394,600 | | 7,745,998 |
Multiline Retail - 1.3% |
Macy's, Inc. | 219,000 | | 8,652,690 |
Specialty Retail - 3.5% |
Best Buy Co., Inc. | 199,600 | | 3,245,496 |
Foot Locker, Inc. | 230,600 | | 7,921,110 |
GameStop Corp. Class A (d) | 158,800 | | 3,684,160 |
Staples, Inc. | 691,000 | | 9,314,680 |
| | 24,165,446 |
TOTAL CONSUMER DISCRETIONARY | | 63,124,019 |
CONSUMER STAPLES - 5.4% |
Beverages - 1.0% |
Molson Coors Brewing Co. Class B | 146,100 | | 6,600,798 |
Food Products - 2.8% |
Campbell Soup Co. (d) | 105,800 | | 3,883,918 |
ConAgra Foods, Inc. | 268,100 | | 8,764,189 |
Tyson Foods, Inc. Class A | 303,700 | | 6,717,844 |
| | 19,365,951 |
Household Products - 0.9% |
Energizer Holdings, Inc. | 74,300 | | 6,464,843 |
Tobacco - 0.7% |
Lorillard, Inc. | 128,600 | | 5,024,402 |
TOTAL CONSUMER STAPLES | | 37,455,994 |
ENERGY - 9.7% |
Energy Equipment & Services - 2.4% |
Cameron International Corp. (a) | 126,500 | | 8,008,715 |
Helmerich & Payne, Inc. | 128,100 | | 8,241,954 |
| | 16,250,669 |
Common Stocks - continued |
| Shares | | Value |
ENERGY - continued |
Oil, Gas & Consumable Fuels - 7.3% |
Denbury Resources, Inc. (a) | 473,300 | | $ 8,817,579 |
Hess Corp. | 108,500 | | 7,286,860 |
Marathon Petroleum Corp. | 164,945 | | 12,240,568 |
Murphy Oil Corp. | 161,700 | | 9,624,384 |
Valero Energy Corp. | 282,900 | | 12,371,218 |
| | 50,340,609 |
TOTAL ENERGY | | 66,591,278 |
FINANCIALS - 29.2% |
Capital Markets - 2.8% |
Apollo Global Management LLC Class A | 241,462 | | 5,377,359 |
KKR & Co. LP | 403,700 | | 6,814,456 |
The Blackstone Group LP | 366,300 | | 6,776,550 |
| | 18,968,365 |
Commercial Banks - 7.2% |
Comerica, Inc. | 197,600 | | 6,789,536 |
Fifth Third Bancorp | 639,600 | | 10,419,084 |
FirstMerit Corp. | 419,700 | | 6,392,031 |
Huntington Bancshares, Inc. | 1,171,600 | | 8,154,336 |
KeyCorp | 810,700 | | 7,620,580 |
SunTrust Banks, Inc. | 359,400 | | 10,196,178 |
| | 49,571,745 |
Consumer Finance - 1.2% |
SLM Corp. | 481,700 | | 8,135,913 |
Diversified Financial Services - 1.1% |
The NASDAQ Stock Market, Inc. | 271,300 | | 7,683,216 |
Insurance - 6.1% |
Allied World Assurance Co. Holdings Ltd. | 46,000 | | 3,902,180 |
Everest Re Group Ltd. | 73,800 | | 8,546,778 |
Hartford Financial Services Group, Inc. | 400,400 | | 9,929,920 |
Lincoln National Corp. | 309,800 | | 8,978,004 |
Reinsurance Group of America, Inc. | 81,100 | | 4,654,329 |
Validus Holdings Ltd. | 162,300 | | 5,909,343 |
| | 41,920,554 |
Real Estate Investment Trusts - 9.6% |
American Campus Communities, Inc. | 134,800 | | 6,277,636 |
AvalonBay Communities, Inc. | 69,500 | | 9,020,405 |
Camden Property Trust (SBI) | 101,300 | | 7,029,207 |
Common Stocks - continued |
| Shares | | Value |
FINANCIALS - continued |
Real Estate Investment Trusts - continued |
DDR Corp. | 273,300 | | $ 4,534,047 |
Extra Space Storage, Inc. | 139,300 | | 5,549,712 |
MFA Financial, Inc. | 667,300 | | 5,999,027 |
Ventas, Inc. | 156,000 | | 10,341,240 |
Vornado Realty Trust | 111,000 | | 9,375,060 |
Weyerhaeuser Co. | 271,100 | | 8,165,532 |
| | 66,291,866 |
Real Estate Management & Development - 1.2% |
Jones Lang LaSalle, Inc. | 86,400 | | 7,960,896 |
TOTAL FINANCIALS | | 200,532,555 |
HEALTH CARE - 7.1% |
Health Care Providers & Services - 4.5% |
CIGNA Corp. | 193,200 | | 11,271,288 |
Community Health Systems, Inc. | 173,000 | | 6,631,090 |
McKesson Corp. | 62,900 | | 6,618,967 |
Omnicare, Inc. | 159,800 | | 6,224,210 |
| | 30,745,555 |
Pharmaceuticals - 2.6% |
Actavis, Inc. (a) | 59,800 | | 5,166,122 |
Endo Pharmaceuticals Holdings, Inc. (a) | 241,900 | | 7,658,554 |
Mylan, Inc. (a) | 186,600 | | 5,275,182 |
| | 18,099,858 |
TOTAL HEALTH CARE | | 48,845,413 |
INDUSTRIALS - 11.3% |
Aerospace & Defense - 1.7% |
Alliant Techsystems, Inc. | 109,600 | | 7,093,312 |
Esterline Technologies Corp. (a) | 73,400 | | 4,873,026 |
| | 11,966,338 |
Airlines - 1.1% |
Delta Air Lines, Inc. (a) | 558,900 | | 7,763,121 |
Commercial Services & Supplies - 1.2% |
Avery Dennison Corp. | 206,000 | | 7,933,060 |
Construction & Engineering - 1.1% |
URS Corp. | 182,903 | | 7,586,816 |
Common Stocks - continued |
| Shares | | Value |
INDUSTRIALS - continued |
Electrical Equipment - 1.0% |
General Cable Corp. (a) | 213,500 | | $ 7,177,870 |
Machinery - 2.2% |
Oshkosh Truck Corp. (a) | 189,700 | | 7,432,446 |
Terex Corp. (a) | 239,600 | | 7,758,248 |
| | 15,190,694 |
Professional Services - 1.2% |
Equifax, Inc. | 60,000 | | 3,522,000 |
Towers Watson & Co. | 73,000 | | 4,458,840 |
| | 7,980,840 |
Trading Companies & Distributors - 1.8% |
MRC Global, Inc. | 168,000 | | 5,162,640 |
WESCO International, Inc. (a) | 94,627 | | 6,901,147 |
| | 12,063,787 |
TOTAL INDUSTRIALS | | 77,662,526 |
INFORMATION TECHNOLOGY - 10.0% |
Communications Equipment - 1.0% |
Brocade Communications Systems, Inc. (a) | 1,268,400 | | 7,255,248 |
Computers & Peripherals - 1.2% |
Western Digital Corp. | 175,300 | | 8,239,100 |
IT Services - 1.2% |
Computer Sciences Corp. | 193,100 | | 8,071,580 |
Office Electronics - 1.4% |
Xerox Corp. | 1,184,900 | | 9,491,049 |
Semiconductors & Semiconductor Equipment - 1.7% |
Avago Technologies Ltd. | 196,400 | | 7,025,228 |
Skyworks Solutions, Inc. (a) | 210,400 | | 5,036,976 |
| | 12,062,204 |
Software - 3.5% |
CA Technologies, Inc. | 358,300 | | 8,893,006 |
Symantec Corp. (a) | 489,300 | | 10,652,061 |
Synopsys, Inc. (a) | 135,800 | | 4,541,152 |
| | 24,086,219 |
TOTAL INFORMATION TECHNOLOGY | | 69,205,400 |
Common Stocks - continued |
| Shares | | Value |
MATERIALS - 5.9% |
Chemicals - 1.8% |
Ashland, Inc. | 62,900 | | $ 4,938,279 |
Eastman Chemical Co. | 100,800 | | 7,171,920 |
| | 12,110,199 |
Containers & Packaging - 0.9% |
Ball Corp. | 147,500 | | 6,566,700 |
Metals & Mining - 1.5% |
Commercial Metals Co. | 337,100 | | 5,612,715 |
Reliance Steel & Aluminum Co. | 72,600 | | 4,698,672 |
| | 10,311,387 |
Paper & Forest Products - 1.7% |
International Paper Co. | 281,700 | | 11,668,014 |
TOTAL MATERIALS | | 40,656,300 |
TELECOMMUNICATION SERVICES - 1.2% |
Diversified Telecommunication Services - 0.8% |
CenturyLink, Inc. | 125,700 | | 5,084,565 |
Wireless Telecommunication Services - 0.4% |
Sprint Nextel Corp. (a) | 527,000 | | 2,967,010 |
TOTAL TELECOMMUNICATION SERVICES | | 8,051,575 |
UTILITIES - 9.6% |
Electric Utilities - 7.3% |
Edison International | 229,500 | | 11,059,605 |
Hawaiian Electric Industries, Inc. | 20,400 | | 550,188 |
IDACORP, Inc. | 148,800 | | 6,905,808 |
NV Energy, Inc. | 418,700 | | 7,925,991 |
Pinnacle West Capital Corp. | 125,300 | | 6,688,514 |
PNM Resources, Inc. | 323,000 | | 6,899,280 |
PPL Corp. | 328,000 | | 9,935,120 |
| | 49,964,506 |
Gas Utilities - 0.9% |
UGI Corp. | 176,500 | | 6,219,860 |
Common Stocks - continued |
| Shares | | Value |
UTILITIES - continued |
Multi-Utilities - 1.4% |
DTE Energy Co. | 153,700 | | $ 9,730,747 |
TOTAL UTILITIES | | 65,915,113 |
TOTAL COMMON STOCKS (Cost $596,508,563) |
678,040,173
|
Money Market Funds - 1.8% |
| | | |
Fidelity Cash Central Fund, 0.16% (b) | 7,500,179 | | 7,500,179 |
Fidelity Securities Lending Cash Central Fund, 0.15% (b)(c) | 4,798,250 | | 4,798,250 |
TOTAL MONEY MARKET FUNDS (Cost $12,298,429) |
12,298,429
|
TOTAL INVESTMENT PORTFOLIO - 100.4% (Cost $608,806,992) | | 690,338,602 |
NET OTHER ASSETS (LIABILITIES) - (0.4)% | | (2,890,871) |
NET ASSETS - 100% | $ 687,447,731 |
Legend |
(a) Non-income producing |
(b) Affiliated fund that is available only to investment companies and other accounts managed by Fidelity Investments. The rate quoted is the annualized seven-day yield of the fund at period end. A complete unaudited listing of the fund's holdings as of its most recent quarter end is available upon request. In addition, each Fidelity Central Fund's financial statements, which are not covered by the Fund's Report of Independent Registered Public Accounting Firm, are available on the SEC's website or upon request. |
(c) Investment made with cash collateral received from securities on loan. |
(d) Security or a portion of the security is on loan at period end. |
Affiliated Central Funds |
Information regarding fiscal year to date income earned by the Fund from investments in Fidelity Central Funds is as follows: |
Fund | Income earned |
Fidelity Cash Central Fund | $ 5,734 |
Fidelity Securities Lending Cash Central Fund | 122,164 |
Total | $ 127,898 |
Other Information |
All investments are categorized as Level 1 under the Fair Value Hierarchy. The inputs or methodology used for valuing securities may not be an indication of the risk associated with investing in those securities. For more information on valuation inputs, please refer to the Investment Valuation section in the accompanying Notes to Financial Statements. |
See accompanying notes which are an integral part of the financial statements.
Annual Report
Statement of Assets and Liabilities
| January 31, 2013 |
| | |
Assets | | |
Investment in securities, at value (including securities loaned of $4,665,358) - See accompanying schedule: Unaffiliated issuers (cost $596,508,563) | $ 678,040,173 | |
Fidelity Central Funds (cost $12,298,429) | 12,298,429 | |
Total Investments (cost $608,806,992) | | $ 690,338,602 |
Receivable for investments sold | | 12,067,676 |
Receivable for fund shares sold | | 2,544,074 |
Dividends receivable | | 397,654 |
Distributions receivable from Fidelity Central Funds | | 3,138 |
Prepaid expenses | | 1,171 |
Other receivables | | 88,145 |
Total assets | | 705,440,460 |
| | |
Liabilities | | |
Payable for investments purchased | $ 11,795,723 | |
Payable for fund shares redeemed | 905,587 | |
Accrued management fee | 288,786 | |
Distribution and service plan fees payable | 14,791 | |
Other affiliated payables | 138,743 | |
Other payables and accrued expenses | 50,849 | |
Collateral on securities loaned, at value | 4,798,250 | |
Total liabilities | | 17,992,729 |
| | |
Net Assets | | $ 687,447,731 |
Net Assets consist of: | | |
Paid in capital | | $ 610,264,039 |
Accumulated undistributed net realized gain (loss) on investments | | (4,347,918) |
Net unrealized appreciation (depreciation) on investments | | 81,531,610 |
Net Assets | | $ 687,447,731 |
See accompanying notes which are an integral part of the financial statements.
Annual Report
Statement of Assets and Liabilities - continued
| January 31, 2013 |
| | |
Calculation of Maximum Offering Price Class A:
Net Asset Value and redemption price per share ($24,436,123 ÷ 1,270,011 shares) | | $ 19.24 |
| | |
Maximum offering price per share (100/94.25 of $19.24) | | $ 20.41 |
Class T:
Net Asset Value and redemption price per share ($8,358,357 ÷ 435,167 shares) | | $ 19.21 |
| | |
Maximum offering price per share (100/96.50 of $19.21) | | $ 19.91 |
Class B:
Net Asset Value and offering price per share ($1,533,480 ÷ 80,601 shares)A | | $ 19.03 |
| | |
Class C:
Net Asset Value and offering price per share ($6,820,179 ÷ 360,217 shares)A | | $ 18.93 |
| | |
Mid Cap Value:
Net Asset Value, offering price and redemption price per share ($638,424,992 ÷ 32,958,886 shares) | | $ 19.37 |
| | |
Institutional Class:
Net Asset Value, offering price and redemption price per share ($7,874,600 ÷ 408,307 shares) | | $ 19.29 |
A Redemption price per share is equal to net asset value less any applicable contingent deferred sales charge.
See accompanying notes which are an integral part of the financial statements.
Annual Report
Financial Statements - continued
Statement of Operations
| Year ended January 31, 2013 |
| | |
Investment Income | | |
Dividends | | $ 13,395,784 |
Income from Fidelity Central Funds | | 127,898 |
Total income | | 13,523,682 |
| | |
Expenses | | |
Management fee
Basic fee | $ 3,314,165 | |
Performance adjustment | (132,746) | |
Transfer agent fees | 1,464,650 | |
Distribution and service plan fees | 154,959 | |
Accounting and security lending fees | 223,431 | |
Custodian fees and expenses | 28,240 | |
Independent trustees' compensation | 3,867 | |
Registration fees | 88,262 | |
Audit | 54,995 | |
Legal | 2,484 | |
Miscellaneous | 6,457 | |
Total expenses before reductions | 5,208,764 | |
Expense reductions | (191,114) | 5,017,650 |
Net investment income (loss) | | 8,506,032 |
Realized and Unrealized Gain (Loss) Net realized gain (loss) on: | | |
Investment securities: | | |
Unaffiliated issuers | 58,043,389 | |
Investment not meeting investment restrictions | 1,279 | |
Total net realized gain (loss) | | 58,044,668 |
Change in net unrealized appreciation (depreciation) on investment securities | | 59,980,492 |
Net gain (loss) | | 118,025,160 |
Net increase (decrease) in net assets resulting from operations | | $ 126,531,192 |
See accompanying notes which are an integral part of the financial statements.
Annual Report
Statement of Changes in Net Assets
| Year ended
January 31,
2013 | Year ended
January 31,
2012 |
Increase (Decrease) in Net Assets | | |
Operations | | |
Net investment income (loss) | $ 8,506,032 | $ 4,545,431 |
Net realized gain (loss) | 58,044,668 | 70,353,241 |
Change in net unrealized appreciation (depreciation) | 59,980,492 | (90,350,275) |
Net increase (decrease) in net assets resulting
from operations | 126,531,192 | (15,451,603) |
Distributions to shareholders from net investment income | (8,438,509) | (4,101,848) |
Share transactions - net increase (decrease) | (21,044,685) | (97,570,396) |
Redemption fees | 8,162 | 28,676 |
Total increase (decrease) in net assets | 97,056,160 | (117,095,171) |
| | |
Net Assets | | |
Beginning of period | 590,391,571 | 707,486,742 |
End of period (including distributions in excess of net investment income of $0 and $137,586, respectively) | $ 687,447,731 | $ 590,391,571 |
See accompanying notes which are an integral part of the financial statements.
Annual Report
Financial Highlights - Class A
Years ended January 31, | 2013 | 2012 | 2011 | 2010 | 2009 |
Selected Per-Share Data | | | | | |
Net asset value, beginning of period | $ 15.87 | $ 16.16 | $ 12.35 | $ 8.53 | $ 15.05 |
Income from Investment Operations | | | | |
Net investment income (loss) C | .20 | .07 | - G | .07 | .09 |
Net realized and unrealized gain (loss) | 3.38 | (.29) | 3.85 | 3.84 | (6.47) |
Total from investment operations | 3.58 | (.22) | 3.85 | 3.91 | (6.38) |
Distributions from net investment income | (.21) | (.07) | (.04) | (.09) | (.14) |
Distributions from net realized gain | - | - | - | - | - G |
Total distributions | (.21) | (.07) | (.04) | (.09) | (.14) |
Redemption fees added to paid in capital C, G | - | - | - | - | - |
Net asset value, end of period | $ 19.24 | $ 15.87 | $ 16.16 | $ 12.35 | $ 8.53 |
Total Return A, B | 22.73% | (1.34)% | 31.14% | 45.79% | (42.40)% |
Ratios to Average Net Assets D, F | | | | |
Expenses before reductions | 1.15% | 1.17% | 1.17% | 1.21% | 1.12% |
Expenses net of fee waivers, if any | 1.15% | 1.17% | 1.17% | 1.21% | 1.12% |
Expenses net of all reductions | 1.12% | 1.16% | 1.17% | 1.20% | 1.12% |
Net investment income (loss) | 1.15% | .44% | .02% | .62% | .71% |
Supplemental Data | | | | | |
Net assets, end of period (000 omitted) | $ 24,436 | $ 19,578 | $ 23,608 | $ 10,640 | $ 6,404 |
Portfolio turnover rate E | 180% | 173% | 133% | 202% | 268% |
A Total returns would have been lower if certain expenses had not been reduced during the applicable periods shown.
B Total returns do not include the effect of the sales charges.
C Calculated based on average shares outstanding during the period.
D Fees and expenses of any underlying Fidelity Central Funds are not included in the Fund's expense ratio. The Fund indirectly bears its proportionate share of the expenses of any underlying Fidelity Central Funds.
E Amount does not include the portfolio activity of any underlying Fidelity Central Funds.
F Expense ratios reflect operating expenses of the class. Expenses before reductions do not reflect amounts reimbursed by the investment adviser or reductions from brokerage service arrangements or reductions from other expense offset arrangements and do not represent the amount paid by the class during periods when reimbursements or reductions occur. Expenses net of fee waivers reflect expenses after reimbursement by the investment adviser but prior to reductions from brokerage service arrangements or other expense offset arrangements. Expenses net of all reductions represent the net expenses paid by the class.
G Amount represents less than $.01 per share.
See accompanying notes which are an integral part of the financial statements.
Annual Report
Financial Highlights - Class T
Years ended January 31, | 2013 | 2012 | 2011 | 2010 | 2009 |
Selected Per-Share Data | | | | | |
Net asset value, beginning of period | $ 15.84 | $ 16.14 | $ 12.34 | $ 8.53 | $ 15.04 |
Income from Investment Operations | | | | | |
Net investment income (loss) C | .15 | .03 | (.03) | .04 | .06 |
Net realized and unrealized gain (loss) | 3.38 | (.29) | 3.83 | 3.84 | (6.46) |
Total from investment operations | 3.53 | (.26) | 3.80 | 3.88 | (6.40) |
Distributions from net investment income | (.16) | (.04) | - | (.07) | (.11) |
Redemption fees added to paid in capital C, G | - | - | - | - | - |
Net asset value, end of period | $ 19.21 | $ 15.84 | $ 16.14 | $ 12.34 | $ 8.53 |
Total Return A, B | 22.42% | (1.59)% | 30.79% | 45.44% | (42.57)% |
Ratios to Average Net Assets D, F | | | | | |
Expenses before reductions | 1.42% | 1.43% | 1.43% | 1.47% | 1.38% |
Expenses net of fee waivers, if any | 1.42% | 1.43% | 1.43% | 1.47% | 1.38% |
Expenses net of all reductions | 1.38% | 1.42% | 1.43% | 1.46% | 1.38% |
Net investment income (loss) | .89% | .18% | (.24)% | .36% | .45% |
Supplemental Data | | | | | |
Net assets, end of period (000 omitted) | $ 8,358 | $ 6,823 | $ 6,993 | $ 4,010 | $ 2,413 |
Portfolio turnover rate E | 180% | 173% | 133% | 202% | 268% |
A Total returns would have been lower if certain expenses had not been reduced during the applicable periods shown.
B Total returns do not include the effect of the sales charges.
C Calculated based on average shares outstanding during the period.
D Fees and expenses of any underlying Fidelity Central Funds are not included in the Fund's expense ratio. The Fund indirectly bears its proportionate share of the expenses of any underlying Fidelity Central Funds.
E Amount does not include the portfolio activity of any underlying Fidelity Central Funds.
F Expense ratios reflect operating expenses of the class. Expenses before reductions do not reflect amounts reimbursed by the investment adviser or reductions from brokerage service arrangements or reductions from other expense offset arrangements and do not represent the amount paid by the class during periods when reimbursements or reductions occur. Expenses net of fee waivers reflect expenses after reimbursement by the investment adviser but prior to reductions from brokerage service arrangements or other expense offset arrangements. Expenses net of all reductions represent the net expenses paid by the class.
G Amount represents less than $.01 per share.
See accompanying notes which are an integral part of the financial statements.
Annual Report
Financial Highlights - Class B
Years ended January 31, | 2013 | 2012 | 2011 | 2010 | 2009 |
Selected Per-Share Data | | | | | |
Net asset value, beginning of period | $ 15.71 | $ 16.04 | $ 12.32 | $ 8.53 | $ 14.99 |
Income from Investment Operations | | | | | |
Net investment income (loss) C | .07 | (.05) | (.10) | (.01) | (.01) |
Net realized and unrealized gain (loss) | 3.34 | (.28) | 3.82 | 3.82 | (6.40) |
Total from investment operations | 3.41 | (.33) | 3.72 | 3.81 | (6.41) |
Distributions from net investment income | (.09) | - | - | (.02) | (.05) |
Redemption fees added to paid in capital C, G | - | - | - | - | - |
Net asset value, end of period | $ 19.03 | $ 15.71 | $ 16.04 | $ 12.32 | $ 8.53 |
Total Return A, B | 21.79% | (2.06)% | 30.19% | 44.61% | (42.79)% |
Ratios to Average Net Assets D, F | | | | | |
Expenses before reductions | 1.91% | 1.92% | 1.93% | 1.97% | 1.87% |
Expenses net of fee waivers, if any | 1.91% | 1.92% | 1.93% | 1.97% | 1.87% |
Expenses net of all reductions | 1.87% | 1.91% | 1.92% | 1.96% | 1.87% |
Net investment income (loss) | .40% | (.31)% | (.74)% | (.14)% | (.04)% |
Supplemental Data | | | | | |
Net assets, end of period (000 omitted) | $ 1,533 | $ 1,376 | $ 1,793 | $ 1,154 | $ 763 |
Portfolio turnover rate E | 180% | 173% | 133% | 202% | 268% |
A Total returns would have been lower if certain expenses had not been reduced during the applicable periods shown.
B Total returns do not include the effect of the contingent deferred sales charge.
C Calculated based on average shares outstanding during the period.
D Fees and expenses of any underlying Fidelity Central Funds are not included in the Fund's expense ratio. The Fund indirectly bears its proportionate share of the expenses of any underlying Fidelity Central Funds.
E Amount does not include the portfolio activity of any underlying Fidelity Central Funds.
F Expense ratios reflect operating expenses of the class. Expenses before reductions do not reflect amounts reimbursed by the investment adviser or reductions from brokerage service arrangements or reductions from other expense offset arrangements and do not represent the amount paid by the class during periods when reimbursements or reductions occur. Expenses net of fee waivers reflect expenses after reimbursement by the investment adviser but prior to reductions from brokerage service arrangements or other expense offset arrangements. Expenses net of all reductions represent the net expenses paid by the class.
G Amount represents less than $.01 per share.
See accompanying notes which are an integral part of the financial statements.
Annual Report
Financial Highlights - Class C
Years ended January 31, | 2013 | 2012 | 2011 | 2010 | 2009 |
Selected Per-Share Data | | | | | |
Net asset value, beginning of period | $ 15.65 | $ 15.98 | $ 12.27 | $ 8.50 | $ 14.98 |
Income from Investment Operations | | | | | |
Net investment income (loss) C | .07 | (.05) | (.10) | (.01) | - |
Net realized and unrealized gain (loss) | 3.32 | (.28) | 3.81 | 3.80 | (6.41) |
Total from investment operations | 3.39 | (.33) | 3.71 | 3.79 | (6.41) |
Distributions from net investment income | (.11) | - | - | (.02) | (.07) |
Redemption fees added to paid in capital C, G | - | - | - | - | - |
Net asset value, end of period | $ 18.93 | $ 15.65 | $ 15.98 | $ 12.27 | $ 8.50 |
Total Return A, B | 21.73% | (2.07)% | 30.24% | 44.56% | (42.79)% |
Ratios to Average Net Assets D, F | | | | | |
Expenses before reductions | 1.91% | 1.92% | 1.93% | 1.96% | 1.86% |
Expenses net of fee waivers, if any | 1.91% | 1.92% | 1.93% | 1.96% | 1.86% |
Expenses net of all reductions | 1.87% | 1.91% | 1.92% | 1.95% | 1.86% |
Net investment income (loss) | .40% | (.31)% | (.73)% | (.13)% | (.03)% |
Supplemental Data | | | | | |
Net assets, end of period (000 omitted) | $ 6,820 | $ 5,000 | $ 5,309 | $ 2,293 | $ 1,232 |
Portfolio turnover rate E | 180% | 173% | 133% | 202% | 268% |
A Total returns would have been lower if certain expenses had not been reduced during the applicable periods shown.
B Total returns do not include the effect of the contingent deferred sales charge.
C Calculated based on average shares outstanding during the period.
D Fees and expenses of any underlying Fidelity Central Funds are not included in the Fund's expense ratio. The Fund indirectly bears its proportionate share of the expenses of any underlying Fidelity Central Funds.
E Amount does not include the portfolio activity of any underlying Fidelity Central Funds.
F Expense ratios reflect operating expenses of the class. Expenses before reductions do not reflect amounts reimbursed by the investment adviser or reductions from brokerage service arrangements or reductions from other expense offset arrangements and do not represent the amount paid by the class during periods when reimbursements or reductions occur. Expenses net of fee waivers reflect expenses after reimbursement by the investment adviser but prior to reductions from brokerage service arrangements or other expense offset arrangements. Expenses net of all reductions represent the net expenses paid by the class.
G Amount represents less than $.01 per share.
See accompanying notes which are an integral part of the financial statements.
Annual Report
Financial Highlights - Mid Cap Value
Years ended January 31, | 2013 | 2012 | 2011 | 2010 | 2009 |
Selected Per-Share Data | | | | | |
Net asset value, beginning of period | $ 15.97 | $ 16.26 | $ 12.41 | $ 8.57 | $ 15.09 |
Income from Investment Operations | | | | | |
Net investment income (loss) B | .25 | .12 | .04 | .09 | .13 |
Net realized and unrealized gain (loss) | 3.41 | (.30) | 3.87 | 3.86 | (6.49) |
Total from investment operations | 3.66 | (.18) | 3.91 | 3.95 | (6.36) |
Distributions from net investment income | (.26) | (.11) | (.06) | (.11) | (.16) |
Distributions from net realized gain | - | - | - | - | - F |
Total distributions | (.26) | (.11) | (.06) | (.11) | (.16) |
Redemption fees added to paid in capital B, F | - | - | - | - | - |
Net asset value, end of period | $ 19.37 | $ 15.97 | $ 16.26 | $ 12.41 | $ 8.57 |
Total Return A | 23.07% | (1.04)% | 31.51% | 46.06% | (42.19)% |
Ratios to Average Net Assets C, E | | | | | |
Expenses before reductions | .85% | .88% | .91% | .95% | .85% |
Expenses net of fee waivers, if any | .85% | .88% | .91% | .95% | .84% |
Expenses net of all reductions | .81% | .87% | .90% | .94% | .84% |
Net investment income (loss) | 1.46% | .73% | .28% | .88% | .99% |
Supplemental Data | | | | | |
Net assets, end of period (000 omitted) | $ 638,425 | $ 553,947 | $ 666,277 | $ 469,476 | $ 358,380 |
Portfolio turnover rate D | 180% | 173% | 133% | 202% | 268% |
A Total returns would have been lower if certain expenses had not been reduced during the applicable periods shown.
B Calculated based on average shares outstanding during the period.
C Fees and expenses of any underlying Fidelity Central Funds are not included in the Fund's expense ratio. The Fund indirectly bears its proportionate share of the expenses of any underlying Fidelity Central Funds.
D Amount does not include the portfolio activity of any underlying Fidelity Central Funds.
E Expense ratios reflect operating expenses of the class. Expenses before reductions do not reflect amounts reimbursed by the investment adviser or reductions from brokerage service arrangements or reductions from other expense offset arrangements and do not represent the amount paid by the class during periods when reimbursements or reductions occur. Expenses net of fee waivers reflect expenses after reimbursement by the investment adviser but prior to reductions from brokerage service arrangements or other expense offset arrangements. Expenses net of all reductions represent the net expenses paid by the class.
F Amount represents less than $.01 per share.
See accompanying notes which are an integral part of the financial statements.
Annual Report
Financial Highlights - Institutional Class
Years ended January 31, | 2013 | 2012 | 2011 | 2010 | 2009 |
Selected Per-Share Data | | | | | |
Net asset value, beginning of period | $ 15.91 | $ 16.20 | $ 12.36 | $ 8.54 | $ 15.06 |
Income from Investment Operations | | | | | |
Net investment income (loss) B | .24 | .11 | .04 | .10 | .12 |
Net realized and unrealized gain (loss) | 3.40 | (.29) | 3.85 | 3.84 | (6.48) |
Total from investment operations | 3.64 | (.18) | 3.89 | 3.94 | (6.36) |
Distributions from net investment income | (.26) | (.11) | (.05) | (.12) | (.16) |
Redemption fees added to paid in capital B, F | - | - | - | - | - |
Net asset value, end of period | $ 19.29 | $ 15.91 | $ 16.20 | $ 12.36 | $ 8.54 |
Total Return A | 23.05% | (1.07)% | 31.51% | 46.12% | (42.26)% |
Ratios to Average Net Assets C, E | | | | | |
Expenses before reductions | .89% | .91% | .92% | .96% | .87% |
Expenses net of fee waivers, if any | .89% | .91% | .92% | .96% | .87% |
Expenses net of all reductions | .85% | .90% | .92% | .95% | .87% |
Net investment income (loss) | 1.42% | .71% | .27% | .87% | .96% |
Supplemental Data | | | | | |
Net assets, end of period (000 omitted) | $ 7,875 | $ 3,667 | $ 3,507 | $ 3,162 | $ 894 |
Portfolio turnover rate D | 180% | 173% | 133% | 202% | 268% |
A Total returns would have been lower if certain expenses had not been reduced during the applicable periods shown.
B Calculated based on average shares outstanding during the period.
C Fees and expenses of any underlying Fidelity Central Funds are not included in the Fund's expense ratio. The Fund indirectly bears its proportionate share of the expenses of any underlying Fidelity Central Funds.
D Amount does not include the portfolio activity of any underlying Fidelity Central Funds.
E Expense ratios reflect operating expenses of the class. Expenses before reductions do not reflect amounts reimbursed by the investment adviser or reductions from brokerage service arrangements or reductions from other expense offset arrangements and do not represent the amount paid by the class during periods when reimbursements or reductions occur. Expenses net of fee waivers reflect expenses after reimbursement by the investment adviser but prior to reductions from brokerage service arrangements or other expense offset arrangements. Expenses net of all reductions represent the net expenses paid by the class.
F Amount represents less than $.01 per share.
See accompanying notes which are an integral part of the financial statements.
Annual Report
Notes to Financial Statements
For the period ended January 31, 2013
1. Organization.
Fidelity Mid Cap Value Fund (the Fund) is a fund of Fidelity Devonshire Trust (the Trust) and is authorized to issue an unlimited number of shares. The Trust is registered under the Investment Company Act of 1940, as amended (the 1940 Act), as an open-end management investment company organized as a Massachusetts business trust. The Fund offers Class A, Class T, Class C, Mid Cap Value and Institutional Class shares, each of which, along with Class B shares, has equal rights as to assets and voting privileges. Class B shares are closed to new accounts and additional purchases, except for exchanges and reinvestments. Each class has exclusive voting rights with respect to matters that affect that class. Class B shares will automatically convert to Class A shares after a holding period of seven years from the initial date of purchase. Investment income, realized and unrealized capital gains and losses, the common expenses of the Fund, and certain fund-level expense reductions, if any, are allocated on a pro-rata basis to each class based on the relative net assets of each class to the total net assets of the Fund. Each class differs with respect to transfer agent and distribution and service plan fees incurred. Certain expense reductions may also differ by class.
2. Investments in Fidelity Central Funds.
The Fund invests in Fidelity Central Funds, which are open-end investment companies available only to other investment companies and accounts managed by Fidelity Management & Research Company (FMR) and its affiliates. The Fund's Schedule of Investments lists each of the Fidelity Central Funds held as of period end, if any, as an investment of the Fund, but does not include the underlying holdings of each Fidelity Central Fund. As an Investing Fund, the Fund indirectly bears its proportionate share of the expenses of the underlying Fidelity Central Funds.
The Money Market Central Funds seek preservation of capital and current income and are managed by Fidelity Investments Money Management, Inc. (FIMM), an affiliate of FMR.
A complete unaudited list of holdings for each Fidelity Central Fund is available upon request or at the Securities and Exchange Commission (the SEC) website at www.sec.gov. In addition, the financial statements of the Fidelity Central Funds, which are not covered by the Fund's Report of Independent Registered Public Accounting Firm, are available on the SEC website or upon request.
3. Significant Accounting Policies.
The financial statements have been prepared in conformity with accounting principles generally accepted in the United States of America (GAAP), which require management to make certain estimates and assumptions at the date of the financial statements. Actual results could differ from those estimates. Subsequent events, if any, through the
Annual Report
3. Significant Accounting Policies - continued
date that the financial statements were issued have been evaluated in the preparation of the financial statements. The following summarizes the significant accounting policies of the Fund:
Investment Valuation. Investments are valued as of 4:00 p.m. Eastern time on the last calendar day of the period. In accordance with valuation policies and procedures approved by the Board of Trustees (the Board), the Fund attempts to obtain prices from one or more third party pricing vendors or brokers to value its investments. When current market prices, quotations or currency exchange rates are not readily available or reliable, investments will be fair valued in good faith by the FMR Fair Value Committee (the Committee), in accordance with procedures adopted by the Fund's Board. Factors used in determining fair value vary by investment type and may include market or investment specific events. The frequency with which these procedures are used cannot be predicted and they may be utilized to a significant extent. The Committee oversees the Fund's valuation policies and procedures and is responsible for approving and reporting to the Board all fair value determinations.
The Fund categorizes the inputs to valuation techniques used to value its investments into a disclosure hierarchy consisting of three levels as shown below:
Level 1 - quoted prices in active markets for identical investments
Level 2 - other significant observable inputs (including quoted prices for similar investments, interest rates, prepayment speeds, etc.)
Level 3 - unobservable inputs (including the Fund's own assumptions based on the best information available)
Valuation techniques used to value the Fund's investments by major category are as follows:
Equity securities, including restricted securities, for which market quotations are readily available, are valued at the last reported sale price or official closing price as reported by a third party pricing vendor on the primary market or exchange on which they are traded and are categorized as Level 1 in the hierarchy. In the event there were no sales during the day or closing prices are not available, securities are valued at the last quoted bid price or may be valued using the last available price and are generally categorized as Level 2 in the hierarchy. For foreign equity securities, when significant market or security specific events arise, comparisons to the valuation of American Depositary Receipts (ADRs), futures contracts, Exchange-Traded Funds (ETFs) and certain indexes as well as quoted prices for similar securities are used and are categorized as Level 2 in the hierarchy. Utilizing these techniques may result in transfers between Level 1 and Level 2.
Annual Report
Notes to Financial Statements - continued
3. Significant Accounting Policies - continued
Investment Valuation - continued
Investments in open-end mutual funds, including the Fidelity Central Funds, are valued at their closing net asset value (NAV) each business day and are categorized as Level 1 in the hierarchy.
Changes in valuation techniques may result in transfers in or out of an assigned level within the disclosure hierarchy.
Investment Transactions and Income. For financial reporting purposes, the Fund's investment holdings and NAV include trades executed through the end of the last business day of the period. The NAV per share for processing shareholder transactions is calculated as of the close of business of the New York Stock Exchange (NYSE), normally 4:00 p.m. Eastern time and includes trades executed through the end of the prior business day. Gains and losses on securities sold are determined on the basis of identified cost and may include proceeds received from litigation. Dividend income is recorded on the ex-dividend date, except for certain dividends from foreign securities where the ex-dividend date may have passed, which are recorded as soon as the Fund is informed of the ex-dividend date. Non-cash dividends included in dividend income, if any, are recorded at the fair market value of the securities received. Distributions received on securities that represent a return of capital or capital gain are recorded as a reduction of cost of investments and/or as a realized gain. The Fund estimates the components of distributions received that may be considered return of capital distributions or capital gain distributions. Interest income and distributions from the Fidelity Central Funds are accrued as earned.
Expenses. Expenses directly attributable to a fund are charged to that fund. Expenses attributable to more than one fund are allocated among the respective funds on the basis of relative net assets or other appropriate methods. Expense estimates are accrued in the period to which they relate and adjustments are made when actual amounts are known.
Income Tax Information and Distributions to Shareholders. Each year, the Fund intends to qualify as a regulated investment company under Subchapter M of the Internal Revenue Code, including distributing substantially all of its taxable income and realized gains. As a result, no provision for income taxes is required. As of January 31, 2013, the Fund did not have any unrecognized tax benefits in the financial statements; nor is the Fund aware of any tax positions for which it is reasonably possible that the total amounts of unrecognized tax benefits will significantly change in the next twelve months. The Fund files a U.S. federal tax return, in addition to state and local tax returns as required. A fund's federal income tax returns are subject to examination by the Internal Revenue Service (IRS) for a period of three fiscal years after they are filed.
Annual Report
3. Significant Accounting Policies - continued
Income Tax Information and Distributions to Shareholders - continued
State and local tax returns may be subject to examination for an additional fiscal year depending on the jurisdiction.
Distributions are declared and recorded on the ex-dividend date. Income dividends and capital gain distributions are declared separately for each class. Income and capital gain distributions are determined in accordance with income tax regulations, which may differ from GAAP. In addition, the Fund claimed a portion of the payment made to redeeming shareholders as a distribution for income tax purposes.
Capital accounts within the financial statements are adjusted for permanent book-tax differences. These adjustments have no impact on net assets or the results of operations. Temporary book-tax differences will reverse in a subsequent period.
Book-tax differences are primarily due to partnerships (including allocations from Fidelity Central Funds), capital loss carryforwards and losses deferred due to wash sales and excise tax regulations.
The federal tax cost of investment securities and unrealized appreciation (depreciation) as of period end were as follows:
Gross unrealized appreciation | $ 87,088,948 |
Gross unrealized depreciation | (6,753,986) |
Net unrealized appreciation (depreciation) on securities and other investments | $ 80,334,962 |
| |
Tax Cost | $ 610,003,640 |
The tax-based components of distributable earnings as of period end were as follows:
Capital loss carryforward | $ (3,151,270) |
Net unrealized appreciation (depreciation) | $ 80,334,962 |
Capital loss carryforwards are only available to offset future capital gains of the Fund to the extent provided by regulations and may be limited. Under the Regulated Investment Company Modernization Act of 2010 (the Act), the Fund is permitted to carry forward capital losses incurred in taxable years beginning after December 22, 2010 for an unlimited period and such capital losses are required to be used prior to any losses that expire. Capital loss carryforwards were as follows:
Fiscal year of expiration | |
2018 | $ (3,151,270) |
Annual Report
Notes to Financial Statements - continued
3. Significant Accounting Policies - continued
Income Tax Information and Distributions to Shareholders - continued
The tax character of distributions paid was as follows:
| January 31, 2013 | January 31, 2012 |
Ordinary Income | $ 8,438,509 | $ 4,101,848 |
Short-Term Trading (Redemption) Fees. Shares held by investors in the Fund less than 30 days are subject to a redemption fee equal to .75% of the net asset value of shares redeemed. All redemption fees, which reduce the proceeds of the shareholder redemption, are retained by the Fund and accounted for as an addition to paid in capital.
4. Purchases and Sales of Investments.
Purchases and sales of securities, other than short-term securities, aggregated $1,071,381,575 and $1,097,503,166, respectively.
The Fund realized a gain on the sale of an investment not meeting the investment restrictions of the Fund.
5. Fees and Other Transactions with Affiliates.
Management Fee. FMR and its affiliates provide the Fund with investment management related services for which the Fund pays a monthly management fee. The management fee is the sum of an individual fund fee rate that is based on an annual rate of .30% of the Fund's average net assets and an annualized group fee rate that averaged .26% during the period. The group fee rate is based upon the average net assets of all the mutual funds advised by FMR. The group fee rate decreases as assets under management increase and increases as assets under management decrease. In addition, the management fee is subject to a performance adjustment (up to a maximum of ± .20% of the Fund's average net assets over a 36 month performance period). The upward or downward adjustment to the management fee is based on the relative investment performance of Mid Cap Value as compared to an appropriate benchmark index. For the period, the total annual management fee rate, including the performance adjustment, was .53% of the Fund's average net assets.
Distribution and Service Plan Fees. In accordance with Rule 12b-1 of the 1940 Act, the Fund has adopted separate Distribution and Service Plans for each class of shares. Certain classes pay Fidelity Distributors Corporation (FDC), an affiliate of FMR, separate Distribution and Service Fees, each of which is based on an annual percentage of each class' average net assets. In addition, FDC may pay financial intermediaries for selling shares of the Fund and providing shareholder support services. For the period,
Annual Report
5. Fees and Other Transactions with Affiliates - continued
Distribution and Service Plan Fees - continued
the Distribution and Service Fee rates, total fees and amounts retained by FDC were as follows:
| Distribution
Fee | Service
Fee | Total Fees | Retained
by FDC |
Class A | -% | .25% | $ 49,153 | $ 1,148 |
Class T | .25% | .25% | 36,050 | 146 |
Class B | .75% | .25% | 13,545 | 10,207 |
Class C | .75% | .25% | 56,211 | 13,628 |
| | | $ 154,959 | $ 25,129 |
Sales Load. FDC may receive a front-end sales charge of up to 5.75% for selling Class A shares and 3.50% for selling Class T shares, some of which is paid to financial intermediaries for selling shares of the Fund. Depending on the holding period, FDC may receive contingent deferred sales charges levied on Class A, Class T, Class B, and Class C redemptions. The deferred sales charges range from 5.00% to 1.00% for Class B shares, 1.00% for Class C shares, 1.00% for certain purchases of Class A shares and .25% for certain purchases of Class T shares.
For the period, sales charge amounts retained by FDC were as follows:
| Retained
by FDC |
Class A | $ 17,414 |
Class T | 3,121 |
Class B* | 1,798 |
Class C* | 1,051 |
| $ 23,384 |
* When Class B and Class C shares are initially sold, FDC pays commissions from its own resources to financial intermediaries through which the sales
are made.
Transfer Agent Fees. Fidelity Investments Institutional Operations Company, Inc. (FIIOC), an affiliate of FMR, is the transfer, dividend disbursing and shareholder servicing agent for each class of the Fund. FIIOC receives account fees and asset-based fees that vary according to the account size and type of account of the shareholders of the respective classes of the Fund. FIIOC pays for typesetting, printing and mailing of
Annual Report
Notes to Financial Statements - continued
5. Fees and Other Transactions with Affiliates - continued
Transfer Agent Fees - continued
shareholder reports, except proxy statements. For the period, transfer agent fees for each class were as follows:
| Amount | % of
Average
Net Assets |
Class A | $ 59,075 | .30 |
Class T | 22,494 | .31 |
Class B | 4,095 | .30 |
Class C | 17,008 | .30 |
Mid Cap Value | 1,349,008 | .24 |
Institutional Class | 12,970 | .28 |
| $ 1,464,650 | |
Accounting and Security Lending Fees. Fidelity Service Company, Inc. (FSC), an affiliate of FMR, maintains the Fund's accounting records. The accounting fee is based on the level of average net assets for each month. Under a separate contract, FSC administers the security lending program. The security lending fee is based on the number and duration of lending transactions.
Brokerage Commissions. The Fund placed a portion of its portfolio transactions with brokerage firms which are affiliates of the investment adviser. The commissions paid to these affiliated firms were $23,609 for the period.
6. Committed Line of Credit.
The Fund participates with other funds managed by FMR or an affiliate in a $4.25 billion credit facility (the "line of credit") to be utilized for temporary or emergency purposes to fund shareholder redemptions or for other short-term liquidity purposes. The Fund has agreed to pay commitment fees on its pro-rata portion of the line of credit, which amounted to $1,566 and is reflected in Miscellaneous expenses on the Statement of Operations. During the period, there were no borrowings on this line of credit.
7. Security Lending.
The Fund lends portfolio securities through a lending agent from time to time in order to earn additional income. For equity securities, a lending agent is used and may loan securities to certain qualified borrowers, including Fidelity Capital Markets (FCM), a broker-dealer affiliated with the Fund. On the settlement date of the loan, the Fund receives collateral (in the form of U.S. Treasury obligations, letters of credit and/or cash) against the loaned securities and maintains collateral in an amount not less than 100% of
Annual Report
7. Security Lending - continued
the market value of the loaned securities during the period of the loan. The market value of the loaned securities is determined at the close of business of the Fund and any additional required collateral is delivered to the Fund on the next business day. If the borrower defaults on its obligation to return the securities loaned because of insolvency or other reasons, a fund could experience delays and costs in recovering the securities loaned or in gaining access to the collateral. Any cash collateral received is invested in the Fidelity Securities Lending Cash Central Fund. The value of loaned securities and cash collateral at period end are disclosed on the Fund's Statement of Assets and Liabilities. The value of securities loaned to FCM at period end was $113,680. Security lending income represents the income earned on investing cash collateral, less rebates paid to borrowers and any lending agent fees associated with the loan, plus any premium payments received for lending certain types of securities. Security lending income is presented in the Statement of Operations as a component of income from Fidelity Central Funds. Total security lending income during the period amounted to $122,164, including $9,612 from securities loaned to FCM.
8. Expense Reductions.
Many of the brokers with whom FMR places trades on behalf of the Fund provided services to the Fund in addition to trade execution. These services included payments of certain expenses on behalf of the Fund totaling $191,057 for the period. In addition, through arrangements with the Fund's custodian, credits realized as a result of uninvested cash balances were used to reduce the Fund's expenses. During the period, these credits reduced the Fund's custody expenses by $57.
9. Distributions to Shareholders.
Distributions to shareholders of each class were as follows:
Years ended January 31, | 2013 | 2012 |
From net investment income | | |
Class A | $ 253,117 | $ 84,201 |
Class T | 66,091 | 17,628 |
Class B | 7,351 | - |
Class C | 38,428 | - |
Mid Cap Value | 7,992,338 | 3,978,985 |
Institutional Class | 81,184 | 21,034 |
Total | $ 8,438,509 | $ 4,101,848 |
Annual Report
Notes to Financial Statements - continued
10. Share Transactions.
Transactions for each class of shares were as follows:
| Shares | Dollars |
Years ended January 31, | 2013 | 2012 | 2013 | 2012 |
Class A | | | | |
Shares sold | 457,731 | 471,749 | $ 7,879,366 | $ 7,485,577 |
Reinvestment of distributions | 13,590 | 5,251 | 235,643 | 78,338 |
Shares redeemed | (434,657) | (704,307) | (7,246,773) | (11,261,227) |
Net increase (decrease) | 36,664 | (227,307) | $ 868,236 | $ (3,697,312) |
Class T | | | | |
Shares sold | 155,888 | 161,524 | $ 2,678,394 | $ 2,605,707 |
Reinvestment of distributions | 3,790 | 1,166 | 65,644 | 17,360 |
Shares redeemed | (155,220) | (165,147) | (2,624,883) | (2,621,038) |
Net increase (decrease) | 4,458 | (2,457) | $ 119,155 | $ 2,029 |
Class B | | | | |
Shares sold | 10,295 | 9,800 | $ 177,345 | $ 158,077 |
Reinvestment of distributions | 397 | - | 6,824 | - |
Shares redeemed | (17,720) | (33,963) | (295,503) | (529,991) |
Net increase (decrease) | (7,028) | (24,163) | $ (111,334) | $ (371,914) |
Class C | | | | |
Shares sold | 137,133 | 124,340 | $ 2,295,740 | $ 1,963,624 |
Reinvestment of distributions | 2,090 | - | 35,705 | - |
Shares redeemed | (98,602) | (137,041) | (1,645,075) | (2,028,206) |
Net increase (decrease) | 40,621 | (12,701) | $ 686,370 | $ (64,582) |
Mid Cap Value | | | | |
Shares sold | 6,300,912 | 7,442,595 | $ 110,558,662 | $ 120,167,268 |
Reinvestment of distributions | 443,673 | 256,561 | 7,742,097 | 3,848,420 |
Shares redeemed | (8,477,007) | (13,984,343) | (144,053,750) | (217,785,024) |
Net increase (decrease) | (1,732,422) | (6,285,187) | $ (25,752,991) | $ (93,769,336) |
Institutional Class | | | | |
Shares sold | 281,696 | 158,721 | $ 4,930,560 | $ 2,526,829 |
Reinvestment of distributions | 4,459 | 1,314 | 77,497 | 19,637 |
Shares redeemed | (108,318) | (146,013) | (1,862,178) | (2,215,747) |
Net increase (decrease) | 177,837 | 14,022 | $ 3,145,879 | $ 330,719 |
11. Other.
The Fund's organizational documents provide former and current trustees and officers with a limited indemnification against liabilities arising in connection with the performance of their duties to the Fund. In the normal course of business, the Fund may also enter into contracts that provide general indemnifications. The Fund's maximum exposure under these arrangements is unknown as this would be dependent on future claims that may be made against the Fund. The risk of material loss from such claims is considered remote.
Annual Report
To the Trustees of Fidelity Devonshire Trust and the Shareholders of Fidelity Mid Cap Value Fund:
In our opinion, the accompanying statement of assets and liabilities, including the schedule of investments, and the related statements of operations and of changes in net assets and the financial highlights present fairly, in all material respects, the financial position of Fidelity Mid Cap Value Fund (a fund of Fidelity Devonshire Trust) at January 31, 2013, the results of its operations for the year then ended, the changes in its net assets for each of the two years in the period then ended and the financial highlights for each of the five years in the period then ended, in conformity with accounting principles generally accepted in the United States of America. These financial statements and financial highlights (hereafter referred to as "financial statements") are the responsibility of the Fidelity Mid Cap Value Fund's management. Our responsibility is to express an opinion on these financial statements based on our audits. We conducted our audits of these financial statements in accordance with the standards of the Public Company Accounting Oversight Board (United States). Those standards require that we plan and perform the audit to obtain reasonable assurance about whether the financial statements are free of material misstatement. An audit includes examining, on a test basis, evidence supporting the amounts and disclosures in the financial statements, assessing the accounting principles used and significant estimates made by management, and evaluating the overall financial statement presentation. We believe that our audits, which included confirmation of securities at January 31, 2013 by correspondence with the custodian and brokers, provide a reasonable basis for our opinion.
PricewaterhouseCoopers LLP
Boston, Massachusetts
March 13, 2013
Annual Report
The Trustees, Members of the Advisory Board, and executive officers of the trust and fund, as applicable, are listed below. The Board of Trustees governs the fund and is responsible for protecting the interests of shareholders. The Trustees are experienced executives who meet periodically throughout the year to oversee the fund's activities, review contractual arrangements with companies that provide services to the fund, oversee management of the risks associated with such activities and contractual arrangements, and review the fund's performance. Except for James C. Curvey, each of the Trustees oversees 234 Fidelity funds. Mr. Curvey oversees 453 Fidelity funds.
The Trustees hold office without limit in time except that (a) any Trustee may resign; (b) any Trustee may be removed by written instrument, signed by at least two-thirds of the number of Trustees prior to such removal; (c) any Trustee who requests to be retired or who has become incapacitated by illness or injury may be retired by written instrument signed by a majority of the other Trustees; and (d) any Trustee may be removed at any special meeting of shareholders by a two-thirds vote of the outstanding voting securities of the trust. Each Trustee who is not an interested person (as defined in the 1940 Act) (Independent Trustee), shall retire not later than the last day of the calendar year in which his or her 75th birthday occurs. The Independent Trustees may waive this mandatory retirement age policy with respect to individual Trustees. The executive officers and Advisory Board Members hold office without limit in time, except that any officer and Advisory Board Member may resign or may be removed by a vote of a majority of the Trustees at any regular meeting or any special meeting of the Trustees. Except as indicated, each individual has held the office shown or other offices in the same company for the past five years.
Experience, Skills, Attributes, and Qualifications of the Fund's Trustees. The Governance and Nominating Committee has adopted a statement of policy that describes the experience, qualifications, attributes, and skills that are necessary and desirable for potential Independent Trustee candidates (Statement of Policy). The Board believes that each Trustee satisfied at the time he or she was initially elected or appointed a Trustee, and continues to satisfy, the standards contemplated by the Statement of Policy. The Governance and Nominating Committee also engages professional search firms to help identify potential Independent Trustee candidates who have the experience, qualifications, attributes, and skills consistent with the Statement of Policy. From time to time, additional criteria based on the composition and skills of the current Independent Trustees, as well as experience or skills that may be appropriate in light of future changes to board composition, business conditions, and regulatory or other developments, have also been considered by the professional search firms and the Governance and Nominating Committee. In addition, the Board takes into account the Trustees' commitment and participation in Board and committee meetings, as well as their leadership of standing and ad hoc committees throughout their tenure.
In determining that a particular Trustee was and continues to be qualified to serve as a Trustee, the Board has considered a variety of criteria, none of which, in isolation, was controlling. The Board believes that, collectively, the Trustees have balanced and diverse experience, qualifications, attributes, and skills, which allow the Board to operate effectively in governing the fund and protecting the interests of shareholders. Information about the specific experience, skills, attributes, and qualifications of each Trustee, which in each case led to the Board's conclusion that the Trustee should serve (or continue to serve) as a trustee of the fund, is provided below.
Annual Report
Board Structure and Oversight Function. James C. Curvey is an interested person (as defined in the 1940 Act) and currently serves as Chairman. The Trustees have determined that an interested Chairman is appropriate and benefits shareholders because an interested Chairman has a personal and professional stake in the quality and continuity of services provided to the fund. Independent Trustees exercise their informed business judgment to appoint an individual of their choosing to serve as Chairman, regardless of whether the Trustee happens to be independent or a member of management. The Independent Trustees have determined that they can act independently and effectively without having an Independent Trustee serve as Chairman and that a key structural component for assuring that they are in a position to do so is for the Independent Trustees to constitute a substantial majority for the Board. The Independent Trustees also regularly meet in executive session. Ned C. Lautenbach serves as Chairman of the Independent Trustees and as such (i) acts as a liaison between the Independent Trustees and management with respect to matters important to the Independent Trustees and (ii) with management prepares agendas for Board meetings.
Fidelity funds are overseen by different Boards of Trustees. The fund's Board oversees Fidelity's equity and high income funds and another Board oversees Fidelity's investment-grade bond, money market, and asset allocation funds. The asset allocation funds may invest in Fidelity funds overseen by the fund's Board. The use of separate Boards, each with its own committee structure, allows the Trustees of each group of Fidelity funds to focus on the unique issues of the funds they oversee, including common research, investment, and operational issues. On occasion, the separate Boards establish joint committees to address issues of overlapping consequences for the Fidelity funds overseen by each Board.
The Trustees operate using a system of committees to facilitate the timely and efficient consideration of all matters of importance to the Trustees, the fund, and fund shareholders and to facilitate compliance with legal and regulatory requirements and oversight of the fund's activities and associated risks. The Board, acting through its committees, has charged FMR and its affiliates with (i) identifying events or circumstances the occurrence of which could have demonstrably adverse effects on the fund's business and/or reputation; (ii) implementing processes and controls to lessen the possibility that such events or circumstances occur or to mitigate the effects of such events or circumstances if they do occur; and (iii) creating and maintaining a system designed to evaluate continuously business and market conditions in order to facilitate the identification and implementation processes described in (i) and (ii) above. Because the day-to-day operations and activities of the fund are carried out by or through FMR, its affiliates and other service providers, the fund's exposure to risks is mitigated but not eliminated by the processes overseen by the Trustees. While each of the Board's committees has responsibility for overseeing different aspects of the fund's activities, oversight is exercised primarily through the Operations, Audit, and Compliance Committees. In addition, the Independent Trustees have worked with FMR to enhance the Board's oversight of investment and financial risks, legal and regulatory risks, technology risks, and operational risks, including the development of additional risk reporting to the Board. For example, a working group comprised of Independent Trustees and FMR has worked and continues to work to review the Fidelity funds' valuation-related activities, reporting and risk management. Appropriate personnel, including but not limited to the fund's Chief Compliance Officer (CCO), FMR's internal auditor, the independent accountants, the fund's Treasurer and portfolio management personnel, make periodic reports to the Board's committees, as appropriate, including an annual review of FMR's risk management program for the Fidelity funds. The responsibilities of each standing committee, including their oversight responsibilities, are described further under "Standing Committees of the Fund's Trustees."
Annual Report
Trustees and Officers - continued
The fund's Statement of Additional Information (SAI) includes more information about the Trustees. To request a free copy, call Fidelity at 1-800-544-8544.
Interested Trustees*:
Correspondence intended for each Trustee who is an interested person may be sent to Fidelity Investments, 245 Summer Street, Boston, Massachusetts 02210.
Name, Age; Principal Occupations and Other Relevant Experience+ |
James C. Curvey (77) |
| Year of Election or Appointment: 2007 Mr. Curvey is Trustee and Chairman of the Board of Trustees of certain Trusts. Mr. Curvey also serves as Trustee (2007-present) of other investment companies advised by FMR. Mr. Curvey is a Director of Fidelity Investments Money Management, Inc. (2009-present), Director of Fidelity Research & Analysis Co. (2009-present) and Director of FMR and FMR Co., Inc. (2007-present). Mr. Curvey is also Vice Chairman (2007-present) and Director of FMR LLC. In addition, Mr. Curvey serves as an Overseer for the Boston Symphony Orchestra and a member of the Trustees of Villanova University. Previously, Mr. Curvey was the Vice Chairman (2006-2007) and Director (2000-2007) of FMR Corp. |
Ronald P. O'Hanley (55) |
| Year of Election or Appointment: 2011 Mr. O'Hanley is Director of FMR Co., Inc. (2010-present), Director of Fidelity Investments Money Management, Inc. (2010-present), Director of Fidelity Research & Analysis Company (2010-present), President of Fidelity Asset Management and Corporate Services and a member of Fidelity's Executive Committee (2010-present). Previously, Mr. O'Hanley served as President and Chief Executive Officer of BNY Mellon Asset Management (2007-2010). Mr. O'Hanley also served as Vice Chairman of Bank New York Mellon Corp. and a member of that firm's Executive Committee. Prior to the 2007 merger of The Bank of New York and Mellon Financial Corporation, he was Vice Chairman of Mellon Financial Corporation and President and Chief Executive Officer of Mellon Asset Management. He joined Mellon in February 1997. Mr. O'Hanley currently serves as Chairman of the Boston Public Library Foundation Board of Directors and sits on the Board of Directors of Beth Israel Deaconess Medical Center, the Board of Trustees of the Marine Biological Laboratory and the Advisory Board of the Maxwell School of Citizenship and Public Administration at Syracuse University. Mr. O'Hanley also chairs the Council on Asset Management for the Financial Services Roundtable and is a member of the Board of Directors of Institutional Investor's U.S. Institute. |
* Trustees have been determined to be "Interested Trustees" by virtue of, among other things, their affiliation with the trust or various entities under common control with FMR.
+ The information above includes each Trustee's principal occupation during the last five years and other information relating to the experience, attributes, and skills relevant to each Trustee's qualifications to serve as a Trustee, which led to the conclusion that each Trustee should serve as a Trustee for the fund.
Annual Report
Trustees and Officers - continued
Independent Trustees:
Correspondence intended for each Independent Trustee (that is, the Trustees other than the Interested Trustees) may be sent to Fidelity Investments, P.O. Box 55235, Boston, Massachusetts 02205-5235.
Name, Age; Principal Occupations and Other Relevant Experience+ |
Dennis J. Dirks (64) |
| Year of Election or Appointment: 2005 Prior to his retirement in May 2003, Mr. Dirks was Chief Operating Officer and a member of the Board of The Depository Trust & Clearing Corporation (DTCC). He also served as President, Chief Operating Officer, and Board member of The Depository Trust Company (DTC) and President and Board member of the National Securities Clearing Corporation (NSCC). In addition, Mr. Dirks served as Chief Executive Officer and Board member of the Government Securities Clearing Corporation, Chief Executive Officer and Board member of the Mortgage-Backed Securities Clearing Corporation, as a Trustee and a member of the Finance Committee of Manhattan College (2005-2008), and as a Trustee and a member of the Finance Committee of AHRC of Nassau County (2006-2008). Mr. Dirks is a member of the Independent Directors Council (IDC) Governing Council (2010-present) and Board of Directors for The Brookville Center for Children's Services, Inc. (2009-present). |
Alan J. Lacy (59) |
| Year of Election or Appointment: 2008 Mr. Lacy serves as Senior Adviser (2007-present) of Oak Hill Capital Partners, L.P. (private equity). Mr. Lacy also served as Chief Executive Officer (2000-2005) and Vice Chairman (2005-2006) of Sears Holdings Corporation and Sears, Roebuck and Co. (retail). In addition, Mr. Lacy serves as a member of the Board of Directors of Dave & Buster's Entertainment, Inc. (restaurant and entertainment complexes, 2010-present), Earth Fare, Inc. (retail grocery, 2012-present), The Hillman Companies, Inc. (hardware wholesalers, 2010-present), and Bristol-Myers Squibb Company (global pharmaceuticals, 2008-present). Mr. Lacy is a member of the Board of Trustees of The National Parks Conservation Association (2006-present). Previously, Mr. Lacy served as Chairman of the Board of Trustees of the National Parks Conservation Association (2008-2011) and as a member of the Board of Directors for the Western Union Company (global money transfer, 2006-2011). |
Ned C. Lautenbach (68) |
| Year of Election or Appointment: 2000 Mr. Lautenbach is Chairman of the Independent Trustees of the Equity and High Income Funds (2006-present). Mr. Lautenbach currently serves as the Lead Director of the Eaton Corporation Board of Directors (diversified industrial, 1997-present). Mr. Lautenbach is Chairman of the Board of Directors of the Philharmonic Center for the Arts in Naples, Florida (2012-present) and a member of the Council on Foreign Relations (1994-present). Previously, Mr. Lautenbach was a Partner/Advisory Partner at Clayton, Dubilier & Rice, LLC (private equity investment, 1998-2010), as well as a Director of Sony Corporation (2006-2007). |
Joseph Mauriello (68) |
| Year of Election or Appointment: 2008 Prior to his retirement in January 2006, Mr. Mauriello served in numerous senior management positions including Deputy Chairman and Chief Operating Officer (2004-2005), and Vice Chairman of Financial Services (2002-2004) of KPMG LLP US (professional services, 1965-2005). Mr. Mauriello currently serves as a member of the Board of Directors of XL Group plc. (global insurance and re-insurance, 2006-present). Previously, Mr. Mauriello served as a Director of the Hamilton Funds of the Bank of New York (2006-2007) and of Arcadia Resources Inc. (health care services and products, 2007-2012). |
Robert W. Selander (62) |
| Year of Election or Appointment: 2011 Previously, Mr. Selander served as a Member of the Advisory Board of Fidelity's Equity and High Income Funds (2011), Executive Vice Chairman (2010), Chief Executive Officer (2009-2010), and President and Chief Executive Officer (1997-2009) of Mastercard, Inc. |
Cornelia M. Small (68) |
| Year of Election or Appointment: 2005 Ms. Small is a member of the Board of Directors (2009-present) and Chair of the Investment Committee (2010-present) of the Teagle Foundation. Ms. Small also serves on the Investment Committee of the Berkshire Taconic Community Foundation (2008-present). Previously, Ms. Small served as Chairperson (2002-2008) and a member of the Investment Committee and Chairperson (2008-2012) and a member of the Board of Trustees of Smith College. In addition, Ms. Small served as Chief Investment Officer, Director of Global Equity Investments, and a member of the Board of Directors of Scudder, Stevens & Clark and Scudder Kemper Investments. |
William S. Stavropoulos (73) |
| Year of Election or Appointment: 2002 Mr. Stavropoulos is Vice Chairman of the Independent Trustees of the Equity and High Income Funds (2006-present). Mr. Stavropoulos serves as President and Founder of the Michigan Baseball Foundation, the Great Lakes Loons (2007-present). Mr. Stavropoulos is Chairman Emeritus of the Board of Directors of The Dow Chemical Company, where he previously served in numerous senior management positions, including President, CEO (1995-2000; 2002-2004), Chairman of the Executive Committee (2000-2006), and as a member of the Board of Directors (1990-2006). Currently, Mr. Stavropoulos is a Director of Univar Inc. (global distributor of commodity and specialty chemicals, Chairman from 2010-May 2012 and Lead Director from May 2012-present), Teradata Corporation (data warehousing and technology solutions, 2008-present), Maersk Inc. (industrial conglomerate), and Tyco International, Ltd. (multinational manufacturing and services, 2007-present), and a member of the Advisory Board for Metalmark Capital LLC (private equity investment, 2005-present). Mr. Stavropoulos is an operating advisor to Clayton, Dubilier & Rice, LLC (private equity investment). In addition, Mr. Stavropoulos is a member of the University of Notre Dame Advisory Council for the College of Science, a Trustee of the Rollin L. Gerstacker Foundation, and a Director of the Naples Philharmonic Center for the Arts. Previously, Mr. Stavropoulos served as a Director of Chemical Financial Corporation (bank holding company, 1993-2012). |
David M. Thomas (63) |
| Year of Election or Appointment: 2008 Previously, Mr. Thomas served as Executive Chairman (2005-2006) and Chairman and Chief Executive Officer (2000-2005) of IMS Health, Inc. (pharmaceutical and healthcare information solutions), and a Director of Fortune Brands, Inc. (consumer products, 2000-2011). In addition, Mr. Thomas serves as Non-Executive Chairman of the Board of Directors of Fortune Brands Home and Security (home and security products, 2011-present), and as a member of the Board of Directors of Interpublic Group of Companies, Inc. (marketing communication, 2004-present). |
Michael E. Wiley (62) |
| Year of Election or Appointment: 2008 Mr. Wiley also serves as a Director of Asia Pacific Exploration Consolidated (international oil and gas exploration and production, 2008-present). Mr. Wiley serves as a Director of Tesoro Corporation (independent oil refiner and marketer, 2005-present), and a Director of Bill Barrett Corporation (exploration and production, 2005-present). In addition, Mr. Wiley also serves as a Director of Post Oak Bank (privately-held bank, 2004-present). Previously, Mr. Wiley served as a member of the Board of Trustees of the University of Tulsa (2000-2006; 2007-2010), as a Senior Energy Advisor of Katzenbach Partners, LLC (consulting, 2006-2007), as an Advisory Director of Riverstone Holdings (private investment), Chairman, President, and CEO of Baker Hughes, Inc. (oilfield services, 2000-2004), and as Director of Spinnaker Exploration Company (exploration and production, 2001-2005). |
+ The information above includes each Trustee's principal occupation during the last five years and other information relating to the experience, attributes, and skills relevant to each Trustee's qualifications to serve as a Trustee, which led to the conclusion that each Trustee should serve as a Trustee for the fund.
Advisory Board Members and Executive Officers:
Correspondence intended for David A. Rosow and Garnett A. Smith may be sent to Fidelity Investments, P.O. Box 55235, Boston, Massachusetts 02205-5235. Correspondence intended for each executive officer and Peter S. Lynch may be sent to Fidelity Investments, 245 Summer Street, Boston, Massachusetts 02210.
Name, Age; Principal Occupation |
Peter S. Lynch (69) |
| Year of Election or Appointment: 2003 Member of the Advisory Board of Fidelity's Equity and High Income Funds. Mr. Lynch is Vice Chairman and a Director of FMR and FMR Co., Inc. In addition, Mr. Lynch serves as a Trustee of Boston College and as the Chairman of the Inner-City Scholarship Fund. Previously, Mr. Lynch served on the Special Olympics International Board of Directors (1997-2006). |
David A. Rosow (70) |
| Year of Election or Appointment: 2012 Member of the Advisory Board of Fidelity's Equity and High Income Funds. Chairman and Chief Executive Officer of International Golf Group, Inc. (golf course development, 1989-present). Previously, Mr. Rosow served as Chairman and Chief Executive Officer of Rosow & Company, Inc. (private investment company, 1989-2011), a Lead Director of Hudson United Bancorp (2001-2006) and as a Director of TD Banknorth (1996-2006). In addition, Mr. Rosow is a member (2008-present) and President (2009-present) of the Town Council of Palm Beach, Florida. |
Garnett A. Smith (65) |
| Year of Election or Appointment: 2012 Member of the Advisory Board of Fidelity's Equity and High Income Funds. Prior to Mr. Smith's retirement, he served as Chairman and Chief Executive Officer of Inbrand Corp. (manufacturer of personal absorbent products, 1990-1997). He also served as President (1986-1990) of Inbrand Corp. Prior to his employment with Inbrand Corp., he was employed by a retail fabric chain and North Carolina National Bank. In addition, Mr. Smith is a board member of the Jackson Hole Land Trust (2009-present). |
Kenneth B. Robins (43) |
| Year of Election or Appointment: 2008 President and Treasurer of Fidelity's Equity and High Income Funds. Mr. Robins also serves as President and Treasurer (2010-present) and Assistant Treasurer (2009-present) of other Fidelity funds and is an employee of Fidelity Investments (2004-present). Previously, Mr. Robins served as Deputy Treasurer of the Fidelity funds (2005-2008) and Treasurer and Chief Financial Officer of The North Carolina Capital Management Trust: Cash and Term Portfolios (2006-2008). |
Brian B. Hogan (48) |
| Year of Election or Appointment: 2009 Vice President of Equity and High Income Funds. Mr. Hogan also serves as President of FMR's Equity Division (2009-present). Previously, Mr. Hogan served as Senior Vice President, Equity Research of FMR (2006-2009) and as a portfolio manager. |
Thomas C. Hense (49) |
| Year of Election or Appointment: 2008 or 2010 Vice President of Fidelity's High Income (2008), Small Cap (2008), and Value (2010) Funds. Previously, Mr. Hense served as a portfolio manager for Fidelity's Institutional Money Management Group (Pyramis) (2003-2008). |
Scott C. Goebel (45) |
| Year of Election or Appointment: 2008 Secretary and Chief Legal Officer (CLO) of the Fidelity funds. Mr. Goebel also serves as Secretary of Fidelity Investments Money Management, Inc. (FIMM) (2010-present) and Fidelity Research and Analysis Company (FRAC) (2010-present); Secretary and CLO of The North Carolina Capital Management Trust: Cash and Term Portfolios (2008-present); General Counsel, Secretary, and Senior Vice President of FMR (2008-present) and FMR Co., Inc. (2008-present); employed by FMR LLC or an affiliate (2001-present); Chief Legal Officer of Fidelity Management & Research (Hong Kong) Limited (2008-present) and Assistant Secretary of Fidelity Management & Research (Japan) Inc. (2008-present), and Fidelity Management & Research (U.K.) Inc. (2008-present). Previously, Mr. Goebel served as Assistant Secretary of FIMM (2008-2010), FRAC (2008-2010), and the Funds (2007-2008) and as Vice President and Secretary of Fidelity Distributors Corporation (FDC) (2005-2007). |
William C. Coffey (43) |
| Year of Election or Appointment: 2009 Assistant Secretary of Fidelity's Equity and High Income Funds. Mr. Coffey also serves as Senior Vice President and Deputy General Counsel of FMR LLC (2010-present), and is an employee of Fidelity Investments. Previously, Mr. Coffey served as Vice President and Associate General Counsel of FMR LLC (2005-2009). |
Elizabeth Paige Baumann (44) |
| Year of Election or Appointment: 2012 Anti-Money Laundering (AML) Officer of the Fidelity funds. Ms. Baumann also serves as AML Officer of The North Carolina Capital Management Trust: Cash and Term Portfolios (2012-present), Chief AML Officer of FMR LLC (2012-present), and is an employee of Fidelity Investments. Previously, Ms. Baumann served as Vice President and Deputy Anti-Money Laundering Officer (2007-2012). |
Christine Reynolds (54) |
| Year of Election or Appointment: 2008 Chief Financial Officer of the Fidelity funds. Ms. Reynolds became President of Fidelity Pricing and Cash Management Services (FPCMS) in August 2008. Ms. Reynolds served as Chief Operating Officer of FPCMS (2007-2008). Previously, Ms. Reynolds served as President, Treasurer, and Anti-Money Laundering officer of the Fidelity funds (2004-2007). |
Joseph A. Hanlon (44) |
| Year of Election or Appointment: 2012 Chief Compliance Officer of Fidelity's Equity and High Income Funds. Mr. Hanlon serves as Compliance Officer of FMR, FMR Co., Inc., Fidelity Investments Money Management, Inc. (FIMM), Fidelity Research and Analysis Company (FRAC), Fidelity Management & Research (Japan) Inc., Fidelity Management & Research (U.K.) Inc., Fidelity Management & Research (Hong Kong), and Strategic Advisers, Inc. (2009-present), as Senior Vice President of the Fidelity Asset Management Division (2009-present), and is an employee of Fidelity Investments. |
Joseph F. Zambello (55) |
| Year of Election or Appointment: 2011 Deputy Treasurer of the Fidelity funds. Mr. Zambello is an employee of Fidelity Investments. Previously, Mr. Zambello served as Vice President of FMR's Program Management Group (2009-2011) and Vice President of the Transfer Agent Oversight Group (2005-2009). |
Adrien E. Deberghes (45) |
| Year of Election or Appointment: 2008 Deputy Treasurer of Fidelity's Equity and High Income Funds. Mr. Deberghes also serves as Vice President (2011-present) and Assistant Treasurer (2010-present) of other Fidelity funds, and is an employee of Fidelity Investments (2008-present). Previously, Mr. Deberghes served as Senior Vice President of Mutual Fund Administration at State Street Corporation (2007-2008), Senior Director of Mutual Fund Administration at Investors Bank & Trust (2005-2007), and Director of Finance for Dunkin' Brands (2000-2005). |
Stephen Sadoski (41) |
| Year of Election or Appointment: 2012 Deputy Treasurer of Fidelity's Equity and High Income Funds. Mr. Sadoski also serves as Deputy Treasurer of other Fidelity funds (2013-present) and is an employee of Fidelity Investments (2012-present). Previously, Mr. Sadoski served as Assistant Treasurer of Fidelity's Fixed Income and Asset Allocation Funds (2012-2013), an assistant chief accountant in the Division of Investment Management of the Securities and Exchange Commission (SEC) (2009-2012) and as a senior manager at Deloitte & Touche (1997-2009). |
Stacie Smith (38) |
| Year of Election or Appointment: 2013 Deputy Treasurer of Fidelity's Equity and High Income Funds. Ms. Smith is an employee of Fidelity Investments (2009-present). Previously, Ms. Smith served as Senior Audit Manager of Ernst & Young LLP (1996-2009). |
Stephanie J. Dorsey (43) |
| Year of Election or Appointment: 2010 Assistant Treasurer of Fidelity's Equity and High Income Funds. Ms. Dorsey also serves as President and Treasurer (2013-present) and Assistant Treasurer (2012-present) of other Fidelity funds and is an employee of Fidelity Investments (2008-present). Previously, Ms. Dorsey served as Deputy Treasurer of Fidelity's Fixed Income and Asset Allocation Funds (2008-2013), Treasurer (2004-2008) of the JPMorgan Mutual Funds and Vice President (2004-2008) of JPMorgan Chase Bank. |
John R. Hebble (54) |
| Year of Election or Appointment: 2009 Assistant Treasurer of Fidelity's Equity and High Income Funds. Mr. Hebble also serves as President (2011-present), Treasurer, and Chief Financial Officer of The North Carolina Capital Management Trust: Cash and Term Portfolios (2008-present) and is an employee of Fidelity Investments. Previously, Mr. Hebble served as President and Treasurer of Fidelity's Fixed Income and Asset Allocation Funds (2008-2013). |
Gary W. Ryan (54) |
| Year of Election or Appointment: 2005 Assistant Treasurer of the Fidelity funds. Mr. Ryan is an employee of Fidelity Investments. Previously, Mr. Ryan served as Vice President of Fund Reporting in Fidelity Pricing and Cash Management Services (FPCMS) (1999-2005). |
Jonathan Davis (44) |
| Year of Election or Appointment: 2010 Assistant Treasurer of the Fidelity funds. Mr. Davis is also Assistant Treasurer of Fidelity Rutland Square Trust II and Fidelity Commonwealth Trust II. Mr. Davis is an employee of Fidelity Investments. Previously, Mr. Davis served as Vice President and Associate General Counsel of FMR LLC (2003-2010). |
Annual Report
Mid Cap Value designates 100% of the dividends distributed during the fiscal year as qualifying for the dividends-received deduction for corporate shareholders.
Mid Cap Value designates 100% of the dividends distributed during the fiscal year as amounts which may be taken into account as a dividend for purposes of the maximum rate under section 1(h)(11) of the Internal Revenue Code.
The fund will notify shareholders in January 2014 of amounts for use in preparing 2013 income tax returns.
Annual Report
Investment Adviser
Fidelity Management & Research Company
Boston, MA
Investment Sub-Advisers
FMR Co., Inc.
Fidelity Management & Research
(U.K.) Inc.
Fidelity Management & Research
(Hong Kong) Limited
Fidelity Management & Research
(Japan) Inc.
General Distributor
Fidelity Distributors Corporation
Smithfield, RI
Transfer and Service Agents
Fidelity Investments Institutional
Operations Company, Inc.
Boston, MA
Fidelity Service Company, Inc.
Boston, MA
Custodian
Citibank, N.A.
New York, NY
The Fidelity Telephone Connection
Mutual Fund 24-Hour Service
Exchanges/Redemptions
and Account Assistance 1-800-544-6666
Product Information 1-800-544-6666
Retirement Accounts 1-800-544-4774
(8 a.m. - 9 p.m.)
TDD Service 1-800-544-0118
for the deaf and hearing impaired
(9 a.m. - 9 p.m. Eastern time)
Fidelity Automated Service
Telephone (FAST®)
1-800-544-5555
Automated line for quickest service
(Fidelity Investment logo)(registered trademark)
Corporate Headquarters
245 Summer St., Boston, MA 02210
www.fidelity.com
MCV-UANN-0313
1.900179.103
(Fidelity Investment logo)(registered trademark)
Fidelity Advisor®
Mid Cap Value
Fund - Class A, Class T, Class B
and Class C
Annual Report
January 31, 2013
(Fidelity Cover Art)
Class A, Class T, Class B, and
Class C are classes of Fidelity®
Mid Cap Value Fund
Contents
Performance | (Click Here) | How the fund has done over time. |
Management's Discussion of Fund Performance | (Click Here) | The Portfolio Manager's review of fund performance and strategy. |
Shareholder Expense Example | (Click Here) | An example of shareholder expenses. |
Investment Changes | (Click Here) | A summary of major shifts in the fund's investments over the past six months. |
Investments | (Click Here) | A complete list of the fund's investments with their market values. |
Financial Statements | (Click Here) | Statements of assets and liabilities, operations, and changes in net assets, as well as financial highlights. |
Notes | (Click Here) | Notes to the financial statements. |
Report of Independent Registered Public Accounting Firm | (Click Here) | |
Trustees and Officers | (Click Here) | |
Distributions | (Click Here) | |
To view a fund's proxy voting guidelines and proxy voting record for the 12-month period ended June 30, visit http://www.fidelity.com/proxyvotingresults or visit the Securities and Exchange Commission's (SEC) web site at http://www.sec.gov. You may also call 1-877-208-0098 to request a free copy of the proxy voting guidelines.
Standard & Poor's, S&P and S&P 500 are registered service marks of The McGraw-Hill Companies, Inc. and have been licensed for use by Fidelity Distributors Corporation.
Other third-party marks appearing herein are the property of their respective owners.
All other marks appearing herein are registered or unregistered trademarks or service marks of FMR LLC or an affiliated company. © 2013 FMR LLC. All rights reserved.
This report and the financial statements contained herein are submitted for the general information of the shareholders of the fund. This report is not authorized for distribution to prospective investors in the fund unless preceded or accompanied by an effective prospectus.
A fund files its complete schedule of portfolio holdings with the SEC for the first and third quarters of each fiscal year on Form N-Q. Forms N-Q are available on the SEC's web site at http://www.sec.gov. A fund's Forms N-Q may be reviewed and copied at the SEC's Public Reference Room in Washington, DC. Information regarding the operation of the SEC's Public Reference Room may be obtained by calling 1-800-SEC-0330. For a complete list of a fund's portfolio holdings, view the most recent holdings listing, semiannual report, or annual report on Fidelity's web site at http://www.fidelity.com, http://www.advisor.fidelity.com, or http://www.401k.com, as applicable.
NOT FDIC INSURED • MAY LOSE VALUE • NO BANK GUARANTEE
Neither the fund nor Fidelity Distributors Corporation is a bank.
Annual Report
Average annual total return reflects the change in the value of an investment, assuming reinvestment of the class' distributions from dividend income and capital gains (the profits earned upon the sale of securities that have grown in value, if any) and assuming a constant rate of performance each year. The $10,000 table and the fund's returns do not reflect the deduction of taxes that a shareholder would pay on fund distributions or the redemption of fund shares. During periods of reimbursement by Fidelity, a fund's total return will be greater than it would be had the reimbursement not occurred. How a fund did yesterday is no guarantee of how it will do tomorrow.
Average Annual Total Returns
Periods ended January 31, 2013 | Past 1
year | Past 5
years | Past 10
years |
Class A (incl. 5.75% sales charge) A | 15.67% | 4.68% | 9.99% |
Class T (incl. 3.50% sales charge) B | 18.14% | 4.90% | 10.08% |
Class B (incl. contingent deferred sales charge) C | 16.79% | 4.81% | 10.16% |
Class C (incl. contingent deferred sales charge) D | 20.73% | 5.13% | 10.14% |
A Class A shares bear a 0.25% 12b-1 fee. The initial offering of Class A shares took place on February 13, 2007. Returns prior to February 13, 2007 are those of Fidelity® Mid Cap Value Fund, the original class of the fund, which has no 12b-1 fee. Had Class A's 12b-1 fee been reflected, returns prior to February 13, 2007 would have been lower.
B Class T shares bear a 0.50% 12b-1 fee. The initial offering of Class T shares took place on February 13, 2007. Returns prior to February 13, 2007 are those of Fidelity® Mid Cap Value Fund, the original class of the fund, which has no 12b-1 fee. Had Class T's 12b-1 fee been reflected, returns prior to February 13, 2007 would have been lower.
C Class B shares bear a 1.00% 12b-1 fee. The initial offering of Class B shares took place on February 13, 2007. Returns prior to February 13, 2007 are those of Fidelity Mid Cap Value Fund, the original class of the fund, which has no 12b-1 fee. Had Class B's 12b-1 fee been reflected, returns prior to February 13, 2007 would have been lower. Class B shares' contingent deferred sales charge included in the past one year, past five years, and past ten years total return figures are 5%, 2%, and 0%, respectively.
D Class C shares bear a 1.00% 12b-1 fee. The initial offering of Class C shares took place on February 13, 2007. Returns prior to February 13, 2007 are those of Fidelity Mid Cap Value Fund, the original class of the fund, which has no 12b-1 fee. Had Class C's 12b-1 fee been reflected, returns prior to February 13, 2007 would have been lower. Class C shares' contingent deferred sales charge included in the past one year, past five years, and past ten years total return figures are 1%, 0%, and 0%, respectively.
Annual Report
$10,000 Over 10 Years
Let's say hypothetically that $10,000 was invested in Fidelity Advisor® Mid Cap Value Fund - Class A on January 31, 2003. The chart shows how the value of your investment would have changed, and also shows how the Russell Midcap® Value Index performed over the same period. The initial offering of Class A took place on February 13, 2007. See the previous page for additional information regarding the performance of Class A.
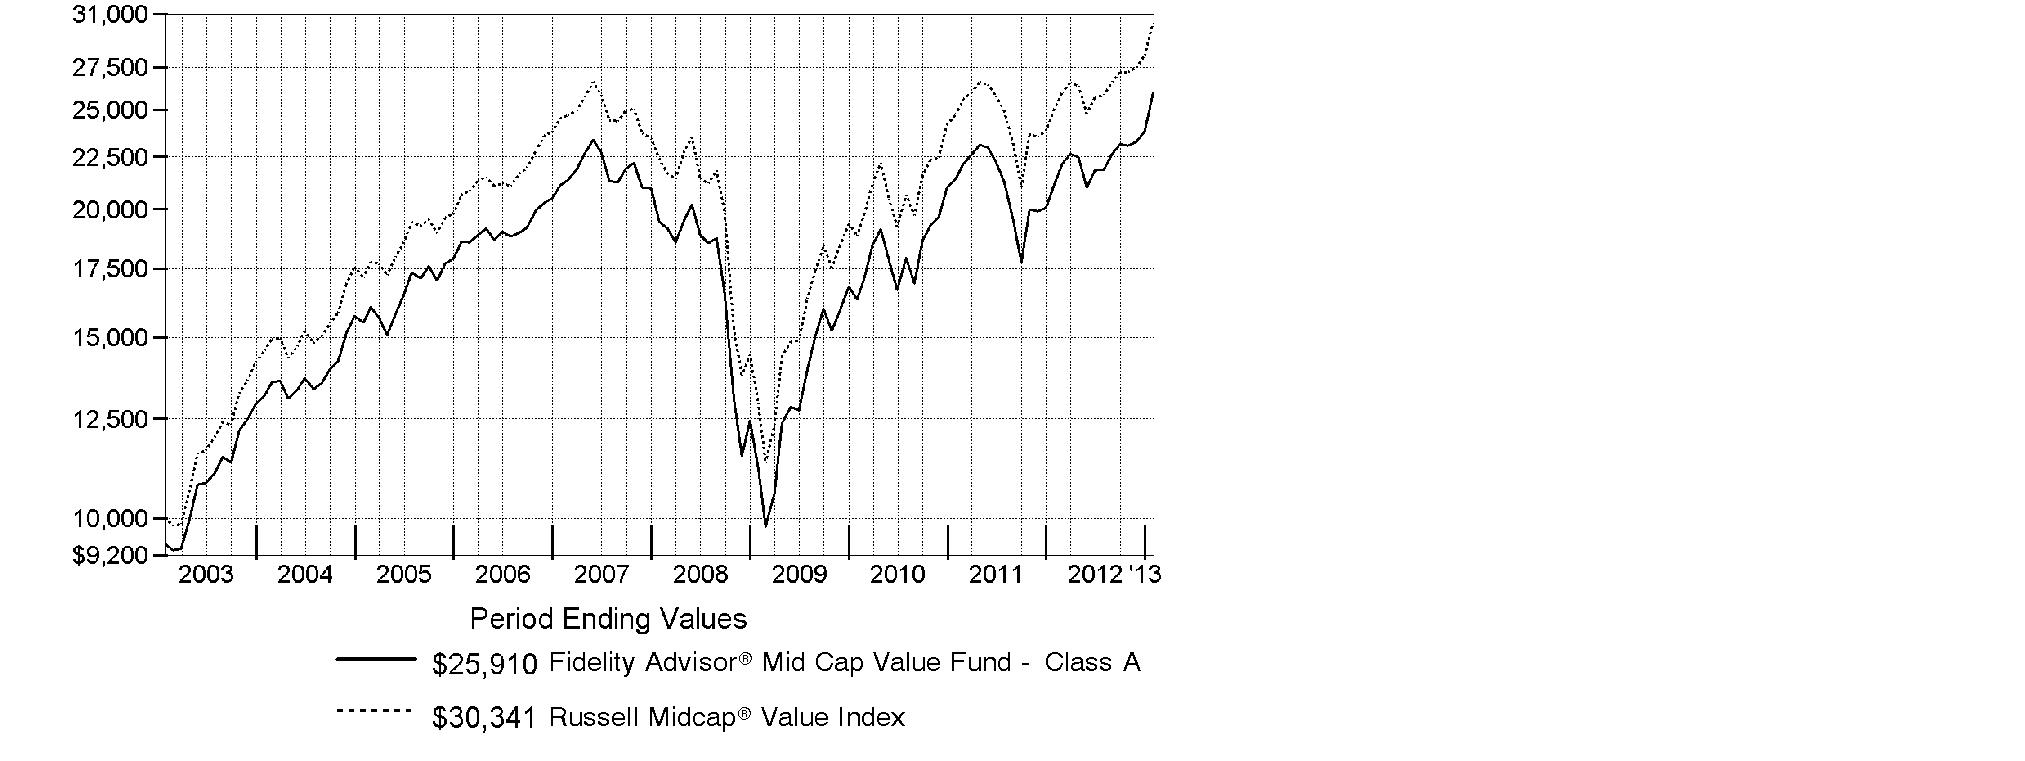
Annual Report
Market Recap: Improvement in the U.S. economy helped lift equity benchmarks to double-digit gains for the year ending January 31, 2013, overcoming moments of volatility driven by sovereign debt woes in Europe, slower economic growth in China and gridlock in Congress. Major U.S. benchmarks hit multiyear highs during the period, encouraged by a rebounding domestic housing market and solid corporate earnings reports. The broad-based S&P 500® Index rose 16.78% for the year, crossing the milestone 1,500 mark near period end. The technology-heavy Nasdaq Composite Index® added 13.13%, and the blue-chip-laden Dow Jones Industrial AverageSM gained 12.75%. Early in the period, stocks rose on positive U.S. economic news and proposed bailouts in Europe. Although fear resurfaced in April and May, equities rebounded in June on central bank stimulus and new life in the housing market. In September, pre-election jitters and the looming "fiscal cliff" of tax hikes and federal spending cuts fueled some profit-taking, followed by a brief post-election sell-off. But stocks proved resilient, as investors continued to pile into riskier assets. Gains were broad-based, with eight of the 10 sectors in the S&P 500® posting double-digit returns. Despite eurozone turmoil, foreign developed-markets stocks rose strongly, with the MSCI® EAFE® Index adding 17.41%.
Comments from Bruce Dirks, Portfolio Manager of Fidelity Advisor® Mid Cap Value Fund: For the year, the fund's Class A, Class T, Class B and Class C shares returned 22.73%, 22.42%, 21.79% and 21.73%, respectively (excluding sales charges), outpacing the 21.34% gain of the Russell Midcap® Value Index. Strong security selection in financials, energy, consumer discretionary, materials and health care fueled the fund's solid relative return. On the downside, adverse stock picking and industry positioning in information technology, industrials and, to a lesser extent, telecommunication services hampered results. The top individual contributors included hospital operator Community Health Systems, oil refiners Valero Energy and Marathon Petroleum, appliance manufacturer Whirlpool, credit card issuer Discover Financial Services and utility Sempra Energy. The primary individual detractors were semiconductor makers Marvell Technology Group and Advanced Micro Devices - the latter being an out-of-benchmark investment - Timken, a maker of specialty steel products, trucking and logistics provider Con-way and flash memory storage developer SanDisk. Most of the stocks mentioned were sold from the fund during the period.
The views expressed above reflect those of the portfolio manager(s) only through the end of the period as stated on the cover of this report and do not necessarily represent the views of Fidelity or any other person in the Fidelity organization. Any such views are subject to change at any time based upon market or other conditions and Fidelity disclaims any responsibility to update such views. These views may not be relied on as investment advice and, because investment decisions for a Fidelity fund are based on numerous factors, may not be relied on as an indication of trading intent on behalf of any Fidelity fund.
Annual Report
Shareholder Expense Example
As a shareholder of the Fund, you incur two types of costs: (1) transaction costs including sales charges (loads) on purchase payments or redemption proceeds, redemption fees and (2) ongoing costs, including management fees, distribution and/or service (12b-1) fees and other Fund expenses. This Example is intended to help you understand your ongoing costs (in dollars) of investing in the Fund and to compare these costs with the ongoing costs of investing in other mutual funds.
The Example is based on an investment of $1,000 invested at the beginning of the period and held for the entire period (August 1, 2012 to January 31, 2013).
Actual Expenses
The first line of the accompanying table for each class of the Fund provides information about actual account values and actual expenses. You may use the information in this line, together with the amount you invested, to estimate the expenses that you paid over the period. Simply divide your account value by $1,000.00 (for example, an $8,600 account value divided by $1,000.00 = 8.6), then multiply the result by the number in the first line for a class of the Fund under the heading entitled "Expenses Paid During Period" to estimate the expenses you paid on your account during this period. A small balance maintenance fee of $12.00 that is charged once a year may apply for certain accounts with a value of less than $2,000. This fee is not included in the table below. If it was, the estimate of expenses you paid during the period would be higher, and your ending account value lower, by this amount. In addition, the Fund, as a shareholder in the underlying Fidelity Central Funds, will indirectly bear its pro-rata share of the fees and expenses incurred by the underlying Fidelity Central Funds. These fees and expenses are not included in the Fund's annualized expense ratio used to calculate the expense estimate in the table below.
Hypothetical Example for Comparison Purposes
The second line of the accompanying table for each class of the Fund provides information about hypothetical account values and hypothetical expenses based on a Class' actual expense ratio and an assumed rate of return of 5% per year before expenses, which is not the Class' actual return. The hypothetical account values and expenses may not be used to estimate the actual ending account balance or expenses you paid for the period. You may use this information to compare the ongoing costs of investing in the Fund and other funds. To do so, compare this 5% hypothetical example with the 5% hypothetical examples that appear in the shareholder reports of the other funds. A small balance maintenance fee of $12.00 that is charged once a year may apply for certain accounts with a value of less than $2,000. This fee is not included in the table below. If it was, the estimate of expenses you paid during the period would be higher, and your ending account value lower, by this amount. In addition, the Fund, as a shareholder in the underlying Fidelity Central Funds, will indirectly bear its pro-rata share of the fees and expenses incurred by the underlying Fidelity Central Funds. These fees and expenses are not included in the Fund's annualized expense ratio used to calculate the expense estimate in the table below.
Please note that the expenses shown in the table are meant to highlight your ongoing costs only and do not reflect any transaction costs. Therefore, the second line of the table is useful in comparing ongoing costs only, and will not help you determine the relative total costs of owning different funds. In addition, if these transactional costs were included, your costs would have been higher.
Annual Report
| Annualized
Expense Ratio | Beginning
Account Value
August 1, 2012 | Ending
Account Value
January 31, 2013 | Expenses Paid
During Period*
August 1, 2012
to January 31, 2013 |
Class A | 1.13% | | | |
Actual | | $ 1,000.00 | $ 1,185.50 | $ 6.21 |
HypotheticalA | | $ 1,000.00 | $ 1,019.46 | $ 5.74 |
Class T | 1.39% | | | |
Actual | | $ 1,000.00 | $ 1,184.60 | $ 7.63 |
HypotheticalA | | $ 1,000.00 | $ 1,018.15 | $ 7.05 |
Class B | 1.88% | | | |
Actual | | $ 1,000.00 | $ 1,181.80 | $ 10.31 |
HypotheticalA | | $ 1,000.00 | $ 1,015.69 | $ 9.53 |
Class C | 1.89% | | | |
Actual | | $ 1,000.00 | $ 1,181.10 | $ 10.36 |
HypotheticalA | | $ 1,000.00 | $ 1,015.63 | $ 9.58 |
Mid Cap Value | .81% | | | |
Actual | | $ 1,000.00 | $ 1,187.60 | $ 4.45 |
HypotheticalA | | $ 1,000.00 | $ 1,021.06 | $ 4.12 |
Institutional Class | .86% | | | |
Actual | | $ 1,000.00 | $ 1,188.00 | $ 4.73 |
HypotheticalA | | $ 1,000.00 | $ 1,020.81 | $ 4.37 |
A 5% return per year before expenses
* Expenses are equal to each Class' annualized expense ratio, multiplied by the average account value over the period, multiplied by 184/366 (to reflect the one-half year period).
Annual Report
Investment Changes (Unaudited)
Top Ten Stocks as of January 31, 2013 |
| % of fund's
net assets | % of fund's net assets
6 months ago |
Valero Energy Corp. | 1.8 | 1.6 |
Marathon Petroleum Corp. | 1.8 | 1.5 |
International Paper Co. | 1.7 | 1.7 |
CIGNA Corp. | 1.6 | 1.1 |
Edison International | 1.6 | 0.0 |
Symantec Corp. | 1.5 | 0.0 |
Fifth Third Bancorp | 1.5 | 1.3 |
Ventas, Inc. | 1.5 | 1.4 |
SunTrust Banks, Inc. | 1.5 | 1.4 |
PPL Corp. | 1.4 | 1.8 |
| 15.9 | |
Top Five Market Sectors as of January 31, 2013 |
| % of fund's
net assets | % of fund's net assets
6 months ago |
Financials | 29.2 | 30.1 |
Industrials | 11.3 | 10.2 |
Information Technology | 10.0 | 10.1 |
Energy | 9.7 | 9.5 |
Utilities | 9.6 | 11.6 |
Asset Allocation (% of fund's net assets) |
As of January 31, 2013* | As of July 31, 2012** |
| Stocks 98.6% | | | Stocks 99.5% | |
| Short-Term
Investments and
Net Other Assets
(Liabilities) 1.4% | | | Short-Term
Investments and
Net Other Assets
(Liabilities) 0.5% | |
* Foreign investments | 3.7% | | ** Foreign investments | 5.2% | |

Annual Report
Investments January 31, 2013
Showing Percentage of Net Assets
Common Stocks - 98.6% |
| Shares | | Value |
CONSUMER DISCRETIONARY - 9.2% |
Diversified Consumer Services - 0.8% |
DeVry, Inc. | 223,100 | | $ 5,615,427 |
Household Durables - 2.5% |
Jarden Corp. | 126,200 | | 7,425,608 |
Whirlpool Corp. | 82,500 | | 9,518,850 |
| | 16,944,458 |
Media - 1.1% |
Gannett Co., Inc. | 394,600 | | 7,745,998 |
Multiline Retail - 1.3% |
Macy's, Inc. | 219,000 | | 8,652,690 |
Specialty Retail - 3.5% |
Best Buy Co., Inc. | 199,600 | | 3,245,496 |
Foot Locker, Inc. | 230,600 | | 7,921,110 |
GameStop Corp. Class A (d) | 158,800 | | 3,684,160 |
Staples, Inc. | 691,000 | | 9,314,680 |
| | 24,165,446 |
TOTAL CONSUMER DISCRETIONARY | | 63,124,019 |
CONSUMER STAPLES - 5.4% |
Beverages - 1.0% |
Molson Coors Brewing Co. Class B | 146,100 | | 6,600,798 |
Food Products - 2.8% |
Campbell Soup Co. (d) | 105,800 | | 3,883,918 |
ConAgra Foods, Inc. | 268,100 | | 8,764,189 |
Tyson Foods, Inc. Class A | 303,700 | | 6,717,844 |
| | 19,365,951 |
Household Products - 0.9% |
Energizer Holdings, Inc. | 74,300 | | 6,464,843 |
Tobacco - 0.7% |
Lorillard, Inc. | 128,600 | | 5,024,402 |
TOTAL CONSUMER STAPLES | | 37,455,994 |
ENERGY - 9.7% |
Energy Equipment & Services - 2.4% |
Cameron International Corp. (a) | 126,500 | | 8,008,715 |
Helmerich & Payne, Inc. | 128,100 | | 8,241,954 |
| | 16,250,669 |
Common Stocks - continued |
| Shares | | Value |
ENERGY - continued |
Oil, Gas & Consumable Fuels - 7.3% |
Denbury Resources, Inc. (a) | 473,300 | | $ 8,817,579 |
Hess Corp. | 108,500 | | 7,286,860 |
Marathon Petroleum Corp. | 164,945 | | 12,240,568 |
Murphy Oil Corp. | 161,700 | | 9,624,384 |
Valero Energy Corp. | 282,900 | | 12,371,218 |
| | 50,340,609 |
TOTAL ENERGY | | 66,591,278 |
FINANCIALS - 29.2% |
Capital Markets - 2.8% |
Apollo Global Management LLC Class A | 241,462 | | 5,377,359 |
KKR & Co. LP | 403,700 | | 6,814,456 |
The Blackstone Group LP | 366,300 | | 6,776,550 |
| | 18,968,365 |
Commercial Banks - 7.2% |
Comerica, Inc. | 197,600 | | 6,789,536 |
Fifth Third Bancorp | 639,600 | | 10,419,084 |
FirstMerit Corp. | 419,700 | | 6,392,031 |
Huntington Bancshares, Inc. | 1,171,600 | | 8,154,336 |
KeyCorp | 810,700 | | 7,620,580 |
SunTrust Banks, Inc. | 359,400 | | 10,196,178 |
| | 49,571,745 |
Consumer Finance - 1.2% |
SLM Corp. | 481,700 | | 8,135,913 |
Diversified Financial Services - 1.1% |
The NASDAQ Stock Market, Inc. | 271,300 | | 7,683,216 |
Insurance - 6.1% |
Allied World Assurance Co. Holdings Ltd. | 46,000 | | 3,902,180 |
Everest Re Group Ltd. | 73,800 | | 8,546,778 |
Hartford Financial Services Group, Inc. | 400,400 | | 9,929,920 |
Lincoln National Corp. | 309,800 | | 8,978,004 |
Reinsurance Group of America, Inc. | 81,100 | | 4,654,329 |
Validus Holdings Ltd. | 162,300 | | 5,909,343 |
| | 41,920,554 |
Real Estate Investment Trusts - 9.6% |
American Campus Communities, Inc. | 134,800 | | 6,277,636 |
AvalonBay Communities, Inc. | 69,500 | | 9,020,405 |
Camden Property Trust (SBI) | 101,300 | | 7,029,207 |
Common Stocks - continued |
| Shares | | Value |
FINANCIALS - continued |
Real Estate Investment Trusts - continued |
DDR Corp. | 273,300 | | $ 4,534,047 |
Extra Space Storage, Inc. | 139,300 | | 5,549,712 |
MFA Financial, Inc. | 667,300 | | 5,999,027 |
Ventas, Inc. | 156,000 | | 10,341,240 |
Vornado Realty Trust | 111,000 | | 9,375,060 |
Weyerhaeuser Co. | 271,100 | | 8,165,532 |
| | 66,291,866 |
Real Estate Management & Development - 1.2% |
Jones Lang LaSalle, Inc. | 86,400 | | 7,960,896 |
TOTAL FINANCIALS | | 200,532,555 |
HEALTH CARE - 7.1% |
Health Care Providers & Services - 4.5% |
CIGNA Corp. | 193,200 | | 11,271,288 |
Community Health Systems, Inc. | 173,000 | | 6,631,090 |
McKesson Corp. | 62,900 | | 6,618,967 |
Omnicare, Inc. | 159,800 | | 6,224,210 |
| | 30,745,555 |
Pharmaceuticals - 2.6% |
Actavis, Inc. (a) | 59,800 | | 5,166,122 |
Endo Pharmaceuticals Holdings, Inc. (a) | 241,900 | | 7,658,554 |
Mylan, Inc. (a) | 186,600 | | 5,275,182 |
| | 18,099,858 |
TOTAL HEALTH CARE | | 48,845,413 |
INDUSTRIALS - 11.3% |
Aerospace & Defense - 1.7% |
Alliant Techsystems, Inc. | 109,600 | | 7,093,312 |
Esterline Technologies Corp. (a) | 73,400 | | 4,873,026 |
| | 11,966,338 |
Airlines - 1.1% |
Delta Air Lines, Inc. (a) | 558,900 | | 7,763,121 |
Commercial Services & Supplies - 1.2% |
Avery Dennison Corp. | 206,000 | | 7,933,060 |
Construction & Engineering - 1.1% |
URS Corp. | 182,903 | | 7,586,816 |
Common Stocks - continued |
| Shares | | Value |
INDUSTRIALS - continued |
Electrical Equipment - 1.0% |
General Cable Corp. (a) | 213,500 | | $ 7,177,870 |
Machinery - 2.2% |
Oshkosh Truck Corp. (a) | 189,700 | | 7,432,446 |
Terex Corp. (a) | 239,600 | | 7,758,248 |
| | 15,190,694 |
Professional Services - 1.2% |
Equifax, Inc. | 60,000 | | 3,522,000 |
Towers Watson & Co. | 73,000 | | 4,458,840 |
| | 7,980,840 |
Trading Companies & Distributors - 1.8% |
MRC Global, Inc. | 168,000 | | 5,162,640 |
WESCO International, Inc. (a) | 94,627 | | 6,901,147 |
| | 12,063,787 |
TOTAL INDUSTRIALS | | 77,662,526 |
INFORMATION TECHNOLOGY - 10.0% |
Communications Equipment - 1.0% |
Brocade Communications Systems, Inc. (a) | 1,268,400 | | 7,255,248 |
Computers & Peripherals - 1.2% |
Western Digital Corp. | 175,300 | | 8,239,100 |
IT Services - 1.2% |
Computer Sciences Corp. | 193,100 | | 8,071,580 |
Office Electronics - 1.4% |
Xerox Corp. | 1,184,900 | | 9,491,049 |
Semiconductors & Semiconductor Equipment - 1.7% |
Avago Technologies Ltd. | 196,400 | | 7,025,228 |
Skyworks Solutions, Inc. (a) | 210,400 | | 5,036,976 |
| | 12,062,204 |
Software - 3.5% |
CA Technologies, Inc. | 358,300 | | 8,893,006 |
Symantec Corp. (a) | 489,300 | | 10,652,061 |
Synopsys, Inc. (a) | 135,800 | | 4,541,152 |
| | 24,086,219 |
TOTAL INFORMATION TECHNOLOGY | | 69,205,400 |
Common Stocks - continued |
| Shares | | Value |
MATERIALS - 5.9% |
Chemicals - 1.8% |
Ashland, Inc. | 62,900 | | $ 4,938,279 |
Eastman Chemical Co. | 100,800 | | 7,171,920 |
| | 12,110,199 |
Containers & Packaging - 0.9% |
Ball Corp. | 147,500 | | 6,566,700 |
Metals & Mining - 1.5% |
Commercial Metals Co. | 337,100 | | 5,612,715 |
Reliance Steel & Aluminum Co. | 72,600 | | 4,698,672 |
| | 10,311,387 |
Paper & Forest Products - 1.7% |
International Paper Co. | 281,700 | | 11,668,014 |
TOTAL MATERIALS | | 40,656,300 |
TELECOMMUNICATION SERVICES - 1.2% |
Diversified Telecommunication Services - 0.8% |
CenturyLink, Inc. | 125,700 | | 5,084,565 |
Wireless Telecommunication Services - 0.4% |
Sprint Nextel Corp. (a) | 527,000 | | 2,967,010 |
TOTAL TELECOMMUNICATION SERVICES | | 8,051,575 |
UTILITIES - 9.6% |
Electric Utilities - 7.3% |
Edison International | 229,500 | | 11,059,605 |
Hawaiian Electric Industries, Inc. | 20,400 | | 550,188 |
IDACORP, Inc. | 148,800 | | 6,905,808 |
NV Energy, Inc. | 418,700 | | 7,925,991 |
Pinnacle West Capital Corp. | 125,300 | | 6,688,514 |
PNM Resources, Inc. | 323,000 | | 6,899,280 |
PPL Corp. | 328,000 | | 9,935,120 |
| | 49,964,506 |
Gas Utilities - 0.9% |
UGI Corp. | 176,500 | | 6,219,860 |
Common Stocks - continued |
| Shares | | Value |
UTILITIES - continued |
Multi-Utilities - 1.4% |
DTE Energy Co. | 153,700 | | $ 9,730,747 |
TOTAL UTILITIES | | 65,915,113 |
TOTAL COMMON STOCKS (Cost $596,508,563) |
678,040,173
|
Money Market Funds - 1.8% |
| | | |
Fidelity Cash Central Fund, 0.16% (b) | 7,500,179 | | 7,500,179 |
Fidelity Securities Lending Cash Central Fund, 0.15% (b)(c) | 4,798,250 | | 4,798,250 |
TOTAL MONEY MARKET FUNDS (Cost $12,298,429) |
12,298,429
|
TOTAL INVESTMENT PORTFOLIO - 100.4% (Cost $608,806,992) | | 690,338,602 |
NET OTHER ASSETS (LIABILITIES) - (0.4)% | | (2,890,871) |
NET ASSETS - 100% | $ 687,447,731 |
Legend |
(a) Non-income producing |
(b) Affiliated fund that is available only to investment companies and other accounts managed by Fidelity Investments. The rate quoted is the annualized seven-day yield of the fund at period end. A complete unaudited listing of the fund's holdings as of its most recent quarter end is available upon request. In addition, each Fidelity Central Fund's financial statements, which are not covered by the Fund's Report of Independent Registered Public Accounting Firm, are available on the SEC's website or upon request. |
(c) Investment made with cash collateral received from securities on loan. |
(d) Security or a portion of the security is on loan at period end. |
Affiliated Central Funds |
Information regarding fiscal year to date income earned by the Fund from investments in Fidelity Central Funds is as follows: |
Fund | Income earned |
Fidelity Cash Central Fund | $ 5,734 |
Fidelity Securities Lending Cash Central Fund | 122,164 |
Total | $ 127,898 |
Other Information |
All investments are categorized as Level 1 under the Fair Value Hierarchy. The inputs or methodology used for valuing securities may not be an indication of the risk associated with investing in those securities. For more information on valuation inputs, please refer to the Investment Valuation section in the accompanying Notes to Financial Statements. |
See accompanying notes which are an integral part of the financial statements.
Annual Report
Statement of Assets and Liabilities
| January 31, 2013 |
| | |
Assets | | |
Investment in securities, at value (including securities loaned of $4,665,358) - See accompanying schedule: Unaffiliated issuers (cost $596,508,563) | $ 678,040,173 | |
Fidelity Central Funds (cost $12,298,429) | 12,298,429 | |
Total Investments (cost $608,806,992) | | $ 690,338,602 |
Receivable for investments sold | | 12,067,676 |
Receivable for fund shares sold | | 2,544,074 |
Dividends receivable | | 397,654 |
Distributions receivable from Fidelity Central Funds | | 3,138 |
Prepaid expenses | | 1,171 |
Other receivables | | 88,145 |
Total assets | | 705,440,460 |
| | |
Liabilities | | |
Payable for investments purchased | $ 11,795,723 | |
Payable for fund shares redeemed | 905,587 | |
Accrued management fee | 288,786 | |
Distribution and service plan fees payable | 14,791 | |
Other affiliated payables | 138,743 | |
Other payables and accrued expenses | 50,849 | |
Collateral on securities loaned, at value | 4,798,250 | |
Total liabilities | | 17,992,729 |
| | |
Net Assets | | $ 687,447,731 |
Net Assets consist of: | | |
Paid in capital | | $ 610,264,039 |
Accumulated undistributed net realized gain (loss) on investments | | (4,347,918) |
Net unrealized appreciation (depreciation) on investments | | 81,531,610 |
Net Assets | | $ 687,447,731 |
See accompanying notes which are an integral part of the financial statements.
Annual Report
Financial Statements - continued
Statement of Assets and Liabilities - continued
| January 31, 2013 |
| | |
Calculation of Maximum Offering Price Class A:
Net Asset Value and redemption price per share ($24,436,123 ÷ 1,270,011 shares) | | $ 19.24 |
| | |
Maximum offering price per share (100/94.25 of $19.24) | | $ 20.41 |
Class T:
Net Asset Value and redemption price per share ($8,358,357 ÷ 435,167 shares) | | $ 19.21 |
| | |
Maximum offering price per share (100/96.50 of $19.21) | | $ 19.91 |
Class B:
Net Asset Value and offering price per share ($1,533,480 ÷ 80,601 shares)A | | $ 19.03 |
| | |
Class C:
Net Asset Value and offering price per share ($6,820,179 ÷ 360,217 shares)A | | $ 18.93 |
| | |
Mid Cap Value:
Net Asset Value, offering price and redemption price per share ($638,424,992 ÷ 32,958,886 shares) | | $ 19.37 |
| | |
Institutional Class:
Net Asset Value, offering price and redemption price per share ($7,874,600 ÷ 408,307 shares) | | $ 19.29 |
A Redemption price per share is equal to net asset value less any applicable contingent deferred sales charge.
See accompanying notes which are an integral part of the financial statements.
Annual Report
Statement of Operations
| Year ended January 31, 2013 |
| | |
Investment Income | | |
Dividends | | $ 13,395,784 |
Income from Fidelity Central Funds | | 127,898 |
Total income | | 13,523,682 |
| | |
Expenses | | |
Management fee
Basic fee | $ 3,314,165 | |
Performance adjustment | (132,746) | |
Transfer agent fees | 1,464,650 | |
Distribution and service plan fees | 154,959 | |
Accounting and security lending fees | 223,431 | |
Custodian fees and expenses | 28,240 | |
Independent trustees' compensation | 3,867 | |
Registration fees | 88,262 | |
Audit | 54,995 | |
Legal | 2,484 | |
Miscellaneous | 6,457 | |
Total expenses before reductions | 5,208,764 | |
Expense reductions | (191,114) | 5,017,650 |
Net investment income (loss) | | 8,506,032 |
Realized and Unrealized Gain (Loss) Net realized gain (loss) on: | | |
Investment securities: | | |
Unaffiliated issuers | 58,043,389 | |
Investment not meeting investment restrictions | 1,279 | |
Total net realized gain (loss) | | 58,044,668 |
Change in net unrealized appreciation (depreciation) on investment securities | | 59,980,492 |
Net gain (loss) | | 118,025,160 |
Net increase (decrease) in net assets resulting from operations | | $ 126,531,192 |
See accompanying notes which are an integral part of the financial statements.
Annual Report
Financial Statements - continued
Statement of Changes in Net Assets
| Year ended
January 31,
2013 | Year ended
January 31,
2012 |
Increase (Decrease) in Net Assets | | |
Operations | | |
Net investment income (loss) | $ 8,506,032 | $ 4,545,431 |
Net realized gain (loss) | 58,044,668 | 70,353,241 |
Change in net unrealized appreciation (depreciation) | 59,980,492 | (90,350,275) |
Net increase (decrease) in net assets resulting
from operations | 126,531,192 | (15,451,603) |
Distributions to shareholders from net investment income | (8,438,509) | (4,101,848) |
Share transactions - net increase (decrease) | (21,044,685) | (97,570,396) |
Redemption fees | 8,162 | 28,676 |
Total increase (decrease) in net assets | 97,056,160 | (117,095,171) |
| | |
Net Assets | | |
Beginning of period | 590,391,571 | 707,486,742 |
End of period (including distributions in excess of net investment income of $0 and $137,586, respectively) | $ 687,447,731 | $ 590,391,571 |
See accompanying notes which are an integral part of the financial statements.
Annual Report
Financial Highlights - Class A
Years ended January 31, | 2013 | 2012 | 2011 | 2010 | 2009 |
Selected Per-Share Data | | | | | |
Net asset value, beginning of period | $ 15.87 | $ 16.16 | $ 12.35 | $ 8.53 | $ 15.05 |
Income from Investment Operations | | | | |
Net investment income (loss) C | .20 | .07 | - G | .07 | .09 |
Net realized and unrealized gain (loss) | 3.38 | (.29) | 3.85 | 3.84 | (6.47) |
Total from investment operations | 3.58 | (.22) | 3.85 | 3.91 | (6.38) |
Distributions from net investment income | (.21) | (.07) | (.04) | (.09) | (.14) |
Distributions from net realized gain | - | - | - | - | - G |
Total distributions | (.21) | (.07) | (.04) | (.09) | (.14) |
Redemption fees added to paid in capital C, G | - | - | - | - | - |
Net asset value, end of period | $ 19.24 | $ 15.87 | $ 16.16 | $ 12.35 | $ 8.53 |
Total Return A, B | 22.73% | (1.34)% | 31.14% | 45.79% | (42.40)% |
Ratios to Average Net Assets D, F | | | | |
Expenses before reductions | 1.15% | 1.17% | 1.17% | 1.21% | 1.12% |
Expenses net of fee waivers, if any | 1.15% | 1.17% | 1.17% | 1.21% | 1.12% |
Expenses net of all reductions | 1.12% | 1.16% | 1.17% | 1.20% | 1.12% |
Net investment income (loss) | 1.15% | .44% | .02% | .62% | .71% |
Supplemental Data | | | | | |
Net assets, end of period (000 omitted) | $ 24,436 | $ 19,578 | $ 23,608 | $ 10,640 | $ 6,404 |
Portfolio turnover rate E | 180% | 173% | 133% | 202% | 268% |
A Total returns would have been lower if certain expenses had not been reduced during the applicable periods shown.
B Total returns do not include the effect of the sales charges.
C Calculated based on average shares outstanding during the period.
D Fees and expenses of any underlying Fidelity Central Funds are not included in the Fund's expense ratio. The Fund indirectly bears its proportionate share of the expenses of any underlying Fidelity Central Funds.
E Amount does not include the portfolio activity of any underlying Fidelity Central Funds.
F Expense ratios reflect operating expenses of the class. Expenses before reductions do not reflect amounts reimbursed by the investment adviser or reductions from brokerage service arrangements or reductions from other expense offset arrangements and do not represent the amount paid by the class during periods when reimbursements or reductions occur. Expenses net of fee waivers reflect expenses after reimbursement by the investment adviser but prior to reductions from brokerage service arrangements or other expense offset arrangements. Expenses net of all reductions represent the net expenses paid by the class.
G Amount represents less than $.01 per share.
See accompanying notes which are an integral part of the financial statements.
Annual Report
Financial Highlights - Class T
Years ended January 31, | 2013 | 2012 | 2011 | 2010 | 2009 |
Selected Per-Share Data | | | | | |
Net asset value, beginning of period | $ 15.84 | $ 16.14 | $ 12.34 | $ 8.53 | $ 15.04 |
Income from Investment Operations | | | | | |
Net investment income (loss) C | .15 | .03 | (.03) | .04 | .06 |
Net realized and unrealized gain (loss) | 3.38 | (.29) | 3.83 | 3.84 | (6.46) |
Total from investment operations | 3.53 | (.26) | 3.80 | 3.88 | (6.40) |
Distributions from net investment income | (.16) | (.04) | - | (.07) | (.11) |
Redemption fees added to paid in capital C, G | - | - | - | - | - |
Net asset value, end of period | $ 19.21 | $ 15.84 | $ 16.14 | $ 12.34 | $ 8.53 |
Total Return A, B | 22.42% | (1.59)% | 30.79% | 45.44% | (42.57)% |
Ratios to Average Net Assets D, F | | | | | |
Expenses before reductions | 1.42% | 1.43% | 1.43% | 1.47% | 1.38% |
Expenses net of fee waivers, if any | 1.42% | 1.43% | 1.43% | 1.47% | 1.38% |
Expenses net of all reductions | 1.38% | 1.42% | 1.43% | 1.46% | 1.38% |
Net investment income (loss) | .89% | .18% | (.24)% | .36% | .45% |
Supplemental Data | | | | | |
Net assets, end of period (000 omitted) | $ 8,358 | $ 6,823 | $ 6,993 | $ 4,010 | $ 2,413 |
Portfolio turnover rate E | 180% | 173% | 133% | 202% | 268% |
A Total returns would have been lower if certain expenses had not been reduced during the applicable periods shown.
B Total returns do not include the effect of the sales charges.
C Calculated based on average shares outstanding during the period.
D Fees and expenses of any underlying Fidelity Central Funds are not included in the Fund's expense ratio. The Fund indirectly bears its proportionate share of the expenses of any underlying Fidelity Central Funds.
E Amount does not include the portfolio activity of any underlying Fidelity Central Funds.
F Expense ratios reflect operating expenses of the class. Expenses before reductions do not reflect amounts reimbursed by the investment adviser or reductions from brokerage service arrangements or reductions from other expense offset arrangements and do not represent the amount paid by the class during periods when reimbursements or reductions occur. Expenses net of fee waivers reflect expenses after reimbursement by the investment adviser but prior to reductions from brokerage service arrangements or other expense offset arrangements. Expenses net of all reductions represent the net expenses paid by the class.
G Amount represents less than $.01 per share.
See accompanying notes which are an integral part of the financial statements.
Annual Report
Financial Highlights - Class B
Years ended January 31, | 2013 | 2012 | 2011 | 2010 | 2009 |
Selected Per-Share Data | | | | | |
Net asset value, beginning of period | $ 15.71 | $ 16.04 | $ 12.32 | $ 8.53 | $ 14.99 |
Income from Investment Operations | | | | | |
Net investment income (loss) C | .07 | (.05) | (.10) | (.01) | (.01) |
Net realized and unrealized gain (loss) | 3.34 | (.28) | 3.82 | 3.82 | (6.40) |
Total from investment operations | 3.41 | (.33) | 3.72 | 3.81 | (6.41) |
Distributions from net investment income | (.09) | - | - | (.02) | (.05) |
Redemption fees added to paid in capital C, G | - | - | - | - | - |
Net asset value, end of period | $ 19.03 | $ 15.71 | $ 16.04 | $ 12.32 | $ 8.53 |
Total Return A, B | 21.79% | (2.06)% | 30.19% | 44.61% | (42.79)% |
Ratios to Average Net Assets D, F | | | | | |
Expenses before reductions | 1.91% | 1.92% | 1.93% | 1.97% | 1.87% |
Expenses net of fee waivers, if any | 1.91% | 1.92% | 1.93% | 1.97% | 1.87% |
Expenses net of all reductions | 1.87% | 1.91% | 1.92% | 1.96% | 1.87% |
Net investment income (loss) | .40% | (.31)% | (.74)% | (.14)% | (.04)% |
Supplemental Data | | | | | |
Net assets, end of period (000 omitted) | $ 1,533 | $ 1,376 | $ 1,793 | $ 1,154 | $ 763 |
Portfolio turnover rate E | 180% | 173% | 133% | 202% | 268% |
A Total returns would have been lower if certain expenses had not been reduced during the applicable periods shown.
B Total returns do not include the effect of the contingent deferred sales charge.
C Calculated based on average shares outstanding during the period.
D Fees and expenses of any underlying Fidelity Central Funds are not included in the Fund's expense ratio. The Fund indirectly bears its proportionate share of the expenses of any underlying Fidelity Central Funds.
E Amount does not include the portfolio activity of any underlying Fidelity Central Funds.
F Expense ratios reflect operating expenses of the class. Expenses before reductions do not reflect amounts reimbursed by the investment adviser or reductions from brokerage service arrangements or reductions from other expense offset arrangements and do not represent the amount paid by the class during periods when reimbursements or reductions occur. Expenses net of fee waivers reflect expenses after reimbursement by the investment adviser but prior to reductions from brokerage service arrangements or other expense offset arrangements. Expenses net of all reductions represent the net expenses paid by the class.
G Amount represents less than $.01 per share.
See accompanying notes which are an integral part of the financial statements.
Annual Report
Financial Highlights - Class C
Years ended January 31, | 2013 | 2012 | 2011 | 2010 | 2009 |
Selected Per-Share Data | | | | | |
Net asset value, beginning of period | $ 15.65 | $ 15.98 | $ 12.27 | $ 8.50 | $ 14.98 |
Income from Investment Operations | | | | | |
Net investment income (loss) C | .07 | (.05) | (.10) | (.01) | - |
Net realized and unrealized gain (loss) | 3.32 | (.28) | 3.81 | 3.80 | (6.41) |
Total from investment operations | 3.39 | (.33) | 3.71 | 3.79 | (6.41) |
Distributions from net investment income | (.11) | - | - | (.02) | (.07) |
Redemption fees added to paid in capital C, G | - | - | - | - | - |
Net asset value, end of period | $ 18.93 | $ 15.65 | $ 15.98 | $ 12.27 | $ 8.50 |
Total Return A, B | 21.73% | (2.07)% | 30.24% | 44.56% | (42.79)% |
Ratios to Average Net Assets D, F | | | | | |
Expenses before reductions | 1.91% | 1.92% | 1.93% | 1.96% | 1.86% |
Expenses net of fee waivers, if any | 1.91% | 1.92% | 1.93% | 1.96% | 1.86% |
Expenses net of all reductions | 1.87% | 1.91% | 1.92% | 1.95% | 1.86% |
Net investment income (loss) | .40% | (.31)% | (.73)% | (.13)% | (.03)% |
Supplemental Data | | | | | |
Net assets, end of period (000 omitted) | $ 6,820 | $ 5,000 | $ 5,309 | $ 2,293 | $ 1,232 |
Portfolio turnover rate E | 180% | 173% | 133% | 202% | 268% |
A Total returns would have been lower if certain expenses had not been reduced during the applicable periods shown.
B Total returns do not include the effect of the contingent deferred sales charge.
C Calculated based on average shares outstanding during the period.
D Fees and expenses of any underlying Fidelity Central Funds are not included in the Fund's expense ratio. The Fund indirectly bears its proportionate share of the expenses of any underlying Fidelity Central Funds.
E Amount does not include the portfolio activity of any underlying Fidelity Central Funds.
F Expense ratios reflect operating expenses of the class. Expenses before reductions do not reflect amounts reimbursed by the investment adviser or reductions from brokerage service arrangements or reductions from other expense offset arrangements and do not represent the amount paid by the class during periods when reimbursements or reductions occur. Expenses net of fee waivers reflect expenses after reimbursement by the investment adviser but prior to reductions from brokerage service arrangements or other expense offset arrangements. Expenses net of all reductions represent the net expenses paid by the class.
G Amount represents less than $.01 per share.
See accompanying notes which are an integral part of the financial statements.
Annual Report
Financial Highlights - Mid Cap Value
Years ended January 31, | 2013 | 2012 | 2011 | 2010 | 2009 |
Selected Per-Share Data | | | | | |
Net asset value, beginning of period | $ 15.97 | $ 16.26 | $ 12.41 | $ 8.57 | $ 15.09 |
Income from Investment Operations | | | | | |
Net investment income (loss) B | .25 | .12 | .04 | .09 | .13 |
Net realized and unrealized gain (loss) | 3.41 | (.30) | 3.87 | 3.86 | (6.49) |
Total from investment operations | 3.66 | (.18) | 3.91 | 3.95 | (6.36) |
Distributions from net investment income | (.26) | (.11) | (.06) | (.11) | (.16) |
Distributions from net realized gain | - | - | - | - | - F |
Total distributions | (.26) | (.11) | (.06) | (.11) | (.16) |
Redemption fees added to paid in capital B, F | - | - | - | - | - |
Net asset value, end of period | $ 19.37 | $ 15.97 | $ 16.26 | $ 12.41 | $ 8.57 |
Total Return A | 23.07% | (1.04)% | 31.51% | 46.06% | (42.19)% |
Ratios to Average Net Assets C, E | | | | | |
Expenses before reductions | .85% | .88% | .91% | .95% | .85% |
Expenses net of fee waivers, if any | .85% | .88% | .91% | .95% | .84% |
Expenses net of all reductions | .81% | .87% | .90% | .94% | .84% |
Net investment income (loss) | 1.46% | .73% | .28% | .88% | .99% |
Supplemental Data | | | | | |
Net assets, end of period (000 omitted) | $ 638,425 | $ 553,947 | $ 666,277 | $ 469,476 | $ 358,380 |
Portfolio turnover rate D | 180% | 173% | 133% | 202% | 268% |
A Total returns would have been lower if certain expenses had not been reduced during the applicable periods shown.
B Calculated based on average shares outstanding during the period.
C Fees and expenses of any underlying Fidelity Central Funds are not included in the Fund's expense ratio. The Fund indirectly bears its proportionate share of the expenses of any underlying Fidelity Central Funds.
D Amount does not include the portfolio activity of any underlying Fidelity Central Funds.
E Expense ratios reflect operating expenses of the class. Expenses before reductions do not reflect amounts reimbursed by the investment adviser or reductions from brokerage service arrangements or reductions from other expense offset arrangements and do not represent the amount paid by the class during periods when reimbursements or reductions occur. Expenses net of fee waivers reflect expenses after reimbursement by the investment adviser but prior to reductions from brokerage service arrangements or other expense offset arrangements. Expenses net of all reductions represent the net expenses paid by the class.
F Amount represents less than $.01 per share.
See accompanying notes which are an integral part of the financial statements.
Annual Report
Financial Highlights - Institutional Class
Years ended January 31, | 2013 | 2012 | 2011 | 2010 | 2009 |
Selected Per-Share Data | | | | | |
Net asset value, beginning of period | $ 15.91 | $ 16.20 | $ 12.36 | $ 8.54 | $ 15.06 |
Income from Investment Operations | | | | | |
Net investment income (loss) B | .24 | .11 | .04 | .10 | .12 |
Net realized and unrealized gain (loss) | 3.40 | (.29) | 3.85 | 3.84 | (6.48) |
Total from investment operations | 3.64 | (.18) | 3.89 | 3.94 | (6.36) |
Distributions from net investment income | (.26) | (.11) | (.05) | (.12) | (.16) |
Redemption fees added to paid in capital B, F | - | - | - | - | - |
Net asset value, end of period | $ 19.29 | $ 15.91 | $ 16.20 | $ 12.36 | $ 8.54 |
Total Return A | 23.05% | (1.07)% | 31.51% | 46.12% | (42.26)% |
Ratios to Average Net Assets C, E | | | | | |
Expenses before reductions | .89% | .91% | .92% | .96% | .87% |
Expenses net of fee waivers, if any | .89% | .91% | .92% | .96% | .87% |
Expenses net of all reductions | .85% | .90% | .92% | .95% | .87% |
Net investment income (loss) | 1.42% | .71% | .27% | .87% | .96% |
Supplemental Data | | | | | |
Net assets, end of period (000 omitted) | $ 7,875 | $ 3,667 | $ 3,507 | $ 3,162 | $ 894 |
Portfolio turnover rate D | 180% | 173% | 133% | 202% | 268% |
A Total returns would have been lower if certain expenses had not been reduced during the applicable periods shown.
B Calculated based on average shares outstanding during the period.
C Fees and expenses of any underlying Fidelity Central Funds are not included in the Fund's expense ratio. The Fund indirectly bears its proportionate share of the expenses of any underlying Fidelity Central Funds.
D Amount does not include the portfolio activity of any underlying Fidelity Central Funds.
E Expense ratios reflect operating expenses of the class. Expenses before reductions do not reflect amounts reimbursed by the investment adviser or reductions from brokerage service arrangements or reductions from other expense offset arrangements and do not represent the amount paid by the class during periods when reimbursements or reductions occur. Expenses net of fee waivers reflect expenses after reimbursement by the investment adviser but prior to reductions from brokerage service arrangements or other expense offset arrangements. Expenses net of all reductions represent the net expenses paid by the class.
F Amount represents less than $.01 per share.
See accompanying notes which are an integral part of the financial statements.
Annual Report
Notes to Financial Statements
For the period ended January 31, 2013
1. Organization.
Fidelity Mid Cap Value Fund (the Fund) is a fund of Fidelity Devonshire Trust (the Trust) and is authorized to issue an unlimited number of shares. The Trust is registered under the Investment Company Act of 1940, as amended (the 1940 Act), as an open-end management investment company organized as a Massachusetts business trust. The Fund offers Class A, Class T, Class C, Mid Cap Value and Institutional Class shares, each of which, along with Class B shares, has equal rights as to assets and voting privileges. Class B shares are closed to new accounts and additional purchases, except for exchanges and reinvestments. Each class has exclusive voting rights with respect to matters that affect that class. Class B shares will automatically convert to Class A shares after a holding period of seven years from the initial date of purchase. Investment income, realized and unrealized capital gains and losses, the common expenses of the Fund, and certain fund-level expense reductions, if any, are allocated on a pro-rata basis to each class based on the relative net assets of each class to the total net assets of the Fund. Each class differs with respect to transfer agent and distribution and service plan fees incurred. Certain expense reductions may also differ by class.
2. Investments in Fidelity Central Funds.
The Fund invests in Fidelity Central Funds, which are open-end investment companies available only to other investment companies and accounts managed by Fidelity Management & Research Company (FMR) and its affiliates. The Fund's Schedule of Investments lists each of the Fidelity Central Funds held as of period end, if any, as an investment of the Fund, but does not include the underlying holdings of each Fidelity Central Fund. As an Investing Fund, the Fund indirectly bears its proportionate share of the expenses of the underlying Fidelity Central Funds.
The Money Market Central Funds seek preservation of capital and current income and are managed by Fidelity Investments Money Management, Inc. (FIMM), an affiliate of FMR.
A complete unaudited list of holdings for each Fidelity Central Fund is available upon request or at the Securities and Exchange Commission (the SEC) website at www.sec.gov. In addition, the financial statements of the Fidelity Central Funds, which are not covered by the Fund's Report of Independent Registered Public Accounting Firm, are available on the SEC website or upon request.
3. Significant Accounting Policies.
The financial statements have been prepared in conformity with accounting principles generally accepted in the United States of America (GAAP), which require management to make certain estimates and assumptions at the date of the financial statements. Actual results could differ from those estimates. Subsequent events, if any, through the
Annual Report
Notes to Financial Statements - continued
3. Significant Accounting Policies - continued
date that the financial statements were issued have been evaluated in the preparation of the financial statements. The following summarizes the significant accounting policies of the Fund:
Investment Valuation. Investments are valued as of 4:00 p.m. Eastern time on the last calendar day of the period. In accordance with valuation policies and procedures approved by the Board of Trustees (the Board), the Fund attempts to obtain prices from one or more third party pricing vendors or brokers to value its investments. When current market prices, quotations or currency exchange rates are not readily available or reliable, investments will be fair valued in good faith by the FMR Fair Value Committee (the Committee), in accordance with procedures adopted by the Fund's Board. Factors used in determining fair value vary by investment type and may include market or investment specific events. The frequency with which these procedures are used cannot be predicted and they may be utilized to a significant extent. The Committee oversees the Fund's valuation policies and procedures and is responsible for approving and reporting to the Board all fair value determinations.
The Fund categorizes the inputs to valuation techniques used to value its investments into a disclosure hierarchy consisting of three levels as shown below:
Level 1 - quoted prices in active markets for identical investments
Level 2 - other significant observable inputs (including quoted prices for similar investments, interest rates, prepayment speeds, etc.)
Level 3 - unobservable inputs (including the Fund's own assumptions based on the best information available)
Valuation techniques used to value the Fund's investments by major category are as follows:
Equity securities, including restricted securities, for which market quotations are readily available, are valued at the last reported sale price or official closing price as reported by a third party pricing vendor on the primary market or exchange on which they are traded and are categorized as Level 1 in the hierarchy. In the event there were no sales during the day or closing prices are not available, securities are valued at the last quoted bid price or may be valued using the last available price and are generally categorized as Level 2 in the hierarchy. For foreign equity securities, when significant market or security specific events arise, comparisons to the valuation of American Depositary Receipts (ADRs), futures contracts, Exchange-Traded Funds (ETFs) and certain indexes as well as quoted prices for similar securities are used and are categorized as Level 2 in the hierarchy. Utilizing these techniques may result in transfers between Level 1 and Level 2.
Annual Report
3. Significant Accounting Policies - continued
Investment Valuation - continued
Investments in open-end mutual funds, including the Fidelity Central Funds, are valued at their closing net asset value (NAV) each business day and are categorized as Level 1 in the hierarchy.
Changes in valuation techniques may result in transfers in or out of an assigned level within the disclosure hierarchy.
Investment Transactions and Income. For financial reporting purposes, the Fund's investment holdings and NAV include trades executed through the end of the last business day of the period. The NAV per share for processing shareholder transactions is calculated as of the close of business of the New York Stock Exchange (NYSE), normally 4:00 p.m. Eastern time and includes trades executed through the end of the prior business day. Gains and losses on securities sold are determined on the basis of identified cost and may include proceeds received from litigation. Dividend income is recorded on the ex-dividend date, except for certain dividends from foreign securities where the ex-dividend date may have passed, which are recorded as soon as the Fund is informed of the ex-dividend date. Non-cash dividends included in dividend income, if any, are recorded at the fair market value of the securities received. Distributions received on securities that represent a return of capital or capital gain are recorded as a reduction of cost of investments and/or as a realized gain. The Fund estimates the components of distributions received that may be considered return of capital distributions or capital gain distributions. Interest income and distributions from the Fidelity Central Funds are accrued as earned.
Expenses. Expenses directly attributable to a fund are charged to that fund. Expenses attributable to more than one fund are allocated among the respective funds on the basis of relative net assets or other appropriate methods. Expense estimates are accrued in the period to which they relate and adjustments are made when actual amounts are known.
Income Tax Information and Distributions to Shareholders. Each year, the Fund intends to qualify as a regulated investment company under Subchapter M of the Internal Revenue Code, including distributing substantially all of its taxable income and realized gains. As a result, no provision for income taxes is required. As of January 31, 2013, the Fund did not have any unrecognized tax benefits in the financial statements; nor is the Fund aware of any tax positions for which it is reasonably possible that the total amounts of unrecognized tax benefits will significantly change in the next twelve months. The Fund files a U.S. federal tax return, in addition to state and local tax returns as required. A fund's federal income tax returns are subject to examination by the Internal Revenue Service (IRS) for a period of three fiscal years after they are filed.
Annual Report
Notes to Financial Statements - continued
3. Significant Accounting Policies - continued
Income Tax Information and Distributions to Shareholders - continued
State and local tax returns may be subject to examination for an additional fiscal year depending on the jurisdiction.
Distributions are declared and recorded on the ex-dividend date. Income dividends and capital gain distributions are declared separately for each class. Income and capital gain distributions are determined in accordance with income tax regulations, which may differ from GAAP. In addition, the Fund claimed a portion of the payment made to redeeming shareholders as a distribution for income tax purposes.
Capital accounts within the financial statements are adjusted for permanent book-tax differences. These adjustments have no impact on net assets or the results of operations. Temporary book-tax differences will reverse in a subsequent period.
Book-tax differences are primarily due to partnerships (including allocations from Fidelity Central Funds), capital loss carryforwards and losses deferred due to wash sales and excise tax regulations.
The federal tax cost of investment securities and unrealized appreciation (depreciation) as of period end were as follows:
Gross unrealized appreciation | $ 87,088,948 |
Gross unrealized depreciation | (6,753,986) |
Net unrealized appreciation (depreciation) on securities and other investments | $ 80,334,962 |
| |
Tax Cost | $ 610,003,640 |
The tax-based components of distributable earnings as of period end were as follows:
Capital loss carryforward | $ (3,151,270) |
Net unrealized appreciation (depreciation) | $ 80,334,962 |
Capital loss carryforwards are only available to offset future capital gains of the Fund to the extent provided by regulations and may be limited. Under the Regulated Investment Company Modernization Act of 2010 (the Act), the Fund is permitted to carry forward capital losses incurred in taxable years beginning after December 22, 2010 for an unlimited period and such capital losses are required to be used prior to any losses that expire. Capital loss carryforwards were as follows:
Fiscal year of expiration | |
2018 | $ (3,151,270) |
Annual Report
3. Significant Accounting Policies - continued
Income Tax Information and Distributions to Shareholders - continued
The tax character of distributions paid was as follows:
| January 31, 2013 | January 31, 2012 |
Ordinary Income | $ 8,438,509 | $ 4,101,848 |
Short-Term Trading (Redemption) Fees. Shares held by investors in the Fund less than 30 days are subject to a redemption fee equal to .75% of the net asset value of shares redeemed. All redemption fees, which reduce the proceeds of the shareholder redemption, are retained by the Fund and accounted for as an addition to paid in capital.
4. Purchases and Sales of Investments.
Purchases and sales of securities, other than short-term securities, aggregated $1,071,381,575 and $1,097,503,166, respectively.
The Fund realized a gain on the sale of an investment not meeting the investment restrictions of the Fund.
5. Fees and Other Transactions with Affiliates.
Management Fee. FMR and its affiliates provide the Fund with investment management related services for which the Fund pays a monthly management fee. The management fee is the sum of an individual fund fee rate that is based on an annual rate of .30% of the Fund's average net assets and an annualized group fee rate that averaged .26% during the period. The group fee rate is based upon the average net assets of all the mutual funds advised by FMR. The group fee rate decreases as assets under management increase and increases as assets under management decrease. In addition, the management fee is subject to a performance adjustment (up to a maximum of ± .20% of the Fund's average net assets over a 36 month performance period). The upward or downward adjustment to the management fee is based on the relative investment performance of Mid Cap Value as compared to an appropriate benchmark index. For the period, the total annual management fee rate, including the performance adjustment, was .53% of the Fund's average net assets.
Distribution and Service Plan Fees. In accordance with Rule 12b-1 of the 1940 Act, the Fund has adopted separate Distribution and Service Plans for each class of shares. Certain classes pay Fidelity Distributors Corporation (FDC), an affiliate of FMR, separate Distribution and Service Fees, each of which is based on an annual percentage of each class' average net assets. In addition, FDC may pay financial intermediaries for selling shares of the Fund and providing shareholder support services. For the period,
Annual Report
Notes to Financial Statements - continued
5. Fees and Other Transactions with Affiliates - continued
Distribution and Service Plan Fees - continued
the Distribution and Service Fee rates, total fees and amounts retained by FDC were as follows:
| Distribution
Fee | Service
Fee | Total Fees | Retained
by FDC |
Class A | -% | .25% | $ 49,153 | $ 1,148 |
Class T | .25% | .25% | 36,050 | 146 |
Class B | .75% | .25% | 13,545 | 10,207 |
Class C | .75% | .25% | 56,211 | 13,628 |
| | | $ 154,959 | $ 25,129 |
Sales Load. FDC may receive a front-end sales charge of up to 5.75% for selling Class A shares and 3.50% for selling Class T shares, some of which is paid to financial intermediaries for selling shares of the Fund. Depending on the holding period, FDC may receive contingent deferred sales charges levied on Class A, Class T, Class B, and Class C redemptions. The deferred sales charges range from 5.00% to 1.00% for Class B shares, 1.00% for Class C shares, 1.00% for certain purchases of Class A shares and .25% for certain purchases of Class T shares.
For the period, sales charge amounts retained by FDC were as follows:
| Retained
by FDC |
Class A | $ 17,414 |
Class T | 3,121 |
Class B* | 1,798 |
Class C* | 1,051 |
| $ 23,384 |
* When Class B and Class C shares are initially sold, FDC pays commissions from its own resources to financial intermediaries through which the sales
are made.
Transfer Agent Fees. Fidelity Investments Institutional Operations Company, Inc. (FIIOC), an affiliate of FMR, is the transfer, dividend disbursing and shareholder servicing agent for each class of the Fund. FIIOC receives account fees and asset-based fees that vary according to the account size and type of account of the shareholders of the respective classes of the Fund. FIIOC pays for typesetting, printing and mailing of
Annual Report
5. Fees and Other Transactions with Affiliates - continued
Transfer Agent Fees - continued
shareholder reports, except proxy statements. For the period, transfer agent fees for each class were as follows:
| Amount | % of
Average
Net Assets |
Class A | $ 59,075 | .30 |
Class T | 22,494 | .31 |
Class B | 4,095 | .30 |
Class C | 17,008 | .30 |
Mid Cap Value | 1,349,008 | .24 |
Institutional Class | 12,970 | .28 |
| $ 1,464,650 | |
Accounting and Security Lending Fees. Fidelity Service Company, Inc. (FSC), an affiliate of FMR, maintains the Fund's accounting records. The accounting fee is based on the level of average net assets for each month. Under a separate contract, FSC administers the security lending program. The security lending fee is based on the number and duration of lending transactions.
Brokerage Commissions. The Fund placed a portion of its portfolio transactions with brokerage firms which are affiliates of the investment adviser. The commissions paid to these affiliated firms were $23,609 for the period.
6. Committed Line of Credit.
The Fund participates with other funds managed by FMR or an affiliate in a $4.25 billion credit facility (the "line of credit") to be utilized for temporary or emergency purposes to fund shareholder redemptions or for other short-term liquidity purposes. The Fund has agreed to pay commitment fees on its pro-rata portion of the line of credit, which amounted to $1,566 and is reflected in Miscellaneous expenses on the Statement of Operations. During the period, there were no borrowings on this line of credit.
7. Security Lending.
The Fund lends portfolio securities through a lending agent from time to time in order to earn additional income. For equity securities, a lending agent is used and may loan securities to certain qualified borrowers, including Fidelity Capital Markets (FCM), a broker-dealer affiliated with the Fund. On the settlement date of the loan, the Fund receives collateral (in the form of U.S. Treasury obligations, letters of credit and/or cash) against the loaned securities and maintains collateral in an amount not less than 100% of
Annual Report
Notes to Financial Statements - continued
7. Security Lending - continued
the market value of the loaned securities during the period of the loan. The market value of the loaned securities is determined at the close of business of the Fund and any additional required collateral is delivered to the Fund on the next business day. If the borrower defaults on its obligation to return the securities loaned because of insolvency or other reasons, a fund could experience delays and costs in recovering the securities loaned or in gaining access to the collateral. Any cash collateral received is invested in the Fidelity Securities Lending Cash Central Fund. The value of loaned securities and cash collateral at period end are disclosed on the Fund's Statement of Assets and Liabilities. The value of securities loaned to FCM at period end was $113,680. Security lending income represents the income earned on investing cash collateral, less rebates paid to borrowers and any lending agent fees associated with the loan, plus any premium payments received for lending certain types of securities. Security lending income is presented in the Statement of Operations as a component of income from Fidelity Central Funds. Total security lending income during the period amounted to $122,164, including $9,612 from securities loaned to FCM.
8. Expense Reductions.
Many of the brokers with whom FMR places trades on behalf of the Fund provided services to the Fund in addition to trade execution. These services included payments of certain expenses on behalf of the Fund totaling $191,057 for the period. In addition, through arrangements with the Fund's custodian, credits realized as a result of uninvested cash balances were used to reduce the Fund's expenses. During the period, these credits reduced the Fund's custody expenses by $57.
9. Distributions to Shareholders.
Distributions to shareholders of each class were as follows:
Years ended January 31, | 2013 | 2012 |
From net investment income | | |
Class A | $ 253,117 | $ 84,201 |
Class T | 66,091 | 17,628 |
Class B | 7,351 | - |
Class C | 38,428 | - |
Mid Cap Value | 7,992,338 | 3,978,985 |
Institutional Class | 81,184 | 21,034 |
Total | $ 8,438,509 | $ 4,101,848 |
Annual Report
10. Share Transactions.
Transactions for each class of shares were as follows:
| Shares | Dollars |
Years ended January 31, | 2013 | 2012 | 2013 | 2012 |
Class A | | | | |
Shares sold | 457,731 | 471,749 | $ 7,879,366 | $ 7,485,577 |
Reinvestment of distributions | 13,590 | 5,251 | 235,643 | 78,338 |
Shares redeemed | (434,657) | (704,307) | (7,246,773) | (11,261,227) |
Net increase (decrease) | 36,664 | (227,307) | $ 868,236 | $ (3,697,312) |
Class T | | | | |
Shares sold | 155,888 | 161,524 | $ 2,678,394 | $ 2,605,707 |
Reinvestment of distributions | 3,790 | 1,166 | 65,644 | 17,360 |
Shares redeemed | (155,220) | (165,147) | (2,624,883) | (2,621,038) |
Net increase (decrease) | 4,458 | (2,457) | $ 119,155 | $ 2,029 |
Class B | | | | |
Shares sold | 10,295 | 9,800 | $ 177,345 | $ 158,077 |
Reinvestment of distributions | 397 | - | 6,824 | - |
Shares redeemed | (17,720) | (33,963) | (295,503) | (529,991) |
Net increase (decrease) | (7,028) | (24,163) | $ (111,334) | $ (371,914) |
Class C | | | | |
Shares sold | 137,133 | 124,340 | $ 2,295,740 | $ 1,963,624 |
Reinvestment of distributions | 2,090 | - | 35,705 | - |
Shares redeemed | (98,602) | (137,041) | (1,645,075) | (2,028,206) |
Net increase (decrease) | 40,621 | (12,701) | $ 686,370 | $ (64,582) |
Mid Cap Value | | | | |
Shares sold | 6,300,912 | 7,442,595 | $ 110,558,662 | $ 120,167,268 |
Reinvestment of distributions | 443,673 | 256,561 | 7,742,097 | 3,848,420 |
Shares redeemed | (8,477,007) | (13,984,343) | (144,053,750) | (217,785,024) |
Net increase (decrease) | (1,732,422) | (6,285,187) | $ (25,752,991) | $ (93,769,336) |
Institutional Class | | | | |
Shares sold | 281,696 | 158,721 | $ 4,930,560 | $ 2,526,829 |
Reinvestment of distributions | 4,459 | 1,314 | 77,497 | 19,637 |
Shares redeemed | (108,318) | (146,013) | (1,862,178) | (2,215,747) |
Net increase (decrease) | 177,837 | 14,022 | $ 3,145,879 | $ 330,719 |
11. Other.
The Fund's organizational documents provide former and current trustees and officers with a limited indemnification against liabilities arising in connection with the performance of their duties to the Fund. In the normal course of business, the Fund may also enter into contracts that provide general indemnifications. The Fund's maximum exposure under these arrangements is unknown as this would be dependent on future claims that may be made against the Fund. The risk of material loss from such claims is considered remote.
Annual Report
To the Trustees of Fidelity Devonshire Trust and the Shareholders of Fidelity Mid Cap Value Fund:
In our opinion, the accompanying statement of assets and liabilities, including the schedule of investments, and the related statements of operations and of changes in net assets and the financial highlights present fairly, in all material respects, the financial position of Fidelity Mid Cap Value Fund (a fund of Fidelity Devonshire Trust) at January 31, 2013, the results of its operations for the year then ended, the changes in its net assets for each of the two years in the period then ended and the financial highlights for each of the five years in the period then ended, in conformity with accounting principles generally accepted in the United States of America. These financial statements and financial highlights (hereafter referred to as "financial statements") are the responsibility of the Fidelity Mid Cap Value Fund's management. Our responsibility is to express an opinion on these financial statements based on our audits. We conducted our audits of these financial statements in accordance with the standards of the Public Company Accounting Oversight Board (United States). Those standards require that we plan and perform the audit to obtain reasonable assurance about whether the financial statements are free of material misstatement. An audit includes examining, on a test basis, evidence supporting the amounts and disclosures in the financial statements, assessing the accounting principles used and significant estimates made by management, and evaluating the overall financial statement presentation. We believe that our audits, which included confirmation of securities at January 31, 2013 by correspondence with the custodian and brokers, provide a reasonable basis for our opinion.
PricewaterhouseCoopers LLP
Boston, Massachusetts
March 13, 2013
Annual Report
The Trustees, Members of the Advisory Board, and executive officers of the trust and fund, as applicable, are listed below. The Board of Trustees governs the fund and is responsible for protecting the interests of shareholders. The Trustees are experienced executives who meet periodically throughout the year to oversee the fund's activities, review contractual arrangements with companies that provide services to the fund, oversee management of the risks associated with such activities and contractual arrangements, and review the fund's performance. Except for James C. Curvey, each of the Trustees oversees 234 Fidelity funds. Mr. Curvey oversees 453 Fidelity funds.
The Trustees hold office without limit in time except that (a) any Trustee may resign; (b) any Trustee may be removed by written instrument, signed by at least two-thirds of the number of Trustees prior to such removal; (c) any Trustee who requests to be retired or who has become incapacitated by illness or injury may be retired by written instrument signed by a majority of the other Trustees; and (d) any Trustee may be removed at any special meeting of shareholders by a two-thirds vote of the outstanding voting securities of the trust. Each Trustee who is not an interested person (as defined in the 1940 Act) (Independent Trustee), shall retire not later than the last day of the calendar year in which his or her 75th birthday occurs. The Independent Trustees may waive this mandatory retirement age policy with respect to individual Trustees. The executive officers and Advisory Board Members hold office without limit in time, except that any officer and Advisory Board Member may resign or may be removed by a vote of a majority of the Trustees at any regular meeting or any special meeting of the Trustees. Except as indicated, each individual has held the office shown or other offices in the same company for the past five years.
Experience, Skills, Attributes, and Qualifications of the Fund's Trustees. The Governance and Nominating Committee has adopted a statement of policy that describes the experience, qualifications, attributes, and skills that are necessary and desirable for potential Independent Trustee candidates (Statement of Policy). The Board believes that each Trustee satisfied at the time he or she was initially elected or appointed a Trustee, and continues to satisfy, the standards contemplated by the Statement of Policy. The Governance and Nominating Committee also engages professional search firms to help identify potential Independent Trustee candidates who have the experience, qualifications, attributes, and skills consistent with the Statement of Policy. From time to time, additional criteria based on the composition and skills of the current Independent Trustees, as well as experience or skills that may be appropriate in light of future changes to board composition, business conditions, and regulatory or other developments, have also been considered by the professional search firms and the Governance and Nominating Committee. In addition, the Board takes into account the Trustees' commitment and participation in Board and committee meetings, as well as their leadership of standing and ad hoc committees throughout their tenure.
In determining that a particular Trustee was and continues to be qualified to serve as a Trustee, the Board has considered a variety of criteria, none of which, in isolation, was controlling. The Board believes that, collectively, the Trustees have balanced and diverse experience, qualifications, attributes, and skills, which allow the Board to operate effectively in governing the fund and protecting the interests of shareholders. Information about the specific experience, skills, attributes, and qualifications of each Trustee, which in each case led to the Board's conclusion that the Trustee should serve (or continue to serve) as a trustee of the fund, is provided below.
Annual Report
Trustees and Officers - continued
Board Structure and Oversight Function. James C. Curvey is an interested person (as defined in the 1940 Act) and currently serves as Chairman. The Trustees have determined that an interested Chairman is appropriate and benefits shareholders because an interested Chairman has a personal and professional stake in the quality and continuity of services provided to the fund. Independent Trustees exercise their informed business judgment to appoint an individual of their choosing to serve as Chairman, regardless of whether the Trustee happens to be independent or a member of management. The Independent Trustees have determined that they can act independently and effectively without having an Independent Trustee serve as Chairman and that a key structural component for assuring that they are in a position to do so is for the Independent Trustees to constitute a substantial majority for the Board. The Independent Trustees also regularly meet in executive session. Ned C. Lautenbach serves as Chairman of the Independent Trustees and as such (i) acts as a liaison between the Independent Trustees and management with respect to matters important to the Independent Trustees and (ii) with management prepares agendas for Board meetings.
Fidelity funds are overseen by different Boards of Trustees. The fund's Board oversees Fidelity's equity and high income funds and another Board oversees Fidelity's investment-grade bond, money market, and asset allocation funds. The asset allocation funds may invest in Fidelity funds overseen by the fund's Board. The use of separate Boards, each with its own committee structure, allows the Trustees of each group of Fidelity funds to focus on the unique issues of the funds they oversee, including common research, investment, and operational issues. On occasion, the separate Boards establish joint committees to address issues of overlapping consequences for the Fidelity funds overseen by each Board.
The Trustees operate using a system of committees to facilitate the timely and efficient consideration of all matters of importance to the Trustees, the fund, and fund shareholders and to facilitate compliance with legal and regulatory requirements and oversight of the fund's activities and associated risks. The Board, acting through its committees, has charged FMR and its affiliates with (i) identifying events or circumstances the occurrence of which could have demonstrably adverse effects on the fund's business and/or reputation; (ii) implementing processes and controls to lessen the possibility that such events or circumstances occur or to mitigate the effects of such events or circumstances if they do occur; and (iii) creating and maintaining a system designed to evaluate continuously business and market conditions in order to facilitate the identification and implementation processes described in (i) and (ii) above. Because the day-to-day operations and activities of the fund are carried out by or through FMR, its affiliates and other service providers, the fund's exposure to risks is mitigated but not eliminated by the processes overseen by the Trustees. While each of the Board's committees has responsibility for overseeing different aspects of the fund's activities, oversight is exercised primarily through the Operations, Audit, and Compliance Committees. In addition, the Independent Trustees have worked with FMR to enhance the Board's oversight of investment and financial risks, legal and regulatory risks, technology risks, and operational risks, including the development of additional risk reporting to the Board. For example, a working group comprised of Independent Trustees and FMR has worked and continues to work to review the Fidelity funds' valuation-related activities, reporting and risk management. Appropriate personnel, including but not limited to the fund's Chief Compliance Officer (CCO), FMR's internal auditor, the independent accountants, the fund's Treasurer and portfolio management personnel, make periodic reports to the Board's committees, as appropriate, including an annual review of FMR's risk management program for the Fidelity funds. The responsibilities of each standing committee, including their oversight responsibilities, are described further under "Standing Committees of the Fund's Trustees."
Annual Report
The fund's Statement of Additional Information (SAI) includes more information about the Trustees. To request a free copy, call Fidelity at 1-877-208-0098.
Interested Trustees*:
Correspondence intended for each Trustee who is an interested person may be sent to Fidelity Investments, 245 Summer Street, Boston, Massachusetts 02210.
Name, Age; Principal Occupations and Other Relevant Experience+ |
James C. Curvey (77) |
| Year of Election or Appointment: 2007 Mr. Curvey is Trustee and Chairman of the Board of Trustees of certain Trusts. Mr. Curvey also serves as Trustee (2007-present) of other investment companies advised by FMR. Mr. Curvey is a Director of Fidelity Investments Money Management, Inc. (2009-present), Director of Fidelity Research & Analysis Co. (2009-present) and Director of FMR and FMR Co., Inc. (2007-present). Mr. Curvey is also Vice Chairman (2007-present) and Director of FMR LLC. In addition, Mr. Curvey serves as an Overseer for the Boston Symphony Orchestra and a member of the Trustees of Villanova University. Previously, Mr. Curvey was the Vice Chairman (2006-2007) and Director (2000-2007) of FMR Corp. |
Ronald P. O'Hanley (55) |
| Year of Election or Appointment: 2011 Mr. O'Hanley is Director of FMR Co., Inc. (2010-present), Director of Fidelity Investments Money Management, Inc. (2010-present), Director of Fidelity Research & Analysis Company (2010-present), President of Fidelity Asset Management and Corporate Services and a member of Fidelity's Executive Committee (2010-present). Previously, Mr. O'Hanley served as President and Chief Executive Officer of BNY Mellon Asset Management (2007-2010). Mr. O'Hanley also served as Vice Chairman of Bank New York Mellon Corp. and a member of that firm's Executive Committee. Prior to the 2007 merger of The Bank of New York and Mellon Financial Corporation, he was Vice Chairman of Mellon Financial Corporation and President and Chief Executive Officer of Mellon Asset Management. He joined Mellon in February 1997. Mr. O'Hanley currently serves as Chairman of the Boston Public Library Foundation Board of Directors and sits on the Board of Directors of Beth Israel Deaconess Medical Center, the Board of Trustees of the Marine Biological Laboratory and the Advisory Board of the Maxwell School of Citizenship and Public Administration at Syracuse University. Mr. O'Hanley also chairs the Council on Asset Management for the Financial Services Roundtable and is a member of the Board of Directors of Institutional Investor's U.S. Institute. |
* Trustees have been determined to be "Interested Trustees" by virtue of, among other things, their affiliation with the trust or various entities under common control with FMR.
+ The information above includes each Trustee's principal occupation during the last five years and other information relating to the experience, attributes, and skills relevant to each Trustee's qualifications to serve as a Trustee, which led to the conclusion that each Trustee should serve as a Trustee for the fund.
Annual Report
Independent Trustees:
Correspondence intended for each Independent Trustee (that is, the Trustees other than the Interested Trustees) may be sent to Fidelity Investments, P.O. Box 55235, Boston, Massachusetts 02205-5235.
Name, Age; Principal Occupations and Other Relevant Experience+ |
Dennis J. Dirks (64) |
| Year of Election or Appointment: 2005 Prior to his retirement in May 2003, Mr. Dirks was Chief Operating Officer and a member of the Board of The Depository Trust & Clearing Corporation (DTCC). He also served as President, Chief Operating Officer, and Board member of The Depository Trust Company (DTC) and President and Board member of the National Securities Clearing Corporation (NSCC). In addition, Mr. Dirks served as Chief Executive Officer and Board member of the Government Securities Clearing Corporation, Chief Executive Officer and Board member of the Mortgage-Backed Securities Clearing Corporation, as a Trustee and a member of the Finance Committee of Manhattan College (2005-2008), and as a Trustee and a member of the Finance Committee of AHRC of Nassau County (2006-2008). Mr. Dirks is a member of the Independent Directors Council (IDC) Governing Council (2010-present) and Board of Directors for The Brookville Center for Children's Services, Inc. (2009-present). |
Alan J. Lacy (59) |
| Year of Election or Appointment: 2008 Mr. Lacy serves as Senior Adviser (2007-present) of Oak Hill Capital Partners, L.P. (private equity). Mr. Lacy also served as Chief Executive Officer (2000-2005) and Vice Chairman (2005-2006) of Sears Holdings Corporation and Sears, Roebuck and Co. (retail). In addition, Mr. Lacy serves as a member of the Board of Directors of Dave & Buster's Entertainment, Inc. (restaurant and entertainment complexes, 2010-present), Earth Fare, Inc. (retail grocery, 2012-present), The Hillman Companies, Inc. (hardware wholesalers, 2010-present), and Bristol-Myers Squibb Company (global pharmaceuticals, 2008-present). Mr. Lacy is a member of the Board of Trustees of The National Parks Conservation Association (2006-present). Previously, Mr. Lacy served as Chairman of the Board of Trustees of the National Parks Conservation Association (2008-2011) and as a member of the Board of Directors for the Western Union Company (global money transfer, 2006-2011). |
Ned C. Lautenbach (68) |
| Year of Election or Appointment: 2000 Mr. Lautenbach is Chairman of the Independent Trustees of the Equity and High Income Funds (2006-present). Mr. Lautenbach currently serves as the Lead Director of the Eaton Corporation Board of Directors (diversified industrial, 1997-present). Mr. Lautenbach is Chairman of the Board of Directors of the Philharmonic Center for the Arts in Naples, Florida (2012-present) and a member of the Council on Foreign Relations (1994-present). Previously, Mr. Lautenbach was a Partner/Advisory Partner at Clayton, Dubilier & Rice, LLC (private equity investment, 1998-2010), as well as a Director of Sony Corporation (2006-2007). |
Joseph Mauriello (68) |
| Year of Election or Appointment: 2008 Prior to his retirement in January 2006, Mr. Mauriello served in numerous senior management positions including Deputy Chairman and Chief Operating Officer (2004-2005), and Vice Chairman of Financial Services (2002-2004) of KPMG LLP US (professional services, 1965-2005). Mr. Mauriello currently serves as a member of the Board of Directors of XL Group plc. (global insurance and re-insurance, 2006-present). Previously, Mr. Mauriello served as a Director of the Hamilton Funds of the Bank of New York (2006-2007) and of Arcadia Resources Inc. (health care services and products, 2007-2012). |
Robert W. Selander (62) |
| Year of Election or Appointment: 2011 Previously, Mr. Selander served as a Member of the Advisory Board of Fidelity's Equity and High Income Funds (2011), Executive Vice Chairman (2010), Chief Executive Officer (2009-2010), and President and Chief Executive Officer (1997-2009) of Mastercard, Inc. |
Cornelia M. Small (68) |
| Year of Election or Appointment: 2005 Ms. Small is a member of the Board of Directors (2009-present) and Chair of the Investment Committee (2010-present) of the Teagle Foundation. Ms. Small also serves on the Investment Committee of the Berkshire Taconic Community Foundation (2008-present). Previously, Ms. Small served as Chairperson (2002-2008) and a member of the Investment Committee and Chairperson (2008-2012) and a member of the Board of Trustees of Smith College. In addition, Ms. Small served as Chief Investment Officer, Director of Global Equity Investments, and a member of the Board of Directors of Scudder, Stevens & Clark and Scudder Kemper Investments. |
William S. Stavropoulos (73) |
| Year of Election or Appointment: 2002 Mr. Stavropoulos is Vice Chairman of the Independent Trustees of the Equity and High Income Funds (2006-present). Mr. Stavropoulos serves as President and Founder of the Michigan Baseball Foundation, the Great Lakes Loons (2007-present). Mr. Stavropoulos is Chairman Emeritus of the Board of Directors of The Dow Chemical Company, where he previously served in numerous senior management positions, including President, CEO (1995-2000; 2002-2004), Chairman of the Executive Committee (2000-2006), and as a member of the Board of Directors (1990-2006). Currently, Mr. Stavropoulos is a Director of Univar Inc. (global distributor of commodity and specialty chemicals, Chairman from 2010-May 2012 and Lead Director from May 2012-present), Teradata Corporation (data warehousing and technology solutions, 2008-present), Maersk Inc. (industrial conglomerate), and Tyco International, Ltd. (multinational manufacturing and services, 2007-present), and a member of the Advisory Board for Metalmark Capital LLC (private equity investment, 2005-present). Mr. Stavropoulos is an operating advisor to Clayton, Dubilier & Rice, LLC (private equity investment). In addition, Mr. Stavropoulos is a member of the University of Notre Dame Advisory Council for the College of Science, a Trustee of the Rollin L. Gerstacker Foundation, and a Director of the Naples Philharmonic Center for the Arts. Previously, Mr. Stavropoulos served as a Director of Chemical Financial Corporation (bank holding company, 1993-2012). |
David M. Thomas (63) |
| Year of Election or Appointment: 2008 Previously, Mr. Thomas served as Executive Chairman (2005-2006) and Chairman and Chief Executive Officer (2000-2005) of IMS Health, Inc. (pharmaceutical and healthcare information solutions), and a Director of Fortune Brands, Inc. (consumer products, 2000-2011). In addition, Mr. Thomas serves as Non-Executive Chairman of the Board of Directors of Fortune Brands Home and Security (home and security products, 2011-present), and as a member of the Board of Directors of Interpublic Group of Companies, Inc. (marketing communication, 2004-present). |
Michael E. Wiley (62) |
| Year of Election or Appointment: 2008 Mr. Wiley also serves as a Director of Asia Pacific Exploration Consolidated (international oil and gas exploration and production, 2008-present). Mr. Wiley serves as a Director of Tesoro Corporation (independent oil refiner and marketer, 2005-present), and a Director of Bill Barrett Corporation (exploration and production, 2005-present). In addition, Mr. Wiley also serves as a Director of Post Oak Bank (privately-held bank, 2004-present). Previously, Mr. Wiley served as a member of the Board of Trustees of the University of Tulsa (2000-2006; 2007-2010), as a Senior Energy Advisor of Katzenbach Partners, LLC (consulting, 2006-2007), as an Advisory Director of Riverstone Holdings (private investment), Chairman, President, and CEO of Baker Hughes, Inc. (oilfield services, 2000-2004), and as Director of Spinnaker Exploration Company (exploration and production, 2001-2005). |
+ The information above includes each Trustee's principal occupation during the last five years and other information relating to the experience, attributes, and skills relevant to each Trustee's qualifications to serve as a Trustee, which led to the conclusion that each Trustee should serve as a Trustee for the fund.
Advisory Board Members and Executive Officers:
Correspondence intended for David A. Rosow and Garnett A. Smith may be sent to Fidelity Investments, P.O. Box 55235, Boston, Massachusetts 02205-5235. Correspondence intended for each executive officer and Peter S. Lynch may be sent to Fidelity Investments, 245 Summer Street, Boston, Massachusetts 02210.
Name, Age; Principal Occupation |
Peter S. Lynch (69) |
| Year of Election or Appointment: 2003 Member of the Advisory Board of Fidelity's Equity and High Income Funds. Mr. Lynch is Vice Chairman and a Director of FMR and FMR Co., Inc. In addition, Mr. Lynch serves as a Trustee of Boston College and as the Chairman of the Inner-City Scholarship Fund. Previously, Mr. Lynch served on the Special Olympics International Board of Directors (1997-2006). |
David A. Rosow (70) |
| Year of Election or Appointment: 2012 Member of the Advisory Board of Fidelity's Equity and High Income Funds. Chairman and Chief Executive Officer of International Golf Group, Inc. (golf course development, 1989-present). Previously, Mr. Rosow served as Chairman and Chief Executive Officer of Rosow & Company, Inc. (private investment company, 1989-2011), a Lead Director of Hudson United Bancorp (2001-2006) and as a Director of TD Banknorth (1996-2006). In addition, Mr. Rosow is a member (2008-present) and President (2009-present) of the Town Council of Palm Beach, Florida. |
Garnett A. Smith (65) |
| Year of Election or Appointment: 2012 Member of the Advisory Board of Fidelity's Equity and High Income Funds. Prior to Mr. Smith's retirement, he served as Chairman and Chief Executive Officer of Inbrand Corp. (manufacturer of personal absorbent products, 1990-1997). He also served as President (1986-1990) of Inbrand Corp. Prior to his employment with Inbrand Corp., he was employed by a retail fabric chain and North Carolina National Bank. In addition, Mr. Smith is a board member of the Jackson Hole Land Trust (2009-present). |
Kenneth B. Robins (43) |
| Year of Election or Appointment: 2008 President and Treasurer of Fidelity's Equity and High Income Funds. Mr. Robins also serves as President and Treasurer (2010-present) and Assistant Treasurer (2009-present) of other Fidelity funds and is an employee of Fidelity Investments (2004-present). Previously, Mr. Robins served as Deputy Treasurer of the Fidelity funds (2005-2008) and Treasurer and Chief Financial Officer of The North Carolina Capital Management Trust: Cash and Term Portfolios (2006-2008). |
Brian B. Hogan (48) |
| Year of Election or Appointment: 2009 Vice President of Equity and High Income Funds. Mr. Hogan also serves as President of FMR's Equity Division (2009-present). Previously, Mr. Hogan served as Senior Vice President, Equity Research of FMR (2006-2009) and as a portfolio manager. |
Thomas C. Hense (49) |
| Year of Election or Appointment: 2008 or 2010 Vice President of Fidelity's High Income (2008), Small Cap (2008), and Value (2010) Funds. Previously, Mr. Hense served as a portfolio manager for Fidelity's Institutional Money Management Group (Pyramis) (2003-2008). |
Scott C. Goebel (45) |
| Year of Election or Appointment: 2008 Secretary and Chief Legal Officer (CLO) of the Fidelity funds. Mr. Goebel also serves as Secretary of Fidelity Investments Money Management, Inc. (FIMM) (2010-present) and Fidelity Research and Analysis Company (FRAC) (2010-present); Secretary and CLO of The North Carolina Capital Management Trust: Cash and Term Portfolios (2008-present); General Counsel, Secretary, and Senior Vice President of FMR (2008-present) and FMR Co., Inc. (2008-present); employed by FMR LLC or an affiliate (2001-present); Chief Legal Officer of Fidelity Management & Research (Hong Kong) Limited (2008-present) and Assistant Secretary of Fidelity Management & Research (Japan) Inc. (2008-present), and Fidelity Management & Research (U.K.) Inc. (2008-present). Previously, Mr. Goebel served as Assistant Secretary of FIMM (2008-2010), FRAC (2008-2010), and the Funds (2007-2008) and as Vice President and Secretary of Fidelity Distributors Corporation (FDC) (2005-2007). |
William C. Coffey (43) |
| Year of Election or Appointment: 2009 Assistant Secretary of Fidelity's Equity and High Income Funds. Mr. Coffey also serves as Senior Vice President and Deputy General Counsel of FMR LLC (2010-present), and is an employee of Fidelity Investments. Previously, Mr. Coffey served as Vice President and Associate General Counsel of FMR LLC (2005-2009). |
Elizabeth Paige Baumann (44) |
| Year of Election or Appointment: 2012 Anti-Money Laundering (AML) Officer of the Fidelity funds. Ms. Baumann also serves as AML Officer of The North Carolina Capital Management Trust: Cash and Term Portfolios (2012-present), Chief AML Officer of FMR LLC (2012-present), and is an employee of Fidelity Investments. Previously, Ms. Baumann served as Vice President and Deputy Anti-Money Laundering Officer (2007-2012). |
Christine Reynolds (54) |
| Year of Election or Appointment: 2008 Chief Financial Officer of the Fidelity funds. Ms. Reynolds became President of Fidelity Pricing and Cash Management Services (FPCMS) in August 2008. Ms. Reynolds served as Chief Operating Officer of FPCMS (2007-2008). Previously, Ms. Reynolds served as President, Treasurer, and Anti-Money Laundering officer of the Fidelity funds (2004-2007). |
Joseph A. Hanlon (44) |
| Year of Election or Appointment: 2012 Chief Compliance Officer of Fidelity's Equity and High Income Funds. Mr. Hanlon serves as Compliance Officer of FMR, FMR Co., Inc., Fidelity Investments Money Management, Inc. (FIMM), Fidelity Research and Analysis Company (FRAC), Fidelity Management & Research (Japan) Inc., Fidelity Management & Research (U.K.) Inc., Fidelity Management & Research (Hong Kong), and Strategic Advisers, Inc. (2009-present), as Senior Vice President of the Fidelity Asset Management Division (2009-present), and is an employee of Fidelity Investments. |
Joseph F. Zambello (55) |
| Year of Election or Appointment: 2011 Deputy Treasurer of the Fidelity funds. Mr. Zambello is an employee of Fidelity Investments. Previously, Mr. Zambello served as Vice President of FMR's Program Management Group (2009-2011) and Vice President of the Transfer Agent Oversight Group (2005-2009). |
Adrien E. Deberghes (45) |
| Year of Election or Appointment: 2008 Deputy Treasurer of Fidelity's Equity and High Income Funds. Mr. Deberghes also serves as Vice President (2011-present) and Assistant Treasurer (2010-present) of other Fidelity funds, and is an employee of Fidelity Investments (2008-present). Previously, Mr. Deberghes served as Senior Vice President of Mutual Fund Administration at State Street Corporation (2007-2008), Senior Director of Mutual Fund Administration at Investors Bank & Trust (2005-2007), and Director of Finance for Dunkin' Brands (2000-2005). |
Stephen Sadoski (41) |
| Year of Election or Appointment: 2012 Deputy Treasurer of Fidelity's Equity and High Income Funds. Mr. Sadoski also serves as Deputy Treasurer of other Fidelity funds (2013-present) and is an employee of Fidelity Investments (2012-present). Previously, Mr. Sadoski served as Assistant Treasurer of Fidelity's Fixed Income and Asset Allocation Funds (2012-2013), an assistant chief accountant in the Division of Investment Management of the Securities and Exchange Commission (SEC) (2009-2012) and as a senior manager at Deloitte & Touche (1997-2009). |
Stacie Smith (38) |
| Year of Election or Appointment: 2013 Deputy Treasurer of Fidelity's Equity and High Income Funds. Ms. Smith is an employee of Fidelity Investments (2009-present). Previously, Ms. Smith served as Senior Audit Manager of Ernst & Young LLP (1996-2009). |
Stephanie J. Dorsey (43) |
| Year of Election or Appointment: 2010 Assistant Treasurer of Fidelity's Equity and High Income Funds. Ms. Dorsey also serves as President and Treasurer (2013-present) and Assistant Treasurer (2012-present) of other Fidelity funds and is an employee of Fidelity Investments (2008-present). Previously, Ms. Dorsey served as Deputy Treasurer of Fidelity's Fixed Income and Asset Allocation Funds (2008-2013), Treasurer (2004-2008) of the JPMorgan Mutual Funds and Vice President (2004-2008) of JPMorgan Chase Bank. |
John R. Hebble (54) |
| Year of Election or Appointment: 2009 Assistant Treasurer of Fidelity's Equity and High Income Funds. Mr. Hebble also serves as President (2011-present), Treasurer, and Chief Financial Officer of The North Carolina Capital Management Trust: Cash and Term Portfolios (2008-present) and is an employee of Fidelity Investments. Previously, Mr. Hebble served as President and Treasurer of Fidelity's Fixed Income and Asset Allocation Funds (2008-2013). |
Gary W. Ryan (54) |
| Year of Election or Appointment: 2005 Assistant Treasurer of the Fidelity funds. Mr. Ryan is an employee of Fidelity Investments. Previously, Mr. Ryan served as Vice President of Fund Reporting in Fidelity Pricing and Cash Management Services (FPCMS) (1999-2005). |
Jonathan Davis (44) |
| Year of Election or Appointment: 2010 Assistant Treasurer of the Fidelity funds. Mr. Davis is also Assistant Treasurer of Fidelity Rutland Square Trust II and Fidelity Commonwealth Trust II. Mr. Davis is an employee of Fidelity Investments. Previously, Mr. Davis served as Vice President and Associate General Counsel of FMR LLC (2003-2010). |
Annual Report
Class A, Class T, Class B, and Class C designate 100% of the dividends distributed during the fiscal year as qualifying for the dividends-received deduction for corporate shareholders.
Class A, Class T, Class B, and Class C designate 100% of the dividends distributed during the fiscal year as amounts which may be taken into account as a dividend for purposes of the maximum rate under section 1(h)(11) of the Internal Revenue Code.
The fund will notify shareholders in January 2014 of amounts for use in preparing 2013 income tax returns.
Annual Report
Investment Adviser
Fidelity Management & Research Company
Boston, MA
Investment Sub-Advisers
FMR Co., Inc.
Fidelity Management & Research
(U.K.) Inc.
Fidelity Management & Research
(Hong Kong) Limited
Fidelity Management & Research
(Japan) Inc.
General Distributor
Fidelity Distributors Corporation
Smithfield, RI
Transfer and Service Agents
Fidelity Investments Institutional Operations Company, Inc.
Boston, MA
Fidelity Service Company, Inc.
Boston, MA
Custodian
Citibank, N.A.
New York, NY
(Fidelity Investment logo)(registered trademark)
AMCV-UANN-0313
1.838439.104
(Fidelity Investment logo)(registered trademark)
Fidelity Advisor®
Mid Cap Value
Fund - Institutional Class
Annual Report
January 31, 2013
(Fidelity Cover Art)
Institutional Class is a class of
Fidelity® Mid Cap Value Fund
Contents
Performance | (Click Here) | How the fund has done over time. |
Management's Discussion of Fund Performance | (Click Here) | The Portfolio Manager's review of fund performance and strategy. |
Shareholder Expense Example | (Click Here) | An example of shareholder expenses. |
Investment Changes | (Click Here) | A summary of major shifts in the fund's investments over the past six months. |
Investments | (Click Here) | A complete list of the fund's investments with their market values. |
Financial Statements | (Click Here) | Statements of assets and liabilities, operations, and changes in net assets, as well as financial highlights. |
Notes | (Click Here) | Notes to the financial statements. |
Report of Independent Registered Public Accounting Firm | (Click Here) | |
Trustees and Officers | (Click Here) | |
Distributions | (Click Here) | |
To view a fund's proxy voting guidelines and proxy voting record for the 12-month period ended June 30, visit http://www.fidelity.com/proxyvotingresults or visit the Securities and Exchange Commission's (SEC) web site at http://www.sec.gov. You may also call 1-877-208-0098 to request a free copy of the proxy voting guidelines.
Standard & Poor's, S&P and S&P 500 are registered service marks of The McGraw-Hill Companies, Inc. and have been licensed for use by Fidelity Distributors Corporation.
Other third-party marks appearing herein are the property of their respective owners.
All other marks appearing herein are registered or unregistered trademarks or service marks of FMR LLC or an affiliated company. © 2013 FMR LLC. All rights reserved.
This report and the financial statements contained herein are submitted for the general information of the shareholders of the fund. This report is not authorized for distribution to prospective investors in the fund unless preceded or accompanied by an effective prospectus.
A fund files its complete schedule of portfolio holdings with the SEC for the first and third quarters of each fiscal year on Form N-Q. Forms N-Q are available on the SEC's web site at http://www.sec.gov. A fund's Forms N-Q may be reviewed and copied at the SEC's Public Reference Room in Washington, DC. Information regarding the operation of the SEC's Public Reference Room may be obtained by calling 1-800-SEC-0330. For a complete list of a fund's portfolio holdings, view the most recent holdings listing, semiannual report, or annual report on Fidelity's web site at http://www.fidelity.com, http://www.advisor.fidelity.com, or http://www.401k.com, as applicable.
NOT FDIC INSURED • MAY LOSE VALUE • NO BANK GUARANTEE
Neither the fund nor Fidelity Distributors Corporation is a bank.
Annual Report
Average annual total return reflects the change in the value of an investment, assuming reinvestment of the class' distributions from dividend income and capital gains (the profits earned upon the sale of securities that have grown in value, if any) and assuming a constant rate of performance each year. The $10,000 table and the fund's returns do not reflect the deduction of taxes that a shareholder would pay on fund distributions or the redemption of fund shares. During periods of reimbursement by Fidelity, a fund's total return will be greater than it would be had the reimbursement not occurred. How a fund did yesterday is no guarantee of how it will do tomorrow.
Average Annual Total Returns
Periods ended January 31, 2013 | Past 1
year | Past 5
years | Past 10
years |
Institutional Class A | 23.05% | 6.20% | 10.81% |
A The initial offering of Institutional Class shares took place on February 13, 2007. Returns prior to February 13, 2007 are those of Fidelity® Mid Cap Value Fund, the original class of the fund.
$10,000 Over 10 Years
Let's say hypothetically that $10,000 was invested in Fidelity Advisor® Mid Cap Value Fund - Institutional Class on January 31, 2003. The chart shows how the value of your investment would have changed, and also shows how the Russell Midcap® Value Index performed over the same period. The initial offering of Institutional Class took place on February 13, 2007. See above for additional information regarding the performance of Institutional Class.
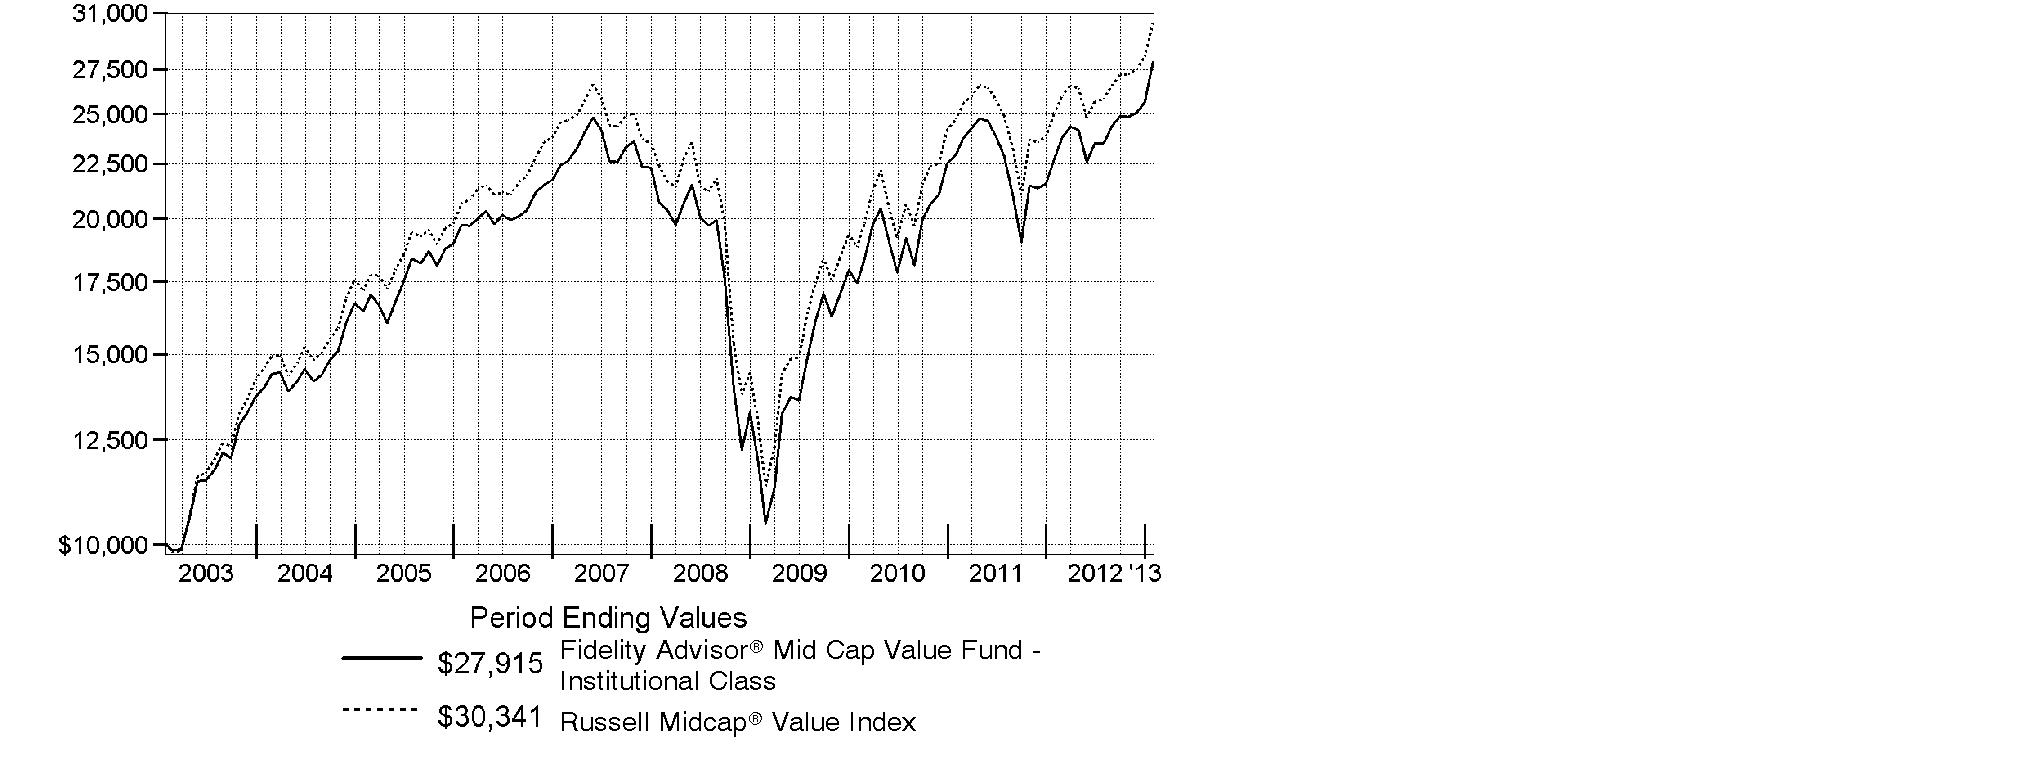
Annual Report
Market Recap: Improvement in the U.S. economy helped lift equity benchmarks to double-digit gains for the year ending January 31, 2013, overcoming moments of volatility driven by sovereign debt woes in Europe, slower economic growth in China and gridlock in Congress. Major U.S. benchmarks hit multiyear highs during the period, encouraged by a rebounding domestic housing market and solid corporate earnings reports. The broad-based S&P 500® Index rose 16.78% for the year, crossing the milestone 1,500 mark near period end. The technology-heavy Nasdaq Composite Index® added 13.13%, and the blue-chip-laden Dow Jones Industrial AverageSM gained 12.75%. Early in the period, stocks rose on positive U.S. economic news and proposed bailouts in Europe. Although fear resurfaced in April and May, equities rebounded in June on central bank stimulus and new life in the housing market. In September, pre-election jitters and the looming "fiscal cliff" of tax hikes and federal spending cuts fueled some profit-taking, followed by a brief post-election sell-off. But stocks proved resilient, as investors continued to pile into riskier assets. Gains were broad-based, with eight of the 10 sectors in the S&P 500® posting double-digit returns. Despite eurozone turmoil, foreign developed-markets stocks rose strongly, with the MSCI® EAFE® Index adding 17.41%.
Comments from Bruce Dirks, Portfolio Manager of Fidelity Advisor® Mid Cap Value Fund: For the year, the fund's Institutional Class shares returned 23.05%, outpacing the 21.34% gain of the Russell Midcap® Value Index. Strong security selection in financials, energy, consumer discretionary, materials and health care fueled the fund's solid relative return. On the downside, adverse stock picking and industry positioning in information technology, industrials and, to a lesser extent, telecommunication services hampered results. The top individual contributors included hospital operator Community Health Systems, oil refiners Valero Energy and Marathon Petroleum, appliance manufacturer Whirlpool, credit card issuer Discover Financial Services and utility Sempra Energy. The primary individual detractors were semiconductor makers Marvell Technology Group and Advanced Micro Devices - the latter being an out-of-benchmark investment - Timken, a maker of specialty steel products, trucking and logistics provider Con-way and flash memory storage developer SanDisk. Most of the stocks mentioned were sold from the fund during the period.
The views expressed above reflect those of the portfolio manager(s) only through the end of the period as stated on the cover of this report and do not necessarily represent the views of Fidelity or any other person in the Fidelity organization. Any such views are subject to change at any time based upon market or other conditions and Fidelity disclaims any responsibility to update such views. These views may not be relied on as investment advice and, because investment decisions for a Fidelity fund are based on numerous factors, may not be relied on as an indication of trading intent on behalf of any Fidelity fund.
Annual Report
Shareholder Expense Example
As a shareholder of the Fund, you incur two types of costs: (1) transaction costs including sales charges (loads) on purchase payments or redemption proceeds, redemption fees and (2) ongoing costs, including management fees, distribution and/or service (12b-1) fees and other Fund expenses. This Example is intended to help you understand your ongoing costs (in dollars) of investing in the Fund and to compare these costs with the ongoing costs of investing in other mutual funds.
The Example is based on an investment of $1,000 invested at the beginning of the period and held for the entire period (August 1, 2012 to January 31, 2013).
Actual Expenses
The first line of the accompanying table for each class of the Fund provides information about actual account values and actual expenses. You may use the information in this line, together with the amount you invested, to estimate the expenses that you paid over the period. Simply divide your account value by $1,000.00 (for example, an $8,600 account value divided by $1,000.00 = 8.6), then multiply the result by the number in the first line for a class of the Fund under the heading entitled "Expenses Paid During Period" to estimate the expenses you paid on your account during this period. A small balance maintenance fee of $12.00 that is charged once a year may apply for certain accounts with a value of less than $2,000. This fee is not included in the table below. If it was, the estimate of expenses you paid during the period would be higher, and your ending account value lower, by this amount. In addition, the Fund, as a shareholder in the underlying Fidelity Central Funds, will indirectly bear its pro-rata share of the fees and expenses incurred by the underlying Fidelity Central Funds. These fees and expenses are not included in the Fund's annualized expense ratio used to calculate the expense estimate in the table below.
Hypothetical Example for Comparison Purposes
The second line of the accompanying table for each class of the Fund provides information about hypothetical account values and hypothetical expenses based on a Class' actual expense ratio and an assumed rate of return of 5% per year before expenses, which is not the Class' actual return. The hypothetical account values and expenses may not be used to estimate the actual ending account balance or expenses you paid for the period. You may use this information to compare the ongoing costs of investing in the Fund and other funds. To do so, compare this 5% hypothetical example with the 5% hypothetical examples that appear in the shareholder reports of the other funds. A small balance maintenance fee of $12.00 that is charged once a year may apply for certain accounts with a value of less than $2,000. This fee is not included in the table below. If it was, the estimate of expenses you paid during the period would be higher, and your ending account value lower, by this amount. In addition, the Fund, as a shareholder in the underlying Fidelity Central Funds, will indirectly bear its pro-rata share of the fees and expenses incurred by the underlying Fidelity Central Funds. These fees and expenses are not included in the Fund's annualized expense ratio used to calculate the expense estimate in the table below.
Please note that the expenses shown in the table are meant to highlight your ongoing costs only and do not reflect any transaction costs. Therefore, the second line of the table is useful in comparing ongoing costs only, and will not help you determine the relative total costs of owning different funds. In addition, if these transactional costs were included, your costs would have been higher.
Annual Report
| Annualized
Expense Ratio | Beginning
Account Value
August 1, 2012 | Ending
Account Value
January 31, 2013 | Expenses Paid
During Period*
August 1, 2012
to January 31, 2013 |
Class A | 1.13% | | | |
Actual | | $ 1,000.00 | $ 1,185.50 | $ 6.21 |
HypotheticalA | | $ 1,000.00 | $ 1,019.46 | $ 5.74 |
Class T | 1.39% | | | |
Actual | | $ 1,000.00 | $ 1,184.60 | $ 7.63 |
HypotheticalA | | $ 1,000.00 | $ 1,018.15 | $ 7.05 |
Class B | 1.88% | | | |
Actual | | $ 1,000.00 | $ 1,181.80 | $ 10.31 |
HypotheticalA | | $ 1,000.00 | $ 1,015.69 | $ 9.53 |
Class C | 1.89% | | | |
Actual | | $ 1,000.00 | $ 1,181.10 | $ 10.36 |
HypotheticalA | | $ 1,000.00 | $ 1,015.63 | $ 9.58 |
Mid Cap Value | .81% | | | |
Actual | | $ 1,000.00 | $ 1,187.60 | $ 4.45 |
HypotheticalA | | $ 1,000.00 | $ 1,021.06 | $ 4.12 |
Institutional Class | .86% | | | |
Actual | | $ 1,000.00 | $ 1,188.00 | $ 4.73 |
HypotheticalA | | $ 1,000.00 | $ 1,020.81 | $ 4.37 |
A 5% return per year before expenses
* Expenses are equal to each Class' annualized expense ratio, multiplied by the average account value over the period, multiplied by 184/366 (to reflect the one-half year period).
Annual Report
Investment Changes (Unaudited)
Top Ten Stocks as of January 31, 2013 |
| % of fund's
net assets | % of fund's net assets
6 months ago |
Valero Energy Corp. | 1.8 | 1.6 |
Marathon Petroleum Corp. | 1.8 | 1.5 |
International Paper Co. | 1.7 | 1.7 |
CIGNA Corp. | 1.6 | 1.1 |
Edison International | 1.6 | 0.0 |
Symantec Corp. | 1.5 | 0.0 |
Fifth Third Bancorp | 1.5 | 1.3 |
Ventas, Inc. | 1.5 | 1.4 |
SunTrust Banks, Inc. | 1.5 | 1.4 |
PPL Corp. | 1.4 | 1.8 |
| 15.9 | |
Top Five Market Sectors as of January 31, 2013 |
| % of fund's
net assets | % of fund's net assets
6 months ago |
Financials | 29.2 | 30.1 |
Industrials | 11.3 | 10.2 |
Information Technology | 10.0 | 10.1 |
Energy | 9.7 | 9.5 |
Utilities | 9.6 | 11.6 |
Asset Allocation (% of fund's net assets) |
As of January 31, 2013* | As of July 31, 2012** |
| Stocks 98.6% | | | Stocks 99.5% | |
| Short-Term
Investments and
Net Other Assets
(Liabilities) 1.4% | | | Short-Term
Investments and
Net Other Assets
(Liabilities) 0.5% | |
* Foreign investments | 3.7% | | ** Foreign investments | 5.2% | |

Annual Report
Investments January 31, 2013
Showing Percentage of Net Assets
Common Stocks - 98.6% |
| Shares | | Value |
CONSUMER DISCRETIONARY - 9.2% |
Diversified Consumer Services - 0.8% |
DeVry, Inc. | 223,100 | | $ 5,615,427 |
Household Durables - 2.5% |
Jarden Corp. | 126,200 | | 7,425,608 |
Whirlpool Corp. | 82,500 | | 9,518,850 |
| | 16,944,458 |
Media - 1.1% |
Gannett Co., Inc. | 394,600 | | 7,745,998 |
Multiline Retail - 1.3% |
Macy's, Inc. | 219,000 | | 8,652,690 |
Specialty Retail - 3.5% |
Best Buy Co., Inc. | 199,600 | | 3,245,496 |
Foot Locker, Inc. | 230,600 | | 7,921,110 |
GameStop Corp. Class A (d) | 158,800 | | 3,684,160 |
Staples, Inc. | 691,000 | | 9,314,680 |
| | 24,165,446 |
TOTAL CONSUMER DISCRETIONARY | | 63,124,019 |
CONSUMER STAPLES - 5.4% |
Beverages - 1.0% |
Molson Coors Brewing Co. Class B | 146,100 | | 6,600,798 |
Food Products - 2.8% |
Campbell Soup Co. (d) | 105,800 | | 3,883,918 |
ConAgra Foods, Inc. | 268,100 | | 8,764,189 |
Tyson Foods, Inc. Class A | 303,700 | | 6,717,844 |
| | 19,365,951 |
Household Products - 0.9% |
Energizer Holdings, Inc. | 74,300 | | 6,464,843 |
Tobacco - 0.7% |
Lorillard, Inc. | 128,600 | | 5,024,402 |
TOTAL CONSUMER STAPLES | | 37,455,994 |
ENERGY - 9.7% |
Energy Equipment & Services - 2.4% |
Cameron International Corp. (a) | 126,500 | | 8,008,715 |
Helmerich & Payne, Inc. | 128,100 | | 8,241,954 |
| | 16,250,669 |
Common Stocks - continued |
| Shares | | Value |
ENERGY - continued |
Oil, Gas & Consumable Fuels - 7.3% |
Denbury Resources, Inc. (a) | 473,300 | | $ 8,817,579 |
Hess Corp. | 108,500 | | 7,286,860 |
Marathon Petroleum Corp. | 164,945 | | 12,240,568 |
Murphy Oil Corp. | 161,700 | | 9,624,384 |
Valero Energy Corp. | 282,900 | | 12,371,218 |
| | 50,340,609 |
TOTAL ENERGY | | 66,591,278 |
FINANCIALS - 29.2% |
Capital Markets - 2.8% |
Apollo Global Management LLC Class A | 241,462 | | 5,377,359 |
KKR & Co. LP | 403,700 | | 6,814,456 |
The Blackstone Group LP | 366,300 | | 6,776,550 |
| | 18,968,365 |
Commercial Banks - 7.2% |
Comerica, Inc. | 197,600 | | 6,789,536 |
Fifth Third Bancorp | 639,600 | | 10,419,084 |
FirstMerit Corp. | 419,700 | | 6,392,031 |
Huntington Bancshares, Inc. | 1,171,600 | | 8,154,336 |
KeyCorp | 810,700 | | 7,620,580 |
SunTrust Banks, Inc. | 359,400 | | 10,196,178 |
| | 49,571,745 |
Consumer Finance - 1.2% |
SLM Corp. | 481,700 | | 8,135,913 |
Diversified Financial Services - 1.1% |
The NASDAQ Stock Market, Inc. | 271,300 | | 7,683,216 |
Insurance - 6.1% |
Allied World Assurance Co. Holdings Ltd. | 46,000 | | 3,902,180 |
Everest Re Group Ltd. | 73,800 | | 8,546,778 |
Hartford Financial Services Group, Inc. | 400,400 | | 9,929,920 |
Lincoln National Corp. | 309,800 | | 8,978,004 |
Reinsurance Group of America, Inc. | 81,100 | | 4,654,329 |
Validus Holdings Ltd. | 162,300 | | 5,909,343 |
| | 41,920,554 |
Real Estate Investment Trusts - 9.6% |
American Campus Communities, Inc. | 134,800 | | 6,277,636 |
AvalonBay Communities, Inc. | 69,500 | | 9,020,405 |
Camden Property Trust (SBI) | 101,300 | | 7,029,207 |
Common Stocks - continued |
| Shares | | Value |
FINANCIALS - continued |
Real Estate Investment Trusts - continued |
DDR Corp. | 273,300 | | $ 4,534,047 |
Extra Space Storage, Inc. | 139,300 | | 5,549,712 |
MFA Financial, Inc. | 667,300 | | 5,999,027 |
Ventas, Inc. | 156,000 | | 10,341,240 |
Vornado Realty Trust | 111,000 | | 9,375,060 |
Weyerhaeuser Co. | 271,100 | | 8,165,532 |
| | 66,291,866 |
Real Estate Management & Development - 1.2% |
Jones Lang LaSalle, Inc. | 86,400 | | 7,960,896 |
TOTAL FINANCIALS | | 200,532,555 |
HEALTH CARE - 7.1% |
Health Care Providers & Services - 4.5% |
CIGNA Corp. | 193,200 | | 11,271,288 |
Community Health Systems, Inc. | 173,000 | | 6,631,090 |
McKesson Corp. | 62,900 | | 6,618,967 |
Omnicare, Inc. | 159,800 | | 6,224,210 |
| | 30,745,555 |
Pharmaceuticals - 2.6% |
Actavis, Inc. (a) | 59,800 | | 5,166,122 |
Endo Pharmaceuticals Holdings, Inc. (a) | 241,900 | | 7,658,554 |
Mylan, Inc. (a) | 186,600 | | 5,275,182 |
| | 18,099,858 |
TOTAL HEALTH CARE | | 48,845,413 |
INDUSTRIALS - 11.3% |
Aerospace & Defense - 1.7% |
Alliant Techsystems, Inc. | 109,600 | | 7,093,312 |
Esterline Technologies Corp. (a) | 73,400 | | 4,873,026 |
| | 11,966,338 |
Airlines - 1.1% |
Delta Air Lines, Inc. (a) | 558,900 | | 7,763,121 |
Commercial Services & Supplies - 1.2% |
Avery Dennison Corp. | 206,000 | | 7,933,060 |
Construction & Engineering - 1.1% |
URS Corp. | 182,903 | | 7,586,816 |
Common Stocks - continued |
| Shares | | Value |
INDUSTRIALS - continued |
Electrical Equipment - 1.0% |
General Cable Corp. (a) | 213,500 | | $ 7,177,870 |
Machinery - 2.2% |
Oshkosh Truck Corp. (a) | 189,700 | | 7,432,446 |
Terex Corp. (a) | 239,600 | | 7,758,248 |
| | 15,190,694 |
Professional Services - 1.2% |
Equifax, Inc. | 60,000 | | 3,522,000 |
Towers Watson & Co. | 73,000 | | 4,458,840 |
| | 7,980,840 |
Trading Companies & Distributors - 1.8% |
MRC Global, Inc. | 168,000 | | 5,162,640 |
WESCO International, Inc. (a) | 94,627 | | 6,901,147 |
| | 12,063,787 |
TOTAL INDUSTRIALS | | 77,662,526 |
INFORMATION TECHNOLOGY - 10.0% |
Communications Equipment - 1.0% |
Brocade Communications Systems, Inc. (a) | 1,268,400 | | 7,255,248 |
Computers & Peripherals - 1.2% |
Western Digital Corp. | 175,300 | | 8,239,100 |
IT Services - 1.2% |
Computer Sciences Corp. | 193,100 | | 8,071,580 |
Office Electronics - 1.4% |
Xerox Corp. | 1,184,900 | | 9,491,049 |
Semiconductors & Semiconductor Equipment - 1.7% |
Avago Technologies Ltd. | 196,400 | | 7,025,228 |
Skyworks Solutions, Inc. (a) | 210,400 | | 5,036,976 |
| | 12,062,204 |
Software - 3.5% |
CA Technologies, Inc. | 358,300 | | 8,893,006 |
Symantec Corp. (a) | 489,300 | | 10,652,061 |
Synopsys, Inc. (a) | 135,800 | | 4,541,152 |
| | 24,086,219 |
TOTAL INFORMATION TECHNOLOGY | | 69,205,400 |
Common Stocks - continued |
| Shares | | Value |
MATERIALS - 5.9% |
Chemicals - 1.8% |
Ashland, Inc. | 62,900 | | $ 4,938,279 |
Eastman Chemical Co. | 100,800 | | 7,171,920 |
| | 12,110,199 |
Containers & Packaging - 0.9% |
Ball Corp. | 147,500 | | 6,566,700 |
Metals & Mining - 1.5% |
Commercial Metals Co. | 337,100 | | 5,612,715 |
Reliance Steel & Aluminum Co. | 72,600 | | 4,698,672 |
| | 10,311,387 |
Paper & Forest Products - 1.7% |
International Paper Co. | 281,700 | | 11,668,014 |
TOTAL MATERIALS | | 40,656,300 |
TELECOMMUNICATION SERVICES - 1.2% |
Diversified Telecommunication Services - 0.8% |
CenturyLink, Inc. | 125,700 | | 5,084,565 |
Wireless Telecommunication Services - 0.4% |
Sprint Nextel Corp. (a) | 527,000 | | 2,967,010 |
TOTAL TELECOMMUNICATION SERVICES | | 8,051,575 |
UTILITIES - 9.6% |
Electric Utilities - 7.3% |
Edison International | 229,500 | | 11,059,605 |
Hawaiian Electric Industries, Inc. | 20,400 | | 550,188 |
IDACORP, Inc. | 148,800 | | 6,905,808 |
NV Energy, Inc. | 418,700 | | 7,925,991 |
Pinnacle West Capital Corp. | 125,300 | | 6,688,514 |
PNM Resources, Inc. | 323,000 | | 6,899,280 |
PPL Corp. | 328,000 | | 9,935,120 |
| | 49,964,506 |
Gas Utilities - 0.9% |
UGI Corp. | 176,500 | | 6,219,860 |
Common Stocks - continued |
| Shares | | Value |
UTILITIES - continued |
Multi-Utilities - 1.4% |
DTE Energy Co. | 153,700 | | $ 9,730,747 |
TOTAL UTILITIES | | 65,915,113 |
TOTAL COMMON STOCKS (Cost $596,508,563) |
678,040,173
|
Money Market Funds - 1.8% |
| | | |
Fidelity Cash Central Fund, 0.16% (b) | 7,500,179 | | 7,500,179 |
Fidelity Securities Lending Cash Central Fund, 0.15% (b)(c) | 4,798,250 | | 4,798,250 |
TOTAL MONEY MARKET FUNDS (Cost $12,298,429) |
12,298,429
|
TOTAL INVESTMENT PORTFOLIO - 100.4% (Cost $608,806,992) | | 690,338,602 |
NET OTHER ASSETS (LIABILITIES) - (0.4)% | | (2,890,871) |
NET ASSETS - 100% | $ 687,447,731 |
Legend |
(a) Non-income producing |
(b) Affiliated fund that is available only to investment companies and other accounts managed by Fidelity Investments. The rate quoted is the annualized seven-day yield of the fund at period end. A complete unaudited listing of the fund's holdings as of its most recent quarter end is available upon request. In addition, each Fidelity Central Fund's financial statements, which are not covered by the Fund's Report of Independent Registered Public Accounting Firm, are available on the SEC's website or upon request. |
(c) Investment made with cash collateral received from securities on loan. |
(d) Security or a portion of the security is on loan at period end. |
Affiliated Central Funds |
Information regarding fiscal year to date income earned by the Fund from investments in Fidelity Central Funds is as follows: |
Fund | Income earned |
Fidelity Cash Central Fund | $ 5,734 |
Fidelity Securities Lending Cash Central Fund | 122,164 |
Total | $ 127,898 |
Other Information |
All investments are categorized as Level 1 under the Fair Value Hierarchy. The inputs or methodology used for valuing securities may not be an indication of the risk associated with investing in those securities. For more information on valuation inputs, please refer to the Investment Valuation section in the accompanying Notes to Financial Statements. |
See accompanying notes which are an integral part of the financial statements.
Annual Report
Statement of Assets and Liabilities
| January 31, 2013 |
| | |
Assets | | |
Investment in securities, at value (including securities loaned of $4,665,358) - See accompanying schedule: Unaffiliated issuers (cost $596,508,563) | $ 678,040,173 | |
Fidelity Central Funds (cost $12,298,429) | 12,298,429 | |
Total Investments (cost $608,806,992) | | $ 690,338,602 |
Receivable for investments sold | | 12,067,676 |
Receivable for fund shares sold | | 2,544,074 |
Dividends receivable | | 397,654 |
Distributions receivable from Fidelity Central Funds | | 3,138 |
Prepaid expenses | | 1,171 |
Other receivables | | 88,145 |
Total assets | | 705,440,460 |
| | |
Liabilities | | |
Payable for investments purchased | $ 11,795,723 | |
Payable for fund shares redeemed | 905,587 | |
Accrued management fee | 288,786 | |
Distribution and service plan fees payable | 14,791 | |
Other affiliated payables | 138,743 | |
Other payables and accrued expenses | 50,849 | |
Collateral on securities loaned, at value | 4,798,250 | |
Total liabilities | | 17,992,729 |
| | |
Net Assets | | $ 687,447,731 |
Net Assets consist of: | | |
Paid in capital | | $ 610,264,039 |
Accumulated undistributed net realized gain (loss) on investments | | (4,347,918) |
Net unrealized appreciation (depreciation) on investments | | 81,531,610 |
Net Assets | | $ 687,447,731 |
See accompanying notes which are an integral part of the financial statements.
Annual Report
Financial Statements - continued
Statement of Assets and Liabilities - continued
| January 31, 2013 |
| | |
Calculation of Maximum Offering Price Class A:
Net Asset Value and redemption price per share ($24,436,123 ÷ 1,270,011 shares) | | $ 19.24 |
| | |
Maximum offering price per share (100/94.25 of $19.24) | | $ 20.41 |
Class T:
Net Asset Value and redemption price per share ($8,358,357 ÷ 435,167 shares) | | $ 19.21 |
| | |
Maximum offering price per share (100/96.50 of $19.21) | | $ 19.91 |
Class B:
Net Asset Value and offering price per share ($1,533,480 ÷ 80,601 shares)A | | $ 19.03 |
| | |
Class C:
Net Asset Value and offering price per share ($6,820,179 ÷ 360,217 shares)A | | $ 18.93 |
| | |
Mid Cap Value:
Net Asset Value, offering price and redemption price per share ($638,424,992 ÷ 32,958,886 shares) | | $ 19.37 |
| | |
Institutional Class:
Net Asset Value, offering price and redemption price per share ($7,874,600 ÷ 408,307 shares) | | $ 19.29 |
A Redemption price per share is equal to net asset value less any applicable contingent deferred sales charge.
See accompanying notes which are an integral part of the financial statements.
Annual Report
Statement of Operations
| Year ended January 31, 2013 |
| | |
Investment Income | | |
Dividends | | $ 13,395,784 |
Income from Fidelity Central Funds | | 127,898 |
Total income | | 13,523,682 |
| | |
Expenses | | |
Management fee
Basic fee | $ 3,314,165 | |
Performance adjustment | (132,746) | |
Transfer agent fees | 1,464,650 | |
Distribution and service plan fees | 154,959 | |
Accounting and security lending fees | 223,431 | |
Custodian fees and expenses | 28,240 | |
Independent trustees' compensation | 3,867 | |
Registration fees | 88,262 | |
Audit | 54,995 | |
Legal | 2,484 | |
Miscellaneous | 6,457 | |
Total expenses before reductions | 5,208,764 | |
Expense reductions | (191,114) | 5,017,650 |
Net investment income (loss) | | 8,506,032 |
Realized and Unrealized Gain (Loss) Net realized gain (loss) on: | | |
Investment securities: | | |
Unaffiliated issuers | 58,043,389 | |
Investment not meeting investment restrictions | 1,279 | |
Total net realized gain (loss) | | 58,044,668 |
Change in net unrealized appreciation (depreciation) on investment securities | | 59,980,492 |
Net gain (loss) | | 118,025,160 |
Net increase (decrease) in net assets resulting from operations | | $ 126,531,192 |
See accompanying notes which are an integral part of the financial statements.
Annual Report
Financial Statements - continued
Statement of Changes in Net Assets
| Year ended
January 31,
2013 | Year ended
January 31,
2012 |
Increase (Decrease) in Net Assets | | |
Operations | | |
Net investment income (loss) | $ 8,506,032 | $ 4,545,431 |
Net realized gain (loss) | 58,044,668 | 70,353,241 |
Change in net unrealized appreciation (depreciation) | 59,980,492 | (90,350,275) |
Net increase (decrease) in net assets resulting
from operations | 126,531,192 | (15,451,603) |
Distributions to shareholders from net investment income | (8,438,509) | (4,101,848) |
Share transactions - net increase (decrease) | (21,044,685) | (97,570,396) |
Redemption fees | 8,162 | 28,676 |
Total increase (decrease) in net assets | 97,056,160 | (117,095,171) |
| | |
Net Assets | | |
Beginning of period | 590,391,571 | 707,486,742 |
End of period (including distributions in excess of net investment income of $0 and $137,586, respectively) | $ 687,447,731 | $ 590,391,571 |
See accompanying notes which are an integral part of the financial statements.
Annual Report
Financial Highlights - Class A
Years ended January 31, | 2013 | 2012 | 2011 | 2010 | 2009 |
Selected Per-Share Data | | | | | |
Net asset value, beginning of period | $ 15.87 | $ 16.16 | $ 12.35 | $ 8.53 | $ 15.05 |
Income from Investment Operations | | | | |
Net investment income (loss) C | .20 | .07 | - G | .07 | .09 |
Net realized and unrealized gain (loss) | 3.38 | (.29) | 3.85 | 3.84 | (6.47) |
Total from investment operations | 3.58 | (.22) | 3.85 | 3.91 | (6.38) |
Distributions from net investment income | (.21) | (.07) | (.04) | (.09) | (.14) |
Distributions from net realized gain | - | - | - | - | - G |
Total distributions | (.21) | (.07) | (.04) | (.09) | (.14) |
Redemption fees added to paid in capital C, G | - | - | - | - | - |
Net asset value, end of period | $ 19.24 | $ 15.87 | $ 16.16 | $ 12.35 | $ 8.53 |
Total Return A, B | 22.73% | (1.34)% | 31.14% | 45.79% | (42.40)% |
Ratios to Average Net Assets D, F | | | | |
Expenses before reductions | 1.15% | 1.17% | 1.17% | 1.21% | 1.12% |
Expenses net of fee waivers, if any | 1.15% | 1.17% | 1.17% | 1.21% | 1.12% |
Expenses net of all reductions | 1.12% | 1.16% | 1.17% | 1.20% | 1.12% |
Net investment income (loss) | 1.15% | .44% | .02% | .62% | .71% |
Supplemental Data | | | | | |
Net assets, end of period (000 omitted) | $ 24,436 | $ 19,578 | $ 23,608 | $ 10,640 | $ 6,404 |
Portfolio turnover rate E | 180% | 173% | 133% | 202% | 268% |
A Total returns would have been lower if certain expenses had not been reduced during the applicable periods shown.
B Total returns do not include the effect of the sales charges.
C Calculated based on average shares outstanding during the period.
D Fees and expenses of any underlying Fidelity Central Funds are not included in the Fund's expense ratio. The Fund indirectly bears its proportionate share of the expenses of any underlying Fidelity Central Funds.
E Amount does not include the portfolio activity of any underlying Fidelity Central Funds.
F Expense ratios reflect operating expenses of the class. Expenses before reductions do not reflect amounts reimbursed by the investment adviser or reductions from brokerage service arrangements or reductions from other expense offset arrangements and do not represent the amount paid by the class during periods when reimbursements or reductions occur. Expenses net of fee waivers reflect expenses after reimbursement by the investment adviser but prior to reductions from brokerage service arrangements or other expense offset arrangements. Expenses net of all reductions represent the net expenses paid by the class.
G Amount represents less than $.01 per share.
See accompanying notes which are an integral part of the financial statements.
Annual Report
Financial Highlights - Class T
Years ended January 31, | 2013 | 2012 | 2011 | 2010 | 2009 |
Selected Per-Share Data | | | | | |
Net asset value, beginning of period | $ 15.84 | $ 16.14 | $ 12.34 | $ 8.53 | $ 15.04 |
Income from Investment Operations | | | | | |
Net investment income (loss) C | .15 | .03 | (.03) | .04 | .06 |
Net realized and unrealized gain (loss) | 3.38 | (.29) | 3.83 | 3.84 | (6.46) |
Total from investment operations | 3.53 | (.26) | 3.80 | 3.88 | (6.40) |
Distributions from net investment income | (.16) | (.04) | - | (.07) | (.11) |
Redemption fees added to paid in capital C, G | - | - | - | - | - |
Net asset value, end of period | $ 19.21 | $ 15.84 | $ 16.14 | $ 12.34 | $ 8.53 |
Total Return A, B | 22.42% | (1.59)% | 30.79% | 45.44% | (42.57)% |
Ratios to Average Net Assets D, F | | | | | |
Expenses before reductions | 1.42% | 1.43% | 1.43% | 1.47% | 1.38% |
Expenses net of fee waivers, if any | 1.42% | 1.43% | 1.43% | 1.47% | 1.38% |
Expenses net of all reductions | 1.38% | 1.42% | 1.43% | 1.46% | 1.38% |
Net investment income (loss) | .89% | .18% | (.24)% | .36% | .45% |
Supplemental Data | | | | | |
Net assets, end of period (000 omitted) | $ 8,358 | $ 6,823 | $ 6,993 | $ 4,010 | $ 2,413 |
Portfolio turnover rate E | 180% | 173% | 133% | 202% | 268% |
A Total returns would have been lower if certain expenses had not been reduced during the applicable periods shown.
B Total returns do not include the effect of the sales charges.
C Calculated based on average shares outstanding during the period.
D Fees and expenses of any underlying Fidelity Central Funds are not included in the Fund's expense ratio. The Fund indirectly bears its proportionate share of the expenses of any underlying Fidelity Central Funds.
E Amount does not include the portfolio activity of any underlying Fidelity Central Funds.
F Expense ratios reflect operating expenses of the class. Expenses before reductions do not reflect amounts reimbursed by the investment adviser or reductions from brokerage service arrangements or reductions from other expense offset arrangements and do not represent the amount paid by the class during periods when reimbursements or reductions occur. Expenses net of fee waivers reflect expenses after reimbursement by the investment adviser but prior to reductions from brokerage service arrangements or other expense offset arrangements. Expenses net of all reductions represent the net expenses paid by the class.
G Amount represents less than $.01 per share.
See accompanying notes which are an integral part of the financial statements.
Annual Report
Financial Highlights - Class B
Years ended January 31, | 2013 | 2012 | 2011 | 2010 | 2009 |
Selected Per-Share Data | | | | | |
Net asset value, beginning of period | $ 15.71 | $ 16.04 | $ 12.32 | $ 8.53 | $ 14.99 |
Income from Investment Operations | | | | | |
Net investment income (loss) C | .07 | (.05) | (.10) | (.01) | (.01) |
Net realized and unrealized gain (loss) | 3.34 | (.28) | 3.82 | 3.82 | (6.40) |
Total from investment operations | 3.41 | (.33) | 3.72 | 3.81 | (6.41) |
Distributions from net investment income | (.09) | - | - | (.02) | (.05) |
Redemption fees added to paid in capital C, G | - | - | - | - | - |
Net asset value, end of period | $ 19.03 | $ 15.71 | $ 16.04 | $ 12.32 | $ 8.53 |
Total Return A, B | 21.79% | (2.06)% | 30.19% | 44.61% | (42.79)% |
Ratios to Average Net Assets D, F | | | | | |
Expenses before reductions | 1.91% | 1.92% | 1.93% | 1.97% | 1.87% |
Expenses net of fee waivers, if any | 1.91% | 1.92% | 1.93% | 1.97% | 1.87% |
Expenses net of all reductions | 1.87% | 1.91% | 1.92% | 1.96% | 1.87% |
Net investment income (loss) | .40% | (.31)% | (.74)% | (.14)% | (.04)% |
Supplemental Data | | | | | |
Net assets, end of period (000 omitted) | $ 1,533 | $ 1,376 | $ 1,793 | $ 1,154 | $ 763 |
Portfolio turnover rate E | 180% | 173% | 133% | 202% | 268% |
A Total returns would have been lower if certain expenses had not been reduced during the applicable periods shown.
B Total returns do not include the effect of the contingent deferred sales charge.
C Calculated based on average shares outstanding during the period.
D Fees and expenses of any underlying Fidelity Central Funds are not included in the Fund's expense ratio. The Fund indirectly bears its proportionate share of the expenses of any underlying Fidelity Central Funds.
E Amount does not include the portfolio activity of any underlying Fidelity Central Funds.
F Expense ratios reflect operating expenses of the class. Expenses before reductions do not reflect amounts reimbursed by the investment adviser or reductions from brokerage service arrangements or reductions from other expense offset arrangements and do not represent the amount paid by the class during periods when reimbursements or reductions occur. Expenses net of fee waivers reflect expenses after reimbursement by the investment adviser but prior to reductions from brokerage service arrangements or other expense offset arrangements. Expenses net of all reductions represent the net expenses paid by the class.
G Amount represents less than $.01 per share.
See accompanying notes which are an integral part of the financial statements.
Annual Report
Financial Highlights - Class C
Years ended January 31, | 2013 | 2012 | 2011 | 2010 | 2009 |
Selected Per-Share Data | | | | | |
Net asset value, beginning of period | $ 15.65 | $ 15.98 | $ 12.27 | $ 8.50 | $ 14.98 |
Income from Investment Operations | | | | | |
Net investment income (loss) C | .07 | (.05) | (.10) | (.01) | - |
Net realized and unrealized gain (loss) | 3.32 | (.28) | 3.81 | 3.80 | (6.41) |
Total from investment operations | 3.39 | (.33) | 3.71 | 3.79 | (6.41) |
Distributions from net investment income | (.11) | - | - | (.02) | (.07) |
Redemption fees added to paid in capital C, G | - | - | - | - | - |
Net asset value, end of period | $ 18.93 | $ 15.65 | $ 15.98 | $ 12.27 | $ 8.50 |
Total Return A, B | 21.73% | (2.07)% | 30.24% | 44.56% | (42.79)% |
Ratios to Average Net Assets D, F | | | | | |
Expenses before reductions | 1.91% | 1.92% | 1.93% | 1.96% | 1.86% |
Expenses net of fee waivers, if any | 1.91% | 1.92% | 1.93% | 1.96% | 1.86% |
Expenses net of all reductions | 1.87% | 1.91% | 1.92% | 1.95% | 1.86% |
Net investment income (loss) | .40% | (.31)% | (.73)% | (.13)% | (.03)% |
Supplemental Data | | | | | |
Net assets, end of period (000 omitted) | $ 6,820 | $ 5,000 | $ 5,309 | $ 2,293 | $ 1,232 |
Portfolio turnover rate E | 180% | 173% | 133% | 202% | 268% |
A Total returns would have been lower if certain expenses had not been reduced during the applicable periods shown.
B Total returns do not include the effect of the contingent deferred sales charge.
C Calculated based on average shares outstanding during the period.
D Fees and expenses of any underlying Fidelity Central Funds are not included in the Fund's expense ratio. The Fund indirectly bears its proportionate share of the expenses of any underlying Fidelity Central Funds.
E Amount does not include the portfolio activity of any underlying Fidelity Central Funds.
F Expense ratios reflect operating expenses of the class. Expenses before reductions do not reflect amounts reimbursed by the investment adviser or reductions from brokerage service arrangements or reductions from other expense offset arrangements and do not represent the amount paid by the class during periods when reimbursements or reductions occur. Expenses net of fee waivers reflect expenses after reimbursement by the investment adviser but prior to reductions from brokerage service arrangements or other expense offset arrangements. Expenses net of all reductions represent the net expenses paid by the class.
G Amount represents less than $.01 per share.
See accompanying notes which are an integral part of the financial statements.
Annual Report
Financial Highlights - Mid Cap Value
Years ended January 31, | 2013 | 2012 | 2011 | 2010 | 2009 |
Selected Per-Share Data | | | | | |
Net asset value, beginning of period | $ 15.97 | $ 16.26 | $ 12.41 | $ 8.57 | $ 15.09 |
Income from Investment Operations | | | | | |
Net investment income (loss) B | .25 | .12 | .04 | .09 | .13 |
Net realized and unrealized gain (loss) | 3.41 | (.30) | 3.87 | 3.86 | (6.49) |
Total from investment operations | 3.66 | (.18) | 3.91 | 3.95 | (6.36) |
Distributions from net investment income | (.26) | (.11) | (.06) | (.11) | (.16) |
Distributions from net realized gain | - | - | - | - | - F |
Total distributions | (.26) | (.11) | (.06) | (.11) | (.16) |
Redemption fees added to paid in capital B, F | - | - | - | - | - |
Net asset value, end of period | $ 19.37 | $ 15.97 | $ 16.26 | $ 12.41 | $ 8.57 |
Total Return A | 23.07% | (1.04)% | 31.51% | 46.06% | (42.19)% |
Ratios to Average Net Assets C, E | | | | | |
Expenses before reductions | .85% | .88% | .91% | .95% | .85% |
Expenses net of fee waivers, if any | .85% | .88% | .91% | .95% | .84% |
Expenses net of all reductions | .81% | .87% | .90% | .94% | .84% |
Net investment income (loss) | 1.46% | .73% | .28% | .88% | .99% |
Supplemental Data | | | | | |
Net assets, end of period (000 omitted) | $ 638,425 | $ 553,947 | $ 666,277 | $ 469,476 | $ 358,380 |
Portfolio turnover rate D | 180% | 173% | 133% | 202% | 268% |
A Total returns would have been lower if certain expenses had not been reduced during the applicable periods shown.
B Calculated based on average shares outstanding during the period.
C Fees and expenses of any underlying Fidelity Central Funds are not included in the Fund's expense ratio. The Fund indirectly bears its proportionate share of the expenses of any underlying Fidelity Central Funds.
D Amount does not include the portfolio activity of any underlying Fidelity Central Funds.
E Expense ratios reflect operating expenses of the class. Expenses before reductions do not reflect amounts reimbursed by the investment adviser or reductions from brokerage service arrangements or reductions from other expense offset arrangements and do not represent the amount paid by the class during periods when reimbursements or reductions occur. Expenses net of fee waivers reflect expenses after reimbursement by the investment adviser but prior to reductions from brokerage service arrangements or other expense offset arrangements. Expenses net of all reductions represent the net expenses paid by the class.
F Amount represents less than $.01 per share.
See accompanying notes which are an integral part of the financial statements.
Annual Report
Financial Highlights - Institutional Class
Years ended January 31, | 2013 | 2012 | 2011 | 2010 | 2009 |
Selected Per-Share Data | | | | | |
Net asset value, beginning of period | $ 15.91 | $ 16.20 | $ 12.36 | $ 8.54 | $ 15.06 |
Income from Investment Operations | | | | | |
Net investment income (loss) B | .24 | .11 | .04 | .10 | .12 |
Net realized and unrealized gain (loss) | 3.40 | (.29) | 3.85 | 3.84 | (6.48) |
Total from investment operations | 3.64 | (.18) | 3.89 | 3.94 | (6.36) |
Distributions from net investment income | (.26) | (.11) | (.05) | (.12) | (.16) |
Redemption fees added to paid in capital B, F | - | - | - | - | - |
Net asset value, end of period | $ 19.29 | $ 15.91 | $ 16.20 | $ 12.36 | $ 8.54 |
Total Return A | 23.05% | (1.07)% | 31.51% | 46.12% | (42.26)% |
Ratios to Average Net Assets C, E | | | | | |
Expenses before reductions | .89% | .91% | .92% | .96% | .87% |
Expenses net of fee waivers, if any | .89% | .91% | .92% | .96% | .87% |
Expenses net of all reductions | .85% | .90% | .92% | .95% | .87% |
Net investment income (loss) | 1.42% | .71% | .27% | .87% | .96% |
Supplemental Data | | | | | |
Net assets, end of period (000 omitted) | $ 7,875 | $ 3,667 | $ 3,507 | $ 3,162 | $ 894 |
Portfolio turnover rate D | 180% | 173% | 133% | 202% | 268% |
A Total returns would have been lower if certain expenses had not been reduced during the applicable periods shown.
B Calculated based on average shares outstanding during the period.
C Fees and expenses of any underlying Fidelity Central Funds are not included in the Fund's expense ratio. The Fund indirectly bears its proportionate share of the expenses of any underlying Fidelity Central Funds.
D Amount does not include the portfolio activity of any underlying Fidelity Central Funds.
E Expense ratios reflect operating expenses of the class. Expenses before reductions do not reflect amounts reimbursed by the investment adviser or reductions from brokerage service arrangements or reductions from other expense offset arrangements and do not represent the amount paid by the class during periods when reimbursements or reductions occur. Expenses net of fee waivers reflect expenses after reimbursement by the investment adviser but prior to reductions from brokerage service arrangements or other expense offset arrangements. Expenses net of all reductions represent the net expenses paid by the class.
F Amount represents less than $.01 per share.
See accompanying notes which are an integral part of the financial statements.
Annual Report
Notes to Financial Statements
For the period ended January 31, 2013
1. Organization.
Fidelity Mid Cap Value Fund (the Fund) is a fund of Fidelity Devonshire Trust (the Trust) and is authorized to issue an unlimited number of shares. The Trust is registered under the Investment Company Act of 1940, as amended (the 1940 Act), as an open-end management investment company organized as a Massachusetts business trust. The Fund offers Class A, Class T, Class C, Mid Cap Value and Institutional Class shares, each of which, along with Class B shares, has equal rights as to assets and voting privileges. Class B shares are closed to new accounts and additional purchases, except for exchanges and reinvestments. Each class has exclusive voting rights with respect to matters that affect that class. Class B shares will automatically convert to Class A shares after a holding period of seven years from the initial date of purchase. Investment income, realized and unrealized capital gains and losses, the common expenses of the Fund, and certain fund-level expense reductions, if any, are allocated on a pro-rata basis to each class based on the relative net assets of each class to the total net assets of the Fund. Each class differs with respect to transfer agent and distribution and service plan fees incurred. Certain expense reductions may also differ by class.
2. Investments in Fidelity Central Funds.
The Fund invests in Fidelity Central Funds, which are open-end investment companies available only to other investment companies and accounts managed by Fidelity Management & Research Company (FMR) and its affiliates. The Fund's Schedule of Investments lists each of the Fidelity Central Funds held as of period end, if any, as an investment of the Fund, but does not include the underlying holdings of each Fidelity Central Fund. As an Investing Fund, the Fund indirectly bears its proportionate share of the expenses of the underlying Fidelity Central Funds.
The Money Market Central Funds seek preservation of capital and current income and are managed by Fidelity Investments Money Management, Inc. (FIMM), an affiliate of FMR.
A complete unaudited list of holdings for each Fidelity Central Fund is available upon request or at the Securities and Exchange Commission (the SEC) website at www.sec.gov. In addition, the financial statements of the Fidelity Central Funds, which are not covered by the Fund's Report of Independent Registered Public Accounting Firm, are available on the SEC website or upon request.
3. Significant Accounting Policies.
The financial statements have been prepared in conformity with accounting principles generally accepted in the United States of America (GAAP), which require management to make certain estimates and assumptions at the date of the financial statements. Actual results could differ from those estimates. Subsequent events, if any, through the
Annual Report
Notes to Financial Statements - continued
3. Significant Accounting Policies - continued
date that the financial statements were issued have been evaluated in the preparation of the financial statements. The following summarizes the significant accounting policies of the Fund:
Investment Valuation. Investments are valued as of 4:00 p.m. Eastern time on the last calendar day of the period. In accordance with valuation policies and procedures approved by the Board of Trustees (the Board), the Fund attempts to obtain prices from one or more third party pricing vendors or brokers to value its investments. When current market prices, quotations or currency exchange rates are not readily available or reliable, investments will be fair valued in good faith by the FMR Fair Value Committee (the Committee), in accordance with procedures adopted by the Fund's Board. Factors used in determining fair value vary by investment type and may include market or investment specific events. The frequency with which these procedures are used cannot be predicted and they may be utilized to a significant extent. The Committee oversees the Fund's valuation policies and procedures and is responsible for approving and reporting to the Board all fair value determinations.
The Fund categorizes the inputs to valuation techniques used to value its investments into a disclosure hierarchy consisting of three levels as shown below:
Level 1 - quoted prices in active markets for identical investments
Level 2 - other significant observable inputs (including quoted prices for similar investments, interest rates, prepayment speeds, etc.)
Level 3 - unobservable inputs (including the Fund's own assumptions based on the best information available)
Valuation techniques used to value the Fund's investments by major category are as follows:
Equity securities, including restricted securities, for which market quotations are readily available, are valued at the last reported sale price or official closing price as reported by a third party pricing vendor on the primary market or exchange on which they are traded and are categorized as Level 1 in the hierarchy. In the event there were no sales during the day or closing prices are not available, securities are valued at the last quoted bid price or may be valued using the last available price and are generally categorized as Level 2 in the hierarchy. For foreign equity securities, when significant market or security specific events arise, comparisons to the valuation of American Depositary Receipts (ADRs), futures contracts, Exchange-Traded Funds (ETFs) and certain indexes as well as quoted prices for similar securities are used and are categorized as Level 2 in the hierarchy. Utilizing these techniques may result in transfers between Level 1 and Level 2.
Annual Report
3. Significant Accounting Policies - continued
Investment Valuation - continued
Investments in open-end mutual funds, including the Fidelity Central Funds, are valued at their closing net asset value (NAV) each business day and are categorized as Level 1 in the hierarchy.
Changes in valuation techniques may result in transfers in or out of an assigned level within the disclosure hierarchy.
Investment Transactions and Income. For financial reporting purposes, the Fund's investment holdings and NAV include trades executed through the end of the last business day of the period. The NAV per share for processing shareholder transactions is calculated as of the close of business of the New York Stock Exchange (NYSE), normally 4:00 p.m. Eastern time and includes trades executed through the end of the prior business day. Gains and losses on securities sold are determined on the basis of identified cost and may include proceeds received from litigation. Dividend income is recorded on the ex-dividend date, except for certain dividends from foreign securities where the ex-dividend date may have passed, which are recorded as soon as the Fund is informed of the ex-dividend date. Non-cash dividends included in dividend income, if any, are recorded at the fair market value of the securities received. Distributions received on securities that represent a return of capital or capital gain are recorded as a reduction of cost of investments and/or as a realized gain. The Fund estimates the components of distributions received that may be considered return of capital distributions or capital gain distributions. Interest income and distributions from the Fidelity Central Funds are accrued as earned.
Expenses. Expenses directly attributable to a fund are charged to that fund. Expenses attributable to more than one fund are allocated among the respective funds on the basis of relative net assets or other appropriate methods. Expense estimates are accrued in the period to which they relate and adjustments are made when actual amounts are known.
Income Tax Information and Distributions to Shareholders. Each year, the Fund intends to qualify as a regulated investment company under Subchapter M of the Internal Revenue Code, including distributing substantially all of its taxable income and realized gains. As a result, no provision for income taxes is required. As of January 31, 2013, the Fund did not have any unrecognized tax benefits in the financial statements; nor is the Fund aware of any tax positions for which it is reasonably possible that the total amounts of unrecognized tax benefits will significantly change in the next twelve months. The Fund files a U.S. federal tax return, in addition to state and local tax returns as required. A fund's federal income tax returns are subject to examination by the Internal Revenue Service (IRS) for a period of three fiscal years after they are filed.
Annual Report
Notes to Financial Statements - continued
3. Significant Accounting Policies - continued
Income Tax Information and Distributions to Shareholders - continued
State and local tax returns may be subject to examination for an additional fiscal year depending on the jurisdiction.
Distributions are declared and recorded on the ex-dividend date. Income dividends and capital gain distributions are declared separately for each class. Income and capital gain distributions are determined in accordance with income tax regulations, which may differ from GAAP. In addition, the Fund claimed a portion of the payment made to redeeming shareholders as a distribution for income tax purposes.
Capital accounts within the financial statements are adjusted for permanent book-tax differences. These adjustments have no impact on net assets or the results of operations. Temporary book-tax differences will reverse in a subsequent period.
Book-tax differences are primarily due to partnerships (including allocations from Fidelity Central Funds), capital loss carryforwards and losses deferred due to wash sales and excise tax regulations.
The federal tax cost of investment securities and unrealized appreciation (depreciation) as of period end were as follows:
Gross unrealized appreciation | $ 87,088,948 |
Gross unrealized depreciation | (6,753,986) |
Net unrealized appreciation (depreciation) on securities and other investments | $ 80,334,962 |
| |
Tax Cost | $ 610,003,640 |
The tax-based components of distributable earnings as of period end were as follows:
Capital loss carryforward | $ (3,151,270) |
Net unrealized appreciation (depreciation) | $ 80,334,962 |
Capital loss carryforwards are only available to offset future capital gains of the Fund to the extent provided by regulations and may be limited. Under the Regulated Investment Company Modernization Act of 2010 (the Act), the Fund is permitted to carry forward capital losses incurred in taxable years beginning after December 22, 2010 for an unlimited period and such capital losses are required to be used prior to any losses that expire. Capital loss carryforwards were as follows:
Fiscal year of expiration | |
2018 | $ (3,151,270) |
Annual Report
3. Significant Accounting Policies - continued
Income Tax Information and Distributions to Shareholders - continued
The tax character of distributions paid was as follows:
| January 31, 2013 | January 31, 2012 |
Ordinary Income | $ 8,438,509 | $ 4,101,848 |
Short-Term Trading (Redemption) Fees. Shares held by investors in the Fund less than 30 days are subject to a redemption fee equal to .75% of the net asset value of shares redeemed. All redemption fees, which reduce the proceeds of the shareholder redemption, are retained by the Fund and accounted for as an addition to paid in capital.
4. Purchases and Sales of Investments.
Purchases and sales of securities, other than short-term securities, aggregated $1,071,381,575 and $1,097,503,166, respectively.
The Fund realized a gain on the sale of an investment not meeting the investment restrictions of the Fund.
5. Fees and Other Transactions with Affiliates.
Management Fee. FMR and its affiliates provide the Fund with investment management related services for which the Fund pays a monthly management fee. The management fee is the sum of an individual fund fee rate that is based on an annual rate of .30% of the Fund's average net assets and an annualized group fee rate that averaged .26% during the period. The group fee rate is based upon the average net assets of all the mutual funds advised by FMR. The group fee rate decreases as assets under management increase and increases as assets under management decrease. In addition, the management fee is subject to a performance adjustment (up to a maximum of ± .20% of the Fund's average net assets over a 36 month performance period). The upward or downward adjustment to the management fee is based on the relative investment performance of Mid Cap Value as compared to an appropriate benchmark index. For the period, the total annual management fee rate, including the performance adjustment, was .53% of the Fund's average net assets.
Distribution and Service Plan Fees. In accordance with Rule 12b-1 of the 1940 Act, the Fund has adopted separate Distribution and Service Plans for each class of shares. Certain classes pay Fidelity Distributors Corporation (FDC), an affiliate of FMR, separate Distribution and Service Fees, each of which is based on an annual percentage of each class' average net assets. In addition, FDC may pay financial intermediaries for selling shares of the Fund and providing shareholder support services. For the period,
Annual Report
Notes to Financial Statements - continued
5. Fees and Other Transactions with Affiliates - continued
Distribution and Service Plan Fees - continued
the Distribution and Service Fee rates, total fees and amounts retained by FDC were as follows:
| Distribution
Fee | Service
Fee | Total Fees | Retained
by FDC |
Class A | -% | .25% | $ 49,153 | $ 1,148 |
Class T | .25% | .25% | 36,050 | 146 |
Class B | .75% | .25% | 13,545 | 10,207 |
Class C | .75% | .25% | 56,211 | 13,628 |
| | | $ 154,959 | $ 25,129 |
Sales Load. FDC may receive a front-end sales charge of up to 5.75% for selling Class A shares and 3.50% for selling Class T shares, some of which is paid to financial intermediaries for selling shares of the Fund. Depending on the holding period, FDC may receive contingent deferred sales charges levied on Class A, Class T, Class B, and Class C redemptions. The deferred sales charges range from 5.00% to 1.00% for Class B shares, 1.00% for Class C shares, 1.00% for certain purchases of Class A shares and .25% for certain purchases of Class T shares.
For the period, sales charge amounts retained by FDC were as follows:
| Retained
by FDC |
Class A | $ 17,414 |
Class T | 3,121 |
Class B* | 1,798 |
Class C* | 1,051 |
| $ 23,384 |
* When Class B and Class C shares are initially sold, FDC pays commissions from its own resources to financial intermediaries through which the sales
are made.
Transfer Agent Fees. Fidelity Investments Institutional Operations Company, Inc. (FIIOC), an affiliate of FMR, is the transfer, dividend disbursing and shareholder servicing agent for each class of the Fund. FIIOC receives account fees and asset-based fees that vary according to the account size and type of account of the shareholders of the respective classes of the Fund. FIIOC pays for typesetting, printing and mailing of
Annual Report
5. Fees and Other Transactions with Affiliates - continued
Transfer Agent Fees - continued
shareholder reports, except proxy statements. For the period, transfer agent fees for each class were as follows:
| Amount | % of
Average
Net Assets |
Class A | $ 59,075 | .30 |
Class T | 22,494 | .31 |
Class B | 4,095 | .30 |
Class C | 17,008 | .30 |
Mid Cap Value | 1,349,008 | .24 |
Institutional Class | 12,970 | .28 |
| $ 1,464,650 | |
Accounting and Security Lending Fees. Fidelity Service Company, Inc. (FSC), an affiliate of FMR, maintains the Fund's accounting records. The accounting fee is based on the level of average net assets for each month. Under a separate contract, FSC administers the security lending program. The security lending fee is based on the number and duration of lending transactions.
Brokerage Commissions. The Fund placed a portion of its portfolio transactions with brokerage firms which are affiliates of the investment adviser. The commissions paid to these affiliated firms were $23,609 for the period.
6. Committed Line of Credit.
The Fund participates with other funds managed by FMR or an affiliate in a $4.25 billion credit facility (the "line of credit") to be utilized for temporary or emergency purposes to fund shareholder redemptions or for other short-term liquidity purposes. The Fund has agreed to pay commitment fees on its pro-rata portion of the line of credit, which amounted to $1,566 and is reflected in Miscellaneous expenses on the Statement of Operations. During the period, there were no borrowings on this line of credit.
7. Security Lending.
The Fund lends portfolio securities through a lending agent from time to time in order to earn additional income. For equity securities, a lending agent is used and may loan securities to certain qualified borrowers, including Fidelity Capital Markets (FCM), a broker-dealer affiliated with the Fund. On the settlement date of the loan, the Fund receives collateral (in the form of U.S. Treasury obligations, letters of credit and/or cash) against the loaned securities and maintains collateral in an amount not less than 100% of
Annual Report
Notes to Financial Statements - continued
7. Security Lending - continued
the market value of the loaned securities during the period of the loan. The market value of the loaned securities is determined at the close of business of the Fund and any additional required collateral is delivered to the Fund on the next business day. If the borrower defaults on its obligation to return the securities loaned because of insolvency or other reasons, a fund could experience delays and costs in recovering the securities loaned or in gaining access to the collateral. Any cash collateral received is invested in the Fidelity Securities Lending Cash Central Fund. The value of loaned securities and cash collateral at period end are disclosed on the Fund's Statement of Assets and Liabilities. The value of securities loaned to FCM at period end was $113,680. Security lending income represents the income earned on investing cash collateral, less rebates paid to borrowers and any lending agent fees associated with the loan, plus any premium payments received for lending certain types of securities. Security lending income is presented in the Statement of Operations as a component of income from Fidelity Central Funds. Total security lending income during the period amounted to $122,164, including $9,612 from securities loaned to FCM.
8. Expense Reductions.
Many of the brokers with whom FMR places trades on behalf of the Fund provided services to the Fund in addition to trade execution. These services included payments of certain expenses on behalf of the Fund totaling $191,057 for the period. In addition, through arrangements with the Fund's custodian, credits realized as a result of uninvested cash balances were used to reduce the Fund's expenses. During the period, these credits reduced the Fund's custody expenses by $57.
9. Distributions to Shareholders.
Distributions to shareholders of each class were as follows:
Years ended January 31, | 2013 | 2012 |
From net investment income | | |
Class A | $ 253,117 | $ 84,201 |
Class T | 66,091 | 17,628 |
Class B | 7,351 | - |
Class C | 38,428 | - |
Mid Cap Value | 7,992,338 | 3,978,985 |
Institutional Class | 81,184 | 21,034 |
Total | $ 8,438,509 | $ 4,101,848 |
Annual Report
10. Share Transactions.
Transactions for each class of shares were as follows:
| Shares | Dollars |
Years ended January 31, | 2013 | 2012 | 2013 | 2012 |
Class A | | | | |
Shares sold | 457,731 | 471,749 | $ 7,879,366 | $ 7,485,577 |
Reinvestment of distributions | 13,590 | 5,251 | 235,643 | 78,338 |
Shares redeemed | (434,657) | (704,307) | (7,246,773) | (11,261,227) |
Net increase (decrease) | 36,664 | (227,307) | $ 868,236 | $ (3,697,312) |
Class T | | | | |
Shares sold | 155,888 | 161,524 | $ 2,678,394 | $ 2,605,707 |
Reinvestment of distributions | 3,790 | 1,166 | 65,644 | 17,360 |
Shares redeemed | (155,220) | (165,147) | (2,624,883) | (2,621,038) |
Net increase (decrease) | 4,458 | (2,457) | $ 119,155 | $ 2,029 |
Class B | | | | |
Shares sold | 10,295 | 9,800 | $ 177,345 | $ 158,077 |
Reinvestment of distributions | 397 | - | 6,824 | - |
Shares redeemed | (17,720) | (33,963) | (295,503) | (529,991) |
Net increase (decrease) | (7,028) | (24,163) | $ (111,334) | $ (371,914) |
Class C | | | | |
Shares sold | 137,133 | 124,340 | $ 2,295,740 | $ 1,963,624 |
Reinvestment of distributions | 2,090 | - | 35,705 | - |
Shares redeemed | (98,602) | (137,041) | (1,645,075) | (2,028,206) |
Net increase (decrease) | 40,621 | (12,701) | $ 686,370 | $ (64,582) |
Mid Cap Value | | | | |
Shares sold | 6,300,912 | 7,442,595 | $ 110,558,662 | $ 120,167,268 |
Reinvestment of distributions | 443,673 | 256,561 | 7,742,097 | 3,848,420 |
Shares redeemed | (8,477,007) | (13,984,343) | (144,053,750) | (217,785,024) |
Net increase (decrease) | (1,732,422) | (6,285,187) | $ (25,752,991) | $ (93,769,336) |
Institutional Class | | | | |
Shares sold | 281,696 | 158,721 | $ 4,930,560 | $ 2,526,829 |
Reinvestment of distributions | 4,459 | 1,314 | 77,497 | 19,637 |
Shares redeemed | (108,318) | (146,013) | (1,862,178) | (2,215,747) |
Net increase (decrease) | 177,837 | 14,022 | $ 3,145,879 | $ 330,719 |
11. Other.
The Fund's organizational documents provide former and current trustees and officers with a limited indemnification against liabilities arising in connection with the performance of their duties to the Fund. In the normal course of business, the Fund may also enter into contracts that provide general indemnifications. The Fund's maximum exposure under these arrangements is unknown as this would be dependent on future claims that may be made against the Fund. The risk of material loss from such claims is considered remote.
Annual Report
To the Trustees of Fidelity Devonshire Trust and the Shareholders of Fidelity Mid Cap Value Fund:
In our opinion, the accompanying statement of assets and liabilities, including the schedule of investments, and the related statements of operations and of changes in net assets and the financial highlights present fairly, in all material respects, the financial position of Fidelity Mid Cap Value Fund (a fund of Fidelity Devonshire Trust) at January 31, 2013, the results of its operations for the year then ended, the changes in its net assets for each of the two years in the period then ended and the financial highlights for each of the five years in the period then ended, in conformity with accounting principles generally accepted in the United States of America. These financial statements and financial highlights (hereafter referred to as "financial statements") are the responsibility of the Fidelity Mid Cap Value Fund's management. Our responsibility is to express an opinion on these financial statements based on our audits. We conducted our audits of these financial statements in accordance with the standards of the Public Company Accounting Oversight Board (United States). Those standards require that we plan and perform the audit to obtain reasonable assurance about whether the financial statements are free of material misstatement. An audit includes examining, on a test basis, evidence supporting the amounts and disclosures in the financial statements, assessing the accounting principles used and significant estimates made by management, and evaluating the overall financial statement presentation. We believe that our audits, which included confirmation of securities at January 31, 2013 by correspondence with the custodian and brokers, provide a reasonable basis for our opinion.
PricewaterhouseCoopers LLP
Boston, Massachusetts
March 13, 2013
Annual Report
The Trustees, Members of the Advisory Board, and executive officers of the trust and fund, as applicable, are listed below. The Board of Trustees governs the fund and is responsible for protecting the interests of shareholders. The Trustees are experienced executives who meet periodically throughout the year to oversee the fund's activities, review contractual arrangements with companies that provide services to the fund, oversee management of the risks associated with such activities and contractual arrangements, and review the fund's performance. Except for James C. Curvey, each of the Trustees oversees 234 Fidelity funds. Mr. Curvey oversees 453 Fidelity funds.
The Trustees hold office without limit in time except that (a) any Trustee may resign; (b) any Trustee may be removed by written instrument, signed by at least two-thirds of the number of Trustees prior to such removal; (c) any Trustee who requests to be retired or who has become incapacitated by illness or injury may be retired by written instrument signed by a majority of the other Trustees; and (d) any Trustee may be removed at any special meeting of shareholders by a two-thirds vote of the outstanding voting securities of the trust. Each Trustee who is not an interested person (as defined in the 1940 Act) (Independent Trustee), shall retire not later than the last day of the calendar year in which his or her 75th birthday occurs. The Independent Trustees may waive this mandatory retirement age policy with respect to individual Trustees. The executive officers and Advisory Board Members hold office without limit in time, except that any officer and Advisory Board Member may resign or may be removed by a vote of a majority of the Trustees at any regular meeting or any special meeting of the Trustees. Except as indicated, each individual has held the office shown or other offices in the same company for the past five years.
Experience, Skills, Attributes, and Qualifications of the Fund's Trustees. The Governance and Nominating Committee has adopted a statement of policy that describes the experience, qualifications, attributes, and skills that are necessary and desirable for potential Independent Trustee candidates (Statement of Policy). The Board believes that each Trustee satisfied at the time he or she was initially elected or appointed a Trustee, and continues to satisfy, the standards contemplated by the Statement of Policy. The Governance and Nominating Committee also engages professional search firms to help identify potential Independent Trustee candidates who have the experience, qualifications, attributes, and skills consistent with the Statement of Policy. From time to time, additional criteria based on the composition and skills of the current Independent Trustees, as well as experience or skills that may be appropriate in light of future changes to board composition, business conditions, and regulatory or other developments, have also been considered by the professional search firms and the Governance and Nominating Committee. In addition, the Board takes into account the Trustees' commitment and participation in Board and committee meetings, as well as their leadership of standing and ad hoc committees throughout their tenure.
In determining that a particular Trustee was and continues to be qualified to serve as a Trustee, the Board has considered a variety of criteria, none of which, in isolation, was controlling. The Board believes that, collectively, the Trustees have balanced and diverse experience, qualifications, attributes, and skills, which allow the Board to operate effectively in governing the fund and protecting the interests of shareholders. Information about the specific experience, skills, attributes, and qualifications of each Trustee, which in each case led to the Board's conclusion that the Trustee should serve (or continue to serve) as a trustee of the fund, is provided below.
Annual Report
Trustees and Officers - continued
Board Structure and Oversight Function. James C. Curvey is an interested person (as defined in the 1940 Act) and currently serves as Chairman. The Trustees have determined that an interested Chairman is appropriate and benefits shareholders because an interested Chairman has a personal and professional stake in the quality and continuity of services provided to the fund. Independent Trustees exercise their informed business judgment to appoint an individual of their choosing to serve as Chairman, regardless of whether the Trustee happens to be independent or a member of management. The Independent Trustees have determined that they can act independently and effectively without having an Independent Trustee serve as Chairman and that a key structural component for assuring that they are in a position to do so is for the Independent Trustees to constitute a substantial majority for the Board. The Independent Trustees also regularly meet in executive session. Ned C. Lautenbach serves as Chairman of the Independent Trustees and as such (i) acts as a liaison between the Independent Trustees and management with respect to matters important to the Independent Trustees and (ii) with management prepares agendas for Board meetings.
Fidelity funds are overseen by different Boards of Trustees. The fund's Board oversees Fidelity's equity and high income funds and another Board oversees Fidelity's investment-grade bond, money market, and asset allocation funds. The asset allocation funds may invest in Fidelity funds overseen by the fund's Board. The use of separate Boards, each with its own committee structure, allows the Trustees of each group of Fidelity funds to focus on the unique issues of the funds they oversee, including common research, investment, and operational issues. On occasion, the separate Boards establish joint committees to address issues of overlapping consequences for the Fidelity funds overseen by each Board.
The Trustees operate using a system of committees to facilitate the timely and efficient consideration of all matters of importance to the Trustees, the fund, and fund shareholders and to facilitate compliance with legal and regulatory requirements and oversight of the fund's activities and associated risks. The Board, acting through its committees, has charged FMR and its affiliates with (i) identifying events or circumstances the occurrence of which could have demonstrably adverse effects on the fund's business and/or reputation; (ii) implementing processes and controls to lessen the possibility that such events or circumstances occur or to mitigate the effects of such events or circumstances if they do occur; and (iii) creating and maintaining a system designed to evaluate continuously business and market conditions in order to facilitate the identification and implementation processes described in (i) and (ii) above. Because the day-to-day operations and activities of the fund are carried out by or through FMR, its affiliates and other service providers, the fund's exposure to risks is mitigated but not eliminated by the processes overseen by the Trustees. While each of the Board's committees has responsibility for overseeing different aspects of the fund's activities, oversight is exercised primarily through the Operations, Audit, and Compliance Committees. In addition, the Independent Trustees have worked with FMR to enhance the Board's oversight of investment and financial risks, legal and regulatory risks, technology risks, and operational risks, including the development of additional risk reporting to the Board. For example, a working group comprised of Independent Trustees and FMR has worked and continues to work to review the Fidelity funds' valuation-related activities, reporting and risk management. Appropriate personnel, including but not limited to the fund's Chief Compliance Officer (CCO), FMR's internal auditor, the independent accountants, the fund's Treasurer and portfolio management personnel, make periodic reports to the Board's committees, as appropriate, including an annual review of FMR's risk management program for the Fidelity funds. The responsibilities of each standing committee, including their oversight responsibilities, are described further under "Standing Committees of the Fund's Trustees."
Annual Report
The fund's Statement of Additional Information (SAI) includes more information about the Trustees. To request a free copy, call Fidelity at 1-877-208-0098.
Interested Trustees*:
Correspondence intended for each Trustee who is an interested person may be sent to Fidelity Investments, 245 Summer Street, Boston, Massachusetts 02210.
Name, Age; Principal Occupations and Other Relevant Experience+ |
James C. Curvey (77) |
| Year of Election or Appointment: 2007 Mr. Curvey is Trustee and Chairman of the Board of Trustees of certain Trusts. Mr. Curvey also serves as Trustee (2007-present) of other investment companies advised by FMR. Mr. Curvey is a Director of Fidelity Investments Money Management, Inc. (2009-present), Director of Fidelity Research & Analysis Co. (2009-present) and Director of FMR and FMR Co., Inc. (2007-present). Mr. Curvey is also Vice Chairman (2007-present) and Director of FMR LLC. In addition, Mr. Curvey serves as an Overseer for the Boston Symphony Orchestra and a member of the Trustees of Villanova University. Previously, Mr. Curvey was the Vice Chairman (2006-2007) and Director (2000-2007) of FMR Corp. |
Ronald P. O'Hanley (55) |
| Year of Election or Appointment: 2011 Mr. O'Hanley is Director of FMR Co., Inc. (2010-present), Director of Fidelity Investments Money Management, Inc. (2010-present), Director of Fidelity Research & Analysis Company (2010-present), President of Fidelity Asset Management and Corporate Services and a member of Fidelity's Executive Committee (2010-present). Previously, Mr. O'Hanley served as President and Chief Executive Officer of BNY Mellon Asset Management (2007-2010). Mr. O'Hanley also served as Vice Chairman of Bank New York Mellon Corp. and a member of that firm's Executive Committee. Prior to the 2007 merger of The Bank of New York and Mellon Financial Corporation, he was Vice Chairman of Mellon Financial Corporation and President and Chief Executive Officer of Mellon Asset Management. He joined Mellon in February 1997. Mr. O'Hanley currently serves as Chairman of the Boston Public Library Foundation Board of Directors and sits on the Board of Directors of Beth Israel Deaconess Medical Center, the Board of Trustees of the Marine Biological Laboratory and the Advisory Board of the Maxwell School of Citizenship and Public Administration at Syracuse University. Mr. O'Hanley also chairs the Council on Asset Management for the Financial Services Roundtable and is a member of the Board of Directors of Institutional Investor's U.S. Institute. |
* Trustees have been determined to be "Interested Trustees" by virtue of, among other things, their affiliation with the trust or various entities under common control with FMR.
+ The information above includes each Trustee's principal occupation during the last five years and other information relating to the experience, attributes, and skills relevant to each Trustee's qualifications to serve as a Trustee, which led to the conclusion that each Trustee should serve as a Trustee for the fund.
Annual Report
Independent Trustees:
Correspondence intended for each Independent Trustee (that is, the Trustees other than the Interested Trustees) may be sent to Fidelity Investments, P.O. Box 55235, Boston, Massachusetts 02205-5235.
Name, Age; Principal Occupations and Other Relevant Experience+ |
Dennis J. Dirks (64) |
| Year of Election or Appointment: 2005 Prior to his retirement in May 2003, Mr. Dirks was Chief Operating Officer and a member of the Board of The Depository Trust & Clearing Corporation (DTCC). He also served as President, Chief Operating Officer, and Board member of The Depository Trust Company (DTC) and President and Board member of the National Securities Clearing Corporation (NSCC). In addition, Mr. Dirks served as Chief Executive Officer and Board member of the Government Securities Clearing Corporation, Chief Executive Officer and Board member of the Mortgage-Backed Securities Clearing Corporation, as a Trustee and a member of the Finance Committee of Manhattan College (2005-2008), and as a Trustee and a member of the Finance Committee of AHRC of Nassau County (2006-2008). Mr. Dirks is a member of the Independent Directors Council (IDC) Governing Council (2010-present) and Board of Directors for The Brookville Center for Children's Services, Inc. (2009-present). |
Alan J. Lacy (59) |
| Year of Election or Appointment: 2008 Mr. Lacy serves as Senior Adviser (2007-present) of Oak Hill Capital Partners, L.P. (private equity). Mr. Lacy also served as Chief Executive Officer (2000-2005) and Vice Chairman (2005-2006) of Sears Holdings Corporation and Sears, Roebuck and Co. (retail). In addition, Mr. Lacy serves as a member of the Board of Directors of Dave & Buster's Entertainment, Inc. (restaurant and entertainment complexes, 2010-present), Earth Fare, Inc. (retail grocery, 2012-present), The Hillman Companies, Inc. (hardware wholesalers, 2010-present), and Bristol-Myers Squibb Company (global pharmaceuticals, 2008-present). Mr. Lacy is a member of the Board of Trustees of The National Parks Conservation Association (2006-present). Previously, Mr. Lacy served as Chairman of the Board of Trustees of the National Parks Conservation Association (2008-2011) and as a member of the Board of Directors for the Western Union Company (global money transfer, 2006-2011). |
Ned C. Lautenbach (68) |
| Year of Election or Appointment: 2000 Mr. Lautenbach is Chairman of the Independent Trustees of the Equity and High Income Funds (2006-present). Mr. Lautenbach currently serves as the Lead Director of the Eaton Corporation Board of Directors (diversified industrial, 1997-present). Mr. Lautenbach is Chairman of the Board of Directors of the Philharmonic Center for the Arts in Naples, Florida (2012-present) and a member of the Council on Foreign Relations (1994-present). Previously, Mr. Lautenbach was a Partner/Advisory Partner at Clayton, Dubilier & Rice, LLC (private equity investment, 1998-2010), as well as a Director of Sony Corporation (2006-2007). |
Joseph Mauriello (68) |
| Year of Election or Appointment: 2008 Prior to his retirement in January 2006, Mr. Mauriello served in numerous senior management positions including Deputy Chairman and Chief Operating Officer (2004-2005), and Vice Chairman of Financial Services (2002-2004) of KPMG LLP US (professional services, 1965-2005). Mr. Mauriello currently serves as a member of the Board of Directors of XL Group plc. (global insurance and re-insurance, 2006-present). Previously, Mr. Mauriello served as a Director of the Hamilton Funds of the Bank of New York (2006-2007) and of Arcadia Resources Inc. (health care services and products, 2007-2012). |
Robert W. Selander (62) |
| Year of Election or Appointment: 2011 Previously, Mr. Selander served as a Member of the Advisory Board of Fidelity's Equity and High Income Funds (2011), Executive Vice Chairman (2010), Chief Executive Officer (2009-2010), and President and Chief Executive Officer (1997-2009) of Mastercard, Inc. |
Cornelia M. Small (68) |
| Year of Election or Appointment: 2005 Ms. Small is a member of the Board of Directors (2009-present) and Chair of the Investment Committee (2010-present) of the Teagle Foundation. Ms. Small also serves on the Investment Committee of the Berkshire Taconic Community Foundation (2008-present). Previously, Ms. Small served as Chairperson (2002-2008) and a member of the Investment Committee and Chairperson (2008-2012) and a member of the Board of Trustees of Smith College. In addition, Ms. Small served as Chief Investment Officer, Director of Global Equity Investments, and a member of the Board of Directors of Scudder, Stevens & Clark and Scudder Kemper Investments. |
William S. Stavropoulos (73) |
| Year of Election or Appointment: 2002 Mr. Stavropoulos is Vice Chairman of the Independent Trustees of the Equity and High Income Funds (2006-present). Mr. Stavropoulos serves as President and Founder of the Michigan Baseball Foundation, the Great Lakes Loons (2007-present). Mr. Stavropoulos is Chairman Emeritus of the Board of Directors of The Dow Chemical Company, where he previously served in numerous senior management positions, including President, CEO (1995-2000; 2002-2004), Chairman of the Executive Committee (2000-2006), and as a member of the Board of Directors (1990-2006). Currently, Mr. Stavropoulos is a Director of Univar Inc. (global distributor of commodity and specialty chemicals, Chairman from 2010-May 2012 and Lead Director from May 2012-present), Teradata Corporation (data warehousing and technology solutions, 2008-present), Maersk Inc. (industrial conglomerate), and Tyco International, Ltd. (multinational manufacturing and services, 2007-present), and a member of the Advisory Board for Metalmark Capital LLC (private equity investment, 2005-present). Mr. Stavropoulos is an operating advisor to Clayton, Dubilier & Rice, LLC (private equity investment). In addition, Mr. Stavropoulos is a member of the University of Notre Dame Advisory Council for the College of Science, a Trustee of the Rollin L. Gerstacker Foundation, and a Director of the Naples Philharmonic Center for the Arts. Previously, Mr. Stavropoulos served as a Director of Chemical Financial Corporation (bank holding company, 1993-2012). |
David M. Thomas (63) |
| Year of Election or Appointment: 2008 Previously, Mr. Thomas served as Executive Chairman (2005-2006) and Chairman and Chief Executive Officer (2000-2005) of IMS Health, Inc. (pharmaceutical and healthcare information solutions), and a Director of Fortune Brands, Inc. (consumer products, 2000-2011). In addition, Mr. Thomas serves as Non-Executive Chairman of the Board of Directors of Fortune Brands Home and Security (home and security products, 2011-present), and as a member of the Board of Directors of Interpublic Group of Companies, Inc. (marketing communication, 2004-present). |
Michael E. Wiley (62) |
| Year of Election or Appointment: 2008 Mr. Wiley also serves as a Director of Asia Pacific Exploration Consolidated (international oil and gas exploration and production, 2008-present). Mr. Wiley serves as a Director of Tesoro Corporation (independent oil refiner and marketer, 2005-present), and a Director of Bill Barrett Corporation (exploration and production, 2005-present). In addition, Mr. Wiley also serves as a Director of Post Oak Bank (privately-held bank, 2004-present). Previously, Mr. Wiley served as a member of the Board of Trustees of the University of Tulsa (2000-2006; 2007-2010), as a Senior Energy Advisor of Katzenbach Partners, LLC (consulting, 2006-2007), as an Advisory Director of Riverstone Holdings (private investment), Chairman, President, and CEO of Baker Hughes, Inc. (oilfield services, 2000-2004), and as Director of Spinnaker Exploration Company (exploration and production, 2001-2005). |
+ The information above includes each Trustee's principal occupation during the last five years and other information relating to the experience, attributes, and skills relevant to each Trustee's qualifications to serve as a Trustee, which led to the conclusion that each Trustee should serve as a Trustee for the fund.
Advisory Board Members and Executive Officers:
Correspondence intended for David A. Rosow and Garnett A. Smith may be sent to Fidelity Investments, P.O. Box 55235, Boston, Massachusetts 02205-5235. Correspondence intended for each executive officer and Peter S. Lynch may be sent to Fidelity Investments, 245 Summer Street, Boston, Massachusetts 02210.
Name, Age; Principal Occupation |
Peter S. Lynch (69) |
| Year of Election or Appointment: 2003 Member of the Advisory Board of Fidelity's Equity and High Income Funds. Mr. Lynch is Vice Chairman and a Director of FMR and FMR Co., Inc. In addition, Mr. Lynch serves as a Trustee of Boston College and as the Chairman of the Inner-City Scholarship Fund. Previously, Mr. Lynch served on the Special Olympics International Board of Directors (1997-2006). |
David A. Rosow (70) |
| Year of Election or Appointment: 2012 Member of the Advisory Board of Fidelity's Equity and High Income Funds. Chairman and Chief Executive Officer of International Golf Group, Inc. (golf course development, 1989-present). Previously, Mr. Rosow served as Chairman and Chief Executive Officer of Rosow & Company, Inc. (private investment company, 1989-2011), a Lead Director of Hudson United Bancorp (2001-2006) and as a Director of TD Banknorth (1996-2006). In addition, Mr. Rosow is a member (2008-present) and President (2009-present) of the Town Council of Palm Beach, Florida. |
Garnett A. Smith (65) |
| Year of Election or Appointment: 2012 Member of the Advisory Board of Fidelity's Equity and High Income Funds. Prior to Mr. Smith's retirement, he served as Chairman and Chief Executive Officer of Inbrand Corp. (manufacturer of personal absorbent products, 1990-1997). He also served as President (1986-1990) of Inbrand Corp. Prior to his employment with Inbrand Corp., he was employed by a retail fabric chain and North Carolina National Bank. In addition, Mr. Smith is a board member of the Jackson Hole Land Trust (2009-present). |
Kenneth B. Robins (43) |
| Year of Election or Appointment: 2008 President and Treasurer of Fidelity's Equity and High Income Funds. Mr. Robins also serves as President and Treasurer (2010-present) and Assistant Treasurer (2009-present) of other Fidelity funds and is an employee of Fidelity Investments (2004-present). Previously, Mr. Robins served as Deputy Treasurer of the Fidelity funds (2005-2008) and Treasurer and Chief Financial Officer of The North Carolina Capital Management Trust: Cash and Term Portfolios (2006-2008). |
Brian B. Hogan (48) |
| Year of Election or Appointment: 2009 Vice President of Equity and High Income Funds. Mr. Hogan also serves as President of FMR's Equity Division (2009-present). Previously, Mr. Hogan served as Senior Vice President, Equity Research of FMR (2006-2009) and as a portfolio manager. |
Thomas C. Hense (49) |
| Year of Election or Appointment: 2008 or 2010 Vice President of Fidelity's High Income (2008), Small Cap (2008), and Value (2010) Funds. Previously, Mr. Hense served as a portfolio manager for Fidelity's Institutional Money Management Group (Pyramis) (2003-2008). |
Scott C. Goebel (45) |
| Year of Election or Appointment: 2008 Secretary and Chief Legal Officer (CLO) of the Fidelity funds. Mr. Goebel also serves as Secretary of Fidelity Investments Money Management, Inc. (FIMM) (2010-present) and Fidelity Research and Analysis Company (FRAC) (2010-present); Secretary and CLO of The North Carolina Capital Management Trust: Cash and Term Portfolios (2008-present); General Counsel, Secretary, and Senior Vice President of FMR (2008-present) and FMR Co., Inc. (2008-present); employed by FMR LLC or an affiliate (2001-present); Chief Legal Officer of Fidelity Management & Research (Hong Kong) Limited (2008-present) and Assistant Secretary of Fidelity Management & Research (Japan) Inc. (2008-present), and Fidelity Management & Research (U.K.) Inc. (2008-present). Previously, Mr. Goebel served as Assistant Secretary of FIMM (2008-2010), FRAC (2008-2010), and the Funds (2007-2008) and as Vice President and Secretary of Fidelity Distributors Corporation (FDC) (2005-2007). |
William C. Coffey (43) |
| Year of Election or Appointment: 2009 Assistant Secretary of Fidelity's Equity and High Income Funds. Mr. Coffey also serves as Senior Vice President and Deputy General Counsel of FMR LLC (2010-present), and is an employee of Fidelity Investments. Previously, Mr. Coffey served as Vice President and Associate General Counsel of FMR LLC (2005-2009). |
Elizabeth Paige Baumann (44) |
| Year of Election or Appointment: 2012 Anti-Money Laundering (AML) Officer of the Fidelity funds. Ms. Baumann also serves as AML Officer of The North Carolina Capital Management Trust: Cash and Term Portfolios (2012-present), Chief AML Officer of FMR LLC (2012-present), and is an employee of Fidelity Investments. Previously, Ms. Baumann served as Vice President and Deputy Anti-Money Laundering Officer (2007-2012). |
Christine Reynolds (54) |
| Year of Election or Appointment: 2008 Chief Financial Officer of the Fidelity funds. Ms. Reynolds became President of Fidelity Pricing and Cash Management Services (FPCMS) in August 2008. Ms. Reynolds served as Chief Operating Officer of FPCMS (2007-2008). Previously, Ms. Reynolds served as President, Treasurer, and Anti-Money Laundering officer of the Fidelity funds (2004-2007). |
Joseph A. Hanlon (44) |
| Year of Election or Appointment: 2012 Chief Compliance Officer of Fidelity's Equity and High Income Funds. Mr. Hanlon serves as Compliance Officer of FMR, FMR Co., Inc., Fidelity Investments Money Management, Inc. (FIMM), Fidelity Research and Analysis Company (FRAC), Fidelity Management & Research (Japan) Inc., Fidelity Management & Research (U.K.) Inc., Fidelity Management & Research (Hong Kong), and Strategic Advisers, Inc. (2009-present), as Senior Vice President of the Fidelity Asset Management Division (2009-present), and is an employee of Fidelity Investments. |
Joseph F. Zambello (55) |
| Year of Election or Appointment: 2011 Deputy Treasurer of the Fidelity funds. Mr. Zambello is an employee of Fidelity Investments. Previously, Mr. Zambello served as Vice President of FMR's Program Management Group (2009-2011) and Vice President of the Transfer Agent Oversight Group (2005-2009). |
Adrien E. Deberghes (45) |
| Year of Election or Appointment: 2008 Deputy Treasurer of Fidelity's Equity and High Income Funds. Mr. Deberghes also serves as Vice President (2011-present) and Assistant Treasurer (2010-present) of other Fidelity funds, and is an employee of Fidelity Investments (2008-present). Previously, Mr. Deberghes served as Senior Vice President of Mutual Fund Administration at State Street Corporation (2007-2008), Senior Director of Mutual Fund Administration at Investors Bank & Trust (2005-2007), and Director of Finance for Dunkin' Brands (2000-2005). |
Stephen Sadoski (41) |
| Year of Election or Appointment: 2012 Deputy Treasurer of Fidelity's Equity and High Income Funds. Mr. Sadoski also serves as Deputy Treasurer of other Fidelity funds (2013-present) and is an employee of Fidelity Investments (2012-present). Previously, Mr. Sadoski served as Assistant Treasurer of Fidelity's Fixed Income and Asset Allocation Funds (2012-2013), an assistant chief accountant in the Division of Investment Management of the Securities and Exchange Commission (SEC) (2009-2012) and as a senior manager at Deloitte & Touche (1997-2009). |
Stacie Smith (38) |
| Year of Election or Appointment: 2013 Deputy Treasurer of Fidelity's Equity and High Income Funds. Ms. Smith is an employee of Fidelity Investments (2009-present). Previously, Ms. Smith served as Senior Audit Manager of Ernst & Young LLP (1996-2009). |
Stephanie J. Dorsey (43) |
| Year of Election or Appointment: 2010 Assistant Treasurer of Fidelity's Equity and High Income Funds. Ms. Dorsey also serves as President and Treasurer (2013-present) and Assistant Treasurer (2012-present) of other Fidelity funds and is an employee of Fidelity Investments (2008-present). Previously, Ms. Dorsey served as Deputy Treasurer of Fidelity's Fixed Income and Asset Allocation Funds (2008-2013), Treasurer (2004-2008) of the JPMorgan Mutual Funds and Vice President (2004-2008) of JPMorgan Chase Bank. |
John R. Hebble (54) |
| Year of Election or Appointment: 2009 Assistant Treasurer of Fidelity's Equity and High Income Funds. Mr. Hebble also serves as President (2011-present), Treasurer, and Chief Financial Officer of The North Carolina Capital Management Trust: Cash and Term Portfolios (2008-present) and is an employee of Fidelity Investments. Previously, Mr. Hebble served as President and Treasurer of Fidelity's Fixed Income and Asset Allocation Funds (2008-2013). |
Gary W. Ryan (54) |
| Year of Election or Appointment: 2005 Assistant Treasurer of the Fidelity funds. Mr. Ryan is an employee of Fidelity Investments. Previously, Mr. Ryan served as Vice President of Fund Reporting in Fidelity Pricing and Cash Management Services (FPCMS) (1999-2005). |
Jonathan Davis (44) |
| Year of Election or Appointment: 2010 Assistant Treasurer of the Fidelity funds. Mr. Davis is also Assistant Treasurer of Fidelity Rutland Square Trust II and Fidelity Commonwealth Trust II. Mr. Davis is an employee of Fidelity Investments. Previously, Mr. Davis served as Vice President and Associate General Counsel of FMR LLC (2003-2010). |
Annual Report
Institutional Class designates 100% of the dividends distributed during the fiscal year as qualifying for the dividends-received deduction for corporate shareholders.
Institutional Class designates 100% of the dividends distributed during the fiscal year as amounts which may be taken into account as a dividend for purposes of the maximum rate under section 1(h)(11) of the Internal Revenue Code.
The fund will notify shareholders in January 2014 of amounts for use in preparing 2013 income tax returns.
Annual Report
Investment Adviser
Fidelity Management & Research Company
Boston, MA
Investment Sub-Advisers
FMR Co., Inc.
Fidelity Management & Research
(U.K.) Inc.
Fidelity Management & Research
(Hong Kong) Limited
Fidelity Management & Research
(Japan) Inc.
General Distributor
Fidelity Distributors Corporation
Smithfield, RI
Transfer and Service Agents
Fidelity Investments Institutional Operations Company, Inc.
Boston, MA
Fidelity Service Company, Inc.
Boston, MA
Custodian
Citibank, N.A.
New York, NY
(Fidelity Investment logo)(registered trademark)
AMCVI-UANN-0313
1.838432.103
Fidelity®
Large Cap Growth
Fund
Annual Report
January 31, 2013
(Fidelity Cover Art)
Contents
Note to shareholders | (Click Here) | Important information about the fund. |
Performance | (Click Here) | How the fund has done over time. |
Management's Discussion of Fund Performance | (Click Here) | The Portfolio Manager's review of fund performance and strategy. |
Shareholder Expense Example | (Click Here) | An example of shareholder expenses. |
Investment Changes | (Click Here) | A summary of major shifts in the fund's investments over the past six months. |
Investments | (Click Here) | A complete list of the fund's investments with their market values. |
Financial Statements | (Click Here) | Statements of assets and liabilities, operations, and changes in net assets, as well as financial highlights. |
Notes | (Click Here) | Notes to the financial statements. |
Report of Independent Registered Public Accounting Firm | (Click Here) | |
Trustees and Officers | (Click Here) | |
Distributions | (Click Here) | |
To view a fund's proxy voting guidelines and proxy voting record for the 12-month period ended June 30, visit http://www.fidelity.com/proxyvotingresults or visit the Securities and Exchange Commission's (SEC) web site at http://www.sec.gov. You may also call 1-800-544-8544 to request a free copy of the proxy voting guidelines.
Standard & Poor's, S&P and S&P 500 are registered service marks of The McGraw-Hill Companies, Inc. and have been licensed for use by Fidelity Distributors Corporation.
Other third-party marks appearing herein are the property of their respective owners.
All other marks appearing herein are registered or unregistered trademarks or service marks of FMR LLC or an affiliated company. © 2013 FMR LLC. All rights reserved.
Annual Report
This report and the financial statements contained herein are submitted for the general information of the shareholders of the fund. This report is not authorized for distribution to prospective investors in the fund unless preceded or accompanied by an effective prospectus.
A fund files its complete schedule of portfolio holdings with the SEC for the first and third quarters of each fiscal year on Form N-Q. Forms N-Q are available on the SEC's web site at http://www.sec.gov. A fund's Forms N-Q may be reviewed and copied at the SEC's Public Reference Room in Washington, DC. Information regarding the operation of the SEC's Public Reference Room may be obtained by calling 1-800-SEC-0330. For a complete list of a fund's portfolio holdings, view the most recent holdings listing, semiannual report, or annual report on Fidelity's web site at http://www.fidelity.com, http://www.advisor.fidelity.com, or http://www.401k.com, as applicable.
NOT FDIC INSURED • MAY LOSE VALUE • NO BANK GUARANTEE
Neither the fund nor Fidelity Distributors Corporation is a bank.
Annual Report
Note to shareholders
On November 14, 2012, the Board of Trustees approved a proposal to merge Fidelity® Large Cap Growth Fund into Fidelity® Stock Selector All Cap Fund. Shareholders of Fidelity Large Cap Growth Fund are expected to meet on May 14, 2013, to vote on the proposal. If approved, the merger is expected to be completed on or about June 21, 2013. Fidelity Large Cap Growth Fund closed to new investors after the close of business on December 14, 2012.
The note above is not a solicitation of any proxy. For a free copy of the proxy statement describing the reorganization (and containing important information about fees, expenses and risk considerations) and a prospectus for Fidelity Stock Selector All Cap Fund, please call 1-800-544-8544. The prospectus/proxy statement also is available for free on the Securities and Exchange Commission's website (www.sec.gov).
Annual Report
Average annual total return reflects the change in the value of an investment, assuming reinvestment of the class' distributions from dividend income and capital gains (the profits earned upon the sale of securities that have grown in value, if any) and assuming a constant rate of performance each year. The $10,000 table and the fund's returns do not reflect the deduction of taxes that a shareholder would pay on fund distributions or the redemption of fund shares. During periods of reimbursement by Fidelity, a fund's total return will be greater than it would be had the reimbursement not occurred. How a fund did yesterday is no guarantee of how it will do tomorrow.
Average Annual Total Returns
Periods ended January 31, 2013 | Past 1
year | Past 5
years | Past 10
years |
Fidelity® Large Cap Growth Fund | 15.00% | 4.02% | 7.34% |
$10,000 Over 10 Years
Let's say hypothetically that $10,000 was invested in Fidelity® Large Cap Growth Fund, a class of the fund, on January 31, 2003. The chart shows how the value of your investment would have changed, and also shows how the Russell 1000® Growth Index performed over the same period.
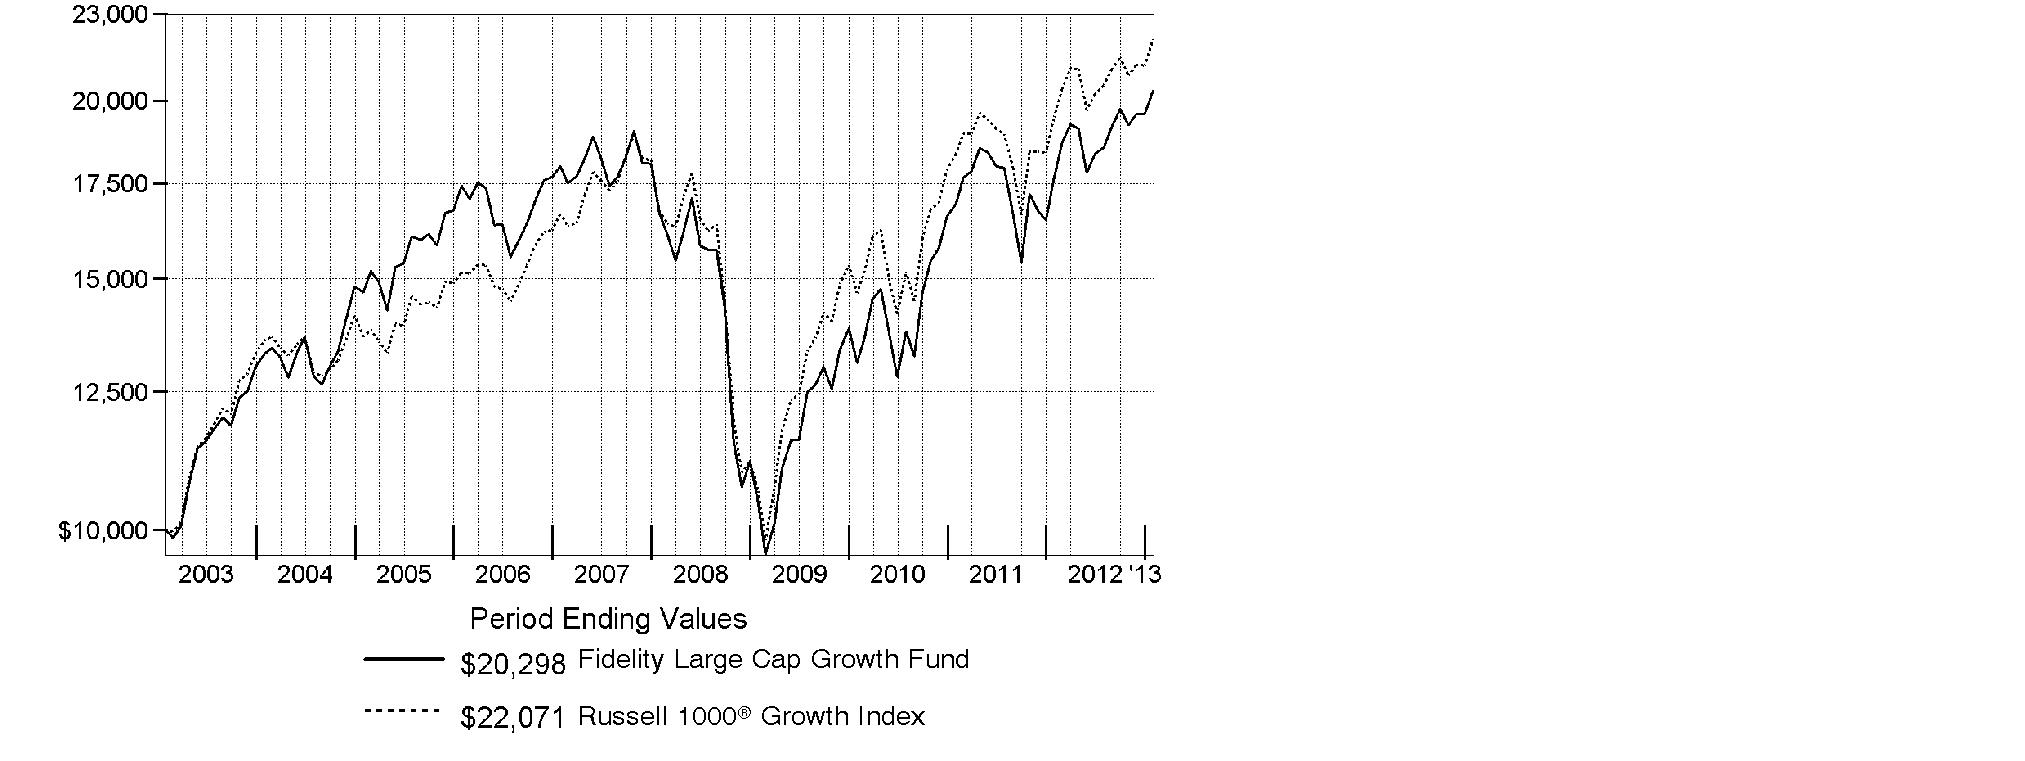
Annual Report
Market Recap: Improvement in the U.S. economy helped lift equity benchmarks to double-digit gains for the year ending January 31, 2013, overcoming moments of volatility driven by sovereign debt woes in Europe, slower economic growth in China and gridlock in Congress. Major U.S. benchmarks hit multiyear highs during the period, encouraged by a rebounding domestic housing market and solid corporate earnings reports. The broad-based S&P 500® Index rose 16.78% for the year, crossing the milestone 1,500 mark near period end. The technology-heavy Nasdaq Composite Index® added 13.13%, and the blue-chip-laden Dow Jones Industrial AverageSM gained 12.75%. Early in the period, stocks rose on positive U.S. economic news and proposed bailouts in Europe. Although fear resurfaced in April and May, equities rebounded in June on central bank stimulus and new life in the housing market. In September, pre-election jitters and the looming "fiscal cliff" of tax hikes and federal spending cuts fueled some profit-taking, followed by a brief post-election sell-off. But stocks proved resilient, as investors continued to pile into riskier assets. Gains were broad-based, with eight of the 10 sectors in the S&P 500® posting double-digit returns. Despite eurozone turmoil, foreign developed-markets stocks rose strongly, with the MSCI® EAFE® Index adding 17.41%.
Comments from Daniel Kelley, Portfolio Manager of Fidelity® Large Cap Growth Fund: For the year, the fund's Retail Class shares were up 15.00%, outperforming the 13.43% advance of the Russell 1000® Growth Index. Security selection helped relative performance the most, particularly in the consumer durables/apparel segment of consumer discretionary. There, companies benefiting from the U.S. housing recovery saw sharp share price gains. Top contributors included appliance manufacturer Whirlpool, which I bought in September. Within information technology, having essentially no exposure to semiconductor manufacturer and index component Intel gave a sizable boost, as slowing personal computer sales hurt revenues. An overweighting in hardware/equipment innovator Apple early on also helped. By contrast, stock picks in the technology hardware/equipment group and a small cash position detracted. Among individual disappointments was enterprise communication hardware/equipment company Polycom, whose stock fell due to a major restructuring of its sales department and concerns that it was losing market share. Elsewhere, the timing of my ownership of Green Mountain Coffee Roasters - maker of the Keurig® single-serve coffee system - hurt. Whirlpool was not in the index, and Green Mountain, Polycom and Intel were not in the portfolio at period end.
The views expressed above reflect those of the portfolio manager(s) only through the end of the period as stated on the cover of this report and do not necessarily represent the views of Fidelity or any other person in the Fidelity organization. Any such views are subject to change at any time based upon market or other conditions and Fidelity disclaims any responsibility to update such views. These views may not be relied on as investment advice and, because investment decisions for a Fidelity fund are based on numerous factors, may not be relied on as an indication of trading intent on behalf of any Fidelity fund.
Annual Report
Shareholder Expense Example
As a shareholder of the Fund, you incur two types of costs: (1) transaction costs, including sales charges (loads) on purchase payments or redemption proceeds, and (2) ongoing costs, including management fees, distribution and/or service (12b-1) fees and other Fund expenses. This Example is intended to help you understand your ongoing costs (in dollars) of investing in the Fund and to compare these costs with the ongoing costs of investing in other mutual funds.
The Example is based on an investment of $1,000 invested at the beginning of the period and held for the entire period (August 1, 2012 to January 31, 2013).
Actual Expenses
The first line of the accompanying table for each class of the Fund provides information about actual account values and actual expenses. You may use the information in this line, together with the amount you invested, to estimate the expenses that you paid over the period. Simply divide your account value by $1,000.00 (for example, an $8,600 account value divided by $1,000.00 = 8.6), then multiply the result by the number in the first line for a class of the Fund under the heading entitled "Expenses Paid During Period" to estimate the expenses you paid on your account during this period. A small balance maintenance fee of $12.00 that is charged once a year may apply for certain accounts with a value of less than $2,000. This fee is not included in the table below. If it was, the estimate of expenses you paid during the period would be higher, and your ending account value lower, by this amount. In addition, the Fund, as a shareholder in the underlying Fidelity Central Funds, will indirectly bear its pro-rata share of the fees and expenses incurred by the underlying Fidelity Central Funds. These fees and expenses are not included in the Fund's annualized expense ratio used to calculate the expense estimate in the table below.
Hypothetical Example for Comparison Purposes
The second line of the accompanying table for each class of the Fund provides information about hypothetical account values and hypothetical expenses based on a Class' actual expense ratio and an assumed rate of return of 5% per year before expenses, which is not the Class' actual return. The hypothetical account values and expenses may not be used to estimate the actual ending account balance or expenses you paid for the period. You may use this information to compare the ongoing costs of investing in the Fund and other funds. To do so, compare this 5% hypothetical example with the 5% hypothetical examples that appear in the shareholder reports of the other funds. A small balance maintenance fee of $12.00 that is charged once a year may apply for certain accounts with a value of less than $2,000. This fee is not included in the table below. If it was, the estimate of expenses you paid during the period would be higher, and your ending account value lower, by this amount. In addition, the Fund, as a shareholder in the underlying Fidelity Central Funds, will indirectly bear its pro-rata share of the fees and expenses incurred by the underlying Fidelity Central Funds. These fees and expenses are not included in the Fund's annualized expense ratio used to calculate the expense estimate in the table below.
Please note that the expenses shown in the table are meant to highlight your ongoing costs only and do not reflect any transaction costs. Therefore, the second line of the table is useful in comparing ongoing costs only, and will not help you determine the relative total costs of owning different funds. In addition, if these transactional costs were included, your costs would have been higher.
Annual Report
| Annualized
Expense Ratio | Beginning
Account Value
August 1, 2012 | Ending
Account Value
January 31, 2013 | Expenses Paid
During Period*
August 1, 2012
to January 31, 2013 |
Class A | 1.25% | | | |
Actual | | $ 1,000.00 | $ 1,092.90 | $ 6.58 |
Hypothetical A | | $ 1,000.00 | $ 1,018.85 | $ 6.34 |
Class T | 1.50% | | | |
Actual | | $ 1,000.00 | $ 1,092.40 | $ 7.89 |
Hypothetical A | | $ 1,000.00 | $ 1,017.60 | $ 7.61 |
Class B | 2.00% | | | |
Actual | | $ 1,000.00 | $ 1,089.20 | $ 10.50 |
Hypothetical A | | $ 1,000.00 | $ 1,015.08 | $ 10.13 |
Class C | 2.00% | | | |
Actual | | $ 1,000.00 | $ 1,089.70 | $ 10.51 |
Hypothetical A | | $ 1,000.00 | $ 1,015.08 | $ 10.13 |
Large Cap Growth | .94% | | | |
Actual | | $ 1,000.00 | $ 1,095.10 | $ 4.95 |
Hypothetical A | | $ 1,000.00 | $ 1,020.41 | $ 4.77 |
Institutional Class | .85% | | | |
Actual | | $ 1,000.00 | $ 1,095.10 | $ 4.48 |
Hypothetical A | | $ 1,000.00 | $ 1,020.86 | $ 4.32 |
A 5% return per year before expenses
* Expenses are equal to each Class' annualized expense ratio, multiplied by the average account value over the period, multiplied by 184/366 (to reflect the one-half year period).
Annual Report
Investment Changes (Unaudited)
Top Ten Stocks as of January 31, 2013 |
| % of fund's
net assets | % of fund's net assets
6 months ago |
Apple, Inc. | 5.7 | 9.1 |
Google, Inc. Class A | 3.4 | 2.9 |
Oracle Corp. | 2.5 | 2.2 |
Amazon.com, Inc. | 2.0 | 1.5 |
Gilead Sciences, Inc. | 1.9 | 1.2 |
Visa, Inc. Class A | 1.9 | 1.7 |
The Coca-Cola Co. | 1.9 | 1.8 |
Home Depot, Inc. | 1.9 | 1.7 |
QUALCOMM, Inc. | 1.8 | 1.8 |
Amgen, Inc. | 1.7 | 1.5 |
| 24.7 | |
Top Five Market Sectors as of January 31, 2013 |
| % of fund's
net assets | % of fund's net assets
6 months ago |
Information Technology | 29.9 | 32.1 |
Consumer Discretionary | 17.0 | 15.4 |
Health Care | 13.1 | 12.1 |
Industrials | 11.4 | 9.9 |
Consumer Staples | 10.6 | 11.8 |
Asset Allocation (% of fund's net assets) |
As of January 31, 2013* | As of July 31, 2012** |
 | Stocks 98.1% | | | Stocks 96.2% | |
 | Short-Term
Investments and
Net Other Assets (Liabilities) 1.9% | | | Short-Term
Investments and
Net Other Assets (Liabilities) 3.8% | |
* Foreign investments | 10.8% | | ** Foreign investments | 8.3% | |

Annual Report
Investments January 31, 2013
Showing Percentage of Net Assets
Common Stocks - 98.1% |
| Shares | | Value |
CONSUMER DISCRETIONARY - 17.0% |
Automobiles - 0.6% |
Ford Motor Co. | 12,750 | | $ 165,113 |
Harley-Davidson, Inc. | 15,300 | | 802,026 |
Tesla Motors, Inc. (a) | 2,500 | | 93,775 |
| | 1,060,914 |
Diversified Consumer Services - 0.2% |
Weight Watchers International, Inc. (d) | 7,100 | | 379,637 |
Hotels, Restaurants & Leisure - 2.0% |
Las Vegas Sands Corp. | 14,957 | | 826,374 |
McDonald's Corp. | 11,578 | | 1,103,268 |
Starbucks Corp. | 28,174 | | 1,581,125 |
| | 3,510,767 |
Household Durables - 1.9% |
D.R. Horton, Inc. | 30,200 | | 714,532 |
Toll Brothers, Inc. (a) | 35,809 | | 1,341,047 |
Whirlpool Corp. | 10,700 | | 1,234,566 |
| | 3,290,145 |
Internet & Catalog Retail - 2.8% |
Amazon.com, Inc. (a) | 12,847 | | 3,410,879 |
priceline.com, Inc. (a) | 2,160 | | 1,480,615 |
| | 4,891,494 |
Media - 2.0% |
Comcast Corp. Class A | 69,675 | | 2,653,224 |
Discovery Communications, Inc. (a) | 11,382 | | 789,683 |
| | 3,442,907 |
Specialty Retail - 4.6% |
American Eagle Outfitters, Inc. | 44,858 | | 906,580 |
Dick's Sporting Goods, Inc. | 19,000 | | 904,210 |
DSW, Inc. Class A | 6,693 | | 447,962 |
Home Depot, Inc. | 47,493 | | 3,178,232 |
Lowe's Companies, Inc. | 24,094 | | 920,150 |
Ross Stores, Inc. | 18,606 | | 1,110,778 |
Tractor Supply Co. | 3,589 | | 372,072 |
| | 7,839,984 |
Textiles, Apparel & Luxury Goods - 2.9% |
lululemon athletica, Inc. (a) | 13,661 | | 942,609 |
Michael Kors Holdings Ltd. (a) | 19,030 | | 1,068,154 |
Common Stocks - continued |
| Shares | | Value |
CONSUMER DISCRETIONARY - continued |
Textiles, Apparel & Luxury Goods - continued |
NIKE, Inc. Class B | 33,100 | | $ 1,789,055 |
PVH Corp. | 10,100 | | 1,200,587 |
| | 5,000,405 |
TOTAL CONSUMER DISCRETIONARY | | 29,416,253 |
CONSUMER STAPLES - 10.6% |
Beverages - 4.5% |
Beam, Inc. | 11,137 | | 683,144 |
Constellation Brands, Inc. Class A (sub. vtg.) (a) | 14,113 | | 456,697 |
Dr. Pepper Snapple Group, Inc. | 20,190 | | 909,963 |
Fomento Economico Mexicano S.A.B. de CV sponsored ADR | 7,200 | | 776,808 |
PepsiCo, Inc. | 16,673 | | 1,214,628 |
Remy Cointreau SA | 4,295 | | 548,126 |
The Coca-Cola Co. | 86,186 | | 3,209,567 |
| | 7,798,933 |
Food & Staples Retailing - 2.2% |
CVS Caremark Corp. | 39,444 | | 2,019,533 |
Wal-Mart Stores, Inc. | 25,256 | | 1,766,657 |
| | 3,786,190 |
Food Products - 0.6% |
Danone SA | 14,700 | | 1,018,741 |
Household Products - 1.1% |
Kimberly-Clark Corp. | 4,181 | | 374,241 |
Procter & Gamble Co. | 20,200 | | 1,518,232 |
| | 1,892,473 |
Tobacco - 2.2% |
Altria Group, Inc. | 50,664 | | 1,706,364 |
British American Tobacco PLC (United Kingdom) | 16,900 | | 878,320 |
Lorillard, Inc. | 30,099 | | 1,175,968 |
| | 3,760,652 |
TOTAL CONSUMER STAPLES | | 18,256,989 |
ENERGY - 5.0% |
Energy Equipment & Services - 2.7% |
Cameron International Corp. (a) | 12,070 | | 764,152 |
Ensco PLC Class A | 17,984 | | 1,143,243 |
Halliburton Co. | 19,100 | | 776,988 |
Common Stocks - continued |
| Shares | | Value |
ENERGY - continued |
Energy Equipment & Services - continued |
National Oilwell Varco, Inc. | 8,614 | | $ 638,642 |
Schlumberger Ltd. | 16,375 | | 1,278,069 |
| | 4,601,094 |
Oil, Gas & Consumable Fuels - 2.3% |
Canadian Natural Resources Ltd. | 14,800 | | 446,938 |
Noble Energy, Inc. | 6,048 | | 651,914 |
Pioneer Natural Resources Co. | 6,300 | | 740,502 |
Suncor Energy, Inc. | 21,300 | | 723,952 |
The Williams Companies, Inc. | 40,350 | | 1,414,268 |
| | 3,977,574 |
TOTAL ENERGY | | 8,578,668 |
FINANCIALS - 5.2% |
Capital Markets - 1.1% |
Charles Schwab Corp. | 53,642 | | 886,702 |
The Blackstone Group LP | 55,678 | | 1,030,043 |
| | 1,916,745 |
Commercial Banks - 0.6% |
M&T Bank Corp. | 2,573 | | 264,221 |
Wells Fargo & Co. | 23,551 | | 820,281 |
| | 1,084,502 |
Consumer Finance - 0.7% |
SLM Corp. | 72,031 | | 1,216,604 |
Diversified Financial Services - 1.0% |
BTG Pactual Participations Ltd. unit | 34,500 | | 593,379 |
Citigroup, Inc. | 26,736 | | 1,127,190 |
| | 1,720,569 |
Real Estate Investment Trusts - 1.2% |
American Tower Corp. | 21,200 | | 1,614,380 |
AvalonBay Communities, Inc. | 2,600 | | 337,454 |
| | 1,951,834 |
Real Estate Management & Development - 0.6% |
CBRE Group, Inc. (a) | 21,389 | | 461,575 |
Realogy Holdings Corp. | 13,930 | | 623,646 |
| | 1,085,221 |
TOTAL FINANCIALS | | 8,975,475 |
Common Stocks - continued |
| Shares | | Value |
HEALTH CARE - 13.1% |
Biotechnology - 5.6% |
Achillion Pharmaceuticals, Inc. (a) | 21,600 | | $ 193,968 |
ADVENTRX Pharmaceuticals, Inc. warrants 11/16/16 (a) | 39,587 | | 3,001 |
Alkermes PLC (a) | 6,900 | | 159,045 |
Amgen, Inc. | 33,800 | | 2,888,548 |
ARIAD Pharmaceuticals, Inc. (a) | 12,680 | | 252,078 |
Biogen Idec, Inc. (a) | 4,700 | | 733,576 |
BioMarin Pharmaceutical, Inc. (a) | 10,700 | | 587,323 |
Elan Corp. PLC sponsored ADR (a) | 44,802 | | 470,869 |
Gilead Sciences, Inc. (a) | 82,574 | | 3,257,544 |
Regeneron Pharmaceuticals, Inc. (a) | 3,350 | | 582,699 |
Theravance, Inc. (a) | 23,066 | | 513,219 |
| | 9,641,870 |
Health Care Equipment & Supplies - 1.6% |
Align Technology, Inc. (a) | 28,107 | | 881,436 |
Boston Scientific Corp. (a) | 47,505 | | 354,862 |
The Cooper Companies, Inc. | 15,150 | | 1,535,453 |
| | 2,771,751 |
Health Care Providers & Services - 2.4% |
Brookdale Senior Living, Inc. (a) | 42,660 | | 1,152,247 |
Catamaran Corp. (a) | 14,130 | | 733,206 |
Express Scripts Holding Co. (a) | 11,476 | | 613,048 |
Laboratory Corp. of America Holdings (a) | 10,221 | | 914,780 |
Qualicorp SA (a) | 35,300 | | 365,169 |
Team Health Holdings, Inc. (a) | 12,780 | | 432,859 |
| | 4,211,309 |
Pharmaceuticals - 3.5% |
AbbVie, Inc. | 43,550 | | 1,597,850 |
Actavis, Inc. (a) | 11,967 | | 1,033,829 |
Johnson & Johnson | 18,712 | | 1,383,191 |
Merck & Co., Inc. | 12,952 | | 560,174 |
Valeant Pharmaceuticals International, Inc. (Canada) (a) | 11,800 | | 782,486 |
Warner Chilcott PLC | 45,800 | | 648,986 |
Zoetis, Inc. Class A | 1,500 | | 39,000 |
| | 6,045,516 |
TOTAL HEALTH CARE | | 22,670,446 |
Common Stocks - continued |
| Shares | | Value |
INDUSTRIALS - 11.4% |
Aerospace & Defense - 2.2% |
Textron, Inc. | 34,650 | | $ 996,534 |
United Technologies Corp. | 32,686 | | 2,862,313 |
| | 3,858,847 |
Air Freight & Logistics - 1.3% |
United Parcel Service, Inc. Class B | 28,300 | | 2,243,907 |
Construction & Engineering - 0.7% |
Dycom Industries, Inc. (a) | 16,214 | | 340,170 |
Quanta Services, Inc. (a) | 28,660 | | 830,280 |
| | 1,170,450 |
Electrical Equipment - 1.2% |
Eaton Corp. PLC | 22,700 | | 1,292,765 |
Regal-Beloit Corp. | 10,500 | | 778,680 |
| | 2,071,445 |
Industrial Conglomerates - 0.5% |
Carlisle Companies, Inc. | 12,558 | | 805,596 |
Machinery - 3.2% |
Caterpillar, Inc. | 19,564 | | 1,924,902 |
Cummins, Inc. | 13,700 | | 1,573,171 |
Ingersoll-Rand PLC | 19,550 | | 1,004,675 |
Manitowoc Co., Inc. | 55,786 | | 981,834 |
| | 5,484,582 |
Professional Services - 0.5% |
Nielsen Holdings B.V. (a) | 16,634 | | 540,771 |
Towers Watson & Co. | 6,569 | | 401,235 |
| | 942,006 |
Road & Rail - 1.0% |
Union Pacific Corp. | 13,100 | | 1,722,126 |
Trading Companies & Distributors - 0.8% |
Watsco, Inc. | 6,965 | | 524,813 |
WESCO International, Inc. (a) | 11,545 | | 841,977 |
| | 1,366,790 |
TOTAL INDUSTRIALS | | 19,665,749 |
INFORMATION TECHNOLOGY - 29.9% |
Communications Equipment - 3.0% |
Juniper Networks, Inc. (a) | 28,352 | | 634,518 |
Common Stocks - continued |
| Shares | | Value |
INFORMATION TECHNOLOGY - continued |
Communications Equipment - continued |
Motorola Solutions, Inc. | 25,489 | | $ 1,488,303 |
QUALCOMM, Inc. | 46,200 | | 3,050,586 |
| | 5,173,407 |
Computers & Peripherals - 6.1% |
Apple, Inc. | 21,589 | | 9,829,682 |
EMC Corp. (a) | 31,400 | | 772,754 |
| | 10,602,436 |
Internet Software & Services - 5.0% |
eBay, Inc. (a) | 27,250 | | 1,524,093 |
Facebook, Inc. Class A | 42,631 | | 1,320,282 |
Google, Inc. Class A (a) | 7,744 | | 5,852,063 |
| | 8,696,438 |
IT Services - 5.9% |
Accenture PLC Class A | 24,910 | | 1,790,780 |
Cognizant Technology Solutions Corp. Class A (a) | 11,952 | | 934,407 |
IBM Corp. | 10,654 | | 2,163,508 |
MasterCard, Inc. Class A | 4,033 | | 2,090,707 |
Visa, Inc. Class A | 20,400 | | 3,221,364 |
| | 10,200,766 |
Semiconductors & Semiconductor Equipment - 2.7% |
Altera Corp. | 31,396 | | 1,049,254 |
ASML Holding NV (Netherlands) | 5,726 | | 429,537 |
Broadcom Corp. Class A | 38,510 | | 1,249,650 |
Samsung Electronics Co. Ltd. | 743 | | 988,836 |
Skyworks Solutions, Inc. (a) | 36,080 | | 863,755 |
| | 4,581,032 |
Software - 7.2% |
Check Point Software Technologies Ltd. (a) | 17,291 | | 864,550 |
Citrix Systems, Inc. (a) | 5,300 | | 387,748 |
Fortinet, Inc. (a) | 22,300 | | 526,057 |
Guidewire Software, Inc. | 29,104 | | 963,924 |
MICROS Systems, Inc. (a) | 8,100 | | 372,843 |
Microsoft Corp. | 71,884 | | 1,974,653 |
Nuance Communications, Inc. (a) | 24,401 | | 586,844 |
Oracle Corp. | 123,017 | | 4,368,334 |
salesforce.com, Inc. (a) | 11,950 | | 2,056,954 |
Common Stocks - continued |
| Shares | | Value |
INFORMATION TECHNOLOGY - continued |
Software - continued |
Splunk, Inc. | 4,700 | | $ 154,912 |
Workday, Inc. | 2,000 | | 106,840 |
| | 12,363,659 |
TOTAL INFORMATION TECHNOLOGY | | 51,617,738 |
MATERIALS - 5.6% |
Chemicals - 4.0% |
Albemarle Corp. | 13,600 | | 833,816 |
Ashland, Inc. | 11,628 | | 912,914 |
Axiall Corp. | 15,600 | | 876,408 |
Eastman Chemical Co. | 18,094 | | 1,287,388 |
LyondellBasell Industries NV Class A | 11,051 | | 700,854 |
Monsanto Co. | 23,223 | | 2,353,651 |
| | 6,965,031 |
Construction Materials - 1.1% |
Martin Marietta Materials, Inc. | 5,712 | | 563,946 |
Vulcan Materials Co. | 24,254 | | 1,371,806 |
| | 1,935,752 |
Metals & Mining - 0.5% |
Commercial Metals Co. | 48,547 | | 808,308 |
TOTAL MATERIALS | | 9,709,091 |
TELECOMMUNICATION SERVICES - 0.3% |
Wireless Telecommunication Services - 0.3% |
Vodafone Group PLC sponsored ADR | 22,500 | | 614,700 |
TOTAL COMMON STOCKS (Cost $150,354,503) |
169,505,109
|
Money Market Funds - 1.9% |
| Shares | | Value |
Fidelity Cash Central Fund, 0.16% (b) | 2,848,348 | | $ 2,848,348 |
Fidelity Securities Lending Cash Central Fund, 0.15% (b)(c) | 442,000 | | 442,000 |
TOTAL MONEY MARKET FUNDS (Cost $3,290,348) |
3,290,348
|
TOTAL INVESTMENT PORTFOLIO - 100.0% (Cost $153,644,851) | | 172,795,457 |
NET OTHER ASSETS (LIABILITIES) - 0.0% | | 55,305 |
NET ASSETS - 100% | $ 172,850,762 |
Legend |
(a) Non-income producing |
(b) Affiliated fund that is available only to investment companies and other accounts managed by Fidelity Investments. The rate quoted is the annualized seven-day yield of the fund at period end. A complete unaudited listing of the fund's holdings as of its most recent quarter end is available upon request. In addition, each Fidelity Central Fund's financial statements, which are not covered by the Fund's Report of Independent Registered Public Accounting Firm, are available on the SEC's website or upon request. |
(c) Investment made with cash collateral received from securities on loan. |
(d) Security or a portion of the security is on loan at period end. |
Affiliated Central Funds |
Information regarding fiscal year to date income earned by the Fund from investments in Fidelity Central Funds is as follows: |
Fund | Income earned |
Fidelity Cash Central Fund | $ 7,926 |
Fidelity Securities Lending Cash Central Fund | 25,843 |
Total | $ 33,769 |
Other Information |
The following is a summary of the inputs used, as of January 31, 2013, involving the Fund's assets and liabilities carried at fair value. The inputs or methodology used for valuing securities may not be an indication of the risk associated with investing in those securities. For more information on valuation inputs, and their aggregation into the levels used in the table below, please refer to the Investment Valuation section in the accompanying Notes to Financial Statements. |
Valuation Inputs at Reporting Date: |
Description | Total | Level 1 | Level 2 | Level 3 |
Investments in Securities: | | | | |
Equities: | | | | |
Consumer Discretionary | $ 29,416,253 | $ 29,416,253 | $ - | $ - |
Consumer Staples | 18,256,989 | 17,378,669 | 878,320 | - |
Energy | 8,578,668 | 8,578,668 | - | - |
Financials | 8,975,475 | 8,975,475 | - | - |
Health Care | 22,670,446 | 22,667,445 | 3,001 | - |
Industrials | 19,665,749 | 19,665,749 | - | - |
Information Technology | 51,617,738 | 51,188,201 | 429,537 | - |
Materials | 9,709,091 | 9,709,091 | - | - |
Telecommunication Services | 614,700 | 614,700 | - | - |
Money Market Funds | 3,290,348 | 3,290,348 | - | - |
Total Investments in Securities: | $ 172,795,457 | $ 171,484,599 | $ 1,310,858 | $ - |
Distribution of investments by country or territory of incorporation, as a percentage of total net assets, is as follows. (Unaudited) |
United States of America | 89.2% |
Ireland | 3.1% |
Canada | 1.6% |
United Kingdom | 1.5% |
Netherlands | 1.0% |
Others (Individually Less Than 1%) | 3.6% |
| 100.0% |
See accompanying notes which are an integral part of the financial statements.
Annual Report
Statement of Assets and Liabilities
| January 31, 2013 |
| | |
Assets | | |
Investment in securities, at value (including securities loaned of $427,760) - See accompanying schedule: Unaffiliated issuers (cost $150,354,503) | $ 169,505,109 | |
Fidelity Central Funds (cost $3,290,348) | 3,290,348 | |
Total Investments (cost $153,644,851) | | $ 172,795,457 |
Cash | | 58,812 |
Foreign currency held at value (cost $74,169) | | 74,169 |
Receivable for investments sold | | 6,274,616 |
Receivable for fund shares sold | | 158,211 |
Dividends receivable | | 57,007 |
Distributions receivable from Fidelity Central Funds | | 1,111 |
Prepaid expenses | | 403 |
Receivable from investment adviser for expense reductions | | 302 |
Other receivables | | 13,372 |
Total assets | | 179,433,460 |
| | |
Liabilities | | |
Payable for investments purchased | $ 5,860,703 | |
Payable for fund shares redeemed | 83,715 | |
Accrued management fee | 90,475 | |
Distribution and service plan fees payable | 13,151 | |
Other affiliated payables | 39,742 | |
Other payables and accrued expenses | 52,912 | |
Collateral on securities loaned, at value | 442,000 | |
Total liabilities | | 6,582,698 |
| | |
Net Assets | | $ 172,850,762 |
Net Assets consist of: | | |
Paid in capital | | $ 156,741,640 |
Accumulated net investment loss | | (43,376) |
Accumulated undistributed net realized gain (loss) on investments and foreign currency transactions | | (2,997,738) |
Net unrealized appreciation (depreciation) on investments and assets and liabilities in foreign currencies | | 19,150,236 |
Net Assets | | $ 172,850,762 |
See accompanying notes which are an integral part of the financial statements.
Annual Report
Financial Statements - continued
Statement of Assets and Liabilities - continued
| January 31, 2013 |
| | |
Calculation of Maximum Offering Price Class A:
Net Asset Value and redemption price per share ($13,900,199 ÷ 1,189,639 shares) | | $ 11.68 |
| | |
Maximum offering price per share (100/94.25 of $11.68) | | $ 12.39 |
Class T:
Net Asset Value and redemption price per share ($6,084,489 ÷ 525,586 shares) | | $ 11.58 |
| | |
Maximum offering price per share (100/96.50 of $11.58) | | $ 12.00 |
Class B:
Net Asset Value and offering price per share ($1,450,525 ÷ 127,633 shares)A | | $ 11.36 |
| | |
Class C:
Net Asset Value and offering price per share ($7,876,758 ÷ 697,322 shares)A | | $ 11.30 |
| | |
Large Cap Growth:
Net Asset Value, offering price and redemption price per share ($139,813,310 ÷ 11,821,014 shares) | | $ 11.83 |
| | |
Institutional Class:
Net Asset Value, offering price and redemption price per share ($3,725,481 ÷ 313,739 shares) | | $ 11.87 |
A Redemption price per share is equal to net asset value less any applicable contingent deferred sales charge.
See accompanying notes which are an integral part of the financial statements.
Annual Report
Statement of Operations
| Year ended January 31, 2013 |
| | |
Investment Income | | |
Dividends | | $ 2,555,088 |
Income from Fidelity Central Funds | | 33,769 |
Total income | | 2,588,857 |
| | |
Expenses | | |
Management fee
Basic fee | $ 939,896 | |
Performance adjustment | (46,376) | |
Transfer agent fees | 414,753 | |
Distribution and service plan fees | 151,448 | |
Accounting and security lending fees | 65,943 | |
Custodian fees and expenses | 41,809 | |
Independent trustees' compensation | 1,099 | |
Registration fees | 83,200 | |
Audit | 54,817 | |
Legal | 703 | |
Miscellaneous | 1,460 | |
Total expenses before reductions | 1,708,752 | |
Expense reductions | (28,326) | 1,680,426 |
Net investment income (loss) | | 908,431 |
Realized and Unrealized Gain (Loss) Net realized gain (loss) on: | | |
Investment securities: | | |
Unaffiliated issuers | 14,981,914 | |
Foreign currency transactions | (3,117) | |
Total net realized gain (loss) | | 14,978,797 |
Change in net unrealized appreciation (depreciation) on: Investment securities | 7,198,392 | |
Assets and liabilities in foreign currencies | (96) | |
Total change in net unrealized appreciation (depreciation) | | 7,198,296 |
Net gain (loss) | | 22,177,093 |
Net increase (decrease) in net assets resulting from operations | | $ 23,085,524 |
See accompanying notes which are an integral part of the financial statements.
Annual Report
Financial Statements - continued
Statement of Changes in Net Assets
| Year ended
January 31,
2013 | Year ended
January 31,
2012 |
Increase (Decrease) in Net Assets | | |
Operations | | |
Net investment income (loss) | $ 908,431 | $ (81,197) |
Net realized gain (loss) | 14,978,797 | 18,062,027 |
Change in net unrealized appreciation (depreciation) | 7,198,296 | (12,510,318) |
Net increase (decrease) in net assets resulting
from operations | 23,085,524 | 5,470,512 |
Distributions to shareholders from net investment income | (1,066,324) | - |
Share transactions - net increase (decrease) | (8,699,386) | 17,565,380 |
Total increase (decrease) in net assets | 13,319,814 | 23,035,892 |
| | |
Net Assets | | |
Beginning of period | 159,530,948 | 136,495,056 |
End of period (including accumulated net investment loss of $43,376 and accumulated net investment loss of $77,636, respectively) | $ 172,850,762 | $ 159,530,948 |
See accompanying notes which are an integral part of the financial statements.
Annual Report
Financial Highlights - Class A
Years ended January 31, | 2013 | 2012 | 2011 | 2010 | 2009 |
Selected Per-Share Data | | | | | |
Net asset value, beginning of period | $ 10.24 | $ 9.84 | $ 7.64 | $ 6.12 | $ 9.85 |
Income from Investment Operations | | | | | |
Net investment income (loss) C | .04 | (.03) | (.02) | .01 | .02 |
Net realized and unrealized gain (loss) | 1.45 | .43 | 2.22 | 1.53 | (3.71) |
Total from investment operations | 1.49 | .40 | 2.20 | 1.54 | (3.69) |
Distributions from net investment income | (.05) | - | - | (.02) | (.04) |
Net asset value, end of period | $ 11.68 | $ 10.24 | $ 9.84 | $ 7.64 | $ 6.12 |
Total Return A,B | 14.52% | 4.07% | 28.80% | 25.14% | (37.49)% |
Ratios to Average Net Assets D,F | | | | | |
Expenses before reductions | 1.23% | 1.17% | 1.12% | 1.07% | 1.01% |
Expenses net of fee waivers, if any | 1.23% | 1.17% | 1.12% | 1.07% | 1.01% |
Expenses net of all reductions | 1.21% | 1.16% | 1.12% | 1.06% | 1.01% |
Net investment income (loss) | .32% | (.26)% | (.28)% | .08% | .20% |
Supplemental Data | | | | | |
Net assets, end of period (000 omitted) | $ 13,900 | $ 12,727 | $ 6,669 | $ 3,805 | $ 2,159 |
Portfolio turnover rate E | 151% | 108% | 126% | 342% | 355% |
A Total returns would have been lower if certain expenses had not been reduced during the applicable periods shown.
B Total returns do not include the effect of the sales charges.
C Calculated based on average shares outstanding during the period.
D Fees and expenses of any underlying Fidelity Central Funds are not included in the Fund's expense ratio. The Fund indirectly bears its proportionate share of the expenses of any underlying Fidelity Central Funds.
E Amount does not include the portfolio activity of any underlying Fidelity Central Funds.
F Expense ratios reflect operating expenses of the class. Expenses before reductions do not reflect amounts reimbursed by the investment adviser or reductions from brokerage service arrangements or reductions from other expense offset arrangements and do not represent the amount paid by the class during periods when reimbursements or reductions occur. Expenses net of fee waivers reflect expenses after reimbursement by the investment adviser but prior to reductions from brokerage service arrangements or other expense offset arrangements. Expenses net of all reductions represent the net expenses paid by the class.
See accompanying notes which are an integral part of the financial statements.
Annual Report
Financial Highlights - Class T
Years ended January 31, | 2013 | 2012 | 2011 | 2010 | 2009 |
Selected Per-Share Data | | | | | |
Net asset value, beginning of period | $ 10.15 | $ 9.78 | $ 7.61 | $ 6.11 | $ 9.85 |
Income from Investment Operations | | | | | |
Net investment income (loss) C | .01 | (.05) | (.05) | (.02) | (.01) |
Net realized and unrealized gain (loss) | 1.44 | .42 | 2.22 | 1.52 | (3.70) |
Total from investment operations | 1.45 | .37 | 2.17 | 1.50 | (3.71) |
Distributions from net investment income | (.02) | - | - | - G | (.03) |
Net asset value, end of period | $ 11.58 | $ 10.15 | $ 9.78 | $ 7.61 | $ 6.11 |
Total Return A,B | 14.30% | 3.78% | 28.52% | 24.60% | (37.71)% |
Ratios to Average Net Assets D,F | | | | | |
Expenses before reductions | 1.52% | 1.44% | 1.42% | 1.38% | 1.31% |
Expenses net of fee waivers, if any | 1.50% | 1.44% | 1.42% | 1.38% | 1.31% |
Expenses net of all reductions | 1.48% | 1.44% | 1.42% | 1.36% | 1.31% |
Net investment income (loss) | .05% | (.53)% | (.58)% | (.23)% | (.10)% |
Supplemental Data | | | | | |
Net assets, end of period (000 omitted) | $ 6,084 | $ 5,876 | $ 2,900 | $ 1,548 | $ 820 |
Portfolio turnover rate E | 151% | 108% | 126% | 342% | 355% |
A Total returns would have been lower if certain expenses had not been reduced during the applicable periods shown.
B Total returns do not include the effect of the sales charges.
C Calculated based on average shares outstanding during the period.
D Fees and expenses of any underlying Fidelity Central Funds are not included in the Fund's expense ratio. The Fund indirectly bears its proportionate share of the expenses of any underlying Fidelity Central Funds.
E Amount does not include the portfolio activity of any underlying Fidelity Central Funds.
F Expense ratios reflect operating expenses of the class. Expenses before reductions do not reflect amounts reimbursed by the investment adviser or reductions from brokerage service arrangements or reductions from other expense offset arrangements and do not represent the amount paid by the class during periods when reimbursements or reductions occur. Expenses net of fee waivers reflect expenses after reimbursement by the investment adviser but prior to reductions from brokerage service arrangements or other expense offset arrangements. Expenses net of all reductions represent the net expenses paid by the class.
G Amount represents less than $.01 per share.
See accompanying notes which are an integral part of the financial statements.
Annual Report
Financial Highlights - Class B
Years ended January 31, | 2013 | 2012 | 2011 | 2010 | 2009 |
Selected Per-Share Data | | | | | |
Net asset value, beginning of period | $ 9.99 | $ 9.68 | $ 7.57 | $ 6.09 | $ 9.83 |
Income from Investment Operations | | | | | |
Net investment income (loss) C | (.05) | (.10) | (.09) | (.05) | (.05) |
Net realized and unrealized gain (loss) | 1.42 | .41 | 2.20 | 1.53 | (3.69) |
Total from investment operations | 1.37 | .31 | 2.11 | 1.48 | (3.74) |
Distributions from net investment income | - | - | - | - | - G |
Net asset value, end of period | $ 11.36 | $ 9.99 | $ 9.68 | $ 7.57 | $ 6.09 |
Total Return A,B | 13.71% | 3.20% | 27.87% | 24.30% | (38.01)% |
Ratios to Average Net Assets D,F | | | | | |
Expenses before reductions | 1.98% | 1.92% | 1.87% | 1.82% | 1.76% |
Expenses net of fee waivers, if any | 1.98% | 1.92% | 1.87% | 1.82% | 1.76% |
Expenses net of all reductions | 1.96% | 1.92% | 1.87% | 1.80% | 1.76% |
Net investment income (loss) | (.43)% | (1.01)% | (1.03)% | (.67)% | (.56)% |
Supplemental Data | | | | | |
Net assets, end of period (000 omitted) | $ 1,451 | $ 1,610 | $ 2,143 | $ 1,466 | $ 815 |
Portfolio turnover rate E | 151% | 108% | 126% | 342% | 355% |
A Total returns would have been lower if certain expenses had not been reduced during the applicable periods shown.
B Total returns do not include the effect of the contingent deferred sales charge.
C Calculated based on average shares outstanding during the period.
D Fees and expenses of any underlying Fidelity Central Funds are not included in the Fund's expense ratio. The Fund indirectly bears its proportionate share of the expenses of any underlying Fidelity Central Funds.
E Amount does not include the portfolio activity of any underlying Fidelity Central Funds.
F Expense ratios reflect operating expenses of the class. Expenses before reductions do not reflect amounts reimbursed by the investment adviser or reductions from brokerage service arrangements or reductions from other expense offset arrangements and do not represent the amount paid by the class during periods when reimbursements or reductions occur. Expenses net of fee waivers reflect expenses after reimbursement by the investment adviser but prior to reductions from brokerage service arrangements or other expense offset arrangements. Expenses net of all reductions represent the net expenses paid by the class.
G Amount represents less than $.01 per share.
See accompanying notes which are an integral part of the financial statements.
Annual Report
Financial Highlights - Class C
Years ended January 31, | 2013 | 2012 | 2011 | 2010 | 2009 |
Selected Per-Share Data | | | | | |
Net asset value, beginning of period | $ 9.93 | $ 9.62 | $ 7.52 | $ 6.06 | $ 9.82 |
Income from Investment Operations | | | | | |
Net investment income (loss) C | (.05) | (.10) | (.09) | (.05) | (.04) |
Net realized and unrealized gain (loss) | 1.42 | .41 | 2.19 | 1.51 | (3.69) |
Total from investment operations | 1.37 | .31 | 2.10 | 1.46 | (3.73) |
Distributions from net investment income | - | - | - | - | (.03) |
Net asset value, end of period | $ 11.30 | $ 9.93 | $ 9.62 | $ 7.52 | $ 6.06 |
Total Return A,B | 13.80% | 3.22% | 27.93% | 24.09% | (37.98)% |
Ratios to Average Net Assets D,F | | | | | |
Expenses before reductions | 1.98% | 1.92% | 1.87% | 1.82% | 1.77% |
Expenses net of fee waivers, if any | 1.98% | 1.92% | 1.87% | 1.82% | 1.77% |
Expenses net of all reductions | 1.96% | 1.91% | 1.87% | 1.80% | 1.77% |
Net investment income (loss) | (.43)% | (1.00)% | (1.03)% | (.67)% | (.57)% |
Supplemental Data | | | | | |
Net assets, end of period (000 omitted) | $ 7,877 | $ 6,061 | $ 3,623 | $ 1,917 | $ 1,441 |
Portfolio turnover rate E | 151% | 108% | 126% | 342% | 355% |
A Total returns would have been lower if certain expenses had not been reduced during the applicable periods shown.
B Total returns do not include the effect of the contingent deferred sales charge.
C Calculated based on average shares outstanding during the period.
D Fees and expenses of any underlying Fidelity Central Funds are not included in the Fund's expense ratio. The Fund indirectly bears its proportionate share of the expenses of any underlying Fidelity Central Funds.
E Amount does not include the portfolio activity of any underlying Fidelity Central Funds.
F Expense ratios reflect operating expenses of the class. Expenses before reductions do not reflect amounts reimbursed by the investment adviser or reductions from brokerage service arrangements or reductions from other expense offset arrangements and do not represent the amount paid by the class during periods when reimbursements or reductions occur. Expenses net of fee waivers reflect expenses after reimbursement by the investment adviser but prior to reductions from brokerage service arrangements or other expense offset arrangements. Expenses net of all reductions represent the net expenses paid by the class.
See accompanying notes which are an integral part of the financial statements.
Annual Report
Financial Highlights - Large Cap Growth
Years ended January 31, | 2013 | 2012 | 2011 | 2010 | 2009 |
Selected Per-Share Data | | | | | |
Net asset value, beginning of period | $ 10.36 | $ 9.93 | $ 7.69 | $ 6.15 | $ 9.89 |
Income from Investment Operations | | | | | |
Net investment income (loss) B | .07 | - F | - F | .02 | .04 |
Net realized and unrealized gain (loss) | 1.48 | .43 | 2.24 | 1.55 | (3.73) |
Total from investment operations | 1.55 | .43 | 2.24 | 1.57 | (3.69) |
Distributions from net investment income | (.08) | - | - | (.03) | (.05) |
Net asset value, end of period | $ 11.83 | $ 10.36 | $ 9.93 | $ 7.69 | $ 6.15 |
Total Return A | 15.00% | 4.33% | 29.13% | 25.50% | (37.36)% |
Ratios to Average Net Assets C,E | | | | | |
Expenses before reductions | .91% | .88% | .87% | .81% | .75% |
Expenses net of fee waivers, if any | .91% | .88% | .87% | .81% | .74% |
Expenses net of all reductions | .90% | .87% | .86% | .80% | .74% |
Net investment income (loss) | .64% | .04% | (.02)% | .34% | .47% |
Supplemental Data | | | | | |
Net assets, end of period (000 omitted) | $ 139,813 | $ 132,123 | $ 120,671 | $ 96,661 | $ 85,332 |
Portfolio turnover rate D | 151% | 108% | 126% | 342% | 355% |
A Total returns would have been lower if certain expenses had not been reduced during the applicable periods shown.
B Calculated based on average shares outstanding during the period.
C Fees and expenses of any underlying Fidelity Central Funds are not included in the Fund's expense ratio. The Fund indirectly bears its proportionate share of the expenses of any underlying Fidelity Central Funds.
D Amount does not include the portfolio activity of any underlying Fidelity Central Funds.
E Expense ratios reflect operating expenses of the class. Expenses before reductions do not reflect amounts reimbursed by the investment adviser or reductions from brokerage service arrangements or reductions from other expense offset arrangements and do not represent the amount paid by the class during periods when reimbursements or reductions occur. Expenses net of fee waivers reflect expenses after reimbursement by the investment adviser but prior to reductions from brokerage service arrangements or other expense offset arrangements. Expenses net of all reductions represent the net expenses paid by the class.
F Amount represents less than $.01 per share.
See accompanying notes which are an integral part of the financial statements.
Annual Report
Financial Highlights - Institutional Class
Years ended January 31, | 2013 | 2012 | 2011 | 2010 | 2009 |
Selected Per-Share Data | | | | | |
Net asset value, beginning of period | $ 10.41 | $ 9.97 | $ 7.72 | $ 6.18 | $ 9.88 |
Income from Investment Operations | | | | | |
Net investment income (loss) B | .08 | .01 | - F | .03 | .04 |
Net realized and unrealized gain (loss) | 1.47 | .43 | 2.25 | 1.54 | (3.72) |
Total from investment operations | 1.55 | .44 | 2.25 | 1.57 | (3.68) |
Distributions from net investment income | (.09) | - | - | (.03) | (.02) |
Net asset value, end of period | $ 11.87 | $ 10.41 | $ 9.97 | $ 7.72 | $ 6.18 |
Total Return A | 14.98% | 4.41% | 29.15% | 25.42% | (37.29)% |
Ratios to Average Net Assets C,E | | | | | |
Expenses before reductions | .83% | .83% | .86% | .76% | .68% |
Expenses net of fee waivers, if any | .83% | .83% | .86% | .76% | .68% |
Expenses net of all reductions | .82% | .82% | .86% | .74% | .68% |
Net investment income (loss) | .72% | .08% | (.02)% | .39% | .52% |
Supplemental Data | | | | | |
Net assets, end of period (000 omitted) | $ 3,725 | $ 1,134 | $ 488 | $ 111 | $ 277 |
Portfolio turnover rate D | 151% | 108% | 126% | 342% | 355% |
A Total returns would have been lower if certain expenses had not been reduced during the applicable periods shown.
B Calculated based on average shares outstanding during the period.
C Fees and expenses of any underlying Fidelity Central Funds are not included in the Fund's expense ratio. The Fund indirectly bears its proportionate share of the expenses of any underlying Fidelity Central Funds.
D Amount does not include the portfolio activity of any underlying Fidelity Central Funds.
E Expense ratios reflect operating expenses of the class. Expenses before reductions do not reflect amounts reimbursed by the investment adviser or reductions from brokerage service arrangements or reductions from other expense offset arrangements and do not represent the amount paid by the class during periods when reimbursements or reductions occur. Expenses net of fee waivers reflect expenses after reimbursement by the investment adviser but prior to reductions from brokerage service arrangements or other expense offset arrangements. Expenses net of all reductions represent the net expenses paid by the class.
F Amount represents less than $.01 per share.
See accompanying notes which are an integral part of the financial statements.
Annual Report
Notes to Financial Statements
For the period ended January 31, 2013
1. Organization.
Fidelity Large Cap Growth Fund (the Fund) is a fund of Fidelity Devonshire Trust (the Trust) and is authorized to issue an unlimited number of shares. The Trust is registered under the Investment Company Act of 1940, as amended (the 1940 Act), as an open-end management investment company organized as a Massachusetts business trust. The Fund offers Class A, Class T, Class C, Large Cap Growth, and Institutional Class shares, each of which, along with Class B shares, has equal rights as to assets and voting privileges. Class B shares are closed to new accounts and additional purchases, except for exchanges and reinvestments. Effective after the close of business on December 14, 2012, the Fund's other share classes were closed to new accounts with certain exceptions. Each class has exclusive voting rights with respect to matters that affect that class. Class B shares will automatically convert to Class A shares after a holding period of seven years from the initial date of purchase. Investment income, realized and unrealized capital gains and losses, the common expenses of the Fund, and certain fund-level expense reductions, if any, are allocated on a pro-rata basis to each class based on the relative net assets of each class to the total net assets of the Fund. Each class differs with respect to transfer agent and distribution and service plan fees incurred. Certain expense reductions may also differ by class.
2. Investments in Fidelity Central Funds.
The Fund invests in Fidelity Central Funds, which are open-end investment companies available only to other investment companies and accounts managed by Fidelity Management & Research Company (FMR) and its affiliates. The Fund's Schedule of Investments lists each of the Fidelity Central Funds held as of period end, if any, as an investment of the Fund, but does not include the underlying holdings of each Fidelity Central Fund. As an Investing Fund, the Fund indirectly bears its proportionate share of the expenses of the underlying Fidelity Central Funds.
The Money Market Central Funds seek preservation of capital and current income and are managed by Fidelity Investments Money Management, Inc. (FIMM), an affiliate of FMR.
A complete unaudited list of holdings for each Fidelity Central Fund is available upon request or at the Securities and Exchange Commission (the SEC) website at www.sec.gov. In addition, the financial statements of the Fidelity Central Funds, which are not covered by the Fund's Report of Independent Registered Public Accounting Firm, are available on the SEC website or upon request.
3. Significant Accounting Policies.
The financial statements have been prepared in conformity with accounting principles generally accepted in the United States of America (GAAP), which require management
Annual Report
3. Significant Accounting Policies - continued
to make certain estimates and assumptions at the date of the financial statements. Actual results could differ from those estimates. Subsequent events, if any, through the date that the financial statements were issued have been evaluated in the preparation of the financial statements. The following summarizes the significant accounting policies of the Fund:
Investment Valuation. Investments are valued as of 4:00 p.m. Eastern time on the last calendar day of the period. In accordance with valuation policies and procedures approved by the Board of Trustees (the Board), the Fund attempts to obtain prices from one or more third party pricing vendors or brokers to value its investments. When current market prices, quotations or currency exchange rates are not readily available or reliable, investments will be fair valued in good faith by the FMR Fair Value Committee (the Committee), in accordance with procedures adopted by the Fund's Board. Factors used in determining fair value vary by investment type and may include market or investment specific events, changes in interest rates and credit quality. The frequency with which these procedures are used cannot be predicted and they may be utilized to a significant extent. The Committee oversees the Fund's valuation policies and procedures and is responsible for approving and reporting to the Board all fair value determinations.
The Fund categorizes the inputs to valuation techniques used to value its investments into a disclosure hierarchy consisting of three levels as shown below:
Level 1 - quoted prices in active markets for identical investments
Level 2 - other significant observable inputs (including quoted prices for similar investments, interest rates, prepayment speeds, etc.)
Level 3 - unobservable inputs (including the Fund's own assumptions based on the best information available)
Valuation techniques used to value the Fund's investments by major category are as follows:
Equity securities, including restricted securities, for which market quotations are readily available, are valued at the last reported sale price or official closing price as reported by a third party pricing vendor on the primary market or exchange on which they are traded and are categorized as Level 1 in the hierarchy. In the event there were no sales during the day or closing prices are not available, securities are valued at the last quoted bid price or may be valued using the last available price and are generally categorized as Level 2 in the hierarchy. For foreign equity securities, when significant market or security specific events arise, comparisons to the valuation of American Depositary Receipts (ADRs), futures contracts, Exchange-Traded Funds (ETFs) and certain indexes as well
Annual Report
Notes to Financial Statements - continued
3. Significant Accounting Policies - continued
Investment Valuation - continued
as quoted prices for similar securities are used and are categorized as Level 2 in the hierarchy. Utilizing these techniques may result in transfers between Level 1 and Level 2.
Investments in open-end mutual funds, including the Fidelity Central Funds, are valued at their closing net asset value (NAV) each business day and are categorized as Level 1 in the hierarchy.
Changes in valuation techniques may result in transfers in or out of an assigned level within the disclosure hierarchy. The aggregate value of investments by input level, as of January 31, 2013, is included at the end of the Fund's Schedule of Investments.
Foreign Currency. The Fund may use foreign currency contracts to facilitate transactions in foreign-denominated securities. Gains and losses from these transactions may arise from changes in the value of the foreign currency or if the counterparties do not perform under the contracts' terms.
Foreign-denominated assets, including investment securities, and liabilities are translated into U.S. dollars at the exchange rates at period end. Purchases and sales of investment securities, income and dividends received and expenses denominated in foreign currencies are translated into U.S. dollars at the exchange rate in effect on the transaction date.
The effects of exchange rate fluctuations on investments are included with the net realized and unrealized gain (loss) on investment securities. Other foreign currency transactions resulting in realized and unrealized gain (loss) are disclosed separately.
Investment Transactions and Income. For financial reporting purposes, the Fund's investment holdings and NAV include trades executed through the end of the last business day of the period. The NAV per share for processing shareholder transactions is calculated as of the close of business of the New York Stock Exchange (NYSE), normally 4:00 p.m. Eastern time and includes trades executed through the end of the prior business day. Gains and losses on securities sold are determined on the basis of identified cost and may include proceeds received from litigation. Dividend income is recorded on the ex-dividend date, except for certain dividends from foreign securities where the ex-dividend date may have passed, which are recorded as soon as the Fund is informed of the ex-dividend date. Non-cash dividends included in dividend income, if any, are recorded at the fair market value of the securities received. Distributions received on securities that represent a return of capital or capital gain are recorded as a reduction of cost of investments and/or as a realized gain. The Fund estimates the components of distributions received that may be considered return of capital distributions or capital gain distributions. Interest income and distributions from the Fidelity Central Funds are
Annual Report
3. Significant Accounting Policies - continued
Investment Transactions and Income - continued
accrued as earned. Investment income is recorded net of foreign taxes withheld where recovery of such taxes is uncertain.
Expenses. Expenses directly attributable to a fund are charged to that fund. Expenses attributable to more than one fund are allocated among the respective funds on the basis of relative net assets or other appropriate methods. Expense estimates are accrued in the period to which they relate and adjustments are made when actual amounts are known.
Income Tax Information and Distributions to Shareholders. Each year, the Fund intends to qualify as a regulated investment company under Subchapter M of the Internal Revenue Code, including distributing substantially all of its taxable income and realized gains. As a result, no provision for income taxes is required. As of January 31, 2013, the Fund did not have any unrecognized tax benefits in the financial statements; nor is the und aware of any tax positions for which it is reasonably possible that the total amounts of unrecognized tax benefits will significantly change in the next twelve months. The Fund files a U.S. federal tax return, in addition to state and local tax returns as required. A fund's federal income tax returns are subject to examination by the Internal Revenue Service (IRS) for a period of three fiscal years after they are filed. State and local tax returns may be subject to examination for an additional fiscal year depending on the jurisdiction. Foreign taxes are provided for based on the Fund's understanding of the tax rules and rates that exist in the foreign markets in which it invests.
Distributions are declared and recorded on the ex-dividend date. Income dividends and capital gain distributions are declared separately for each class. Income and capital gain distributions are determined in accordance with income tax regulations, which may differ from GAAP.
Capital accounts within the financial statements are adjusted for permanent book-tax differences. These adjustments have no impact on net assets or the results of operations. Temporary book-tax differences will reverse in a subsequent period.
Book-tax differences are primarily due to foreign currency transactions, capital loss carryforwards, partnerships and losses deferred due to wash sales and excise tax regulations.
Annual Report
Notes to Financial Statements - continued
3. Significant Accounting Policies - continued
Income Tax Information and Distributions to Shareholders - continued
The federal tax cost of investment securities and unrealized appreciation (depreciation) as of period end were as follows:
Gross unrealized appreciation | $ 20,880,542 |
Gross unrealized depreciation | (1,962,681) |
Net unrealized appreciation (depreciation) on securities and other investments | $ 18,917,861 |
| |
Tax Cost | $ 153,877,596 |
The tax-based components of distributable earnings as of period end were as follows:
Capital loss carryforward | $ (2,764,993) |
Net unrealized appreciation (depreciation) | $ 18,917,491 |
Capital loss carryforwards are only available to offset future capital gains of the Fund to the extent provided by regulations and may be limited. Under the Regulated Investment Company Modernization Act of 2010 (the Act), the Fund is permitted to carry forward capital losses incurred in taxable years beginning after December 22, 2010 for an unlimited period and such capital losses are required to be used prior to any losses that expire. Capital loss carryforwards were as follows:
Fiscal year of expiration |
2018 | $ (2,764,993) |
The tax character of distributions paid was as follows:
| January 31, 2013 | January 31, 2012 |
Ordinary Income | $ 1,066,324 | $ - |
4. Purchases and Sales of Investments.
Purchases and sales of securities, other than short-term securities, aggregated $246,994,013 and $256,698,436, respectively.
5. Fees and Other Transactions with Affiliates.
Management Fee. FMR and its affiliates provide the Fund with investment management related services for which the Fund pays a monthly management fee. The management fee is the sum of an individual fund fee rate that is based on an annual rate of .30% of the Fund's average net assets and an annualized group fee rate that averaged .26% during the period. The group fee rate is based upon the average net assets of all the
Annual Report
5. Fees and Other Transactions with Affiliates - continued
Management Fee - continued
mutual funds advised by FMR. The group fee rate decreases as assets under management increase and increases as assets under management decrease. In addition, the management fee is subject to a performance adjustment (up to a maximum of ± .20% of the Fund's average net assets over a 36 month performance period). The upward or downward adjustment to the management fee is based on the relative investment performance of Large Cap Growth as compared to an appropriate benchmark index. For the period, the total annual management fee rate, including the performance adjustment, was .53% of the Fund's average net assets.
Distribution and Service Plan Fees. In accordance with Rule 12b-1 of the 1940 Act, the Fund has adopted separate Distribution and Service Plans for each class of shares. Certain classes pay Fidelity Distributors Corporation (FDC), an affiliate of FMR, separate Distribution and Service Fees, each of which is based on an annual percentage of each class' average net assets. In addition, FDC may pay financial intermediaries for selling shares of the Fund and providing shareholder support services. For the period, the Distribution and Service Fee rates, total fees and amounts retained by FDC were as follows:
| Distribution
Fee | Service
Fee | Total Fees | Retained
by FDC |
Class A | -% | .25% | $ 34,262 | $ 2,314 |
Class T | .25% | .25% | 29,474 | 260 |
Class B | .75% | .25% | 15,344 | 11,529 |
Class C | .75% | .25% | 72,368 | 24,814 |
| | | $ 151,448 | $ 38,917 |
Sales Load. FDC may receive a front-end sales charge of up to 5.75% for selling Class A shares and 3.50% for selling Class T shares, some of which is paid to financial intermediaries for selling shares of the Fund. Depending on the holding period, FDC may receive contingent deferred sales charges levied on Class A, Class T, Class B, and Class C redemptions. The deferred sales charges range from 5.00% to 1.00% for Class B shares, 1.00% for Class C shares, 1.00% for certain purchases of Class A shares and .25% for certain purchases of Class T shares.
For the period, sales charge amounts retained by FDC were as follows:
| Retained
by FDC |
Class A | $ 10,526 |
Class T | 4,857 |
Class B* | 4,014 |
Class C* | 2,807 |
| $ 22,204 |
* When Class B and Class C shares are initially sold, FDC pays commissions from its own resources to financial intermediaries through which the sales are made.
Annual Report
Notes to Financial Statements - continued
5. Fees and Other Transactions with Affiliates - continued
Transfer Agent Fees. Fidelity Investments Institutional Operations Company, Inc. (FIIOC), an affiliate of FMR, is the transfer, dividend disbursing and shareholder servicing agent for each class of the Fund. FIIOC receives account fees and asset-based fees that vary according to the account size and type of account of the shareholders of the respective classes of the Fund. FIIOC pays for typesetting, printing and mailing of shareholder reports, except proxy statements. For the period, transfer agent fees for each class were as follows:
| Amount | % of
Average
Net Assets |
Class A | $ 41,337 | .30 |
Class T | 19,984 | .34 |
Class B | 4,613 | .30 |
Class C | 21,949 | .30 |
Large Cap Growth | 323,204 | .23 |
Institutional Class | 3,666 | .16 |
| $ 414,753 | |
Accounting and Security Lending Fees. Fidelity Service Company, Inc. (FSC), an affiliate of FMR, maintains the Fund's accounting records. The accounting fee is based on the level of average net assets for each month. Under a separate contract, FSC administers the security lending program. The security lending fee is based on the number and duration of lending transactions.
Brokerage Commissions. The Fund placed a portion of its portfolio transactions with brokerage firms which are affiliates of the investment adviser. The commissions paid to these affiliated firms were $6,094 for the period.
6. Committed Line of Credit.
The Fund participates with other funds managed by FMR or an affiliate in a $4.25 billion credit facility (the "line of credit") to be utilized for temporary or emergency purposes to fund shareholder redemptions or for other short-term liquidity purposes. The Fund has agreed to pay commitment fees on its pro-rata portion of the line of credit, which amounted to $442 and is reflected in Miscellaneous expenses on the Statement of Operations. During the period, there were no borrowings on this line of credit.
7. Security Lending.
The Fund lends portfolio securities through a lending agent from time to time in order to earn additional income. For equity securities, a lending agent is used and may loan securities to certain qualified borrowers, including Fidelity Capital Markets (FCM), a
Annual Report
7. Security Lending - continued
broker-dealer affiliated with the Fund. On the settlement date of the loan, the Fund receives collateral (in the form of U.S. Treasury obligations, letters of credit and/or cash) against the loaned securities and maintains collateral in an amount not less than 100% of the market value of the loaned securities during the period of the loan. The market value of the loaned securities is determined at the close of business of the Fund and any additional required collateral is delivered to the Fund on the next business day. If the borrower defaults on its obligation to return the securities loaned because of insolvency or other reasons, a fund could experience delays and costs in recovering the securities loaned or in gaining access to the collateral. Any cash collateral received is invested in the Fidelity Securities Lending Cash Central Fund. The value of loaned securities and cash collateral at period end are disclosed on the Fund's Statement of Assets and Liabilities. Security lending income represents the income earned on investing cash collateral, less rebates paid to borrowers and any lending agent fees associated with the loan, plus any premium payments received for lending certain types of securities. Security lending income is presented in the Statement of Operations as a component of income from Fidelity Central Funds. Total security lending income during the period amounted to $25,843. During the period, there were no securities loaned to FCM.
8. Expense Reductions.
The following classes were in reimbursement during the period:
| Expense
Limitations | Reimbursement |
Class T | 1.50% | $ 970 |
Many of the brokers with whom FMR places trades on behalf of the Fund provided services to the Fund in addition to trade execution. These services included payments of certain expenses on behalf of the Fund totaling $27,351 for the period.
In addition, through arrangements with the Fund's custodian, credits realized as a result of uninvested cash balances were used to reduce the Fund's expenses. During the period, these credits reduced the Fund's custody expenses by $5.
Annual Report
Notes to Financial Statements - continued
9. Distributions to Shareholders.
Distributions to shareholders of each class were as follows:
Years ended January 31, | 2013 |
From net investment income | |
Class A | $ 53,334 |
Class T | 10,579 |
Large Cap Growth | 973,019 |
Institutional Class | 29,392 |
Total | $ 1,066,324 |
10. Share Transactions.
Transactions for each class of shares were as follows:
| Shares | Dollars |
Years ended January 31, | 2013 | 2012 | 2013 | 2012 |
Class A | | | | |
Shares sold | 433,337 | 943,999 | $ 4,740,889 | $ 9,391,213 |
Reinvestment of distributions | 4,558 | - | 50,641 | - |
Shares redeemed | (491,229) | (378,889) | (5,447,040) | (3,682,555) |
Net increase (decrease) | (53,334) | 565,110 | $ (655,510) | $ 5,708,658 |
Class T | | | | |
Shares sold | 167,129 | 899,142 | $ 1,821,552 | $ 9,125,430 |
Reinvestment of distributions | 933 | - | 10,269 | - |
Shares redeemed | (221,388) | (616,824) | (2,417,742) | (6,053,114) |
Net increase (decrease) | (53,326) | 282,318 | $ (585,921) | $ 3,072,316 |
Class B | | | | |
Shares sold | 6,137 | 19,634 | $ 65,205 | $ 195,465 |
Reinvestment of distributions | - | - | - | - |
Shares redeemed | (39,593) | (80,066) | (425,001) | (776,888) |
Net increase (decrease) | (33,456) | (60,432) | $ (359,796) | $ (581,423) |
Class C | | | | |
Shares sold | 295,397 | 689,847 | $ 3,136,691 | $ 6,821,638 |
Reinvestment of distributions | - | - | - | - |
Shares redeemed | (208,272) | (456,431) | (2,198,388) | (4,462,829) |
Net increase (decrease) | 87,125 | 233,416 | $ 938,303 | $ 2,358,809 |
Large Cap Growth | | | | |
Shares sold | 3,639,058 | 6,389,996 | $ 40,657,344 | $ 64,463,259 |
Reinvestment of distributions | 85,063 | - | 956,110 | - |
Shares redeemed | (4,652,017) | (5,795,048) | (51,937,735) | (58,191,405) |
Net increase (decrease) | (927,896) | 594,948 | $ (10,324,281) | $ 6,271,854 |
Annual Report
10. Share Transactions - continued
| Shares | Dollars |
Years ended January 31, | 2013 | 2012 | 2013 | 2012 |
Institutional Class | | | | |
Shares sold | 242,405 | 185,823 | $ 2,707,389 | $ 1,915,796 |
Reinvestment of distributions | 2,336 | - | 26,346 | - |
Shares redeemed | (39,986) | (125,753) | (445,916) | (1,180,630) |
Net increase (decrease) | 204,755 | 60,070 | $ 2,287,819 | $ 735,166 |
11. Proposed Reorganization.
The Board of Trustees of the Fund approved an Agreement and Plan of Reorganization (the Agreement) between the Fund and Fidelity Stock Selector All Cap Fund. The Agreement provides for the transfer of all the assets and the assumption of all the liabilities of the Fund in exchange for corresponding shares of Fidelity Stock Selector All Cap Fund equal in value to the net assets of the Fund on the day the reorganization is effective.
A meeting of shareholders of the Fund is expected to be held during the second quarter of 2013. If approved by shareholders, the reorganization is expected to become effective on or about June 21, 2013. The reorganization is expected to qualify as a tax-free transaction with no gain or loss recognized by the funds or their shareholders.
12. Other.
The Fund's organizational documents provide former and current trustees and officers with a limited indemnification against liabilities arising in connection with the performance of their duties to the Fund. In the normal course of business, the Fund may also enter into contracts that provide general indemnifications. The Fund's maximum exposure under these arrangements is unknown as this would be dependent on future claims that may be made against the Fund. The risk of material loss from such claims is considered remote.
Annual Report
To the Trustees of Fidelity Devonshire Trust and the Shareholders of Fidelity Large Cap Growth Fund:
In our opinion, the accompanying statement of assets and liabilities, including the schedule of investments, and the related statements of operations and of changes in net assets and the financial highlights present fairly, in all material respects, the financial position of Fidelity Large Cap Growth Fund (a fund of Fidelity Devonshire Trust) at January 31, 2013, the results of its operations for the year then ended, the changes in its net assets for each of the two years in the period then ended and the financial highlights for each of the five years in the period then ended, in conformity with accounting principles generally accepted in the United States of America. These financial statements and financial highlights (hereafter referred to as "financial statements") are the responsibility of the Fidelity Large Cap Growth Fund's management. Our responsibility is to express an opinion on these financial statements based on our audits. We conducted our audits of these financial statements in accordance with the standards of the Public Company Accounting Oversight Board (United States). Those standards require that we plan and perform the audit to obtain reasonable assurance about whether the financial statements are free of material misstatement. An audit includes examining, on a test basis, evidence supporting the amounts and disclosures in the financial statements, assessing the accounting principles used and significant estimates made by management, and evaluating the overall financial statement presentation. We believe that our audits, which included confirmation of securities at January 31, 2013 by correspondence with the custodian and brokers, provide a reasonable basis for our opinion.
PricewaterhouseCoopers LLP
Boston, Massachusetts
March 15, 2013
Annual Report
The Trustees, Members of the Advisory Board, and executive officers of the trust and fund, as applicable, are listed below. The Board of Trustees governs the fund and is responsible for protecting the interests of shareholders. The Trustees are experienced executives who meet periodically throughout the year to oversee the fund's activities, review contractual arrangements with companies that provide services to the fund, oversee management of the risks associated with such activities and contractual arrangements, and review the fund's performance. Except for James C. Curvey, each of the Trustees oversees 234 Fidelity funds. Mr. Curvey oversees 453 Fidelity funds.
The Trustees hold office without limit in time except that (a) any Trustee may resign; (b) any Trustee may be removed by written instrument, signed by at least two-thirds of the number of Trustees prior to such removal; (c) any Trustee who requests to be retired or who has become incapacitated by illness or injury may be retired by written instrument signed by a majority of the other Trustees; and (d) any Trustee may be removed at any special meeting of shareholders by a two-thirds vote of the outstanding voting securities of the trust. Each Trustee who is not an interested person (as defined in the 1940 Act) (Independent Trustee), shall retire not later than the last day of the calendar year in which his or her 75th birthday occurs. The Independent Trustees may waive this mandatory retirement age policy with respect to individual Trustees. The executive officers and Advisory Board Members hold office without limit in time, except that any officer and Advisory Board Member may resign or may be removed by a vote of a majority of the Trustees at any regular meeting or any special meeting of the Trustees. Except as indicated, each individual has held the office shown or other offices in the same company for the past five years.
Experience, Skills, Attributes, and Qualifications of the Fund's Trustees. The Governance and Nominating Committee has adopted a statement of policy that describes the experience, qualifications, attributes, and skills that are necessary and desirable for potential Independent Trustee candidates (Statement of Policy). The Board believes that each Trustee satisfied at the time he or she was initially elected or appointed a Trustee, and continues to satisfy, the standards contemplated by the Statement of Policy. The Governance and Nominating Committee also engages professional search firms to help identify potential Independent Trustee candidates who have the experience, qualifications, attributes, and skills consistent with the Statement of Policy. From time to time, additional criteria based on the composition and skills of the current Independent Trustees, as well as experience or skills that may be appropriate in light of future changes to board composition, business conditions, and regulatory or other developments, have also been considered by the professional search firms and the Governance and Nominating Committee. In addition, the Board takes into account the Trustees' commitment and participation in Board and committee meetings, as well as their leadership of standing and ad hoc committees throughout their tenure.
In determining that a particular Trustee was and continues to be qualified to serve as a Trustee, the Board has considered a variety of criteria, none of which, in isolation, was controlling. The Board believes that, collectively, the Trustees have balanced and diverse experience, qualifications, attributes, and skills, which allow the Board to operate effectively in governing the fund and protecting the interests of shareholders. Information about the specific experience, skills, attributes, and qualifications of each Trustee, which in each case led to the Board's conclusion that the Trustee should serve (or continue to serve) as a trustee of the fund, is provided below.
Annual Report
Trustees and Officers - continued
Board Structure and Oversight Function. James C. Curvey is an interested person (as defined in the 1940 Act) and currently serves as Chairman. The Trustees have determined that an interested Chairman is appropriate and benefits shareholders because an interested Chairman has a personal and professional stake in the quality and continuity of services provided to the fund. Independent Trustees exercise their informed business judgment to appoint an individual of their choosing to serve as Chairman, regardless of whether the Trustee happens to be independent or a member of management. The Independent Trustees have determined that they can act independently and effectively without having an Independent Trustee serve as Chairman and that a key structural component for assuring that they are in a position to do so is for the Independent Trustees to constitute a substantial majority for the Board. The Independent Trustees also regularly meet in executive session. Ned C. Lautenbach serves as Chairman of the Independent Trustees and as such (i) acts as a liaison between the Independent Trustees and management with respect to matters important to the Independent Trustees and (ii) with management prepares agendas for Board meetings.
Fidelity funds are overseen by different Boards of Trustees. The fund's Board oversees Fidelity's equity and high income funds and another Board oversees Fidelity's investment-grade bond, money market, and asset allocation funds. The asset allocation funds may invest in Fidelity funds overseen by the fund's Board. The use of separate Boards, each with its own committee structure, allows the Trustees of each group of Fidelity funds to focus on the unique issues of the funds they oversee, including common research, investment, and operational issues. On occasion, the separate Boards establish joint committees to address issues of overlapping consequences for the Fidelity funds overseen by each Board.
The Trustees operate using a system of committees to facilitate the timely and efficient consideration of all matters of importance to the Trustees, the fund, and fund shareholders and to facilitate compliance with legal and regulatory requirements and oversight of the fund's activities and associated risks. The Board, acting through its committees, has charged FMR and its affiliates with (i) identifying events or circumstances the occurrence of which could have demonstrably adverse effects on the fund's business and/or reputation; (ii) implementing processes and controls to lessen the possibility that such events or circumstances occur or to mitigate the effects of such events or circumstances if they do occur; and (iii) creating and maintaining a system designed to evaluate continuously business and market conditions in order to facilitate the identification and implementation processes described in (i) and (ii) above. Because the day-to-day operations and activities of the fund are carried out by or through FMR, its affiliates and other service providers, the fund's exposure to risks is mitigated but not eliminated by the processes overseen by the Trustees. While each of the Board's committees has responsibility for overseeing different aspects of the fund's activities, oversight is exercised primarily through the Operations, Audit, and Compliance Committees. In addition, the Independent Trustees have worked with FMR to enhance the Board's oversight of investment and financial risks, legal and regulatory risks, technology risks, and operational risks, including the development of additional risk reporting to the Board. For example, a working group comprised of Independent Trustees and FMR has worked and continues to work to review the Fidelity funds' valuation-related activities, reporting and risk management. Appropriate personnel, including but not limited to the fund's Chief Compliance Officer (CCO), FMR's internal auditor, the independent accountants, the fund's Treasurer and portfolio management personnel, make periodic reports to the Board's committees, as appropriate, including an annual review of FMR's risk management program for the Fidelity funds. The responsibilities of each standing committee, including their oversight responsibilities, are described further under "Standing Committees of the Fund's Trustees."
Annual Report
The fund's Statement of Additional Information (SAI) includes more information about the Trustees. To request a free copy, call Fidelity at 1-800-544-8544.
Interested Trustees*:
Correspondence intended for each Trustee who is an interested person may be sent to Fidelity Investments, 245 Summer Street, Boston, Massachusetts 02210.
Name, Age; Principal Occupations and Other Relevant Experience+ |
James C. Curvey (77) |
| Year of Election or Appointment: 2007 Mr. Curvey is Trustee and Chairman of the Board of Trustees of certain Trusts. Mr. Curvey also serves as Trustee (2007-present) of other investment companies advised by FMR. Mr. Curvey is a Director of Fidelity Investments Money Management, Inc. (2009-present), Director of Fidelity Research & Analysis Co. (2009-present) and Director of FMR and FMR Co., Inc. (2007-present). Mr. Curvey is also Vice Chairman (2007-present) and Director of FMR LLC. In addition, Mr. Curvey serves as an Overseer for the Boston Symphony Orchestra and a member of the Trustees of Villanova University. Previously, Mr. Curvey was the Vice Chairman (2006-2007) and Director (2000-2007) of FMR Corp. |
Ronald P. O'Hanley (55) |
| Year of Election or Appointment: 2011 Mr. O'Hanley is Director of FMR Co., Inc. (2010-present), Director of Fidelity Investments Money Management, Inc. (2010-present), Director of Fidelity Research & Analysis Company (2010-present), President of Fidelity Asset Management and Corporate Services and a member of Fidelity's Executive Committee (2010-present). Previously, Mr. O'Hanley served as President and Chief Executive Officer of BNY Mellon Asset Management (2007-2010). Mr. O'Hanley also served as Vice Chairman of Bank New York Mellon Corp. and a member of that firm's Executive Committee. Prior to the 2007 merger of The Bank of New York and Mellon Financial Corporation, he was Vice Chairman of Mellon Financial Corporation and President and Chief Executive Officer of Mellon Asset Management. He joined Mellon in February 1997. Mr. O'Hanley currently serves as Chairman of the Boston Public Library Foundation Board of Directors and sits on the Board of Directors of Beth Israel Deaconess Medical Center, the Board of Trustees of the Marine Biological Laboratory and the Advisory Board of the Maxwell School of Citizenship and Public Administration at Syracuse University. Mr. O'Hanley also chairs the Council on Asset Management for the Financial Services Roundtable and is a member of the Board of Directors of Institutional Investor's U.S. Institute. |
* Trustees have been determined to be "Interested Trustees" by virtue of, among other things, their affiliation with the trust or various entities under common control with FMR.
+ The information above includes each Trustee's principal occupation during the last five years and other information relating to the experience, attributes, and skills relevant to each Trustee's qualifications to serve as a Trustee, which led to the conclusion that each Trustee should serve as a Trustee for the fund.
Annual Report
Independent Trustees:
Correspondence intended for each Independent Trustee (that is, the Trustees other than the Interested Trustees) may be sent to Fidelity Investments, P.O. Box 55235, Boston, Massachusetts 02205-5235.
Name, Age; Principal Occupations and Other Relevant Experience+ |
Dennis J. Dirks (64) |
| Year of Election or Appointment: 2005 Prior to his retirement in May 2003, Mr. Dirks was Chief Operating Officer and a member of the Board of The Depository Trust & Clearing Corporation (DTCC). He also served as President, Chief Operating Officer, and Board member of The Depository Trust Company (DTC) and President and Board member of the National Securities Clearing Corporation (NSCC). In addition, Mr. Dirks served as Chief Executive Officer and Board member of the Government Securities Clearing Corporation, Chief Executive Officer and Board member of the Mortgage-Backed Securities Clearing Corporation, as a Trustee and a member of the Finance Committee of Manhattan College (2005-2008), and as a Trustee and a member of the Finance Committee of AHRC of Nassau County (2006-2008). Mr. Dirks is a member of the Independent Directors Council (IDC) Governing Council (2010-present) and Board of Directors for The Brookville Center for Children's Services, Inc. (2009-present). |
Alan J. Lacy (59) |
| Year of Election or Appointment: 2008 Mr. Lacy serves as Senior Adviser (2007-present) of Oak Hill Capital Partners, L.P. (private equity). Mr. Lacy also served as Chief Executive Officer (2000-2005) and Vice Chairman (2005-2006) of Sears Holdings Corporation and Sears, Roebuck and Co. (retail). In addition, Mr. Lacy serves as a member of the Board of Directors of Dave & Buster's Entertainment, Inc. (restaurant and entertainment complexes, 2010-present), Earth Fare, Inc. (retail grocery, 2012-present), The Hillman Companies, Inc. (hardware wholesalers, 2010-present), and Bristol-Myers Squibb Company (global pharmaceuticals, 2008-present). Mr. Lacy is a member of the Board of Trustees of The National Parks Conservation Association (2006-present). Previously, Mr. Lacy served as Chairman of the Board of Trustees of the National Parks Conservation Association (2008-2011) and as a member of the Board of Directors for the Western Union Company (global money transfer, 2006-2011). |
Ned C. Lautenbach (68) |
| Year of Election or Appointment: 2000 Mr. Lautenbach currently serves as the Lead Director of the Eaton Corporation Board of Directors (diversified industrial, 1997-present). Mr. Lautenbach is Chairman of the Board of Directors of the Philharmonic Center for the Arts in Naples, Florida (2012-present) and a member of the Council on Foreign Relations (1994-present). Previously, Mr. Lautenbach was a Partner/Advisory Partner at Clayton, Dubilier & Rice, LLC (private equity investment, 1998-2010), as well as a Director of Sony Corporation (2006-2007). |
Joseph Mauriello (68) |
| Year of Election or Appointment: 2008 Prior to his retirement in January 2006, Mr. Mauriello served in numerous senior management positions including Deputy Chairman and Chief Operating Officer (2004-2005), and Vice Chairman of Financial Services (2002-2004) of KPMG LLP US (professional services, 1965-2005). Mr. Mauriello currently serves as a member of the Board of Directors of XL Group plc. (global insurance and re-insurance, 2006-present). Previously, Mr. Mauriello served as a Director of the Hamilton Funds of the Bank of New York (2006-2007) and of Arcadia Resources Inc. (health care services and products, 2007-2012). |
Robert W. Selander (62) |
| Year of Election or Appointment: 2011 Previously, Mr. Selander served as a Member of the Advisory Board of Fidelity's Equity and High Income Funds (2011), Executive Vice Chairman (2010), Chief Executive Officer (2009-2010), and President and Chief Executive Officer (1997-2009) of Mastercard, Inc. |
Cornelia M. Small (68) |
| Year of Election or Appointment: 2005 Ms. Small is a member of the Board of Directors (2009-present) and Chair of the Investment Committee (2010-present) of the Teagle Foundation. Ms. Small also serves on the Investment Committee of the Berkshire Taconic Community Foundation (2008-present). Previously, Ms. Small served as Chairperson (2002-2008) and a member of the Investment Committee and Chairperson (2008-2012) and a member of the Board of Trustees of Smith College. In addition, Ms. Small served as Chief Investment Officer, Director of Global Equity Investments, and a member of the Board of Directors of Scudder, Stevens & Clark and Scudder Kemper Investments. |
William S. Stavropoulos (73) |
| Year of Election or Appointment: 2002 Mr. Stavropoulos is Vice Chairman of the Independent Trustees of the Equity and High Income Funds (2006-present). Mr. Stavropoulos serves as President and Founder of the Michigan Baseball Foundation, the Great Lakes Loons (2007-present). Mr. Stavropoulos is Chairman Emeritus of the Board of Directors of The Dow Chemical Company, where he previously served in numerous senior management positions, including President, CEO (1995-2000; 2002-2004), Chairman of the Executive Committee (2000-2006), and as a member of the Board of Directors (1990-2006). Currently, Mr. Stavropoulos is a Director of Univar Inc. (global distributor of commodity and specialty chemicals, Chairman from 2010-May 2012 and Lead Director from May 2012-present), Teradata Corporation (data warehousing and technology solutions, 2008-present), Maersk Inc. (industrial conglomerate), and Tyco International, Ltd. (multinational manufacturing and services, 2007-present), and a member of the Advisory Board for Metalmark Capital LLC (private equity investment, 2005-present). Mr. Stavropoulos is an operating advisor to Clayton, Dubilier & Rice, LLC (private equity investment). In addition, Mr. Stavropoulos is a member of the University of Notre Dame Advisory Council for the College of Science, a Trustee of the Rollin L. Gerstacker Foundation, and a Director of the Naples Philharmonic Center for the Arts. Previously, Mr. Stavropoulos served as a Director of Chemical Financial Corporation (bank holding company, 1993-2012). |
David M. Thomas (63) |
| Year of Election or Appointment: 2008 Previously, Mr. Thomas served as Executive Chairman (2005-2006) and Chairman and Chief Executive Officer (2000-2005) of IMS Health, Inc. (pharmaceutical and healthcare information solutions), and a Director of Fortune Brands, Inc. (consumer products, 2000-2011). In addition, Mr. Thomas serves as Non-Executive Chairman of the Board of Directors of Fortune Brands Home and Security (home and security products, 2011-present), and as a member of the Board of Directors of Interpublic Group of Companies, Inc. (marketing communication, 2004-present). |
Michael E. Wiley (62) |
| Year of Election or Appointment: 2008 Mr. Wiley also serves as a Director of Asia Pacific Exploration Consolidated (international oil and gas exploration and production, 2008-present). Mr. Wiley serves as a Director of Tesoro Corporation (independent oil refiner and marketer, 2005-present), and a Director of Bill Barrett Corporation (exploration and production, 2005-present). In addition, Mr. Wiley also serves as a Director of Post Oak Bank (privately-held bank, 2004-present). Previously, Mr. Wiley served as a member of the Board of Trustees of the University of Tulsa (2000-2006; 2007-2010), as a Senior Energy Advisor of Katzenbach Partners, LLC (consulting, 2006-2007), as an Advisory Director of Riverstone Holdings (private investment), Chairman, President, and CEO of Baker Hughes, Inc. (oilfield services, 2000-2004), and as Director of Spinnaker Exploration Company (exploration and production, 2001-2005). |
+ The information above includes each Trustee's principal occupation during the last five years and other information relating to the experience, attributes, and skills relevant to each Trustee's qualifications to serve as a Trustee, which led to the conclusion that each Trustee should serve as a Trustee for the fund.
Advisory Board Members and Executive Officers:
Correspondence intended for David A. Rosow and Garnett A. Smith may be sent to Fidelity Investments, P.O. Box 55235, Boston, Massachusetts 02205-5235. Correspondence intended for each executive officer and Peter S. Lynch may be sent to Fidelity Investments, 245 Summer Street, Boston, Massachusetts 02210.
Name, Age; Principal Occupation |
Peter S. Lynch (69) |
| Year of Election or Appointment: 2003 Member of the Advisory Board of Fidelity's Equity and High Income Funds. Mr. Lynch is Vice Chairman and a Director of FMR and FMR Co., Inc. In addition, Mr. Lynch serves as a Trustee of Boston College and as the Chairman of the Inner-City Scholarship Fund. Previously, Mr. Lynch served on the Special Olympics International Board of Directors (1997-2006). |
David A. Rosow (70) |
| Year of Election or Appointment: 2012 Member of the Advisory Board of Fidelity's Equity and High Income Funds. Chairman and Chief Executive Officer of International Golf Group, Inc. (golf course development, 1989-present). Previously, Mr. Rosow served as Chairman and Chief Executive Officer of Rosow & Company, Inc. (private investment company, 1989-2011), a Lead Director of Hudson United Bancorp (2001-2006) and as a Director of TD Banknorth (1996-2006). In addition, Mr. Rosow is a member (2008-present) and President (2009-present) of the Town Council of Palm Beach, Florida. |
Garnett A. Smith (65) |
| Year of Election or Appointment: 2012 Member of the Advisory Board of Fidelity's Equity and High Income Funds. Prior to Mr. Smith's retirement, he served as Chairman and Chief Executive Officer of Inbrand Corp. (manufacturer of personal absorbent products, 1990-1997). He also served as President (1986-1990) of Inbrand Corp. Prior to his employment with Inbrand Corp., he was employed by a retail fabric chain and North Carolina National Bank. In addition, Mr. Smith is a board member of the Jackson Hole Land Trust (2009-present). |
Kenneth B. Robins (43) |
| Year of Election or Appointment: 2008 President and Treasurer of Fidelity's Equity and High Income Funds. Mr. Robins also serves as President and Treasurer (2010-present) and Assistant Treasurer (2009-present) of other Fidelity funds and is an employee of Fidelity Investments (2004-present). Previously, Mr. Robins served as Deputy Treasurer of the Fidelity funds (2005-2008) and Treasurer and Chief Financial Officer of The North Carolina Capital Management Trust: Cash and Term Portfolios (2006-2008). |
Bruce T. Herring (47) |
| Year of Election or Appointment: 2006 Vice President of certain Equity Funds. Mr. Herring also serves as Chief Investment Officer of Fidelity Global Asset Allocation (GAA) (2013-present), Chief Investment Officer and Director of Fidelity Management & Research (U.K.) Inc. (2010-present), Group Chief Investment Officer of FMR, and President of Fidelity Research & Analysis Company (2010-present). Previously, Mr. Herring served as Vice President (2005-2006) and Senior Vice President (2006-2007) of Fidelity Management & Research Company, Vice President of FMR Co., Inc. (2001-2007) and as a portfolio manager for Fidelity U.S. Equity Funds. |
Brian B. Hogan (48) |
| Year of Election or Appointment: 2009 Vice President of Equity and High Income Funds. Mr. Hogan also serves as President of FMR's Equity Division (2009-present). Previously, Mr. Hogan served as Senior Vice President, Equity Research of FMR (2006-2009) and as a portfolio manager. |
Scott C. Goebel (45) |
| Year of Election or Appointment: 2008 Secretary and Chief Legal Officer (CLO) of the Fidelity funds. Mr. Goebel also serves as Secretary of Fidelity Investments Money Management, Inc. (FIMM) (2010-present) and Fidelity Research and Analysis Company (FRAC) (2010-present); Secretary and CLO of The North Carolina Capital Management Trust: Cash and Term Portfolios (2008-present); General Counsel, Secretary, and Senior Vice President of FMR (2008-present) and FMR Co., Inc. (2008-present); employed by FMR LLC or an affiliate (2001-present); Chief Legal Officer of Fidelity Management & Research (Hong Kong) Limited (2008-present) and Assistant Secretary of Fidelity Management & Research (Japan) Inc. (2008-present), and Fidelity Management & Research (U.K.) Inc. (2008-present). Previously, Mr. Goebel served as Assistant Secretary of FIMM (2008-2010), FRAC (2008-2010), and the Funds (2007-2008) and as Vice President and Secretary of Fidelity Distributors Corporation (FDC) (2005-2007). |
William C. Coffey (43) |
| Year of Election or Appointment: 2009 Assistant Secretary of Fidelity's Equity and High Income Funds. Mr. Coffey also serves as Senior Vice President and Deputy General Counsel of FMR LLC (2010-present), and is an employee of Fidelity Investments. Previously, Mr. Coffey served as Vice President and Associate General Counsel of FMR LLC (2005-2009). |
Elizabeth Paige Baumann (44) |
| Year of Election or Appointment: 2012 Anti-Money Laundering (AML) Officer of the Fidelity funds. Ms. Baumann also serves as AML Officer of The North Carolina Capital Management Trust: Cash and Term Portfolios (2012-present), Chief AML Officer of FMR LLC (2012-present), and is an employee of Fidelity Investments. Previously, Ms. Baumann served as Vice President and Deputy Anti-Money Laundering Officer (2007-2012). |
Christine Reynolds (54) |
| Year of Election or Appointment: 2008 Chief Financial Officer of the Fidelity funds. Ms. Reynolds became President of Fidelity Pricing and Cash Management Services (FPCMS) in August 2008. Ms. Reynolds served as Chief Operating Officer of FPCMS (2007-2008). Previously, Ms. Reynolds served as President, Treasurer, and Anti-Money Laundering officer of the Fidelity funds (2004-2007). |
Joseph A. Hanlon (44) |
| Year of Election or Appointment: 2012 Chief Compliance Officer of Fidelity's Equity and High Income Funds. Mr. Hanlon serves as Compliance Officer of FMR, FMR Co., Inc., Fidelity Investments Money Management, Inc. (FIMM), Fidelity Research and Analysis Company (FRAC), Fidelity Management & Research (Japan) Inc., Fidelity Management & Research (U.K.) Inc., Fidelity Management & Research (Hong Kong), and Strategic Advisers, Inc. (2009-present), as Senior Vice President of the Fidelity Asset Management Division (2009-present), and is an employee of Fidelity Investments. |
Joseph F. Zambello (55) |
| Year of Election or Appointment: 2011 Deputy Treasurer of the Fidelity funds. Mr. Zambello is an employee of Fidelity Investments. Previously, Mr. Zambello served as Vice President of FMR's Program Management Group (2009-2011) and Vice President of the Transfer Agent Oversight Group (2005-2009). |
Adrien E. Deberghes (45) |
| Year of Election or Appointment: 2008 Deputy Treasurer of Fidelity's Equity and High Income Funds. Mr. Deberghes also serves as Vice President (2011-present) and Assistant Treasurer (2010-present) of other Fidelity funds, and is an employee of Fidelity Investments (2008-present). Previously, Mr. Deberghes served as Senior Vice President of Mutual Fund Administration at State Street Corporation (2007-2008), Senior Director of Mutual Fund Administration at Investors Bank & Trust (2005-2007), and Director of Finance for Dunkin' Brands (2000-2005). |
Stephen Sadoski (41) |
| Year of Election or Appointment: 2012 Deputy Treasurer of Fidelity's Equity and High Income Funds. Mr. Sadoski also serves as Deputy Treasurer of other Fidelity funds (2013-present) and is an employee of Fidelity Investments (2012-present). Previously, Mr. Sadoski served as Assistant Treasurer of Fidelity's Fixed Income and Asset Allocation Funds (2012-2013), an assistant chief accountant in the Division of Investment Management of the Securities and Exchange Commission (SEC) (2009-2012) and as a senior manager at Deloitte & Touche (1997-2009). |
Stacie Smith (38) |
| Year of Election or Appointment: 2013 Deputy Treasurer of Fidelity's Equity and High Income Funds. Ms. Smith is an employee of Fidelity Investments (2009-present). Previously, Ms. Smith served as Senior Audit Manager of Ernst & Young LLP (1996-2009). |
Stephanie J. Dorsey (43) |
| Year of Election or Appointment: 2010 Assistant Treasurer of Fidelity's Equity and High Income Funds. Ms. Dorsey also serves as President and Treasurer (2013-present) and Assistant Treasurer (2012-present) of other Fidelity funds and is an employee of Fidelity Investments (2008-present). Previously, Ms. Dorsey served as Deputy Treasurer of Fidelity's Fixed Income and Asset Allocation Funds (2008-2013), Treasurer (2004-2008) of the JPMorgan Mutual Funds and Vice President (2004-2008) of JPMorgan Chase Bank. |
John R. Hebble (54) |
| Year of Election or Appointment: 2009 Assistant Treasurer of Fidelity's Equity and High Income Funds. Mr. Hebble also serves as President (2011-present), Treasurer, and Chief Financial Officer of The North Carolina Capital Management Trust: Cash and Term Portfolios (2008-present) and is an employee of Fidelity Investments. Previously, Mr. Hebble served as President and Treasurer of Fidelity's Fixed Income and Asset Allocation Funds (2008-2013). |
Gary W. Ryan (54) |
| Year of Election or Appointment: 2005 Assistant Treasurer of the Fidelity funds. Mr. Ryan is an employee of Fidelity Investments. Previously, Mr. Ryan served as Vice President of Fund Reporting in Fidelity Pricing and Cash Management Services (FPCMS) (1999-2005). |
Jonathan Davis (44) |
| Year of Election or Appointment: 2010 Assistant Treasurer of the Fidelity funds. Mr. Davis is also Assistant Treasurer of Fidelity Rutland Square Trust II and Fidelity Commonwealth Trust II. Mr. Davis is an employee of Fidelity Investments. Previously, Mr. Davis served as Vice President and Associate General Counsel of FMR LLC (2003-2010). |
Annual Report
Large Cap Growth designates 100% of the dividends distributed during the fiscal year as qualifying for the dividends-received deduction for corporate shareholders.
Large Cap Growth designates 100% of the dividends distributed in during the fiscal year as amounts which may be taken into account as a dividend for the purposes of the maximum rate under section 1(h)(11) of the Internal Revenue Code.
The fund will notify shareholders in January 2014 of amounts for use in preparing 2013 income tax returns.
Annual Report
Investment Adviser
Fidelity Management & Research Company
Boston, MA
Investment Sub-Advisers
FMR Co., Inc.
Fidelity Management & Research
(U.K.) Inc.
Fidelity Management & Research
(Hong Kong) Limited
Fidelity Management & Research
(Japan) Inc.
General Distributor
Fidelity Distributors Corporation
Smithfield, RI
Transfer and Service Agents
Fidelity Investments Institutional
Operations Company, Inc.
Boston, MA
Fidelity Service Company, Inc.
Boston, MA
Custodian
Citibank, N.A.
New York, NY
The Fidelity Telephone Connection
Mutual Fund 24-Hour Service
Exchanges/Redemptions
and Account Assistance 1-800-544-6666
Product Information 1-800-544-6666
Retirement Accounts 1-800-544-4774
(8 a.m. - 9 p.m.)
TDD Service 1-800-544-0118
for the deaf and hearing impaired
(9 a.m. - 9 p.m. Eastern time)
Fidelity Automated Service
Telephone (FAST®)
1-800-544-5555
Automated line for quickest service
(Fidelity Investment logo)(registered trademark)
Corporate Headquarters
245 Summer St., Boston, MA 02210
www.fidelity.com
LCG-UANN-0313
1.900187.103
(Fidelity Investment logo)(registered trademark)
Fidelity Advisor®
Large Cap Growth
Fund - Class A, Class T, Class B
and Class C
Annual Report
January 31, 2013
(Fidelity Cover Art)
Class A, Class T, Class B, and Class C are classes of Fidelity® Large Cap Growth Fund
Contents
Note to shareholders | (Click Here) | Important information about the fund. |
Performance | (Click Here) | How the fund has done over time. |
Management's Discussion of Fund Performance | (Click Here) | The Portfolio Manager's review of fund performance and strategy. |
Shareholder Expense Example | (Click Here) | An example of shareholder expenses. |
Investment Changes | (Click Here) | A summary of major shifts in the fund's investments over the past six months. |
Investments | (Click Here) | A complete list of the fund's investments with their market values. |
Financial Statements | (Click Here) | Statements of assets and liabilities, operations, and changes in net assets, as well as financial highlights. |
Notes | (Click Here) | Notes to the financial statements. |
Report of Independent Registered Public Accounting Firm | (Click Here) | |
Trustees and Officers | (Click Here) | |
Distributions | (Click Here) | |
To view a fund's proxy voting guidelines and proxy voting record for the 12-month period ended June 30, visit http://www.fidelity.com/proxyvotingresults or visit the Securities and Exchange Commission's (SEC) web site at http://www.sec.gov. You may also call 1-877-208-0098 to request a free copy of the proxy voting guidelines.
Standard & Poor's, S&P and S&P 500 are registered service marks of The McGraw-Hill Companies, Inc. and have been licensed for use by Fidelity Distributors Corporation.
Other third-party marks appearing herein are the property of their respective owners.
All other marks appearing herein are registered or unregistered trademarks or service marks of FMR LLC or an affiliated company. © 2013 FMR LLC. All rights reserved.
Annual Report
This report and the financial statements contained herein are submitted for the general information of the shareholders of the fund. This report is not authorized for distribution to prospective investors in the fund unless preceded or accompanied by an effective prospectus.
A fund files its complete schedule of portfolio holdings with the SEC for the first and third quarters of each fiscal year on Form N-Q. Forms N-Q are available on the SEC's web site at http://www.sec.gov. A fund's Forms N-Q may be reviewed and copied at the SEC's Public Reference Room in Washington, DC. Information regarding the operation of the SEC's Public Reference Room may be obtained by calling 1-800-SEC-0330. For a complete list of a fund's portfolio holdings, view the most recent holdings listing, semiannual report, or annual report on Fidelity's web site at http://www.fidelity.com, http://www.advisor.fidelity.com, or http://www.401k.com, as applicable.
NOT FDIC INSURED • MAY LOSE VALUE • NO BANK GUARANTEE
Neither the fund nor Fidelity Distributors Corporation is a bank.
Annual Report
Note to shareholders
On November 14, 2012, the Board of Trustees approved a proposal to merge Fidelity® Large Cap Growth Fund into Fidelity® Stock Selector All Cap Fund. Shareholders of Fidelity Large Cap Growth Fund are expected to meet on May 14, 2013, to vote on the proposal. If approved, the merger is expected to be completed on or about June 21, 2013, and Advisor Class shareholders of Fidelity Large Cap Growth Fund will receive Advisor Class shares of Fidelity Stock Selector All Cap Fund. Fidelity Large Cap Growth Fund closed to new investors after the close of business on December 14, 2012.
The note above is not a solicitation of any proxy. For a free copy of the proxy statement describing the reorganization (and containing important information about fees, expenses and risk considerations) and a prospectus for Fidelity Stock Selector All Cap Fund, please call 1-877-208-0098. The prospectus/proxy statement also is available for free on the Securities and Exchange Commission's website (www.sec.gov).
Annual Report
Average annual total return reflects the change in the value of an investment, assuming reinvestment of the class' distributions from dividend income and capital gains (the profits earned upon the sale of securities that have grown in value, if any) and assuming a constant rate of performance each year. The $10,000 table and the fund's returns do not reflect the deduction of taxes that a shareholder would pay on fund distributions or the redemption of fund shares. During periods of reimbursement by Fidelity, a fund's total return will be greater than it would be had the reimbursement not occurred. How a fund did yesterday is no guarantee of how it will do tomorrow.
Average Annual Total Returns
Periods ended January 31, 2013 | Past 1
year | Past 5
years | Past 10
years |
Class A (incl. 5.75% sales charge) A | 7.94% | 2.50% | 6.52% |
Class T (incl. 3.50% sales charge) B | 10.30% | 2.69% | 6.61% |
Class B (incl. contingent deferred sales charge) C | 8.71% | 2.59% | 6.68% |
Class C (incl. contingent deferred sales charge) D | 12.80% | 2.95% | 6.69% |
A Class A shares bear a 0.25% 12b-1 fee. The initial offering of Class A shares took place on February 13, 2007. Returns prior to February 13, 2007, are those of Fidelity® Large Cap Growth Fund, the original class of the fund, which has no 12b-1 fee. Had Class A's 12b-1 fee been reflected, returns prior to February 13, 2007, would have been lower.
B Class T shares bear a 0.50% 12b-1 fee. The initial offering of Class T shares took place on February 13, 2007. Returns prior to February 13, 2007, are those of Fidelity Large Cap Growth Fund, the original class of the fund, which has no 12b-1 fee. Had Class T's 12b-1 fee been reflected, returns prior to February 13, 2007, would have been lower.
C Class B shares bear a 1.00% 12b-1 fee. The initial offering of Class B shares took place on February 13, 2007. Returns prior to February 13, 2007, are those of Fidelity Large Cap Growth Fund, the original class of the fund, which has no 12b-1 fee. Had Class B's 12b-1 fee been reflected, returns prior to February 13, 2007, would have been lower. Class B shares' contingent deferred sales charge included in the past one year, past five years, and past ten years total return figures are 5%, 2%, and 0%, respectively.
D Class C shares bear a 1.00% 12b-1 fee. The initial offering of Class C shares took place on February 13, 2007. Returns prior to February 13, 2007, are those of Fidelity Large Cap Growth Fund, the original class of the fund, which has no 12b-1 fee. Had Class C's 12b-1 fee been reflected, returns prior to February 13, 2007, would have been lower. Class C shares' contingent deferred sales charge included in the past one year, past five years, and past ten years total return figures are 1%, 0%, and 0%, respectively.
Annual Report
$10,000 Over 10 Years
Let's say hypothetically that $10,000 was invested in Fidelity Advisor® Large Cap Growth Fund - Class A on January 31, 2003, and the current 5.75% sales charge was paid. The chart shows how the value of your investment would have changed, and also shows how the Russell 1000® Growth Index performed over the same period. The initial offering of Class A took place on February 13, 2007. See the previous page for additional information regarding performance of Class A.
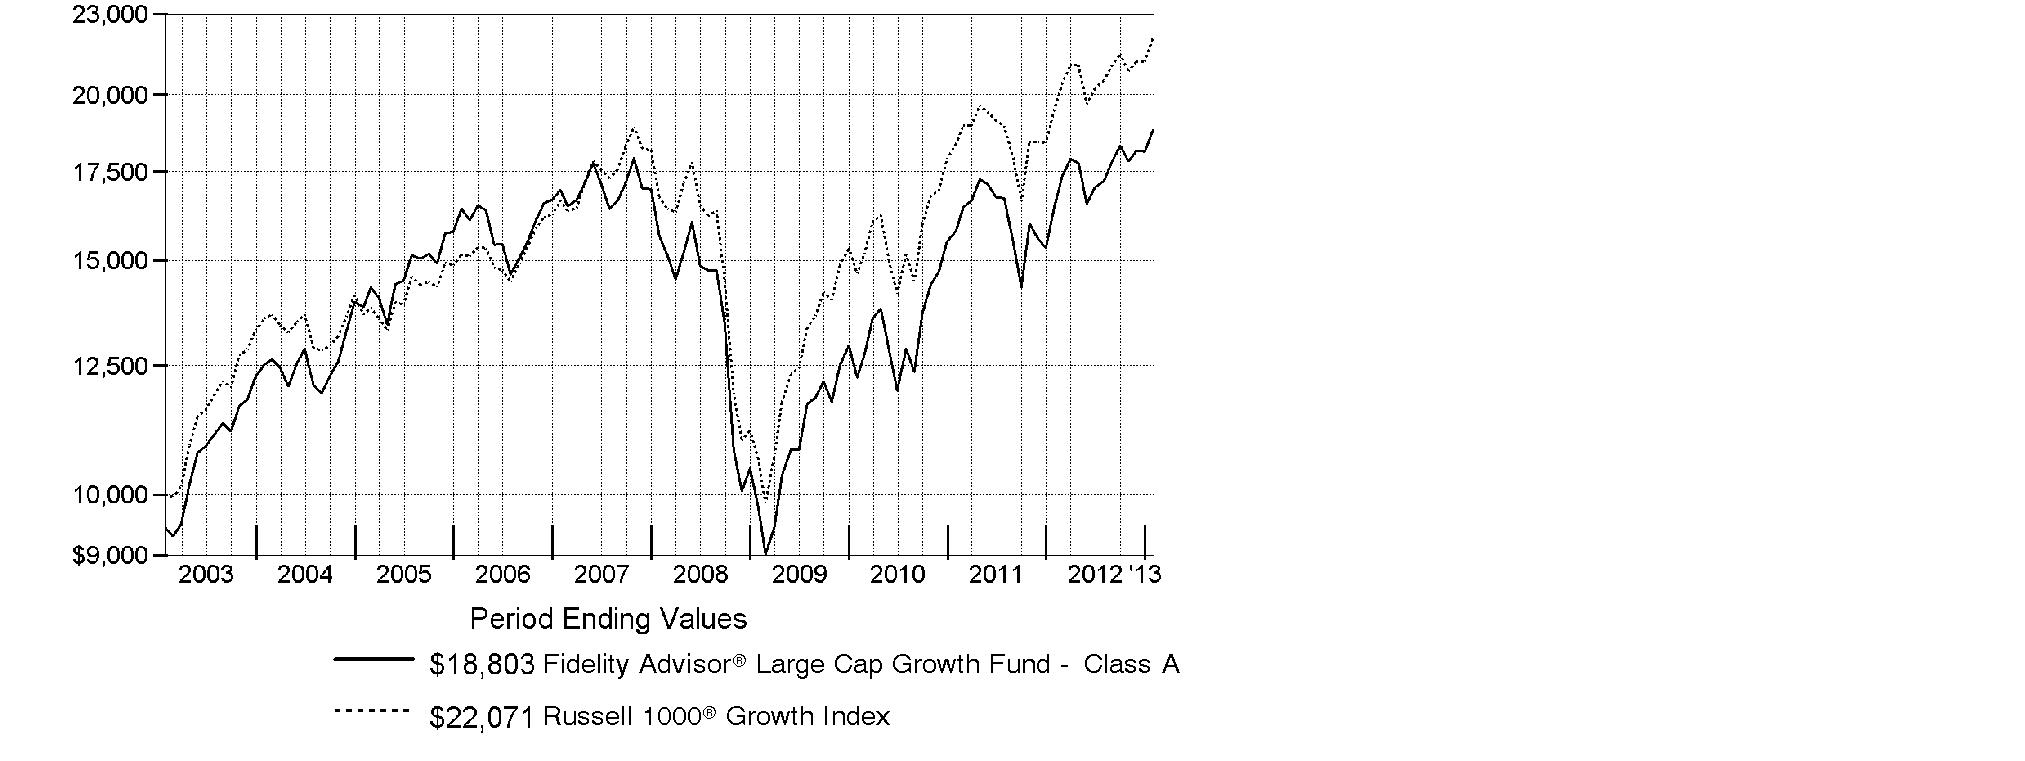
Annual Report
Market Recap: Improvement in the U.S. economy helped lift equity benchmarks to double-digit gains for the year ending January 31, 2013, overcoming moments of volatility driven by sovereign debt woes in Europe, slower economic growth in China and gridlock in Congress. Major U.S. benchmarks hit multiyear highs during the period, encouraged by a rebounding domestic housing market and solid corporate earnings reports. The broad-based S&P 500® Index rose 16.78% for the year, crossing the milestone 1,500 mark near period end. The technology-heavy Nasdaq Composite Index® added 13.13%, and the blue-chip-laden Dow Jones Industrial AverageSM gained 12.75%. Early in the period, stocks rose on positive U.S. economic news and proposed bailouts in Europe. Although fear resurfaced in April and May, equities rebounded in June on central bank stimulus and new life in the housing market. In September, pre-election jitters and the looming "fiscal cliff" of tax hikes and federal spending cuts fueled some profit-taking, followed by a brief post-election sell-off. But stocks proved resilient, as investors continued to pile into riskier assets. Gains were broad-based, with eight of the 10 sectors in the S&P 500® posting double-digit returns. Despite eurozone turmoil, foreign developed-markets stocks rose strongly, with the MSCI® EAFE® Index adding 17.41%.
Comments from Daniel Kelley, Portfolio Manager of Fidelity Advisor® Large Cap Growth Fund: For the year, the fund's Class A, Class T, Class B and Class C shares were up 14.52%, 14.30%, 13.71% and 13.80%, respectively (excluding sales charges), outperforming the 13.43% advance of the Russell 1000® Growth Index. Security selection helped relative performance the most, particularly in the consumer durables/apparel segment of consumer discretionary. There, companies benefiting from the U.S. housing recovery saw sharp share price gains. Top contributors included appliance manufacturer Whirlpool, which I bought in September. Within information technology, having essentially no exposure to semiconductor manufacturer and index component Intel gave a sizable boost, as slowing personal computer sales hurt revenues. An overweighting in hardware/equipment innovator Apple early on also helped. By contrast, stock picks in the technology hardware/equipment group and a small cash position detracted. Among individual disappointments was enterprise communication hardware/equipment company Polycom, whose stock fell due to a major restructuring of its sales department and concerns that it was losing market share. Elsewhere, the timing of my ownership of Green Mountain Coffee Roasters - maker of the Keurig® single-serve coffee system - hurt. Whirlpool was not in the index, and Green Mountain, Polycom and Intel were not in the portfolio at period end.
The views expressed above reflect those of the portfolio manager(s) only through the end of the period as stated on the cover of this report and do not necessarily represent the views of Fidelity or any other person in the Fidelity organization. Any such views are subject to change at any time based upon market or other conditions and Fidelity disclaims any responsibility to update such views. These views may not be relied on as investment advice and, because investment decisions for a Fidelity fund are based on numerous factors, may not be relied on as an indication of trading intent on behalf of any Fidelity fund.
Annual Report
Shareholder Expense Example
As a shareholder of the Fund, you incur two types of costs: (1) transaction costs, including sales charges (loads) on purchase payments or redemption proceeds, and (2) ongoing costs, including management fees, distribution and/or service (12b-1) fees and other Fund expenses. This Example is intended to help you understand your ongoing costs (in dollars) of investing in the Fund and to compare these costs with the ongoing costs of investing in other mutual funds.
The Example is based on an investment of $1,000 invested at the beginning of the period and held for the entire period (August 1, 2012 to January 31, 2013).
Actual Expenses
The first line of the accompanying table for each class of the Fund provides information about actual account values and actual expenses. You may use the information in this line, together with the amount you invested, to estimate the expenses that you paid over the period. Simply divide your account value by $1,000.00 (for example, an $8,600 account value divided by $1,000.00 = 8.6), then multiply the result by the number in the first line for a class of the Fund under the heading entitled "Expenses Paid During Period" to estimate the expenses you paid on your account during this period. A small balance maintenance fee of $12.00 that is charged once a year may apply for certain accounts with a value of less than $2,000. This fee is not included in the table below. If it was, the estimate of expenses you paid during the period would be higher, and your ending account value lower, by this amount. In addition, the Fund, as a shareholder in the underlying Fidelity Central Funds, will indirectly bear its pro-rata share of the fees and expenses incurred by the underlying Fidelity Central Funds. These fees and expenses are not included in the Fund's annualized expense ratio used to calculate the expense estimate in the table below.
Hypothetical Example for Comparison Purposes
The second line of the accompanying table for each class of the Fund provides information about hypothetical account values and hypothetical expenses based on a Class' actual expense ratio and an assumed rate of return of 5% per year before expenses, which is not the Class' actual return. The hypothetical account values and expenses may not be used to estimate the actual ending account balance or expenses you paid for the period. You may use this information to compare the ongoing costs of investing in the Fund and other funds. To do so, compare this 5% hypothetical example with the 5% hypothetical examples that appear in the shareholder reports of the other funds. A small balance maintenance fee of $12.00 that is charged once a year may apply for certain accounts with a value of less than $2,000. This fee is not included in the table below. If it was, the estimate of expenses you paid during the period would be higher, and your ending account value lower, by this amount. In addition, the Fund, as a shareholder in the underlying Fidelity Central Funds, will indirectly bear its pro-rata share of the fees and expenses incurred by the underlying Fidelity Central Funds. These fees and expenses are not included in the Fund's annualized expense ratio used to calculate the expense estimate in the table below.
Please note that the expenses shown in the table are meant to highlight your ongoing costs only and do not reflect any transaction costs. Therefore, the second line of the table is useful in comparing ongoing costs only, and will not help you determine the relative total costs of owning different funds. In addition, if these transactional costs were included, your costs would have been higher.
Annual Report
Shareholder Expense Example - continued
| Annualized
Expense Ratio | Beginning
Account Value
August 1, 2012 | Ending
Account Value
January 31, 2013 | Expenses Paid
During Period*
August 1, 2012
to January 31, 2013 |
Class A | 1.25% | | | |
Actual | | $ 1,000.00 | $ 1,092.90 | $ 6.58 |
Hypothetical A | | $ 1,000.00 | $ 1,018.85 | $ 6.34 |
Class T | 1.50% | | | |
Actual | | $ 1,000.00 | $ 1,092.40 | $ 7.89 |
Hypothetical A | | $ 1,000.00 | $ 1,017.60 | $ 7.61 |
Class B | 2.00% | | | |
Actual | | $ 1,000.00 | $ 1,089.20 | $ 10.50 |
Hypothetical A | | $ 1,000.00 | $ 1,015.08 | $ 10.13 |
Class C | 2.00% | | | |
Actual | | $ 1,000.00 | $ 1,089.70 | $ 10.51 |
Hypothetical A | | $ 1,000.00 | $ 1,015.08 | $ 10.13 |
Large Cap Growth | .94% | | | |
Actual | | $ 1,000.00 | $ 1,095.10 | $ 4.95 |
Hypothetical A | | $ 1,000.00 | $ 1,020.41 | $ 4.77 |
Institutional Class | .85% | | | |
Actual | | $ 1,000.00 | $ 1,095.10 | $ 4.48 |
Hypothetical A | | $ 1,000.00 | $ 1,020.86 | $ 4.32 |
A 5% return per year before expenses
* Expenses are equal to each Class' annualized expense ratio, multiplied by the average account value over the period, multiplied by 184/366 (to reflect the one-half year period).
Annual Report
Investment Changes (Unaudited)
Top Ten Stocks as of January 31, 2013 |
| % of fund's
net assets | % of fund's net assets
6 months ago |
Apple, Inc. | 5.7 | 9.1 |
Google, Inc. Class A | 3.4 | 2.9 |
Oracle Corp. | 2.5 | 2.2 |
Amazon.com, Inc. | 2.0 | 1.5 |
Gilead Sciences, Inc. | 1.9 | 1.2 |
Visa, Inc. Class A | 1.9 | 1.7 |
The Coca-Cola Co. | 1.9 | 1.8 |
Home Depot, Inc. | 1.9 | 1.7 |
QUALCOMM, Inc. | 1.8 | 1.8 |
Amgen, Inc. | 1.7 | 1.5 |
| 24.7 | |
Top Five Market Sectors as of January 31, 2013 |
| % of fund's
net assets | % of fund's net assets
6 months ago |
Information Technology | 29.9 | 32.1 |
Consumer Discretionary | 17.0 | 15.4 |
Health Care | 13.1 | 12.1 |
Industrials | 11.4 | 9.9 |
Consumer Staples | 10.6 | 11.8 |
Asset Allocation (% of fund's net assets) |
As of January 31, 2013* | As of July 31, 2012** |
| Stocks 98.1% | | | Stocks 96.2% | |
| Short-Term
Investments and
Net Other Assets (Liabilities) 1.9% | | | Short-Term
Investments and
Net Other Assets (Liabilities) 3.8% | |
* Foreign investments | 10.8% | | ** Foreign investments | 8.3% | |

Annual Report
Investments January 31, 2013
Showing Percentage of Net Assets
Common Stocks - 98.1% |
| Shares | | Value |
CONSUMER DISCRETIONARY - 17.0% |
Automobiles - 0.6% |
Ford Motor Co. | 12,750 | | $ 165,113 |
Harley-Davidson, Inc. | 15,300 | | 802,026 |
Tesla Motors, Inc. (a) | 2,500 | | 93,775 |
| | 1,060,914 |
Diversified Consumer Services - 0.2% |
Weight Watchers International, Inc. (d) | 7,100 | | 379,637 |
Hotels, Restaurants & Leisure - 2.0% |
Las Vegas Sands Corp. | 14,957 | | 826,374 |
McDonald's Corp. | 11,578 | | 1,103,268 |
Starbucks Corp. | 28,174 | | 1,581,125 |
| | 3,510,767 |
Household Durables - 1.9% |
D.R. Horton, Inc. | 30,200 | | 714,532 |
Toll Brothers, Inc. (a) | 35,809 | | 1,341,047 |
Whirlpool Corp. | 10,700 | | 1,234,566 |
| | 3,290,145 |
Internet & Catalog Retail - 2.8% |
Amazon.com, Inc. (a) | 12,847 | | 3,410,879 |
priceline.com, Inc. (a) | 2,160 | | 1,480,615 |
| | 4,891,494 |
Media - 2.0% |
Comcast Corp. Class A | 69,675 | | 2,653,224 |
Discovery Communications, Inc. (a) | 11,382 | | 789,683 |
| | 3,442,907 |
Specialty Retail - 4.6% |
American Eagle Outfitters, Inc. | 44,858 | | 906,580 |
Dick's Sporting Goods, Inc. | 19,000 | | 904,210 |
DSW, Inc. Class A | 6,693 | | 447,962 |
Home Depot, Inc. | 47,493 | | 3,178,232 |
Lowe's Companies, Inc. | 24,094 | | 920,150 |
Ross Stores, Inc. | 18,606 | | 1,110,778 |
Tractor Supply Co. | 3,589 | | 372,072 |
| | 7,839,984 |
Textiles, Apparel & Luxury Goods - 2.9% |
lululemon athletica, Inc. (a) | 13,661 | | 942,609 |
Michael Kors Holdings Ltd. (a) | 19,030 | | 1,068,154 |
Common Stocks - continued |
| Shares | | Value |
CONSUMER DISCRETIONARY - continued |
Textiles, Apparel & Luxury Goods - continued |
NIKE, Inc. Class B | 33,100 | | $ 1,789,055 |
PVH Corp. | 10,100 | | 1,200,587 |
| | 5,000,405 |
TOTAL CONSUMER DISCRETIONARY | | 29,416,253 |
CONSUMER STAPLES - 10.6% |
Beverages - 4.5% |
Beam, Inc. | 11,137 | | 683,144 |
Constellation Brands, Inc. Class A (sub. vtg.) (a) | 14,113 | | 456,697 |
Dr. Pepper Snapple Group, Inc. | 20,190 | | 909,963 |
Fomento Economico Mexicano S.A.B. de CV sponsored ADR | 7,200 | | 776,808 |
PepsiCo, Inc. | 16,673 | | 1,214,628 |
Remy Cointreau SA | 4,295 | | 548,126 |
The Coca-Cola Co. | 86,186 | | 3,209,567 |
| | 7,798,933 |
Food & Staples Retailing - 2.2% |
CVS Caremark Corp. | 39,444 | | 2,019,533 |
Wal-Mart Stores, Inc. | 25,256 | | 1,766,657 |
| | 3,786,190 |
Food Products - 0.6% |
Danone SA | 14,700 | | 1,018,741 |
Household Products - 1.1% |
Kimberly-Clark Corp. | 4,181 | | 374,241 |
Procter & Gamble Co. | 20,200 | | 1,518,232 |
| | 1,892,473 |
Tobacco - 2.2% |
Altria Group, Inc. | 50,664 | | 1,706,364 |
British American Tobacco PLC (United Kingdom) | 16,900 | | 878,320 |
Lorillard, Inc. | 30,099 | | 1,175,968 |
| | 3,760,652 |
TOTAL CONSUMER STAPLES | | 18,256,989 |
ENERGY - 5.0% |
Energy Equipment & Services - 2.7% |
Cameron International Corp. (a) | 12,070 | | 764,152 |
Ensco PLC Class A | 17,984 | | 1,143,243 |
Halliburton Co. | 19,100 | | 776,988 |
Common Stocks - continued |
| Shares | | Value |
ENERGY - continued |
Energy Equipment & Services - continued |
National Oilwell Varco, Inc. | 8,614 | | $ 638,642 |
Schlumberger Ltd. | 16,375 | | 1,278,069 |
| | 4,601,094 |
Oil, Gas & Consumable Fuels - 2.3% |
Canadian Natural Resources Ltd. | 14,800 | | 446,938 |
Noble Energy, Inc. | 6,048 | | 651,914 |
Pioneer Natural Resources Co. | 6,300 | | 740,502 |
Suncor Energy, Inc. | 21,300 | | 723,952 |
The Williams Companies, Inc. | 40,350 | | 1,414,268 |
| | 3,977,574 |
TOTAL ENERGY | | 8,578,668 |
FINANCIALS - 5.2% |
Capital Markets - 1.1% |
Charles Schwab Corp. | 53,642 | | 886,702 |
The Blackstone Group LP | 55,678 | | 1,030,043 |
| | 1,916,745 |
Commercial Banks - 0.6% |
M&T Bank Corp. | 2,573 | | 264,221 |
Wells Fargo & Co. | 23,551 | | 820,281 |
| | 1,084,502 |
Consumer Finance - 0.7% |
SLM Corp. | 72,031 | | 1,216,604 |
Diversified Financial Services - 1.0% |
BTG Pactual Participations Ltd. unit | 34,500 | | 593,379 |
Citigroup, Inc. | 26,736 | | 1,127,190 |
| | 1,720,569 |
Real Estate Investment Trusts - 1.2% |
American Tower Corp. | 21,200 | | 1,614,380 |
AvalonBay Communities, Inc. | 2,600 | | 337,454 |
| | 1,951,834 |
Real Estate Management & Development - 0.6% |
CBRE Group, Inc. (a) | 21,389 | | 461,575 |
Realogy Holdings Corp. | 13,930 | | 623,646 |
| | 1,085,221 |
TOTAL FINANCIALS | | 8,975,475 |
Common Stocks - continued |
| Shares | | Value |
HEALTH CARE - 13.1% |
Biotechnology - 5.6% |
Achillion Pharmaceuticals, Inc. (a) | 21,600 | | $ 193,968 |
ADVENTRX Pharmaceuticals, Inc. warrants 11/16/16 (a) | 39,587 | | 3,001 |
Alkermes PLC (a) | 6,900 | | 159,045 |
Amgen, Inc. | 33,800 | | 2,888,548 |
ARIAD Pharmaceuticals, Inc. (a) | 12,680 | | 252,078 |
Biogen Idec, Inc. (a) | 4,700 | | 733,576 |
BioMarin Pharmaceutical, Inc. (a) | 10,700 | | 587,323 |
Elan Corp. PLC sponsored ADR (a) | 44,802 | | 470,869 |
Gilead Sciences, Inc. (a) | 82,574 | | 3,257,544 |
Regeneron Pharmaceuticals, Inc. (a) | 3,350 | | 582,699 |
Theravance, Inc. (a) | 23,066 | | 513,219 |
| | 9,641,870 |
Health Care Equipment & Supplies - 1.6% |
Align Technology, Inc. (a) | 28,107 | | 881,436 |
Boston Scientific Corp. (a) | 47,505 | | 354,862 |
The Cooper Companies, Inc. | 15,150 | | 1,535,453 |
| | 2,771,751 |
Health Care Providers & Services - 2.4% |
Brookdale Senior Living, Inc. (a) | 42,660 | | 1,152,247 |
Catamaran Corp. (a) | 14,130 | | 733,206 |
Express Scripts Holding Co. (a) | 11,476 | | 613,048 |
Laboratory Corp. of America Holdings (a) | 10,221 | | 914,780 |
Qualicorp SA (a) | 35,300 | | 365,169 |
Team Health Holdings, Inc. (a) | 12,780 | | 432,859 |
| | 4,211,309 |
Pharmaceuticals - 3.5% |
AbbVie, Inc. | 43,550 | | 1,597,850 |
Actavis, Inc. (a) | 11,967 | | 1,033,829 |
Johnson & Johnson | 18,712 | | 1,383,191 |
Merck & Co., Inc. | 12,952 | | 560,174 |
Valeant Pharmaceuticals International, Inc. (Canada) (a) | 11,800 | | 782,486 |
Warner Chilcott PLC | 45,800 | | 648,986 |
Zoetis, Inc. Class A | 1,500 | | 39,000 |
| | 6,045,516 |
TOTAL HEALTH CARE | | 22,670,446 |
Common Stocks - continued |
| Shares | | Value |
INDUSTRIALS - 11.4% |
Aerospace & Defense - 2.2% |
Textron, Inc. | 34,650 | | $ 996,534 |
United Technologies Corp. | 32,686 | | 2,862,313 |
| | 3,858,847 |
Air Freight & Logistics - 1.3% |
United Parcel Service, Inc. Class B | 28,300 | | 2,243,907 |
Construction & Engineering - 0.7% |
Dycom Industries, Inc. (a) | 16,214 | | 340,170 |
Quanta Services, Inc. (a) | 28,660 | | 830,280 |
| | 1,170,450 |
Electrical Equipment - 1.2% |
Eaton Corp. PLC | 22,700 | | 1,292,765 |
Regal-Beloit Corp. | 10,500 | | 778,680 |
| | 2,071,445 |
Industrial Conglomerates - 0.5% |
Carlisle Companies, Inc. | 12,558 | | 805,596 |
Machinery - 3.2% |
Caterpillar, Inc. | 19,564 | | 1,924,902 |
Cummins, Inc. | 13,700 | | 1,573,171 |
Ingersoll-Rand PLC | 19,550 | | 1,004,675 |
Manitowoc Co., Inc. | 55,786 | | 981,834 |
| | 5,484,582 |
Professional Services - 0.5% |
Nielsen Holdings B.V. (a) | 16,634 | | 540,771 |
Towers Watson & Co. | 6,569 | | 401,235 |
| | 942,006 |
Road & Rail - 1.0% |
Union Pacific Corp. | 13,100 | | 1,722,126 |
Trading Companies & Distributors - 0.8% |
Watsco, Inc. | 6,965 | | 524,813 |
WESCO International, Inc. (a) | 11,545 | | 841,977 |
| | 1,366,790 |
TOTAL INDUSTRIALS | | 19,665,749 |
INFORMATION TECHNOLOGY - 29.9% |
Communications Equipment - 3.0% |
Juniper Networks, Inc. (a) | 28,352 | | 634,518 |
Common Stocks - continued |
| Shares | | Value |
INFORMATION TECHNOLOGY - continued |
Communications Equipment - continued |
Motorola Solutions, Inc. | 25,489 | | $ 1,488,303 |
QUALCOMM, Inc. | 46,200 | | 3,050,586 |
| | 5,173,407 |
Computers & Peripherals - 6.1% |
Apple, Inc. | 21,589 | | 9,829,682 |
EMC Corp. (a) | 31,400 | | 772,754 |
| | 10,602,436 |
Internet Software & Services - 5.0% |
eBay, Inc. (a) | 27,250 | | 1,524,093 |
Facebook, Inc. Class A | 42,631 | | 1,320,282 |
Google, Inc. Class A (a) | 7,744 | | 5,852,063 |
| | 8,696,438 |
IT Services - 5.9% |
Accenture PLC Class A | 24,910 | | 1,790,780 |
Cognizant Technology Solutions Corp. Class A (a) | 11,952 | | 934,407 |
IBM Corp. | 10,654 | | 2,163,508 |
MasterCard, Inc. Class A | 4,033 | | 2,090,707 |
Visa, Inc. Class A | 20,400 | | 3,221,364 |
| | 10,200,766 |
Semiconductors & Semiconductor Equipment - 2.7% |
Altera Corp. | 31,396 | | 1,049,254 |
ASML Holding NV (Netherlands) | 5,726 | | 429,537 |
Broadcom Corp. Class A | 38,510 | | 1,249,650 |
Samsung Electronics Co. Ltd. | 743 | | 988,836 |
Skyworks Solutions, Inc. (a) | 36,080 | | 863,755 |
| | 4,581,032 |
Software - 7.2% |
Check Point Software Technologies Ltd. (a) | 17,291 | | 864,550 |
Citrix Systems, Inc. (a) | 5,300 | | 387,748 |
Fortinet, Inc. (a) | 22,300 | | 526,057 |
Guidewire Software, Inc. | 29,104 | | 963,924 |
MICROS Systems, Inc. (a) | 8,100 | | 372,843 |
Microsoft Corp. | 71,884 | | 1,974,653 |
Nuance Communications, Inc. (a) | 24,401 | | 586,844 |
Oracle Corp. | 123,017 | | 4,368,334 |
salesforce.com, Inc. (a) | 11,950 | | 2,056,954 |
Common Stocks - continued |
| Shares | | Value |
INFORMATION TECHNOLOGY - continued |
Software - continued |
Splunk, Inc. | 4,700 | | $ 154,912 |
Workday, Inc. | 2,000 | | 106,840 |
| | 12,363,659 |
TOTAL INFORMATION TECHNOLOGY | | 51,617,738 |
MATERIALS - 5.6% |
Chemicals - 4.0% |
Albemarle Corp. | 13,600 | | 833,816 |
Ashland, Inc. | 11,628 | | 912,914 |
Axiall Corp. | 15,600 | | 876,408 |
Eastman Chemical Co. | 18,094 | | 1,287,388 |
LyondellBasell Industries NV Class A | 11,051 | | 700,854 |
Monsanto Co. | 23,223 | | 2,353,651 |
| | 6,965,031 |
Construction Materials - 1.1% |
Martin Marietta Materials, Inc. | 5,712 | | 563,946 |
Vulcan Materials Co. | 24,254 | | 1,371,806 |
| | 1,935,752 |
Metals & Mining - 0.5% |
Commercial Metals Co. | 48,547 | | 808,308 |
TOTAL MATERIALS | | 9,709,091 |
TELECOMMUNICATION SERVICES - 0.3% |
Wireless Telecommunication Services - 0.3% |
Vodafone Group PLC sponsored ADR | 22,500 | | 614,700 |
TOTAL COMMON STOCKS (Cost $150,354,503) |
169,505,109
|
Money Market Funds - 1.9% |
| Shares | | Value |
Fidelity Cash Central Fund, 0.16% (b) | 2,848,348 | | $ 2,848,348 |
Fidelity Securities Lending Cash Central Fund, 0.15% (b)(c) | 442,000 | | 442,000 |
TOTAL MONEY MARKET FUNDS (Cost $3,290,348) |
3,290,348
|
TOTAL INVESTMENT PORTFOLIO - 100.0% (Cost $153,644,851) | | 172,795,457 |
NET OTHER ASSETS (LIABILITIES) - 0.0% | | 55,305 |
NET ASSETS - 100% | $ 172,850,762 |
Legend |
(a) Non-income producing |
(b) Affiliated fund that is available only to investment companies and other accounts managed by Fidelity Investments. The rate quoted is the annualized seven-day yield of the fund at period end. A complete unaudited listing of the fund's holdings as of its most recent quarter end is available upon request. In addition, each Fidelity Central Fund's financial statements, which are not covered by the Fund's Report of Independent Registered Public Accounting Firm, are available on the SEC's website or upon request. |
(c) Investment made with cash collateral received from securities on loan. |
(d) Security or a portion of the security is on loan at period end. |
Affiliated Central Funds |
Information regarding fiscal year to date income earned by the Fund from investments in Fidelity Central Funds is as follows: |
Fund | Income earned |
Fidelity Cash Central Fund | $ 7,926 |
Fidelity Securities Lending Cash Central Fund | 25,843 |
Total | $ 33,769 |
Other Information |
The following is a summary of the inputs used, as of January 31, 2013, involving the Fund's assets and liabilities carried at fair value. The inputs or methodology used for valuing securities may not be an indication of the risk associated with investing in those securities. For more information on valuation inputs, and their aggregation into the levels used in the table below, please refer to the Investment Valuation section in the accompanying Notes to Financial Statements. |
Valuation Inputs at Reporting Date: |
Description | Total | Level 1 | Level 2 | Level 3 |
Investments in Securities: | | | | |
Equities: | | | | |
Consumer Discretionary | $ 29,416,253 | $ 29,416,253 | $ - | $ - |
Consumer Staples | 18,256,989 | 17,378,669 | 878,320 | - |
Energy | 8,578,668 | 8,578,668 | - | - |
Financials | 8,975,475 | 8,975,475 | - | - |
Health Care | 22,670,446 | 22,667,445 | 3,001 | - |
Industrials | 19,665,749 | 19,665,749 | - | - |
Information Technology | 51,617,738 | 51,188,201 | 429,537 | - |
Materials | 9,709,091 | 9,709,091 | - | - |
Telecommunication Services | 614,700 | 614,700 | - | - |
Money Market Funds | 3,290,348 | 3,290,348 | - | - |
Total Investments in Securities: | $ 172,795,457 | $ 171,484,599 | $ 1,310,858 | $ - |
Distribution of investments by country or territory of incorporation, as a percentage of total net assets, is as follows. (Unaudited) |
United States of America | 89.2% |
Ireland | 3.1% |
Canada | 1.6% |
United Kingdom | 1.5% |
Netherlands | 1.0% |
Others (Individually Less Than 1%) | 3.6% |
| 100.0% |
See accompanying notes which are an integral part of the financial statements.
Annual Report
Statement of Assets and Liabilities
| January 31, 2013 |
| | |
Assets | | |
Investment in securities, at value (including securities loaned of $427,760) - See accompanying schedule: Unaffiliated issuers (cost $150,354,503) | $ 169,505,109 | |
Fidelity Central Funds (cost $3,290,348) | 3,290,348 | |
Total Investments (cost $153,644,851) | | $ 172,795,457 |
Cash | | 58,812 |
Foreign currency held at value (cost $74,169) | | 74,169 |
Receivable for investments sold | | 6,274,616 |
Receivable for fund shares sold | | 158,211 |
Dividends receivable | | 57,007 |
Distributions receivable from Fidelity Central Funds | | 1,111 |
Prepaid expenses | | 403 |
Receivable from investment adviser for expense reductions | | 302 |
Other receivables | | 13,372 |
Total assets | | 179,433,460 |
| | |
Liabilities | | |
Payable for investments purchased | $ 5,860,703 | |
Payable for fund shares redeemed | 83,715 | |
Accrued management fee | 90,475 | |
Distribution and service plan fees payable | 13,151 | |
Other affiliated payables | 39,742 | |
Other payables and accrued expenses | 52,912 | |
Collateral on securities loaned, at value | 442,000 | |
Total liabilities | | 6,582,698 |
| | |
Net Assets | | $ 172,850,762 |
Net Assets consist of: | | |
Paid in capital | | $ 156,741,640 |
Accumulated net investment loss | | (43,376) |
Accumulated undistributed net realized gain (loss) on investments and foreign currency transactions | | (2,997,738) |
Net unrealized appreciation (depreciation) on investments and assets and liabilities in foreign currencies | | 19,150,236 |
Net Assets | | $ 172,850,762 |
See accompanying notes which are an integral part of the financial statements.
Annual Report
Statement of Assets and Liabilities - continued
| January 31, 2013 |
| | |
Calculation of Maximum Offering Price Class A:
Net Asset Value and redemption price per share ($13,900,199 ÷ 1,189,639 shares) | | $ 11.68 |
| | |
Maximum offering price per share (100/94.25 of $11.68) | | $ 12.39 |
Class T:
Net Asset Value and redemption price per share ($6,084,489 ÷ 525,586 shares) | | $ 11.58 |
| | |
Maximum offering price per share (100/96.50 of $11.58) | | $ 12.00 |
Class B:
Net Asset Value and offering price per share ($1,450,525 ÷ 127,633 shares)A | | $ 11.36 |
| | |
Class C:
Net Asset Value and offering price per share ($7,876,758 ÷ 697,322 shares)A | | $ 11.30 |
| | |
Large Cap Growth:
Net Asset Value, offering price and redemption price per share ($139,813,310 ÷ 11,821,014 shares) | | $ 11.83 |
| | |
Institutional Class:
Net Asset Value, offering price and redemption price per share ($3,725,481 ÷ 313,739 shares) | | $ 11.87 |
A Redemption price per share is equal to net asset value less any applicable contingent deferred sales charge.
See accompanying notes which are an integral part of the financial statements.
Annual Report
Financial Statements - continued
Statement of Operations
| Year ended January 31, 2013 |
| | |
Investment Income | | |
Dividends | | $ 2,555,088 |
Income from Fidelity Central Funds | | 33,769 |
Total income | | 2,588,857 |
| | |
Expenses | | |
Management fee
Basic fee | $ 939,896 | |
Performance adjustment | (46,376) | |
Transfer agent fees | 414,753 | |
Distribution and service plan fees | 151,448 | |
Accounting and security lending fees | 65,943 | |
Custodian fees and expenses | 41,809 | |
Independent trustees' compensation | 1,099 | |
Registration fees | 83,200 | |
Audit | 54,817 | |
Legal | 703 | |
Miscellaneous | 1,460 | |
Total expenses before reductions | 1,708,752 | |
Expense reductions | (28,326) | 1,680,426 |
Net investment income (loss) | | 908,431 |
Realized and Unrealized Gain (Loss) Net realized gain (loss) on: | | |
Investment securities: | | |
Unaffiliated issuers | 14,981,914 | |
Foreign currency transactions | (3,117) | |
Total net realized gain (loss) | | 14,978,797 |
Change in net unrealized appreciation (depreciation) on: Investment securities | 7,198,392 | |
Assets and liabilities in foreign currencies | (96) | |
Total change in net unrealized appreciation (depreciation) | | 7,198,296 |
Net gain (loss) | | 22,177,093 |
Net increase (decrease) in net assets resulting from operations | | $ 23,085,524 |
See accompanying notes which are an integral part of the financial statements.
Annual Report
Statement of Changes in Net Assets
| Year ended
January 31,
2013 | Year ended
January 31,
2012 |
Increase (Decrease) in Net Assets | | |
Operations | | |
Net investment income (loss) | $ 908,431 | $ (81,197) |
Net realized gain (loss) | 14,978,797 | 18,062,027 |
Change in net unrealized appreciation (depreciation) | 7,198,296 | (12,510,318) |
Net increase (decrease) in net assets resulting
from operations | 23,085,524 | 5,470,512 |
Distributions to shareholders from net investment income | (1,066,324) | - |
Share transactions - net increase (decrease) | (8,699,386) | 17,565,380 |
Total increase (decrease) in net assets | 13,319,814 | 23,035,892 |
| | |
Net Assets | | |
Beginning of period | 159,530,948 | 136,495,056 |
End of period (including accumulated net investment loss of $43,376 and accumulated net investment loss of $77,636, respectively) | $ 172,850,762 | $ 159,530,948 |
See accompanying notes which are an integral part of the financial statements.
Annual Report
Financial Highlights - Class A
Years ended January 31, | 2013 | 2012 | 2011 | 2010 | 2009 |
Selected Per-Share Data | | | | | |
Net asset value, beginning of period | $ 10.24 | $ 9.84 | $ 7.64 | $ 6.12 | $ 9.85 |
Income from Investment Operations | | | | | |
Net investment income (loss) C | .04 | (.03) | (.02) | .01 | .02 |
Net realized and unrealized gain (loss) | 1.45 | .43 | 2.22 | 1.53 | (3.71) |
Total from investment operations | 1.49 | .40 | 2.20 | 1.54 | (3.69) |
Distributions from net investment income | (.05) | - | - | (.02) | (.04) |
Net asset value, end of period | $ 11.68 | $ 10.24 | $ 9.84 | $ 7.64 | $ 6.12 |
Total Return A,B | 14.52% | 4.07% | 28.80% | 25.14% | (37.49)% |
Ratios to Average Net Assets D,F | | | | | |
Expenses before reductions | 1.23% | 1.17% | 1.12% | 1.07% | 1.01% |
Expenses net of fee waivers, if any | 1.23% | 1.17% | 1.12% | 1.07% | 1.01% |
Expenses net of all reductions | 1.21% | 1.16% | 1.12% | 1.06% | 1.01% |
Net investment income (loss) | .32% | (.26)% | (.28)% | .08% | .20% |
Supplemental Data | | | | | |
Net assets, end of period (000 omitted) | $ 13,900 | $ 12,727 | $ 6,669 | $ 3,805 | $ 2,159 |
Portfolio turnover rate E | 151% | 108% | 126% | 342% | 355% |
A Total returns would have been lower if certain expenses had not been reduced during the applicable periods shown.
B Total returns do not include the effect of the sales charges.
C Calculated based on average shares outstanding during the period.
D Fees and expenses of any underlying Fidelity Central Funds are not included in the Fund's expense ratio. The Fund indirectly bears its proportionate share of the expenses of any underlying Fidelity Central Funds.
E Amount does not include the portfolio activity of any underlying Fidelity Central Funds.
F Expense ratios reflect operating expenses of the class. Expenses before reductions do not reflect amounts reimbursed by the investment adviser or reductions from brokerage service arrangements or reductions from other expense offset arrangements and do not represent the amount paid by the class during periods when reimbursements or reductions occur. Expenses net of fee waivers reflect expenses after reimbursement by the investment adviser but prior to reductions from brokerage service arrangements or other expense offset arrangements. Expenses net of all reductions represent the net expenses paid by the class.
See accompanying notes which are an integral part of the financial statements.
Annual Report
Financial Highlights - Class T
Years ended January 31, | 2013 | 2012 | 2011 | 2010 | 2009 |
Selected Per-Share Data | | | | | |
Net asset value, beginning of period | $ 10.15 | $ 9.78 | $ 7.61 | $ 6.11 | $ 9.85 |
Income from Investment Operations | | | | | |
Net investment income (loss) C | .01 | (.05) | (.05) | (.02) | (.01) |
Net realized and unrealized gain (loss) | 1.44 | .42 | 2.22 | 1.52 | (3.70) |
Total from investment operations | 1.45 | .37 | 2.17 | 1.50 | (3.71) |
Distributions from net investment income | (.02) | - | - | - G | (.03) |
Net asset value, end of period | $ 11.58 | $ 10.15 | $ 9.78 | $ 7.61 | $ 6.11 |
Total Return A,B | 14.30% | 3.78% | 28.52% | 24.60% | (37.71)% |
Ratios to Average Net Assets D,F | | | | | |
Expenses before reductions | 1.52% | 1.44% | 1.42% | 1.38% | 1.31% |
Expenses net of fee waivers, if any | 1.50% | 1.44% | 1.42% | 1.38% | 1.31% |
Expenses net of all reductions | 1.48% | 1.44% | 1.42% | 1.36% | 1.31% |
Net investment income (loss) | .05% | (.53)% | (.58)% | (.23)% | (.10)% |
Supplemental Data | | | | | |
Net assets, end of period (000 omitted) | $ 6,084 | $ 5,876 | $ 2,900 | $ 1,548 | $ 820 |
Portfolio turnover rate E | 151% | 108% | 126% | 342% | 355% |
A Total returns would have been lower if certain expenses had not been reduced during the applicable periods shown.
B Total returns do not include the effect of the sales charges.
C Calculated based on average shares outstanding during the period.
D Fees and expenses of any underlying Fidelity Central Funds are not included in the Fund's expense ratio. The Fund indirectly bears its proportionate share of the expenses of any underlying Fidelity Central Funds.
E Amount does not include the portfolio activity of any underlying Fidelity Central Funds.
F Expense ratios reflect operating expenses of the class. Expenses before reductions do not reflect amounts reimbursed by the investment adviser or reductions from brokerage service arrangements or reductions from other expense offset arrangements and do not represent the amount paid by the class during periods when reimbursements or reductions occur. Expenses net of fee waivers reflect expenses after reimbursement by the investment adviser but prior to reductions from brokerage service arrangements or other expense offset arrangements. Expenses net of all reductions represent the net expenses paid by the class.
G Amount represents less than $.01 per share.
See accompanying notes which are an integral part of the financial statements.
Annual Report
Financial Highlights - Class B
Years ended January 31, | 2013 | 2012 | 2011 | 2010 | 2009 |
Selected Per-Share Data | | | | | |
Net asset value, beginning of period | $ 9.99 | $ 9.68 | $ 7.57 | $ 6.09 | $ 9.83 |
Income from Investment Operations | | | | | |
Net investment income (loss) C | (.05) | (.10) | (.09) | (.05) | (.05) |
Net realized and unrealized gain (loss) | 1.42 | .41 | 2.20 | 1.53 | (3.69) |
Total from investment operations | 1.37 | .31 | 2.11 | 1.48 | (3.74) |
Distributions from net investment income | - | - | - | - | - G |
Net asset value, end of period | $ 11.36 | $ 9.99 | $ 9.68 | $ 7.57 | $ 6.09 |
Total Return A,B | 13.71% | 3.20% | 27.87% | 24.30% | (38.01)% |
Ratios to Average Net Assets D,F | | | | | |
Expenses before reductions | 1.98% | 1.92% | 1.87% | 1.82% | 1.76% |
Expenses net of fee waivers, if any | 1.98% | 1.92% | 1.87% | 1.82% | 1.76% |
Expenses net of all reductions | 1.96% | 1.92% | 1.87% | 1.80% | 1.76% |
Net investment income (loss) | (.43)% | (1.01)% | (1.03)% | (.67)% | (.56)% |
Supplemental Data | | | | | |
Net assets, end of period (000 omitted) | $ 1,451 | $ 1,610 | $ 2,143 | $ 1,466 | $ 815 |
Portfolio turnover rate E | 151% | 108% | 126% | 342% | 355% |
A Total returns would have been lower if certain expenses had not been reduced during the applicable periods shown.
B Total returns do not include the effect of the contingent deferred sales charge.
C Calculated based on average shares outstanding during the period.
D Fees and expenses of any underlying Fidelity Central Funds are not included in the Fund's expense ratio. The Fund indirectly bears its proportionate share of the expenses of any underlying Fidelity Central Funds.
E Amount does not include the portfolio activity of any underlying Fidelity Central Funds.
F Expense ratios reflect operating expenses of the class. Expenses before reductions do not reflect amounts reimbursed by the investment adviser or reductions from brokerage service arrangements or reductions from other expense offset arrangements and do not represent the amount paid by the class during periods when reimbursements or reductions occur. Expenses net of fee waivers reflect expenses after reimbursement by the investment adviser but prior to reductions from brokerage service arrangements or other expense offset arrangements. Expenses net of all reductions represent the net expenses paid by the class.
G Amount represents less than $.01 per share.
See accompanying notes which are an integral part of the financial statements.
Annual Report
Financial Highlights - Class C
Years ended January 31, | 2013 | 2012 | 2011 | 2010 | 2009 |
Selected Per-Share Data | | | | | |
Net asset value, beginning of period | $ 9.93 | $ 9.62 | $ 7.52 | $ 6.06 | $ 9.82 |
Income from Investment Operations | | | | | |
Net investment income (loss) C | (.05) | (.10) | (.09) | (.05) | (.04) |
Net realized and unrealized gain (loss) | 1.42 | .41 | 2.19 | 1.51 | (3.69) |
Total from investment operations | 1.37 | .31 | 2.10 | 1.46 | (3.73) |
Distributions from net investment income | - | - | - | - | (.03) |
Net asset value, end of period | $ 11.30 | $ 9.93 | $ 9.62 | $ 7.52 | $ 6.06 |
Total Return A,B | 13.80% | 3.22% | 27.93% | 24.09% | (37.98)% |
Ratios to Average Net Assets D,F | | | | | |
Expenses before reductions | 1.98% | 1.92% | 1.87% | 1.82% | 1.77% |
Expenses net of fee waivers, if any | 1.98% | 1.92% | 1.87% | 1.82% | 1.77% |
Expenses net of all reductions | 1.96% | 1.91% | 1.87% | 1.80% | 1.77% |
Net investment income (loss) | (.43)% | (1.00)% | (1.03)% | (.67)% | (.57)% |
Supplemental Data | | | | | |
Net assets, end of period (000 omitted) | $ 7,877 | $ 6,061 | $ 3,623 | $ 1,917 | $ 1,441 |
Portfolio turnover rate E | 151% | 108% | 126% | 342% | 355% |
A Total returns would have been lower if certain expenses had not been reduced during the applicable periods shown.
B Total returns do not include the effect of the contingent deferred sales charge.
C Calculated based on average shares outstanding during the period.
D Fees and expenses of any underlying Fidelity Central Funds are not included in the Fund's expense ratio. The Fund indirectly bears its proportionate share of the expenses of any underlying Fidelity Central Funds.
E Amount does not include the portfolio activity of any underlying Fidelity Central Funds.
F Expense ratios reflect operating expenses of the class. Expenses before reductions do not reflect amounts reimbursed by the investment adviser or reductions from brokerage service arrangements or reductions from other expense offset arrangements and do not represent the amount paid by the class during periods when reimbursements or reductions occur. Expenses net of fee waivers reflect expenses after reimbursement by the investment adviser but prior to reductions from brokerage service arrangements or other expense offset arrangements. Expenses net of all reductions represent the net expenses paid by the class.
See accompanying notes which are an integral part of the financial statements.
Annual Report
Financial Highlights - Large Cap Growth
Years ended January 31, | 2013 | 2012 | 2011 | 2010 | 2009 |
Selected Per-Share Data | | | | | |
Net asset value, beginning of period | $ 10.36 | $ 9.93 | $ 7.69 | $ 6.15 | $ 9.89 |
Income from Investment Operations | | | | | |
Net investment income (loss) B | .07 | - F | - F | .02 | .04 |
Net realized and unrealized gain (loss) | 1.48 | .43 | 2.24 | 1.55 | (3.73) |
Total from investment operations | 1.55 | .43 | 2.24 | 1.57 | (3.69) |
Distributions from net investment income | (.08) | - | - | (.03) | (.05) |
Net asset value, end of period | $ 11.83 | $ 10.36 | $ 9.93 | $ 7.69 | $ 6.15 |
Total Return A | 15.00% | 4.33% | 29.13% | 25.50% | (37.36)% |
Ratios to Average Net Assets C,E | | | | | |
Expenses before reductions | .91% | .88% | .87% | .81% | .75% |
Expenses net of fee waivers, if any | .91% | .88% | .87% | .81% | .74% |
Expenses net of all reductions | .90% | .87% | .86% | .80% | .74% |
Net investment income (loss) | .64% | .04% | (.02)% | .34% | .47% |
Supplemental Data | | | | | |
Net assets, end of period (000 omitted) | $ 139,813 | $ 132,123 | $ 120,671 | $ 96,661 | $ 85,332 |
Portfolio turnover rate D | 151% | 108% | 126% | 342% | 355% |
A Total returns would have been lower if certain expenses had not been reduced during the applicable periods shown.
B Calculated based on average shares outstanding during the period.
C Fees and expenses of any underlying Fidelity Central Funds are not included in the Fund's expense ratio. The Fund indirectly bears its proportionate share of the expenses of any underlying Fidelity Central Funds.
D Amount does not include the portfolio activity of any underlying Fidelity Central Funds.
E Expense ratios reflect operating expenses of the class. Expenses before reductions do not reflect amounts reimbursed by the investment adviser or reductions from brokerage service arrangements or reductions from other expense offset arrangements and do not represent the amount paid by the class during periods when reimbursements or reductions occur. Expenses net of fee waivers reflect expenses after reimbursement by the investment adviser but prior to reductions from brokerage service arrangements or other expense offset arrangements. Expenses net of all reductions represent the net expenses paid by the class.
F Amount represents less than $.01 per share.
See accompanying notes which are an integral part of the financial statements.
Annual Report
Financial Highlights - Institutional Class
Years ended January 31, | 2013 | 2012 | 2011 | 2010 | 2009 |
Selected Per-Share Data | | | | | |
Net asset value, beginning of period | $ 10.41 | $ 9.97 | $ 7.72 | $ 6.18 | $ 9.88 |
Income from Investment Operations | | | | | |
Net investment income (loss) B | .08 | .01 | - F | .03 | .04 |
Net realized and unrealized gain (loss) | 1.47 | .43 | 2.25 | 1.54 | (3.72) |
Total from investment operations | 1.55 | .44 | 2.25 | 1.57 | (3.68) |
Distributions from net investment income | (.09) | - | - | (.03) | (.02) |
Net asset value, end of period | $ 11.87 | $ 10.41 | $ 9.97 | $ 7.72 | $ 6.18 |
Total Return A | 14.98% | 4.41% | 29.15% | 25.42% | (37.29)% |
Ratios to Average Net Assets C,E | | | | | |
Expenses before reductions | .83% | .83% | .86% | .76% | .68% |
Expenses net of fee waivers, if any | .83% | .83% | .86% | .76% | .68% |
Expenses net of all reductions | .82% | .82% | .86% | .74% | .68% |
Net investment income (loss) | .72% | .08% | (.02)% | .39% | .52% |
Supplemental Data | | | | | |
Net assets, end of period (000 omitted) | $ 3,725 | $ 1,134 | $ 488 | $ 111 | $ 277 |
Portfolio turnover rate D | 151% | 108% | 126% | 342% | 355% |
A Total returns would have been lower if certain expenses had not been reduced during the applicable periods shown.
B Calculated based on average shares outstanding during the period.
C Fees and expenses of any underlying Fidelity Central Funds are not included in the Fund's expense ratio. The Fund indirectly bears its proportionate share of the expenses of any underlying Fidelity Central Funds.
D Amount does not include the portfolio activity of any underlying Fidelity Central Funds.
E Expense ratios reflect operating expenses of the class. Expenses before reductions do not reflect amounts reimbursed by the investment adviser or reductions from brokerage service arrangements or reductions from other expense offset arrangements and do not represent the amount paid by the class during periods when reimbursements or reductions occur. Expenses net of fee waivers reflect expenses after reimbursement by the investment adviser but prior to reductions from brokerage service arrangements or other expense offset arrangements. Expenses net of all reductions represent the net expenses paid by the class.
F Amount represents less than $.01 per share.
See accompanying notes which are an integral part of the financial statements.
Annual Report
Notes to Financial Statements
For the period ended January 31, 2013
1. Organization.
Fidelity Large Cap Growth Fund (the Fund) is a fund of Fidelity Devonshire Trust (the Trust) and is authorized to issue an unlimited number of shares. The Trust is registered under the Investment Company Act of 1940, as amended (the 1940 Act), as an open-end management investment company organized as a Massachusetts business trust. The Fund offers Class A, Class T, Class C, Large Cap Growth, and Institutional Class shares, each of which, along with Class B shares, has equal rights as to assets and voting privileges. Class B shares are closed to new accounts and additional purchases, except for exchanges and reinvestments. Effective after the close of business on December 14, 2012, the Fund's other share classes were closed to new accounts with certain exceptions. Each class has exclusive voting rights with respect to matters that affect that class. Class B shares will automatically convert to Class A shares after a holding period of seven years from the initial date of purchase. Investment income, realized and unrealized capital gains and losses, the common expenses of the Fund, and certain fund-level expense reductions, if any, are allocated on a pro-rata basis to each class based on the relative net assets of each class to the total net assets of the Fund. Each class differs with respect to transfer agent and distribution and service plan fees incurred. Certain expense reductions may also differ by class.
2. Investments in Fidelity Central Funds.
The Fund invests in Fidelity Central Funds, which are open-end investment companies available only to other investment companies and accounts managed by Fidelity Management & Research Company (FMR) and its affiliates. The Fund's Schedule of Investments lists each of the Fidelity Central Funds held as of period end, if any, as an investment of the Fund, but does not include the underlying holdings of each Fidelity Central Fund. As an Investing Fund, the Fund indirectly bears its proportionate share of the expenses of the underlying Fidelity Central Funds.
The Money Market Central Funds seek preservation of capital and current income and are managed by Fidelity Investments Money Management, Inc. (FIMM), an affiliate of FMR.
A complete unaudited list of holdings for each Fidelity Central Fund is available upon request or at the Securities and Exchange Commission (the SEC) website at www.sec.gov. In addition, the financial statements of the Fidelity Central Funds, which are not covered by the Fund's Report of Independent Registered Public Accounting Firm, are available on the SEC website or upon request.
3. Significant Accounting Policies.
The financial statements have been prepared in conformity with accounting principles generally accepted in the United States of America (GAAP), which require management
Annual Report
3. Significant Accounting Policies - continued
to make certain estimates and assumptions at the date of the financial statements. Actual results could differ from those estimates. Subsequent events, if any, through the date that the financial statements were issued have been evaluated in the preparation of the financial statements. The following summarizes the significant accounting policies of the Fund:
Investment Valuation. Investments are valued as of 4:00 p.m. Eastern time on the last calendar day of the period. In accordance with valuation policies and procedures approved by the Board of Trustees (the Board), the Fund attempts to obtain prices from one or more third party pricing vendors or brokers to value its investments. When current market prices, quotations or currency exchange rates are not readily available or reliable, investments will be fair valued in good faith by the FMR Fair Value Committee (the Committee), in accordance with procedures adopted by the Fund's Board. Factors used in determining fair value vary by investment type and may include market or investment specific events, changes in interest rates and credit quality. The frequency with which these procedures are used cannot be predicted and they may be utilized to a significant extent. The Committee oversees the Fund's valuation policies and procedures and is responsible for approving and reporting to the Board all fair value determinations.
The Fund categorizes the inputs to valuation techniques used to value its investments into a disclosure hierarchy consisting of three levels as shown below:
Level 1 - quoted prices in active markets for identical investments
Level 2 - other significant observable inputs (including quoted prices for similar investments, interest rates, prepayment speeds, etc.)
Level 3 - unobservable inputs (including the Fund's own assumptions based on the best information available)
Valuation techniques used to value the Fund's investments by major category are as follows:
Equity securities, including restricted securities, for which market quotations are readily available, are valued at the last reported sale price or official closing price as reported by a third party pricing vendor on the primary market or exchange on which they are traded and are categorized as Level 1 in the hierarchy. In the event there were no sales during the day or closing prices are not available, securities are valued at the last quoted bid price or may be valued using the last available price and are generally categorized as Level 2 in the hierarchy. For foreign equity securities, when significant market or security specific events arise, comparisons to the valuation of American Depositary Receipts (ADRs), futures contracts, Exchange-Traded Funds (ETFs) and certain indexes as well
Annual Report
Notes to Financial Statements - continued
3. Significant Accounting Policies - continued
Investment Valuation - continued
as quoted prices for similar securities are used and are categorized as Level 2 in the hierarchy. Utilizing these techniques may result in transfers between Level 1 and Level 2.
Investments in open-end mutual funds, including the Fidelity Central Funds, are valued at their closing net asset value (NAV) each business day and are categorized as Level 1 in the hierarchy.
Changes in valuation techniques may result in transfers in or out of an assigned level within the disclosure hierarchy. The aggregate value of investments by input level, as of January 31, 2013, is included at the end of the Fund's Schedule of Investments.
Foreign Currency. The Fund may use foreign currency contracts to facilitate transactions in foreign-denominated securities. Gains and losses from these transactions may arise from changes in the value of the foreign currency or if the counterparties do not perform under the contracts' terms.
Foreign-denominated assets, including investment securities, and liabilities are translated into U.S. dollars at the exchange rates at period end. Purchases and sales of investment securities, income and dividends received and expenses denominated in foreign currencies are translated into U.S. dollars at the exchange rate in effect on the transaction date.
The effects of exchange rate fluctuations on investments are included with the net realized and unrealized gain (loss) on investment securities. Other foreign currency transactions resulting in realized and unrealized gain (loss) are disclosed separately.
Investment Transactions and Income. For financial reporting purposes, the Fund's investment holdings and NAV include trades executed through the end of the last business day of the period. The NAV per share for processing shareholder transactions is calculated as of the close of business of the New York Stock Exchange (NYSE), normally 4:00 p.m. Eastern time and includes trades executed through the end of the prior business day. Gains and losses on securities sold are determined on the basis of identified cost and may include proceeds received from litigation. Dividend income is recorded on the ex-dividend date, except for certain dividends from foreign securities where the ex-dividend date may have passed, which are recorded as soon as the Fund is informed of the ex-dividend date. Non-cash dividends included in dividend income, if any, are recorded at the fair market value of the securities received. Distributions received on securities that represent a return of capital or capital gain are recorded as a reduction of cost of investments and/or as a realized gain. The Fund estimates the components of distributions received that may be considered return of capital distributions or capital gain distributions. Interest income and distributions from the Fidelity Central Funds are
Annual Report
3. Significant Accounting Policies - continued
Investment Transactions and Income - continued
accrued as earned. Investment income is recorded net of foreign taxes withheld where recovery of such taxes is uncertain.
Expenses. Expenses directly attributable to a fund are charged to that fund. Expenses attributable to more than one fund are allocated among the respective funds on the basis of relative net assets or other appropriate methods. Expense estimates are accrued in the period to which they relate and adjustments are made when actual amounts are known.
Income Tax Information and Distributions to Shareholders. Each year, the Fund intends to qualify as a regulated investment company under Subchapter M of the Internal Revenue Code, including distributing substantially all of its taxable income and realized gains. As a result, no provision for income taxes is required. As of January 31, 2013, the Fund did not have any unrecognized tax benefits in the financial statements; nor is the und aware of any tax positions for which it is reasonably possible that the total amounts of unrecognized tax benefits will significantly change in the next twelve months. The Fund files a U.S. federal tax return, in addition to state and local tax returns as required. A fund's federal income tax returns are subject to examination by the Internal Revenue Service (IRS) for a period of three fiscal years after they are filed. State and local tax returns may be subject to examination for an additional fiscal year depending on the jurisdiction. Foreign taxes are provided for based on the Fund's understanding of the tax rules and rates that exist in the foreign markets in which it invests.
Distributions are declared and recorded on the ex-dividend date. Income dividends and capital gain distributions are declared separately for each class. Income and capital gain distributions are determined in accordance with income tax regulations, which may differ from GAAP.
Capital accounts within the financial statements are adjusted for permanent book-tax differences. These adjustments have no impact on net assets or the results of operations. Temporary book-tax differences will reverse in a subsequent period.
Book-tax differences are primarily due to foreign currency transactions, capital loss carryforwards, partnerships and losses deferred due to wash sales and excise tax regulations.
Annual Report
Notes to Financial Statements - continued
3. Significant Accounting Policies - continued
Income Tax Information and Distributions to Shareholders - continued
The federal tax cost of investment securities and unrealized appreciation (depreciation) as of period end were as follows:
Gross unrealized appreciation | $ 20,880,542 |
Gross unrealized depreciation | (1,962,681) |
Net unrealized appreciation (depreciation) on securities and other investments | $ 18,917,861 |
| |
Tax Cost | $ 153,877,596 |
The tax-based components of distributable earnings as of period end were as follows:
Capital loss carryforward | $ (2,764,993) |
Net unrealized appreciation (depreciation) | $ 18,917,491 |
Capital loss carryforwards are only available to offset future capital gains of the Fund to the extent provided by regulations and may be limited. Under the Regulated Investment Company Modernization Act of 2010 (the Act), the Fund is permitted to carry forward capital losses incurred in taxable years beginning after December 22, 2010 for an unlimited period and such capital losses are required to be used prior to any losses that expire. Capital loss carryforwards were as follows:
Fiscal year of expiration |
2018 | $ (2,764,993) |
The tax character of distributions paid was as follows:
| January 31, 2013 | January 31, 2012 |
Ordinary Income | $ 1,066,324 | $ - |
4. Purchases and Sales of Investments.
Purchases and sales of securities, other than short-term securities, aggregated $246,994,013 and $256,698,436, respectively.
5. Fees and Other Transactions with Affiliates.
Management Fee. FMR and its affiliates provide the Fund with investment management related services for which the Fund pays a monthly management fee. The management fee is the sum of an individual fund fee rate that is based on an annual rate of .30% of the Fund's average net assets and an annualized group fee rate that averaged .26% during the period. The group fee rate is based upon the average net assets of all the
Annual Report
5. Fees and Other Transactions with Affiliates - continued
Management Fee - continued
mutual funds advised by FMR. The group fee rate decreases as assets under management increase and increases as assets under management decrease. In addition, the management fee is subject to a performance adjustment (up to a maximum of ± .20% of the Fund's average net assets over a 36 month performance period). The upward or downward adjustment to the management fee is based on the relative investment performance of Large Cap Growth as compared to an appropriate benchmark index. For the period, the total annual management fee rate, including the performance adjustment, was .53% of the Fund's average net assets.
Distribution and Service Plan Fees. In accordance with Rule 12b-1 of the 1940 Act, the Fund has adopted separate Distribution and Service Plans for each class of shares. Certain classes pay Fidelity Distributors Corporation (FDC), an affiliate of FMR, separate Distribution and Service Fees, each of which is based on an annual percentage of each class' average net assets. In addition, FDC may pay financial intermediaries for selling shares of the Fund and providing shareholder support services. For the period, the Distribution and Service Fee rates, total fees and amounts retained by FDC were as follows:
| Distribution
Fee | Service
Fee | Total Fees | Retained
by FDC |
Class A | -% | .25% | $ 34,262 | $ 2,314 |
Class T | .25% | .25% | 29,474 | 260 |
Class B | .75% | .25% | 15,344 | 11,529 |
Class C | .75% | .25% | 72,368 | 24,814 |
| | | $ 151,448 | $ 38,917 |
Sales Load. FDC may receive a front-end sales charge of up to 5.75% for selling Class A shares and 3.50% for selling Class T shares, some of which is paid to financial intermediaries for selling shares of the Fund. Depending on the holding period, FDC may receive contingent deferred sales charges levied on Class A, Class T, Class B, and Class C redemptions. The deferred sales charges range from 5.00% to 1.00% for Class B shares, 1.00% for Class C shares, 1.00% for certain purchases of Class A shares and .25% for certain purchases of Class T shares.
For the period, sales charge amounts retained by FDC were as follows:
| Retained
by FDC |
Class A | $ 10,526 |
Class T | 4,857 |
Class B* | 4,014 |
Class C* | 2,807 |
| $ 22,204 |
* When Class B and Class C shares are initially sold, FDC pays commissions from its own resources to financial intermediaries through which the sales are made.
Annual Report
Notes to Financial Statements - continued
5. Fees and Other Transactions with Affiliates - continued
Transfer Agent Fees. Fidelity Investments Institutional Operations Company, Inc. (FIIOC), an affiliate of FMR, is the transfer, dividend disbursing and shareholder servicing agent for each class of the Fund. FIIOC receives account fees and asset-based fees that vary according to the account size and type of account of the shareholders of the respective classes of the Fund. FIIOC pays for typesetting, printing and mailing of shareholder reports, except proxy statements. For the period, transfer agent fees for each class were as follows:
| Amount | % of
Average
Net Assets |
Class A | $ 41,337 | .30 |
Class T | 19,984 | .34 |
Class B | 4,613 | .30 |
Class C | 21,949 | .30 |
Large Cap Growth | 323,204 | .23 |
Institutional Class | 3,666 | .16 |
| $ 414,753 | |
Accounting and Security Lending Fees. Fidelity Service Company, Inc. (FSC), an affiliate of FMR, maintains the Fund's accounting records. The accounting fee is based on the level of average net assets for each month. Under a separate contract, FSC administers the security lending program. The security lending fee is based on the number and duration of lending transactions.
Brokerage Commissions. The Fund placed a portion of its portfolio transactions with brokerage firms which are affiliates of the investment adviser. The commissions paid to these affiliated firms were $6,094 for the period.
6. Committed Line of Credit.
The Fund participates with other funds managed by FMR or an affiliate in a $4.25 billion credit facility (the "line of credit") to be utilized for temporary or emergency purposes to fund shareholder redemptions or for other short-term liquidity purposes. The Fund has agreed to pay commitment fees on its pro-rata portion of the line of credit, which amounted to $442 and is reflected in Miscellaneous expenses on the Statement of Operations. During the period, there were no borrowings on this line of credit.
7. Security Lending.
The Fund lends portfolio securities through a lending agent from time to time in order to earn additional income. For equity securities, a lending agent is used and may loan securities to certain qualified borrowers, including Fidelity Capital Markets (FCM), a
Annual Report
7. Security Lending - continued
broker-dealer affiliated with the Fund. On the settlement date of the loan, the Fund receives collateral (in the form of U.S. Treasury obligations, letters of credit and/or cash) against the loaned securities and maintains collateral in an amount not less than 100% of the market value of the loaned securities during the period of the loan. The market value of the loaned securities is determined at the close of business of the Fund and any additional required collateral is delivered to the Fund on the next business day. If the borrower defaults on its obligation to return the securities loaned because of insolvency or other reasons, a fund could experience delays and costs in recovering the securities loaned or in gaining access to the collateral. Any cash collateral received is invested in the Fidelity Securities Lending Cash Central Fund. The value of loaned securities and cash collateral at period end are disclosed on the Fund's Statement of Assets and Liabilities. Security lending income represents the income earned on investing cash collateral, less rebates paid to borrowers and any lending agent fees associated with the loan, plus any premium payments received for lending certain types of securities. Security lending income is presented in the Statement of Operations as a component of income from Fidelity Central Funds. Total security lending income during the period amounted to $25,843. During the period, there were no securities loaned to FCM.
8. Expense Reductions.
The following classes were in reimbursement during the period:
| Expense
Limitations | Reimbursement |
Class T | 1.50% | $ 970 |
Many of the brokers with whom FMR places trades on behalf of the Fund provided services to the Fund in addition to trade execution. These services included payments of certain expenses on behalf of the Fund totaling $27,351 for the period.
In addition, through arrangements with the Fund's custodian, credits realized as a result of uninvested cash balances were used to reduce the Fund's expenses. During the period, these credits reduced the Fund's custody expenses by $5.
Annual Report
Notes to Financial Statements - continued
9. Distributions to Shareholders.
Distributions to shareholders of each class were as follows:
Years ended January 31, | 2013 |
From net investment income | |
Class A | $ 53,334 |
Class T | 10,579 |
Large Cap Growth | 973,019 |
Institutional Class | 29,392 |
Total | $ 1,066,324 |
10. Share Transactions.
Transactions for each class of shares were as follows:
| Shares | Dollars |
Years ended January 31, | 2013 | 2012 | 2013 | 2012 |
Class A | | | | |
Shares sold | 433,337 | 943,999 | $ 4,740,889 | $ 9,391,213 |
Reinvestment of distributions | 4,558 | - | 50,641 | - |
Shares redeemed | (491,229) | (378,889) | (5,447,040) | (3,682,555) |
Net increase (decrease) | (53,334) | 565,110 | $ (655,510) | $ 5,708,658 |
Class T | | | | |
Shares sold | 167,129 | 899,142 | $ 1,821,552 | $ 9,125,430 |
Reinvestment of distributions | 933 | - | 10,269 | - |
Shares redeemed | (221,388) | (616,824) | (2,417,742) | (6,053,114) |
Net increase (decrease) | (53,326) | 282,318 | $ (585,921) | $ 3,072,316 |
Class B | | | | |
Shares sold | 6,137 | 19,634 | $ 65,205 | $ 195,465 |
Reinvestment of distributions | - | - | - | - |
Shares redeemed | (39,593) | (80,066) | (425,001) | (776,888) |
Net increase (decrease) | (33,456) | (60,432) | $ (359,796) | $ (581,423) |
Class C | | | | |
Shares sold | 295,397 | 689,847 | $ 3,136,691 | $ 6,821,638 |
Reinvestment of distributions | - | - | - | - |
Shares redeemed | (208,272) | (456,431) | (2,198,388) | (4,462,829) |
Net increase (decrease) | 87,125 | 233,416 | $ 938,303 | $ 2,358,809 |
Large Cap Growth | | | | |
Shares sold | 3,639,058 | 6,389,996 | $ 40,657,344 | $ 64,463,259 |
Reinvestment of distributions | 85,063 | - | 956,110 | - |
Shares redeemed | (4,652,017) | (5,795,048) | (51,937,735) | (58,191,405) |
Net increase (decrease) | (927,896) | 594,948 | $ (10,324,281) | $ 6,271,854 |
Annual Report
10. Share Transactions - continued
| Shares | Dollars |
Years ended January 31, | 2013 | 2012 | 2013 | 2012 |
Institutional Class | | | | |
Shares sold | 242,405 | 185,823 | $ 2,707,389 | $ 1,915,796 |
Reinvestment of distributions | 2,336 | - | 26,346 | - |
Shares redeemed | (39,986) | (125,753) | (445,916) | (1,180,630) |
Net increase (decrease) | 204,755 | 60,070 | $ 2,287,819 | $ 735,166 |
11. Proposed Reorganization.
The Board of Trustees of the Fund approved an Agreement and Plan of Reorganization (the Agreement) between the Fund and Fidelity Stock Selector All Cap Fund. The Agreement provides for the transfer of all the assets and the assumption of all the liabilities of the Fund in exchange for corresponding shares of Fidelity Stock Selector All Cap Fund equal in value to the net assets of the Fund on the day the reorganization is effective.
A meeting of shareholders of the Fund is expected to be held during the second quarter of 2013. If approved by shareholders, the reorganization is expected to become effective on or about June 21, 2013. The reorganization is expected to qualify as a tax-free transaction with no gain or loss recognized by the funds or their shareholders.
12. Other.
The Fund's organizational documents provide former and current trustees and officers with a limited indemnification against liabilities arising in connection with the performance of their duties to the Fund. In the normal course of business, the Fund may also enter into contracts that provide general indemnifications. The Fund's maximum exposure under these arrangements is unknown as this would be dependent on future claims that may be made against the Fund. The risk of material loss from such claims is considered remote.
Annual Report
To the Trustees of Fidelity Devonshire Trust and the Shareholders of Fidelity Large Cap Growth Fund:
In our opinion, the accompanying statement of assets and liabilities, including the schedule of investments, and the related statements of operations and of changes in net assets and the financial highlights present fairly, in all material respects, the financial position of Fidelity Large Cap Growth Fund (a fund of Fidelity Devonshire Trust) at January 31, 2013, the results of its operations for the year then ended, the changes in its net assets for each of the two years in the period then ended and the financial highlights for each of the five years in the period then ended, in conformity with accounting principles generally accepted in the United States of America. These financial statements and financial highlights (hereafter referred to as "financial statements") are the responsibility of the Fidelity Large Cap Growth Fund's management. Our responsibility is to express an opinion on these financial statements based on our audits. We conducted our audits of these financial statements in accordance with the standards of the Public Company Accounting Oversight Board (United States). Those standards require that we plan and perform the audit to obtain reasonable assurance about whether the financial statements are free of material misstatement. An audit includes examining, on a test basis, evidence supporting the amounts and disclosures in the financial statements, assessing the accounting principles used and significant estimates made by management, and evaluating the overall financial statement presentation. We believe that our audits, which included confirmation of securities at January 31, 2013 by correspondence with the custodian and brokers, provide a reasonable basis for our opinion.
PricewaterhouseCoopers LLP
Boston, Massachusetts
March 15, 2013
Annual Report
The Trustees, Members of the Advisory Board, and executive officers of the trust and fund, as applicable, are listed below. The Board of Trustees governs the fund and is responsible for protecting the interests of shareholders. The Trustees are experienced executives who meet periodically throughout the year to oversee the fund's activities, review contractual arrangements with companies that provide services to the fund, oversee management of the risks associated with such activities and contractual arrangements, and review the fund's performance. Except for James C. Curvey, each of the Trustees oversees 234 Fidelity funds. Mr. Curvey oversees 453 Fidelity funds.
The Trustees hold office without limit in time except that (a) any Trustee may resign; (b) any Trustee may be removed by written instrument, signed by at least two-thirds of the number of Trustees prior to such removal; (c) any Trustee who requests to be retired or who has become incapacitated by illness or injury may be retired by written instrument signed by a majority of the other Trustees; and (d) any Trustee may be removed at any special meeting of shareholders by a two-thirds vote of the outstanding voting securities of the trust. Each Trustee who is not an interested person (as defined in the 1940 Act) (Independent Trustee), shall retire not later than the last day of the calendar year in which his or her 75th birthday occurs. The Independent Trustees may waive this mandatory retirement age policy with respect to individual Trustees. The executive officers and Advisory Board Members hold office without limit in time, except that any officer and Advisory Board Member may resign or may be removed by a vote of a majority of the Trustees at any regular meeting or any special meeting of the Trustees. Except as indicated, each individual has held the office shown or other offices in the same company for the past five years.
Experience, Skills, Attributes, and Qualifications of the Fund's Trustees. The Governance and Nominating Committee has adopted a statement of policy that describes the experience, qualifications, attributes, and skills that are necessary and desirable for potential Independent Trustee candidates (Statement of Policy). The Board believes that each Trustee satisfied at the time he or she was initially elected or appointed a Trustee, and continues to satisfy, the standards contemplated by the Statement of Policy. The Governance and Nominating Committee also engages professional search firms to help identify potential Independent Trustee candidates who have the experience, qualifications, attributes, and skills consistent with the Statement of Policy. From time to time, additional criteria based on the composition and skills of the current Independent Trustees, as well as experience or skills that may be appropriate in light of future changes to board composition, business conditions, and regulatory or other developments, have also been considered by the professional search firms and the Governance and Nominating Committee. In addition, the Board takes into account the Trustees' commitment and participation in Board and committee meetings, as well as their leadership of standing and ad hoc committees throughout their tenure.
In determining that a particular Trustee was and continues to be qualified to serve as a Trustee, the Board has considered a variety of criteria, none of which, in isolation, was controlling. The Board believes that, collectively, the Trustees have balanced and diverse experience, qualifications, attributes, and skills, which allow the Board to operate effectively in governing the fund and protecting the interests of shareholders. Information about the specific experience, skills, attributes, and qualifications of each Trustee, which in each case led to the Board's conclusion that the Trustee should serve (or continue to serve) as a trustee of the fund, is provided below.
Annual Report
Trustees and Officers - continued
Board Structure and Oversight Function. James C. Curvey is an interested person (as defined in the 1940 Act) and currently serves as Chairman. The Trustees have determined that an interested Chairman is appropriate and benefits shareholders because an interested Chairman has a personal and professional stake in the quality and continuity of services provided to the fund. Independent Trustees exercise their informed business judgment to appoint an individual of their choosing to serve as Chairman, regardless of whether the Trustee happens to be independent or a member of management. The Independent Trustees have determined that they can act independently and effectively without having an Independent Trustee serve as Chairman and that a key structural component for assuring that they are in a position to do so is for the Independent Trustees to constitute a substantial majority for the Board. The Independent Trustees also regularly meet in executive session. Ned C. Lautenbach serves as Chairman of the Independent Trustees and as such (i) acts as a liaison between the Independent Trustees and management with respect to matters important to the Independent Trustees and (ii) with management prepares agendas for Board meetings.
Fidelity funds are overseen by different Boards of Trustees. The fund's Board oversees Fidelity's equity and high income funds and another Board oversees Fidelity's investment-grade bond, money market, and asset allocation funds. The asset allocation funds may invest in Fidelity funds overseen by the fund's Board. The use of separate Boards, each with its own committee structure, allows the Trustees of each group of Fidelity funds to focus on the unique issues of the funds they oversee, including common research, investment, and operational issues. On occasion, the separate Boards establish joint committees to address issues of overlapping consequences for the Fidelity funds overseen by each Board.
The Trustees operate using a system of committees to facilitate the timely and efficient consideration of all matters of importance to the Trustees, the fund, and fund shareholders and to facilitate compliance with legal and regulatory requirements and oversight of the fund's activities and associated risks. The Board, acting through its committees, has charged FMR and its affiliates with (i) identifying events or circumstances the occurrence of which could have demonstrably adverse effects on the fund's business and/or reputation; (ii) implementing processes and controls to lessen the possibility that such events or circumstances occur or to mitigate the effects of such events or circumstances if they do occur; and (iii) creating and maintaining a system designed to evaluate continuously business and market conditions in order to facilitate the identification and implementation processes described in (i) and (ii) above. Because the day-to-day operations and activities of the fund are carried out by or through FMR, its affiliates and other service providers, the fund's exposure to risks is mitigated but not eliminated by the processes overseen by the Trustees. While each of the Board's committees has responsibility for overseeing different aspects of the fund's activities, oversight is exercised primarily through the Operations, Audit, and Compliance Committees. In addition, the Independent Trustees have worked with FMR to enhance the Board's oversight of investment and financial risks, legal and regulatory risks, technology risks, and operational risks, including the development of additional risk reporting to the Board. For example, a working group comprised of Independent Trustees and FMR has worked and continues to work to review the Fidelity funds' valuation-related activities, reporting and risk management. Appropriate personnel, including but not limited to the fund's Chief Compliance Officer (CCO), FMR's internal auditor, the independent accountants, the fund's Treasurer and portfolio management personnel, make periodic reports to the Board's committees, as appropriate, including an annual review of FMR's risk management program for the Fidelity funds. The responsibilities of each standing committee, including their oversight responsibilities, are described further under "Standing Committees of the Fund's Trustees."
Annual Report
The fund's Statement of Additional Information (SAI) includes more information about the Trustees. To request a free copy, call Fidelity at 1-877-208-0098.
Interested Trustees*:
Correspondence intended for each Trustee who is an interested person may be sent to Fidelity Investments, 245 Summer Street, Boston, Massachusetts 02210.
Name, Age; Principal Occupations and Other Relevant Experience+ |
James C. Curvey (77) |
| Year of Election or Appointment: 2007 Mr. Curvey is Trustee and Chairman of the Board of Trustees of certain Trusts. Mr. Curvey also serves as Trustee (2007-present) of other investment companies advised by FMR. Mr. Curvey is a Director of Fidelity Investments Money Management, Inc. (2009-present), Director of Fidelity Research & Analysis Co. (2009-present) and Director of FMR and FMR Co., Inc. (2007-present). Mr. Curvey is also Vice Chairman (2007-present) and Director of FMR LLC. In addition, Mr. Curvey serves as an Overseer for the Boston Symphony Orchestra and a member of the Trustees of Villanova University. Previously, Mr. Curvey was the Vice Chairman (2006-2007) and Director (2000-2007) of FMR Corp. |
Ronald P. O'Hanley (55) |
| Year of Election or Appointment: 2011 Mr. O'Hanley is Director of FMR Co., Inc. (2010-present), Director of Fidelity Investments Money Management, Inc. (2010-present), Director of Fidelity Research & Analysis Company (2010-present), President of Fidelity Asset Management and Corporate Services and a member of Fidelity's Executive Committee (2010-present). Previously, Mr. O'Hanley served as President and Chief Executive Officer of BNY Mellon Asset Management (2007-2010). Mr. O'Hanley also served as Vice Chairman of Bank New York Mellon Corp. and a member of that firm's Executive Committee. Prior to the 2007 merger of The Bank of New York and Mellon Financial Corporation, he was Vice Chairman of Mellon Financial Corporation and President and Chief Executive Officer of Mellon Asset Management. He joined Mellon in February 1997. Mr. O'Hanley currently serves as Chairman of the Boston Public Library Foundation Board of Directors and sits on the Board of Directors of Beth Israel Deaconess Medical Center, the Board of Trustees of the Marine Biological Laboratory and the Advisory Board of the Maxwell School of Citizenship and Public Administration at Syracuse University. Mr. O'Hanley also chairs the Council on Asset Management for the Financial Services Roundtable and is a member of the Board of Directors of Institutional Investor's U.S. Institute. |
* Trustees have been determined to be "Interested Trustees" by virtue of, among other things, their affiliation with the trust or various entities under common control with FMR.
+ The information above includes each Trustee's principal occupation during the last five years and other information relating to the experience, attributes, and skills relevant to each Trustee's qualifications to serve as a Trustee, which led to the conclusion that each Trustee should serve as a Trustee for the fund.
Annual Report
Independent Trustees:
Correspondence intended for each Independent Trustee (that is, the Trustees other than the Interested Trustees) may be sent to Fidelity Investments, P.O. Box 55235, Boston, Massachusetts 02205-5235.
Name, Age; Principal Occupations and Other Relevant Experience+ |
Dennis J. Dirks (64) |
| Year of Election or Appointment: 2005 Prior to his retirement in May 2003, Mr. Dirks was Chief Operating Officer and a member of the Board of The Depository Trust & Clearing Corporation (DTCC). He also served as President, Chief Operating Officer, and Board member of The Depository Trust Company (DTC) and President and Board member of the National Securities Clearing Corporation (NSCC). In addition, Mr. Dirks served as Chief Executive Officer and Board member of the Government Securities Clearing Corporation, Chief Executive Officer and Board member of the Mortgage-Backed Securities Clearing Corporation, as a Trustee and a member of the Finance Committee of Manhattan College (2005-2008), and as a Trustee and a member of the Finance Committee of AHRC of Nassau County (2006-2008). Mr. Dirks is a member of the Independent Directors Council (IDC) Governing Council (2010-present) and Board of Directors for The Brookville Center for Children's Services, Inc. (2009-present). |
Alan J. Lacy (59) |
| Year of Election or Appointment: 2008 Mr. Lacy serves as Senior Adviser (2007-present) of Oak Hill Capital Partners, L.P. (private equity). Mr. Lacy also served as Chief Executive Officer (2000-2005) and Vice Chairman (2005-2006) of Sears Holdings Corporation and Sears, Roebuck and Co. (retail). In addition, Mr. Lacy serves as a member of the Board of Directors of Dave & Buster's Entertainment, Inc. (restaurant and entertainment complexes, 2010-present), Earth Fare, Inc. (retail grocery, 2012-present), The Hillman Companies, Inc. (hardware wholesalers, 2010-present), and Bristol-Myers Squibb Company (global pharmaceuticals, 2008-present). Mr. Lacy is a member of the Board of Trustees of The National Parks Conservation Association (2006-present). Previously, Mr. Lacy served as Chairman of the Board of Trustees of the National Parks Conservation Association (2008-2011) and as a member of the Board of Directors for the Western Union Company (global money transfer, 2006-2011). |
Ned C. Lautenbach (68) |
| Year of Election or Appointment: 2000 Mr. Lautenbach currently serves as the Lead Director of the Eaton Corporation Board of Directors (diversified industrial, 1997-present). Mr. Lautenbach is Chairman of the Board of Directors of the Philharmonic Center for the Arts in Naples, Florida (2012-present) and a member of the Council on Foreign Relations (1994-present). Previously, Mr. Lautenbach was a Partner/Advisory Partner at Clayton, Dubilier & Rice, LLC (private equity investment, 1998-2010), as well as a Director of Sony Corporation (2006-2007). |
Joseph Mauriello (68) |
| Year of Election or Appointment: 2008 Prior to his retirement in January 2006, Mr. Mauriello served in numerous senior management positions including Deputy Chairman and Chief Operating Officer (2004-2005), and Vice Chairman of Financial Services (2002-2004) of KPMG LLP US (professional services, 1965-2005). Mr. Mauriello currently serves as a member of the Board of Directors of XL Group plc. (global insurance and re-insurance, 2006-present). Previously, Mr. Mauriello served as a Director of the Hamilton Funds of the Bank of New York (2006-2007) and of Arcadia Resources Inc. (health care services and products, 2007-2012). |
Robert W. Selander (62) |
| Year of Election or Appointment: 2011 Previously, Mr. Selander served as a Member of the Advisory Board of Fidelity's Equity and High Income Funds (2011), Executive Vice Chairman (2010), Chief Executive Officer (2009-2010), and President and Chief Executive Officer (1997-2009) of Mastercard, Inc. |
Cornelia M. Small (68) |
| Year of Election or Appointment: 2005 Ms. Small is a member of the Board of Directors (2009-present) and Chair of the Investment Committee (2010-present) of the Teagle Foundation. Ms. Small also serves on the Investment Committee of the Berkshire Taconic Community Foundation (2008-present). Previously, Ms. Small served as Chairperson (2002-2008) and a member of the Investment Committee and Chairperson (2008-2012) and a member of the Board of Trustees of Smith College. In addition, Ms. Small served as Chief Investment Officer, Director of Global Equity Investments, and a member of the Board of Directors of Scudder, Stevens & Clark and Scudder Kemper Investments. |
William S. Stavropoulos (73) |
| Year of Election or Appointment: 2002 Mr. Stavropoulos is Vice Chairman of the Independent Trustees of the Equity and High Income Funds (2006-present). Mr. Stavropoulos serves as President and Founder of the Michigan Baseball Foundation, the Great Lakes Loons (2007-present). Mr. Stavropoulos is Chairman Emeritus of the Board of Directors of The Dow Chemical Company, where he previously served in numerous senior management positions, including President, CEO (1995-2000; 2002-2004), Chairman of the Executive Committee (2000-2006), and as a member of the Board of Directors (1990-2006). Currently, Mr. Stavropoulos is a Director of Univar Inc. (global distributor of commodity and specialty chemicals, Chairman from 2010-May 2012 and Lead Director from May 2012-present), Teradata Corporation (data warehousing and technology solutions, 2008-present), Maersk Inc. (industrial conglomerate), and Tyco International, Ltd. (multinational manufacturing and services, 2007-present), and a member of the Advisory Board for Metalmark Capital LLC (private equity investment, 2005-present). Mr. Stavropoulos is an operating advisor to Clayton, Dubilier & Rice, LLC (private equity investment). In addition, Mr. Stavropoulos is a member of the University of Notre Dame Advisory Council for the College of Science, a Trustee of the Rollin L. Gerstacker Foundation, and a Director of the Naples Philharmonic Center for the Arts. Previously, Mr. Stavropoulos served as a Director of Chemical Financial Corporation (bank holding company, 1993-2012). |
David M. Thomas (63) |
| Year of Election or Appointment: 2008 Previously, Mr. Thomas served as Executive Chairman (2005-2006) and Chairman and Chief Executive Officer (2000-2005) of IMS Health, Inc. (pharmaceutical and healthcare information solutions), and a Director of Fortune Brands, Inc. (consumer products, 2000-2011). In addition, Mr. Thomas serves as Non-Executive Chairman of the Board of Directors of Fortune Brands Home and Security (home and security products, 2011-present), and as a member of the Board of Directors of Interpublic Group of Companies, Inc. (marketing communication, 2004-present). |
Michael E. Wiley (62) |
| Year of Election or Appointment: 2008 Mr. Wiley also serves as a Director of Asia Pacific Exploration Consolidated (international oil and gas exploration and production, 2008-present). Mr. Wiley serves as a Director of Tesoro Corporation (independent oil refiner and marketer, 2005-present), and a Director of Bill Barrett Corporation (exploration and production, 2005-present). In addition, Mr. Wiley also serves as a Director of Post Oak Bank (privately-held bank, 2004-present). Previously, Mr. Wiley served as a member of the Board of Trustees of the University of Tulsa (2000-2006; 2007-2010), as a Senior Energy Advisor of Katzenbach Partners, LLC (consulting, 2006-2007), as an Advisory Director of Riverstone Holdings (private investment), Chairman, President, and CEO of Baker Hughes, Inc. (oilfield services, 2000-2004), and as Director of Spinnaker Exploration Company (exploration and production, 2001-2005). |
+ The information above includes each Trustee's principal occupation during the last five years and other information relating to the experience, attributes, and skills relevant to each Trustee's qualifications to serve as a Trustee, which led to the conclusion that each Trustee should serve as a Trustee for the fund.
Advisory Board Members and Executive Officers:
Correspondence intended for David A. Rosow and Garnett A. Smith may be sent to Fidelity Investments, P.O. Box 55235, Boston, Massachusetts 02205-5235. Correspondence intended for each executive officer and Peter S. Lynch may be sent to Fidelity Investments, 245 Summer Street, Boston, Massachusetts 02210.
Name, Age; Principal Occupation |
Peter S. Lynch (69) |
| Year of Election or Appointment: 2003 Member of the Advisory Board of Fidelity's Equity and High Income Funds. Mr. Lynch is Vice Chairman and a Director of FMR and FMR Co., Inc. In addition, Mr. Lynch serves as a Trustee of Boston College and as the Chairman of the Inner-City Scholarship Fund. Previously, Mr. Lynch served on the Special Olympics International Board of Directors (1997-2006). |
David A. Rosow (70) |
| Year of Election or Appointment: 2012 Member of the Advisory Board of Fidelity's Equity and High Income Funds. Chairman and Chief Executive Officer of International Golf Group, Inc. (golf course development, 1989-present). Previously, Mr. Rosow served as Chairman and Chief Executive Officer of Rosow & Company, Inc. (private investment company, 1989-2011), a Lead Director of Hudson United Bancorp (2001-2006) and as a Director of TD Banknorth (1996-2006). In addition, Mr. Rosow is a member (2008-present) and President (2009-present) of the Town Council of Palm Beach, Florida. |
Garnett A. Smith (65) |
| Year of Election or Appointment: 2012 Member of the Advisory Board of Fidelity's Equity and High Income Funds. Prior to Mr. Smith's retirement, he served as Chairman and Chief Executive Officer of Inbrand Corp. (manufacturer of personal absorbent products, 1990-1997). He also served as President (1986-1990) of Inbrand Corp. Prior to his employment with Inbrand Corp., he was employed by a retail fabric chain and North Carolina National Bank. In addition, Mr. Smith is a board member of the Jackson Hole Land Trust (2009-present). |
Kenneth B. Robins (43) |
| Year of Election or Appointment: 2008 President and Treasurer of Fidelity's Equity and High Income Funds. Mr. Robins also serves as President and Treasurer (2010-present) and Assistant Treasurer (2009-present) of other Fidelity funds and is an employee of Fidelity Investments (2004-present). Previously, Mr. Robins served as Deputy Treasurer of the Fidelity funds (2005-2008) and Treasurer and Chief Financial Officer of The North Carolina Capital Management Trust: Cash and Term Portfolios (2006-2008). |
Bruce T. Herring (47) |
| Year of Election or Appointment: 2006 Vice President of certain Equity Funds. Mr. Herring also serves as Chief Investment Officer of Fidelity Global Asset Allocation (GAA) (2013-present), Chief Investment Officer and Director of Fidelity Management & Research (U.K.) Inc. (2010-present), Group Chief Investment Officer of FMR, and President of Fidelity Research & Analysis Company (2010-present). Previously, Mr. Herring served as Vice President (2005-2006) and Senior Vice President (2006-2007) of Fidelity Management & Research Company, Vice President of FMR Co., Inc. (2001-2007) and as a portfolio manager for Fidelity U.S. Equity Funds. |
Brian B. Hogan (48) |
| Year of Election or Appointment: 2009 Vice President of Equity and High Income Funds. Mr. Hogan also serves as President of FMR's Equity Division (2009-present). Previously, Mr. Hogan served as Senior Vice President, Equity Research of FMR (2006-2009) and as a portfolio manager. |
Scott C. Goebel (45) |
| Year of Election or Appointment: 2008 Secretary and Chief Legal Officer (CLO) of the Fidelity funds. Mr. Goebel also serves as Secretary of Fidelity Investments Money Management, Inc. (FIMM) (2010-present) and Fidelity Research and Analysis Company (FRAC) (2010-present); Secretary and CLO of The North Carolina Capital Management Trust: Cash and Term Portfolios (2008-present); General Counsel, Secretary, and Senior Vice President of FMR (2008-present) and FMR Co., Inc. (2008-present); employed by FMR LLC or an affiliate (2001-present); Chief Legal Officer of Fidelity Management & Research (Hong Kong) Limited (2008-present) and Assistant Secretary of Fidelity Management & Research (Japan) Inc. (2008-present), and Fidelity Management & Research (U.K.) Inc. (2008-present). Previously, Mr. Goebel served as Assistant Secretary of FIMM (2008-2010), FRAC (2008-2010), and the Funds (2007-2008) and as Vice President and Secretary of Fidelity Distributors Corporation (FDC) (2005-2007). |
William C. Coffey (43) |
| Year of Election or Appointment: 2009 Assistant Secretary of Fidelity's Equity and High Income Funds. Mr. Coffey also serves as Senior Vice President and Deputy General Counsel of FMR LLC (2010-present), and is an employee of Fidelity Investments. Previously, Mr. Coffey served as Vice President and Associate General Counsel of FMR LLC (2005-2009). |
Elizabeth Paige Baumann (44) |
| Year of Election or Appointment: 2012 Anti-Money Laundering (AML) Officer of the Fidelity funds. Ms. Baumann also serves as AML Officer of The North Carolina Capital Management Trust: Cash and Term Portfolios (2012-present), Chief AML Officer of FMR LLC (2012-present), and is an employee of Fidelity Investments. Previously, Ms. Baumann served as Vice President and Deputy Anti-Money Laundering Officer (2007-2012). |
Christine Reynolds (54) |
| Year of Election or Appointment: 2008 Chief Financial Officer of the Fidelity funds. Ms. Reynolds became President of Fidelity Pricing and Cash Management Services (FPCMS) in August 2008. Ms. Reynolds served as Chief Operating Officer of FPCMS (2007-2008). Previously, Ms. Reynolds served as President, Treasurer, and Anti-Money Laundering officer of the Fidelity funds (2004-2007). |
Joseph A. Hanlon (44) |
| Year of Election or Appointment: 2012 Chief Compliance Officer of Fidelity's Equity and High Income Funds. Mr. Hanlon serves as Compliance Officer of FMR, FMR Co., Inc., Fidelity Investments Money Management, Inc. (FIMM), Fidelity Research and Analysis Company (FRAC), Fidelity Management & Research (Japan) Inc., Fidelity Management & Research (U.K.) Inc., Fidelity Management & Research (Hong Kong), and Strategic Advisers, Inc. (2009-present), as Senior Vice President of the Fidelity Asset Management Division (2009-present), and is an employee of Fidelity Investments. |
Joseph F. Zambello (55) |
| Year of Election or Appointment: 2011 Deputy Treasurer of the Fidelity funds. Mr. Zambello is an employee of Fidelity Investments. Previously, Mr. Zambello served as Vice President of FMR's Program Management Group (2009-2011) and Vice President of the Transfer Agent Oversight Group (2005-2009). |
Adrien E. Deberghes (45) |
| Year of Election or Appointment: 2008 Deputy Treasurer of Fidelity's Equity and High Income Funds. Mr. Deberghes also serves as Vice President (2011-present) and Assistant Treasurer (2010-present) of other Fidelity funds, and is an employee of Fidelity Investments (2008-present). Previously, Mr. Deberghes served as Senior Vice President of Mutual Fund Administration at State Street Corporation (2007-2008), Senior Director of Mutual Fund Administration at Investors Bank & Trust (2005-2007), and Director of Finance for Dunkin' Brands (2000-2005). |
Stephen Sadoski (41) |
| Year of Election or Appointment: 2012 Deputy Treasurer of Fidelity's Equity and High Income Funds. Mr. Sadoski also serves as Deputy Treasurer of other Fidelity funds (2013-present) and is an employee of Fidelity Investments (2012-present). Previously, Mr. Sadoski served as Assistant Treasurer of Fidelity's Fixed Income and Asset Allocation Funds (2012-2013), an assistant chief accountant in the Division of Investment Management of the Securities and Exchange Commission (SEC) (2009-2012) and as a senior manager at Deloitte & Touche (1997-2009). |
Stacie Smith (38) |
| Year of Election or Appointment: 2013 Deputy Treasurer of Fidelity's Equity and High Income Funds. Ms. Smith is an employee of Fidelity Investments (2009-present). Previously, Ms. Smith served as Senior Audit Manager of Ernst & Young LLP (1996-2009). |
Stephanie J. Dorsey (43) |
| Year of Election or Appointment: 2010 Assistant Treasurer of Fidelity's Equity and High Income Funds. Ms. Dorsey also serves as President and Treasurer (2013-present) and Assistant Treasurer (2012-present) of other Fidelity funds and is an employee of Fidelity Investments (2008-present). Previously, Ms. Dorsey served as Deputy Treasurer of Fidelity's Fixed Income and Asset Allocation Funds (2008-2013), Treasurer (2004-2008) of the JPMorgan Mutual Funds and Vice President (2004-2008) of JPMorgan Chase Bank. |
John R. Hebble (54) |
| Year of Election or Appointment: 2009 Assistant Treasurer of Fidelity's Equity and High Income Funds. Mr. Hebble also serves as President (2011-present), Treasurer, and Chief Financial Officer of The North Carolina Capital Management Trust: Cash and Term Portfolios (2008-present) and is an employee of Fidelity Investments. Previously, Mr. Hebble served as President and Treasurer of Fidelity's Fixed Income and Asset Allocation Funds (2008-2013). |
Gary W. Ryan (54) |
| Year of Election or Appointment: 2005 Assistant Treasurer of the Fidelity funds. Mr. Ryan is an employee of Fidelity Investments. Previously, Mr. Ryan served as Vice President of Fund Reporting in Fidelity Pricing and Cash Management Services (FPCMS) (1999-2005). |
Jonathan Davis (44) |
| Year of Election or Appointment: 2010 Assistant Treasurer of the Fidelity funds. Mr. Davis is also Assistant Treasurer of Fidelity Rutland Square Trust II and Fidelity Commonwealth Trust II. Mr. Davis is an employee of Fidelity Investments. Previously, Mr. Davis served as Vice President and Associate General Counsel of FMR LLC (2003-2010). |
Annual Report
Class A and Class T designates 100% of the dividends distributed during the fiscal year as qualifying for the dividends-received deduction for corporate shareholders.
Class A and Class T designates 100% of the dividends distributed during the fiscal year as amounts which may be taken into account as a dividend for purposes of the maximum rate under section 1(h)(11) of the Internal Revenue Code.
The fund will notify shareholders in January 2014 of amounts for use in preparing 2013 income tax returns.
Annual Report
Investment Adviser
Fidelity Management & Research Company
Boston, MA
Investment Sub-Advisers
FMR Co., Inc.
Fidelity Management & Research
(U.K.) Inc.
Fidelity Management & Research
(Hong Kong) Limited
Fidelity Management & Research
(Japan) Inc.
General Distributor
Fidelity Distributors Corporation
Smithfield, RI
Transfer and Service Agents
Fidelity Investments Institutional Operations Company, Inc.
Boston, MA
Fidelity Service Company, Inc.
Boston, MA
Custodian
Citibank, N.A.
New York, NY
(Fidelity Investment logo)(registered trademark)
ALCG-UANN-0313
1.900740.103
(Fidelity Investment logo)(registered trademark)
Fidelity Advisor®
Large Cap Growth
Fund - Institutional Class
Annual Report
January 31, 2013
(Fidelity Cover Art)
Institutional Class is a class of
Fidelity® Large Cap Growth Fund
Contents
Note to shareholders | (Click Here) | Important information about the fund. |
Performance | (Click Here) | How the fund has done over time. |
Management's Discussion of Fund Performance | (Click Here) | The Portfolio Manager's review of fund performance and strategy. |
Shareholder Expense Example | (Click Here) | An example of shareholder expenses. |
Investment Changes | (Click Here) | A summary of major shifts in the fund's investments over the past six months. |
Investments | (Click Here) | A complete list of the fund's investments with their market values. |
Financial Statements | (Click Here) | Statements of assets and liabilities, operations, and changes in net assets, as well as financial highlights. |
Notes | (Click Here) | Notes to the financial statements. |
Report of Independent Registered Public Accounting Firm | (Click Here) | |
Trustees and Officers | (Click Here) | |
Distributions | (Click Here) | |
To view a fund's proxy voting guidelines and proxy voting record for the 12-month period ended June 30, visit http://www.fidelity.com/proxyvotingresults or visit the Securities and Exchange Commission's (SEC) web site at http://www.sec.gov. You may also call 1-877-208-0098 to request a free copy of the proxy voting guidelines.
Standard & Poor's, S&P and S&P 500 are registered service marks of The McGraw-Hill Companies, Inc. and have been licensed for use by Fidelity Distributors Corporation.
Other third-party marks appearing herein are the property of their respective owners.
All other marks appearing herein are registered or unregistered trademarks or service marks of FMR LLC or an affiliated company. © 2013 FMR LLC. All rights reserved.
Annual Report
This report and the financial statements contained herein are submitted for the general information of the shareholders of the fund. This report is not authorized for distribution to prospective investors in the fund unless preceded or accompanied by an effective prospectus.
A fund files its complete schedule of portfolio holdings with the SEC for the first and third quarters of each fiscal year on Form N-Q. Forms N-Q are available on the SEC's web site at http://www.sec.gov. A fund's Forms N-Q may be reviewed and copied at the SEC's Public Reference Room in Washington, DC. Information regarding the operation of the SEC's Public Reference Room may be obtained by calling 1-800-SEC-0330. For a complete list of a fund's portfolio holdings, view the most recent holdings listing, semiannual report, or annual report on Fidelity's web site at http://www.fidelity.com, http://www.advisor.fidelity.com, or http://www.401k.com, as applicable.
NOT FDIC INSURED • MAY LOSE VALUE • NO BANK GUARANTEE
Neither the fund nor Fidelity Distributors Corporation is a bank.
Annual Report
Note to shareholders
On November 14, 2012, the Board of Trustees approved a proposal to merge Fidelity® Large Cap Growth Fund into Fidelity® Stock Selector All Cap Fund. Shareholders of Fidelity Large Cap Growth Fund are expected to meet on May 14, 2013, to vote on the proposal. If approved, the merger is expected to be completed on or about June 21, 2013, and Advisor Class shareholders of Fidelity Large Cap Growth Fund will receive Advisor Class shares of Fidelity Stock Selector All Cap Fund. Fidelity Large Cap Growth Fund closed to new investors after the close of business on December 14, 2012.
The note above is not a solicitation of any proxy. For a free copy of the proxy statement describing the reorganization (and containing important information about fees, expenses and risk considerations) and a prospectus for Fidelity Stock Selector All Cap Fund, please call 1-877-208-0098. The prospectus/proxy statement also is available for free on the Securities and Exchange Commission's website (www.sec.gov).
Annual Report
Average annual total return reflects the change in the value of an investment, assuming reinvestment of the class' distributions from dividend income and capital gains (the profits earned upon the sale of securities that have grown in value, if any) and assuming a constant rate of performance each year. The $10,000 table and the fund's returns do not reflect the deduction of taxes that a shareholder would pay on fund distributions or the redemption of fund shares. During periods of reimbursement by Fidelity, a fund's total return will be greater than it would be had the reimbursement not occurred. How a fund did yesterday is no guarantee of how it will do tomorrow.
Average Annual Total Returns
Periods ended January 31, 2013 | Past 1
year | Past 5
years | Past 10
years |
Institutional Class A | 14.98% | 4.05% | 7.36% |
A The initial offering of Institutional Class shares took place on February 13, 2007. Returns prior to February 13, 2007, are those of Fidelity® Large Cap Growth Fund, the original class of the fund.
$10,000 Over 10 Years
Let's say hypothetically that $10,000 was invested in Fidelity Advisor® Large Cap Growth Fund - Institutional Class on January 31, 2003. The chart shows how the value of your investment would have changed, and also shows how the Russell 1000® Growth Index performed over the same period. The initial offering of Institutional Class took place on February 13, 2007. See above for additional information regarding the performance of Institutional Class.
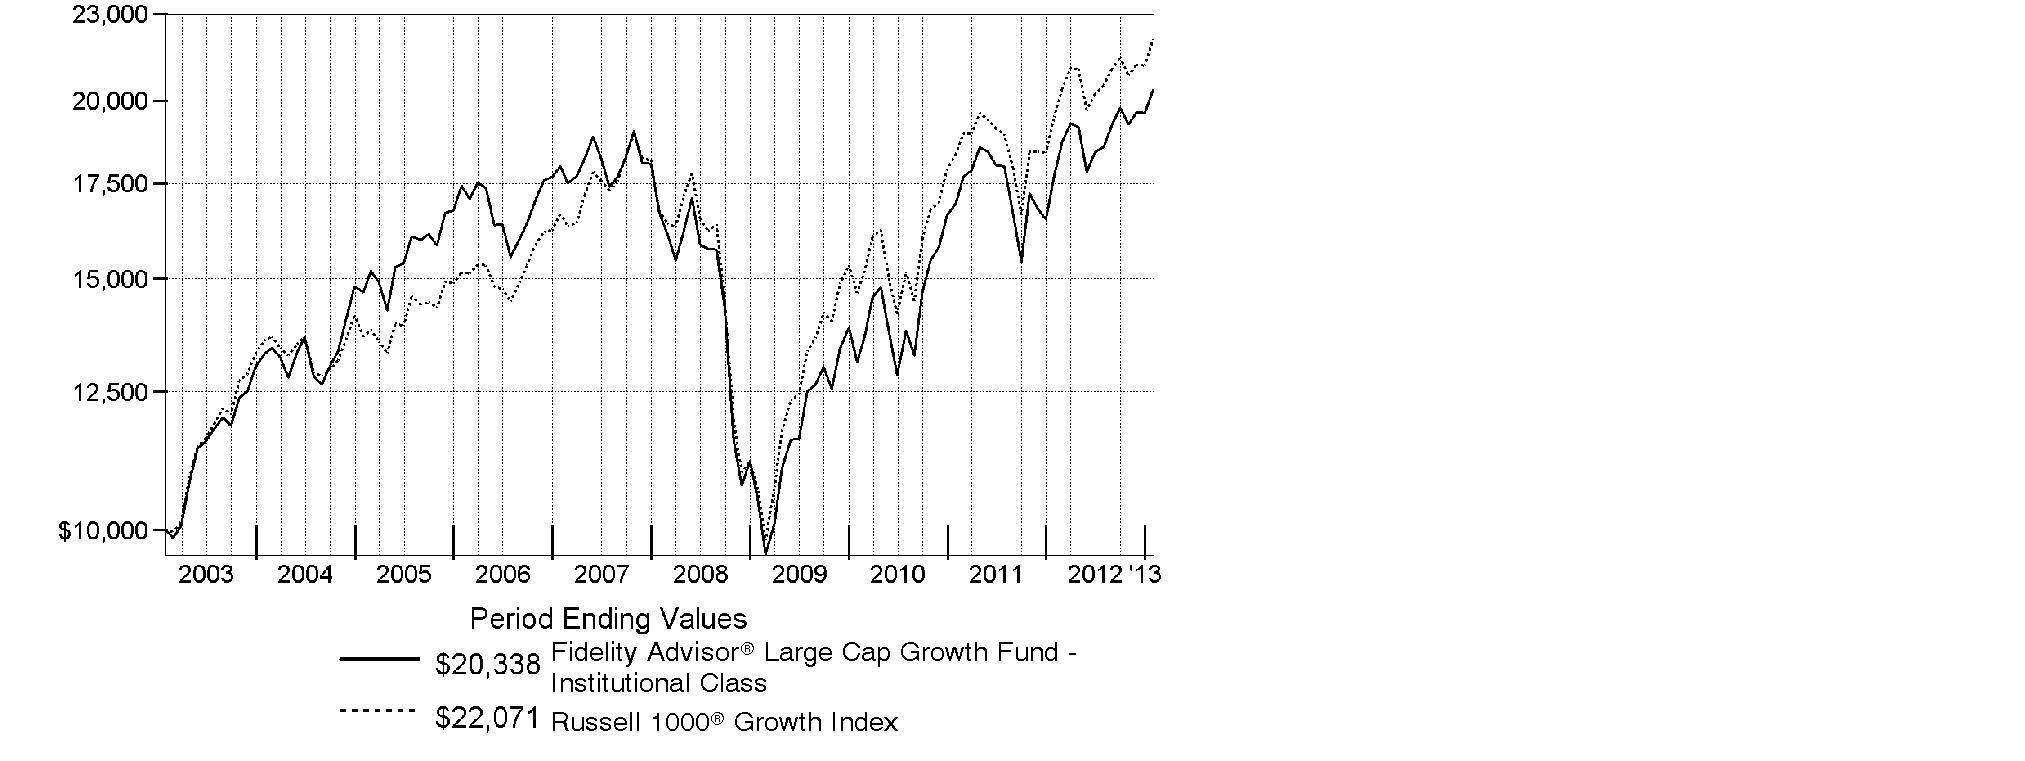
Annual Report
Market Recap: Improvement in the U.S. economy helped lift equity benchmarks to double-digit gains for the year ending January 31, 2013, overcoming moments of volatility driven by sovereign debt woes in Europe, slower economic growth in China and gridlock in Congress. Major U.S. benchmarks hit multiyear highs during the period, encouraged by a rebounding domestic housing market and solid corporate earnings reports. The broad-based S&P 500® Index rose 16.78% for the year, crossing the milestone 1,500 mark near period end. The technology-heavy Nasdaq Composite Index® added 13.13%, and the blue-chip-laden Dow Jones Industrial AverageSM gained 12.75%. Early in the period, stocks rose on positive U.S. economic news and proposed bailouts in Europe. Although fear resurfaced in April and May, equities rebounded in June on central bank stimulus and new life in the housing market. In September, pre-election jitters and the looming "fiscal cliff" of tax hikes and federal spending cuts fueled some profit-taking, followed by a brief post-election sell-off. But stocks proved resilient, as investors continued to pile into riskier assets. Gains were broad-based, with eight of the 10 sectors in the S&P 500® posting double-digit returns. Despite eurozone turmoil, foreign developed-markets stocks rose strongly, with the MSCI® EAFE® Index adding 17.41%.
Comments from Daniel Kelley, Portfolio Manager of Fidelity Advisor® Large Cap Growth Fund: For the year, the fund's Institutional Class shares were up 14.98%, outperforming the 13.43% advance of the Russell 1000® Growth Index. Security selection helped relative performance the most, particularly in the consumer durables/apparel segment of consumer discretionary. There, companies benefiting from the U.S. housing recovery saw sharp share price gains. Top contributors included appliance manufacturer Whirlpool, which I bought in September. Within information technology, having essentially no exposure to semiconductor manufacturer and index component Intel gave a sizable boost, as slowing personal computer sales hurt revenues. An overweighting in hardware/equipment innovator Apple early on also helped. By contrast, stock picks in the technology hardware/equipment group and a small cash position detracted. Among individual disappointments was enterprise communication hardware/equipment company Polycom, whose stock fell due to a major restructuring of its sales department and concerns that it was losing market share. Elsewhere, the timing of my ownership of Green Mountain Coffee Roasters - maker of the Keurig® single-serve coffee system - hurt. Whirlpool was not in the index, and Green Mountain, Polycom and Intel were not in the portfolio at period end.
The views expressed above reflect those of the portfolio manager(s) only through the end of the period as stated on the cover of this report and do not necessarily represent the views of Fidelity or any other person in the Fidelity organization. Any such views are subject to change at any time based upon market or other conditions and Fidelity disclaims any responsibility to update such views. These views may not be relied on as investment advice and, because investment decisions for a Fidelity fund are based on numerous factors, may not be relied on as an indication of trading intent on behalf of any Fidelity fund.
Annual Report
Shareholder Expense Example
As a shareholder of the Fund, you incur two types of costs: (1) transaction costs, including sales charges (loads) on purchase payments or redemption proceeds, and (2) ongoing costs, including management fees, distribution and/or service (12b-1) fees and other Fund expenses. This Example is intended to help you understand your ongoing costs (in dollars) of investing in the Fund and to compare these costs with the ongoing costs of investing in other mutual funds.
The Example is based on an investment of $1,000 invested at the beginning of the period and held for the entire period (August 1, 2012 to January 31, 2013).
Actual Expenses
The first line of the accompanying table for each class of the Fund provides information about actual account values and actual expenses. You may use the information in this line, together with the amount you invested, to estimate the expenses that you paid over the period. Simply divide your account value by $1,000.00 (for example, an $8,600 account value divided by $1,000.00 = 8.6), then multiply the result by the number in the first line for a class of the Fund under the heading entitled "Expenses Paid During Period" to estimate the expenses you paid on your account during this period. A small balance maintenance fee of $12.00 that is charged once a year may apply for certain accounts with a value of less than $2,000. This fee is not included in the table below. If it was, the estimate of expenses you paid during the period would be higher, and your ending account value lower, by this amount. In addition, the Fund, as a shareholder in the underlying Fidelity Central Funds, will indirectly bear its pro-rata share of the fees and expenses incurred by the underlying Fidelity Central Funds. These fees and expenses are not included in the Fund's annualized expense ratio used to calculate the expense estimate in the table below.
Hypothetical Example for Comparison Purposes
The second line of the accompanying table for each class of the Fund provides information about hypothetical account values and hypothetical expenses based on a Class' actual expense ratio and an assumed rate of return of 5% per year before expenses, which is not the Class' actual return. The hypothetical account values and expenses may not be used to estimate the actual ending account balance or expenses you paid for the period. You may use this information to compare the ongoing costs of investing in the Fund and other funds. To do so, compare this 5% hypothetical example with the 5% hypothetical examples that appear in the shareholder reports of the other funds. A small balance maintenance fee of $12.00 that is charged once a year may apply for certain accounts with a value of less than $2,000. This fee is not included in the table below. If it was, the estimate of expenses you paid during the period would be higher, and your ending account value lower, by this amount. In addition, the Fund, as a shareholder in the underlying Fidelity Central Funds, will indirectly bear its pro-rata share of the fees and expenses incurred by the underlying Fidelity Central Funds. These fees and expenses are not included in the Fund's annualized expense ratio used to calculate the expense estimate in the table below.
Please note that the expenses shown in the table are meant to highlight your ongoing costs only and do not reflect any transaction costs. Therefore, the second line of the table is useful in comparing ongoing costs only, and will not help you determine the relative total costs of owning different funds. In addition, if these transactional costs were included, your costs would have been higher.
Annual Report
Shareholder Expense Example - continued
| Annualized
Expense Ratio | Beginning
Account Value
August 1, 2012 | Ending
Account Value
January 31, 2013 | Expenses Paid
During Period*
August 1, 2012
to January 31, 2013 |
Class A | 1.25% | | | |
Actual | | $ 1,000.00 | $ 1,092.90 | $ 6.58 |
Hypothetical A | | $ 1,000.00 | $ 1,018.85 | $ 6.34 |
Class T | 1.50% | | | |
Actual | | $ 1,000.00 | $ 1,092.40 | $ 7.89 |
Hypothetical A | | $ 1,000.00 | $ 1,017.60 | $ 7.61 |
Class B | 2.00% | | | |
Actual | | $ 1,000.00 | $ 1,089.20 | $ 10.50 |
Hypothetical A | | $ 1,000.00 | $ 1,015.08 | $ 10.13 |
Class C | 2.00% | | | |
Actual | | $ 1,000.00 | $ 1,089.70 | $ 10.51 |
Hypothetical A | | $ 1,000.00 | $ 1,015.08 | $ 10.13 |
Large Cap Growth | .94% | | | |
Actual | | $ 1,000.00 | $ 1,095.10 | $ 4.95 |
Hypothetical A | | $ 1,000.00 | $ 1,020.41 | $ 4.77 |
Institutional Class | .85% | | | |
Actual | | $ 1,000.00 | $ 1,095.10 | $ 4.48 |
Hypothetical A | | $ 1,000.00 | $ 1,020.86 | $ 4.32 |
A 5% return per year before expenses
* Expenses are equal to each Class' annualized expense ratio, multiplied by the average account value over the period, multiplied by 184/366 (to reflect the one-half year period).
Annual Report
Investment Changes (Unaudited)
Top Ten Stocks as of January 31, 2013 |
| % of fund's
net assets | % of fund's net assets
6 months ago |
Apple, Inc. | 5.7 | 9.1 |
Google, Inc. Class A | 3.4 | 2.9 |
Oracle Corp. | 2.5 | 2.2 |
Amazon.com, Inc. | 2.0 | 1.5 |
Gilead Sciences, Inc. | 1.9 | 1.2 |
Visa, Inc. Class A | 1.9 | 1.7 |
The Coca-Cola Co. | 1.9 | 1.8 |
Home Depot, Inc. | 1.9 | 1.7 |
QUALCOMM, Inc. | 1.8 | 1.8 |
Amgen, Inc. | 1.7 | 1.5 |
| 24.7 | |
Top Five Market Sectors as of January 31, 2013 |
| % of fund's
net assets | % of fund's net assets
6 months ago |
Information Technology | 29.9 | 32.1 |
Consumer Discretionary | 17.0 | 15.4 |
Health Care | 13.1 | 12.1 |
Industrials | 11.4 | 9.9 |
Consumer Staples | 10.6 | 11.8 |
Asset Allocation (% of fund's net assets) |
As of January 31, 2013* | As of July 31, 2012** |
| Stocks 98.1% | | | Stocks 96.2% | |
| Short-Term
Investments and
Net Other Assets (Liabilities) 1.9% | | | Short-Term
Investments and
Net Other Assets (Liabilities) 3.8% | |
* Foreign investments | 10.8% | | ** Foreign investments | 8.3% | |

Annual Report
Investments January 31, 2013
Showing Percentage of Net Assets
Common Stocks - 98.1% |
| Shares | | Value |
CONSUMER DISCRETIONARY - 17.0% |
Automobiles - 0.6% |
Ford Motor Co. | 12,750 | | $ 165,113 |
Harley-Davidson, Inc. | 15,300 | | 802,026 |
Tesla Motors, Inc. (a) | 2,500 | | 93,775 |
| | 1,060,914 |
Diversified Consumer Services - 0.2% |
Weight Watchers International, Inc. (d) | 7,100 | | 379,637 |
Hotels, Restaurants & Leisure - 2.0% |
Las Vegas Sands Corp. | 14,957 | | 826,374 |
McDonald's Corp. | 11,578 | | 1,103,268 |
Starbucks Corp. | 28,174 | | 1,581,125 |
| | 3,510,767 |
Household Durables - 1.9% |
D.R. Horton, Inc. | 30,200 | | 714,532 |
Toll Brothers, Inc. (a) | 35,809 | | 1,341,047 |
Whirlpool Corp. | 10,700 | | 1,234,566 |
| | 3,290,145 |
Internet & Catalog Retail - 2.8% |
Amazon.com, Inc. (a) | 12,847 | | 3,410,879 |
priceline.com, Inc. (a) | 2,160 | | 1,480,615 |
| | 4,891,494 |
Media - 2.0% |
Comcast Corp. Class A | 69,675 | | 2,653,224 |
Discovery Communications, Inc. (a) | 11,382 | | 789,683 |
| | 3,442,907 |
Specialty Retail - 4.6% |
American Eagle Outfitters, Inc. | 44,858 | | 906,580 |
Dick's Sporting Goods, Inc. | 19,000 | | 904,210 |
DSW, Inc. Class A | 6,693 | | 447,962 |
Home Depot, Inc. | 47,493 | | 3,178,232 |
Lowe's Companies, Inc. | 24,094 | | 920,150 |
Ross Stores, Inc. | 18,606 | | 1,110,778 |
Tractor Supply Co. | 3,589 | | 372,072 |
| | 7,839,984 |
Textiles, Apparel & Luxury Goods - 2.9% |
lululemon athletica, Inc. (a) | 13,661 | | 942,609 |
Michael Kors Holdings Ltd. (a) | 19,030 | | 1,068,154 |
Common Stocks - continued |
| Shares | | Value |
CONSUMER DISCRETIONARY - continued |
Textiles, Apparel & Luxury Goods - continued |
NIKE, Inc. Class B | 33,100 | | $ 1,789,055 |
PVH Corp. | 10,100 | | 1,200,587 |
| | 5,000,405 |
TOTAL CONSUMER DISCRETIONARY | | 29,416,253 |
CONSUMER STAPLES - 10.6% |
Beverages - 4.5% |
Beam, Inc. | 11,137 | | 683,144 |
Constellation Brands, Inc. Class A (sub. vtg.) (a) | 14,113 | | 456,697 |
Dr. Pepper Snapple Group, Inc. | 20,190 | | 909,963 |
Fomento Economico Mexicano S.A.B. de CV sponsored ADR | 7,200 | | 776,808 |
PepsiCo, Inc. | 16,673 | | 1,214,628 |
Remy Cointreau SA | 4,295 | | 548,126 |
The Coca-Cola Co. | 86,186 | | 3,209,567 |
| | 7,798,933 |
Food & Staples Retailing - 2.2% |
CVS Caremark Corp. | 39,444 | | 2,019,533 |
Wal-Mart Stores, Inc. | 25,256 | | 1,766,657 |
| | 3,786,190 |
Food Products - 0.6% |
Danone SA | 14,700 | | 1,018,741 |
Household Products - 1.1% |
Kimberly-Clark Corp. | 4,181 | | 374,241 |
Procter & Gamble Co. | 20,200 | | 1,518,232 |
| | 1,892,473 |
Tobacco - 2.2% |
Altria Group, Inc. | 50,664 | | 1,706,364 |
British American Tobacco PLC (United Kingdom) | 16,900 | | 878,320 |
Lorillard, Inc. | 30,099 | | 1,175,968 |
| | 3,760,652 |
TOTAL CONSUMER STAPLES | | 18,256,989 |
ENERGY - 5.0% |
Energy Equipment & Services - 2.7% |
Cameron International Corp. (a) | 12,070 | | 764,152 |
Ensco PLC Class A | 17,984 | | 1,143,243 |
Halliburton Co. | 19,100 | | 776,988 |
Common Stocks - continued |
| Shares | | Value |
ENERGY - continued |
Energy Equipment & Services - continued |
National Oilwell Varco, Inc. | 8,614 | | $ 638,642 |
Schlumberger Ltd. | 16,375 | | 1,278,069 |
| | 4,601,094 |
Oil, Gas & Consumable Fuels - 2.3% |
Canadian Natural Resources Ltd. | 14,800 | | 446,938 |
Noble Energy, Inc. | 6,048 | | 651,914 |
Pioneer Natural Resources Co. | 6,300 | | 740,502 |
Suncor Energy, Inc. | 21,300 | | 723,952 |
The Williams Companies, Inc. | 40,350 | | 1,414,268 |
| | 3,977,574 |
TOTAL ENERGY | | 8,578,668 |
FINANCIALS - 5.2% |
Capital Markets - 1.1% |
Charles Schwab Corp. | 53,642 | | 886,702 |
The Blackstone Group LP | 55,678 | | 1,030,043 |
| | 1,916,745 |
Commercial Banks - 0.6% |
M&T Bank Corp. | 2,573 | | 264,221 |
Wells Fargo & Co. | 23,551 | | 820,281 |
| | 1,084,502 |
Consumer Finance - 0.7% |
SLM Corp. | 72,031 | | 1,216,604 |
Diversified Financial Services - 1.0% |
BTG Pactual Participations Ltd. unit | 34,500 | | 593,379 |
Citigroup, Inc. | 26,736 | | 1,127,190 |
| | 1,720,569 |
Real Estate Investment Trusts - 1.2% |
American Tower Corp. | 21,200 | | 1,614,380 |
AvalonBay Communities, Inc. | 2,600 | | 337,454 |
| | 1,951,834 |
Real Estate Management & Development - 0.6% |
CBRE Group, Inc. (a) | 21,389 | | 461,575 |
Realogy Holdings Corp. | 13,930 | | 623,646 |
| | 1,085,221 |
TOTAL FINANCIALS | | 8,975,475 |
Common Stocks - continued |
| Shares | | Value |
HEALTH CARE - 13.1% |
Biotechnology - 5.6% |
Achillion Pharmaceuticals, Inc. (a) | 21,600 | | $ 193,968 |
ADVENTRX Pharmaceuticals, Inc. warrants 11/16/16 (a) | 39,587 | | 3,001 |
Alkermes PLC (a) | 6,900 | | 159,045 |
Amgen, Inc. | 33,800 | | 2,888,548 |
ARIAD Pharmaceuticals, Inc. (a) | 12,680 | | 252,078 |
Biogen Idec, Inc. (a) | 4,700 | | 733,576 |
BioMarin Pharmaceutical, Inc. (a) | 10,700 | | 587,323 |
Elan Corp. PLC sponsored ADR (a) | 44,802 | | 470,869 |
Gilead Sciences, Inc. (a) | 82,574 | | 3,257,544 |
Regeneron Pharmaceuticals, Inc. (a) | 3,350 | | 582,699 |
Theravance, Inc. (a) | 23,066 | | 513,219 |
| | 9,641,870 |
Health Care Equipment & Supplies - 1.6% |
Align Technology, Inc. (a) | 28,107 | | 881,436 |
Boston Scientific Corp. (a) | 47,505 | | 354,862 |
The Cooper Companies, Inc. | 15,150 | | 1,535,453 |
| | 2,771,751 |
Health Care Providers & Services - 2.4% |
Brookdale Senior Living, Inc. (a) | 42,660 | | 1,152,247 |
Catamaran Corp. (a) | 14,130 | | 733,206 |
Express Scripts Holding Co. (a) | 11,476 | | 613,048 |
Laboratory Corp. of America Holdings (a) | 10,221 | | 914,780 |
Qualicorp SA (a) | 35,300 | | 365,169 |
Team Health Holdings, Inc. (a) | 12,780 | | 432,859 |
| | 4,211,309 |
Pharmaceuticals - 3.5% |
AbbVie, Inc. | 43,550 | | 1,597,850 |
Actavis, Inc. (a) | 11,967 | | 1,033,829 |
Johnson & Johnson | 18,712 | | 1,383,191 |
Merck & Co., Inc. | 12,952 | | 560,174 |
Valeant Pharmaceuticals International, Inc. (Canada) (a) | 11,800 | | 782,486 |
Warner Chilcott PLC | 45,800 | | 648,986 |
Zoetis, Inc. Class A | 1,500 | | 39,000 |
| | 6,045,516 |
TOTAL HEALTH CARE | | 22,670,446 |
Common Stocks - continued |
| Shares | | Value |
INDUSTRIALS - 11.4% |
Aerospace & Defense - 2.2% |
Textron, Inc. | 34,650 | | $ 996,534 |
United Technologies Corp. | 32,686 | | 2,862,313 |
| | 3,858,847 |
Air Freight & Logistics - 1.3% |
United Parcel Service, Inc. Class B | 28,300 | | 2,243,907 |
Construction & Engineering - 0.7% |
Dycom Industries, Inc. (a) | 16,214 | | 340,170 |
Quanta Services, Inc. (a) | 28,660 | | 830,280 |
| | 1,170,450 |
Electrical Equipment - 1.2% |
Eaton Corp. PLC | 22,700 | | 1,292,765 |
Regal-Beloit Corp. | 10,500 | | 778,680 |
| | 2,071,445 |
Industrial Conglomerates - 0.5% |
Carlisle Companies, Inc. | 12,558 | | 805,596 |
Machinery - 3.2% |
Caterpillar, Inc. | 19,564 | | 1,924,902 |
Cummins, Inc. | 13,700 | | 1,573,171 |
Ingersoll-Rand PLC | 19,550 | | 1,004,675 |
Manitowoc Co., Inc. | 55,786 | | 981,834 |
| | 5,484,582 |
Professional Services - 0.5% |
Nielsen Holdings B.V. (a) | 16,634 | | 540,771 |
Towers Watson & Co. | 6,569 | | 401,235 |
| | 942,006 |
Road & Rail - 1.0% |
Union Pacific Corp. | 13,100 | | 1,722,126 |
Trading Companies & Distributors - 0.8% |
Watsco, Inc. | 6,965 | | 524,813 |
WESCO International, Inc. (a) | 11,545 | | 841,977 |
| | 1,366,790 |
TOTAL INDUSTRIALS | | 19,665,749 |
INFORMATION TECHNOLOGY - 29.9% |
Communications Equipment - 3.0% |
Juniper Networks, Inc. (a) | 28,352 | | 634,518 |
Common Stocks - continued |
| Shares | | Value |
INFORMATION TECHNOLOGY - continued |
Communications Equipment - continued |
Motorola Solutions, Inc. | 25,489 | | $ 1,488,303 |
QUALCOMM, Inc. | 46,200 | | 3,050,586 |
| | 5,173,407 |
Computers & Peripherals - 6.1% |
Apple, Inc. | 21,589 | | 9,829,682 |
EMC Corp. (a) | 31,400 | | 772,754 |
| | 10,602,436 |
Internet Software & Services - 5.0% |
eBay, Inc. (a) | 27,250 | | 1,524,093 |
Facebook, Inc. Class A | 42,631 | | 1,320,282 |
Google, Inc. Class A (a) | 7,744 | | 5,852,063 |
| | 8,696,438 |
IT Services - 5.9% |
Accenture PLC Class A | 24,910 | | 1,790,780 |
Cognizant Technology Solutions Corp. Class A (a) | 11,952 | | 934,407 |
IBM Corp. | 10,654 | | 2,163,508 |
MasterCard, Inc. Class A | 4,033 | | 2,090,707 |
Visa, Inc. Class A | 20,400 | | 3,221,364 |
| | 10,200,766 |
Semiconductors & Semiconductor Equipment - 2.7% |
Altera Corp. | 31,396 | | 1,049,254 |
ASML Holding NV (Netherlands) | 5,726 | | 429,537 |
Broadcom Corp. Class A | 38,510 | | 1,249,650 |
Samsung Electronics Co. Ltd. | 743 | | 988,836 |
Skyworks Solutions, Inc. (a) | 36,080 | | 863,755 |
| | 4,581,032 |
Software - 7.2% |
Check Point Software Technologies Ltd. (a) | 17,291 | | 864,550 |
Citrix Systems, Inc. (a) | 5,300 | | 387,748 |
Fortinet, Inc. (a) | 22,300 | | 526,057 |
Guidewire Software, Inc. | 29,104 | | 963,924 |
MICROS Systems, Inc. (a) | 8,100 | | 372,843 |
Microsoft Corp. | 71,884 | | 1,974,653 |
Nuance Communications, Inc. (a) | 24,401 | | 586,844 |
Oracle Corp. | 123,017 | | 4,368,334 |
salesforce.com, Inc. (a) | 11,950 | | 2,056,954 |
Common Stocks - continued |
| Shares | | Value |
INFORMATION TECHNOLOGY - continued |
Software - continued |
Splunk, Inc. | 4,700 | | $ 154,912 |
Workday, Inc. | 2,000 | | 106,840 |
| | 12,363,659 |
TOTAL INFORMATION TECHNOLOGY | | 51,617,738 |
MATERIALS - 5.6% |
Chemicals - 4.0% |
Albemarle Corp. | 13,600 | | 833,816 |
Ashland, Inc. | 11,628 | | 912,914 |
Axiall Corp. | 15,600 | | 876,408 |
Eastman Chemical Co. | 18,094 | | 1,287,388 |
LyondellBasell Industries NV Class A | 11,051 | | 700,854 |
Monsanto Co. | 23,223 | | 2,353,651 |
| | 6,965,031 |
Construction Materials - 1.1% |
Martin Marietta Materials, Inc. | 5,712 | | 563,946 |
Vulcan Materials Co. | 24,254 | | 1,371,806 |
| | 1,935,752 |
Metals & Mining - 0.5% |
Commercial Metals Co. | 48,547 | | 808,308 |
TOTAL MATERIALS | | 9,709,091 |
TELECOMMUNICATION SERVICES - 0.3% |
Wireless Telecommunication Services - 0.3% |
Vodafone Group PLC sponsored ADR | 22,500 | | 614,700 |
TOTAL COMMON STOCKS (Cost $150,354,503) |
169,505,109
|
Money Market Funds - 1.9% |
| Shares | | Value |
Fidelity Cash Central Fund, 0.16% (b) | 2,848,348 | | $ 2,848,348 |
Fidelity Securities Lending Cash Central Fund, 0.15% (b)(c) | 442,000 | | 442,000 |
TOTAL MONEY MARKET FUNDS (Cost $3,290,348) |
3,290,348
|
TOTAL INVESTMENT PORTFOLIO - 100.0% (Cost $153,644,851) | | 172,795,457 |
NET OTHER ASSETS (LIABILITIES) - 0.0% | | 55,305 |
NET ASSETS - 100% | $ 172,850,762 |
Legend |
(a) Non-income producing |
(b) Affiliated fund that is available only to investment companies and other accounts managed by Fidelity Investments. The rate quoted is the annualized seven-day yield of the fund at period end. A complete unaudited listing of the fund's holdings as of its most recent quarter end is available upon request. In addition, each Fidelity Central Fund's financial statements, which are not covered by the Fund's Report of Independent Registered Public Accounting Firm, are available on the SEC's website or upon request. |
(c) Investment made with cash collateral received from securities on loan. |
(d) Security or a portion of the security is on loan at period end. |
Affiliated Central Funds |
Information regarding fiscal year to date income earned by the Fund from investments in Fidelity Central Funds is as follows: |
Fund | Income earned |
Fidelity Cash Central Fund | $ 7,926 |
Fidelity Securities Lending Cash Central Fund | 25,843 |
Total | $ 33,769 |
Other Information |
The following is a summary of the inputs used, as of January 31, 2013, involving the Fund's assets and liabilities carried at fair value. The inputs or methodology used for valuing securities may not be an indication of the risk associated with investing in those securities. For more information on valuation inputs, and their aggregation into the levels used in the table below, please refer to the Investment Valuation section in the accompanying Notes to Financial Statements. |
Valuation Inputs at Reporting Date: |
Description | Total | Level 1 | Level 2 | Level 3 |
Investments in Securities: | | | | |
Equities: | | | | |
Consumer Discretionary | $ 29,416,253 | $ 29,416,253 | $ - | $ - |
Consumer Staples | 18,256,989 | 17,378,669 | 878,320 | - |
Energy | 8,578,668 | 8,578,668 | - | - |
Financials | 8,975,475 | 8,975,475 | - | - |
Health Care | 22,670,446 | 22,667,445 | 3,001 | - |
Industrials | 19,665,749 | 19,665,749 | - | - |
Information Technology | 51,617,738 | 51,188,201 | 429,537 | - |
Materials | 9,709,091 | 9,709,091 | - | - |
Telecommunication Services | 614,700 | 614,700 | - | - |
Money Market Funds | 3,290,348 | 3,290,348 | - | - |
Total Investments in Securities: | $ 172,795,457 | $ 171,484,599 | $ 1,310,858 | $ - |
Distribution of investments by country or territory of incorporation, as a percentage of total net assets, is as follows. (Unaudited) |
United States of America | 89.2% |
Ireland | 3.1% |
Canada | 1.6% |
United Kingdom | 1.5% |
Netherlands | 1.0% |
Others (Individually Less Than 1%) | 3.6% |
| 100.0% |
See accompanying notes which are an integral part of the financial statements.
Annual Report
Statement of Assets and Liabilities
| January 31, 2013 |
| | |
Assets | | |
Investment in securities, at value (including securities loaned of $427,760) - See accompanying schedule: Unaffiliated issuers (cost $150,354,503) | $ 169,505,109 | |
Fidelity Central Funds (cost $3,290,348) | 3,290,348 | |
Total Investments (cost $153,644,851) | | $ 172,795,457 |
Cash | | 58,812 |
Foreign currency held at value (cost $74,169) | | 74,169 |
Receivable for investments sold | | 6,274,616 |
Receivable for fund shares sold | | 158,211 |
Dividends receivable | | 57,007 |
Distributions receivable from Fidelity Central Funds | | 1,111 |
Prepaid expenses | | 403 |
Receivable from investment adviser for expense reductions | | 302 |
Other receivables | | 13,372 |
Total assets | | 179,433,460 |
| | |
Liabilities | | |
Payable for investments purchased | $ 5,860,703 | |
Payable for fund shares redeemed | 83,715 | |
Accrued management fee | 90,475 | |
Distribution and service plan fees payable | 13,151 | |
Other affiliated payables | 39,742 | |
Other payables and accrued expenses | 52,912 | |
Collateral on securities loaned, at value | 442,000 | |
Total liabilities | | 6,582,698 |
| | |
Net Assets | | $ 172,850,762 |
Net Assets consist of: | | |
Paid in capital | | $ 156,741,640 |
Accumulated net investment loss | | (43,376) |
Accumulated undistributed net realized gain (loss) on investments and foreign currency transactions | | (2,997,738) |
Net unrealized appreciation (depreciation) on investments and assets and liabilities in foreign currencies | | 19,150,236 |
Net Assets | | $ 172,850,762 |
See accompanying notes which are an integral part of the financial statements.
Annual Report
Statement of Assets and Liabilities - continued
| January 31, 2013 |
| | |
Calculation of Maximum Offering Price Class A:
Net Asset Value and redemption price per share ($13,900,199 ÷ 1,189,639 shares) | | $ 11.68 |
| | |
Maximum offering price per share (100/94.25 of $11.68) | | $ 12.39 |
Class T:
Net Asset Value and redemption price per share ($6,084,489 ÷ 525,586 shares) | | $ 11.58 |
| | |
Maximum offering price per share (100/96.50 of $11.58) | | $ 12.00 |
Class B:
Net Asset Value and offering price per share ($1,450,525 ÷ 127,633 shares)A | | $ 11.36 |
| | |
Class C:
Net Asset Value and offering price per share ($7,876,758 ÷ 697,322 shares)A | | $ 11.30 |
| | |
Large Cap Growth:
Net Asset Value, offering price and redemption price per share ($139,813,310 ÷ 11,821,014 shares) | | $ 11.83 |
| | |
Institutional Class:
Net Asset Value, offering price and redemption price per share ($3,725,481 ÷ 313,739 shares) | | $ 11.87 |
A Redemption price per share is equal to net asset value less any applicable contingent deferred sales charge.
See accompanying notes which are an integral part of the financial statements.
Annual Report
Financial Statements - continued
Statement of Operations
| Year ended January 31, 2013 |
| | |
Investment Income | | |
Dividends | | $ 2,555,088 |
Income from Fidelity Central Funds | | 33,769 |
Total income | | 2,588,857 |
| | |
Expenses | | |
Management fee
Basic fee | $ 939,896 | |
Performance adjustment | (46,376) | |
Transfer agent fees | 414,753 | |
Distribution and service plan fees | 151,448 | |
Accounting and security lending fees | 65,943 | |
Custodian fees and expenses | 41,809 | |
Independent trustees' compensation | 1,099 | |
Registration fees | 83,200 | |
Audit | 54,817 | |
Legal | 703 | |
Miscellaneous | 1,460 | |
Total expenses before reductions | 1,708,752 | |
Expense reductions | (28,326) | 1,680,426 |
Net investment income (loss) | | 908,431 |
Realized and Unrealized Gain (Loss) Net realized gain (loss) on: | | |
Investment securities: | | |
Unaffiliated issuers | 14,981,914 | |
Foreign currency transactions | (3,117) | |
Total net realized gain (loss) | | 14,978,797 |
Change in net unrealized appreciation (depreciation) on: Investment securities | 7,198,392 | |
Assets and liabilities in foreign currencies | (96) | |
Total change in net unrealized appreciation (depreciation) | | 7,198,296 |
Net gain (loss) | | 22,177,093 |
Net increase (decrease) in net assets resulting from operations | | $ 23,085,524 |
See accompanying notes which are an integral part of the financial statements.
Annual Report
Statement of Changes in Net Assets
| Year ended
January 31,
2013 | Year ended
January 31,
2012 |
Increase (Decrease) in Net Assets | | |
Operations | | |
Net investment income (loss) | $ 908,431 | $ (81,197) |
Net realized gain (loss) | 14,978,797 | 18,062,027 |
Change in net unrealized appreciation (depreciation) | 7,198,296 | (12,510,318) |
Net increase (decrease) in net assets resulting
from operations | 23,085,524 | 5,470,512 |
Distributions to shareholders from net investment income | (1,066,324) | - |
Share transactions - net increase (decrease) | (8,699,386) | 17,565,380 |
Total increase (decrease) in net assets | 13,319,814 | 23,035,892 |
| | |
Net Assets | | |
Beginning of period | 159,530,948 | 136,495,056 |
End of period (including accumulated net investment loss of $43,376 and accumulated net investment loss of $77,636, respectively) | $ 172,850,762 | $ 159,530,948 |
See accompanying notes which are an integral part of the financial statements.
Annual Report
Financial Highlights - Class A
Years ended January 31, | 2013 | 2012 | 2011 | 2010 | 2009 |
Selected Per-Share Data | | | | | |
Net asset value, beginning of period | $ 10.24 | $ 9.84 | $ 7.64 | $ 6.12 | $ 9.85 |
Income from Investment Operations | | | | | |
Net investment income (loss) C | .04 | (.03) | (.02) | .01 | .02 |
Net realized and unrealized gain (loss) | 1.45 | .43 | 2.22 | 1.53 | (3.71) |
Total from investment operations | 1.49 | .40 | 2.20 | 1.54 | (3.69) |
Distributions from net investment income | (.05) | - | - | (.02) | (.04) |
Net asset value, end of period | $ 11.68 | $ 10.24 | $ 9.84 | $ 7.64 | $ 6.12 |
Total Return A,B | 14.52% | 4.07% | 28.80% | 25.14% | (37.49)% |
Ratios to Average Net Assets D,F | | | | | |
Expenses before reductions | 1.23% | 1.17% | 1.12% | 1.07% | 1.01% |
Expenses net of fee waivers, if any | 1.23% | 1.17% | 1.12% | 1.07% | 1.01% |
Expenses net of all reductions | 1.21% | 1.16% | 1.12% | 1.06% | 1.01% |
Net investment income (loss) | .32% | (.26)% | (.28)% | .08% | .20% |
Supplemental Data | | | | | |
Net assets, end of period (000 omitted) | $ 13,900 | $ 12,727 | $ 6,669 | $ 3,805 | $ 2,159 |
Portfolio turnover rate E | 151% | 108% | 126% | 342% | 355% |
A Total returns would have been lower if certain expenses had not been reduced during the applicable periods shown.
B Total returns do not include the effect of the sales charges.
C Calculated based on average shares outstanding during the period.
D Fees and expenses of any underlying Fidelity Central Funds are not included in the Fund's expense ratio. The Fund indirectly bears its proportionate share of the expenses of any underlying Fidelity Central Funds.
E Amount does not include the portfolio activity of any underlying Fidelity Central Funds.
F Expense ratios reflect operating expenses of the class. Expenses before reductions do not reflect amounts reimbursed by the investment adviser or reductions from brokerage service arrangements or reductions from other expense offset arrangements and do not represent the amount paid by the class during periods when reimbursements or reductions occur. Expenses net of fee waivers reflect expenses after reimbursement by the investment adviser but prior to reductions from brokerage service arrangements or other expense offset arrangements. Expenses net of all reductions represent the net expenses paid by the class.
See accompanying notes which are an integral part of the financial statements.
Annual Report
Financial Highlights - Class T
Years ended January 31, | 2013 | 2012 | 2011 | 2010 | 2009 |
Selected Per-Share Data | | | | | |
Net asset value, beginning of period | $ 10.15 | $ 9.78 | $ 7.61 | $ 6.11 | $ 9.85 |
Income from Investment Operations | | | | | |
Net investment income (loss) C | .01 | (.05) | (.05) | (.02) | (.01) |
Net realized and unrealized gain (loss) | 1.44 | .42 | 2.22 | 1.52 | (3.70) |
Total from investment operations | 1.45 | .37 | 2.17 | 1.50 | (3.71) |
Distributions from net investment income | (.02) | - | - | - G | (.03) |
Net asset value, end of period | $ 11.58 | $ 10.15 | $ 9.78 | $ 7.61 | $ 6.11 |
Total Return A,B | 14.30% | 3.78% | 28.52% | 24.60% | (37.71)% |
Ratios to Average Net Assets D,F | | | | | |
Expenses before reductions | 1.52% | 1.44% | 1.42% | 1.38% | 1.31% |
Expenses net of fee waivers, if any | 1.50% | 1.44% | 1.42% | 1.38% | 1.31% |
Expenses net of all reductions | 1.48% | 1.44% | 1.42% | 1.36% | 1.31% |
Net investment income (loss) | .05% | (.53)% | (.58)% | (.23)% | (.10)% |
Supplemental Data | | | | | |
Net assets, end of period (000 omitted) | $ 6,084 | $ 5,876 | $ 2,900 | $ 1,548 | $ 820 |
Portfolio turnover rate E | 151% | 108% | 126% | 342% | 355% |
A Total returns would have been lower if certain expenses had not been reduced during the applicable periods shown.
B Total returns do not include the effect of the sales charges.
C Calculated based on average shares outstanding during the period.
D Fees and expenses of any underlying Fidelity Central Funds are not included in the Fund's expense ratio. The Fund indirectly bears its proportionate share of the expenses of any underlying Fidelity Central Funds.
E Amount does not include the portfolio activity of any underlying Fidelity Central Funds.
F Expense ratios reflect operating expenses of the class. Expenses before reductions do not reflect amounts reimbursed by the investment adviser or reductions from brokerage service arrangements or reductions from other expense offset arrangements and do not represent the amount paid by the class during periods when reimbursements or reductions occur. Expenses net of fee waivers reflect expenses after reimbursement by the investment adviser but prior to reductions from brokerage service arrangements or other expense offset arrangements. Expenses net of all reductions represent the net expenses paid by the class.
G Amount represents less than $.01 per share.
See accompanying notes which are an integral part of the financial statements.
Annual Report
Financial Highlights - Class B
Years ended January 31, | 2013 | 2012 | 2011 | 2010 | 2009 |
Selected Per-Share Data | | | | | |
Net asset value, beginning of period | $ 9.99 | $ 9.68 | $ 7.57 | $ 6.09 | $ 9.83 |
Income from Investment Operations | | | | | |
Net investment income (loss) C | (.05) | (.10) | (.09) | (.05) | (.05) |
Net realized and unrealized gain (loss) | 1.42 | .41 | 2.20 | 1.53 | (3.69) |
Total from investment operations | 1.37 | .31 | 2.11 | 1.48 | (3.74) |
Distributions from net investment income | - | - | - | - | - G |
Net asset value, end of period | $ 11.36 | $ 9.99 | $ 9.68 | $ 7.57 | $ 6.09 |
Total Return A,B | 13.71% | 3.20% | 27.87% | 24.30% | (38.01)% |
Ratios to Average Net Assets D,F | | | | | |
Expenses before reductions | 1.98% | 1.92% | 1.87% | 1.82% | 1.76% |
Expenses net of fee waivers, if any | 1.98% | 1.92% | 1.87% | 1.82% | 1.76% |
Expenses net of all reductions | 1.96% | 1.92% | 1.87% | 1.80% | 1.76% |
Net investment income (loss) | (.43)% | (1.01)% | (1.03)% | (.67)% | (.56)% |
Supplemental Data | | | | | |
Net assets, end of period (000 omitted) | $ 1,451 | $ 1,610 | $ 2,143 | $ 1,466 | $ 815 |
Portfolio turnover rate E | 151% | 108% | 126% | 342% | 355% |
A Total returns would have been lower if certain expenses had not been reduced during the applicable periods shown.
B Total returns do not include the effect of the contingent deferred sales charge.
C Calculated based on average shares outstanding during the period.
D Fees and expenses of any underlying Fidelity Central Funds are not included in the Fund's expense ratio. The Fund indirectly bears its proportionate share of the expenses of any underlying Fidelity Central Funds.
E Amount does not include the portfolio activity of any underlying Fidelity Central Funds.
F Expense ratios reflect operating expenses of the class. Expenses before reductions do not reflect amounts reimbursed by the investment adviser or reductions from brokerage service arrangements or reductions from other expense offset arrangements and do not represent the amount paid by the class during periods when reimbursements or reductions occur. Expenses net of fee waivers reflect expenses after reimbursement by the investment adviser but prior to reductions from brokerage service arrangements or other expense offset arrangements. Expenses net of all reductions represent the net expenses paid by the class.
G Amount represents less than $.01 per share.
See accompanying notes which are an integral part of the financial statements.
Annual Report
Financial Highlights - Class C
Years ended January 31, | 2013 | 2012 | 2011 | 2010 | 2009 |
Selected Per-Share Data | | | | | |
Net asset value, beginning of period | $ 9.93 | $ 9.62 | $ 7.52 | $ 6.06 | $ 9.82 |
Income from Investment Operations | | | | | |
Net investment income (loss) C | (.05) | (.10) | (.09) | (.05) | (.04) |
Net realized and unrealized gain (loss) | 1.42 | .41 | 2.19 | 1.51 | (3.69) |
Total from investment operations | 1.37 | .31 | 2.10 | 1.46 | (3.73) |
Distributions from net investment income | - | - | - | - | (.03) |
Net asset value, end of period | $ 11.30 | $ 9.93 | $ 9.62 | $ 7.52 | $ 6.06 |
Total Return A,B | 13.80% | 3.22% | 27.93% | 24.09% | (37.98)% |
Ratios to Average Net Assets D,F | | | | | |
Expenses before reductions | 1.98% | 1.92% | 1.87% | 1.82% | 1.77% |
Expenses net of fee waivers, if any | 1.98% | 1.92% | 1.87% | 1.82% | 1.77% |
Expenses net of all reductions | 1.96% | 1.91% | 1.87% | 1.80% | 1.77% |
Net investment income (loss) | (.43)% | (1.00)% | (1.03)% | (.67)% | (.57)% |
Supplemental Data | | | | | |
Net assets, end of period (000 omitted) | $ 7,877 | $ 6,061 | $ 3,623 | $ 1,917 | $ 1,441 |
Portfolio turnover rate E | 151% | 108% | 126% | 342% | 355% |
A Total returns would have been lower if certain expenses had not been reduced during the applicable periods shown.
B Total returns do not include the effect of the contingent deferred sales charge.
C Calculated based on average shares outstanding during the period.
D Fees and expenses of any underlying Fidelity Central Funds are not included in the Fund's expense ratio. The Fund indirectly bears its proportionate share of the expenses of any underlying Fidelity Central Funds.
E Amount does not include the portfolio activity of any underlying Fidelity Central Funds.
F Expense ratios reflect operating expenses of the class. Expenses before reductions do not reflect amounts reimbursed by the investment adviser or reductions from brokerage service arrangements or reductions from other expense offset arrangements and do not represent the amount paid by the class during periods when reimbursements or reductions occur. Expenses net of fee waivers reflect expenses after reimbursement by the investment adviser but prior to reductions from brokerage service arrangements or other expense offset arrangements. Expenses net of all reductions represent the net expenses paid by the class.
See accompanying notes which are an integral part of the financial statements.
Annual Report
Financial Highlights - Large Cap Growth
Years ended January 31, | 2013 | 2012 | 2011 | 2010 | 2009 |
Selected Per-Share Data | | | | | |
Net asset value, beginning of period | $ 10.36 | $ 9.93 | $ 7.69 | $ 6.15 | $ 9.89 |
Income from Investment Operations | | | | | |
Net investment income (loss) B | .07 | - F | - F | .02 | .04 |
Net realized and unrealized gain (loss) | 1.48 | .43 | 2.24 | 1.55 | (3.73) |
Total from investment operations | 1.55 | .43 | 2.24 | 1.57 | (3.69) |
Distributions from net investment income | (.08) | - | - | (.03) | (.05) |
Net asset value, end of period | $ 11.83 | $ 10.36 | $ 9.93 | $ 7.69 | $ 6.15 |
Total Return A | 15.00% | 4.33% | 29.13% | 25.50% | (37.36)% |
Ratios to Average Net Assets C,E | | | | | |
Expenses before reductions | .91% | .88% | .87% | .81% | .75% |
Expenses net of fee waivers, if any | .91% | .88% | .87% | .81% | .74% |
Expenses net of all reductions | .90% | .87% | .86% | .80% | .74% |
Net investment income (loss) | .64% | .04% | (.02)% | .34% | .47% |
Supplemental Data | | | | | |
Net assets, end of period (000 omitted) | $ 139,813 | $ 132,123 | $ 120,671 | $ 96,661 | $ 85,332 |
Portfolio turnover rate D | 151% | 108% | 126% | 342% | 355% |
A Total returns would have been lower if certain expenses had not been reduced during the applicable periods shown.
B Calculated based on average shares outstanding during the period.
C Fees and expenses of any underlying Fidelity Central Funds are not included in the Fund's expense ratio. The Fund indirectly bears its proportionate share of the expenses of any underlying Fidelity Central Funds.
D Amount does not include the portfolio activity of any underlying Fidelity Central Funds.
E Expense ratios reflect operating expenses of the class. Expenses before reductions do not reflect amounts reimbursed by the investment adviser or reductions from brokerage service arrangements or reductions from other expense offset arrangements and do not represent the amount paid by the class during periods when reimbursements or reductions occur. Expenses net of fee waivers reflect expenses after reimbursement by the investment adviser but prior to reductions from brokerage service arrangements or other expense offset arrangements. Expenses net of all reductions represent the net expenses paid by the class.
F Amount represents less than $.01 per share.
See accompanying notes which are an integral part of the financial statements.
Annual Report
Financial Highlights - Institutional Class
Years ended January 31, | 2013 | 2012 | 2011 | 2010 | 2009 |
Selected Per-Share Data | | | | | |
Net asset value, beginning of period | $ 10.41 | $ 9.97 | $ 7.72 | $ 6.18 | $ 9.88 |
Income from Investment Operations | | | | | |
Net investment income (loss) B | .08 | .01 | - F | .03 | .04 |
Net realized and unrealized gain (loss) | 1.47 | .43 | 2.25 | 1.54 | (3.72) |
Total from investment operations | 1.55 | .44 | 2.25 | 1.57 | (3.68) |
Distributions from net investment income | (.09) | - | - | (.03) | (.02) |
Net asset value, end of period | $ 11.87 | $ 10.41 | $ 9.97 | $ 7.72 | $ 6.18 |
Total Return A | 14.98% | 4.41% | 29.15% | 25.42% | (37.29)% |
Ratios to Average Net Assets C,E | | | | | |
Expenses before reductions | .83% | .83% | .86% | .76% | .68% |
Expenses net of fee waivers, if any | .83% | .83% | .86% | .76% | .68% |
Expenses net of all reductions | .82% | .82% | .86% | .74% | .68% |
Net investment income (loss) | .72% | .08% | (.02)% | .39% | .52% |
Supplemental Data | | | | | |
Net assets, end of period (000 omitted) | $ 3,725 | $ 1,134 | $ 488 | $ 111 | $ 277 |
Portfolio turnover rate D | 151% | 108% | 126% | 342% | 355% |
A Total returns would have been lower if certain expenses had not been reduced during the applicable periods shown.
B Calculated based on average shares outstanding during the period.
C Fees and expenses of any underlying Fidelity Central Funds are not included in the Fund's expense ratio. The Fund indirectly bears its proportionate share of the expenses of any underlying Fidelity Central Funds.
D Amount does not include the portfolio activity of any underlying Fidelity Central Funds.
E Expense ratios reflect operating expenses of the class. Expenses before reductions do not reflect amounts reimbursed by the investment adviser or reductions from brokerage service arrangements or reductions from other expense offset arrangements and do not represent the amount paid by the class during periods when reimbursements or reductions occur. Expenses net of fee waivers reflect expenses after reimbursement by the investment adviser but prior to reductions from brokerage service arrangements or other expense offset arrangements. Expenses net of all reductions represent the net expenses paid by the class.
F Amount represents less than $.01 per share.
See accompanying notes which are an integral part of the financial statements.
Annual Report
Notes to Financial Statements
For the period ended January 31, 2013
1. Organization.
Fidelity Large Cap Growth Fund (the Fund) is a fund of Fidelity Devonshire Trust (the Trust) and is authorized to issue an unlimited number of shares. The Trust is registered under the Investment Company Act of 1940, as amended (the 1940 Act), as an open-end management investment company organized as a Massachusetts business trust. The Fund offers Class A, Class T, Class C, Large Cap Growth, and Institutional Class shares, each of which, along with Class B shares, has equal rights as to assets and voting privileges. Class B shares are closed to new accounts and additional purchases, except for exchanges and reinvestments. Effective after the close of business on December 14, 2012, the Fund's other share classes were closed to new accounts with certain exceptions. Each class has exclusive voting rights with respect to matters that affect that class. Class B shares will automatically convert to Class A shares after a holding period of seven years from the initial date of purchase. Investment income, realized and unrealized capital gains and losses, the common expenses of the Fund, and certain fund-level expense reductions, if any, are allocated on a pro-rata basis to each class based on the relative net assets of each class to the total net assets of the Fund. Each class differs with respect to transfer agent and distribution and service plan fees incurred. Certain expense reductions may also differ by class.
2. Investments in Fidelity Central Funds.
The Fund invests in Fidelity Central Funds, which are open-end investment companies available only to other investment companies and accounts managed by Fidelity Management & Research Company (FMR) and its affiliates. The Fund's Schedule of Investments lists each of the Fidelity Central Funds held as of period end, if any, as an investment of the Fund, but does not include the underlying holdings of each Fidelity Central Fund. As an Investing Fund, the Fund indirectly bears its proportionate share of the expenses of the underlying Fidelity Central Funds.
The Money Market Central Funds seek preservation of capital and current income and are managed by Fidelity Investments Money Management, Inc. (FIMM), an affiliate of FMR.
A complete unaudited list of holdings for each Fidelity Central Fund is available upon request or at the Securities and Exchange Commission (the SEC) website at www.sec.gov. In addition, the financial statements of the Fidelity Central Funds, which are not covered by the Fund's Report of Independent Registered Public Accounting Firm, are available on the SEC website or upon request.
3. Significant Accounting Policies.
The financial statements have been prepared in conformity with accounting principles generally accepted in the United States of America (GAAP), which require management
Annual Report
3. Significant Accounting Policies - continued
to make certain estimates and assumptions at the date of the financial statements. Actual results could differ from those estimates. Subsequent events, if any, through the date that the financial statements were issued have been evaluated in the preparation of the financial statements. The following summarizes the significant accounting policies of the Fund:
Investment Valuation. Investments are valued as of 4:00 p.m. Eastern time on the last calendar day of the period. In accordance with valuation policies and procedures approved by the Board of Trustees (the Board), the Fund attempts to obtain prices from one or more third party pricing vendors or brokers to value its investments. When current market prices, quotations or currency exchange rates are not readily available or reliable, investments will be fair valued in good faith by the FMR Fair Value Committee (the Committee), in accordance with procedures adopted by the Fund's Board. Factors used in determining fair value vary by investment type and may include market or investment specific events, changes in interest rates and credit quality. The frequency with which these procedures are used cannot be predicted and they may be utilized to a significant extent. The Committee oversees the Fund's valuation policies and procedures and is responsible for approving and reporting to the Board all fair value determinations.
The Fund categorizes the inputs to valuation techniques used to value its investments into a disclosure hierarchy consisting of three levels as shown below:
Level 1 - quoted prices in active markets for identical investments
Level 2 - other significant observable inputs (including quoted prices for similar investments, interest rates, prepayment speeds, etc.)
Level 3 - unobservable inputs (including the Fund's own assumptions based on the best information available)
Valuation techniques used to value the Fund's investments by major category are as follows:
Equity securities, including restricted securities, for which market quotations are readily available, are valued at the last reported sale price or official closing price as reported by a third party pricing vendor on the primary market or exchange on which they are traded and are categorized as Level 1 in the hierarchy. In the event there were no sales during the day or closing prices are not available, securities are valued at the last quoted bid price or may be valued using the last available price and are generally categorized as Level 2 in the hierarchy. For foreign equity securities, when significant market or security specific events arise, comparisons to the valuation of American Depositary Receipts (ADRs), futures contracts, Exchange-Traded Funds (ETFs) and certain indexes as well
Annual Report
Notes to Financial Statements - continued
3. Significant Accounting Policies - continued
Investment Valuation - continued
as quoted prices for similar securities are used and are categorized as Level 2 in the hierarchy. Utilizing these techniques may result in transfers between Level 1 and Level 2.
Investments in open-end mutual funds, including the Fidelity Central Funds, are valued at their closing net asset value (NAV) each business day and are categorized as Level 1 in the hierarchy.
Changes in valuation techniques may result in transfers in or out of an assigned level within the disclosure hierarchy. The aggregate value of investments by input level, as of January 31, 2013, is included at the end of the Fund's Schedule of Investments.
Foreign Currency. The Fund may use foreign currency contracts to facilitate transactions in foreign-denominated securities. Gains and losses from these transactions may arise from changes in the value of the foreign currency or if the counterparties do not perform under the contracts' terms.
Foreign-denominated assets, including investment securities, and liabilities are translated into U.S. dollars at the exchange rates at period end. Purchases and sales of investment securities, income and dividends received and expenses denominated in foreign currencies are translated into U.S. dollars at the exchange rate in effect on the transaction date.
The effects of exchange rate fluctuations on investments are included with the net realized and unrealized gain (loss) on investment securities. Other foreign currency transactions resulting in realized and unrealized gain (loss) are disclosed separately.
Investment Transactions and Income. For financial reporting purposes, the Fund's investment holdings and NAV include trades executed through the end of the last business day of the period. The NAV per share for processing shareholder transactions is calculated as of the close of business of the New York Stock Exchange (NYSE), normally 4:00 p.m. Eastern time and includes trades executed through the end of the prior business day. Gains and losses on securities sold are determined on the basis of identified cost and may include proceeds received from litigation. Dividend income is recorded on the ex-dividend date, except for certain dividends from foreign securities where the ex-dividend date may have passed, which are recorded as soon as the Fund is informed of the ex-dividend date. Non-cash dividends included in dividend income, if any, are recorded at the fair market value of the securities received. Distributions received on securities that represent a return of capital or capital gain are recorded as a reduction of cost of investments and/or as a realized gain. The Fund estimates the components of distributions received that may be considered return of capital distributions or capital gain distributions. Interest income and distributions from the Fidelity Central Funds are
Annual Report
3. Significant Accounting Policies - continued
Investment Transactions and Income - continued
accrued as earned. Investment income is recorded net of foreign taxes withheld where recovery of such taxes is uncertain.
Expenses. Expenses directly attributable to a fund are charged to that fund. Expenses attributable to more than one fund are allocated among the respective funds on the basis of relative net assets or other appropriate methods. Expense estimates are accrued in the period to which they relate and adjustments are made when actual amounts are known.
Income Tax Information and Distributions to Shareholders. Each year, the Fund intends to qualify as a regulated investment company under Subchapter M of the Internal Revenue Code, including distributing substantially all of its taxable income and realized gains. As a result, no provision for income taxes is required. As of January 31, 2013, the Fund did not have any unrecognized tax benefits in the financial statements; nor is the und aware of any tax positions for which it is reasonably possible that the total amounts of unrecognized tax benefits will significantly change in the next twelve months. The Fund files a U.S. federal tax return, in addition to state and local tax returns as required. A fund's federal income tax returns are subject to examination by the Internal Revenue Service (IRS) for a period of three fiscal years after they are filed. State and local tax returns may be subject to examination for an additional fiscal year depending on the jurisdiction. Foreign taxes are provided for based on the Fund's understanding of the tax rules and rates that exist in the foreign markets in which it invests.
Distributions are declared and recorded on the ex-dividend date. Income dividends and capital gain distributions are declared separately for each class. Income and capital gain distributions are determined in accordance with income tax regulations, which may differ from GAAP.
Capital accounts within the financial statements are adjusted for permanent book-tax differences. These adjustments have no impact on net assets or the results of operations. Temporary book-tax differences will reverse in a subsequent period.
Book-tax differences are primarily due to foreign currency transactions, capital loss carryforwards, partnerships and losses deferred due to wash sales and excise tax regulations.
Annual Report
Notes to Financial Statements - continued
3. Significant Accounting Policies - continued
Income Tax Information and Distributions to Shareholders - continued
The federal tax cost of investment securities and unrealized appreciation (depreciation) as of period end were as follows:
Gross unrealized appreciation | $ 20,880,542 |
Gross unrealized depreciation | (1,962,681) |
Net unrealized appreciation (depreciation) on securities and other investments | $ 18,917,861 |
| |
Tax Cost | $ 153,877,596 |
The tax-based components of distributable earnings as of period end were as follows:
Capital loss carryforward | $ (2,764,993) |
Net unrealized appreciation (depreciation) | $ 18,917,491 |
Capital loss carryforwards are only available to offset future capital gains of the Fund to the extent provided by regulations and may be limited. Under the Regulated Investment Company Modernization Act of 2010 (the Act), the Fund is permitted to carry forward capital losses incurred in taxable years beginning after December 22, 2010 for an unlimited period and such capital losses are required to be used prior to any losses that expire. Capital loss carryforwards were as follows:
Fiscal year of expiration |
2018 | $ (2,764,993) |
The tax character of distributions paid was as follows:
| January 31, 2013 | January 31, 2012 |
Ordinary Income | $ 1,066,324 | $ - |
4. Purchases and Sales of Investments.
Purchases and sales of securities, other than short-term securities, aggregated $246,994,013 and $256,698,436, respectively.
5. Fees and Other Transactions with Affiliates.
Management Fee. FMR and its affiliates provide the Fund with investment management related services for which the Fund pays a monthly management fee. The management fee is the sum of an individual fund fee rate that is based on an annual rate of .30% of the Fund's average net assets and an annualized group fee rate that averaged .26% during the period. The group fee rate is based upon the average net assets of all the
Annual Report
5. Fees and Other Transactions with Affiliates - continued
Management Fee - continued
mutual funds advised by FMR. The group fee rate decreases as assets under management increase and increases as assets under management decrease. In addition, the management fee is subject to a performance adjustment (up to a maximum of ± .20% of the Fund's average net assets over a 36 month performance period). The upward or downward adjustment to the management fee is based on the relative investment performance of Large Cap Growth as compared to an appropriate benchmark index. For the period, the total annual management fee rate, including the performance adjustment, was .53% of the Fund's average net assets.
Distribution and Service Plan Fees. In accordance with Rule 12b-1 of the 1940 Act, the Fund has adopted separate Distribution and Service Plans for each class of shares. Certain classes pay Fidelity Distributors Corporation (FDC), an affiliate of FMR, separate Distribution and Service Fees, each of which is based on an annual percentage of each class' average net assets. In addition, FDC may pay financial intermediaries for selling shares of the Fund and providing shareholder support services. For the period, the Distribution and Service Fee rates, total fees and amounts retained by FDC were as follows:
| Distribution
Fee | Service
Fee | Total Fees | Retained
by FDC |
Class A | -% | .25% | $ 34,262 | $ 2,314 |
Class T | .25% | .25% | 29,474 | 260 |
Class B | .75% | .25% | 15,344 | 11,529 |
Class C | .75% | .25% | 72,368 | 24,814 |
| | | $ 151,448 | $ 38,917 |
Sales Load. FDC may receive a front-end sales charge of up to 5.75% for selling Class A shares and 3.50% for selling Class T shares, some of which is paid to financial intermediaries for selling shares of the Fund. Depending on the holding period, FDC may receive contingent deferred sales charges levied on Class A, Class T, Class B, and Class C redemptions. The deferred sales charges range from 5.00% to 1.00% for Class B shares, 1.00% for Class C shares, 1.00% for certain purchases of Class A shares and .25% for certain purchases of Class T shares.
For the period, sales charge amounts retained by FDC were as follows:
| Retained
by FDC |
Class A | $ 10,526 |
Class T | 4,857 |
Class B* | 4,014 |
Class C* | 2,807 |
| $ 22,204 |
* When Class B and Class C shares are initially sold, FDC pays commissions from its own resources to financial intermediaries through which the sales are made.
Annual Report
Notes to Financial Statements - continued
5. Fees and Other Transactions with Affiliates - continued
Transfer Agent Fees. Fidelity Investments Institutional Operations Company, Inc. (FIIOC), an affiliate of FMR, is the transfer, dividend disbursing and shareholder servicing agent for each class of the Fund. FIIOC receives account fees and asset-based fees that vary according to the account size and type of account of the shareholders of the respective classes of the Fund. FIIOC pays for typesetting, printing and mailing of shareholder reports, except proxy statements. For the period, transfer agent fees for each class were as follows:
| Amount | % of
Average
Net Assets |
Class A | $ 41,337 | .30 |
Class T | 19,984 | .34 |
Class B | 4,613 | .30 |
Class C | 21,949 | .30 |
Large Cap Growth | 323,204 | .23 |
Institutional Class | 3,666 | .16 |
| $ 414,753 | |
Accounting and Security Lending Fees. Fidelity Service Company, Inc. (FSC), an affiliate of FMR, maintains the Fund's accounting records. The accounting fee is based on the level of average net assets for each month. Under a separate contract, FSC administers the security lending program. The security lending fee is based on the number and duration of lending transactions.
Brokerage Commissions. The Fund placed a portion of its portfolio transactions with brokerage firms which are affiliates of the investment adviser. The commissions paid to these affiliated firms were $6,094 for the period.
6. Committed Line of Credit.
The Fund participates with other funds managed by FMR or an affiliate in a $4.25 billion credit facility (the "line of credit") to be utilized for temporary or emergency purposes to fund shareholder redemptions or for other short-term liquidity purposes. The Fund has agreed to pay commitment fees on its pro-rata portion of the line of credit, which amounted to $442 and is reflected in Miscellaneous expenses on the Statement of Operations. During the period, there were no borrowings on this line of credit.
7. Security Lending.
The Fund lends portfolio securities through a lending agent from time to time in order to earn additional income. For equity securities, a lending agent is used and may loan securities to certain qualified borrowers, including Fidelity Capital Markets (FCM), a
Annual Report
7. Security Lending - continued
broker-dealer affiliated with the Fund. On the settlement date of the loan, the Fund receives collateral (in the form of U.S. Treasury obligations, letters of credit and/or cash) against the loaned securities and maintains collateral in an amount not less than 100% of the market value of the loaned securities during the period of the loan. The market value of the loaned securities is determined at the close of business of the Fund and any additional required collateral is delivered to the Fund on the next business day. If the borrower defaults on its obligation to return the securities loaned because of insolvency or other reasons, a fund could experience delays and costs in recovering the securities loaned or in gaining access to the collateral. Any cash collateral received is invested in the Fidelity Securities Lending Cash Central Fund. The value of loaned securities and cash collateral at period end are disclosed on the Fund's Statement of Assets and Liabilities. Security lending income represents the income earned on investing cash collateral, less rebates paid to borrowers and any lending agent fees associated with the loan, plus any premium payments received for lending certain types of securities. Security lending income is presented in the Statement of Operations as a component of income from Fidelity Central Funds. Total security lending income during the period amounted to $25,843. During the period, there were no securities loaned to FCM.
8. Expense Reductions.
The following classes were in reimbursement during the period:
| Expense
Limitations | Reimbursement |
Class T | 1.50% | $ 970 |
Many of the brokers with whom FMR places trades on behalf of the Fund provided services to the Fund in addition to trade execution. These services included payments of certain expenses on behalf of the Fund totaling $27,351 for the period.
In addition, through arrangements with the Fund's custodian, credits realized as a result of uninvested cash balances were used to reduce the Fund's expenses. During the period, these credits reduced the Fund's custody expenses by $5.
Annual Report
Notes to Financial Statements - continued
9. Distributions to Shareholders.
Distributions to shareholders of each class were as follows:
Years ended January 31, | 2013 |
From net investment income | |
Class A | $ 53,334 |
Class T | 10,579 |
Large Cap Growth | 973,019 |
Institutional Class | 29,392 |
Total | $ 1,066,324 |
10. Share Transactions.
Transactions for each class of shares were as follows:
| Shares | Dollars |
Years ended January 31, | 2013 | 2012 | 2013 | 2012 |
Class A | | | | |
Shares sold | 433,337 | 943,999 | $ 4,740,889 | $ 9,391,213 |
Reinvestment of distributions | 4,558 | - | 50,641 | - |
Shares redeemed | (491,229) | (378,889) | (5,447,040) | (3,682,555) |
Net increase (decrease) | (53,334) | 565,110 | $ (655,510) | $ 5,708,658 |
Class T | | | | |
Shares sold | 167,129 | 899,142 | $ 1,821,552 | $ 9,125,430 |
Reinvestment of distributions | 933 | - | 10,269 | - |
Shares redeemed | (221,388) | (616,824) | (2,417,742) | (6,053,114) |
Net increase (decrease) | (53,326) | 282,318 | $ (585,921) | $ 3,072,316 |
Class B | | | | |
Shares sold | 6,137 | 19,634 | $ 65,205 | $ 195,465 |
Reinvestment of distributions | - | - | - | - |
Shares redeemed | (39,593) | (80,066) | (425,001) | (776,888) |
Net increase (decrease) | (33,456) | (60,432) | $ (359,796) | $ (581,423) |
Class C | | | | |
Shares sold | 295,397 | 689,847 | $ 3,136,691 | $ 6,821,638 |
Reinvestment of distributions | - | - | - | - |
Shares redeemed | (208,272) | (456,431) | (2,198,388) | (4,462,829) |
Net increase (decrease) | 87,125 | 233,416 | $ 938,303 | $ 2,358,809 |
Large Cap Growth | | | | |
Shares sold | 3,639,058 | 6,389,996 | $ 40,657,344 | $ 64,463,259 |
Reinvestment of distributions | 85,063 | - | 956,110 | - |
Shares redeemed | (4,652,017) | (5,795,048) | (51,937,735) | (58,191,405) |
Net increase (decrease) | (927,896) | 594,948 | $ (10,324,281) | $ 6,271,854 |
Annual Report
10. Share Transactions - continued
| Shares | Dollars |
Years ended January 31, | 2013 | 2012 | 2013 | 2012 |
Institutional Class | | | | |
Shares sold | 242,405 | 185,823 | $ 2,707,389 | $ 1,915,796 |
Reinvestment of distributions | 2,336 | - | 26,346 | - |
Shares redeemed | (39,986) | (125,753) | (445,916) | (1,180,630) |
Net increase (decrease) | 204,755 | 60,070 | $ 2,287,819 | $ 735,166 |
11. Proposed Reorganization.
The Board of Trustees of the Fund approved an Agreement and Plan of Reorganization (the Agreement) between the Fund and Fidelity Stock Selector All Cap Fund. The Agreement provides for the transfer of all the assets and the assumption of all the liabilities of the Fund in exchange for corresponding shares of Fidelity Stock Selector All Cap Fund equal in value to the net assets of the Fund on the day the reorganization is effective.
A meeting of shareholders of the Fund is expected to be held during the second quarter of 2013. If approved by shareholders, the reorganization is expected to become effective on or about June 21, 2013. The reorganization is expected to qualify as a tax-free transaction with no gain or loss recognized by the funds or their shareholders.
12. Other.
The Fund's organizational documents provide former and current trustees and officers with a limited indemnification against liabilities arising in connection with the performance of their duties to the Fund. In the normal course of business, the Fund may also enter into contracts that provide general indemnifications. The Fund's maximum exposure under these arrangements is unknown as this would be dependent on future claims that may be made against the Fund. The risk of material loss from such claims is considered remote.
Annual Report
To the Trustees of Fidelity Devonshire Trust and the Shareholders of Fidelity Large Cap Growth Fund:
In our opinion, the accompanying statement of assets and liabilities, including the schedule of investments, and the related statements of operations and of changes in net assets and the financial highlights present fairly, in all material respects, the financial position of Fidelity Large Cap Growth Fund (a fund of Fidelity Devonshire Trust) at January 31, 2013, the results of its operations for the year then ended, the changes in its net assets for each of the two years in the period then ended and the financial highlights for each of the five years in the period then ended, in conformity with accounting principles generally accepted in the United States of America. These financial statements and financial highlights (hereafter referred to as "financial statements") are the responsibility of the Fidelity Large Cap Growth Fund's management. Our responsibility is to express an opinion on these financial statements based on our audits. We conducted our audits of these financial statements in accordance with the standards of the Public Company Accounting Oversight Board (United States). Those standards require that we plan and perform the audit to obtain reasonable assurance about whether the financial statements are free of material misstatement. An audit includes examining, on a test basis, evidence supporting the amounts and disclosures in the financial statements, assessing the accounting principles used and significant estimates made by management, and evaluating the overall financial statement presentation. We believe that our audits, which included confirmation of securities at January 31, 2013 by correspondence with the custodian and brokers, provide a reasonable basis for our opinion.
PricewaterhouseCoopers LLP
Boston, Massachusetts
March 15, 2013
Annual Report
The Trustees, Members of the Advisory Board, and executive officers of the trust and fund, as applicable, are listed below. The Board of Trustees governs the fund and is responsible for protecting the interests of shareholders. The Trustees are experienced executives who meet periodically throughout the year to oversee the fund's activities, review contractual arrangements with companies that provide services to the fund, oversee management of the risks associated with such activities and contractual arrangements, and review the fund's performance. Except for James C. Curvey, each of the Trustees oversees 234 Fidelity funds. Mr. Curvey oversees 453 Fidelity funds.
The Trustees hold office without limit in time except that (a) any Trustee may resign; (b) any Trustee may be removed by written instrument, signed by at least two-thirds of the number of Trustees prior to such removal; (c) any Trustee who requests to be retired or who has become incapacitated by illness or injury may be retired by written instrument signed by a majority of the other Trustees; and (d) any Trustee may be removed at any special meeting of shareholders by a two-thirds vote of the outstanding voting securities of the trust. Each Trustee who is not an interested person (as defined in the 1940 Act) (Independent Trustee), shall retire not later than the last day of the calendar year in which his or her 75th birthday occurs. The Independent Trustees may waive this mandatory retirement age policy with respect to individual Trustees. The executive officers and Advisory Board Members hold office without limit in time, except that any officer and Advisory Board Member may resign or may be removed by a vote of a majority of the Trustees at any regular meeting or any special meeting of the Trustees. Except as indicated, each individual has held the office shown or other offices in the same company for the past five years.
Experience, Skills, Attributes, and Qualifications of the Fund's Trustees. The Governance and Nominating Committee has adopted a statement of policy that describes the experience, qualifications, attributes, and skills that are necessary and desirable for potential Independent Trustee candidates (Statement of Policy). The Board believes that each Trustee satisfied at the time he or she was initially elected or appointed a Trustee, and continues to satisfy, the standards contemplated by the Statement of Policy. The Governance and Nominating Committee also engages professional search firms to help identify potential Independent Trustee candidates who have the experience, qualifications, attributes, and skills consistent with the Statement of Policy. From time to time, additional criteria based on the composition and skills of the current Independent Trustees, as well as experience or skills that may be appropriate in light of future changes to board composition, business conditions, and regulatory or other developments, have also been considered by the professional search firms and the Governance and Nominating Committee. In addition, the Board takes into account the Trustees' commitment and participation in Board and committee meetings, as well as their leadership of standing and ad hoc committees throughout their tenure.
In determining that a particular Trustee was and continues to be qualified to serve as a Trustee, the Board has considered a variety of criteria, none of which, in isolation, was controlling. The Board believes that, collectively, the Trustees have balanced and diverse experience, qualifications, attributes, and skills, which allow the Board to operate effectively in governing the fund and protecting the interests of shareholders. Information about the specific experience, skills, attributes, and qualifications of each Trustee, which in each case led to the Board's conclusion that the Trustee should serve (or continue to serve) as a trustee of the fund, is provided below.
Annual Report
Trustees and Officers - continued
Board Structure and Oversight Function. James C. Curvey is an interested person (as defined in the 1940 Act) and currently serves as Chairman. The Trustees have determined that an interested Chairman is appropriate and benefits shareholders because an interested Chairman has a personal and professional stake in the quality and continuity of services provided to the fund. Independent Trustees exercise their informed business judgment to appoint an individual of their choosing to serve as Chairman, regardless of whether the Trustee happens to be independent or a member of management. The Independent Trustees have determined that they can act independently and effectively without having an Independent Trustee serve as Chairman and that a key structural component for assuring that they are in a position to do so is for the Independent Trustees to constitute a substantial majority for the Board. The Independent Trustees also regularly meet in executive session. Ned C. Lautenbach serves as Chairman of the Independent Trustees and as such (i) acts as a liaison between the Independent Trustees and management with respect to matters important to the Independent Trustees and (ii) with management prepares agendas for Board meetings.
Fidelity funds are overseen by different Boards of Trustees. The fund's Board oversees Fidelity's equity and high income funds and another Board oversees Fidelity's investment-grade bond, money market, and asset allocation funds. The asset allocation funds may invest in Fidelity funds overseen by the fund's Board. The use of separate Boards, each with its own committee structure, allows the Trustees of each group of Fidelity funds to focus on the unique issues of the funds they oversee, including common research, investment, and operational issues. On occasion, the separate Boards establish joint committees to address issues of overlapping consequences for the Fidelity funds overseen by each Board.
The Trustees operate using a system of committees to facilitate the timely and efficient consideration of all matters of importance to the Trustees, the fund, and fund shareholders and to facilitate compliance with legal and regulatory requirements and oversight of the fund's activities and associated risks. The Board, acting through its committees, has charged FMR and its affiliates with (i) identifying events or circumstances the occurrence of which could have demonstrably adverse effects on the fund's business and/or reputation; (ii) implementing processes and controls to lessen the possibility that such events or circumstances occur or to mitigate the effects of such events or circumstances if they do occur; and (iii) creating and maintaining a system designed to evaluate continuously business and market conditions in order to facilitate the identification and implementation processes described in (i) and (ii) above. Because the day-to-day operations and activities of the fund are carried out by or through FMR, its affiliates and other service providers, the fund's exposure to risks is mitigated but not eliminated by the processes overseen by the Trustees. While each of the Board's committees has responsibility for overseeing different aspects of the fund's activities, oversight is exercised primarily through the Operations, Audit, and Compliance Committees. In addition, the Independent Trustees have worked with FMR to enhance the Board's oversight of investment and financial risks, legal and regulatory risks, technology risks, and operational risks, including the development of additional risk reporting to the Board. For example, a working group comprised of Independent Trustees and FMR has worked and continues to work to review the Fidelity funds' valuation-related activities, reporting and risk management. Appropriate personnel, including but not limited to the fund's Chief Compliance Officer (CCO), FMR's internal auditor, the independent accountants, the fund's Treasurer and portfolio management personnel, make periodic reports to the Board's committees, as appropriate, including an annual review of FMR's risk management program for the Fidelity funds. The responsibilities of each standing committee, including their oversight responsibilities, are described further under "Standing Committees of the Fund's Trustees."
Annual Report
The fund's Statement of Additional Information (SAI) includes more information about the Trustees. To request a free copy, call Fidelity at 1-877-208-0098.
Interested Trustees*:
Correspondence intended for each Trustee who is an interested person may be sent to Fidelity Investments, 245 Summer Street, Boston, Massachusetts 02210.
Name, Age; Principal Occupations and Other Relevant Experience+ |
James C. Curvey (77) |
| Year of Election or Appointment: 2007 Mr. Curvey is Trustee and Chairman of the Board of Trustees of certain Trusts. Mr. Curvey also serves as Trustee (2007-present) of other investment companies advised by FMR. Mr. Curvey is a Director of Fidelity Investments Money Management, Inc. (2009-present), Director of Fidelity Research & Analysis Co. (2009-present) and Director of FMR and FMR Co., Inc. (2007-present). Mr. Curvey is also Vice Chairman (2007-present) and Director of FMR LLC. In addition, Mr. Curvey serves as an Overseer for the Boston Symphony Orchestra and a member of the Trustees of Villanova University. Previously, Mr. Curvey was the Vice Chairman (2006-2007) and Director (2000-2007) of FMR Corp. |
Ronald P. O'Hanley (55) |
| Year of Election or Appointment: 2011 Mr. O'Hanley is Director of FMR Co., Inc. (2010-present), Director of Fidelity Investments Money Management, Inc. (2010-present), Director of Fidelity Research & Analysis Company (2010-present), President of Fidelity Asset Management and Corporate Services and a member of Fidelity's Executive Committee (2010-present). Previously, Mr. O'Hanley served as President and Chief Executive Officer of BNY Mellon Asset Management (2007-2010). Mr. O'Hanley also served as Vice Chairman of Bank New York Mellon Corp. and a member of that firm's Executive Committee. Prior to the 2007 merger of The Bank of New York and Mellon Financial Corporation, he was Vice Chairman of Mellon Financial Corporation and President and Chief Executive Officer of Mellon Asset Management. He joined Mellon in February 1997. Mr. O'Hanley currently serves as Chairman of the Boston Public Library Foundation Board of Directors and sits on the Board of Directors of Beth Israel Deaconess Medical Center, the Board of Trustees of the Marine Biological Laboratory and the Advisory Board of the Maxwell School of Citizenship and Public Administration at Syracuse University. Mr. O'Hanley also chairs the Council on Asset Management for the Financial Services Roundtable and is a member of the Board of Directors of Institutional Investor's U.S. Institute. |
* Trustees have been determined to be "Interested Trustees" by virtue of, among other things, their affiliation with the trust or various entities under common control with FMR.
+ The information above includes each Trustee's principal occupation during the last five years and other information relating to the experience, attributes, and skills relevant to each Trustee's qualifications to serve as a Trustee, which led to the conclusion that each Trustee should serve as a Trustee for the fund.
Annual Report
Independent Trustees:
Correspondence intended for each Independent Trustee (that is, the Trustees other than the Interested Trustees) may be sent to Fidelity Investments, P.O. Box 55235, Boston, Massachusetts 02205-5235.
Name, Age; Principal Occupations and Other Relevant Experience+ |
Dennis J. Dirks (64) |
| Year of Election or Appointment: 2005 Prior to his retirement in May 2003, Mr. Dirks was Chief Operating Officer and a member of the Board of The Depository Trust & Clearing Corporation (DTCC). He also served as President, Chief Operating Officer, and Board member of The Depository Trust Company (DTC) and President and Board member of the National Securities Clearing Corporation (NSCC). In addition, Mr. Dirks served as Chief Executive Officer and Board member of the Government Securities Clearing Corporation, Chief Executive Officer and Board member of the Mortgage-Backed Securities Clearing Corporation, as a Trustee and a member of the Finance Committee of Manhattan College (2005-2008), and as a Trustee and a member of the Finance Committee of AHRC of Nassau County (2006-2008). Mr. Dirks is a member of the Independent Directors Council (IDC) Governing Council (2010-present) and Board of Directors for The Brookville Center for Children's Services, Inc. (2009-present). |
Alan J. Lacy (59) |
| Year of Election or Appointment: 2008 Mr. Lacy serves as Senior Adviser (2007-present) of Oak Hill Capital Partners, L.P. (private equity). Mr. Lacy also served as Chief Executive Officer (2000-2005) and Vice Chairman (2005-2006) of Sears Holdings Corporation and Sears, Roebuck and Co. (retail). In addition, Mr. Lacy serves as a member of the Board of Directors of Dave & Buster's Entertainment, Inc. (restaurant and entertainment complexes, 2010-present), Earth Fare, Inc. (retail grocery, 2012-present), The Hillman Companies, Inc. (hardware wholesalers, 2010-present), and Bristol-Myers Squibb Company (global pharmaceuticals, 2008-present). Mr. Lacy is a member of the Board of Trustees of The National Parks Conservation Association (2006-present). Previously, Mr. Lacy served as Chairman of the Board of Trustees of the National Parks Conservation Association (2008-2011) and as a member of the Board of Directors for the Western Union Company (global money transfer, 2006-2011). |
Ned C. Lautenbach (68) |
| Year of Election or Appointment: 2000 Mr. Lautenbach currently serves as the Lead Director of the Eaton Corporation Board of Directors (diversified industrial, 1997-present). Mr. Lautenbach is Chairman of the Board of Directors of the Philharmonic Center for the Arts in Naples, Florida (2012-present) and a member of the Council on Foreign Relations (1994-present). Previously, Mr. Lautenbach was a Partner/Advisory Partner at Clayton, Dubilier & Rice, LLC (private equity investment, 1998-2010), as well as a Director of Sony Corporation (2006-2007). |
Joseph Mauriello (68) |
| Year of Election or Appointment: 2008 Prior to his retirement in January 2006, Mr. Mauriello served in numerous senior management positions including Deputy Chairman and Chief Operating Officer (2004-2005), and Vice Chairman of Financial Services (2002-2004) of KPMG LLP US (professional services, 1965-2005). Mr. Mauriello currently serves as a member of the Board of Directors of XL Group plc. (global insurance and re-insurance, 2006-present). Previously, Mr. Mauriello served as a Director of the Hamilton Funds of the Bank of New York (2006-2007) and of Arcadia Resources Inc. (health care services and products, 2007-2012). |
Robert W. Selander (62) |
| Year of Election or Appointment: 2011 Previously, Mr. Selander served as a Member of the Advisory Board of Fidelity's Equity and High Income Funds (2011), Executive Vice Chairman (2010), Chief Executive Officer (2009-2010), and President and Chief Executive Officer (1997-2009) of Mastercard, Inc. |
Cornelia M. Small (68) |
| Year of Election or Appointment: 2005 Ms. Small is a member of the Board of Directors (2009-present) and Chair of the Investment Committee (2010-present) of the Teagle Foundation. Ms. Small also serves on the Investment Committee of the Berkshire Taconic Community Foundation (2008-present). Previously, Ms. Small served as Chairperson (2002-2008) and a member of the Investment Committee and Chairperson (2008-2012) and a member of the Board of Trustees of Smith College. In addition, Ms. Small served as Chief Investment Officer, Director of Global Equity Investments, and a member of the Board of Directors of Scudder, Stevens & Clark and Scudder Kemper Investments. |
William S. Stavropoulos (73) |
| Year of Election or Appointment: 2002 Mr. Stavropoulos is Vice Chairman of the Independent Trustees of the Equity and High Income Funds (2006-present). Mr. Stavropoulos serves as President and Founder of the Michigan Baseball Foundation, the Great Lakes Loons (2007-present). Mr. Stavropoulos is Chairman Emeritus of the Board of Directors of The Dow Chemical Company, where he previously served in numerous senior management positions, including President, CEO (1995-2000; 2002-2004), Chairman of the Executive Committee (2000-2006), and as a member of the Board of Directors (1990-2006). Currently, Mr. Stavropoulos is a Director of Univar Inc. (global distributor of commodity and specialty chemicals, Chairman from 2010-May 2012 and Lead Director from May 2012-present), Teradata Corporation (data warehousing and technology solutions, 2008-present), Maersk Inc. (industrial conglomerate), and Tyco International, Ltd. (multinational manufacturing and services, 2007-present), and a member of the Advisory Board for Metalmark Capital LLC (private equity investment, 2005-present). Mr. Stavropoulos is an operating advisor to Clayton, Dubilier & Rice, LLC (private equity investment). In addition, Mr. Stavropoulos is a member of the University of Notre Dame Advisory Council for the College of Science, a Trustee of the Rollin L. Gerstacker Foundation, and a Director of the Naples Philharmonic Center for the Arts. Previously, Mr. Stavropoulos served as a Director of Chemical Financial Corporation (bank holding company, 1993-2012). |
David M. Thomas (63) |
| Year of Election or Appointment: 2008 Previously, Mr. Thomas served as Executive Chairman (2005-2006) and Chairman and Chief Executive Officer (2000-2005) of IMS Health, Inc. (pharmaceutical and healthcare information solutions), and a Director of Fortune Brands, Inc. (consumer products, 2000-2011). In addition, Mr. Thomas serves as Non-Executive Chairman of the Board of Directors of Fortune Brands Home and Security (home and security products, 2011-present), and as a member of the Board of Directors of Interpublic Group of Companies, Inc. (marketing communication, 2004-present). |
Michael E. Wiley (62) |
| Year of Election or Appointment: 2008 Mr. Wiley also serves as a Director of Asia Pacific Exploration Consolidated (international oil and gas exploration and production, 2008-present). Mr. Wiley serves as a Director of Tesoro Corporation (independent oil refiner and marketer, 2005-present), and a Director of Bill Barrett Corporation (exploration and production, 2005-present). In addition, Mr. Wiley also serves as a Director of Post Oak Bank (privately-held bank, 2004-present). Previously, Mr. Wiley served as a member of the Board of Trustees of the University of Tulsa (2000-2006; 2007-2010), as a Senior Energy Advisor of Katzenbach Partners, LLC (consulting, 2006-2007), as an Advisory Director of Riverstone Holdings (private investment), Chairman, President, and CEO of Baker Hughes, Inc. (oilfield services, 2000-2004), and as Director of Spinnaker Exploration Company (exploration and production, 2001-2005). |
+ The information above includes each Trustee's principal occupation during the last five years and other information relating to the experience, attributes, and skills relevant to each Trustee's qualifications to serve as a Trustee, which led to the conclusion that each Trustee should serve as a Trustee for the fund.
Advisory Board Members and Executive Officers:
Correspondence intended for David A. Rosow and Garnett A. Smith may be sent to Fidelity Investments, P.O. Box 55235, Boston, Massachusetts 02205-5235. Correspondence intended for each executive officer and Peter S. Lynch may be sent to Fidelity Investments, 245 Summer Street, Boston, Massachusetts 02210.
Name, Age; Principal Occupation |
Peter S. Lynch (69) |
| Year of Election or Appointment: 2003 Member of the Advisory Board of Fidelity's Equity and High Income Funds. Mr. Lynch is Vice Chairman and a Director of FMR and FMR Co., Inc. In addition, Mr. Lynch serves as a Trustee of Boston College and as the Chairman of the Inner-City Scholarship Fund. Previously, Mr. Lynch served on the Special Olympics International Board of Directors (1997-2006). |
David A. Rosow (70) |
| Year of Election or Appointment: 2012 Member of the Advisory Board of Fidelity's Equity and High Income Funds. Chairman and Chief Executive Officer of International Golf Group, Inc. (golf course development, 1989-present). Previously, Mr. Rosow served as Chairman and Chief Executive Officer of Rosow & Company, Inc. (private investment company, 1989-2011), a Lead Director of Hudson United Bancorp (2001-2006) and as a Director of TD Banknorth (1996-2006). In addition, Mr. Rosow is a member (2008-present) and President (2009-present) of the Town Council of Palm Beach, Florida. |
Garnett A. Smith (65) |
| Year of Election or Appointment: 2012 Member of the Advisory Board of Fidelity's Equity and High Income Funds. Prior to Mr. Smith's retirement, he served as Chairman and Chief Executive Officer of Inbrand Corp. (manufacturer of personal absorbent products, 1990-1997). He also served as President (1986-1990) of Inbrand Corp. Prior to his employment with Inbrand Corp., he was employed by a retail fabric chain and North Carolina National Bank. In addition, Mr. Smith is a board member of the Jackson Hole Land Trust (2009-present). |
Kenneth B. Robins (43) |
| Year of Election or Appointment: 2008 President and Treasurer of Fidelity's Equity and High Income Funds. Mr. Robins also serves as President and Treasurer (2010-present) and Assistant Treasurer (2009-present) of other Fidelity funds and is an employee of Fidelity Investments (2004-present). Previously, Mr. Robins served as Deputy Treasurer of the Fidelity funds (2005-2008) and Treasurer and Chief Financial Officer of The North Carolina Capital Management Trust: Cash and Term Portfolios (2006-2008). |
Bruce T. Herring (47) |
| Year of Election or Appointment: 2006 Vice President of certain Equity Funds. Mr. Herring also serves as Chief Investment Officer of Fidelity Global Asset Allocation (GAA) (2013-present), Chief Investment Officer and Director of Fidelity Management & Research (U.K.) Inc. (2010-present), Group Chief Investment Officer of FMR, and President of Fidelity Research & Analysis Company (2010-present). Previously, Mr. Herring served as Vice President (2005-2006) and Senior Vice President (2006-2007) of Fidelity Management & Research Company, Vice President of FMR Co., Inc. (2001-2007) and as a portfolio manager for Fidelity U.S. Equity Funds. |
Brian B. Hogan (48) |
| Year of Election or Appointment: 2009 Vice President of Equity and High Income Funds. Mr. Hogan also serves as President of FMR's Equity Division (2009-present). Previously, Mr. Hogan served as Senior Vice President, Equity Research of FMR (2006-2009) and as a portfolio manager. |
Scott C. Goebel (45) |
| Year of Election or Appointment: 2008 Secretary and Chief Legal Officer (CLO) of the Fidelity funds. Mr. Goebel also serves as Secretary of Fidelity Investments Money Management, Inc. (FIMM) (2010-present) and Fidelity Research and Analysis Company (FRAC) (2010-present); Secretary and CLO of The North Carolina Capital Management Trust: Cash and Term Portfolios (2008-present); General Counsel, Secretary, and Senior Vice President of FMR (2008-present) and FMR Co., Inc. (2008-present); employed by FMR LLC or an affiliate (2001-present); Chief Legal Officer of Fidelity Management & Research (Hong Kong) Limited (2008-present) and Assistant Secretary of Fidelity Management & Research (Japan) Inc. (2008-present), and Fidelity Management & Research (U.K.) Inc. (2008-present). Previously, Mr. Goebel served as Assistant Secretary of FIMM (2008-2010), FRAC (2008-2010), and the Funds (2007-2008) and as Vice President and Secretary of Fidelity Distributors Corporation (FDC) (2005-2007). |
William C. Coffey (43) |
| Year of Election or Appointment: 2009 Assistant Secretary of Fidelity's Equity and High Income Funds. Mr. Coffey also serves as Senior Vice President and Deputy General Counsel of FMR LLC (2010-present), and is an employee of Fidelity Investments. Previously, Mr. Coffey served as Vice President and Associate General Counsel of FMR LLC (2005-2009). |
Elizabeth Paige Baumann (44) |
| Year of Election or Appointment: 2012 Anti-Money Laundering (AML) Officer of the Fidelity funds. Ms. Baumann also serves as AML Officer of The North Carolina Capital Management Trust: Cash and Term Portfolios (2012-present), Chief AML Officer of FMR LLC (2012-present), and is an employee of Fidelity Investments. Previously, Ms. Baumann served as Vice President and Deputy Anti-Money Laundering Officer (2007-2012). |
Christine Reynolds (54) |
| Year of Election or Appointment: 2008 Chief Financial Officer of the Fidelity funds. Ms. Reynolds became President of Fidelity Pricing and Cash Management Services (FPCMS) in August 2008. Ms. Reynolds served as Chief Operating Officer of FPCMS (2007-2008). Previously, Ms. Reynolds served as President, Treasurer, and Anti-Money Laundering officer of the Fidelity funds (2004-2007). |
Joseph A. Hanlon (44) |
| Year of Election or Appointment: 2012 Chief Compliance Officer of Fidelity's Equity and High Income Funds. Mr. Hanlon serves as Compliance Officer of FMR, FMR Co., Inc., Fidelity Investments Money Management, Inc. (FIMM), Fidelity Research and Analysis Company (FRAC), Fidelity Management & Research (Japan) Inc., Fidelity Management & Research (U.K.) Inc., Fidelity Management & Research (Hong Kong), and Strategic Advisers, Inc. (2009-present), as Senior Vice President of the Fidelity Asset Management Division (2009-present), and is an employee of Fidelity Investments. |
Joseph F. Zambello (55) |
| Year of Election or Appointment: 2011 Deputy Treasurer of the Fidelity funds. Mr. Zambello is an employee of Fidelity Investments. Previously, Mr. Zambello served as Vice President of FMR's Program Management Group (2009-2011) and Vice President of the Transfer Agent Oversight Group (2005-2009). |
Adrien E. Deberghes (45) |
| Year of Election or Appointment: 2008 Deputy Treasurer of Fidelity's Equity and High Income Funds. Mr. Deberghes also serves as Vice President (2011-present) and Assistant Treasurer (2010-present) of other Fidelity funds, and is an employee of Fidelity Investments (2008-present). Previously, Mr. Deberghes served as Senior Vice President of Mutual Fund Administration at State Street Corporation (2007-2008), Senior Director of Mutual Fund Administration at Investors Bank & Trust (2005-2007), and Director of Finance for Dunkin' Brands (2000-2005). |
Stephen Sadoski (41) |
| Year of Election or Appointment: 2012 Deputy Treasurer of Fidelity's Equity and High Income Funds. Mr. Sadoski also serves as Deputy Treasurer of other Fidelity funds (2013-present) and is an employee of Fidelity Investments (2012-present). Previously, Mr. Sadoski served as Assistant Treasurer of Fidelity's Fixed Income and Asset Allocation Funds (2012-2013), an assistant chief accountant in the Division of Investment Management of the Securities and Exchange Commission (SEC) (2009-2012) and as a senior manager at Deloitte & Touche (1997-2009). |
Stacie Smith (38) |
| Year of Election or Appointment: 2013 Deputy Treasurer of Fidelity's Equity and High Income Funds. Ms. Smith is an employee of Fidelity Investments (2009-present). Previously, Ms. Smith served as Senior Audit Manager of Ernst & Young LLP (1996-2009). |
Stephanie J. Dorsey (43) |
| Year of Election or Appointment: 2010 Assistant Treasurer of Fidelity's Equity and High Income Funds. Ms. Dorsey also serves as President and Treasurer (2013-present) and Assistant Treasurer (2012-present) of other Fidelity funds and is an employee of Fidelity Investments (2008-present). Previously, Ms. Dorsey served as Deputy Treasurer of Fidelity's Fixed Income and Asset Allocation Funds (2008-2013), Treasurer (2004-2008) of the JPMorgan Mutual Funds and Vice President (2004-2008) of JPMorgan Chase Bank. |
John R. Hebble (54) |
| Year of Election or Appointment: 2009 Assistant Treasurer of Fidelity's Equity and High Income Funds. Mr. Hebble also serves as President (2011-present), Treasurer, and Chief Financial Officer of The North Carolina Capital Management Trust: Cash and Term Portfolios (2008-present) and is an employee of Fidelity Investments. Previously, Mr. Hebble served as President and Treasurer of Fidelity's Fixed Income and Asset Allocation Funds (2008-2013). |
Gary W. Ryan (54) |
| Year of Election or Appointment: 2005 Assistant Treasurer of the Fidelity funds. Mr. Ryan is an employee of Fidelity Investments. Previously, Mr. Ryan served as Vice President of Fund Reporting in Fidelity Pricing and Cash Management Services (FPCMS) (1999-2005). |
Jonathan Davis (44) |
| Year of Election or Appointment: 2010 Assistant Treasurer of the Fidelity funds. Mr. Davis is also Assistant Treasurer of Fidelity Rutland Square Trust II and Fidelity Commonwealth Trust II. Mr. Davis is an employee of Fidelity Investments. Previously, Mr. Davis served as Vice President and Associate General Counsel of FMR LLC (2003-2010). |
Annual Report
Institutional Class designates 100% of the dividends distributed during the fiscal year as qualifying for the dividends-received deduction for corporate shareholders.
Institutional Class designates 100% of the dividends distributed during the fiscal year as amounts which may be taken into account as a dividend for the purposes of the maximum rate under section 1(h)(11) of the Internal Revenue Code.
The fund will notify shareholders in January 2014 of amounts for use in preparing 2013 income tax returns.
Annual Report
Investment Adviser
Fidelity Management & Research Company
Boston, MA
Investment Sub-Advisers
FMR Co., Inc.
Fidelity Management & Research
(U.K.) Inc.
Fidelity Management & Research
(Hong Kong) Limited
Fidelity Management & Research
(Japan) Inc.
General Distributor
Fidelity Distributors Corporation
Smithfield, RI
Transfer and Service Agents
Fidelity Investments Institutional Operations Company, Inc.
Boston, MA
Fidelity Service Company, Inc.
Boston, MA
Custodian
Citibank, N.A.
New York, NY
(Fidelity Investment logo)(registered trademark)
ALCGI-UANN-0313
1.900735.103
Fidelity®
Series Equity-Income Fund
and
Fidelity
Series Stock Selector Large Cap Value Fund
Fidelity Series Equity-Income Fund
Fidelity Series Stock Selector Large
Cap Value Fund
Class F
Annual Report
January 31, 2013
(Fidelity Cover Art)
Contents
Shareholder Expense Example | (Click Here) | An example of shareholder expenses. |
Fidelity® Series Equity-Income Fund |
Investment Summary | (Click Here) | A summary of the fund's holdings. |
Investments | (Click Here) | A complete list of the fund's investments with their market values. |
Financial Statements | (Click Here) | Statements of assets and liabilities, operations, and changes in net assets, as well as financial highlights. |
Fidelity® Series Stock Selector Large Cap Value Fund |
Investment Summary | (Click Here) | A summary of the fund's holdings. |
Investments | (Click Here) | A complete list of the fund's investments with their market values. |
Financial Statements | (Click Here) | Statements of assets and liabilities, operations, and changes in net assets, as well as financial highlights. |
Notes | (Click Here) | Notes to the Financial Statements. |
Reports of Independent Registered Public Accounting Firms | (Click Here) | |
Trustees and Officers | (Click Here) | |
Distributions | (Click Here) | |
Board Approval of Investment Advisory Contracts and Management Fees | (Click Here) | |
To view a fund's proxy voting guidelines and proxy voting record for the 12-month period ended June 30, visit http://www.fidelity.com/proxyvotingresults or visit the Securities and Exchange Commission's (SEC) web site at http://www.sec.gov. You may also call 1-800-544-8544 for Fidelity Series Equity-Income Fund and Fidelity Series Stock Selector Large Cap Value Fund or 1-800-835-5092 for Class F of each fund to request a free copy of the proxy voting guidelines.
Standard & Poor's, S&P and S&P 500 are registered service marks of The McGraw-Hill Companies, Inc. and have been licensed for use by Fidelity Distributors Corporation.
Other third-party marks appearing herein are the property of their respective owners.
All other marks appearing herein are registered or unregistered trademarks or service marks of FMR LLC or an affiliated company. © 2013 FMR LLC. All rights reserved.
Annual Report
This report and the financial statements contained herein are submitted for the general information of the shareholders of the funds. This report is not authorized for distribution to prospective investors in the funds unless preceded or accompanied by an effective prospectus.
A fund files its complete schedule of portfolio holdings with the SEC for the first and third quarters of each fiscal year on Form N-Q. Forms N-Q are available on the SEC's web site at http://www.sec.gov. A fund's Forms N-Q may be reviewed and copied at the SEC's Public Reference Room in Washington, DC. Information regarding the operation of the SEC's Public Reference Room may be obtained by calling 1-800-SEC-0330. For a complete list of a fund's portfolio holdings, view the most recent holdings listing, semiannual report, or annual report on Fidelity's web site at http://www.fidelity.com, http://www.advisor.fidelity.com, or http://www.401k.com, as applicable.
NOT FDIC INSURED • MAY LOSE VALUE • NO BANK GUARANTEE
Neither the funds nor Fidelity Distributors Corporation is a bank.
Annual Report
Shareholder Expense Example
As a shareholder of a Fund, you incur two types of costs: (1) transaction costs, and (2) ongoing costs, including management fees and other Fund expenses. This Example is intended to help you understand your ongoing costs (in dollars) of investing in the Funds and to compare these costs with the ongoing costs of investing in other mutual funds.
The actual expense Example is based on an investment of $1,000 invested at the beginning of the period and held for the entire period (December 6, 2012 to January 31, 2013). The hypothetical expense Example is based on an investment of $1,000 invested for the one-half year period (August 1, 2012 to January 31, 2013).
Actual Expenses
The first line of the accompanying table for each class of each fund provides information about actual account values and actual expenses. You may use the information in this line, together with the amount you invested, to estimate the expenses that you paid over the period. Simply divide your account value by $1,000.00 (for example, an $8,600 account value divided by $1,000.00 = 8.6), then multiply the result by the number in the first line for a class of the fund under the heading entitled "Expenses Paid During Period" to estimate the expenses you paid on your account during this period. In addition, each Fund, as a shareholder in the underlying Fidelity Central Funds, will indirectly bear its pro-rata share of the fees and expenses incurred by the underlying Fidelity Central Funds. These fees and expenses are not included in the Fund's annualized expense ratio used to calculate the expense estimate in the table below.
Hypothetical Example for Comparison Purposes
The second line of the accompanying table for each class of each fund provides information about hypothetical account values and hypothetical expenses based on a Class' actual expense ratio and an assumed rate of return of 5% per year before expenses, which is not the Class' actual return. The hypothetical account values and expenses may not be used to estimate the actual ending account balance or expenses you paid for the period. You may use this information to compare the ongoing costs of investing in the Fund and other funds. To do so, compare this 5% hypothetical example with the 5% hypothetical examples that appear in the shareholder reports of the other funds. In addition, each Fund, as a shareholder in the underlying Fidelity Central Funds, will indirectly bear its pro-rata share of the fees and expenses incurred by the underlying Fidelity Central Funds. These fees and expenses are not included in the Fund's annualized expense ratio used to calculate the expense estimate in the table below.
Please note that the expenses shown in the table are meant to highlight your ongoing costs only and do not reflect any transaction costs. Therefore, the second line of the table is useful in comparing ongoing costs only, and will not help you determine the relative total costs of owning different funds.
Annual Report
| Annualized
Expense Ratio | Beginning
Account Value | Ending
Account Value
January 31, 2013 | Expenses Paid
During Period |
Fidelity Series Equity-Income Fund | | | | |
Series Equity-Income | .68% | | | |
Actual | | $ 1,000.00 | $ 1,058.90 | $ 1.09 B |
Hypothetical A | | $ 1,000.00 | $ 1,021.72 | $ 3.46 C |
Class F | .49% | | | |
Actual | | $ 1,000.00 | $ 1,059.00 | $ .79 B |
Hypothetical A | | $ 1,000.00 | $ 1,022.67 | $ 2.49 C |
Fidelity Series Stock Selector Large Cap Value Fund | | | | |
Series Stock Selector Large Cap Value | .78% | | | |
Actual | | $ 1,000.00 | $ 1,072.70 | $ 1.26 B |
Hypothetical A | | $ 1,000.00 | $ 1,021.22 | $ 3.96 C |
Class F | .59% | | | |
Actual | | $ 1,000.00 | $ 1,072.80 | $ .95 B |
Hypothetical A | | $ 1,000.00 | $ 1,022.17 | $ 3.00 C |
A 5% return per year before expenses
B Actual expenses are equal to each Class' annualized expense ratio, multiplied by the average account value over the period, multiplied by 57/366 (to reflect the period December 6, 2012 to January 31, 2013.
C Hypothetical expenses are equal to each Class' annualized expense ratio, multiplied by the average account value over the period, multiplied by 184/366 (to reflect the one-half year period).
Annual Report
Fidelity Series Equity-Income Fund
Investment Summary (Unaudited)
Top Ten Stocks as of January 31, 2013 |
| % of fund's
net assets |
Chevron Corp. | 4.7 |
JPMorgan Chase & Co. | 4.0 |
Wells Fargo & Co. | 3.9 |
Exxon Mobil Corp. | 3.7 |
Procter & Gamble Co. | 3.2 |
Comcast Corp. Class A | 3.0 |
Verizon Communications, Inc. | 2.6 |
Pfizer, Inc. | 2.6 |
General Electric Co. | 2.4 |
Johnson & Johnson | 2.4 |
| 32.5 |
Top Five Market Sectors as of January 31, 2013 |
| % of fund's
net assets |
Financials | 20.0 |
Energy | 14.0 |
Health Care | 13.7 |
Consumer Staples | 11.0 |
Industrials | 10.6 |
Asset Allocation (% of fund's net assets) |
As of January 31, 2013* |
 | Stocks 98.6% | |
 | Short-Term
Investments and
Net Other Assets (Liabilities) 1.4% | |
* Foreign investments | 4.6% | |

Annual Report
Fidelity Series Equity-Income Fund
Investments January 31, 2013
Showing Percentage of Net Assets
Common Stocks - 98.6% |
| Shares | | Value |
CONSUMER DISCRETIONARY - 9.4% |
Auto Components - 0.2% |
Gentex Corp. | 626,100 | | $ 11,977,293 |
Diversified Consumer Services - 0.2% |
Strayer Education, Inc. | 169,500 | | 9,644,550 |
Hotels, Restaurants & Leisure - 1.3% |
CEC Entertainment, Inc. | 12,100 | | 398,816 |
McDonald's Corp. | 516,300 | | 49,198,227 |
Texas Roadhouse, Inc. Class A | 329,400 | | 5,794,146 |
Yum! Brands, Inc. | 172,000 | | 11,169,680 |
| | 66,560,869 |
Media - 4.7% |
Comcast Corp. Class A | 4,131,300 | | 157,319,904 |
Time Warner, Inc. | 1,732,200 | | 87,510,744 |
| | 244,830,648 |
Multiline Retail - 2.0% |
Kohl's Corp. | 250,200 | | 11,581,758 |
Target Corp. | 1,572,400 | | 94,988,684 |
| | 106,570,442 |
Specialty Retail - 1.0% |
Lowe's Companies, Inc. | 1,070,668 | | 40,888,811 |
Staples, Inc. | 1,093,700 | | 14,743,076 |
| | 55,631,887 |
TOTAL CONSUMER DISCRETIONARY | | 495,215,689 |
CONSUMER STAPLES - 11.0% |
Beverages - 2.1% |
Molson Coors Brewing Co. Class B | 296,600 | | 13,400,388 |
PepsiCo, Inc. | 787,600 | | 57,376,660 |
The Coca-Cola Co. | 1,019,900 | | 37,981,076 |
| | 108,758,124 |
Food & Staples Retailing - 2.9% |
Safeway, Inc. | 1,790,800 | | 34,472,900 |
Sysco Corp. | 769,000 | | 24,431,130 |
Wal-Mart Stores, Inc. | 369,500 | | 25,846,525 |
Walgreen Co. | 1,689,000 | | 67,492,440 |
| | 152,242,995 |
Food Products - 1.1% |
Kellogg Co. | 928,300 | | 54,305,550 |
Common Stocks - continued |
| Shares | | Value |
CONSUMER STAPLES - continued |
Household Products - 3.5% |
Kimberly-Clark Corp. | 198,100 | | $ 17,731,931 |
Procter & Gamble Co. | 2,229,600 | | 167,576,736 |
| | 185,308,667 |
Tobacco - 1.4% |
Altria Group, Inc. | 1,163,900 | | 39,200,152 |
Lorillard, Inc. | 468,900 | | 18,319,923 |
Philip Morris International, Inc. | 196,800 | | 17,349,888 |
| | 74,869,963 |
TOTAL CONSUMER STAPLES | | 575,485,299 |
ENERGY - 14.0% |
Energy Equipment & Services - 1.8% |
Ensco PLC Class A | 304,400 | | 19,350,708 |
Exterran Partners LP | 250,000 | | 5,870,000 |
Halliburton Co. | 703,900 | | 28,634,652 |
National Oilwell Varco, Inc. | 207,100 | | 15,354,394 |
Noble Corp. | 568,600 | | 23,028,300 |
| | 92,238,054 |
Oil, Gas & Consumable Fuels - 12.2% |
Apache Corp. | 474,100 | | 39,710,616 |
Buckeye Partners LP | 125,000 | | 6,580,000 |
Chevron Corp. | 2,119,503 | | 244,060,772 |
EV Energy Partners LP | 311,400 | | 18,310,320 |
Exxon Mobil Corp. | 2,135,000 | | 192,085,950 |
Hess Corp. | 312,300 | | 20,974,068 |
Holly Energy Partners LP | 150,000 | | 5,392,500 |
HollyFrontier Corp. | 306,024 | | 15,980,573 |
Inergy Midstream LP | 8,626 | | 204,522 |
Legacy Reserves LP | 275,000 | | 6,916,250 |
Markwest Energy Partners LP | 299,300 | | 16,527,346 |
Murphy Oil Corp. | 233,900 | | 13,921,728 |
Occidental Petroleum Corp. | 135,100 | | 11,925,277 |
Pioneer Southwest Energy Partners LP | 90,984 | | 2,309,174 |
The Williams Companies, Inc. | 1,208,100 | | 42,343,905 |
Western Gas Equity Partners LP | 90,000 | | 3,038,400 |
| | 640,281,401 |
TOTAL ENERGY | | 732,519,455 |
Common Stocks - continued |
| Shares | | Value |
FINANCIALS - 20.0% |
Capital Markets - 3.5% |
Apollo Investment Corp. | 1,251,720 | | $ 11,265,480 |
BlackRock, Inc. Class A | 134,400 | | 31,756,032 |
Charles Schwab Corp. | 2,156,500 | | 35,646,945 |
KKR & Co. LP | 1,959,079 | | 33,069,254 |
Morgan Stanley | 1,636,900 | | 37,403,165 |
The Blackstone Group LP | 1,734,500 | | 32,088,250 |
| | 181,229,126 |
Commercial Banks - 6.1% |
Comerica, Inc. | 379,100 | | 13,025,876 |
Cullen/Frost Bankers, Inc. | 159,800 | | 9,410,622 |
M&T Bank Corp. | 307,600 | | 31,587,444 |
SunTrust Banks, Inc. | 306,800 | | 8,703,916 |
U.S. Bancorp | 1,525,800 | | 50,503,980 |
Wells Fargo & Co. | 5,962,200 | | 207,663,426 |
| | 320,895,264 |
Diversified Financial Services - 4.0% |
JPMorgan Chase & Co. | 4,493,000 | | 211,395,650 |
KKR Financial Holdings LLC | 12,300 | | 135,177 |
| | 211,530,827 |
Insurance - 4.8% |
ACE Ltd. | 559,000 | | 47,699,470 |
AFLAC, Inc. | 455,000 | | 24,142,300 |
Assured Guaranty Ltd. | 622,300 | | 11,282,299 |
Hanover Insurance Group, Inc. | 334,500 | | 13,901,820 |
MetLife, Inc. | 2,958,200 | | 110,459,188 |
Prudential Financial, Inc. | 281,000 | | 16,264,280 |
Validus Holdings Ltd. | 711,600 | | 25,909,356 |
| | 249,658,713 |
Real Estate Investment Trusts - 1.6% |
American Capital Agency Corp. | 551,000 | | 17,428,130 |
Annaly Capital Management, Inc. | 1,205,600 | | 17,927,272 |
DCT Industrial Trust, Inc. | 467,400 | | 3,299,844 |
Home Properties, Inc. | 124,000 | | 7,622,280 |
Lexington Corporate Properties Trust | 294,400 | | 3,238,400 |
Rayonier, Inc. | 370,300 | | 19,936,952 |
Common Stocks - continued |
| Shares | | Value |
FINANCIALS - continued |
Real Estate Investment Trusts - continued |
Retail Properties America, Inc. | 722,250 | | $ 9,345,915 |
Ventas, Inc. | 114,500 | | 7,590,205 |
| | 86,388,998 |
TOTAL FINANCIALS | | 1,049,702,928 |
HEALTH CARE - 13.7% |
Biotechnology - 0.5% |
Amgen, Inc. | 193,200 | | 16,510,872 |
PDL BioPharma, Inc. | 1,180,400 | | 8,121,152 |
| | 24,632,024 |
Health Care Equipment & Supplies - 1.2% |
Abbott Laboratories | 626,300 | | 21,219,044 |
Baxter International, Inc. | 124,500 | | 8,446,080 |
Covidien PLC | 331,700 | | 20,678,178 |
St. Jude Medical, Inc. | 321,700 | | 13,093,190 |
| | 63,436,492 |
Health Care Providers & Services - 2.4% |
Aetna, Inc. | 553,400 | | 26,690,482 |
Cardinal Health, Inc. | 290,600 | | 12,731,186 |
McKesson Corp. | 143,200 | | 15,068,936 |
UnitedHealth Group, Inc. | 183,600 | | 10,136,556 |
WellPoint, Inc. | 944,900 | | 61,248,418 |
| | 125,875,578 |
Health Care Technology - 0.1% |
Quality Systems, Inc. | 271,814 | | 4,957,887 |
Pharmaceuticals - 9.5% |
AbbVie, Inc. | 885,300 | | 32,481,657 |
Eli Lilly & Co. | 895,000 | | 48,052,550 |
Johnson & Johnson | 1,704,600 | | 126,004,032 |
Merck & Co., Inc. | 2,608,700 | | 112,826,275 |
Pfizer, Inc. | 4,933,300 | | 134,580,424 |
Teva Pharmaceutical Industries Ltd. sponsored ADR | 678,600 | | 25,780,014 |
Warner Chilcott PLC | 1,302,000 | | 18,449,340 |
Zoetis, Inc. Class A | 47,200 | | 1,227,200 |
| | 499,401,492 |
TOTAL HEALTH CARE | | 718,303,473 |
Common Stocks - continued |
| Shares | | Value |
INDUSTRIALS - 10.6% |
Aerospace & Defense - 1.9% |
Raytheon Co. | 563,400 | | $ 29,679,912 |
Rockwell Collins, Inc. | 177,522 | | 10,452,495 |
United Technologies Corp. | 651,700 | | 57,069,369 |
| | 97,201,776 |
Air Freight & Logistics - 2.1% |
C.H. Robinson Worldwide, Inc. | 570,800 | | 37,758,420 |
United Parcel Service, Inc. Class B | 914,000 | | 72,471,060 |
| | 110,229,480 |
Commercial Services & Supplies - 1.3% |
Pitney Bowes, Inc. | 557,998 | | 8,040,751 |
Republic Services, Inc. | 1,967,600 | | 62,746,764 |
| | 70,787,515 |
Electrical Equipment - 0.6% |
Eaton Corp. PLC | 151,500 | | 8,627,925 |
Emerson Electric Co. | 148,800 | | 8,518,800 |
Hubbell, Inc. Class B | 46,828 | | 4,263,689 |
Rockwell Automation, Inc. | 97,200 | | 8,669,268 |
| | 30,079,682 |
Industrial Conglomerates - 2.4% |
General Electric Co. | 5,743,900 | | 127,974,092 |
Machinery - 1.6% |
Briggs & Stratton Corp. | 943,400 | | 22,386,882 |
Cummins, Inc. | 135,400 | | 15,547,982 |
Illinois Tool Works, Inc. | 193,100 | | 12,132,473 |
Stanley Black & Decker, Inc. | 420,300 | | 32,291,649 |
| | 82,358,986 |
Road & Rail - 0.4% |
Union Pacific Corp. | 151,600 | | 19,929,336 |
Trading Companies & Distributors - 0.3% |
Watsco, Inc. | 230,700 | | 17,383,245 |
TOTAL INDUSTRIALS | | 555,944,112 |
INFORMATION TECHNOLOGY - 9.5% |
Communications Equipment - 1.9% |
Cisco Systems, Inc. | 4,893,000 | | 100,649,010 |
Computers & Peripherals - 0.5% |
Apple, Inc. | 24,700 | | 11,246,157 |
Common Stocks - continued |
| Shares | | Value |
INFORMATION TECHNOLOGY - continued |
Computers & Peripherals - continued |
Dell, Inc. | 842,400 | | $ 11,153,376 |
Lexmark International, Inc. Class A | 155,700 | | 3,746,142 |
| | 26,145,675 |
IT Services - 5.0% |
Accenture PLC Class A | 510,600 | | 36,707,034 |
Cognizant Technology Solutions Corp. Class A (a) | 359,800 | | 28,129,164 |
Fidelity National Information Services, Inc. | 65,000 | | 2,412,150 |
IBM Corp. | 324,900 | | 65,977,443 |
Paychex, Inc. | 3,636,700 | | 118,665,521 |
The Western Union Co. | 374,400 | | 5,327,712 |
Visa, Inc. Class A | 47,400 | | 7,484,934 |
| | 264,703,958 |
Semiconductors & Semiconductor Equipment - 1.1% |
Applied Materials, Inc. | 3,109,916 | | 40,149,016 |
KLA-Tencor Corp. | 282,900 | | 15,534,039 |
| | 55,683,055 |
Software - 1.0% |
CA Technologies, Inc. | 461,300 | | 11,449,466 |
Microsoft Corp. | 1,456,600 | | 40,012,802 |
| | 51,462,268 |
TOTAL INFORMATION TECHNOLOGY | | 498,643,966 |
MATERIALS - 0.8% |
Chemicals - 0.3% |
Eastman Chemical Co. | 228,815 | | 16,280,187 |
Metals & Mining - 0.5% |
Commercial Metals Co. | 939,540 | | 15,643,341 |
Nucor Corp. | 226,600 | | 10,425,866 |
| | 26,069,207 |
TOTAL MATERIALS | | 42,349,394 |
TELECOMMUNICATION SERVICES - 4.0% |
Diversified Telecommunication Services - 4.0% |
AT&T, Inc. | 1,702,400 | | 59,226,496 |
CenturyLink, Inc. | 356,500 | | 14,420,425 |
Verizon Communications, Inc. | 3,160,200 | | 137,816,322 |
| | 211,463,243 |
Common Stocks - continued |
| Shares | | Value |
UTILITIES - 5.6% |
Electric Utilities - 4.4% |
Duke Energy Corp. | 770,800 | | $ 52,984,792 |
Edison International | 142,400 | | 6,862,256 |
FirstEnergy Corp. | 718,300 | | 29,083,967 |
NextEra Energy, Inc. | 487,000 | | 35,088,350 |
Northeast Utilities | 363,500 | | 14,805,355 |
PPL Corp. | 2,222,400 | | 67,316,496 |
Southern Co. | 583,500 | | 25,808,205 |
| | 231,949,421 |
Multi-Utilities - 1.2% |
CMS Energy Corp. | 99,400 | | 2,554,580 |
PG&E Corp. | 524,500 | | 22,364,680 |
Sempra Energy | 459,300 | | 34,470,465 |
| | 59,389,725 |
TOTAL UTILITIES | | 291,339,146 |
TOTAL COMMON STOCKS (Cost $4,902,840,216) |
5,170,966,705
|
Money Market Funds - 1.0% |
| | | |
Fidelity Cash Central Fund, 0.16% (b)
(Cost $51,051,892) | 51,051,892 | |
51,051,892
|
TOTAL INVESTMENT PORTFOLIO - 99.6% (Cost $4,953,892,108) | | 5,222,018,597 |
NET OTHER ASSETS (LIABILITIES) - 0.4% | | 23,353,196 |
NET ASSETS - 100% | $ 5,245,371,793 |
Legend |
(a) Non-income producing |
(b) Affiliated fund that is available only to investment companies and other accounts managed by Fidelity Investments. The rate quoted is the annualized seven-day yield of the fund at period end. A complete unaudited listing of the fund's holdings as of its most recent quarter end is available upon request. In addition, each Fidelity Central Fund's financial statements, which are not covered by the Fund's Report of Independent Registered Public Accounting Firm, are available on the SEC's website or upon request. |
Affiliated Central Funds |
Information regarding fiscal year to date income earned by the Fund from investments in Fidelity Central Funds is as follows: |
Fund | Income earned |
Fidelity Cash Central Fund | $ 14,957 |
Other Information |
All investments are categorized as Level 1 under the Fair Value Hierarchy. The inputs or methodology used for valuing securities may not be an indication of the risk associated with investing in those securities. For more information on valuation inputs, please refer to the Investment Valuation section in the accompanying Notes to Financial Statements. |
See accompanying notes which are an integral part of the financial statements.
Annual Report
Fidelity Series Equity-Income Fund
Statement of Assets and Liabilities
| January 31, 2013 |
| | |
Assets | | |
Investment in securities, at value - See accompanying schedule: Unaffiliated issuers (cost $4,902,840,216) | $ 5,170,966,705 | |
Fidelity Central Funds (cost $51,051,892) | 51,051,892 | |
Total Investments (cost $4,953,892,108) | | $ 5,222,018,597 |
Cash | | 15,155 |
Foreign currency held at value (cost $61,380) | | 62,945 |
Receivable for investments sold | | 40,477,511 |
Receivable for fund shares sold | | 154,447 |
Dividends receivable | | 8,358,149 |
Distributions receivable from Fidelity Central Funds | | 6,498 |
Other receivables | | 673,781 |
Total assets | | 5,271,767,083 |
| | |
Liabilities | | |
Payable for investments purchased | $ 22,401,259 | |
Payable for fund shares redeemed | 1,043,562 | |
Accrued management fee | 1,964,626 | |
Other affiliated payables | 464,469 | |
Other payables and accrued expenses | 521,374 | |
Total liabilities | | 26,395,290 |
| | |
Net Assets | | $ 5,245,371,793 |
Net Assets consist of: | | |
Paid in capital | | $ 4,960,030,477 |
Undistributed net investment income | | 7,360,901 |
Accumulated undistributed net realized gain (loss) on investments and foreign currency transactions | | 9,852,361 |
Net unrealized appreciation (depreciation) on investments and assets and liabilities in foreign currencies | | 268,128,054 |
Net Assets | | $ 5,245,371,793 |
See accompanying notes which are an integral part of the financial statements.
Annual Report
Statement of Assets and Liabilities - continued
| January 31, 2013 |
| | |
Series Equity-Income:
Net Asset Value, offering price and redemption price per share ($2,493,355,696 ÷ 235,875,438 shares) | | $ 10.57 |
| | |
Class F:
Net Asset Value, offering price and redemption price per share ($2,752,016,097 ÷ 260,299,498 shares) | | $ 10.57 |
See accompanying notes which are an integral part of the financial statements.
Annual Report
Fidelity Series Equity-Income Fund
Financial Statements - continued
Statement of Operations
| For the period December 6, 2012
(commencement of operations) to
January 31, 2013 |
| | |
Investment Income | | |
Dividends | | $ 20,579,647 |
Interest | | 521 |
Income from Fidelity Central Funds | | 14,957 |
Total income | | 20,595,125 |
| | |
Expenses | | |
Management fee | $ 3,403,138 | |
Transfer agent fees | 682,426 | |
Accounting fees and expenses | 165,655 | |
Custodian fees and expenses | 39,974 | |
Independent trustees' compensation | 2,395 | |
Audit | 41,902 | |
Interest | 71 | |
Miscellaneous | 10 | |
Total expenses before reductions | 4,335,571 | |
Expense reductions | (673,781) | 3,661,790 |
Net investment income (loss) | | 16,933,335 |
Realized and Unrealized Gain (Loss) Net realized gain (loss) on: | | |
Investment securities: | | |
Unaffiliated issuers | 9,582,891 | |
Foreign currency transactions | 25,161 | |
Total net realized gain (loss) | | 9,608,052 |
Change in net unrealized appreciation (depreciation) on: Investment securities | 268,126,489 | |
Assets and liabilities in foreign currencies | 1,565 | |
Total change in net unrealized appreciation (depreciation) | | 268,128,054 |
Net gain (loss) | | 277,736,106 |
Net increase (decrease) in net assets resulting from operations | | $ 294,669,441 |
See accompanying notes which are an integral part of the financial statements.
Annual Report
Statement of Changes in Net Assets
| For the period
December 6, 2012
(commencement of operations) to
January 31, 2013 |
Increase (Decrease) in Net Assets | |
Operations | |
Net investment income (loss) | $ 16,933,335 |
Net realized gain (loss) | 9,608,052 |
Change in net unrealized appreciation (depreciation) | 268,128,054 |
Net increase (decrease) in net assets resulting from operations | 294,669,441 |
Distributions to shareholders from net investment income | (9,328,125) |
Share transactions - net increase (decrease) | 4,960,030,477 |
Total increase (decrease) in net assets | 5,245,371,793 |
| |
Net Assets | |
Beginning of period | - |
End of period (including undistributed net investment income of $7,360,901) | $ 5,245,371,793 |
See accompanying notes which are an integral part of the financial statements.
Annual Report
Financial Highlights - Series Equity-Income
| Period ended
January 31,
2013 G |
Selected Per-Share Data | |
Net asset value, beginning of period | $ 10.00 |
Income from Investment Operations | |
Net investment income (loss) D | .03 |
Net realized and unrealized gain (loss) | .56 |
Total from investment operations | .59 |
Distributions from net investment income | (.02) |
Net asset value, end of period | $ 10.57 |
Total Return B,C | 5.89% |
Ratios to Average Net Assets E,H | |
Expenses before reductions | .68% A |
Expenses net of fee waivers, if any | .68% A |
Expenses net of all reductions | .59% A |
Net investment income (loss) | 2.17% A |
Supplemental Data | |
Net assets, end of period (000 omitted) | $ 2,493,356 |
Portfolio turnover rate F | 47% I |
A Annualized
B Total returns for periods of less than one year are not annualized.
C Total returns would have been lower if certain expenses had not been reduced during the applicable periods shown.
D Calculated based on average shares outstanding during the period.
E Fees and expenses of any underlying Fidelity Central Funds are not included in the Fund's expense ratio. The Fund indirectly bears its proportionate share of the expenses of any underlying Fidelity Central Funds.
F Amount does not include the portfolio activity of any underlying Fidelity Central Funds.
G For the period December 6, 2012 (commencement of operations) to January 31, 2013.
H Expense ratios reflect operating expenses of the class. Expenses before reductions do not reflect amounts reimbursed by the investment adviser or reductions from brokerage service arrangements or reductions from other expense offset arrangements and do not represent the amount paid by the class during periods when reimbursements or reductions occur. Expense ratios before reductions for start-up periods may not be representative of longer-term operating periods. Expenses net of fee waivers reflect expenses after reimbursement by the investment adviser but prior to reductions from brokerage service arrangements or other expense offset arrangements. Expenses net of all reductions represent the net expenses paid by the class.
I Amount not annualized.
See accompanying notes which are an integral part of the financial statements.
Annual Report
Financial Highlights - Class F
| Period ended
January 31,
2013 G |
Selected Per-Share Data | |
Net asset value, beginning of period | $ 10.00 |
Income from Investment Operations | |
Net investment income (loss) D | .04 |
Net realized and unrealized gain (loss) | .55 |
Total from investment operations | .59 |
Distributions from net investment income | (.02) |
Net asset value, end of period | $ 10.57 |
Total Return B,C | 5.90% |
Ratios to Average Net Assets E,H | |
Expenses before reductions | .49% A |
Expenses net of fee waivers, if any | .49% A |
Expenses net of all reductions | .40% A |
Net investment income (loss) | 2.35% A |
Supplemental Data | |
Net assets, end of period (000 omitted) | $ 2,752,016 |
Portfolio turnover rate F | 47% I |
A Annualized
B Total returns for periods of less than one year are not annualized.
C Total returns would have been lower if certain expenses had not been reduced during the applicable periods shown.
D Calculated based on average shares outstanding during the period.
E Fees and expenses of any underlying Fidelity Central Funds are not included in the Fund's expense ratio. The Fund indirectly bears its proportionate share of the expenses of any underlying Fidelity Central Funds.
F Amount does not include the portfolio activity of any underlying Fidelity Central Funds.
G For the period December 6, 2012 (commencement of operations) to January 31, 2013.
H Expense ratios reflect operating expenses of the class. Expenses before reductions do not reflect amounts reimbursed by the investment adviser or reductions from brokerage service arrangements or reductions from other expense offset arrangements and do not represent the amount paid by the class during periods when reimbursements or reductions occur. Expense ratios before reductions for start-up periods may not be representative of longer-term operating periods. Expenses net of fee waivers reflect expenses after reimbursement by the investment adviser but prior to reductions from brokerage service arrangements or other expense offset arrangements. Expenses net of all reductions represent the net expenses paid by the class.
I Amount not annualized.
See accompanying notes which are an integral part of the financial statements.
Annual Report
Fidelity Series Stock Selector Large Cap Value Fund
Investment Summary (Unaudited)
Top Ten Stocks as of January 31, 2013 |
| % of fund's
net assets |
Exxon Mobil Corp. | 7.1 |
Berkshire Hathaway, Inc. Class B | 3.4 |
General Electric Co. | 3.3 |
Wells Fargo & Co. | 3.2 |
Occidental Petroleum Corp. | 3.0 |
Merck & Co., Inc. | 2.5 |
Johnson & Johnson | 2.3 |
Pfizer, Inc. | 2.2 |
U.S. Bancorp | 1.9 |
AT&T, Inc. | 1.8 |
| 30.7 |
Top Five Market Sectors as of January 31, 2013 |
| % of fund's
net assets |
Financials | 26.8 |
Energy | 16.3 |
Health Care | 11.4 |
Industrials | 8.9 |
Consumer Discretionary | 8.4 |
Asset Allocation (% of fund's net assets) |
As of January 31, 2013* |
| Stocks 99.1% | |
| Short-Term
Investments and
Net Other Assets (Liabilities) 0.9% | |
* Foreign investments | 6.1% | |

Annual Report
Fidelity Series Stock Selector Large Cap Value Fund
Investments January 31, 2013
Showing Percentage of Net Assets
Common Stocks - 99.1% |
| Shares | | Value |
CONSUMER DISCRETIONARY - 8.4% |
Auto Components - 0.7% |
Delphi Automotive PLC (a) | 883,600 | | $ 34,159,976 |
Household Durables - 1.3% |
Jarden Corp. | 495,100 | | 29,131,684 |
Whirlpool Corp. | 342,307 | | 39,495,382 |
| | 68,627,066 |
Internet & Catalog Retail - 0.7% |
Liberty Media Corp.: | | | |
Interactive Series A (a) | 1,127,600 | | 23,972,776 |
Series A (a) | 195,106 | | 14,560,761 |
| | 38,533,537 |
Media - 2.4% |
Comcast Corp. Class A | 1,599,898 | | 60,924,116 |
News Corp. Class A | 2,103,500 | | 58,351,090 |
Omnicom Group, Inc. | 180,925 | | 9,820,609 |
| | 129,095,815 |
Multiline Retail - 1.7% |
Macy's, Inc. | 885,824 | | 34,998,906 |
Target Corp. | 944,028 | | 57,028,731 |
| | 92,027,637 |
Specialty Retail - 1.6% |
Lowe's Companies, Inc. | 1,281,004 | | 48,921,543 |
Staples, Inc. | 2,680,688 | | 36,135,674 |
| | 85,057,217 |
TOTAL CONSUMER DISCRETIONARY | | 447,501,248 |
CONSUMER STAPLES - 7.3% |
Beverages - 1.1% |
Dr. Pepper Snapple Group, Inc. | 407,100 | | 18,347,997 |
Molson Coors Brewing Co. Class B | 864,200 | | 39,044,556 |
| | 57,392,553 |
Food & Staples Retailing - 1.0% |
Walgreen Co. | 1,335,600 | | 53,370,576 |
Food Products - 3.2% |
Archer Daniels Midland Co. | 1,517,400 | | 43,291,422 |
ConAgra Foods, Inc. | 862,900 | | 28,208,201 |
Common Stocks - continued |
| Shares | | Value |
CONSUMER STAPLES - continued |
Food Products - continued |
Mondelez International, Inc. | 2,259,400 | | $ 62,788,726 |
The J.M. Smucker Co. | 382,100 | | 33,865,523 |
| | 168,153,872 |
Household Products - 1.7% |
Procter & Gamble Co. | 1,198,100 | | 90,049,196 |
Tobacco - 0.3% |
Lorillard, Inc. | 481,505 | | 18,812,400 |
TOTAL CONSUMER STAPLES | | 387,778,597 |
ENERGY - 16.3% |
Energy Equipment & Services - 2.1% |
Cameron International Corp. (a) | 792,800 | | 50,192,168 |
National Oilwell Varco, Inc. | 811,824 | | 60,188,631 |
| | 110,380,799 |
Oil, Gas & Consumable Fuels - 14.2% |
Anadarko Petroleum Corp. | 1,045,900 | | 83,692,918 |
Energen Corp. | 804,000 | | 38,704,560 |
Exxon Mobil Corp. | 4,162,400 | | 374,491,128 |
Occidental Petroleum Corp. | 1,802,300 | | 159,089,021 |
Phillips 66 | 1,141,500 | | 69,140,655 |
The Williams Companies, Inc. | 815,541 | | 28,584,712 |
| | 753,702,994 |
TOTAL ENERGY | | 864,083,793 |
FINANCIALS - 26.8% |
Capital Markets - 3.1% |
BlackRock, Inc. Class A | 348,600 | | 82,367,208 |
State Street Corp. | 1,503,600 | | 83,675,340 |
| | 166,042,548 |
Commercial Banks - 8.3% |
CIT Group, Inc. (a) | 1,404,100 | | 59,463,635 |
PNC Financial Services Group, Inc. | 1,216,600 | | 75,185,880 |
Popular, Inc. (a) | 1,270,217 | | 34,092,624 |
U.S. Bancorp | 2,971,400 | | 98,353,340 |
Wells Fargo & Co. | 4,891,300 | | 170,363,979 |
| | 437,459,458 |
Common Stocks - continued |
| Shares | | Value |
FINANCIALS - continued |
Consumer Finance - 1.5% |
Capital One Financial Corp. | 1,424,100 | | $ 80,205,312 |
Diversified Financial Services - 0.9% |
The NASDAQ Stock Market, Inc. | 1,711,600 | | 48,472,512 |
Insurance - 10.2% |
ACE Ltd. | 838,400 | | 71,540,672 |
AFLAC, Inc. | 1,008,200 | | 53,495,092 |
Axis Capital Holdings Ltd. | 1,476,907 | | 56,521,231 |
Berkshire Hathaway, Inc. Class B (a) | 1,861,200 | | 180,406,116 |
MetLife, Inc. | 1,642,300 | | 61,323,482 |
Reinsurance Group of America, Inc. | 781,500 | | 44,850,285 |
The Travelers Companies, Inc. | 925,000 | | 72,575,500 |
| | 540,712,378 |
Real Estate Investment Trusts - 1.9% |
Boston Properties, Inc. | 512,500 | | 53,956,000 |
Simon Property Group, Inc. | 286,744 | | 45,930,654 |
| | 99,886,654 |
Real Estate Management & Development - 0.9% |
CBRE Group, Inc. (a) | 2,139,800 | | 46,176,884 |
TOTAL FINANCIALS | | 1,418,955,746 |
HEALTH CARE - 11.4% |
Health Care Equipment & Supplies - 0.7% |
Alere, Inc. (a) | 66,700 | | 1,418,042 |
Baxter International, Inc. | 177,000 | | 12,007,680 |
Covidien PLC | 196,300 | | 12,237,342 |
St. Jude Medical, Inc. | 195,900 | | 7,973,130 |
Teleflex, Inc. | 54,309 | | 4,073,175 |
| | 37,709,369 |
Health Care Providers & Services - 2.2% |
Quest Diagnostics, Inc. | 208,256 | | 12,068,435 |
UnitedHealth Group, Inc. | 1,210,500 | | 66,831,705 |
WellPoint, Inc. | 612,000 | | 39,669,840 |
| | 118,569,980 |
Health Care Technology - 0.2% |
Allscripts Healthcare Solutions, Inc. (a) | 674,900 | | 7,477,892 |
Common Stocks - continued |
| Shares | | Value |
HEALTH CARE - continued |
Life Sciences Tools & Services - 0.7% |
QIAGEN NV (a) | 317,610 | | $ 6,669,810 |
Thermo Fisher Scientific, Inc. | 423,100 | | 30,522,434 |
| | 37,192,244 |
Pharmaceuticals - 7.6% |
Eli Lilly & Co. | 232,000 | | 12,456,080 |
Endo Pharmaceuticals Holdings, Inc. (a) | 261,300 | | 8,272,758 |
Jazz Pharmaceuticals PLC (a) | 107,200 | | 6,045,008 |
Johnson & Johnson | 1,656,200 | | 122,426,304 |
Merck & Co., Inc. | 3,007,100 | | 130,057,075 |
Pfizer, Inc. | 4,200,475 | | 114,588,958 |
Warner Chilcott PLC | 438,800 | | 6,217,796 |
Zoetis, Inc. Class A | 45,400 | | 1,180,400 |
| | 401,244,379 |
TOTAL HEALTH CARE | | 602,193,864 |
INDUSTRIALS - 8.9% |
Aerospace & Defense - 0.9% |
General Dynamics Corp. | 731,640 | | 48,507,732 |
Air Freight & Logistics - 0.9% |
FedEx Corp. | 474,500 | | 48,138,025 |
Commercial Services & Supplies - 1.5% |
Corrections Corp. of America | 639,600 | | 24,234,444 |
Republic Services, Inc. | 825,389 | | 26,321,655 |
Waste Management, Inc. | 851,465 | | 30,976,297 |
| | 81,532,396 |
Construction & Engineering - 1.0% |
AECOM Technology Corp. (a) | 612,500 | | 15,661,625 |
URS Corp. | 863,812 | | 35,830,922 |
| | 51,492,547 |
Industrial Conglomerates - 3.3% |
General Electric Co. | 7,882,909 | | 175,631,213 |
Professional Services - 0.6% |
Towers Watson & Co. | 498,325 | | 30,437,691 |
Common Stocks - continued |
| Shares | | Value |
INDUSTRIALS - continued |
Road & Rail - 0.7% |
Con-way, Inc. | 516,999 | | $ 16,223,429 |
CSX Corp. | 990,027 | | 21,810,295 |
| | 38,033,724 |
TOTAL INDUSTRIALS | | 473,773,328 |
INFORMATION TECHNOLOGY - 6.4% |
Communications Equipment - 1.5% |
Cisco Systems, Inc. | 3,867,900 | | 79,562,703 |
Computers & Peripherals - 0.8% |
Hewlett-Packard Co. | 2,488,000 | | 41,076,880 |
Electronic Equipment & Components - 1.3% |
Corning, Inc. | 1,738,200 | | 20,858,400 |
Jabil Circuit, Inc. | 1,369,300 | | 25,893,463 |
Tech Data Corp. (a) | 486,500 | | 24,767,715 |
| | 71,519,578 |
IT Services - 0.5% |
Amdocs Ltd. | 282,800 | | 10,093,132 |
Global Payments, Inc. | 345,200 | | 17,004,552 |
| | 27,097,684 |
Semiconductors & Semiconductor Equipment - 1.8% |
Avago Technologies Ltd. | 403,700 | | 14,440,349 |
Broadcom Corp. Class A | 838,900 | | 27,222,305 |
Freescale Semiconductor Holdings I Ltd. (a) | 1,317,500 | | 19,037,875 |
Intersil Corp. Class A | 2,053,500 | | 17,762,775 |
ON Semiconductor Corp. (a) | 1,820,900 | | 14,294,065 |
| | 92,757,369 |
Software - 0.5% |
Symantec Corp. (a) | 1,146,408 | | 24,957,302 |
TOTAL INFORMATION TECHNOLOGY | | 336,971,516 |
MATERIALS - 3.7% |
Chemicals - 2.9% |
Air Products & Chemicals, Inc. | 519,400 | | 45,411,142 |
Ashland, Inc. | 332,800 | | 26,128,128 |
Eastman Chemical Co. | 472,800 | | 33,639,720 |
LyondellBasell Industries NV Class A | 763,400 | | 48,414,828 |
| | 153,593,818 |
Common Stocks - continued |
| Shares | | Value |
MATERIALS - continued |
Containers & Packaging - 0.8% |
Rock-Tenn Co. Class A | 514,800 | | $ 40,643,460 |
TOTAL MATERIALS | | 194,237,278 |
TELECOMMUNICATION SERVICES - 3.4% |
Diversified Telecommunication Services - 3.0% |
AT&T, Inc. | 2,771,800 | | 96,430,922 |
CenturyLink, Inc. | 1,291,500 | | 52,241,175 |
Frontier Communications Corp. (d) | 2,206,900 | | 10,085,533 |
| | 158,757,630 |
Wireless Telecommunication Services - 0.4% |
NII Holdings, Inc. (a) | 3,489,029 | | 24,423,203 |
TOTAL TELECOMMUNICATION SERVICES | | 183,180,833 |
UTILITIES - 6.5% |
Electric Utilities - 3.6% |
Edison International | 959,000 | | 46,214,210 |
ITC Holdings Corp. | 424,800 | | 34,408,800 |
NextEra Energy, Inc. | 468,700 | | 33,769,835 |
Northeast Utilities | 1,186,800 | | 48,338,364 |
OGE Energy Corp. | 463,700 | | 27,223,827 |
| | 189,955,036 |
Gas Utilities - 0.4% |
ONEOK, Inc. | 282,745 | | 13,291,842 |
Questar Corp. | 304,920 | | 7,083,292 |
| | 20,375,134 |
Independent Power Producers & Energy Traders - 0.5% |
Calpine Corp. (a) | 454,100 | | 8,959,393 |
The AES Corp. | 1,826,200 | | 19,796,008 |
| | 28,755,401 |
Multi-Utilities - 2.0% |
CMS Energy Corp. | 1,211,200 | | 31,127,840 |
Common Stocks - continued |
| Shares | | Value |
UTILITIES - continued |
Multi-Utilities - continued |
NiSource, Inc. | 971,300 | | $ 26,254,239 |
Sempra Energy | 625,400 | | 46,936,270 |
| | 104,318,349 |
TOTAL UTILITIES | | 343,403,920 |
TOTAL COMMON STOCKS (Cost $4,922,040,691) |
5,252,080,123
|
Money Market Funds - 1.1% |
| | | |
Fidelity Cash Central Fund, 0.16% (b) | 54,063,689 | | 54,063,689 |
Fidelity Securities Lending Cash Central Fund, 0.15% (b)(c) | 5,966,000 | | 5,966,000 |
TOTAL MONEY MARKET FUNDS (Cost $60,029,689) |
60,029,689
|
TOTAL INVESTMENT PORTFOLIO - 100.2% (Cost $4,982,070,380) | | 5,312,109,812 |
NET OTHER ASSETS (LIABILITIES) - (0.2)% | | (9,073,801) |
NET ASSETS - 100% | $ 5,303,036,011 |
Legend |
(a) Non-income producing |
(b) Affiliated fund that is available only to investment companies and other accounts managed by Fidelity Investments. The rate quoted is the annualized seven-day yield of the fund at period end. A complete unaudited listing of the fund's holdings as of its most recent quarter end is available upon request. In addition, each Fidelity Central Fund's financial statements, which are not covered by the Fund's Report of Independent Registered Public Accounting Firm, are available on the SEC's website or upon request. |
(c) Investment made with cash collateral received from securities on loan. |
(d) Security or a portion of the security is on loan at period end. |
Affiliated Central Funds |
Information regarding fiscal year to date income earned by the Fund from investments in Fidelity Central Funds is as follows: |
Fund | Income earned |
Fidelity Cash Central Fund | $ 14,653 |
Fidelity Securities Lending Cash Central Fund | 8,598 |
Total | $ 23,251 |
Other Information |
All investments are categorized as Level 1 under the Fair Value Hierarchy. The inputs or methodology used for valuing securities may not be an indication of the risk associated with investing in those securities. For more information on valuation inputs, please refer to the Investment Valuation section in the accompanying Notes to Financial Statements. |
See accompanying notes which are an integral part of the financial statements.
Annual Report
Fidelity Series Stock Selector Large Cap Value Fund
Statement of Assets and Liabilities
| January 31, 2013 |
| | |
Assets | | |
Investment in securities, at value (including securities loaned of $5,739,920) - See accompanying schedule: Unaffiliated issuers (cost $4,922,040,691) | $ 5,252,080,123 | |
Fidelity Central Funds (cost $60,029,689) | 60,029,689 | |
Total Investments (cost $4,982,070,380) | | $ 5,312,109,812 |
Cash | | 47,944 |
Receivable for investments sold | | 108,600,033 |
Receivable for fund shares sold | | 154,447 |
Dividends receivable | | 6,098,300 |
Distributions receivable from Fidelity Central Funds | | 17,353 |
Other receivables | | 605,462 |
Total assets | | 5,427,633,351 |
| | |
Liabilities | | |
Payable for investments purchased | $ 114,618,775 | |
Payable for fund shares redeemed | 1,044,345 | |
Accrued management fee | 2,417,347 | |
Other affiliated payables | 468,069 | |
Other payables and accrued expenses | 82,804 | |
Collateral on securities loaned, at value | 5,966,000 | |
Total liabilities | | 124,597,340 |
| | |
Net Assets | | $ 5,303,036,011 |
Net Assets consist of: | | |
Paid in capital | | $ 4,950,756,968 |
Undistributed net investment income | | 2,921,615 |
Accumulated undistributed net realized gain (loss) on investments and foreign currency transactions | | 19,317,996 |
Net unrealized appreciation (depreciation) on investments | | 330,039,432 |
Net Assets | | $ 5,303,036,011 |
See accompanying notes which are an integral part of the financial statements.
Annual Report
Statement of Assets and Liabilities - continued
| January 31, 2013 |
| | |
Series Stock Selector Large Cap Value:
Net Asset Value, offering price and redemption price per share ($2,520,689,062 ÷ 235,467,224 shares) | | $ 10.71 |
| | |
Class F:
Net Asset Value, offering price and redemption price per share ($2,782,346,949 ÷ 259,863,998 shares) | | $ 10.71 |
See accompanying notes which are an integral part of the financial statements.
Annual Report
Fidelity Series Stock Selector Large Cap Value Fund
Financial Statements - continued
Statement of Operations
| For the period December 6, 2012
(commencement of operations) to
January 31, 2013 |
| | |
Investment Income | | |
Dividends | | $ 15,694,560 |
Interest | | 67 |
Income from Fidelity Central Funds | | 23,251 |
Total income | | 15,717,878 |
| | |
Expenses | | |
Management fee | $ 4,174,143 | |
Transfer agent fees | 686,880 | |
Accounting and security lending fees | 165,836 | |
Custodian fees and expenses | 48,457 | |
Independent trustees' compensation | 2,399 | |
Audit | 35,573 | |
Miscellaneous | 10 | |
Total expenses before reductions | 5,113,298 | |
Expense reductions | (605,462) | 4,507,836 |
Net investment income (loss) | | 11,210,042 |
Realized and Unrealized Gain (Loss) Net realized gain (loss) on: | | |
Investment securities: | | |
Unaffiliated issuers | 19,317,997 | |
Foreign currency transactions | 24,164 | |
Total net realized gain (loss) | | 19,342,161 |
Change in net unrealized appreciation (depreciation) on investment securities | | 330,039,432 |
Net gain (loss) | | 349,381,593 |
Net increase (decrease) in net assets resulting from operations | | $ 360,591,635 |
See accompanying notes which are an integral part of the financial statements.
Annual Report
Statement of Changes in Net Assets
| For the period
December 6, 2012
(commencement of operations) to
January 31, 2013 |
Increase (Decrease) in Net Assets | |
Operations | |
Net investment income (loss) | $ 11,210,042 |
Net realized gain (loss) | 19,342,161 |
Change in net unrealized appreciation (depreciation) | 330,039,432 |
Net increase (decrease) in net assets resulting from operations | 360,591,635 |
Distributions to shareholders from net investment income | (8,312,592) |
Share transactions - net increase (decrease) | 4,950,756,968 |
Total increase (decrease) in net assets | 5,303,036,011 |
| |
Net Assets | |
Beginning of period | - |
End of period (including undistributed net investment income of $2,921,615) | $ 5,303,036,011 |
See accompanying notes which are an integral part of the financial statements.
Annual Report
Financial Highlights - Series Stock Selector Large Cap Value
| Period ended
January 31,
2013 G |
Selected Per-Share Data | |
Net asset value, beginning of period | $ 10.00 |
Income from Investment Operations | |
Net investment income (loss) D | .02 |
Net realized and unrealized gain (loss) | .71 |
Total from investment operations | .73 |
Distributions from net investment income | (.02) |
Net asset value, end of period | $ 10.71 |
Total Return B,C | 7.27% |
Ratios to Average Net Assets E,H | |
Expenses before reductions | .78% A |
Expenses net of fee waivers, if any | .78% A |
Expenses net of all reductions | .70% A |
Net investment income (loss) | 1.39% A |
Supplemental Data | |
Net assets, end of period (000 omitted) | $ 2,520,689 |
Portfolio turnover rate F | 44% I |
A Annualized
B Total returns for periods of less than one year are not annualized.
C Total returns would have been lower if certain expenses had not been reduced during the applicable periods shown.
D Calculated based on average shares outstanding during the period.
E Fees and expenses of any underlying Fidelity Central Funds are not included in the Fund's expense ratio. The Fund indirectly bears its proportionate share of the expenses of any underlying Fidelity Central Funds.
F Amount does not include the portfolio activity of any underlying Fidelity Central Funds.
G For the period December 6, 2012 (commencement of operations) to January 31, 2013.
H Expense ratios reflect operating expenses of the class. Expenses before reductions do not reflect amounts reimbursed by the investment adviser or reductions from brokerage service arrangements or reductions from other expense offset arrangements and do not represent the amount paid by the class during periods when reimbursements or reductions occur. Expense ratios before reductions for start-up periods may not be representative of longer-term operating periods. Expenses net of fee waivers reflect expenses after reimbursement by the investment adviser but prior to reductions from brokerage service arrangements or other expense offset arrangements. Expenses net of all reductions represent the net expenses paid by the class.
I Amount not annualized.
See accompanying notes which are an integral part of the financial statements.
Annual Report
Financial Highlights - Class F
| Period ended
January 31,
2013 G |
Selected Per-Share Data | |
Net asset value, beginning of period | $ 10.00 |
Income from Investment Operations | |
Net investment income (loss) D | .02 |
Net realized and unrealized gain (loss) | .71 |
Total from investment operations | .73 |
Distributions from net investment income | (.02) |
Net asset value, end of period | $ 10.71 |
Total Return B,C | 7.28% |
Ratios to Average Net Assets E,H | |
Expenses before reductions | .59% A |
Expenses net of fee waivers, if any | .59% A |
Expenses net of all reductions | .51% A |
Net investment income (loss) | 1.58% A |
Supplemental Data | |
Net assets, end of period (000 omitted) | $ 2,782,347 |
Portfolio turnover rate F | 44% I |
A Annualized
B Total returns for periods of less than one year are not annualized.
C Total returns would have been lower if certain expenses had not been reduced during the applicable periods shown.
D Calculated based on average shares outstanding during the period.
E Fees and expenses of any underlying Fidelity Central Funds are not included in the Fund's expense ratio. The Fund indirectly bears its proportionate share of the expenses of any underlying Fidelity Central Funds.
F Amount does not include the portfolio activity of any underlying Fidelity Central Funds.
G For the period December 6, 2012 (commencement of operations) to January 31, 2013.
H Expense ratios reflect operating expenses of the class. Expenses before reductions do not reflect amounts reimbursed by the investment adviser or reductions from brokerage service arrangements or reductions from other expense offset arrangements and do not represent the amount paid by the class during periods when reimbursements or reductions occur. Expense ratios before reductions for start-up periods may not be representative of longer-term operating periods. Expenses net of fee waivers reflect expenses after reimbursement by the investment adviser but prior to reductions from brokerage service arrangements or other expense offset arrangements. Expenses net of all reductions represent the net expenses paid by the class.
I Amount not annualized.
See accompanying notes which are an integral part of the financial statements.
Annual Report
Notes to Financial Statements
For the period ended January 31, 2013
1. Organization.
Fidelity Series Equity-Income Fund and Fidelity Series Stock Selector Large Cap Value Fund (the Funds) are funds of Fidelity Devonshire Trust (the Trust) and are authorized to issue an unlimited number of shares. Shares of the Funds are only available for purchase by mutual funds for which Fidelity Management & Research Company (FMR) or an affiliate serves as an investment manager. The Trust is registered under the Investment Company Act of 1940, as amended (the 1940 Act), as an open-end management investment company organized as a Massachusetts business trust. Fidelity Series Equity-Income Fund offers Series Equity-Income shares and Class F shares. Fidelity Series Stock Selector Large Cap Value Fund offers Series Stock Selector Large Cap Value shares and Class F shares. All classes have equal rights as to assets and voting privileges. Each class has exclusive voting rights with respect to matters that affect that class. Investment income, realized and unrealized capital gains and losses, the common expenses of each Fund, and certain fund-level expense reductions, if any, are allocated on a pro-rata basis to each class based on the relative net assets of each class to the total net assets of each Fund. Each class differs with respect to transfer agent fees incurred. Certain expense reductions may also differ by class.
2. Investments in Fidelity Central Funds.
The Funds invest in Fidelity Central Funds, which are open-end investment companies available only to other investment companies and accounts managed by FMR and its affiliates. The Funds' Schedules of Investments list each of the Fidelity Central Funds held as of period end, if any, as an investment of each Fund, but do not include the underlying holdings of each Fidelity Central Fund. As an Investing Fund, each Fund indirectly bears its proportionate share of the expenses of the underlying Fidelity Central Funds.
The Money Market Central Funds seek preservation of capital and current income and are managed by Fidelity Investments Money Management, Inc. (FIMM), an affiliate of FMR.
A complete unaudited list of holdings for each Fidelity Central Fund is available upon request or at the Securities and Exchange Commission (the SEC) website at www.sec.gov. In addition, the financial statements of the Fidelity Central Funds, which are not covered by the Funds' Report of Independent Registered Public Accounting Firm, are available on the SEC website or upon request.
3. Significant Accounting Policies.
The financial statements have been prepared in conformity with accounting principles generally accepted in the United States of America (GAAP), which require management to make certain estimates and assumptions at the date of the financial statements.
Annual Report
3. Significant Accounting Policies - continued
Actual results could differ from those estimates. Subsequent events, if any, through the date that the financial statements were issued have been evaluated in the preparation of the financial statements. The following summarizes the significant accounting policies of the Funds:
Investment Valuation. Investments are valued as of 4:00 p.m. Eastern time on the last calendar day of the period. In accordance with valuation policies and procedures approved by the Board of Trustees (the Board), each Fund attempts to obtain prices from one or more third party pricing vendors or brokers to value its investments. When current market prices, quotations or currency exchange rates are not readily available or reliable, investments will be fair valued in good faith by the FMR Fair Value Committee (the Committee), in accordance with procedures adopted by each Fund's Board. Factors used in determining fair value vary by investment type and may include market or investment specific events. The frequency with which these procedures are used cannot be predicted and they may be utilized to a significant extent. The Committee oversees each Fund's valuation policies and procedures and is responsible for approving and reporting to the Board all fair value determinations.
Each Fund categorizes the inputs to valuation techniques used to value their investments into a disclosure hierarchy consisting of three levels as shown below:
Level 1 - quoted prices in active markets for identical investments
Level 2 - other significant observable inputs (including quoted prices for similar investments, interest rates, prepayment speeds, etc.)
Level 3 - unobservable inputs (including the Fund's own assumptions based on the best information available)
Valuation techniques used to value each Fund's investments by major category are as follows:
Equity securities, including restricted securities, for which market quotations are readily available, are valued at the last reported sale price or official closing price as reported by a third party pricing vendor on the primary market or exchange on which they are traded and are categorized as Level 1 in the hierarchy. In the event there were no sales during the day or closing prices are not available, securities are valued at the last quoted bid price or may be valued using the last available price and are generally categorized as Level 2 in the hierarchy. For foreign equity securities, when significant market or security specific events arise, comparisons to the valuation of American Depositary Receipts (ADRs), futures contracts, Exchange-Traded Funds (ETFs) and certain indexes as well as quoted prices for similar securities are used and are categorized as Level 2 in the hierarchy. Utilizing these techniques may result in transfers between Level 1 and Level 2.
Annual Report
Notes to Financial Statements - continued
3. Significant Accounting Policies - continued
Investment Valuation - continued
Investments in open-end mutual funds, including the Fidelity Central Funds, are valued at their closing net asset value (NAV) each business day and are categorized as Level 1 in the hierarchy.
Changes in valuation techniques may result in transfers in or out of an assigned level within the disclosure hierarchy.
Foreign Currency. The Funds may use foreign currency contracts to facilitate transactions in foreign-denominated securities. Gains and losses from these transactions may arise from changes in the value of the foreign currency or if the counterparties do not perform under the contracts' terms.
Foreign-denominated assets, including investment securities, and liabilities are translated into U.S. dollars at the exchange rates at period end. Purchases and sales of investment securities, income and dividends received and expenses denominated in foreign currencies are translated into U.S. dollars at the exchange rate in effect on the transaction date.
The effects of exchange rate fluctuations on investments are included with the net realized and unrealized gain (loss) on investment securities. Other foreign currency transactions resulting in realized and unrealized gain (loss) are disclosed separately.
Investment Transactions and Income. For financial reporting purposes, the Funds' investment holdings and NAV include trades executed through the end of the last business day of the period. The NAV per share for processing shareholder transactions is calculated as of the close of business of the New York Stock Exchange (NYSE), normally 4:00 p.m. Eastern time and includes trades executed through the end of the prior business day. Gains and losses on securities sold are determined on the basis of identified cost. Dividend income is recorded on the ex-dividend date, except for certain dividends from foreign securities where the ex-dividend date may have passed, which are recorded as soon as the Funds are informed of the ex-dividend date. Non-cash dividends included in dividend income, if any, are recorded at the fair market value of the securities received. Distributions received on securities that represent a return of capital or capital gain are recorded as a reduction of cost of investments and/or as a realized gain. The Funds estimate the components of distributions received that may be considered return of capital distributions or capital gain distributions. Interest income and distributions from the Fidelity Central Funds are accrued as earned. Interest income includes coupon interest and amortization of premium and accretion of discount on debt securities. Investment income is recorded net of foreign taxes withheld where recovery of such taxes is uncertain.
Annual Report
3. Significant Accounting Policies - continued
Expenses. Expenses directly attributable to a fund are charged to that fund. Expenses attributable to more than one fund are allocated among the respective funds on the basis of relative net assets or other appropriate methods. Expense estimates are accrued in the period to which they relate and adjustments are made when actual amounts are known.
Income Tax Information and Distributions to Shareholders. Each year, each Fund intends to qualify as a regulated investment company under Subchapter M of the Internal Revenue Code, including distributing substantially all of its taxable income and realized gains. As a result, no provision for income taxes is required. As of January 31, 2013, each Fund did not have any unrecognized tax benefits in the financial statements; nor is each Fund aware of any tax positions for which it is reasonably possible that the total amounts of unrecognized tax benefits will significantly change in the next twelve months. Each Fund files a U.S. federal tax return, in addition to state and local tax returns as required. A fund's federal income tax returns are subject to examination by the Internal Revenue Service (IRS) for a period of three fiscal years after they are filed. State and local tax returns may be subject to examination for an additional fiscal year depending on the jurisdiction. Foreign taxes are provided for based on each Fund's understanding of the tax rules and rates that exist in the foreign markets in which it invests.
Distributions are declared and recorded on the ex-dividend date. Income dividends and capital gain distributions are declared separately for each class. Income and capital gain distributions are determined in accordance with income tax regulations, which may differ from GAAP.
Capital accounts within the financial statements are adjusted for permanent book-tax differences. These adjustments have no impact on net assets or the results of operations. Temporary book-tax differences will reverse in a subsequent period.
Book-tax differences are primarily due to foreign currency transactions, partnerships, and losses deferred due to wash sales.
Annual Report
Notes to Financial Statements - continued
3. Significant Accounting Policies - continued
Income Tax Information and Distributions to Shareholders - continued
The federal tax cost of investment securities and unrealized appreciation (depreciation) as of period end were as follows for each Fund:
| Tax cost | Gross unrealized
appreciation | Gross unrealized
depreciation | Net unrealized
appreciation
(depreciation) on
securities and other investments |
Fidelity Series Equity-Income Fund | $ 4,955,497,746 | $ 288,251,937 | $ (21,731,086) | $ 266,520,851 |
Fidelity Series Stock Selector Large Cap Value Fund | 4,982,916,574 | 342,238,643 | (13,045,405) | 329,193,238 |
The tax-based components of distributable earnings as of period end were as follows for each Fund:
| Undistributed
ordinary income | Undistributed long-term
capital gain | Net unrealized appreciation
(depreciation) |
Fidelity Series Equity-Income Fund | $ 18,650,071 | $ 168,828 | $ 266,522,416 |
Fidelity Series Stock Selector Large Cap Value Fund | 23,073,850 | 11,954 | 329,193,238 |
The tax character of distributions paid was as follows:
January 31, 2013 | Ordinary Income |
Fidelity Series Equity-Income Fund | $ 9,328,125 |
Fidelity Series Stock Selector Large Cap Value Fund | 8,312,592 |
4. Purchases and Sales of Investments.
Purchases and sales of securities, other than short-term securities, are noted in the table below.
| Purchases ($) | Sales ($) |
Fidelity Series Equity-Income Fund | 7,288,581,815 | 2,395,080,410 |
Fidelity Series Stock Selector Large Cap Value Fund | 7,158,614,499 | 2,255,902,475 |
5. Fees and Other Transactions with Affiliates.
Management Fee. FMR and its affiliates provide the Funds with investment management related services for which the Funds pay a monthly management fee. The management fee is the sum of an individual fund fee rate and an annualized group fee rate. The
Annual Report
5. Fees and Other Transactions with Affiliates - continued
Management Fee - continued
individual fund fee rate is applied to each Fund's average net assets. The group fee rate is based upon the average net assets of all the mutual funds advised by FMR. The group fee rate decreases as assets under management increase and increases as assets under management decrease. In addition, the management fee for Fidelity Series Stock Selector Large Cap Value Fund is subject to a performance adjustment (up to a maximum of ± .20% of the Fund's average net assets over a 36 month performance period). The upward or downward adjustment to the management fee is based on Series Stock Selector Large Cap Value's relative investment performance as compared to an appropriate benchmark index. The Fund's performance adjustment will not take effect until December 1, 2013. Subsequent months will be added until the performance period includes 36 months. For the period, each Fund's annualized management fee rate expressed as a percentage of each Fund's average net assets was as follows:
| Individual Rate | Group Rate | Total |
Fidelity Series Equity-Income Fund | .20% | .26% | .45% |
Fidelity Series Stock Selector Large Cap Value Fund | .30% | .26% | .55% |
Transfer Agent Fees. Fidelity Investments Institutional Operations Company, Inc. (FIIOC), an affiliate of FMR, is the transfer, dividend disbursing and shareholder servicing agent for each class of the Funds. FIIOC receives account fees and asset-based fees that vary according to the account size and type of account of the shareholders of the respective classes of each Fund except for Class F. FIIOC receives no fees for providing transfer agency services to Class F. FIIOC pays for typesetting, printing and mailing of shareholder reports, except proxy statements. For the period, transfer agent fees for each applicable class were as follows:
Fidelity Series Equity-Income Fund | Amount | % of
Average
Net Assets* |
Series Equity-Income | $ 682,426 | .19 |
| | |
Fidelity Series Stock Selector Large Cap Value Fund | | |
Series Stock Selector Large Cap Value | $ 686,880 | .19 |
* Annualized
Accounting and Security Lending Fees. Fidelity Service Company, Inc. (FSC), an affiliate of FMR, maintains each Fund's accounting records. The accounting fee is based on the level of average net assets for each month. Under a separate contract, FSC administers the security lending program. The security lending fee is based on the number and duration of lending transactions.
Annual Report
Notes to Financial Statements - continued
5. Fees and Other Transactions with Affiliates - continued
Brokerage Commissions. The Funds placed a portion of their portfolio transactions with brokerage firms which are affiliates of the investment adviser. The commissions paid to these affiliated firms were as follows:
| Amount |
Fidelity Series Equity-Income Fund | $ 61,663 |
Fidelity Series Stock Selector Large Cap Value Fund | 56,626 |
Interfund Lending Program. Pursuant to an Exemptive Order issued by the SEC, the Funds, along with other registered investment companies having management contracts with FMR, may participate in an interfund lending program. This program provides an alternative credit facility allowing the funds to borrow from, or lend money to, other participating affiliated funds. At period end, Fidelity Series Equity-Income Fund had no interfund loans outstanding. Each applicable fund's activity in this program during the period for which loans were outstanding was as follows:
| Borrower or
Lender | Average Loan
Balance | Weighted
Average
Interest Rate | Interest
Expense |
Fidelity Series Equity-Income Fund | Borrower | $ 7,584,000 | .33% | $ 71 |
Exchanges In-Kind. During the period, certain investment companies managed by FMR or its affiliates (Investing Funds) completed exchanges in-kind with Fidelity Series Equity-Income Fund. The Investing Funds delivered cash and securities valued at $5,038,397,215 in exchange for 503,839,721 shares of Fidelity Series Equity-Income Fund. The amount of in-kind exchanges is included in share transactions in the accompanying Statement of Changes in Net Assets as well as Note 9: Share Transactions. Fidelity Series Equity-Income Fund recognized no gain or loss for federal income tax purposes.
In addition, certain investment companies managed by FMR or its affiliates (Investing Funds) completed exchanges in-kind with Fidelity Series Stock Selector Large Cap Value Fund. The Investing Funds delivered cash and securities valued at $5,033,637,867 in exchange for 503,363,787 shares of Fidelity Series Stock Selector Large Cap Value Fund. The amount of in-kind exchanges is included in share transactions in the accompanying Statement of Changes in Net Assets as well as Note 9: Share Transactions. Fidelity Series Stock Selector Large Cap Value Fund recognized no gain or loss for federal income tax purposes.
Annual Report
6. Security Lending.
Certain Funds lend portfolio securities through a lending agent from time to time in order to earn additional income. For equity securities, a lending agent is used and may loan securities to certain qualified borrowers, including Fidelity Capital Markets (FCM), a broker-dealer affiliated with the Funds. On the settlement date of the loan, each applicable Fund receives collateral (in the form of U.S. Treasury obligations, letters of credit and/or cash) against the loaned securities and maintains collateral in an amount not less than 100% of the market value of the loaned securities during the period of the loan. The market value of the loaned securities is determined at the close of business of the Funds and any additional required collateral is delivered to the Funds on the next business day. If the borrower defaults on its obligation to return the securities loaned because of insolvency or other reasons, a fund could experience delays and costs in recovering the securities loaned or in gaining access to the collateral. Any cash collateral received is invested in the Fidelity Securities Lending Cash Central Fund. The value of loaned securities and cash collateral at period end are disclosed on each applicable Fund's Statement of Assets and Liabilities. Security lending income represents the income earned on investing cash collateral, less rebates paid to borrowers and any lending agent fees associated with the loan, plus any premium payments received for lending certain types of securities. Security lending income is presented on each applicable Fund's Statement of Operations as a component of income from Fidelity Central Funds. During the period, there were no securities loaned to FCM. Security lending activity as of and during the period was as follows:
| Total Security
Lending Income |
Fidelity Series Stock Selector Large Cap Value Fund | $ 8,598 |
7. Expense Reductions.
Many of the brokers with whom FMR places trades on behalf of certain Funds provided services to these Funds in addition to trade execution. These services included payments of expenses on behalf of each applicable Fund. All of the applicable expense reductions are noted in the table below.
| Expense
reduction |
| |
Fidelity Series Equity-Income Fund | $ 673,781 |
Fidelity Series Stock Selector Large Cap Value Fund | 605,462 |
Annual Report
Notes to Financial Statements - continued
8. Distributions to Shareholders.
Distributions to shareholders of each class were as follows:
Period ended January 31, | 2013 A |
Fidelity Series Equity-Income Fund | |
From net investment income | |
Series Equity-Income | $ 4,406,929 |
Class F | 4,921,196 |
Total | $ 9,328,125 |
Fidelity Series Stock Selector Large Cap Value Fund | |
From net investment income | |
Series Stock Selector Large Cap Value | $ 3,913,471 |
Class F | 4,399,121 |
Total | $ 8,312,592 |
A For the period December 6, 2012 (commencement of operations) to January 31, 2013.
9. Share Transactions.
Transactions for each class of shares were as follows:
| Shares A | Dollars A |
Period ended January 31, | | |
Fidelity Series Equity-Income Fund | | |
Series Equity-Income | | |
Shares sold | 244,923,244 B | $ 2,449,276,441 B |
Reinvestment of distributions | 439,813 | 4,406,929 |
Shares redeemed | (9,487,619) | (98,169,070) |
Net increase (decrease) | 235,875,438 | $ 2,355,514,300 |
Class F | | |
Shares sold | 263,502,861 B | $ 2,636,943,798 B |
Reinvestment of distributions | 491,137 | 4,921,196 |
Shares redeemed | (3,694,500) | (37,348,817) |
Net increase (decrease) | 260,299,498 | $ 2,604,516,177 |
Fidelity Series Stock Selector Large Cap Value Fund | | |
Series Stock Selector Large Cap Value | | |
Shares sold | 244,684,738 B | $ 2,446,901,557B |
Reinvestment of distributions | 389,400 | 3,913,471 |
Shares redeemed | (9,606,914) | (100,362,070) |
Net increase (decrease) | 235,467,224 | $ 2,350,452,958 |
Class F | | |
Shares sold | 263,241,693 B | $ 2,634,811,908B |
Reinvestment of distributions | 437,723 | 4,399,121 |
Shares redeemed | (3,815,418) | (38,907,019) |
Net increase (decrease) | 259,863,998 | $ 2,600,304,010 |
A For the period December 6, 2012 (commencement of operations) to January 31, 2013.
B Amount includes in-kind exchanges (see Note 5: Exchanges In-Kind).
Annual Report
10. Other.
The Funds' organizational documents provide former and current trustees and officers with a limited indemnification against liabilities arising in connection with the performance of their duties to the Funds. In the normal course of business, the Funds may also enter into contracts that provide general indemnifications. The Funds' maximum exposure under these arrangements is unknown as this would be dependent on future claims that may be made against the Funds. The risk of material loss from such claims is considered remote.
At the end of the period, mutual funds managed by FMR or an FMR affiliate were the owners of record of all of the outstanding shares of the Funds.
Annual Report
To the Trustees of Fidelity Devonshire Trust and Shareholders of Fidelity Series Equity-Income Fund:
We have audited the accompanying statement of assets and liabilities of Fidelity Series Equity-Income Fund (the Fund), a fund of Fidelity Devonshire Trust, including the schedule of investments, as of January 31, 2013, and the related statement of operations, the statement of changes in net assets and the financial highlights for the period from December 6, 2012 (commencement of operations) to January 31, 2013. These financial statements and financial highlights are the responsibility of the Fund's management. Our responsibility is to express an opinion on these financial statements and financial highlights based on our audit.
We conducted our audit in accordance with the standards of the Public Company Accounting Oversight Board (United States). Those standards require that we plan and perform the audit to obtain reasonable assurance about whether the financial statements and financial highlights are free of material misstatement. The Fund is not required to have, nor were we engaged to perform, an audit of its internal control over financial reporting. Our audit included consideration of internal control over financial reporting as a basis for designing audit procedures that are appropriate in the circumstances, but not for the purpose of expressing an opinion on the effectiveness of the Fund's internal control over financial reporting. Accordingly, we express no such opinion. An audit also includes examining, on a test basis, evidence supporting the amounts and disclosures in the financial statements, assessing the accounting principles used and significant estimates made by management, as well as evaluating the overall financial statement presentation. Our procedures included confirmation of securities owned as of January 31, 2013, by correspondence with the custodians and brokers; where replies were not received from brokers, we performed other auditing procedures. We believe that our audit provides a reasonable basis for our opinion.
In our opinion, the financial statements and financial highlights referred to above present fairly, in all material respects, the financial position of Fidelity Series Equity-Income Fund as of January 31, 2013, and the results of its operations, the changes in its net assets and the financial highlights for the period from December 6, 2012 (commencement of operations) to January 31, 2013, in conformity with accounting principles generally accepted in the United States of America.
DELOITTE & TOUCHE LLP
Boston, Massachusetts
March 20, 2013
Annual Report
Report of Independent Registered Public Accounting Firm
To the Trustees of Fidelity Devonshire Trust and the Shareholders of Fidelity Series Stock Selector Large Cap Value Fund:
In our opinion, the accompanying statement of assets and liabilities, including the schedule of investments, and the related statements of operations and of changes in net assets and the financial highlights present fairly, in all material respects, the financial position of Fidelity Series Stock Selector Large Cap Value Fund (a fund of Fidelity Devonshire Trust) at January 31, 2013 and the results of its operations, the changes in its net assets and the financial highlights for the period of December 6, 2012 (commencement of operations) through January 31, 2013, in conformity with accounting principles generally accepted in the United States of America. These financial statements and financial highlights (hereafter referred to as "financial statements") are the responsibility of the Fidelity Series Stock Selector Large Cap Value Fund's management. Our responsibility is to express an opinion on these financial statements based on our audit. We conducted our audit of these financial statements in accordance with the standards of the Public Company Accounting Oversight Board (United States). Those standards require that we plan and perform the audit to obtain reasonable assurance about whether the financial statements are free of material misstatement. An audit includes examining, on a test basis, evidence supporting the amounts and disclosures in the financial statements, assessing the accounting principles used and significant estimates made by management, and evaluating the overall financial statement presentation. We believe that our audit, which included confirmation of securities at January 31, 2013 by correspondence with the custodian and brokers, provide a reasonable basis for our opinion.
PricewaterhouseCoopers LLP
Boston, Massachusetts
March 20, 2013
Annual Report
The Trustees, Members of the Advisory Board, and executive officers of the trust and funds, as applicable, are listed below. The Board of Trustees governs each fund and is responsible for protecting the interests of shareholders. The Trustees are experienced executives who meet periodically throughout the year to oversee each fund's activities, review contractual arrangements with companies that provide services to each fund, oversee management of the risks associated with such activities and contractual arrangements, and review each fund's performance. Except for James C. Curvey, each of the Trustees oversees 234 Fidelity funds. Mr. Curvey oversees 453 Fidelity funds.
The Trustees hold office without limit in time except that (a) any Trustee may resign; (b) any Trustee may be removed by written instrument, signed by at least two-thirds of the number of Trustees prior to such removal; (c) any Trustee who requests to be retired or who has become incapacitated by illness or injury may be retired by written instrument signed by a majority of the other Trustees; and (d) any Trustee may be removed at any special meeting of shareholders by a two-thirds vote of the outstanding voting securities of the trust. Each Trustee who is not an interested person (as defined in the 1940 Act) (Independent Trustee), shall retire not later than the last day of the calendar year in which his or her 75th birthday occurs. The Independent Trustees may waive this mandatory retirement age policy with respect to individual Trustees. The executive officers and Advisory Board Members hold office without limit in time, except that any officer and Advisory Board Member may resign or may be removed by a vote of a majority of the Trustees at any regular meeting or any special meeting of the Trustees. Except as indicated, each individual has held the office shown or other offices in the same company for the past five years.
Experience, Skills, Attributes, and Qualifications of the Funds' Trustees. The Governance and Nominating Committee has adopted a statement of policy that describes the experience, qualifications, attributes, and skills that are necessary and desirable for potential Independent Trustee candidates (Statement of Policy). The Board believes that each Trustee satisfied at the time he or she was initially elected or appointed a Trustee, and continues to satisfy, the standards contemplated by the Statement of Policy. The Governance and Nominating Committee also engages professional search firms to help identify potential Independent Trustee candidates who have the experience, qualifications, attributes, and skills consistent with the Statement of Policy. From time to time, additional criteria based on the composition and skills of the current Independent Trustees, as well as experience or skills that may be appropriate in light of future changes to board composition, business conditions, and regulatory or other developments, have also been considered by the professional search firms and the Governance and Nominating Committee. In addition, the Board takes into account the Trustees' commitment and participation in Board and committee meetings, as well as their leadership of standing and ad hoc committees throughout their tenure.
In determining that a particular Trustee was and continues to be qualified to serve as a Trustee, the Board has considered a variety of criteria, none of which, in isolation, was controlling. The Board believes that, collectively, the Trustees have balanced and diverse experience, qualifications, attributes, and skills, which allow the Board to operate effectively in governing each fund and protecting the interests of shareholders. Information about the specific experience, skills, attributes, and qualifications of each Trustee, which in each case led to the Board's conclusion that the Trustee should serve (or continue to serve) as a trustee of the funds, is provided below.
Annual Report
Board Structure and Oversight Function. James C. Curvey is an interested person (as defined in the 1940 Act) and currently serves as Chairman. The Trustees have determined that an interested Chairman is appropriate and benefits shareholders because an interested Chairman has a personal and professional stake in the quality and continuity of services provided to the funds. Independent Trustees exercise their informed business judgment to appoint an individual of their choosing to serve as Chairman, regardless of whether the Trustee happens to be independent or a member of management. The Independent Trustees have determined that they can act independently and effectively without having an Independent Trustee serve as Chairman and that a key structural component for assuring that they are in a position to do so is for the Independent Trustees to constitute a substantial majority for the Board. The Independent Trustees also regularly meet in executive session. Ned C. Lautenbach serves as Chairman of the Independent Trustees and as such (i) acts as a liaison between the Independent Trustees and management with respect to matters important to the Independent Trustees and (ii) with management prepares agendas for Board meetings.
Fidelity funds are overseen by different Boards of Trustees. The funds' Board oversees Fidelity's equity and high income funds and another Board oversees Fidelity's investment-grade bond, money market, and asset allocation funds. The asset allocation funds may invest in Fidelity funds overseen by the funds' Board. The use of separate Boards, each with its own committee structure, allows the Trustees of each group of Fidelity funds to focus on the unique issues of the funds they oversee, including common research, investment, and operational issues. On occasion, the separate Boards establish joint committees to address issues of overlapping consequences for the Fidelity funds overseen by each Board.
The Trustees operate using a system of committees to facilitate the timely and efficient consideration of all matters of importance to the Trustees, each fund, and fund shareholders and to facilitate compliance with legal and regulatory requirements and oversight of the funds' activities and associated risks. The Board, acting through its committees, has charged FMR and its affiliates with (i) identifying events or circumstances the occurrence of which could have demonstrably adverse effects on the funds' business and/or reputation; (ii) implementing processes and controls to lessen the possibility that such events or circumstances occur or to mitigate the effects of such events or circumstances if they do occur; and (iii) creating and maintaining a system designed to evaluate continuously business and market conditions in order to facilitate the identification and implementation processes described in (i) and (ii) above. Because the day-to-day operations and activities of the funds are carried out by or through FMR, its affiliates and other service providers, the funds' exposure to risks is mitigated but not eliminated by the processes overseen by the Trustees. While each of the Board's committees has responsibility for overseeing different aspects of the funds' activities, oversight is exercised primarily through the Operations, Audit, and Compliance Committees. In addition, the Independent Trustees have worked with FMR to enhance the Board's oversight of investment and financial risks, legal and regulatory risks, technology risks, and operational risks, including the development of additional risk reporting to the Board. For example, a working group comprised of Independent Trustees and FMR has worked and continues to work to review the Fidelity funds' valuation-related activities, reporting and risk management. Appropriate personnel, including but not limited to the funds' Chief Compliance Officer (CCO), FMR's internal auditor, the independent accountants, the funds' Treasurer and portfolio management personnel, make periodic reports to the Board's committees, as appropriate, including an annual review of FMR's risk management program for the Fidelity funds. The responsibilities of each standing committee, including their oversight responsibilities, are described further under "Standing Committees of the Funds' Trustees."
Annual Report
Trustees and Officers - continued
The funds' Statements of Additional Information (SAIs) include more information about the Trustees. To request a free copy, call Fidelity at 1-800-544-8544 for Fidelity Series Equity-Income Fund and Fidelity Series Stock Selector Large Cap Value Fund, or 1-800-835-5092 for Class F.
Interested Trustees*:
Correspondence intended for each Trustee who is an interested person may be sent to Fidelity Investments, 245 Summer Street, Boston, Massachusetts 02210.
Name, Age; Principal Occupations and Other Relevant Experience+ |
James C. Curvey (77) |
| Year of Election or Appointment: 2007 Mr. Curvey is Trustee and Chairman of the Board of Trustees of certain Trusts. Mr. Curvey also serves as Trustee (2007-present) of other investment companies advised by FMR. Mr. Curvey is a Director of Fidelity Investments Money Management, Inc. (2009-present), Director of Fidelity Research & Analysis Co. (2009-present) and Director of FMR and FMR Co., Inc. (2007-present). Mr. Curvey is also Vice Chairman (2007-present) and Director of FMR LLC. In addition, Mr. Curvey serves as an Overseer for the Boston Symphony Orchestra and a member of the Trustees of Villanova University. Previously, Mr. Curvey was the Vice Chairman (2006-2007) and Director (2000-2007) of FMR Corp. |
Ronald P. O'Hanley (55) |
| Year of Election or Appointment: 2011 Mr. O'Hanley is Director of FMR Co., Inc. (2010-present), Director of Fidelity Investments Money Management, Inc. (2010-present), Director of Fidelity Research & Analysis Company (2010-present), President of Fidelity Asset Management and Corporate Services and a member of Fidelity's Executive Committee (2010-present). Previously, Mr. O'Hanley served as President and Chief Executive Officer of BNY Mellon Asset Management (2007-2010). Mr. O'Hanley also served as Vice Chairman of Bank New York Mellon Corp. and a member of that firm's Executive Committee. Prior to the 2007 merger of The Bank of New York and Mellon Financial Corporation, he was Vice Chairman of Mellon Financial Corporation and President and Chief Executive Officer of Mellon Asset Management. He joined Mellon in February 1997. Mr. O'Hanley currently serves as Chairman of the Boston Public Library Foundation Board of Directors and sits on the Board of Directors of Beth Israel Deaconess Medical Center, the Board of Trustees of the Marine Biological Laboratory and the Advisory Board of the Maxwell School of Citizenship and Public Administration at Syracuse University. Mr. O'Hanley also chairs the Council on Asset Management for the Financial Services Roundtable and is a member of the Board of Directors of Institutional Investor's U.S. Institute. |
* Trustees have been determined to be "Interested Trustees" by virtue of, among other things, their affiliation with the trust or various entities under common control with FMR.
+ The information above includes each Trustee's principal occupation during the last five years and other information relating to the experience, attributes, and skills relevant to each Trustee's qualifications to serve as a Trustee, which led to the conclusion that each Trustee should serve as a Trustee for each fund.
Annual Report
Trustees and Officers - continued
Independent Trustees:
Correspondence intended for each Independent Trustee (that is, the Trustees other than the Interested Trustees) may be sent to Fidelity Investments, P.O. Box 55235, Boston, Massachusetts 02205-5235.
Name, Age; Principal Occupations and Other Relevant Experience+ |
Dennis J. Dirks (64) |
| Year of Election or Appointment: 2005 Prior to his retirement in May 2003, Mr. Dirks was Chief Operating Officer and a member of the Board of The Depository Trust & Clearing Corporation (DTCC). He also served as President, Chief Operating Officer, and Board member of The Depository Trust Company (DTC) and President and Board member of the National Securities Clearing Corporation (NSCC). In addition, Mr. Dirks served as Chief Executive Officer and Board member of the Government Securities Clearing Corporation, Chief Executive Officer and Board member of the Mortgage-Backed Securities Clearing Corporation, as a Trustee and a member of the Finance Committee of Manhattan College (2005-2008), and as a Trustee and a member of the Finance Committee of AHRC of Nassau County (2006-2008). Mr. Dirks is a member of the Independent Directors Council (IDC) Governing Council (2010-present) and Board of Directors for The Brookville Center for Children's Services, Inc. (2009-present). |
Alan J. Lacy (59) |
| Year of Election or Appointment: 2008 Mr. Lacy serves as Senior Adviser (2007-present) of Oak Hill Capital Partners, L.P. (private equity). Mr. Lacy also served as Chief Executive Officer (2000-2005) and Vice Chairman (2005-2006) of Sears Holdings Corporation and Sears, Roebuck and Co. (retail). In addition, Mr. Lacy serves as a member of the Board of Directors of Dave & Buster's Entertainment, Inc. (restaurant and entertainment complexes, 2010-present), Earth Fare, Inc. (retail grocery, 2012-present), The Hillman Companies, Inc. (hardware wholesalers, 2010-present), and Bristol-Myers Squibb Company (global pharmaceuticals, 2008-present). Mr. Lacy is a member of the Board of Trustees of The National Parks Conservation Association (2006-present). Previously, Mr. Lacy served as Chairman of the Board of Trustees of the National Parks Conservation Association (2008-2011) and as a member of the Board of Directors for the Western Union Company (global money transfer, 2006-2011). |
Ned C. Lautenbach (68) |
| Year of Election or Appointment: 2000 Mr. Lautenbach is Chairman of the Independent Trustees of the Equity and High Income Funds (2006-present). Mr. Lautenbach currently serves as the Lead Director of the Eaton Corporation Board of Directors (diversified industrial, 1997-present). Mr. Lautenbach is Chairman of the Board of Directors of the Philharmonic Center for the Arts in Naples, Florida (2012-present) and a member of the Council on Foreign Relations (1994-present). Previously, Mr. Lautenbach was a Partner/Advisory Partner at Clayton, Dubilier & Rice, LLC (private equity investment, 1998-2010), as well as a Director of Sony Corporation (2006-2007). |
Joseph Mauriello (68) |
| Year of Election or Appointment: 2008 Prior to his retirement in January 2006, Mr. Mauriello served in numerous senior management positions including Deputy Chairman and Chief Operating Officer (2004-2005), and Vice Chairman of Financial Services (2002-2004) of KPMG LLP US (professional services, 1965-2005). Mr. Mauriello currently serves as a member of the Board of Directors of XL Group plc. (global insurance and re-insurance, 2006-present). Previously, Mr. Mauriello served as a Director of the Hamilton Funds of the Bank of New York (2006-2007) and of Arcadia Resources Inc. (health care services and products, 2007-2012). |
Robert W. Selander (62) |
| Year of Election or Appointment: 2011 Previously, Mr. Selander served as a Member of the Advisory Board of Fidelity's Equity and High Income Funds (2011), Executive Vice Chairman (2010), Chief Executive Officer (2009-2010), and President and Chief Executive Officer (1997-2009) of Mastercard, Inc. |
Cornelia M. Small (68) |
| Year of Election or Appointment: 2005 Ms. Small is a member of the Board of Directors (2009-present) and Chair of the Investment Committee (2010-present) of the Teagle Foundation. Ms. Small also serves on the Investment Committee of the Berkshire Taconic Community Foundation (2008-present). Previously, Ms. Small served as Chairperson (2002-2008) and a member of the Investment Committee and Chairperson (2008-2012) and a member of the Board of Trustees of Smith College. In addition, Ms. Small served as Chief Investment Officer, Director of Global Equity Investments, and a member of the Board of Directors of Scudder, Stevens & Clark and Scudder Kemper Investments. |
William S. Stavropoulos (73) |
| Year of Election or Appointment: 2002 Mr. Stavropoulos is Vice Chairman of the Independent Trustees of the Equity and High Income Funds (2006-present). Mr. Stavropoulos serves as President and Founder of the Michigan Baseball Foundation, the Great Lakes Loons (2007-present). Mr. Stavropoulos is Chairman Emeritus of the Board of Directors of The Dow Chemical Company, where he previously served in numerous senior management positions, including President, CEO (1995-2000; 2002-2004), Chairman of the Executive Committee (2000-2006), and as a member of the Board of Directors (1990-2006). Currently, Mr. Stavropoulos is a Director of Univar Inc. (global distributor of commodity and specialty chemicals, Chairman from 2010-May 2012 and Lead Director from May 2012-present), Teradata Corporation (data warehousing and technology solutions, 2008-present), Maersk Inc. (industrial conglomerate), and Tyco International, Ltd. (multinational manufacturing and services, 2007-present), and a member of the Advisory Board for Metalmark Capital LLC (private equity investment, 2005-present). Mr. Stavropoulos is an operating advisor to Clayton, Dubilier & Rice, LLC (private equity investment). In addition, Mr. Stavropoulos is a member of the University of Notre Dame Advisory Council for the College of Science, a Trustee of the Rollin L. Gerstacker Foundation, and a Director of the Naples Philharmonic Center for the Arts. Previously, Mr. Stavropoulos served as a Director of Chemical Financial Corporation (bank holding company, 1993-2012). |
David M. Thomas (63) |
| Year of Election or Appointment: 2008 Previously, Mr. Thomas served as Executive Chairman (2005-2006) and Chairman and Chief Executive Officer (2000-2005) of IMS Health, Inc. (pharmaceutical and healthcare information solutions), and a Director of Fortune Brands, Inc. (consumer products, 2000-2011). In addition, Mr. Thomas serves as Non-Executive Chairman of the Board of Directors of Fortune Brands Home and Security (home and security products, 2011-present), and as a member of the Board of Directors of Interpublic Group of Companies, Inc. (marketing communication, 2004-present). |
Michael E. Wiley (62) |
| Year of Election or Appointment: 2008 Mr. Wiley also serves as a Director of Asia Pacific Exploration Consolidated (international oil and gas exploration and production, 2008-present). Mr. Wiley serves as a Director of Tesoro Corporation (independent oil refiner and marketer, 2005-present), and a Director of Bill Barrett Corporation (exploration and production, 2005-present). In addition, Mr. Wiley also serves as a Director of Post Oak Bank (privately-held bank, 2004-present). Previously, Mr. Wiley served as a member of the Board of Trustees of the University of Tulsa (2000-2006; 2007-2010), as a Senior Energy Advisor of Katzenbach Partners, LLC (consulting, 2006-2007), as an Advisory Director of Riverstone Holdings (private investment), Chairman, President, and CEO of Baker Hughes, Inc. (oilfield services, 2000-2004), and as Director of Spinnaker Exploration Company (exploration and production, 2001-2005). |
+ The information above includes each Trustee's principal occupation during the last five years and other information relating to the experience, attributes, and skills relevant to each Trustee's qualifications to serve as a Trustee, which led to the conclusion that each Trustee should serve as a Trustee for each fund.
Advisory Board Members and Executive Officers:
Correspondence intended for David A. Rosow and Garnett A. Smith may be sent to Fidelity Investments, P.O. Box 55235, Boston, Massachusetts 02205-5235. Correspondence intended for each executive officer and Peter S. Lynch may be sent to Fidelity Investments, 245 Summer Street, Boston, Massachusetts 02210.
Name, Age; Principal Occupation |
Peter S. Lynch (69) |
| Year of Election or Appointment: 2003 Member of the Advisory Board of Fidelity's Equity and High Income Funds. Mr. Lynch is Vice Chairman and a Director of FMR and FMR Co., Inc. In addition, Mr. Lynch serves as a Trustee of Boston College and as the Chairman of the Inner-City Scholarship Fund. Previously, Mr. Lynch served on the Special Olympics International Board of Directors (1997-2006). |
David A. Rosow (70) |
| Year of Election or Appointment: 2012 Member of the Advisory Board of Fidelity's Equity and High Income Funds. Chairman and Chief Executive Officer of International Golf Group, Inc. (golf course development, 1989-present). Previously, Mr. Rosow served as Chairman and Chief Executive Officer of Rosow & Company, Inc. (private investment company, 1989-2011), a Lead Director of Hudson United Bancorp (2001-2006) and as a Director of TD Banknorth (1996-2006). In addition, Mr. Rosow is a member (2008-present) and President (2009-present) of the Town Council of Palm Beach, Florida. |
Garnett A. Smith (65) |
| Year of Election or Appointment: 2012 Member of the Advisory Board of Fidelity's Equity and High Income Funds. Prior to Mr. Smith's retirement, he served as Chairman and Chief Executive Officer of Inbrand Corp. (manufacturer of personal absorbent products, 1990-1997). He also served as President (1986-1990) of Inbrand Corp. Prior to his employment with Inbrand Corp., he was employed by a retail fabric chain and North Carolina National Bank. In addition, Mr. Smith is a board member of the Jackson Hole Land Trust (2009-present). |
Kenneth B. Robins (43) |
| Year of Election or Appointment: 2008 President and Treasurer of Fidelity's Equity and High Income Funds. Mr. Robins also serves as President and Treasurer (2010-present) and Assistant Treasurer (2009-present) of other Fidelity funds and is an employee of Fidelity Investments (2004-present). Previously, Mr. Robins served as Deputy Treasurer of the Fidelity funds (2005-2008) and Treasurer and Chief Financial Officer of The North Carolina Capital Management Trust: Cash and Term Portfolios (2006-2008). |
Bruce T. Herring (47) |
| Year of Election or Appointment: 2006 Vice President of certain Equity Funds. Mr. Herring also serves as Chief Investment Officer of Fidelity Global Asset Allocation (GAA) (2013-present), Chief Investment Officer and Director of Fidelity Management & Research (U.K.) Inc. (2010-present), Group Chief Investment Officer of FMR, and President of Fidelity Research & Analysis Company (2010-present). Previously, Mr. Herring served as Vice President (2005-2006) and Senior Vice President (2006-2007) of Fidelity Management & Research Company, Vice President of FMR Co., Inc. (2001-2007) and as a portfolio manager for Fidelity U.S. Equity Funds. |
Brian B. Hogan (48) |
| Year of Election or Appointment: 2009 Vice President of Equity and High Income Funds. Mr. Hogan also serves as President of FMR's Equity Division (2009-present). Previously, Mr. Hogan served as Senior Vice President, Equity Research of FMR (2006-2009) and as a portfolio manager. |
Thomas C. Hense (49) |
| Year of Election or Appointment: 2008 or 2010 Vice President of Fidelity's High Income (2008), Small Cap (2008), and Value (2010) Funds. Previously, Mr. Hense served as a portfolio manager for Fidelity's Institutional Money Management Group (Pyramis) (2003-2008). |
Scott C. Goebel (45) |
| Year of Election or Appointment: 2008 Secretary and Chief Legal Officer (CLO) of the Fidelity funds. Mr. Goebel also serves as Secretary of Fidelity Investments Money Management, Inc. (FIMM) (2010-present) and Fidelity Research and Analysis Company (FRAC) (2010-present); Secretary and CLO of The North Carolina Capital Management Trust: Cash and Term Portfolios (2008-present); General Counsel, Secretary, and Senior Vice President of FMR (2008-present) and FMR Co., Inc. (2008-present); employed by FMR LLC or an affiliate (2001-present); Chief Legal Officer of Fidelity Management & Research (Hong Kong) Limited (2008-present) and Assistant Secretary of Fidelity Management & Research (Japan) Inc. (2008-present), and Fidelity Management & Research (U.K.) Inc. (2008-present). Previously, Mr. Goebel served as Assistant Secretary of FIMM (2008-2010), FRAC (2008-2010), and the Funds (2007-2008) and as Vice President and Secretary of Fidelity Distributors Corporation (FDC) (2005-2007). |
William C. Coffey (43) |
| Year of Election or Appointment: 2009 Assistant Secretary of Fidelity's Equity and High Income Funds. Mr. Coffey also serves as Senior Vice President and Deputy General Counsel of FMR LLC (2010-present), and is an employee of Fidelity Investments. Previously, Mr. Coffey served as Vice President and Associate General Counsel of FMR LLC (2005-2009). |
Elizabeth Paige Baumann (44) |
| Year of Election or Appointment: 2012 Anti-Money Laundering (AML) Officer of the Fidelity funds. Ms. Baumann also serves as AML Officer of The North Carolina Capital Management Trust: Cash and Term Portfolios (2012-present), Chief AML Officer of FMR LLC (2012-present), and is an employee of Fidelity Investments. Previously, Ms. Baumann served as Vice President and Deputy Anti-Money Laundering Officer (2007-2012). |
Christine Reynolds (54) |
| Year of Election or Appointment: 2008 Chief Financial Officer of the Fidelity funds. Ms. Reynolds became President of Fidelity Pricing and Cash Management Services (FPCMS) in August 2008. Ms. Reynolds served as Chief Operating Officer of FPCMS (2007-2008). Previously, Ms. Reynolds served as President, Treasurer, and Anti-Money Laundering officer of the Fidelity funds (2004-2007). |
Joseph A. Hanlon (44) |
| Year of Election or Appointment: 2012 Chief Compliance Officer of Fidelity's Equity and High Income Funds. Mr. Hanlon serves as Compliance Officer of FMR, FMR Co., Inc., Fidelity Investments Money Management, Inc. (FIMM), Fidelity Research and Analysis Company (FRAC), Fidelity Management & Research (Japan) Inc., Fidelity Management & Research (U.K.) Inc., Fidelity Management & Research (Hong Kong), and Strategic Advisers, Inc. (2009-present), as Senior Vice President of the Fidelity Asset Management Division (2009-present), and is an employee of Fidelity Investments. |
Joseph F. Zambello (55) |
| Year of Election or Appointment: 2011 Deputy Treasurer of the Fidelity funds. Mr. Zambello is an employee of Fidelity Investments. Previously, Mr. Zambello served as Vice President of FMR's Program Management Group (2009-2011) and Vice President of the Transfer Agent Oversight Group (2005-2009). |
Adrien E. Deberghes (45) |
| Year of Election or Appointment: 2008 Deputy Treasurer of Fidelity's Equity and High Income Funds. Mr. Deberghes also serves as Vice President (2011-present) and Assistant Treasurer (2010-present) of other Fidelity funds, and is an employee of Fidelity Investments (2008-present). Previously, Mr. Deberghes served as Senior Vice President of Mutual Fund Administration at State Street Corporation (2007-2008), Senior Director of Mutual Fund Administration at Investors Bank & Trust (2005-2007), and Director of Finance for Dunkin' Brands (2000-2005). |
Stephen Sadoski (41) |
| Year of Election or Appointment: 2012 Deputy Treasurer of Fidelity's Equity and High Income Funds. Mr. Sadoski also serves as Deputy Treasurer of other Fidelity funds (2013-present) and is an employee of Fidelity Investments (2012-present). Previously, Mr. Sadoski served as Assistant Treasurer of Fidelity's Fixed Income and Asset Allocation Funds (2012-2013), an assistant chief accountant in the Division of Investment Management of the Securities and Exchange Commission (SEC) (2009-2012) and as a senior manager at Deloitte & Touche (1997-2009). |
Stacie Smith (38) |
| Year of Election or Appointment: 2013 Deputy Treasurer of Fidelity's Equity and High Income Funds. Ms. Smith is an employee of Fidelity Investments (2009-present). Previously, Ms. Smith served as Senior Audit Manager of Ernst & Young LLP (1996-2009). |
Stephanie J. Dorsey (43) |
| Year of Election or Appointment: 2010 Assistant Treasurer of Fidelity's Equity and High Income Funds. Ms. Dorsey also serves as President and Treasurer (2013-present) and Assistant Treasurer (2012-present) of other Fidelity funds and is an employee of Fidelity Investments (2008-present). Previously, Ms. Dorsey served as Deputy Treasurer of Fidelity's Fixed Income and Asset Allocation Funds (2008-2013), Treasurer (2004-2008) of the JPMorgan Mutual Funds and Vice President (2004-2008) of JPMorgan Chase Bank. |
John R. Hebble (54) |
| Year of Election or Appointment: 2009 Assistant Treasurer of Fidelity's Equity and High Income Funds. Mr. Hebble also serves as President (2011-present), Treasurer, and Chief Financial Officer of The North Carolina Capital Management Trust: Cash and Term Portfolios (2008-present) and is an employee of Fidelity Investments. Previously, Mr. Hebble served as President and Treasurer of Fidelity's Fixed Income and Asset Allocation Funds (2008-2013). |
Gary W. Ryan (54) |
| Year of Election or Appointment: 2005 Assistant Treasurer of the Fidelity funds. Mr. Ryan is an employee of Fidelity Investments. Previously, Mr. Ryan served as Vice President of Fund Reporting in Fidelity Pricing and Cash Management Services (FPCMS) (1999-2005). |
Jonathan Davis (44) |
| Year of Election or Appointment: 2010 Assistant Treasurer of the Fidelity funds. Mr. Davis is also Assistant Treasurer of Fidelity Rutland Square Trust II and Fidelity Commonwealth Trust II. Mr. Davis is an employee of Fidelity Investments. Previously, Mr. Davis served as Vice President and Associate General Counsel of FMR LLC (2003-2010). |
Annual Report
The Board of Trustees of each voted to pay to shareholders of record at the opening of business on record date, the following distributions per share derived from capital gains realized from sales of portfolio securities and dividends derived from net investment income:
Fund | Pay Date | Record Date | Dividends | Capital Gains |
Fidelity Series Equity-Income Fund | 03/11/13 | 03/08/13 | $0.000 | $0.025 |
Class F | 03/11/13 | 03/08/13 | $0.000 | $0.025 |
Fidelity Series Stock Selector Large Cap Value Fund | 03/11/13 | 03/08/13 | $0.005 | $0.043 |
Class F | 03/11/13 | 03/08/13 | $0.007 | $0.043 |
The funds hereby designate as capital gain dividend the amounts noted below for the taxable year ended January 31, 2013, or, if subsequently determined to be different, the net capital gain of such year.
Fidelity Series Equity-Income Fund | $ 168,828 |
Fidelity Series Stock Selector Large Cap Value Fund | $ 11,954 |
A percentage of the dividends distributed during the fiscal year for the following funds was derived from interest on U.S. Government securities which is generally exempt from state income tax:
Fidelity Series Equity-Income Fund | 0.02% |
Class F | 0.02% |
A percentage of the dividends distributed during the fiscal year for the following funds qualifies for the dividends-received deduction for corporate shareholders:
Fund | December
2012 |
Fidelity Series Equity-Income Fund | 81% |
Class F | 77% |
Fidelity Series Stock Selector Large Cap Value Fund | 84% |
Class F | 79% |
A percentage of the dividends distributed during the fiscal year for the following funds may be taken into account as a dividend for purposes of a maximum rate under 1(h) (11) of the Internal Revenue Code.
Fund | December
2012 |
Fidelity Series Equity-Income Fund | 86% |
Class F | 82% |
Fidelity Series Stock Selector Large Cap Value Fund | 100% |
Class F | 95% |
The fund will notify shareholders in January 2014 of amounts for use in preparing 2013 income tax returns.
Annual Report
Board Approval of Investment Advisory Contracts and Management Fees
Fidelity Series Equity-Income Fund
Fidelity Series Stock Selector Large Cap Value Fund
On September 19, 2012, the Board of Trustees, including the Independent Trustees (together, the Board), voted to approve the management contract and sub-advisory agreements (together, the Advisory Contracts) for each fund. The Board, assisted by the advice of fund counsel and Independent Trustees' counsel, considered a broad range of information.
Nature, Extent, and Quality of Services Provided. The Board considered the staffing within the investment adviser, FMR, and the sub-advisers (together, the Investment Advisers), including the backgrounds of the funds' investment personnel, and also considered the funds' investment objective, strategies, and related investment philosophy. The Board considered the structure of the portfolio manager compensation program and whether this structure provides appropriate incentives to act in the best interests of each fund.
Resources Dedicated to Investment Management and Support Services. The Board and the Fund Oversight and Research Committees reviewed the general qualifications and capabilities of the Investment Advisers' investment staff, including its size, education, experience, and resources, as well as the Investment Advisers' approach to recruiting, training, managing, and compensating investment personnel. The Board also noted that FMR has continued to increase the resources devoted to non-U.S. offices, including expansion of Fidelity's global investment organization. The Board noted that Fidelity's analysts have extensive resources, tools and capabilities that allow them to conduct sophisticated quantitative and fundamental analysis, as well as credit analysis of issuers, counterparties and guarantors. The Board also believes that Fidelity's investment professionals have sufficient access to global information and data so as to provide competitive investment results over time, and that those professionals also have access to sophisticated tools that permit them to assess portfolio construction and risk and performance attribution characteristics continuously, as well as to transmit new information and research conclusions rapidly around the world. Additionally, in its deliberations, the Board considered the Investment Advisers' trading and risk management capabilities and resources, which are an integral part of the investment management process.
Shareholder and Administrative Services. The Board considered the nature, extent, quality, and cost of advisory, administrative, and shareholder services to be performed by the Investment Advisers and their affiliates under the Advisory Contracts and under separate agreements covering transfer agency, pricing and bookkeeping, and securities lending services for each fund. The Board also considered the nature and extent of the supervision of third party service providers, principally custodians and subcustodians.
Annual Report
Board Approval of Investment Advisory Contracts and
Management Fees - continued
The Board noted that the growth of fund assets over time across the complex allows Fidelity to reinvest in the development of services designed to enhance the value or convenience of the Fidelity funds as investment vehicles. These services include 24-hour access to account information and market information through telephone representatives and over the Internet, investor education materials and asset allocation tools, and the expanded availability of Fidelity Investor Centers.
Investment Performance. Each fund is a new fund and therefore had no historical performance for the Board to review at the time it approved each fund's Advisory Contracts. The Board considered the Investment Advisers' strength in fundamental, research-driven Income/Growth and Growth & Capital Appreciation selection, which the Board is familiar with through its supervision of other Fidelity funds that invest in such securities.
Based on its review, the Board concluded that the nature, extent, and quality of services to be provided to each fund under the Advisory Contracts should benefit each fund's shareholders.
Competitiveness of Management Fee and Total Expense Ratio. The Board considered each fund's proposed management fee and the projected total expense ratio of each class of the fund in reviewing the Advisory Contracts. The Board noted that each fund's proposed management fee rate is lower than the median fee rate of funds with similar Lipper investment objective categories and comparable management fee characteristics. The Board also considered that the projected total expense ratios are comparable to those of similar classes and funds that Fidelity offers to shareholders.
Based on its review, the Board concluded that the management fee and the projected total expense ratio of each class of each fund were reasonable in light of the services that the fund and its shareholders will receive and the other factors considered.
Costs of the Services and Profitability. Each fund is a new fund and therefore no revenue, cost, or profitability data was available for the Board to review in respect of each fund at the time it approved the Advisory Contracts. In connection with its future renewal of each fund's Advisory Contracts, the Board will consider the revenues earned and the expenses incurred by Fidelity in conducting the business of developing, marketing, distributing, managing, administering and servicing each fund and its shareholders.
Economies of Scale. The Board will consider economies of scale when there is operating experience to permit assessment thereof. It noted that, notwithstanding the entrepreneurial risk associated with a new fund, the management fee was at a level normally associated, by comparison with competitors, with very high fund net assets, and Fidelity asserted to the Board that the level of the fee anticipated economies of scale at lower asset levels even before, if ever, economies of scale are achieved. The Board also noted that each fund and its shareholders would have access to the very considerable number and variety of services available through Fidelity and its affiliates.
Annual Report
Based on its evaluation of all of the conclusions noted above, and after considering all factors it believed relevant, the Board ultimately concluded that the advisory fee structures are fair and reasonable, and that each fund's Advisory Contracts should be approved.
Annual Report
Investment Adviser
Fidelity Management & Research Company
Boston, MA
Investment Sub-Advisers
FMR Co., Inc.
Fidelity Management & Research (U.K.) Inc.
Fidelity Management & Research (Hong Kong) Limited
Fidelity Management & Research (Japan) Inc.
General Distributor
Fidelity Distributors Corporation
Smithfield, RI
Transfer and Service Agents
Fidelity Investments Institutional Operations Company, Inc.
Boston, MA
Fidelity Service Company, Inc.
Boston, MA
Custodian
The Northern Trust Company
Chicago, IL
Fidelity Series Equity-Income Fund
State Street Bank & Trust Company
Quincy, MA
Fidelity Series Stock Selector Large Cap Value Fund
(Fidelity Investment logo)(registered trademark)
Corporate Headquarters
245 Summer St., Boston, MA 02210
www.fidelity.com
EDT-LDT-ANN-0313
1.956971.100
Fidelity Advisor®
Series Equity-Income Fund
and
Fidelity Advisor
Series Stock Selector Large Cap Value Fund
Annual Report
January 31, 2013
(Fidelity Cover Art)
Contents
Shareholder Expense Example | (Click Here) | An example of shareholder expenses. |
Fidelity Advisor® Series Equity-Income Fund |
Investment Summary | (Click Here) | A summary of the fund's holdings. |
Investments | (Click Here) | A complete list of the fund's investments with their market values. |
Financial Statements | (Click Here) | Statements of assets and liabilities, operations, and changes in net assets, as well as financial highlights. |
Fidelity Advisor Series Stock Selector Large Cap Value Fund |
Investment Summary | (Click Here) | A summary of the fund's holdings. |
Investments | (Click Here) | A complete list of the fund's investments with their market values. |
Financial Statements | (Click Here) | Statements of assets and liabilities, operations, and changes in net assets, as well as financial highlights. |
Notes | (Click Here) | Notes to the Financial Statements. |
Reports of Independent Registered Public Accounting Firms | (Click Here) | |
Trustees and Officers | (Click Here) | |
Distributions | (Click Here) | |
Board Approval of Investment Advisory Contracts and Management Fees | (Click Here) | |
To view a fund's proxy voting guidelines and proxy voting record for the 12-month period ended June 30, visit http://www.fidelity.com/proxyvotingresults or visit the Securities and Exchange Commission's (SEC) web site at http://www.sec.gov. You may also call 1-877-208-0098 to request a free copy of the proxy voting guidelines.
Standard & Poor's, S&P and S&P 500 are registered service marks of The McGraw-Hill Companies, Inc. and have been licensed for use by Fidelity Distributors Corporation.
Other third-party marks appearing herein are the property of their respective owners.
All other marks appearing herein are registered or unregistered trademarks or service marks of FMR LLC or an affiliated company. © 2013 FMR LLC. All rights reserved.
Annual Report
This report and the financial statements contained herein are submitted for the general information of the shareholders of the funds. This report is not authorized for distribution to prospective investors in the funds unless preceded or accompanied by an effective prospectus.
A fund files its complete schedule of portfolio holdings with the SEC for the first and third quarters of each fiscal year on Form N-Q. Forms N-Q are available on the SEC's web site at http://www.sec.gov. A fund's Forms N-Q may be reviewed and copied at the SEC's Public Reference Room in Washington, DC. Information regarding the operation of the SEC's Public Reference Room may be obtained by calling 1-800-SEC-0330. For a complete list of a fund's portfolio holdings, view the most recent holdings listing, semiannual report, or annual report on Fidelity's web site at http://www.fidelity.com, http://www.advisor.fidelity.com, or http://www.401k.com, as applicable.
NOT FDIC INSURED • MAY LOSE VALUE • NO BANK GUARANTEE
Neither the funds nor Fidelity Distributors Corporation is a bank.
Annual Report
Shareholder Expense Example
As a shareholder of a Fund, you incur two types of costs: (1) transaction costs and (2) ongoing costs, including management fees and other Fund expenses. This Example is intended to help you understand your ongoing costs (in dollars) of investing in the Funds and to compare these costs with the ongoing costs of investing in other mutual funds.
The actual expense Example is based on an investment of $1,000 invested at the beginning of the period and held for the entire period (December 6, 2012 to January 31, 2013). The hypothetical expense Example is based on an investment of $1,000 invested for the one-half year period (August 1, 2012 to January 31, 2013).
Actual Expenses
The first line of the accompanying table for each fund provides information about actual account values and actual expenses. You may use the information in this line, together with the amount you invested, to estimate the expenses that you paid over the period. Simply divide your account value by $1,000.00 (for example, an $8,600 account value divided by $1,000.00 = 8.6), then multiply the result by the number in the first line for a fund under the heading entitled "Expenses Paid During Period" to estimate the expenses you paid on your account during this period. In addition, each Fund, as a shareholder in the underlying Fidelity Central Funds, will indirectly bear its pro-rata share of the fees and expenses incurred by the underlying Fidelity Central Funds. These fees and expenses are not included in the Fund's annualized expense ratio used to calculate the expense estimate in the table below.
Hypothetical Example for Comparison Purposes
The second line of the accompanying table for each fund provides information about hypothetical account values and hypothetical expenses based on a fund's actual expense ratio and an assumed rate of return of 5% per year before expenses, which is not the Fund's actual return. The hypothetical account values and expenses may not be used to estimate the actual ending account balance or expenses you paid for the period. You may use this information to compare the ongoing costs of investing in the Fund and other funds. To do so, compare this 5% hypothetical example with the 5% hypothetical examples that appear in the shareholder reports of the other funds. In addition, each Fund, as a shareholder in the underlying Fidelity Central Funds, will indirectly bear its pro-rata share of the fees and expenses incurred by the underlying Fidelity Central Funds. These fees and expenses are not included in the Fund's annualized expense ratio used to calculate the expense estimate in the table below.
Please note that the expenses shown in the table are meant to highlight your ongoing costs only and do not reflect any transaction costs. Therefore, the second line of the table is useful in comparing ongoing costs only, and will not help you determine the relative total costs of owning different funds.
Annual Report
| Annualized
Expense Ratio | Beginning
Account Value | Ending
Account Value
January 31, 2013 | Expenses Paid
During Period |
Fidelity Advisor Series Equity-Income Fund | .75% | | | |
Actual | | $ 1,000.00 | $ 1,061.80 | $ 1.20 B |
HypotheticalA | | $ 1,000.00 | $ 1,021.37 | $ 3.81 C |
Fidelity Advisor Series Stock Selector Large Cap Value Fund | .85% | | | |
Actual | | $ 1,000.00 | $ 1,073.60 | $ 1.37 B |
HypotheticalA | | $ 1,000.00 | $ 1,020.86 | $ 4.32 C |
A 5% return per year before expenses
B Actual expenses are equal to each Fund's annualized expense ratio, multiplied by the average account value over the period, multiplied by 57/366 (to reflect the period December 6, 2012 to January 31, 2013).
C Hypothetical expenses are equal to each Fund's annualized expense ratio, multiplied by the average account value over the period, multiplied by 184/366 (to reflect the one-half year period).
Annual Report
Fidelity Advisor Series Equity-Income Fund
Top Ten Stocks as of January 31, 2013 |
| % of fund's
net assets |
Chevron Corp. | 4.6 |
JPMorgan Chase & Co. | 4.0 |
Wells Fargo & Co. | 3.9 |
Exxon Mobil Corp. | 3.7 |
Procter & Gamble Co. | 3.2 |
Comcast Corp. Class A | 3.0 |
Verizon Communications, Inc. | 2.6 |
Pfizer, Inc. | 2.6 |
General Electric Co. | 2.4 |
Johnson & Johnson | 2.4 |
| 32.4 |
Top Five Market Sectors as of January 31, 2013 |
| % of fund's
net assets |
Financials | 19.9 |
Energy | 14.0 |
Health Care | 13.7 |
Consumer Staples | 11.0 |
Industrials | 10.6 |
Asset Allocation (% of fund's net assets) |
As of January 31, 2013* |
| Stocks 98.5% | |
| Short-Term
Investments and
Net Other Assets
(Liabilities) 1.5% | |
* Foreign investments | 4.5% | |

Annual Report
Fidelity Advisor Series Equity-Income Fund
Investments January 31, 2013
Showing Percentage of Net Assets
Common Stocks - 98.5% |
| Shares | | Value |
CONSUMER DISCRETIONARY - 9.5% |
Auto Components - 0.2% |
Gentex Corp. | 83,500 | | $ 1,597,355 |
Diversified Consumer Services - 0.2% |
Strayer Education, Inc. | 22,700 | | 1,291,630 |
Hotels, Restaurants & Leisure - 1.3% |
CEC Entertainment, Inc. | 1,600 | | 52,736 |
McDonald's Corp. | 70,200 | | 6,689,358 |
Texas Roadhouse, Inc. Class A | 44,100 | | 775,719 |
Yum! Brands, Inc. | 23,000 | | 1,493,620 |
| | 9,011,433 |
Media - 4.7% |
Comcast Corp. Class A | 556,100 | | 21,176,288 |
Time Warner, Inc. | 233,200 | | 11,781,264 |
| | 32,957,552 |
Multiline Retail - 2.0% |
Kohl's Corp. | 33,700 | | 1,559,973 |
Target Corp. | 211,700 | | 12,788,797 |
| | 14,348,770 |
Specialty Retail - 1.1% |
Lowe's Companies, Inc. | 145,600 | | 5,560,464 |
Staples, Inc. | 146,527 | | 1,975,184 |
| | 7,535,648 |
TOTAL CONSUMER DISCRETIONARY | | 66,742,388 |
CONSUMER STAPLES - 11.0% |
Beverages - 2.1% |
Molson Coors Brewing Co. Class B | 39,700 | | 1,793,646 |
PepsiCo, Inc. | 106,000 | | 7,722,100 |
The Coca-Cola Co. | 138,600 | | 5,161,464 |
| | 14,677,210 |
Food & Staples Retailing - 2.9% |
Safeway, Inc. | 239,900 | | 4,618,075 |
Sysco Corp. | 103,000 | | 3,272,310 |
Wal-Mart Stores, Inc. | 49,300 | | 3,448,535 |
Walgreen Co. | 228,800 | | 9,142,848 |
| | 20,481,768 |
Food Products - 1.1% |
Kellogg Co. | 124,900 | | 7,306,650 |
Common Stocks - continued |
| Shares | | Value |
CONSUMER STAPLES - continued |
Household Products - 3.5% |
Kimberly-Clark Corp. | 26,500 | | $ 2,372,015 |
Procter & Gamble Co. | 300,232 | | 22,565,437 |
| | 24,937,452 |
Tobacco - 1.4% |
Altria Group, Inc. | 158,200 | | 5,328,176 |
Lorillard, Inc. | 62,700 | | 2,449,689 |
Philip Morris International, Inc. | 26,400 | | 2,327,424 |
| | 10,105,289 |
TOTAL CONSUMER STAPLES | | 77,508,369 |
ENERGY - 14.0% |
Energy Equipment & Services - 1.8% |
Ensco PLC Class A | 40,700 | | 2,587,299 |
Exterran Partners LP | 33,400 | | 784,232 |
Halliburton Co. | 94,100 | | 3,827,988 |
National Oilwell Varco, Inc. | 27,800 | | 2,061,092 |
Noble Corp. | 76,200 | | 3,086,100 |
| | 12,346,711 |
Oil, Gas & Consumable Fuels - 12.2% |
Apache Corp. | 64,200 | | 5,377,392 |
Buckeye Partners LP | 16,700 | | 879,088 |
Chevron Corp. | 285,321 | | 32,854,715 |
EV Energy Partners LP | 41,600 | | 2,446,080 |
Exxon Mobil Corp. | 287,400 | | 25,857,378 |
Hess Corp. | 41,800 | | 2,807,288 |
Holly Energy Partners LP | 20,000 | | 719,000 |
HollyFrontier Corp. | 40,900 | | 2,135,798 |
Inergy Midstream LP | 1,106 | | 26,223 |
Legacy Reserves LP | 36,700 | | 923,005 |
Markwest Energy Partners LP | 39,900 | | 2,203,278 |
Murphy Oil Corp. | 31,300 | | 1,862,976 |
Occidental Petroleum Corp. | 18,100 | | 1,597,687 |
Pioneer Southwest Energy Partners LP | 16,800 | | 426,384 |
The Williams Companies, Inc. | 164,200 | | 5,755,210 |
Western Gas Equity Partners LP | 12,000 | | 405,120 |
| | 86,276,622 |
TOTAL ENERGY | | 98,623,333 |
Common Stocks - continued |
| Shares | | Value |
FINANCIALS - 19.9% |
Capital Markets - 3.4% |
Apollo Investment Corp. | 168,000 | | $ 1,512,000 |
BlackRock, Inc. Class A | 17,900 | | 4,229,412 |
Charles Schwab Corp. | 288,000 | | 4,760,640 |
KKR & Co. LP | 261,900 | | 4,420,872 |
Morgan Stanley | 218,600 | | 4,995,010 |
The Blackstone Group LP | 231,700 | | 4,286,450 |
| | 24,204,384 |
Commercial Banks - 6.1% |
Comerica, Inc. | 50,800 | | 1,745,488 |
Cullen/Frost Bankers, Inc. | 21,400 | | 1,260,246 |
M&T Bank Corp. | 41,100 | | 4,220,559 |
SunTrust Banks, Inc. | 41,100 | | 1,166,007 |
U.S. Bancorp | 206,700 | | 6,841,770 |
Wells Fargo & Co. | 802,600 | | 27,954,558 |
| | 43,188,628 |
Diversified Financial Services - 4.0% |
JPMorgan Chase & Co. | 604,800 | | 28,455,840 |
Insurance - 4.8% |
ACE Ltd. | 75,700 | | 6,459,481 |
AFLAC, Inc. | 61,000 | | 3,236,660 |
Assured Guaranty Ltd. | 83,800 | | 1,519,294 |
Hanover Insurance Group, Inc. | 44,800 | | 1,861,888 |
MetLife, Inc. | 398,200 | | 14,868,788 |
Prudential Financial, Inc. | 37,600 | | 2,176,288 |
Validus Holdings Ltd. | 95,400 | | 3,473,514 |
| | 33,595,913 |
Real Estate Investment Trusts - 1.6% |
American Capital Agency Corp. | 74,000 | | 2,340,620 |
Annaly Capital Management, Inc. | 161,600 | | 2,402,992 |
Home Properties, Inc. | 16,600 | | 1,020,402 |
Lexington Corporate Properties Trust | 39,300 | | 432,300 |
Rayonier, Inc. | 49,800 | | 2,681,232 |
Retail Properties America, Inc. | 95,800 | | 1,239,652 |
Ventas, Inc. | 15,300 | | 1,014,237 |
| | 11,131,435 |
TOTAL FINANCIALS | | 140,576,200 |
Common Stocks - continued |
| Shares | | Value |
HEALTH CARE - 13.7% |
Biotechnology - 0.5% |
Amgen, Inc. | 25,900 | | $ 2,213,414 |
PDL BioPharma, Inc. (d) | 158,200 | | 1,088,416 |
| | 3,301,830 |
Health Care Equipment & Supplies - 1.2% |
Abbott Laboratories | 83,900 | | 2,842,532 |
Baxter International, Inc. | 16,700 | | 1,132,928 |
Covidien PLC | 44,300 | | 2,761,662 |
St. Jude Medical, Inc. | 43,100 | | 1,754,170 |
| | 8,491,292 |
Health Care Providers & Services - 2.4% |
Aetna, Inc. | 74,200 | | 3,578,666 |
Cardinal Health, Inc. | 38,800 | | 1,699,828 |
McKesson Corp. | 19,200 | | 2,020,416 |
UnitedHealth Group, Inc. | 24,600 | | 1,358,166 |
WellPoint, Inc. | 127,892 | | 8,289,959 |
| | 16,947,035 |
Health Care Technology - 0.1% |
Quality Systems, Inc. | 36,760 | | 670,502 |
Pharmaceuticals - 9.5% |
AbbVie, Inc. | 118,500 | | 4,347,765 |
Eli Lilly & Co. | 120,300 | | 6,458,907 |
Johnson & Johnson | 229,500 | | 16,964,640 |
Merck & Co., Inc. | 351,200 | | 15,189,400 |
Pfizer, Inc. | 664,100 | | 18,116,648 |
Teva Pharmaceutical Industries Ltd. sponsored ADR | 90,900 | | 3,453,291 |
Warner Chilcott PLC | 174,528 | | 2,473,062 |
Zoetis, Inc. Class A | 6,400 | | 166,400 |
| | 67,170,113 |
TOTAL HEALTH CARE | | 96,580,772 |
INDUSTRIALS - 10.6% |
Aerospace & Defense - 1.9% |
Raytheon Co. | 75,500 | | 3,977,340 |
Rockwell Collins, Inc. | 24,000 | | 1,413,120 |
United Technologies Corp. | 88,300 | | 7,732,431 |
| | 13,122,891 |
Common Stocks - continued |
| Shares | | Value |
INDUSTRIALS - continued |
Air Freight & Logistics - 2.1% |
C.H. Robinson Worldwide, Inc. | 77,600 | | $ 5,133,240 |
United Parcel Service, Inc. Class B | 123,000 | | 9,752,670 |
| | 14,885,910 |
Commercial Services & Supplies - 1.3% |
Pitney Bowes, Inc. | 75,100 | | 1,082,191 |
Republic Services, Inc. | 266,500 | | 8,498,685 |
| | 9,580,876 |
Electrical Equipment - 0.6% |
Eaton Corp. PLC | 20,300 | | 1,156,085 |
Emerson Electric Co. | 19,900 | | 1,139,275 |
Hubbell, Inc. Class B | 6,200 | | 564,510 |
Rockwell Automation, Inc. | 13,000 | | 1,159,470 |
| | 4,019,340 |
Industrial Conglomerates - 2.4% |
General Electric Co. | 773,200 | | 17,226,896 |
Machinery - 1.6% |
Briggs & Stratton Corp. | 126,400 | | 2,999,472 |
Cummins, Inc. | 18,100 | | 2,078,423 |
Illinois Tool Works, Inc. | 25,900 | | 1,627,297 |
Stanley Black & Decker, Inc. | 56,300 | | 4,325,529 |
| | 11,030,721 |
Road & Rail - 0.4% |
Union Pacific Corp. | 20,300 | | 2,668,638 |
Trading Companies & Distributors - 0.3% |
Watsco, Inc. | 30,900 | | 2,328,315 |
TOTAL INDUSTRIALS | | 74,863,587 |
INFORMATION TECHNOLOGY - 9.5% |
Communications Equipment - 1.9% |
Cisco Systems, Inc. | 658,700 | | 13,549,459 |
Computers & Peripherals - 0.5% |
Apple, Inc. | 3,200 | | 1,456,992 |
Dell, Inc. | 112,900 | | 1,494,796 |
Lexmark International, Inc. Class A | 20,900 | | 502,854 |
| | 3,454,642 |
IT Services - 5.0% |
Accenture PLC Class A | 69,400 | | 4,989,166 |
Cognizant Technology Solutions Corp. Class A (a) | 48,200 | | 3,768,276 |
Common Stocks - continued |
| Shares | | Value |
INFORMATION TECHNOLOGY - continued |
IT Services - continued |
Fidelity National Information Services, Inc. | 8,700 | | $ 322,857 |
IBM Corp. | 44,000 | | 8,935,080 |
Paychex, Inc. | 489,600 | | 15,975,648 |
The Western Union Co. | 50,000 | | 711,500 |
Visa, Inc. Class A | 6,400 | | 1,010,624 |
| | 35,713,151 |
Semiconductors & Semiconductor Equipment - 1.1% |
Applied Materials, Inc. | 423,100 | | 5,462,221 |
KLA-Tencor Corp. | 37,795 | | 2,075,323 |
| | 7,537,544 |
Software - 1.0% |
CA Technologies, Inc. | 61,800 | | 1,533,876 |
Microsoft Corp. | 198,000 | | 5,439,060 |
| | 6,972,936 |
TOTAL INFORMATION TECHNOLOGY | | 67,227,732 |
MATERIALS - 0.8% |
Chemicals - 0.3% |
Eastman Chemical Co. | 30,785 | | 2,190,353 |
Metals & Mining - 0.5% |
Commercial Metals Co. | 126,125 | | 2,099,981 |
Nucor Corp. | 30,400 | | 1,398,704 |
| | 3,498,685 |
TOTAL MATERIALS | | 5,689,038 |
TELECOMMUNICATION SERVICES - 4.0% |
Diversified Telecommunication Services - 4.0% |
AT&T, Inc. | 230,500 | | 8,019,095 |
CenturyLink, Inc. | 47,800 | | 1,933,510 |
Verizon Communications, Inc. | 425,400 | | 18,551,694 |
| | 28,504,299 |
UTILITIES - 5.5% |
Electric Utilities - 4.4% |
Duke Energy Corp. | 103,700 | | 7,128,338 |
Edison International | 19,100 | | 920,429 |
FirstEnergy Corp. | 96,300 | | 3,899,187 |
NextEra Energy, Inc. | 66,300 | | 4,776,915 |
Common Stocks - continued |
| Shares | | Value |
UTILITIES - continued |
Electric Utilities - continued |
Northeast Utilities | 48,700 | | $ 1,983,551 |
PPL Corp. | 299,200 | | 9,062,768 |
Southern Co. | 78,200 | | 3,458,786 |
| | 31,229,974 |
Multi-Utilities - 1.1% |
CMS Energy Corp. | 13,300 | | 341,810 |
PG&E Corp. | 70,300 | | 2,997,592 |
Sempra Energy | 61,600 | | 4,623,080 |
| | 7,962,482 |
TOTAL UTILITIES | | 39,192,456 |
TOTAL COMMON STOCKS (Cost $658,178,900) |
695,508,174
|
Money Market Funds - 1.1% |
| | | |
Fidelity Cash Central Fund, 0.16% (b) | 7,343,309 | | 7,343,309 |
Fidelity Securities Lending Cash Central Fund, 0.15% (b)(c) | 128,100 | | 128,100 |
TOTAL MONEY MARKET FUNDS (Cost $7,471,409) |
7,471,409
|
TOTAL INVESTMENT PORTFOLIO - 99.6% (Cost $665,650,309) | | 702,979,583 |
NET OTHER ASSETS (LIABILITIES) - 0.4% | | 3,032,661 |
NET ASSETS - 100% | $ 706,012,244 |
Legend |
(a) Non-income producing |
(b) Affiliated fund that is available only to investment companies and other accounts managed by Fidelity Investments. The rate quoted is the annualized seven-day yield of the fund at period end. A complete unaudited listing of the fund's holdings as of its most recent quarter end is available upon request. In addition, each Fidelity Central Fund's financial statements, which are not covered by the Fund's Report of Independent Registered Public Accounting Firm, are available on the SEC's website or upon request. |
(c) Investment made with cash collateral received from securities on loan. |
(d) Security or a portion of the security is on loan at period end. |
Affiliated Central Funds |
Information regarding fiscal year to date income earned by the Fund from investments in Fidelity Central Funds is as follows: |
Fund | Income earned |
Fidelity Cash Central Fund | $ 3,317 |
Fidelity Securities Lending Cash Central Fund | 12 |
Total | $ 3,329 |
Other Information |
All investments are categorized as Level 1 under the Fair Value Hierarchy. The inputs or methodology used for valuing securities may not be an indication of the risk associated with investing in those securities. For more information on valuation inputs, please refer to the Investment Valuation section in the accompanying Notes to Financial Statements. |
See accompanying notes which are an integral part of the financial statements.
Annual Report
Fidelity Advisor Series Equity-Income Fund
Statement of Assets and Liabilities
| January 31, 2013 |
| | |
Assets | | |
Investment in securities, at value (including securities loaned of $125,904) - See accompanying schedule: Unaffiliated issuers (cost $658,178,900) | $ 695,508,174 | |
Fidelity Central Funds (cost $7,471,409) | 7,471,409 | |
Total Investments (cost $665,650,309) | | $ 702,979,583 |
Cash | | 2,506 |
Foreign currency held at value (cost $2,739) | | 2,809 |
Receivable for investments sold | | 5,456,231 |
Dividends receivable | | 1,122,401 |
Distributions receivable from Fidelity Central Funds | | 1,248 |
Other receivables | | 63,410 |
Total assets | | 709,628,188 |
| | |
Liabilities | | |
Payable for investments purchased | $ 3,030,754 | |
Accrued management fee | 264,077 | |
Other affiliated payables | 124,436 | |
Other payables and accrued expenses | 68,577 | |
Collateral on securities loaned, at value | 128,100 | |
Total liabilities | | 3,615,944 |
| | |
Net Assets | | $ 706,012,244 |
Net Assets consist of: | | |
Paid in capital | | $ 666,034,717 |
Undistributed net investment income | | 899,123 |
Accumulated undistributed net realized gain (loss) on investments and foreign currency transactions | | 1,749,060 |
Net unrealized appreciation (depreciation) on investments and assets and liabilities in foreign currencies | | 37,329,344 |
Net Assets, for 66,624,096 shares outstanding | | $ 706,012,244 |
Net Asset Value, offering price and redemption price per share ($706,012,244 ÷ 66,624,096 shares) | | $ 10.60 |
See accompanying notes which are an integral part of the financial statements.
Annual Report
Statement of Operations
| For the period December 6, 2012
(commencement of operations) to
January 31, 2013 |
| | |
Investment Income | | |
Dividends | | $ 2,762,366 |
Income from Fidelity Central Funds | | 3,329 |
Total income | | 2,765,695 |
| | |
Expenses | | |
Management fee | $ 457,319 | |
Transfer agent fees | 187,778 | |
Accounting and security lending fees | 36,373 | |
Custodian fees and expenses | 27,878 | |
Independent trustees' compensation | 322 | |
Audit | 41,225 | |
Miscellaneous | 1 | |
Total expenses before reductions | 750,896 | |
Expense reductions | (63,410) | 687,486 |
Net investment income (loss) | | 2,078,209 |
Realized and Unrealized Gain (Loss) Net realized gain (loss) on: | | |
Investment securities: | | |
Unaffiliated issuers | 1,710,946 | |
Foreign currency transactions | 6,806 | |
Total net realized gain (loss) | | 1,717,752 |
Change in net unrealized appreciation (depreciation) on: Investment securities | 37,329,274 | |
Assets and liabilities in foreign currencies | 70 | |
Total change in net unrealized appreciation (depreciation) | | 37,329,344 |
Net gain (loss) | | 39,047,096 |
Net increase (decrease) in net assets resulting from operations | | $ 41,125,305 |
See accompanying notes which are an integral part of the financial statements.
Annual Report
Fidelity Advisor Series Equity-Income Fund
Financial Statements - continued
Statement of Changes in Net Assets
| For the period
December 6, 2012
(commencement of operations) to
January 31, 2013 |
Increase (Decrease) in Net Assets | |
Operations | |
Net investment income (loss) | $ 2,078,209 |
Net realized gain (loss) | 1,717,752 |
Change in net unrealized appreciation (depreciation) | 37,329,344 |
Net increase (decrease) in net assets resulting
from operations | 41,125,305 |
Distributions to shareholders from net investment income | (1,147,778) |
Share transactions
Proceeds from sales of shares | 675,225,856 |
Reinvestment of distributions | 1,147,778 |
Cost of shares redeemed | (10,338,917) |
Net increase (decrease) in net assets resulting from share transactions | 666,034,717 |
Total increase (decrease) in net assets | 706,012,244 |
| |
Net Assets | |
Beginning of period | - |
End of period (including undistributed net investment income of $899,123) | $ 706,012,244 |
Other Information Shares | |
Sold | 67,522,485 |
Issued in reinvestment of distributions | 114,207 |
Redeemed | (1,012,596) |
Net increase (decrease) | 66,624,096 |
See accompanying notes which are an integral part of the financial statements.
Annual Report
Financial Highlights
| Period ended
January 31,
2013 G |
Selected Per-Share Data | |
Net asset value, beginning of period | $ 10.00 |
Income from Investment Operations | |
Net investment income (loss) D | .03 |
Net realized and unrealized gain (loss) | .59 |
Total from investment operations | .62 |
Distributions from net investment income | (.02) |
Net asset value, end of period | $ 10.60 |
Total Return B,C | 6.18% |
Ratios to Average Net Assets E,H | |
Expenses before reductions | .75% A |
Expenses net of fee waivers, if any | .75% A |
Expenses net of all reductions | .68% A |
Net investment income (loss) | 2.07% A |
Supplemental Data | |
Net assets, end of period (000 omitted) | $ 706,012 |
Portfolio turnover rate F | 34% I |
A Annualized
B Total returns for periods of less than one year are not annualized.
C Total returns would have been lower if certain expenses had not been reduced during the applicable periods shown.
D Calculated based on average shares outstanding during the period.
E Fees and expenses of any underlying Fidelity Central Funds are not included in the Fund's expense ratio. The Fund indirectly bears its proportionate share of the expenses of any underlying Fidelity Central Funds.
F Amount does not include the portfolio activity of any underlying Fidelity Central Funds.
G For the period December 6, 2012 (commencement of operations) to January 31, 2013.
H Expense ratios reflect operating expenses of the Fund. Expenses before reductions do not reflect amounts reimbursed by the investment adviser or reductions from brokerage service arrangements or reductions from other expense offset arrangements and do not represent the amount paid by the Fund during periods when reimbursements or reductions occur. Expense ratios before reductions for start-up periods may not be representative of longer term operating periods. Expenses net of fee waivers reflect expenses after reimbursement by the investment adviser but prior to reductions from brokerage service arrangements or other expense offset arrangements. Expenses net of all reductions represent the net expenses paid by the Fund.
I Amount not annualized.
See accompanying notes which are an integral part of the financial statements.
Annual Report
Fidelity Advisor Series Stock Selector Large Cap Value Fund
Top Ten Stocks as of January 31, 2013 |
| % of fund's
net assets |
Exxon Mobil Corp. | 7.0 |
Berkshire Hathaway, Inc. Class B | 3.4 |
General Electric Co. | 3.3 |
Wells Fargo & Co. | 3.2 |
Occidental Petroleum Corp. | 3.0 |
Merck & Co., Inc. | 2.5 |
Johnson & Johnson | 2.3 |
Pfizer, Inc. | 2.0 |
U.S. Bancorp | 1.9 |
AT&T, Inc. | 1.8 |
| 30.4 |
Top Five Market Sectors as of January 31, 2013 |
| % of fund's
net assets |
Financials | 26.4 |
Energy | 16.2 |
Health Care | 11.3 |
Industrials | 8.9 |
Consumer Discretionary | 8.4 |
Asset Allocation (% of fund's net assets) |
As of January 31, 2013* |
| Stocks 98.2% | |
| Short-Term
Investments and
Net Other Assets
(Liabilities) 1.8% | |
* Foreign investments | 5.7% | |

Annual Report
Fidelity Advisor Series Stock Selector Large Cap Value Fund
Investments January 31, 2013
Showing Percentage of Net Assets
Common Stocks - 98.2% |
| Shares | | Value |
CONSUMER DISCRETIONARY - 8.4% |
Auto Components - 0.7% |
Delphi Automotive PLC (a) | 118,500 | | $ 4,581,210 |
Household Durables - 1.3% |
Jarden Corp. | 66,400 | | 3,906,976 |
Whirlpool Corp. | 45,900 | | 5,295,942 |
| | 9,202,918 |
Internet & Catalog Retail - 0.7% |
Liberty Media Corp.: | | | |
Interactive Series A (a) | 151,300 | | 3,216,638 |
Series A (a) | 26,126 | | 1,949,783 |
| | 5,166,421 |
Media - 2.4% |
Comcast Corp. Class A | 214,600 | | 8,171,968 |
News Corp. Class A | 282,200 | | 7,828,228 |
Omnicom Group, Inc. | 24,256 | | 1,316,616 |
| | 17,316,812 |
Multiline Retail - 1.7% |
Macy's, Inc. | 118,800 | | 4,693,788 |
Target Corp. | 126,700 | | 7,653,947 |
| | 12,347,735 |
Specialty Retail - 1.6% |
Lowe's Companies, Inc. | 171,800 | | 6,561,042 |
Staples, Inc. | 359,600 | | 4,847,408 |
| | 11,408,450 |
TOTAL CONSUMER DISCRETIONARY | | 60,023,546 |
CONSUMER STAPLES - 7.3% |
Beverages - 1.1% |
Dr. Pepper Snapple Group, Inc. | 54,600 | | 2,460,822 |
Molson Coors Brewing Co. Class B | 115,900 | | 5,236,362 |
| | 7,697,184 |
Food & Staples Retailing - 1.0% |
Walgreen Co. | 179,200 | | 7,160,832 |
Food Products - 3.2% |
Archer Daniels Midland Co. | 203,500 | | 5,805,855 |
ConAgra Foods, Inc. | 115,800 | | 3,785,502 |
Common Stocks - continued |
| Shares | | Value |
CONSUMER STAPLES - continued |
Food Products - continued |
Mondelez International, Inc. | 303,100 | | $ 8,423,149 |
The J.M. Smucker Co. | 51,200 | | 4,537,856 |
| | 22,552,362 |
Household Products - 1.7% |
Procter & Gamble Co. | 160,700 | | 12,078,212 |
Tobacco - 0.3% |
Lorillard, Inc. | 64,595 | | 2,523,727 |
TOTAL CONSUMER STAPLES | | 52,012,317 |
ENERGY - 16.2% |
Energy Equipment & Services - 2.1% |
Cameron International Corp. (a) | 106,200 | | 6,723,522 |
National Oilwell Varco, Inc. | 108,776 | | 8,064,653 |
| | 14,788,175 |
Oil, Gas & Consumable Fuels - 14.1% |
Anadarko Petroleum Corp. | 139,900 | | 11,194,798 |
Energen Corp. | 107,800 | | 5,189,492 |
Exxon Mobil Corp. | 557,800 | | 50,185,265 |
Occidental Petroleum Corp. | 241,100 | | 21,281,897 |
Phillips 66 | 152,700 | | 9,249,039 |
The Williams Companies, Inc. | 109,259 | | 3,829,528 |
| | 100,930,019 |
TOTAL ENERGY | | 115,718,194 |
FINANCIALS - 26.4% |
Capital Markets - 3.1% |
BlackRock, Inc. Class A | 46,700 | | 11,034,276 |
State Street Corp. | 201,300 | | 11,202,345 |
| | 22,236,621 |
Commercial Banks - 8.2% |
CIT Group, Inc. (a) | 188,000 | | 7,961,800 |
PNC Financial Services Group, Inc. | 162,900 | | 10,067,220 |
Popular, Inc. (a) | 170,200 | | 4,568,168 |
U.S. Bancorp | 397,900 | | 13,170,490 |
Wells Fargo & Co. | 655,000 | | 22,813,650 |
| | 58,581,328 |
Common Stocks - continued |
| Shares | | Value |
FINANCIALS - continued |
Consumer Finance - 1.5% |
Capital One Financial Corp. | 190,700 | | $ 10,740,224 |
Diversified Financial Services - 0.9% |
The NASDAQ Stock Market, Inc. | 229,200 | | 6,490,944 |
Insurance - 10.1% |
ACE Ltd. | 112,300 | | 9,582,559 |
AFLAC, Inc. | 135,000 | | 7,163,100 |
Axis Capital Holdings Ltd. | 178,570 | | 6,833,874 |
Berkshire Hathaway, Inc. Class B (a) | 249,200 | | 24,154,956 |
MetLife, Inc. | 219,900 | | 8,211,066 |
Reinsurance Group of America, Inc. | 104,600 | | 6,002,994 |
The Travelers Companies, Inc. | 123,900 | | 9,721,194 |
| | 71,669,743 |
Real Estate Investment Trusts - 1.7% |
Boston Properties, Inc. | 68,600 | | 7,222,208 |
Simon Property Group, Inc. | 30,500 | | 4,885,490 |
| | 12,107,698 |
Real Estate Management & Development - 0.9% |
CBRE Group, Inc. (a) | 286,500 | | 6,182,670 |
TOTAL FINANCIALS | | 188,009,228 |
HEALTH CARE - 11.3% |
Biotechnology - 0.0% |
Prothena Corp. PLC (a) | 9 | | 54 |
Health Care Equipment & Supplies - 0.7% |
Alere, Inc. (a) | 9,100 | | 193,466 |
Baxter International, Inc. | 23,700 | | 1,607,808 |
Covidien PLC | 26,300 | | 1,639,542 |
St. Jude Medical, Inc. | 26,300 | | 1,070,410 |
Teleflex, Inc. | 8,238 | | 617,850 |
| | 5,129,076 |
Health Care Providers & Services - 2.4% |
Cardinal Health, Inc. | 29,800 | | 1,305,538 |
Quest Diagnostics, Inc. | 28,100 | | 1,628,395 |
UnitedHealth Group, Inc. | 162,300 | | 8,960,583 |
WellPoint, Inc. | 82,100 | | 5,321,722 |
| | 17,216,238 |
Health Care Technology - 0.2% |
Allscripts Healthcare Solutions, Inc. (a) | 90,500 | | 1,002,740 |
Common Stocks - continued |
| Shares | | Value |
HEALTH CARE - continued |
Life Sciences Tools & Services - 0.7% |
QIAGEN NV (a) | 42,590 | | $ 894,390 |
Thermo Fisher Scientific, Inc. | 56,700 | | 4,090,338 |
| | 4,984,728 |
Pharmaceuticals - 7.3% |
Eli Lilly & Co. | 31,100 | | 1,669,759 |
Endo Pharmaceuticals Holdings, Inc. (a) | 35,000 | | 1,108,100 |
Jazz Pharmaceuticals PLC (a) | 14,400 | | 812,016 |
Johnson & Johnson | 221,900 | | 16,402,848 |
Merck & Co., Inc. | 403,300 | | 17,442,725 |
Pfizer, Inc. | 534,300 | | 14,575,704 |
Zoetis, Inc. Class A | 6,100 | | 158,600 |
| | 52,169,752 |
TOTAL HEALTH CARE | | 80,502,588 |
INDUSTRIALS - 8.9% |
Aerospace & Defense - 0.9% |
General Dynamics Corp. | 97,690 | | 6,476,847 |
Air Freight & Logistics - 0.9% |
FedEx Corp. | 63,360 | | 6,427,872 |
Commercial Services & Supplies - 1.5% |
Corrections Corp. of America | 85,400 | | 3,235,806 |
Republic Services, Inc. | 110,337 | | 3,518,647 |
Waste Management, Inc. | 113,745 | | 4,138,043 |
| | 10,892,496 |
Construction & Engineering - 1.0% |
AECOM Technology Corp. (a) | 82,100 | | 2,099,297 |
URS Corp. | 115,347 | | 4,784,594 |
| | 6,883,891 |
Industrial Conglomerates - 3.3% |
General Electric Co. | 1,053,081 | | 23,462,645 |
Professional Services - 0.6% |
Towers Watson & Co. | 66,536 | | 4,064,019 |
Road & Rail - 0.7% |
Con-way, Inc. | 69,034 | | 2,166,287 |
CSX Corp. | 132,272 | | 2,913,952 |
| | 5,080,239 |
TOTAL INDUSTRIALS | | 63,288,009 |
Common Stocks - continued |
| Shares | | Value |
INFORMATION TECHNOLOGY - 6.3% |
Communications Equipment - 1.5% |
Cisco Systems, Inc. | 512,500 | | $ 10,542,125 |
Computers & Peripherals - 0.8% |
Hewlett-Packard Co. | 328,200 | | 5,418,582 |
Electronic Equipment & Components - 1.3% |
Corning, Inc. | 231,800 | | 2,781,600 |
Jabil Circuit, Inc. | 182,900 | | 3,458,639 |
Tech Data Corp. (a) | 64,200 | | 3,268,422 |
| | 9,508,661 |
IT Services - 0.5% |
Amdocs Ltd. | 37,700 | | 1,345,513 |
Global Payments, Inc. | 46,000 | | 2,265,960 |
| | 3,611,473 |
Semiconductors & Semiconductor Equipment - 1.7% |
Avago Technologies Ltd. | 53,200 | | 1,902,964 |
Broadcom Corp. Class A | 110,600 | | 3,588,970 |
Freescale Semiconductor Holdings I Ltd. (a) | 173,800 | | 2,511,410 |
Intersil Corp. Class A | 275,200 | | 2,380,480 |
ON Semiconductor Corp. (a) | 242,800 | | 1,905,980 |
| | 12,289,804 |
Software - 0.5% |
Symantec Corp. (a) | 151,292 | | 3,293,627 |
TOTAL INFORMATION TECHNOLOGY | | 44,664,272 |
MATERIALS - 3.5% |
Chemicals - 2.8% |
Air Products & Chemicals, Inc. | 67,100 | | 5,866,553 |
Ashland, Inc. | 43,000 | | 3,375,930 |
Eastman Chemical Co. | 61,100 | | 4,347,265 |
LyondellBasell Industries NV Class A | 98,600 | | 6,253,212 |
| | 19,842,960 |
Containers & Packaging - 0.7% |
Rock-Tenn Co. Class A | 66,500 | | 5,250,175 |
TOTAL MATERIALS | | 25,093,135 |
TELECOMMUNICATION SERVICES - 3.4% |
Diversified Telecommunication Services - 3.0% |
AT&T, Inc. | 369,400 | | 12,851,426 |
Common Stocks - continued |
| Shares | | Value |
TELECOMMUNICATION SERVICES - continued |
Diversified Telecommunication Services - continued |
CenturyLink, Inc. | 172,100 | | $ 6,961,445 |
Frontier Communications Corp. (d) | 294,200 | | 1,344,494 |
| | 21,157,365 |
Wireless Telecommunication Services - 0.4% |
NII Holdings, Inc. (a)(d) | 468,357 | | 3,278,499 |
TOTAL TELECOMMUNICATION SERVICES | | 24,435,864 |
UTILITIES - 6.5% |
Electric Utilities - 3.6% |
Edison International | 128,500 | | 6,192,415 |
ITC Holdings Corp. | 56,900 | | 4,608,900 |
NextEra Energy, Inc. | 62,800 | | 4,524,740 |
Northeast Utilities | 159,000 | | 6,476,070 |
OGE Energy Corp. | 62,100 | | 3,645,891 |
| | 25,448,016 |
Gas Utilities - 0.4% |
ONEOK, Inc. | 37,896 | | 1,781,491 |
Questar Corp. | 40,900 | | 950,107 |
| | 2,731,598 |
Independent Power Producers & Energy Traders - 0.5% |
Calpine Corp. (a) | 60,900 | | 1,201,557 |
The AES Corp. | 244,700 | | 2,652,548 |
| | 3,854,105 |
Multi-Utilities - 2.0% |
CMS Energy Corp. | 162,300 | | 4,171,110 |
NiSource, Inc. | 130,100 | | 3,516,603 |
Sempra Energy | 83,800 | | 6,289,190 |
| | 13,976,903 |
TOTAL UTILITIES | | 46,010,622 |
TOTAL COMMON STOCKS (Cost $655,923,026) |
699,757,775
|
Money Market Funds - 2.0% |
| Shares | | Value |
Fidelity Cash Central Fund, 0.16% (b) | 12,422,328 | | $ 12,422,328 |
Fidelity Securities Lending Cash Central Fund, 0.15% (b)(c) | 1,655,325 | | 1,655,325 |
TOTAL MONEY MARKET FUNDS (Cost $14,077,653) |
14,077,653
|
TOTAL INVESTMENT PORTFOLIO - 100.2% (Cost $670,000,679) | | 713,835,428 |
NET OTHER ASSETS (LIABILITIES) - (0.2)% | | (1,274,824) |
NET ASSETS - 100% | $ 712,560,604 |
Legend |
(a) Non-income producing |
(b) Affiliated fund that is available only to investment companies and other accounts managed by Fidelity Investments. The rate quoted is the annualized seven-day yield of the fund at period end. A complete unaudited listing of the fund's holdings as of its most recent quarter end is available upon request. In addition, each Fidelity Central Fund's financial statements, which are not covered by the Fund's Report of Independent Registered Public Accounting Firm, are available on the SEC's website or upon request. |
(c) Investment made with cash collateral received from securities on loan. |
(d) Security or a portion of the security is on loan at period end. |
Affiliated Central Funds |
Information regarding fiscal year to date income earned by the Fund from investments in Fidelity Central Funds is as follows: |
Fund | Income earned |
Fidelity Cash Central Fund | $ 4,092 |
Fidelity Securities Lending Cash Central Fund | 1,999 |
Total | $ 6,091 |
Other Information |
All investments are categorized as Level 1 under the Fair Value Hierarchy. The inputs or methodology used for valuing securities may not be an indication of the risk associated with investing in those securities. For more information on valuation inputs, please refer to the Investment Valuation section in the accompanying Notes to Financial Statements. |
See accompanying notes which are an integral part of the financial statements.
Annual Report
Fidelity Advisor Series Stock Selector Large Cap Value Fund
Statement of Assets and Liabilities
| January 31, 2013 |
| | |
Assets | | |
Investment in securities, at value (including securities loaned of $1,593,480) - See accompanying schedule: Unaffiliated issuers (cost $655,923,026) | $ 699,757,775 | |
Fidelity Central Funds (cost $14,077,653) | 14,077,653 | |
Total Investments (cost $670,000,679) | | $ 713,835,428 |
Cash | | 97,917 |
Receivable for investments sold | | 14,079,963 |
Dividends receivable | | 817,431 |
Distributions receivable from Fidelity Central Funds | | 3,656 |
Other receivables | | 82,235 |
Total assets | | 728,916,630 |
| | |
Liabilities | | |
Payable for investments purchased | $ 14,179,999 | |
Accrued management fee | 324,402 | |
Other affiliated payables | 125,349 | |
Other payables and accrued expenses | 70,951 | |
Collateral on securities loaned, at value | 1,655,325 | |
Total liabilities | | 16,356,026 |
| | |
Net Assets | | $ 712,560,604 |
Net Assets consist of: | | |
Paid in capital | | $ 664,583,032 |
Undistributed net investment income | | 266,102 |
Accumulated undistributed net realized gain (loss) on investments and foreign currency transactions | | 3,876,721 |
Net unrealized appreciation (depreciation) on investments | | 43,834,749 |
Net Assets, for 66,488,581 shares outstanding | | $ 712,560,604 |
Net Asset Value, offering price and redemption price per share ($712,560,604 ÷ 66,488,581 shares) | | $ 10.72 |
See accompanying notes which are an integral part of the financial statements.
Annual Report
Fidelity Advisor Series Stock Selector Large Cap Value Fund
Financial Statements - continued
Statement of Operations
| For the period December 6, 2012
(commencement of operations) to
January 31, 2013 |
| | |
Investment Income | | |
Dividends | | $ 2,035,935 |
Income from Fidelity Central Funds | | 6,091 |
Total income | | 2,042,026 |
| | |
Expenses | | |
Management fee | $ 560,053 | |
Transfer agent fees | 188,684 | |
Accounting and security lending fees | 36,493 | |
Custodian fees and expenses | 39,007 | |
Independent trustees' compensation | 322 | |
Audit | 32,495 | |
Miscellaneous | 1 | |
Total expenses before reductions | 857,055 | |
Expense reductions | (82,235) | 774,820 |
Net investment income (loss) | | 1,267,206 |
Realized and Unrealized Gain (Loss) Net realized gain (loss) on: | | |
Investment securities: | | |
Unaffiliated issuers | 3,876,750 | |
Foreign currency transactions | 10,693 | |
Total net realized gain (loss) | | 3,887,443 |
Change in net unrealized appreciation (depreciation) on investment securities | | 43,834,749 |
Net gain (loss) | | 47,722,192 |
Net increase (decrease) in net assets resulting from operations | | $ 48,989,398 |
See accompanying notes which are an integral part of the financial statements.
Annual Report
Statement of Changes in Net Assets
| For the period
December 6, 2012
(commencement of operations) to
January 31, 2013 |
Increase (Decrease) in Net Assets | |
Operations | |
Net investment income (loss) | $ 1,267,206 |
Net realized gain (loss) | 3,887,443 |
Change in net unrealized appreciation (depreciation) | 43,834,749 |
Net increase (decrease) in net assets resulting
from operations | 48,989,398 |
Distributions to shareholders from net investment income | (1,011,826) |
Share transactions
Proceeds from sales of shares | 674,612,777 |
Reinvestment of distributions | 1,011,826 |
Cost of shares redeemed | (11,041,571) |
Net increase (decrease) in net assets resulting from share transactions | 664,583,032 |
Total increase (decrease) in net assets | 712,560,604 |
| |
Net Assets | |
Beginning of period | - |
End of period (including undistributed net investment income of $266,102) | $ 712,560,604 |
Other Information Shares | |
Sold | 67,461,144 |
Issued in reinvestment of distributions | 100,579 |
Redeemed | (1,073,142) |
Net increase (decrease) | 66,488,581 |
See accompanying notes which are an integral part of the financial statements.
Annual Report
Financial Highlights
| Period ended
January 31,
2013 G |
Selected Per-Share Data | |
Net asset value, beginning of period | $ 10.00 |
Income from Investment Operations | |
Net investment income (loss) D | .02 |
Net realized and unrealized gain (loss) | .72 |
Total from investment operations | .74 |
Distributions from net investment income | (.02) |
Net asset value, end of period | $ 10.72 |
Total Return B,C | 7.36% |
Ratios to Average Net Assets E,H | |
Expenses before reductions | .85% A |
Expenses net of fee waivers, if any | .85% A |
Expenses net of all reductions | .77% A |
Net investment income (loss) | 1.25% A |
Supplemental Data | |
Net assets, end of period (000 omitted) | $ 712,561 |
Portfolio turnover rate F | 48% I |
A Annualized
B Total returns for periods of less than one year are not annualized.
C Total returns would have been lower if certain expenses had not been reduced during the applicable periods shown.
D Calculated based on average shares outstanding during the period.
E Fees and expenses of any underlying Fidelity Central Funds are not included in the Fund's expense ratio. The Fund indirectly bears its proportionate share of the expenses of any underlying Fidelity Central Funds.
F Amount does not include the portfolio activity of any underlying Fidelity Central Funds.
G For the period December 6, 2012 (commencement of operations) to January 31, 2013.
H Expense ratios reflect operating expenses of the Fund. Expenses before reductions do not reflect amounts reimbursed by the investment adviser or reductions from brokerage service arrangements or reductions from other expense offset arrangements and do not represent the amount paid by the Fund during periods when reimbursements or reductions occur. Expense ratios before reductions for start-up periods may not be representative of longer term operating periods. Expenses net of fee waivers reflect expenses after reimbursement by the investment adviser but prior to reductions from brokerage service arrangements or other expense offset arrangements. Expenses net of all reductions represent the net expenses paid by the Fund.
I Amount not annualized.
See accompanying notes which are an integral part of the financial statements.
Annual Report
Notes to Financial Statements
For the period ended January 31, 2013
1. Organization.
Fidelity Advisor Series Equity-Income Fund and Fidelity Advisor Series Stock Selector Large Cap Value Fund (the Funds) are funds of Fidelity Devonshire Trust (the Trust). The Trust is registered under the Investment Company Act of 1940, as amended (the 1940 Act), as an open-end management investment company organized as a Massachusetts business trust. Each Fund is authorized to issue an unlimited number of shares. Shares of the Funds are only available for purchase by mutual funds for which Fidelity Management & Research Company (FMR) or an affiliate serves as an investment manager.
2. Investments in Fidelity Central Funds.
The Funds invest in Fidelity Central Funds, which are open-end investment companies available only to other investment companies and accounts managed by FMR and its affiliates. The Funds' Schedules of Investments list each of the Fidelity Central Funds held as of period end, if any, as an investment of each Fund, but do not include the underlying holdings of each Fidelity Central Fund. As an Investing Fund, each Fund indirectly bears its proportionate share of the expenses of the underlying Fidelity Central Funds.
The Money Market Central Funds seek preservation of capital and current income and are managed by Fidelity Investments Money Management, Inc. (FIMM), an affiliate of FMR.
A complete unaudited list of holdings for each Fidelity Central Fund is available upon request or at the Securities and Exchange Commission (the SEC) website at www.sec.gov. In addition, the financial statements of the Fidelity Central Funds, which are not covered by the Funds' Report of Independent Registered Public Accounting Firm, are available on the SEC website or upon request.
3. Significant Accounting Policies.
The financial statements have been prepared in conformity with accounting principles generally accepted in the United States of America (GAAP), which require management to make certain estimates and assumptions at the date of the financial statements. Actual results could differ from those estimates. Subsequent events, if any, through the date that the financial statements were issued have been evaluated in the preparation of the financial statements. The following summarizes the significant accounting policies of the Funds:
Investment Valuation. Investments are valued as of 4:00 p.m. Eastern time on the last calendar day of the period. In accordance with valuation policies and procedures approved by the Board of Trustees (the Board), each Fund attempts to obtain prices from
Annual Report
3. Significant Accounting Policies - continued
Investment Valuation - continued
one or more third party pricing vendors or brokers to value its investments. When current market prices, quotations or currency exchange rates are not readily available or reliable, investments will be fair valued in good faith by the FMR Fair Value Committee (the Committee), in accordance with procedures adopted by each Fund's Board. Factors used in determining fair value vary by investment type and may include market or investment specific events. The frequency with which these procedures are used cannot be predicted and they may be utilized to a significant extent. The Committee oversees each Fund's valuation policies and procedures and is responsible for approving and reporting to the Board all fair value determinations.
Each Fund categorizes the inputs to valuation techniques used to value their investments into a disclosure hierarchy consisting of three levels as shown below:
Level 1 - quoted prices in active markets for identical investments
Level 2 - other significant observable inputs (including quoted prices for similar investments, interest rates, prepayment speeds, etc.)
Level 3 - unobservable inputs (including the Fund's own assumptions based on the best information available)
Valuation techniques used to value each Fund's investments by major category are as follows:
Equity securities, including restricted securities, for which market quotations are readily available, are valued at the last reported sale price or official closing price as reported by a third party pricing vendor on the primary market or exchange on which they are traded and are categorized as Level 1 in the hierarchy. In the event there were no sales during the day or closing prices are not available, securities are valued at the last quoted bid price or may be valued using the last available price and are generally categorized as Level 2 in the hierarchy. For foreign equity securities, when significant market or security specific events arise, comparisons to the valuation of American Depositary Receipts (ADRs), futures contracts, Exchange-Traded Funds (ETFs) and certain indexes as well as quoted prices for similar securities are used and are categorized as Level 2 in the hierarchy. Utilizing these techniques may result in transfers between Level 1 and Level 2.
Investments in open-end mutual funds, including the Fidelity Central Funds, are valued at their closing net asset value (NAV) each business day and are categorized as Level 1 in the hierarchy.
Changes in valuation techniques may result in transfers in or out of an assigned level within the disclosure hierarchy.
Annual Report
Notes to Financial Statements - continued
3. Significant Accounting Policies - continued
Foreign Currency. The Funds may use foreign currency contracts to facilitate transactions in foreign-denominated securities. Gains and losses from these transactions may arise from changes in the value of the foreign currency or if the counterparties do not perform under the contracts' terms.
Foreign-denominated assets, including investment securities, and liabilities are translated into U.S. dollars at the exchange rates at period end. Purchases and sales of investment securities, income and dividends received and expenses denominated in foreign currencies are translated into U.S. dollars at the exchange rate in effect on the transaction date.
The effects of exchange rate fluctuations on investments are included with the net realized and unrealized gain (loss) on investment securities. Other foreign currency transactions resulting in realized and unrealized gain (loss) are disclosed separately.
Investment Transactions and Income. For financial reporting purposes, the Funds' investment holdings and NAV include trades executed through the end of the last business day of the period. The NAV per share for processing shareholder transactions is calculated as of the close of business of the New York Stock Exchange (NYSE), normally 4:00 p.m. Eastern time and includes trades executed through the end of the prior business day. Gains and losses on securities sold are determined on the basis of identified cost. Dividend income is recorded on the ex-dividend date, except for certain dividends from foreign securities where the ex-dividend date may have passed, which are recorded as soon as the Funds are informed of the ex-dividend date. Non-cash dividends included in dividend income, if any, are recorded at the fair market value of the securities received. Distributions received on securities that represent a return of capital or capital gain are recorded as a reduction of cost of investments and/or as a realized gain. The Funds estimate the components of distributions received that may be considered return of capital distributions or capital gain distributions. Interest income and distributions from the Fidelity Central Funds are accrued as earned. Investment income is recorded net of foreign taxes withheld where recovery of such taxes is uncertain.
Expenses. Expenses directly attributable to a fund are charged to that fund. Expenses attributable to more than one fund are allocated among the respective funds on the basis of relative net assets or other appropriate methods. Expense estimates are accrued in the period to which they relate and adjustments are made when actual amounts are known.
Income Tax Information and Distributions to Shareholders. Each year, each Fund intends to qualify as a regulated investment company under Subchapter M of the Internal Revenue Code, including distributing substantially all of its taxable income and realized gains. As a result, no provision for income taxes is required. As of January 31, 2013, each Fund did not have any unrecognized tax benefits in the financial statements;
Annual Report
3. Significant Accounting Policies - continued
Income Tax Information and Distributions to Shareholders - continued
nor is each Fund aware of any tax positions for which it is reasonably possible that the total amounts of unrecognized tax benefits will significantly change in the next twelve months. Each Fund files a U.S. federal tax return, in addition to state and local tax returns as required. A fund's federal income tax returns are subject to examination by the Internal Revenue Service (IRS) for a period of three fiscal years after they are filed. State and local tax returns may be subject to examination for an additional fiscal year depending on the jurisdiction. Foreign taxes are provided for based on each Fund's understanding of the tax rules and rates that exist in the foreign markets in which it invests.
Distributions are declared and recorded on the ex-dividend date. Income and capital gain distributions are determined in accordance with income tax regulations, which may differ from GAAP.
Capital accounts within the financial statements are adjusted for permanent book-tax differences. These adjustments have no impact on net assets or the results of operations. Temporary book-tax differences will reverse in a subsequent period.
Book-tax differences are primarily due to foreign currency transactions, equity debt classifications, partnerships and losses deferred due to wash sales.
The federal tax cost of investment securities and unrealized appreciation (depreciation) as of period end were as follows for each Fund:
| Tax cost | Gross unrealized
appreciation | Gross unrealized
depreciation | Net unrealized
appreciation
(depreciation) on
securities and
other investments |
Fidelity Advisor Series Equity-Income Fund | $ 665,974,768 | $ 40,197,952 | $ (3,193,137) | $ 37,004,815 |
Fidelity Advisor Series Stock Selector Large Cap Value Fund | 670,131,383 | 45,601,665 | (1,897,620) | 43,704,045 |
The tax-based components of distributable earnings as of period end were as follows for each Fund:
| Undistributed
ordinary income | Undistributed long-term
capital gain | Net unrealized appreciation
(depreciation) |
Fidelity Advisor Series Equity-Income Fund | $ 2,949,953 | $ 22,689 | $ 37,004,885 |
Fidelity Advisor Series Stock Selector Large Cap Value Fund | 4,271,925 | 1,602 | 43,704,045 |
Annual Report
Notes to Financial Statements - continued
3. Significant Accounting Policies - continued
Income Tax Information and Distributions to Shareholders - continued
The tax character of distributions paid was as follows:
January 31, 2013 | |
| Ordinary Income |
Fidelity Advisor Series Equity-Income Fund | $ 1,147,778 |
Fidelity Advisor Series Stock Selector Large Cap Value Fund | 1,011,826 |
4. Purchases and Sales of Investments.
Purchases and sales of securities, other than short-term securities, are noted in the table below.
| Purchases ($) | Sales ($) |
Fidelity Advisor Series Equity-Income Fund | 883,943,189 | 227,442,334 |
Fidelity Advisor Series Stock Selector Large Cap Value Fund | 975,136,910 | 323,084,891 |
5. Fees and Other Transactions with Affiliates.
Management Fee. FMR and its affiliates provide the Funds with investment management related services for which the Funds pay a monthly management fee. The management fee is the sum of an individual fund fee rate and an annualized group fee rate. The individual fund fee rate is applied to each Fund's average net assets. The group fee rate is based upon the average net assets of all the mutual funds advised by FMR. The group fee rate decreases as assets under management increase and increases as assets under management decrease. In addition, the management fee for Fidelity Advisor Series Stock Selector Large Cap Value Fund is subject to a performance adjustment (up to a maximum of ± .20% of the Fund's average net assets over a 36 month performance period). The upward or downward adjustment to the management fee is based on Fidelity Advisor Series Stock Selector Large Cap Value Fund's relative investment performance as compared to an appropriate benchmark index. The Fund's performance adjustment will not take effect until December 1, 2013. Subsequent months will be added until the performance period includes 36 months. For the period, each Fund's annualized management fee rate expressed as a percentage of each Fund's net assets was as follows:
| Individual Rate | Group Rate | Total |
Fidelity Advisor Series Equity-Income Fund | .20% | .26% | .45% |
Fidelity Advisor Series Stock Selector Large Cap Value Fund | .30% | .26% | .55% |
Annual Report
5. Fees and Other Transactions with Affiliates - continued
Transfer Agent Fees. Fidelity Investments Institutional Operations Company, Inc. (FIIOC), an affiliate of FMR, is the Funds' transfer, dividend disbursing and shareholder servicing agent. FIIOC receives account fees and asset-based fees that vary according to account size and type of account. FIIOC pays for typesetting, printing and mailing of shareholder reports, except proxy statements. For the period, transfer agent fees were equivalent to the following annualized rates expressed as a percentage of average net assets:
Fidelity Advisor Series Equity-Income Fund | .19% |
Fidelity Advisor Series Stock Selector Large Cap Value Fund | .19% |
Accounting and Security Lending Fees. Fidelity Service Company, Inc. (FSC), an affiliate of FMR, maintains each Fund's accounting records. The accounting fee is based on the level of average net assets for each month. Under a separate contract, FSC administers the security lending program. The security lending fee is based on the number and duration of lending transactions.
Brokerage Commissions. The Funds placed a portion of their portfolio transactions with brokerage firms which are affiliates of the investment adviser. The commissions paid to these affiliated firms were as follows:
| Amount |
Fidelity Advisor Series Equity-Income Fund | $ 5,004 |
Fidelity Advisor Series Stock Selector Large Cap Value Fund | 7,595 |
Exchanges In-Kind. During the period, certain investment companies managed by FMR or its affiliates (Investing Funds) completed exchanges in-kind with Fidelity Advisor Series Equity-Income Fund. The Investing Funds delivered cash and securities valued at $675,163,591 in exchange for 67,516,359 shares of Fidelity Advisor Series Equity-Income Fund. The amount of in-kind exchanges is included in share transactions in the accompanying Statement of Changes in Net Assets. Fidelity Advisor Series Equity-Income Fund recognized no gain or loss for federal income tax purposes.
In addition, certain investment companies managed by FMR or its affiliates (Investing Funds) completed exchanges in-kind with Fidelity Advisor Series Stock Selector Large Cap Value Fund. The Investing Funds delivered cash and securities valued at $674,550,401 in exchange for 67,455,040 shares of Fidelity Advisor Series Stock Selector Large Cap Value Fund. The amount of in-kind exchanges is included in share transactions in the accompanying Statement of Changes in Net Assets. Fidelity Advisor Series Stock Selector Large Cap Value Fund recognized no gain or loss for federal income tax purposes.
Annual Report
Notes to Financial Statements - continued
6. Security Lending.
The Funds lend portfolio securities through a lending agent from time to time in order to earn additional income. For equity securities, a lending agent is used and may loan securities to certain qualified borrowers, including Fidelity Capital Markets (FCM), a broker-dealer affiliated with the Funds. On the settlement date of the loan, each applicable Fund receives collateral (in the form of U.S. Treasury obligations, letters of credit and/or cash) against the loaned securities and maintains collateral in an amount not less than 100% of the market value of the loaned securities during the period of the loan. The market value of the loaned securities is determined at the close of business of the Funds and any additional required collateral is delivered to the Funds on the next business day. If the borrower defaults on its obligation to return the securities loaned because of insolvency or other reasons, a fund could experience delays and costs in recovering the securities loaned or in gaining access to the collateral. Any cash collateral received is invested in the Fidelity Securities Lending Cash Central Fund. The value of loaned securities and cash collateral at period end are disclosed on each applicable Fund's Statement of Assets and Liabilities. Security lending income represents the income earned on investing cash collateral, less rebates paid to borrowers and any lending agent fees associated with the loan, plus any premium payments received for lending certain types of securities. Security lending income is presented on each applicable Fund's Statement of Operations as a component of income from Fidelity Central Funds.
| Total Security
Lending Income | Security Lending
Income From
Securities Loaned
to FCM | Value of Securities
Loaned to FCM at
Period End |
Fidelity Advisor Series Equity-Income Fund | $ 12 | $ - | $ - |
Fidelity Advisor Series Stock Selector Large Cap Value Fund | 1,999 | 1,849 | 1,343,580 |
7. Expense Reductions.
Many of the brokers with whom FMR places trades on behalf of certain Funds provided services to these Funds in addition to trade execution. These services included payments of expenses on behalf of each applicable Fund. All of the applicable expense reductions are noted in the table below.
| Brokerage Service
reduction |
| |
Fidelity Advisor Series Equity-Income Fund | $ 63,410 |
Fidelity Advisor Series Stock Selector Large Cap Value Fund | 82,235 |
Annual Report
8. Other.
The Funds' organizational documents provide former and current trustees and officers with a limited indemnification against liabilities arising in connection with the performance of their duties to the Funds. In the normal course of business, the Funds may also enter into contracts that provide general indemnifications. The Funds' maximum exposure under these arrangements is unknown as this would be dependent on future claims that may be made against the Funds. The risk of material loss from such claims is considered remote.
At the end of the period, mutual funds managed by FMR or an FMR affiliate were the owners of record of all of the outstanding shares of the Funds.
Annual Report
To the Trustees of Fidelity Devonshire Trust and Shareholders of Fidelity Advisor Series Equity-Income Fund:
We have audited the accompanying statement of assets and liabilities of Fidelity Advisor Series Equity-Income Fund (the Fund), a fund of Fidelity Devonshire Trust, including the schedule of investments, as of January 31, 2013, and the related statement of operations, the statement of changes in net assets and the financial highlights for the period from December 6, 2012 (commencement of operations) to January 31, 2013. These financial statements and financial highlights are the responsibility of the Fund's management. Our responsibility is to express an opinion on these financial statements and financial highlights based on our audit.
We conducted our audit in accordance with the standards of the Public Company Accounting Oversight Board (United States). Those standards require that we plan and perform the audit to obtain reasonable assurance about whether the financial statements and financial highlights are free of material misstatement. The Fund is not required to have, nor were we engaged to perform, an audit of its internal control over financial reporting. Our audit included consideration of internal control over financial reporting as a basis for designing audit procedures that are appropriate in the circumstances, but not for the purpose of expressing an opinion on the effectiveness of the Fund's internal control over financial reporting. Accordingly, we express no such opinion. An audit also includes examining, on a test basis, evidence supporting the amounts and disclosures in the financial statements, assessing the accounting principles used and significant estimates made by management, as well as evaluating the overall financial statement presentation. Our procedures included confirmation of securities owned as of January 31, 2013, by correspondence with the custodians and brokers; where replies were not received from brokers, we performed other auditing procedures. We believe that our audit provides a reasonable basis for our opinion.
In our opinion, the financial statements and financial highlights referred to above present fairly, in all material respects, the financial position of Fidelity Advisor Series Equity-Income Fund as of January 31, 2013, and the results of its operations, the changes in its net assets and the financial highlights for the period from December 6, 2012 (commencement of operations) to January 31, 2013, in conformity with accounting principles generally accepted in the United States of America.
DELOITTE & TOUCHE LLP
Boston, Massachusetts
March 20, 2013
Annual Report
Report of Independent Registered Public Accounting Firm
To the Trustees of Fidelity Devonshire Trust and the Shareholders of Fidelity Advisor Series Stock Selector Large Cap Value Fund:
In our opinion, the accompanying statement of assets and liabilities, including the schedule of investments, and the related statements of operations and of changes in net assets and the financial highlights present fairly, in all material respects, the financial position of Fidelity Advisor Series Stock Selector Large Cap Value Fund (a fund of Fidelity Devonshire Trust) at January 31, 2013 and the results of its operations, the changes in its net assets for and the financial highlights for the period of December 6, 2012 (commencement of operations) through January 31, 2013, in conformity with accounting principles generally accepted in the United States of America. These financial statements and financial highlights (hereafter referred to as "financial statements") are the responsibility of the Fidelity Advisor Series Stock Selector Large Cap Value Fund's management. Our responsibility is to express an opinion on these financial statements based on our audit. We conducted our audit of these financial statements in accordance with the standards of the Public Company Accounting Oversight Board (United States). Those standards require that we plan and perform the audit to obtain reasonable assurance about whether the financial statements are free of material misstatement. An audit includes examining, on a test basis, evidence supporting the amounts and disclosures in the financial statements, assessing the accounting principles used and significant estimates made by management, and evaluating the overall financial statement presentation. We believe that our audit, which included confirmation of securities at January 31, 2013 by correspondence with the custodian and brokers, provides a reasonable basis for our opinion.
PricewaterhouseCoopers LLP
Boston, Massachusetts
March 20, 2013
Annual Report
The Trustees, Members of the Advisory Board, and executive officers of the trust and funds, as applicable, are listed below. The Board of Trustees governs each fund and is responsible for protecting the interests of shareholders. The Trustees are experienced executives who meet periodically throughout the year to oversee each fund's activities, review contractual arrangements with companies that provide services to each fund, oversee management of the risks associated with such activities and contractual arrangements, and review each fund's performance. Except for James C. Curvey, each of the Trustees oversees 234 Fidelity funds. Mr. Curvey oversees 453 Fidelity funds.
The Trustees hold office without limit in time except that (a) any Trustee may resign; (b) any Trustee may be removed by written instrument, signed by at least two-thirds of the number of Trustees prior to such removal; (c) any Trustee who requests to be retired or who has become incapacitated by illness or injury may be retired by written instrument signed by a majority of the other Trustees; and (d) any Trustee may be removed at any special meeting of shareholders by a two-thirds vote of the outstanding voting securities of the trust. Each Trustee who is not an interested person (as defined in the 1940 Act) (Independent Trustee), shall retire not later than the last day of the calendar year in which his or her 75th birthday occurs. The Independent Trustees may waive this mandatory retirement age policy with respect to individual Trustees. The executive officers and Advisory Board Members hold office without limit in time, except that any officer and Advisory Board Member may resign or may be removed by a vote of a majority of the Trustees at any regular meeting or any special meeting of the Trustees. Except as indicated, each individual has held the office shown or other offices in the same company for the past five years.
Experience, Skills, Attributes, and Qualifications of the Funds' Trustees. The Governance and Nominating Committee has adopted a statement of policy that describes the experience, qualifications, attributes, and skills that are necessary and desirable for potential Independent Trustee candidates (Statement of Policy). The Board believes that each Trustee satisfied at the time he or she was initially elected or appointed a Trustee, and continues to satisfy, the standards contemplated by the Statement of Policy. The Governance and Nominating Committee also engages professional search firms to help identify potential Independent Trustee candidates who have the experience, qualifications, attributes, and skills consistent with the Statement of Policy. From time to time, additional criteria based on the composition and skills of the current Independent Trustees, as well as experience or skills that may be appropriate in light of future changes to board composition, business conditions, and regulatory or other developments, have also been considered by the professional search firms and the Governance and Nominating Committee. In addition, the Board takes into account the Trustees' commitment and participation in Board and committee meetings, as well as their leadership of standing and ad hoc committees throughout their tenure.
In determining that a particular Trustee was and continues to be qualified to serve as a Trustee, the Board has considered a variety of criteria, none of which, in isolation, was controlling. The Board believes that, collectively, the Trustees have balanced and diverse experience, qualifications, attributes, and skills, which allow the Board to operate effectively in governing each fund and protecting the interests of shareholders. Information about the specific experience, skills, attributes, and qualifications of each Trustee, which in each case led to the Board's conclusion that the Trustee should serve (or continue to serve) as a trustee of the funds, is provided below.
Annual Report
Board Structure and Oversight Function. James C. Curvey is an interested person (as defined in the 1940 Act) and currently serves as Chairman. The Trustees have determined that an interested Chairman is appropriate and benefits shareholders because an interested Chairman has a personal and professional stake in the quality and continuity of services provided to the funds. Independent Trustees exercise their informed business judgment to appoint an individual of their choosing to serve as Chairman, regardless of whether the Trustee happens to be independent or a member of management. The Independent Trustees have determined that they can act independently and effectively without having an Independent Trustee serve as Chairman and that a key structural component for assuring that they are in a position to do so is for the Independent Trustees to constitute a substantial majority for the Board. The Independent Trustees also regularly meet in executive session. Ned C. Lautenbach serves as Chairman of the Independent Trustees and as such (i) acts as a liaison between the Independent Trustees and management with respect to matters important to the Independent Trustees and (ii) with management prepares agendas for Board meetings.
Fidelity funds are overseen by different Boards of Trustees. The funds' Board oversees Fidelity's equity and high income funds and another Board oversees Fidelity's investment-grade bond, money market, and asset allocation funds. The asset allocation funds may invest in Fidelity funds overseen by the funds' Board. The use of separate Boards, each with its own committee structure, allows the Trustees of each group of Fidelity funds to focus on the unique issues of the funds they oversee, including common research, investment, and operational issues. On occasion, the separate Boards establish joint committees to address issues of overlapping consequences for the Fidelity funds overseen by each Board.
The Trustees operate using a system of committees to facilitate the timely and efficient consideration of all matters of importance to the Trustees, each fund, and fund shareholders and to facilitate compliance with legal and regulatory requirements and oversight of the funds' activities and associated risks. The Board, acting through its committees, has charged FMR and its affiliates with (i) identifying events or circumstances the occurrence of which could have demonstrably adverse effects on the funds' business and/or reputation; (ii) implementing processes and controls to lessen the possibility that such events or circumstances occur or to mitigate the effects of such events or circumstances if they do occur; and (iii) creating and maintaining a system designed to evaluate continuously business and market conditions in order to facilitate the identification and implementation processes described in (i) and (ii) above. Because the day-to-day operations and activities of the funds are carried out by or through FMR, its affiliates and other service providers, the funds' exposure to risks is mitigated but not eliminated by the processes overseen by the Trustees. While each of the Board's committees has responsibility for overseeing different aspects of the funds' activities, oversight is exercised primarily through the Operations, Audit, and Compliance Committees. In addition, the Independent Trustees have worked with FMR to enhance the Board's oversight of investment and financial risks, legal and regulatory risks, technology risks, and operational risks, including the development of additional risk reporting to the Board. For example, a working group comprised of Independent Trustees and FMR has worked and continues to work to review the Fidelity funds' valuation-related activities, reporting and risk management. Appropriate personnel, including but not limited to the funds' Chief Compliance Officer (CCO), FMR's internal auditor, the independent accountants, the funds' Treasurer and portfolio management personnel, make periodic reports to the Board's committees, as appropriate, including an annual review of FMR's risk management program for the Fidelity funds. The responsibilities of each standing committee, including their oversight responsibilities, are described further under "Standing Committees of the Funds' Trustees."
Annual Report
Trustees and Officers - continued
The funds' Statements of Additional Information (SAIs) include more information about the Trustees. To request a free copy, call Fidelity at 1-877-208-0098.
Interested Trustees*:
Correspondence intended for each Trustee who is an interested person may be sent to Fidelity Investments, 245 Summer Street, Boston, Massachusetts 02210.
Name, Age; Principal Occupations and Other Relevant Experience+ |
James C. Curvey (77) |
| Year of Election or Appointment: 2007 Mr. Curvey is Trustee and Chairman of the Board of Trustees of certain Trusts. Mr. Curvey also serves as Trustee (2007-present) of other investment companies advised by FMR. Mr. Curvey is a Director of Fidelity Investments Money Management, Inc. (2009-present), Director of Fidelity Research & Analysis Co. (2009-present) and Director of FMR and FMR Co., Inc. (2007-present). Mr. Curvey is also Vice Chairman (2007-present) and Director of FMR LLC. In addition, Mr. Curvey serves as an Overseer for the Boston Symphony Orchestra and a member of the Trustees of Villanova University. Previously, Mr. Curvey was the Vice Chairman (2006-2007) and Director (2000-2007) of FMR Corp. |
Ronald P. O'Hanley (55) |
| Year of Election or Appointment: 2011 Mr. O'Hanley is Director of FMR Co., Inc. (2010-present), Director of Fidelity Investments Money Management, Inc. (2010-present), Director of Fidelity Research & Analysis Company (2010-present), President of Fidelity Asset Management and Corporate Services and a member of Fidelity's Executive Committee (2010-present). Previously, Mr. O'Hanley served as President and Chief Executive Officer of BNY Mellon Asset Management (2007-2010). Mr. O'Hanley also served as Vice Chairman of Bank New York Mellon Corp. and a member of that firm's Executive Committee. Prior to the 2007 merger of The Bank of New York and Mellon Financial Corporation, he was Vice Chairman of Mellon Financial Corporation and President and Chief Executive Officer of Mellon Asset Management. He joined Mellon in February 1997. Mr. O'Hanley currently serves as Chairman of the Boston Public Library Foundation Board of Directors and sits on the Board of Directors of Beth Israel Deaconess Medical Center, the Board of Trustees of the Marine Biological Laboratory and the Advisory Board of the Maxwell School of Citizenship and Public Administration at Syracuse University. Mr. O'Hanley also chairs the Council on Asset Management for the Financial Services Roundtable and is a member of the Board of Directors of Institutional Investor's U.S. Institute. |
* Trustees have been determined to be "Interested Trustees" by virtue of, among other things, their affiliation with the trust or various entities under common control with FMR.
+ The information above includes each Trustee's principal occupation during the last five years and other information relating to the experience, attributes, and skills relevant to each Trustee's qualifications to serve as a Trustee, which led to the conclusion that each Trustee should serve as a Trustee for each fund.
Annual Report
Trustees and Officers - continued
Independent Trustees:
Correspondence intended for each Independent Trustee (that is, the Trustees other than the Interested Trustees) may be sent to Fidelity Investments, P.O. Box 55235, Boston, Massachusetts 02205-5235.
Name, Age; Principal Occupations and Other Relevant Experience+ |
Dennis J. Dirks (64) |
| Year of Election or Appointment: 2005 Prior to his retirement in May 2003, Mr. Dirks was Chief Operating Officer and a member of the Board of The Depository Trust & Clearing Corporation (DTCC). He also served as President, Chief Operating Officer, and Board member of The Depository Trust Company (DTC) and President and Board member of the National Securities Clearing Corporation (NSCC). In addition, Mr. Dirks served as Chief Executive Officer and Board member of the Government Securities Clearing Corporation, Chief Executive Officer and Board member of the Mortgage-Backed Securities Clearing Corporation, as a Trustee and a member of the Finance Committee of Manhattan College (2005-2008), and as a Trustee and a member of the Finance Committee of AHRC of Nassau County (2006-2008). Mr. Dirks is a member of the Independent Directors Council (IDC) Governing Council (2010-present) and Board of Directors for The Brookville Center for Children's Services, Inc. (2009-present). |
Alan J. Lacy (59) |
| Year of Election or Appointment: 2008 Mr. Lacy serves as Senior Adviser (2007-present) of Oak Hill Capital Partners, L.P. (private equity). Mr. Lacy also served as Chief Executive Officer (2000-2005) and Vice Chairman (2005-2006) of Sears Holdings Corporation and Sears, Roebuck and Co. (retail). In addition, Mr. Lacy serves as a member of the Board of Directors of Dave & Buster's Entertainment, Inc. (restaurant and entertainment complexes, 2010-
present), Earth Fare, Inc. (retail grocery, 2012-present), The Hillman Companies, Inc. (hardware wholesalers, 2010-present), and Bristol-Myers Squibb Company (global pharmaceuticals, 2008-present). Mr. Lacy is a member of the Board of Trustees of The National Parks Conservation Association (2006-present). Previously, Mr. Lacy served as Chairman of the Board of Trustees of the National Parks Conservation Association (2008-2011) and as a member of the Board of Directors for the Western Union Company (global money transfer, 2006-2011). |
Ned C. Lautenbach (68) |
| Year of Election or Appointment: 2000 Mr. Lautenbach is Chairman of the Independent Trustees of the Equity and High Income Funds (2006-present). Mr. Lautenbach currently serves as the Lead Director of the Eaton Corporation Board of Directors (diversified industrial, 1997-present). Mr. Lautenbach is Chairman of the Board of Directors of the Philharmonic Center for the Arts in Naples, Florida (2012-present) and a member of the Council on Foreign Relations (1994-present). Previously, Mr. Lautenbach was a Partner/Advisory Partner at Clayton, Dubilier & Rice, LLC (private equity investment, 1998-2010), as well as a Director of Sony Corporation (2006-2007). |
Joseph Mauriello (68) |
| Year of Election or Appointment: 2008 Prior to his retirement in January 2006, Mr. Mauriello served in numerous senior management positions including Deputy Chairman and Chief Operating Officer (2004-2005), and Vice Chairman of Financial Services (2002-2004) of KPMG LLP US (professional services, 1965-2005). Mr. Mauriello currently serves as a member of the Board of Directors of XL Group plc. (global insurance and re-insurance, 2006-present). Previously, Mr. Mauriello served as a Director of the Hamilton Funds of the Bank of New York (2006-2007) and of Arcadia Resources Inc. (health care services and products, 2007-2012). |
Robert W. Selander (62) |
| Year of Election or Appointment: 2011 Previously, Mr. Selander served as a Member of the Advisory Board of Fidelity's Equity and High Income Funds (2011), Executive Vice Chairman (2010), Chief Executive Officer (2009-2010), and President and Chief Executive Officer (1997-2009) of Mastercard, Inc. |
Cornelia M. Small (68) |
| Year of Election or Appointment: 2005 Ms. Small is a member of the Board of Directors (2009-present) and Chair of the Investment Committee (2010-present) of the Teagle Foundation. Ms. Small also serves on the Investment Committee of the Berkshire Taconic Community Foundation (2008-present). Previously, Ms. Small served as Chairperson (2002-2008) and a member of the Investment Committee and Chairperson (2008-2012) and a member of the Board of Trustees of Smith College. In addition, Ms. Small served as Chief Investment Officer, Director of Global Equity Investments, and a member of the Board of Directors of Scudder, Stevens & Clark and Scudder Kemper Investments. |
William S. Stavropoulos (73) |
| Year of Election or Appointment: 2002 Mr. Stavropoulos is Vice Chairman of the Independent Trustees of the Equity and High Income Funds (2006-present). Mr. Stavropoulos serves as President and Founder of the Michigan Baseball Foundation, the Great Lakes Loons (2007-present). Mr. Stavropoulos is Chairman Emeritus of the Board of Directors of The Dow Chemical Company, where he previously served in numerous senior management positions, including President, CEO (1995-2000; 2002-2004), Chairman of the Executive Committee (2000-2006), and as a member of the Board of Directors (1990-2006). Currently, Mr. Stavropoulos is a Director of Univar Inc. (global distributor of commodity and specialty chemicals, Chairman from 2010-May 2012 and Lead Director from May 2012-present), Teradata Corporation (data warehousing and technology solutions, 2008-present), Maersk Inc. (industrial conglomerate), and Tyco International, Ltd. (multinational manufacturing and services, 2007-present), and a member of the Advisory Board for Metalmark Capital LLC (private equity investment, 2005-present). Mr. Stavropoulos is an operating advisor to Clayton, Dubilier & Rice, LLC (private equity investment). In addition, Mr. Stavropoulos is a member of the University of Notre Dame Advisory Council for the College of Science, a Trustee of the Rollin L. Gerstacker Foundation, and a Director of the Naples Philharmonic Center for the Arts. Previously, Mr. Stavropoulos served as a Director of Chemical Financial Corporation (bank holding company, 1993-2012). |
David M. Thomas (63) |
| Year of Election or Appointment: 2008 Previously, Mr. Thomas served as Executive Chairman (2005-2006) and Chairman and Chief Executive Officer (2000-2005) of IMS Health, Inc. (pharmaceutical and healthcare information solutions), and a Director of Fortune Brands, Inc. (consumer products, 2000-2011). In addition, Mr. Thomas serves as Non-Executive Chairman of the Board of Directors of Fortune Brands Home and Security (home and security products, 2011-present), and as a member of the Board of Directors of Interpublic Group of Companies, Inc. (marketing communication, 2004-present). |
Michael E. Wiley (62) |
| Year of Election or Appointment: 2008 Mr. Wiley also serves as a Director of Asia Pacific Exploration Consolidated (international oil and gas exploration and production, 2008-present). Mr. Wiley serves as a Director of Tesoro Corporation (independent oil refiner and marketer, 2005-present), and a Director of Bill Barrett Corporation (exploration and production, 2005-present). In addition, Mr. Wiley also serves as a Director of Post Oak Bank (privately-held bank, 2004-present). Previously, Mr. Wiley served as a member of the Board of Trustees of the University of Tulsa (2000-2006; 2007-2010), as a Senior Energy Advisor of Katzenbach Partners, LLC (consulting, 2006-2007), as an Advisory Director of Riverstone Holdings (private investment), Chairman, President, and CEO of Baker Hughes, Inc. (oilfield services, 2000-2004), and as Director of Spinnaker Exploration Company (exploration and production, 2001-2005). |
+ The information above includes each Trustee's principal occupation during the last five years and other information relating to the experience, attributes, and skills relevant to each Trustee's qualifications to serve as a Trustee, which led to the conclusion that each Trustee should serve as a Trustee for each fund.
Advisory Board Members and Executive Officers:
Correspondence intended for David A. Rosow and Garnett A. Smith may be sent to Fidelity Investments, P.O. Box 55235, Boston, Massachusetts 02205-5235. Correspondence intended for each executive officer and Peter S. Lynch may be sent to Fidelity Investments, 245 Summer Street, Boston, Massachusetts 02210.
Name, Age; Principal Occupation |
Peter S. Lynch (69) |
| Year of Election or Appointment: 2003 Member of the Advisory Board of Fidelity's Equity and High Income Funds. Mr. Lynch is Vice Chairman and a Director of FMR and FMR Co., Inc. In addition, Mr. Lynch serves as a Trustee of Boston College and as the Chairman of the Inner-City Scholarship Fund. Previously, Mr. Lynch served on the Special Olympics International Board of Directors (1997-2006). |
David A. Rosow (70) |
| Year of Election or Appointment: 2012 Member of the Advisory Board of Fidelity's Equity and High Income Funds. Chairman and Chief Executive Officer of International Golf Group, Inc. (golf course development, 1989-present). Previously, Mr. Rosow served as Chairman and Chief Executive Officer of Rosow & Company, Inc. (private investment company, 1989-2011), a Lead Director of Hudson United Bancorp (2001-2006) and as a Director of TD Banknorth (1996-2006). In addition, Mr. Rosow is a member (2008-present) and President (2009-present) of the Town Council of Palm Beach, Florida. |
Garnett A. Smith (65) |
| Year of Election or Appointment: 2012 Member of the Advisory Board of Fidelity's Equity and High Income Funds. Prior to Mr. Smith's retirement, he served as Chairman and Chief Executive Officer of Inbrand Corp. (manufacturer of personal absorbent products, 1990-1997). He also served as President (1986-1990) of Inbrand Corp. Prior to his employment with Inbrand Corp., he was employed by a retail fabric chain and North Carolina National Bank. In addition, Mr. Smith is a board member of the Jackson Hole Land Trust (2009-present). |
Kenneth B. Robins (43) |
| Year of Election or Appointment: 2008 President and Treasurer of Fidelity's Equity and High Income Funds. Mr. Robins also serves as President and Treasurer (2010-present) and Assistant Treasurer (2009-present) of other Fidelity funds and is an employee of Fidelity Investments (2004-present). Previously, Mr. Robins served as Deputy Treasurer of the Fidelity funds (2005-2008) and Treasurer and Chief Financial Officer of The North Carolina Capital Management Trust: Cash and Term Portfolios (2006-2008). |
Bruce T. Herring (47) |
| Year of Election or Appointment: 2006
Vice President of certain Equity Funds. Mr. Herring also serves as Chief Investment Officer of Fidelity Global Asset Allocation (GAA) (2013-present), Chief Investment Officer and Director of Fidelity Management & Research (U.K.) Inc. (2010-present), Group Chief Investment Officer of FMR, and President of Fidelity Research & Analysis Company (2010-present). Previously, Mr. Herring served as Vice President (2005-2006) and Senior Vice President (2006-2007) of Fidelity Management & Research Company, Vice President of FMR Co., Inc. (2001-2007) and as a portfolio manager for Fidelity U.S. Equity Funds. |
Brian B. Hogan (48) |
| Year of Election or Appointment: 2009 Vice President of Equity and High Income Funds. Mr. Hogan also serves as President of FMR's Equity Division (2009-present). Previously, Mr. Hogan served as Senior Vice President, Equity Research of FMR (2006-2009) and as a portfolio manager. |
Thomas C. Hense (49) |
| Year of Election or Appointment: 2008 or 2010 Vice President of Fidelity's High Income (2008), Small Cap (2008), and Value (2010) Funds. Previously, Mr. Hense served as a portfolio manager for Fidelity's Institutional Money Management Group (Pyramis) (2003-2008). |
Scott C. Goebel (45) |
| Year of Election or Appointment: 2008 Secretary and Chief Legal Officer (CLO) of the Fidelity funds. Mr. Goebel also serves as Secretary of Fidelity Investments Money Management, Inc. (FIMM) (2010-present) and Fidelity Research and Analysis Company (FRAC) (2010-present); Secretary and CLO of The North Carolina Capital Management Trust: Cash and Term Portfolios (2008-present); General Counsel, Secretary, and Senior Vice President of FMR (2008-present) and FMR Co., Inc. (2008-present); employed by FMR LLC or an affiliate (2001-present); Chief Legal Officer of Fidelity Management & Research (Hong Kong) Limited (2008-present) and Assistant Secretary of Fidelity Management & Research (Japan) Inc. (2008-present), and Fidelity Management & Research (U.K.) Inc. (2008-present). Previously, Mr. Goebel served as Assistant Secretary of FIMM (2008-2010), FRAC (2008-2010), and the Funds (2007-2008) and as Vice President and Secretary of Fidelity Distributors Corporation (FDC) (2005-2007). |
William C. Coffey (43) |
| Year of Election or Appointment: 2009 Assistant Secretary of Fidelity's Equity and High Income Funds. Mr. Coffey also serves as Senior Vice President and Deputy General Counsel of FMR LLC (2010-present), and is an employee of Fidelity Investments. Previously, Mr. Coffey served as Vice President and Associate General Counsel of FMR LLC (2005-2009). |
Elizabeth Paige Baumann (44) |
| Year of Election or Appointment: 2012 Anti-Money Laundering (AML) Officer of the Fidelity funds. Ms. Baumann also serves as AML Officer of The North Carolina Capital Management Trust: Cash and Term Portfolios (2012-present), Chief AML Officer of FMR LLC (2012-present), and is an employee of Fidelity Investments. Previously, Ms. Baumann served as Vice President and Deputy Anti-Money Laundering Officer (2007-2012). |
Christine Reynolds (54) |
| Year of Election or Appointment: 2008 Chief Financial Officer of the Fidelity funds. Ms. Reynolds became President of Fidelity Pricing and Cash Management Services (FPCMS) in August 2008. Ms. Reynolds served as Chief Operating Officer of FPCMS (2007-2008). Previously, Ms. Reynolds served as President, Treasurer, and Anti-Money Laundering officer of the Fidelity funds (2004-2007). |
Joseph A. Hanlon (44) |
| Year of Election or Appointment: 2012 Chief Compliance Officer of Fidelity's Equity and High Income Funds. Mr. Hanlon serves as Compliance Officer of FMR, FMR Co., Inc., Fidelity Investments Money Management, Inc. (FIMM), Fidelity Research and Analysis Company (FRAC), Fidelity Management & Research (Japan) Inc., Fidelity Management & Research (U.K.) Inc., Fidelity Management & Research (Hong Kong), and Strategic Advisers, Inc. (2009-present), as Senior Vice President of the Fidelity Asset Management Division (2009-present), and is an employee of Fidelity Investments. |
Joseph F. Zambello (55) |
| Year of Election or Appointment: 2011 Deputy Treasurer of the Fidelity funds. Mr. Zambello is an employee of Fidelity Investments. Previously, Mr. Zambello served as Vice President of FMR's Program Management Group (2009-2011) and Vice President of the Transfer Agent Oversight Group (2005-2009). |
Adrien E. Deberghes (45) |
| Year of Election or Appointment: 2008 Deputy Treasurer of Fidelity's Equity and High Income Funds. Mr. Deberghes also serves as Vice President (2011-present) and Assistant Treasurer (2010-present) of other Fidelity funds, and is an employee of Fidelity Investments (2008-present). Previously, Mr. Deberghes served as Senior Vice President of Mutual Fund Administration at State Street Corporation (2007-2008), Senior Director of Mutual Fund Administration at Investors Bank & Trust (2005-2007), and Director of Finance for Dunkin' Brands (2000-2005). |
Stephen Sadoski (41) |
| Year of Election or Appointment: 2012 Deputy Treasurer of Fidelity's Equity and High Income Funds. Mr. Sadoski also serves as Deputy Treasurer of other Fidelity funds (2013-present) and is an employee of Fidelity Investments (2012-present). Previously, Mr. Sadoski served as Assistant Treasurer of Fidelity's Fixed Income and Asset Allocation Funds (2012-2013), an assistant chief accountant in the Division of Investment Management of the Securities and Exchange Commission (SEC) (2009-2012) and as a senior manager at Deloitte & Touche (1997-2009). |
Stacie Smith (38) |
| Year of Election or Appointment: 2013 Deputy Treasurer of Fidelity's Equity and High Income Funds. Ms. Smith is an employee of Fidelity Investments (2009-present). Previously, Ms. Smith served as Senior Audit Manager of Ernst & Young LLP (1996-2009). |
Stephanie J. Dorsey (43) |
| Year of Election or Appointment: 2010 Assistant Treasurer of Fidelity's Equity and High Income Funds. Ms. Dorsey also serves as President and Treasurer (2013-present) and Assistant Treasurer (2012-present) of other Fidelity funds and is an employee of Fidelity Investments (2008-present). Previously, Ms. Dorsey served as Deputy Treasurer of Fidelity's Fixed Income and Asset Allocation Funds (2008-2013), Treasurer (2004-2008) of the JPMorgan Mutual Funds and Vice President (2004-2008) of JPMorgan Chase Bank. |
John R. Hebble (54) |
| Year of Election or Appointment: 2009 Assistant Treasurer of Fidelity's Equity and High Income Funds. Mr. Hebble also serves as President (2011-present), Treasurer, and Chief Financial Officer of The North Carolina Capital Management Trust: Cash and Term Portfolios (2008-present) and is an employee of Fidelity Investments. Previously, Mr. Hebble served as President and Treasurer of Fidelity's Fixed Income and Asset Allocation Funds (2008-2013). |
Gary W. Ryan (54) |
| Year of Election or Appointment: 2005 Assistant Treasurer of the Fidelity funds. Mr. Ryan is an employee of Fidelity Investments. Previously, Mr. Ryan served as Vice President of Fund Reporting in Fidelity Pricing and Cash Management Services (FPCMS) (1999-2005). |
Jonathan Davis (44) |
| Year of Election or Appointment: 2010 Assistant Treasurer of the Fidelity funds. Mr. Davis is also Assistant Treasurer of Fidelity Rutland Square Trust II and Fidelity Commonwealth Trust II. Mr. Davis is an employee of Fidelity Investments. Previously, Mr. Davis served as Vice President and Associate General Counsel of FMR LLC (2003-2010). |
Annual Report
The Board of Trustees of each fund voted to pay to shareholders of record at the opening of business on record date, the following distributions per share derived from capital gains realized from sales of portfolio securities and dividends derived from net investment income:
| Pay Date | Record Date | Dividends | Capital Gains |
Fidelity Advisor Series Equity-Income Fund | 03/11/13 | 03/08/13 | $0.000 | $0.033 |
Fidelity Advisor Series Stock Selector Large Cap Value Fund | 03/11/13 | 03/08/13 | $0.005 | $0.061 |
The funds hereby designate as a capital gain dividend the amounts noted below for the taxable year ended January 31, 2013 or, if subsequently determined to be different, the net capital gain of such year.
Fidelity Advisor Series Equity-Income Fund | $ 22,688 |
Fidelity Advisor Series Stock Selector Large Cap Value Fund | $ 1,602 |
A percentage of the dividends distributed during the fiscal year for the following funds was derived from interest on U.S. Government securities which is generally exempt from state income tax.
Fidelity Advisor Series Equity-Income Fund | 0.04% |
A percentage of the dividends distributed during the fiscal year for the following funds qualifies for dividends-received deduction shareholders.
| December 2012 |
Fidelity Advisor Series Equity-Income Fund | 99% |
Fidelity Advisor Series Stock Selector Large Cap Value Fund | 88% |
A percentage of the dividends distributed during the fiscal year for the following funds may be taken into account as a dividend for purposes of a maximum rate under 1(h) (11) of the Internal Revenue Code.
| December 2012 |
Fidelity Advisor Series Equity-Income Fund | 99% |
Fidelity Advisor Series Stock Selector Large Cap Value Fund | 100% |
The fund will notify shareholders in January 2014 of amounts for use in preparing 2013 income tax returns.
Annual Report
Board Approval of Investment Advisory Contracts and Management Fees
Fidelity Advisor Series Equity-Income Fund
Fidelity Advisor Series Stock Selector Large Cap Value Fund
On September 19, 2012, the Board of Trustees, including the Independent Trustees (together, the Board), voted to approve the management contract and sub-advisory agreements (together, the Advisory Contracts) for each fund. The Board, assisted by the advice of fund counsel and Independent Trustees' counsel, considered a broad range of information.
Nature, Extent, and Quality of Services Provided. The Board considered the staffing within the investment adviser, FMR, and the sub-advisers (together, the Investment Advisers), including the backgrounds of the funds' investment personnel, and also considered the funds' investment objective, strategies, and related investment philosophy. The Board considered the structure of the portfolio manager compensation program and whether this structure provides appropriate incentives to act in the best interests of each fund.
Resources Dedicated to Investment Management and Support Services. The Board and the Fund Oversight and Research Committees reviewed the general qualifications and capabilities of the Investment Advisers' investment staff, including its size, education, experience, and resources, as well as the Investment Advisers' approach to recruiting, training, managing, and compensating investment personnel. The Board also noted that FMR has continued to increase the resources devoted to non-U.S. offices, including expansion of Fidelity's global investment organization. The Board noted that Fidelity's analysts have extensive resources, tools and capabilities that allow them to conduct sophisticated quantitative and fundamental analysis, as well as credit analysis of issuers, counterparties and guarantors. The Board also believes that Fidelity's investment professionals have sufficient access to global information and data so as to provide competitive investment results over time, and that those professionals also have access to sophisticated tools that permit them to assess portfolio construction and risk and performance attribution characteristics continuously, as well as to transmit new information and research conclusions rapidly around the world. Additionally, in its deliberations, the Board considered the Investment Advisers' trading and risk management capabilities and resources, which are an integral part of the investment management process.
Shareholder and Administrative Services. The Board considered the nature, extent, quality, and cost of advisory, administrative, and shareholder services to be performed by the Investment Advisers and their affiliates under the Advisory Contracts and under separate agreements covering transfer agency, pricing and bookkeeping, and securities lending services for each fund. The Board also considered the nature and extent of the supervision of third party service providers, principally custodians and subcustodians.
The Board noted that the growth of fund assets over time across the complex allows Fidelity to reinvest in the development of services designed to enhance the value or convenience of the Fidelity funds as investment vehicles. These services include 24-hour access to account information and market information through telephone representatives and over the Internet, investor education materials and asset allocation tools, and the expanded availability of Fidelity Investor Centers.
Annual Report
Board Approval of Investment Advisory Contracts and
Management Fees - continued
Investment Performance. Each fund is a new fund and therefore had no historical performance for the Board to review at the time it approved each fund's Advisory Contracts. The Board considered the Investment Advisers' strength in fundamental, research-driven Income/Growth and Growth & Capital Appreciation selection, which the Board is familiar with through its supervision of other Fidelity funds that invest in such securities.
Based on its review, the Board concluded that the nature, extent, and quality of services to be provided to each fund under the Advisory Contracts should benefit each fund's shareholders.
Competitiveness of Management Fee and Total Expense Ratio. The Board considered each fund's proposed management fee and the projected total expense ratio of the fund in reviewing the Advisory Contracts. The Board noted that each fund's proposed management fee rate is lower than the median fee rate of funds with similar Lipper investment objective categories and comparable management fee characteristics. The Board also considered that the projected total expense ratios are comparable to those of similar classes and funds that Fidelity offers to shareholders.
Based on its review, the Board concluded that each fund's management fee and projected total expense ratio were reasonable in light of the services that the fund and its shareholders will receive and the other factors considered.
Costs of the Services and Profitability. Each fund is a new fund and therefore no revenue, cost, or profitability data was available for the Board to review in respect of each fund at the time it approved the Advisory Contracts. In connection with its future renewal of each fund's Advisory Contracts, the Board will consider the revenues earned and the expenses incurred by Fidelity in conducting the business of developing, marketing, distributing, managing, administering and servicing each fund and its shareholders.
Economies of Scale. The Board will consider economies of scale when there is operating experience to permit assessment thereof. It noted that, notwithstanding the entrepreneurial risk associated with a new fund, the management fee was at a level normally associated, by comparison with competitors, with very high fund net assets, and Fidelity asserted to the Board that the level of the fee anticipated economies of scale at lower asset levels even before, if ever, economies of scale are achieved. The Board also noted that each fund and its shareholders would have access to the very considerable number and variety of services available through Fidelity and its affiliates.
Based on its evaluation of all of the conclusions noted above, and after considering all factors it believed relevant, the Board ultimately concluded that the advisory fee structures are fair and reasonable, and that each fund's Advisory Contracts should be approved.
Annual Report
Investment Adviser
Fidelity Management & Research Company
Boston, MA
Investment Sub-Advisers
FMR Co., Inc.
Fidelity Management & Research (U.K.) Inc.
Fidelity Management & Research (Hong Kong) Limited
Fidelity Management & Research (Japan) Inc.
General Distributor
Fidelity Distributors Corporation
Smithfield, RI
Transfer and Service Agents
Fidelity Investments Institutional Operations Company, Inc.
Boston, MA
Fidelity Service Company, Inc.
Boston, MA
Custodian
State Street Bank and Trust Company
Quincy, MA
Fidelity Advisor Series Stock Selector Large Cap Value Fund
The Northern Trust Company
Chicago, IL
Fidelity Advisor Series Equity-Income Fund
(Fidelity Investment logo)(registered trademark)
Corporate Headquarters
245 Summer St., Boston, MA 02210
www.fidelity.com
AEDTI-ALDTI-ANN-0313
1.956891.100
Item 2. Code of Ethics
As of the end of the period, January 31, 2013, Fidelity Devonshire Trust (the trust) has adopted a code of ethics, as defined in Item 2 of Form N-CSR, that applies to its President and Treasurer and its Chief Financial Officer. A copy of the code of ethics is filed as an exhibit to this Form N-CSR.
Item 3. Audit Committee Financial Expert
The Board of Trustees of the trust has determined that Joseph Mauriello is an audit committee financial expert, as defined in Item 3 of Form N-CSR. Mr. Mauriello is independent for purposes of Item 3 of Form N-CSR.
Item 4. Principal Accountant Fees and Services
Fees and Services
The following table presents fees billed by Deloitte & Touche LLP, the member firms of Deloitte Touche Tohmatsu, and their respective affiliates (collectively, "Deloitte Entities") in each of the last two fiscal years for services rendered to Fidelity Advisor Series Equity-Income Fund, Fidelity Series All-Sector Equity Fund, Fidelity Series Equity-Income Fund and Fidelity Series Large Cap Value Fund (the "Funds"):
Services Billed by Deloitte Entities
January 31, 2013 FeesA,b
| Audit Fees | Audit-Related Fees | Tax Fees | All Other Fees |
Fidelity Advisor Series Equity-Income Fund | $35,000 | $- | $5,800 | $- |
Fidelity Series All-Sector Equity Fund | $43,000 | $- | $4,700 | $2,100 |
Fidelity Series Equity-Income Fund | $35,000 | $- | $5,800 | $100 |
Fidelity Series Large Cap Value Fund | $51,000 | $- | $6,700 | $1,900 |
January 31, 2012 FeesA,B
| Audit Fees | Audit-Related Fees | Tax Fees | All Other Fees |
Fidelity Advisor Series Equity-Income Fund | $- | $- | $- | $- |
Fidelity Series All-Sector Equity Fund | $42,000 | | $4,600 | $1,800 |
Fidelity Series Equity-Income Fund | $- | $- | $- | $- |
Fidelity Series Large Cap Value Fund | $54,000 | $- | $6,600 | $1,700 |
A Amounts may reflect rounding.
B Fidelity Advisor Series Equity-Income Fund and Fidelity Series Equity-Income Fund commenced operations on December 6, 2012.
The following table presents fees billed by PricewaterhouseCoopers LLP ("PwC") in each of the last two fiscal years for services rendered to Fidelity Advisor Series Stock Selector Large Cap Value Fund, Fidelity Equity-Income Fund, Fidelity Large Cap Growth Fund, Fidelity Mid Cap Value Fund, and Fidelity Series Stock Selector Large Cap Value Fund and Fidelity Stock Selector Large Cap Value Fund (the "Funds"):
Services Billed by PwC
January 31, 2013 FeesA,B
| Audit Fees | Audit-Related Fees | Tax Fees | All Other Fees |
Fidelity Advisor Series Stock Selector Large Cap Value Fund | $30,000 | $- | $2,700 | $200 |
Fidelity Equity-Income Fund | $146,000 | $- | $4,400 | $5,000 |
Fidelity Large Cap Growth Fund | $49,000 | $- | $3,300 | $1,600 |
Fidelity Mid Cap Value Fund | $50,000 | $- | $3,300 | $1,700 |
Fidelity Series Stock Selector Large Cap Value Fund | $32,000 | $- | $2,700 | $300 |
Fidelity Stock Selector Large Cap Value Fund | $50,000 | $- | $3,300 | $1,700 |
January 31, 2012 FeesA,B
| Audit Fees | Audit-Related Fees | Tax Fees | All Other Fees |
Fidelity Advisor Series Stock Selector Large Cap Value Fund | $- | $- | $- | $- |
Fidelity Equity-Income Fund | $169,000 | $- | $4,300 | $6,100 |
Fidelity Large Cap Growth Fund | $49,000 | $- | $3,300 | $1,600 |
Fidelity Mid Cap Value Fund | $49,000 | $- | $3,300 | $1,800 |
Fidelity Series Stock Selector Large Cap Value Fund | $- | $- | $- | $- |
Fidelity Stock Selector Large Cap Value Fund | $49,000 | $- | $3,300 | $1,800 |
A Amounts may reflect rounding.
B Fidelity Advisor Series Stock Selector Large Cap Value Fund and Fidelity Series Stock Selector Large Cap Value Fund commenced operations on December 6, 2012.
The following table presents fees billed by PwC and Deloitte Entities that were required to be approved by the Audit Committee for services that relate directly to the operations and financial reporting of the Funds and that are rendered on behalf of Fidelity Management & Research Company ("FMR") and entities controlling, controlled by, or under common control with FMR (not including any sub-adviser whose role is primarily portfolio management and is subcontracted with or overseen by another investment adviser) that provide ongoing services to the Funds ("Fund Service Providers"):
Services Billed by Deloitte Entities
| January 31, 2013A,B | January 31, 2012A,B |
Audit-Related Fees | $910,000 | $612,000 |
Tax Fees | $- | $- |
All Other Fees | $735,000 | $635,000 |
A Amounts may reflect rounding.
B May include amounts billed prior to the Fidelity Advisor Series Equity-Income Fund and Fidelity Series Equity-Income Fund's commencement of operations.
Services Billed by PwC
| January 31, 2013A,B | January 31, 2012A,B |
Audit-Related Fees | $4,755,000 | $3,793,000 |
Tax Fees | $- | $- |
All Other Fees | $- | $- |
A Amounts may reflect rounding.
B May include amounts billed prior to the Fidelity Advisor Series Stock Selector Large Cap Value Fund and Fidelity Series Stock Selector Large Cap Value Fund's commencement of operations.
"Audit-Related Fees" represent fees billed for assurance and related services that are reasonably related to the performance of the fund audit or the review of the fund's financial statements and that are not reported under Audit Fees.
"Tax Fees" represent fees billed for tax compliance, tax advice or tax planning that relate directly to the operations and financial reporting of the fund.
"All Other Fees" represent fees billed for services provided to the fund or Fund Service Provider, a significant portion of which are assurance related, that relate directly to the operations and financial reporting of the fund, excluding those services that are reported under Audit Fees, Audit-Related Fees or Tax Fees.
Assurance services must be performed by an independent public accountant.
* * *
The aggregate non-audit fees billed by PwC and Deloitte Entities for services rendered to the Funds, FMR (not including any sub-adviser whose role is primarily portfolio management and is subcontracted with or overseen by another investment adviser), and any Fund Service Provider for each of the last two fiscal years of the Funds are as follows:
Billed By | January 31, 2013 A,B | January 31, 2012 A,B |
PwC | $5,595,000 | $5,105,000 |
Deloitte Entities | $1,695,000 | $1,355,000 |
A Amounts may reflect rounding.
B May include amounts billed prior to the Fidelity Advisor Series Equity-Income Fund and Fidelity Series Equity-Income Fund's commencement of operations and may include amounts billed prior to the Fidelity Advisor Series Stock Selector Large Cap Value Fund and Fidelity Series Stock Selector Large Cap Value Fund's commencement of operations.
The trust's Audit Committee has considered non-audit services that were not pre-approved that were provided by PwC and Deloitte Entities to Fund Service Providers to be compatible with maintaining the independence of PwC and Deloitte Entities in their audits of the Funds, taking into account representations from PwC and Deloitte Entities, in accordance with Public Company Accounting Oversight Board rules, regarding their independence from the Funds and their related entities and FMR's review of the appropriateness and permissibility under applicable law of such non-audit services prior to their provision to the Fund Service Providers.
Audit Committee Pre-Approval Policies and Procedures
The trust's Audit Committee must pre-approve all audit and non-audit services provided by a fund's independent registered public accounting firm relating to the operations or financial reporting of the fund. Prior to the commencement of any audit or non-audit services to a fund, the Audit Committee reviews the services to determine whether they are appropriate and permissible under applicable law.
The Audit Committee has adopted policies and procedures to, among other purposes, provide a framework for the Committee's consideration of non-audit services by the audit firms that audit the Fidelity funds. The policies and procedures require that any non-audit service provided by a fund audit firm to a Fidelity fund and any non-audit service provided by a fund auditor to a Fund Service Provider that relates directly to the operations and financial reporting of a Fidelity fund ("Covered Service") are subject to approval by the Audit Committee before such service is provided.
All Covered Services must be approved in advance of provision of the service either: (i) by formal resolution of the Audit Committee, or (ii) by oral or written approval of the service by the Chair of the Audit Committee (or if the Chair is unavailable, such other member of the Audit Committee as may be designated by the Chair to act in the Chair's absence). The approval contemplated by (ii) above is permitted where the Treasurer determines that action on such an engagement is necessary before the next meeting of the Audit Committee.
Non-audit services provided by a fund audit firm to a Fund Service Provider that do not relate directly to the operations and financial reporting of a Fidelity fund are reported to the Audit Committee on a periodic basis.
Non-Audit Services Approved Pursuant to Rule 2-01(c)(7)(i)(C) and (ii) of Regulation S-X ("De Minimis Exception")
There were no non-audit services approved or required to be approved by the Audit Committee pursuant to the De Minimis Exception during the Funds' last two fiscal years relating to services provided to (i) the Funds or (ii) any Fund Service Provider that relate directly to the operations and financial reporting of the Funds.
Item 5. Audit Committee of Listed Registrants
Not applicable.
Item 6. Investments
(a) Not applicable.
(b) Not applicable
Item 7. Disclosure of Proxy Voting Policies and Procedures for Closed-End Management Investment Companies
Not applicable.
Item 8. Portfolio Managers of Closed-End Management Investment Companies
Not applicable.
Item 9. Purchase of Equity Securities by Closed-End Management Investment Company and Affiliated Purchasers
Not applicable.
Item 10. Submission of Matters to a Vote of Security Holders
There were no material changes to the procedures by which shareholders may recommend nominees to the trust's Board of Trustees.
Item 11. Controls and Procedures
(a)(i) The President and Treasurer and the Chief Financial Officer have concluded that the trust's disclosure controls and procedures (as defined in Rule 30a-3(c) under the Investment Company Act) provide reasonable assurances that material information relating to the trust is made known to them by the appropriate persons, based on their evaluation of these controls and procedures as of a date within 90 days of the filing date of this report.
(a)(ii) There was no change in the trust's internal control over financial reporting (as defined in Rule 30a-3(d) under the Investment Company Act) that occurred during the second fiscal quarter of the period covered by this report that has materially affected, or is reasonably likely to materially affect, the trust's internal control over financial reporting.
Item 12. Exhibits
(a) | (1) | Code of Ethics pursuant to Item 2 of Form N-CSR is filed and attached hereto as EX-99.CODE ETH. |
(a) | (2) | Certification pursuant to Rule 30a-2(a) under the Investment Company Act of 1940 (17 CFR 270.30a-2(a)) is filed and attached hereto as Exhibit 99.CERT. |
(a) | (3) | Not applicable. |
(b) | | Certification pursuant to Rule 30a-2(b) under the Investment Company Act of 1940 (17 CFR 270.30a-2(b)) is furnished and attached hereto as Exhibit 99.906CERT. |
SIGNATURES
Pursuant to the requirements of the Securities Exchange Act of 1934 and the Investment Company Act of 1940, the registrant has duly caused this report to be signed on its behalf by the undersigned, thereunto duly authorized.
Fidelity Devonshire Trust
By: | /s/Kenneth B. Robins |
| Kenneth B. Robins |
| President and Treasurer |
| |
Date: | March 27, 2013 |
Pursuant to the requirements of the Securities Exchange Act of 1934 and the Investment Company Act of 1940, this report has been signed below by the following persons on behalf of the registrant and in the capacities and on the dates indicated.
By: | /s/Kenneth B. Robins |
| Kenneth B. Robins |
| President and Treasurer |
| |
Date: | March 27, 2013 |
By: | /s/Christine Reynolds |
| Christine Reynolds |
| Chief Financial Officer |
| |
Date: | March 27, 2013 |