UNITED STATES
SECURITIES AND EXCHANGE COMMISSION
Washington, D.C. 20549
FORM N-CSR
CERTIFIED SHAREHOLDER REPORT OF REGISTERED
MANAGEMENT INVESTMENT COMPANIES
Investment Company Act file number 811-1352
Fidelity Devonshire Trust
(Exact name of registrant as specified in charter)
245 Summer St., Boston, Massachusetts 02210
(Address of principal executive offices) (Zip code)
Marc Bryant, Secretary
245 Summer St.
Boston, Massachusetts 02210
(Name and address of agent for service)
Registrant's telephone number, including area code:
617-563-7000
| |
Date of fiscal year end: | January 31 |
| |
Date of reporting period: | January 31, 2017 |
Item 1.
Reports to Stockholders
Fidelity® Equity-Income Fund
Annual Report January 31, 2017 |
 |
Contents
To view a fund's proxy voting guidelines and proxy voting record for the 12-month period ended June 30, visit http://www.fidelity.com/proxyvotingresults or visit the Securities and Exchange Commission's (SEC) web site at http://www.sec.gov.
You may also call 1-800-544-8544 to request a free copy of the proxy voting guidelines.
Standard & Poor's, S&P and S&P 500 are registered service marks of The McGraw-Hill Companies, Inc. and have been licensed for use by Fidelity Distributors Corporation.
Other third-party marks appearing herein are the property of their respective owners.
All other marks appearing herein are registered or unregistered trademarks or service marks of FMR LLC or an affiliated company. © 2017 FMR LLC. All rights reserved.
This report and the financial statements contained herein are submitted for the general information of the shareholders of the Fund. This report is not authorized for distribution to prospective investors in the Fund unless preceded or accompanied by an effective prospectus.
A fund files its complete schedule of portfolio holdings with the SEC for the first and third quarters of each fiscal year on Form N-Q. Forms N-Q are available on the SEC’s web site at http://www.sec.gov. A fund's Forms N-Q may be reviewed and copied at the SEC’s Public Reference Room in Washington, DC. Information regarding the operation of the SEC's Public Reference Room may be obtained by calling 1-800-SEC-0330.
For a complete list of a fund's portfolio holdings, view the most recent holdings listing, semiannual report, or annual report on Fidelity's web site at http://www.fidelity.com, http://www.institutional.fidelity.com, or http://www.401k.com, as applicable.
NOT FDIC INSURED •MAY LOSE VALUE •NO BANK GUARANTEE
Neither the Fund nor Fidelity Distributors Corporation is a bank.
Performance: The Bottom Line
Average annual total return reflects the change in the value of an investment, assuming reinvestment of distributions from dividend income and capital gains (the profits earned upon the sale of securities that have grown in value, if any) and assuming a constant rate of performance each year. The hypothetical investment and the average annual total returns do not reflect the deduction of taxes that a shareholder would pay on fund distributions or the redemption of fund shares. During periods of reimbursement by Fidelity, a fund’s total return will be greater than it would be had the reimbursement not occurred. How a fund did yesterday is no guarantee of how it will do tomorrow.
Average Annual Total Returns
| For the periods ended January 31, 2017 | Past 1 year | Past 5 years | Past 10 years |
| Fidelity® Equity-Income Fund | 24.42% | 12.39% | 4.42% |
$10,000 Over 10 Years
Let's say hypothetically that $10,000 was invested in Fidelity® Equity-Income Fund, a class of the fund, on January 31, 2007.
The chart shows how the value of your investment would have changed, and also shows how the Russell 3000® Value Index performed over the same period.
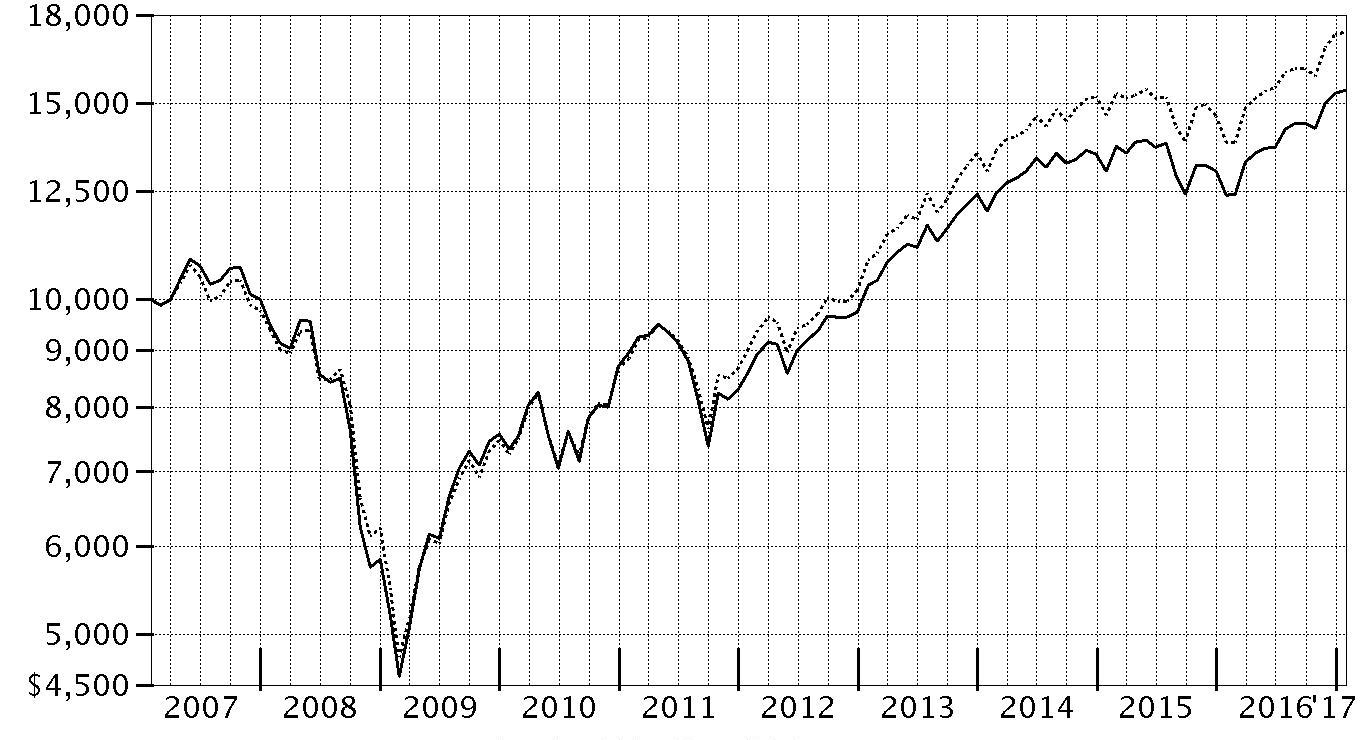
| Period Ending Values |
| $15,414 | Fidelity® Equity-Income Fund |
| $17,386 | Russell 3000® Value Index |
Management's Discussion of Fund Performance
Market Recap: The U.S. equity bellwether S&P 500
® index posted a 20.04% gain for the year ending January 31, 2017, rising sharply in the period’s final months on renewed optimism for economic growth. The beginning of the period saw improving investor sentiment amid U.S. job gains, a rally in energy and other stimuli that helped keep the seven-year bull uptrend intact. Markets tumbled briefly following the U.K.’s June 23 vote to exit the European Union (Brexit) – then recovered quickly and settled into a flattish stretch until the November 8 U.S. presidential election. Stocks then broke out in response to Donald Trump’s surprise victory, surging to a series of new all-time highs on expectations for reflation and fiscal stimulus. For the year, industrials (+28%), energy (+27%) and materials (+37%) all did well, the latter two driven by a cyclical rebound in commodity prices. Financials (+35%) also shined, riding an uptick in bond yields and the strong rally in banks (+41%), especially post-election. Information technology rose about 25%, despite cooling off in the fourth quarter of 2016. Conversely, real estate (+8%) lagged on the prospect for rising interest rates. An improved backdrop for riskier assets curbed dividend-rich telecommunication services (+13%), utilities (+12%) and consumer staples (+6%). Health care (+8%) underperformed amid an uncertain political and regulatory outlook.
Comments from Portfolio Manager James Morrow: For the year, the fund’s share classes gained roughly 24% to 25%, nearly keeping pace with the 25.76% advance of the benchmark Russell 3000
® Value Index. Relative to the benchmark, the fund was hurt by a higher-than-normal amount of cash. This reflected my caution about market volatility leading up to the election, which did not come to pass. Weak stock selection in health care also detracted, especially an out-of-benchmark stake in Israeli drug manufacturer Teva Pharmaceutical Industries. Teva’s multiple challenges this period included overpaying to acquire a competitor, falling earnings and unfavorable patent decisions. Another drug manufacturer that detracted from relative performance was GlaxoSmithKline, an out-of-benchmark stock hurt mostly by a weaker British pound. Elsewhere, the fund’s biggest individual detractor was CVS, a retail drug store chain that reported lighter-than-expected revenue in November. On the positive side, security selection in the energy sector helped performance – especially energy transportation companies Williams Partners, Energy Transfer Equity and Williams Companies, parent of Williams Partners and the only one of the three in the benchmark. Stock picking in financials, especially banks, also helped. JPMorgan Chase, the fund’s largest holding, was a notable contributor.
The views expressed above reflect those of the portfolio manager(s) only through the end of the period as stated on the cover of this report and do not necessarily represent the views of Fidelity or any other person in the Fidelity organization. Any such views are subject to change at any time based upon market or other conditions and Fidelity disclaims any responsibility to update such views. These views may not be relied on as investment advice and, because investment decisions for a Fidelity fund are based on numerous factors, may not be relied on as an indication of trading intent on behalf of any Fidelity fund.
Investment Summary (Unaudited)
Top Ten Stocks as of January 31, 2017
| | % of fund's net assets | % of fund's net assets 6 months ago |
| JPMorgan Chase & Co.(a) | 4.3 | 3.7 |
| Cisco Systems, Inc. | 3.3 | 2.6 |
| Procter & Gamble Co. | 2.8 | 2.5 |
| Johnson & Johnson | 2.6 | 2.8 |
| General Electric Co.(a) | 2.2 | 2.8 |
| Comcast Corp. Class A(a) | 2.1 | 1.0 |
| Verizon Communications, Inc. | 2.1 | 2.1 |
| Chubb Ltd. | 2.0 | 1.5 |
| The Blackstone Group LP | 1.9 | 1.5 |
| Exelon Corp. | 1.8 | 1.7 |
| | 25.1 | |
(a) Security or a portion of the security is pledged as collateral for call options written.
Top Five Market Sectors as of January 31, 2017
| | % of fund's net assets | % of fund's net assets 6 months ago |
| Financials | 24.7 | 23.8 |
| Energy | 10.9 | 11.8 |
| Information Technology | 9.7 | 11.3 |
| Health Care | 9.6 | 10.2 |
| Industrials | 9.5 | 10.9 |
Prior period industry classifications reflect the categories in place as of the date indicated and have not been adjusted to reflect current industry classifications.
Asset Allocation (% of fund's net assets)
| As of January 31, 2017*,** |
| | Stocks | 94.5% |
| | Convertible Securities | 0.4% |
| | Other Investments | 0.2% |
| | Short-Term Investments and Net Other Assets (Liabilities) | 4.9% |

* Foreign investments - 13.5%
** Written options - (0.1)%
| As of July 31, 2016*,** |
| | Stocks | 92.9% |
| | Bonds | 0.1% |
| | Convertible Securities | 0.6% |
| | Short-Term Investments and Net Other Assets (Liabilities) | 6.4% |

* Foreign investments - 12.1%
** Written options - (0.1)%
Investments January 31, 2017
Showing Percentage of Net Assets
| Common Stocks - 94.5% | | | |
| | | Shares | Value (000s) |
| CONSUMER DISCRETIONARY - 9.3% | | | |
| Auto Components - 0.2% | | | |
| Delphi Automotive PLC | | 240,400 | $16,842 |
| Automobiles - 1.9% | | | |
| Fiat Chrysler Automobiles NV | | 372,400 | 4,093 |
| Fiat Chrysler Automobiles NV | | 3,180,000 | 34,671 |
| General Motors Co. | | 3,312,900 | 121,285 |
| | | | 160,049 |
| Hotels, Restaurants & Leisure - 1.0% | | | |
| Dunkin' Brands Group, Inc. | | 1,261,600 | 65,439 |
| Whitbread PLC | | 381,261 | 18,825 |
| | | | 84,264 |
| Household Durables - 0.6% | | | |
| M.D.C. Holdings, Inc. | | 1,093,580 | 29,570 |
| Tupperware Brands Corp. | | 392,700 | 23,703 |
| | | | 53,273 |
| Leisure Products - 0.5% | | | |
| Mattel, Inc. | | 930,600 | 24,391 |
| Polaris Industries, Inc. (a) | | 242,600 | 20,395 |
| | | | 44,786 |
| Media - 3.5% | | | |
| Comcast Corp. Class A (b) | | 2,347,294 | 177,033 |
| Daiichikosho Co. Ltd. | | 736,000 | 29,235 |
| ITV PLC | | 5,871,300 | 15,009 |
| The Walt Disney Co. | | 239,900 | 26,545 |
| Time Warner, Inc. | | 451,600 | 43,737 |
| | | | 291,559 |
| Multiline Retail - 1.2% | | | |
| Kohl's Corp. | | 643,724 | 25,640 |
| Macy's, Inc. | | 949,200 | 28,039 |
| Target Corp. | | 735,009 | 47,393 |
| | | | 101,072 |
| Specialty Retail - 0.4% | | | |
| Bed Bath & Beyond, Inc. | | 90,600 | 3,656 |
| Foot Locker, Inc. | | 179,100 | 12,276 |
| GNC Holdings, Inc. | | 546,543 | 4,848 |
| Lewis Group Ltd. | | 2,117,300 | 6,419 |
| Stage Stores, Inc. (a) | | 890,500 | 2,493 |
| Williams-Sonoma, Inc. (a) | | 154,700 | 7,458 |
| | | | 37,150 |
|
| TOTAL CONSUMER DISCRETIONARY | | | 788,995 |
|
| CONSUMER STAPLES - 9.1% | | | |
| Beverages - 0.8% | | | |
| Molson Coors Brewing Co. Class B | | 227,295 | 21,939 |
| The Coca-Cola Co. | | 1,082,500 | 45,000 |
| | | | 66,939 |
| Food & Staples Retailing - 3.8% | | | |
| CVS Health Corp. | | 1,288,100 | 101,515 |
| Kroger Co. | | 282,300 | 9,587 |
| Rami Levi Chain Stores Hashikma Marketing 2006 Ltd. | | 189,404 | 7,698 |
| Wal-Mart Stores, Inc. | | 1,385,191 | 92,448 |
| Walgreens Boots Alliance, Inc. | | 1,082,020 | 88,661 |
| Whole Foods Market, Inc. | | 649,800 | 19,637 |
| | | | 319,546 |
| Food Products - 1.0% | | | |
| B&G Foods, Inc. Class A | | 793,367 | 35,186 |
| Hilton Food Group PLC | | 1,240,932 | 10,420 |
| Morinaga & Co. Ltd. | | 198,500 | 8,579 |
| The Hain Celestial Group, Inc. (c) | | 159,200 | 6,298 |
| The Hershey Co. (b) | | 190,600 | 20,103 |
| The J.M. Smucker Co. | | 64,000 | 8,694 |
| | | | 89,280 |
| Household Products - 3.1% | | | |
| Kimberly-Clark Corp. | | 209,200 | 25,340 |
| Procter & Gamble Co. | | 2,691,997 | 235,819 |
| | | | 261,159 |
| Personal Products - 0.2% | | | |
| Unilever NV (NY Reg.) | | 431,100 | 17,524 |
| Tobacco - 0.2% | | | |
| Reynolds American, Inc. | | 251,700 | 15,135 |
|
| TOTAL CONSUMER STAPLES | | | 769,583 |
|
| ENERGY - 10.6% | | | |
| Energy Equipment & Services - 1.0% | | | |
| Baker Hughes, Inc. (b) | | 391,200 | 24,677 |
| Halliburton Co. | | 454,300 | 25,700 |
| Oceaneering International, Inc. | | 115,400 | 3,214 |
| Schlumberger Ltd. | | 349,900 | 29,290 |
| | | | 82,881 |
| Oil, Gas & Consumable Fuels - 9.6% | | | |
| Anadarko Petroleum Corp. | | 598,432 | 41,609 |
| Apache Corp. | | 606,801 | 36,299 |
| Chevron Corp. (b) | | 992,472 | 110,512 |
| ConocoPhillips Co. | | 2,391,100 | 116,590 |
| CONSOL Energy, Inc. | | 624,634 | 10,581 |
| Energy Transfer Equity LP | | 147,200 | 2,642 |
| EQT Midstream Partners LP | | 19,800 | 1,550 |
| Golar LNG Ltd. | | 271,100 | 7,011 |
| Imperial Oil Ltd. | | 386,300 | 12,700 |
| Kinder Morgan, Inc. | | 2,421,600 | 54,099 |
| Legacy Reserves LP (c) | | 1,845,900 | 4,338 |
| MPLX LP | | 832,811 | 31,522 |
| Suncor Energy, Inc. | | 3,294,700 | 102,190 |
| The Williams Companies, Inc. | | 5,110,743 | 147,394 |
| Williams Partners LP | | 3,396,369 | 139,387 |
| | | | 818,424 |
|
| TOTAL ENERGY | | | 901,305 |
|
| FINANCIALS - 24.7% | | | |
| Banks - 13.5% | | | |
| Bank of America Corp. (b) | | 6,081,900 | 137,694 |
| Comerica, Inc. (b) | | 737,372 | 49,795 |
| Huntington Bancshares, Inc. | | 658,168 | 8,905 |
| JPMorgan Chase & Co. | | 4,311,782 | 364,907 |
| KeyCorp (b) | | 2,920,716 | 52,485 |
| Lakeland Financial Corp. | | 357,600 | 15,885 |
| Lloyds Banking Group PLC | | 12,478,000 | 10,234 |
| M&T Bank Corp. (b) | | 836,578 | 136,002 |
| Prosperity Bancshares, Inc. | | 28,600 | 2,077 |
| Regions Financial Corp. (b) | | 3,747,200 | 53,997 |
| Standard Chartered PLC (United Kingdom) (c) | | 1,432,566 | 13,951 |
| SunTrust Banks, Inc. (b) | | 1,183,600 | 67,252 |
| U.S. Bancorp | | 1,876,322 | 98,788 |
| Wells Fargo & Co. | | 2,368,350 | 133,409 |
| | | | 1,145,381 |
| Capital Markets - 6.3% | | | |
| Apollo Global Management LLC Class A | | 280,300 | 5,954 |
| Ares Capital Corp. | | 1,156,574 | 19,546 |
| Ares Management LP | | 266,715 | 5,241 |
| AURELIUS AG | | 258,470 | 16,281 |
| KKR & Co. LP | | 6,632,365 | 115,138 |
| Morgan Stanley (b) | | 1,671,131 | 71,006 |
| S&P Global, Inc. | | 127,300 | 15,299 |
| State Street Corp. | | 1,503,699 | 114,582 |
| The Blackstone Group LP | | 5,278,032 | 161,666 |
| TPG Specialty Lending, Inc. | | 372,293 | 6,802 |
| Virtu Financial, Inc. Class A | | 245,800 | 4,314 |
| | | | 535,829 |
| Consumer Finance - 0.2% | | | |
| Capital One Financial Corp. | | 191,600 | 16,744 |
| Insurance - 4.3% | | | |
| American International Group, Inc. | | 62,100 | 3,991 |
| Chubb Ltd. | | 1,300,000 | 170,937 |
| Marsh & McLennan Companies, Inc. (b) | | 325,700 | 22,154 |
| MetLife, Inc. | | 2,108,738 | 114,736 |
| Prudential Financial, Inc. | | 520,577 | 54,718 |
| | | | 366,536 |
| Mortgage Real Estate Investment Trusts - 0.2% | | | |
| Agnc Investment Corp. | | 214,063 | 3,997 |
| Two Harbors Investment Corp. | | 1,041,178 | 9,131 |
| | | | 13,128 |
| Thrifts & Mortgage Finance - 0.2% | | | |
| Radian Group, Inc. | | 844,727 | 15,543 |
|
| TOTAL FINANCIALS | | | 2,093,161 |
|
| HEALTH CARE - 9.5% | | | |
| Biotechnology - 1.3% | | | |
| Amgen, Inc. | | 364,500 | 57,110 |
| Gilead Sciences, Inc. | | 723,200 | 52,396 |
| | | | 109,506 |
| Health Care Equipment & Supplies - 2.1% | | | |
| Dentsply Sirona, Inc. | | 365,400 | 20,718 |
| Hoya Corp. | | 469,200 | 20,453 |
| Medtronic PLC | | 1,822,656 | 138,558 |
| | | | 179,729 |
| Health Care Providers & Services - 0.2% | | | |
| AmerisourceBergen Corp. | | 43,500 | 3,797 |
| Anthem, Inc. | | 29,900 | 4,609 |
| HealthSouth Corp. | | 3 | 0 |
| McKesson Corp. | | 48,500 | 6,749 |
| | | | 15,155 |
| Pharmaceuticals - 5.9% | | | |
| Astellas Pharma, Inc. | | 1,918,500 | 25,750 |
| Bristol-Myers Squibb Co. | | 375,000 | 18,435 |
| GlaxoSmithKline PLC | | 4,336,000 | 83,793 |
| Johnson & Johnson | | 1,991,248 | 225,509 |
| Merck & Co., Inc. | | 803,400 | 49,803 |
| Pfizer, Inc. | | 879,179 | 27,896 |
| Sanofi SA | | 291,332 | 23,416 |
| Teva Pharmaceutical Industries Ltd. sponsored ADR | | 1,526,000 | 51,014 |
| | | | 505,616 |
|
| TOTAL HEALTH CARE | | | 810,006 |
|
| INDUSTRIALS - 9.5% | | | |
| Aerospace & Defense - 3.1% | | | |
| General Dynamics Corp. (b) | | 406,500 | 73,609 |
| Raytheon Co. (b) | | 258,900 | 37,323 |
| The Boeing Co. | | 158,600 | 25,918 |
| United Technologies Corp. | | 1,124,420 | 123,315 |
| | | | 260,165 |
| Air Freight & Logistics - 2.0% | | | |
| C.H. Robinson Worldwide, Inc. | | 125,556 | 9,550 |
| PostNL NV (c) | | 6,587,500 | 28,829 |
| United Parcel Service, Inc. Class B | | 1,201,773 | 131,149 |
| | | | 169,528 |
| Airlines - 0.3% | | | |
| Allegiant Travel Co. | | 18,200 | 3,130 |
| Copa Holdings SA Class A | | 221,400 | 21,584 |
| | | | 24,714 |
| Commercial Services & Supplies - 0.7% | | | |
| KAR Auction Services, Inc. | | 1,100,200 | 50,114 |
| Mears Group PLC | | 198,400 | 1,265 |
| Waste Connection, Inc. (Canada) | | 116,297 | 9,327 |
| | | | 60,706 |
| Electrical Equipment - 0.8% | | | |
| AMETEK, Inc. (b) | | 162,200 | 8,288 |
| Eaton Corp. PLC | | 622,200 | 44,039 |
| Regal Beloit Corp. | | 189,800 | 13,779 |
| | | | 66,106 |
| Industrial Conglomerates - 2.5% | | | |
| General Electric Co. (b) | | 6,245,455 | 185,490 |
| Roper Technologies, Inc. | | 138,000 | 26,475 |
| | | | 211,965 |
| Machinery - 0.1% | | | |
| Allison Transmission Holdings, Inc. | | 243,700 | 8,525 |
|
| TOTAL INDUSTRIALS | | | 801,709 |
|
| INFORMATION TECHNOLOGY - 9.6% | | | |
| Communications Equipment - 3.3% | | | |
| Cisco Systems, Inc. | | 8,965,686 | 275,426 |
| Electronic Equipment & Components - 0.7% | | | |
| Dell Technologies, Inc. (c) | | 475,603 | 29,958 |
| TE Connectivity Ltd. | | 388,832 | 28,910 |
| | | | 58,868 |
| IT Services - 1.5% | | | |
| First Data Corp. Class A (c) | | 4,371,136 | 67,053 |
| Paychex, Inc. (b) | | 631,757 | 38,089 |
| Sabre Corp. | | 828,600 | 20,301 |
| | | | 125,443 |
| Semiconductors & Semiconductor Equipment - 1.5% | | | |
| KLA-Tencor Corp. | | 50,400 | 4,290 |
| Maxim Integrated Products, Inc. | | 709,900 | 31,576 |
| Qualcomm, Inc. | | 1,644,916 | 87,888 |
| | | | 123,754 |
| Software - 1.5% | | | |
| Micro Focus International PLC | | 1,788,200 | 48,253 |
| Microsoft Corp. | | 1,174,116 | 75,907 |
| SS&C Technologies Holdings, Inc. | | 207,000 | 6,651 |
| | | | 130,811 |
| Technology Hardware, Storage & Peripherals - 1.1% | | | |
| Apple, Inc. (b) | | 718,800 | 87,226 |
| Inventec Corp. | | 13,096,000 | 9,867 |
| | | | 97,093 |
|
| TOTAL INFORMATION TECHNOLOGY | | | 811,395 |
|
| MATERIALS - 1.8% | | | |
| Chemicals - 1.3% | | | |
| LyondellBasell Industries NV Class A | | 382,100 | 35,638 |
| Potash Corp. of Saskatchewan, Inc. | | 922,200 | 17,158 |
| The Dow Chemical Co. | | 924,700 | 55,140 |
| | | | 107,936 |
| Containers & Packaging - 0.5% | | | |
| WestRock Co. | | 781,900 | 41,722 |
| Metals & Mining - 0.0% | | | |
| Walter Energy Guc Trust | | 67 | 18 |
|
| TOTAL MATERIALS | | | 149,676 |
|
| REAL ESTATE - 2.0% | | | |
| Equity Real Estate Investment Trusts (REITs) - 2.0% | | | |
| American Tower Corp. | | 151,100 | 15,639 |
| Cousins Properties, Inc. | | 1,589,400 | 13,510 |
| Crown Castle International Corp. | | 408,500 | 35,879 |
| Duke Realty LP | | 709,700 | 17,267 |
| First Potomac Realty Trust | | 1,743,625 | 17,855 |
| Piedmont Office Realty Trust, Inc. Class A | | 970,000 | 21,068 |
| Public Storage | | 128,700 | 27,671 |
| Sabra Health Care REIT, Inc. | | 256,800 | 6,523 |
| Ventas, Inc. | | 236,203 | 14,567 |
| | | | 169,979 |
| TELECOMMUNICATION SERVICES - 3.7% | | | |
| Diversified Telecommunication Services - 3.6% | | | |
| AT&T, Inc. | | 2,963,089 | 124,924 |
| Verizon Communications, Inc. | | 3,599,960 | 176,434 |
| | | | 301,358 |
| Wireless Telecommunication Services - 0.1% | | | |
| KDDI Corp. | | 354,800 | 9,533 |
|
| TOTAL TELECOMMUNICATION SERVICES | | | 310,891 |
|
| UTILITIES - 4.7% | | | |
| Electric Utilities - 4.2% | | | |
| American Electric Power Co., Inc. | | 396,082 | 25,373 |
| Duke Energy Corp. | | 310,300 | 24,371 |
| Entergy Corp. | | 595,000 | 42,626 |
| Exelon Corp. | | 4,243,800 | 152,268 |
| PPL Corp. | | 1,563,700 | 54,479 |
| Southern Co. | | 818,777 | 40,472 |
| Xcel Energy, Inc. | | 413,500 | 17,086 |
| | | | 356,675 |
| Multi-Utilities - 0.5% | | | |
| CenterPoint Energy, Inc. | | 1,056,800 | 27,699 |
| Public Service Enterprise Group, Inc. | | 387,100 | 17,129 |
| | | | 44,828 |
|
| TOTAL UTILITIES | | | 401,503 |
|
| TOTAL COMMON STOCKS | | | |
| (Cost $6,521,714) | | | 8,008,203 |
|
| Convertible Preferred Stocks - 0.2% | | | |
| CONSUMER STAPLES - 0.0% | | | |
| Food Products - 0.0% | | | |
| Post Holdings, Inc. 5.25% (c) | | 7,700 | 1,117 |
| ENERGY - 0.0% | | | |
| Oil, Gas & Consumable Fuels - 0.0% | | | |
| Southwestern Energy Co. Series B 6.25% | | 98,800 | 2,186 |
| FINANCIALS - 0.0% | | | |
| Banks - 0.0% | | | |
| Wells Fargo & Co. 7.50% | | 2,300 | 2,762 |
| HEALTH CARE - 0.1% | | | |
| Health Care Providers & Services - 0.0% | | | |
| Envision Healthcare Corp. Series A 5.25% | | 10,400 | 1,307 |
| Pharmaceuticals - 0.1% | | | |
| Allergan PLC 5.50% | | 2,928 | 2,317 |
|
| TOTAL HEALTH CARE | | | 3,624 |
|
| TELECOMMUNICATION SERVICES - 0.0% | | | |
| Wireless Telecommunication Services - 0.0% | | | |
| T-Mobile U.S., Inc. Series A 5.50% | | 16,700 | 1,706 |
| UTILITIES - 0.1% | | | |
| Multi-Utilities - 0.1% | | | |
| CenterPoint Energy, Inc. 2.00% ZENS | | 41,400 | 2,880 |
| TOTAL CONVERTIBLE PREFERRED STOCKS | | | |
| (Cost $13,090) | | | 14,275 |
| | | Principal Amount (000s) | Value (000s) |
|
| Corporate Bonds - 0.2% | | | |
| Convertible Bonds - 0.2% | | | |
| CONSUMER DISCRETIONARY - 0.0% | | | |
| Media - 0.0% | | | |
| DISH Network Corp. 3.375% 8/15/26 (d) | | 2,980 | 3,481 |
| ENERGY - 0.1% | | | |
| Energy Equipment & Services - 0.0% | | | |
| Weatherford International Ltd. 5.875% 7/1/21 | | 1,200 | 1,343 |
| Oil, Gas & Consumable Fuels - 0.1% | | | |
| Amyris, Inc. 9.5% 4/15/19 pay-in-kind | | 2,626 | 1,402 |
| Chesapeake Energy Corp. 5.5% 9/15/26 (d) | | 1,630 | 1,737 |
| Scorpio Tankers, Inc. 2.375% 7/1/19 (d) | | 2,330 | 1,959 |
| | | | 5,098 |
| TOTAL ENERGY | | | 6,441 |
| INFORMATION TECHNOLOGY - 0.1% | | | |
| Communications Equipment - 0.0% | | | |
| InterDigital, Inc. 1.5% 3/1/20 | | 1,350 | 1,862 |
| Internet Software & Services - 0.1% | | | |
| Twitter, Inc. 1% 9/15/21 | | 4,955 | 4,518 |
| TOTAL INFORMATION TECHNOLOGY | | | 6,380 |
|
| TOTAL CONVERTIBLE BONDS | | | 16,302 |
|
| Nonconvertible Bonds - 0.0% | | | |
| FINANCIALS - 0.0% | | | |
| Thrifts & Mortgage Finance - 0.0% | | | |
| Prime Securities Services Borrower LLC/Prime Finance, Inc. 9.25% 5/15/23 (d) | | 2,585 | 2,801 |
| TOTAL CORPORATE BONDS | | | |
| (Cost $18,137) | | | 19,103 |
|
| Preferred Securities - 0.0% | | | |
| INDUSTRIALS - 0.0% | | | |
| Industrial Conglomerates - 0.0% | | | |
General Electric Co. 5%
(e)(f) | | | |
| (Cost $4,636) | | $4,410 | $4,615 |
| | | Shares | Value (000s) |
|
| Other - 0.2% | | | |
| Energy - 0.2% | | | |
| Oil, Gas & Consumable Fuels - 0.2% | | | |
| Utica Shale Drilling Program (non-operating revenue interest) (g)(h) | | | |
| (Cost $15,119) | | 15,119,286 | 15,119 |
|
| Money Market Funds - 5.4% | | | |
| Fidelity Cash Central Fund, 0.62% (i) | | 426,357,512 | 426,443 |
| Fidelity Securities Lending Cash Central Fund 0.65% (i)(j) | | 28,288,357 | 28,294 |
| TOTAL MONEY MARKET FUNDS | | | |
| (Cost $454,678) | | | 454,737 |
| TOTAL INVESTMENT PORTFOLIO - 100.5% | | | |
| (Cost $7,027,374) | | | 8,516,052 |
| NET OTHER ASSETS (LIABILITIES) - (0.5)% | | | (39,205) |
| NET ASSETS - 100% | | | $8,476,847 |
| Written Options | | | | |
| | Expiration Date/Exercise Price | Number of Contracts | Premium (000s) | Value (000s) |
| Call Options | | | | |
| AMETEK, Inc. | 3/17/17 - $55.00 | 387 | $22 | $(14) |
| Apple, Inc. | 3/17/17 - $125.00 | 3,568 | 493 | (524) |
| AT&T, Inc. | 3/17/17 - $44.00 | 7,396 | 104 | (152) |
| Baker Hughes, Inc. | 4/21/17 - $67.50 | 959 | 112 | (103) |
| Bank of America Corp. | 3/17/17 - $25.00 | 15,200 | 259 | (182) |
| Chevron Corp. | 3/17/17 - $120.00 | 2,473 | 275 | (36) |
| Comcast Corp. Class A | 4/21/17 - $77.50 | 5,850 | 521 | (804) |
| Comerica, Inc. | 4/21/17 - $70.00 | 1,835 | 472 | (385) |
| Crown Castle International Corp. | 3/17/17 - $92.50 | 1,011 | 64 | (64) |
| General Dynamics Corp. | 5/19/17 - $185.00 | 1,012 | 335 | (546) |
| General Electric Co. | 4/21/17 - $32.00 | 15,593 | 281 | (249) |
| Halliburton Co. | 4/21/17 - $62.50 | 1,116 | 87 | (88) |
| JPMorgan Chase & Co. | 4/21/17 - $87.50 | 9,479 | 1,855 | (1,701) |
| KeyCorp | 3/17/17 - $20.00 | 7,293 | 66 | (62) |
| M&T Bank Corp. | 2/17/17 - $165.00 | 2,077 | 278 | (312) |
| Marsh & McLennan Companies, Inc. | 4/21/17 - $70.00 | 812 | 91 | (77) |
| MetLife, Inc. | 3/17/17 - $57.50 | 5,267 | 511 | (365) |
| Morgan Stanley | 4/21/17 - $45.00 | 4,168 | 438 | (423) |
| Paychex, Inc. | 3/17/17 - $62.50 | 1,573 | 115 | (75) |
| Prudential Financial, Inc. | 3/17/17 - $110.00 | 1,281 | 314 | (246) |
| Raytheon Co. | 5/19/17 - $155.00 | 640 | 163 | (102) |
| Regions Financial Corp. | 2/17/17 - $13.00 | 6,509 | 222 | (944) |
| Regions Financial Corp. | 5/19/17 - $16.00 | 9,367 | 300 | (295) |
| Schlumberger Ltd. | 3/17/17 - $92.50 | 867 | 14 | (8) |
| SunTrust Banks, Inc. | 4/21/17 - $60.00 | 2,952 | 420 | (339) |
| The Hershey Co. | 5/19/17 - $110.00 | 475 | 131 | (120) |
| TOTAL WRITTEN OPTIONS | | | $7,943 | $(8,216) |
Values shown as $0 may reflect amounts less than $500.
Legend
(a) Security or a portion of the security is on loan at period end.
(b) Security or a portion of the security is pledged as collateral for call options written. At period end, the value of securities pledged amounted to $367,898,000.
(c) Non-income producing
(d) Security exempt from registration under Rule 144A of the Securities Act of 1933. These securities may be resold in transactions exempt from registration, normally to qualified institutional buyers. At the end of the period, the value of these securities amounted to $9,978,000 or 0.1% of net assets.
(e) Security is perpetual in nature with no stated maturity date.
(f) Coupon rates for floating and adjustable rate securities reflect the rates in effect at period end.
(g) Investment is owned by a wholly-owned subsidiary (Subsidiary) that is treated as a corporation for U.S. tax purposes.
(h) Restricted securities - Investment in securities not registered under the Securities Act of 1933 (excluding 144A issues). At the end of the period, the value of restricted securities (excluding 144A issues) amounted to $15,119,000 or 0.2% of net assets.
(i) Affiliated fund that is generally available only to investment companies and other accounts managed by Fidelity Investments. The rate quoted is the annualized seven-day yield of the fund at period end. A complete unaudited listing of the fund's holdings as of its most recent quarter end is available upon request. In addition, each Fidelity Central Fund's financial statements, which are not covered by the Fund's Report of Independent Registered Public Accounting Firm, are available on the SEC's website or upon request.
(j) Investment made with cash collateral received from securities on loan.
Additional information on each restricted holding is as follows:
| Security | Acquisition Date | Acquisition Cost (000s) |
| Utica Shale Drilling Program (non-operating revenue interest) | 10/5/16 - 11/4/16 | $15,119 |
Affiliated Central Funds
Information regarding fiscal year to date income earned by the Fund from investments in Fidelity Central Funds is as follows:
| Fund | Income earned |
| | (Amounts in thousands) |
| Fidelity Cash Central Fund | $1,429 |
| Fidelity Securities Lending Cash Central Fund | 502 |
| Total | $1,931 |
Investment Valuation
The following is a summary of the inputs used, as of January 31, 2017, involving the Fund's assets and liabilities carried at fair value. The inputs or methodology used for valuing securities may not be an indication of the risk associated with investing in those securities. For more information on valuation inputs, and their aggregation into the levels used below, please refer to the Investment Valuation section in the accompanying Notes to Financial Statements.
| | Valuation Inputs at Reporting Date: |
| Description | Total | Level 1 | Level 2 | Level 3 |
| (Amounts in thousands) | | | | |
| Investments in Securities: | | | | |
| Equities: | | | | |
| Consumer Discretionary | $788,995 | $788,995 | $-- | $-- |
| Consumer Staples | 770,700 | 769,583 | 1,117 | -- |
| Energy | 903,491 | 903,491 | -- | -- |
| Financials | 2,095,923 | 2,085,689 | 10,234 | -- |
| Health Care | 813,630 | 680,671 | 132,959 | -- |
| Industrials | 801,709 | 801,709 | -- | -- |
| Information Technology | 811,395 | 811,395 | -- | -- |
| Materials | 149,676 | 149,658 | -- | 18 |
| Real Estate | 169,979 | 169,979 | -- | -- |
| Telecommunication Services | 312,597 | 303,064 | 9,533 | -- |
| Utilities | 404,383 | 401,503 | 2,880 | -- |
| Corporate Bonds | 19,103 | -- | 19,103 | -- |
| Preferred Securities | 4,615 | -- | 4,615 | -- |
| Other | 15,119 | | -- | 15,119 |
| Money Market Funds | 454,737 | 454,737 | -- | -- |
| Total Investments in Securities: | $8,516,052 | $8,320,474 | $180,441 | $15,137 |
| Derivative Instruments: | | | | |
| Liabilities | | | | |
| Written Options | $(8,216) | $(5,592) | $(2,624) | $-- |
| Total Liabilities | $(8,216) | $(5,592) | $(2,624) | $-- |
| Total Derivative Instruments: | $(8,216) | $(5,592) | $(2,624) | $-- |
The following is a summary of transfers between Level 1 and Level 2 for the period ended January 31, 2017. Transfers are assumed to have occurred at the beginning of the period, and are primarily attributable to the valuation techniques used for foreign equity securities, as discussed in the accompanying Notes to Financial Statements:
| Transfers | Total (000s) |
| (Amounts in thousands) | |
| Level 1 to Level 2 | $0 |
| Level 2 to Level 1 | $186,858 |
Value of Derivative Instruments
The following table is a summary of the Fund's value of derivative instruments by primary risk exposure as of January 31, 2017. For additional information on derivative instruments, please refer to the Derivative Instruments section in the accompanying Notes to Financial Statements.
| Primary Risk Exposure / Derivative Type | Value |
| | Asset | Liability |
| (Amounts in thousands) | | |
| Equity Risk | | |
| Written Options(a) | $0 | $(8,216) |
| Total Equity Risk | 0 | (8,216) |
| Total Value of Derivatives | $0 | $(8,216) |
(a) Gross value is presented in the Statement of Assets and Liabilities in the written options, at value line-item.
Other Information
Distribution of investments by country or territory of incorporation, as a percentage of Total Net Assets, is as follows (Unaudited):
| United States of America | 86.5% |
| United Kingdom | 2.3% |
| Switzerland | 2.3% |
| Ireland | 2.2% |
| Canada | 1.7% |
| Netherlands | 1.4% |
| Japan | 1.1% |
| Others (Individually Less Than 1%) | 2.5% |
| | 100.0% |
See accompanying notes which are an integral part of the financial statements.
Financial Statements
Statement of Assets and Liabilities
| Amounts in thousands (except per-share amounts) | | January 31, 2017 |
| Assets | | |
Investment in securities, at value (including securities loaned of $27,886) — See accompanying schedule:
Unaffiliated issuers (cost $6,572,696) | $8,061,315 | |
| Fidelity Central Funds (cost $454,678) | 454,737 | |
| Total Investments (cost $7,027,374) | | $8,516,052 |
| Receivable for investments sold | | 6,467 |
| Receivable for fund shares sold | | 4,757 |
| Dividends receivable | | 8,523 |
| Interest receivable | | 251 |
| Distributions receivable from Fidelity Central Funds | | 215 |
| Prepaid expenses | | 13 |
| Other receivables | | 1,081 |
| Total assets | | 8,537,359 |
| Liabilities | | |
| Payable for investments purchased | $459 | |
| Payable for fund shares redeemed | 18,266 | |
| Accrued management fee | 3,209 | |
| Written options, at value (premium received $7,943) | 8,216 | |
| Other affiliated payables | 1,052 | |
| Other payables and accrued expenses | 1,020 | |
| Collateral on Securities Loaned | 28,290 | |
| Total liabilities | | 60,512 |
| Net Assets | | $8,476,847 |
| Net Assets consist of: | | |
| Paid in capital | | $6,969,622 |
| Distributions in excess of net investment income | | (52,348) |
| Accumulated undistributed net realized gain (loss) on investments and foreign currency transactions | | 71,225 |
| Net unrealized appreciation (depreciation) on investments and assets and liabilities in foreign currencies | | 1,488,348 |
| Net Assets | | $8,476,847 |
| Equity-Income: | | |
| Net Asset Value, offering price and redemption price per share ($6,685,798 ÷ 115,758 shares) | | $57.76 |
| Class K: | | |
| Net Asset Value, offering price and redemption price per share ($1,791,049 ÷ 31,027 shares) | | $57.73 |
See accompanying notes which are an integral part of the financial statements.
Statement of Operations
| Amounts in thousands | | Year ended January 31, 2017 |
| Investment Income | | |
| Dividends | | $229,014 |
| Interest | | 1,479 |
| Income from Fidelity Central Funds | | 1,931 |
| Total income | | 232,424 |
| Expenses | | |
| Management fee | $35,936 | |
| Transfer agent fees | 10,726 | |
| Accounting and security lending fees | 1,214 | |
| Custodian fees and expenses | 153 | |
| Independent trustees' fees and expenses | 35 | |
| Appreciation in deferred trustee compensation account | 2 | |
| Registration fees | 159 | |
| Audit | 114 | |
| Legal | 26 | |
| Miscellaneous | 70 | |
| Total expenses before reductions | 48,435 | |
| Expense reductions | (292) | 48,143 |
| Net investment income (loss) | | 184,281 |
| Realized and Unrealized Gain (Loss) | | |
| Net realized gain (loss) on: | | |
| Investment securities: | | |
| Unaffiliated issuers | 128,235 | |
| Fidelity Central Funds | 5 | |
| Foreign currency transactions | (346) | |
| Written options | 12,878 | |
| Total net realized gain (loss) | | 140,772 |
Change in net unrealized appreciation (depreciation) on:
Investment securities | 1,413,409 | |
| Assets and liabilities in foreign currencies | 14 | |
| Written options | (1,373) | |
| Total change in net unrealized appreciation (depreciation) | | 1,412,050 |
| Net gain (loss) | | 1,552,822 |
| Net increase (decrease) in net assets resulting from operations | | $1,737,103 |
See accompanying notes which are an integral part of the financial statements.
Statement of Changes in Net Assets
| Amounts in thousands | Year ended January 31, 2017 | Year ended January 31, 2016 |
| Increase (Decrease) in Net Assets | | |
| Operations | | |
| Net investment income (loss) | $184,281 | $221,310 |
| Net realized gain (loss) | 140,772 | 508,669 |
| Change in net unrealized appreciation (depreciation) | 1,412,050 | (1,074,501) |
| Net increase (decrease) in net assets resulting from operations | 1,737,103 | (344,522) |
| Distributions to shareholders from net investment income | (204,416) | (262,218) |
| Distributions to shareholders from net realized gain | (163,868) | (674,726) |
| Total distributions | (368,284) | (936,944) |
| Share transactions - net increase (decrease) | (289,881) | (278,644) |
| Total increase (decrease) in net assets | 1,078,938 | (1,560,110) |
| Net Assets | | |
| Beginning of period | 7,397,909 | 8,958,019 |
| End of period | $8,476,847 | $7,397,909 |
| Other Information | | |
| Distributions in excess of net investment income end of period | $(52,348) | $(2,420) |
See accompanying notes which are an integral part of the financial statements.
Financial Highlights — Fidelity Equity-Income Fund
| Years ended January 31, | 2017 | 2016 | 2015 | 2014 | 2013 |
| Selected Per–Share Data | | | | | |
| Net asset value, beginning of period | $48.57 | $57.26 | $56.69 | $49.72 | $42.77 |
| Income from Investment Operations | | | | | |
| Net investment income (loss)A | 1.22 | 1.43 | 2.00B | 1.26 | 1.32 |
| Net realized and unrealized gain (loss) | 10.43 | (3.91)C | 2.87 | 6.99 | 6.95 |
| Total from investment operations | 11.65 | (2.48) | 4.87 | 8.25 | 8.27 |
| Distributions from net investment income | (1.36) | (1.71)D | (1.60) | (1.28) | (1.32) |
| Distributions from net realized gain | (1.10) | (4.51)D | (2.70) | – | – |
| Total distributions | (2.46) | (6.21)E | (4.30) | (1.28) | (1.32) |
| Net asset value, end of period | $57.76 | $48.57 | $57.26 | $56.69 | $49.72 |
| Total ReturnF | 24.42% | (4.89)%C | 8.53% | 16.72% | 19.63% |
| Ratios to Average Net AssetsG,H | | | | | |
| Expenses before reductions | .63% | .64% | .63% | .64% | .67% |
| Expenses net of fee waivers, if any | .63% | .64% | .63% | .64% | .67% |
| Expenses net of all reductions | .62% | .63% | .63% | .64% | .66% |
| Net investment income (loss) | 2.27% | 2.55% | 3.30%B | 2.30% | 2.89% |
| Supplemental Data | | | | | |
| Net assets, end of period (in millions) | $6,686 | $5,752 | $6,686 | $6,842 | $6,401 |
| Portfolio turnover rateI | 36% | 46%J | 40% | 43% | 43% |
A Calculated based on average shares outstanding during the period.
B Net Investment income per share reflects a large, non-recurring dividend which amounted to $.48 per share. Excluding this non-recurring dividend, the ratio of net investment income (loss) to average net assets would have been 2.51%.
C Net realized and unrealized gain (loss) per share reflects proceeds received from litigation which amounted to $.13 per share. Excluding these litigation proceeds, the total return would have been (5.12)%
D The amounts shown reflect certain reclassifications related to book to tax differences that were made in the year shown.
E Total distributions of $6.21 per share is comprised of distributions from net investment income of $1.709 and distributions from net realized gain of $4.505 per share.
F Total returns would have been lower if certain expenses had not been reduced during the applicable periods shown.
G Fees and expenses of any underlying Fidelity Central Funds are not included in the Fund's expense ratio. The Fund indirectly bears its proportionate share of the expenses of any underlying Fidelity Central Funds.
H Expense ratios reflect operating expenses of the class. Expenses before reductions do not reflect amounts reimbursed by the investment adviser or reductions from brokerage service arrangements or reductions from other expense offset arrangements and do not represent the amount paid by the class during periods when reimbursements or reductions occur. Expenses net of fee waivers reflect expenses after reimbursement by the investment adviser but prior to reductions from brokerage service arrangements or other expense offset arrangements. Expenses net of all reductions represent the net expenses paid by the class.
I Amount does not include the portfolio activity of any underlying Fidelity Central Funds.
J Portfolio turnover rate excludes securities received or delivered in-kind.
See accompanying notes which are an integral part of the financial statements.
Financial Highlights — Fidelity Equity-Income Fund Class K
| Years ended January 31, | 2017 | 2016 | 2015 | 2014 | 2013 |
| Selected Per–Share Data | | | | | |
| Net asset value, beginning of period | $48.55 | $57.25 | $56.67 | $49.70 | $42.76 |
| Income from Investment Operations | | | | | |
| Net investment income (loss)A | 1.28 | 1.50 | 2.07B | 1.33 | 1.38 |
| Net realized and unrealized gain (loss) | 10.42 | (3.92)C | 2.88 | 6.99 | 6.95 |
| Total from investment operations | 11.70 | (2.42) | 4.95 | 8.32 | 8.33 |
| Distributions from net investment income | (1.42) | (1.78)D | (1.67) | (1.35) | (1.39) |
| Distributions from net realized gain | (1.10) | (4.51)D | (2.70) | – | – |
| Total distributions | (2.52) | (6.28)E | (4.37) | (1.35) | (1.39) |
| Net asset value, end of period | $57.73 | $48.55 | $57.25 | $56.67 | $49.70 |
| Total ReturnF | 24.56% | (4.78)%C | 8.68% | 16.87% | 19.78% |
| Ratios to Average Net AssetsG,H | | | | | |
| Expenses before reductions | .52% | .52% | .52% | .52% | .53% |
| Expenses net of fee waivers, if any | .52% | .52% | .52% | .52% | .53% |
| Expenses net of all reductions | .51% | .51% | .51% | .52% | .52% |
| Net investment income (loss) | 2.39% | 2.67% | 3.41%B | 2.42% | 3.03% |
| Supplemental Data | | | | | |
| Net assets, end of period (in millions) | $1,791 | $1,646 | $2,272 | $2,480 | $2,276 |
| Portfolio turnover rateI | 36% | 46%J | 40% | 43% | 43% |
A Calculated based on average shares outstanding during the period.
B Net Investment income per share reflects a large, non-recurring dividend which amounted to $.48 per share. Excluding this non-recurring dividend, the ratio of net investment income (loss) to average net assets would have been 2.63%.
C Net realized and unrealized gain (loss) per share reflects proceeds received from litigation which amounted to $.13 per share. Excluding these litigation proceeds, the total return would have been (5.01)%
D The amounts shown reflect certain reclassifications related to book to tax differences that were made in the year shown.
E Total distributions of $6.28 per share is comprised of distributions from net investment income of $1.777 and distributions from net realized gain of $4.505 per share.
F Total returns would have been lower if certain expenses had not been reduced during the applicable periods shown.
G Fees and expenses of any underlying Fidelity Central Funds are not included in the Fund's expense ratio. The Fund indirectly bears its proportionate share of the expenses of any underlying Fidelity Central Funds.
H Expense ratios reflect operating expenses of the class. Expenses before reductions do not reflect amounts reimbursed by the investment adviser or reductions from brokerage service arrangements or reductions from other expense offset arrangements and do not represent the amount paid by the class during periods when reimbursements or reductions occur. Expenses net of fee waivers reflect expenses after reimbursement by the investment adviser but prior to reductions from brokerage service arrangements or other expense offset arrangements. Expenses net of all reductions represent the net expenses paid by the class.
I Amount does not include the portfolio activity of any underlying Fidelity Central Funds.
J Portfolio turnover rate excludes securities received or delivered in-kind.
See accompanying notes which are an integral part of the financial statements.
Notes to Financial Statements
For the period ended January 31, 2017
(Amounts in thousands except percentages)
1. Organization.
Fidelity Equity-Income Fund (the Fund) is a fund of Fidelity Devonshire Trust (the Trust) and is authorized to issue an unlimited number of shares. The Trust is registered under the Investment Company Act of 1940, as amended (the 1940 Act), as an open-end management investment company organized as a Massachusetts business trust. The Fund offers Equity Income and Class K shares, each of which has equal rights as to assets and voting privileges. Each class has exclusive voting rights with respect to matters that affect that class.
2. Investments in Fidelity Central Funds.
The Fund invests in Fidelity Central Funds, which are open-end investment companies generally available only to other investment companies and accounts managed by the investment adviser and its affiliates. The Fund's Schedule of Investments lists each of the Fidelity Central Funds held as of period end, if any, as an investment of the Fund, but does not include the underlying holdings of each Fidelity Central Fund. As an Investing Fund, the Fund indirectly bears its proportionate share of the expenses of the underlying Fidelity Central Funds.
The Money Market Central Funds seek preservation of capital and current income and are managed by Fidelity Investments Money Management, Inc. (FIMM), an affiliate of the investment adviser. Annualized expenses of the Money Market Central Funds as of their most recent shareholder report date are less than .005%.
A complete unaudited list of holdings for each Fidelity Central Fund is available upon request or at the Securities and Exchange Commission (the SEC) website at www.sec.gov. In addition, the financial statements of the Fidelity Central Funds, which are not covered by the Fund's Report of Independent Registered Public Accounting Firm, are available on the SEC website or upon request.
3. Significant Accounting Policies.
The financial statements have been prepared in conformity with accounting principles generally accepted in the United States of America (GAAP), which require management to make certain estimates and assumptions at the date of the financial statements. Actual results could differ from those estimates. Subsequent events, if any, through the date that the financial statements were issued have been evaluated in the preparation of the financial statements. The following summarizes the significant accounting policies of the Fund:
Investment Valuation. Investments are valued as of 4:00 p.m. Eastern time on the last calendar day of the period. The Board of Trustees (the Board) has delegated the day to day responsibility for the valuation of the Fund's investments to the Fair Value Committee (the Committee) established by the Fund's investment adviser. In accordance with valuation policies and procedures approved by the Board, the Fund attempts to obtain prices from one or more third party pricing vendors or brokers to value its investments. When current market prices, quotations or currency exchange rates are not readily available or reliable, investments will be fair valued in good faith by the Committee, in accordance with procedures adopted by the Board. Factors used in determining fair value vary by investment type and may include market or investment specific events, changes in interest rates and credit quality. The frequency with which these procedures are used cannot be predicted and they may be utilized to a significant extent. The Committee oversees the Fund's valuation policies and procedures and reports to the Board on the Committee's activities and fair value determinations. The Board monitors the appropriateness of the procedures used in valuing the Fund's investments and ratifies the fair value determinations of the Committee.
The Fund categorizes the inputs to valuation techniques used to value its investments into a disclosure hierarchy consisting of three levels as shown below:
- Level 1 – quoted prices in active markets for identical investments
- Level 2 – other significant observable inputs (including quoted prices for similar investments, interest rates, prepayment speeds, etc.)
- Level 3 – unobservable inputs (including the Fund's own assumptions based on the best information available)
Valuation techniques used to value the Fund's investments by major category are as follows:
Equity securities, including restricted securities, for which market quotations are readily available, are valued at the last reported sale price or official closing price as reported by a third party pricing vendor on the primary market or exchange on which they are traded and are categorized as Level 1 in the hierarchy. In the event there were no sales during the day or closing prices are not available, securities are valued at the last quoted bid price or may be valued using the last available price and are generally categorized as Level 2 in the hierarchy. For foreign equity securities, when market or security specific events arise, comparisons to the valuation of American Depositary Receipts (ADRs), futures contracts, Exchange-Traded Funds (ETFs) and certain indexes as well as quoted prices for similar securities may be used and would be categorized as Level 2 in the hierarchy. Utilizing these techniques may result in transfers between Level 1 and Level 2. For equity securities, including restricted securities, where observable inputs are limited, assumptions about market activity and risk are used and these securities may be categorized as Level 3 in the hierarchy.
Debt securities, including restricted securities, are valued based on evaluated prices received from third party pricing vendors or from brokers who make markets in such securities. Corporate bonds and preferred securities are valued by pricing vendors who utilize matrix pricing which considers yield or price of bonds of comparable quality, coupon, maturity and type or by broker-supplied prices. When independent prices are unavailable or unreliable, debt securities may be valued utilizing pricing methodologies which consider similar factors that would be used by third party pricing vendors. Debt securities are generally categorized as Level 2 in the hierarchy but may be Level 3 depending on the circumstances.
Exchange-traded options are valued using the last sale price or, in the absence of a sale, the last offering price and are categorized as Level 1 in the hierarchy. Options traded over-the-counter are valued using broker-supplied valuations and are categorized as Level 2 in the hierarchy. Investments in open-end mutual funds, including the Fidelity Central Funds, are valued at their closing net asset value (NAV) each business day and are categorized as Level 1 in the hierarchy.
Changes in valuation techniques may result in transfers in or out of an assigned level within the disclosure hierarchy. The aggregate value of investments by input level as of January 31, 2017, including information on transfers between Levels 1 and 2 is included at the end of the Fund's Schedule of Investments.
Foreign Currency. The Fund may use foreign currency contracts to facilitate transactions in foreign-denominated securities. Gains and losses from these transactions may arise from changes in the value of the foreign currency or if the counterparties do not perform under the contracts' terms.
Foreign-denominated assets, including investment securities, and liabilities are translated into U.S. dollars at the exchange rates at period end. Purchases and sales of investment securities, income and dividends received and expenses denominated in foreign currencies are translated into U.S. dollars at the exchange rate in effect on the transaction date.
The effects of exchange rate fluctuations on investments are included with the net realized and unrealized gain (loss) on investment securities. Other foreign currency transactions resulting in realized and unrealized gain (loss) are disclosed separately.
Investment Transactions and Income. For financial reporting purposes, the Fund's investment holdings and NAV include trades executed through the end of the last business day of the period. The NAV per share for processing shareholder transactions is calculated as of the close of business of the New York Stock Exchange (NYSE), normally 4:00 p.m. Eastern time and includes trades executed through the end of the prior business day. Gains and losses on securities sold are determined on the basis of identified cost and may include proceeds received from litigation. Dividend income is recorded on the ex-dividend date, except for certain dividends from foreign securities where the ex-dividend date may have passed, which are recorded as soon as the Fund is informed of the ex-dividend date. Non-cash dividends included in dividend income, if any, are recorded at the fair market value of the securities received. Income and capital gain distributions from Fidelity Central Funds, if any, are recorded on the ex-dividend date. Certain distributions received by the Fund represent a return of capital or capital gain. The Fund determines the components of these distributions subsequent to the ex-dividend date, based upon receipt of tax filings or other correspondence relating to the underlying investment. These distributions are recorded as a reduction of cost of investments and/or as a realized gain. Interest income is accrued as earned and includes coupon interest and amortization of premium and accretion of discount on debt securities as applicable. Investment income is recorded net of foreign taxes withheld where recovery of such taxes is uncertain. Debt obligations may be placed on non-accrual status and related interest income may be reduced by ceasing current accruals and writing off interest receivables when the collection of all or a portion of interest has become doubtful based on consistently applied procedures. A debt obligation is removed from non-accrual status when the issuer resumes interest payments or when collectability of interest is reasonably assured.
Class Allocations and Expenses. Investment income, realized and unrealized capital gains and losses, common expenses of the Fund, and certain fund-level expense reductions, if any, are allocated daily on a pro-rata basis to each class based on the relative net assets of each class to the total net assets of the Fund. Each class differs with respect to transfer agent fees incurred. Certain expense reductions may also differ by class. For the reporting period, the allocated portion of income and expenses to each class as a percent of its average net assets may vary due to the timing of recording these transactions in relation to fluctuating net assets of the classes. Expenses directly attributable to a fund are charged to that fund. Expenses attributable to more than one fund are allocated among the respective funds on the basis of relative net assets or other appropriate methods. Expense estimates are accrued in the period to which they relate and adjustments are made when actual amounts are known.
Deferred Trustee Compensation. Under a Deferred Compensation Plan (the Plan), independent Trustees may elect to defer receipt of a portion of their annual compensation. Deferred amounts are invested in a cross-section of Fidelity funds, are marked-to-market and remain in the Fund until distributed in accordance with the Plan. The investment of deferred amounts and the offsetting payable to the Trustees are included in the accompanying Statement of Assets and Liabilities.
Income Tax Information and Distributions to Shareholders. Each year, the Fund intends to qualify as a regulated investment company under Subchapter M of the Internal Revenue Code, including distributing substantially all of its taxable income and realized gains. As a result, no provision for U.S. Federal income taxes is required. As of January 31, 2017, the Fund did not have any unrecognized tax benefits in the financial statements; nor is the Fund aware of any tax positions for which it is reasonably possible that the total amounts of unrecognized tax benefits will significantly change in the next twelve months. The Fund files a U.S. federal tax return, in addition to state and local tax returns as required. The Fund's federal income tax returns are subject to examination by the Internal Revenue Service (IRS) for a period of three fiscal years after they are filed. State and local tax returns may be subject to examination for an additional fiscal year depending on the jurisdiction. Foreign taxes are provided for based on the Fund's understanding of the tax rules and rates that exist in the foreign markets in which it invests.
Distributions are declared and recorded on the ex-dividend date. Income dividends and capital gain distributions are declared separately for each class. Income and capital gain distributions are determined in accordance with income tax regulations, which may differ from GAAP. In addition, the Fund claimed a portion of the payment made to redeeming shareholders as a distribution for income tax purposes.
Capital accounts within the financial statements are adjusted for permanent book-tax differences. These adjustments have no impact on net assets or the results of operations. Capital accounts are not adjusted for temporary book-tax differences which will reverse in a subsequent period.
Book-tax differences are primarily due to foreign currency transactions, market discount, contingent interest, equity-debt classifications, certain conversion ratio adjustments, partnerships, deferred trustees compensation and losses deferred due to wash sales.
The federal tax cost of investment securities and unrealized appreciation (depreciation) as of period end were as follows:
| Gross unrealized appreciation | $1,842,771 |
| Gross unrealized depreciation | (356,441) |
| Net unrealized appreciation (depreciation) on securities | $1,486,330 |
| Tax Cost | $7,029,722 |
The tax-based components of distributable earnings as of period end were as follows:
| Undistributed ordinary income | $33,199 |
| Undistributed long-term capital gain | $40,570 |
| Net unrealized appreciation (depreciation) on securities and other investments | $1,434,648 |
The tax character of distributions paid was as follows:
| | January 31, 2017 | January 31, 2016 |
| Ordinary Income | $220,676 | $ 285,451 |
| Long-term Capital Gains | 147,608 | 651,493 |
| Total | $368,284 | $ 936,944 |
Restricted Securities. The Fund may invest in securities that are subject to legal or contractual restrictions on resale. These securities generally may be resold in transactions exempt from registration or to the public if the securities are registered. Disposal of these securities may involve time-consuming negotiations and expense, and prompt sale at an acceptable price may be difficult. Information regarding restricted securities is included at the end of the Fund's Schedule of Investments.
Consolidated Subsidiary. The Fund invests in certain investments through a wholly-owned subsidiary ("Subsidiary"), which may be subject to federal and state taxes upon disposition.
As of period end, the Fund held an investment of $15,119 in this Subsidiary, representing .18% of the Fund's net assets. The financial statements have been consolidated and include accounts of the Fund and each Subsidiary. Accordingly, all inter-company transactions and balances have been eliminated.
4. Derivative Instruments.
Risk Exposures and the Use of Derivative Instruments. The Fund's investment objective allows the Fund to enter into various types of derivative contracts, including options. Derivatives are investments whose value is primarily derived from underlying assets, indices or reference rates and may be transacted on an exchange or over-the-counter (OTC). Derivatives may involve a future commitment to buy or sell a specified asset based on specified terms, to exchange future cash flows at periodic intervals based on a notional principal amount, or for one party to make one or more payments upon the occurrence of specified events in exchange for periodic payments from the other party.
The Fund used derivatives to increase returns and to manage exposure to certain risks as defined below. The success of any strategy involving derivatives depends on analysis of numerous economic factors, and if the strategies for investment do not work as intended, the Fund may not achieve its objectives.
The Fund's use of derivatives increased or decreased its exposure to the following risk:
| Equity Risk | Equity risk relates to the fluctuations in the value of financial instruments as a result of changes in market prices (other than those arising from interest rate risk or foreign exchange risk), whether caused by factors specific to an individual investment, its issuer, or all factors affecting all instruments traded in a market or market segment.
|
The Fund is also exposed to additional risks from investing in derivatives, such as liquidity risk and counterparty credit risk. Liquidity risk is the risk that the Fund will be unable to close out the derivative in the open market in a timely manner. Counterparty credit risk is the risk that the counterparty will not be able to fulfill its obligation to the Fund. Derivative counterparty credit risk is managed through formal evaluation of the creditworthiness of all potential counterparties. On certain OTC derivatives such as options, the Fund attempts to reduce its exposure to counterparty credit risk by entering into an International Swaps and Derivatives Association, Inc. (ISDA) Master Agreement with each of its counterparties. The ISDA Master Agreement gives the Fund the right to terminate all transactions traded under such agreement upon the deterioration in the credit quality of the counterparty beyond specified levels. The ISDA Master Agreement gives each party the right, upon an event of default by the other party or a termination of the agreement, to close out all transactions traded under such agreement and to net amounts owed under each transaction to one net payable by one party to the other. To mitigate counterparty credit risk on bi-lateral OTC derivatives, the Fund receives collateral in the form of cash or securities once the Fund's net unrealized appreciation on outstanding derivative contracts under an ISDA Master Agreement exceeds certain applicable thresholds, subject to certain minimum transfer provisions. The collateral received is held in segregated accounts with the Fund's custodian bank in accordance with the collateral agreements entered into between the Fund, the counterparty and the Fund's custodian bank. The Fund could experience delays and costs in gaining access to the collateral even though it is held by the Fund's custodian bank. The Fund's maximum risk of loss from counterparty credit risk related to bi-lateral OTC derivatives is generally the aggregate unrealized appreciation and unpaid counterparty payments in excess of any collateral pledged by the counterparty to the Fund. The Fund may be required to pledge collateral for the benefit of the counterparties on bi-lateral OTC derivatives in an amount not less than each counterparty's unrealized appreciation on outstanding derivative contracts, subject to certain minimum transfer provisions, and any such pledged collateral is identified in the Schedule of Investments. Counterparty credit risk related to exchange-traded options may be mitigated by the protection provided by the exchange on which they trade.
Investing in derivatives may involve greater risks than investing in the underlying assets directly and, to varying degrees, may involve risk of loss in excess of any initial investment and collateral received and amounts recognized in the Statement of Assets and Liabilities. In addition, there may be the risk that the change in value of the derivative contract does not correspond to the change in value of the underlying instrument.
Options. Options give the purchaser the right, but not the obligation, to buy (call) or sell (put) an underlying security or financial instrument at an agreed exercise or strike price between or on certain dates. Options obligate the seller (writer) to buy (put) or sell (call) an underlying instrument at the exercise or strike price or cash settle an underlying derivative instrument if the holder exercises the option on or before the expiration date.
The Fund used exchange-traded and OTC written covered call options to manage its exposure to the market. When the Fund writes a covered call option, the Fund holds the underlying instrument which must be delivered to the holder upon the exercise of the option.
Upon entering into a written options contract, the Fund will receive a premium. Premiums received are reflected as a liability on the Statement of Assets and Liabilities. Options are valued daily and any unrealized appreciation (depreciation) is reflected on the Statement of Assets and Liabilities. When a written option is exercised, the premium is added to the proceeds from the sale of the underlying instrument in determining the gain or loss realized on that investment. When an option is closed the Fund will realize a gain or loss depending on whether the proceeds or amount paid for the closing sale transaction are greater or less than the premium received. When an option expires, gains and losses are realized to the extent of premiums received. The net realized gain (loss) on closed and expired written options and the change in net unrealized appreciation (depreciation) on written options are reflected separately on the Statement of Operations.
Writing call options tends to decrease exposure to the underlying instrument and risk of loss is the change in value in excess of the premium received.
Any open options at period end are presented in the Schedule of Investments under the caption "Written Options".
During the period, the Fund recognized net realized gain (loss) of $12,878 and a change in net unrealized appreciation (depreciation) of $(1,373) related to its investment in written options. This amount is included in the Statement of Operations.
The following is a summary of the Fund's written options activity:
| | Number of Contracts | Amount of Premiums |
| Outstanding at beginning of period | 26 | $1,377 |
| Options Opened | 437 | 31,735 |
| Options Exercised | (171) | (11,204) |
| Options Closed | (80) | (5,152) |
| Options Expired | (103) | (8,813) |
| Outstanding at end of period | 109 | $7,943 |
5. Purchases and Sales of Investments.
Purchases and sales of securities, other than short-term securities, aggregated $2,774,154 and $3,393,199, respectively.
Prior Fiscal Year Redemptions In-Kind. During the prior period, 1,158 shares of the Fund held by an unaffiliated entity were redeemed in-kind for investments and cash, including accrued interest, with a value of $62,186. The Fund had a net realized gain of $14,316 on investments delivered through the in-kind redemptions. The amount of in-kind redemptions is included in share transactions in the accompanying Statement of Changes in Net Assets as well as Note 11: Share Transactions. The Fund recognized no gain or loss for federal income tax purposes.
6. Fees and Other Transactions with Affiliates.
Management Fee. Fidelity Management & Research Company (the investment adviser) and its affiliates provide the Fund with investment management related services for which the Fund pays a monthly management fee. The management fee is the sum of an individual fund fee rate that is based on an annual rate of .20% of the Fund's average net assets and an annualized group fee rate that averaged .25% during the period. The group fee rate is based upon the average net assets of all the mutual funds advised by the investment adviser, including any mutual funds previously advised by the investment adviser that are currently advised by Fidelity SelectCo, LLC, an affiliate of the investment adviser. The group fee rate decreases as assets under management increase and increases as assets under management decrease. For the reporting period, the total annual management fee rate was .45% of the Fund's average net assets.
Transfer Agent Fees. Fidelity Investments Institutional Operations Company, Inc., (FIIOC), an affiliate of the investment adviser, is the transfer, dividend disbursing and shareholder servicing agent for each class of the Fund. FIIOC receives account fees and asset-based fees that vary according to the account size and type of account of the shareholders of Equity Income. FIIOC receives an asset-based fee of Class K's average net assets. FIIOC pays for typesetting, printing and mailing of shareholder reports, except proxy statements.
For the period, transfer agent fees for each class were as follows:
| | Amount | % of
Class-Level Average
Net Assets |
| Equity-Income | $9,919 | .16 |
| Class K | 807 | .05 |
| | $10,726 | |
Accounting and Security Lending Fees. Fidelity Service Company, Inc. (FSC), an affiliate of the investment adviser, maintains the Fund's accounting records. The accounting fee is based on the level of average net assets for each month. Under a separate contract, FSC administers the security lending program. The security lending fee is based on the number and duration of lending transactions.
Brokerage Commissions. The Fund placed a portion of its portfolio transactions with brokerage firms which are affiliates of the investment adviser. Brokerage commissions are included in net realized gain (loss) and change in net unrealized appreciation (depreciation) in the Statement of Operations. The commissions paid to these affiliated firms were $76 for the period.
Interfund Trades. The Fund may purchase from or sell securities to other Fidelity Funds under procedures adopted by the Board. The procedures have been designed to ensure these interfund trades are executed in accordance with Rule 17a-7 of the 1940 Act. Interfund trades are included within the respective purchases and sales amounts shown in the Purchases and Sales of Investments note.
7. Committed Line of Credit.
The Fund participates with other funds managed by the investment adviser or an affiliate in a $4.25 billion credit facility (the "line of credit") to be utilized for temporary or emergency purposes to fund shareholder redemptions or for other short-term liquidity purposes. The Fund has agreed to pay commitment fees on its pro-rata portion of the line of credit, which amounted to $24 and is reflected in Miscellaneous expenses on the Statement of Operations. During the period, the Fund did not borrow on this line of credit.
8. Security Lending.
The Fund lends portfolio securities through a lending agent from time to time in order to earn additional income. For equity securities, a lending agent is used and may loan securities to certain qualified borrowers, including Fidelity Capital Markets (FCM), a broker-dealer affiliated with the Fund. On the settlement date of the loan, the Fund receives collateral (in the form of U.S. Treasury obligations, letters of credit and/or cash) against the loaned securities and maintains collateral in an amount not less than 100% of the market value of the loaned securities during the period of the loan. The market value of the loaned securities is determined at the close of business of the Fund and any additional required collateral is delivered to the Fund on the next business day. The Fund or borrower may terminate the loan at any time, and if the borrower defaults on its obligation to return the securities loaned because of insolvency or other reasons, the Fund may apply collateral received from the borrower against the obligation. The Fund may experience delays and costs in recovering the securities loaned. Any cash collateral received is invested in the Fidelity Securities Lending Cash Central Fund. The value of loaned securities and cash collateral at period end are disclosed on the Fund's Statement of Assets and Liabilities. The value of securities loaned to FCM at period end was $4,515. Security lending income represents the income earned on investing cash collateral, less rebates paid to borrowers and any lending agent fees associated with the loan, plus any premium payments received for lending certain types of securities. Security lending income is presented in the Statement of Operations as a component of income from Fidelity Central Funds. Total security lending income during the period amounted to $502, including $47 from securities loaned to FCM.
9. Expense Reductions.
Commissions paid to certain brokers with whom the investment adviser, or its affiliates, places trades on behalf of the Fund include an amount in addition to trade execution, which may be rebated back to the Fund to offset certain expenses. This amount totaled $223 for the period. Through arrangements with the Fund's custodian, credits realized as a result of certain uninvested cash balances were used to reduce the Fund's expenses. During the period, these credits reduced the Fund's custody expenses by $2.
In addition, during the period the investment adviser reimbursed and/or waived a portion of fund-level operating expenses in the amount of $67.
10. Distributions to Shareholders.
Distributions to shareholders of each class were as follows:
| | Year ended
January 31, 2017 | Year ended
January 31, 2016 |
| From net investment income | | |
| Equity-Income | $158,629 | $199,167 |
| Class K | 45,787 | 63,051 |
| Total | $204,416 | $262,218 |
| From net realized gain | | |
| Equity-Income | $127,710 | $515,493 |
| Class K | 36,158 | 159,233 |
| Total | $163,868 | $674,726 |
11. Share Transactions.
Share transactions for each class were as follows and may contain automatic conversions between classes or exchanges between affiliated funds:
| | Shares | Shares | Dollars | Dollars |
| | Year ended
January 31, 2017 | Year ended January 31, 2016 | Year ended
January 31, 2017 | Year ended January 31, 2016 |
| Equity-Income | | | | |
| Shares sold | 12,430 | 11,557 | $670,860 | $638,905 |
| Reinvestment of distributions | 5,024 | 12,773 | 271,182 | 679,623 |
| Shares redeemed | (20,110) | (22,666) | (1,087,701) | (1,259,206) |
| Net increase (decrease) | (2,656) | 1,664 | $(145,659) | $59,322 |
| Class K | | | | |
| Shares sold | 9,202 | 5,714 | $506,412 | $318,377 |
| Reinvestment of distributions | 1,517 | 4,160 | 81,945 | 222,285 |
| Shares redeemed | (13,599) | (15,663)(a) | (732,579) | (878,628)(a) |
| Net increase (decrease) | (2,880) | (5,789) | $(144,222) | $(337,966) |
(a) Amount includes in-kind redemptions (See note 5: Prior Fiscal Year Redemptions In-Kind)
12. Other.
The Fund's organizational documents provide former and current trustees and officers with a limited indemnification against liabilities arising in connection with the performance of their duties to the Fund. In the normal course of business, the Fund may also enter into contracts that provide general indemnifications. The Fund's maximum exposure under these arrangements is unknown as this would be dependent on future claims that may be made against the Fund. The risk of material loss from such claims is considered remote.
Report of Independent Registered Public Accounting Firm
To the Trustees of Fidelity Devonshire Trust and Shareholders of Fidelity Equity-Income Fund:
In our opinion, the accompanying statement of assets and liabilities, including the schedule of investments, and the related statements of operations and of changes in net assets and the financial highlights present fairly, in all material respects, the financial position of Fidelity Equity-Income Fund (a fund of Fidelity Devonshire Trust) as of January 31, 2017, the results of its operations for the year then ended, the changes in its net assets for each of the two years in the period then ended and the financial highlights for each of the five years in the period then ended, in conformity with accounting principles generally accepted in the United States of America. These financial statements and financial highlights (hereafter referred to as “financial statements”) are the responsibility of the Fidelity Equity-Income Fund’s management. Our responsibility is to express an opinion on these financial statements based on our audits. We conducted our audits of these financial statements in accordance with the standards of the Public Company Accounting Oversight Board (United States). Those standards require that we plan and perform the audit to obtain reasonable assurance about whether the financial statements are free of material misstatement. An audit includes examining, on a test basis, evidence supporting the amounts and disclosures in the financial statements, assessing the accounting principles used and significant estimates made by management, and evaluating the overall financial statement presentation. We believe that our audits, which included confirmation of securities as of January 31, 2017 by correspondence with the custodian and brokers, provide a reasonable basis for our opinion.
PricewaterhouseCoopers LLP
Boston, Massachusetts
March 16, 2017
Trustees and Officers
The Trustees, Members of the Advisory Board (if any), and officers of the trust and fund, as applicable, are listed below. The Board of Trustees governs the fund and is responsible for protecting the interests of shareholders. The Trustees are experienced executives who meet periodically throughout the year to oversee the fund's activities, review contractual arrangements with companies that provide services to the fund, oversee management of the risks associated with such activities and contractual arrangements, and review the fund's performance. Each of the Trustees oversees 169 funds.
The Trustees hold office without limit in time except that (a) any Trustee may resign; (b) any Trustee may be removed by written instrument, signed by at least two-thirds of the number of Trustees prior to such removal; (c) any Trustee who requests to be retired or who has become incapacitated by illness or injury may be retired by written instrument signed by a majority of the other Trustees; and (d) any Trustee may be removed at any special meeting of shareholders by a two-thirds vote of the outstanding voting securities of the trust. Each Trustee who is not an interested person (as defined in the 1940 Act) of the trust and the fund is referred to herein as an Independent Trustee. Each Independent Trustee shall retire not later than the last day of the calendar year in which his or her 75th birthday occurs. The Independent Trustees may waive this mandatory retirement age policy with respect to individual Trustees. Officers and Advisory Board Members hold office without limit in time, except that any officer or Advisory Board Member may resign or may be removed by a vote of a majority of the Trustees at any regular meeting or any special meeting of the Trustees. Except as indicated, each individual has held the office shown or other offices in the same company for the past five years.
The fund’s Statement of Additional Information (SAI) includes more information about the Trustees. To request a free copy, call Fidelity at 1-800-544-8544.
Experience, Skills, Attributes, and Qualifications of the Trustees. The Governance and Nominating Committee has adopted a statement of policy that describes the experience, qualifications, attributes, and skills that are necessary and desirable for potential Independent Trustee candidates (Statement of Policy). The Board believes that each Trustee satisfied at the time he or she was initially elected or appointed a Trustee, and continues to satisfy, the standards contemplated by the Statement of Policy. The Governance and Nominating Committee also engages professional search firms to help identify potential Independent Trustee candidates who have the experience, qualifications, attributes, and skills consistent with the Statement of Policy. From time to time, additional criteria based on the composition and skills of the current Independent Trustees, as well as experience or skills that may be appropriate in light of future changes to board composition, business conditions, and regulatory or other developments, have also been considered by the professional search firms and the Governance and Nominating Committee. In addition, the Board takes into account the Trustees' commitment and participation in Board and committee meetings, as well as their leadership of standing and ad hoc committees throughout their tenure.
In determining that a particular Trustee was and continues to be qualified to serve as a Trustee, the Board has considered a variety of criteria, none of which, in isolation, was controlling. The Board believes that, collectively, the Trustees have balanced and diverse experience, qualifications, attributes, and skills, which allow the Board to operate effectively in governing the fund and protecting the interests of shareholders. Information about the specific experience, skills, attributes, and qualifications of each Trustee, which in each case led to the Board's conclusion that the Trustee should serve (or continue to serve) as a trustee of the fund, is provided below.
Board Structure and Oversight Function. James C. Curvey is an interested person and currently serves as Chairman. The Trustees have determined that an interested Chairman is appropriate and benefits shareholders because an interested Chairman has a personal and professional stake in the quality and continuity of services provided to the fund. Independent Trustees exercise their informed business judgment to appoint an individual of their choosing to serve as Chairman, regardless of whether the Trustee happens to be independent or a member of management. The Independent Trustees have determined that they can act independently and effectively without having an Independent Trustee serve as Chairman and that a key structural component for assuring that they are in a position to do so is for the Independent Trustees to constitute a substantial majority for the Board. The Independent Trustees also regularly meet in executive session. Ned C. Lautenbach serves as Chairman of the Independent Trustees and as such (i) acts as a liaison between the Independent Trustees and management with respect to matters important to the Independent Trustees and (ii) with management prepares agendas for Board meetings.
Fidelity® funds are overseen by different Boards of Trustees. The fund's Board oversees Fidelity's high income and certain equity funds, and other Boards oversee Fidelity's investment-grade bond, money market, asset allocation, and sector funds. The asset allocation funds may invest in Fidelity® funds overseen by the fund's Board. The use of separate Boards, each with its own committee structure, allows the Trustees of each group of Fidelity® funds to focus on the unique issues of the funds they oversee, including common research, investment, and operational issues. On occasion, the separate Boards establish joint committees to address issues of overlapping consequences for the Fidelity® funds overseen by each Board.
The Trustees operate using a system of committees to facilitate the timely and efficient consideration of all matters of importance to the Trustees, the fund, and fund shareholders and to facilitate compliance with legal and regulatory requirements and oversight of the fund's activities and associated risks. The Board, acting through its committees, has charged FMR and its affiliates with (i) identifying events or circumstances the occurrence of which could have demonstrably adverse effects on the fund's business and/or reputation; (ii) implementing processes and controls to lessen the possibility that such events or circumstances occur or to mitigate the effects of such events or circumstances if they do occur; and (iii) creating and maintaining a system designed to evaluate continuously business and market conditions in order to facilitate the identification and implementation processes described in (i) and (ii) above. Because the day-to-day operations and activities of the fund are carried out by or through FMR, its affiliates, and other service providers, the fund's exposure to risks is mitigated but not eliminated by the processes overseen by the Trustees. While each of the Board's committees has responsibility for overseeing different aspects of the fund's activities, oversight is exercised primarily through the Operations, Audit, and Compliance Committees. In addition, the Independent Trustees have worked with FMR to enhance the Board's oversight of investment and financial risks, legal and regulatory risks, technology risks, and operational risks, including the development of additional risk reporting to the Board. For example, a working group comprised of Independent Trustees and FMR has worked and continues to work to review the Fidelity® funds' valuation-related activities, reporting and risk management. Appropriate personnel, including but not limited to the fund's Chief Compliance Officer (CCO), FMR's internal auditor, the independent accountants, the fund's Treasurer and portfolio management personnel, make periodic reports to the Board's committees, as appropriate, including an annual review of Fidelity's risk management program for the Fidelity® funds. The responsibilities of each standing committee, including their oversight responsibilities, are described further under "Standing Committees of the Trustees."
Interested Trustees*:
Correspondence intended for a Trustee who is an interested person may be sent to Fidelity Investments, 245 Summer Street, Boston, Massachusetts 02210.
Name, Year of Birth; Principal Occupations and Other Relevant Experience+
James C. Curvey (1935)
Year of Election or Appointment: 2007
Trustee
Chairman of the Board of Trustees
Mr. Curvey also serves as Trustee of other Fidelity® funds. Mr. Curvey is a Director of Fidelity Research & Analysis Co. (investment adviser firm, 2009-present), and Vice Chairman (2007-present) and Director of FMR LLC (diversified financial services company). In addition, Mr. Curvey serves as an Overseer for the Boston Symphony Orchestra and a member of the board of Artis-Naples, Naples, Florida, and as a Trustee for Brewster Academy, Wolfeboro, New Hampshire. Previously, Mr. Curvey served as a Director of Fidelity Investments Money Management, Inc. (investment adviser firm, 2009-2014) and a Director of FMR and FMR Co., Inc. (investment adviser firms, 2007-2014).
Charles S. Morrison (1960)
Year of Election or Appointment: 2014
Trustee
Mr. Morrison also serves as Trustee of other funds. He serves as President of Fidelity Management & Research Company (FMR) (investment adviser firm, 2016-present), a Director of Fidelity Investments Money Management, Inc. (FIMM) (investment adviser firm, 2014-present), Director of Fidelity SelectCo, LLC (investment adviser firm, 2014-present), President, Asset Management (2014-present), and is an employee of Fidelity Investments. Previously, Mr. Morrison served as Vice President of Fidelity's Fixed Income and Asset Allocation Funds (2012-2014), President, Fixed Income (2011-2014), Vice President of Fidelity's Money Market Funds (2005-2009), President, Money Market Group Leader of FMR (investment adviser firm, 2009), and Senior Vice President, Money Market Group of FMR (2004-2009). Mr. Morrison also served as Vice President of Fidelity's Bond Funds (2002-2005), certain Balanced Funds (2002-2005), and certain Asset Allocation Funds (2002-2007), and as Senior Vice President (2002-2005) of Fidelity's Bond Division.
* Determined to be an “Interested Trustee” by virtue of, among other things, his or her affiliation with the trust or various entities under common control with FMR.
+ The information includes the Trustee's principal occupation during the last five years and other information relating to the experience, attributes, and skills relevant to the Trustee's qualifications to serve as a Trustee, which led to the conclusion that the Trustee should serve as a Trustee for the fund.
Independent Trustees:
Correspondence intended for an Independent Trustee may be sent to Fidelity Investments, P.O. Box 55235, Boston, Massachusetts 02205-5235.
Name, Year of Birth; Principal Occupations and Other Relevant Experience+
Dennis J. Dirks (1948)
Year of Election or Appointment: 2005
Trustee
Mr. Dirks also serves as Trustee of other Fidelity® funds. Prior to his retirement in May 2003, Mr. Dirks was Chief Operating Officer and a member of the Board of The Depository Trust & Clearing Corporation (DTCC). He also served as President, Chief Operating Officer, and Board member of The Depository Trust Company (DTC) and President and Board member of the National Securities Clearing Corporation (NSCC). In addition, Mr. Dirks served as Chief Executive Officer and Board member of the Government Securities Clearing Corporation, Chief Executive Officer and Board member of the Mortgage-Backed Securities Clearing Corporation, as a Trustee and a member of the Finance Committee of Manhattan College (2005-2008), as a Trustee and a member of the Finance Committee of AHRC of Nassau County (2006-2008), and as a member of the Independent Directors Council (IDC) Governing Council (2010-2015). Mr. Dirks is a member of the Board of Directors for The Brookville Center for Children's Services, Inc. (2009-present) and the Finance Committee of the Asolo Repertory Theatre (2016-present).
Alan J. Lacy (1953)
Year of Election or Appointment: 2008
Trustee
Mr. Lacy also serves as Trustee of other Fidelity® funds. Mr. Lacy serves as Chairman (2014-present) and a member (2010-present) of the Board of Directors of Dave & Buster's Entertainment, Inc. (restaurant and entertainment complexes) and a Director of Bristol-Myers Squibb Company (global pharmaceuticals, 2008-present). He is a Trustee of the California Chapter of The Nature Conservancy (2015-present) and a Director of the Center for Advanced Study in the Behavioral Sciences at Stanford University (2015-present). In addition, Mr. Lacy served as Senior Adviser (2007-2014) of Oak Hill Capital Partners, L.P. (private equity) and also served as Chief Executive Officer (2005) and Vice Chairman (2005-2006) of Sears Holdings Corporation (retail) and Chief Executive Officer and Chairman of the Board of Sears, Roebuck and Co. (retail, 2000-2005). Previously, Mr. Lacy served as Chairman (2008-2011) and a member (2006-2015) of the Board of Trustees of the National Parks Conservation Association and as a member of the Board of Directors for The Western Union Company (global money transfer, 2006-2011), The Hillman Companies, Inc. (hardware wholesalers, 2010-2014), and Earth Fare, Inc. (retail grocery, 2010-2014).
Ned C. Lautenbach (1944)
Year of Election or Appointment: 2000
Trustee
Chairman of the Independent Trustees
Mr. Lautenbach also serves as Trustee of other Fidelity® funds. Mr. Lautenbach currently serves as the Lead Director of the Eaton Corporation Board of Directors (diversified industrial, 1997-present). Mr. Lautenbach is Chairman of the Board of Directors of Artis-Naples in Naples, Florida (2012-present), a member of the Council on Foreign Relations (1994-present), and currently Vice Chair of the Board of Governors, State University System of Florida (2013-present). Previously, Mr. Lautenbach was a Partner and Advisory Partner at Clayton, Dubilier & Rice, LLC (private equity investment, 1998-2010), as well as a Director of Sony Corporation (2006-2007). Mr. Lautenbach also had a 30-year career with IBM (technology company) during which time he served as Senior Vice President and a member of the Corporate Executive Committee (1968-1998).
Joseph Mauriello (1944)
Year of Election or Appointment: 2008
Trustee
Mr. Mauriello also serves as Trustee of other Fidelity® funds. Prior to his retirement in January 2006, Mr. Mauriello served in numerous senior management positions including Deputy Chairman and Chief Operating Officer (2004-2005), and Vice Chairman of Financial Services (2002-2004) of KPMG LLP US (professional services, 1965-2005). Mr. Mauriello currently serves as a member of the Board of Directors of XL Group plc. (global insurance and re-insurance, 2006-present) and the Independent Directors Council (IDC) Governing Council (2015-present). Previously, Mr. Mauriello served as a Director of the Hamilton Funds of the Bank of New York (2006-2007) and of Arcadia Resources Inc. (health care services and products, 2007-2012).
Robert W. Selander (1950)
Year of Election or Appointment: 2011
Trustee
Mr. Selander also serves as Trustee of other Fidelity® funds. Mr. Selander serves as a Director of The Western Union Company (global money transfer, 2014-present) and a non-executive Chairman of Health Equity, Inc. (health savings custodian, 2015-present). Previously, Mr. Selander served as a Member of the Advisory Board of certain Fidelity® funds (2011), and Executive Vice Chairman (2010), Chief Executive Officer (2009-2010), and President and Chief Executive Officer (1997-2009) of Mastercard, Inc.
Cornelia M. Small (1944)
Year of Election or Appointment: 2005
Trustee
Ms. Small also serves as Trustee of other Fidelity® funds. Ms. Small is a member of the Board of Directors (2009-present) and Chair of the Investment Committee (2010-present) of the Teagle Foundation. Ms. Small also serves on the Investment Committee of the Berkshire Taconic Community Foundation (2008-present). Previously, Ms. Small served as Chairperson (2002-2008) and a member of the Investment Committee and Chairperson (2008-2012) and a member of the Board of Trustees of Smith College. In addition, Ms. Small served as Chief Investment Officer, Director of Global Equity Investments, and a member of the Board of Directors of Scudder, Stevens & Clark and Scudder Kemper Investments.
William S. Stavropoulos (1939)
Year of Election or Appointment: 2002
Trustee
Vice Chairman of the Independent Trustees
Mr. Stavropoulos also serves as Trustee of other Fidelity® funds. Mr. Stavropoulos serves as President and Founder of the Michigan Baseball Foundation, the Great Lakes Loons (2007-present). Mr. Stavropoulos is Chairman Emeritus of the Board of Directors of The Dow Chemical Company, where he previously served in numerous senior management positions, including President, CEO (1995-2000; 2002-2004), Chairman of the Executive Committee (2000-2006), and as a member of the Board of Directors (1990-2006). Currently, Mr. Stavropoulos is Chairman of the Board of Directors of Univar Inc. (global distributor of commodity and specialty chemicals), a Director of Teradata Corporation (data warehousing and technology solutions), and a member of the Advisory Board for Metalmark Capital LLC (private equity investment, 2005-present). Mr. Stavropoulos is an operating advisor to Clayton, Dubilier & Rice, LLC (private equity investment). In addition, Mr. Stavropoulos is a member of the University of Notre Dame Advisory Council for the College of Science, a Trustee of the Rollin L. Gerstacker Foundation, and a Director of Artis-Naples in Naples, Florida. Previously, Mr. Stavropoulos served as a Director of Chemical Financial Corporation (bank holding company, 1993-2012) and Tyco International, Ltd. (multinational manufacturing and services, 2007-2012).
David M. Thomas (1949)
Year of Election or Appointment: 2008
Trustee
Mr. Thomas also serves as Trustee of other Fidelity® funds. Mr. Thomas serves as Non-Executive Chairman of the Board of Directors of Fortune Brands Home and Security (home and security products, 2011-present), as a member of the Board of Directors (2004-present) and Presiding Director (2013-present) of Interpublic Group of Companies, Inc. (marketing communication), and as a member of the Board of Trustees of the University of Florida (2013-present). Previously, Mr. Thomas served as Executive Chairman (2005-2006) and Chairman and Chief Executive Officer (2000-2005) of IMS Health, Inc. (pharmaceutical and healthcare information solutions), and a Director of Fortune Brands, Inc. (consumer products, 2000-2011).
+ The information includes the Trustee's principal occupation during the last five years and other information relating to the experience, attributes, and skills relevant to the Trustee's qualifications to serve as a Trustee, which led to the conclusion that the Trustee should serve as a Trustee for the fund.
Advisory Board Members and Officers:
Correspondence intended for an officer or Peter S. Lynch may be sent to Fidelity Investments, 245 Summer Street, Boston, Massachusetts 02210. Officers appear below in alphabetical order.
Name, Year of Birth; Principal Occupation
Peter S. Lynch (1944)
Year of Election or Appointment: 2003
Member of the Advisory Board
Mr. Lynch also serves as Member of the Advisory Board of other Fidelity® funds. Mr. Lynch is Vice Chairman and a Director of FMR (investment adviser firm) and FMR Co., Inc. (investment adviser firm). In addition, Mr. Lynch serves as a Trustee of Boston College and as the Chairman of the Inner-City Scholarship Fund. Previously, Mr. Lynch served on the Special Olympics International Board of Directors (1997-2006).
Elizabeth Paige Baumann (1968)
Year of Election or Appointment: 2017
Interim Anti-Money Laundering (AML) Officer
Ms. Baumann also serves as AML Officer of other funds. She is Chief AML Officer (2012-present) and Senior Vice President (2014-present) of FMR LLC (diversified financial services company) and is an employee of Fidelity Investments. Previously, Ms. Baumann served as AML Officer (2012-2016), Vice President (2007-2014), and Deputy Anti-Money Laundering Officer (2007-2012).
Marc R. Bryant (1966)
Year of Election or Appointment: 2015
Secretary and Chief Legal Officer (CLO)
Mr. Bryant also serves as Secretary and CLO of other funds. Mr. Bryant serves as CLO, Secretary, and Senior Vice President of Fidelity Management & Research Company (investment adviser firm, 2015-present) and FMR Co., Inc. (investment adviser firm, 2015-present); Secretary of Fidelity SelectCo, LLC (investment adviser firm, 2015-present) and Fidelity Investments Money Management, Inc. (investment adviser firm, 2015-present); and CLO of Fidelity Management & Research (Hong Kong) Limited and FMR Investment Management (UK) Limited (investment adviser firms, 2015-present) and Fidelity Management & Research (Japan) Limited (investment adviser firm, 2016-present). He is Senior Vice President and Deputy General Counsel of FMR LLC (diversified financial services company). Previously, Mr. Bryant served as Secretary and CLO of Fidelity Rutland Square Trust II (2010-2014) and Assistant Secretary of Fidelity's Fixed Income and Asset Allocation Funds (2013-2015). Prior to joining Fidelity Investments, Mr. Bryant served as a Senior Vice President and the Head of Global Retail Legal for AllianceBernstein L.P. (2006-2010), and as the General Counsel for ProFund Advisors LLC (2001-2006).
Jeffrey S. Christian (1961)
Year of Election or Appointment: 2016
Assistant Treasurer
Mr. Christian also serves as Assistant Treasurer of other funds. Mr. Christian is an employee of Fidelity Investments (2003-present).
William C. Coffey (1969)
Year of Election or Appointment: 2009
Assistant Secretary
Mr. Coffey also serves as Assistant Secretary of other funds. He is Senior Vice President and Deputy General Counsel of FMR LLC (diversified financial services company, 2010-present), and is an employee of Fidelity Investments. Previously, Mr. Coffey served as Vice President and Associate General Counsel of FMR LLC (2005-2009).
Jonathan Davis (1968)
Year of Election or Appointment: 2010
Assistant Treasurer
Mr. Davis also serves as Assistant Treasurer of other funds, and is an employee of Fidelity Investments. Previously, Mr. Davis served as Vice President and Associate General Counsel of FMR LLC (diversified financial services company, 2003-2010).
Adrien E. Deberghes (1967)
Year of Election or Appointment: 2016
Assistant Treasurer
Mr. Deberghes also serves as an officer of other funds. He serves as Executive Vice President of Fidelity Investments Money Management, Inc. (FIMM) (investment adviser firm, 2016-present) and is an employee of Fidelity Investments (2008-present). Prior to joining Fidelity Investments, Mr. Deberghes was Senior Vice President of Mutual Fund Administration at State Street Corporation (2007-2008), Senior Director of Mutual Fund Administration at Investors Bank & Trust (2005-2007), and Director of Finance for Dunkin' Brands (2000-2005). Previously, Mr. Deberghes served in other fund officer roles.
Stephanie J. Dorsey (1969)
Year of Election or Appointment: 2010
Assistant Treasurer
Ms. Dorsey also serves as an officer of other funds. She is an employee of Fidelity Investments (2008-present) and has served in other fund officer roles. Prior to joining Fidelity Investments, Ms. Dorsey served as Treasurer (2004-2008) of the JPMorgan Mutual Funds and Vice President (2004-2008) of JPMorgan Chase Bank.
Howard J. Galligan III (1966)
Year of Election or Appointment: 2014
Chief Financial Officer
Mr. Galligan also serves as Chief Financial Officer of other funds. Mr. Galligan serves as President of Fidelity Pricing and Cash Management Services (FPCMS) (2014-present) and as a Director of Strategic Advisers, Inc. (investment adviser firm, 2008-present). Previously, Mr. Galligan served as Chief Administrative Officer of Asset Management (2011-2014) and Chief Operating Officer and Senior Vice President of Investment Support for Strategic Advisers, Inc. (2003-2011).
Scott C. Goebel (1968)
Year of Election or Appointment: 2015
Vice President
Mr. Goebel serves as Vice President of other funds and is an employee of Fidelity Investments (2001-present). Previously, Mr. Goebel served as Senior Vice President of Fidelity Management & Research Company (FMR) (investment adviser firm, 2016), Secretary of Fidelity SelectCo, LLC (investment adviser firm, 2013-2015), Fidelity Investments Money Management, Inc. (FIMM) (investment adviser firm, 2010-2015), and Fidelity Research and Analysis Company (FRAC) (investment adviser firm, 2010-2015); General Counsel, Secretary, and Senior Vice President of FMR (investment adviser firm, 2008-2015) and FMR Co., Inc. (investment adviser firm, 2008-2015); Assistant Secretary of Fidelity Management & Research (Japan) Limited (investment adviser firm, 2008-2015) and Fidelity Management & Research (U.K.) Inc. (investment adviser firm, 2008-2015); Chief Legal Officer (CLO) of Fidelity Management & Research (Hong Kong) Limited (investment adviser firm, 2008-2015); Secretary and CLO of certain Fidelity® funds (2008-2015); Assistant Secretary of FIMM (2008-2010), FRAC (2008-2010), and certain funds (2007-2008); and as Vice President and Secretary of Fidelity Distributors Corporation (FDC) (2005-2007).
Thomas C. Hense (1964)
Year of Election or Appointment: 2008, 2010, or 2015
Vice President
Mr. Hense serves as Vice President of Fidelity Advisor® Multi-Asset Income Fund (2015) and other funds (High Income (2008), Small Cap (2008), and Value (2010) funds), and is an employee of Fidelity Investments (1993-present). Previously, Mr. Hense served as a portfolio manager for Fidelity's Institutional Money Management Group (Pyramis) (2003-2008).
Brian B. Hogan (1964)
Year of Election or Appointment: 2009
Vice President
Mr. Hogan also serves as Trustee or Vice President of other funds. Mr. Hogan serves as a Director of FMR Investment Management (UK) Limited (investment adviser firm, 2015-present) and Fidelity SelectCo, LLC (investment adviser firm, 2014-present) and President of the Equity Division of FMR (investment adviser firm, 2009-present). Previously, Mr. Hogan served as Senior Vice President, Equity Research of FMR (2006-2009) and as a portfolio manager. Mr. Brian B. Hogan is not related to Mr. Colm A. Hogan.
Colm A. Hogan (1973)
Year of Election or Appointment: 2016
Deputy Treasurer
Mr. Hogan also serves as an officer of other funds. Mr. Hogan is an employee of Fidelity Investments (2005-present). Mr. Colm A. Hogan is not related to Mr. Brian B. Hogan.
Chris Maher (1972)
Year of Election or Appointment: 2013
Assistant Treasurer
Mr. Maher serves as Assistant Treasurer of other funds. Mr. Maher is Vice President of Valuation Oversight and is an employee of Fidelity Investments. Previously, Mr. Maher served as Vice President of Asset Management Compliance (2013), Vice President of the Program Management Group of FMR (investment adviser firm, 2010-2013), and Vice President of Valuation Oversight (2008-2010).
Kenneth B. Robins (1969)
Year of Election or Appointment: 2016
Chief Compliance Officer
Mr. Robins also serves as an officer of other funds. Mr. Robins serves as Compliance Officer of Fidelity Management & Research Company and FMR Co., Inc. (investment adviser firms, 2016-present) and is an employee of Fidelity Investments (2004-present). Previously, Mr. Robins served as Executive Vice President of Fidelity Investments Money Management, Inc. (investment adviser firm, 2013-2016) and served in other fund officer roles.
Stacie M. Smith (1974)
Year of Election or Appointment: 2016
President and Treasurer
Ms. Smith also serves as an officer of other funds. She is an employee of Fidelity Investments (2009-present) and has served in other fund officer roles. Prior to joining Fidelity Investments, Ms. Smith served as Senior Audit Manager of Ernst & Young LLP (accounting firm, 1996-2009). Previously, Ms. Smith served as Deputy Treasurer of certain Fidelity® funds (2013-2016).
Marc L. Spector (1972)
Year of Election or Appointment: 2016
Assistant Treasurer
Mr. Spector also serves as an officer of other funds. Mr. Spector is an employee of Fidelity Investments (2016-present). Prior to joining Fidelity Investments, Mr. Spector served as Director at the Siegfried Group (accounting firm, 2013-2016), and prior to Siegfried Group as audit senior manager at Deloitte & Touche (accounting firm, 2005-2013).
Renee Stagnone (1975)
Year of Election or Appointment: 2016
Assistant Treasurer
Ms. Stagnone also serves as an officer of other funds. Ms. Stagnone is an employee of Fidelity Investments (1997-present). Previously, Ms. Stagnone served as Deputy Treasurer of certain Fidelity® funds (2013-2016).
Shareholder Expense Example
As a shareholder of the Fund, you incur two types of costs: (1) transaction costs, and (2) ongoing costs, including management fees and other Fund expenses. This Example is intended to help you understand your ongoing costs (in dollars) of investing in the Fund and to compare these costs with the ongoing costs of investing in other mutual funds.
The Example is based on an investment of $1,000 invested at the beginning of the period and held for the entire period (August 1, 2016 to January 31, 2017).
Actual Expenses
The first line of the accompanying table for each class of the Fund provides information about actual account values and actual expenses. You may use the information in this line, together with the amount you invested, to estimate the expenses that you paid over the period. Simply divide your account value by $1,000.00 (for example, an $8,600 account value divided by $1,000.00 = 8.6), then multiply the result by the number in the first line for a class of the Fund under the heading entitled "Expenses Paid During Period" to estimate the expenses you paid on your account during this period. A small balance maintenance fee of $12.00 that is charged once a year may apply for certain accounts with a value of less than $2,000. This fee is not included in the table below. If it was, the estimate of expenses you paid during the period would be higher, and your ending account value lower, by this amount. In addition, the Fund, as a shareholder in the underlying Fidelity Central Funds, will indirectly bear its pro-rata share of the fees and expenses incurred by the underlying Fidelity Central Funds. These fees and expenses are not included in the Fund's annualized expense ratio used to calculate the expense estimate in the table below.
Hypothetical Example for Comparison Purposes
The second line of the accompanying table for each class of the Fund provides information about hypothetical account values and hypothetical expenses based on a Class' actual expense ratio and an assumed rate of return of 5% per year before expenses, which is not the Class' actual return. The hypothetical account values and expenses may not be used to estimate the actual ending account balance or expenses you paid for the period. You may use this information to compare the ongoing costs of investing in the Fund and other funds. To do so, compare this 5% hypothetical example with the 5% hypothetical examples that appear in the shareholder reports of the other funds. A small balance maintenance fee of $12.00 that is charged once a year may apply for certain accounts with a value of less than $2,000. This fee is not included in the table below. If it was, the estimate of expenses you paid during the period would be higher, and your ending account value lower, by this amount. In addition, the Fund, as a shareholder in the underlying Fidelity Central Funds, will indirectly bear its pro-rata share of the fees and expenses incurred by the underlying Fidelity Central Funds. These fees and expenses are not included in the Fund's annualized expense ratio used to calculate the expense estimate in the table below.
Please note that the expenses shown in the table are meant to highlight your ongoing costs only and do not reflect any transaction costs. Therefore, the second line of the table is useful in comparing ongoing costs only, and will not help you determine the relative total costs of owning different funds.
| | Annualized Expense Ratio-A | Beginning
Account Value
August 1, 2016 | Ending
Account Value
January 31, 2017 | Expenses Paid
During Period-B
August 1, 2016
to January 31, 2017 |
| Equity-Income | .62% | | | |
| Actual | | $1,000.00 | $1,084.60 | $3.25 |
| Hypothetical-C | | $1,000.00 | $1,022.02 | $3.15 |
| Class K | .52% | | | |
| Actual | | $1,000.00 | $1,085.30 | $2.73 |
| Hypothetical-C | | $1,000.00 | $1,022.52 | $2.64 |
A Annualized expense ratio reflects expenses net of applicable fee waivers.
B Expenses are equal to each Class' annualized expense ratio, multiplied by the average account value over the period, multiplied by 184/366 (to reflect the one-half year period).
C 5% return per year before expenses
Distributions (Unaudited)
The Board of Trustees of Fidelity Equity-Income Fund voted to pay to shareholders of record at the opening of business on record date, the following distributions per share derived from capital gains realized from sales of portfolio securities:
| | Pay Date | Record Date | Capital Gains |
| Fidelity Equity-Income Fund | | | |
| Equity Income | 03/13/2017 | 03/10/2017 | $0.507 |
| Class K | 03/13/2017 | 03/10/2017 | $0.512 |
|
The fund hereby designates as a capital gain dividend with respect to the taxable year ended January 31, 2017, $107,001,300, or, if subsequently determined to be different, the net capital gain of such year.
A total of 0.16% of the dividends distributed during the fiscal year was derived from interest on U.S. Government securities which is generally exempt from state income tax.
Equity Income designates 85%, 85%, 85%, 85% and 84%; Class K designates 71%, 80%, 81%, 81% and 82%; of the dividends distributed in March, April, July, October and December 2016, respectively during the fiscal year as qualifying for the dividends–received deduction for corporate shareholders.
Equity Income designates 71%, 91%, 96%, 96% and 96%; Class K designates 59%, 85%, 92%, 92% and 93%; of the dividends distributed in March, April, July, October and December 2016, respectively during the fiscal year as amounts which may be taken into account as a dividend for purposes of the maximum rate under section 1(h)(11) of the Internal Revenue Code.
The fund will notify shareholders in January 2018 of amounts for use in preparing 2017 income tax returns.

Corporate Headquarters
245 Summer St.
Boston, MA 02210
www.fidelity.com
EQU-ANN-0317
1.471443.120
Fidelity Advisor® Mid Cap Value Fund - Class A, Class T, Class C and Class I
Annual Report January 31, 2017 Class A, Class T, Class C and Class I are classes of Fidelity® Mid Cap Value Fund |
|
Contents
To view a fund's proxy voting guidelines and proxy voting record for the 12-month period ended June 30, visit http://www.fidelity.com/proxyvotingresults or visit the Securities and Exchange Commission's (SEC) web site at http://www.sec.gov.
You may also call 1-877-208-0098 to request a free copy of the proxy voting guidelines.
Standard & Poor's, S&P and S&P 500 are registered service marks of The McGraw-Hill Companies, Inc. and have been licensed for use by Fidelity Distributors Corporation.
Other third-party marks appearing herein are the property of their respective owners.
All other marks appearing herein are registered or unregistered trademarks or service marks of FMR LLC or an affiliated company. © 2017 FMR LLC. All rights reserved.
This report and the financial statements contained herein are submitted for the general information of the shareholders of the Fund. This report is not authorized for distribution to prospective investors in the Fund unless preceded or accompanied by an effective prospectus.
A fund files its complete schedule of portfolio holdings with the SEC for the first and third quarters of each fiscal year on Form N-Q. Forms N-Q are available on the SEC’s web site at http://www.sec.gov. A fund's Forms N-Q may be reviewed and copied at the SEC’s Public Reference Room in Washington, DC. Information regarding the operation of the SEC's Public Reference Room may be obtained by calling 1-800-SEC-0330.
For a complete list of a fund's portfolio holdings, view the most recent holdings listing, semiannual report, or annual report on Fidelity's web site at http://www.fidelity.com, http://www.institutional.fidelity.com, or http://www.401k.com, as applicable.
NOT FDIC INSURED •MAY LOSE VALUE •NO BANK GUARANTEE
Neither the Fund nor Fidelity Distributors Corporation is a bank.
Performance: The Bottom Line
Average annual total return reflects the change in the value of an investment, assuming reinvestment of distributions from dividend income and capital gains (the profits earned upon the sale of securities that have grown in value, if any) and assuming a constant rate of performance each year. The hypothetical investment and the average annual total returns do not reflect the deduction of taxes that a shareholder would pay on fund distributions or the redemption of fund shares. During periods of reimbursement by Fidelity, a fund’s total return will be greater than it would be had the reimbursement not occurred. How a fund did yesterday is no guarantee of how it will do tomorrow.
Average Annual Total Returns
| For the periods ended January 31, 2017 | Past 1 year | Past 5 years | Past 10 years |
| Class A (incl. 5.75% sales charge) | 15.80% | 13.21% | 6.40% |
| Class T (incl. 3.50% sales charge) | 18.19% | 13.43% | 6.37% |
| Class C (incl. contingent deferred sales charge) | 20.97% | 13.70% | 6.24% |
| Class I | 23.19% | 14.87% | 7.32% |
Class A shares bear a 0.25% 12b-1 fee. The initial offering of Class A shares took place on February 13, 2007. Returns prior to February 13, 2007, are those of Fidelity® Mid Cap Value Fund, the original class of the fund, which has no 12b-1 fee. Had Class A's 12b-1 fee been reflected, returns prior to February 13, 2007, would have been lower.
Class T shares bear a 0.50% 12b-1 fee. The initial offering of Class T shares took place on February 13, 2007. Returns prior to February 13, 2007, are those of Fidelity® Mid Cap Value Fund, the original class of the fund, which has no 12b-1 fee. Had Class T's 12b-1 fee been reflected, returns prior to February 13, 2007, would have been lower.
Class C shares bear a 1.00% 12b-1 fee. The initial offering of Class C shares took place on February 13, 2007. Returns prior to February 13, 2007, are those of Fidelity® Mid Cap Value Fund, the original class of the fund, which has no 12b-1 fee. Had Class C's 12b-1 fee been reflected, returns prior to February 13, 2007, would have been lower.
Class C shares' contingent deferred sales charges included in the past one year, past five years and past ten years total return figures are 1%, 0% and 0%, respectively.
The initial offering of Class I shares took place on February 13, 2007. Returns prior to February 13, 2007 are those of Fidelity® Mid Cap Value Fund, the original class of the fund.
$10,000 Over 10 Years
Let's say hypothetically that $10,000 was invested in Fidelity Advisor® Mid Cap Value Fund - Class A on January 31, 2007, and the current 5.75% sales charge was paid.
The chart shows how the value of your investment would have changed, and also shows how the Russell Midcap® Value Index performed over the same period.
See previous page for additional information regarding the performance of Class A.
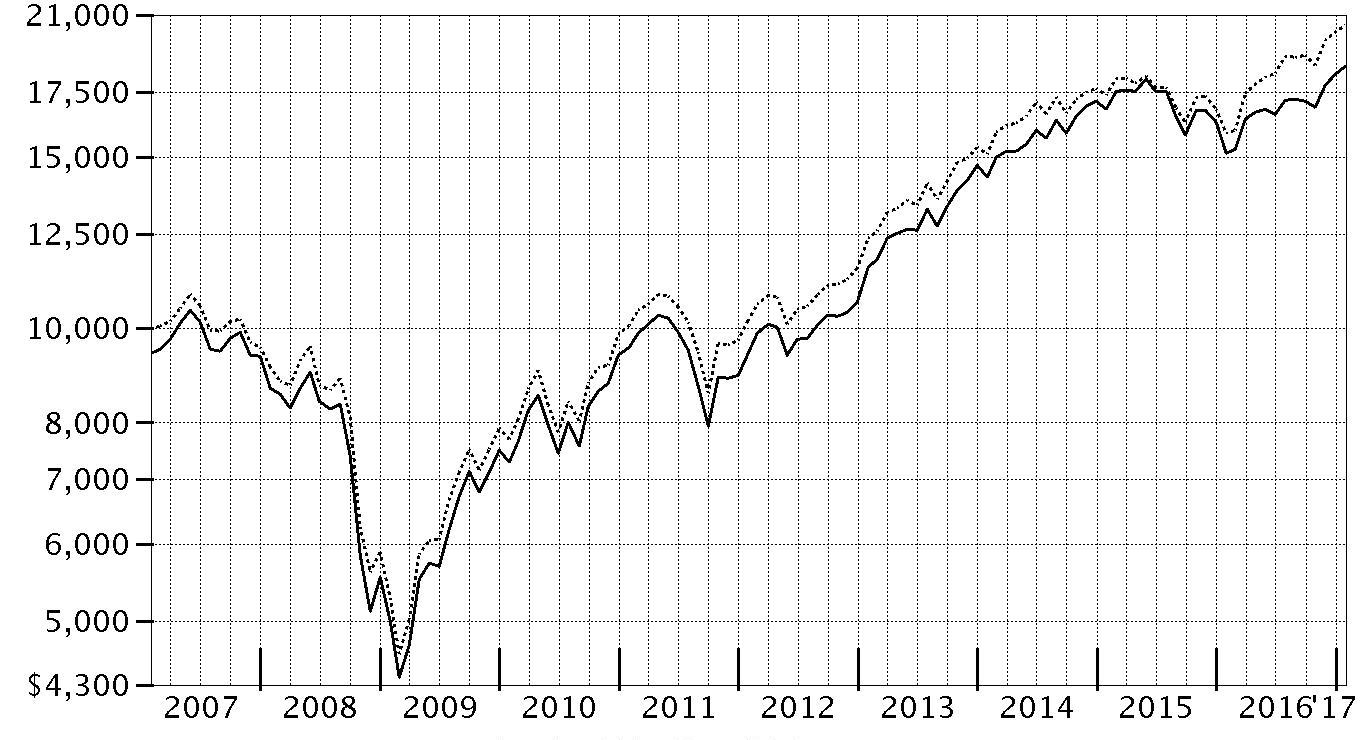
| Period Ending Values |
| $18,603 | Fidelity Advisor® Mid Cap Value Fund - Class A |
| $20,494 | Russell Midcap® Value Index |
Management's Discussion of Fund Performance
Market Recap: The U.S. equity bellwether S&P 500
®index posted a 20.04% gain for the year ending January 31, 2017, rising sharply in the period’s final months on renewed optimism for economic growth. The beginning of the period saw improving investor sentiment amid U.S. job gains, a rally in energy and other stimuli that helped keep the seven-year bull uptrend intact. Markets tumbled briefly following the U.K.’s June 23 vote to exit the European Union (Brexit) – then recovered quickly and settled into a flattish stretch until the November 8 U.S. presidential election. Stocks then broke out in response to Donald Trump’s surprise victory, surging to a series of new all-time highs on expectations for reflation and fiscal stimulus. For the year, industrials (+28%), energy (+27%) and materials (+37%) all did well, the latter two driven by a cyclical rebound in commodity prices. Financials (+35%) also shined, riding an uptick in bond yields and the strong rally in banks (+41%), especially post-election. Information technology rose about 25%, despite cooling off in the fourth quarter of 2016. Conversely, real estate (+8%) lagged on the prospect for rising interest rates. An improved backdrop for riskier assets curbed dividend-rich telecommunication services (+13%), utilities (+12%) and consumer staples (+6%). Health care (+8%) underperformed amid an uncertain political and regulatory outlook.
Comments from Portfolio Manager Court Dignan: For the year, the fund’s share classes (excluding sales charges, if applicable) gained roughly 22% to 23%, lagging the 29.15% advance of the benchmark Russell Midcap
® Value Index. Versus the Russell benchmark, stock picks in the health care and materials sectors hurt most. Individual relative detractors included two pharmaceuticals stocks: Israel-based Teva Pharmaceutical Industries, a non-benchmark holding, and Ireland’s Endo International, both of which fell due to the threat of price deflation on generic drugs and company-specific issues. I sold Endo by period end and added to Teva, based on its deep pipeline of products. In materials, fertilizer producer CF Industries Holdings detracted because shares declined in the first five months of the period, when CF was not in the benchmark. The firm was pressured by new nitrogen supply that hurt pricing, among other factors. Conversely, security selection and an underweighting in real estate helped, as did picks in diversified financials. Notable individual contributors included Discover Financial Services, a non-benchmark consumer finance company and our largest holding, and Science Applications International, a logistics and cyber security company that gained from better-than-expected earnings. Science Applications was not held at period end.
The views expressed above reflect those of the portfolio manager(s) only through the end of the period as stated on the cover of this report and do not necessarily represent the views of Fidelity or any other person in the Fidelity organization. Any such views are subject to change at any time based upon market or other conditions and Fidelity disclaims any responsibility to update such views. These views may not be relied on as investment advice and, because investment decisions for a Fidelity fund are based on numerous factors, may not be relied on as an indication of trading intent on behalf of any Fidelity fund.
Investment Summary (Unaudited)
Top Ten Stocks as of January 31, 2017
| | % of fund's net assets | % of fund's net assets 6 months ago |
| Discover Financial Services | 2.8 | 3.3 |
| American Tower Corp. | 2.8 | 2.0 |
| FNF Group | 2.6 | 2.6 |
| Synchrony Financial | 2.6 | 1.8 |
| Baker Hughes, Inc. | 2.4 | 1.2 |
| Mack-Cali Realty Corp. | 2.1 | 2.1 |
| Teva Pharmaceutical Industries Ltd. sponsored ADR | 1.8 | 3.2 |
| Allison Transmission Holdings, Inc. | 1.8 | 0.8 |
| DTE Energy Co. | 1.7 | 1.1 |
| AerCap Holdings NV | 1.7 | 2.0 |
| | 22.3 | |
Top Five Market Sectors as of January 31, 2017
| | % of fund's net assets | % of fund's net assets 6 months ago |
| Financials | 19.2 | 34.5 |
| Real Estate | 12.7 | 0.0 |
| Industrials | 11.2 | 10.1 |
| Utilities | 10.5 | 10.9 |
| Energy | 10.1 | 9.0 |
Prior period industry classifications reflect the categories in place as of the date indicated and have not been adjusted to reflect current industry classifications.
Asset Allocation (% of fund's net assets)
| As of January 31, 2017* |
| | Stocks | 96.2% |
| | Convertible Securities | 0.5% |
| | Short-Term Investments and Net Other Assets (Liabilities) | 3.3% |

* Foreign investments - 13.4%
| As of July 31, 2016* |
| | Stocks | 97.8% |
| | Short-Term Investments and Net Other Assets (Liabilities) | 2.2% |

* Foreign investments - 15.5%
Percentages shown as 0.0% may reflect amounts less than 0.05%.
Investments January 31, 2017
Showing Percentage of Net Assets
| Common Stocks - 96.2% | | | |
| | | Shares | Value |
| CONSUMER DISCRETIONARY - 8.1% | | | |
| Auto Components - 0.9% | | | |
| Delphi Automotive PLC | | 330,300 | $23,140,818 |
| The Goodyear Tire & Rubber Co. | | 149,500 | 4,842,305 |
| | | | 27,983,123 |
| Hotels, Restaurants & Leisure - 2.7% | | | |
| International Game Technology PLC | | 87,900 | 2,321,439 |
| Royal Caribbean Cruises Ltd. | | 419,600 | 39,287,148 |
| U.S. Foods Holding Corp. | | 313,700 | 8,532,640 |
| Wyndham Worldwide Corp. | | 476,700 | 37,687,902 |
| | | | 87,829,129 |
| Household Durables - 1.8% | | | |
| D.R. Horton, Inc. | | 313,300 | 9,370,803 |
| Harman International Industries, Inc. | | 35,500 | 3,946,180 |
| PulteGroup, Inc. | | 1,766,500 | 37,997,415 |
| Whirlpool Corp. | | 45,100 | 7,887,539 |
| | | | 59,201,937 |
| Internet & Direct Marketing Retail - 0.7% | | | |
| Liberty Interactive Corp. QVC Group Series A (a) | | 1,284,100 | 24,629,038 |
| Media - 1.4% | | | |
| Interpublic Group of Companies, Inc. | | 894,000 | 21,035,820 |
| Liberty Global PLC LiLAC Class A (a) | | 17 | 391 |
| Twenty-First Century Fox, Inc. Class A | | 838,700 | 26,318,406 |
| | | | 47,354,617 |
| Specialty Retail - 0.6% | | | |
| GameStop Corp. Class A (b) | | 814,459 | 19,946,101 |
|
| TOTAL CONSUMER DISCRETIONARY | | | 266,943,945 |
|
| CONSUMER STAPLES - 3.1% | | | |
| Beverages - 0.5% | | | |
| Molson Coors Brewing Co. Class B | | 161,800 | 15,616,936 |
| Food & Staples Retailing - 0.2% | | | |
| Kroger Co. | | 244,700 | 8,310,012 |
| Food Products - 2.4% | | | |
| ConAgra Foods, Inc. | | 592,600 | 23,164,734 |
| Lamb Weston Holdings, Inc. | | 471,933 | 17,631,417 |
| Mead Johnson Nutrition Co. Class A | | 107,400 | 7,567,404 |
| The J.M. Smucker Co. | | 221,700 | 30,117,945 |
| | | | 78,481,500 |
|
| TOTAL CONSUMER STAPLES | | | 102,408,448 |
|
| ENERGY - 9.6% | | | |
| Energy Equipment & Services - 2.4% | | | |
| Baker Hughes, Inc. | | 1,225,200 | 77,285,616 |
| Oil, Gas & Consumable Fuels - 7.2% | | | |
| Anadarko Petroleum Corp. | | 640,500 | 44,533,965 |
| Apache Corp. | | 49,100 | 2,937,162 |
| Cheniere Energy, Inc. (a) | | 108,700 | 5,179,555 |
| Continental Resources, Inc. (a) | | 45,000 | 2,185,200 |
| EQT Corp. | | 582,100 | 35,292,723 |
| Marathon Petroleum Corp. | | 430,400 | 20,680,720 |
| Newfield Exploration Co. (a) | | 840,400 | 33,683,232 |
| Noble Energy, Inc. | | 398,400 | 15,840,384 |
| PDC Energy, Inc. (a) | | 177,900 | 13,153,926 |
| QEP Resources, Inc. (a) | | 1,589,200 | 27,715,648 |
| Targa Resources Corp. | | 409,100 | 23,572,342 |
| Teekay LNG Partners LP | | 599,217 | 10,905,749 |
| Whiting Petroleum Corp. (a) | | 189,200 | 2,098,228 |
| | | | 237,778,834 |
|
| TOTAL ENERGY | | | 315,064,450 |
|
| FINANCIALS - 19.2% | | | |
| Banks - 4.1% | | | |
| East West Bancorp, Inc. | | 812,600 | 41,800,144 |
| PNC Financial Services Group, Inc. | | 135,015 | 16,263,907 |
| Regions Financial Corp. | | 1,535,917 | 22,132,564 |
| SunTrust Banks, Inc. | | 672,200 | 38,194,404 |
| U.S. Bancorp | | 284,800 | 14,994,720 |
| | | | 133,385,739 |
| Capital Markets - 1.4% | | | |
| Northern Trust Corp. | | 215,700 | 17,894,472 |
| The Blackstone Group LP | | 899,500 | 27,551,685 |
| | | | 45,446,157 |
| Consumer Finance - 5.4% | | | |
| Discover Financial Services | | 1,344,800 | 93,167,745 |
| Synchrony Financial | | 2,379,800 | 85,244,436 |
| | | | 178,412,181 |
| Diversified Financial Services - 0.3% | | | |
| Voya Financial, Inc. | | 195,000 | 7,842,900 |
| Insurance - 7.9% | | | |
| Allied World Assurance Co. Holdings AG | | 203,300 | 10,801,329 |
| Allstate Corp. | | 438,676 | 32,992,822 |
| American Financial Group, Inc. | | 329,800 | 28,418,866 |
| AmTrust Financial Services, Inc. | | 1,694,310 | 44,712,841 |
| Brown & Brown, Inc. | | 65,000 | 2,738,450 |
| Chubb Ltd. | | 360,329 | 47,379,660 |
| FNF Group | | 2,441,000 | 86,313,760 |
| Principal Financial Group, Inc. | | 139,300 | 7,952,637 |
| | | | 261,310,365 |
| Mortgage Real Estate Investment Trusts - 0.1% | | | |
| MFA Financial, Inc. | | 565,700 | 4,463,373 |
|
| TOTAL FINANCIALS | | | 630,860,715 |
|
| HEALTH CARE - 4.8% | | | |
| Health Care Equipment & Supplies - 1.3% | | | |
| Alere, Inc. (a) | | 66,000 | 2,442,000 |
| Zimmer Biomet Holdings, Inc. | | 349,500 | 41,356,335 |
| | | | 43,798,335 |
| Health Care Providers & Services - 1.7% | | | |
| Cigna Corp. | | 55,800 | 8,159,076 |
| HCA Holdings, Inc. (a) | | 249,900 | 20,061,972 |
| Laboratory Corp. of America Holdings (a) | | 147,800 | 19,836,238 |
| Universal Health Services, Inc. Class B | | 60,600 | 6,825,378 |
| | | | 54,882,664 |
| Pharmaceuticals - 1.8% | | | |
| Teva Pharmaceutical Industries Ltd. sponsored ADR | | 1,776,800 | 59,398,424 |
|
| TOTAL HEALTH CARE | | | 158,079,423 |
|
| INDUSTRIALS - 11.2% | | | |
| Airlines - 1.1% | | | |
| American Airlines Group, Inc. | | 564,400 | 24,974,700 |
| JetBlue Airways Corp. (a) | | 534,200 | 10,475,662 |
| | | | 35,450,362 |
| Commercial Services & Supplies - 1.3% | | | |
| KAR Auction Services, Inc. | | 728,400 | 33,178,620 |
| Stericycle, Inc. (a) | | 132,400 | 10,213,336 |
| | | | 43,391,956 |
| Construction & Engineering - 0.4% | | | |
| AECOM (a) | | 262,170 | 9,681,938 |
| KBR, Inc. | | 322,300 | 5,482,323 |
| | | | 15,164,261 |
| Electrical Equipment - 2.0% | | | |
| AMETEK, Inc. | | 976,300 | 49,888,930 |
| Fortive Corp. | | 149,250 | 8,255,018 |
| Generac Holdings, Inc. (a) | | 197,600 | 7,955,376 |
| | | | 66,099,324 |
| Machinery - 4.3% | | | |
| Allison Transmission Holdings, Inc. | | 1,672,400 | 58,500,552 |
| Ingersoll-Rand PLC | | 639,400 | 50,736,390 |
| Stanley Black & Decker, Inc. | | 260,300 | 32,277,200 |
| | | | 141,514,142 |
| Road & Rail - 0.3% | | | |
| Genesee & Wyoming, Inc. Class A (a) | | 140,100 | 10,557,936 |
| Trading Companies & Distributors - 1.8% | | | |
| AerCap Holdings NV (a) | | 1,240,500 | 54,916,935 |
| United Rentals, Inc. (a) | | 26,600 | 3,365,166 |
| | | | 58,282,101 |
|
| TOTAL INDUSTRIALS | | | 370,460,082 |
|
| INFORMATION TECHNOLOGY - 9.0% | | | |
| Communications Equipment - 1.7% | | | |
| Brocade Communications Systems, Inc. | | 1,035,600 | 12,913,932 |
| CommScope Holding Co., Inc. (a) | | 681,800 | 25,785,676 |
| Harris Corp. | | 164,100 | 16,854,711 |
| | | | 55,554,319 |
| Electronic Equipment & Components - 1.4% | | | |
| Dell Technologies, Inc. (a) | | 413,024 | 26,016,382 |
| TE Connectivity Ltd. | | 267,000 | 19,851,450 |
| | | | 45,867,832 |
| Internet Software & Services - 0.4% | | | |
| Akamai Technologies, Inc. (a) | | 188,500 | 12,929,215 |
| IT Services - 0.8% | | | |
| Cognizant Technology Solutions Corp. Class A (a) | | 122,600 | 6,447,534 |
| Fidelity National Information Services, Inc. | | 257,900 | 20,482,418 |
| | | | 26,929,952 |
| Semiconductors & Semiconductor Equipment - 3.5% | | | |
| Lam Research Corp. | | 299,700 | 34,423,542 |
| Micron Technology, Inc. (a) | | 609,400 | 14,692,634 |
| NXP Semiconductors NV (a) | | 290,600 | 28,435,210 |
| ON Semiconductor Corp. (a) | | 1,802,900 | 24,014,628 |
| Qorvo, Inc. (a) | | 108,400 | 6,960,364 |
| Skyworks Solutions, Inc. | | 57,000 | 5,229,180 |
| | | | 113,755,558 |
| Software - 0.6% | | | |
| Check Point Software Technologies Ltd. (a) | | 206,800 | 20,425,636 |
| Technology Hardware, Storage & Peripherals - 0.6% | | | |
| Western Digital Corp. | | 265,184 | 21,143,120 |
|
| TOTAL INFORMATION TECHNOLOGY | | | 296,605,632 |
|
| MATERIALS - 7.1% | | | |
| Chemicals - 3.5% | | | |
| Celanese Corp. Class A | | 224,000 | 18,905,600 |
| CF Industries Holdings, Inc. | | 492,100 | 17,366,209 |
| Eastman Chemical Co. | | 245,800 | 19,049,500 |
| LyondellBasell Industries NV Class A | | 453,200 | 42,269,964 |
| The Chemours Co. LLC | | 699,100 | 18,470,222 |
| | | | 116,061,495 |
| Construction Materials - 0.7% | | | |
| Eagle Materials, Inc. | | 199,500 | 20,863,710 |
| Vulcan Materials Co. | | 21,000 | 2,694,930 |
| | | | 23,558,640 |
| Containers & Packaging - 1.9% | | | |
| Graphic Packaging Holding Co. | | 2,209,100 | 27,635,841 |
| WestRock Co. | | 636,300 | 33,952,968 |
| | | | 61,588,809 |
| Metals & Mining - 1.0% | | | |
| Franco-Nevada Corp. | | 289,516 | 18,831,611 |
| Freeport-McMoRan, Inc. (a) | | 163,800 | 2,727,270 |
| Steel Dynamics, Inc. | | 369,500 | 12,492,795 |
| | | | 34,051,676 |
|
| TOTAL MATERIALS | | | 235,260,620 |
|
| REAL ESTATE - 12.7% | | | |
| Equity Real Estate Investment Trusts (REITs) - 12.3% | | | |
| American Tower Corp. | | 878,457 | 90,920,300 |
| Brixmor Property Group, Inc. | | 385,000 | 9,290,050 |
| Colony NorthStar, Inc. | | 757,844 | 10,549,188 |
| Corporate Office Properties Trust (SBI) | | 402,400 | 12,804,368 |
| EastGroup Properties, Inc. | | 185,500 | 13,127,835 |
| Equity Lifestyle Properties, Inc. | | 223,200 | 16,503,408 |
| Essex Property Trust, Inc. | | 213,400 | 47,865,620 |
| Lamar Advertising Co. Class A (b) | | 282,600 | 21,341,952 |
| Life Storage, Inc. | | 216,400 | 17,625,780 |
| Mack-Cali Realty Corp. | | 2,522,800 | 70,688,856 |
| Piedmont Office Realty Trust, Inc. Class A | | 670,300 | 14,558,916 |
| Prologis, Inc. | | 819,200 | 40,017,920 |
| Public Storage | | 83,600 | 17,974,000 |
| Taubman Centers, Inc. | | 185,700 | 13,154,988 |
| Ventas, Inc. | | 85,300 | 5,260,451 |
| Welltower, Inc. | | 29,400 | 1,949,220 |
| | | | 403,632,852 |
| Real Estate Management & Development - 0.4% | | | |
| CBRE Group, Inc. (a) | | 433,900 | 13,173,204 |
|
| TOTAL REAL ESTATE | | | 416,806,056 |
|
| TELECOMMUNICATION SERVICES - 0.9% | | | |
| Diversified Telecommunication Services - 0.9% | | | |
| Level 3 Communications, Inc. (a) | | 496,700 | 29,533,782 |
| UTILITIES - 10.5% | | | |
| Electric Utilities - 5.3% | | | |
| American Electric Power Co., Inc. | | 610,600 | 39,115,036 |
| Edison International | | 523,800 | 38,174,544 |
| IDACORP, Inc. | | 389,800 | 31,191,796 |
| NextEra Energy, Inc. | | 68,100 | 8,425,332 |
| PPL Corp. | | 634,100 | 22,092,044 |
| Xcel Energy, Inc. | | 883,700 | 36,514,484 |
| | | | 175,513,236 |
| Gas Utilities - 0.5% | | | |
| Atmos Energy Corp. | | 227,500 | 17,330,950 |
| Independent Power and Renewable Electricity Producers - 0.2% | | | |
| NRG Energy, Inc. | | 298,800 | 4,942,152 |
| Multi-Utilities - 4.5% | | | |
| Avangrid, Inc. | | 181,100 | 7,026,680 |
| CenterPoint Energy, Inc. | | 533,100 | 13,972,551 |
| CMS Energy Corp. | | 380,700 | 16,217,820 |
| DTE Energy Co. | | 578,700 | 57,082,968 |
| NiSource, Inc. | | 444,900 | 9,952,413 |
| Public Service Enterprise Group, Inc. | | 69,400 | 3,070,950 |
| Sempra Energy | | 399,700 | 40,925,283 |
| | | | 148,248,665 |
|
| TOTAL UTILITIES | | | 346,035,003 |
|
| TOTAL COMMON STOCKS | | | |
| (Cost $2,712,065,861) | | | 3,168,058,156 |
| | | Principal Amount | Value |
|
| Convertible Bonds - 0.5% | | | |
| ENERGY - 0.5% | | | |
| Oil, Gas & Consumable Fuels - 0.5% | | | |
Scorpio Tankers, Inc. 2.375% 7/1/19
(Cost $16,332,840)(c) | | 19,410,000 | 16,316,531 |
| | | Shares | Value |
|
| Money Market Funds - 2.6% | | | |
| Fidelity Cash Central Fund, 0.62% (d) | | 81,603,813 | 81,620,134 |
| Fidelity Securities Lending Cash Central Fund 0.65% (d)(e) | | 4,607,102 | 4,608,023 |
| TOTAL MONEY MARKET FUNDS | | | |
| (Cost $86,221,277) | | | 86,228,157 |
| TOTAL INVESTMENT PORTFOLIO - 99.3% | | | |
| (Cost $2,814,619,978) | | | 3,270,602,844 |
| NET OTHER ASSETS (LIABILITIES) - 0.7% | | | 24,092,208 |
| NET ASSETS - 100% | | | $3,294,695,052 |
Legend
(a) Non-income producing
(b) Security or a portion of the security is on loan at period end.
(c) Security exempt from registration under Rule 144A of the Securities Act of 1933. These securities may be resold in transactions exempt from registration, normally to qualified institutional buyers. At the end of the period, the value of these securities amounted to $16,316,531 or 0.5% of net assets.
(d) Affiliated fund that is generally available only to investment companies and other accounts managed by Fidelity Investments. The rate quoted is the annualized seven-day yield of the fund at period end. A complete unaudited listing of the fund's holdings as of its most recent quarter end is available upon request. In addition, each Fidelity Central Fund's financial statements, which are not covered by the Fund's Report of Independent Registered Public Accounting Firm, are available on the SEC's website or upon request.
(e) Investment made with cash collateral received from securities on loan.
Affiliated Central Funds
Information regarding fiscal year to date income earned by the Fund from investments in Fidelity Central Funds is as follows:
| Fund | Income earned |
| Fidelity Cash Central Fund | $250,631 |
| Fidelity Securities Lending Cash Central Fund | 388,531 |
| Total | $639,162 |
Investment Valuation
The following is a summary of the inputs used, as of January 31, 2017, involving the Fund's assets and liabilities carried at fair value. The inputs or methodology used for valuing securities may not be an indication of the risk associated with investing in those securities. For more information on valuation inputs, and their aggregation into the levels used below, please refer to the Investment Valuation section in the accompanying Notes to Financial Statements.
| | Valuation Inputs at Reporting Date: |
| Description | Total | Level 1 | Level 2 | Level 3 |
| Investments in Securities: | | | | |
| Equities: | | | | |
| Consumer Discretionary | $266,943,945 | $266,943,945 | $-- | $-- |
| Consumer Staples | 102,408,448 | 102,408,448 | -- | -- |
| Energy | 315,064,450 | 315,064,450 | -- | -- |
| Financials | 630,860,715 | 630,860,715 | -- | -- |
| Health Care | 158,079,423 | 158,079,423 | -- | -- |
| Industrials | 370,460,082 | 370,460,082 | -- | -- |
| Information Technology | 296,605,632 | 296,605,632 | -- | -- |
| Materials | 235,260,620 | 235,260,620 | -- | -- |
| Real Estate | 416,806,056 | 416,806,056 | -- | -- |
| Telecommunication Services | 29,533,782 | 29,533,782 | -- | -- |
| Utilities | 346,035,003 | 346,035,003 | -- | -- |
| Corporate Bonds | 16,316,531 | -- | 16,316,531 | -- |
| Money Market Funds | 86,228,157 | 86,228,157 | -- | -- |
| Total Investments in Securities: | $3,270,602,844 | $3,254,286,313 | $16,316,531 | $-- |
Other Information
Distribution of investments by country or territory of incorporation, as a percentage of Total Net Assets, is as follows (Unaudited):
| United States of America | 86.6% |
| Netherlands | 3.9% |
| Israel | 2.4% |
| Switzerland | 2.3% |
| Ireland | 1.5% |
| Liberia | 1.2% |
| Others (Individually Less Than 1%) | 2.1% |
| | 100.0% |
See accompanying notes which are an integral part of the financial statements.
Financial Statements
Statement of Assets and Liabilities
| | | January 31, 2017 |
| Assets | | |
Investment in securities, at value (including securities loaned of $4,543,543) — See accompanying schedule:
Unaffiliated issuers (cost $2,728,398,701) | $3,184,374,687 | |
| Fidelity Central Funds (cost $86,221,277) | 86,228,157 | |
| Total Investments (cost $2,814,619,978) | | $3,270,602,844 |
| Receivable for investments sold | | 42,699,022 |
| Receivable for fund shares sold | | 4,952,827 |
| Dividends receivable | | 878,461 |
| Interest receivable | | 39,632 |
| Distributions receivable from Fidelity Central Funds | | 42,694 |
| Prepaid expenses | | 5,351 |
| Other receivables | | 20,803 |
| Total assets | | 3,319,241,634 |
| Liabilities | | |
| Payable for investments purchased | $12,083,510 | |
| Payable for fund shares redeemed | 5,714,819 | |
| Accrued management fee | 1,284,897 | |
| Distribution and service plan fees payable | 206,664 | |
| Other affiliated payables | 587,684 | |
| Other payables and accrued expenses | 73,608 | |
| Collateral on Securities Loaned | 4,595,400 | |
| Total liabilities | | 24,546,582 |
| Net Assets | | $3,294,695,052 |
| Net Assets consist of: | | |
| Paid in capital | | $2,937,261,588 |
| Distributions in excess of net investment income | | (1,976,077) |
| Accumulated undistributed net realized gain (loss) on investments and foreign currency transactions | | (96,573,673) |
| Net unrealized appreciation (depreciation) on investments and assets and liabilities in foreign currencies | | 455,983,214 |
| Net Assets | | $3,294,695,052 |
| Calculation of Maximum Offering Price | | |
| Class A: | | |
| Net Asset Value and redemption price per share ($299,123,730 ÷ 11,993,075 shares) | | $24.94 |
| Maximum offering price per share (100/94.25 of $24.94) | | $26.46 |
| Class T: | | |
| Net Asset Value and redemption price per share ($60,760,657 ÷ 2,445,967 shares) | | $24.84 |
| Maximum offering price per share (100/96.50 of $24.84) | | $25.74 |
| Class C: | | |
| Net Asset Value and offering price per share ($144,503,227 ÷ 5,966,634 shares)(a) | | $24.22 |
| Mid Cap Value: | | |
| Net Asset Value, offering price and redemption price per share ($2,426,358,528 ÷ 96,118,871 shares) | | $25.24 |
| Class I: | | |
| Net Asset Value, offering price and redemption price per share ($363,948,910 ÷ 14,526,346 shares) | | $25.05 |
(a) Redemption price per share is equal to net asset value less any applicable contingent deferred sales charge.
See accompanying notes which are an integral part of the financial statements.
Statement of Operations
| | | Year ended January 31, 2017 |
| Investment Income | | |
| Dividends | | $71,404,378 |
| Interest | | 35,138 |
| Income from Fidelity Central Funds | | 639,162 |
| Total income | | 72,078,678 |
| Expenses | | |
| Management fee | | |
| Basic fee | $17,529,296 | |
| Performance adjustment | (1,506,968) | |
| Transfer agent fees | 6,131,167 | |
| Distribution and service plan fees | 2,398,907 | |
| Accounting and security lending fees | 947,053 | |
| Custodian fees and expenses | 71,809 | |
| Independent trustees' fees and expenses | 13,758 | |
| Registration fees | 160,887 | |
| Audit | 65,056 | |
| Legal | 10,590 | |
| Miscellaneous | 28,602 | |
| Total expenses before reductions | 25,850,157 | |
| Expense reductions | (172,522) | 25,677,635 |
| Net investment income (loss) | | 46,401,043 |
| Realized and Unrealized Gain (Loss) | | |
| Net realized gain (loss) on: | | |
| Investment securities: | | |
| Unaffiliated issuers | (11,769,221) | |
| Fidelity Central Funds | 11,826 | |
| Foreign currency transactions | 19,232 | |
| Total net realized gain (loss) | | (11,738,163) |
Change in net unrealized appreciation (depreciation) on:
Investment securities | 627,288,792 | |
| Assets and liabilities in foreign currencies | 348 | |
| Total change in net unrealized appreciation (depreciation) | | 627,289,140 |
| Net gain (loss) | | 615,550,977 |
| Net increase (decrease) in net assets resulting from operations | | $661,952,020 |
See accompanying notes which are an integral part of the financial statements.
Statement of Changes in Net Assets
| | Year ended January 31, 2017 | Year ended January 31, 2016 |
| Increase (Decrease) in Net Assets | | |
| Operations | | |
| Net investment income (loss) | $46,401,043 | $53,620,473 |
| Net realized gain (loss) | (11,738,163) | 29,947,105 |
| Change in net unrealized appreciation (depreciation) | 627,289,140 | (464,541,026) |
| Net increase (decrease) in net assets resulting from operations | 661,952,020 | (380,973,448) |
| Distributions to shareholders from net investment income | (41,087,101) | (48,238,328) |
| Distributions to shareholders from net realized gain | – | (123,721,000) |
| Total distributions | (41,087,101) | (171,959,328) |
| Share transactions - net increase (decrease) | (374,923,459) | 475,831,325 |
| Redemption fees | 60,004 | 106,541 |
| Total increase (decrease) in net assets | 246,001,464 | (76,994,910) |
| Net Assets | | |
| Beginning of period | 3,048,693,588 | 3,125,688,498 |
| End of period | $3,294,695,052 | $3,048,693,588 |
| Other Information | | |
| Distributions in excess of net investment income end of period | $(1,976,077) | $(2,952,557) |
See accompanying notes which are an integral part of the financial statements.
Financial Highlights — Fidelity Mid Cap Value Fund Class A
| Years ended January 31, | 2017 | 2016 | 2015 | 2014 | 2013 |
| Selected Per–Share Data | | | | | |
| Net asset value, beginning of period | $20.52 | $23.90 | $21.78 | $19.24 | $15.87 |
| Income from Investment Operations | | | | | |
| Net investment income (loss)A | .29 | .29 | .24 | .24 | .20 |
| Net realized and unrealized gain (loss) | 4.40 | (2.57) | 3.45 | 4.29 | 3.38 |
| Total from investment operations | 4.69 | (2.28) | 3.69 | 4.53 | 3.58 |
| Distributions from net investment income | (.27) | (.28) | (.17) | (.19) | (.21) |
| Distributions from net realized gain | – | (.82) | (1.40) | (1.79) | – |
| Total distributions | (.27) | (1.10) | (1.57) | (1.99)B | (.21) |
| Redemption fees added to paid in capitalA,C | – | – | – | – | – |
| Net asset value, end of period | $24.94 | $20.52 | $23.90 | $21.78 | $19.24 |
| Total ReturnD,E | 22.87% | (9.83)% | 17.32% | 23.69% | 22.73% |
| Ratios to Average Net AssetsF,G | | | | | |
| Expenses before reductions | 1.01% | 1.14% | 1.15% | 1.15% | 1.15% |
| Expenses net of fee waivers, if any | 1.01% | 1.14% | 1.15% | 1.15% | 1.15% |
| Expenses net of all reductions | 1.00% | 1.14% | 1.15% | 1.14% | 1.12% |
| Net investment income (loss) | 1.25% | 1.21% | 1.04% | 1.11% | 1.15% |
| Supplemental Data | | | | | |
| Net assets, end of period (000 omitted) | $299,124 | $277,462 | $171,263 | $67,826 | $24,436 |
| Portfolio turnover rateH | 83% | 83% | 69% | 169% | 180% |
A Calculated based on average shares outstanding during the period.
B Total distributions of $1.99 per share is comprised of distributions from net investment income of $.193 and distributions from net realized gain of $1.793 per share.
C Amount represents less than $.005 per share.
D Total returns would have been lower if certain expenses had not been reduced during the applicable periods shown.
E Total returns do not include the effect of the sales charges.
F Fees and expenses of any underlying Fidelity Central Funds are not included in the Fund's expense ratio. The Fund indirectly bears its proportionate share of the expenses of any underlying Fidelity Central Funds.
G Expense ratios reflect operating expenses of the class. Expenses before reductions do not reflect amounts reimbursed by the investment adviser or reductions from brokerage service arrangements or reductions from other expense offset arrangements and do not represent the amount paid by the class during periods when reimbursements or reductions occur. Expenses net of fee waivers reflect expenses after reimbursement by the investment adviser but prior to reductions from brokerage service arrangements or other expense offset arrangements. Expenses net of all reductions represent the net expenses paid by the class.
H Amount does not include the portfolio activity of any underlying Fidelity Central Funds.
See accompanying notes which are an integral part of the financial statements.
Financial Highlights — Fidelity Mid Cap Value Fund Class T
| Years ended January 31, | 2017 | 2016 | 2015 | 2014 | 2013 |
| Selected Per–Share Data | | | | | |
| Net asset value, beginning of period | $20.46 | $23.81 | $21.70 | $19.21 | $15.84 |
| Income from Investment Operations | | | | | |
| Net investment income (loss)A | .22 | .22 | .17 | .18 | .15 |
| Net realized and unrealized gain (loss) | 4.38 | (2.54) | 3.44 | 4.27 | 3.38 |
| Total from investment operations | 4.60 | (2.32) | 3.61 | 4.45 | 3.53 |
| Distributions from net investment income | (.22) | (.21) | (.10) | (.17) | (.16) |
| Distributions from net realized gain | – | (.82) | (1.40) | (1.79) | – |
| Total distributions | (.22) | (1.03) | (1.50) | (1.96) | (.16) |
| Redemption fees added to paid in capitalA,B | – | – | – | – | – |
| Net asset value, end of period | $24.84 | $20.46 | $23.81 | $21.70 | $19.21 |
| Total ReturnC,D | 22.48% | (10.04)% | 16.98% | 23.32% | 22.42% |
| Ratios to Average Net AssetsE,F | | | | | |
| Expenses before reductions | 1.29% | 1.42% | 1.44% | 1.42% | 1.42% |
| Expenses net of fee waivers, if any | 1.29% | 1.42% | 1.44% | 1.42% | 1.42% |
| Expenses net of all reductions | 1.29% | 1.42% | 1.44% | 1.41% | 1.38% |
| Net investment income (loss) | .96% | .93% | .74% | .84% | .89% |
| Supplemental Data | | | | | |
| Net assets, end of period (000 omitted) | $60,761 | $46,084 | $40,752 | $24,136 | $8,358 |
| Portfolio turnover rateG | 83% | 83% | 69% | 169% | 180% |
A Calculated based on average shares outstanding during the period.
B Amount represents less than $.005 per share.
C Total returns would have been lower if certain expenses had not been reduced during the applicable periods shown.
D Total returns do not include the effect of the sales charges.
E Fees and expenses of any underlying Fidelity Central Funds are not included in the Fund's expense ratio. The Fund indirectly bears its proportionate share of the expenses of any underlying Fidelity Central Funds.
F Expense ratios reflect operating expenses of the class. Expenses before reductions do not reflect amounts reimbursed by the investment adviser or reductions from brokerage service arrangements or reductions from other expense offset arrangements and do not represent the amount paid by the class during periods when reimbursements or reductions occur. Expenses net of fee waivers reflect expenses after reimbursement by the investment adviser but prior to reductions from brokerage service arrangements or other expense offset arrangements. Expenses net of all reductions represent the net expenses paid by the class.
G Amount does not include the portfolio activity of any underlying Fidelity Central Funds.
See accompanying notes which are an integral part of the financial statements.
Financial Highlights — Fidelity Mid Cap Value Fund Class C
| Years ended January 31, | 2017 | 2016 | 2015 | 2014 | 2013 |
| Selected Per–Share Data | | | | | |
| Net asset value, beginning of period | $19.95 | $23.30 | $21.31 | $18.93 | $15.65 |
| Income from Investment Operations | | | | | |
| Net investment income (loss)A | .11 | .11 | .07 | .08 | .07 |
| Net realized and unrealized gain (loss) | 4.27 | (2.49) | 3.37 | 4.20 | 3.32 |
| Total from investment operations | 4.38 | (2.38) | 3.44 | 4.28 | 3.39 |
| Distributions from net investment income | (.11) | (.15) | (.06) | (.11) | (.11) |
| Distributions from net realized gain | – | (.81) | (1.39) | (1.79) | – |
| Total distributions | (.11) | (.97)B | (1.45) | (1.90) | (.11) |
| Redemption fees added to paid in capitalA,C | – | – | – | – | – |
| Net asset value, end of period | $24.22 | $19.95 | $23.30 | $21.31 | $18.93 |
| Total ReturnD,E | 21.97% | (10.52)% | 16.48% | 22.77% | 21.73% |
| Ratios to Average Net AssetsF,G | | | | | |
| Expenses before reductions | 1.76% | 1.89% | 1.89% | 1.89% | 1.91% |
| Expenses net of fee waivers, if any | 1.76% | 1.89% | 1.89% | 1.89% | 1.91% |
| Expenses net of all reductions | 1.75% | 1.88% | 1.89% | 1.89% | 1.87% |
| Net investment income (loss) | .50% | .47% | .29% | .36% | .40% |
| Supplemental Data | | | | | |
| Net assets, end of period (000 omitted) | $144,503 | $130,636 | $71,263 | $25,177 | $6,820 |
| Portfolio turnover rateH | 83% | 83% | 69% | 169% | 180% |
A Calculated based on average shares outstanding during the period.
B Total distributions of $.97 per share is comprised of distributions from net investment income of $.153 and distributions from net realized gain of $.812 per share.
C Amount represents less than $.005 per share.
D Total returns would have been lower if certain expenses had not been reduced during the applicable periods shown.
E Total returns do not include the effect of the contingent deferred sales charge.
F Fees and expenses of any underlying Fidelity Central Funds are not included in the Fund's expense ratio. The Fund indirectly bears its proportionate share of the expenses of any underlying Fidelity Central Funds.
G Expense ratios reflect operating expenses of the class. Expenses before reductions do not reflect amounts reimbursed by the investment adviser or reductions from brokerage service arrangements or reductions from other expense offset arrangements and do not represent the amount paid by the class during periods when reimbursements or reductions occur. Expenses net of fee waivers reflect expenses after reimbursement by the investment adviser but prior to reductions from brokerage service arrangements or other expense offset arrangements. Expenses net of all reductions represent the net expenses paid by the class.
H Amount does not include the portfolio activity of any underlying Fidelity Central Funds.
See accompanying notes which are an integral part of the financial statements.
Financial Highlights — Fidelity Mid Cap Value Fund
| Years ended January 31, | 2017 | 2016 | 2015 | 2014 | 2013 |
| Selected Per–Share Data | | | | | |
| Net asset value, beginning of period | $20.76 | $24.15 | $21.96 | $19.37 | $15.97 |
| Income from Investment Operations | | | | | |
| Net investment income (loss)A | .35 | .36 | .32 | .32 | .25 |
| Net realized and unrealized gain (loss) | 4.46 | (2.60) | 3.49 | 4.31 | 3.41 |
| Total from investment operations | 4.81 | (2.24) | 3.81 | 4.63 | 3.66 |
| Distributions from net investment income | (.33) | (.33) | (.22) | (.25) | (.26) |
| Distributions from net realized gain | – | (.82) | (1.40) | (1.79) | – |
| Total distributions | (.33) | (1.15) | (1.62) | (2.04) | (.26) |
| Redemption fees added to paid in capitalA,B | – | – | – | – | – |
| Net asset value, end of period | $25.24 | $20.76 | $24.15 | $21.96 | $19.37 |
| Total ReturnC | 23.19% | (9.58)% | 17.75% | 24.08% | 23.07% |
| Ratios to Average Net AssetsD,E | | | | | |
| Expenses before reductions | .73% | .86% | .83% | .80% | .85% |
| Expenses net of fee waivers, if any | .73% | .85% | .83% | .80% | .85% |
| Expenses net of all reductions | .72% | .85% | .83% | .80% | .81% |
| Net investment income (loss) | 1.53% | 1.50% | 1.36% | 1.45% | 1.46% |
| Supplemental Data | | | | | |
| Net assets, end of period (000 omitted) | $2,426,359 | $2,331,665 | $2,691,765 | $1,404,968 | $638,425 |
| Portfolio turnover rateF | 83% | 83% | 69% | 169% | 180% |
A Calculated based on average shares outstanding during the period.
B Amount represents less than $.005 per share.
C Total returns would have been lower if certain expenses had not been reduced during the applicable periods shown.
D Fees and expenses of any underlying Fidelity Central Funds are not included in the Fund's expense ratio. The Fund indirectly bears its proportionate share of the expenses of any underlying Fidelity Central Funds.
E Expense ratios reflect operating expenses of the class. Expenses before reductions do not reflect amounts reimbursed by the investment adviser or reductions from brokerage service arrangements or reductions from other expense offset arrangements and do not represent the amount paid by the class during periods when reimbursements or reductions occur. Expenses net of fee waivers reflect expenses after reimbursement by the investment adviser but prior to reductions from brokerage service arrangements or other expense offset arrangements. Expenses net of all reductions represent the net expenses paid by the class.
F Amount does not include the portfolio activity of any underlying Fidelity Central Funds.
See accompanying notes which are an integral part of the financial statements.
Financial Highlights — Fidelity Mid Cap Value Fund Class I
| Years ended January 31, | 2017 | 2016 | 2015 | 2014 | 2013 |
| Selected Per–Share Data | | | | | |
| Net asset value, beginning of period | $20.61 | $24.00 | $21.84 | $19.29 | $15.91 |
| Income from Investment Operations | | | | | |
| Net investment income (loss)A | .35 | .35 | .32 | .31 | .24 |
| Net realized and unrealized gain (loss) | 4.43 | (2.58) | 3.47 | 4.28 | 3.40 |
| Total from investment operations | 4.78 | (2.23) | 3.79 | 4.59 | 3.64 |
| Distributions from net investment income | (.34) | (.34) | (.23) | (.25) | (.26) |
| Distributions from net realized gain | – | (.82) | (1.40) | (1.79) | – |
| Total distributions | (.34) | (1.16) | (1.63) | (2.04) | (.26) |
| Redemption fees added to paid in capitalA,B | – | – | – | – | – |
| Net asset value, end of period | $25.05 | $20.61 | $24.00 | $21.84 | $19.29 |
| Total ReturnC | 23.19% | (9.60)% | 17.75% | 23.98% | 23.05% |
| Ratios to Average Net AssetsD,E | | | | | |
| Expenses before reductions | .73% | .87% | .85% | .85% | .89% |
| Expenses net of fee waivers, if any | .73% | .86% | .85% | .85% | .89% |
| Expenses net of all reductions | .73% | .86% | .85% | .85% | .85% |
| Net investment income (loss) | 1.53% | 1.49% | 1.33% | 1.40% | 1.42% |
| Supplemental Data | | | | | |
| Net assets, end of period (000 omitted) | $363,949 | $261,686 | $148,390 | $26,277 | $7,875 |
| Portfolio turnover rateF | 83% | 83% | 69% | 169% | 180% |
A Calculated based on average shares outstanding during the period.
B Amount represents less than $.005 per share.
C Total returns would have been lower if certain expenses had not been reduced during the applicable periods shown.
D Fees and expenses of any underlying Fidelity Central Funds are not included in the Fund's expense ratio. The Fund indirectly bears its proportionate share of the expenses of any underlying Fidelity Central Funds.
E Expense ratios reflect operating expenses of the class. Expenses before reductions do not reflect amounts reimbursed by the investment adviser or reductions from brokerage service arrangements or reductions from other expense offset arrangements and do not represent the amount paid by the class during periods when reimbursements or reductions occur. Expenses net of fee waivers reflect expenses after reimbursement by the investment adviser but prior to reductions from brokerage service arrangements or other expense offset arrangements. Expenses net of all reductions represent the net expenses paid by the class.
F Amount does not include the portfolio activity of any underlying Fidelity Central Funds.
See accompanying notes which are an integral part of the financial statements.
Notes to Financial Statements
For the period ended January 31, 2017
1. Organization.
Fidelity Mid Cap Value Fund (the Fund) is a fund of Fidelity Devonshire Trust (the Trust) and is authorized to issue an unlimited number of shares. The Trust is registered under the Investment Company Act of 1940, as amended (the 1940 Act), as an open-end management investment company organized as a Massachusetts business trust. The Fund offers Class A, Class T, Class C, Mid Cap Value and Class I shares, each of which has equal rights as to assets and voting privileges. Each class has exclusive voting rights with respect to matters that affect that class.
After the close of business on June 24, 2016, all outstanding Class B shares were converted to Class A shares. All current fiscal period dollar and share amounts for Class B presented in the Notes to Financial Statements are for the period February 1, 2016 through June 24, 2016.
In March 2017 the Board of Trustees approved a change in the name of Class T to Class M effective after the close of business on March 24, 2017.
2. Investments in Fidelity Central Funds.
The Fund invests in Fidelity Central Funds, which are open-end investment companies generally available only to other investment companies and accounts managed by the investment adviser and its affiliates. The Fund's Schedule of Investments lists each of the Fidelity Central Funds held as of period end, if any, as an investment of the Fund, but does not include the underlying holdings of each Fidelity Central Fund. As an Investing Fund, the Fund indirectly bears its proportionate share of the expenses of the underlying Fidelity Central Funds.
The Money Market Central Funds seek preservation of capital and current income and are managed by Fidelity Investments Money Management, Inc. (FIMM), an affiliate of the investment adviser. Annualized expenses of the Money Market Central Funds as of their most recent shareholder report date are less than .005%.
A complete unaudited list of holdings for each Fidelity Central Fund is available upon request or at the Securities and Exchange Commission (the SEC) website at www.sec.gov. In addition, the financial statements of the Fidelity Central Funds, which are not covered by the Fund's Report of Independent Registered Public Accounting Firm, are available on the SEC website or upon request.
3. Significant Accounting Policies.
The financial statements have been prepared in conformity with accounting principles generally accepted in the United States of America (GAAP), which require management to make certain estimates and assumptions at the date of the financial statements. Actual results could differ from those estimates. Subsequent events, if any, through the date that the financial statements were issued have been evaluated in the preparation of the financial statements. The following summarizes the significant accounting policies of the Fund:
Investment Valuation. Investments are valued as of 4:00 p.m. Eastern time on the last calendar day of the period. The Board of Trustees (the Board) has delegated the day to day responsibility for the valuation of the Fund's investments to the Fair Value Committee (the Committee) established by the Fund's investment adviser. In accordance with valuation policies and procedures approved by the Board, the Fund attempts to obtain prices from one or more third party pricing vendors or brokers to value its investments. When current market prices, quotations or currency exchange rates are not readily available or reliable, investments will be fair valued in good faith by the Committee, in accordance with procedures adopted by the Board. Factors used in determining fair value vary by investment type and may include market or investment specific events, changes in interest rates and credit quality. The frequency with which these procedures are used cannot be predicted and they may be utilized to a significant extent. The Committee oversees the Fund's valuation policies and procedures and reports to the Board on the Committee's activities and fair value determinations. The Board monitors the appropriateness of the procedures used in valuing the Fund's investments and ratifies the fair value determinations of the Committee.
The Fund categorizes the inputs to valuation techniques used to value its investments into a disclosure hierarchy consisting of three levels as shown below:
- Level 1– quoted prices in active markets for identical investments
- Level 2 – other significant observable inputs (including quoted prices for similar investments, interest rates, prepayment speeds, etc.)
- Level 3 – unobservable inputs (including the Fund's own assumptions based on the best information available)
Valuation techniques used to value the Fund's investments by major category are as follows:
Equity securities, including restricted securities, for which market quotations are readily available, are valued at the last reported sale price or official closing price as reported by a third party pricing vendor on the primary market or exchange on which they are traded and are categorized as Level 1 in the hierarchy. In the event there were no sales during the day or closing prices are not available, securities are valued at the last quoted bid price or may be valued using the last available price and are generally categorized as Level 2 in the hierarchy. For foreign equity securities, when market or security specific events arise, comparisons to the valuation of American Depositary Receipts (ADRs), futures contracts, Exchange-Traded Funds (ETFs) and certain indexes as well as quoted prices for similar securities may be used and would be categorized as Level 2 in the hierarchy. Utilizing these techniques may result in transfers between Level 1 and Level 2. For equity securities, including restricted securities, where observable inputs are limited, assumptions about market activity and risk are used and these securities may be categorized as Level 3 in the hierarchy.
Debt securities, including restricted securities, are valued based on evaluated prices received from third party pricing vendors or from brokers who make markets in such securities. Corporate bonds are valued by pricing vendors who utilize matrix pricing which considers yield or price of bonds of comparable quality, coupon, maturity and type or by broker-supplied prices. When independent prices are unavailable or unreliable, debt securities may be valued utilizing pricing methodologies which consider similar factors that would be used by third party pricing vendors. Debt securities are generally categorized as Level 2 in the hierarchy but may be Level 3 depending on the circumstances.
Investments in open-end mutual funds, including the Fidelity Central Funds, are valued at their closing net asset value (NAV) each business day and are categorized as Level 1 in the hierarchy.
Changes in valuation techniques may result in transfers in or out of an assigned level within the disclosure hierarchy. The aggregate value of investments by input level as of January 31, 2017 is included at the end of the Fund's Schedule of Investments.
Foreign Currency. The Fund may use foreign currency contracts to facilitate transactions in foreign-denominated securities. Gains and losses from these transactions may arise from changes in the value of the foreign currency or if the counterparties do not perform under the contracts' terms.
Foreign-denominated assets, including investment securities, and liabilities are translated into U.S. dollars at the exchange rates at period end. Purchases and sales of investment securities, income and dividends received and expenses denominated in foreign currencies are translated into U.S. dollars at the exchange rate in effect on the transaction date.
The effects of exchange rate fluctuations on investments are included with the net realized and unrealized gain (loss) on investment securities. Other foreign currency transactions resulting in realized and unrealized gain (loss) are disclosed separately.
Investment Transactions and Income. For financial reporting purposes, the Fund's investment holdings and NAV include trades executed through the end of the last business day of the period. The NAV per share for processing shareholder transactions is calculated as of the close of business of the New York Stock Exchange (NYSE), normally 4:00 p.m. Eastern time and includes trades executed through the end of the prior business day. Gains and losses on securities sold are determined on the basis of identified cost and may include proceeds received from litigation. Dividend income is recorded on the ex-dividend date, except for certain dividends from foreign securities where the ex-dividend date may have passed, which are recorded as soon as the Fund is informed of the ex-dividend date. Non-cash dividends included in dividend income, if any, are recorded at the fair market value of the securities received. Income and capital gain distributions from Fidelity Central Funds, if any, are recorded on the ex-dividend date. Certain distributions received by the Fund represent a return of capital or capital gain. The Fund determines the components of these distributions subsequent to the ex-dividend date, based upon receipt of tax filings or other correspondence relating to the underlying investment. These distributions are recorded as a reduction of cost of investments and/or as a realized gain. Interest income is accrued as earned and includes coupon interest and amortization of premium and accretion of discount on debt securities as applicable. Investment income is recorded net of foreign taxes withheld where recovery of such taxes is uncertain.
Class Allocations and Expenses. Investment income, realized and unrealized capital gains and losses, common expenses of the Fund, and certain fund-level expense reductions, if any, are allocated daily on a pro-rata basis to each class based on the relative net assets of each class to the total net assets of the Fund. Each class differs with respect to transfer agent and distribution and service plan fees incurred. Certain expense reductions may also differ by class. For the reporting period, the allocated portion of income and expenses to each class as a percent of its average net assets may vary due to the timing of recording these transactions in relation to fluctuating net assets of the classes. Expenses directly attributable to a fund are charged to that fund. Expenses attributable to more than one fund are allocated among the respective funds on the basis of relative net assets or other appropriate methods. Expense estimates are accrued in the period to which they relate and adjustments are made when actual amounts are known.
Income Tax Information and Distributions to Shareholders. Each year, the Fund intends to qualify as a regulated investment company under Subchapter M of the Internal Revenue Code, including distributing substantially all of its taxable income and realized gains. As a result, no provision for U.S. Federal income taxes is required. As of January 31, 2017, the Fund did not have any unrecognized tax benefits in the financial statements; nor is the Fund aware of any tax positions for which it is reasonably possible that the total amounts of unrecognized tax benefits will significantly change in the next twelve months. The Fund files a U.S. federal tax return, in addition to state and local tax returns as required. The Fund's federal income tax returns are subject to examination by the Internal Revenue Service (IRS) for a period of three fiscal years after they are filed. State and local tax returns may be subject to examination for an additional fiscal year depending on the jurisdiction. Foreign taxes are provided for based on the Fund's understanding of the tax rules and rates that exist in the foreign markets in which it invests.
Distributions are declared and recorded on the ex-dividend date. Income dividends and capital gain distributions are declared separately for each class. Income and capital gain distributions are determined in accordance with income tax regulations, which may differ from GAAP.
Capital accounts within the financial statements are adjusted for permanent book-tax differences. These adjustments have no impact on net assets or the results of operations. Capital accounts are not adjusted for temporary book-tax differences which will reverse in a subsequent period.
Book-tax differences are primarily due to foreign currency transactions, partnerships, market discount, capital loss carryforwards and losses deferred due to wash sales and excise tax regulations.
The federal tax cost of investment securities and unrealized appreciation (depreciation) as of period end were as follows:
| Gross unrealized appreciation | $499,146,063 |
| Gross unrealized depreciation | (69,311,026) |
| Net unrealized appreciation (depreciation) on securities | $429,835,037 |
| Tax Cost | $2,840,767,807 |
The tax-based components of distributable earnings as of period end were as follows:
| Capital loss carryforward | $(70,401,023) |
| Net unrealized appreciation (depreciation) on securities and other investments | $429,835,037 |
Capital loss carryforwards are only available to offset future capital gains of the Fund to the extent provided by regulations and may be limited. Under the Regulated Investment Company Modernization Act of 2010 (the Act), the Fund is permitted to carry forward capital losses incurred in taxable years beginning after December 22, 2010 for an unlimited period and such capital losses are required to be used prior to any losses that expire. The capital loss carryforward information presented below, including any applicable limitation, is estimated as of fiscal period end and is subject to adjustment.
| Fiscal year of expiration | |
| No expiration | |
| Short-term | $(70,401,023) |
The tax character of distributions paid was as follows:
| | January 31, 2017 | January 31, 2016 |
| Ordinary Income | $41,087,101 | $ 57,536,518 |
| Long-term Capital Gains | – | 114,422,810 |
| Total | $41,087,101 | $ 171,959,328 |
The fund intends to elect to defer to its next fiscal year $2,000,550 of ordinary losses recognized during the period January 1, 2017 to January 31, 2017.
Short-Term Trading (Redemption) Fees. During the period, shares held by investors in the Fund less than 30 days may have been subject to a redemption fee equal to .75% of the NAV of shares redeemed. All redemption fees, which reduce the proceeds of the shareholder redemption, are retained by the Fund and accounted for as an addition to paid in capital. In November 2016, the Board of Trustees approved the elimination of these redemption fees effective December 12, 2016.
Restricted Securities. The Fund may invest in securities that are subject to legal or contractual restrictions on resale. These securities generally may be resold in transactions exempt from registration or to the public if the securities are registered. Disposal of these securities may involve time-consuming negotiations and expense, and prompt sale at an acceptable price may be difficult. Information regarding restricted securities is included at the end of the Fund's Schedule of Investments.
4. Purchases and Sales of Investments.
Purchases and sales of securities, other than short-term securities, aggregated $2,611,613,443 and $3,004,755,924, respectively.
5. Fees and Other Transactions with Affiliates.
Management Fee. Fidelity Management & Research Company (the investment adviser) and its affiliates provide the Fund with investment management related services for which the Fund pays a monthly management fee. The management fee is the sum of an individual fund fee rate that is based on an annual rate of .30% of the Fund's average net assets and an annualized group fee rate that averaged .25% during the period. The group fee rate is based upon the average net assets of all the mutual funds advised by the investment adviser, including any mutual funds previously advised by the investment adviser that are currently advised by Fidelity SelectCo, LLC, an affiliate of the investment adviser. The group fee rate decreases as assets under management increase and increases as assets under management decrease. In addition, the management fee is subject to a performance adjustment (up to a maximum of +/- .20% of the Fund's average net assets over a 36 month performance period). The upward or downward adjustment to the management fee is based on the relative investment performance of Mid Cap Value as compared to its benchmark index, the Russell Midcap Value Index, over the same 36 month performance period. For the reporting period, the total annual management fee rate, including the performance adjustment, was .50% of the Fund's average net assets. The performance adjustment included in the management fee rate may be higher or lower than the maximum performance adjustment rate due to the difference between the average net assets for the reporting and performance periods.
Distribution and Service Plan Fees. In accordance with Rule 12b-1 of the 1940 Act, the Fund has adopted separate Distribution and Service Plans for each class of shares, except for the Class I. Certain classes pay Fidelity Distributors Corporation (FDC), an affiliate of the investment adviser, separate Distribution and Service Fees, each of which is based on an annual percentage of each class' average net assets. In addition, FDC may pay financial intermediaries for selling shares of the Fund and providing shareholder support services. For the period, the Distribution and Service Fee rates, total fees and amounts retained by FDC were as follows:
| | Distribution
Fee | Service
Fee | Total Fees | Retained
by FDC |
| Class A | -% | .25% | $731,756 | $6,113 |
| Class T | .25% | .25% | 258,545 | – |
| Class B | .75% | .25% | 4,163 | 3,127 |
| Class C | .75% | .25% | 1,404,443 | 428,535 |
| | | | $2,398,907 | $437,775 |
Sales Load. FDC may receive a front-end sales charge of up to 5.75% for selling Class A shares and 3.50% for selling Class T shares, some of which is paid to financial intermediaries for selling shares of the Fund. Depending on the holding period, FDC may receive contingent deferred sales charges levied on Class A, Class T, Class B, and Class C redemptions. The deferred sales charges range from 5.00% to 1.00% for Class B shares, 1.00% for Class C shares, 1.00% for certain purchases of Class A shares and .25% for certain purchases of Class T shares.
For the period, sales charge amounts retained by FDC were as follows:
| | Retained
by FDC |
| Class A | $111,187 |
| Class T | 14,983 |
| Class B(a) | 160 |
| Class C(a) | 30,275 |
| | $156,605 |
(a) When Class B and Class C shares are initially sold, FDC pays commissions from its own resources to financial intermediaries through which the sales are made.
Transfer Agent Fees. Fidelity Investments Institutional Operations Company, Inc., (FIIOC), an affiliate of the investment adviser, is the transfer, dividend disbursing and shareholder servicing agent for each class of the Fund. FIIOC receives account fees and asset-based fees that vary according to the account size and type of account of the shareholders of the respective classes of the Fund. FIIOC pays for typesetting, printing and mailing of shareholder reports, except proxy statements.
For the period, transfer agent fees for each class were as follows:
| | Amount | % of
Class-Level Average
Net Assets |
| Class A | $640,751 | .22 |
| Class T | 130,881 | .25 |
| Class B | 1,113 | .27 |
| Class C | 304,306 | .22 |
| Mid Cap Value | 4,449,318 | .19 |
| Class I | 604,798 | .19 |
| | $6,131,167 | |
Accounting and Security Lending Fees. Fidelity Service Company, Inc. (FSC), an affiliate of the investment adviser, maintains the Fund's accounting records. The accounting fee is based on the level of average net assets for each month. Under a separate contract, FSC administers the security lending program. The security lending fee is based on the number and duration of lending transactions.
Brokerage Commissions. The Fund placed a portion of its portfolio transactions with brokerage firms which are affiliates of the investment adviser. Brokerage commissions are included in net realized gain (loss) and change in net unrealized appreciation (depreciation) in the Statement of Operations. The commissions paid to these affiliated firms were $98,742 for the period.
Interfund Trades. The Fund may purchase from or sell securities to other Fidelity Funds under procedures adopted by the Board. The procedures have been designed to ensure these interfund trades are executed in accordance with Rule 17a-7 of the 1940 Act. Interfund trades are included within the respective purchases and sales amounts shown in the Purchases and Sales of Investments note.
6. Committed Line of Credit.
The Fund participates with other funds managed by the investment adviser or an affiliate in a $4.25 billion credit facility (the "line of credit") to be utilized for temporary or emergency purposes to fund shareholder redemptions or for other short-term liquidity purposes. The Fund has agreed to pay commitment fees on its pro-rata portion of the line of credit, which amounted to $9,668 and is reflected in Miscellaneous expenses on the Statement of Operations. During the period, the Fund did not borrow on this line of credit.
7. Security Lending.
The Fund lends portfolio securities through a lending agent from time to time in order to earn additional income. For equity securities, a lending agent is used and may loan securities to certain qualified borrowers, including Fidelity Capital Markets (FCM), a broker-dealer affiliated with the Fund. On the settlement date of the loan, the Fund receives collateral (in the form of U.S. Treasury obligations, letters of credit and/or cash) against the loaned securities and maintains collateral in an amount not less than 100% of the market value of the loaned securities during the period of the loan. The market value of the loaned securities is determined at the close of business of the Fund and any additional required collateral is delivered to the Fund on the next business day. The Fund or borrower may terminate the loan at any time, and if the borrower defaults on its obligation to return the securities loaned because of insolvency or other reasons, the Fund may apply collateral received from the borrower against the obligation. The Fund may experience delays and costs in recovering the securities loaned. Any cash collateral received is invested in the Fidelity Securities Lending Cash Central Fund. The value of loaned securities and cash collateral at period end are disclosed on the Fund's Statement of Assets and Liabilities. At period end, there were no security loans outstanding with FCM. Security lending income represents the income earned on investing cash collateral, less rebates paid to borrowers and any lending agent fees associated with the loan, plus any premium payments received for lending certain types of securities. Security lending income is presented in the Statement of Operations as a component of income from Fidelity Central Funds. Total security lending income during the period amounted to $388,531, including $12,851 from securities loaned to FCM.
8. Expense Reductions.
Commissions paid to certain brokers with whom the investment adviser, or its affiliates, places trades on behalf of the Fund include an amount in addition to trade execution, which may be rebated back to the Fund to offset certain expenses. This amount totaled $142,888 for the period. In addition, through arrangements with the Fund's custodian, credits realized as a result of certain uninvested cash balances were used to reduce the Fund's expenses. During the period, these credits reduced the Fund's custody expenses by $2,404.
In addition, during the period the investment advisor reimbursed and/or waived a portion of fund-level operating expenses in the amount of $27,230.
9. Distributions to Shareholders.
Distributions to shareholders of each class were as follows:
| | Year ended
January 31, 2017 | Year ended
January 31, 2016 |
| From net investment income | | |
| Class A | $3,240,040 | $3,590,650 |
| Class T | 485,923 | 450,830 |
| Class C | 670,220 | 957,929 |
| Mid Cap Value | 31,956,186 | 38,962,949 |
| Class I | 4,734,732 | 4,275,970 |
| Total | $41,087,101 | $48,238,328 |
| From net realized gain | | |
| Class A | $– | $9,802,091 |
| Class T | – | 1,753,515 |
| Class B | – | 54,117 |
| Class C | – | 4,641,645 |
| Mid Cap Value | – | 97,878,091 |
| Class I | – | 9,591,541 |
| Total | $– | $123,721,000 |
10. Share Transactions.
Share transactions for each class were as follows and may contain automatic conversions between classes or exchanges between affiliated funds:
| | Shares | Shares | Dollars | Dollars |
| | Year ended January 31, 2017 | Year ended January 31, 2016 | Year ended January 31, 2017 | Year ended January 31, 2016 |
| Class A | | | | |
| Shares sold | 4,061,771 | 9,081,738 | $92,401,738 | $218,832,696 |
| Reinvestment of distributions | 126,883 | 583,393 | 3,145,426 | 12,803,794 |
| Shares redeemed | (5,714,824) | (3,310,982) | (130,944,178) | (76,794,668) |
| Net increase (decrease) | (1,526,170) | 6,354,149 | $(35,397,014) | $154,841,822 |
| Class T | | | | |
| Shares sold | 833,265 | 1,181,705 | $19,150,838 | $28,521,084 |
| Reinvestment of distributions | 19,366 | 98,288 | 478,331 | 2,163,028 |
| Shares redeemed | (659,446) | (738,423) | (14,982,028) | (17,743,135) |
| Net increase (decrease) | 193,185 | 541,570 | $4,647,141 | $12,940,977 |
| Class B | | | | |
| Shares sold | 2,126 | 10,778 | $42,739 | $261,816 |
| Reinvestment of distributions | – | 2,323 | – | 51,564 |
| Shares redeemed | (59,169) | (51,733) | (1,292,132) | (1,224,693) |
| Net increase (decrease) | (57,043) | (38,632) | $(1,249,393) | $(911,313) |
| Class C | | | | |
| Shares sold | 1,618,271 | 4,251,099 | $35,957,291 | $100,518,623 |
| Reinvestment of distributions | 26,040 | 239,960 | 627,560 | 5,124,148 |
| Shares redeemed | (2,224,436) | (1,002,857) | (49,614,483) | (22,726,253) |
| Net increase (decrease) | (580,125) | 3,488,202 | $(13,029,632) | $82,916,518 |
| Mid Cap Value | | | | |
| Shares sold | 16,140,186 | 58,089,867 | $372,060,966 | $1,426,603,937 |
| Reinvestment of distributions | 1,217,324 | 5,832,007 | 30,530,476 | 130,161,634 |
| Shares redeemed | (33,547,192) | (63,081,592) | (774,130,054) | (1,492,965,304) |
| Net increase (decrease) | (16,189,682) | 840,282 | $(371,538,612) | $63,800,267 |
| Class I | | | | |
| Shares sold | 7,909,760 | 11,498,838 | $179,687,090 | $278,387,809 |
| Reinvestment of distributions | 178,757 | 559,848 | 4,451,059 | 12,321,209 |
| Shares redeemed | (6,257,939) | (5,547,072) | (142,494,098) | (128,465,964) |
| Net increase (decrease) | 1,830,578 | 6,511,614 | $41,644,051 | $162,243,054 |
11. Other.
The Fund's organizational documents provide former and current trustees and officers with a limited indemnification against liabilities arising in connection with the performance of their duties to the Fund. In the normal course of business, the Fund may also enter into contracts that provide general indemnifications. The Fund's maximum exposure under these arrangements is unknown as this would be dependent on future claims that may be made against the Fund. The risk of material loss from such claims is considered remote.
Report of Independent Registered Public Accounting Firm
To the Trustees of Fidelity Devonshire Trust and Shareholders of Fidelity Mid Cap Value Fund:
In our opinion, the accompanying statement of assets and liabilities, including the schedule of investments, and the related statements of operations and of changes in net assets and the financial highlights present fairly, in all material respects, the financial position of Fidelity Mid Cap Value Fund (a fund of Fidelity Devonshire Trust) as of January 31, 2017, the results of its operations for the year then ended, the changes in its net assets for each of the two years in the period then ended and the financial highlights for each of the five years in the period then ended, in conformity with accounting principles generally accepted in the United States of America. These financial statements and financial highlights (hereafter referred to as “financial statements”) are the responsibility of the Fidelity Mid Cap Value Fund’s management. Our responsibility is to express an opinion on these financial statements based on our audits. We conducted our audits of these financial statements in accordance with the standards of the Public Company Accounting Oversight Board (United States). Those standards require that we plan and perform the audit to obtain reasonable assurance about whether the financial statements are free of material misstatement. An audit includes examining, on a test basis, evidence supporting the amounts and disclosures in the financial statements, assessing the accounting principles used and significant estimates made by management, and evaluating the overall financial statement presentation. We believe that our audits, which included confirmation of securities as of January 31, 2017 by correspondence with the custodian and brokers, provide a reasonable basis for our opinion.
PricewaterhouseCoopers LLP
Boston, Massachusetts
March 14, 2017
Trustees and Officers
The Trustees, Members of the Advisory Board (if any), and officers of the trust and fund, as applicable, are listed below. The Board of Trustees governs the fund and is responsible for protecting the interests of shareholders. The Trustees are experienced executives who meet periodically throughout the year to oversee the fund's activities, review contractual arrangements with companies that provide services to the fund, oversee management of the risks associated with such activities and contractual arrangements, and review the fund's performance. Each of the Trustees oversees 169 funds.
The Trustees hold office without limit in time except that (a) any Trustee may resign; (b) any Trustee may be removed by written instrument, signed by at least two-thirds of the number of Trustees prior to such removal; (c) any Trustee who requests to be retired or who has become incapacitated by illness or injury may be retired by written instrument signed by a majority of the other Trustees; and (d) any Trustee may be removed at any special meeting of shareholders by a two-thirds vote of the outstanding voting securities of the trust. Each Trustee who is not an interested person (as defined in the 1940 Act) of the trust and the fund is referred to herein as an Independent Trustee. Each Independent Trustee shall retire not later than the last day of the calendar year in which his or her 75th birthday occurs. The Independent Trustees may waive this mandatory retirement age policy with respect to individual Trustees. Officers and Advisory Board Members hold office without limit in time, except that any officer or Advisory Board Member may resign or may be removed by a vote of a majority of the Trustees at any regular meeting or any special meeting of the Trustees. Except as indicated, each individual has held the office shown or other offices in the same company for the past five years.
The fund’s Statement of Additional Information (SAI) includes more information about the Trustees. To request a free copy, call Fidelity at 1-877-208-0098.
Experience, Skills, Attributes, and Qualifications of the Trustees. The Governance and Nominating Committee has adopted a statement of policy that describes the experience, qualifications, attributes, and skills that are necessary and desirable for potential Independent Trustee candidates (Statement of Policy). The Board believes that each Trustee satisfied at the time he or she was initially elected or appointed a Trustee, and continues to satisfy, the standards contemplated by the Statement of Policy. The Governance and Nominating Committee also engages professional search firms to help identify potential Independent Trustee candidates who have the experience, qualifications, attributes, and skills consistent with the Statement of Policy. From time to time, additional criteria based on the composition and skills of the current Independent Trustees, as well as experience or skills that may be appropriate in light of future changes to board composition, business conditions, and regulatory or other developments, have also been considered by the professional search firms and the Governance and Nominating Committee. In addition, the Board takes into account the Trustees' commitment and participation in Board and committee meetings, as well as their leadership of standing and ad hoc committees throughout their tenure.
In determining that a particular Trustee was and continues to be qualified to serve as a Trustee, the Board has considered a variety of criteria, none of which, in isolation, was controlling. The Board believes that, collectively, the Trustees have balanced and diverse experience, qualifications, attributes, and skills, which allow the Board to operate effectively in governing the fund and protecting the interests of shareholders. Information about the specific experience, skills, attributes, and qualifications of each Trustee, which in each case led to the Board's conclusion that the Trustee should serve (or continue to serve) as a trustee of the fund, is provided below.
Board Structure and Oversight Function. James C. Curvey is an interested person and currently serves as Chairman. The Trustees have determined that an interested Chairman is appropriate and benefits shareholders because an interested Chairman has a personal and professional stake in the quality and continuity of services provided to the fund. Independent Trustees exercise their informed business judgment to appoint an individual of their choosing to serve as Chairman, regardless of whether the Trustee happens to be independent or a member of management. The Independent Trustees have determined that they can act independently and effectively without having an Independent Trustee serve as Chairman and that a key structural component for assuring that they are in a position to do so is for the Independent Trustees to constitute a substantial majority for the Board. The Independent Trustees also regularly meet in executive session. Ned C. Lautenbach serves as Chairman of the Independent Trustees and as such (i) acts as a liaison between the Independent Trustees and management with respect to matters important to the Independent Trustees and (ii) with management prepares agendas for Board meetings.
Fidelity® funds are overseen by different Boards of Trustees. The fund's Board oversees Fidelity's high income and certain equity funds, and other Boards oversee Fidelity's investment-grade bond, money market, asset allocation, and sector funds. The asset allocation funds may invest in Fidelity® funds overseen by the fund's Board. The use of separate Boards, each with its own committee structure, allows the Trustees of each group of Fidelity® funds to focus on the unique issues of the funds they oversee, including common research, investment, and operational issues. On occasion, the separate Boards establish joint committees to address issues of overlapping consequences for the Fidelity® funds overseen by each Board.
The Trustees operate using a system of committees to facilitate the timely and efficient consideration of all matters of importance to the Trustees, the fund, and fund shareholders and to facilitate compliance with legal and regulatory requirements and oversight of the fund's activities and associated risks. The Board, acting through its committees, has charged FMR and its affiliates with (i) identifying events or circumstances the occurrence of which could have demonstrably adverse effects on the fund's business and/or reputation; (ii) implementing processes and controls to lessen the possibility that such events or circumstances occur or to mitigate the effects of such events or circumstances if they do occur; and (iii) creating and maintaining a system designed to evaluate continuously business and market conditions in order to facilitate the identification and implementation processes described in (i) and (ii) above. Because the day-to-day operations and activities of the fund are carried out by or through FMR, its affiliates, and other service providers, the fund's exposure to risks is mitigated but not eliminated by the processes overseen by the Trustees. While each of the Board's committees has responsibility for overseeing different aspects of the fund's activities, oversight is exercised primarily through the Operations, Audit, and Compliance Committees. In addition, the Independent Trustees have worked with FMR to enhance the Board's oversight of investment and financial risks, legal and regulatory risks, technology risks, and operational risks, including the development of additional risk reporting to the Board. For example, a working group comprised of Independent Trustees and FMR has worked and continues to work to review the Fidelity® funds' valuation-related activities, reporting and risk management. Appropriate personnel, including but not limited to the fund's Chief Compliance Officer (CCO), FMR's internal auditor, the independent accountants, the fund's Treasurer and portfolio management personnel, make periodic reports to the Board's committees, as appropriate, including an annual review of Fidelity's risk management program for the Fidelity® funds. The responsibilities of each standing committee, including their oversight responsibilities, are described further under "Standing Committees of the Trustees."
Interested Trustees*:
Correspondence intended for a Trustee who is an interested person may be sent to Fidelity Investments, 245 Summer Street, Boston, Massachusetts 02210.
Name, Year of Birth; Principal Occupations and Other Relevant Experience+
James C. Curvey (1935)
Year of Election or Appointment: 2007
Trustee
Chairman of the Board of Trustees
Mr. Curvey also serves as Trustee of other Fidelity® funds. Mr. Curvey is a Director of Fidelity Research & Analysis Co. (investment adviser firm, 2009-present), and Vice Chairman (2007-present) and Director of FMR LLC (diversified financial services company). In addition, Mr. Curvey serves as an Overseer for the Boston Symphony Orchestra and a member of the board of Artis-Naples, Naples, Florida, and as a Trustee for Brewster Academy, Wolfeboro, New Hampshire. Previously, Mr. Curvey served as a Director of Fidelity Investments Money Management, Inc. (investment adviser firm, 2009-2014) and a Director of FMR and FMR Co., Inc. (investment adviser firms, 2007-2014).
Charles S. Morrison (1960)
Year of Election or Appointment: 2014
Trustee
Mr. Morrison also serves as Trustee of other funds. He serves as President of Fidelity Management & Research Company (FMR) (investment adviser firm, 2016-present), a Director of Fidelity Investments Money Management, Inc. (FIMM) (investment adviser firm, 2014-present), Director of Fidelity SelectCo, LLC (investment adviser firm, 2014-present), President, Asset Management (2014-present), and is an employee of Fidelity Investments. Previously, Mr. Morrison served as Vice President of Fidelity's Fixed Income and Asset Allocation Funds (2012-2014), President, Fixed Income (2011-2014), Vice President of Fidelity's Money Market Funds (2005-2009), President, Money Market Group Leader of FMR (investment adviser firm, 2009), and Senior Vice President, Money Market Group of FMR (2004-2009). Mr. Morrison also served as Vice President of Fidelity's Bond Funds (2002-2005), certain Balanced Funds (2002-2005), and certain Asset Allocation Funds (2002-2007), and as Senior Vice President (2002-2005) of Fidelity's Bond Division.
* Determined to be an “Interested Trustee” by virtue of, among other things, his or her affiliation with the trust or various entities under common control with FMR.
+ The information includes the Trustee's principal occupation during the last five years and other information relating to the experience, attributes, and skills relevant to the Trustee's qualifications to serve as a Trustee, which led to the conclusion that the Trustee should serve as a Trustee for the fund.
Independent Trustees:
Correspondence intended for an Independent Trustee may be sent to Fidelity Investments, P.O. Box 55235, Boston, Massachusetts 02205-5235.
Name, Year of Birth; Principal Occupations and Other Relevant Experience+
Dennis J. Dirks (1948)
Year of Election or Appointment: 2005
Trustee
Mr. Dirks also serves as Trustee of other Fidelity® funds. Prior to his retirement in May 2003, Mr. Dirks was Chief Operating Officer and a member of the Board of The Depository Trust & Clearing Corporation (DTCC). He also served as President, Chief Operating Officer, and Board member of The Depository Trust Company (DTC) and President and Board member of the National Securities Clearing Corporation (NSCC). In addition, Mr. Dirks served as Chief Executive Officer and Board member of the Government Securities Clearing Corporation, Chief Executive Officer and Board member of the Mortgage-Backed Securities Clearing Corporation, as a Trustee and a member of the Finance Committee of Manhattan College (2005-2008), as a Trustee and a member of the Finance Committee of AHRC of Nassau County (2006-2008), and as a member of the Independent Directors Council (IDC) Governing Council (2010-2015). Mr. Dirks is a member of the Board of Directors for The Brookville Center for Children's Services, Inc. (2009-present) and the Finance Committee of the Asolo Repertory Theatre (2016-present).
Alan J. Lacy (1953)
Year of Election or Appointment: 2008
Trustee
Mr. Lacy also serves as Trustee of other Fidelity® funds. Mr. Lacy serves as Chairman (2014-present) and a member (2010-present) of the Board of Directors of Dave & Buster's Entertainment, Inc. (restaurant and entertainment complexes) and a Director of Bristol-Myers Squibb Company (global pharmaceuticals, 2008-present). He is a Trustee of the California Chapter of The Nature Conservancy (2015-present) and a Director of the Center for Advanced Study in the Behavioral Sciences at Stanford University (2015-present). In addition, Mr. Lacy served as Senior Adviser (2007-2014) of Oak Hill Capital Partners, L.P. (private equity) and also served as Chief Executive Officer (2005) and Vice Chairman (2005-2006) of Sears Holdings Corporation (retail) and Chief Executive Officer and Chairman of the Board of Sears, Roebuck and Co. (retail, 2000-2005). Previously, Mr. Lacy served as Chairman (2008-2011) and a member (2006-2015) of the Board of Trustees of the National Parks Conservation Association and as a member of the Board of Directors for The Western Union Company (global money transfer, 2006-2011), The Hillman Companies, Inc. (hardware wholesalers, 2010-2014), and Earth Fare, Inc. (retail grocery, 2010-2014).
Ned C. Lautenbach (1944)
Year of Election or Appointment: 2000
Trustee
Chairman of the Independent Trustees
Mr. Lautenbach also serves as Trustee of other Fidelity® funds. Mr. Lautenbach currently serves as the Lead Director of the Eaton Corporation Board of Directors (diversified industrial, 1997-present). Mr. Lautenbach is Chairman of the Board of Directors of Artis-Naples in Naples, Florida (2012-present), a member of the Council on Foreign Relations (1994-present), and currently Vice Chair of the Board of Governors, State University System of Florida (2013-present). Previously, Mr. Lautenbach was a Partner and Advisory Partner at Clayton, Dubilier & Rice, LLC (private equity investment, 1998-2010), as well as a Director of Sony Corporation (2006-2007). Mr. Lautenbach also had a 30-year career with IBM (technology company) during which time he served as Senior Vice President and a member of the Corporate Executive Committee (1968-1998).
Joseph Mauriello (1944)
Year of Election or Appointment: 2008
Trustee
Mr. Mauriello also serves as Trustee of other Fidelity® funds. Prior to his retirement in January 2006, Mr. Mauriello served in numerous senior management positions including Deputy Chairman and Chief Operating Officer (2004-2005), and Vice Chairman of Financial Services (2002-2004) of KPMG LLP US (professional services, 1965-2005). Mr. Mauriello currently serves as a member of the Board of Directors of XL Group plc. (global insurance and re-insurance, 2006-present) and the Independent Directors Council (IDC) Governing Council (2015-present). Previously, Mr. Mauriello served as a Director of the Hamilton Funds of the Bank of New York (2006-2007) and of Arcadia Resources Inc. (health care services and products, 2007-2012).
Robert W. Selander (1950)
Year of Election or Appointment: 2011
Trustee
Mr. Selander also serves as Trustee of other Fidelity® funds. Mr. Selander serves as a Director of The Western Union Company (global money transfer, 2014-present) and a non-executive Chairman of Health Equity, Inc. (health savings custodian, 2015-present). Previously, Mr. Selander served as a Member of the Advisory Board of certain Fidelity® funds (2011), and Executive Vice Chairman (2010), Chief Executive Officer (2009-2010), and President and Chief Executive Officer (1997-2009) of Mastercard, Inc.
Cornelia M. Small (1944)
Year of Election or Appointment: 2005
Trustee
Ms. Small also serves as Trustee of other Fidelity® funds. Ms. Small is a member of the Board of Directors (2009-present) and Chair of the Investment Committee (2010-present) of the Teagle Foundation. Ms. Small also serves on the Investment Committee of the Berkshire Taconic Community Foundation (2008-present). Previously, Ms. Small served as Chairperson (2002-2008) and a member of the Investment Committee and Chairperson (2008-2012) and a member of the Board of Trustees of Smith College. In addition, Ms. Small served as Chief Investment Officer, Director of Global Equity Investments, and a member of the Board of Directors of Scudder, Stevens & Clark and Scudder Kemper Investments.
William S. Stavropoulos (1939)
Year of Election or Appointment: 2002
Trustee
Vice Chairman of the Independent Trustees
Mr. Stavropoulos also serves as Trustee of other Fidelity® funds. Mr. Stavropoulos serves as President and Founder of the Michigan Baseball Foundation, the Great Lakes Loons (2007-present). Mr. Stavropoulos is Chairman Emeritus of the Board of Directors of The Dow Chemical Company, where he previously served in numerous senior management positions, including President, CEO (1995-2000; 2002-2004), Chairman of the Executive Committee (2000-2006), and as a member of the Board of Directors (1990-2006). Currently, Mr. Stavropoulos is Chairman of the Board of Directors of Univar Inc. (global distributor of commodity and specialty chemicals), a Director of Teradata Corporation (data warehousing and technology solutions), and a member of the Advisory Board for Metalmark Capital LLC (private equity investment, 2005-present). Mr. Stavropoulos is an operating advisor to Clayton, Dubilier & Rice, LLC (private equity investment). In addition, Mr. Stavropoulos is a member of the University of Notre Dame Advisory Council for the College of Science, a Trustee of the Rollin L. Gerstacker Foundation, and a Director of Artis-Naples in Naples, Florida. Previously, Mr. Stavropoulos served as a Director of Chemical Financial Corporation (bank holding company, 1993-2012) and Tyco International, Ltd. (multinational manufacturing and services, 2007-2012).
David M. Thomas (1949)
Year of Election or Appointment: 2008
Trustee
Mr. Thomas also serves as Trustee of other Fidelity® funds. Mr. Thomas serves as Non-Executive Chairman of the Board of Directors of Fortune Brands Home and Security (home and security products, 2011-present), as a member of the Board of Directors (2004-present) and Presiding Director (2013-present) of Interpublic Group of Companies, Inc. (marketing communication), and as a member of the Board of Trustees of the University of Florida (2013-present). Previously, Mr. Thomas served as Executive Chairman (2005-2006) and Chairman and Chief Executive Officer (2000-2005) of IMS Health, Inc. (pharmaceutical and healthcare information solutions), and a Director of Fortune Brands, Inc. (consumer products, 2000-2011).
+ The information includes the Trustee's principal occupation during the last five years and other information relating to the experience, attributes, and skills relevant to the Trustee's qualifications to serve as a Trustee, which led to the conclusion that the Trustee should serve as a Trustee for the fund.
Advisory Board Members and Officers:
Correspondence intended for an officer or Peter S. Lynch may be sent to Fidelity Investments, 245 Summer Street, Boston, Massachusetts 02210. Officers appear below in alphabetical order.
Name, Year of Birth; Principal Occupation
Peter S. Lynch (1944)
Year of Election or Appointment: 2003
Member of the Advisory Board
Mr. Lynch also serves as Member of the Advisory Board of other Fidelity® funds. Mr. Lynch is Vice Chairman and a Director of FMR (investment adviser firm) and FMR Co., Inc. (investment adviser firm). In addition, Mr. Lynch serves as a Trustee of Boston College and as the Chairman of the Inner-City Scholarship Fund. Previously, Mr. Lynch served on the Special Olympics International Board of Directors (1997-2006).
Elizabeth Paige Baumann (1968)
Year of Election or Appointment: 2017
Interim Anti-Money Laundering (AML) Officer
Ms. Baumann also serves as AML Officer of other funds. She is Chief AML Officer (2012-present) and Senior Vice President (2014-present) of FMR LLC (diversified financial services company) and is an employee of Fidelity Investments. Previously, Ms. Baumann served as AML Officer (2012-2016), Vice President (2007-2014), and Deputy Anti-Money Laundering Officer (2007-2012).
Marc R. Bryant (1966)
Year of Election or Appointment: 2015
Secretary and Chief Legal Officer (CLO)
Mr. Bryant also serves as Secretary and CLO of other funds. Mr. Bryant serves as CLO, Secretary, and Senior Vice President of Fidelity Management & Research Company (investment adviser firm, 2015-present) and FMR Co., Inc. (investment adviser firm, 2015-present); Secretary of Fidelity SelectCo, LLC (investment adviser firm, 2015-present) and Fidelity Investments Money Management, Inc. (investment adviser firm, 2015-present); and CLO of Fidelity Management & Research (Hong Kong) Limited and FMR Investment Management (UK) Limited (investment adviser firms, 2015-present) and Fidelity Management & Research (Japan) Limited (investment adviser firm, 2016-present). He is Senior Vice President and Deputy General Counsel of FMR LLC (diversified financial services company). Previously, Mr. Bryant served as Secretary and CLO of Fidelity Rutland Square Trust II (2010-2014) and Assistant Secretary of Fidelity's Fixed Income and Asset Allocation Funds (2013-2015). Prior to joining Fidelity Investments, Mr. Bryant served as a Senior Vice President and the Head of Global Retail Legal for AllianceBernstein L.P. (2006-2010), and as the General Counsel for ProFund Advisors LLC (2001-2006).
Jeffrey S. Christian (1961)
Year of Election or Appointment: 2016
Assistant Treasurer
Mr. Christian also serves as Assistant Treasurer of other funds. Mr. Christian is an employee of Fidelity Investments (2003-present).
William C. Coffey (1969)
Year of Election or Appointment: 2009
Assistant Secretary
Mr. Coffey also serves as Assistant Secretary of other funds. He is Senior Vice President and Deputy General Counsel of FMR LLC (diversified financial services company, 2010-present), and is an employee of Fidelity Investments. Previously, Mr. Coffey served as Vice President and Associate General Counsel of FMR LLC (2005-2009).
Jonathan Davis (1968)
Year of Election or Appointment: 2010
Assistant Treasurer
Mr. Davis also serves as Assistant Treasurer of other funds, and is an employee of Fidelity Investments. Previously, Mr. Davis served as Vice President and Associate General Counsel of FMR LLC (diversified financial services company, 2003-2010).
Adrien E. Deberghes (1967)
Year of Election or Appointment: 2016
Assistant Treasurer
Mr. Deberghes also serves as an officer of other funds. He serves as Executive Vice President of Fidelity Investments Money Management, Inc. (FIMM) (investment adviser firm, 2016-present) and is an employee of Fidelity Investments (2008-present). Prior to joining Fidelity Investments, Mr. Deberghes was Senior Vice President of Mutual Fund Administration at State Street Corporation (2007-2008), Senior Director of Mutual Fund Administration at Investors Bank & Trust (2005-2007), and Director of Finance for Dunkin' Brands (2000-2005). Previously, Mr. Deberghes served in other fund officer roles.
Stephanie J. Dorsey (1969)
Year of Election or Appointment: 2010
Assistant Treasurer
Ms. Dorsey also serves as an officer of other funds. She is an employee of Fidelity Investments (2008-present) and has served in other fund officer roles. Prior to joining Fidelity Investments, Ms. Dorsey served as Treasurer (2004-2008) of the JPMorgan Mutual Funds and Vice President (2004-2008) of JPMorgan Chase Bank.
Howard J. Galligan III (1966)
Year of Election or Appointment: 2014
Chief Financial Officer
Mr. Galligan also serves as Chief Financial Officer of other funds. Mr. Galligan serves as President of Fidelity Pricing and Cash Management Services (FPCMS) (2014-present) and as a Director of Strategic Advisers, Inc. (investment adviser firm, 2008-present). Previously, Mr. Galligan served as Chief Administrative Officer of Asset Management (2011-2014) and Chief Operating Officer and Senior Vice President of Investment Support for Strategic Advisers, Inc. (2003-2011).
Scott C. Goebel (1968)
Year of Election or Appointment: 2015
Vice President
Mr. Goebel serves as Vice President of other funds and is an employee of Fidelity Investments (2001-present). Previously, Mr. Goebel served as Senior Vice President of Fidelity Management & Research Company (FMR) (investment adviser firm, 2016), Secretary of Fidelity SelectCo, LLC (investment adviser firm, 2013-2015), Fidelity Investments Money Management, Inc. (FIMM) (investment adviser firm, 2010-2015), and Fidelity Research and Analysis Company (FRAC) (investment adviser firm, 2010-2015); General Counsel, Secretary, and Senior Vice President of FMR (investment adviser firm, 2008-2015) and FMR Co., Inc. (investment adviser firm, 2008-2015); Assistant Secretary of Fidelity Management & Research (Japan) Limited (investment adviser firm, 2008-2015) and Fidelity Management & Research (U.K.) Inc. (investment adviser firm, 2008-2015); Chief Legal Officer (CLO) of Fidelity Management & Research (Hong Kong) Limited (investment adviser firm, 2008-2015); Secretary and CLO of certain Fidelity® funds (2008-2015); Assistant Secretary of FIMM (2008-2010), FRAC (2008-2010), and certain funds (2007-2008); and as Vice President and Secretary of Fidelity Distributors Corporation (FDC) (2005-2007).
Thomas C. Hense (1964)
Year of Election or Appointment: 2008, 2010, or 2015
Vice President
Mr. Hense serves as Vice President of Fidelity Advisor® Multi-Asset Income Fund (2015) and other funds (High Income (2008), Small Cap (2008), and Value (2010) funds), and is an employee of Fidelity Investments (1993-present). Previously, Mr. Hense served as a portfolio manager for Fidelity's Institutional Money Management Group (Pyramis) (2003-2008).
Brian B. Hogan (1964)
Year of Election or Appointment: 2009
Vice President
Mr. Hogan also serves as Trustee or Vice President of other funds. Mr. Hogan serves as a Director of FMR Investment Management (UK) Limited (investment adviser firm, 2015-present) and Fidelity SelectCo, LLC (investment adviser firm, 2014-present) and President of the Equity Division of FMR (investment adviser firm, 2009-present). Previously, Mr. Hogan served as Senior Vice President, Equity Research of FMR (2006-2009) and as a portfolio manager. Mr. Brian B. Hogan is not related to Mr. Colm A. Hogan.
Colm A. Hogan (1973)
Year of Election or Appointment: 2016
Deputy Treasurer
Mr. Hogan also serves as an officer of other funds. Mr. Hogan is an employee of Fidelity Investments (2005-present). Mr. Colm A. Hogan is not related to Mr. Brian B. Hogan.
Chris Maher (1972)
Year of Election or Appointment: 2013
Assistant Treasurer
Mr. Maher serves as Assistant Treasurer of other funds. Mr. Maher is Vice President of Valuation Oversight and is an employee of Fidelity Investments. Previously, Mr. Maher served as Vice President of Asset Management Compliance (2013), Vice President of the Program Management Group of FMR (investment adviser firm, 2010-2013), and Vice President of Valuation Oversight (2008-2010).
Kenneth B. Robins (1969)
Year of Election or Appointment: 2016
Chief Compliance Officer
Mr. Robins also serves as an officer of other funds. Mr. Robins serves as Compliance Officer of Fidelity Management & Research Company and FMR Co., Inc. (investment adviser firms, 2016-present) and is an employee of Fidelity Investments (2004-present). Previously, Mr. Robins served as Executive Vice President of Fidelity Investments Money Management, Inc. (investment adviser firm, 2013-2016) and served in other fund officer roles.
Stacie M. Smith (1974)
Year of Election or Appointment: 2016
President and Treasurer
Ms. Smith also serves as an officer of other funds. She is an employee of Fidelity Investments (2009-present) and has served in other fund officer roles. Prior to joining Fidelity Investments, Ms. Smith served as Senior Audit Manager of Ernst & Young LLP (accounting firm, 1996-2009). Previously, Ms. Smith served as Deputy Treasurer of certain Fidelity® funds (2013-2016).
Marc L. Spector (1972)
Year of Election or Appointment: 2016
Assistant Treasurer
Mr. Spector also serves as an officer of other funds. Mr. Spector is an employee of Fidelity Investments (2016-present). Prior to joining Fidelity Investments, Mr. Spector served as Director at the Siegfried Group (accounting firm, 2013-2016), and prior to Siegfried Group as audit senior manager at Deloitte & Touche (accounting firm, 2005-2013).
Renee Stagnone (1975)
Year of Election or Appointment: 2016
Assistant Treasurer
Ms. Stagnone also serves as an officer of other funds. Ms. Stagnone is an employee of Fidelity Investments (1997-present). Previously, Ms. Stagnone served as Deputy Treasurer of certain Fidelity® funds (2013-2016).
Shareholder Expense Example
As a shareholder of the Fund, you incur two types of costs: (1) transaction costs, including sales charges (loads) on purchase payments or redemption proceeds, redemption fees and (2) ongoing costs, including management fees, distribution and/or service (12b-1) fees and other Fund expenses. This Example is intended to help you understand your ongoing costs (in dollars) of investing in the Fund and to compare these costs with the ongoing costs of investing in other mutual funds.
The Example is based on an investment of $1,000 invested at the beginning of the period and held for the entire period (August 1, 2016 to January 31, 2017).
Actual Expenses
The first line of the accompanying table for each class of the Fund provides information about actual account values and actual expenses. You may use the information in this line, together with the amount you invested, to estimate the expenses that you paid over the period. Simply divide your account value by $1,000.00 (for example, an $8,600 account value divided by $1,000.00 = 8.6), then multiply the result by the number in the first line for a class of the Fund under the heading entitled "Expenses Paid During Period" to estimate the expenses you paid on your account during this period. A small balance maintenance fee of $12.00 that is charged once a year may apply for certain accounts with a value of less than $2,000. This fee is not included in the table below. If it was, the estimate of expenses you paid during the period would be higher, and your ending account value lower, by this amount. In addition, the Fund, as a shareholder in the underlying Fidelity Central Funds, will indirectly bear its pro-rata share of the fees and expenses incurred by the underlying Fidelity Central Funds. These fees and expenses are not included in the Fund's annualized expense ratio used to calculate the expense estimate in the table below.
Hypothetical Example for Comparison Purposes
The second line of the accompanying table for each class of the Fund provides information about hypothetical account values and hypothetical expenses based on a Class' actual expense ratio and an assumed rate of return of 5% per year before expenses, which is not the Class' actual return. The hypothetical account values and expenses may not be used to estimate the actual ending account balance or expenses you paid for the period. You may use this information to compare the ongoing costs of investing in the Fund and other funds. To do so, compare this 5% hypothetical example with the 5% hypothetical examples that appear in the shareholder reports of the other funds. A small balance maintenance fee of $12.00 that is charged once a year may apply for certain accounts with a value of less than $2,000. This fee is not included in the table below. If it was, the estimate of expenses you paid during the period would be higher, and your ending account value lower, by this amount. In addition, the Fund, as a shareholder in the underlying Fidelity Central Funds, will indirectly bear its pro-rata share of the fees and expenses incurred by the underlying Fidelity Central Funds. These fees and expenses are not included in the Fund's annualized expense ratio used to calculate the expense estimate in the table below.
Please note that the expenses shown in the table are meant to highlight your ongoing costs only and do not reflect any transaction costs. Therefore, the second line of the table is useful in comparing ongoing costs only, and will not help you determine the relative total costs of owning different funds. In addition, if these transactional costs were included, your costs would have been higher.
| | Annualized Expense Ratio-A | Beginning
Account Value
August 1, 2016 | Ending
Account Value
January 31, 2017 | Expenses Paid
During Period-B
August 1, 2016
to January 31, 2017 |
| Class A | .97% | | | |
| Actual | | $1,000.00 | $1,083.00 | $5.08 |
| Hypothetical-C | | $1,000.00 | $1,020.26 | $4.93 |
| Class T | 1.25% | | | |
| Actual | | $1,000.00 | $1,081.50 | $6.54 |
| Hypothetical-C | | $1,000.00 | $1,018.85 | $6.34 |
| Class C | 1.72% | | | |
| Actual | | $1,000.00 | $1,079.10 | $8.99 |
| Hypothetical-C | | $1,000.00 | $1,016.49 | $8.72 |
| Mid Cap Value | .68% | | | |
| Actual | | $1,000.00 | $1,084.60 | $3.56 |
| Hypothetical-C | | $1,000.00 | $1,021.72 | $3.46 |
| Class I | .69% | | | |
| Actual | | $1,000.00 | $1,084.50 | $3.62 |
| Hypothetical-C | | $1,000.00 | $1,021.67 | $3.51 |
A Annualized expense ratio reflects expenses net of applicable fee waivers.
B Expenses are equal to each Class' annualized expense ratio, multiplied by the average account value over the period, multiplied by 184/366 (to reflect the one-half year period).
C 5% return per year before expenses
Distributions (Unaudited)
Mid Cap Value, Class A, Class T, Class C and Class I designate 100% of the dividends distributed during the fiscal year as qualifying for the dividends–received deduction for corporate shareholders.
Mid Cap Value, Class A, Class T, Class C and Class I designate 100% of the dividends distributed during the fiscal year as amounts which may be taken into account as a dividend for purposes of the maximum rate under section 1(h)(11) of the Internal Revenue Code.
The fund will notify shareholders in January 2018 of amounts for use in preparing 2017 income tax returns.
AMCV-ANN-0317
1.838440.107
Fidelity Advisor® Series Equity-Income Fund
Fidelity Advisor® Series Stock Selector Large Cap Value Fund
Annual Report January 31, 2017 |
|
Contents
To view a fund's proxy voting guidelines and proxy voting record for the 12-month period ended June 30, visit http://www.fidelity.com/proxyvotingresults or visit the Securities and Exchange Commission's (SEC) web site at http://www.sec.gov.
You may also call 1-877-208-0098 to request a free copy of the proxy voting guidelines.
Standard & Poor's, S&P and S&P 500 are registered service marks of The McGraw-Hill Companies, Inc. and have been licensed for use by Fidelity Distributors Corporation.
Other third-party marks appearing herein are the property of their respective owners.
All other marks appearing herein are registered or unregistered trademarks or service marks of FMR LLC or an affiliated company. © 2017 FMR LLC. All rights reserved.
This report and the financial statements contained herein are submitted for the general information of the shareholders of the Funds. This report is not authorized for distribution to prospective investors in the Funds unless preceded or accompanied by an effective prospectus.
A fund files its complete schedule of portfolio holdings with the SEC for the first and third quarters of each fiscal year on Form N-Q. Forms N-Q are available on the SEC’s web site at http://www.sec.gov. A fund's Forms N-Q may be reviewed and copied at the SEC’s Public Reference Room in Washington, DC. Information regarding the operation of the SEC's Public Reference Room may be obtained by calling 1-800-SEC-0330.
For a complete list of a fund's portfolio holdings, view the most recent holdings listing, semiannual report, or annual report on Fidelity's web site at http://www.fidelity.com, http://www.institutional.fidelity.com, or http://www.401k.com, as applicable.
NOT FDIC INSURED •MAY LOSE VALUE •NO BANK GUARANTEE
Neither the Funds nor Fidelity Distributors Corporation is a bank.
Fidelity Advisor® Series Equity-Income Fund
Performance: The Bottom Line
Average annual total return reflects the change in the value of an investment, assuming reinvestment of distributions from dividend income and capital gains (the profits earned upon the sale of securities that have grown in value, if any) and assuming a constant rate of performance each year. The hypothetical investment and the average annual total returns do not reflect the deduction of taxes that a shareholder would pay on fund distributions or the redemption of fund shares. During periods of reimbursement by Fidelity, a fund’s total return will be greater than it would be had the reimbursement not occurred. How a fund did yesterday is no guarantee of how it will do tomorrow.
Average Annual Total Returns
| For the periods ended January 31, 2017 | Past 1 year | Life of fundA |
| Fidelity Advisor® Series Equity-Income Fund | 25.49% | 12.51% |
A From December 6, 2012
$10,000 Over Life of Fund
Let's say hypothetically that $10,000 was invested in Fidelity Advisor® Series Equity-Income Fund on December 6, 2012, when the fund started.
The chart shows how the value of your investment would have changed, and also shows how the Russell 3000® Value Index performed over the same period.

| Period Ending Values |
| $16,324 | Fidelity Advisor® Series Equity-Income Fund |
| $17,391 | Russell 3000® Value Index |
Fidelity Advisor® Series Equity-Income Fund
Management's Discussion of Fund Performance
Market Recap: The U.S. equity bellwether S&P 500
® index posted a 20.04% gain for the year ending January 31, 2017, rising sharply in the period’s final months on renewed optimism for economic growth. The beginning of the period saw improving investor sentiment amid U.S. job gains, a rally in energy and other stimuli that helped keep the seven-year bull uptrend intact. Markets tumbled briefly following the U.K.’s June 23 vote to exit the European Union (Brexit) – then recovered quickly and settled into a flattish stretch until the November 8 U.S. presidential election. Stocks then broke out in response to Donald Trump’s surprise victory, surging to a series of new all-time highs on expectations for reflation and fiscal stimulus. For the year, industrials (+28%), energy (+27%) and materials (+37%) all did well, the latter two driven by a cyclical rebound in commodity prices. Financials (+35%) also shined, riding an uptick in bond yields and the strong rally in banks (+41%), especially post-election. Information technology rose about 25%, despite cooling off in the fourth quarter of 2016. Conversely, real estate (+8%) lagged on the prospect for rising interest rates. An improved backdrop for riskier assets curbed dividend-rich telecommunication services (+13%), utilities (+12%) and consumer staples (+6%). Health care (+8%) underperformed amid an uncertain political and regulatory outlook.
Comments from Portfolio Manager James Morrow: For the year, the fund gained 25.49%, roughly in line with the 25.76% advance of the benchmark Russell 3000
® Value Index. Relative to the benchmark, the fund was hurt by a higher-than-normal amount of cash – reflecting my caution about market volatility leading up to the election. Weak stock selection in industrials and health care also detracted. Within the latter group, an out-of-benchmark stake in Israeli drug manufacturer Teva Pharmaceutical Industries meaningfully detracted. Teva’s multiple challenges this period included overpaying to acquire a competitor, falling earnings and unfavorable patent decisions. Also weighing on results was an overweighting in pharmaceutical and medical-products company Johnson & Johnson, whose shares lagged the index. Elsewhere, the fund’s biggest individual detractor was CVS Health, a retail drugstore chain that reported lighter-than-expected revenue in November. On the positive side, security selection in the energy sector notably helped performance, including energy transportation companies Williams Partners, Energy Transfer Equity and Williams Companies, parent of Williams Partners and the only one of the three in the benchmark. Stock picking in financials, especially banks, also helped. JPMorgan Chase, among the fund’s largest holdings, contributed, as did regional banks M&T and Comerica.
The views expressed above reflect those of the portfolio manager(s) only through the end of the period as stated on the cover of this report and do not necessarily represent the views of Fidelity or any other person in the Fidelity organization. Any such views are subject to change at any time based upon market or other conditions and Fidelity disclaims any responsibility to update such views. These views may not be relied on as investment advice and, because investment decisions for a Fidelity fund are based on numerous factors, may not be relied on as an indication of trading intent on behalf of any Fidelity fund.
Fidelity Advisor® Series Equity-Income Fund
Investment Summary (Unaudited)
Top Ten Stocks as of January 31, 2017
| | % of fund's net assets | % of fund's net assets 6 months ago |
| JPMorgan Chase & Co. | 3.6 | 3.3 |
| Cisco Systems, Inc. | 3.4 | 2.8 |
| Johnson & Johnson | 3.0 | 3.2 |
| Procter & Gamble Co. | 3.0 | 2.7 |
| General Electric Co.(a) | 2.6 | 3.1 |
| Verizon Communications, Inc. | 2.3 | 2.4 |
| Comcast Corp. Class A(a) | 2.2 | 1.1 |
| Medtronic PLC | 2.2 | 2.3 |
| M&T Bank Corp.(a) | 2.1 | 1.8 |
| Wells Fargo & Co. | 2.1 | 1.9 |
| | 26.5 | |
(a) Security or a portion of the security is pledged as collateral for call options written.
Top Five Market Sectors as of January 31, 2017
| | % of fund's net assets | % of fund's net assets 6 months ago |
| Financials | 24.2 | 24.5 |
| Energy | 11.0 | 12.3 |
| Industrials | 9.3 | 10.3 |
| Information Technology | 9.3 | 10.9 |
| Consumer Staples | 9.1 | 7.5 |
Prior period industry classifications reflect the categories in place as of the date indicated and have not been adjusted to reflect current industry classifications.
Asset Allocation (% of fund's net assets)
| As of January 31, 2017*,** |
| | Stocks | 93.5% |
| | Other Investments | 0.2% |
| | Short-Term Investments and Net Other Assets (Liabilities) | 6.3% |

* Foreign investments - 8.1%
** Written options - (0.1)%
| As of July 31, 2016*,** |
| | Stocks | 93.0% |
| | Short-Term Investments and Net Other Assets (Liabilities) | 7.0% |

* Foreign investments - 6.6%
** Written options - (0.1)%
Fidelity Advisor® Series Equity-Income Fund
Investments January 31, 2017
Showing Percentage of Net Assets
| Common Stocks - 93.5% | | | |
| | | Shares | Value |
| CONSUMER DISCRETIONARY - 8.9% | | | |
| Auto Components - 0.2% | | | |
| Delphi Automotive PLC | | 49,400 | $3,460,964 |
| Automobiles - 1.9% | | | |
| Fiat Chrysler Automobiles NV | | 74,700 | 820,953 |
| Fiat Chrysler Automobiles NV | | 661,300 | 7,210,121 |
| General Motors Co. | | 644,400 | 23,591,484 |
| | | | 31,622,558 |
| Hotels, Restaurants & Leisure - 0.8% | | | |
| Dunkin' Brands Group, Inc. | | 248,600 | 12,894,882 |
| Household Durables - 0.7% | | | |
| M.D.C. Holdings, Inc. | | 226,170 | 6,115,637 |
| Tupperware Brands Corp. | | 78,500 | 4,738,260 |
| | | | 10,853,897 |
| Leisure Products - 0.6% | | | |
| Mattel, Inc. | | 199,500 | 5,228,895 |
| Polaris Industries, Inc. (a) | | 50,500 | 4,245,535 |
| | | | 9,474,430 |
| Media - 3.0% | | | |
| Comcast Corp. Class A (b) | | 478,528 | 36,090,582 |
| The Walt Disney Co. | | 48,100 | 5,322,265 |
| Time Warner, Inc. | | 92,300 | 8,939,255 |
| | | | 50,352,102 |
| Multiline Retail - 1.3% | | | |
| Kohl's Corp. | | 132,302 | 5,269,589 |
| Macy's, Inc. | | 196,100 | 5,792,794 |
| Target Corp. | | 150,597 | 9,710,495 |
| | | | 20,772,878 |
| Specialty Retail - 0.4% | | | |
| Bed Bath & Beyond, Inc. | | 18,400 | 742,440 |
| Foot Locker, Inc. | | 35,500 | 2,433,170 |
| GNC Holdings, Inc. | | 129,300 | 1,146,891 |
| Stage Stores, Inc. (a) | | 196,300 | 549,640 |
| Williams-Sonoma, Inc. (a) | | 33,200 | 1,600,572 |
| | | | 6,472,713 |
|
| TOTAL CONSUMER DISCRETIONARY | | | 145,904,424 |
|
| CONSUMER STAPLES - 9.1% | | | |
| Beverages - 0.8% | | | |
| Molson Coors Brewing Co. Class B | | 48,400 | 4,671,568 |
| The Coca-Cola Co. | | 216,300 | 8,991,591 |
| | | | 13,663,159 |
| Food & Staples Retailing - 3.7% | | | |
| CVS Health Corp. | | 259,487 | 20,450,170 |
| Kroger Co. | | 60,500 | 2,054,580 |
| Wal-Mart Stores, Inc. | | 256,942 | 17,148,309 |
| Walgreens Boots Alliance, Inc. | | 212,686 | 17,427,491 |
| Whole Foods Market, Inc. | | 133,100 | 4,022,282 |
| | | | 61,102,832 |
| Food Products - 0.9% | | | |
| B&G Foods, Inc. Class A | | 149,555 | 6,632,764 |
| The Hain Celestial Group, Inc. (c) | | 35,000 | 1,384,600 |
| The Hershey Co. (b) | | 38,800 | 4,092,236 |
| The J.M. Smucker Co. | | 13,000 | 1,766,050 |
| | | | 13,875,650 |
| Household Products - 3.3% | | | |
| Kimberly-Clark Corp. | | 43,500 | 5,269,155 |
| Procter & Gamble Co. | | 565,381 | 49,527,376 |
| | | | 54,796,531 |
| Personal Products - 0.2% | | | |
| Unilever NV (NY Reg.) (a) | | 90,100 | 3,662,565 |
| Tobacco - 0.2% | | | |
| Reynolds American, Inc. | | 54,100 | 3,253,033 |
|
| TOTAL CONSUMER STAPLES | | | 150,353,770 |
|
| ENERGY - 10.8% | | | |
| Energy Equipment & Services - 1.3% | | | |
| Baker Hughes, Inc. (b) | | 83,700 | 5,279,796 |
| Halliburton Co. | | 97,200 | 5,498,604 |
| Oceaneering International, Inc. | | 31,400 | 874,490 |
| Schlumberger Ltd. | | 115,100 | 9,635,021 |
| | | | 21,287,911 |
| Oil, Gas & Consumable Fuels - 9.5% | | | |
| Anadarko Petroleum Corp. | | 246,959 | 17,171,059 |
| Apache Corp. | | 184,495 | 11,036,491 |
| Chevron Corp. (b) | | 180,269 | 20,072,953 |
| ConocoPhillips Co. | | 480,200 | 23,414,552 |
| CONSOL Energy, Inc. | | 137,506 | 2,329,352 |
| Energy Transfer Equity LP | | 34,500 | 619,275 |
| EQT Midstream Partners LP | | 4,300 | 336,518 |
| Golar LNG Ltd. | | 57,389 | 1,484,080 |
| Imperial Oil Ltd. | | 30,500 | 1,002,720 |
| Kinder Morgan, Inc. | | 531,000 | 11,862,540 |
| Legacy Reserves LP (c) | | 347,700 | 817,095 |
| MPLX LP | | 175,529 | 6,643,773 |
| Suncor Energy, Inc. | | 28,200 | 874,661 |
| The Williams Companies, Inc. | | 1,056,800 | 30,478,112 |
| Williams Partners LP | | 699,951 | 28,725,989 |
| | | | 156,869,170 |
|
| TOTAL ENERGY | | | 178,157,081 |
|
| FINANCIALS - 24.2% | | | |
| Banks - 13.4% | | | |
| Bank of America Corp. (b) | | 1,146,000 | 25,945,440 |
| Comerica, Inc. (b) | | 180,600 | 12,195,918 |
| Huntington Bancshares, Inc. | | 112,800 | 1,526,184 |
| JPMorgan Chase & Co. | | 693,930 | 58,727,293 |
| KeyCorp (b) | | 588,728 | 10,579,442 |
| M&T Bank Corp. (b) | | 214,170 | 34,817,617 |
| Prosperity Bancshares, Inc. | | 6,400 | 464,832 |
| Regions Financial Corp. (b) | | 719,300 | 10,365,113 |
| SunTrust Banks, Inc. (b) | | 234,600 | 13,329,972 |
| U.S. Bancorp | | 371,921 | 19,581,641 |
| Wells Fargo & Co. | | 604,449 | 34,048,612 |
| | | | 221,582,064 |
| Capital Markets - 6.1% | | | |
| Apollo Global Management LLC Class A | | 213,400 | 4,532,616 |
| Ares Capital Corp. | | 249,152 | 4,210,669 |
| Ares Management LP | | 55,357 | 1,087,765 |
| KKR & Co. LP | | 962,704 | 16,712,541 |
| Morgan Stanley (b) | | 360,800 | 15,330,392 |
| State Street Corp. | | 294,400 | 22,433,280 |
| The Blackstone Group LP | | 1,083,400 | 33,184,542 |
| TPG Specialty Lending, Inc. | | 73,411 | 1,341,219 |
| Virtu Financial, Inc. Class A | | 50,100 | 879,255 |
| | | | 99,712,279 |
| Insurance - 4.4% | | | |
| American International Group, Inc. | | 12,700 | 816,102 |
| Chubb Ltd. | | 246,693 | 32,437,663 |
| Marsh & McLennan Companies, Inc. (b) | | 67,700 | 4,604,954 |
| MetLife, Inc. | | 425,851 | 23,170,553 |
| Prudential Financial, Inc. | | 112,992 | 11,876,589 |
| | | | 72,905,861 |
| Mortgage Real Estate Investment Trusts - 0.1% | | | |
| Agnc Investment Corp. | | 49,773 | 929,262 |
| Two Harbors Investment Corp. | | 140,600 | 1,233,062 |
| | | | 2,162,324 |
| Thrifts & Mortgage Finance - 0.2% | | | |
| Radian Group, Inc. | | 155,762 | 2,866,021 |
|
| TOTAL FINANCIALS | | | 399,228,549 |
|
| HEALTH CARE - 9.1% | | | |
| Biotechnology - 1.7% | | | |
| Amgen, Inc. | | 100,200 | 15,699,336 |
| Gilead Sciences, Inc. | | 164,700 | 11,932,515 |
| | | | 27,631,851 |
| Health Care Equipment & Supplies - 2.5% | | | |
| Dentsply Sirona, Inc. | | 87,600 | 4,966,920 |
| Medtronic PLC | | 469,574 | 35,697,015 |
| | | | 40,663,935 |
| Health Care Providers & Services - 0.2% | | | |
| AmerisourceBergen Corp. | | 9,300 | 811,704 |
| Anthem, Inc. | | 6,400 | 986,496 |
| McKesson Corp. | | 10,400 | 1,447,160 |
| | | | 3,245,360 |
| Pharmaceuticals - 4.7% | | | |
| Bristol-Myers Squibb Co. | | 76,500 | 3,760,740 |
| GlaxoSmithKline PLC | | 45,500 | 879,288 |
| Johnson & Johnson | | 439,193 | 49,738,607 |
| Merck & Co., Inc. | | 165,400 | 10,253,146 |
| Pfizer, Inc. | | 182,436 | 5,788,694 |
| Teva Pharmaceutical Industries Ltd. sponsored ADR | | 217,500 | 7,271,025 |
| | | | 77,691,500 |
|
| TOTAL HEALTH CARE | | | 149,232,646 |
|
| INDUSTRIALS - 9.3% | | | |
| Aerospace & Defense - 3.0% | | | |
| General Dynamics Corp. (b) | | 83,500 | 15,120,180 |
| Raytheon Co. (b) | | 54,900 | 7,914,384 |
| The Boeing Co. | | 38,100 | 6,226,302 |
| United Technologies Corp. | | 178,500 | 19,576,095 |
| | | | 48,836,961 |
| Air Freight & Logistics - 1.8% | | | |
| C.H. Robinson Worldwide, Inc. | | 26,443 | 2,011,255 |
| United Parcel Service, Inc. Class B | | 246,200 | 26,867,806 |
| | | | 28,879,061 |
| Airlines - 0.0% | | | |
| Allegiant Travel Co. | | 3,900 | 670,800 |
| Commercial Services & Supplies - 0.8% | | | |
| KAR Auction Services, Inc. | | 248,350 | 11,312,343 |
| Waste Connection, Inc. (Canada) | | 26,241 | 2,104,523 |
| | | | 13,416,866 |
| Electrical Equipment - 1.0% | | | |
| AMETEK, Inc. (b) | | 34,800 | 1,778,280 |
| Eaton Corp. PLC | | 163,300 | 11,558,374 |
| Regal Beloit Corp. | | 40,600 | 2,947,560 |
| | | | 16,284,214 |
| Industrial Conglomerates - 2.6% | | | |
| General Electric Co. (b) | | 1,461,333 | 43,401,590 |
| Machinery - 0.1% | | | |
| Allison Transmission Holdings, Inc. | | 53,300 | 1,864,434 |
|
| TOTAL INDUSTRIALS | | | 153,353,926 |
|
| INFORMATION TECHNOLOGY - 9.3% | | | |
| Communications Equipment - 3.4% | | | |
| Cisco Systems, Inc. | | 1,827,859 | 56,151,828 |
| Electronic Equipment & Components - 0.8% | | | |
| Dell Technologies, Inc. (c) | | 95,788 | 6,033,686 |
| TE Connectivity Ltd. | | 86,424 | 6,425,624 |
| | | | 12,459,310 |
| IT Services - 1.6% | | | |
| First Data Corp. Class A (c) | | 911,700 | 13,985,478 |
| Paychex, Inc. (b) | | 127,696 | 7,698,792 |
| Sabre Corp. | | 174,800 | 4,282,600 |
| | | | 25,966,870 |
| Semiconductors & Semiconductor Equipment - 1.5% | | | |
| KLA-Tencor Corp. | | 10,800 | 919,188 |
| Maxim Integrated Products, Inc. | | 142,300 | 6,329,504 |
| Qualcomm, Inc. | | 331,910 | 17,733,951 |
| | | | 24,982,643 |
| Software - 1.0% | | | |
| Microsoft Corp. | | 231,700 | 14,979,405 |
| SS&C Technologies Holdings, Inc. | | 44,000 | 1,413,720 |
| | | | 16,393,125 |
| Technology Hardware, Storage & Peripherals - 1.0% | | | |
| Apple, Inc. (b) | | 142,100 | 17,243,835 |
|
| TOTAL INFORMATION TECHNOLOGY | | | 153,197,611 |
|
| MATERIALS - 2.0% | | | |
| Chemicals - 1.4% | | | |
| CF Industries Holdings, Inc. | | 138,100 | 4,873,549 |
| LyondellBasell Industries NV Class A | | 76,600 | 7,144,482 |
| The Dow Chemical Co. | | 187,100 | 11,156,773 |
| | | | 23,174,804 |
| Containers & Packaging - 0.6% | | | |
| WestRock Co. | | 182,600 | 9,743,536 |
|
| TOTAL MATERIALS | | | 32,918,340 |
|
| REAL ESTATE - 2.1% | | | |
| Equity Real Estate Investment Trusts (REITs) - 2.1% | | | |
| American Tower Corp. | | 35,200 | 3,643,200 |
| Cousins Properties, Inc. | | 311,400 | 2,646,900 |
| Crown Castle International Corp. | | 88,100 | 7,737,823 |
| Duke Realty LP | | 145,900 | 3,549,747 |
| First Potomac Realty Trust | | 254,915 | 2,610,330 |
| Piedmont Office Realty Trust, Inc. Class A | | 217,400 | 4,721,928 |
| Public Storage | | 29,100 | 6,256,500 |
| Sabra Health Care REIT, Inc. | | 64,500 | 1,638,300 |
| Ventas, Inc. | | 38,000 | 2,343,460 |
| | | | 35,148,188 |
| TELECOMMUNICATION SERVICES - 3.8% | | | |
| Diversified Telecommunication Services - 3.8% | | | |
| AT&T, Inc. | | 611,791 | 25,793,109 |
| Verizon Communications, Inc. | | 765,090 | 37,497,061 |
| | | | 63,290,170 |
| UTILITIES - 4.9% | | | |
| Electric Utilities - 4.4% | | | |
| American Electric Power Co., Inc. | | 76,745 | 4,916,285 |
| Duke Energy Corp. | | 65,000 | 5,105,100 |
| Entergy Corp. | | 125,300 | 8,976,492 |
| Exelon Corp. | | 822,100 | 29,496,948 |
| PPL Corp. | | 335,800 | 11,699,272 |
| Southern Co. | | 181,334 | 8,963,340 |
| Xcel Energy, Inc. | | 84,200 | 3,479,144 |
| | | | 72,636,581 |
| Multi-Utilities - 0.5% | | | |
| CenterPoint Energy, Inc. | | 200,700 | 5,260,347 |
| Public Service Enterprise Group, Inc. | | 82,400 | 3,646,200 |
| | | | 8,906,547 |
|
| TOTAL UTILITIES | | | 81,543,128 |
|
| TOTAL COMMON STOCKS | | | |
| (Cost $1,290,828,812) | | | 1,542,327,833 |
|
| Other - 0.2% | | | |
| ENERGY - 0.2% | | | |
| Oil, Gas & Consumable Fuels - 0.2% | | | |
| Utica Shale Drilling Program (non-operating revenue interest) (d)(e) | | | |
| (Cost $3,088,232) | | 3,088,232 | 3,088,232 |
|
| Money Market Funds - 7.2% | | | |
| Fidelity Cash Central Fund, 0.62% (f) | | 108,226,582 | 108,248,228 |
| Fidelity Securities Lending Cash Central Fund 0.65% (f)(g) | | 10,233,850 | 10,235,897 |
| TOTAL MONEY MARKET FUNDS | | | |
| (Cost $118,482,977) | | | 118,484,125 |
| TOTAL INVESTMENT PORTFOLIO - 100.9% | | | |
| (Cost $1,412,400,021) | | | 1,663,900,190 |
| NET OTHER ASSETS (LIABILITIES) - (0.9)% | | | (14,542,191) |
| NET ASSETS - 100% | | | $1,649,357,999 |
| Written Options | | | | |
| | Expiration Date/Exercise Price | Number of Contracts | Premium | Value |
| Call Options | | | | |
| AMETEK, Inc. | 3/17/17 - $55.00 | 83 | $4,689 | $(2,905) |
| Apple, Inc. | 3/17/17 - $125.00 | 705 | 97,429 | (103,635) |
| AT&T, Inc. | 3/17/17 - $44.00 | 1,527 | 21,378 | (31,402) |
| Baker Hughes, Inc. | 4/21/17 - $67.50 | 205 | 23,984 | (21,935) |
| Bank of America Corp. | 3/17/17 - $25.00 | 2,864 | 48,859 | (34,368) |
| Chevron Corp. | 3/17/17 - $120.00 | 449 | 49,851 | (6,511) |
| Comcast Corp. Class A | 4/21/17 - $77.50 | 1,192 | 106,090 | (163,900) |
| Comerica, Inc. | 4/21/17 - $70.00 | 449 | 115,516 | (94,290) |
| Crown Castle International Corp. | 3/17/17 - $92.50 | 218 | 13,734 | (13,779) |
| General Dynamics Corp. | 5/19/17 - $185.00 | 207 | 68,551 | (111,780) |
| General Electric Co. | 4/21/17 - $32.00 | 3,648 | 65,662 | (58,368) |
| Halliburton Co. | 4/21/17 - $62.50 | 239 | 18,642 | (18,822) |
| JPMorgan Chase & Co. | 4/21/17 - $87.50 | 1,731 | 339,276 | (310,481) |
| KeyCorp | 3/17/17 - $20.00 | 1,469 | 13,221 | (12,487) |
| M&T Bank Corp. | 2/17/17 - $165.00 | 532 | 71,106 | (79,800) |
| Marsh& McLennan Companies, Inc. | 4/21/17 - $70.00 | 169 | 18,928 | (16,055) |
| MetLife, Inc. | 3/17/17 - $57.50 | 1,063 | 103,111 | (73,750) |
| Morgan Stanley | 4/21/17 - $45.00 | 900 | 94,592 | (91,350) |
| Paychex, Inc. | 3/17/17 - $62.50 | 318 | 23,217 | (15,105) |
| Prudential Financial, Inc. | 3/17/17 - $110.00 | 278 | 68,110 | (53,281) |
| Raytheon Co. | 5/19/17 - $155.00 | 136 | 34,619 | (21,624) |
| Regions Financial Corp. | 2/17/17 - $13.00 | 1,325 | 45,138 | (192,125) |
| Regions Financial Corp. | 5/19/17 - $16.00 | 1,798 | 57,535 | (56,637) |
| Schlumberger Ltd. | 3/17/17 - $92.50 | 285 | 4,560 | (2,670) |
| SunTrust Banks, Inc. | 4/21/17 - $60.00 | 585 | 83,308 | (67,275) |
| The Hershey Co. | 5/19/17 - $110.00 | 97 | 26,787 | (24,492) |
| TOTAL WRITTEN OPTIONS | | | $1,617,893 | $(1,678,827) |
Legend
(a) Security or a portion of the security is on loan at period end.
(b) Security or a portion of the security is pledged as collateral for call options written. At period end, the value of securities pledged amounted to $77,348,458.
(c) Non-income producing
(d) Investment is owned by a wholly-owned subsidiary (Subsidiary) that is treated as a corporation for U.S. tax purposes.
(e) Restricted securities - Investment in securities not registered under the Securities Act of 1933 (excluding 144A issues). At the end of the period, the value of restricted securities (excluding 144A issues) amounted to $3,088,232 or 0.2% of net assets.
(f) Affiliated fund that is generally available only to investment companies and other accounts managed by Fidelity Investments. The rate quoted is the annualized seven-day yield of the fund at period end. A complete unaudited listing of the fund's holdings as of its most recent quarter end is available upon request. In addition, each Fidelity Central Fund's financial statements, which are not covered by the Fund's Report of Independent Registered Public Accounting Firm, are available on the SEC's website or upon request.
(g) Investment made with cash collateral received from securities on loan.
Additional information on each restricted holding is as follows:
| Security | Acquisition Date | Acquisition Cost |
| Utica Shale Drilling Program (non-operating revenue interest) | 10/5/16 - 11/4/16 | $3,088,232 |
Affiliated Central Funds
Information regarding fiscal year to date income earned by the Fund from investments in Fidelity Central Funds is as follows:
| Fund | Income earned |
| Fidelity Cash Central Fund | $268,586 |
| Fidelity Securities Lending Cash Central Fund | 107,937 |
| Total | $376,523 |
Investment Valuation
The following is a summary of the inputs used, as of January 31, 2017, involving the Fund's assets and liabilities carried at fair value. The inputs or methodology used for valuing securities may not be an indication of the risk associated with investing in those securities. For more information on valuation inputs, and their aggregation into the levels used below, please refer to the Investment Valuation section in the accompanying Notes to Financial Statements.
| | Valuation Inputs at Reporting Date: |
| Description | Total | Level 1 | Level 2 | Level 3 |
| Investments in Securities: | | | | |
| Equities: | | | | |
| Consumer Discretionary | $145,904,424 | $145,904,424 | $-- | $-- |
| Consumer Staples | 150,353,770 | 150,353,770 | -- | -- |
| Energy | 178,157,081 | 178,157,081 | -- | -- |
| Financials | 399,228,549 | 399,228,549 | -- | -- |
| Health Care | 149,232,646 | 148,353,358 | 879,288 | -- |
| Industrials | 153,353,926 | 153,353,926 | -- | -- |
| Information Technology | 153,197,611 | 153,197,611 | -- | -- |
| Materials | 32,918,340 | 32,918,340 | -- | -- |
| Real Estate | 35,148,188 | 35,148,188 | -- | -- |
| Telecommunication Services | 63,290,170 | 63,290,170 | -- | -- |
| Utilities | 81,543,128 | 81,543,128 | -- | -- |
| Other | 3,088,232 | -- | -- | 3,088,232 |
| Money Market Funds | 118,484,125 | 118,484,125 | -- | -- |
| Total Investments in Securities: | $1,663,900,190 | $1,659,932,670 | $879,288 | $3,088,232 |
| Derivative Instruments: | | | | |
| Liabilities | | | | |
| Written Options | $(1,678,827) | $(1,174,642) | $(504,185) | $-- |
| Total Liabilities | $(1,678,827) | $(1,174,642) | $(504,185) | $-- |
| Total Derivative Instruments: | $(1,678,827) | $(1,174,642) | $(504,185) | $-- |
Value of Derivative Instruments
The following table is a summary of the Fund's value of derivative instruments by primary risk exposure as of January 31, 2017. For additional information on derivative instruments, please refer to the Derivative Instruments section in the accompanying Notes to Financial Statements.
| Primary Risk Exposure / Derivative Type | Value |
| | Asset | Liability |
| Equity Risk | | |
| Written Options(a) | $0 | $(1,678,827) |
| Total Equity Risk | 0 | (1,678,827) |
| Total Value of Derivatives | $0 | $(1,678,827) |
(a) Gross value is presented in the Statement of Assets and Liabilities in the written options, at value line-item.
See accompanying notes which are an integral part of the financial statements.
Fidelity Advisor® Series Equity-Income Fund
Financial Statements
Statement of Assets and Liabilities
| | | January 31, 2017 |
| Assets | | |
Investment in securities, at value (including securities loaned of $10,040,739) — See accompanying schedule:
Unaffiliated issuers (cost $1,293,917,044) | $1,545,416,065 | |
| Fidelity Central Funds (cost $118,482,977) | 118,484,125 | |
| Total Investments (cost $1,412,400,021) | | $1,663,900,190 |
| Receivable for investments sold | | 1,385,119 |
| Receivable for fund shares sold | | 34,731 |
| Dividends receivable | | 1,697,312 |
| Distributions receivable from Fidelity Central Funds | | 36,958 |
| Prepaid expenses | | 2,663 |
| Other receivables | | 19,344 |
| Total assets | | 1,667,076,317 |
| Liabilities | | |
| Payable for fund shares redeemed | $4,844,899 | |
| Accrued management fee | 616,303 | |
| Written options, at value (premium received $1,617,893) | 1,678,827 | |
| Other affiliated payables | 279,268 | |
| Other payables and accrued expenses | 65,196 | |
| Collateral on Securities Loaned | 10,233,825 | |
| Total liabilities | | 17,718,318 |
| Net Assets | | $1,649,357,999 |
| Net Assets consist of: | | |
| Paid in capital | | $1,392,445,599 |
| Distributions in excess of net investment income | | (13,483,051) |
| Accumulated undistributed net realized gain (loss) on investments and foreign currency transactions | | 18,956,216 |
| Net unrealized appreciation (depreciation) on investments | | 251,439,235 |
| Net Assets, for 126,636,818 shares outstanding | | $1,649,357,999 |
| Net Asset Value, offering price and redemption price per share ($1,649,357,999 ÷ 126,636,818 shares) | | $13.02 |
See accompanying notes which are an integral part of the financial statements.
Statement of Operations
| | | Year ended January 31, 2017 |
| Investment Income | | |
| Dividends | | $46,392,028 |
| Income from Fidelity Central Funds | | 376,523 |
| Total income | | 46,768,551 |
| Expenses | | |
| Management fee | $7,350,755 | |
| Transfer agent fees | 2,873,542 | |
| Accounting and security lending fees | 511,524 | |
| Custodian fees and expenses | 45,061 | |
| Independent trustees' fees and expenses | 7,043 | |
| Audit | 66,110 | |
| Legal | 6,088 | |
| Miscellaneous | 15,143 | |
| Total expenses before reductions | 10,875,266 | |
| Expense reductions | (67,632) | 10,807,634 |
| Net investment income (loss) | | 35,960,917 |
| Realized and Unrealized Gain (Loss) | | |
| Net realized gain (loss) on: | | |
| Investment securities: | | |
| Unaffiliated issuers | 26,497,897 | |
| Fidelity Central Funds | 10,367 | |
| Foreign currency transactions | (6,052) | |
| Written options | 2,922,676 | |
| Total net realized gain (loss) | | 29,424,888 |
Change in net unrealized appreciation (depreciation) on:
Investment securities | 305,979,239 | |
| Written options | (307,088) | |
| Total change in net unrealized appreciation (depreciation) | | 305,672,151 |
| Net gain (loss) | | 335,097,039 |
| Net increase (decrease) in net assets resulting from operations | | $371,057,956 |
See accompanying notes which are an integral part of the financial statements.
Statement of Changes in Net Assets
| | Year ended January 31, 2017 | Year ended January 31, 2016 |
| Increase (Decrease) in Net Assets | | |
| Operations | | |
| Net investment income (loss) | $35,960,917 | $44,658,940 |
| Net realized gain (loss) | 29,424,888 | 84,399,015 |
| Change in net unrealized appreciation (depreciation) | 305,672,151 | (196,587,627) |
| Net increase (decrease) in net assets resulting from operations | 371,057,956 | (67,529,672) |
| Distributions to shareholders from net investment income | (37,037,611) | (46,764,873) |
| Distributions to shareholders from net realized gain | (34,594,261) | (101,112,040) |
| Total distributions | (71,631,872) | (147,876,913) |
| Share transactions | | |
| Proceeds from sales of shares | 172,539,476 | 200,885,928 |
| Reinvestment of distributions | 71,631,872 | 147,876,913 |
| Cost of shares redeemed | (461,348,979) | (352,692,924) |
| Net increase (decrease) in net assets resulting from share transactions | (217,177,631) | (3,930,083) |
| Total increase (decrease) in net assets | 82,248,453 | (219,336,668) |
| Net Assets | | |
| Beginning of period | 1,567,109,546 | 1,786,446,214 |
| End of period | $1,649,357,999 | $1,567,109,546 |
| Other Information | | |
| Distributions in excess of net investment income end of period | $(13,483,051) | $(6,895,999) |
| Shares | | |
| Sold | 14,274,083 | 16,478,409 |
| Issued in reinvestment of distributions | 5,905,698 | 12,736,170 |
| Redeemed | (38,117,394) | (29,111,447) |
| Net increase (decrease) | (17,937,613) | 103,132 |
See accompanying notes which are an integral part of the financial statements.
Financial Highlights — Fidelity Advisor Series Equity-Income Fund
| Years ended January 31, | 2017 | 2016 | 2015 | 2014 | 2013 A |
| Selected Per–Share Data | | | | | |
| Net asset value, beginning of period | $10.84 | $12.37 | $11.84 | $10.60 | $10.00 |
| Income from Investment Operations | | | | | |
| Net investment income (loss)B | .26 | .31 | .32 | .25 | .03 |
| Net realized and unrealized gain (loss) | 2.46 | (.80) | .88 | 1.49 | .59 |
| Total from investment operations | 2.72 | (.49) | 1.20 | 1.74 | .62 |
| Distributions from net investment income | (.28) | (.33) | (.28) | (.24) | (.02) |
| Distributions from net realized gain | (.26) | (.71) | (.39) | (.26) | – |
| Total distributions | (.54) | (1.04) | (.67) | (.50) | (.02) |
| Net asset value, end of period | $13.02 | $10.84 | $12.37 | $11.84 | $10.60 |
| Total ReturnC,D | 25.49% | (4.34)% | 9.99% | 16.44% | 6.18% |
| Ratios to Average Net AssetsE,F | | | | | |
| Expenses before reductions | .66% | .66% | .66% | .68% | .75%G |
| Expenses net of fee waivers, if any | .66% | .66% | .66% | .68% | .75%G |
| Expenses net of all reductions | .66% | .66% | .66% | .68% | .68%G |
| Net investment income (loss) | 2.19% | 2.50% | 2.48% | 2.15% | 2.07%G |
| Supplemental Data | | | | | |
| Net assets, end of period (000 omitted) | $1,649,358 | $1,567,110 | $1,786,446 | $1,770,773 | $706,012 |
| Portfolio turnover rateH | 39% | 42% | 39% | 44% | 34%I |
A For the period December 6, 2012 (commencement of operations) to January 31, 2013.
B Calculated based on average shares outstanding during the period.
C Total returns for periods of less than one year are not annualized.
D Total returns would have been lower if certain expenses had not been reduced during the applicable periods shown.
E Fees and expenses of any underlying Fidelity Central Funds are not included in the Fund's expense ratio. The Fund indirectly bears its proportionate share of the expenses of any underlying Fidelity Central Funds.
F Expense ratios reflect operating expenses of the Fund. Expenses before reductions do not reflect amounts reimbursed by the investment adviser or reductions from brokerage service arrangements or reductions from other expense offset arrangements and do not represent the amount paid by the Fund during periods when reimbursements or reductions occur. Expense ratios before reductions for start-up periods may not be representative of longer term operating periods. Expenses net of fee waivers reflect expenses after reimbursement by the investment adviser but prior to reductions from brokerage service arrangements or other expense offset arrangements. Expenses net of all reductions represent the net expenses paid by the Fund.
G Annualized
H Amount does not include the portfolio activity of any underlying Fidelity Central Funds.
I Amount not annualized.
See accompanying notes which are an integral part of the financial statements.
Fidelity Advisor® Series Stock Selector Large Cap Value Fund
Performance: The Bottom Line
Average annual total return reflects the change in the value of an investment, assuming reinvestment of distributions from dividend income and capital gains (the profits earned upon the sale of securities that have grown in value, if any) and assuming a constant rate of performance each year. The hypothetical investment and the average annual total returns do not reflect the deduction of taxes that a shareholder would pay on fund distributions or the redemption of fund shares. During periods of reimbursement by Fidelity, a fund’s total return will be greater than it would be had the reimbursement not occurred. How a fund did yesterday is no guarantee of how it will do tomorrow.
Average Annual Total Returns
| For the periods ended January 31, 2017 | Past 1 year | Life of fundA |
| Fidelity Advisor® Series Stock Selector Large Cap Value Fund | 24.12% | 13.28% |
A From December 6, 2012
$10,000 Over Life of Fund
Let's say hypothetically that $10,000 was invested in Fidelity Advisor® Series Stock Selector Large Cap Value Fund on December 6, 2012, when the fund started.
The chart shows how the value of your investment would have changed, and also shows how the Russell 1000® Value Index performed over the same period.
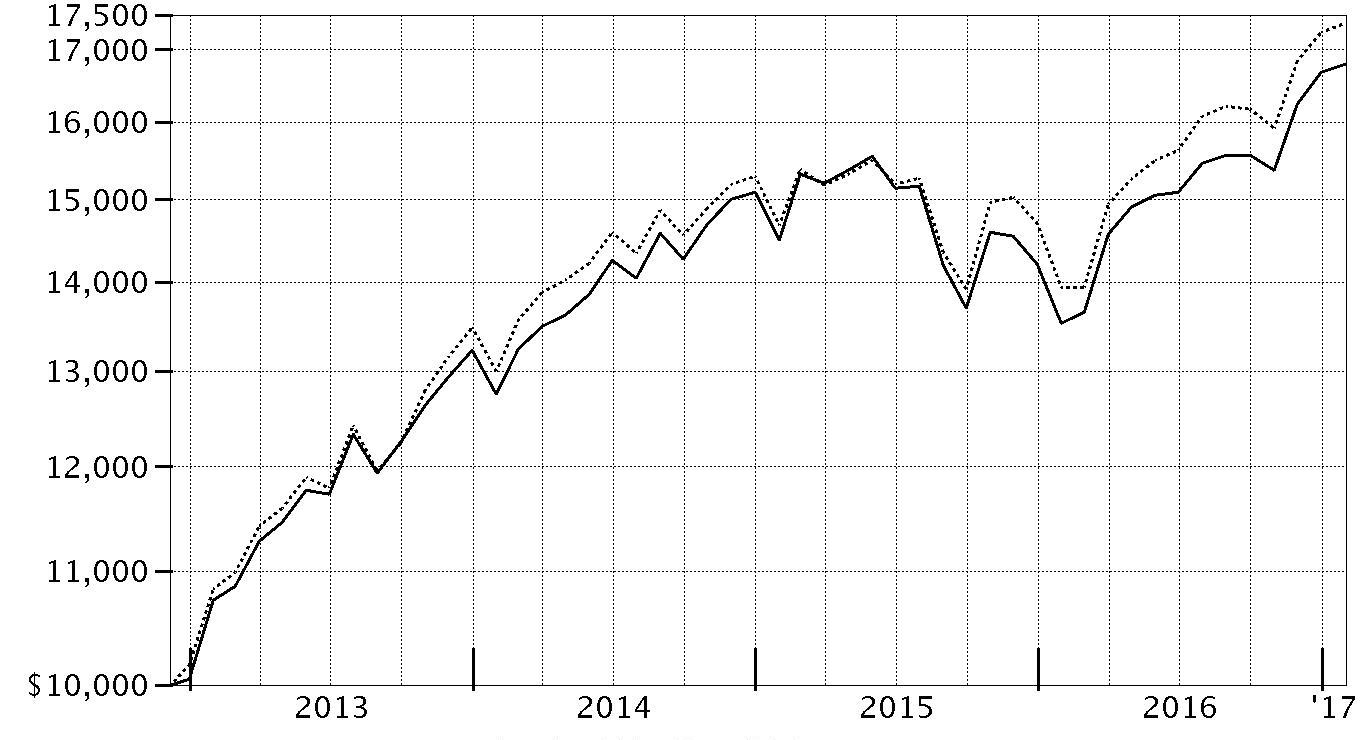
| Period Ending Values |
| $16,789 | Fidelity Advisor® Series Stock Selector Large Cap Value Fund |
| $17,378 | Russell 1000® Value Index |
Fidelity Advisor® Series Stock Selector Large Cap Value Fund
Management's Discussion of Fund Performance
Market Recap: The U.S. equity bellwether S&P 500
® index posted a 20.04% gain for the year ending January 31, 2017, rising sharply in the period’s final months on renewed optimism for economic growth. The beginning of the period saw improving investor sentiment amid U.S. job gains, a rally in energy and other stimuli that helped keep the seven-year bull uptrend intact. Markets tumbled briefly following the U.K.’s June 23 vote to exit the European Union (Brexit) – then recovered quickly and settled into a flattish stretch until the November 8 U.S. presidential election. Stocks then broke out in response to Donald Trump’s surprise victory, surging to a series of new all-time highs on expectations for reflation and fiscal stimulus. For the year, industrials (+28%), energy (+27%) and materials (+37%) all did well, the latter two driven by a cyclical rebound in commodity prices. Financials (+35%) also shined, riding an uptick in bond yields and the strong rally in banks (+41%), especially post-election. Information technology rose about 25%, despite cooling off in the fourth quarter of 2016. Conversely, real estate (+8%) lagged on the prospect for rising interest rates. An improved backdrop for riskier assets curbed dividend-rich telecommunication services (+13%), utilities (+12%) and consumer staples (+6%). Health care (+8%) underperformed amid an uncertain political and regulatory outlook.
Comments from Lead Portfolio Manager Matthew Friedman: For the year, the fund gained 24.12%, while the Russell 1000
® Value Index returned 24.62%. Although the fund benefited from favorable stock and market selection overall, having a cash position of 3%, on average, detracted meaningfully in a strong up market. Among primary assets, we had very strong relative results within information technology and energy. On an individual security basis, railroad company CSX was our top contributor. The stock more than doubled this period, rebounding as the market gained confidence that earnings would rise should the economy improve. It also helped to avoid lagging index giant Exxon Mobil. Conversely, we were held back by an underweighting in strong-performing banks such as JPMorgan Chase, the fund's biggest individual detractor. We also struggled with picks in materials, health care and retailing. Within health care specifically, investments in Ireland-based Allergan and Jazz Pharmaceuticals, a non-index holding, were hurt by market fear about generic-drug price deflation.
The views expressed above reflect those of the portfolio manager(s) only through the end of the period as stated on the cover of this report and do not necessarily represent the views of Fidelity or any other person in the Fidelity organization. Any such views are subject to change at any time based upon market or other conditions and Fidelity disclaims any responsibility to update such views. These views may not be relied on as investment advice and, because investment decisions for a Fidelity fund are based on numerous factors, may not be relied on as an indication of trading intent on behalf of any Fidelity fund.
Note to shareholders: On June 17, 2016, John Sheehy joined Steve Barwikowski as Co-Manager of the fund's technology and telecom services sleeves, and on January 3, 2017, assumed sole management responsibilities.
Fidelity Advisor® Series Stock Selector Large Cap Value Fund
Investment Summary (Unaudited)
Top Ten Stocks as of January 31, 2017
| | % of fund's net assets | % of fund's net assets 6 months ago |
| Chevron Corp. | 4.4 | 4.8 |
| Berkshire Hathaway, Inc. Class B | 4.0 | 4.0 |
| Procter & Gamble Co. | 2.7 | 3.1 |
| Wells Fargo & Co. | 2.7 | 2.6 |
| Johnson & Johnson | 2.5 | 2.8 |
| AT&T, Inc. | 2.2 | 2.4 |
| ConocoPhillips Co. | 2.1 | 1.6 |
| Goldman Sachs Group, Inc. | 2.1 | 1.6 |
| Cisco Systems, Inc. | 2.0 | 1.3 |
| U.S. Bancorp | 1.9 | 1.8 |
| | 26.6 | |
Top Five Market Sectors as of January 31, 2017
| | % of fund's net assets | % of fund's net assets 6 months ago |
| Financials | 27.3 | 27.4 |
| Energy | 12.8 | 13.0 |
| Health Care | 10.1 | 10.9 |
| Information Technology | 9.3 | 9.5 |
| Industrials | 8.8 | 8.2 |
Prior period industry classifications reflect the categories in place as of the date indicated and have not been adjusted to reflect current industry classifications.
Asset Allocation (% of fund's net assets)
| As of January 31, 2017* |
| | Stocks and Equity Futures | 98.0% |
| | Short-Term Investments and Net Other Assets (Liabilities) | 2.0% |

* Foreign investments - 7.2%
| As of July 31, 2016* |
| | Stocks and Equity Futures | 96.8% |
| | Short-Term Investments and Net Other Assets (Liabilities) | 3.2% |

* Foreign investments - 7.5%
Fidelity Advisor® Series Stock Selector Large Cap Value Fund
Investments January 31, 2017
Showing Percentage of Net Assets
| Common Stocks - 96.8% | | | |
| | | Shares | Value |
| CONSUMER DISCRETIONARY - 5.1% | | | |
| Auto Components - 0.5% | | | |
| Delphi Automotive PLC | | 77,270 | $5,413,536 |
| Diversified Consumer Services - 0.7% | | | |
| ServiceMaster Global Holdings, Inc. (a) | | 211,152 | 7,808,401 |
| Household Durables - 0.7% | | | |
| Whirlpool Corp. | | 42,289 | 7,395,923 |
| Internet & Direct Marketing Retail - 0.4% | | | |
| Liberty Interactive Corp. QVC Group Series A (a) | | 235,872 | 4,524,025 |
| Leisure Products - 0.2% | | | |
| Mattel, Inc. | | 85,339 | 2,236,735 |
| Media - 1.9% | | | |
| Charter Communications, Inc. Class A (a) | | 8,386 | 2,716,645 |
| Liberty Broadband Corp. Class C (a) | | 71,188 | 6,075,184 |
| Time Warner, Inc. | | 26,900 | 2,605,265 |
| Twenty-First Century Fox, Inc. Class A | | 293,260 | 9,202,499 |
| | | | 20,599,593 |
| Multiline Retail - 0.7% | | | |
| Target Corp. | | 121,119 | 7,809,753 |
|
| TOTAL CONSUMER DISCRETIONARY | | | 55,787,966 |
|
| CONSUMER STAPLES - 7.9% | | | |
| Food & Staples Retailing - 1.8% | | | |
| Kroger Co. | | 106,600 | 3,620,136 |
| Wal-Mart Stores, Inc. | | 55,818 | 3,725,293 |
| Walgreens Boots Alliance, Inc. | | 154,846 | 12,688,081 |
| | | | 20,033,510 |
| Food Products - 2.3% | | | |
| Mondelez International, Inc. | | 137,200 | 6,075,216 |
| The J.M. Smucker Co. | | 71,558 | 9,721,154 |
| The Kraft Heinz Co. | | 101,800 | 9,089,722 |
| | | | 24,886,092 |
| Household Products - 2.7% | | | |
| Procter & Gamble Co. | | 343,689 | 30,107,156 |
| Personal Products - 0.3% | | | |
| Coty, Inc. Class A | | 187,100 | 3,592,320 |
| Tobacco - 0.8% | | | |
| Philip Morris International, Inc. | | 89,963 | 8,648,143 |
|
| TOTAL CONSUMER STAPLES | | | 87,267,221 |
|
| ENERGY - 12.8% | | | |
| Energy Equipment & Services - 2.4% | | | |
| Baker Hughes, Inc. | | 291,681 | 18,399,237 |
| Dril-Quip, Inc. (a) | | 127,821 | 7,950,466 |
| | | | 26,349,703 |
| Oil, Gas & Consumable Fuels - 10.4% | | | |
| Anadarko Petroleum Corp. | | 260,720 | 18,127,862 |
| Cabot Oil & Gas Corp. | | 252,976 | 5,433,924 |
| Cenovus Energy, Inc. | | 644,483 | 8,796,171 |
| Chevron Corp. | | 438,486 | 48,825,417 |
| ConocoPhillips Co. | | 467,906 | 22,815,097 |
| Phillips 66 Co. | | 132,700 | 10,830,974 |
| | | | 114,829,445 |
|
| TOTAL ENERGY | | | 141,179,148 |
|
| FINANCIALS - 27.3% | | | |
| Banks - 10.0% | | | |
| Bank of America Corp. | | 697,500 | 15,791,400 |
| CIT Group, Inc. | | 228,100 | 9,395,439 |
| Citigroup, Inc. | | 135,100 | 7,542,633 |
| Comerica, Inc. | | 9,600 | 648,288 |
| Cullen/Frost Bankers, Inc. | | 4,300 | 384,420 |
| JPMorgan Chase & Co. | | 43,200 | 3,656,016 |
| PNC Financial Services Group, Inc. | | 126,700 | 15,262,282 |
| Popular, Inc. | | 165,974 | 7,374,225 |
| U.S. Bancorp | | 395,808 | 20,839,291 |
| Wells Fargo & Co. | | 524,075 | 29,521,145 |
| | | | 110,415,139 |
| Capital Markets - 3.9% | | | |
| Brookfield Asset Management, Inc. Class A | | 45,900 | 1,587,320 |
| Franklin Resources, Inc. | | 258,900 | 10,288,686 |
| Goldman Sachs Group, Inc. | | 98,422 | 22,570,133 |
| State Street Corp. | | 14,054 | 1,070,915 |
| The Blackstone Group LP | | 244,700 | 7,495,161 |
| | | | 43,012,215 |
| Consumer Finance - 3.6% | | | |
| American Express Co. | | 73,500 | 5,613,930 |
| Capital One Financial Corp. | | 185,586 | 16,218,361 |
| Discover Financial Services | | 252,200 | 17,472,416 |
| | | | 39,304,707 |
| Diversified Financial Services - 4.0% | | | |
| Berkshire Hathaway, Inc. Class B (a) | | 266,139 | 43,684,055 |
| Leucadia National Corp. | | 12,300 | 293,355 |
| | | | 43,977,410 |
| Insurance - 5.5% | | | |
| AFLAC, Inc. | | 157,100 | 10,995,429 |
| Chubb Ltd. | | 112,647 | 14,811,954 |
| Kansas City Life Insurance Co. | | 600 | 27,600 |
| MetLife, Inc. | | 190,251 | 10,351,557 |
| Reinsurance Group of America, Inc. | | 89,200 | 11,191,924 |
| The Travelers Companies, Inc. | | 115,500 | 13,603,590 |
| | | | 60,982,054 |
| Mortgage Real Estate Investment Trusts - 0.3% | | | |
| Annaly Capital Management, Inc. | | 339,735 | 3,472,092 |
|
| TOTAL FINANCIALS | | | 301,163,617 |
|
| HEALTH CARE - 10.1% | | | |
| Biotechnology - 0.0% | | | |
| Prothena Corp. PLC (a) | | 9 | 441 |
| Health Care Equipment & Supplies - 2.3% | | | |
| Abbott Laboratories | | 227,766 | 9,513,786 |
| Medtronic PLC | | 172,655 | 13,125,233 |
| Zimmer Biomet Holdings, Inc. | | 24,885 | 2,944,642 |
| | | | 25,583,661 |
| Health Care Providers & Services - 1.0% | | | |
| Aetna, Inc. | | 30,126 | 3,573,245 |
| Anthem, Inc. | | 21,619 | 3,332,353 |
| Cigna Corp. | | 21,826 | 3,191,398 |
| Humana, Inc. | | 4,100 | 813,850 |
| | | | 10,910,846 |
| Life Sciences Tools & Services - 0.4% | | | |
| Thermo Fisher Scientific, Inc. | | 24,007 | 3,658,427 |
| Pharmaceuticals - 6.4% | | | |
| Allergan PLC | | 19,863 | 4,347,812 |
| Jazz Pharmaceuticals PLC (a) | | 66,982 | 8,166,445 |
| Johnson & Johnson | | 241,686 | 27,370,940 |
| Merck & Co., Inc. | | 249,571 | 15,470,906 |
| Mylan N.V. (a) | | 38,200 | 1,453,510 |
| Pfizer, Inc. | | 435,596 | 13,821,461 |
| | | | 70,631,074 |
|
| TOTAL HEALTH CARE | | | 110,784,449 |
|
| INDUSTRIALS - 8.8% | | | |
| Aerospace & Defense - 1.3% | | | |
| Aerojet Rocketdyne Holdings, Inc. (a) | | 221,920 | 4,018,971 |
| Raytheon Co. | | 25,910 | 3,735,186 |
| United Technologies Corp. | | 54,750 | 6,004,433 |
| | | | 13,758,590 |
| Airlines - 1.0% | | | |
| American Airlines Group, Inc. | | 236,000 | 10,443,000 |
| Commercial Services & Supplies - 0.2% | | | |
| Stericycle, Inc. (a) | | 29,400 | 2,267,916 |
| Construction & Engineering - 1.3% | | | |
| AECOM (a) | | 399,350 | 14,747,996 |
| Electrical Equipment - 1.0% | | | |
| AMETEK, Inc. | | 109,140 | 5,577,054 |
| Fortive Corp. | | 100,840 | 5,577,460 |
| | | | 11,154,514 |
| Industrial Conglomerates - 1.9% | | | |
| General Electric Co. | | 693,510 | 20,597,247 |
| Machinery - 0.9% | | | |
| Deere & Co. | | 54,490 | 5,833,155 |
| Flowserve Corp. | | 92,570 | 4,550,741 |
| | | | 10,383,896 |
| Road & Rail - 1.2% | | | |
| CSX Corp. | | 261,920 | 12,150,469 |
| Union Pacific Corp. | | 10,280 | 1,095,642 |
| | | | 13,246,111 |
|
| TOTAL INDUSTRIALS | | | 96,599,270 |
|
| INFORMATION TECHNOLOGY - 9.3% | | | |
| Communications Equipment - 2.0% | | | |
| Cisco Systems, Inc. | | 728,414 | 22,376,878 |
| Electronic Equipment & Components - 0.9% | | | |
| Dell Technologies, Inc. (a) | | 150,400 | 9,473,696 |
| Internet Software & Services - 0.4% | | | |
| Alphabet, Inc. Class A (a) | | 5,600 | 4,593,064 |
| IT Services - 1.5% | | | |
| Amdocs Ltd. | | 157,100 | 9,223,341 |
| Cognizant Technology Solutions Corp. Class A (a) | | 46,900 | 2,466,471 |
| CoreLogic, Inc. (a) | | 69,400 | 2,447,738 |
| Total System Services, Inc. | | 50,400 | 2,554,272 |
| | | | 16,691,822 |
| Semiconductors & Semiconductor Equipment - 1.0% | | | |
| Maxim Integrated Products, Inc. | | 51 | 2,268 |
| Qualcomm, Inc. | | 199,793 | 10,674,940 |
| | | | 10,677,208 |
| Software - 1.8% | | | |
| Oracle Corp. | | 326,497 | 13,095,795 |
| SS&C Technologies Holdings, Inc. | | 208,200 | 6,689,466 |
| | | | 19,785,261 |
| Technology Hardware, Storage & Peripherals - 1.7% | | | |
| Apple, Inc. | | 116,624 | 14,152,322 |
| HP, Inc. | | 321,113 | 4,832,751 |
| | | | 18,985,073 |
|
| TOTAL INFORMATION TECHNOLOGY | | | 102,583,002 |
|
| MATERIALS - 2.9% | | | |
| Chemicals - 2.2% | | | |
| E.I. du Pont de Nemours & Co. | | 145,700 | 11,000,350 |
| Eastman Chemical Co. | | 72,587 | 5,625,493 |
| LyondellBasell Industries NV Class A | | 44,900 | 4,187,823 |
| Westlake Chemical Corp. | | 56,174 | 3,477,732 |
| | | | 24,291,398 |
| Containers & Packaging - 0.4% | | | |
| Ball Corp. | | 52,216 | 3,981,992 |
| Metals & Mining - 0.3% | | | |
| Compass Minerals International, Inc. | | 45,029 | 3,764,424 |
|
| TOTAL MATERIALS | | | 32,037,814 |
|
| REAL ESTATE - 3.0% | | | |
| Equity Real Estate Investment Trusts (REITs) - 2.9% | | | |
| American Tower Corp. | | 10,200 | 1,055,700 |
| AvalonBay Communities, Inc. | | 25,300 | 4,384,743 |
| Boston Properties, Inc. | | 28,100 | 3,678,290 |
| Colony NorthStar, Inc. | | 211,563 | 2,944,957 |
| Equity Residential (SBI) | | 69,600 | 4,229,592 |
| Essex Property Trust, Inc. | | 13,900 | 3,117,770 |
| General Growth Properties, Inc. | | 89,944 | 2,234,209 |
| Public Storage | | 10,500 | 2,257,500 |
| Simon Property Group, Inc. | | 13,900 | 2,554,403 |
| The Macerich Co. | | 25,500 | 1,751,595 |
| Vornado Realty Trust | | 38,200 | 4,061,042 |
| | | | 32,269,801 |
| Real Estate Management & Development - 0.1% | | | |
| CBRE Group, Inc. (a) | | 40,271 | 1,222,628 |
|
| TOTAL REAL ESTATE | | | 33,492,429 |
|
| TELECOMMUNICATION SERVICES - 3.7% | | | |
| Diversified Telecommunication Services - 3.7% | | | |
| AT&T, Inc. | | 571,865 | 24,109,828 |
| SBA Communications Corp. Class A (a) | | 39,600 | 4,168,296 |
| Verizon Communications, Inc. | | 242,858 | 11,902,471 |
| | | | 40,180,595 |
| UTILITIES - 5.9% | | | |
| Electric Utilities - 4.0% | | | |
| American Electric Power Co., Inc. | | 120,608 | 7,726,148 |
| Edison International | | 100,272 | 7,307,823 |
| NextEra Energy, Inc. | | 83,967 | 10,388,397 |
| OGE Energy Corp. | | 141,922 | 4,760,064 |
| PG&E Corp. | | 121,700 | 7,532,013 |
| Xcel Energy, Inc. | | 160,979 | 6,651,652 |
| | | | 44,366,097 |
| Multi-Utilities - 1.9% | | | |
| CMS Energy Corp. | | 126,802 | 5,401,765 |
| DTE Energy Co. | | 68,922 | 6,798,466 |
| Sempra Energy | | 83,831 | 8,583,456 |
| | | | 20,783,687 |
|
| TOTAL UTILITIES | | | 65,149,784 |
|
| TOTAL COMMON STOCKS | | | |
| (Cost $882,591,600) | | | 1,066,225,295 |
| | | Principal Amount | Value |
|
| U.S. Treasury Obligations - 0.1% | | | |
| U.S. Treasury Bills, yield at date of purchase 0.46% to 0.52% 2/16/17 to 3/30/17 (b) | | | |
| (Cost $1,079,443) | | 1,080,000 | 1,079,480 |
| | | Shares | Value |
|
| Money Market Funds - 3.1% | | | |
| Fidelity Cash Central Fund, 0.62% (c) | | | |
| (Cost $34,729,600) | | 34,722,656 | 34,729,601 |
| TOTAL INVESTMENT PORTFOLIO - 100.0% | | | |
| (Cost $918,400,643) | | | 1,102,034,376 |
| NET OTHER ASSETS (LIABILITIES) - 0.0% | | | (82,799) |
| NET ASSETS - 100% | | | $1,101,951,577 |
| Futures Contracts | | | |
| | Expiration Date | Underlying Face Amount at Value | Unrealized Appreciation/(Depreciation) |
| Purchased | | | |
| Equity Index Contracts | | | |
| 246 ICE Russell 1000 Value Index Contracts (United States) | March 2017 | 13,613,640 | $68,554 |
The face value of futures purchased as a percentage of Net Assets is 1.2%
Legend
(a) Non-income producing
(b) Security or a portion of the security was pledged to cover margin requirements for futures contracts. At period end, the value of securities pledged amounted to $626,813.
(c) Affiliated fund that is generally available only to investment companies and other accounts managed by Fidelity Investments. The rate quoted is the annualized seven-day yield of the fund at period end. A complete unaudited listing of the fund's holdings as of its most recent quarter end is available upon request. In addition, each Fidelity Central Fund's financial statements, which are not covered by the Fund's Report of Independent Registered Public Accounting Firm, are available on the SEC's website or upon request.
Affiliated Central Funds
Information regarding fiscal year to date income earned by the Fund from investments in Fidelity Central Funds is as follows:
| Fund | Income earned |
| Fidelity Cash Central Fund | $155,363 |
| Fidelity Securities Lending Cash Central Fund | 36,765 |
| Total | $192,128 |
Investment Valuation
The following is a summary of the inputs used, as of January 31, 2017, involving the Fund's assets and liabilities carried at fair value. The inputs or methodology used for valuing securities may not be an indication of the risk associated with investing in those securities. For more information on valuation inputs, and their aggregation into the levels used below, please refer to the Investment Valuation section in the accompanying Notes to Financial Statements.
| | Valuation Inputs at Reporting Date: |
| Description | Total | Level 1 | Level 2 | Level 3 |
| Investments in Securities: | | | | |
| Equities: | | | | |
| Consumer Discretionary | $55,787,966 | $55,787,966 | $-- | $-- |
| Consumer Staples | 87,267,221 | 87,267,221 | -- | -- |
| Energy | 141,179,148 | 141,179,148 | -- | -- |
| Financials | 301,163,617 | 301,163,617 | -- | -- |
| Health Care | 110,784,449 | 110,784,449 | -- | -- |
| Industrials | 96,599,270 | 96,599,270 | -- | -- |
| Information Technology | 102,583,002 | 102,583,002 | -- | -- |
| Materials | 32,037,814 | 32,037,814 | -- | -- |
| Real Estate | 33,492,429 | 33,492,429 | -- | -- |
| Telecommunication Services | 40,180,595 | 40,180,595 | -- | -- |
| Utilities | 65,149,784 | 65,149,784 | -- | -- |
| U.S. Government and Government Agency Obligations | 1,079,480 | -- | 1,079,480 | -- |
| Money Market Funds | 34,729,601 | 34,729,601 | -- | -- |
| Total Investments in Securities: | $1,102,034,376 | $1,100,954,896 | $1,079,480 | $-- |
| Derivative Instruments: | | | | |
| Assets | | | | |
| Futures Contracts | $68,554 | $68,554 | $-- | $-- |
| Total Assets | $68,554 | $68,554 | $-- | $-- |
| Total Derivative Instruments: | $68,554 | $68,554 | $-- | $-- |
Value of Derivative Instruments
The following table is a summary of the Fund's value of derivative instruments by primary risk exposure as of January 31, 2017. For additional information on derivative instruments, please refer to the Derivative Instruments section in the accompanying Notes to Financial Statements.
| Primary Risk Exposure / Derivative Type | Value |
| | Asset | Liability |
| Equity Risk | | |
| Futures Contracts(a) | $68,554 | $0 |
| Total Equity Risk | 68,554 | 0 |
| Total Value of Derivatives | $68,554 | $0 |
(a) Reflects gross cumulative appreciation (depreciation) on futures contracts as presented in the Schedule of Investments. In the Statement of Assets and Liabilities, the period end daily variation margin is included in receivable or payable for daily variation margin for derivative instruments, and the net cumulative appreciation (depreciation) is included in net unrealized appreciation (depreciation).
See accompanying notes which are an integral part of the financial statements.
Fidelity Advisor® Series Stock Selector Large Cap Value Fund
Financial Statements
Statement of Assets and Liabilities
| | | January 31, 2017 |
| Assets | | |
Investment in securities, at value — See accompanying schedule:
Unaffiliated issuers (cost $883,671,043) | $1,067,304,775 | |
| Fidelity Central Funds (cost $34,729,600) | 34,729,601 | |
| Total Investments (cost $918,400,643) | | $1,102,034,376 |
| Receivable for investments sold | | 11,880,198 |
| Receivable for fund shares sold | | 23,171 |
| Dividends receivable | | 912,250 |
| Distributions receivable from Fidelity Central Funds | | 14,962 |
| Receivable for daily variation margin for derivative instruments | | 15,990 |
| Prepaid expenses | | 1,764 |
| Other receivables | | 4,727 |
| Total assets | | 1,114,887,438 |
| Liabilities | | |
| Payable to custodian bank | $4,747,952 | |
| Payable for investments purchased | 4,010,510 | |
| Payable for fund shares redeemed | 3,471,963 | |
| Accrued management fee | 462,008 | |
| Other affiliated payables | 188,375 | |
| Other payables and accrued expenses | 55,053 | |
| Total liabilities | | 12,935,861 |
| Net Assets | | $1,101,951,577 |
| Net Assets consist of: | | |
| Paid in capital | | $915,121,295 |
| Undistributed net investment income | | 212,811 |
| Accumulated undistributed net realized gain (loss) on investments and foreign currency transactions | | 2,915,184 |
| Net unrealized appreciation (depreciation) on investments | | 183,702,287 |
| Net Assets, for 86,918,931 shares outstanding | | $1,101,951,577 |
| Net Asset Value, offering price and redemption price per share ($1,101,951,577 ÷ 86,918,931 shares) | | $12.68 |
See accompanying notes which are an integral part of the financial statements.
Statement of Operations
| | | Year ended January 31, 2017 |
| Investment Income | | |
| Dividends | | $24,245,679 |
| Interest | | 1,549 |
| Income from Fidelity Central Funds | | 192,128 |
| Total income | | 24,439,356 |
| Expenses | | |
| Management fee | | |
| Basic fee | $5,987,376 | |
| Performance adjustment | (661,888) | |
| Transfer agent fees | 1,914,393 | |
| Accounting and security lending fees | 358,803 | |
| Custodian fees and expenses | 64,986 | |
| Independent trustees' fees and expenses | 4,688 | |
| Audit | 55,418 | |
| Legal | 4,558 | |
| Interest | 1,673 | |
| Miscellaneous | 9,667 | |
| Total expenses before reductions | 7,739,674 | |
| Expense reductions | (40,673) | 7,699,001 |
| Net investment income (loss) | | 16,740,355 |
| Realized and Unrealized Gain (Loss) | | |
| Net realized gain (loss) on: | | |
| Investment securities: | | |
| Unaffiliated issuers | 8,110,504 | |
| Fidelity Central Funds | 12,694 | |
| Foreign currency transactions | 1,122 | |
| Futures contracts | 1,546,864 | |
| Total net realized gain (loss) | | 9,671,184 |
Change in net unrealized appreciation (depreciation) on:
Investment securities | 208,511,287 | |
| Assets and liabilities in foreign currencies | 92 | |
| Futures contracts | 40,208 | |
| Total change in net unrealized appreciation (depreciation) | | 208,551,587 |
| Net gain (loss) | | 218,222,771 |
| Net increase (decrease) in net assets resulting from operations | | $234,963,126 |
See accompanying notes which are an integral part of the financial statements.
Statement of Changes in Net Assets
| | Year ended January 31, 2017 | Year ended January 31, 2016 |
| Increase (Decrease) in Net Assets | | |
| Operations | | |
| Net investment income (loss) | $16,740,355 | $16,413,383 |
| Net realized gain (loss) | 9,671,184 | 104,600,454 |
| Change in net unrealized appreciation (depreciation) | 208,551,587 | (194,324,706) |
| Net increase (decrease) in net assets resulting from operations | 234,963,126 | (73,310,869) |
| Distributions to shareholders from net investment income | (16,097,435) | (18,104,106) |
| Distributions to shareholders from net realized gain | (14,241,328) | (121,742,545) |
| Total distributions | (30,338,763) | (139,846,651) |
| Share transactions | | |
| Proceeds from sales of shares | 131,912,975 | 137,443,144 |
| Reinvestment of distributions | 30,338,763 | 139,846,651 |
| Cost of shares redeemed | (309,555,741) | (220,798,953) |
| Net increase (decrease) in net assets resulting from share transactions | (147,304,003) | 56,490,842 |
| Total increase (decrease) in net assets | 57,320,360 | (156,666,678) |
| Net Assets | | |
| Beginning of period | 1,044,631,217 | 1,201,297,895 |
| End of period | $1,101,951,577 | $1,044,631,217 |
| Other Information | | |
| Undistributed net investment income end of period | $212,811 | $960 |
| Shares | | |
| Sold | 11,225,322 | 11,010,488 |
| Issued in reinvestment of distributions | 2,552,673 | 12,535,406 |
| Redeemed | (26,340,733) | (17,788,785) |
| Net increase (decrease) | (12,562,738) | 5,757,109 |
See accompanying notes which are an integral part of the financial statements.
Financial Highlights — Fidelity Advisor Series Stock Selector Large Cap Value Fund
| Years ended January 31, | 2017 | 2016 | 2015 | 2014 | 2013 A |
| Selected Per–Share Data | | | | | |
| Net asset value, beginning of period | $10.50 | $12.82 | $12.07 | $10.72 | $10.00 |
| Income from Investment Operations | | | | | |
| Net investment income (loss)B | .18 | .17 | .18 | .14 | .02 |
| Net realized and unrealized gain (loss) | 2.33 | (.97) | 1.50 | 1.88 | .72 |
| Total from investment operations | 2.51 | (.80) | 1.68 | 2.02 | .74 |
| Distributions from net investment income | (.19) | (.20)C | (.16) | (.12) | (.02) |
| Distributions from net realized gain | (.15) | (1.32)C | (.76) | (.55) | – |
| Total distributions | (.33)D | (1.52) | (.93)E | (.67) | (.02) |
| Net asset value, end of period | $12.68 | $10.50 | $12.82 | $12.07 | $10.72 |
| Total ReturnF,G | 24.12% | (6.72)% | 13.70% | 18.79% | 7.36% |
| Ratios to Average Net AssetsH,I | | | | | |
| Expenses before reductions | .71% | .77% | .75% | .78% | .85%J |
| Expenses net of fee waivers, if any | .71% | .76% | .75% | .78% | .85%J |
| Expenses net of all reductions | .70% | .76% | .75% | .78% | .77%J |
| Net investment income (loss) | 1.53% | 1.38% | 1.35% | 1.19% | 1.25%J |
| Supplemental Data | | | | | |
| Net assets, end of period (000 omitted) | $1,101,952 | $1,044,631 | $1,201,298 | $1,139,423 | $712,561 |
| Portfolio turnover rateK | 48% | 64% | 55% | 61% | 48%L |
A For the period December 6, 2012 (commencement of operations) to January 31, 2013.
B Calculated based on average shares outstanding during the period.
C The amounts shown reflect certain reclassifications related to book to tax differences that were made in the year shown.
D Total distributions of $.33 per share is comprised of distributions from net investment income of $.185 and distributions from net realized gain of $.145 per share.
E Total distributions of $.93 per share is comprised of distributions from net investment income of $.163 and distributions from net realized gain of $.762 per share.
F Total returns for periods of less than one year are not annualized.
G Total returns would have been lower if certain expenses had not been reduced during the applicable periods shown.
H Fees and expenses of any underlying Fidelity Central Funds are not included in the Fund's expense ratio. The Fund indirectly bears its proportionate share of the expenses of any underlying Fidelity Central Funds.
I Expense ratios reflect operating expenses of the Fund. Expenses before reductions do not reflect amounts reimbursed by the investment adviser or reductions from brokerage service arrangements or reductions from other expense offset arrangements and do not represent the amount paid by the Fund during periods when reimbursements or reductions occur. Expense ratios before reductions for start-up periods may not be representative of longer term operating periods. Expenses net of fee waivers reflect expenses after reimbursement by the investment adviser but prior to reductions from brokerage service arrangements or other expense offset arrangements. Expenses net of all reductions represent the net expenses paid by the Fund.
J Annualized
K Amount does not include the portfolio activity of any underlying Fidelity Central Funds.
L Amount not annualized.
See accompanying notes which are an integral part of the financial statements.
Notes to Financial Statements
For the period ended January 31, 2017
1. Organization.
Fidelity Advisor Series Equity-Income Fund and Fidelity Advisor Series Stock Selector Large Cap Value Fund (the Funds) are funds of Fidelity Devonshire Trust (the Trust). Each Fund is authorized to issue an unlimited number of shares. Shares of the Funds are only available for purchase by mutual funds for which Fidelity Management & Research Company (FMR) or an affiliate serves as an investment manager. The Trust is registered under the Investment Company Act of 1940, as amended (the 1940 Act), as an open-end management investment company organized as a Massachusetts business trust.
2. Investments in Fidelity Central Funds.
The Funds invest in Fidelity Central Funds, which are open-end investment companies generally available only to other investment companies and accounts managed by the investment adviser and its affiliates. The Funds' Schedules of Investments list each of the Fidelity Central Funds held as of period end, if any, as an investment of each Fund, but do not include the underlying holdings of each Fidelity Central Fund. As an Investing Fund, each Fund indirectly bears its proportionate share of the expenses of the underlying Fidelity Central Funds.
The Money Market Central Funds seek preservation of capital and current income and are managed by Fidelity Investments Money Management, Inc. (FIMM), an affiliate of the investment adviser. Annualized expenses of the Money Market Central Funds as of their most recent shareholder report date are less than .005%.
A complete unaudited list of holdings for each Fidelity Central Fund is available upon request or at the Securities and Exchange Commission (the SEC) website at www.sec.gov. In addition, the financial statements of the Fidelity Central Funds, which are not covered by the Funds' Report of Independent Registered Public Accounting Firm, are available on the SEC website or upon request.
3. Significant Accounting Policies.
The financial statements have been prepared in conformity with accounting principles generally accepted in the United States of America (GAAP), which require management to make certain estimates and assumptions at the date of the financial statements. Actual results could differ from those estimates. Subsequent events, if any, through the date that the financial statements were issued have been evaluated in the preparation of the financial statements. The following summarizes the significant accounting policies of the Funds:
Investment Valuation. Investments are valued as of 4:00 p.m. Eastern time on the last calendar day of the period. The Board of Trustees (the Board) has delegated the day to day responsibility for the valuation of each Fund's investments to the Fair Value Committee (the Committee) established by each Fund's investment adviser. In accordance with valuation policies and procedures approved by the Board, each Fund attempts to obtain prices from one or more third party pricing vendors or brokers to value its investments. When current market prices, quotations or currency exchange rates are not readily available or reliable, investments will be fair valued in good faith by the Committee, in accordance with procedures adopted by the Board. Factors used in determining fair value vary by investment type and may include market or investment specific events, changes in interest rates and credit quality. The frequency with which these procedures are used cannot be predicted and they may be utilized to a significant extent. The Committee oversees each Fund's valuation policies and procedures and reports to the Board on the Committee's activities and fair value determinations. The Board monitors the appropriateness of the procedures used in valuing each Fund's investments and ratifies the fair value determinations of the Committee.
Each Fund categorizes the inputs to valuation techniques used to value its investments into a disclosure hierarchy consisting of three levels as shown below:
- Level 1 – quoted prices in active markets for identical investments
- Level 2 – other significant observable inputs (including quoted prices for similar investments, interest rates, prepayment speeds, etc.)
- Level 3 – unobservable inputs (including the Fund's own assumptions based on the best information available)
Valuation techniques used to value each Fund's investments by major category are as follows:
Equity securities, including restricted securities, for which market quotations are readily available, are valued at the last reported sale price or official closing price as reported by a third party pricing vendor on the primary market or exchange on which they are traded and are categorized as Level 1 in the hierarchy. In the event there were no sales during the day or closing prices are not available, securities are valued at the last quoted bid price or may be valued using the last available price and are generally categorized as Level 2 in the hierarchy. For foreign equity securities, when market or security specific events arise, comparisons to the valuation of American Depositary Receipts (ADRs), futures contracts, Exchange-Traded Funds (ETFs) and certain indexes as well as quoted prices for similar securities may be used and would be categorized as Level 2 in the hierarchy. Utilizing these techniques may result in transfers between Level 1 and Level 2. For equity securities, including restricted securities, where observable inputs are limited, assumptions about market activity and risk are used and these securities may be categorized as Level 3 in the hierarchy.
Debt securities, including restricted securities, are valued based on evaluated prices received from third party pricing vendors or from brokers who make markets in such securities. U.S. government and government agency obligations are valued by pricing vendors who utilize matrix pricing which considers yield or price of bonds of comparable quality, coupon, maturity and type or by broker-supplied prices. When independent prices are unavailable or unreliable, debt securities may be valued utilizing pricing methodologies which consider similar factors that would be used by third party pricing vendors. Debt securities are generally categorized as Level 2 in the hierarchy but may be Level 3 depending on the circumstances.
Futures contracts are valued at the settlement price established each day by the board of trade or exchange on which they are traded and are categorized as Level 1 in the hierarchy. Exchange-traded options are valued using the last sale price or, in the absence of a sale, the last offering price and are categorized as Level 1 in the hierarchy. Options traded over-the-counter are valued using broker-supplied valuations and are categorized as Level 2 in the hierarchy.
Investments in open-end mutual funds, including the Fidelity Central Funds, are valued at their closing net asset value (NAV) each business day and are categorized as Level 1 in the hierarchy.
Changes in valuation techniques may result in transfers in or out of an assigned level within the disclosure hierarchy. The aggregate value of investments by input level as of January 31, 2017 is included at the end of each Fund's Schedule of Investments.
Foreign Currency. The Funds may use foreign currency contracts to facilitate transactions in foreign-denominated securities. Gains and losses from these transactions may arise from changes in the value of the foreign currency or if the counterparties do not perform under the contracts' terms.
Foreign-denominated assets, including investment securities, and liabilities are translated into U.S. dollars at the exchange rates at period end. Purchases and sales of investment securities, income and dividends received and expenses denominated in foreign currencies are translated into U.S. dollars at the exchange rate in effect on the transaction date.
The effects of exchange rate fluctuations on investments are included with the net realized and unrealized gain (loss) on investment securities. Other foreign currency transactions resulting in realized and unrealized gain (loss) are disclosed separately.
Investment Transactions and Income. For financial reporting purposes, the Funds' investment holdings and NAV include trades executed through the end of the last business day of the period. The NAV per share for processing shareholder transactions is calculated as of the close of business of the New York Stock Exchange (NYSE), normally 4:00 p.m. Eastern time and includes trades executed through the end of the prior business day. Gains and losses on securities sold are determined on the basis of identified cost and may include proceeds received from litigation. Dividend income is recorded on the ex-dividend date, except for certain dividends from foreign securities where the ex-dividend date may have passed, which are recorded as soon as the Funds are informed of the ex-dividend date. Non-cash dividends included in dividend income, if any, are recorded at the fair market value of the securities received. Income and capital gain distributions from Fidelity Central Funds, if any, are recorded on the ex-dividend date. Certain distributions received by the Funds represent a return of capital or capital gain. The Funds determine the components of these distributions subsequent to the ex-dividend date, based upon receipt of tax filings or other correspondence relating to the underlying investment. These distributions are recorded as a reduction of cost of investments and/or as a realized gain. Interest income is accrued as earned and includes coupon interest and amortization of premium and accretion of discount on debt securities as applicable. Investment income is recorded net of foreign taxes withheld where recovery of such taxes is uncertain.
Expenses. Expenses directly attributable to a fund are charged to that fund. Expenses attributable to more than one fund are allocated among the respective funds on the basis of relative net assets or other appropriate methods. Expense estimates are accrued in the period to which they relate and adjustments are made when actual amounts are known.
Income Tax Information and Distributions to Shareholders. Each year, each Fund intends to qualify as a regulated investment company under Subchapter M of the Internal Revenue Code, including distributing substantially all of its taxable income and realized gains. As a result, no provision for U.S. Federal income taxes is required. As of January 31, 2017, each Fund did not have any unrecognized tax benefits in the financial statements; nor is each Fund aware of any tax positions for which it is reasonably possible that the total amounts of unrecognized tax benefits will significantly change in the next twelve months. Each Fund files a U.S. federal tax return, in addition to state and local tax returns as required. Each Fund's federal income tax returns are subject to examination by the Internal Revenue Service (IRS) for a period of three fiscal years after they are filed. State and local tax returns may be subject to examination for an additional fiscal year depending on the jurisdiction. Foreign taxes are provided for based on each Fund's understanding of the tax rules and rates that exist in the foreign markets in which it invests.
Distributions are declared and recorded on the ex-dividend date. Income and capital gain distributions are determined in accordance with income tax regulations, which may differ from GAAP.
Capital accounts within the financial statements are adjusted for permanent book-tax differences. These adjustments have no impact on net assets or the results of operations. Capital accounts are not adjusted for temporary book-tax differences which will reverse in a subsequent period.
Book-tax differences are primarily due to short-term capital gains, futures contracts, foreign currency transactions, passive foreign investment companies (PFIC), market discount, partnerships and losses deferred due to wash sales and excise tax regulations.
The federal tax cost of investment securities and unrealized appreciation (depreciation) as of period end were as follows for each Fund:
| | Tax cost | Gross unrealized appreciation | Gross unrealized depreciation | Net unrealized appreciation (depreciation) on securities |
| Fidelity Advisor Series Equity-Income Fund | $1,412,393,324 | $302,050,467 | $(50,543,601) | $251,506,866 |
| Fidelity Advisor Series Stock Selector Large Cap Value Fund | 919,909,976 | 203,342,133 | (21,217,733) | 182,124,400 |
The tax-based components of distributable earnings as of period end were as follows for each Fund:
| | Undistributed ordinary income | Undistributed long-term capital gain | Net unrealized appreciation (depreciation) on securities and other investments |
| Fidelity Advisor Series Equity-Income Fund | $5,978,764 | $12,970,756 | $238,016,067 |
| Fidelity Advisor Series Stock Selector Large Cap Value Fund | 212,109 | 4,493,772 | 182,124,400 |
The tax character of distributions paid was as follows:
| January 31, 2017 | | | |
| | Ordinary Income | Long-term Capital Gains | Total |
| Fidelity Advisor Series Equity-Income Fund | $38,806,261 | $32,825,611 | $71,631,872 |
| Fidelity Advisor Series Stock Selector Large Cap Value Fund | 16,097,435 | 14,241,328 | 30,338,763 |
| January 31, 2016 | | | |
| | Ordinary Income | Long-term Capital Gains | Total |
| Fidelity Advisor Series Equity-Income Fund | $56,397,935 | $91,478,978 | $147,876,913 |
| Fidelity Advisor Series Stock Selector Large Cap Value Fund | 39,464,008 | 100,382,643 | 139,846,651 |
Restricted Securities. The Funds may invest in securities that are subject to legal or contractual restrictions on resale. These securities generally may be resold in transactions exempt from registration or to the public if the securities are registered. Disposal of these securities may involve time-consuming negotiations and expense, and prompt sale at an acceptable price may be difficult. Information regarding restricted securities is included at the end of each applicable Fund's Schedule of Investments.
Consolidated Subsidiary. Fidelity Advisor Series Equity-Income Fund invests in certain investments through a wholly-owned subsidiary ("Subsidiary"), which may be subject to federal and state taxes upon disposition.
As of period end, the Fund held an investment of $3,088,232 in this Subsidiary, representing .19% of the Fund's net assets. The financial statements have been consolidated and include accounts of the Fund and each Subsidiary. Accordingly, all inter-company transactions and balances have been eliminated.
4. Derivative Instruments.
Risk Exposures and the Use of Derivative Instruments. The Funds' investment objective allows the Funds to enter into various types of derivative contracts, including futures contracts and options. Derivatives are investments whose value is primarily derived from underlying assets, indices or reference rates and may be transacted on an exchange or over-the-counter (OTC). Derivatives may involve a future commitment to buy or sell a specified asset based on specified terms, to exchange future cash flows at periodic intervals based on a notional principal amount, or for one party to make one or more payments upon the occurrence of specified events in exchange for periodic payments from the other party.
The Funds used derivatives to increase returns and to manage exposure to certain risks as defined below. The success of any strategy involving derivatives depends on analysis of numerous economic factors, and if the strategies for investment do not work as intended, the Funds may not achieve their objectives.
The Funds' use of derivatives increased or decreased their exposure to the following risk:
| Equity Risk | Equity risk relates to the fluctuations in the value of financial instruments as a result of changes in market prices (other than those arising from interest rate risk or foreign exchange risk), whether caused by factors specific to an individual investment, its issuer, or all factors affecting all instruments traded in a market or market segment.
|
The Funds are also exposed to additional risks from investing in derivatives, such as liquidity risk and counterparty credit risk. Liquidity risk is the risk that the Funds will be unable to close out the derivative in the open market in a timely manner. Counterparty credit risk is the risk that the counterparty will not be able to fulfill its obligation to the Funds. Derivative counterparty credit risk is managed through formal evaluation of the creditworthiness of all potential counterparties. On certain OTC derivatives such as options, the Funds attempt to reduce their exposure to counterparty credit risk by entering into an International Swaps and Derivatives Association, Inc. (ISDA) Master Agreement with each of its counterparties. The ISDA Master Agreement gives the Funds the right to terminate all transactions traded under such agreement upon the deterioration in the credit quality of the counterparty beyond specified levels. The ISDA Master Agreement gives each party the right, upon an event of default by the other party or a termination of the agreement, to close out all transactions traded under such agreement and to net amounts owed under each transaction to one net payable by one party to the other. To mitigate counterparty credit risk on bi-lateral OTC derivatives, the Funds receive collateral in the form of cash or securities once each Fund's net unrealized appreciation on outstanding derivative contracts under an ISDA Master Agreement exceeds certain applicable thresholds, subject to certain minimum transfer provisions. The collateral received is held in segregated accounts with the Funds' custodian bank in accordance with the collateral agreements entered into between the Funds, the counterparty and the Funds' custodian bank. The Funds could experience delays and costs in gaining access to the collateral even though it is held by the Funds' custodian bank. The Funds' maximum risk of loss from counterparty credit risk related to bi-lateral OTC derivatives is generally the aggregate unrealized appreciation and unpaid counterparty payments in excess of any collateral pledged by the counterparty to the Funds. The Funds may be required to pledge collateral for the benefit of the counterparties on bi-lateral OTC derivatives in an amount not less than each counterparty's unrealized appreciation on outstanding derivative contracts, subject to certain minimum transfer provisions, and any such pledged collateral is identified in the Schedule of Investments. Exchange-traded futures contracts and exchange-traded options are not covered by the ISDA Master Agreement; however counterparty credit risk related to exchange-traded futures contracts and exchange-traded options may be mitigated by the protection provided by the exchange on which they trade.
Investing in derivatives may involve greater risks than investing in the underlying assets directly and, to varying degrees, may involve risk of loss in excess of any initial investment and collateral received and amounts recognized in the Statement of Assets and Liabilities. In addition, there may be the risk that the change in value of the derivative contract does not correspond to the change in value of the underlying instrument.
Net Realized Gain (Loss) and Change in Net Unrealized Appreciation (Depreciation) on Derivatives. The table below, which reflects the impacts of derivatives on the financial performance of the Funds, summarizes the net realized gain (loss) and change in net unrealized appreciation (depreciation) for derivatives during the period as presented in the Statement of Operations.
| Primary Risk Exposure / Derivative Type | Net Realized Gain (Loss) | Change in Net Unrealized Appreciation (Depreciation) |
| Fidelity Advisor Series Equity-Income Fund | | |
| Equity Risk | | |
| Written Options | $2,922,676 | $(307,088) |
| Total Equity Risk | 2,922,676 | (307,088) |
| Totals | $2,922,676 | $(307,088) |
| Fidelity Advisor Series Stock Selector Large Cap Value Fund | | |
| Equity Risk | | |
| Futures Contracts | $1,546,864 | $40,208 |
| Total Equity Risk | 1,546,864 | 40,208 |
| Totals | $1,546,864 | $40,208 |
A summary of the value of derivatives by primary risk exposure as of period end is included at the end of the Schedule of Investments.
Futures Contracts. A futures contract is an agreement between two parties to buy or sell a specified underlying instrument for a fixed price at a specified future date. Fidelity Advisor Stock Selector Large Cap Value Fund used futures contracts to manage their exposure to the stock market.
Upon entering into a futures contract, a fund is required to deposit either cash or securities (initial margin) with a clearing broker in an amount equal to a certain percentage of the face value of the contract. Futures contracts are marked-to-market daily and subsequent daily payments (variation margin) are made or received by a fund depending on the daily fluctuations in the value of the futures contracts and are recorded as unrealized appreciation or (depreciation). This receivable and/or payable, if any, is included in daily variation margin for derivative instruments in the Statement of Assets and Liabilities. Realized gain or (loss) is recorded upon the expiration or closing of a futures contract.
Any open futures contracts at period end are presented in the Schedule of Investments under the caption "Futures Contracts". The underlying face amount at value reflects each contract's exposure to the underlying instrument or index at period end and is representative of volume of activity during the period. Securities deposited to meet initial margin requirements are identified in the Schedule of Investments.
Options. Options give the purchaser the right, but not the obligation, to buy (call) or sell (put) an underlying security or financial instrument at an agreed exercise or strike price between or on certain dates. Options obligate the seller (writer) to buy (put) or sell (call) an underlying instrument at the exercise or strike price or cash settle an underlying derivative instrument if the holder exercises the option on or before the expiration date.
Fidelity Advisor Series Equity-Income Fund (the Fund) used exchange-traded and OTC written covered call options to manage its exposure to the market. When the Fund writes a covered call option, the Fund holds the underlying instrument which must be delivered to the holder upon the exercise of the option.
Upon entering into a written options contract, the Fund will receive a premium. Premiums received are reflected as a liability on the Statement of Assets and Liabilities. Options are valued daily and any unrealized appreciation (depreciation) is reflected on the Statement of Assets and Liabilities. When a written option is exercised, the premium is added to the proceeds from the sale of the underlying instrument in determining the gain or loss realized on that investment. When an option is closed the Fund will realize a gain or loss depending on whether the proceeds or amount paid for the closing sale transaction are greater or less than the premium received. When an option expires, gains and losses are realized to the extent of premiums received. The net realized gain (loss) on closed and expired written options and the change in net unrealized appreciation (depreciation) on written options are reflected separately on the Statement of Operations.
Writing call options tends to decrease exposure to the underlying instrument and risk of loss is the change in value in excess of the premium received.
Any open options at period end are presented in the Schedule of Investments under the caption "Written Options".
The following is a summary of the Fund's written options activity:
| | Number of Contracts | Amount of Premiums |
| Outstanding at beginning of period | 6,210 | $307,238 |
| Options Opened | 95,912 | 6,991,110 |
| Options Exercised | (37,984) | (2,496,510) |
| Options Closed | (18,648) | (1,218,885) |
| Options Expired | (23,018) | (1,965,060) |
| Outstanding at end of period | 22,472 | $1,617,893 |
5. Purchases and Sales of Investments.
Purchases and sales of securities, other than short-term securities, are noted in the table below.
| | Purchases ($) | Sales ($) |
| Fidelity Advisor Series Equity-Income Fund | 611,197,132 | 934,361,928 |
| Fidelity Advisor Series Stock Selector Large Cap Value Fund | 509,634,354 | 671,488,743 |
6. Fees and Other Transactions with Affiliates.
Management Fee. Fidelity Management & Research Company (the investment adviser) and its affiliates provide the Funds with investment management related services for which the Funds pay a monthly management fee. The management fee is the sum of an individual fund fee rate and an annualized group fee rate. The individual fund fee rate is applied to each Fund's average net assets. The group fee rate is based upon the average net assets of all the mutual funds advised by the investment adviser, including any mutual funds previously advised by the investment adviser that are currently advised by Fidelity SelectCo, LLC, an affiliate of the investment adviser. The group fee rate decreases as assets under management increase and increases as assets under management decrease. In addition, the management fee for Fidelity Advisor Series Stock Selector Large Cap Value Fund is subject to a performance adjustment (up to a maximum of +/- .20% of each applicable Fund's average net assets over a 36 month performance period.) The upward or downward adjustment to the management fee is based on the Fidelity Advisor Series Stock Selector Large Cap Value Fund's relative investment performance as compared to its benchmark index over the same 36 month performance period. For the reporting period, each Fund's annual management fee rate expressed as a percentage of each Fund's average net assets, including the performance adjustment, if applicable was as follows. The performance adjustment included in the management fee rate may be higher or lower than the maximum performance adjustment rate due to the difference between the average net asset for the reporting and performance periods.
| | Individual Rate | Group Rate | Total |
| Fidelity Advisor Series Equity-Income Fund | .20% | .25% | .45% |
| Fidelity Advisor Series Stock Selector Large Cap Value Fund | .30% | .25% | .49% |
| | Performance Benchmark |
| Fidelity Advisor Series Stock Selector Large Cap Value Fund | Russell 1000 Value Index |
Transfer Agent Fees. Fidelity Investments Institutional Operations Company, Inc. (FIIOC), an affiliate of the investment adviser, is the Funds' transfer, dividend disbursing and shareholder servicing agent. FIIOC receives account fees and asset-based fees that vary according to account size and type of account. FIIOC pays for typesetting, printing and mailing of shareholder reports, except proxy statements. For the period, transfer agent fees were equivalent to the following annual rates expressed as a percentage of average net assets:
| Fidelity Advisor Series Equity-Income Fund | .18% |
| Fidelity Advisor Series Stock Selector Large Cap Value Fund | .18% |
Accounting and Security Lending Fees. Fidelity Service Company, Inc. (FSC), an affiliate of the investment adviser, maintains each Fund's accounting records. The accounting fee is based on the level of average net assets for each month. Under a separate contract, FSC administers the security lending program. The security lending fee is based on the number and duration of lending transactions.
Brokerage Commissions. Certain Funds placed a portion of their portfolio transactions with brokerage firms which are affiliates of the investment adviser. Brokerage commissions are included in net realized gain (loss) and change in net unrealized appreciation (depreciation) in the Statement of Operations. The commissions paid to these affiliated firms were as follows:
| | Amount |
| Fidelity Advisor Series Equity-Income Fund | $19,401 |
| Fidelity Advisor Series Stock Selector Large Cap Value Fund | 18,420 |
Interfund Lending Program. Pursuant to an Exemptive Order issued by the SEC, the Funds, along with other registered investment companies having management contracts with FMR or other affiliated entities of FMR, may participate in an interfund lending program. This program provides an alternative credit facility allowing the funds to borrow from, or lend money to, other participating affiliated funds. At period end, Fidelity Advisor Series Stock Selector Large Cap Value Fund had no interfund loans outstanding. Each applicable fund's activity in this program during the period for which loans were outstanding was as follows:
| | Borrower or Lender | Average Loan Balance | Weighted Average Interest Rate | Interest Expense |
| Fidelity Advisor Series Stock Selector Large Cap Value Fund | Borrower | $26,307,250 | .57% | $1,673 |
Interfund Trades. The Funds may purchase from or sell securities to other Fidelity Funds under procedures adopted by the Board. The procedures have been designed to ensure these interfund trades are executed in accordance with Rule 17a-7 of the 1940 Act. Interfund trades are included within the respective purchases and sales amounts shown in the Purchases and Sales of Investments note.
7. Committed Line of Credit.
Certain Funds participate with other funds managed by the investment adviser or an affiliate in a $4.25 billion credit facility (the "line of credit") to be utilized for temporary or emergency purposes to fund shareholder redemptions or for other short-term liquidity purposes. The participating funds have agreed to pay commitment fees on their pro-rata portion of the line of credit, which are reflected in Miscellaneous expenses on the Statement of Operations, and are as follows:
| Fidelity Advisor Series Equity-Income Fund | $4,966 |
| Fidelity Advisor Series Stock Selector Large Cap Value Fund | 3,302 |
During the period, the Funds did not borrow on this line of credit.
8. Security Lending.
Certain Funds lend portfolio securities through a lending agent from time to time in order to earn additional income. For equity securities, a lending agent is used and may loan securities to certain qualified borrowers, including Fidelity Capital Markets (FCM), a broker-dealer affiliated with the Funds. On the settlement date of the loan, each applicable Fund receives collateral (in the form of U.S. Treasury obligations, letters of credit and/or cash) against the loaned securities and maintains collateral in an amount not less than 100% of the market value of the loaned securities during the period of the loan. The market value of the loaned securities is determined at the close of business of the Funds and any additional required collateral is delivered to the Funds on the next business day. The Funds or borrower may terminate the loan at any time, and if the borrower defaults on its obligation to return the securities loaned because of insolvency or other reasons, the Funds may apply collateral received from the borrower against the obligation. The Funds may experience delays and costs in recovering the securities loaned. Any cash collateral received is invested in the Fidelity Securities Lending Cash Central Fund. The value of loaned securities and cash collateral at period end are disclosed on each applicable Fund's Statement of Assets and Liabilities. Security lending income represents the income earned on investing cash collateral, less rebates paid to borrowers and any lending agent fees associated with the loan, plus any premium payments received for lending certain types of securities. Security lending income is presented on each applicable Fund's Statement of Operations as a component of income from Fidelity Central Funds. FCM security lending activity was as follows:
| | Total Security Lending Income | Security Lending Income From Securities Loaned to FCM | Value of Securities Loaned to FCM at Period End |
| Fidelity Advisor Series Equity-Income Fund | $107,937 | $7,956 | $807,072 |
| Fidelity Advisor Series Stock Selector Large Cap Value Fund | $36,765 | $– | $– |
9. Expense Reductions.
Commissions paid to certain brokers with whom the investment adviser, or its affiliates, places trades on behalf of Certain Funds include an amount in addition to trade execution, which may be rebated back to the Funds to offset certain expenses. In addition, through arrangements with each applicable Fund's custodian, credits realized as a result of certain uninvested cash balances were used to reduce each applicable Fund's expenses. All of the applicable expense reductions are noted in the table below.
| | Brokerage Service reduction | Custody expense
reduction |
| Fidelity Advisor Series Equity-Income Fund | $53,677 | $367 |
| Fidelity Advisor Series Stock Selector Large Cap Value Fund | 31,630 | – |
In addition, during the period the investment adviser reimbursed and/or waived a portion of operating expenses as follows:
| | Amount |
| Fidelity Advisor Series Equity-Income Fund | $13,588 |
| Fidelity Advisor Series Stock Selector Large Cap Value Fund | $9,043 |
10. Other.
The Funds' organizational documents provide former and current trustees and officers with a limited indemnification against liabilities arising in connection with the performance of their duties to the Funds. In the normal course of business, the Funds may also enter into contracts that provide general indemnifications. The Funds' maximum exposure under these arrangements is unknown as this would be dependent on future claims that may be made against the Funds. The risk of material loss from such claims is considered remote.
At the end of the period, mutual funds managed by the investment adviser or its affiliates were the owners of record of all of the outstanding shares of the Funds.
Report of Independent Registered Public Accounting Firm
To the Trustees of Fidelity Devonshire Trust and the Shareholders of Fidelity Advisor Series Equity-Income Fund:
We have audited the accompanying statement of assets and liabilities of Fidelity Advisor Series Equity-Income Fund (the Fund), a fund of Fidelity Devonshire Trust, including the schedule of investments, as of January 31, 2017, and the related statement of operations for the year then ended, the statement of changes in net assets for each of the two years in the period then ended, and the financial highlights for each of the four years in the period then ended and for the period from December 6, 2012 (commencement of operations) to January 31, 2013. These financial statements and financial highlights are the responsibility of the Fund's management. Our responsibility is to express an opinion on these financial statements and financial highlights based on our audits.
We conducted our audits in accordance with the standards of the Public Company Accounting Oversight Board (United States). Those standards require that we plan and perform the audit to obtain reasonable assurance about whether the financial statements and financial highlights are free of material misstatement. The Fund is not required to have, nor were we engaged to perform, an audit of its internal control over financial reporting. Our audits included consideration of internal control over financial reporting as a basis for designing audit procedures that are appropriate in the circumstances, but not for the purpose of expressing an opinion on the effectiveness of the Fund's internal control over financial reporting. Accordingly, we express no such opinion. An audit also includes examining, on a test basis, evidence supporting the amounts and disclosures in the financial statements, assessing the accounting principles used and significant estimates made by management, as well as evaluating the overall financial statement presentation. Our procedures included confirmation of securities owned as of January 31, 2017, by correspondence with the custodians and brokers; when replies were not received from brokers, we performed other auditing procedures. We believe that our audit provides a reasonable basis for our opinion.
In our opinion, such financial statements and financial highlights referred to above present fairly, in all material respects, the financial position of Fidelity Advisor Series Equity-Income Fund as of January 31, 2017, the results of its operations for the year then ended, the chnages in its net assets for each of the two years in the period then ended, and the financial highlights for each of the four years in the period then ended and for the period from December 6, 2012 (commencement of operations) to January 31, 2013, in conformity with accounting principles generally accepted in the United States of America.
DELOITTE & TOUCHE LLP
Boston, Massachusetts
March 20, 2017
Report of Independent Registered Public Accounting Firm
To the Trustees of Fidelity Devonshire Trust and the Shareholders of Fidelity Advisor Series Stock Selector Large Cap Value Fund:
In our opinion, the accompanying statement of assets and liabilities, including the schedule of investments, and the related statements of operations and of changes in net assets and the financial highlights present fairly, in all material respects, the financial position of Fidelity Advisor Series Stock Selector Large Cap Value Fund (a fund of Fidelity Devonshire Trust) as of January 31, 2017, the results of its operations for the year then ended, the changes in its net assets for each of the two years in the period then ended and the financial highlights for each of the periods indicated, in conformity with accounting principles generally accepted in the United States of America. These financial statements and financial highlights (hereafter referred to as “financial statements”) are the responsibility of the Fidelity Advisor Series Stock Selector Large Cap Value Fund’s management. Our responsibility is to express an opinion on these financial statements based on our audits. We conducted our audits of these financial statements in accordance with the standards of the Public Company Accounting Oversight Board (United States). Those standards require that we plan and perform the audit to obtain reasonable assurance about whether the financial statements are free of material misstatement. An audit includes examining, on a test basis, evidence supporting the amounts and disclosures in the financial statements, assessing the accounting principles used and significant estimates made by management, and evaluating the overall financial statement presentation. We believe that our audits, which included confirmation of securities as of January 31, 2017 by correspondence with the custodian and brokers, provide a reasonable basis for our opinion.
PricewaterhouseCoopers LLP
Boston, Massachusetts
March 20, 2017
Trustees and Officers
The Trustees, Members of the Advisory Board (if any), and officers of the trust and funds, as applicable, are listed below. The Board of Trustees governs each fund and is responsible for protecting the interests of shareholders. The Trustees are experienced executives who meet periodically throughout the year to oversee each fund's activities, review contractual arrangements with companies that provide services to each fund, oversee management of the risks associated with such activities and contractual arrangements, and review each fund's performance. Each of the Trustees oversees 169 funds.
The Trustees hold office without limit in time except that (a) any Trustee may resign; (b) any Trustee may be removed by written instrument, signed by at least two-thirds of the number of Trustees prior to such removal; (c) any Trustee who requests to be retired or who has become incapacitated by illness or injury may be retired by written instrument signed by a majority of the other Trustees; and (d) any Trustee may be removed at any special meeting of shareholders by a two-thirds vote of the outstanding voting securities of the trust. Each Trustee who is not an interested person (as defined in the 1940 Act) of the trust and the funds is referred to herein as an Independent Trustee. Each Independent Trustee shall retire not later than the last day of the calendar year in which his or her 75th birthday occurs. The Independent Trustees may waive this mandatory retirement age policy with respect to individual Trustees. Officers and Advisory Board Members hold office without limit in time, except that any officer or Advisory Board Member may resign or may be removed by a vote of a majority of the Trustees at any regular meeting or any special meeting of the Trustees. Except as indicated, each individual has held the office shown or other offices in the same company for the past five years.
Each fund’s Statement of Additional Information (SAI) includes more information about the Trustees. To request a free copy, call Fidelity at 1-877-208-0098.
Experience, Skills, Attributes, and Qualifications of the Trustees. The Governance and Nominating Committee has adopted a statement of policy that describes the experience, qualifications, attributes, and skills that are necessary and desirable for potential Independent Trustee candidates (Statement of Policy). The Board believes that each Trustee satisfied at the time he or she was initially elected or appointed a Trustee, and continues to satisfy, the standards contemplated by the Statement of Policy. The Governance and Nominating Committee also engages professional search firms to help identify potential Independent Trustee candidates who have the experience, qualifications, attributes, and skills consistent with the Statement of Policy. From time to time, additional criteria based on the composition and skills of the current Independent Trustees, as well as experience or skills that may be appropriate in light of future changes to board composition, business conditions, and regulatory or other developments, have also been considered by the professional search firms and the Governance and Nominating Committee. In addition, the Board takes into account the Trustees' commitment and participation in Board and committee meetings, as well as their leadership of standing and ad hoc committees throughout their tenure.
In determining that a particular Trustee was and continues to be qualified to serve as a Trustee, the Board has considered a variety of criteria, none of which, in isolation, was controlling. The Board believes that, collectively, the Trustees have balanced and diverse experience, qualifications, attributes, and skills, which allow the Board to operate effectively in governing each fund and protecting the interests of shareholders. Information about the specific experience, skills, attributes, and qualifications of each Trustee, which in each case led to the Board's conclusion that the Trustee should serve (or continue to serve) as a trustee of the funds, is provided below.
Board Structure and Oversight Function. James C. Curvey is an interested person and currently serves as Chairman. The Trustees have determined that an interested Chairman is appropriate and benefits shareholders because an interested Chairman has a personal and professional stake in the quality and continuity of services provided to the funds. Independent Trustees exercise their informed business judgment to appoint an individual of their choosing to serve as Chairman, regardless of whether the Trustee happens to be independent or a member of management. The Independent Trustees have determined that they can act independently and effectively without having an Independent Trustee serve as Chairman and that a key structural component for assuring that they are in a position to do so is for the Independent Trustees to constitute a substantial majority for the Board. The Independent Trustees also regularly meet in executive session. Ned C. Lautenbach serves as Chairman of the Independent Trustees and as such (i) acts as a liaison between the Independent Trustees and management with respect to matters important to the Independent Trustees and (ii) with management prepares agendas for Board meetings.
Fidelity® funds are overseen by different Boards of Trustees. The funds' Board oversees Fidelity's high income and certain equity funds, and other Boards oversee Fidelity's investment-grade bond, money market, asset allocation, and sector funds. The asset allocation funds may invest in Fidelity® funds overseen by the funds' Board. The use of separate Boards, each with its own committee structure, allows the Trustees of each group of Fidelity® funds to focus on the unique issues of the funds they oversee, including common research, investment, and operational issues. On occasion, the separate Boards establish joint committees to address issues of overlapping consequences for the Fidelity® funds overseen by each Board.
The Trustees operate using a system of committees to facilitate the timely and efficient consideration of all matters of importance to the Trustees, each fund, and fund shareholders and to facilitate compliance with legal and regulatory requirements and oversight of the funds' activities and associated risks. The Board, acting through its committees, has charged FMR and its affiliates with (i) identifying events or circumstances the occurrence of which could have demonstrably adverse effects on the funds' business and/or reputation; (ii) implementing processes and controls to lessen the possibility that such events or circumstances occur or to mitigate the effects of such events or circumstances if they do occur; and (iii) creating and maintaining a system designed to evaluate continuously business and market conditions in order to facilitate the identification and implementation processes described in (i) and (ii) above. Because the day-to-day operations and activities of the funds are carried out by or through FMR, its affiliates, and other service providers, the funds' exposure to risks is mitigated but not eliminated by the processes overseen by the Trustees. While each of the Board's committees has responsibility for overseeing different aspects of the funds' activities, oversight is exercised primarily through the Operations, Audit, and Compliance Committees. In addition, the Independent Trustees have worked with FMR to enhance the Board's oversight of investment and financial risks, legal and regulatory risks, technology risks, and operational risks, including the development of additional risk reporting to the Board. For example, a working group comprised of Independent Trustees and FMR has worked and continues to work to review the Fidelity® funds' valuation-related activities, reporting and risk management. Appropriate personnel, including but not limited to the funds' Chief Compliance Officer (CCO), FMR's internal auditor, the independent accountants, the funds' Treasurer and portfolio management personnel, make periodic reports to the Board's committees, as appropriate, including an annual review of Fidelity's risk management program for the Fidelity® funds. The responsibilities of each standing committee, including their oversight responsibilities, are described further under "Standing Committees of the Trustees."
Interested Trustees*:
Correspondence intended for a Trustee who is an interested person may be sent to Fidelity Investments, 245 Summer Street, Boston, Massachusetts 02210.
Name, Year of Birth; Principal Occupations and Other Relevant Experience+
James C. Curvey (1935)
Year of Election or Appointment: 2007
Trustee
Chairman of the Board of Trustees
Mr. Curvey also serves as Trustee of other Fidelity® funds. Mr. Curvey is a Director of Fidelity Research & Analysis Co. (investment adviser firm, 2009-present), and Vice Chairman (2007-present) and Director of FMR LLC (diversified financial services company). In addition, Mr. Curvey serves as an Overseer for the Boston Symphony Orchestra and a member of the board of Artis-Naples, Naples, Florida, and as a Trustee for Brewster Academy, Wolfeboro, New Hampshire. Previously, Mr. Curvey served as a Director of Fidelity Investments Money Management, Inc. (investment adviser firm, 2009-2014) and a Director of FMR and FMR Co., Inc. (investment adviser firms, 2007-2014).
Charles S. Morrison (1960)
Year of Election or Appointment: 2014
Trustee
Mr. Morrison also serves as Trustee of other funds. He serves as President of Fidelity Management & Research Company (FMR) (investment adviser firm, 2016-present), a Director of Fidelity Investments Money Management, Inc. (FIMM) (investment adviser firm, 2014-present), Director of Fidelity SelectCo, LLC (investment adviser firm, 2014-present), President, Asset Management (2014-present), and is an employee of Fidelity Investments. Previously, Mr. Morrison served as Vice President of Fidelity's Fixed Income and Asset Allocation Funds (2012-2014), President, Fixed Income (2011-2014), Vice President of Fidelity's Money Market Funds (2005-2009), President, Money Market Group Leader of FMR (investment adviser firm, 2009), and Senior Vice President, Money Market Group of FMR (2004-2009). Mr. Morrison also served as Vice President of Fidelity's Bond Funds (2002-2005), certain Balanced Funds (2002-2005), and certain Asset Allocation Funds (2002-2007), and as Senior Vice President (2002-2005) of Fidelity's Bond Division.
* Determined to be an “Interested Trustee” by virtue of, among other things, his or her affiliation with the trust or various entities under common control with FMR.
+ The information includes the Trustee's principal occupation during the last five years and other information relating to the experience, attributes, and skills relevant to the Trustee's qualifications to serve as a Trustee, which led to the conclusion that the Trustee should serve as a Trustee for each fund.
Independent Trustees:
Correspondence intended for an Independent Trustee may be sent to Fidelity Investments, P.O. Box 55235, Boston, Massachusetts 02205-5235.
Name, Year of Birth; Principal Occupations and Other Relevant Experience+
Dennis J. Dirks (1948)
Year of Election or Appointment: 2005
Trustee
Mr. Dirks also serves as Trustee of other Fidelity® funds. Prior to his retirement in May 2003, Mr. Dirks was Chief Operating Officer and a member of the Board of The Depository Trust & Clearing Corporation (DTCC). He also served as President, Chief Operating Officer, and Board member of The Depository Trust Company (DTC) and President and Board member of the National Securities Clearing Corporation (NSCC). In addition, Mr. Dirks served as Chief Executive Officer and Board member of the Government Securities Clearing Corporation, Chief Executive Officer and Board member of the Mortgage-Backed Securities Clearing Corporation, as a Trustee and a member of the Finance Committee of Manhattan College (2005-2008), as a Trustee and a member of the Finance Committee of AHRC of Nassau County (2006-2008), and as a member of the Independent Directors Council (IDC) Governing Council (2010-2015). Mr. Dirks is a member of the Board of Directors for The Brookville Center for Children's Services, Inc. (2009-present) and the Finance Committee of the Asolo Repertory Theatre (2016-present).
Alan J. Lacy (1953)
Year of Election or Appointment: 2008
Trustee
Mr. Lacy also serves as Trustee of other Fidelity® funds. Mr. Lacy serves as Chairman (2014-present) and a member (2010-present) of the Board of Directors of Dave & Buster's Entertainment, Inc. (restaurant and entertainment complexes) and a Director of Bristol-Myers Squibb Company (global pharmaceuticals, 2008-present). He is a Trustee of the California Chapter of The Nature Conservancy (2015-present) and a Director of the Center for Advanced Study in the Behavioral Sciences at Stanford University (2015-present). In addition, Mr. Lacy served as Senior Adviser (2007-2014) of Oak Hill Capital Partners, L.P. (private equity) and also served as Chief Executive Officer (2005) and Vice Chairman (2005-2006) of Sears Holdings Corporation (retail) and Chief Executive Officer and Chairman of the Board of Sears, Roebuck and Co. (retail, 2000-2005). Previously, Mr. Lacy served as Chairman (2008-2011) and a member (2006-2015) of the Board of Trustees of the National Parks Conservation Association and as a member of the Board of Directors for The Western Union Company (global money transfer, 2006-2011), The Hillman Companies, Inc. (hardware wholesalers, 2010-2014), and Earth Fare, Inc. (retail grocery, 2010-2014).
Ned C. Lautenbach (1944)
Year of Election or Appointment: 2000
Trustee
Chairman of the Independent Trustees
Mr. Lautenbach also serves as Trustee of other Fidelity® funds. Mr. Lautenbach currently serves as the Lead Director of the Eaton Corporation Board of Directors (diversified industrial, 1997-present). Mr. Lautenbach is Chairman of the Board of Directors of Artis-Naples in Naples, Florida (2012-present), a member of the Council on Foreign Relations (1994-present), and currently Vice Chair of the Board of Governors, State University System of Florida (2013-present). Previously, Mr. Lautenbach was a Partner and Advisory Partner at Clayton, Dubilier & Rice, LLC (private equity investment, 1998-2010), as well as a Director of Sony Corporation (2006-2007). Mr. Lautenbach also had a 30-year career with IBM (technology company) during which time he served as Senior Vice President and a member of the Corporate Executive Committee (1968-1998).
Joseph Mauriello (1944)
Year of Election or Appointment: 2008
Trustee
Mr. Mauriello also serves as Trustee of other Fidelity® funds. Prior to his retirement in January 2006, Mr. Mauriello served in numerous senior management positions including Deputy Chairman and Chief Operating Officer (2004-2005), and Vice Chairman of Financial Services (2002-2004) of KPMG LLP US (professional services, 1965-2005). Mr. Mauriello currently serves as a member of the Board of Directors of XL Group plc. (global insurance and re-insurance, 2006-present) and the Independent Directors Council (IDC) Governing Council (2015-present). Previously, Mr. Mauriello served as a Director of the Hamilton Funds of the Bank of New York (2006-2007) and of Arcadia Resources Inc. (health care services and products, 2007-2012).
Robert W. Selander (1950)
Year of Election or Appointment: 2011
Trustee
Mr. Selander also serves as Trustee of other Fidelity® funds. Mr. Selander serves as a Director of The Western Union Company (global money transfer, 2014-present) and a non-executive Chairman of Health Equity, Inc. (health savings custodian, 2015-present). Previously, Mr. Selander served as a Member of the Advisory Board of certain Fidelity® funds (2011), and Executive Vice Chairman (2010), Chief Executive Officer (2009-2010), and President and Chief Executive Officer (1997-2009) of Mastercard, Inc.
Cornelia M. Small (1944)
Year of Election or Appointment: 2005
Trustee
Ms. Small also serves as Trustee of other Fidelity® funds. Ms. Small is a member of the Board of Directors (2009-present) and Chair of the Investment Committee (2010-present) of the Teagle Foundation. Ms. Small also serves on the Investment Committee of the Berkshire Taconic Community Foundation (2008-present). Previously, Ms. Small served as Chairperson (2002-2008) and a member of the Investment Committee and Chairperson (2008-2012) and a member of the Board of Trustees of Smith College. In addition, Ms. Small served as Chief Investment Officer, Director of Global Equity Investments, and a member of the Board of Directors of Scudder, Stevens & Clark and Scudder Kemper Investments.
William S. Stavropoulos (1939)
Year of Election or Appointment: 2002
Trustee
Vice Chairman of the Independent Trustees
Mr. Stavropoulos also serves as Trustee of other Fidelity® funds. Mr. Stavropoulos serves as President and Founder of the Michigan Baseball Foundation, the Great Lakes Loons (2007-present). Mr. Stavropoulos is Chairman Emeritus of the Board of Directors of The Dow Chemical Company, where he previously served in numerous senior management positions, including President, CEO (1995-2000; 2002-2004), Chairman of the Executive Committee (2000-2006), and as a member of the Board of Directors (1990-2006). Currently, Mr. Stavropoulos is Chairman of the Board of Directors of Univar Inc. (global distributor of commodity and specialty chemicals), a Director of Teradata Corporation (data warehousing and technology solutions), and a member of the Advisory Board for Metalmark Capital LLC (private equity investment, 2005-present). Mr. Stavropoulos is an operating advisor to Clayton, Dubilier & Rice, LLC (private equity investment). In addition, Mr. Stavropoulos is a member of the University of Notre Dame Advisory Council for the College of Science, a Trustee of the Rollin L. Gerstacker Foundation, and a Director of Artis-Naples in Naples, Florida. Previously, Mr. Stavropoulos served as a Director of Chemical Financial Corporation (bank holding company, 1993-2012) and Tyco International, Ltd. (multinational manufacturing and services, 2007-2012).
David M. Thomas (1949)
Year of Election or Appointment: 2008
Trustee
Mr. Thomas also serves as Trustee of other Fidelity® funds. Mr. Thomas serves as Non-Executive Chairman of the Board of Directors of Fortune Brands Home and Security (home and security products, 2011-present), as a member of the Board of Directors (2004-present) and Presiding Director (2013-present) of Interpublic Group of Companies, Inc. (marketing communication), and as a member of the Board of Trustees of the University of Florida (2013-present). Previously, Mr. Thomas served as Executive Chairman (2005-2006) and Chairman and Chief Executive Officer (2000-2005) of IMS Health, Inc. (pharmaceutical and healthcare information solutions), and a Director of Fortune Brands, Inc. (consumer products, 2000-2011).
+ The information includes the Trustee's principal occupation during the last five years and other information relating to the experience, attributes, and skills relevant to the Trustee's qualifications to serve as a Trustee, which led to the conclusion that the Trustee should serve as a Trustee for each fund.
Advisory Board Members and Officers:
Correspondence intended for an officer or Peter S. Lynch may be sent to Fidelity Investments, 245 Summer Street, Boston, Massachusetts 02210. Officers appear below in alphabetical order.
Name, Year of Birth; Principal Occupation
Peter S. Lynch (1944)
Year of Election or Appointment: 2003
Member of the Advisory Board
Mr. Lynch also serves as Member of the Advisory Board of other Fidelity® funds. Mr. Lynch is Vice Chairman and a Director of FMR (investment adviser firm) and FMR Co., Inc. (investment adviser firm). In addition, Mr. Lynch serves as a Trustee of Boston College and as the Chairman of the Inner-City Scholarship Fund. Previously, Mr. Lynch served on the Special Olympics International Board of Directors (1997-2006).
Elizabeth Paige Baumann (1968)
Year of Election or Appointment: 2017
Interim Anti-Money Laundering (AML) Officer
Ms. Baumann also serves as AML Officer of other funds. She is Chief AML Officer (2012-present) and Senior Vice President (2014-present) of FMR LLC (diversified financial services company) and is an employee of Fidelity Investments. Previously, Ms. Baumann served as AML Officer (2012-2016), Vice President (2007-2014), and Deputy Anti-Money Laundering Officer (2007-2012).
Marc R. Bryant (1966)
Year of Election or Appointment: 2015
Secretary and Chief Legal Officer (CLO)
Mr. Bryant also serves as Secretary and CLO of other funds. Mr. Bryant serves as CLO, Secretary, and Senior Vice President of Fidelity Management & Research Company (investment adviser firm, 2015-present) and FMR Co., Inc. (investment adviser firm, 2015-present); Secretary of Fidelity SelectCo, LLC (investment adviser firm, 2015-present) and Fidelity Investments Money Management, Inc. (investment adviser firm, 2015-present); and CLO of Fidelity Management & Research (Hong Kong) Limited and FMR Investment Management (UK) Limited (investment adviser firms, 2015-present) and Fidelity Management & Research (Japan) Limited (investment adviser firm, 2016-present). He is Senior Vice President and Deputy General Counsel of FMR LLC (diversified financial services company). Previously, Mr. Bryant served as Secretary and CLO of Fidelity Rutland Square Trust II (2010-2014) and Assistant Secretary of Fidelity's Fixed Income and Asset Allocation Funds (2013-2015). Prior to joining Fidelity Investments, Mr. Bryant served as a Senior Vice President and the Head of Global Retail Legal for AllianceBernstein L.P. (2006-2010), and as the General Counsel for ProFund Advisors LLC (2001-2006).
Jeffrey S. Christian (1961)
Year of Election or Appointment: 2016
Assistant Treasurer
Mr. Christian also serves as Assistant Treasurer of other funds. Mr. Christian is an employee of Fidelity Investments (2003-present).
William C. Coffey (1969)
Year of Election or Appointment: 2009
Assistant Secretary
Mr. Coffey also serves as Assistant Secretary of other funds. He is Senior Vice President and Deputy General Counsel of FMR LLC (diversified financial services company, 2010-present), and is an employee of Fidelity Investments. Previously, Mr. Coffey served as Vice President and Associate General Counsel of FMR LLC (2005-2009).
Jonathan Davis (1968)
Year of Election or Appointment: 2010
Assistant Treasurer
Mr. Davis also serves as Assistant Treasurer of other funds, and is an employee of Fidelity Investments. Previously, Mr. Davis served as Vice President and Associate General Counsel of FMR LLC (diversified financial services company, 2003-2010).
Adrien E. Deberghes (1967)
Year of Election or Appointment: 2016
Assistant Treasurer
Mr. Deberghes also serves as an officer of other funds. He serves as Executive Vice President of Fidelity Investments Money Management, Inc. (FIMM) (investment adviser firm, 2016-present) and is an employee of Fidelity Investments (2008-present). Prior to joining Fidelity Investments, Mr. Deberghes was Senior Vice President of Mutual Fund Administration at State Street Corporation (2007-2008), Senior Director of Mutual Fund Administration at Investors Bank & Trust (2005-2007), and Director of Finance for Dunkin' Brands (2000-2005). Previously, Mr. Deberghes served in other fund officer roles.
Stephanie J. Dorsey (1969)
Year of Election or Appointment: 2010
Assistant Treasurer
Ms. Dorsey also serves as an officer of other funds. She is an employee of Fidelity Investments (2008-present) and has served in other fund officer roles. Prior to joining Fidelity Investments, Ms. Dorsey served as Treasurer (2004-2008) of the JPMorgan Mutual Funds and Vice President (2004-2008) of JPMorgan Chase Bank.
Howard J. Galligan III (1966)
Year of Election or Appointment: 2014
Chief Financial Officer
Mr. Galligan also serves as Chief Financial Officer of other funds. Mr. Galligan serves as President of Fidelity Pricing and Cash Management Services (FPCMS) (2014-present) and as a Director of Strategic Advisers, Inc. (investment adviser firm, 2008-present). Previously, Mr. Galligan served as Chief Administrative Officer of Asset Management (2011-2014) and Chief Operating Officer and Senior Vice President of Investment Support for Strategic Advisers, Inc. (2003-2011).
Scott C. Goebel (1968)
Year of Election or Appointment: 2015
Vice President
Mr. Goebel serves as Vice President of other funds and is an employee of Fidelity Investments (2001-present). Previously, Mr. Goebel served as Senior Vice President of Fidelity Management & Research Company (FMR) (investment adviser firm, 2016), Secretary of Fidelity SelectCo, LLC (investment adviser firm, 2013-2015), Fidelity Investments Money Management, Inc. (FIMM) (investment adviser firm, 2010-2015), and Fidelity Research and Analysis Company (FRAC) (investment adviser firm, 2010-2015); General Counsel, Secretary, and Senior Vice President of FMR (investment adviser firm, 2008-2015) and FMR Co., Inc. (investment adviser firm, 2008-2015); Assistant Secretary of Fidelity Management & Research (Japan) Limited (investment adviser firm, 2008-2015) and Fidelity Management & Research (U.K.) Inc. (investment adviser firm, 2008-2015); Chief Legal Officer (CLO) of Fidelity Management & Research (Hong Kong) Limited (investment adviser firm, 2008-2015); Secretary and CLO of certain Fidelity® funds (2008-2015); Assistant Secretary of FIMM (2008-2010), FRAC (2008-2010), and certain funds (2007-2008); and as Vice President and Secretary of Fidelity Distributors Corporation (FDC) (2005-2007).
Thomas C. Hense (1964)
Year of Election or Appointment: 2008, 2010, or 2015
Vice President
Mr. Hense serves as Vice President of Fidelity Advisor® Multi-Asset Income Fund (2015) and other funds (High Income (2008), Small Cap (2008), and Value (2010) funds), and is an employee of Fidelity Investments (1993-present). Previously, Mr. Hense served as a portfolio manager for Fidelity's Institutional Money Management Group (Pyramis) (2003-2008).
Brian B. Hogan (1964)
Year of Election or Appointment: 2009
Vice President
Mr. Hogan also serves as Trustee or Vice President of other funds. Mr. Hogan serves as a Director of FMR Investment Management (UK) Limited (investment adviser firm, 2015-present) and Fidelity SelectCo, LLC (investment adviser firm, 2014-present) and President of the Equity Division of FMR (investment adviser firm, 2009-present). Previously, Mr. Hogan served as Senior Vice President, Equity Research of FMR (2006-2009) and as a portfolio manager. Mr. Brian B. Hogan is not related to Mr. Colm A. Hogan.
Colm A. Hogan (1973)
Year of Election or Appointment: 2016
Deputy Treasurer
Mr. Hogan also serves as an officer of other funds. Mr. Hogan is an employee of Fidelity Investments (2005-present). Mr. Colm A. Hogan is not related to Mr. Brian B. Hogan.
Chris Maher (1972)
Year of Election or Appointment: 2013
Assistant Treasurer
Mr. Maher serves as Assistant Treasurer of other funds. Mr. Maher is Vice President of Valuation Oversight and is an employee of Fidelity Investments. Previously, Mr. Maher served as Vice President of Asset Management Compliance (2013), Vice President of the Program Management Group of FMR (investment adviser firm, 2010-2013), and Vice President of Valuation Oversight (2008-2010).
Kenneth B. Robins (1969)
Year of Election or Appointment: 2016
Chief Compliance Officer
Mr. Robins also serves as an officer of other funds. Mr. Robins serves as Compliance Officer of Fidelity Management & Research Company and FMR Co., Inc. (investment adviser firms, 2016-present) and is an employee of Fidelity Investments (2004-present). Previously, Mr. Robins served as Executive Vice President of Fidelity Investments Money Management, Inc. (investment adviser firm, 2013-2016) and served in other fund officer roles.
Stacie M. Smith (1974)
Year of Election or Appointment: 2016
President and Treasurer
Ms. Smith also serves as an officer of other funds. She is an employee of Fidelity Investments (2009-present) and has served in other fund officer roles. Prior to joining Fidelity Investments, Ms. Smith served as Senior Audit Manager of Ernst & Young LLP (accounting firm, 1996-2009). Previously, Ms. Smith served as Deputy Treasurer of certain Fidelity® funds (2013-2016).
Marc L. Spector (1972)
Year of Election or Appointment: 2016
Assistant Treasurer
Mr. Spector also serves as an officer of other funds. Mr. Spector is an employee of Fidelity Investments (2016-present). Prior to joining Fidelity Investments, Mr. Spector served as Director at the Siegfried Group (accounting firm, 2013-2016), and prior to Siegfried Group as audit senior manager at Deloitte & Touche (accounting firm, 2005-2013).
Renee Stagnone (1975)
Year of Election or Appointment: 2016
Assistant Treasurer
Ms. Stagnone also serves as an officer of other funds. Ms. Stagnone is an employee of Fidelity Investments (1997-present). Previously, Ms. Stagnone served as Deputy Treasurer of certain Fidelity® funds (2013-2016).
Shareholder Expense Example
As a shareholder of the Fund, you incur two types of costs: (1) transaction costs and (2) ongoing costs, including management fees and other Fund expenses. This Example is intended to help you understand your ongoing costs (in dollars) of investing in the Fund and to compare these costs with the ongoing costs of investing in other mutual funds.
The Example is based on an investment of $1,000 invested at the beginning of the period and held for the entire period (August 1, 2016 to January 31, 2017).
Actual Expenses
The first line of the accompanying table for each fund provides information about actual account values and actual expenses. You may use the information in this line, together with the amount you invested, to estimate the expenses that you paid over the period. Simply divide your account value by $1,000.00 (for example, an $8,600 account value divided by $1,000.00 = 8.6), then multiply the result by the number in the first line for a fund under the heading entitled "Expenses Paid During Period" to estimate the expenses you paid on your account during this period. In addition, each Fund, as a shareholder in the underlying Fidelity Central Funds, will indirectly bear its pro-rata share of the fees and expenses incurred by the underlying Fidelity Central Funds. These fees and expenses are not included in the Fund's annualized expense ratio used to calculate the expense estimate in the table below.
Hypothetical Example for Comparison Purposes
The second line of the accompanying table for each fund provides information about hypothetical account values and hypothetical expenses based on a fund's actual expense ratio and an assumed rate of return of 5% per year before expenses, which is not the Fund's actual return. The hypothetical account values and expenses may not be used to estimate the actual ending account balance or expenses you paid for the period. You may use this information to compare the ongoing costs of investing in the Fund and other funds. To do so, compare this 5% hypothetical example with the 5% hypothetical examples that appear in the shareholder reports of the other funds. In addition, each Fund, as a shareholder in the underlying Fidelity Central Funds, will indirectly bear its pro-rata share of the fees and expenses incurred by the underlying Fidelity Central Funds. These fees and expenses are not included in the Fund's annualized expense ratio used to calculate the expense estimate in the table below.
Please note that the expenses shown in the table are meant to highlight your ongoing costs only and do not reflect any transaction costs. Therefore, the second line of the table is useful in comparing ongoing costs only, and will not help you determine the relative total costs of owning different funds.
| | Annualized Expense Ratio-A | Beginning
Account Value
August 1, 2016 | Ending
Account Value
January 31, 2017 | Expenses Paid
During Period-B
August 1, 2016
to January 31, 2017 |
| Fidelity Advisor Series Equity-Income Fund | .66% | | | |
| Actual | | $1,000.00 | $1,090.40 | $3.47 |
| Hypothetical-C | | $1,000.00 | $1,021.82 | $3.35 |
| Fidelity Advisor Series Stock Selector Large Cap Value Fund | .70% | | | |
| Actual | | $1,000.00 | $1,085.60 | $3.67 |
| Hypothetical-C | | $1,000.00 | $1,021.62 | $3.56 |
A Annualized expense ratio reflects expenses net of applicable fee waivers.
B Expenses are equal to each Fund's annualized expense ratio, multiplied by the average account value over the period, multiplied by 184/366 (to reflect the one-half year period).
C 5% return per year before expenses
Distributions (Unaudited)
The Board of Trustees of each fund voted to pay to shareholders of record at the opening of business on record date, the following distributions per share derived from capital gains realized from sales of portfolio securities, and dividends derived from net investment income:
| | Pay Date | Record Date | Dividends | Capital Gains |
| Fidelity Advisor Series Equity-Income Fund | 03/13/2017 | 03/10/2017 | $0.000 | $0.155 |
| Fidelity Advisor Series Stock Selector Large Cap Value Fund | 03/13/2017 | 03/10/2017 | $0.003 | $0.055 |
|
The funds hereby designate as capital gain dividend the amounts noted below for the taxable year ended January 31, 2017, or, if subsequently determined to be different, the net capital gain of such year.
| Fidelity Advisor Series Equity-Income Fund | $27,267,259 |
| Fidelity Advisor Series Stock Selector Large Cap Value Fund | $4,493,773 |
|
A percentage of the dividends distributed during the fiscal year for the following fund was derived from interest on U.S. Government securities which is generally exempt from state income tax:
| Fidelity Advisor Series Equity-Income Fund | 0.15% |
|
A percentage of the dividends distributed during the fiscal year for the following funds qualify for the dividends–received deduction for corporate shareholders:
| Fidelity Advisor Series Equity-Income Fund | |
| April 2016 | 99% |
| July 2016 | 99% |
| October 2016 | 99% |
| December 2016 | 99% |
| Fidelity Advisor Series Stock Selector Large Cap Value Fund | |
| December 2016 | 100% |
|
Fidelity Advisor Series Equity-Income Fund and Fidelity Advisor Series Stock Selector Large Cap Value Fund designate 100% of the dividends distributed during the fiscal year as amounts which may be taken into account as a dividend for purposes of the maximum rate under section 1(h)(11) of the Internal Revenue Code.
The funds will notify shareholders in January 2018 of amounts for use in preparing 2017 income tax returns.
AEDTI-ALDTI-ANN-0317
1.956891.104
Fidelity® Stock Selector Large Cap Value Fund
Annual Report January 31, 2017 |
|
Contents
To view a fund's proxy voting guidelines and proxy voting record for the 12-month period ended June 30, visit http://www.fidelity.com/proxyvotingresults or visit the Securities and Exchange Commission's (SEC) web site at http://www.sec.gov.
You may also call 1-800-544-8544 to request a free copy of the proxy voting guidelines.
Standard & Poor's, S&P and S&P 500 are registered service marks of The McGraw-Hill Companies, Inc. and have been licensed for use by Fidelity Distributors Corporation.
Other third-party marks appearing herein are the property of their respective owners.
All other marks appearing herein are registered or unregistered trademarks or service marks of FMR LLC or an affiliated company. © 2017 FMR LLC. All rights reserved.
This report and the financial statements contained herein are submitted for the general information of the shareholders of the Fund. This report is not authorized for distribution to prospective investors in the Fund unless preceded or accompanied by an effective prospectus.
A fund files its complete schedule of portfolio holdings with the SEC for the first and third quarters of each fiscal year on Form N-Q. Forms N-Q are available on the SEC’s web site at http://www.sec.gov. A fund's Forms N-Q may be reviewed and copied at the SEC’s Public Reference Room in Washington, DC. Information regarding the operation of the SEC's Public Reference Room may be obtained by calling 1-800-SEC-0330.
For a complete list of a fund's portfolio holdings, view the most recent holdings listing, semiannual report, or annual report on Fidelity's web site at http://www.fidelity.com, http://www.institutional.fidelity.com, or http://www.401k.com, as applicable.
NOT FDIC INSURED •MAY LOSE VALUE •NO BANK GUARANTEE
Neither the Fund nor Fidelity Distributors Corporation is a bank.
Performance: The Bottom Line
Average annual total return reflects the change in the value of an investment, assuming reinvestment of distributions from dividend income and capital gains (the profits earned upon the sale of securities that have grown in value, if any) and assuming a constant rate of performance each year. The hypothetical investment and the average annual total returns do not reflect the deduction of taxes that a shareholder would pay on fund distributions or the redemption of fund shares. During periods of reimbursement by Fidelity, a fund’s total return will be greater than it would be had the reimbursement not occurred. How a fund did yesterday is no guarantee of how it will do tomorrow.
Average Annual Total Returns
| For the periods ended January 31, 2017 | Past 1 year | Past 5 years | Past 10 years |
| Fidelity® Stock Selector Large Cap Value Fund | 22.82% | 13.35% | 4.28% |
$10,000 Over 10 Years
Let's say hypothetically that $10,000 was invested in Fidelity® Stock Selector Large Cap Value Fund, a class of the fund, on January 31, 2007.
The chart shows how the value of your investment would have changed, and also shows how the Russell 1000® Value Index performed over the same period.

| Period Ending Values |
| $15,208 | Fidelity® Stock Selector Large Cap Value Fund |
| $17,348 | Russell 1000® Value Index |
Management's Discussion of Fund Performance
Market Recap: The S&P 500
® index posted a 20.04% gain for the year ending January 31, 2017, rising sharply in the final months on renewed optimism for economic growth. The beginning of the period saw improving investor sentiment amid U.S. job gains, a rally in energy and other stimuli that helped keep the seven-year bull uptrend intact. Markets tumbled briefly following the U.K.'s June 23 vote to exit the European Union (Brexit) – then recovered quickly and settled into a flattish stretch until the November 8 U.S. presidential election. Stocks then broke out in response to Donald Trump's surprise victory, surging to a series of new all-time highs on expectations for reflation and fiscal stimulus. For the year, industrials (+28%), energy (+27%) and materials (+37%) all did well, the latter two driven by a cyclical rebound in commodity prices. Financials (+35%) also shined, riding an uptick in bond yields and the strong rally in banks (+41%), especially post-election. Information technology rose about 25%, despite cooling off in the fourth quarter of 2016. Conversely, real estate (+8%) lagged on the prospect of rising interest rates. An improved backdrop for riskier assets curbed dividend-rich telecom services (+13%), utilities (+12%) and consumer staples (+6%). Health care (+8%) underperformed amid an uncertain political and regulatory outlook.
Comments from Lead Portfolio Manager Matthew Friedman: For the year, the fund's share classes (excluding sales charges, if applicable) underperformed the 24.62% result of the benchmark Russell 1000
® Value Index. Versus the benchmark, the fund’s average cash position of 4% was by far the biggest drag on performance. Security and sector selection were modest contributors overall, driven by picks in technology. Conversely, picks in materials, health care and financials hurt. The fund’s two biggest relative detractors were major index components Bank of America (+63%), which we did not own, and JPMorgan Chase (+46%), an underweighting in the fund. Shares of both banking giants surged as investors expected higher interest rates to boost bank profits, among other factors. Within health care, our non-benchmark stakes in Ireland-based Jazz Pharmaceuticals and Allergan were hurt by market fear about generic-drug price deflation and uncertainty regarding future health care legislation. Allergan also was hurt by a failed merger attempt with industry giant Pfizer. Conversely, the fund’s top individual contributor was our holdings in rail operator CSX, the value of which doubled this period. It also helped to avoid integrated oil giant Exxon Mobil (+12%), a large index member that underperformed the strong gain of the benchmark.
The views expressed above reflect those of the portfolio manager(s) only through the end of the period as stated on the cover of this report and do not necessarily represent the views of Fidelity or any other person in the Fidelity organization. Any such views are subject to change at any time based upon market or other conditions and Fidelity disclaims any responsibility to update such views. These views may not be relied on as investment advice and, because investment decisions for a Fidelity fund are based on numerous factors, may not be relied on as an indication of trading intent on behalf of any Fidelity fund.
Note to shareholders: On June 17, 2016, John Sheehy joined Steve Barwikowski as Co-Portfolio Manager of the fund's information technology and telecommunication services sleeves, and on January 3, 2017, assumed sole management responsibilities.
Investment Summary (Unaudited)
Top Ten Stocks as of January 31, 2017
| | % of fund's net assets | % of fund's net assets 6 months ago |
| Berkshire Hathaway, Inc. Class B | 5.6 | 4.5 |
| Wells Fargo & Co. | 3.8 | 2.6 |
| Chevron Corp. | 3.0 | 2.7 |
| Procter & Gamble Co. | 2.8 | 3.2 |
| Suncor Energy, Inc. | 2.5 | 2.2 |
| ConocoPhillips Co. | 2.5 | 1.6 |
| Chubb Ltd. | 2.4 | 1.8 |
| Johnson & Johnson | 2.4 | 2.8 |
| AT&T, Inc. | 2.2 | 2.4 |
| Cisco Systems, Inc. | 2.1 | 1.3 |
| | 29.3 | |
Top Five Market Sectors as of January 31, 2017
| | % of fund's net assets | % of fund's net assets 6 months ago |
| Financials | 27.6 | 26.3 |
| Energy | 13.7 | 12.9 |
| Health Care | 10.2 | 11.0 |
| Information Technology | 9.4 | 9.4 |
| Industrials | 8.8 | 8.3 |
Prior period industry classifications reflect the categories in place as of the date indicated and have not been adjusted to reflect current industry classifications.
Asset Allocation (% of fund's net assets)
| As of January 31, 2017* |
| | Stocks | 98.6% |
| | Short-Term Investments and Net Other Assets (Liabilities) | 1.4% |

* Foreign investments - 10.8%
| As of July 31, 2016* |
| | Stocks and Equity Futures | 95.6% |
| | Short-Term Investments and Net Other Assets (Liabilities) | 4.4% |

* Foreign investments - 9.8%
Investments January 31, 2017
Showing Percentage of Net Assets
| Common Stocks - 97.8% | | | |
| | | Shares | Value |
| CONSUMER DISCRETIONARY - 5.5% | | | |
| Auto Components - 0.5% | | | |
| Delphi Automotive PLC | | 59,500 | $4,168,570 |
| Diversified Consumer Services - 0.7% | | | |
| ServiceMaster Global Holdings, Inc. (a) | | 148,833 | 5,503,844 |
| Household Durables - 0.7% | | | |
| Whirlpool Corp. | | 32,530 | 5,689,172 |
| Internet & Direct Marketing Retail - 0.5% | | | |
| Liberty Interactive Corp. QVC Group Series A (a) | | 181,414 | 3,479,521 |
| Leisure Products - 0.2% | | | |
| Mattel, Inc. | | 65,600 | 1,719,376 |
| Media - 2.1% | | | |
| Charter Communications, Inc. Class A (a) | | 6,455 | 2,091,097 |
| Liberty Broadband Corp. Class C (a) | | 54,787 | 4,675,523 |
| Time Warner, Inc. | | 20,677 | 2,002,567 |
| Twenty-First Century Fox, Inc. Class A | | 225,700 | 7,082,466 |
| | | | 15,851,653 |
| Multiline Retail - 0.8% | | | |
| Target Corp. | | 93,134 | 6,005,280 |
|
| TOTAL CONSUMER DISCRETIONARY | | | 42,417,416 |
|
| CONSUMER STAPLES - 8.2% | | | |
| Food & Staples Retailing - 1.9% | | | |
| Kroger Co. | | 77,100 | 2,618,316 |
| Wal-Mart Stores, Inc. | | 40,345 | 2,692,625 |
| Walgreens Boots Alliance, Inc. | | 111,840 | 9,164,170 |
| | | | 14,475,111 |
| Food Products - 2.4% | | | |
| Mondelez International, Inc. | | 99,100 | 4,388,148 |
| The J.M. Smucker Co. | | 51,642 | 7,015,566 |
| The Kraft Heinz Co. | | 73,500 | 6,562,815 |
| | | | 17,966,529 |
| Household Products - 2.8% | | | |
| Procter & Gamble Co. | | 248,280 | 21,749,328 |
| Personal Products - 0.3% | | | |
| Coty, Inc. Class A | | 135,200 | 2,595,840 |
| Tobacco - 0.8% | | | |
| Philip Morris International, Inc. | | 65,000 | 6,248,450 |
|
| TOTAL CONSUMER STAPLES | | | 63,035,258 |
|
| ENERGY - 13.7% | | | |
| Energy Equipment & Services - 2.0% | | | |
| Baker Hughes, Inc. | | 173,000 | 10,912,840 |
| Dril-Quip, Inc. (a) | | 77,600 | 4,826,720 |
| | | | 15,739,560 |
| Oil, Gas & Consumable Fuels - 11.7% | | | |
| Cabot Oil & Gas Corp. | | 139,100 | 2,987,868 |
| Cenovus Energy, Inc. | | 545,700 | 7,447,940 |
| Chevron Corp. | | 207,000 | 23,049,450 |
| ConocoPhillips Co. | | 386,700 | 18,855,492 |
| Diamondback Energy, Inc. (a) | | 74,200 | 7,803,614 |
| Phillips 66 Co. | | 124,700 | 10,178,014 |
| Suncor Energy, Inc. | | 619,000 | 19,199,109 |
| | | | 89,521,487 |
|
| TOTAL ENERGY | | | 105,261,047 |
|
| FINANCIALS - 27.6% | | | |
| Banks - 10.4% | | | |
| CIT Group, Inc. | | 147,000 | 6,054,930 |
| Comerica, Inc. | | 33,500 | 2,262,255 |
| First Citizen Bancshares, Inc. | | 14,700 | 5,391,078 |
| First Citizen Bancshares, Inc. Class A (a) | | 10,000 | 3,667,400 |
| JPMorgan Chase & Co. | | 111,800 | 9,461,634 |
| PNC Financial Services Group, Inc. | | 60,700 | 7,311,922 |
| Popular, Inc. | | 98,280 | 4,366,580 |
| U.S. Bancorp | | 223,300 | 11,756,745 |
| Wells Fargo & Co. | | 520,800 | 29,336,664 |
| | | | 79,609,208 |
| Capital Markets - 3.6% | | | |
| Fortress Investment Group LLC | | 523,300 | 2,935,713 |
| Franklin Resources, Inc. | | 78,000 | 3,099,720 |
| Goldman Sachs Group, Inc. | | 68,600 | 15,731,352 |
| Interactive Brokers Group, Inc. | | 150,800 | 5,630,872 |
| | | | 27,397,657 |
| Consumer Finance - 1.0% | | | |
| Discover Financial Services | | 111,000 | 7,690,080 |
| Diversified Financial Services - 5.6% | | | |
| Berkshire Hathaway, Inc. Class B (a) | | 263,457 | 43,243,831 |
| Insurance - 6.3% | | | |
| AFLAC, Inc. | | 119,450 | 8,360,306 |
| AMBAC Financial Group, Inc. (a) | | 180,000 | 3,765,600 |
| Chubb Ltd. | | 139,400 | 18,329,706 |
| Kansas City Life Insurance Co. | | 50,604 | 2,327,784 |
| National Western Life Group, Inc. | | 8,350 | 2,447,803 |
| Torchmark Corp. | | 104,725 | 7,701,477 |
| Universal Insurance Holdings, Inc. (b) | | 212,500 | 5,556,875 |
| | | | 48,489,551 |
| Thrifts & Mortgage Finance - 0.7% | | | |
| Meridian Bancorp, Inc. Maryland | | 284,164 | 5,356,491 |
|
| TOTAL FINANCIALS | | | 211,786,818 |
|
| HEALTH CARE - 10.2% | | | |
| Health Care Equipment & Supplies - 2.3% | | | |
| Abbott Laboratories | | 151,839 | 6,342,315 |
| Medtronic PLC | | 119,420 | 9,078,308 |
| Zimmer Biomet Holdings, Inc. | | 18,382 | 2,175,142 |
| | | | 17,595,765 |
| Health Care Providers & Services - 1.0% | | | |
| Aetna, Inc. | | 21,115 | 2,504,450 |
| Anthem, Inc. | | 15,837 | 2,441,115 |
| Cigna Corp. | | 14,632 | 2,139,491 |
| Humana, Inc. | | 2,900 | 575,650 |
| | | | 7,660,706 |
| Life Sciences Tools & Services - 0.4% | | | |
| Thermo Fisher Scientific, Inc. | | 19,870 | 3,027,989 |
| Pharmaceuticals - 6.5% | | | |
| Allergan PLC | | 14,040 | 3,073,216 |
| Jazz Pharmaceuticals PLC (a) | | 47,627 | 5,806,684 |
| Johnson & Johnson | | 161,802 | 18,324,077 |
| Merck & Co., Inc. | | 189,359 | 11,738,364 |
| Mylan N.V. (a) | | 25,800 | 981,690 |
| Pfizer, Inc. | | 308,771 | 9,797,304 |
| | | | 49,721,335 |
|
| TOTAL HEALTH CARE | | | 78,005,795 |
|
| INDUSTRIALS - 8.8% | | | |
| Aerospace & Defense - 1.3% | | | |
| Aerojet Rocketdyne Holdings, Inc. (a) | | 154,410 | 2,796,365 |
| Raytheon Co. | | 18,150 | 2,616,504 |
| United Technologies Corp. | | 38,370 | 4,208,038 |
| | | | 9,620,907 |
| Airlines - 1.0% | | | |
| American Airlines Group, Inc. | | 165,580 | 7,326,915 |
| Commercial Services & Supplies - 0.2% | | | |
| Stericycle, Inc. (a) | | 20,600 | 1,589,084 |
| Construction & Engineering - 1.3% | | | |
| AECOM (a) | | 277,870 | 10,261,739 |
| Electrical Equipment - 1.0% | | | |
| AMETEK, Inc. | | 75,980 | 3,882,578 |
| Fortive Corp. | | 70,160 | 3,880,550 |
| | | | 7,763,128 |
| Industrial Conglomerates - 1.9% | | | |
| General Electric Co. | | 486,480 | 14,448,456 |
| Machinery - 0.9% | | | |
| Deere & Co. | | 38,270 | 4,096,804 |
| Flowserve Corp. | | 64,940 | 3,192,450 |
| | | | 7,289,254 |
| Road & Rail - 1.2% | | | |
| CSX Corp. | | 183,660 | 8,519,987 |
| Union Pacific Corp. | | 7,250 | 772,705 |
| | | | 9,292,692 |
|
| TOTAL INDUSTRIALS | | | 67,592,175 |
|
| INFORMATION TECHNOLOGY - 9.4% | | | |
| Communications Equipment - 2.1% | | | |
| Cisco Systems, Inc. | | 512,700 | 15,750,144 |
| Electronic Equipment & Components - 0.9% | | | |
| Dell Technologies, Inc. (a) | | 105,800 | 6,664,342 |
| Internet Software & Services - 0.4% | | | |
| Alphabet, Inc. Class A (a) | | 3,900 | 3,198,741 |
| IT Services - 1.5% | | | |
| Amdocs Ltd. | | 110,650 | 6,496,262 |
| Cognizant Technology Solutions Corp. Class A (a) | | 33,000 | 1,735,470 |
| CoreLogic, Inc. (a) | | 48,800 | 1,721,176 |
| Total System Services, Inc. | | 35,500 | 1,799,140 |
| | | | 11,752,048 |
| Semiconductors & Semiconductor Equipment - 1.0% | | | |
| Qualcomm, Inc. | | 140,600 | 7,512,258 |
| Software - 1.8% | | | |
| Oracle Corp. | | 229,800 | 9,217,278 |
| SS&C Technologies Holdings, Inc. | | 146,600 | 4,710,258 |
| | | | 13,927,536 |
| Technology Hardware, Storage & Peripherals - 1.7% | | | |
| Apple, Inc. | | 82,100 | 9,962,835 |
| HP, Inc. | | 226,000 | 3,401,300 |
| | | | 13,364,135 |
|
| TOTAL INFORMATION TECHNOLOGY | | | 72,169,204 |
|
| MATERIALS - 3.0% | | | |
| Chemicals - 2.3% | | | |
| E.I. du Pont de Nemours & Co. | | 105,000 | 7,927,500 |
| Eastman Chemical Co. | | 52,300 | 4,053,250 |
| LyondellBasell Industries NV Class A | | 32,200 | 3,003,294 |
| Westlake Chemical Corp. | | 40,600 | 2,513,546 |
| | | | 17,497,590 |
| Containers & Packaging - 0.4% | | | |
| Ball Corp. | | 37,800 | 2,882,628 |
| Metals & Mining - 0.3% | | | |
| Compass Minerals International, Inc. (b) | | 33,300 | 2,783,880 |
|
| TOTAL MATERIALS | | | 23,164,098 |
|
| REAL ESTATE - 1.7% | | | |
| Equity Real Estate Investment Trusts (REITs) - 0.5% | | | |
| American Tower Corp. | | 5,000 | 517,500 |
| Colony NorthStar, Inc. | | 253,944 | 3,534,900 |
| | | | 4,052,400 |
| Real Estate Management & Development - 1.2% | | | |
| Consolidated-Tomoka Land Co. (b) | | 54,350 | 2,989,250 |
| Jones Lang LaSalle, Inc. | | 10,000 | 1,030,300 |
| Kennedy-Wilson Holdings, Inc. (a) | | 240,000 | 4,908,000 |
| | | | 8,927,550 |
|
| TOTAL REAL ESTATE | | | 12,979,950 |
|
| TELECOMMUNICATION SERVICES - 3.7% | | | |
| Diversified Telecommunication Services - 3.7% | | | |
| AT&T, Inc. | | 402,400 | 16,965,184 |
| SBA Communications Corp. Class A (a) | | 27,900 | 2,936,754 |
| Verizon Communications, Inc. | | 170,900 | 8,375,809 |
| | | | 28,277,747 |
| UTILITIES - 6.0% | | | |
| Electric Utilities - 4.1% | | | |
| American Electric Power Co., Inc. | | 85,700 | 5,489,942 |
| Edison International | | 71,200 | 5,189,056 |
| NextEra Energy, Inc. | | 59,510 | 7,362,577 |
| OGE Energy Corp. | | 100,600 | 3,374,124 |
| PG&E Corp. | | 86,500 | 5,353,485 |
| Xcel Energy, Inc. | | 114,400 | 4,727,008 |
| | | | 31,496,192 |
| Multi-Utilities - 1.9% | | | |
| CMS Energy Corp. | | 89,900 | 3,829,740 |
| DTE Energy Co. | | 49,000 | 4,833,360 |
| Sempra Energy | | 59,450 | 6,087,086 |
| | | | 14,750,186 |
|
| TOTAL UTILITIES | | | 46,246,378 |
|
| TOTAL COMMON STOCKS | | | |
| (Cost $672,008,470) | | | 750,935,886 |
|
| Nonconvertible Preferred Stocks - 0.8% | | | |
| REAL ESTATE - 0.8% | | | |
| Equity Real Estate Investment Trusts (REITs) - 0.8% | | | |
| Equity Lifestyle Properties, Inc. Series C, 6.75% | | | |
| (Cost $5,109,713) | | 225,866 | 5,709,892 |
| | | Principal Amount | Value |
|
| U.S. Treasury Obligations - 0.1% | | | |
| U.S. Treasury Bills, yield at date of purchase 0.34% to 0.53% 2/2/17 to 3/23/17 | | | |
| (Cost $619,683) | | 620,000 | 619,710 |
| | | Shares | Value |
|
| Money Market Funds - 3.1% | | | |
| Fidelity Cash Central Fund, 0.62% (c) | | 18,951,709 | $18,955,499 |
| Fidelity Securities Lending Cash Central Fund 0.65% (c)(d) | | 4,772,188 | 4,773,142 |
| TOTAL MONEY MARKET FUNDS | | | |
| (Cost $23,730,536) | | | 23,728,641 |
| TOTAL INVESTMENT PORTFOLIO - 101.8% | | | |
| (Cost $701,468,402) | | | 780,994,129 |
| NET OTHER ASSETS (LIABILITIES) - (1.8)% | | | (13,439,299) |
| NET ASSETS - 100% | | | $767,554,830 |
Legend
(a) Non-income producing
(b) Security or a portion of the security is on loan at period end.
(c) Affiliated fund that is generally available only to investment companies and other accounts managed by Fidelity Investments. The rate quoted is the annualized seven-day yield of the fund at period end. A complete unaudited listing of the fund's holdings as of its most recent quarter end is available upon request. In addition, each Fidelity Central Fund's financial statements, which are not covered by the Fund's Report of Independent Registered Public Accounting Firm, are available on the SEC's website or upon request.
(d) Investment made with cash collateral received from securities on loan.
Affiliated Central Funds
Information regarding fiscal year to date income earned by the Fund from investments in Fidelity Central Funds is as follows:
| Fund | Income earned |
| Fidelity Cash Central Fund | $158,483 |
| Fidelity Securities Lending Cash Central Fund | 94,253 |
| Total | $252,736 |
Investment Valuation
The following is a summary of the inputs used, as of January 31, 2017, involving the Fund's assets and liabilities carried at fair value. The inputs or methodology used for valuing securities may not be an indication of the risk associated with investing in those securities. For more information on valuation inputs, and their aggregation into the levels used below, please refer to the Investment Valuation section in the accompanying Notes to Financial Statements.
| | Valuation Inputs at Reporting Date: |
| Description | Total | Level 1 | Level 2 | Level 3 |
| Investments in Securities: | | | | |
| Equities: | | | | |
| Consumer Discretionary | $42,417,416 | $42,417,416 | $-- | $-- |
| Consumer Staples | 63,035,258 | 63,035,258 | -- | -- |
| Energy | 105,261,047 | 105,261,047 | -- | -- |
| Financials | 211,786,818 | 211,786,818 | -- | -- |
| Health Care | 78,005,795 | 78,005,795 | -- | -- |
| Industrials | 67,592,175 | 67,592,175 | -- | -- |
| Information Technology | 72,169,204 | 72,169,204 | -- | -- |
| Materials | 23,164,098 | 23,164,098 | -- | -- |
| Real Estate | 18,689,842 | 18,689,842 | -- | -- |
| Telecommunication Services | 28,277,747 | 28,277,747 | -- | -- |
| Utilities | 46,246,378 | 46,246,378 | -- | -- |
| U.S. Government and Government Agency Obligations | 619,710 | -- | 619,710 | -- |
| Money Market Funds | 23,728,641 | 23,728,641 | -- | -- |
| Total Investments in Securities: | $780,994,129 | $780,374,419 | $619,710 | $-- |
Other Information
Distribution of investments by country or territory of incorporation, as a percentage of Total Net Assets, is as follows (Unaudited):
| United States of America | 89.2% |
| Canada | 3.5% |
| Switzerland | 2.4% |
| Ireland | 2.4% |
| Others (Individually Less Than 1%) | 2.5% |
| | 100.0% |
See accompanying notes which are an integral part of the financial statements.
Financial Statements
Statement of Assets and Liabilities
| | | January 31, 2017 |
| Assets | | |
Investment in securities, at value (including securities loaned of $4,648,758) — See accompanying schedule:
Unaffiliated issuers (cost $677,737,866) | $757,265,488 | |
| Fidelity Central Funds (cost $23,730,536) | 23,728,641 | |
| Total Investments (cost $701,468,402) | | $780,994,129 |
| Receivable for investments sold | | 2,099,279 |
| Receivable for fund shares sold | | 294,269 |
| Dividends receivable | | 624,039 |
| Distributions receivable from Fidelity Central Funds | | 17,869 |
| Prepaid expenses | | 1,257 |
| Other receivables | | 3,128 |
| Total assets | | 784,033,970 |
| Liabilities | | |
| Payable to custodian bank | $4,865,723 | |
| Payable for investments purchased | 2,760,926 | |
| Payable for fund shares redeemed | 3,528,886 | |
| Accrued management fee | 324,371 | |
| Distribution and service plan fees payable | 19,930 | |
| Other affiliated payables | 144,436 | |
| Other payables and accrued expenses | 62,814 | |
| Collateral on Securities Loaned | 4,772,054 | |
| Total liabilities | | 16,479,140 |
| Net Assets | | $767,554,830 |
| Net Assets consist of: | | |
| Paid in capital | | $831,359,178 |
| Undistributed net investment income | | 194,495 |
| Accumulated undistributed net realized gain (loss) on investments and foreign currency transactions | | (143,524,843) |
| Net unrealized appreciation (depreciation) on investments and assets and liabilities in foreign currencies | | 79,526,000 |
| Net Assets | | $767,554,830 |
| Calculation of Maximum Offering Price | | |
| Class A: | | |
| Net Asset Value and redemption price per share ($31,054,382 ÷ 1,667,024 shares) | | $18.63 |
| Maximum offering price per share (100/94.25 of $18.63) | | $19.77 |
| Class T: | | |
| Net Asset Value and redemption price per share ($10,703,530 ÷ 575,057 shares) | | $18.61 |
| Maximum offering price per share (100/96.50 of $18.61) | | $19.28 |
| Class C: | | |
| Net Asset Value and offering price per share ($10,801,697 ÷ 591,969 shares)(a) | | $18.25 |
| Stock Selector Large Cap Value: | | |
| Net Asset Value, offering price and redemption price per share ($703,722,459 ÷ 37,509,844 shares) | | $18.76 |
| Class I: | | |
| Net Asset Value, offering price and redemption price per share ($11,272,762 ÷ 603,955 shares) | | $18.66 |
(a) Redemption price per share is equal to net asset value less any applicable contingent deferred sales charge.
See accompanying notes which are an integral part of the financial statements.
Statement of Operations
| | | Year ended January 31, 2017 |
| Investment Income | | |
| Dividends | | $15,883,029 |
| Interest | | 1,430 |
| Income from Fidelity Central Funds | | 252,736 |
| Total income | | 16,137,195 |
| Expenses | | |
| Management fee | | |
| Basic fee | $4,130,330 | |
| Performance adjustment | (211,440) | |
| Transfer agent fees | 1,422,815 | |
| Distribution and service plan fees | 222,071 | |
| Accounting and security lending fees | 266,016 | |
| Custodian fees and expenses | 34,951 | |
| Independent trustees' fees and expenses | 3,213 | |
| Registration fees | 89,813 | |
| Audit | 65,534 | |
| Legal | 6,596 | |
| Miscellaneous | 6,643 | |
| Total expenses before reductions | 6,036,542 | |
| Expense reductions | (28,101) | 6,008,441 |
| Net investment income (loss) | | 10,128,754 |
| Realized and Unrealized Gain (Loss) | | |
| Net realized gain (loss) on: | | |
| Investment securities: | | |
| Unaffiliated issuers | 15,588,080 | |
| Fidelity Central Funds | 10,323 | |
| Foreign currency transactions | 8,168 | |
| Futures contracts | 2,161,166 | |
| Total net realized gain (loss) | | 17,767,737 |
Change in net unrealized appreciation (depreciation) on:
Investment securities | 125,509,336 | |
| Assets and liabilities in foreign currencies | 944 | |
| Futures contracts | (192,091) | |
| Total change in net unrealized appreciation (depreciation) | | 125,318,189 |
| Net gain (loss) | | 143,085,926 |
| Net increase (decrease) in net assets resulting from operations | | $153,214,680 |
See accompanying notes which are an integral part of the financial statements.
Statement of Changes in Net Assets
| | Year ended January 31, 2017 | Year ended January 31, 2016 |
| Increase (Decrease) in Net Assets | | |
| Operations | | |
| Net investment income (loss) | $10,128,754 | $8,985,831 |
| Net realized gain (loss) | 17,767,737 | 73,907,820 |
| Change in net unrealized appreciation (depreciation) | 125,318,189 | (115,833,041) |
| Net increase (decrease) in net assets resulting from operations | 153,214,680 | (32,939,390) |
| Distributions to shareholders from net investment income | (9,868,427) | (9,078,643) |
| Share transactions - net increase (decrease) | (69,523,371) | (83,813,071) |
| Total increase (decrease) in net assets | 73,822,882 | (125,831,104) |
| Net Assets | | |
| Beginning of period | 693,731,948 | 819,563,052 |
| End of period | $767,554,830 | $693,731,948 |
| Other Information | | |
| Undistributed net investment income end of period | $194,495 | $– |
| Distributions in excess of net investment income end of period | $– | $(34,636) |
See accompanying notes which are an integral part of the financial statements.
Financial Highlights — Fidelity Stock Selector Large Cap Value Fund Class A
| Years ended January 31, | 2017 | 2016 | 2015 | 2014 | 2013 |
| Selected Per–Share Data | | | | | |
| Net asset value, beginning of period | $15.37 | $16.41 | $14.72 | $12.43 | $10.71 |
| Income from Investment Operations | | | | | |
| Net investment income (loss)A | .19 | .15 | .15 | .13 | .20 |
| Net realized and unrealized gain (loss) | 3.27 | (1.03) | 1.65 | 2.35 | 1.73 |
| Total from investment operations | 3.46 | (.88) | 1.80 | 2.48 | 1.93 |
| Distributions from net investment income | (.20) | (.16) | (.11) | (.15) | (.21) |
| Distributions from net realized gain | – | – | – | (.05) | – |
| Total distributions | (.20) | (.16) | (.11) | (.19)B | (.21) |
| Net asset value, end of period | $18.63 | $15.37 | $16.41 | $14.72 | $12.43 |
| Total ReturnC,D | 22.48% | (5.40)% | 12.25% | 20.01% | 18.15% |
| Ratios to Average Net AssetsE,F | | | | | |
| Expenses before reductions | 1.05% | 1.10% | 1.07% | 1.00% | .87% |
| Expenses net of fee waivers, if any | 1.05% | 1.10% | 1.07% | 1.00% | .87% |
| Expenses net of all reductions | 1.05% | 1.09% | 1.07% | 1.00% | .85% |
| Net investment income (loss) | 1.10% | .90% | .94% | .95% | 1.74% |
| Supplemental Data | | | | | |
| Net assets, end of period (000 omitted) | $31,054 | $24,201 | $26,536 | $21,266 | $18,234 |
| Portfolio turnover rateG | 51% | 67% | 60% | 64% | 63% |
A Calculated based on average shares outstanding during the period.
B Total distributions of $.19 per share is comprised of distributions from net investment income of $.147 and distributions from net realized gain of $.047 per share.
C Total returns would have been lower if certain expenses had not been reduced during the applicable periods shown.
D Total returns do not include the effect of the sales charges.
E Fees and expenses of any underlying Fidelity Central Funds are not included in the Fund's expense ratio. The Fund indirectly bears its proportionate share of the expenses of any underlying Fidelity Central Funds.
F Expense ratios reflect operating expenses of the class. Expenses before reductions do not reflect amounts reimbursed by the investment adviser or reductions from brokerage service arrangements or reductions from other expense offset arrangements and do not represent the amount paid by the class during periods when reimbursements or reductions occur. Expenses net of fee waivers reflect expenses after reimbursement by the investment adviser but prior to reductions from brokerage service arrangements or other expense offset arrangements. Expenses net of all reductions represent the net expenses paid by the class.
G Amount does not include the portfolio activity of any underlying Fidelity Central Funds.
See accompanying notes which are an integral part of the financial statements.
Financial Highlights — Fidelity Stock Selector Large Cap Value Fund Class T
| Years ended January 31, | 2017 | 2016 | 2015 | 2014 | 2013 |
| Selected Per–Share Data | | | | | |
| Net asset value, beginning of period | $15.36 | $16.40 | $14.71 | $12.44 | $10.72 |
| Income from Investment Operations | | | | | |
| Net investment income (loss)A | .13 | .10 | .10 | .09 | .17 |
| Net realized and unrealized gain (loss) | 3.26 | (1.03) | 1.66 | 2.34 | 1.73 |
| Total from investment operations | 3.39 | (.93) | 1.76 | 2.43 | 1.90 |
| Distributions from net investment income | (.14) | (.11) | (.07) | (.11) | (.18) |
| Distributions from net realized gain | – | – | – | (.05) | – |
| Total distributions | (.14) | (.11) | (.07) | (.16) | (.18) |
| Net asset value, end of period | $18.61 | $15.36 | $16.40 | $14.71 | $12.44 |
| Total ReturnB,C | 22.04% | (5.71)% | 11.95% | 19.54% | 17.88% |
| Ratios to Average Net AssetsD,E | | | | | |
| Expenses before reductions | 1.39% | 1.42% | 1.39% | 1.32% | 1.14% |
| Expenses net of fee waivers, if any | 1.39% | 1.42% | 1.39% | 1.32% | 1.14% |
| Expenses net of all reductions | 1.39% | 1.41% | 1.39% | 1.31% | 1.12% |
| Net investment income (loss) | .76% | .58% | .62% | .63% | 1.48% |
| Supplemental Data | | | | | |
| Net assets, end of period (000 omitted) | $10,704 | $9,515 | $10,469 | $8,244 | $6,544 |
| Portfolio turnover rateF | 51% | 67% | 60% | 64% | 63% |
A Calculated based on average shares outstanding during the period.
B Total returns would have been lower if certain expenses had not been reduced during the applicable periods shown.
C Total returns do not include the effect of the sales charges.
D Fees and expenses of any underlying Fidelity Central Funds are not included in the Fund's expense ratio. The Fund indirectly bears its proportionate share of the expenses of any underlying Fidelity Central Funds.
E Expense ratios reflect operating expenses of the class. Expenses before reductions do not reflect amounts reimbursed by the investment adviser or reductions from brokerage service arrangements or reductions from other expense offset arrangements and do not represent the amount paid by the class during periods when reimbursements or reductions occur. Expenses net of fee waivers reflect expenses after reimbursement by the investment adviser but prior to reductions from brokerage service arrangements or other expense offset arrangements. Expenses net of all reductions represent the net expenses paid by the class.
F Amount does not include the portfolio activity of any underlying Fidelity Central Funds.
See accompanying notes which are an integral part of the financial statements.
Financial Highlights — Fidelity Stock Selector Large Cap Value Fund Class C
| Years ended January 31, | 2017 | 2016 | 2015 | 2014 | 2013 |
| Selected Per–Share Data | | | | | |
| Net asset value, beginning of period | $15.09 | $16.18 | $14.53 | $12.30 | $10.61 |
| Income from Investment Operations | | | | | |
| Net investment income (loss)A | .05 | .01 | .02 | .02 | .11 |
| Net realized and unrealized gain (loss) | 3.18 | (1.00) | 1.63 | 2.31 | 1.72 |
| Total from investment operations | 3.23 | (.99) | 1.65 | 2.33 | 1.83 |
| Distributions from net investment income | (.07) | (.10) | – | (.05) | (.14) |
| Distributions from net realized gain | – | – | – | (.05) | – |
| Total distributions | (.07) | (.10) | – | (.10) | (.14) |
| Net asset value, end of period | $18.25 | $15.09 | $16.18 | $14.53 | $12.30 |
| Total ReturnB,C | 21.43% | (6.13)% | 11.36% | 18.94% | 17.32% |
| Ratios to Average Net AssetsD,E | | | | | |
| Expenses before reductions | 1.88% | 1.93% | 1.89% | 1.81% | 1.63% |
| Expenses net of fee waivers, if any | 1.88% | 1.93% | 1.89% | 1.80% | 1.63% |
| Expenses net of all reductions | 1.87% | 1.93% | 1.89% | 1.80% | 1.61% |
| Net investment income (loss) | .27% | .07% | .12% | .14% | .99% |
| Supplemental Data | | | | | |
| Net assets, end of period (000 omitted) | $10,802 | $8,956 | $10,118 | $7,789 | $5,839 |
| Portfolio turnover rateF | 51% | 67% | 60% | 64% | 63% |
A Calculated based on average shares outstanding during the period.
B Total returns would have been lower if certain expenses had not been reduced during the applicable periods shown.
C Total returns do not include the effect of the contingent deferred sales charge.
D Fees and expenses of any underlying Fidelity Central Funds are not included in the Fund's expense ratio. The Fund indirectly bears its proportionate share of the expenses of any underlying Fidelity Central Funds.
E Expense ratios reflect operating expenses of the class. Expenses before reductions do not reflect amounts reimbursed by the investment adviser or reductions from brokerage service arrangements or reductions from other expense offset arrangements and do not represent the amount paid by the class during periods when reimbursements or reductions occur. Expenses net of fee waivers reflect expenses after reimbursement by the investment adviser but prior to reductions from brokerage service arrangements or other expense offset arrangements. Expenses net of all reductions represent the net expenses paid by the class.
F Amount does not include the portfolio activity of any underlying Fidelity Central Funds.
See accompanying notes which are an integral part of the financial statements.
Financial Highlights — Fidelity Stock Selector Large Cap Value Fund
| Years ended January 31, | 2017 | 2016 | 2015 | 2014 | 2013 |
| Selected Per–Share Data | | | | | |
| Net asset value, beginning of period | $15.47 | $16.51 | $14.81 | $12.51 | $10.77 |
| Income from Investment Operations | | | | | |
| Net investment income (loss)A | .24 | .20 | .20 | .17 | .23 |
| Net realized and unrealized gain (loss) | 3.29 | (1.03) | 1.66 | 2.37 | 1.75 |
| Total from investment operations | 3.53 | (.83) | 1.86 | 2.54 | 1.98 |
| Distributions from net investment income | (.24) | (.21) | (.16) | (.19) | (.24) |
| Distributions from net realized gain | – | – | – | (.05) | – |
| Total distributions | (.24) | (.21) | (.16) | (.24) | (.24) |
| Net asset value, end of period | $18.76 | $15.47 | $16.51 | $14.81 | $12.51 |
| Total ReturnB | 22.82% | (5.10)% | 12.54% | 20.31% | 18.55% |
| Ratios to Average Net AssetsC,D | | | | | |
| Expenses before reductions | .77% | .81% | .78% | .72% | .57% |
| Expenses net of fee waivers, if any | .77% | .81% | .78% | .72% | .57% |
| Expenses net of all reductions | .76% | .80% | .78% | .71% | .55% |
| Net investment income (loss) | 1.38% | 1.19% | 1.23% | 1.23% | 2.05% |
| Supplemental Data | | | | | |
| Net assets, end of period (000 omitted) | $703,722 | $644,182 | $761,542 | $518,206 | $465,702 |
| Portfolio turnover rateE | 51% | 67% | 60% | 64% | 63% |
A Calculated based on average shares outstanding during the period.
B Total returns would have been lower if certain expenses had not been reduced during the applicable periods shown.
C Fees and expenses of any underlying Fidelity Central Funds are not included in the Fund's expense ratio. The Fund indirectly bears its proportionate share of the expenses of any underlying Fidelity Central Funds.
D Expense ratios reflect operating expenses of the class. Expenses before reductions do not reflect amounts reimbursed by the investment adviser or reductions from brokerage service arrangements or reductions from other expense offset arrangements and do not represent the amount paid by the class during periods when reimbursements or reductions occur. Expenses net of fee waivers reflect expenses after reimbursement by the investment adviser but prior to reductions from brokerage service arrangements or other expense offset arrangements. Expenses net of all reductions represent the net expenses paid by the class.
E Amount does not include the portfolio activity of any underlying Fidelity Central Funds.
See accompanying notes which are an integral part of the financial statements.
Financial Highlights — Fidelity Stock Selector Large Cap Value Fund Class I
| Years ended January 31, | 2017 | 2016 | 2015 | 2014 | 2013 |
| Selected Per–Share Data | | | | | |
| Net asset value, beginning of period | $15.40 | $16.44 | $14.74 | $12.46 | $10.74 |
| Income from Investment Operations | | | | | |
| Net investment income (loss)A | .23 | .20 | .20 | .17 | .23 |
| Net realized and unrealized gain (loss) | 3.27 | (1.04) | 1.66 | 2.35 | 1.73 |
| Total from investment operations | 3.50 | (.84) | 1.86 | 2.52 | 1.96 |
| Distributions from net investment income | (.24) | (.20) | (.16) | (.19) | (.24) |
| Distributions from net realized gain | – | – | – | (.05) | – |
| Total distributions | (.24) | (.20) | (.16) | (.24) | (.24) |
| Net asset value, end of period | $18.66 | $15.40 | $16.44 | $14.74 | $12.46 |
| Total ReturnB | 22.72% | (5.14)% | 12.58% | 20.25% | 18.42% |
| Ratios to Average Net AssetsC,D | | | | | |
| Expenses before reductions | .84% | .82% | .81% | .73% | .61% |
| Expenses net of fee waivers, if any | .84% | .82% | .81% | .73% | .61% |
| Expenses net of all reductions | .84% | .81% | .81% | .73% | .58% |
| Net investment income (loss) | 1.30% | 1.18% | 1.20% | 1.22% | 2.01% |
| Supplemental Data | | | | | |
| Net assets, end of period (000 omitted) | $11,273 | $6,164 | $9,544 | $3,881 | $1,995 |
| Portfolio turnover rateE | 51% | 67% | 60% | 64% | 63% |
A Calculated based on average shares outstanding during the period.
B Total returns would have been lower if certain expenses had not been reduced during the applicable periods shown.
C Fees and expenses of any underlying Fidelity Central Funds are not included in the Fund's expense ratio. The Fund indirectly bears its proportionate share of the expenses of any underlying Fidelity Central Funds.
D Expense ratios reflect operating expenses of the class. Expenses before reductions do not reflect amounts reimbursed by the investment adviser or reductions from brokerage service arrangements or reductions from other expense offset arrangements and do not represent the amount paid by the class during periods when reimbursements or reductions occur. Expenses net of fee waivers reflect expenses after reimbursement by the investment adviser but prior to reductions from brokerage service arrangements or other expense offset arrangements. Expenses net of all reductions represent the net expenses paid by the class.
E Amount does not include the portfolio activity of any underlying Fidelity Central Funds.
See accompanying notes which are an integral part of the financial statements.
Notes to Financial Statements
For the period ended January 31, 2017
1. Organization.
Fidelity Stock Selector Large Cap Value Fund (the Fund) is a fund of Fidelity Devonshire Trust (the Trust) and is authorized to issue an unlimited number of shares. The Trust is registered under the Investment Company Act of 1940, as amended (the 1940 Act), as an open-end management investment company organized as a Massachusetts business trust. The Fund offers Class A, Class T, Class C, Stock Selector Large Cap Value and Class I shares, each of which has equal rights as to assets and voting privileges. Each class has exclusive voting rights with respect to matters that affect that class.
After the close of business on June 24, 2016, all outstanding Class B shares were converted to Class A shares. All current fiscal period dollar and share amounts for Class B presented in the Notes to Financial Statements are for the period February 1, 2016 through June 24, 2016.
In March 2017 the Board of Trustees approved a change in the name of Class T to Class M effective after the close of business on March 24, 2017.
2. Investments in Fidelity Central Funds.
The Fund may invest in Fidelity Central Funds, which are open-end investment companies generally available only to other investment companies and accounts managed by the investment adviser and its affiliates. The Fund's Schedule of Investments lists each of the Fidelity Central Funds held as of period end, if any, as an investment of the Fund, but does not include the underlying holdings of each Fidelity Central Fund. As an Investing Fund, the Fund indirectly bears its proportionate share of the expenses of the underlying Fidelity Central Funds.
The Money Market Central Funds seek preservation of capital and current income and are managed by Fidelity Investments Money Management, Inc. (FIMM), an affiliate of the investment adviser. Annualized expenses of the Money Market Central Funds as of their most recent shareholder report date are less than .005%.
A complete unaudited list of holdings for each Fidelity Central Fund is available upon request or at the Securities and Exchange Commission (the SEC) website at www.sec.gov. In addition, the financial statements of the Fidelity Central Funds, which are not covered by the Fund's Report of Independent Registered Public Accounting Firm, are available on the SEC website or upon request.
3. Significant Accounting Policies.
The financial statements have been prepared in conformity with accounting principles generally accepted in the United States of America (GAAP), which require management to make certain estimates and assumptions at the date of the financial statements. Actual results could differ from those estimates. Subsequent events, if any, through the date that the financial statements were issued have been evaluated in the preparation of the financial statements. The following summarizes the significant accounting policies of the Fund:
Investment Valuation. Investments are valued as of 4:00 p.m. Eastern time on the last calendar day of the period. The Board of Trustees (the Board) has delegated the day to day responsibility for the valuation of the Fund's investments to the Fair Value Committee (the Committee) established by the Fund's investment adviser. In accordance with valuation policies and procedures approved by the Board, the Fund attempts to obtain prices from one or more third party pricing vendors or brokers to value its investments. When current market prices, quotations or currency exchange rates are not readily available or reliable, investments will be fair valued in good faith by the Committee, in accordance with procedures adopted by the Board. Factors used in determining fair value vary by investment type and may include market or investment specific events, changes in interest rates and credit quality. The frequency with which these procedures are used cannot be predicted and they may be utilized to a significant extent. The Committee oversees the Fund's valuation policies and procedures and reports to the Board on the Committee's activities and fair value determinations. The Board monitors the appropriateness of the procedures used in valuing the Fund's investments and ratifies the fair value determinations of the Committee.
The Fund categorizes the inputs to valuation techniques used to value its investments into a disclosure hierarchy consisting of three levels as shown below:
- Level 1 – quoted prices in active markets for identical investments
- Level 2 – other significant observable inputs (including quoted prices for similar investments, interest rates, prepayment speeds, etc.)
- Level 3 – unobservable inputs (including the Fund's own assumptions based on the best information available)
Valuation techniques used to value the Fund's investments by major category are as follows:
Equity securities, including restricted securities, for which market quotations are readily available, are valued at the last reported sale price or official closing price as reported by a third party pricing vendor on the primary market or exchange on which they are traded and are categorized as Level 1 in the hierarchy. In the event there were no sales during the day or closing prices are not available, securities are valued at the last quoted bid price or may be valued using the last available price and are generally categorized as Level 2 in the hierarchy. For foreign equity securities, when market or security specific events arise, comparisons to the valuation of American Depositary Receipts (ADRs), futures contracts, Exchange-Traded Funds (ETFs) and certain indexes as well as quoted prices for similar securities may be used and would be categorized as Level 2 in the hierarchy. Utilizing these techniques may result in transfers between Level 1 and Level 2. For equity securities, including restricted securities, where observable inputs are limited, assumptions about market activity and risk are used and these securities may be categorized as Level 3 in the hierarchy.
Debt securities, including restricted securities, are valued based on evaluated prices received from third party pricing vendors or from brokers who make markets in such securities. U.S. government and government agency obligations are valued by pricing vendors who utilize matrix pricing which considers yield or price of bonds of comparable quality, coupon, maturity and type or by broker-supplied prices. When independent prices are unavailable or unreliable, debt securities may be valued utilizing pricing methodologies which consider similar factors that would be used by third party pricing vendors. Debt securities are generally categorized as Level 2 in the hierarchy but may be Level 3 depending on the circumstances.
Investments in open-end mutual funds, including Fidelity Central Funds, are valued at their closing net asset value (NAV) each business day and are categorized as Level 1 in the hierarchy. Changes in valuation techniques may result in transfers in or out of an assigned level within the disclosure hierarchy. The aggregate value of investments by input level as of January 31, 2017 is included at the end of the Fund's Schedule of Investments.
Foreign Currency. The Fund may use foreign currency contracts to facilitate transactions in foreign-denominated securities. Gains and losses from these transactions may arise from changes in the value of the foreign currency or if the counterparties do not perform under the contracts' terms.
Foreign-denominated assets, including investment securities, and liabilities are translated into U.S. dollars at the exchange rates at period end. Purchases and sales of investment securities, income and dividends received and expenses denominated in foreign currencies are translated into U.S. dollars at the exchange rate in effect on the transaction date.
The effects of exchange rate fluctuations on investments are included with the net realized and unrealized gain (loss) on investment securities. Other foreign currency transactions resulting in realized and unrealized gain (loss) are disclosed separately.
Investment Transactions and Income. For financial reporting purposes, the Fund's investment holdings and NAV include trades executed through the end of the last business day of the period. The NAV per share for processing shareholder transactions is calculated as of the close of business of the New York Stock Exchange (NYSE), normally 4:00 p.m. Eastern time and includes trades executed through the end of the prior business day. Gains and losses on securities sold are determined on the basis of identified cost and may include proceeds received from litigation. Dividend income is recorded on the ex-dividend date, except for certain dividends from foreign securities where the ex-dividend date may have passed, which are recorded as soon as the Fund is informed of the ex-dividend date. Non-cash dividends included in dividend income, if any, are recorded at the fair market value of the securities received. Income and capital gain distributions from Fidelity Central Funds, if any, are recorded on the ex-dividend date. Certain distributions received by the Fund represent a return of capital or capital gain. The Fund determines the components of these distributions subsequent to the ex-dividend date, based upon receipt of tax filings or other correspondence relating to the underlying investment. These distributions are recorded as a reduction of cost of investments and/or as a realized gain. Interest income is accrued as earned and includes coupon interest and amortization of premium and accretion of discount on debt securities as applicable. Investment income is recorded net of foreign taxes withheld where recovery of such taxes is uncertain.
Class Allocations and Expenses. Investment income, realized and unrealized capital gains and losses, common expenses of the Fund, and certain fund-level expense reductions, if any, are allocated daily on a pro-rata basis to each class based on the relative net assets of each class to the total net assets of the Fund. Each class differs with respect to transfer agent and distribution and service plan fees incurred. Certain expense reductions may also differ by class. For the reporting period, the allocated portion of income and expenses to each class as a percent of its average net assets may vary due to the timing of recording these transactions in relation to fluctuating net assets of the classes. Expenses directly attributable to a fund are charged to that fund. Expenses attributable to more than one fund are allocated among the respective funds on the basis of relative net assets or other appropriate methods. Expense estimates are accrued in the period to which they relate and adjustments are made when actual amounts are known.
Income Tax Information and Distributions to Shareholders. Each year, the Fund intends to qualify as a regulated investment company under Subchapter M of the Internal Revenue Code, including distributing substantially all of its taxable income and realized gains. As a result, no provision for U.S. Federal income taxes is required. As of January 31, 2017, the Fund did not have any unrecognized tax benefits in the financial statements; nor is the Fund aware of any tax positions for which it is reasonably possible that the total amounts of unrecognized tax benefits will significantly change in the next twelve months. The Fund files a U.S. federal tax return, in addition to state and local tax returns as required. The Fund's federal income tax returns are subject to examination by the Internal Revenue Service (IRS) for a period of three fiscal years after they are filed. State and local tax returns may be subject to examination for an additional fiscal year depending on the jurisdiction. Foreign taxes are provided for based on the Fund's understanding of the tax rules and rates that exist in the foreign markets in which it invests.
Distributions are declared and recorded on the ex-dividend date. Income dividends and capital gain distributions are declared separately for each class. Income and capital gain distributions are determined in accordance with income tax regulations, which may differ from GAAP.
Capital accounts within the financial statements are adjusted for permanent book-tax differences. These adjustments have no impact on net assets or the results of operations. Capital accounts are not adjusted for temporary book-tax differences which will reverse in a subsequent period.
Book-tax differences are primarily due to market discount, futures contracts, foreign currency transactions, partnerships, capital loss carryforwards, and losses deferred due to wash sales and excise tax regulations.
The federal tax cost of investment securities and unrealized appreciation (depreciation) as of period end were as follows:
| Gross unrealized appreciation | $101,933,741 |
| Gross unrealized depreciation | (27,071,614) |
| Net unrealized appreciation (depreciation) on securities | $74,862,127 |
| Tax Cost | $706,132,002 |
The tax-based components of distributable earnings as of period end were as follows:
| Undistributed ordinary income | $194,206 |
| Capital loss carryforward | $(138,860,952) |
| Net unrealized appreciation (depreciation) on securities and other investments | $74,862,400 |
Capital loss carryforwards are only available to offset future capital gains of the Fund to the extent provided by regulations and may be limited. Under the Regulated Investment Company Modernization Act of 2010 (the Act), the Fund is permitted to carry forward capital losses incurred in taxable years beginning after December 22, 2010 for an unlimited period and such capital losses are required to be used prior to any losses that expire. The capital loss carryforward information presented below, including any applicable limitation, is estimated as of fiscal period end and is subject to adjustment.
| Fiscal year of expiration | |
| 2018 | $(138,860,952) |
The tax character of distributions paid was as follows:
| | January 31, 2017 | January 31, 2016 |
| Ordinary Income | $9,868,427 | $ 9,078,643 |
4. Derivative Instruments.
Risk Exposures and the Use of Derivative Instruments. The Fund's investment objective allows the Fund to enter into various types of derivative contracts, including futures contracts. Derivatives are investments whose value is primarily derived from underlying assets, indices or reference rates and may be transacted on an exchange or over-the-counter (OTC). Derivatives may involve a future commitment to buy or sell a specified asset based on specified terms, to exchange future cash flows at periodic intervals based on a notional principal amount, or for one party to make one or more payments upon the occurrence of specified events in exchange for periodic payments from the other party.
The Fund used derivatives to increase returns and to manage exposure to certain risks as defined below. The success of any strategy involving derivatives depends on analysis of numerous economic factors, and if the strategies for investment do not work as intended, the Fund may not achieve its objectives.
The Fund's use of derivatives increased or decreased its exposure to the following risk:
| Equity Risk | Equity risk relates to the fluctuations in the value of financial instruments as a result of changes in market prices (other than those arising from interest rate risk or foreign exchange risk), whether caused by factors specific to an individual investment, its issuer, or all factors affecting all instruments traded in a market or market segment.
|
The Fund is also exposed to additional risks from investing in derivatives, such as liquidity risk and counterparty credit risk. Liquidity risk is the risk that the Fund will be unable to close out the derivative in the open market in a timely manner. Counterparty credit risk is the risk that the counterparty will not be able to fulfill its obligation to the Fund. Counterparty credit risk related to exchange-traded futures contracts may be mitigated by the protection provided by the on which they trade.
Investing in derivatives may involve greater risks than investing in the underlying assets directly and, to varying degrees, may involve risk of loss in excess of any initial investment and collateral received and amounts recognized in the Statement of Assets and Liabilities. In addition, there may be the risk that the change in value of the derivative contract does not correspond to the change in value of the underlying instrument.
Futures Contracts. A futures contract is an agreement between two parties to buy or sell a specified underlying instrument for a fixed price at a specified future date. The Fund used futures contracts to manage its exposure to the stock market.
Upon entering into a futures contract, a fund is required to deposit either cash or securities (initial margin) with a clearing broker in an amount equal to a certain percentage of the face value of the contract. Futures contracts are marked-to-market daily and subsequent daily payments (variation margin) are made or received by a fund depending on the daily fluctuations in the value of the futures contracts and are recorded as unrealized appreciation or (depreciation). This receivable and/or payable, if any, is included in daily variation margin for derivative instruments in the Statement of Assets and Liabilities. Realized gain or (loss) is recorded upon the expiration or closing of a futures contract.
Any open futures contracts at period end are presented in the Schedule of Investments under the caption "Futures Contracts". The underlying face amount at value reflects each contract's exposure to the underlying instrument or index at period end.
During the period the Fund recognized net realized gain (loss) of $2,161,166 and a change in net unrealized appreciation (depreciation) of $(192,091) related to its investment in futures contracts. These amounts are included in the Statement of Operations.
5. Purchases and Sales of Investments.
Purchases and sales of securities, other than short-term securities, aggregated $369,092,321 and $411,698,454, respectively.
6. Fees and Other Transactions with Affiliates.
Management Fee. Fidelity Management & Research Company (the investment adviser) and its affiliates provide the Fund with investment management related services for which the Fund pays a monthly management fee. The management fee is the sum of an individual fund fee rate that is based on an annual rate of .30% of the Fund's average net assets and an annualized group fee rate that averaged .25% during the period. The group fee rate is based upon the average net assets of all the mutual funds advised by the investment adviser, including any mutual funds previously advised by the investment adviser that are currently advised by Fidelity SelectCo, LLC, an affiliate of the investment adviser. The group fee rate decreases as assets under management increase and increases as assets under management decrease. In addition, the management fee is subject to a performance adjustment (up to a maximum of +/- .20% of the Fund's average net assets over a 36 month performance period). The upward or downward adjustment to the management fee is based on the relative investment performance of Stock Selector Large Cap Value as compared to its benchmark index, the Russell 1000 Value Index, over the same 36 month performance period. For the reporting period, the total annual management fee rate, including the performance adjustment, was .52% of the Fund's average net assets. The performance adjustment included in the management fee rate may be higher or lower than the maximum performance adjustment rate due to the difference between the average net assets for the reporting and performance periods.
Distribution and Service Plan Fees. In accordance with Rule 12b-1 of the 1940 Act, the Fund has adopted separate Distribution and Service Plans for each class of shares. Certain classes pay Fidelity Distributors Corporation (FDC), an affiliate of the investment adviser, separate Distribution and Service Fees, each of which is based on an annual percentage of each class' average net assets. In addition, FDC may pay financial intermediaries for selling shares of the Fund and providing shareholder support services. For the period, the Distribution and Service Fee rates, total fees and amounts retained by FDC were as follows:
| | Distribution
Fee | Service
Fee | Total Fees | Retained
by FDC |
| Class A | -% | .25% | $68,974 | $671 |
| Class T | .25% | .25% | 52,536 | – |
| Class B | .75% | .25% | 2,497 | 1,873 |
| Class C | .75% | .25% | 98,064 | 13,416 |
| | | | $222,071 | $15,960 |
Sales Load. FDC may receive a front-end sales charge of up to 5.75% for selling Class A shares and 3.50% for selling Class T shares, some of which is paid to financial intermediaries for selling shares of the Fund. Depending on the holding period, FDC may receive contingent deferred sales charges levied on Class A, Class T, Class B and Class C redemptions. The deferred sales charges range from 5.00% to 1.00% for Class B shares, 1.00% for Class C shares, 1.00% for certain purchases of Class A shares and .25% for certain purchases of Class T shares.
For the period, sales charge amounts retained by FDC were as follows:
| | Retained
by FDC |
| Class A | $13,712 |
| Class T | 2,269 |
| Class B(a) | 16 |
| Class C(a) | 2,517 |
| | $18,514 |
(a) When Class B and Class C shares are initially sold, FDC pays commissions from its own resources to financial intermediaries through which the sales are made.
Transfer Agent Fees. Fidelity Investments Institutional Operations Company, Inc., (FIIOC), an affiliate of the investment adviser, is the transfer, dividend disbursing and shareholder servicing agent for each class of the Fund. FIIOC receives account fees and asset-based fees that vary according to the account size and type of account of the shareholders of the respective classes of the Fund. FIIOC pays for typesetting, printing and mailing of shareholder reports, except proxy statements.
For the period, transfer agent fees for each class were as follows:
| | Amount | % of
Class-Level Average
Net Assets |
| Class A | $59,828 | .22 |
| Class T | 32,302 | .31 |
| Class B | 638 | .26 |
| Class C | 29,122 | .30 |
| Stock Selector Large Cap Value | 1,279,802 | .18 |
| Class I | 21,123 | .26 |
| | $1,422,815 | |
Accounting and Security Lending Fees. Fidelity Service Company, Inc. (FSC), an affiliate of the investment adviser, maintains the Fund's accounting records. The accounting fee is based on the level of average net assets for each month. Under a separate contract, FSC administers the security lending program. The security lending fee is based on the number and duration of lending transactions.
Brokerage Commissions. The Fund placed a portion of its portfolio transactions with brokerage firms which are affiliates of the investment adviser. Brokerage commissions are included in net realized gain (loss) and change in net unrealized appreciation (depreciation) in the Statement of Operations. The commissions paid to these affiliated firms were $12,141 for the period.
Interfund Trades. The Fund may purchase from or sell securities to other Fidelity Funds under procedures adopted by the Board. The procedures have been designed to ensure these interfund trades are executed in accordance with Rule 17a-7 of the 1940 Act. Interfund trades are included within the respective purchases and sales amounts shown in the Purchases and Sales of Investments note.
7. Committed Line of Credit.
The Fund participates with other funds managed by the investment adviser or an affiliate in a $4.25 billion credit facility (the "line of credit") to be utilized for temporary or emergency purposes to fund shareholder redemptions or for other short-term liquidity purposes. The Fund has agreed to pay commitment fees on its pro-rata portion of the line of credit, which amounted to $2,267 and is reflected in Miscellaneous expenses on the Statement of Operations. During the period, the Fund did not borrow on this line of credit.
8. Security Lending.
The Fund lends portfolio securities through a lending agent from time to time in order to earn additional income. For equity securities, a lending agent is used and may loan securities to certain qualified borrowers, including Fidelity Capital Markets (FCM), a broker-dealer affiliated with the Fund. On the settlement date of the loan, the Fund receives collateral (in the form of U.S. Treasury obligations, letters of credit and/or cash) against the loaned securities and maintains collateral in an amount not less than 100% of the market value of the loaned securities during the period of the loan. The market value of the loaned securities is determined at the close of business of the Fund and any additional required collateral is delivered to the Fund on the next business day. The Fund or borrower may terminate the loan at any time, and if the borrower defaults on its obligation to return the securities loaned because of insolvency or other reasons, the Fund may apply collateral received from the borrower against the obligation. The Fund may experience delays and costs in recovering the securities loaned. Any cash collateral received is invested in the Fidelity Securities Lending Cash Central Fund. The value of loaned securities and cash collateral at period end are disclosed on the Fund's Statement of Assets and Liabilities. Security lending income represents the income earned on investing cash collateral, less rebates paid to borrowers and any lending agent fees associated with the loan, plus any premium payments received for lending certain types of securities. Security lending income is presented in the Statement of Operations as a component of income from Fidelity Central Funds. Total security lending income during the period amounted to $94,253, including $9,201 from securities loaned to FCM. During the period, there were no securities loaned to FCM.
9. Expense Reductions.
Commissions paid to certain brokers with whom the investment adviser, or its affiliates, places trades on behalf of the Fund include an amount in addition to trade execution, which may be rebated back to the Fund to offset certain expenses. This amount totaled $21,851 for the period.
In addition, during the period the investment adviser reimbursed and/or waived a portion of fund-level operating expenses in the amount of $6,250.
10. Distributions to Shareholders.
Distributions to shareholders of each class were as follows:
| | Year ended
January 31, 2017 | Year ended January 31, 2016 |
| From net investment income | | |
| Class A | $311,950 | $247,938 |
| Class T | 78,380 | 66,187 |
| Class C | 43,306 | 100,122 |
| Stock Selector Large Cap Value | 9,290,473 | 8,576,233 |
| Class I | 144,318 | 88,163 |
| Total | $9,868,427 | $9,078,643 |
11. Share Transactions.
Share transactions for each class were as follows and may contain automatic conversions between classes or exchanges between affiliated funds:
| | Shares | Shares | Dollars | Dollars |
| | Year ended January 31, 2017 | Year ended January 31, 2016 | Year ended January 31, 2017 | Year ended January 31, 2016 |
| Class A | | | | |
| Shares sold | 569,952 | 331,048 | $9,932,134 | $5,512,197 |
| Reinvestment of distributions | 15,663 | 14,824 | 292,587 | 235,407 |
| Shares redeemed | (492,854) | (389,058) | (8,537,525) | (6,510,850) |
| Net increase (decrease) | 92,761 | (43,186) | $1,687,196 | $(763,246) |
| Class T | | | | |
| Shares sold | 126,680 | 98,719 | $2,167,151 | $1,650,938 |
| Reinvestment of distributions | 4,151 | 4,138 | 77,494 | 65,711 |
| Shares redeemed | (175,085) | (122,073) | (3,030,158) | (2,032,878) |
| Net increase (decrease) | (44,254) | (19,216) | $(785,513) | $(316,229) |
| Class B | | | | |
| Shares sold | 1,059 | – | $17,571 | $2 |
| Shares redeemed | (47,495) | (36,212) | (785,079) | (608,112) |
| Net increase (decrease) | (46,436) | (36,212) | $(767,508) | $(608,110) |
| Class C | | | | |
| Shares sold | 170,423 | 627,414 | $2,904,730 | $10,101,962 |
| Reinvestment of distributions | 2,230 | 6,075 | 40,853 | 94,778 |
| Shares redeemed | (174,329) | (665,157) | (2,952,260) | (10,105,437) |
| Net increase (decrease) | (1,676) | (31,668) | $(6,677) | $91,303 |
| Stock Selector Large Cap Value | | | | |
| Shares sold | 6,066,305 | 8,102,341 | $105,307,511 | $135,383,965 |
| Reinvestment of distributions | 481,523 | 523,476 | 9,052,639 | 8,373,276 |
| Shares redeemed | (10,670,867) | (13,116,688) | (187,755,649) | (222,880,353) |
| Net increase (decrease) | (4,123,039) | (4,490,871) | $(73,395,499) | $(79,123,112) |
| Class I | | | | |
| Shares sold | 520,730 | 142,790 | $9,225,865 | $2,313,025 |
| Reinvestment of distributions | 2,892 | 5,311 | 54,106 | 84,600 |
| Shares redeemed | (319,842) | (328,617) | (5,535,341) | (5,491,302) |
| Net increase (decrease) | 203,780 | (180,516) | $3,744,630 | $(3,093,677) |
12. Other.
The Fund's organizational documents provide former and current trustees and officers with a limited indemnification against liabilities arising in connection with the performance of their duties to the Fund. In the normal course of business, the Fund may also enter into contracts that provide general indemnifications. The Fund's maximum exposure under these arrangements is unknown as this would be dependent on future claims that may be made against the Fund. The risk of material loss from such claims is considered remote.
At the end of the period, VIP FundsManager 50% Portfolio was the owner of record of approximately 11% of the total outstanding shares of the Fund.
Report of Independent Registered Public Accounting Firm
To the Trustees of Fidelity Devonshire Trust and Shareholders of Fidelity Stock Selector Large Cap Value Fund:
In our opinion, the accompanying statement of assets and liabilities, including the schedule of investments, and the related statements of operations and of changes in net assets and the financial highlights present fairly, in all material respects, the financial position of Fidelity Stock Selector Large Cap Value Fund (a fund of Fidelity Devonshire Trust) as of January 31, 2017, the results of its operations for the year then ended, the changes in its net assets for each of the two years in the period then ended and the financial highlights for each of the five years in the period then ended, in conformity with accounting principles generally accepted in the United States of America. These financial statements and financial highlights (hereafter referred to as “financial statements”) are the responsibility of the Fidelity Stock Selector Large Cap Value Fund’s management. Our responsibility is to express an opinion on these financial statements based on our audits. We conducted our audits of these financial statements in accordance with the standards of the Public Company Accounting Oversight Board (United States). Those standards require that we plan and perform the audit to obtain reasonable assurance about whether the financial statements are free of material misstatement. An audit includes examining, on a test basis, evidence supporting the amounts and disclosures in the financial statements, assessing the accounting principles used and significant estimates made by management, and evaluating the overall financial statement presentation. We believe that our audits, which included confirmation of securities as of January 31, 2017 by correspondence with the custodian and brokers, provide a reasonable basis for our opinion.
PricewaterhouseCoopers LLP
Boston, Massachusetts
March 14, 2017
Trustees and Officers
The Trustees, Members of the Advisory Board (if any), and officers of the trust and fund, as applicable, are listed below. The Board of Trustees governs the fund and is responsible for protecting the interests of shareholders. The Trustees are experienced executives who meet periodically throughout the year to oversee the fund's activities, review contractual arrangements with companies that provide services to the fund, oversee management of the risks associated with such activities and contractual arrangements, and review the fund's performance. Each of the Trustees oversees 169 funds.
The Trustees hold office without limit in time except that (a) any Trustee may resign; (b) any Trustee may be removed by written instrument, signed by at least two-thirds of the number of Trustees prior to such removal; (c) any Trustee who requests to be retired or who has become incapacitated by illness or injury may be retired by written instrument signed by a majority of the other Trustees; and (d) any Trustee may be removed at any special meeting of shareholders by a two-thirds vote of the outstanding voting securities of the trust. Each Trustee who is not an interested person (as defined in the 1940 Act) of the trust and the fund is referred to herein as an Independent Trustee. Each Independent Trustee shall retire not later than the last day of the calendar year in which his or her 75th birthday occurs. The Independent Trustees may waive this mandatory retirement age policy with respect to individual Trustees. Officers and Advisory Board Members hold office without limit in time, except that any officer or Advisory Board Member may resign or may be removed by a vote of a majority of the Trustees at any regular meeting or any special meeting of the Trustees. Except as indicated, each individual has held the office shown or other offices in the same company for the past five years.
The fund’s Statement of Additional Information (SAI) includes more information about the Trustees. To request a free copy, call Fidelity at 1-800-544-8544.
Experience, Skills, Attributes, and Qualifications of the Trustees. The Governance and Nominating Committee has adopted a statement of policy that describes the experience, qualifications, attributes, and skills that are necessary and desirable for potential Independent Trustee candidates (Statement of Policy). The Board believes that each Trustee satisfied at the time he or she was initially elected or appointed a Trustee, and continues to satisfy, the standards contemplated by the Statement of Policy. The Governance and Nominating Committee also engages professional search firms to help identify potential Independent Trustee candidates who have the experience, qualifications, attributes, and skills consistent with the Statement of Policy. From time to time, additional criteria based on the composition and skills of the current Independent Trustees, as well as experience or skills that may be appropriate in light of future changes to board composition, business conditions, and regulatory or other developments, have also been considered by the professional search firms and the Governance and Nominating Committee. In addition, the Board takes into account the Trustees' commitment and participation in Board and committee meetings, as well as their leadership of standing and ad hoc committees throughout their tenure.
In determining that a particular Trustee was and continues to be qualified to serve as a Trustee, the Board has considered a variety of criteria, none of which, in isolation, was controlling. The Board believes that, collectively, the Trustees have balanced and diverse experience, qualifications, attributes, and skills, which allow the Board to operate effectively in governing the fund and protecting the interests of shareholders. Information about the specific experience, skills, attributes, and qualifications of each Trustee, which in each case led to the Board's conclusion that the Trustee should serve (or continue to serve) as a trustee of the fund, is provided below.
Board Structure and Oversight Function. James C. Curvey is an interested person and currently serves as Chairman. The Trustees have determined that an interested Chairman is appropriate and benefits shareholders because an interested Chairman has a personal and professional stake in the quality and continuity of services provided to the fund. Independent Trustees exercise their informed business judgment to appoint an individual of their choosing to serve as Chairman, regardless of whether the Trustee happens to be independent or a member of management. The Independent Trustees have determined that they can act independently and effectively without having an Independent Trustee serve as Chairman and that a key structural component for assuring that they are in a position to do so is for the Independent Trustees to constitute a substantial majority for the Board. The Independent Trustees also regularly meet in executive session. Ned C. Lautenbach serves as Chairman of the Independent Trustees and as such (i) acts as a liaison between the Independent Trustees and management with respect to matters important to the Independent Trustees and (ii) with management prepares agendas for Board meetings.
Fidelity® funds are overseen by different Boards of Trustees. The fund's Board oversees Fidelity's high income and certain equity funds, and other Boards oversee Fidelity's investment-grade bond, money market, asset allocation, and sector funds. The asset allocation funds may invest in Fidelity® funds overseen by the fund's Board. The use of separate Boards, each with its own committee structure, allows the Trustees of each group of Fidelity® funds to focus on the unique issues of the funds they oversee, including common research, investment, and operational issues. On occasion, the separate Boards establish joint committees to address issues of overlapping consequences for the Fidelity® funds overseen by each Board.
The Trustees operate using a system of committees to facilitate the timely and efficient consideration of all matters of importance to the Trustees, the fund, and fund shareholders and to facilitate compliance with legal and regulatory requirements and oversight of the fund's activities and associated risks. The Board, acting through its committees, has charged FMR and its affiliates with (i) identifying events or circumstances the occurrence of which could have demonstrably adverse effects on the fund's business and/or reputation; (ii) implementing processes and controls to lessen the possibility that such events or circumstances occur or to mitigate the effects of such events or circumstances if they do occur; and (iii) creating and maintaining a system designed to evaluate continuously business and market conditions in order to facilitate the identification and implementation processes described in (i) and (ii) above. Because the day-to-day operations and activities of the fund are carried out by or through FMR, its affiliates, and other service providers, the fund's exposure to risks is mitigated but not eliminated by the processes overseen by the Trustees. While each of the Board's committees has responsibility for overseeing different aspects of the fund's activities, oversight is exercised primarily through the Operations, Audit, and Compliance Committees. In addition, the Independent Trustees have worked with FMR to enhance the Board's oversight of investment and financial risks, legal and regulatory risks, technology risks, and operational risks, including the development of additional risk reporting to the Board. For example, a working group comprised of Independent Trustees and FMR has worked and continues to work to review the Fidelity® funds' valuation-related activities, reporting and risk management. Appropriate personnel, including but not limited to the fund's Chief Compliance Officer (CCO), FMR's internal auditor, the independent accountants, the fund's Treasurer and portfolio management personnel, make periodic reports to the Board's committees, as appropriate, including an annual review of Fidelity's risk management program for the Fidelity® funds. The responsibilities of each standing committee, including their oversight responsibilities, are described further under "Standing Committees of the Trustees."
Interested Trustees*:
Correspondence intended for a Trustee who is an interested person may be sent to Fidelity Investments, 245 Summer Street, Boston, Massachusetts 02210.
Name, Year of Birth; Principal Occupations and Other Relevant Experience+
James C. Curvey (1935)
Year of Election or Appointment: 2007
Trustee
Chairman of the Board of Trustees
Mr. Curvey also serves as Trustee of other Fidelity® funds. Mr. Curvey is a Director of Fidelity Research & Analysis Co. (investment adviser firm, 2009-present), and Vice Chairman (2007-present) and Director of FMR LLC (diversified financial services company). In addition, Mr. Curvey serves as an Overseer for the Boston Symphony Orchestra and a member of the board of Artis-Naples, Naples, Florida, and as a Trustee for Brewster Academy, Wolfeboro, New Hampshire. Previously, Mr. Curvey served as a Director of Fidelity Investments Money Management, Inc. (investment adviser firm, 2009-2014) and a Director of FMR and FMR Co., Inc. (investment adviser firms, 2007-2014).
Charles S. Morrison (1960)
Year of Election or Appointment: 2014
Trustee
Mr. Morrison also serves as Trustee of other funds. He serves as President of Fidelity Management & Research Company (FMR) (investment adviser firm, 2016-present), a Director of Fidelity Investments Money Management, Inc. (FIMM) (investment adviser firm, 2014-present), Director of Fidelity SelectCo, LLC (investment adviser firm, 2014-present), President, Asset Management (2014-present), and is an employee of Fidelity Investments. Previously, Mr. Morrison served as Vice President of Fidelity's Fixed Income and Asset Allocation Funds (2012-2014), President, Fixed Income (2011-2014), Vice President of Fidelity's Money Market Funds (2005-2009), President, Money Market Group Leader of FMR (investment adviser firm, 2009), and Senior Vice President, Money Market Group of FMR (2004-2009). Mr. Morrison also served as Vice President of Fidelity's Bond Funds (2002-2005), certain Balanced Funds (2002-2005), and certain Asset Allocation Funds (2002-2007), and as Senior Vice President (2002-2005) of Fidelity's Bond Division.
* Determined to be an “Interested Trustee” by virtue of, among other things, his or her affiliation with the trust or various entities under common control with FMR.
+ The information includes the Trustee's principal occupation during the last five years and other information relating to the experience, attributes, and skills relevant to the Trustee's qualifications to serve as a Trustee, which led to the conclusion that the Trustee should serve as a Trustee for the fund.
Independent Trustees:
Correspondence intended for an Independent Trustee may be sent to Fidelity Investments, P.O. Box 55235, Boston, Massachusetts 02205-5235.
Name, Year of Birth; Principal Occupations and Other Relevant Experience+
Dennis J. Dirks (1948)
Year of Election or Appointment: 2005
Trustee
Mr. Dirks also serves as Trustee of other Fidelity® funds. Prior to his retirement in May 2003, Mr. Dirks was Chief Operating Officer and a member of the Board of The Depository Trust & Clearing Corporation (DTCC). He also served as President, Chief Operating Officer, and Board member of The Depository Trust Company (DTC) and President and Board member of the National Securities Clearing Corporation (NSCC). In addition, Mr. Dirks served as Chief Executive Officer and Board member of the Government Securities Clearing Corporation, Chief Executive Officer and Board member of the Mortgage-Backed Securities Clearing Corporation, as a Trustee and a member of the Finance Committee of Manhattan College (2005-2008), as a Trustee and a member of the Finance Committee of AHRC of Nassau County (2006-2008), and as a member of the Independent Directors Council (IDC) Governing Council (2010-2015). Mr. Dirks is a member of the Board of Directors for The Brookville Center for Children's Services, Inc. (2009-present) and the Finance Committee of the Asolo Repertory Theatre (2016-present).
Alan J. Lacy (1953)
Year of Election or Appointment: 2008
Trustee
Mr. Lacy also serves as Trustee of other Fidelity® funds. Mr. Lacy serves as Chairman (2014-present) and a member (2010-present) of the Board of Directors of Dave & Buster's Entertainment, Inc. (restaurant and entertainment complexes) and a Director of Bristol-Myers Squibb Company (global pharmaceuticals, 2008-present). He is a Trustee of the California Chapter of The Nature Conservancy (2015-present) and a Director of the Center for Advanced Study in the Behavioral Sciences at Stanford University (2015-present). In addition, Mr. Lacy served as Senior Adviser (2007-2014) of Oak Hill Capital Partners, L.P. (private equity) and also served as Chief Executive Officer (2005) and Vice Chairman (2005-2006) of Sears Holdings Corporation (retail) and Chief Executive Officer and Chairman of the Board of Sears, Roebuck and Co. (retail, 2000-2005). Previously, Mr. Lacy served as Chairman (2008-2011) and a member (2006-2015) of the Board of Trustees of the National Parks Conservation Association and as a member of the Board of Directors for The Western Union Company (global money transfer, 2006-2011), The Hillman Companies, Inc. (hardware wholesalers, 2010-2014), and Earth Fare, Inc. (retail grocery, 2010-2014).
Ned C. Lautenbach (1944)
Year of Election or Appointment: 2000
Trustee
Chairman of the Independent Trustees
Mr. Lautenbach also serves as Trustee of other Fidelity® funds. Mr. Lautenbach currently serves as the Lead Director of the Eaton Corporation Board of Directors (diversified industrial, 1997-present). Mr. Lautenbach is Chairman of the Board of Directors of Artis-Naples in Naples, Florida (2012-present), a member of the Council on Foreign Relations (1994-present), and currently Vice Chair of the Board of Governors, State University System of Florida (2013-present). Previously, Mr. Lautenbach was a Partner and Advisory Partner at Clayton, Dubilier & Rice, LLC (private equity investment, 1998-2010), as well as a Director of Sony Corporation (2006-2007). Mr. Lautenbach also had a 30-year career with IBM (technology company) during which time he served as Senior Vice President and a member of the Corporate Executive Committee (1968-1998).
Joseph Mauriello (1944)
Year of Election or Appointment: 2008
Trustee
Mr. Mauriello also serves as Trustee of other Fidelity® funds. Prior to his retirement in January 2006, Mr. Mauriello served in numerous senior management positions including Deputy Chairman and Chief Operating Officer (2004-2005), and Vice Chairman of Financial Services (2002-2004) of KPMG LLP US (professional services, 1965-2005). Mr. Mauriello currently serves as a member of the Board of Directors of XL Group plc. (global insurance and re-insurance, 2006-present) and the Independent Directors Council (IDC) Governing Council (2015-present). Previously, Mr. Mauriello served as a Director of the Hamilton Funds of the Bank of New York (2006-2007) and of Arcadia Resources Inc. (health care services and products, 2007-2012).
Robert W. Selander (1950)
Year of Election or Appointment: 2011
Trustee
Mr. Selander also serves as Trustee of other Fidelity® funds. Mr. Selander serves as a Director of The Western Union Company (global money transfer, 2014-present) and a non-executive Chairman of Health Equity, Inc. (health savings custodian, 2015-present). Previously, Mr. Selander served as a Member of the Advisory Board of certain Fidelity® funds (2011), and Executive Vice Chairman (2010), Chief Executive Officer (2009-2010), and President and Chief Executive Officer (1997-2009) of Mastercard, Inc.
Cornelia M. Small (1944)
Year of Election or Appointment: 2005
Trustee
Ms. Small also serves as Trustee of other Fidelity® funds. Ms. Small is a member of the Board of Directors (2009-present) and Chair of the Investment Committee (2010-present) of the Teagle Foundation. Ms. Small also serves on the Investment Committee of the Berkshire Taconic Community Foundation (2008-present). Previously, Ms. Small served as Chairperson (2002-2008) and a member of the Investment Committee and Chairperson (2008-2012) and a member of the Board of Trustees of Smith College. In addition, Ms. Small served as Chief Investment Officer, Director of Global Equity Investments, and a member of the Board of Directors of Scudder, Stevens & Clark and Scudder Kemper Investments.
William S. Stavropoulos (1939)
Year of Election or Appointment: 2002
Trustee
Vice Chairman of the Independent Trustees
Mr. Stavropoulos also serves as Trustee of other Fidelity® funds. Mr. Stavropoulos serves as President and Founder of the Michigan Baseball Foundation, the Great Lakes Loons (2007-present). Mr. Stavropoulos is Chairman Emeritus of the Board of Directors of The Dow Chemical Company, where he previously served in numerous senior management positions, including President, CEO (1995-2000; 2002-2004), Chairman of the Executive Committee (2000-2006), and as a member of the Board of Directors (1990-2006). Currently, Mr. Stavropoulos is Chairman of the Board of Directors of Univar Inc. (global distributor of commodity and specialty chemicals), a Director of Teradata Corporation (data warehousing and technology solutions), and a member of the Advisory Board for Metalmark Capital LLC (private equity investment, 2005-present). Mr. Stavropoulos is an operating advisor to Clayton, Dubilier & Rice, LLC (private equity investment). In addition, Mr. Stavropoulos is a member of the University of Notre Dame Advisory Council for the College of Science, a Trustee of the Rollin L. Gerstacker Foundation, and a Director of Artis-Naples in Naples, Florida. Previously, Mr. Stavropoulos served as a Director of Chemical Financial Corporation (bank holding company, 1993-2012) and Tyco International, Ltd. (multinational manufacturing and services, 2007-2012).
David M. Thomas (1949)
Year of Election or Appointment: 2008
Trustee
Mr. Thomas also serves as Trustee of other Fidelity® funds. Mr. Thomas serves as Non-Executive Chairman of the Board of Directors of Fortune Brands Home and Security (home and security products, 2011-present), as a member of the Board of Directors (2004-present) and Presiding Director (2013-present) of Interpublic Group of Companies, Inc. (marketing communication), and as a member of the Board of Trustees of the University of Florida (2013-present). Previously, Mr. Thomas served as Executive Chairman (2005-2006) and Chairman and Chief Executive Officer (2000-2005) of IMS Health, Inc. (pharmaceutical and healthcare information solutions), and a Director of Fortune Brands, Inc. (consumer products, 2000-2011).
+ The information includes the Trustee's principal occupation during the last five years and other information relating to the experience, attributes, and skills relevant to the Trustee's qualifications to serve as a Trustee, which led to the conclusion that the Trustee should serve as a Trustee for the fund.
Advisory Board Members and Officers:
Correspondence intended for an officer or Peter S. Lynch may be sent to Fidelity Investments, 245 Summer Street, Boston, Massachusetts 02210. Officers appear below in alphabetical order.
Name, Year of Birth; Principal Occupation
Peter S. Lynch (1944)
Year of Election or Appointment: 2003
Member of the Advisory Board
Mr. Lynch also serves as Member of the Advisory Board of other Fidelity® funds. Mr. Lynch is Vice Chairman and a Director of FMR (investment adviser firm) and FMR Co., Inc. (investment adviser firm). In addition, Mr. Lynch serves as a Trustee of Boston College and as the Chairman of the Inner-City Scholarship Fund. Previously, Mr. Lynch served on the Special Olympics International Board of Directors (1997-2006).
Elizabeth Paige Baumann (1968)
Year of Election or Appointment: 2017
Interim Anti-Money Laundering (AML) Officer
Ms. Baumann also serves as AML Officer of other funds. She is Chief AML Officer (2012-present) and Senior Vice President (2014-present) of FMR LLC (diversified financial services company) and is an employee of Fidelity Investments. Previously, Ms. Baumann served as AML Officer (2012-2016), Vice President (2007-2014), and Deputy Anti-Money Laundering Officer (2007-2012).
Marc R. Bryant (1966)
Year of Election or Appointment: 2015
Secretary and Chief Legal Officer (CLO)
Mr. Bryant also serves as Secretary and CLO of other funds. Mr. Bryant serves as CLO, Secretary, and Senior Vice President of Fidelity Management & Research Company (investment adviser firm, 2015-present) and FMR Co., Inc. (investment adviser firm, 2015-present); Secretary of Fidelity SelectCo, LLC (investment adviser firm, 2015-present) and Fidelity Investments Money Management, Inc. (investment adviser firm, 2015-present); and CLO of Fidelity Management & Research (Hong Kong) Limited and FMR Investment Management (UK) Limited (investment adviser firms, 2015-present) and Fidelity Management & Research (Japan) Limited (investment adviser firm, 2016-present). He is Senior Vice President and Deputy General Counsel of FMR LLC (diversified financial services company). Previously, Mr. Bryant served as Secretary and CLO of Fidelity Rutland Square Trust II (2010-2014) and Assistant Secretary of Fidelity's Fixed Income and Asset Allocation Funds (2013-2015). Prior to joining Fidelity Investments, Mr. Bryant served as a Senior Vice President and the Head of Global Retail Legal for AllianceBernstein L.P. (2006-2010), and as the General Counsel for ProFund Advisors LLC (2001-2006).
Jeffrey S. Christian (1961)
Year of Election or Appointment: 2016
Assistant Treasurer
Mr. Christian also serves as Assistant Treasurer of other funds. Mr. Christian is an employee of Fidelity Investments (2003-present).
William C. Coffey (1969)
Year of Election or Appointment: 2009
Assistant Secretary
Mr. Coffey also serves as Assistant Secretary of other funds. He is Senior Vice President and Deputy General Counsel of FMR LLC (diversified financial services company, 2010-present), and is an employee of Fidelity Investments. Previously, Mr. Coffey served as Vice President and Associate General Counsel of FMR LLC (2005-2009).
Jonathan Davis (1968)
Year of Election or Appointment: 2010
Assistant Treasurer
Mr. Davis also serves as Assistant Treasurer of other funds, and is an employee of Fidelity Investments. Previously, Mr. Davis served as Vice President and Associate General Counsel of FMR LLC (diversified financial services company, 2003-2010).
Adrien E. Deberghes (1967)
Year of Election or Appointment: 2016
Assistant Treasurer
Mr. Deberghes also serves as an officer of other funds. He serves as Executive Vice President of Fidelity Investments Money Management, Inc. (FIMM) (investment adviser firm, 2016-present) and is an employee of Fidelity Investments (2008-present). Prior to joining Fidelity Investments, Mr. Deberghes was Senior Vice President of Mutual Fund Administration at State Street Corporation (2007-2008), Senior Director of Mutual Fund Administration at Investors Bank & Trust (2005-2007), and Director of Finance for Dunkin' Brands (2000-2005). Previously, Mr. Deberghes served in other fund officer roles.
Stephanie J. Dorsey (1969)
Year of Election or Appointment: 2010
Assistant Treasurer
Ms. Dorsey also serves as an officer of other funds. She is an employee of Fidelity Investments (2008-present) and has served in other fund officer roles. Prior to joining Fidelity Investments, Ms. Dorsey served as Treasurer (2004-2008) of the JPMorgan Mutual Funds and Vice President (2004-2008) of JPMorgan Chase Bank.
Howard J. Galligan III (1966)
Year of Election or Appointment: 2014
Chief Financial Officer
Mr. Galligan also serves as Chief Financial Officer of other funds. Mr. Galligan serves as President of Fidelity Pricing and Cash Management Services (FPCMS) (2014-present) and as a Director of Strategic Advisers, Inc. (investment adviser firm, 2008-present). Previously, Mr. Galligan served as Chief Administrative Officer of Asset Management (2011-2014) and Chief Operating Officer and Senior Vice President of Investment Support for Strategic Advisers, Inc. (2003-2011).
Scott C. Goebel (1968)
Year of Election or Appointment: 2015
Vice President
Mr. Goebel serves as Vice President of other funds and is an employee of Fidelity Investments (2001-present). Previously, Mr. Goebel served as Senior Vice President of Fidelity Management & Research Company (FMR) (investment adviser firm, 2016), Secretary of Fidelity SelectCo, LLC (investment adviser firm, 2013-2015), Fidelity Investments Money Management, Inc. (FIMM) (investment adviser firm, 2010-2015), and Fidelity Research and Analysis Company (FRAC) (investment adviser firm, 2010-2015); General Counsel, Secretary, and Senior Vice President of FMR (investment adviser firm, 2008-2015) and FMR Co., Inc. (investment adviser firm, 2008-2015); Assistant Secretary of Fidelity Management & Research (Japan) Limited (investment adviser firm, 2008-2015) and Fidelity Management & Research (U.K.) Inc. (investment adviser firm, 2008-2015); Chief Legal Officer (CLO) of Fidelity Management & Research (Hong Kong) Limited (investment adviser firm, 2008-2015); Secretary and CLO of certain Fidelity® funds (2008-2015); Assistant Secretary of FIMM (2008-2010), FRAC (2008-2010), and certain funds (2007-2008); and as Vice President and Secretary of Fidelity Distributors Corporation (FDC) (2005-2007).
Thomas C. Hense (1964)
Year of Election or Appointment: 2008, 2010, or 2015
Vice President
Mr. Hense serves as Vice President of Fidelity Advisor® Multi-Asset Income Fund (2015) and other funds (High Income (2008), Small Cap (2008), and Value (2010) funds), and is an employee of Fidelity Investments (1993-present). Previously, Mr. Hense served as a portfolio manager for Fidelity's Institutional Money Management Group (Pyramis) (2003-2008).
Brian B. Hogan (1964)
Year of Election or Appointment: 2009
Vice President
Mr. Hogan also serves as Trustee or Vice President of other funds. Mr. Hogan serves as a Director of FMR Investment Management (UK) Limited (investment adviser firm, 2015-present) and Fidelity SelectCo, LLC (investment adviser firm, 2014-present) and President of the Equity Division of FMR (investment adviser firm, 2009-present). Previously, Mr. Hogan served as Senior Vice President, Equity Research of FMR (2006-2009) and as a portfolio manager. Mr. Brian B. Hogan is not related to Mr. Colm A. Hogan.
Colm A. Hogan (1973)
Year of Election or Appointment: 2016
Deputy Treasurer
Mr. Hogan also serves as an officer of other funds. Mr. Hogan is an employee of Fidelity Investments (2005-present). Mr. Colm A. Hogan is not related to Mr. Brian B. Hogan.
Chris Maher (1972)
Year of Election or Appointment: 2013
Assistant Treasurer
Mr. Maher serves as Assistant Treasurer of other funds. Mr. Maher is Vice President of Valuation Oversight and is an employee of Fidelity Investments. Previously, Mr. Maher served as Vice President of Asset Management Compliance (2013), Vice President of the Program Management Group of FMR (investment adviser firm, 2010-2013), and Vice President of Valuation Oversight (2008-2010).
Kenneth B. Robins (1969)
Year of Election or Appointment: 2016
Chief Compliance Officer
Mr. Robins also serves as an officer of other funds. Mr. Robins serves as Compliance Officer of Fidelity Management & Research Company and FMR Co., Inc. (investment adviser firms, 2016-present) and is an employee of Fidelity Investments (2004-present). Previously, Mr. Robins served as Executive Vice President of Fidelity Investments Money Management, Inc. (investment adviser firm, 2013-2016) and served in other fund officer roles.
Stacie M. Smith (1974)
Year of Election or Appointment: 2016
President and Treasurer
Ms. Smith also serves as an officer of other funds. She is an employee of Fidelity Investments (2009-present) and has served in other fund officer roles. Prior to joining Fidelity Investments, Ms. Smith served as Senior Audit Manager of Ernst & Young LLP (accounting firm, 1996-2009). Previously, Ms. Smith served as Deputy Treasurer of certain Fidelity® funds (2013-2016).
Marc L. Spector (1972)
Year of Election or Appointment: 2016
Assistant Treasurer
Mr. Spector also serves as an officer of other funds. Mr. Spector is an employee of Fidelity Investments (2016-present). Prior to joining Fidelity Investments, Mr. Spector served as Director at the Siegfried Group (accounting firm, 2013-2016), and prior to Siegfried Group as audit senior manager at Deloitte & Touche (accounting firm, 2005-2013).
Renee Stagnone (1975)
Year of Election or Appointment: 2016
Assistant Treasurer
Ms. Stagnone also serves as an officer of other funds. Ms. Stagnone is an employee of Fidelity Investments (1997-present). Previously, Ms. Stagnone served as Deputy Treasurer of certain Fidelity® funds (2013-2016).
Shareholder Expense Example
As a shareholder of the Fund, you incur two types of costs: (1) transaction costs, including sales charges (loads) on purchase payments or redemption proceeds, and (2) ongoing costs, including management fees, distribution and/or service (12b-1) fees and other Fund expenses. This Example is intended to help you understand your ongoing costs (in dollars) of investing in the Fund and to compare these costs with the ongoing costs of investing in other mutual funds.
The Example is based on an investment of $1,000 invested at the beginning of the period and held for the entire period (August 1, 2016 to January 31, 2017).
Actual Expenses
The first line of the accompanying table for each class of the Fund provides information about actual account values and actual expenses. You may use the information in this line, together with the amount you invested, to estimate the expenses that you paid over the period. Simply divide your account value by $1,000.00 (for example, an $8,600 account value divided by $1,000.00 = 8.6), then multiply the result by the number in the first line for a class of the Fund under the heading entitled "Expenses Paid During Period" to estimate the expenses you paid on your account during this period. A small balance maintenance fee of $12.00 that is charged once a year may apply for certain accounts with a value of less than $2,000. This fee is not included in the table below. If it was, the estimate of expenses you paid during the period would be higher, and your ending account value lower, by this amount. In addition, the Fund, as a shareholder in the underlying Fidelity Central Funds, will indirectly bear its pro-rata share of the fees and expenses incurred by the underlying Fidelity Central Funds. These fees and expenses are not included in the Fund's annualized expense ratio used to calculate the expense estimate in the table below.
Hypothetical Example for Comparison Purposes
The second line of the accompanying table for each class of the Fund provides information about hypothetical account values and hypothetical expenses based on a Class' actual expense ratio and an assumed rate of return of 5% per year before expenses, which is not the Class' actual return. The hypothetical account values and expenses may not be used to estimate the actual ending account balance or expenses you paid for the period. You may use this information to compare the ongoing costs of investing in the Fund and other funds. To do so, compare this 5% hypothetical example with the 5% hypothetical examples that appear in the shareholder reports of the other funds. A small balance maintenance fee of $12.00 that is charged once a year may apply for certain accounts with a value of less than $2,000. This fee is not included in the table below. If it was, the estimate of expenses you paid during the period would be higher, and your ending account value lower, by this amount. In addition, the Fund, as a shareholder in the underlying Fidelity Central Funds, will indirectly bear its pro-rata share of the fees and expenses incurred by the underlying Fidelity Central Funds. These fees and expenses are not included in the Fund's annualized expense ratio used to calculate the expense estimate in the table below.
Please note that the expenses shown in the table are meant to highlight your ongoing costs only and do not reflect any transaction costs. Therefore, the second line of the table is useful in comparing ongoing costs only, and will not help you determine the relative total costs of owning different funds. In addition, if these transactional costs were included, your costs would have been higher.
| | Annualized Expense Ratio-A | Beginning
Account Value
August 1, 2016 | Ending
Account Value
January 31, 2017 | Expenses Paid
During Period-B
August 1, 2016
to January 31, 2017 |
| Class A | 1.02% | | | |
| Actual | | $1,000.00 | $1,077.00 | $5.33 |
| Hypothetical-C | | $1,000.00 | $1,020.01 | $5.18 |
| Class T | 1.36% | | | |
| Actual | | $1,000.00 | $1,074.90 | $7.09 |
| Hypothetical-C | | $1,000.00 | $1,018.30 | $6.90 |
| Class C | 1.87% | | | |
| Actual | | $1,000.00 | $1,072.80 | $9.74 |
| Hypothetical-C | | $1,000.00 | $1,015.74 | $9.48 |
| Stock Selector Large Cap Value | .74% | | | |
| Actual | | $1,000.00 | $1,078.30 | $3.87 |
| Hypothetical-C | | $1,000.00 | $1,021.42 | $3.76 |
| Class I | .87% | | | |
| Actual | | $1,000.00 | $1,077.50 | $4.54 |
| Hypothetical-C | | $1,000.00 | $1,020.76 | $4.42 |
A Annualized expense ratio reflects expenses net of applicable fee waivers.
B Expenses are equal to each Class' annualized expense ratio, multiplied by the average account value over the period, multiplied by 184/366 (to reflect the one-half year period).
C 5% return per year before expenses
Distributions (Unaudited)
Class A, Class T, Class C, Stock Selector Large Cap Value, and Class I designate 100% of the dividends distributed in December 2016 during the fiscal year as qualifying for the dividends–received deduction for corporate shareholders.
Class A, Class T, Class C, Stock Selector Large Cap Value, and Class I designate 100% of the dividends distributed during the fiscal year as amounts which may be taken into account as a dividend for purposes of the maximum rate under section 1(h)(11) of the Internal Revenue Code.
The fund will notify shareholders in January 2018 of amounts for use in preparing 2017 income tax returns.
Corporate Headquarters
245 Summer St.
Boston, MA 02210
www.fidelity.com
LCV-ANN-0317
1.900194.107
Fidelity® Mid Cap Value Fund
Annual Report January 31, 2017 |
|
Contents
To view a fund's proxy voting guidelines and proxy voting record for the 12-month period ended June 30, visit http://www.fidelity.com/proxyvotingresults or visit the Securities and Exchange Commission's (SEC) web site at http://www.sec.gov.
You may also call 1-800-544-8544 to request a free copy of the proxy voting guidelines.
Standard & Poor's, S&P and S&P 500 are registered service marks of The McGraw-Hill Companies, Inc. and have been licensed for use by Fidelity Distributors Corporation.
Other third-party marks appearing herein are the property of their respective owners.
All other marks appearing herein are registered or unregistered trademarks or service marks of FMR LLC or an affiliated company. © 2017 FMR LLC. All rights reserved.
This report and the financial statements contained herein are submitted for the general information of the shareholders of the Fund. This report is not authorized for distribution to prospective investors in the Fund unless preceded or accompanied by an effective prospectus.
A fund files its complete schedule of portfolio holdings with the SEC for the first and third quarters of each fiscal year on Form N-Q. Forms N-Q are available on the SEC’s web site at http://www.sec.gov. A fund's Forms N-Q may be reviewed and copied at the SEC’s Public Reference Room in Washington, DC. Information regarding the operation of the SEC's Public Reference Room may be obtained by calling 1-800-SEC-0330.
For a complete list of a fund's portfolio holdings, view the most recent holdings listing, semiannual report, or annual report on Fidelity's web site at http://www.fidelity.com, http://www.institutional.fidelity.com, or http://www.401k.com, as applicable.
NOT FDIC INSURED •MAY LOSE VALUE •NO BANK GUARANTEE
Neither the Fund nor Fidelity Distributors Corporation is a bank.
Performance: The Bottom Line
Average annual total return reflects the change in the value of an investment, assuming reinvestment of distributions from dividend income and capital gains (the profits earned upon the sale of securities that have grown in value, if any) and assuming a constant rate of performance each year. The hypothetical investment and the average annual total returns do not reflect the deduction of taxes that a shareholder would pay on fund distributions or the redemption of fund shares. During periods of reimbursement by Fidelity, a fund’s total return will be greater than it would be had the reimbursement not occurred. How a fund did yesterday is no guarantee of how it will do tomorrow.
Average Annual Total Returns
| For the periods ended January 31, 2017 | Past 1 year | Past 5 years | Past 10 years |
| Fidelity® Mid Cap Value Fund | 23.19% | 14.91% | 7.35% |
$10,000 Over 10 Years
Let's say hypothetically that $10,000 was invested in Fidelity® Mid Cap Value Fund, a class of the fund, on January 31, 2007.
The chart shows how the value of your investment would have changed, and also shows how the Russell Midcap® Value Index performed over the same period.

| Period Ending Values |
| $20,325 | Fidelity® Mid Cap Value Fund |
| $20,494 | Russell Midcap® Value Index |
Management's Discussion of Fund Performance
Market Recap: The U.S. equity bellwether S&P 500
®index posted a 20.04% gain for the year ending January 31, 2017, rising sharply in the period’s final months on renewed optimism for economic growth. The beginning of the period saw improving investor sentiment amid U.S. job gains, a rally in energy and other stimuli that helped keep the seven-year bull uptrend intact. Markets tumbled briefly following the U.K.’s June 23 vote to exit the European Union (Brexit) – then recovered quickly and settled into a flattish stretch until the November 8 U.S. presidential election. Stocks then broke out in response to Donald Trump’s surprise victory, surging to a series of new all-time highs on expectations for reflation and fiscal stimulus. For the year, industrials (+28%), energy (+27%) and materials (+37%) all did well, the latter two driven by a cyclical rebound in commodity prices. Financials (+35%) also shined, riding an uptick in bond yields and the strong rally in banks (+41%), especially post-election. Information technology rose about 25%, despite cooling off in the fourth quarter of 2016. Conversely, real estate (+8%) lagged on the prospect for rising interest rates. An improved backdrop for riskier assets curbed dividend-rich telecommunication services (+13%), utilities (+12%) and consumer staples (+6%). Health care (+8%) underperformed amid an uncertain political and regulatory outlook.
Comments from Portfolio Manager Court Dignan: For the year, the fund’s share classes (excluding sales charges, if applicable) gained roughly 22% to 23%, lagging the 29.15% advance of the benchmark Russell Midcap
® Value Index. Versus the Russell benchmark, stock picks in the health care and materials sectors hurt most. Individual relative detractors included two pharmaceuticals stocks: Israel-based Teva Pharmaceutical Industries, a non-benchmark holding, and Ireland’s Endo International, both of which fell due to the threat of price deflation on generic drugs and company-specific issues. I sold Endo by period end and added to Teva, based on its deep pipeline of products. In materials, fertilizer producer CF Industries Holdings detracted because shares declined in the first five months of the period, when CF was not in the benchmark. The firm was pressured by new nitrogen supply that hurt pricing, among other factors. Conversely, security selection and an underweighting in real estate helped, as did picks in diversified financials. Notable individual contributors included Discover Financial Services, a non-benchmark consumer finance company and our largest holding, and Science Applications International, a logistics and cyber security company that gained from better-than-expected earnings. Science Applications was not held at period end.
The views expressed above reflect those of the portfolio manager(s) only through the end of the period as stated on the cover of this report and do not necessarily represent the views of Fidelity or any other person in the Fidelity organization. Any such views are subject to change at any time based upon market or other conditions and Fidelity disclaims any responsibility to update such views. These views may not be relied on as investment advice and, because investment decisions for a Fidelity fund are based on numerous factors, may not be relied on as an indication of trading intent on behalf of any Fidelity fund.
Investment Summary (Unaudited)
Top Ten Stocks as of January 31, 2017
| | % of fund's net assets | % of fund's net assets 6 months ago |
| Discover Financial Services | 2.8 | 3.3 |
| American Tower Corp. | 2.8 | 2.0 |
| FNF Group | 2.6 | 2.6 |
| Synchrony Financial | 2.6 | 1.8 |
| Baker Hughes, Inc. | 2.4 | 1.2 |
| Mack-Cali Realty Corp. | 2.1 | 2.1 |
| Teva Pharmaceutical Industries Ltd. sponsored ADR | 1.8 | 3.2 |
| Allison Transmission Holdings, Inc. | 1.8 | 0.8 |
| DTE Energy Co. | 1.7 | 1.1 |
| AerCap Holdings NV | 1.7 | 2.0 |
| | 22.3 | |
Top Five Market Sectors as of January 31, 2017
| | % of fund's net assets | % of fund's net assets 6 months ago |
| Financials | 19.2 | 34.5 |
| Real Estate | 12.7 | 0.0 |
| Industrials | 11.2 | 10.1 |
| Utilities | 10.5 | 10.9 |
| Energy | 10.1 | 9.0 |
Prior period industry classifications reflect the categories in place as of the date indicated and have not been adjusted to reflect current industry classifications.
Asset Allocation (% of fund's net assets)
| As of January 31, 2017* |
| | Stocks | 96.2% |
| | Convertible Securities | 0.5% |
| | Short-Term Investments and Net Other Assets (Liabilities) | 3.3% |

* Foreign investments - 13.4%
| As of July 31, 2016* |
| | Stocks | 97.8% |
| | Short-Term Investments and Net Other Assets (Liabilities) | 2.2% |

* Foreign investments - 15.5%
Percentages shown as 0.0% may reflect amounts less than 0.05%.
Investments January 31, 2017
Showing Percentage of Net Assets
| Common Stocks - 96.2% | | | |
| | | Shares | Value |
| CONSUMER DISCRETIONARY - 8.1% | | | |
| Auto Components - 0.9% | | | |
| Delphi Automotive PLC | | 330,300 | $23,140,818 |
| The Goodyear Tire & Rubber Co. | | 149,500 | 4,842,305 |
| | | | 27,983,123 |
| Hotels, Restaurants & Leisure - 2.7% | | | |
| International Game Technology PLC | | 87,900 | 2,321,439 |
| Royal Caribbean Cruises Ltd. | | 419,600 | 39,287,148 |
| U.S. Foods Holding Corp. | | 313,700 | 8,532,640 |
| Wyndham Worldwide Corp. | | 476,700 | 37,687,902 |
| | | | 87,829,129 |
| Household Durables - 1.8% | | | |
| D.R. Horton, Inc. | | 313,300 | 9,370,803 |
| Harman International Industries, Inc. | | 35,500 | 3,946,180 |
| PulteGroup, Inc. | | 1,766,500 | 37,997,415 |
| Whirlpool Corp. | | 45,100 | 7,887,539 |
| | | | 59,201,937 |
| Internet & Direct Marketing Retail - 0.7% | | | |
| Liberty Interactive Corp. QVC Group Series A (a) | | 1,284,100 | 24,629,038 |
| Media - 1.4% | | | |
| Interpublic Group of Companies, Inc. | | 894,000 | 21,035,820 |
| Liberty Global PLC LiLAC Class A (a) | | 17 | 391 |
| Twenty-First Century Fox, Inc. Class A | | 838,700 | 26,318,406 |
| | | | 47,354,617 |
| Specialty Retail - 0.6% | | | |
| GameStop Corp. Class A (b) | | 814,459 | 19,946,101 |
|
| TOTAL CONSUMER DISCRETIONARY | | | 266,943,945 |
|
| CONSUMER STAPLES - 3.1% | | | |
| Beverages - 0.5% | | | |
| Molson Coors Brewing Co. Class B | | 161,800 | 15,616,936 |
| Food & Staples Retailing - 0.2% | | | |
| Kroger Co. | | 244,700 | 8,310,012 |
| Food Products - 2.4% | | | |
| ConAgra Foods, Inc. | | 592,600 | 23,164,734 |
| Lamb Weston Holdings, Inc. | | 471,933 | 17,631,417 |
| Mead Johnson Nutrition Co. Class A | | 107,400 | 7,567,404 |
| The J.M. Smucker Co. | | 221,700 | 30,117,945 |
| | | | 78,481,500 |
|
| TOTAL CONSUMER STAPLES | | | 102,408,448 |
|
| ENERGY - 9.6% | | | |
| Energy Equipment & Services - 2.4% | | | |
| Baker Hughes, Inc. | | 1,225,200 | 77,285,616 |
| Oil, Gas & Consumable Fuels - 7.2% | | | |
| Anadarko Petroleum Corp. | | 640,500 | 44,533,965 |
| Apache Corp. | | 49,100 | 2,937,162 |
| Cheniere Energy, Inc. (a) | | 108,700 | 5,179,555 |
| Continental Resources, Inc. (a) | | 45,000 | 2,185,200 |
| EQT Corp. | | 582,100 | 35,292,723 |
| Marathon Petroleum Corp. | | 430,400 | 20,680,720 |
| Newfield Exploration Co. (a) | | 840,400 | 33,683,232 |
| Noble Energy, Inc. | | 398,400 | 15,840,384 |
| PDC Energy, Inc. (a) | | 177,900 | 13,153,926 |
| QEP Resources, Inc. (a) | | 1,589,200 | 27,715,648 |
| Targa Resources Corp. | | 409,100 | 23,572,342 |
| Teekay LNG Partners LP | | 599,217 | 10,905,749 |
| Whiting Petroleum Corp. (a) | | 189,200 | 2,098,228 |
| | | | 237,778,834 |
|
| TOTAL ENERGY | | | 315,064,450 |
|
| FINANCIALS - 19.2% | | | |
| Banks - 4.1% | | | |
| East West Bancorp, Inc. | | 812,600 | 41,800,144 |
| PNC Financial Services Group, Inc. | | 135,015 | 16,263,907 |
| Regions Financial Corp. | | 1,535,917 | 22,132,564 |
| SunTrust Banks, Inc. | | 672,200 | 38,194,404 |
| U.S. Bancorp | | 284,800 | 14,994,720 |
| | | | 133,385,739 |
| Capital Markets - 1.4% | | | |
| Northern Trust Corp. | | 215,700 | 17,894,472 |
| The Blackstone Group LP | | 899,500 | 27,551,685 |
| | | | 45,446,157 |
| Consumer Finance - 5.4% | | | |
| Discover Financial Services | | 1,344,800 | 93,167,745 |
| Synchrony Financial | | 2,379,800 | 85,244,436 |
| | | | 178,412,181 |
| Diversified Financial Services - 0.3% | | | |
| Voya Financial, Inc. | | 195,000 | 7,842,900 |
| Insurance - 7.9% | | | |
| Allied World Assurance Co. Holdings AG | | 203,300 | 10,801,329 |
| Allstate Corp. | | 438,676 | 32,992,822 |
| American Financial Group, Inc. | | 329,800 | 28,418,866 |
| AmTrust Financial Services, Inc. | | 1,694,310 | 44,712,841 |
| Brown & Brown, Inc. | | 65,000 | 2,738,450 |
| Chubb Ltd. | | 360,329 | 47,379,660 |
| FNF Group | | 2,441,000 | 86,313,760 |
| Principal Financial Group, Inc. | | 139,300 | 7,952,637 |
| | | | 261,310,365 |
| Mortgage Real Estate Investment Trusts - 0.1% | | | |
| MFA Financial, Inc. | | 565,700 | 4,463,373 |
|
| TOTAL FINANCIALS | | | 630,860,715 |
|
| HEALTH CARE - 4.8% | | | |
| Health Care Equipment & Supplies - 1.3% | | | |
| Alere, Inc. (a) | | 66,000 | 2,442,000 |
| Zimmer Biomet Holdings, Inc. | | 349,500 | 41,356,335 |
| | | | 43,798,335 |
| Health Care Providers & Services - 1.7% | | | |
| Cigna Corp. | | 55,800 | 8,159,076 |
| HCA Holdings, Inc. (a) | | 249,900 | 20,061,972 |
| Laboratory Corp. of America Holdings (a) | | 147,800 | 19,836,238 |
| Universal Health Services, Inc. Class B | | 60,600 | 6,825,378 |
| | | | 54,882,664 |
| Pharmaceuticals - 1.8% | | | |
| Teva Pharmaceutical Industries Ltd. sponsored ADR | | 1,776,800 | 59,398,424 |
|
| TOTAL HEALTH CARE | | | 158,079,423 |
|
| INDUSTRIALS - 11.2% | | | |
| Airlines - 1.1% | | | |
| American Airlines Group, Inc. | | 564,400 | 24,974,700 |
| JetBlue Airways Corp. (a) | | 534,200 | 10,475,662 |
| | | | 35,450,362 |
| Commercial Services & Supplies - 1.3% | | | |
| KAR Auction Services, Inc. | | 728,400 | 33,178,620 |
| Stericycle, Inc. (a) | | 132,400 | 10,213,336 |
| | | | 43,391,956 |
| Construction & Engineering - 0.4% | | | |
| AECOM (a) | | 262,170 | 9,681,938 |
| KBR, Inc. | | 322,300 | 5,482,323 |
| | | | 15,164,261 |
| Electrical Equipment - 2.0% | | | |
| AMETEK, Inc. | | 976,300 | 49,888,930 |
| Fortive Corp. | | 149,250 | 8,255,018 |
| Generac Holdings, Inc. (a) | | 197,600 | 7,955,376 |
| | | | 66,099,324 |
| Machinery - 4.3% | | | |
| Allison Transmission Holdings, Inc. | | 1,672,400 | 58,500,552 |
| Ingersoll-Rand PLC | | 639,400 | 50,736,390 |
| Stanley Black & Decker, Inc. | | 260,300 | 32,277,200 |
| | | | 141,514,142 |
| Road & Rail - 0.3% | | | |
| Genesee & Wyoming, Inc. Class A (a) | | 140,100 | 10,557,936 |
| Trading Companies & Distributors - 1.8% | | | |
| AerCap Holdings NV (a) | | 1,240,500 | 54,916,935 |
| United Rentals, Inc. (a) | | 26,600 | 3,365,166 |
| | | | 58,282,101 |
|
| TOTAL INDUSTRIALS | | | 370,460,082 |
|
| INFORMATION TECHNOLOGY - 9.0% | | | |
| Communications Equipment - 1.7% | | | |
| Brocade Communications Systems, Inc. | | 1,035,600 | 12,913,932 |
| CommScope Holding Co., Inc. (a) | | 681,800 | 25,785,676 |
| Harris Corp. | | 164,100 | 16,854,711 |
| | | | 55,554,319 |
| Electronic Equipment & Components - 1.4% | | | |
| Dell Technologies, Inc. (a) | | 413,024 | 26,016,382 |
| TE Connectivity Ltd. | | 267,000 | 19,851,450 |
| | | | 45,867,832 |
| Internet Software & Services - 0.4% | | | |
| Akamai Technologies, Inc. (a) | | 188,500 | 12,929,215 |
| IT Services - 0.8% | | | |
| Cognizant Technology Solutions Corp. Class A (a) | | 122,600 | 6,447,534 |
| Fidelity National Information Services, Inc. | | 257,900 | 20,482,418 |
| | | | 26,929,952 |
| Semiconductors & Semiconductor Equipment - 3.5% | | | |
| Lam Research Corp. | | 299,700 | 34,423,542 |
| Micron Technology, Inc. (a) | | 609,400 | 14,692,634 |
| NXP Semiconductors NV (a) | | 290,600 | 28,435,210 |
| ON Semiconductor Corp. (a) | | 1,802,900 | 24,014,628 |
| Qorvo, Inc. (a) | | 108,400 | 6,960,364 |
| Skyworks Solutions, Inc. | | 57,000 | 5,229,180 |
| | | | 113,755,558 |
| Software - 0.6% | | | |
| Check Point Software Technologies Ltd. (a) | | 206,800 | 20,425,636 |
| Technology Hardware, Storage & Peripherals - 0.6% | | | |
| Western Digital Corp. | | 265,184 | 21,143,120 |
|
| TOTAL INFORMATION TECHNOLOGY | | | 296,605,632 |
|
| MATERIALS - 7.1% | | | |
| Chemicals - 3.5% | | | |
| Celanese Corp. Class A | | 224,000 | 18,905,600 |
| CF Industries Holdings, Inc. | | 492,100 | 17,366,209 |
| Eastman Chemical Co. | | 245,800 | 19,049,500 |
| LyondellBasell Industries NV Class A | | 453,200 | 42,269,964 |
| The Chemours Co. LLC | | 699,100 | 18,470,222 |
| | | | 116,061,495 |
| Construction Materials - 0.7% | | | |
| Eagle Materials, Inc. | | 199,500 | 20,863,710 |
| Vulcan Materials Co. | | 21,000 | 2,694,930 |
| | | | 23,558,640 |
| Containers & Packaging - 1.9% | | | |
| Graphic Packaging Holding Co. | | 2,209,100 | 27,635,841 |
| WestRock Co. | | 636,300 | 33,952,968 |
| | | | 61,588,809 |
| Metals & Mining - 1.0% | | | |
| Franco-Nevada Corp. | | 289,516 | 18,831,611 |
| Freeport-McMoRan, Inc. (a) | | 163,800 | 2,727,270 |
| Steel Dynamics, Inc. | | 369,500 | 12,492,795 |
| | | | 34,051,676 |
|
| TOTAL MATERIALS | | | 235,260,620 |
|
| REAL ESTATE - 12.7% | | | |
| Equity Real Estate Investment Trusts (REITs) - 12.3% | | | |
| American Tower Corp. | | 878,457 | 90,920,300 |
| Brixmor Property Group, Inc. | | 385,000 | 9,290,050 |
| Colony NorthStar, Inc. | | 757,844 | 10,549,188 |
| Corporate Office Properties Trust (SBI) | | 402,400 | 12,804,368 |
| EastGroup Properties, Inc. | | 185,500 | 13,127,835 |
| Equity Lifestyle Properties, Inc. | | 223,200 | 16,503,408 |
| Essex Property Trust, Inc. | | 213,400 | 47,865,620 |
| Lamar Advertising Co. Class A (b) | | 282,600 | 21,341,952 |
| Life Storage, Inc. | | 216,400 | 17,625,780 |
| Mack-Cali Realty Corp. | | 2,522,800 | 70,688,856 |
| Piedmont Office Realty Trust, Inc. Class A | | 670,300 | 14,558,916 |
| Prologis, Inc. | | 819,200 | 40,017,920 |
| Public Storage | | 83,600 | 17,974,000 |
| Taubman Centers, Inc. | | 185,700 | 13,154,988 |
| Ventas, Inc. | | 85,300 | 5,260,451 |
| Welltower, Inc. | | 29,400 | 1,949,220 |
| | | | 403,632,852 |
| Real Estate Management & Development - 0.4% | | | |
| CBRE Group, Inc. (a) | | 433,900 | 13,173,204 |
|
| TOTAL REAL ESTATE | | | 416,806,056 |
|
| TELECOMMUNICATION SERVICES - 0.9% | | | |
| Diversified Telecommunication Services - 0.9% | | | |
| Level 3 Communications, Inc. (a) | | 496,700 | 29,533,782 |
| UTILITIES - 10.5% | | | |
| Electric Utilities - 5.3% | | | |
| American Electric Power Co., Inc. | | 610,600 | 39,115,036 |
| Edison International | | 523,800 | 38,174,544 |
| IDACORP, Inc. | | 389,800 | 31,191,796 |
| NextEra Energy, Inc. | | 68,100 | 8,425,332 |
| PPL Corp. | | 634,100 | 22,092,044 |
| Xcel Energy, Inc. | | 883,700 | 36,514,484 |
| | | | 175,513,236 |
| Gas Utilities - 0.5% | | | |
| Atmos Energy Corp. | | 227,500 | 17,330,950 |
| Independent Power and Renewable Electricity Producers - 0.2% | | | |
| NRG Energy, Inc. | | 298,800 | 4,942,152 |
| Multi-Utilities - 4.5% | | | |
| Avangrid, Inc. | | 181,100 | 7,026,680 |
| CenterPoint Energy, Inc. | | 533,100 | 13,972,551 |
| CMS Energy Corp. | | 380,700 | 16,217,820 |
| DTE Energy Co. | | 578,700 | 57,082,968 |
| NiSource, Inc. | | 444,900 | 9,952,413 |
| Public Service Enterprise Group, Inc. | | 69,400 | 3,070,950 |
| Sempra Energy | | 399,700 | 40,925,283 |
| | | | 148,248,665 |
|
| TOTAL UTILITIES | | | 346,035,003 |
|
| TOTAL COMMON STOCKS | | | |
| (Cost $2,712,065,861) | | | 3,168,058,156 |
| | | Principal Amount | Value |
|
| Convertible Bonds - 0.5% | | | |
| ENERGY - 0.5% | | | |
| Oil, Gas & Consumable Fuels - 0.5% | | | |
Scorpio Tankers, Inc. 2.375% 7/1/19
(Cost $16,332,840)(c) | | 19,410,000 | 16,316,531 |
| | | Shares | Value |
|
| Money Market Funds - 2.6% | | | |
| Fidelity Cash Central Fund, 0.62% (d) | | 81,603,813 | 81,620,134 |
| Fidelity Securities Lending Cash Central Fund 0.65% (d)(e) | | 4,607,102 | 4,608,023 |
| TOTAL MONEY MARKET FUNDS | | | |
| (Cost $86,221,277) | | | 86,228,157 |
| TOTAL INVESTMENT PORTFOLIO - 99.3% | | | |
| (Cost $2,814,619,978) | | | 3,270,602,844 |
| NET OTHER ASSETS (LIABILITIES) - 0.7% | | | 24,092,208 |
| NET ASSETS - 100% | | | $3,294,695,052 |
Legend
(a) Non-income producing
(b) Security or a portion of the security is on loan at period end.
(c) Security exempt from registration under Rule 144A of the Securities Act of 1933. These securities may be resold in transactions exempt from registration, normally to qualified institutional buyers. At the end of the period, the value of these securities amounted to $16,316,531 or 0.5% of net assets.
(d) Affiliated fund that is generally available only to investment companies and other accounts managed by Fidelity Investments. The rate quoted is the annualized seven-day yield of the fund at period end. A complete unaudited listing of the fund's holdings as of its most recent quarter end is available upon request. In addition, each Fidelity Central Fund's financial statements, which are not covered by the Fund's Report of Independent Registered Public Accounting Firm, are available on the SEC's website or upon request.
(e) Investment made with cash collateral received from securities on loan.
Affiliated Central Funds
Information regarding fiscal year to date income earned by the Fund from investments in Fidelity Central Funds is as follows:
| Fund | Income earned |
| Fidelity Cash Central Fund | $250,631 |
| Fidelity Securities Lending Cash Central Fund | 388,531 |
| Total | $639,162 |
Investment Valuation
The following is a summary of the inputs used, as of January 31, 2017, involving the Fund's assets and liabilities carried at fair value. The inputs or methodology used for valuing securities may not be an indication of the risk associated with investing in those securities. For more information on valuation inputs, and their aggregation into the levels used below, please refer to the Investment Valuation section in the accompanying Notes to Financial Statements.
| | Valuation Inputs at Reporting Date: |
| Description | Total | Level 1 | Level 2 | Level 3 |
| Investments in Securities: | | | | |
| Equities: | | | | |
| Consumer Discretionary | $266,943,945 | $266,943,945 | $-- | $-- |
| Consumer Staples | 102,408,448 | 102,408,448 | -- | -- |
| Energy | 315,064,450 | 315,064,450 | -- | -- |
| Financials | 630,860,715 | 630,860,715 | -- | -- |
| Health Care | 158,079,423 | 158,079,423 | -- | -- |
| Industrials | 370,460,082 | 370,460,082 | -- | -- |
| Information Technology | 296,605,632 | 296,605,632 | -- | -- |
| Materials | 235,260,620 | 235,260,620 | -- | -- |
| Real Estate | 416,806,056 | 416,806,056 | -- | -- |
| Telecommunication Services | 29,533,782 | 29,533,782 | -- | -- |
| Utilities | 346,035,003 | 346,035,003 | -- | -- |
| Corporate Bonds | 16,316,531 | -- | 16,316,531 | -- |
| Money Market Funds | 86,228,157 | 86,228,157 | -- | -- |
| Total Investments in Securities: | $3,270,602,844 | $3,254,286,313 | $16,316,531 | $-- |
Other Information
Distribution of investments by country or territory of incorporation, as a percentage of Total Net Assets, is as follows (Unaudited):
| United States of America | 86.6% |
| Netherlands | 3.9% |
| Israel | 2.4% |
| Switzerland | 2.3% |
| Ireland | 1.5% |
| Liberia | 1.2% |
| Others (Individually Less Than 1%) | 2.1% |
| | 100.0% |
See accompanying notes which are an integral part of the financial statements.
Financial Statements
Statement of Assets and Liabilities
| | | January 31, 2017 |
| Assets | | |
Investment in securities, at value (including securities loaned of $4,543,543) — See accompanying schedule:
Unaffiliated issuers (cost $2,728,398,701) | $3,184,374,687 | |
| Fidelity Central Funds (cost $86,221,277) | 86,228,157 | |
| Total Investments (cost $2,814,619,978) | | $3,270,602,844 |
| Receivable for investments sold | | 42,699,022 |
| Receivable for fund shares sold | | 4,952,827 |
| Dividends receivable | | 878,461 |
| Interest receivable | | 39,632 |
| Distributions receivable from Fidelity Central Funds | | 42,694 |
| Prepaid expenses | | 5,351 |
| Other receivables | | 20,803 |
| Total assets | | 3,319,241,634 |
| Liabilities | | |
| Payable for investments purchased | $12,083,510 | |
| Payable for fund shares redeemed | 5,714,819 | |
| Accrued management fee | 1,284,897 | |
| Distribution and service plan fees payable | 206,664 | |
| Other affiliated payables | 587,684 | |
| Other payables and accrued expenses | 73,608 | |
| Collateral on Securities Loaned | 4,595,400 | |
| Total liabilities | | 24,546,582 |
| Net Assets | | $3,294,695,052 |
| Net Assets consist of: | | |
| Paid in capital | | $2,937,261,588 |
| Distributions in excess of net investment income | | (1,976,077) |
| Accumulated undistributed net realized gain (loss) on investments and foreign currency transactions | | (96,573,673) |
| Net unrealized appreciation (depreciation) on investments and assets and liabilities in foreign currencies | | 455,983,214 |
| Net Assets | | $3,294,695,052 |
| Calculation of Maximum Offering Price | | |
| Class A: | | |
| Net Asset Value and redemption price per share ($299,123,730 ÷ 11,993,075 shares) | | $24.94 |
| Maximum offering price per share (100/94.25 of $24.94) | | $26.46 |
| Class T: | | |
| Net Asset Value and redemption price per share ($60,760,657 ÷ 2,445,967 shares) | | $24.84 |
| Maximum offering price per share (100/96.50 of $24.84) | | $25.74 |
| Class C: | | |
| Net Asset Value and offering price per share ($144,503,227 ÷ 5,966,634 shares)(a) | | $24.22 |
| Mid Cap Value: | | |
| Net Asset Value, offering price and redemption price per share ($2,426,358,528 ÷ 96,118,871 shares) | | $25.24 |
| Class I: | | |
| Net Asset Value, offering price and redemption price per share ($363,948,910 ÷ 14,526,346 shares) | | $25.05 |
(a) Redemption price per share is equal to net asset value less any applicable contingent deferred sales charge.
See accompanying notes which are an integral part of the financial statements.
Statement of Operations
| | | Year ended January 31, 2017 |
| Investment Income | | |
| Dividends | | $71,404,378 |
| Interest | | 35,138 |
| Income from Fidelity Central Funds | | 639,162 |
| Total income | | 72,078,678 |
| Expenses | | |
| Management fee | | |
| Basic fee | $17,529,296 | |
| Performance adjustment | (1,506,968) | |
| Transfer agent fees | 6,131,167 | |
| Distribution and service plan fees | 2,398,907 | |
| Accounting and security lending fees | 947,053 | |
| Custodian fees and expenses | 71,809 | |
| Independent trustees' fees and expenses | 13,758 | |
| Registration fees | 160,887 | |
| Audit | 65,056 | |
| Legal | 10,590 | |
| Miscellaneous | 28,602 | |
| Total expenses before reductions | 25,850,157 | |
| Expense reductions | (172,522) | 25,677,635 |
| Net investment income (loss) | | 46,401,043 |
| Realized and Unrealized Gain (Loss) | | |
| Net realized gain (loss) on: | | |
| Investment securities: | | |
| Unaffiliated issuers | (11,769,221) | |
| Fidelity Central Funds | 11,826 | |
| Foreign currency transactions | 19,232 | |
| Total net realized gain (loss) | | (11,738,163) |
Change in net unrealized appreciation (depreciation) on:
Investment securities | 627,288,792 | |
| Assets and liabilities in foreign currencies | 348 | |
| Total change in net unrealized appreciation (depreciation) | | 627,289,140 |
| Net gain (loss) | | 615,550,977 |
| Net increase (decrease) in net assets resulting from operations | | $661,952,020 |
See accompanying notes which are an integral part of the financial statements.
Statement of Changes in Net Assets
| | Year ended January 31, 2017 | Year ended January 31, 2016 |
| Increase (Decrease) in Net Assets | | |
| Operations | | |
| Net investment income (loss) | $46,401,043 | $53,620,473 |
| Net realized gain (loss) | (11,738,163) | 29,947,105 |
| Change in net unrealized appreciation (depreciation) | 627,289,140 | (464,541,026) |
| Net increase (decrease) in net assets resulting from operations | 661,952,020 | (380,973,448) |
| Distributions to shareholders from net investment income | (41,087,101) | (48,238,328) |
| Distributions to shareholders from net realized gain | – | (123,721,000) |
| Total distributions | (41,087,101) | (171,959,328) |
| Share transactions - net increase (decrease) | (374,923,459) | 475,831,325 |
| Redemption fees | 60,004 | 106,541 |
| Total increase (decrease) in net assets | 246,001,464 | (76,994,910) |
| Net Assets | | |
| Beginning of period | 3,048,693,588 | 3,125,688,498 |
| End of period | $3,294,695,052 | $3,048,693,588 |
| Other Information | | |
| Distributions in excess of net investment income end of period | $(1,976,077) | $(2,952,557) |
See accompanying notes which are an integral part of the financial statements.
Financial Highlights — Fidelity Mid Cap Value Fund Class A
| Years ended January 31, | 2017 | 2016 | 2015 | 2014 | 2013 |
| Selected Per–Share Data | | | | | |
| Net asset value, beginning of period | $20.52 | $23.90 | $21.78 | $19.24 | $15.87 |
| Income from Investment Operations | | | | | |
| Net investment income (loss)A | .29 | .29 | .24 | .24 | .20 |
| Net realized and unrealized gain (loss) | 4.40 | (2.57) | 3.45 | 4.29 | 3.38 |
| Total from investment operations | 4.69 | (2.28) | 3.69 | 4.53 | 3.58 |
| Distributions from net investment income | (.27) | (.28) | (.17) | (.19) | (.21) |
| Distributions from net realized gain | – | (.82) | (1.40) | (1.79) | – |
| Total distributions | (.27) | (1.10) | (1.57) | (1.99)B | (.21) |
| Redemption fees added to paid in capitalA,C | – | – | – | – | – |
| Net asset value, end of period | $24.94 | $20.52 | $23.90 | $21.78 | $19.24 |
| Total ReturnD,E | 22.87% | (9.83)% | 17.32% | 23.69% | 22.73% |
| Ratios to Average Net AssetsF,G | | | | | |
| Expenses before reductions | 1.01% | 1.14% | 1.15% | 1.15% | 1.15% |
| Expenses net of fee waivers, if any | 1.01% | 1.14% | 1.15% | 1.15% | 1.15% |
| Expenses net of all reductions | 1.00% | 1.14% | 1.15% | 1.14% | 1.12% |
| Net investment income (loss) | 1.25% | 1.21% | 1.04% | 1.11% | 1.15% |
| Supplemental Data | | | | | |
| Net assets, end of period (000 omitted) | $299,124 | $277,462 | $171,263 | $67,826 | $24,436 |
| Portfolio turnover rateH | 83% | 83% | 69% | 169% | 180% |
A Calculated based on average shares outstanding during the period.
B Total distributions of $1.99 per share is comprised of distributions from net investment income of $.193 and distributions from net realized gain of $1.793 per share.
C Amount represents less than $.005 per share.
D Total returns would have been lower if certain expenses had not been reduced during the applicable periods shown.
E Total returns do not include the effect of the sales charges.
F Fees and expenses of any underlying Fidelity Central Funds are not included in the Fund's expense ratio. The Fund indirectly bears its proportionate share of the expenses of any underlying Fidelity Central Funds.
G Expense ratios reflect operating expenses of the class. Expenses before reductions do not reflect amounts reimbursed by the investment adviser or reductions from brokerage service arrangements or reductions from other expense offset arrangements and do not represent the amount paid by the class during periods when reimbursements or reductions occur. Expenses net of fee waivers reflect expenses after reimbursement by the investment adviser but prior to reductions from brokerage service arrangements or other expense offset arrangements. Expenses net of all reductions represent the net expenses paid by the class.
H Amount does not include the portfolio activity of any underlying Fidelity Central Funds.
See accompanying notes which are an integral part of the financial statements.
Financial Highlights — Fidelity Mid Cap Value Fund Class T
| Years ended January 31, | 2017 | 2016 | 2015 | 2014 | 2013 |
| Selected Per–Share Data | | | | | |
| Net asset value, beginning of period | $20.46 | $23.81 | $21.70 | $19.21 | $15.84 |
| Income from Investment Operations | | | | | |
| Net investment income (loss)A | .22 | .22 | .17 | .18 | .15 |
| Net realized and unrealized gain (loss) | 4.38 | (2.54) | 3.44 | 4.27 | 3.38 |
| Total from investment operations | 4.60 | (2.32) | 3.61 | 4.45 | 3.53 |
| Distributions from net investment income | (.22) | (.21) | (.10) | (.17) | (.16) |
| Distributions from net realized gain | – | (.82) | (1.40) | (1.79) | – |
| Total distributions | (.22) | (1.03) | (1.50) | (1.96) | (.16) |
| Redemption fees added to paid in capitalA,B | – | – | – | – | – |
| Net asset value, end of period | $24.84 | $20.46 | $23.81 | $21.70 | $19.21 |
| Total ReturnC,D | 22.48% | (10.04)% | 16.98% | 23.32% | 22.42% |
| Ratios to Average Net AssetsE,F | | | | | |
| Expenses before reductions | 1.29% | 1.42% | 1.44% | 1.42% | 1.42% |
| Expenses net of fee waivers, if any | 1.29% | 1.42% | 1.44% | 1.42% | 1.42% |
| Expenses net of all reductions | 1.29% | 1.42% | 1.44% | 1.41% | 1.38% |
| Net investment income (loss) | .96% | .93% | .74% | .84% | .89% |
| Supplemental Data | | | | | |
| Net assets, end of period (000 omitted) | $60,761 | $46,084 | $40,752 | $24,136 | $8,358 |
| Portfolio turnover rateG | 83% | 83% | 69% | 169% | 180% |
A Calculated based on average shares outstanding during the period.
B Amount represents less than $.005 per share.
C Total returns would have been lower if certain expenses had not been reduced during the applicable periods shown.
D Total returns do not include the effect of the sales charges.
E Fees and expenses of any underlying Fidelity Central Funds are not included in the Fund's expense ratio. The Fund indirectly bears its proportionate share of the expenses of any underlying Fidelity Central Funds.
F Expense ratios reflect operating expenses of the class. Expenses before reductions do not reflect amounts reimbursed by the investment adviser or reductions from brokerage service arrangements or reductions from other expense offset arrangements and do not represent the amount paid by the class during periods when reimbursements or reductions occur. Expenses net of fee waivers reflect expenses after reimbursement by the investment adviser but prior to reductions from brokerage service arrangements or other expense offset arrangements. Expenses net of all reductions represent the net expenses paid by the class.
G Amount does not include the portfolio activity of any underlying Fidelity Central Funds.
See accompanying notes which are an integral part of the financial statements.
Financial Highlights — Fidelity Mid Cap Value Fund Class C
| Years ended January 31, | 2017 | 2016 | 2015 | 2014 | 2013 |
| Selected Per–Share Data | | | | | |
| Net asset value, beginning of period | $19.95 | $23.30 | $21.31 | $18.93 | $15.65 |
| Income from Investment Operations | | | | | |
| Net investment income (loss)A | .11 | .11 | .07 | .08 | .07 |
| Net realized and unrealized gain (loss) | 4.27 | (2.49) | 3.37 | 4.20 | 3.32 |
| Total from investment operations | 4.38 | (2.38) | 3.44 | 4.28 | 3.39 |
| Distributions from net investment income | (.11) | (.15) | (.06) | (.11) | (.11) |
| Distributions from net realized gain | – | (.81) | (1.39) | (1.79) | – |
| Total distributions | (.11) | (.97)B | (1.45) | (1.90) | (.11) |
| Redemption fees added to paid in capitalA,C | – | – | – | – | – |
| Net asset value, end of period | $24.22 | $19.95 | $23.30 | $21.31 | $18.93 |
| Total ReturnD,E | 21.97% | (10.52)% | 16.48% | 22.77% | 21.73% |
| Ratios to Average Net AssetsF,G | | | | | |
| Expenses before reductions | 1.76% | 1.89% | 1.89% | 1.89% | 1.91% |
| Expenses net of fee waivers, if any | 1.76% | 1.89% | 1.89% | 1.89% | 1.91% |
| Expenses net of all reductions | 1.75% | 1.88% | 1.89% | 1.89% | 1.87% |
| Net investment income (loss) | .50% | .47% | .29% | .36% | .40% |
| Supplemental Data | | | | | |
| Net assets, end of period (000 omitted) | $144,503 | $130,636 | $71,263 | $25,177 | $6,820 |
| Portfolio turnover rateH | 83% | 83% | 69% | 169% | 180% |
A Calculated based on average shares outstanding during the period.
B Total distributions of $.97 per share is comprised of distributions from net investment income of $.153 and distributions from net realized gain of $.812 per share.
C Amount represents less than $.005 per share.
D Total returns would have been lower if certain expenses had not been reduced during the applicable periods shown.
E Total returns do not include the effect of the contingent deferred sales charge.
F Fees and expenses of any underlying Fidelity Central Funds are not included in the Fund's expense ratio. The Fund indirectly bears its proportionate share of the expenses of any underlying Fidelity Central Funds.
G Expense ratios reflect operating expenses of the class. Expenses before reductions do not reflect amounts reimbursed by the investment adviser or reductions from brokerage service arrangements or reductions from other expense offset arrangements and do not represent the amount paid by the class during periods when reimbursements or reductions occur. Expenses net of fee waivers reflect expenses after reimbursement by the investment adviser but prior to reductions from brokerage service arrangements or other expense offset arrangements. Expenses net of all reductions represent the net expenses paid by the class.
H Amount does not include the portfolio activity of any underlying Fidelity Central Funds.
See accompanying notes which are an integral part of the financial statements.
Financial Highlights — Fidelity Mid Cap Value Fund
| Years ended January 31, | 2017 | 2016 | 2015 | 2014 | 2013 |
| Selected Per–Share Data | | | | | |
| Net asset value, beginning of period | $20.76 | $24.15 | $21.96 | $19.37 | $15.97 |
| Income from Investment Operations | | | | | |
| Net investment income (loss)A | .35 | .36 | .32 | .32 | .25 |
| Net realized and unrealized gain (loss) | 4.46 | (2.60) | 3.49 | 4.31 | 3.41 |
| Total from investment operations | 4.81 | (2.24) | 3.81 | 4.63 | 3.66 |
| Distributions from net investment income | (.33) | (.33) | (.22) | (.25) | (.26) |
| Distributions from net realized gain | – | (.82) | (1.40) | (1.79) | – |
| Total distributions | (.33) | (1.15) | (1.62) | (2.04) | (.26) |
| Redemption fees added to paid in capitalA,B | – | – | – | – | – |
| Net asset value, end of period | $25.24 | $20.76 | $24.15 | $21.96 | $19.37 |
| Total ReturnC | 23.19% | (9.58)% | 17.75% | 24.08% | 23.07% |
| Ratios to Average Net AssetsD,E | | | | | |
| Expenses before reductions | .73% | .86% | .83% | .80% | .85% |
| Expenses net of fee waivers, if any | .73% | .85% | .83% | .80% | .85% |
| Expenses net of all reductions | .72% | .85% | .83% | .80% | .81% |
| Net investment income (loss) | 1.53% | 1.50% | 1.36% | 1.45% | 1.46% |
| Supplemental Data | | | | | |
| Net assets, end of period (000 omitted) | $2,426,359 | $2,331,665 | $2,691,765 | $1,404,968 | $638,425 |
| Portfolio turnover rateF | 83% | 83% | 69% | 169% | 180% |
A Calculated based on average shares outstanding during the period.
B Amount represents less than $.005 per share.
C Total returns would have been lower if certain expenses had not been reduced during the applicable periods shown.
D Fees and expenses of any underlying Fidelity Central Funds are not included in the Fund's expense ratio. The Fund indirectly bears its proportionate share of the expenses of any underlying Fidelity Central Funds.
E Expense ratios reflect operating expenses of the class. Expenses before reductions do not reflect amounts reimbursed by the investment adviser or reductions from brokerage service arrangements or reductions from other expense offset arrangements and do not represent the amount paid by the class during periods when reimbursements or reductions occur. Expenses net of fee waivers reflect expenses after reimbursement by the investment adviser but prior to reductions from brokerage service arrangements or other expense offset arrangements. Expenses net of all reductions represent the net expenses paid by the class.
F Amount does not include the portfolio activity of any underlying Fidelity Central Funds.
See accompanying notes which are an integral part of the financial statements.
Financial Highlights — Fidelity Mid Cap Value Fund Class I
| Years ended January 31, | 2017 | 2016 | 2015 | 2014 | 2013 |
| Selected Per–Share Data | | | | | |
| Net asset value, beginning of period | $20.61 | $24.00 | $21.84 | $19.29 | $15.91 |
| Income from Investment Operations | | | | | |
| Net investment income (loss)A | .35 | .35 | .32 | .31 | .24 |
| Net realized and unrealized gain (loss) | 4.43 | (2.58) | 3.47 | 4.28 | 3.40 |
| Total from investment operations | 4.78 | (2.23) | 3.79 | 4.59 | 3.64 |
| Distributions from net investment income | (.34) | (.34) | (.23) | (.25) | (.26) |
| Distributions from net realized gain | – | (.82) | (1.40) | (1.79) | – |
| Total distributions | (.34) | (1.16) | (1.63) | (2.04) | (.26) |
| Redemption fees added to paid in capitalA,B | – | – | – | – | – |
| Net asset value, end of period | $25.05 | $20.61 | $24.00 | $21.84 | $19.29 |
| Total ReturnC | 23.19% | (9.60)% | 17.75% | 23.98% | 23.05% |
| Ratios to Average Net AssetsD,E | | | | | |
| Expenses before reductions | .73% | .87% | .85% | .85% | .89% |
| Expenses net of fee waivers, if any | .73% | .86% | .85% | .85% | .89% |
| Expenses net of all reductions | .73% | .86% | .85% | .85% | .85% |
| Net investment income (loss) | 1.53% | 1.49% | 1.33% | 1.40% | 1.42% |
| Supplemental Data | | | | | |
| Net assets, end of period (000 omitted) | $363,949 | $261,686 | $148,390 | $26,277 | $7,875 |
| Portfolio turnover rateF | 83% | 83% | 69% | 169% | 180% |
A Calculated based on average shares outstanding during the period.
B Amount represents less than $.005 per share.
C Total returns would have been lower if certain expenses had not been reduced during the applicable periods shown.
D Fees and expenses of any underlying Fidelity Central Funds are not included in the Fund's expense ratio. The Fund indirectly bears its proportionate share of the expenses of any underlying Fidelity Central Funds.
E Expense ratios reflect operating expenses of the class. Expenses before reductions do not reflect amounts reimbursed by the investment adviser or reductions from brokerage service arrangements or reductions from other expense offset arrangements and do not represent the amount paid by the class during periods when reimbursements or reductions occur. Expenses net of fee waivers reflect expenses after reimbursement by the investment adviser but prior to reductions from brokerage service arrangements or other expense offset arrangements. Expenses net of all reductions represent the net expenses paid by the class.
F Amount does not include the portfolio activity of any underlying Fidelity Central Funds.
See accompanying notes which are an integral part of the financial statements.
Notes to Financial Statements
For the period ended January 31, 2017
1. Organization.
Fidelity Mid Cap Value Fund (the Fund) is a fund of Fidelity Devonshire Trust (the Trust) and is authorized to issue an unlimited number of shares. The Trust is registered under the Investment Company Act of 1940, as amended (the 1940 Act), as an open-end management investment company organized as a Massachusetts business trust. The Fund offers Class A, Class T, Class C, Mid Cap Value and Class I shares, each of which has equal rights as to assets and voting privileges. Each class has exclusive voting rights with respect to matters that affect that class.
After the close of business on June 24, 2016, all outstanding Class B shares were converted to Class A shares. All current fiscal period dollar and share amounts for Class B presented in the Notes to Financial Statements are for the period February 1, 2016 through June 24, 2016.
In March 2017 the Board of Trustees approved a change in the name of Class T to Class M effective after the close of business on March 24, 2017.
2. Investments in Fidelity Central Funds.
The Fund invests in Fidelity Central Funds, which are open-end investment companies generally available only to other investment companies and accounts managed by the investment adviser and its affiliates. The Fund's Schedule of Investments lists each of the Fidelity Central Funds held as of period end, if any, as an investment of the Fund, but does not include the underlying holdings of each Fidelity Central Fund. As an Investing Fund, the Fund indirectly bears its proportionate share of the expenses of the underlying Fidelity Central Funds.
The Money Market Central Funds seek preservation of capital and current income and are managed by Fidelity Investments Money Management, Inc. (FIMM), an affiliate of the investment adviser. Annualized expenses of the Money Market Central Funds as of their most recent shareholder report date are less than .005%.
A complete unaudited list of holdings for each Fidelity Central Fund is available upon request or at the Securities and Exchange Commission (the SEC) website at www.sec.gov. In addition, the financial statements of the Fidelity Central Funds, which are not covered by the Fund's Report of Independent Registered Public Accounting Firm, are available on the SEC website or upon request.
3. Significant Accounting Policies.
The financial statements have been prepared in conformity with accounting principles generally accepted in the United States of America (GAAP), which require management to make certain estimates and assumptions at the date of the financial statements. Actual results could differ from those estimates. Subsequent events, if any, through the date that the financial statements were issued have been evaluated in the preparation of the financial statements. The following summarizes the significant accounting policies of the Fund:
Investment Valuation. Investments are valued as of 4:00 p.m. Eastern time on the last calendar day of the period. The Board of Trustees (the Board) has delegated the day to day responsibility for the valuation of the Fund's investments to the Fair Value Committee (the Committee) established by the Fund's investment adviser. In accordance with valuation policies and procedures approved by the Board, the Fund attempts to obtain prices from one or more third party pricing vendors or brokers to value its investments. When current market prices, quotations or currency exchange rates are not readily available or reliable, investments will be fair valued in good faith by the Committee, in accordance with procedures adopted by the Board. Factors used in determining fair value vary by investment type and may include market or investment specific events, changes in interest rates and credit quality. The frequency with which these procedures are used cannot be predicted and they may be utilized to a significant extent. The Committee oversees the Fund's valuation policies and procedures and reports to the Board on the Committee's activities and fair value determinations. The Board monitors the appropriateness of the procedures used in valuing the Fund's investments and ratifies the fair value determinations of the Committee.
The Fund categorizes the inputs to valuation techniques used to value its investments into a disclosure hierarchy consisting of three levels as shown below:
- Level 1– quoted prices in active markets for identical investments
- Level 2 – other significant observable inputs (including quoted prices for similar investments, interest rates, prepayment speeds, etc.)
- Level 3 – unobservable inputs (including the Fund's own assumptions based on the best information available)
Valuation techniques used to value the Fund's investments by major category are as follows:
Equity securities, including restricted securities, for which market quotations are readily available, are valued at the last reported sale price or official closing price as reported by a third party pricing vendor on the primary market or exchange on which they are traded and are categorized as Level 1 in the hierarchy. In the event there were no sales during the day or closing prices are not available, securities are valued at the last quoted bid price or may be valued using the last available price and are generally categorized as Level 2 in the hierarchy. For foreign equity securities, when market or security specific events arise, comparisons to the valuation of American Depositary Receipts (ADRs), futures contracts, Exchange-Traded Funds (ETFs) and certain indexes as well as quoted prices for similar securities may be used and would be categorized as Level 2 in the hierarchy. Utilizing these techniques may result in transfers between Level 1 and Level 2. For equity securities, including restricted securities, where observable inputs are limited, assumptions about market activity and risk are used and these securities may be categorized as Level 3 in the hierarchy.
Debt securities, including restricted securities, are valued based on evaluated prices received from third party pricing vendors or from brokers who make markets in such securities. Corporate bonds are valued by pricing vendors who utilize matrix pricing which considers yield or price of bonds of comparable quality, coupon, maturity and type or by broker-supplied prices. When independent prices are unavailable or unreliable, debt securities may be valued utilizing pricing methodologies which consider similar factors that would be used by third party pricing vendors. Debt securities are generally categorized as Level 2 in the hierarchy but may be Level 3 depending on the circumstances.
Investments in open-end mutual funds, including the Fidelity Central Funds, are valued at their closing net asset value (NAV) each business day and are categorized as Level 1 in the hierarchy.
Changes in valuation techniques may result in transfers in or out of an assigned level within the disclosure hierarchy. The aggregate value of investments by input level as of January 31, 2017 is included at the end of the Fund's Schedule of Investments.
Foreign Currency. The Fund may use foreign currency contracts to facilitate transactions in foreign-denominated securities. Gains and losses from these transactions may arise from changes in the value of the foreign currency or if the counterparties do not perform under the contracts' terms.
Foreign-denominated assets, including investment securities, and liabilities are translated into U.S. dollars at the exchange rates at period end. Purchases and sales of investment securities, income and dividends received and expenses denominated in foreign currencies are translated into U.S. dollars at the exchange rate in effect on the transaction date.
The effects of exchange rate fluctuations on investments are included with the net realized and unrealized gain (loss) on investment securities. Other foreign currency transactions resulting in realized and unrealized gain (loss) are disclosed separately.
Investment Transactions and Income. For financial reporting purposes, the Fund's investment holdings and NAV include trades executed through the end of the last business day of the period. The NAV per share for processing shareholder transactions is calculated as of the close of business of the New York Stock Exchange (NYSE), normally 4:00 p.m. Eastern time and includes trades executed through the end of the prior business day. Gains and losses on securities sold are determined on the basis of identified cost and may include proceeds received from litigation. Dividend income is recorded on the ex-dividend date, except for certain dividends from foreign securities where the ex-dividend date may have passed, which are recorded as soon as the Fund is informed of the ex-dividend date. Non-cash dividends included in dividend income, if any, are recorded at the fair market value of the securities received. Income and capital gain distributions from Fidelity Central Funds, if any, are recorded on the ex-dividend date. Certain distributions received by the Fund represent a return of capital or capital gain. The Fund determines the components of these distributions subsequent to the ex-dividend date, based upon receipt of tax filings or other correspondence relating to the underlying investment. These distributions are recorded as a reduction of cost of investments and/or as a realized gain. Interest income is accrued as earned and includes coupon interest and amortization of premium and accretion of discount on debt securities as applicable. Investment income is recorded net of foreign taxes withheld where recovery of such taxes is uncertain.
Class Allocations and Expenses. Investment income, realized and unrealized capital gains and losses, common expenses of the Fund, and certain fund-level expense reductions, if any, are allocated daily on a pro-rata basis to each class based on the relative net assets of each class to the total net assets of the Fund. Each class differs with respect to transfer agent and distribution and service plan fees incurred. Certain expense reductions may also differ by class. For the reporting period, the allocated portion of income and expenses to each class as a percent of its average net assets may vary due to the timing of recording these transactions in relation to fluctuating net assets of the classes. Expenses directly attributable to a fund are charged to that fund. Expenses attributable to more than one fund are allocated among the respective funds on the basis of relative net assets or other appropriate methods. Expense estimates are accrued in the period to which they relate and adjustments are made when actual amounts are known.
Income Tax Information and Distributions to Shareholders. Each year, the Fund intends to qualify as a regulated investment company under Subchapter M of the Internal Revenue Code, including distributing substantially all of its taxable income and realized gains. As a result, no provision for U.S. Federal income taxes is required. As of January 31, 2017, the Fund did not have any unrecognized tax benefits in the financial statements; nor is the Fund aware of any tax positions for which it is reasonably possible that the total amounts of unrecognized tax benefits will significantly change in the next twelve months. The Fund files a U.S. federal tax return, in addition to state and local tax returns as required. The Fund's federal income tax returns are subject to examination by the Internal Revenue Service (IRS) for a period of three fiscal years after they are filed. State and local tax returns may be subject to examination for an additional fiscal year depending on the jurisdiction. Foreign taxes are provided for based on the Fund's understanding of the tax rules and rates that exist in the foreign markets in which it invests.
Distributions are declared and recorded on the ex-dividend date. Income dividends and capital gain distributions are declared separately for each class. Income and capital gain distributions are determined in accordance with income tax regulations, which may differ from GAAP.
Capital accounts within the financial statements are adjusted for permanent book-tax differences. These adjustments have no impact on net assets or the results of operations. Capital accounts are not adjusted for temporary book-tax differences which will reverse in a subsequent period.
Book-tax differences are primarily due to foreign currency transactions, partnerships, market discount, capital loss carryforwards and losses deferred due to wash sales and excise tax regulations.
The federal tax cost of investment securities and unrealized appreciation (depreciation) as of period end were as follows:
| Gross unrealized appreciation | $499,146,063 |
| Gross unrealized depreciation | (69,311,026) |
| Net unrealized appreciation (depreciation) on securities | $429,835,037 |
| Tax Cost | $2,840,767,807 |
The tax-based components of distributable earnings as of period end were as follows:
| Capital loss carryforward | $(70,401,023) |
| Net unrealized appreciation (depreciation) on securities and other investments | $429,835,037 |
Capital loss carryforwards are only available to offset future capital gains of the Fund to the extent provided by regulations and may be limited. Under the Regulated Investment Company Modernization Act of 2010 (the Act), the Fund is permitted to carry forward capital losses incurred in taxable years beginning after December 22, 2010 for an unlimited period and such capital losses are required to be used prior to any losses that expire. The capital loss carryforward information presented below, including any applicable limitation, is estimated as of fiscal period end and is subject to adjustment.
| Fiscal year of expiration | |
| No expiration | |
| Short-term | $(70,401,023) |
The tax character of distributions paid was as follows:
| | January 31, 2017 | January 31, 2016 |
| Ordinary Income | $41,087,101 | $ 57,536,518 |
| Long-term Capital Gains | – | 114,422,810 |
| Total | $41,087,101 | $ 171,959,328 |
The fund intends to elect to defer to its next fiscal year $2,000,550 of ordinary losses recognized during the period January 1, 2017 to January 31, 2017.
Short-Term Trading (Redemption) Fees. During the period, shares held by investors in the Fund less than 30 days may have been subject to a redemption fee equal to .75% of the NAV of shares redeemed. All redemption fees, which reduce the proceeds of the shareholder redemption, are retained by the Fund and accounted for as an addition to paid in capital. In November 2016, the Board of Trustees approved the elimination of these redemption fees effective December 12, 2016.
Restricted Securities. The Fund may invest in securities that are subject to legal or contractual restrictions on resale. These securities generally may be resold in transactions exempt from registration or to the public if the securities are registered. Disposal of these securities may involve time-consuming negotiations and expense, and prompt sale at an acceptable price may be difficult. Information regarding restricted securities is included at the end of the Fund's Schedule of Investments.
4. Purchases and Sales of Investments.
Purchases and sales of securities, other than short-term securities, aggregated $2,611,613,443 and $3,004,755,924, respectively.
5. Fees and Other Transactions with Affiliates.
Management Fee. Fidelity Management & Research Company (the investment adviser) and its affiliates provide the Fund with investment management related services for which the Fund pays a monthly management fee. The management fee is the sum of an individual fund fee rate that is based on an annual rate of .30% of the Fund's average net assets and an annualized group fee rate that averaged .25% during the period. The group fee rate is based upon the average net assets of all the mutual funds advised by the investment adviser, including any mutual funds previously advised by the investment adviser that are currently advised by Fidelity SelectCo, LLC, an affiliate of the investment adviser. The group fee rate decreases as assets under management increase and increases as assets under management decrease. In addition, the management fee is subject to a performance adjustment (up to a maximum of +/- .20% of the Fund's average net assets over a 36 month performance period). The upward or downward adjustment to the management fee is based on the relative investment performance of Mid Cap Value as compared to its benchmark index, the Russell Midcap Value Index, over the same 36 month performance period. For the reporting period, the total annual management fee rate, including the performance adjustment, was .50% of the Fund's average net assets. The performance adjustment included in the management fee rate may be higher or lower than the maximum performance adjustment rate due to the difference between the average net assets for the reporting and performance periods.
Distribution and Service Plan Fees. In accordance with Rule 12b-1 of the 1940 Act, the Fund has adopted separate Distribution and Service Plans for each class of shares, except for the Class I. Certain classes pay Fidelity Distributors Corporation (FDC), an affiliate of the investment adviser, separate Distribution and Service Fees, each of which is based on an annual percentage of each class' average net assets. In addition, FDC may pay financial intermediaries for selling shares of the Fund and providing shareholder support services. For the period, the Distribution and Service Fee rates, total fees and amounts retained by FDC were as follows:
| | Distribution
Fee | Service
Fee | Total Fees | Retained
by FDC |
| Class A | -% | .25% | $731,756 | $6,113 |
| Class T | .25% | .25% | 258,545 | – |
| Class B | .75% | .25% | 4,163 | 3,127 |
| Class C | .75% | .25% | 1,404,443 | 428,535 |
| | | | $2,398,907 | $437,775 |
Sales Load. FDC may receive a front-end sales charge of up to 5.75% for selling Class A shares and 3.50% for selling Class T shares, some of which is paid to financial intermediaries for selling shares of the Fund. Depending on the holding period, FDC may receive contingent deferred sales charges levied on Class A, Class T, Class B, and Class C redemptions. The deferred sales charges range from 5.00% to 1.00% for Class B shares, 1.00% for Class C shares, 1.00% for certain purchases of Class A shares and .25% for certain purchases of Class T shares.
For the period, sales charge amounts retained by FDC were as follows:
| | Retained
by FDC |
| Class A | $111,187 |
| Class T | 14,983 |
| Class B(a) | 160 |
| Class C(a) | 30,275 |
| | $156,605 |
(a) When Class B and Class C shares are initially sold, FDC pays commissions from its own resources to financial intermediaries through which the sales are made.
Transfer Agent Fees. Fidelity Investments Institutional Operations Company, Inc., (FIIOC), an affiliate of the investment adviser, is the transfer, dividend disbursing and shareholder servicing agent for each class of the Fund. FIIOC receives account fees and asset-based fees that vary according to the account size and type of account of the shareholders of the respective classes of the Fund. FIIOC pays for typesetting, printing and mailing of shareholder reports, except proxy statements.
For the period, transfer agent fees for each class were as follows:
| | Amount | % of
Class-Level Average
Net Assets |
| Class A | $640,751 | .22 |
| Class T | 130,881 | .25 |
| Class B | 1,113 | .27 |
| Class C | 304,306 | .22 |
| Mid Cap Value | 4,449,318 | .19 |
| Class I | 604,798 | .19 |
| | $6,131,167 | |
Accounting and Security Lending Fees. Fidelity Service Company, Inc. (FSC), an affiliate of the investment adviser, maintains the Fund's accounting records. The accounting fee is based on the level of average net assets for each month. Under a separate contract, FSC administers the security lending program. The security lending fee is based on the number and duration of lending transactions.
Brokerage Commissions. The Fund placed a portion of its portfolio transactions with brokerage firms which are affiliates of the investment adviser. Brokerage commissions are included in net realized gain (loss) and change in net unrealized appreciation (depreciation) in the Statement of Operations. The commissions paid to these affiliated firms were $98,742 for the period.
Interfund Trades. The Fund may purchase from or sell securities to other Fidelity Funds under procedures adopted by the Board. The procedures have been designed to ensure these interfund trades are executed in accordance with Rule 17a-7 of the 1940 Act. Interfund trades are included within the respective purchases and sales amounts shown in the Purchases and Sales of Investments note.
6. Committed Line of Credit.
The Fund participates with other funds managed by the investment adviser or an affiliate in a $4.25 billion credit facility (the "line of credit") to be utilized for temporary or emergency purposes to fund shareholder redemptions or for other short-term liquidity purposes. The Fund has agreed to pay commitment fees on its pro-rata portion of the line of credit, which amounted to $9,668 and is reflected in Miscellaneous expenses on the Statement of Operations. During the period, the Fund did not borrow on this line of credit.
7. Security Lending.
The Fund lends portfolio securities through a lending agent from time to time in order to earn additional income. For equity securities, a lending agent is used and may loan securities to certain qualified borrowers, including Fidelity Capital Markets (FCM), a broker-dealer affiliated with the Fund. On the settlement date of the loan, the Fund receives collateral (in the form of U.S. Treasury obligations, letters of credit and/or cash) against the loaned securities and maintains collateral in an amount not less than 100% of the market value of the loaned securities during the period of the loan. The market value of the loaned securities is determined at the close of business of the Fund and any additional required collateral is delivered to the Fund on the next business day. The Fund or borrower may terminate the loan at any time, and if the borrower defaults on its obligation to return the securities loaned because of insolvency or other reasons, the Fund may apply collateral received from the borrower against the obligation. The Fund may experience delays and costs in recovering the securities loaned. Any cash collateral received is invested in the Fidelity Securities Lending Cash Central Fund. The value of loaned securities and cash collateral at period end are disclosed on the Fund's Statement of Assets and Liabilities. At period end, there were no security loans outstanding with FCM. Security lending income represents the income earned on investing cash collateral, less rebates paid to borrowers and any lending agent fees associated with the loan, plus any premium payments received for lending certain types of securities. Security lending income is presented in the Statement of Operations as a component of income from Fidelity Central Funds. Total security lending income during the period amounted to $388,531, including $12,851 from securities loaned to FCM.
8. Expense Reductions.
Commissions paid to certain brokers with whom the investment adviser, or its affiliates, places trades on behalf of the Fund include an amount in addition to trade execution, which may be rebated back to the Fund to offset certain expenses. This amount totaled $142,888 for the period. In addition, through arrangements with the Fund's custodian, credits realized as a result of certain uninvested cash balances were used to reduce the Fund's expenses. During the period, these credits reduced the Fund's custody expenses by $2,404.
In addition, during the period the investment advisor reimbursed and/or waived a portion of fund-level operating expenses in the amount of $27,230.
9. Distributions to Shareholders.
Distributions to shareholders of each class were as follows:
| | Year ended
January 31, 2017 | Year ended
January 31, 2016 |
| From net investment income | | |
| Class A | $3,240,040 | $3,590,650 |
| Class T | 485,923 | 450,830 |
| Class C | 670,220 | 957,929 |
| Mid Cap Value | 31,956,186 | 38,962,949 |
| Class I | 4,734,732 | 4,275,970 |
| Total | $41,087,101 | $48,238,328 |
| From net realized gain | | |
| Class A | $– | $9,802,091 |
| Class T | – | 1,753,515 |
| Class B | – | 54,117 |
| Class C | – | 4,641,645 |
| Mid Cap Value | – | 97,878,091 |
| Class I | – | 9,591,541 |
| Total | $– | $123,721,000 |
10. Share Transactions.
Share transactions for each class were as follows and may contain automatic conversions between classes or exchanges between affiliated funds:
| | Shares | Shares | Dollars | Dollars |
| | Year ended January 31, 2017 | Year ended January 31, 2016 | Year ended January 31, 2017 | Year ended January 31, 2016 |
| Class A | | | | |
| Shares sold | 4,061,771 | 9,081,738 | $92,401,738 | $218,832,696 |
| Reinvestment of distributions | 126,883 | 583,393 | 3,145,426 | 12,803,794 |
| Shares redeemed | (5,714,824) | (3,310,982) | (130,944,178) | (76,794,668) |
| Net increase (decrease) | (1,526,170) | 6,354,149 | $(35,397,014) | $154,841,822 |
| Class T | | | | |
| Shares sold | 833,265 | 1,181,705 | $19,150,838 | $28,521,084 |
| Reinvestment of distributions | 19,366 | 98,288 | 478,331 | 2,163,028 |
| Shares redeemed | (659,446) | (738,423) | (14,982,028) | (17,743,135) |
| Net increase (decrease) | 193,185 | 541,570 | $4,647,141 | $12,940,977 |
| Class B | | | | |
| Shares sold | 2,126 | 10,778 | $42,739 | $261,816 |
| Reinvestment of distributions | – | 2,323 | – | 51,564 |
| Shares redeemed | (59,169) | (51,733) | (1,292,132) | (1,224,693) |
| Net increase (decrease) | (57,043) | (38,632) | $(1,249,393) | $(911,313) |
| Class C | | | | |
| Shares sold | 1,618,271 | 4,251,099 | $35,957,291 | $100,518,623 |
| Reinvestment of distributions | 26,040 | 239,960 | 627,560 | 5,124,148 |
| Shares redeemed | (2,224,436) | (1,002,857) | (49,614,483) | (22,726,253) |
| Net increase (decrease) | (580,125) | 3,488,202 | $(13,029,632) | $82,916,518 |
| Mid Cap Value | | | | |
| Shares sold | 16,140,186 | 58,089,867 | $372,060,966 | $1,426,603,937 |
| Reinvestment of distributions | 1,217,324 | 5,832,007 | 30,530,476 | 130,161,634 |
| Shares redeemed | (33,547,192) | (63,081,592) | (774,130,054) | (1,492,965,304) |
| Net increase (decrease) | (16,189,682) | 840,282 | $(371,538,612) | $63,800,267 |
| Class I | | | | |
| Shares sold | 7,909,760 | 11,498,838 | $179,687,090 | $278,387,809 |
| Reinvestment of distributions | 178,757 | 559,848 | 4,451,059 | 12,321,209 |
| Shares redeemed | (6,257,939) | (5,547,072) | (142,494,098) | (128,465,964) |
| Net increase (decrease) | 1,830,578 | 6,511,614 | $41,644,051 | $162,243,054 |
11. Other.
The Fund's organizational documents provide former and current trustees and officers with a limited indemnification against liabilities arising in connection with the performance of their duties to the Fund. In the normal course of business, the Fund may also enter into contracts that provide general indemnifications. The Fund's maximum exposure under these arrangements is unknown as this would be dependent on future claims that may be made against the Fund. The risk of material loss from such claims is considered remote.
Report of Independent Registered Public Accounting Firm
To the Trustees of Fidelity Devonshire Trust and Shareholders of Fidelity Mid Cap Value Fund:
In our opinion, the accompanying statement of assets and liabilities, including the schedule of investments, and the related statements of operations and of changes in net assets and the financial highlights present fairly, in all material respects, the financial position of Fidelity Mid Cap Value Fund (a fund of Fidelity Devonshire Trust) as of January 31, 2017, the results of its operations for the year then ended, the changes in its net assets for each of the two years in the period then ended and the financial highlights for each of the five years in the period then ended, in conformity with accounting principles generally accepted in the United States of America. These financial statements and financial highlights (hereafter referred to as “financial statements”) are the responsibility of the Fidelity Mid Cap Value Fund’s management. Our responsibility is to express an opinion on these financial statements based on our audits. We conducted our audits of these financial statements in accordance with the standards of the Public Company Accounting Oversight Board (United States). Those standards require that we plan and perform the audit to obtain reasonable assurance about whether the financial statements are free of material misstatement. An audit includes examining, on a test basis, evidence supporting the amounts and disclosures in the financial statements, assessing the accounting principles used and significant estimates made by management, and evaluating the overall financial statement presentation. We believe that our audits, which included confirmation of securities as of January 31, 2017 by correspondence with the custodian and brokers, provide a reasonable basis for our opinion.
PricewaterhouseCoopers LLP
Boston, Massachusetts
March 14, 2017
Trustees and Officers
The Trustees, Members of the Advisory Board (if any), and officers of the trust and fund, as applicable, are listed below. The Board of Trustees governs the fund and is responsible for protecting the interests of shareholders. The Trustees are experienced executives who meet periodically throughout the year to oversee the fund's activities, review contractual arrangements with companies that provide services to the fund, oversee management of the risks associated with such activities and contractual arrangements, and review the fund's performance. Each of the Trustees oversees 169 funds.
The Trustees hold office without limit in time except that (a) any Trustee may resign; (b) any Trustee may be removed by written instrument, signed by at least two-thirds of the number of Trustees prior to such removal; (c) any Trustee who requests to be retired or who has become incapacitated by illness or injury may be retired by written instrument signed by a majority of the other Trustees; and (d) any Trustee may be removed at any special meeting of shareholders by a two-thirds vote of the outstanding voting securities of the trust. Each Trustee who is not an interested person (as defined in the 1940 Act) of the trust and the fund is referred to herein as an Independent Trustee. Each Independent Trustee shall retire not later than the last day of the calendar year in which his or her 75th birthday occurs. The Independent Trustees may waive this mandatory retirement age policy with respect to individual Trustees. Officers and Advisory Board Members hold office without limit in time, except that any officer or Advisory Board Member may resign or may be removed by a vote of a majority of the Trustees at any regular meeting or any special meeting of the Trustees. Except as indicated, each individual has held the office shown or other offices in the same company for the past five years.
The fund’s Statement of Additional Information (SAI) includes more information about the Trustees. To request a free copy, call Fidelity at 1-800-544-8544.
Experience, Skills, Attributes, and Qualifications of the Trustees. The Governance and Nominating Committee has adopted a statement of policy that describes the experience, qualifications, attributes, and skills that are necessary and desirable for potential Independent Trustee candidates (Statement of Policy). The Board believes that each Trustee satisfied at the time he or she was initially elected or appointed a Trustee, and continues to satisfy, the standards contemplated by the Statement of Policy. The Governance and Nominating Committee also engages professional search firms to help identify potential Independent Trustee candidates who have the experience, qualifications, attributes, and skills consistent with the Statement of Policy. From time to time, additional criteria based on the composition and skills of the current Independent Trustees, as well as experience or skills that may be appropriate in light of future changes to board composition, business conditions, and regulatory or other developments, have also been considered by the professional search firms and the Governance and Nominating Committee. In addition, the Board takes into account the Trustees' commitment and participation in Board and committee meetings, as well as their leadership of standing and ad hoc committees throughout their tenure.
In determining that a particular Trustee was and continues to be qualified to serve as a Trustee, the Board has considered a variety of criteria, none of which, in isolation, was controlling. The Board believes that, collectively, the Trustees have balanced and diverse experience, qualifications, attributes, and skills, which allow the Board to operate effectively in governing the fund and protecting the interests of shareholders. Information about the specific experience, skills, attributes, and qualifications of each Trustee, which in each case led to the Board's conclusion that the Trustee should serve (or continue to serve) as a trustee of the fund, is provided below.
Board Structure and Oversight Function. James C. Curvey is an interested person and currently serves as Chairman. The Trustees have determined that an interested Chairman is appropriate and benefits shareholders because an interested Chairman has a personal and professional stake in the quality and continuity of services provided to the fund. Independent Trustees exercise their informed business judgment to appoint an individual of their choosing to serve as Chairman, regardless of whether the Trustee happens to be independent or a member of management. The Independent Trustees have determined that they can act independently and effectively without having an Independent Trustee serve as Chairman and that a key structural component for assuring that they are in a position to do so is for the Independent Trustees to constitute a substantial majority for the Board. The Independent Trustees also regularly meet in executive session. Ned C. Lautenbach serves as Chairman of the Independent Trustees and as such (i) acts as a liaison between the Independent Trustees and management with respect to matters important to the Independent Trustees and (ii) with management prepares agendas for Board meetings.
Fidelity® funds are overseen by different Boards of Trustees. The fund's Board oversees Fidelity's high income and certain equity funds, and other Boards oversee Fidelity's investment-grade bond, money market, asset allocation, and sector funds. The asset allocation funds may invest in Fidelity® funds overseen by the fund's Board. The use of separate Boards, each with its own committee structure, allows the Trustees of each group of Fidelity® funds to focus on the unique issues of the funds they oversee, including common research, investment, and operational issues. On occasion, the separate Boards establish joint committees to address issues of overlapping consequences for the Fidelity® funds overseen by each Board.
The Trustees operate using a system of committees to facilitate the timely and efficient consideration of all matters of importance to the Trustees, the fund, and fund shareholders and to facilitate compliance with legal and regulatory requirements and oversight of the fund's activities and associated risks. The Board, acting through its committees, has charged FMR and its affiliates with (i) identifying events or circumstances the occurrence of which could have demonstrably adverse effects on the fund's business and/or reputation; (ii) implementing processes and controls to lessen the possibility that such events or circumstances occur or to mitigate the effects of such events or circumstances if they do occur; and (iii) creating and maintaining a system designed to evaluate continuously business and market conditions in order to facilitate the identification and implementation processes described in (i) and (ii) above. Because the day-to-day operations and activities of the fund are carried out by or through FMR, its affiliates, and other service providers, the fund's exposure to risks is mitigated but not eliminated by the processes overseen by the Trustees. While each of the Board's committees has responsibility for overseeing different aspects of the fund's activities, oversight is exercised primarily through the Operations, Audit, and Compliance Committees. In addition, the Independent Trustees have worked with FMR to enhance the Board's oversight of investment and financial risks, legal and regulatory risks, technology risks, and operational risks, including the development of additional risk reporting to the Board. For example, a working group comprised of Independent Trustees and FMR has worked and continues to work to review the Fidelity® funds' valuation-related activities, reporting and risk management. Appropriate personnel, including but not limited to the fund's Chief Compliance Officer (CCO), FMR's internal auditor, the independent accountants, the fund's Treasurer and portfolio management personnel, make periodic reports to the Board's committees, as appropriate, including an annual review of Fidelity's risk management program for the Fidelity® funds. The responsibilities of each standing committee, including their oversight responsibilities, are described further under "Standing Committees of the Trustees."
Interested Trustees*:
Correspondence intended for a Trustee who is an interested person may be sent to Fidelity Investments, 245 Summer Street, Boston, Massachusetts 02210.
Name, Year of Birth; Principal Occupations and Other Relevant Experience+
James C. Curvey (1935)
Year of Election or Appointment: 2007
Trustee
Chairman of the Board of Trustees
Mr. Curvey also serves as Trustee of other Fidelity® funds. Mr. Curvey is a Director of Fidelity Research & Analysis Co. (investment adviser firm, 2009-present), and Vice Chairman (2007-present) and Director of FMR LLC (diversified financial services company). In addition, Mr. Curvey serves as an Overseer for the Boston Symphony Orchestra and a member of the board of Artis-Naples, Naples, Florida, and as a Trustee for Brewster Academy, Wolfeboro, New Hampshire. Previously, Mr. Curvey served as a Director of Fidelity Investments Money Management, Inc. (investment adviser firm, 2009-2014) and a Director of FMR and FMR Co., Inc. (investment adviser firms, 2007-2014).
Charles S. Morrison (1960)
Year of Election or Appointment: 2014
Trustee
Mr. Morrison also serves as Trustee of other funds. He serves as President of Fidelity Management & Research Company (FMR) (investment adviser firm, 2016-present), a Director of Fidelity Investments Money Management, Inc. (FIMM) (investment adviser firm, 2014-present), Director of Fidelity SelectCo, LLC (investment adviser firm, 2014-present), President, Asset Management (2014-present), and is an employee of Fidelity Investments. Previously, Mr. Morrison served as Vice President of Fidelity's Fixed Income and Asset Allocation Funds (2012-2014), President, Fixed Income (2011-2014), Vice President of Fidelity's Money Market Funds (2005-2009), President, Money Market Group Leader of FMR (investment adviser firm, 2009), and Senior Vice President, Money Market Group of FMR (2004-2009). Mr. Morrison also served as Vice President of Fidelity's Bond Funds (2002-2005), certain Balanced Funds (2002-2005), and certain Asset Allocation Funds (2002-2007), and as Senior Vice President (2002-2005) of Fidelity's Bond Division.
* Determined to be an “Interested Trustee” by virtue of, among other things, his or her affiliation with the trust or various entities under common control with FMR.
+ The information includes the Trustee's principal occupation during the last five years and other information relating to the experience, attributes, and skills relevant to the Trustee's qualifications to serve as a Trustee, which led to the conclusion that the Trustee should serve as a Trustee for the fund.
Independent Trustees:
Correspondence intended for an Independent Trustee may be sent to Fidelity Investments, P.O. Box 55235, Boston, Massachusetts 02205-5235.
Name, Year of Birth; Principal Occupations and Other Relevant Experience+
Dennis J. Dirks (1948)
Year of Election or Appointment: 2005
Trustee
Mr. Dirks also serves as Trustee of other Fidelity® funds. Prior to his retirement in May 2003, Mr. Dirks was Chief Operating Officer and a member of the Board of The Depository Trust & Clearing Corporation (DTCC). He also served as President, Chief Operating Officer, and Board member of The Depository Trust Company (DTC) and President and Board member of the National Securities Clearing Corporation (NSCC). In addition, Mr. Dirks served as Chief Executive Officer and Board member of the Government Securities Clearing Corporation, Chief Executive Officer and Board member of the Mortgage-Backed Securities Clearing Corporation, as a Trustee and a member of the Finance Committee of Manhattan College (2005-2008), as a Trustee and a member of the Finance Committee of AHRC of Nassau County (2006-2008), and as a member of the Independent Directors Council (IDC) Governing Council (2010-2015). Mr. Dirks is a member of the Board of Directors for The Brookville Center for Children's Services, Inc. (2009-present) and the Finance Committee of the Asolo Repertory Theatre (2016-present).
Alan J. Lacy (1953)
Year of Election or Appointment: 2008
Trustee
Mr. Lacy also serves as Trustee of other Fidelity® funds. Mr. Lacy serves as Chairman (2014-present) and a member (2010-present) of the Board of Directors of Dave & Buster's Entertainment, Inc. (restaurant and entertainment complexes) and a Director of Bristol-Myers Squibb Company (global pharmaceuticals, 2008-present). He is a Trustee of the California Chapter of The Nature Conservancy (2015-present) and a Director of the Center for Advanced Study in the Behavioral Sciences at Stanford University (2015-present). In addition, Mr. Lacy served as Senior Adviser (2007-2014) of Oak Hill Capital Partners, L.P. (private equity) and also served as Chief Executive Officer (2005) and Vice Chairman (2005-2006) of Sears Holdings Corporation (retail) and Chief Executive Officer and Chairman of the Board of Sears, Roebuck and Co. (retail, 2000-2005). Previously, Mr. Lacy served as Chairman (2008-2011) and a member (2006-2015) of the Board of Trustees of the National Parks Conservation Association and as a member of the Board of Directors for The Western Union Company (global money transfer, 2006-2011), The Hillman Companies, Inc. (hardware wholesalers, 2010-2014), and Earth Fare, Inc. (retail grocery, 2010-2014).
Ned C. Lautenbach (1944)
Year of Election or Appointment: 2000
Trustee
Chairman of the Independent Trustees
Mr. Lautenbach also serves as Trustee of other Fidelity® funds. Mr. Lautenbach currently serves as the Lead Director of the Eaton Corporation Board of Directors (diversified industrial, 1997-present). Mr. Lautenbach is Chairman of the Board of Directors of Artis-Naples in Naples, Florida (2012-present), a member of the Council on Foreign Relations (1994-present), and currently Vice Chair of the Board of Governors, State University System of Florida (2013-present). Previously, Mr. Lautenbach was a Partner and Advisory Partner at Clayton, Dubilier & Rice, LLC (private equity investment, 1998-2010), as well as a Director of Sony Corporation (2006-2007). Mr. Lautenbach also had a 30-year career with IBM (technology company) during which time he served as Senior Vice President and a member of the Corporate Executive Committee (1968-1998).
Joseph Mauriello (1944)
Year of Election or Appointment: 2008
Trustee
Mr. Mauriello also serves as Trustee of other Fidelity® funds. Prior to his retirement in January 2006, Mr. Mauriello served in numerous senior management positions including Deputy Chairman and Chief Operating Officer (2004-2005), and Vice Chairman of Financial Services (2002-2004) of KPMG LLP US (professional services, 1965-2005). Mr. Mauriello currently serves as a member of the Board of Directors of XL Group plc. (global insurance and re-insurance, 2006-present) and the Independent Directors Council (IDC) Governing Council (2015-present). Previously, Mr. Mauriello served as a Director of the Hamilton Funds of the Bank of New York (2006-2007) and of Arcadia Resources Inc. (health care services and products, 2007-2012).
Robert W. Selander (1950)
Year of Election or Appointment: 2011
Trustee
Mr. Selander also serves as Trustee of other Fidelity® funds. Mr. Selander serves as a Director of The Western Union Company (global money transfer, 2014-present) and a non-executive Chairman of Health Equity, Inc. (health savings custodian, 2015-present). Previously, Mr. Selander served as a Member of the Advisory Board of certain Fidelity® funds (2011), and Executive Vice Chairman (2010), Chief Executive Officer (2009-2010), and President and Chief Executive Officer (1997-2009) of Mastercard, Inc.
Cornelia M. Small (1944)
Year of Election or Appointment: 2005
Trustee
Ms. Small also serves as Trustee of other Fidelity® funds. Ms. Small is a member of the Board of Directors (2009-present) and Chair of the Investment Committee (2010-present) of the Teagle Foundation. Ms. Small also serves on the Investment Committee of the Berkshire Taconic Community Foundation (2008-present). Previously, Ms. Small served as Chairperson (2002-2008) and a member of the Investment Committee and Chairperson (2008-2012) and a member of the Board of Trustees of Smith College. In addition, Ms. Small served as Chief Investment Officer, Director of Global Equity Investments, and a member of the Board of Directors of Scudder, Stevens & Clark and Scudder Kemper Investments.
William S. Stavropoulos (1939)
Year of Election or Appointment: 2002
Trustee
Vice Chairman of the Independent Trustees
Mr. Stavropoulos also serves as Trustee of other Fidelity® funds. Mr. Stavropoulos serves as President and Founder of the Michigan Baseball Foundation, the Great Lakes Loons (2007-present). Mr. Stavropoulos is Chairman Emeritus of the Board of Directors of The Dow Chemical Company, where he previously served in numerous senior management positions, including President, CEO (1995-2000; 2002-2004), Chairman of the Executive Committee (2000-2006), and as a member of the Board of Directors (1990-2006). Currently, Mr. Stavropoulos is Chairman of the Board of Directors of Univar Inc. (global distributor of commodity and specialty chemicals), a Director of Teradata Corporation (data warehousing and technology solutions), and a member of the Advisory Board for Metalmark Capital LLC (private equity investment, 2005-present). Mr. Stavropoulos is an operating advisor to Clayton, Dubilier & Rice, LLC (private equity investment). In addition, Mr. Stavropoulos is a member of the University of Notre Dame Advisory Council for the College of Science, a Trustee of the Rollin L. Gerstacker Foundation, and a Director of Artis-Naples in Naples, Florida. Previously, Mr. Stavropoulos served as a Director of Chemical Financial Corporation (bank holding company, 1993-2012) and Tyco International, Ltd. (multinational manufacturing and services, 2007-2012).
David M. Thomas (1949)
Year of Election or Appointment: 2008
Trustee
Mr. Thomas also serves as Trustee of other Fidelity® funds. Mr. Thomas serves as Non-Executive Chairman of the Board of Directors of Fortune Brands Home and Security (home and security products, 2011-present), as a member of the Board of Directors (2004-present) and Presiding Director (2013-present) of Interpublic Group of Companies, Inc. (marketing communication), and as a member of the Board of Trustees of the University of Florida (2013-present). Previously, Mr. Thomas served as Executive Chairman (2005-2006) and Chairman and Chief Executive Officer (2000-2005) of IMS Health, Inc. (pharmaceutical and healthcare information solutions), and a Director of Fortune Brands, Inc. (consumer products, 2000-2011).
+ The information includes the Trustee's principal occupation during the last five years and other information relating to the experience, attributes, and skills relevant to the Trustee's qualifications to serve as a Trustee, which led to the conclusion that the Trustee should serve as a Trustee for the fund.
Advisory Board Members and Officers:
Correspondence intended for an officer or Peter S. Lynch may be sent to Fidelity Investments, 245 Summer Street, Boston, Massachusetts 02210. Officers appear below in alphabetical order.
Name, Year of Birth; Principal Occupation
Peter S. Lynch (1944)
Year of Election or Appointment: 2003
Member of the Advisory Board
Mr. Lynch also serves as Member of the Advisory Board of other Fidelity® funds. Mr. Lynch is Vice Chairman and a Director of FMR (investment adviser firm) and FMR Co., Inc. (investment adviser firm). In addition, Mr. Lynch serves as a Trustee of Boston College and as the Chairman of the Inner-City Scholarship Fund. Previously, Mr. Lynch served on the Special Olympics International Board of Directors (1997-2006).
Elizabeth Paige Baumann (1968)
Year of Election or Appointment: 2017
Interim Anti-Money Laundering (AML) Officer
Ms. Baumann also serves as AML Officer of other funds. She is Chief AML Officer (2012-present) and Senior Vice President (2014-present) of FMR LLC (diversified financial services company) and is an employee of Fidelity Investments. Previously, Ms. Baumann served as AML Officer (2012-2016), Vice President (2007-2014), and Deputy Anti-Money Laundering Officer (2007-2012).
Marc R. Bryant (1966)
Year of Election or Appointment: 2015
Secretary and Chief Legal Officer (CLO)
Mr. Bryant also serves as Secretary and CLO of other funds. Mr. Bryant serves as CLO, Secretary, and Senior Vice President of Fidelity Management & Research Company (investment adviser firm, 2015-present) and FMR Co., Inc. (investment adviser firm, 2015-present); Secretary of Fidelity SelectCo, LLC (investment adviser firm, 2015-present) and Fidelity Investments Money Management, Inc. (investment adviser firm, 2015-present); and CLO of Fidelity Management & Research (Hong Kong) Limited and FMR Investment Management (UK) Limited (investment adviser firms, 2015-present) and Fidelity Management & Research (Japan) Limited (investment adviser firm, 2016-present). He is Senior Vice President and Deputy General Counsel of FMR LLC (diversified financial services company). Previously, Mr. Bryant served as Secretary and CLO of Fidelity Rutland Square Trust II (2010-2014) and Assistant Secretary of Fidelity's Fixed Income and Asset Allocation Funds (2013-2015). Prior to joining Fidelity Investments, Mr. Bryant served as a Senior Vice President and the Head of Global Retail Legal for AllianceBernstein L.P. (2006-2010), and as the General Counsel for ProFund Advisors LLC (2001-2006).
Jeffrey S. Christian (1961)
Year of Election or Appointment: 2016
Assistant Treasurer
Mr. Christian also serves as Assistant Treasurer of other funds. Mr. Christian is an employee of Fidelity Investments (2003-present).
William C. Coffey (1969)
Year of Election or Appointment: 2009
Assistant Secretary
Mr. Coffey also serves as Assistant Secretary of other funds. He is Senior Vice President and Deputy General Counsel of FMR LLC (diversified financial services company, 2010-present), and is an employee of Fidelity Investments. Previously, Mr. Coffey served as Vice President and Associate General Counsel of FMR LLC (2005-2009).
Jonathan Davis (1968)
Year of Election or Appointment: 2010
Assistant Treasurer
Mr. Davis also serves as Assistant Treasurer of other funds, and is an employee of Fidelity Investments. Previously, Mr. Davis served as Vice President and Associate General Counsel of FMR LLC (diversified financial services company, 2003-2010).
Adrien E. Deberghes (1967)
Year of Election or Appointment: 2016
Assistant Treasurer
Mr. Deberghes also serves as an officer of other funds. He serves as Executive Vice President of Fidelity Investments Money Management, Inc. (FIMM) (investment adviser firm, 2016-present) and is an employee of Fidelity Investments (2008-present). Prior to joining Fidelity Investments, Mr. Deberghes was Senior Vice President of Mutual Fund Administration at State Street Corporation (2007-2008), Senior Director of Mutual Fund Administration at Investors Bank & Trust (2005-2007), and Director of Finance for Dunkin' Brands (2000-2005). Previously, Mr. Deberghes served in other fund officer roles.
Stephanie J. Dorsey (1969)
Year of Election or Appointment: 2010
Assistant Treasurer
Ms. Dorsey also serves as an officer of other funds. She is an employee of Fidelity Investments (2008-present) and has served in other fund officer roles. Prior to joining Fidelity Investments, Ms. Dorsey served as Treasurer (2004-2008) of the JPMorgan Mutual Funds and Vice President (2004-2008) of JPMorgan Chase Bank.
Howard J. Galligan III (1966)
Year of Election or Appointment: 2014
Chief Financial Officer
Mr. Galligan also serves as Chief Financial Officer of other funds. Mr. Galligan serves as President of Fidelity Pricing and Cash Management Services (FPCMS) (2014-present) and as a Director of Strategic Advisers, Inc. (investment adviser firm, 2008-present). Previously, Mr. Galligan served as Chief Administrative Officer of Asset Management (2011-2014) and Chief Operating Officer and Senior Vice President of Investment Support for Strategic Advisers, Inc. (2003-2011).
Scott C. Goebel (1968)
Year of Election or Appointment: 2015
Vice President
Mr. Goebel serves as Vice President of other funds and is an employee of Fidelity Investments (2001-present). Previously, Mr. Goebel served as Senior Vice President of Fidelity Management & Research Company (FMR) (investment adviser firm, 2016), Secretary of Fidelity SelectCo, LLC (investment adviser firm, 2013-2015), Fidelity Investments Money Management, Inc. (FIMM) (investment adviser firm, 2010-2015), and Fidelity Research and Analysis Company (FRAC) (investment adviser firm, 2010-2015); General Counsel, Secretary, and Senior Vice President of FMR (investment adviser firm, 2008-2015) and FMR Co., Inc. (investment adviser firm, 2008-2015); Assistant Secretary of Fidelity Management & Research (Japan) Limited (investment adviser firm, 2008-2015) and Fidelity Management & Research (U.K.) Inc. (investment adviser firm, 2008-2015); Chief Legal Officer (CLO) of Fidelity Management & Research (Hong Kong) Limited (investment adviser firm, 2008-2015); Secretary and CLO of certain Fidelity® funds (2008-2015); Assistant Secretary of FIMM (2008-2010), FRAC (2008-2010), and certain funds (2007-2008); and as Vice President and Secretary of Fidelity Distributors Corporation (FDC) (2005-2007).
Thomas C. Hense (1964)
Year of Election or Appointment: 2008, 2010, or 2015
Vice President
Mr. Hense serves as Vice President of Fidelity Advisor® Multi-Asset Income Fund (2015) and other funds (High Income (2008), Small Cap (2008), and Value (2010) funds), and is an employee of Fidelity Investments (1993-present). Previously, Mr. Hense served as a portfolio manager for Fidelity's Institutional Money Management Group (Pyramis) (2003-2008).
Brian B. Hogan (1964)
Year of Election or Appointment: 2009
Vice President
Mr. Hogan also serves as Trustee or Vice President of other funds. Mr. Hogan serves as a Director of FMR Investment Management (UK) Limited (investment adviser firm, 2015-present) and Fidelity SelectCo, LLC (investment adviser firm, 2014-present) and President of the Equity Division of FMR (investment adviser firm, 2009-present). Previously, Mr. Hogan served as Senior Vice President, Equity Research of FMR (2006-2009) and as a portfolio manager. Mr. Brian B. Hogan is not related to Mr. Colm A. Hogan.
Colm A. Hogan (1973)
Year of Election or Appointment: 2016
Deputy Treasurer
Mr. Hogan also serves as an officer of other funds. Mr. Hogan is an employee of Fidelity Investments (2005-present). Mr. Colm A. Hogan is not related to Mr. Brian B. Hogan.
Chris Maher (1972)
Year of Election or Appointment: 2013
Assistant Treasurer
Mr. Maher serves as Assistant Treasurer of other funds. Mr. Maher is Vice President of Valuation Oversight and is an employee of Fidelity Investments. Previously, Mr. Maher served as Vice President of Asset Management Compliance (2013), Vice President of the Program Management Group of FMR (investment adviser firm, 2010-2013), and Vice President of Valuation Oversight (2008-2010).
Kenneth B. Robins (1969)
Year of Election or Appointment: 2016
Chief Compliance Officer
Mr. Robins also serves as an officer of other funds. Mr. Robins serves as Compliance Officer of Fidelity Management & Research Company and FMR Co., Inc. (investment adviser firms, 2016-present) and is an employee of Fidelity Investments (2004-present). Previously, Mr. Robins served as Executive Vice President of Fidelity Investments Money Management, Inc. (investment adviser firm, 2013-2016) and served in other fund officer roles.
Stacie M. Smith (1974)
Year of Election or Appointment: 2016
President and Treasurer
Ms. Smith also serves as an officer of other funds. She is an employee of Fidelity Investments (2009-present) and has served in other fund officer roles. Prior to joining Fidelity Investments, Ms. Smith served as Senior Audit Manager of Ernst & Young LLP (accounting firm, 1996-2009). Previously, Ms. Smith served as Deputy Treasurer of certain Fidelity® funds (2013-2016).
Marc L. Spector (1972)
Year of Election or Appointment: 2016
Assistant Treasurer
Mr. Spector also serves as an officer of other funds. Mr. Spector is an employee of Fidelity Investments (2016-present). Prior to joining Fidelity Investments, Mr. Spector served as Director at the Siegfried Group (accounting firm, 2013-2016), and prior to Siegfried Group as audit senior manager at Deloitte & Touche (accounting firm, 2005-2013).
Renee Stagnone (1975)
Year of Election or Appointment: 2016
Assistant Treasurer
Ms. Stagnone also serves as an officer of other funds. Ms. Stagnone is an employee of Fidelity Investments (1997-present). Previously, Ms. Stagnone served as Deputy Treasurer of certain Fidelity® funds (2013-2016).
Shareholder Expense Example
As a shareholder of the Fund, you incur two types of costs: (1) transaction costs, including sales charges (loads) on purchase payments or redemption proceeds, redemption fees and (2) ongoing costs, including management fees, distribution and/or service (12b-1) fees and other Fund expenses. This Example is intended to help you understand your ongoing costs (in dollars) of investing in the Fund and to compare these costs with the ongoing costs of investing in other mutual funds.
The Example is based on an investment of $1,000 invested at the beginning of the period and held for the entire period (August 1, 2016 to January 31, 2017).
Actual Expenses
The first line of the accompanying table for each class of the Fund provides information about actual account values and actual expenses. You may use the information in this line, together with the amount you invested, to estimate the expenses that you paid over the period. Simply divide your account value by $1,000.00 (for example, an $8,600 account value divided by $1,000.00 = 8.6), then multiply the result by the number in the first line for a class of the Fund under the heading entitled "Expenses Paid During Period" to estimate the expenses you paid on your account during this period. A small balance maintenance fee of $12.00 that is charged once a year may apply for certain accounts with a value of less than $2,000. This fee is not included in the table below. If it was, the estimate of expenses you paid during the period would be higher, and your ending account value lower, by this amount. In addition, the Fund, as a shareholder in the underlying Fidelity Central Funds, will indirectly bear its pro-rata share of the fees and expenses incurred by the underlying Fidelity Central Funds. These fees and expenses are not included in the Fund's annualized expense ratio used to calculate the expense estimate in the table below.
Hypothetical Example for Comparison Purposes
The second line of the accompanying table for each class of the Fund provides information about hypothetical account values and hypothetical expenses based on a Class' actual expense ratio and an assumed rate of return of 5% per year before expenses, which is not the Class' actual return. The hypothetical account values and expenses may not be used to estimate the actual ending account balance or expenses you paid for the period. You may use this information to compare the ongoing costs of investing in the Fund and other funds. To do so, compare this 5% hypothetical example with the 5% hypothetical examples that appear in the shareholder reports of the other funds. A small balance maintenance fee of $12.00 that is charged once a year may apply for certain accounts with a value of less than $2,000. This fee is not included in the table below. If it was, the estimate of expenses you paid during the period would be higher, and your ending account value lower, by this amount. In addition, the Fund, as a shareholder in the underlying Fidelity Central Funds, will indirectly bear its pro-rata share of the fees and expenses incurred by the underlying Fidelity Central Funds. These fees and expenses are not included in the Fund's annualized expense ratio used to calculate the expense estimate in the table below.
Please note that the expenses shown in the table are meant to highlight your ongoing costs only and do not reflect any transaction costs. Therefore, the second line of the table is useful in comparing ongoing costs only, and will not help you determine the relative total costs of owning different funds. In addition, if these transactional costs were included, your costs would have been higher.
| | Annualized Expense Ratio-A | Beginning
Account Value
August 1, 2016 | Ending
Account Value
January 31, 2017 | Expenses Paid
During Period-B
August 1, 2016
to January 31, 2017 |
| Class A | .97% | | | |
| Actual | | $1,000.00 | $1,083.00 | $5.08 |
| Hypothetical-C | | $1,000.00 | $1,020.26 | $4.93 |
| Class T | 1.25% | | | |
| Actual | | $1,000.00 | $1,081.50 | $6.54 |
| Hypothetical-C | | $1,000.00 | $1,018.85 | $6.34 |
| Class C | 1.72% | | | |
| Actual | | $1,000.00 | $1,079.10 | $8.99 |
| Hypothetical-C | | $1,000.00 | $1,016.49 | $8.72 |
| Mid Cap Value | .68% | | | |
| Actual | | $1,000.00 | $1,084.60 | $3.56 |
| Hypothetical-C | | $1,000.00 | $1,021.72 | $3.46 |
| Class I | .69% | | | |
| Actual | | $1,000.00 | $1,084.50 | $3.62 |
| Hypothetical-C | | $1,000.00 | $1,021.67 | $3.51 |
A Annualized expense ratio reflects expenses net of applicable fee waivers.
B Expenses are equal to each Class' annualized expense ratio, multiplied by the average account value over the period, multiplied by 184/366 (to reflect the one-half year period).
C 5% return per year before expenses
Distributions (Unaudited)
Mid Cap Value, Class A, Class T, Class C and Class I designate 100% of the dividends distributed during the fiscal year as qualifying for the dividends–received deduction for corporate shareholders.
Mid Cap Value, Class A, Class T, Class C and Class I designate 100% of the dividends distributed during the fiscal year as amounts which may be taken into account as a dividend for purposes of the maximum rate under section 1(h)(11) of the Internal Revenue Code.
The fund will notify shareholders in January 2018 of amounts for use in preparing 2017 income tax returns.
Corporate Headquarters
245 Summer St.
Boston, MA 02210
www.fidelity.com
MCV-ANN-0317
1.900180.107
Fidelity Advisor® Stock Selector Large Cap Value Fund - Class A, Class T, Class C and Class I
Annual Report January 31, 2017 Class A, Class T, Class C and Class I are classes of Fidelity® Stock Selector Large Cap Value Fund |
|
Contents
To view a fund's proxy voting guidelines and proxy voting record for the 12-month period ended June 30, visit http://www.fidelity.com/proxyvotingresults or visit the Securities and Exchange Commission's (SEC) web site at http://www.sec.gov.
You may also call 1-877-208-0098 to request a free copy of the proxy voting guidelines.
Standard & Poor's, S&P and S&P 500 are registered service marks of The McGraw-Hill Companies, Inc. and have been licensed for use by Fidelity Distributors Corporation.
Other third-party marks appearing herein are the property of their respective owners.
All other marks appearing herein are registered or unregistered trademarks or service marks of FMR LLC or an affiliated company. © 2017 FMR LLC. All rights reserved.
This report and the financial statements contained herein are submitted for the general information of the shareholders of the Fund. This report is not authorized for distribution to prospective investors in the Fund unless preceded or accompanied by an effective prospectus.
A fund files its complete schedule of portfolio holdings with the SEC for the first and third quarters of each fiscal year on Form N-Q. Forms N-Q are available on the SEC’s web site at http://www.sec.gov. A fund's Forms N-Q may be reviewed and copied at the SEC’s Public Reference Room in Washington, DC. Information regarding the operation of the SEC's Public Reference Room may be obtained by calling 1-800-SEC-0330.
For a complete list of a fund's portfolio holdings, view the most recent holdings listing, semiannual report, or annual report on Fidelity's web site at http://www.fidelity.com, http://www.institutional.fidelity.com, or http://www.401k.com, as applicable.
NOT FDIC INSURED •MAY LOSE VALUE •NO BANK GUARANTEE
Neither the Fund nor Fidelity Distributors Corporation is a bank.
Performance: The Bottom Line
Average annual total return reflects the change in the value of an investment, assuming reinvestment of distributions from dividend income and capital gains (the profits earned upon the sale of securities that have grown in value, if any) and assuming a constant rate of performance each year. The hypothetical investment and the average annual total returns do not reflect the deduction of taxes that a shareholder would pay on fund distributions or the redemption of fund shares. During periods of reimbursement by Fidelity, a fund’s total return will be greater than it would be had the reimbursement not occurred. How a fund did yesterday is no guarantee of how it will do tomorrow.
Average Annual Total Returns
| For the periods ended January 31, 2017 | Past 1 year | Past 5 years | Past 10 years |
| Class A (incl. 5.75% sales charge) | 15.44% | 11.69% | 3.36% |
| Class T (incl. 3.50% sales charge) | 17.77% | 11.87% | 3.29% |
| Class C (incl. contingent deferred sales charge) | 20.43% | 12.11% | 3.18% |
| Class I | 22.72% | 13.29% | 4.25% |
Class A shares bear a 0.25% 12b-1 fee. The initial offering of Class A shares took place on February 13, 2007. Returns prior to February 13, 2007, are those of Fidelity® Stock Selector Large Cap Value Fund, the original class of the fund, which has no 12b-1 fee. Had Class A's 12b-1 fee been reflected, returns prior to February 13, 2007, would have been lower.
Class T shares bear a 0.50% 12b-1 fee. The initial offering of Class T shares took place on February 13, 2007. Returns prior to February 13, 2007, are those of Fidelity® Stock Selector Large Cap Value Fund, the original class of the fund, which has no 12b-1 fee. Had Class T's 12b-1 fee been reflected, returns prior to February 13, 2007, would have been lower.
Class C shares bear a 1.00% 12b-1 fee. The initial offering of Class C shares took place on February 13, 2007. Returns prior to February 13, 2007, are those of Fidelity® Stock Selector Large Cap Value Fund, the original class of the fund, which has no 12b-1 fee. Had Class C's 12b-1 fee been reflected, returns prior to February 13, 2007, would have been lower.
Class C shares' contingent deferred sales charges included in the past one year, past five years and past ten years total return figures are 1%, 0% and 0%, respectively.
The initial offering of Class I shares took place on February 13, 2007. Returns prior to February 13, 2007 are those of Fidelity® Stock Selector Large Cap Value Fund, the original class of the fund.
$10,000 Over 10 Years
Let's say hypothetically that $10,000 was invested in Fidelity Advisor® Stock Selector Large Cap Value Fund - Class A on January 31, 2007, and the current 5.75% sales charge was paid.
The chart shows how the value of your investment would have changed, and also shows how the Russell 1000® Value Index performed over the same period.
See previous page for additional information regarding the performance of Class A.

| Period Ending Values |
| $13,917 | Fidelity Advisor® Stock Selector Large Cap Value Fund - Class A |
| $17,348 | Russell 1000® Value Index |
Management's Discussion of Fund Performance
Market Recap: The S&P 500
® index posted a 20.04% gain for the year ending January 31, 2017, rising sharply in the final months on renewed optimism for economic growth. The beginning of the period saw improving investor sentiment amid U.S. job gains, a rally in energy and other stimuli that helped keep the seven-year bull uptrend intact. Markets tumbled briefly following the U.K.'s June 23 vote to exit the European Union (Brexit) – then recovered quickly and settled into a flattish stretch until the November 8 U.S. presidential election. Stocks then broke out in response to Donald Trump's surprise victory, surging to a series of new all-time highs on expectations for reflation and fiscal stimulus. For the year, industrials (+28%), energy (+27%) and materials (+37%) all did well, the latter two driven by a cyclical rebound in commodity prices. Financials (+35%) also shined, riding an uptick in bond yields and the strong rally in banks (+41%), especially post-election. Information technology rose about 25%, despite cooling off in the fourth quarter of 2016. Conversely, real estate (+8%) lagged on the prospect of rising interest rates. An improved backdrop for riskier assets curbed dividend-rich telecom services (+13%), utilities (+12%) and consumer staples (+6%). Health care (+8%) underperformed amid an uncertain political and regulatory outlook.
Comments from Lead Portfolio Manager Matthew Friedman: For the year, the fund's share classes (excluding sales charges, if applicable) underperformed the 24.62% result of the benchmark Russell 1000
® Value Index. Versus the benchmark, the fund’s average cash position of 4% was by far the biggest drag on performance. Security and sector selection were modest contributors overall, driven by picks in technology. Conversely, picks in materials, health care and financials hurt. The fund’s two biggest relative detractors were major index components Bank of America (+63%), which we did not own, and JPMorgan Chase (+46%), an underweighting in the fund. Shares of both banking giants surged as investors expected higher interest rates to boost bank profits, among other factors. Within health care, our non-benchmark stakes in Ireland-based Jazz Pharmaceuticals and Allergan were hurt by market fear about generic-drug price deflation and uncertainty regarding future health care legislation. Allergan also was hurt by a failed merger attempt with industry giant Pfizer. Conversely, the fund’s top individual contributor was our holdings in rail operator CSX, the value of which doubled this period. It also helped to avoid integrated oil giant Exxon Mobil (+12%), a large index member that underperformed the strong gain of the benchmark.
The views expressed above reflect those of the portfolio manager(s) only through the end of the period as stated on the cover of this report and do not necessarily represent the views of Fidelity or any other person in the Fidelity organization. Any such views are subject to change at any time based upon market or other conditions and Fidelity disclaims any responsibility to update such views. These views may not be relied on as investment advice and, because investment decisions for a Fidelity fund are based on numerous factors, may not be relied on as an indication of trading intent on behalf of any Fidelity fund.
Note to shareholders: On June 17, 2016, John Sheehy joined Steve Barwikowski as Co-Portfolio Manager of the fund's information technology and telecommunication services sleeves, and on January 3, 2017, assumed sole management responsibilities.
Investment Summary (Unaudited)
Top Ten Stocks as of January 31, 2017
| | % of fund's net assets | % of fund's net assets 6 months ago |
| Berkshire Hathaway, Inc. Class B | 5.6 | 4.5 |
| Wells Fargo & Co. | 3.8 | 2.6 |
| Chevron Corp. | 3.0 | 2.7 |
| Procter & Gamble Co. | 2.8 | 3.2 |
| Suncor Energy, Inc. | 2.5 | 2.2 |
| ConocoPhillips Co. | 2.5 | 1.6 |
| Chubb Ltd. | 2.4 | 1.8 |
| Johnson & Johnson | 2.4 | 2.8 |
| AT&T, Inc. | 2.2 | 2.4 |
| Cisco Systems, Inc. | 2.1 | 1.3 |
| | 29.3 | |
Top Five Market Sectors as of January 31, 2017
| | % of fund's net assets | % of fund's net assets 6 months ago |
| Financials | 27.6 | 26.3 |
| Energy | 13.7 | 12.9 |
| Health Care | 10.2 | 11.0 |
| Information Technology | 9.4 | 9.4 |
| Industrials | 8.8 | 8.3 |
Prior period industry classifications reflect the categories in place as of the date indicated and have not been adjusted to reflect current industry classifications.
Asset Allocation (% of fund's net assets)
| As of January 31, 2017* |
| | Stocks | 98.6% |
| | Short-Term Investments and Net Other Assets (Liabilities) | 1.4% |

* Foreign investments - 10.8%
| As of July 31, 2016* |
| | Stocks and Equity Futures | 95.6% |
| | Short-Term Investments and Net Other Assets (Liabilities) | 4.4% |

* Foreign investments - 9.8%
Investments January 31, 2017
Showing Percentage of Net Assets
| Common Stocks - 97.8% | | | |
| | | Shares | Value |
| CONSUMER DISCRETIONARY - 5.5% | | | |
| Auto Components - 0.5% | | | |
| Delphi Automotive PLC | | 59,500 | $4,168,570 |
| Diversified Consumer Services - 0.7% | | | |
| ServiceMaster Global Holdings, Inc. (a) | | 148,833 | 5,503,844 |
| Household Durables - 0.7% | | | |
| Whirlpool Corp. | | 32,530 | 5,689,172 |
| Internet & Direct Marketing Retail - 0.5% | | | |
| Liberty Interactive Corp. QVC Group Series A (a) | | 181,414 | 3,479,521 |
| Leisure Products - 0.2% | | | |
| Mattel, Inc. | | 65,600 | 1,719,376 |
| Media - 2.1% | | | |
| Charter Communications, Inc. Class A (a) | | 6,455 | 2,091,097 |
| Liberty Broadband Corp. Class C (a) | | 54,787 | 4,675,523 |
| Time Warner, Inc. | | 20,677 | 2,002,567 |
| Twenty-First Century Fox, Inc. Class A | | 225,700 | 7,082,466 |
| | | | 15,851,653 |
| Multiline Retail - 0.8% | | | |
| Target Corp. | | 93,134 | 6,005,280 |
|
| TOTAL CONSUMER DISCRETIONARY | | | 42,417,416 |
|
| CONSUMER STAPLES - 8.2% | | | |
| Food & Staples Retailing - 1.9% | | | |
| Kroger Co. | | 77,100 | 2,618,316 |
| Wal-Mart Stores, Inc. | | 40,345 | 2,692,625 |
| Walgreens Boots Alliance, Inc. | | 111,840 | 9,164,170 |
| | | | 14,475,111 |
| Food Products - 2.4% | | | |
| Mondelez International, Inc. | | 99,100 | 4,388,148 |
| The J.M. Smucker Co. | | 51,642 | 7,015,566 |
| The Kraft Heinz Co. | | 73,500 | 6,562,815 |
| | | | 17,966,529 |
| Household Products - 2.8% | | | |
| Procter & Gamble Co. | | 248,280 | 21,749,328 |
| Personal Products - 0.3% | | | |
| Coty, Inc. Class A | | 135,200 | 2,595,840 |
| Tobacco - 0.8% | | | |
| Philip Morris International, Inc. | | 65,000 | 6,248,450 |
|
| TOTAL CONSUMER STAPLES | | | 63,035,258 |
|
| ENERGY - 13.7% | | | |
| Energy Equipment & Services - 2.0% | | | |
| Baker Hughes, Inc. | | 173,000 | 10,912,840 |
| Dril-Quip, Inc. (a) | | 77,600 | 4,826,720 |
| | | | 15,739,560 |
| Oil, Gas & Consumable Fuels - 11.7% | | | |
| Cabot Oil & Gas Corp. | | 139,100 | 2,987,868 |
| Cenovus Energy, Inc. | | 545,700 | 7,447,940 |
| Chevron Corp. | | 207,000 | 23,049,450 |
| ConocoPhillips Co. | | 386,700 | 18,855,492 |
| Diamondback Energy, Inc. (a) | | 74,200 | 7,803,614 |
| Phillips 66 Co. | | 124,700 | 10,178,014 |
| Suncor Energy, Inc. | | 619,000 | 19,199,109 |
| | | | 89,521,487 |
|
| TOTAL ENERGY | | | 105,261,047 |
|
| FINANCIALS - 27.6% | | | |
| Banks - 10.4% | | | |
| CIT Group, Inc. | | 147,000 | 6,054,930 |
| Comerica, Inc. | | 33,500 | 2,262,255 |
| First Citizen Bancshares, Inc. | | 14,700 | 5,391,078 |
| First Citizen Bancshares, Inc. Class A (a) | | 10,000 | 3,667,400 |
| JPMorgan Chase & Co. | | 111,800 | 9,461,634 |
| PNC Financial Services Group, Inc. | | 60,700 | 7,311,922 |
| Popular, Inc. | | 98,280 | 4,366,580 |
| U.S. Bancorp | | 223,300 | 11,756,745 |
| Wells Fargo & Co. | | 520,800 | 29,336,664 |
| | | | 79,609,208 |
| Capital Markets - 3.6% | | | |
| Fortress Investment Group LLC | | 523,300 | 2,935,713 |
| Franklin Resources, Inc. | | 78,000 | 3,099,720 |
| Goldman Sachs Group, Inc. | | 68,600 | 15,731,352 |
| Interactive Brokers Group, Inc. | | 150,800 | 5,630,872 |
| | | | 27,397,657 |
| Consumer Finance - 1.0% | | | |
| Discover Financial Services | | 111,000 | 7,690,080 |
| Diversified Financial Services - 5.6% | | | |
| Berkshire Hathaway, Inc. Class B (a) | | 263,457 | 43,243,831 |
| Insurance - 6.3% | | | |
| AFLAC, Inc. | | 119,450 | 8,360,306 |
| AMBAC Financial Group, Inc. (a) | | 180,000 | 3,765,600 |
| Chubb Ltd. | | 139,400 | 18,329,706 |
| Kansas City Life Insurance Co. | | 50,604 | 2,327,784 |
| National Western Life Group, Inc. | | 8,350 | 2,447,803 |
| Torchmark Corp. | | 104,725 | 7,701,477 |
| Universal Insurance Holdings, Inc. (b) | | 212,500 | 5,556,875 |
| | | | 48,489,551 |
| Thrifts & Mortgage Finance - 0.7% | | | |
| Meridian Bancorp, Inc. Maryland | | 284,164 | 5,356,491 |
|
| TOTAL FINANCIALS | | | 211,786,818 |
|
| HEALTH CARE - 10.2% | | | |
| Health Care Equipment & Supplies - 2.3% | | | |
| Abbott Laboratories | | 151,839 | 6,342,315 |
| Medtronic PLC | | 119,420 | 9,078,308 |
| Zimmer Biomet Holdings, Inc. | | 18,382 | 2,175,142 |
| | | | 17,595,765 |
| Health Care Providers & Services - 1.0% | | | |
| Aetna, Inc. | | 21,115 | 2,504,450 |
| Anthem, Inc. | | 15,837 | 2,441,115 |
| Cigna Corp. | | 14,632 | 2,139,491 |
| Humana, Inc. | | 2,900 | 575,650 |
| | | | 7,660,706 |
| Life Sciences Tools & Services - 0.4% | | | |
| Thermo Fisher Scientific, Inc. | | 19,870 | 3,027,989 |
| Pharmaceuticals - 6.5% | | | |
| Allergan PLC | | 14,040 | 3,073,216 |
| Jazz Pharmaceuticals PLC (a) | | 47,627 | 5,806,684 |
| Johnson & Johnson | | 161,802 | 18,324,077 |
| Merck & Co., Inc. | | 189,359 | 11,738,364 |
| Mylan N.V. (a) | | 25,800 | 981,690 |
| Pfizer, Inc. | | 308,771 | 9,797,304 |
| | | | 49,721,335 |
|
| TOTAL HEALTH CARE | | | 78,005,795 |
|
| INDUSTRIALS - 8.8% | | | |
| Aerospace & Defense - 1.3% | | | |
| Aerojet Rocketdyne Holdings, Inc. (a) | | 154,410 | 2,796,365 |
| Raytheon Co. | | 18,150 | 2,616,504 |
| United Technologies Corp. | | 38,370 | 4,208,038 |
| | | | 9,620,907 |
| Airlines - 1.0% | | | |
| American Airlines Group, Inc. | | 165,580 | 7,326,915 |
| Commercial Services & Supplies - 0.2% | | | |
| Stericycle, Inc. (a) | | 20,600 | 1,589,084 |
| Construction & Engineering - 1.3% | | | |
| AECOM (a) | | 277,870 | 10,261,739 |
| Electrical Equipment - 1.0% | | | |
| AMETEK, Inc. | | 75,980 | 3,882,578 |
| Fortive Corp. | | 70,160 | 3,880,550 |
| | | | 7,763,128 |
| Industrial Conglomerates - 1.9% | | | |
| General Electric Co. | | 486,480 | 14,448,456 |
| Machinery - 0.9% | | | |
| Deere & Co. | | 38,270 | 4,096,804 |
| Flowserve Corp. | | 64,940 | 3,192,450 |
| | | | 7,289,254 |
| Road & Rail - 1.2% | | | |
| CSX Corp. | | 183,660 | 8,519,987 |
| Union Pacific Corp. | | 7,250 | 772,705 |
| | | | 9,292,692 |
|
| TOTAL INDUSTRIALS | | | 67,592,175 |
|
| INFORMATION TECHNOLOGY - 9.4% | | | |
| Communications Equipment - 2.1% | | | |
| Cisco Systems, Inc. | | 512,700 | 15,750,144 |
| Electronic Equipment & Components - 0.9% | | | |
| Dell Technologies, Inc. (a) | | 105,800 | 6,664,342 |
| Internet Software & Services - 0.4% | | | |
| Alphabet, Inc. Class A (a) | | 3,900 | 3,198,741 |
| IT Services - 1.5% | | | |
| Amdocs Ltd. | | 110,650 | 6,496,262 |
| Cognizant Technology Solutions Corp. Class A (a) | | 33,000 | 1,735,470 |
| CoreLogic, Inc. (a) | | 48,800 | 1,721,176 |
| Total System Services, Inc. | | 35,500 | 1,799,140 |
| | | | 11,752,048 |
| Semiconductors & Semiconductor Equipment - 1.0% | | | |
| Qualcomm, Inc. | | 140,600 | 7,512,258 |
| Software - 1.8% | | | |
| Oracle Corp. | | 229,800 | 9,217,278 |
| SS&C Technologies Holdings, Inc. | | 146,600 | 4,710,258 |
| | | | 13,927,536 |
| Technology Hardware, Storage & Peripherals - 1.7% | | | |
| Apple, Inc. | | 82,100 | 9,962,835 |
| HP, Inc. | | 226,000 | 3,401,300 |
| | | | 13,364,135 |
|
| TOTAL INFORMATION TECHNOLOGY | | | 72,169,204 |
|
| MATERIALS - 3.0% | | | |
| Chemicals - 2.3% | | | |
| E.I. du Pont de Nemours & Co. | | 105,000 | 7,927,500 |
| Eastman Chemical Co. | | 52,300 | 4,053,250 |
| LyondellBasell Industries NV Class A | | 32,200 | 3,003,294 |
| Westlake Chemical Corp. | | 40,600 | 2,513,546 |
| | | | 17,497,590 |
| Containers & Packaging - 0.4% | | | |
| Ball Corp. | | 37,800 | 2,882,628 |
| Metals & Mining - 0.3% | | | |
| Compass Minerals International, Inc. (b) | | 33,300 | 2,783,880 |
|
| TOTAL MATERIALS | | | 23,164,098 |
|
| REAL ESTATE - 1.7% | | | |
| Equity Real Estate Investment Trusts (REITs) - 0.5% | | | |
| American Tower Corp. | | 5,000 | 517,500 |
| Colony NorthStar, Inc. | | 253,944 | 3,534,900 |
| | | | 4,052,400 |
| Real Estate Management & Development - 1.2% | | | |
| Consolidated-Tomoka Land Co. (b) | | 54,350 | 2,989,250 |
| Jones Lang LaSalle, Inc. | | 10,000 | 1,030,300 |
| Kennedy-Wilson Holdings, Inc. (a) | | 240,000 | 4,908,000 |
| | | | 8,927,550 |
|
| TOTAL REAL ESTATE | | | 12,979,950 |
|
| TELECOMMUNICATION SERVICES - 3.7% | | | |
| Diversified Telecommunication Services - 3.7% | | | |
| AT&T, Inc. | | 402,400 | 16,965,184 |
| SBA Communications Corp. Class A (a) | | 27,900 | 2,936,754 |
| Verizon Communications, Inc. | | 170,900 | 8,375,809 |
| | | | 28,277,747 |
| UTILITIES - 6.0% | | | |
| Electric Utilities - 4.1% | | | |
| American Electric Power Co., Inc. | | 85,700 | 5,489,942 |
| Edison International | | 71,200 | 5,189,056 |
| NextEra Energy, Inc. | | 59,510 | 7,362,577 |
| OGE Energy Corp. | | 100,600 | 3,374,124 |
| PG&E Corp. | | 86,500 | 5,353,485 |
| Xcel Energy, Inc. | | 114,400 | 4,727,008 |
| | | | 31,496,192 |
| Multi-Utilities - 1.9% | | | |
| CMS Energy Corp. | | 89,900 | 3,829,740 |
| DTE Energy Co. | | 49,000 | 4,833,360 |
| Sempra Energy | | 59,450 | 6,087,086 |
| | | | 14,750,186 |
|
| TOTAL UTILITIES | | | 46,246,378 |
|
| TOTAL COMMON STOCKS | | | |
| (Cost $672,008,470) | | | 750,935,886 |
|
| Nonconvertible Preferred Stocks - 0.8% | | | |
| REAL ESTATE - 0.8% | | | |
| Equity Real Estate Investment Trusts (REITs) - 0.8% | | | |
| Equity Lifestyle Properties, Inc. Series C, 6.75% | | | |
| (Cost $5,109,713) | | 225,866 | 5,709,892 |
| | | Principal Amount | Value |
|
| U.S. Treasury Obligations - 0.1% | | | |
| U.S. Treasury Bills, yield at date of purchase 0.34% to 0.53% 2/2/17 to 3/23/17 | | | |
| (Cost $619,683) | | 620,000 | 619,710 |
| | | Shares | Value |
|
| Money Market Funds - 3.1% | | | |
| Fidelity Cash Central Fund, 0.62% (c) | | 18,951,709 | $18,955,499 |
| Fidelity Securities Lending Cash Central Fund 0.65% (c)(d) | | 4,772,188 | 4,773,142 |
| TOTAL MONEY MARKET FUNDS | | | |
| (Cost $23,730,536) | | | 23,728,641 |
| TOTAL INVESTMENT PORTFOLIO - 101.8% | | | |
| (Cost $701,468,402) | | | 780,994,129 |
| NET OTHER ASSETS (LIABILITIES) - (1.8)% | | | (13,439,299) |
| NET ASSETS - 100% | | | $767,554,830 |
Legend
(a) Non-income producing
(b) Security or a portion of the security is on loan at period end.
(c) Affiliated fund that is generally available only to investment companies and other accounts managed by Fidelity Investments. The rate quoted is the annualized seven-day yield of the fund at period end. A complete unaudited listing of the fund's holdings as of its most recent quarter end is available upon request. In addition, each Fidelity Central Fund's financial statements, which are not covered by the Fund's Report of Independent Registered Public Accounting Firm, are available on the SEC's website or upon request.
(d) Investment made with cash collateral received from securities on loan.
Affiliated Central Funds
Information regarding fiscal year to date income earned by the Fund from investments in Fidelity Central Funds is as follows:
| Fund | Income earned |
| Fidelity Cash Central Fund | $158,483 |
| Fidelity Securities Lending Cash Central Fund | 94,253 |
| Total | $252,736 |
Investment Valuation
The following is a summary of the inputs used, as of January 31, 2017, involving the Fund's assets and liabilities carried at fair value. The inputs or methodology used for valuing securities may not be an indication of the risk associated with investing in those securities. For more information on valuation inputs, and their aggregation into the levels used below, please refer to the Investment Valuation section in the accompanying Notes to Financial Statements.
| | Valuation Inputs at Reporting Date: |
| Description | Total | Level 1 | Level 2 | Level 3 |
| Investments in Securities: | | | | |
| Equities: | | | | |
| Consumer Discretionary | $42,417,416 | $42,417,416 | $-- | $-- |
| Consumer Staples | 63,035,258 | 63,035,258 | -- | -- |
| Energy | 105,261,047 | 105,261,047 | -- | -- |
| Financials | 211,786,818 | 211,786,818 | -- | -- |
| Health Care | 78,005,795 | 78,005,795 | -- | -- |
| Industrials | 67,592,175 | 67,592,175 | -- | -- |
| Information Technology | 72,169,204 | 72,169,204 | -- | -- |
| Materials | 23,164,098 | 23,164,098 | -- | -- |
| Real Estate | 18,689,842 | 18,689,842 | -- | -- |
| Telecommunication Services | 28,277,747 | 28,277,747 | -- | -- |
| Utilities | 46,246,378 | 46,246,378 | -- | -- |
| U.S. Government and Government Agency Obligations | 619,710 | -- | 619,710 | -- |
| Money Market Funds | 23,728,641 | 23,728,641 | -- | -- |
| Total Investments in Securities: | $780,994,129 | $780,374,419 | $619,710 | $-- |
Other Information
Distribution of investments by country or territory of incorporation, as a percentage of Total Net Assets, is as follows (Unaudited):
| United States of America | 89.2% |
| Canada | 3.5% |
| Switzerland | 2.4% |
| Ireland | 2.4% |
| Others (Individually Less Than 1%) | 2.5% |
| | 100.0% |
See accompanying notes which are an integral part of the financial statements.
Financial Statements
Statement of Assets and Liabilities
| | | January 31, 2017 |
| Assets | | |
Investment in securities, at value (including securities loaned of $4,648,758) — See accompanying schedule:
Unaffiliated issuers (cost $677,737,866) | $757,265,488 | |
| Fidelity Central Funds (cost $23,730,536) | 23,728,641 | |
| Total Investments (cost $701,468,402) | | $780,994,129 |
| Receivable for investments sold | | 2,099,279 |
| Receivable for fund shares sold | | 294,269 |
| Dividends receivable | | 624,039 |
| Distributions receivable from Fidelity Central Funds | | 17,869 |
| Prepaid expenses | | 1,257 |
| Other receivables | | 3,128 |
| Total assets | | 784,033,970 |
| Liabilities | | |
| Payable to custodian bank | $4,865,723 | |
| Payable for investments purchased | 2,760,926 | |
| Payable for fund shares redeemed | 3,528,886 | |
| Accrued management fee | 324,371 | |
| Distribution and service plan fees payable | 19,930 | |
| Other affiliated payables | 144,436 | |
| Other payables and accrued expenses | 62,814 | |
| Collateral on Securities Loaned | 4,772,054 | |
| Total liabilities | | 16,479,140 |
| Net Assets | | $767,554,830 |
| Net Assets consist of: | | |
| Paid in capital | | $831,359,178 |
| Undistributed net investment income | | 194,495 |
| Accumulated undistributed net realized gain (loss) on investments and foreign currency transactions | | (143,524,843) |
| Net unrealized appreciation (depreciation) on investments and assets and liabilities in foreign currencies | | 79,526,000 |
| Net Assets | | $767,554,830 |
| Calculation of Maximum Offering Price | | |
| Class A: | | |
| Net Asset Value and redemption price per share ($31,054,382 ÷ 1,667,024 shares) | | $18.63 |
| Maximum offering price per share (100/94.25 of $18.63) | | $19.77 |
| Class T: | | |
| Net Asset Value and redemption price per share ($10,703,530 ÷ 575,057 shares) | | $18.61 |
| Maximum offering price per share (100/96.50 of $18.61) | | $19.28 |
| Class C: | | |
| Net Asset Value and offering price per share ($10,801,697 ÷ 591,969 shares)(a) | | $18.25 |
| Stock Selector Large Cap Value: | | |
| Net Asset Value, offering price and redemption price per share ($703,722,459 ÷ 37,509,844 shares) | | $18.76 |
| Class I: | | |
| Net Asset Value, offering price and redemption price per share ($11,272,762 ÷ 603,955 shares) | | $18.66 |
(a) Redemption price per share is equal to net asset value less any applicable contingent deferred sales charge.
See accompanying notes which are an integral part of the financial statements.
Statement of Operations
| | | Year ended January 31, 2017 |
| Investment Income | | |
| Dividends | | $15,883,029 |
| Interest | | 1,430 |
| Income from Fidelity Central Funds | | 252,736 |
| Total income | | 16,137,195 |
| Expenses | | |
| Management fee | | |
| Basic fee | $4,130,330 | |
| Performance adjustment | (211,440) | |
| Transfer agent fees | 1,422,815 | |
| Distribution and service plan fees | 222,071 | |
| Accounting and security lending fees | 266,016 | |
| Custodian fees and expenses | 34,951 | |
| Independent trustees' fees and expenses | 3,213 | |
| Registration fees | 89,813 | |
| Audit | 65,534 | |
| Legal | 6,596 | |
| Miscellaneous | 6,643 | |
| Total expenses before reductions | 6,036,542 | |
| Expense reductions | (28,101) | 6,008,441 |
| Net investment income (loss) | | 10,128,754 |
| Realized and Unrealized Gain (Loss) | | |
| Net realized gain (loss) on: | | |
| Investment securities: | | |
| Unaffiliated issuers | 15,588,080 | |
| Fidelity Central Funds | 10,323 | |
| Foreign currency transactions | 8,168 | |
| Futures contracts | 2,161,166 | |
| Total net realized gain (loss) | | 17,767,737 |
Change in net unrealized appreciation (depreciation) on:
Investment securities | 125,509,336 | |
| Assets and liabilities in foreign currencies | 944 | |
| Futures contracts | (192,091) | |
| Total change in net unrealized appreciation (depreciation) | | 125,318,189 |
| Net gain (loss) | | 143,085,926 |
| Net increase (decrease) in net assets resulting from operations | | $153,214,680 |
See accompanying notes which are an integral part of the financial statements.
Statement of Changes in Net Assets
| | Year ended January 31, 2017 | Year ended January 31, 2016 |
| Increase (Decrease) in Net Assets | | |
| Operations | | |
| Net investment income (loss) | $10,128,754 | $8,985,831 |
| Net realized gain (loss) | 17,767,737 | 73,907,820 |
| Change in net unrealized appreciation (depreciation) | 125,318,189 | (115,833,041) |
| Net increase (decrease) in net assets resulting from operations | 153,214,680 | (32,939,390) |
| Distributions to shareholders from net investment income | (9,868,427) | (9,078,643) |
| Share transactions - net increase (decrease) | (69,523,371) | (83,813,071) |
| Total increase (decrease) in net assets | 73,822,882 | (125,831,104) |
| Net Assets | | |
| Beginning of period | 693,731,948 | 819,563,052 |
| End of period | $767,554,830 | $693,731,948 |
| Other Information | | |
| Undistributed net investment income end of period | $194,495 | $– |
| Distributions in excess of net investment income end of period | $– | $(34,636) |
See accompanying notes which are an integral part of the financial statements.
Financial Highlights — Fidelity Stock Selector Large Cap Value Fund Class A
| Years ended January 31, | 2017 | 2016 | 2015 | 2014 | 2013 |
| Selected Per–Share Data | | | | | |
| Net asset value, beginning of period | $15.37 | $16.41 | $14.72 | $12.43 | $10.71 |
| Income from Investment Operations | | | | | |
| Net investment income (loss)A | .19 | .15 | .15 | .13 | .20 |
| Net realized and unrealized gain (loss) | 3.27 | (1.03) | 1.65 | 2.35 | 1.73 |
| Total from investment operations | 3.46 | (.88) | 1.80 | 2.48 | 1.93 |
| Distributions from net investment income | (.20) | (.16) | (.11) | (.15) | (.21) |
| Distributions from net realized gain | – | – | – | (.05) | – |
| Total distributions | (.20) | (.16) | (.11) | (.19)B | (.21) |
| Net asset value, end of period | $18.63 | $15.37 | $16.41 | $14.72 | $12.43 |
| Total ReturnC,D | 22.48% | (5.40)% | 12.25% | 20.01% | 18.15% |
| Ratios to Average Net AssetsE,F | | | | | |
| Expenses before reductions | 1.05% | 1.10% | 1.07% | 1.00% | .87% |
| Expenses net of fee waivers, if any | 1.05% | 1.10% | 1.07% | 1.00% | .87% |
| Expenses net of all reductions | 1.05% | 1.09% | 1.07% | 1.00% | .85% |
| Net investment income (loss) | 1.10% | .90% | .94% | .95% | 1.74% |
| Supplemental Data | | | | | |
| Net assets, end of period (000 omitted) | $31,054 | $24,201 | $26,536 | $21,266 | $18,234 |
| Portfolio turnover rateG | 51% | 67% | 60% | 64% | 63% |
A Calculated based on average shares outstanding during the period.
B Total distributions of $.19 per share is comprised of distributions from net investment income of $.147 and distributions from net realized gain of $.047 per share.
C Total returns would have been lower if certain expenses had not been reduced during the applicable periods shown.
D Total returns do not include the effect of the sales charges.
E Fees and expenses of any underlying Fidelity Central Funds are not included in the Fund's expense ratio. The Fund indirectly bears its proportionate share of the expenses of any underlying Fidelity Central Funds.
F Expense ratios reflect operating expenses of the class. Expenses before reductions do not reflect amounts reimbursed by the investment adviser or reductions from brokerage service arrangements or reductions from other expense offset arrangements and do not represent the amount paid by the class during periods when reimbursements or reductions occur. Expenses net of fee waivers reflect expenses after reimbursement by the investment adviser but prior to reductions from brokerage service arrangements or other expense offset arrangements. Expenses net of all reductions represent the net expenses paid by the class.
G Amount does not include the portfolio activity of any underlying Fidelity Central Funds.
See accompanying notes which are an integral part of the financial statements.
Financial Highlights — Fidelity Stock Selector Large Cap Value Fund Class T
| Years ended January 31, | 2017 | 2016 | 2015 | 2014 | 2013 |
| Selected Per–Share Data | | | | | |
| Net asset value, beginning of period | $15.36 | $16.40 | $14.71 | $12.44 | $10.72 |
| Income from Investment Operations | | | | | |
| Net investment income (loss)A | .13 | .10 | .10 | .09 | .17 |
| Net realized and unrealized gain (loss) | 3.26 | (1.03) | 1.66 | 2.34 | 1.73 |
| Total from investment operations | 3.39 | (.93) | 1.76 | 2.43�� | 1.90 |
| Distributions from net investment income | (.14) | (.11) | (.07) | (.11) | (.18) |
| Distributions from net realized gain | – | – | – | (.05) | – |
| Total distributions | (.14) | (.11) | (.07) | (.16) | (.18) |
| Net asset value, end of period | $18.61 | $15.36 | $16.40 | $14.71 | $12.44 |
| Total ReturnB,C | 22.04% | (5.71)% | 11.95% | 19.54% | 17.88% |
| Ratios to Average Net AssetsD,E | | | | | |
| Expenses before reductions | 1.39% | 1.42% | 1.39% | 1.32% | 1.14% |
| Expenses net of fee waivers, if any | 1.39% | 1.42% | 1.39% | 1.32% | 1.14% |
| Expenses net of all reductions | 1.39% | 1.41% | 1.39% | 1.31% | 1.12% |
| Net investment income (loss) | .76% | .58% | .62% | .63% | 1.48% |
| Supplemental Data | | | | | |
| Net assets, end of period (000 omitted) | $10,704 | $9,515 | $10,469 | $8,244 | $6,544 |
| Portfolio turnover rateF | 51% | 67% | 60% | 64% | 63% |
A Calculated based on average shares outstanding during the period.
B Total returns would have been lower if certain expenses had not been reduced during the applicable periods shown.
C Total returns do not include the effect of the sales charges.
D Fees and expenses of any underlying Fidelity Central Funds are not included in the Fund's expense ratio. The Fund indirectly bears its proportionate share of the expenses of any underlying Fidelity Central Funds.
E Expense ratios reflect operating expenses of the class. Expenses before reductions do not reflect amounts reimbursed by the investment adviser or reductions from brokerage service arrangements or reductions from other expense offset arrangements and do not represent the amount paid by the class during periods when reimbursements or reductions occur. Expenses net of fee waivers reflect expenses after reimbursement by the investment adviser but prior to reductions from brokerage service arrangements or other expense offset arrangements. Expenses net of all reductions represent the net expenses paid by the class.
F Amount does not include the portfolio activity of any underlying Fidelity Central Funds.
See accompanying notes which are an integral part of the financial statements.
Financial Highlights — Fidelity Stock Selector Large Cap Value Fund Class C
| Years ended January 31, | 2017 | 2016 | 2015 | 2014 | 2013 |
| Selected Per–Share Data | | | | | |
| Net asset value, beginning of period | $15.09 | $16.18 | $14.53 | $12.30 | $10.61 |
| Income from Investment Operations | | | | | |
| Net investment income (loss)A | .05 | .01 | .02 | .02 | .11 |
| Net realized and unrealized gain (loss) | 3.18 | (1.00) | 1.63 | 2.31 | 1.72 |
| Total from investment operations | 3.23 | (.99) | 1.65 | 2.33 | 1.83 |
| Distributions from net investment income | (.07) | (.10) | – | (.05) | (.14) |
| Distributions from net realized gain | – | – | – | (.05) | – |
| Total distributions | (.07) | (.10) | – | (.10) | (.14) |
| Net asset value, end of period | $18.25 | $15.09 | $16.18 | $14.53 | $12.30 |
| Total ReturnB,C | 21.43% | (6.13)% | 11.36% | 18.94% | 17.32% |
| Ratios to Average Net AssetsD,E | | | | | |
| Expenses before reductions | 1.88% | 1.93% | 1.89% | 1.81% | 1.63% |
| Expenses net of fee waivers, if any | 1.88% | 1.93% | 1.89% | 1.80% | 1.63% |
| Expenses net of all reductions | 1.87% | 1.93% | 1.89% | 1.80% | 1.61% |
| Net investment income (loss) | .27% | .07% | .12% | .14% | .99% |
| Supplemental Data | | | | | |
| Net assets, end of period (000 omitted) | $10,802 | $8,956 | $10,118 | $7,789 | $5,839 |
| Portfolio turnover rateF | 51% | 67% | 60% | 64% | 63% |
A Calculated based on average shares outstanding during the period.
B Total returns would have been lower if certain expenses had not been reduced during the applicable periods shown.
C Total returns do not include the effect of the contingent deferred sales charge.
D Fees and expenses of any underlying Fidelity Central Funds are not included in the Fund's expense ratio. The Fund indirectly bears its proportionate share of the expenses of any underlying Fidelity Central Funds.
E Expense ratios reflect operating expenses of the class. Expenses before reductions do not reflect amounts reimbursed by the investment adviser or reductions from brokerage service arrangements or reductions from other expense offset arrangements and do not represent the amount paid by the class during periods when reimbursements or reductions occur. Expenses net of fee waivers reflect expenses after reimbursement by the investment adviser but prior to reductions from brokerage service arrangements or other expense offset arrangements. Expenses net of all reductions represent the net expenses paid by the class.
F Amount does not include the portfolio activity of any underlying Fidelity Central Funds.
See accompanying notes which are an integral part of the financial statements.
Financial Highlights — Fidelity Stock Selector Large Cap Value Fund
| Years ended January 31, | 2017 | 2016 | 2015 | 2014 | 2013 |
| Selected Per–Share Data | | | | | |
| Net asset value, beginning of period | $15.47 | $16.51 | $14.81 | $12.51 | $10.77 |
| Income from Investment Operations | | | | | |
| Net investment income (loss)A | .24 | .20 | .20 | .17 | .23 |
| Net realized and unrealized gain (loss) | 3.29 | (1.03) | 1.66 | 2.37 | 1.75 |
| Total from investment operations | 3.53 | (.83) | 1.86 | 2.54 | 1.98 |
| Distributions from net investment income | (.24) | (.21) | (.16) | (.19) | (.24) |
| Distributions from net realized gain | – | – | – | (.05) | – |
| Total distributions | (.24) | (.21) | (.16) | (.24) | (.24) |
| Net asset value, end of period | $18.76 | $15.47 | $16.51 | $14.81 | $12.51 |
| Total ReturnB | 22.82% | (5.10)% | 12.54% | 20.31% | 18.55% |
| Ratios to Average Net AssetsC,D | | | | | |
| Expenses before reductions | .77% | .81% | .78% | .72% | .57% |
| Expenses net of fee waivers, if any | .77% | .81% | .78% | .72% | .57% |
| Expenses net of all reductions | .76% | .80% | .78% | .71% | .55% |
| Net investment income (loss) | 1.38% | 1.19% | 1.23% | 1.23% | 2.05% |
| Supplemental Data | | | | | |
| Net assets, end of period (000 omitted) | $703,722 | $644,182 | $761,542 | $518,206 | $465,702 |
| Portfolio turnover rateE | 51% | 67% | 60% | 64% | 63% |
A Calculated based on average shares outstanding during the period.
B Total returns would have been lower if certain expenses had not been reduced during the applicable periods shown.
C Fees and expenses of any underlying Fidelity Central Funds are not included in the Fund's expense ratio. The Fund indirectly bears its proportionate share of the expenses of any underlying Fidelity Central Funds.
D Expense ratios reflect operating expenses of the class. Expenses before reductions do not reflect amounts reimbursed by the investment adviser or reductions from brokerage service arrangements or reductions from other expense offset arrangements and do not represent the amount paid by the class during periods when reimbursements or reductions occur. Expenses net of fee waivers reflect expenses after reimbursement by the investment adviser but prior to reductions from brokerage service arrangements or other expense offset arrangements. Expenses net of all reductions represent the net expenses paid by the class.
E Amount does not include the portfolio activity of any underlying Fidelity Central Funds.
See accompanying notes which are an integral part of the financial statements.
Financial Highlights — Fidelity Stock Selector Large Cap Value Fund Class I
| Years ended January 31, | 2017 | 2016 | 2015 | 2014 | 2013 |
| Selected Per–Share Data | | | | | |
| Net asset value, beginning of period | $15.40 | $16.44 | $14.74 | $12.46 | $10.74 |
| Income from Investment Operations | | | | | |
| Net investment income (loss)A | .23 | .20 | .20 | .17 | .23 |
| Net realized and unrealized gain (loss) | 3.27 | (1.04) | 1.66 | 2.35 | 1.73 |
| Total from investment operations | 3.50 | (.84) | 1.86 | 2.52 | 1.96 |
| Distributions from net investment income | (.24) | (.20) | (.16) | (.19) | (.24) |
| Distributions from net realized gain | – | – | – | (.05) | – |
| Total distributions | (.24) | (.20) | (.16) | (.24) | (.24) |
| Net asset value, end of period | $18.66 | $15.40 | $16.44 | $14.74 | $12.46 |
| Total ReturnB | 22.72% | (5.14)% | 12.58% | 20.25% | 18.42% |
| Ratios to Average Net AssetsC,D | | | | | |
| Expenses before reductions | .84% | .82% | .81% | .73% | .61% |
| Expenses net of fee waivers, if any | .84% | .82% | .81% | .73% | .61% |
| Expenses net of all reductions | .84% | .81% | .81% | .73% | .58% |
| Net investment income (loss) | 1.30% | 1.18% | 1.20% | 1.22% | 2.01% |
| Supplemental Data | | | | | |
| Net assets, end of period (000 omitted) | $11,273 | $6,164 | $9,544 | $3,881 | $1,995 |
| Portfolio turnover rateE | 51% | 67% | 60% | 64% | 63% |
A Calculated based on average shares outstanding during the period.
B Total returns would have been lower if certain expenses had not been reduced during the applicable periods shown.
C Fees and expenses of any underlying Fidelity Central Funds are not included in the Fund's expense ratio. The Fund indirectly bears its proportionate share of the expenses of any underlying Fidelity Central Funds.
D Expense ratios reflect operating expenses of the class. Expenses before reductions do not reflect amounts reimbursed by the investment adviser or reductions from brokerage service arrangements or reductions from other expense offset arrangements and do not represent the amount paid by the class during periods when reimbursements or reductions occur. Expenses net of fee waivers reflect expenses after reimbursement by the investment adviser but prior to reductions from brokerage service arrangements or other expense offset arrangements. Expenses net of all reductions represent the net expenses paid by the class.
E Amount does not include the portfolio activity of any underlying Fidelity Central Funds.
See accompanying notes which are an integral part of the financial statements.
Notes to Financial Statements
For the period ended January 31, 2017
1. Organization.
Fidelity Stock Selector Large Cap Value Fund (the Fund) is a fund of Fidelity Devonshire Trust (the Trust) and is authorized to issue an unlimited number of shares. The Trust is registered under the Investment Company Act of 1940, as amended (the 1940 Act), as an open-end management investment company organized as a Massachusetts business trust. The Fund offers Class A, Class T, Class C, Stock Selector Large Cap Value and Class I shares, each of which has equal rights as to assets and voting privileges. Each class has exclusive voting rights with respect to matters that affect that class.
After the close of business on June 24, 2016, all outstanding Class B shares were converted to Class A shares. All current fiscal period dollar and share amounts for Class B presented in the Notes to Financial Statements are for the period February 1, 2016 through June 24, 2016.
In March 2017 the Board of Trustees approved a change in the name of Class T to Class M effective after the close of business on March 24, 2017.
2. Investments in Fidelity Central Funds.
The Fund may invest in Fidelity Central Funds, which are open-end investment companies generally available only to other investment companies and accounts managed by the investment adviser and its affiliates. The Fund's Schedule of Investments lists each of the Fidelity Central Funds held as of period end, if any, as an investment of the Fund, but does not include the underlying holdings of each Fidelity Central Fund. As an Investing Fund, the Fund indirectly bears its proportionate share of the expenses of the underlying Fidelity Central Funds.
The Money Market Central Funds seek preservation of capital and current income and are managed by Fidelity Investments Money Management, Inc. (FIMM), an affiliate of the investment adviser. Annualized expenses of the Money Market Central Funds as of their most recent shareholder report date are less than .005%.
A complete unaudited list of holdings for each Fidelity Central Fund is available upon request or at the Securities and Exchange Commission (the SEC) website at www.sec.gov. In addition, the financial statements of the Fidelity Central Funds, which are not covered by the Fund's Report of Independent Registered Public Accounting Firm, are available on the SEC website or upon request.
3. Significant Accounting Policies.
The financial statements have been prepared in conformity with accounting principles generally accepted in the United States of America (GAAP), which require management to make certain estimates and assumptions at the date of the financial statements. Actual results could differ from those estimates. Subsequent events, if any, through the date that the financial statements were issued have been evaluated in the preparation of the financial statements. The following summarizes the significant accounting policies of the Fund:
Investment Valuation. Investments are valued as of 4:00 p.m. Eastern time on the last calendar day of the period. The Board of Trustees (the Board) has delegated the day to day responsibility for the valuation of the Fund's investments to the Fair Value Committee (the Committee) established by the Fund's investment adviser. In accordance with valuation policies and procedures approved by the Board, the Fund attempts to obtain prices from one or more third party pricing vendors or brokers to value its investments. When current market prices, quotations or currency exchange rates are not readily available or reliable, investments will be fair valued in good faith by the Committee, in accordance with procedures adopted by the Board. Factors used in determining fair value vary by investment type and may include market or investment specific events, changes in interest rates and credit quality. The frequency with which these procedures are used cannot be predicted and they may be utilized to a significant extent. The Committee oversees the Fund's valuation policies and procedures and reports to the Board on the Committee's activities and fair value determinations. The Board monitors the appropriateness of the procedures used in valuing the Fund's investments and ratifies the fair value determinations of the Committee.
The Fund categorizes the inputs to valuation techniques used to value its investments into a disclosure hierarchy consisting of three levels as shown below:
- Level 1 – quoted prices in active markets for identical investments
- Level 2 – other significant observable inputs (including quoted prices for similar investments, interest rates, prepayment speeds, etc.)
- Level 3 – unobservable inputs (including the Fund's own assumptions based on the best information available)
Valuation techniques used to value the Fund's investments by major category are as follows:
Equity securities, including restricted securities, for which market quotations are readily available, are valued at the last reported sale price or official closing price as reported by a third party pricing vendor on the primary market or exchange on which they are traded and are categorized as Level 1 in the hierarchy. In the event there were no sales during the day or closing prices are not available, securities are valued at the last quoted bid price or may be valued using the last available price and are generally categorized as Level 2 in the hierarchy. For foreign equity securities, when market or security specific events arise, comparisons to the valuation of American Depositary Receipts (ADRs), futures contracts, Exchange-Traded Funds (ETFs) and certain indexes as well as quoted prices for similar securities may be used and would be categorized as Level 2 in the hierarchy. Utilizing these techniques may result in transfers between Level 1 and Level 2. For equity securities, including restricted securities, where observable inputs are limited, assumptions about market activity and risk are used and these securities may be categorized as Level 3 in the hierarchy.
Debt securities, including restricted securities, are valued based on evaluated prices received from third party pricing vendors or from brokers who make markets in such securities. U.S. government and government agency obligations are valued by pricing vendors who utilize matrix pricing which considers yield or price of bonds of comparable quality, coupon, maturity and type or by broker-supplied prices. When independent prices are unavailable or unreliable, debt securities may be valued utilizing pricing methodologies which consider similar factors that would be used by third party pricing vendors. Debt securities are generally categorized as Level 2 in the hierarchy but may be Level 3 depending on the circumstances.
Investments in open-end mutual funds, including Fidelity Central Funds, are valued at their closing net asset value (NAV) each business day and are categorized as Level 1 in the hierarchy. Changes in valuation techniques may result in transfers in or out of an assigned level within the disclosure hierarchy. The aggregate value of investments by input level as of January 31, 2017 is included at the end of the Fund's Schedule of Investments.
Foreign Currency. The Fund may use foreign currency contracts to facilitate transactions in foreign-denominated securities. Gains and losses from these transactions may arise from changes in the value of the foreign currency or if the counterparties do not perform under the contracts' terms.
Foreign-denominated assets, including investment securities, and liabilities are translated into U.S. dollars at the exchange rates at period end. Purchases and sales of investment securities, income and dividends received and expenses denominated in foreign currencies are translated into U.S. dollars at the exchange rate in effect on the transaction date.
The effects of exchange rate fluctuations on investments are included with the net realized and unrealized gain (loss) on investment securities. Other foreign currency transactions resulting in realized and unrealized gain (loss) are disclosed separately.
Investment Transactions and Income. For financial reporting purposes, the Fund's investment holdings and NAV include trades executed through the end of the last business day of the period. The NAV per share for processing shareholder transactions is calculated as of the close of business of the New York Stock Exchange (NYSE), normally 4:00 p.m. Eastern time and includes trades executed through the end of the prior business day. Gains and losses on securities sold are determined on the basis of identified cost and may include proceeds received from litigation. Dividend income is recorded on the ex-dividend date, except for certain dividends from foreign securities where the ex-dividend date may have passed, which are recorded as soon as the Fund is informed of the ex-dividend date. Non-cash dividends included in dividend income, if any, are recorded at the fair market value of the securities received. Income and capital gain distributions from Fidelity Central Funds, if any, are recorded on the ex-dividend date. Certain distributions received by the Fund represent a return of capital or capital gain. The Fund determines the components of these distributions subsequent to the ex-dividend date, based upon receipt of tax filings or other correspondence relating to the underlying investment. These distributions are recorded as a reduction of cost of investments and/or as a realized gain. Interest income is accrued as earned and includes coupon interest and amortization of premium and accretion of discount on debt securities as applicable. Investment income is recorded net of foreign taxes withheld where recovery of such taxes is uncertain.
Class Allocations and Expenses. Investment income, realized and unrealized capital gains and losses, common expenses of the Fund, and certain fund-level expense reductions, if any, are allocated daily on a pro-rata basis to each class based on the relative net assets of each class to the total net assets of the Fund. Each class differs with respect to transfer agent and distribution and service plan fees incurred. Certain expense reductions may also differ by class. For the reporting period, the allocated portion of income and expenses to each class as a percent of its average net assets may vary due to the timing of recording these transactions in relation to fluctuating net assets of the classes. Expenses directly attributable to a fund are charged to that fund. Expenses attributable to more than one fund are allocated among the respective funds on the basis of relative net assets or other appropriate methods. Expense estimates are accrued in the period to which they relate and adjustments are made when actual amounts are known.
Income Tax Information and Distributions to Shareholders. Each year, the Fund intends to qualify as a regulated investment company under Subchapter M of the Internal Revenue Code, including distributing substantially all of its taxable income and realized gains. As a result, no provision for U.S. Federal income taxes is required. As of January 31, 2017, the Fund did not have any unrecognized tax benefits in the financial statements; nor is the Fund aware of any tax positions for which it is reasonably possible that the total amounts of unrecognized tax benefits will significantly change in the next twelve months. The Fund files a U.S. federal tax return, in addition to state and local tax returns as required. The Fund's federal income tax returns are subject to examination by the Internal Revenue Service (IRS) for a period of three fiscal years after they are filed. State and local tax returns may be subject to examination for an additional fiscal year depending on the jurisdiction. Foreign taxes are provided for based on the Fund's understanding of the tax rules and rates that exist in the foreign markets in which it invests.
Distributions are declared and recorded on the ex-dividend date. Income dividends and capital gain distributions are declared separately for each class. Income and capital gain distributions are determined in accordance with income tax regulations, which may differ from GAAP.
Capital accounts within the financial statements are adjusted for permanent book-tax differences. These adjustments have no impact on net assets or the results of operations. Capital accounts are not adjusted for temporary book-tax differences which will reverse in a subsequent period.
Book-tax differences are primarily due to market discount, futures contracts, foreign currency transactions, partnerships, capital loss carryforwards, and losses deferred due to wash sales and excise tax regulations.
The federal tax cost of investment securities and unrealized appreciation (depreciation) as of period end were as follows:
| Gross unrealized appreciation | $101,933,741 |
| Gross unrealized depreciation | (27,071,614) |
| Net unrealized appreciation (depreciation) on securities | $74,862,127 |
| Tax Cost | $706,132,002 |
The tax-based components of distributable earnings as of period end were as follows:
| Undistributed ordinary income | $194,206 |
| Capital loss carryforward | $(138,860,952) |
| Net unrealized appreciation (depreciation) on securities and other investments | $74,862,400 |
Capital loss carryforwards are only available to offset future capital gains of the Fund to the extent provided by regulations and may be limited. Under the Regulated Investment Company Modernization Act of 2010 (the Act), the Fund is permitted to carry forward capital losses incurred in taxable years beginning after December 22, 2010 for an unlimited period and such capital losses are required to be used prior to any losses that expire. The capital loss carryforward information presented below, including any applicable limitation, is estimated as of fiscal period end and is subject to adjustment.
| Fiscal year of expiration | |
| 2018 | $(138,860,952) |
The tax character of distributions paid was as follows:
| | January 31, 2017 | January 31, 2016 |
| Ordinary Income | $9,868,427 | $ 9,078,643 |
4. Derivative Instruments.
Risk Exposures and the Use of Derivative Instruments. The Fund's investment objective allows the Fund to enter into various types of derivative contracts, including futures contracts. Derivatives are investments whose value is primarily derived from underlying assets, indices or reference rates and may be transacted on an exchange or over-the-counter (OTC). Derivatives may involve a future commitment to buy or sell a specified asset based on specified terms, to exchange future cash flows at periodic intervals based on a notional principal amount, or for one party to make one or more payments upon the occurrence of specified events in exchange for periodic payments from the other party.
The Fund used derivatives to increase returns and to manage exposure to certain risks as defined below. The success of any strategy involving derivatives depends on analysis of numerous economic factors, and if the strategies for investment do not work as intended, the Fund may not achieve its objectives.
The Fund's use of derivatives increased or decreased its exposure to the following risk:
| Equity Risk | Equity risk relates to the fluctuations in the value of financial instruments as a result of changes in market prices (other than those arising from interest rate risk or foreign exchange risk), whether caused by factors specific to an individual investment, its issuer, or all factors affecting all instruments traded in a market or market segment.
|
The Fund is also exposed to additional risks from investing in derivatives, such as liquidity risk and counterparty credit risk. Liquidity risk is the risk that the Fund will be unable to close out the derivative in the open market in a timely manner. Counterparty credit risk is the risk that the counterparty will not be able to fulfill its obligation to the Fund. Counterparty credit risk related to exchange-traded futures contracts may be mitigated by the protection provided by the on which they trade.
Investing in derivatives may involve greater risks than investing in the underlying assets directly and, to varying degrees, may involve risk of loss in excess of any initial investment and collateral received and amounts recognized in the Statement of Assets and Liabilities. In addition, there may be the risk that the change in value of the derivative contract does not correspond to the change in value of the underlying instrument.
Futures Contracts. A futures contract is an agreement between two parties to buy or sell a specified underlying instrument for a fixed price at a specified future date. The Fund used futures contracts to manage its exposure to the stock market.
Upon entering into a futures contract, a fund is required to deposit either cash or securities (initial margin) with a clearing broker in an amount equal to a certain percentage of the face value of the contract. Futures contracts are marked-to-market daily and subsequent daily payments (variation margin) are made or received by a fund depending on the daily fluctuations in the value of the futures contracts and are recorded as unrealized appreciation or (depreciation). This receivable and/or payable, if any, is included in daily variation margin for derivative instruments in the Statement of Assets and Liabilities. Realized gain or (loss) is recorded upon the expiration or closing of a futures contract.
Any open futures contracts at period end are presented in the Schedule of Investments under the caption "Futures Contracts". The underlying face amount at value reflects each contract's exposure to the underlying instrument or index at period end.
During the period the Fund recognized net realized gain (loss) of $2,161,166 and a change in net unrealized appreciation (depreciation) of $(192,091) related to its investment in futures contracts. These amounts are included in the Statement of Operations.
5. Purchases and Sales of Investments.
Purchases and sales of securities, other than short-term securities, aggregated $369,092,321 and $411,698,454, respectively.
6. Fees and Other Transactions with Affiliates.
Management Fee. Fidelity Management & Research Company (the investment adviser) and its affiliates provide the Fund with investment management related services for which the Fund pays a monthly management fee. The management fee is the sum of an individual fund fee rate that is based on an annual rate of .30% of the Fund's average net assets and an annualized group fee rate that averaged .25% during the period. The group fee rate is based upon the average net assets of all the mutual funds advised by the investment adviser, including any mutual funds previously advised by the investment adviser that are currently advised by Fidelity SelectCo, LLC, an affiliate of the investment adviser. The group fee rate decreases as assets under management increase and increases as assets under management decrease. In addition, the management fee is subject to a performance adjustment (up to a maximum of +/- .20% of the Fund's average net assets over a 36 month performance period). The upward or downward adjustment to the management fee is based on the relative investment performance of Stock Selector Large Cap Value as compared to its benchmark index, the Russell 1000 Value Index, over the same 36 month performance period. For the reporting period, the total annual management fee rate, including the performance adjustment, was .52% of the Fund's average net assets. The performance adjustment included in the management fee rate may be higher or lower than the maximum performance adjustment rate due to the difference between the average net assets for the reporting and performance periods.
Distribution and Service Plan Fees. In accordance with Rule 12b-1 of the 1940 Act, the Fund has adopted separate Distribution and Service Plans for each class of shares. Certain classes pay Fidelity Distributors Corporation (FDC), an affiliate of the investment adviser, separate Distribution and Service Fees, each of which is based on an annual percentage of each class' average net assets. In addition, FDC may pay financial intermediaries for selling shares of the Fund and providing shareholder support services. For the period, the Distribution and Service Fee rates, total fees and amounts retained by FDC were as follows:
| | Distribution
Fee | Service
Fee | Total Fees | Retained
by FDC |
| Class A | -% | .25% | $68,974 | $671 |
| Class T | .25% | .25% | 52,536 | – |
| Class B | .75% | .25% | 2,497 | 1,873 |
| Class C | .75% | .25% | 98,064 | 13,416 |
| | | | $222,071 | $15,960 |
Sales Load. FDC may receive a front-end sales charge of up to 5.75% for selling Class A shares and 3.50% for selling Class T shares, some of which is paid to financial intermediaries for selling shares of the Fund. Depending on the holding period, FDC may receive contingent deferred sales charges levied on Class A, Class T, Class B and Class C redemptions. The deferred sales charges range from 5.00% to 1.00% for Class B shares, 1.00% for Class C shares, 1.00% for certain purchases of Class A shares and .25% for certain purchases of Class T shares.
For the period, sales charge amounts retained by FDC were as follows:
| | Retained
by FDC |
| Class A | $13,712 |
| Class T | 2,269 |
| Class B(a) | 16 |
| Class C(a) | 2,517 |
| | $18,514 |
(a) When Class B and Class C shares are initially sold, FDC pays commissions from its own resources to financial intermediaries through which the sales are made.
Transfer Agent Fees. Fidelity Investments Institutional Operations Company, Inc., (FIIOC), an affiliate of the investment adviser, is the transfer, dividend disbursing and shareholder servicing agent for each class of the Fund. FIIOC receives account fees and asset-based fees that vary according to the account size and type of account of the shareholders of the respective classes of the Fund. FIIOC pays for typesetting, printing and mailing of shareholder reports, except proxy statements.
For the period, transfer agent fees for each class were as follows:
| | Amount | % of
Class-Level Average
Net Assets |
| Class A | $59,828 | .22 |
| Class T | 32,302 | .31 |
| Class B | 638 | .26 |
| Class C | 29,122 | .30 |
| Stock Selector Large Cap Value | 1,279,802 | .18 |
| Class I | 21,123 | .26 |
| | $1,422,815 | |
Accounting and Security Lending Fees. Fidelity Service Company, Inc. (FSC), an affiliate of the investment adviser, maintains the Fund's accounting records. The accounting fee is based on the level of average net assets for each month. Under a separate contract, FSC administers the security lending program. The security lending fee is based on the number and duration of lending transactions.
Brokerage Commissions. The Fund placed a portion of its portfolio transactions with brokerage firms which are affiliates of the investment adviser. Brokerage commissions are included in net realized gain (loss) and change in net unrealized appreciation (depreciation) in the Statement of Operations. The commissions paid to these affiliated firms were $12,141 for the period.
Interfund Trades. The Fund may purchase from or sell securities to other Fidelity Funds under procedures adopted by the Board. The procedures have been designed to ensure these interfund trades are executed in accordance with Rule 17a-7 of the 1940 Act. Interfund trades are included within the respective purchases and sales amounts shown in the Purchases and Sales of Investments note.
7. Committed Line of Credit.
The Fund participates with other funds managed by the investment adviser or an affiliate in a $4.25 billion credit facility (the "line of credit") to be utilized for temporary or emergency purposes to fund shareholder redemptions or for other short-term liquidity purposes. The Fund has agreed to pay commitment fees on its pro-rata portion of the line of credit, which amounted to $2,267 and is reflected in Miscellaneous expenses on the Statement of Operations. During the period, the Fund did not borrow on this line of credit.
8. Security Lending.
The Fund lends portfolio securities through a lending agent from time to time in order to earn additional income. For equity securities, a lending agent is used and may loan securities to certain qualified borrowers, including Fidelity Capital Markets (FCM), a broker-dealer affiliated with the Fund. On the settlement date of the loan, the Fund receives collateral (in the form of U.S. Treasury obligations, letters of credit and/or cash) against the loaned securities and maintains collateral in an amount not less than 100% of the market value of the loaned securities during the period of the loan. The market value of the loaned securities is determined at the close of business of the Fund and any additional required collateral is delivered to the Fund on the next business day. The Fund or borrower may terminate the loan at any time, and if the borrower defaults on its obligation to return the securities loaned because of insolvency or other reasons, the Fund may apply collateral received from the borrower against the obligation. The Fund may experience delays and costs in recovering the securities loaned. Any cash collateral received is invested in the Fidelity Securities Lending Cash Central Fund. The value of loaned securities and cash collateral at period end are disclosed on the Fund's Statement of Assets and Liabilities. Security lending income represents the income earned on investing cash collateral, less rebates paid to borrowers and any lending agent fees associated with the loan, plus any premium payments received for lending certain types of securities. Security lending income is presented in the Statement of Operations as a component of income from Fidelity Central Funds. Total security lending income during the period amounted to $94,253, including $9,201 from securities loaned to FCM. During the period, there were no securities loaned to FCM.
9. Expense Reductions.
Commissions paid to certain brokers with whom the investment adviser, or its affiliates, places trades on behalf of the Fund include an amount in addition to trade execution, which may be rebated back to the Fund to offset certain expenses. This amount totaled $21,851 for the period.
In addition, during the period the investment adviser reimbursed and/or waived a portion of fund-level operating expenses in the amount of $6,250.
10. Distributions to Shareholders.
Distributions to shareholders of each class were as follows:
| | Year ended
January 31, 2017 | Year ended January 31, 2016 |
| From net investment income | | |
| Class A | $311,950 | $247,938 |
| Class T | 78,380 | 66,187 |
| Class C | 43,306 | 100,122 |
| Stock Selector Large Cap Value | 9,290,473 | 8,576,233 |
| Class I | 144,318 | 88,163 |
| Total | $9,868,427 | $9,078,643 |
11. Share Transactions.
Share transactions for each class were as follows and may contain automatic conversions between classes or exchanges between affiliated funds:
| | Shares | Shares | Dollars | Dollars |
| | Year ended January 31, 2017 | Year ended January 31, 2016 | Year ended January 31, 2017 | Year ended January 31, 2016 |
| Class A | | | | |
| Shares sold | 569,952 | 331,048 | $9,932,134 | $5,512,197 |
| Reinvestment of distributions | 15,663 | 14,824 | 292,587 | 235,407 |
| Shares redeemed | (492,854) | (389,058) | (8,537,525) | (6,510,850) |
| Net increase (decrease) | 92,761 | (43,186) | $1,687,196 | $(763,246) |
| Class T | | | | |
| Shares sold | 126,680 | 98,719 | $2,167,151 | $1,650,938 |
| Reinvestment of distributions | 4,151 | 4,138 | 77,494 | 65,711 |
| Shares redeemed | (175,085) | (122,073) | (3,030,158) | (2,032,878) |
| Net increase (decrease) | (44,254) | (19,216) | $(785,513) | $(316,229) |
| Class B | | | | |
| Shares sold | 1,059 | – | $17,571 | $2 |
| Shares redeemed | (47,495) | (36,212) | (785,079) | (608,112) |
| Net increase (decrease) | (46,436) | (36,212) | $(767,508) | $(608,110) |
| Class C | | | | |
| Shares sold | 170,423 | 627,414 | $2,904,730 | $10,101,962 |
| Reinvestment of distributions | 2,230 | 6,075 | 40,853 | 94,778 |
| Shares redeemed | (174,329) | (665,157) | (2,952,260) | (10,105,437) |
| Net increase (decrease) | (1,676) | (31,668) | $(6,677) | $91,303 |
| Stock Selector Large Cap Value | | | | |
| Shares sold | 6,066,305 | 8,102,341 | $105,307,511 | $135,383,965 |
| Reinvestment of distributions | 481,523 | 523,476 | 9,052,639 | 8,373,276 |
| Shares redeemed | (10,670,867) | (13,116,688) | (187,755,649) | (222,880,353) |
| Net increase (decrease) | (4,123,039) | (4,490,871) | $(73,395,499) | $(79,123,112) |
| Class I | | | | |
| Shares sold | 520,730 | 142,790 | $9,225,865 | $2,313,025 |
| Reinvestment of distributions | 2,892 | 5,311 | 54,106 | 84,600 |
| Shares redeemed | (319,842) | (328,617) | (5,535,341) | (5,491,302) |
| Net increase (decrease) | 203,780 | (180,516) | $3,744,630 | $(3,093,677) |
12. Other.
The Fund's organizational documents provide former and current trustees and officers with a limited indemnification against liabilities arising in connection with the performance of their duties to the Fund. In the normal course of business, the Fund may also enter into contracts that provide general indemnifications. The Fund's maximum exposure under these arrangements is unknown as this would be dependent on future claims that may be made against the Fund. The risk of material loss from such claims is considered remote.
At the end of the period, VIP FundsManager 50% Portfolio was the owner of record of approximately 11% of the total outstanding shares of the Fund.
Report of Independent Registered Public Accounting Firm
To the Trustees of Fidelity Devonshire Trust and Shareholders of Fidelity Stock Selector Large Cap Value Fund:
In our opinion, the accompanying statement of assets and liabilities, including the schedule of investments, and the related statements of operations and of changes in net assets and the financial highlights present fairly, in all material respects, the financial position of Fidelity Stock Selector Large Cap Value Fund (a fund of Fidelity Devonshire Trust) as of January 31, 2017, the results of its operations for the year then ended, the changes in its net assets for each of the two years in the period then ended and the financial highlights for each of the five years in the period then ended, in conformity with accounting principles generally accepted in the United States of America. These financial statements and financial highlights (hereafter referred to as “financial statements”) are the responsibility of the Fidelity Stock Selector Large Cap Value Fund’s management. Our responsibility is to express an opinion on these financial statements based on our audits. We conducted our audits of these financial statements in accordance with the standards of the Public Company Accounting Oversight Board (United States). Those standards require that we plan and perform the audit to obtain reasonable assurance about whether the financial statements are free of material misstatement. An audit includes examining, on a test basis, evidence supporting the amounts and disclosures in the financial statements, assessing the accounting principles used and significant estimates made by management, and evaluating the overall financial statement presentation. We believe that our audits, which included confirmation of securities as of January 31, 2017 by correspondence with the custodian and brokers, provide a reasonable basis for our opinion.
PricewaterhouseCoopers LLP
Boston, Massachusetts
March 14, 2017
Trustees and Officers
The Trustees, Members of the Advisory Board (if any), and officers of the trust and fund, as applicable, are listed below. The Board of Trustees governs the fund and is responsible for protecting the interests of shareholders. The Trustees are experienced executives who meet periodically throughout the year to oversee the fund's activities, review contractual arrangements with companies that provide services to the fund, oversee management of the risks associated with such activities and contractual arrangements, and review the fund's performance. Each of the Trustees oversees 169 funds.
The Trustees hold office without limit in time except that (a) any Trustee may resign; (b) any Trustee may be removed by written instrument, signed by at least two-thirds of the number of Trustees prior to such removal; (c) any Trustee who requests to be retired or who has become incapacitated by illness or injury may be retired by written instrument signed by a majority of the other Trustees; and (d) any Trustee may be removed at any special meeting of shareholders by a two-thirds vote of the outstanding voting securities of the trust. Each Trustee who is not an interested person (as defined in the 1940 Act) of the trust and the fund is referred to herein as an Independent Trustee. Each Independent Trustee shall retire not later than the last day of the calendar year in which his or her 75th birthday occurs. The Independent Trustees may waive this mandatory retirement age policy with respect to individual Trustees. Officers and Advisory Board Members hold office without limit in time, except that any officer or Advisory Board Member may resign or may be removed by a vote of a majority of the Trustees at any regular meeting or any special meeting of the Trustees. Except as indicated, each individual has held the office shown or other offices in the same company for the past five years.
The fund’s Statement of Additional Information (SAI) includes more information about the Trustees. To request a free copy, call Fidelity at 1-877-208-0098.
Experience, Skills, Attributes, and Qualifications of the Trustees. The Governance and Nominating Committee has adopted a statement of policy that describes the experience, qualifications, attributes, and skills that are necessary and desirable for potential Independent Trustee candidates (Statement of Policy). The Board believes that each Trustee satisfied at the time he or she was initially elected or appointed a Trustee, and continues to satisfy, the standards contemplated by the Statement of Policy. The Governance and Nominating Committee also engages professional search firms to help identify potential Independent Trustee candidates who have the experience, qualifications, attributes, and skills consistent with the Statement of Policy. From time to time, additional criteria based on the composition and skills of the current Independent Trustees, as well as experience or skills that may be appropriate in light of future changes to board composition, business conditions, and regulatory or other developments, have also been considered by the professional search firms and the Governance and Nominating Committee. In addition, the Board takes into account the Trustees' commitment and participation in Board and committee meetings, as well as their leadership of standing and ad hoc committees throughout their tenure.
In determining that a particular Trustee was and continues to be qualified to serve as a Trustee, the Board has considered a variety of criteria, none of which, in isolation, was controlling. The Board believes that, collectively, the Trustees have balanced and diverse experience, qualifications, attributes, and skills, which allow the Board to operate effectively in governing the fund and protecting the interests of shareholders. Information about the specific experience, skills, attributes, and qualifications of each Trustee, which in each case led to the Board's conclusion that the Trustee should serve (or continue to serve) as a trustee of the fund, is provided below.
Board Structure and Oversight Function. James C. Curvey is an interested person and currently serves as Chairman. The Trustees have determined that an interested Chairman is appropriate and benefits shareholders because an interested Chairman has a personal and professional stake in the quality and continuity of services provided to the fund. Independent Trustees exercise their informed business judgment to appoint an individual of their choosing to serve as Chairman, regardless of whether the Trustee happens to be independent or a member of management. The Independent Trustees have determined that they can act independently and effectively without having an Independent Trustee serve as Chairman and that a key structural component for assuring that they are in a position to do so is for the Independent Trustees to constitute a substantial majority for the Board. The Independent Trustees also regularly meet in executive session. Ned C. Lautenbach serves as Chairman of the Independent Trustees and as such (i) acts as a liaison between the Independent Trustees and management with respect to matters important to the Independent Trustees and (ii) with management prepares agendas for Board meetings.
Fidelity® funds are overseen by different Boards of Trustees. The fund's Board oversees Fidelity's high income and certain equity funds, and other Boards oversee Fidelity's investment-grade bond, money market, asset allocation, and sector funds. The asset allocation funds may invest in Fidelity® funds overseen by the fund's Board. The use of separate Boards, each with its own committee structure, allows the Trustees of each group of Fidelity® funds to focus on the unique issues of the funds they oversee, including common research, investment, and operational issues. On occasion, the separate Boards establish joint committees to address issues of overlapping consequences for the Fidelity® funds overseen by each Board.
The Trustees operate using a system of committees to facilitate the timely and efficient consideration of all matters of importance to the Trustees, the fund, and fund shareholders and to facilitate compliance with legal and regulatory requirements and oversight of the fund's activities and associated risks. The Board, acting through its committees, has charged FMR and its affiliates with (i) identifying events or circumstances the occurrence of which could have demonstrably adverse effects on the fund's business and/or reputation; (ii) implementing processes and controls to lessen the possibility that such events or circumstances occur or to mitigate the effects of such events or circumstances if they do occur; and (iii) creating and maintaining a system designed to evaluate continuously business and market conditions in order to facilitate the identification and implementation processes described in (i) and (ii) above. Because the day-to-day operations and activities of the fund are carried out by or through FMR, its affiliates, and other service providers, the fund's exposure to risks is mitigated but not eliminated by the processes overseen by the Trustees. While each of the Board's committees has responsibility for overseeing different aspects of the fund's activities, oversight is exercised primarily through the Operations, Audit, and Compliance Committees. In addition, the Independent Trustees have worked with FMR to enhance the Board's oversight of investment and financial risks, legal and regulatory risks, technology risks, and operational risks, including the development of additional risk reporting to the Board. For example, a working group comprised of Independent Trustees and FMR has worked and continues to work to review the Fidelity® funds' valuation-related activities, reporting and risk management. Appropriate personnel, including but not limited to the fund's Chief Compliance Officer (CCO), FMR's internal auditor, the independent accountants, the fund's Treasurer and portfolio management personnel, make periodic reports to the Board's committees, as appropriate, including an annual review of Fidelity's risk management program for the Fidelity® funds. The responsibilities of each standing committee, including their oversight responsibilities, are described further under "Standing Committees of the Trustees."
Interested Trustees*:
Correspondence intended for a Trustee who is an interested person may be sent to Fidelity Investments, 245 Summer Street, Boston, Massachusetts 02210.
Name, Year of Birth; Principal Occupations and Other Relevant Experience+
James C. Curvey (1935)
Year of Election or Appointment: 2007
Trustee
Chairman of the Board of Trustees
Mr. Curvey also serves as Trustee of other Fidelity® funds. Mr. Curvey is a Director of Fidelity Research & Analysis Co. (investment adviser firm, 2009-present), and Vice Chairman (2007-present) and Director of FMR LLC (diversified financial services company). In addition, Mr. Curvey serves as an Overseer for the Boston Symphony Orchestra and a member of the board of Artis-Naples, Naples, Florida, and as a Trustee for Brewster Academy, Wolfeboro, New Hampshire. Previously, Mr. Curvey served as a Director of Fidelity Investments Money Management, Inc. (investment adviser firm, 2009-2014) and a Director of FMR and FMR Co., Inc. (investment adviser firms, 2007-2014).
Charles S. Morrison (1960)
Year of Election or Appointment: 2014
Trustee
Mr. Morrison also serves as Trustee of other funds. He serves as President of Fidelity Management & Research Company (FMR) (investment adviser firm, 2016-present), a Director of Fidelity Investments Money Management, Inc. (FIMM) (investment adviser firm, 2014-present), Director of Fidelity SelectCo, LLC (investment adviser firm, 2014-present), President, Asset Management (2014-present), and is an employee of Fidelity Investments. Previously, Mr. Morrison served as Vice President of Fidelity's Fixed Income and Asset Allocation Funds (2012-2014), President, Fixed Income (2011-2014), Vice President of Fidelity's Money Market Funds (2005-2009), President, Money Market Group Leader of FMR (investment adviser firm, 2009), and Senior Vice President, Money Market Group of FMR (2004-2009). Mr. Morrison also served as Vice President of Fidelity's Bond Funds (2002-2005), certain Balanced Funds (2002-2005), and certain Asset Allocation Funds (2002-2007), and as Senior Vice President (2002-2005) of Fidelity's Bond Division.
* Determined to be an “Interested Trustee” by virtue of, among other things, his or her affiliation with the trust or various entities under common control with FMR.
+ The information includes the Trustee's principal occupation during the last five years and other information relating to the experience, attributes, and skills relevant to the Trustee's qualifications to serve as a Trustee, which led to the conclusion that the Trustee should serve as a Trustee for the fund.
Independent Trustees:
Correspondence intended for an Independent Trustee may be sent to Fidelity Investments, P.O. Box 55235, Boston, Massachusetts 02205-5235.
Name, Year of Birth; Principal Occupations and Other Relevant Experience+
Dennis J. Dirks (1948)
Year of Election or Appointment: 2005
Trustee
Mr. Dirks also serves as Trustee of other Fidelity® funds. Prior to his retirement in May 2003, Mr. Dirks was Chief Operating Officer and a member of the Board of The Depository Trust & Clearing Corporation (DTCC). He also served as President, Chief Operating Officer, and Board member of The Depository Trust Company (DTC) and President and Board member of the National Securities Clearing Corporation (NSCC). In addition, Mr. Dirks served as Chief Executive Officer and Board member of the Government Securities Clearing Corporation, Chief Executive Officer and Board member of the Mortgage-Backed Securities Clearing Corporation, as a Trustee and a member of the Finance Committee of Manhattan College (2005-2008), as a Trustee and a member of the Finance Committee of AHRC of Nassau County (2006-2008), and as a member of the Independent Directors Council (IDC) Governing Council (2010-2015). Mr. Dirks is a member of the Board of Directors for The Brookville Center for Children's Services, Inc. (2009-present) and the Finance Committee of the Asolo Repertory Theatre (2016-present).
Alan J. Lacy (1953)
Year of Election or Appointment: 2008
Trustee
Mr. Lacy also serves as Trustee of other Fidelity® funds. Mr. Lacy serves as Chairman (2014-present) and a member (2010-present) of the Board of Directors of Dave & Buster's Entertainment, Inc. (restaurant and entertainment complexes) and a Director of Bristol-Myers Squibb Company (global pharmaceuticals, 2008-present). He is a Trustee of the California Chapter of The Nature Conservancy (2015-present) and a Director of the Center for Advanced Study in the Behavioral Sciences at Stanford University (2015-present). In addition, Mr. Lacy served as Senior Adviser (2007-2014) of Oak Hill Capital Partners, L.P. (private equity) and also served as Chief Executive Officer (2005) and Vice Chairman (2005-2006) of Sears Holdings Corporation (retail) and Chief Executive Officer and Chairman of the Board of Sears, Roebuck and Co. (retail, 2000-2005). Previously, Mr. Lacy served as Chairman (2008-2011) and a member (2006-2015) of the Board of Trustees of the National Parks Conservation Association and as a member of the Board of Directors for The Western Union Company (global money transfer, 2006-2011), The Hillman Companies, Inc. (hardware wholesalers, 2010-2014), and Earth Fare, Inc. (retail grocery, 2010-2014).
Ned C. Lautenbach (1944)
Year of Election or Appointment: 2000
Trustee
Chairman of the Independent Trustees
Mr. Lautenbach also serves as Trustee of other Fidelity® funds. Mr. Lautenbach currently serves as the Lead Director of the Eaton Corporation Board of Directors (diversified industrial, 1997-present). Mr. Lautenbach is Chairman of the Board of Directors of Artis-Naples in Naples, Florida (2012-present), a member of the Council on Foreign Relations (1994-present), and currently Vice Chair of the Board of Governors, State University System of Florida (2013-present). Previously, Mr. Lautenbach was a Partner and Advisory Partner at Clayton, Dubilier & Rice, LLC (private equity investment, 1998-2010), as well as a Director of Sony Corporation (2006-2007). Mr. Lautenbach also had a 30-year career with IBM (technology company) during which time he served as Senior Vice President and a member of the Corporate Executive Committee (1968-1998).
Joseph Mauriello (1944)
Year of Election or Appointment: 2008
Trustee
Mr. Mauriello also serves as Trustee of other Fidelity® funds. Prior to his retirement in January 2006, Mr. Mauriello served in numerous senior management positions including Deputy Chairman and Chief Operating Officer (2004-2005), and Vice Chairman of Financial Services (2002-2004) of KPMG LLP US (professional services, 1965-2005). Mr. Mauriello currently serves as a member of the Board of Directors of XL Group plc. (global insurance and re-insurance, 2006-present) and the Independent Directors Council (IDC) Governing Council (2015-present). Previously, Mr. Mauriello served as a Director of the Hamilton Funds of the Bank of New York (2006-2007) and of Arcadia Resources Inc. (health care services and products, 2007-2012).
Robert W. Selander (1950)
Year of Election or Appointment: 2011
Trustee
Mr. Selander also serves as Trustee of other Fidelity® funds. Mr. Selander serves as a Director of The Western Union Company (global money transfer, 2014-present) and a non-executive Chairman of Health Equity, Inc. (health savings custodian, 2015-present). Previously, Mr. Selander served as a Member of the Advisory Board of certain Fidelity® funds (2011), and Executive Vice Chairman (2010), Chief Executive Officer (2009-2010), and President and Chief Executive Officer (1997-2009) of Mastercard, Inc.
Cornelia M. Small (1944)
Year of Election or Appointment: 2005
Trustee
Ms. Small also serves as Trustee of other Fidelity® funds. Ms. Small is a member of the Board of Directors (2009-present) and Chair of the Investment Committee (2010-present) of the Teagle Foundation. Ms. Small also serves on the Investment Committee of the Berkshire Taconic Community Foundation (2008-present). Previously, Ms. Small served as Chairperson (2002-2008) and a member of the Investment Committee and Chairperson (2008-2012) and a member of the Board of Trustees of Smith College. In addition, Ms. Small served as Chief Investment Officer, Director of Global Equity Investments, and a member of the Board of Directors of Scudder, Stevens & Clark and Scudder Kemper Investments.
William S. Stavropoulos (1939)
Year of Election or Appointment: 2002
Trustee
Vice Chairman of the Independent Trustees
Mr. Stavropoulos also serves as Trustee of other Fidelity® funds. Mr. Stavropoulos serves as President and Founder of the Michigan Baseball Foundation, the Great Lakes Loons (2007-present). Mr. Stavropoulos is Chairman Emeritus of the Board of Directors of The Dow Chemical Company, where he previously served in numerous senior management positions, including President, CEO (1995-2000; 2002-2004), Chairman of the Executive Committee (2000-2006), and as a member of the Board of Directors (1990-2006). Currently, Mr. Stavropoulos is Chairman of the Board of Directors of Univar Inc. (global distributor of commodity and specialty chemicals), a Director of Teradata Corporation (data warehousing and technology solutions), and a member of the Advisory Board for Metalmark Capital LLC (private equity investment, 2005-present). Mr. Stavropoulos is an operating advisor to Clayton, Dubilier & Rice, LLC (private equity investment). In addition, Mr. Stavropoulos is a member of the University of Notre Dame Advisory Council for the College of Science, a Trustee of the Rollin L. Gerstacker Foundation, and a Director of Artis-Naples in Naples, Florida. Previously, Mr. Stavropoulos served as a Director of Chemical Financial Corporation (bank holding company, 1993-2012) and Tyco International, Ltd. (multinational manufacturing and services, 2007-2012).
David M. Thomas (1949)
Year of Election or Appointment: 2008
Trustee
Mr. Thomas also serves as Trustee of other Fidelity® funds. Mr. Thomas serves as Non-Executive Chairman of the Board of Directors of Fortune Brands Home and Security (home and security products, 2011-present), as a member of the Board of Directors (2004-present) and Presiding Director (2013-present) of Interpublic Group of Companies, Inc. (marketing communication), and as a member of the Board of Trustees of the University of Florida (2013-present). Previously, Mr. Thomas served as Executive Chairman (2005-2006) and Chairman and Chief Executive Officer (2000-2005) of IMS Health, Inc. (pharmaceutical and healthcare information solutions), and a Director of Fortune Brands, Inc. (consumer products, 2000-2011).
+ The information includes the Trustee's principal occupation during the last five years and other information relating to the experience, attributes, and skills relevant to the Trustee's qualifications to serve as a Trustee, which led to the conclusion that the Trustee should serve as a Trustee for the fund.
Advisory Board Members and Officers:
Correspondence intended for an officer or Peter S. Lynch may be sent to Fidelity Investments, 245 Summer Street, Boston, Massachusetts 02210. Officers appear below in alphabetical order.
Name, Year of Birth; Principal Occupation
Peter S. Lynch (1944)
Year of Election or Appointment: 2003
Member of the Advisory Board
Mr. Lynch also serves as Member of the Advisory Board of other Fidelity® funds. Mr. Lynch is Vice Chairman and a Director of FMR (investment adviser firm) and FMR Co., Inc. (investment adviser firm). In addition, Mr. Lynch serves as a Trustee of Boston College and as the Chairman of the Inner-City Scholarship Fund. Previously, Mr. Lynch served on the Special Olympics International Board of Directors (1997-2006).
Elizabeth Paige Baumann (1968)
Year of Election or Appointment: 2017
Interim Anti-Money Laundering (AML) Officer
Ms. Baumann also serves as AML Officer of other funds. She is Chief AML Officer (2012-present) and Senior Vice President (2014-present) of FMR LLC (diversified financial services company) and is an employee of Fidelity Investments. Previously, Ms. Baumann served as AML Officer (2012-2016), Vice President (2007-2014), and Deputy Anti-Money Laundering Officer (2007-2012).
Marc R. Bryant (1966)
Year of Election or Appointment: 2015
Secretary and Chief Legal Officer (CLO)
Mr. Bryant also serves as Secretary and CLO of other funds. Mr. Bryant serves as CLO, Secretary, and Senior Vice President of Fidelity Management & Research Company (investment adviser firm, 2015-present) and FMR Co., Inc. (investment adviser firm, 2015-present); Secretary of Fidelity SelectCo, LLC (investment adviser firm, 2015-present) and Fidelity Investments Money Management, Inc. (investment adviser firm, 2015-present); and CLO of Fidelity Management & Research (Hong Kong) Limited and FMR Investment Management (UK) Limited (investment adviser firms, 2015-present) and Fidelity Management & Research (Japan) Limited (investment adviser firm, 2016-present). He is Senior Vice President and Deputy General Counsel of FMR LLC (diversified financial services company). Previously, Mr. Bryant served as Secretary and CLO of Fidelity Rutland Square Trust II (2010-2014) and Assistant Secretary of Fidelity's Fixed Income and Asset Allocation Funds (2013-2015). Prior to joining Fidelity Investments, Mr. Bryant served as a Senior Vice President and the Head of Global Retail Legal for AllianceBernstein L.P. (2006-2010), and as the General Counsel for ProFund Advisors LLC (2001-2006).
Jeffrey S. Christian (1961)
Year of Election or Appointment: 2016
Assistant Treasurer
Mr. Christian also serves as Assistant Treasurer of other funds. Mr. Christian is an employee of Fidelity Investments (2003-present).
William C. Coffey (1969)
Year of Election or Appointment: 2009
Assistant Secretary
Mr. Coffey also serves as Assistant Secretary of other funds. He is Senior Vice President and Deputy General Counsel of FMR LLC (diversified financial services company, 2010-present), and is an employee of Fidelity Investments. Previously, Mr. Coffey served as Vice President and Associate General Counsel of FMR LLC (2005-2009).
Jonathan Davis (1968)
Year of Election or Appointment: 2010
Assistant Treasurer
Mr. Davis also serves as Assistant Treasurer of other funds, and is an employee of Fidelity Investments. Previously, Mr. Davis served as Vice President and Associate General Counsel of FMR LLC (diversified financial services company, 2003-2010).
Adrien E. Deberghes (1967)
Year of Election or Appointment: 2016
Assistant Treasurer
Mr. Deberghes also serves as an officer of other funds. He serves as Executive Vice President of Fidelity Investments Money Management, Inc. (FIMM) (investment adviser firm, 2016-present) and is an employee of Fidelity Investments (2008-present). Prior to joining Fidelity Investments, Mr. Deberghes was Senior Vice President of Mutual Fund Administration at State Street Corporation (2007-2008), Senior Director of Mutual Fund Administration at Investors Bank & Trust (2005-2007), and Director of Finance for Dunkin' Brands (2000-2005). Previously, Mr. Deberghes served in other fund officer roles.
Stephanie J. Dorsey (1969)
Year of Election or Appointment: 2010
Assistant Treasurer
Ms. Dorsey also serves as an officer of other funds. She is an employee of Fidelity Investments (2008-present) and has served in other fund officer roles. Prior to joining Fidelity Investments, Ms. Dorsey served as Treasurer (2004-2008) of the JPMorgan Mutual Funds and Vice President (2004-2008) of JPMorgan Chase Bank.
Howard J. Galligan III (1966)
Year of Election or Appointment: 2014
Chief Financial Officer
Mr. Galligan also serves as Chief Financial Officer of other funds. Mr. Galligan serves as President of Fidelity Pricing and Cash Management Services (FPCMS) (2014-present) and as a Director of Strategic Advisers, Inc. (investment adviser firm, 2008-present). Previously, Mr. Galligan served as Chief Administrative Officer of Asset Management (2011-2014) and Chief Operating Officer and Senior Vice President of Investment Support for Strategic Advisers, Inc. (2003-2011).
Scott C. Goebel (1968)
Year of Election or Appointment: 2015
Vice President
Mr. Goebel serves as Vice President of other funds and is an employee of Fidelity Investments (2001-present). Previously, Mr. Goebel served as Senior Vice President of Fidelity Management & Research Company (FMR) (investment adviser firm, 2016), Secretary of Fidelity SelectCo, LLC (investment adviser firm, 2013-2015), Fidelity Investments Money Management, Inc. (FIMM) (investment adviser firm, 2010-2015), and Fidelity Research and Analysis Company (FRAC) (investment adviser firm, 2010-2015); General Counsel, Secretary, and Senior Vice President of FMR (investment adviser firm, 2008-2015) and FMR Co., Inc. (investment adviser firm, 2008-2015); Assistant Secretary of Fidelity Management & Research (Japan) Limited (investment adviser firm, 2008-2015) and Fidelity Management & Research (U.K.) Inc. (investment adviser firm, 2008-2015); Chief Legal Officer (CLO) of Fidelity Management & Research (Hong Kong) Limited (investment adviser firm, 2008-2015); Secretary and CLO of certain Fidelity® funds (2008-2015); Assistant Secretary of FIMM (2008-2010), FRAC (2008-2010), and certain funds (2007-2008); and as Vice President and Secretary of Fidelity Distributors Corporation (FDC) (2005-2007).
Thomas C. Hense (1964)
Year of Election or Appointment: 2008, 2010, or 2015
Vice President
Mr. Hense serves as Vice President of Fidelity Advisor® Multi-Asset Income Fund (2015) and other funds (High Income (2008), Small Cap (2008), and Value (2010) funds), and is an employee of Fidelity Investments (1993-present). Previously, Mr. Hense served as a portfolio manager for Fidelity's Institutional Money Management Group (Pyramis) (2003-2008).
Brian B. Hogan (1964)
Year of Election or Appointment: 2009
Vice President
Mr. Hogan also serves as Trustee or Vice President of other funds. Mr. Hogan serves as a Director of FMR Investment Management (UK) Limited (investment adviser firm, 2015-present) and Fidelity SelectCo, LLC (investment adviser firm, 2014-present) and President of the Equity Division of FMR (investment adviser firm, 2009-present). Previously, Mr. Hogan served as Senior Vice President, Equity Research of FMR (2006-2009) and as a portfolio manager. Mr. Brian B. Hogan is not related to Mr. Colm A. Hogan.
Colm A. Hogan (1973)
Year of Election or Appointment: 2016
Deputy Treasurer
Mr. Hogan also serves as an officer of other funds. Mr. Hogan is an employee of Fidelity Investments (2005-present). Mr. Colm A. Hogan is not related to Mr. Brian B. Hogan.
Chris Maher (1972)
Year of Election or Appointment: 2013
Assistant Treasurer
Mr. Maher serves as Assistant Treasurer of other funds. Mr. Maher is Vice President of Valuation Oversight and is an employee of Fidelity Investments. Previously, Mr. Maher served as Vice President of Asset Management Compliance (2013), Vice President of the Program Management Group of FMR (investment adviser firm, 2010-2013), and Vice President of Valuation Oversight (2008-2010).
Kenneth B. Robins (1969)
Year of Election or Appointment: 2016
Chief Compliance Officer
Mr. Robins also serves as an officer of other funds. Mr. Robins serves as Compliance Officer of Fidelity Management & Research Company and FMR Co., Inc. (investment adviser firms, 2016-present) and is an employee of Fidelity Investments (2004-present). Previously, Mr. Robins served as Executive Vice President of Fidelity Investments Money Management, Inc. (investment adviser firm, 2013-2016) and served in other fund officer roles.
Stacie M. Smith (1974)
Year of Election or Appointment: 2016
President and Treasurer
Ms. Smith also serves as an officer of other funds. She is an employee of Fidelity Investments (2009-present) and has served in other fund officer roles. Prior to joining Fidelity Investments, Ms. Smith served as Senior Audit Manager of Ernst & Young LLP (accounting firm, 1996-2009). Previously, Ms. Smith served as Deputy Treasurer of certain Fidelity® funds (2013-2016).
Marc L. Spector (1972)
Year of Election or Appointment: 2016
Assistant Treasurer
Mr. Spector also serves as an officer of other funds. Mr. Spector is an employee of Fidelity Investments (2016-present). Prior to joining Fidelity Investments, Mr. Spector served as Director at the Siegfried Group (accounting firm, 2013-2016), and prior to Siegfried Group as audit senior manager at Deloitte & Touche (accounting firm, 2005-2013).
Renee Stagnone (1975)
Year of Election or Appointment: 2016
Assistant Treasurer
Ms. Stagnone also serves as an officer of other funds. Ms. Stagnone is an employee of Fidelity Investments (1997-present). Previously, Ms. Stagnone served as Deputy Treasurer of certain Fidelity® funds (2013-2016).
Shareholder Expense Example
As a shareholder of the Fund, you incur two types of costs: (1) transaction costs, including sales charges (loads) on purchase payments or redemption proceeds, and (2) ongoing costs, including management fees, distribution and/or service (12b-1) fees and other Fund expenses. This Example is intended to help you understand your ongoing costs (in dollars) of investing in the Fund and to compare these costs with the ongoing costs of investing in other mutual funds.
The Example is based on an investment of $1,000 invested at the beginning of the period and held for the entire period (August 1, 2016 to January 31, 2017).
Actual Expenses
The first line of the accompanying table for each class of the Fund provides information about actual account values and actual expenses. You may use the information in this line, together with the amount you invested, to estimate the expenses that you paid over the period. Simply divide your account value by $1,000.00 (for example, an $8,600 account value divided by $1,000.00 = 8.6), then multiply the result by the number in the first line for a class of the Fund under the heading entitled "Expenses Paid During Period" to estimate the expenses you paid on your account during this period. A small balance maintenance fee of $12.00 that is charged once a year may apply for certain accounts with a value of less than $2,000. This fee is not included in the table below. If it was, the estimate of expenses you paid during the period would be higher, and your ending account value lower, by this amount. In addition, the Fund, as a shareholder in the underlying Fidelity Central Funds, will indirectly bear its pro-rata share of the fees and expenses incurred by the underlying Fidelity Central Funds. These fees and expenses are not included in the Fund's annualized expense ratio used to calculate the expense estimate in the table below.
Hypothetical Example for Comparison Purposes
The second line of the accompanying table for each class of the Fund provides information about hypothetical account values and hypothetical expenses based on a Class' actual expense ratio and an assumed rate of return of 5% per year before expenses, which is not the Class' actual return. The hypothetical account values and expenses may not be used to estimate the actual ending account balance or expenses you paid for the period. You may use this information to compare the ongoing costs of investing in the Fund and other funds. To do so, compare this 5% hypothetical example with the 5% hypothetical examples that appear in the shareholder reports of the other funds. A small balance maintenance fee of $12.00 that is charged once a year may apply for certain accounts with a value of less than $2,000. This fee is not included in the table below. If it was, the estimate of expenses you paid during the period would be higher, and your ending account value lower, by this amount. In addition, the Fund, as a shareholder in the underlying Fidelity Central Funds, will indirectly bear its pro-rata share of the fees and expenses incurred by the underlying Fidelity Central Funds. These fees and expenses are not included in the Fund's annualized expense ratio used to calculate the expense estimate in the table below.
Please note that the expenses shown in the table are meant to highlight your ongoing costs only and do not reflect any transaction costs. Therefore, the second line of the table is useful in comparing ongoing costs only, and will not help you determine the relative total costs of owning different funds. In addition, if these transactional costs were included, your costs would have been higher.
| | Annualized Expense Ratio-A | Beginning
Account Value
August 1, 2016 | Ending
Account Value
January 31, 2017 | Expenses Paid
During Period-B
August 1, 2016
to January 31, 2017 |
| Class A | 1.02% | | | |
| Actual | | $1,000.00 | $1,077.00 | $5.33 |
| Hypothetical-C | | $1,000.00 | $1,020.01 | $5.18 |
| Class T | 1.36% | | | |
| Actual | | $1,000.00 | $1,074.90 | $7.09 |
| Hypothetical-C | | $1,000.00 | $1,018.30 | $6.90 |
| Class C | 1.87% | | | |
| Actual | | $1,000.00 | $1,072.80 | $9.74 |
| Hypothetical-C | | $1,000.00 | $1,015.74 | $9.48 |
| Stock Selector Large Cap Value | .74% | | | |
| Actual | | $1,000.00 | $1,078.30 | $3.87 |
| Hypothetical-C | | $1,000.00 | $1,021.42 | $3.76 |
| Class I | .87% | | | |
| Actual | | $1,000.00 | $1,077.50 | $4.54 |
| Hypothetical-C | | $1,000.00 | $1,020.76 | $4.42 |
A Annualized expense ratio reflects expenses net of applicable fee waivers.
B Expenses are equal to each Class' annualized expense ratio, multiplied by the average account value over the period, multiplied by 184/366 (to reflect the one-half year period).
C 5% return per year before expenses
Distributions (Unaudited)
Class A, Class T, Class C, Stock Selector Large Cap Value, and Class I designate 100% of the dividends distributed in December 2016 during the fiscal year as qualifying for the dividends–received deduction for corporate shareholders.
Class A, Class T, Class C, Stock Selector Large Cap Value, and Class I designate 100% of the dividends distributed during the fiscal year as amounts which may be taken into account as a dividend for purposes of the maximum rate under section 1(h)(11) of the Internal Revenue Code.
The fund will notify shareholders in January 2018 of amounts for use in preparing 2017 income tax returns.
ALCV-ANN-0317
1.838396.107
Fidelity® Series All-Sector Equity Fund
Fidelity® Series All-Sector Equity Fund
Class F Fidelity® Series Equity-Income Fund
Fidelity® Series Equity-Income Fund
Class F Fidelity® Series Stock Selector Large Cap Value Fund
Fidelity® Series Stock Selector Large Cap Value Fund
Class F
Annual Report January 31, 2017 |
|
Contents
To view a fund's proxy voting guidelines and proxy voting record for the 12-month period ended June 30, visit http://www.fidelity.com/proxyvotingresults or visit the Securities and Exchange Commission's (SEC) web site at http://www.sec.gov.
You may also call 1-800-544-8544, or for Class F, call 1-800-835-5092, to request a free copy of the proxy voting guidelines.
Standard & Poor's, S&P and S&P 500 are registered service marks of The McGraw-Hill Companies, Inc. and have been licensed for use by Fidelity Distributors Corporation.
Other third-party marks appearing herein are the property of their respective owners.
All other marks appearing herein are registered or unregistered trademarks or service marks of FMR LLC or an affiliated company. © 2017 FMR LLC. All rights reserved.
This report and the financial statements contained herein are submitted for the general information of the shareholders of the Funds. This report is not authorized for distribution to prospective investors in the Funds unless preceded or accompanied by an effective prospectus.
A fund files its complete schedule of portfolio holdings with the SEC for the first and third quarters of each fiscal year on Form N-Q. Forms N-Q are available on the SEC’s web site at http://www.sec.gov. A fund's Forms N-Q may be reviewed and copied at the SEC’s Public Reference Room in Washington, DC. Information regarding the operation of the SEC's Public Reference Room may be obtained by calling 1-800-SEC-0330.
For a complete list of a fund's portfolio holdings, view the most recent holdings listing, semiannual report, or annual report on Fidelity's web site at http://www.fidelity.com, http://www.institutional.fidelity.com, or http://www.401k.com, as applicable.
NOT FDIC INSURED •MAY LOSE VALUE •NO BANK GUARANTEE
Neither the Funds nor Fidelity Distributors Corporation is a bank.
Fidelity® Series All-Sector Equity Fund
Performance: The Bottom Line
Average annual total return reflects the change in the value of an investment, assuming reinvestment of distributions from dividend income and capital gains (the profits earned upon the sale of securities that have grown in value, if any) and assuming a constant rate of performance each year. The hypothetical investment and the average annual total returns do not reflect the deduction of taxes that a shareholder would pay on fund distributions or the redemption of fund shares. During periods of reimbursement by Fidelity, a fund’s total return will be greater than it would be had the reimbursement not occurred. How a fund did yesterday is no guarantee of how it will do tomorrow.
Average Annual Total Returns
| For the periods ended January 31, 2017 | Past 1 year | Past 5 years | Life of fundA |
| Fidelity® Series All-Sector Equity Fund | 21.03% | 13.69% | 13.17% |
| Class F | 21.11% | 13.87% | 13.36% |
A From October 17, 2008
The initial offering of Class F shares took place on June 26, 2009. Returns prior to June 26, 2009 are those of Fidelity® Series All-Sector Equity Fund, the original class of the fund.
$10,000 Over Life of Fund
Let's say hypothetically that $10,000 was invested in Fidelity® Series All-Sector Equity Fund, a class of the fund, on October 17, 2008, when the fund started.
The chart shows how the value of your investment would have changed, and also shows how the Russell 1000® Index performed over the same period.

| Period Ending Values |
| $27,917 | Fidelity® Series All-Sector Equity Fund |
| $29,620 | Russell 1000® Index |
Fidelity® Series All-Sector Equity Fund
Management's Discussion of Fund Performance
Market Recap: The U.S. equity bellwether S&P 500
® index posted a 20.04% gain for the year ending January 31, 2017, rising sharply in the period’s final months on renewed optimism for economic growth. The beginning of the period saw improving investor sentiment amid U.S. job gains, a rally in energy and other stimuli that helped keep the seven-year bull uptrend intact. Markets tumbled briefly following the U.K.’s June 23 vote to exit the European Union (Brexit) – then recovered quickly and settled into a flattish stretch until the November 8 U.S. presidential election. Stocks then broke out in response to Donald Trump’s surprise victory, surging to a series of new all-time highs on expectations for reflation and fiscal stimulus. For the year, industrials (+28%), energy (+27%) and materials (+37%) all did well, the latter two driven by a cyclical rebound in commodity prices. Financials (+35%) also shined, riding an uptick in bond yields and the strong rally in banks (+41%), especially post-election. Information technology rose about 25%, despite cooling off in the fourth quarter of 2016. Conversely, real estate (+8%) lagged on the prospect for rising interest rates. An improved backdrop for riskier assets curbed dividend-rich telecommunication services (+13%), utilities (+12%) and consumer staples (+6%). Health care (+8%) underperformed amid an uncertain political and regulatory outlook.
Comments from Co-Portfolio Manager Robert Stansky: For the year, the fund’s share classes gained roughly 21%, slightly better than the 20.81% return of the benchmark Russell 1000
® Index. Versus the benchmark, stock picking in the information technology and financials sectors helped most. Technology was home to the fund’s largest contributor, Autodesk, which makes design software for engineering and architectural firms. The stock rallied as the company’s decision to transition its business to a subscription model gained traction in the second half of 2016. Autodesk was among the fund’s largest holdings. Qorvo, another contributor we overweighted, epitomized the strong semiconductor group this period. Larger-than-benchmark exposure to credit-card issuer Capital One Financial was timely, as this stock was one of many in the financials sector that was lifted by Donald Trump’s victory in the U.S. presidential election. Conversely, stock selection in health care and consumer discretionary worked against relative results. Overweighting L Brands detracted. The parent of intimate-apparel retailer Victoria’s Secret was hurt by brand repositioning and management’s decision to restructure. Lastly, it hurt to overweight weak-performing pharmaceutical company Allergan. A number of factors weighed on the Irish firm, including earnings dilution related to the sale of its generics business.
The views expressed above reflect those of the portfolio manager(s) only through the end of the period as stated on the cover of this report and do not necessarily represent the views of Fidelity or any other person in the Fidelity organization. Any such views are subject to change at any time based upon market or other conditions and Fidelity disclaims any responsibility to update such views. These views may not be relied on as investment advice and, because investment decisions for a Fidelity fund are based on numerous factors, may not be relied on as an indication of trading intent on behalf of any Fidelity fund.
Fidelity® Series All-Sector Equity Fund
Investment Summary (Unaudited)
Top Ten Stocks as of January 31, 2017
| | % of fund's net assets | % of fund's net assets 6 months ago |
| Apple, Inc. | 3.4 | 2.9 |
| Alphabet, Inc. Class C | 2.6 | 3.0 |
| Autodesk, Inc. | 2.6 | 1.6 |
| Microsoft Corp. | 2.0 | 1.1 |
| Capital One Financial Corp. | 2.0 | 1.8 |
| Amazon.com, Inc. | 1.9 | 2.0 |
| Philip Morris International, Inc. | 1.9 | 2.0 |
| Bank of America Corp. | 1.6 | 1.0 |
| Facebook, Inc. Class A | 1.5 | 1.5 |
| The Walt Disney Co. | 1.4 | 1.2 |
| | 20.9 | |
Top Five Market Sectors as of January 31, 2017
| | % of fund's net assets | % of fund's net assets 6 months ago |
| Information Technology | 20.5 | 18.6 |
| Financials | 14.3 | 16.8 |
| Health Care | 12.4 | 14.1 |
| Consumer Discretionary | 11.8 | 12.2 |
| Industrials | 10.1 | 9.6 |
Prior period industry classifications reflect the categories in place as of the date indicated and have not been adjusted to reflect current industry classifications.
Asset Allocation (% of fund's net assets)
| As of January 31, 2017 * |
| | Stocks and Equity Futures | 97.6% |
| | Short-Term Investments and Net Other Assets (Liabilities) | 2.4% |

* Foreign investments - 4.2%
| As of July 31, 2016 * |
| | Stocks and Equity Futures | 98.7% |
| | Short-Term Investments and Net Other Assets (Liabilities) | 1.3% |

* Foreign investments - 5.4%
Fidelity® Series All-Sector Equity Fund
Investments January 31, 2017
Showing Percentage of Net Assets
| Common Stocks - 96.5% | | | |
| | | Shares | Value |
| CONSUMER DISCRETIONARY - 11.8% | | | |
| Distributors - 0.2% | | | |
| LKQ Corp. (a) | | 318,388 | $10,159,761 |
| Hotels, Restaurants & Leisure - 0.9% | | | |
| Darden Restaurants, Inc. | | 125,700 | 9,211,296 |
| Hilton Grand Vacations, Inc. (a) | | 147,444 | 4,324,533 |
| Hilton Worldwide Holdings, Inc. | | 349,081 | 20,100,084 |
| Starbucks Corp. | | 284,638 | 15,717,710 |
| U.S. Foods Holding Corp. | | 100,000 | 2,720,000 |
| | | | 52,073,623 |
| Internet & Direct Marketing Retail - 2.2% | | | |
| Amazon.com, Inc. (a) | | 139,180 | 114,611,946 |
| Liberty Interactive Corp. QVC Group Series A (a) | | 744,800 | 14,285,264 |
| | | | 128,897,210 |
| Leisure Products - 0.2% | | | |
| Mattel, Inc. | | 542,300 | 14,213,683 |
| Media - 3.4% | | | |
| Charter Communications, Inc. Class A (a) | | 187,469 | 60,730,583 |
| Comcast Corp. Class A | | 275,274 | 20,761,165 |
| Interpublic Group of Companies, Inc. | | 588,000 | 13,835,640 |
| The Walt Disney Co. | | 753,817 | 83,409,851 |
| Time Warner, Inc. | | 233,637 | 22,627,743 |
| | | | 201,364,982 |
| Multiline Retail - 0.6% | | | |
| Dollar Tree, Inc. (a) | | 485,960 | 37,511,252 |
| Specialty Retail - 2.9% | | | |
| Advance Auto Parts, Inc. | | 37,861 | 6,218,291 |
| AutoZone, Inc. (a) | | 1,505 | 1,091,095 |
| Home Depot, Inc. | | 586,979 | 80,756,571 |
| L Brands, Inc. | | 599,273 | 36,082,227 |
| Ross Stores, Inc. | | 320,324 | 21,176,620 |
| TJX Companies, Inc. | | 389,898 | 29,211,158 |
| | | | 174,535,962 |
| Textiles, Apparel & Luxury Goods - 1.4% | | | |
| NIKE, Inc. Class B | | 1,062,784 | 56,221,274 |
| VF Corp. | | 545,594 | 28,087,179 |
| | | | 84,308,453 |
|
| TOTAL CONSUMER DISCRETIONARY | | | 703,064,926 |
|
| CONSUMER STAPLES - 8.4% | | | |
| Beverages - 1.7% | | | |
| Constellation Brands, Inc. Class A (sub. vtg.) | | 151,804 | 22,734,167 |
| Monster Beverage Corp. (a) | | 433,398 | 18,462,755 |
| The Coca-Cola Co. | | 1,440,354 | 59,875,516 |
| | | | 101,072,438 |
| Food & Staples Retailing - 1.6% | | | |
| CVS Health Corp. | | 622,981 | 49,097,133 |
| Kroger Co. | | 980,500 | 33,297,780 |
| Walgreens Boots Alliance, Inc. | | 143,329 | 11,744,378 |
| | | | 94,139,291 |
| Food Products - 0.8% | | | |
| Bunge Ltd. | | 170,200 | 11,779,542 |
| Mead Johnson Nutrition Co. Class A | | 220,609 | 15,544,110 |
| The Hain Celestial Group, Inc. (a) | | 150,000 | 5,934,000 |
| TreeHouse Foods, Inc. (a) | | 155,000 | 11,761,400 |
| | | | 45,019,052 |
| Household Products - 0.6% | | | |
| Colgate-Palmolive Co. | | 531,607 | 34,331,180 |
| Personal Products - 0.7% | | | |
| Coty, Inc. Class A | | 736,371 | 14,138,323 |
| Estee Lauder Companies, Inc. Class A | | 361,900 | 29,389,899 |
| | | | 43,528,222 |
| Tobacco - 3.0% | | | |
| Altria Group, Inc. | | 886,030 | 63,067,615 |
| Philip Morris International, Inc. | | 1,168,498 | 112,327,713 |
| Reynolds American, Inc. | | 97,000 | 5,832,610 |
| | | | 181,227,938 |
|
| TOTAL CONSUMER STAPLES | | | 499,318,121 |
|
| ENERGY - 6.8% | | | |
| Energy Equipment & Services - 1.4% | | | |
| Baker Hughes, Inc. | | 376,200 | 23,730,696 |
| Halliburton Co. | | 74,740 | 4,228,042 |
| Oceaneering International, Inc. | | 228,500 | 6,363,725 |
| Schlumberger Ltd. | | 566,200 | 47,396,602 |
| | | | 81,719,065 |
| Oil, Gas & Consumable Fuels - 5.4% | | | |
| Anadarko Petroleum Corp. | | 449,181 | 31,231,555 |
| Cabot Oil & Gas Corp. | | 323,200 | 6,942,336 |
| Chevron Corp. | | 454,329 | 50,589,534 |
| Cimarex Energy Co. | | 99,393 | 13,438,928 |
| Cobalt International Energy, Inc. (a) | | 739,600 | 725,400 |
| ConocoPhillips Co. | | 589,600 | 28,748,896 |
| Devon Energy Corp. | | 345,800 | 15,747,732 |
| EOG Resources, Inc. | | 364,700 | 37,046,226 |
| Exxon Mobil Corp. | | 572,424 | 48,020,649 |
| Newfield Exploration Co. (a) | | 292,300 | 11,715,384 |
| Parsley Energy, Inc. Class A (a) | | 325,800 | 11,474,676 |
| Phillips 66 Co. | | 280,000 | 22,853,600 |
| Pioneer Natural Resources Co. | | 118,700 | 21,393,301 |
| Rice Energy, Inc. (a) | | 274,600 | 5,445,318 |
| SM Energy Co. | | 342,300 | 10,443,573 |
| The Williams Companies, Inc. | | 322,000 | 9,286,480 |
| | | | 325,103,588 |
|
| TOTAL ENERGY | | | 406,822,653 |
|
| FINANCIALS - 14.3% | | | |
| Banks - 5.3% | | | |
| Bank of America Corp. | | 4,211,987 | 95,359,386 |
| Citigroup, Inc. | | 1,072,584 | 59,882,365 |
| Huntington Bancshares, Inc. | | 3,343,457 | 45,236,973 |
| JPMorgan Chase & Co. | | 313,900 | 26,565,357 |
| M&T Bank Corp. | | 120,200 | 19,540,914 |
| PNC Financial Services Group, Inc. | | 159,000 | 19,153,140 |
| Synovus Financial Corp. | | 120,051 | 5,003,726 |
| U.S. Bancorp | | 875,078 | 46,072,857 |
| | | | 316,814,718 |
| Capital Markets - 2.4% | | | |
| BlackRock, Inc. Class A | | 99,918 | 37,367,334 |
| CBOE Holdings, Inc. | | 123,000 | 9,793,260 |
| CME Group, Inc. | | 144,700 | 17,520,276 |
| E*TRADE Financial Corp. (a) | | 388,652 | 14,555,017 |
| Goldman Sachs Group, Inc. | | 141,200 | 32,379,984 |
| IntercontinentalExchange, Inc. | | 388,700 | 22,684,532 |
| Legg Mason, Inc. | | 151,800 | 4,810,542 |
| Northern Trust Corp. | | 62,600 | 5,193,296 |
| | | | 144,304,241 |
| Consumer Finance - 2.7% | | | |
| Capital One Financial Corp. | | 1,360,105 | 118,859,576 |
| SLM Corp. (a) | | 2,274,746 | 27,023,982 |
| Synchrony Financial | | 322,300 | 11,544,786 |
| | | | 157,428,344 |
| Diversified Financial Services - 1.1% | | | |
| Berkshire Hathaway, Inc.: | | | |
| Class A (a) | | 124 | 30,501,563 |
| Class B (a) | | 214,203 | 35,159,280 |
| | | | 65,660,843 |
| Insurance - 2.8% | | | |
| American International Group, Inc. | | 751,700 | 48,304,242 |
| Chubb Ltd. | | 287,054 | 37,744,730 |
| Marsh & McLennan Companies, Inc. | | 592,200 | 40,281,444 |
| The Travelers Companies, Inc. | | 197,800 | 23,296,884 |
| Unum Group | | 373,400 | 16,963,562 |
| | | | 166,590,862 |
| Real Estate Management & Development - 0.0% | | | |
| The RMR Group, Inc. | | 523 | 24,999 |
|
| TOTAL FINANCIALS | | | 850,824,007 |
|
| HEALTH CARE - 12.4% | | | |
| Biotechnology - 3.4% | | | |
| Alexion Pharmaceuticals, Inc. (a) | | 244,700 | 31,977,396 |
| Amgen, Inc. | | 422,265 | 66,160,480 |
| Biogen, Inc. (a)(b) | | 119,124 | 33,025,938 |
| Celgene Corp. (a) | | 175,400 | 20,372,710 |
| Gilead Sciences, Inc. | | 161,192 | 11,678,360 |
| Regeneron Pharmaceuticals, Inc. (a) | | 51,600 | 18,539,364 |
| Vertex Pharmaceuticals, Inc. (a) | | 280,600 | 24,095,122 |
| | | | 205,849,370 |
| Health Care Equipment & Supplies - 2.9% | | | |
| Abbott Laboratories | | 625,900 | 26,143,843 |
| Boston Scientific Corp. (a) | | 2,181,210 | 52,479,913 |
| Edwards Lifesciences Corp. (a) | | 177,100 | 17,044,104 |
| Intuitive Surgical, Inc. (a) | | 38,300 | 26,530,027 |
| Medtronic PLC | | 691,678 | 52,581,362 |
| | | | 174,779,249 |
| Health Care Providers & Services - 3.0% | | | |
| Aetna, Inc. | | 175,000 | 20,756,750 |
| Cigna Corp. | | 105,000 | 15,353,100 |
| Henry Schein, Inc. (a) | | 151,187 | 24,168,754 |
| Humana, Inc. | | 102,000 | 20,247,000 |
| McKesson Corp. | | 13,554 | 1,886,039 |
| UnitedHealth Group, Inc. | | 491,600 | 79,688,360 |
| Universal Health Services, Inc. Class B | | 143,500 | 16,162,405 |
| | | | 178,262,408 |
| Life Sciences Tools & Services - 0.8% | | | |
| Agilent Technologies, Inc. | | 422,600 | 20,694,722 |
| Thermo Fisher Scientific, Inc. | | 169,800 | 25,875,822 |
| | | | 46,570,544 |
| Pharmaceuticals - 2.3% | | | |
| Allergan PLC | | 226,804 | 49,645,128 |
| Bristol-Myers Squibb Co. | | 697,500 | 34,289,100 |
| Merck & Co., Inc. | | 375,000 | 23,246,250 |
| Pfizer, Inc. | | 881,609 | 27,973,454 |
| | | | 135,153,932 |
|
| TOTAL HEALTH CARE | | | 740,615,503 |
|
| INDUSTRIALS - 10.1% | | | |
| Aerospace & Defense - 2.3% | | | |
| General Dynamics Corp. | | 261,100 | 47,279,988 |
| Northrop Grumman Corp. | | 204,000 | 46,732,320 |
| United Technologies Corp. | | 375,848 | 41,219,250 |
| | | | 135,231,558 |
| Building Products - 0.2% | | | |
| A.O. Smith Corp. | | 231,600 | 11,290,500 |
| Construction & Engineering - 0.7% | | | |
| AECOM (a) | | 1,192,435 | 44,036,625 |
| Electrical Equipment - 1.2% | | | |
| AMETEK, Inc. | | 798,849 | 40,821,184 |
| Fortive Corp. | | 534,498 | 29,563,084 |
| | | | 70,384,268 |
| Industrial Conglomerates - 1.4% | | | |
| General Electric Co. | | 1,481,800 | 44,009,460 |
| Honeywell International, Inc. | | 364,105 | 43,080,904 |
| | | | 87,090,364 |
| Machinery - 2.6% | | | |
| Allison Transmission Holdings, Inc. | | 942,000 | 32,951,160 |
| Caterpillar, Inc. | | 521,100 | 49,848,426 |
| Flowserve Corp. | | 408,600 | 20,086,776 |
| IDEX Corp. | | 157,082 | 14,162,513 |
| Wabtec Corp. | | 442,500 | 38,338,200 |
| | | | 155,387,075 |
| Road & Rail - 1.2% | | | |
| J.B. Hunt Transport Services, Inc. | | 335,750 | 33,266,110 |
| Norfolk Southern Corp. | | 333,800 | 39,208,148 |
| | | | 72,474,258 |
| Trading Companies & Distributors - 0.5% | | | |
| HD Supply Holdings, Inc. (a) | | 650,705 | 27,524,822 |
|
| TOTAL INDUSTRIALS | | | 603,419,470 |
|
| INFORMATION TECHNOLOGY - 20.5% | | | |
| Communications Equipment - 0.0% | | | |
| CommScope Holding Co., Inc. (a) | | 77,400 | 2,927,268 |
| Electronic Equipment & Components - 0.8% | | | |
| CDW Corp. | | 202,700 | 10,441,077 |
| Jabil Circuit, Inc. | | 1,624,414 | 38,953,448 |
| | | | 49,394,525 |
| Internet Software & Services - 4.6% | | | |
| Alphabet, Inc. Class C (a) | | 195,966 | 156,143,749 |
| Facebook, Inc. Class A (a) | | 691,500 | 90,116,280 |
| Twitter, Inc. (a) | | 132,300 | 2,331,126 |
| Yahoo!, Inc. (a) | | 521,700 | 22,991,319 |
| | | | 271,582,474 |
| IT Services - 1.5% | | | |
| Alliance Data Systems Corp. | | 56,500 | 12,903,470 |
| Cognizant Technology Solutions Corp. Class A (a) | | 315,200 | 16,576,368 |
| Fidelity National Information Services, Inc. | | 235,800 | 18,727,236 |
| Global Payments, Inc. | | 317,600 | 24,544,128 |
| Total System Services, Inc. | | 185,700 | 9,411,276 |
| Vantiv, Inc. (a) | | 108,300 | 6,740,592 |
| | | | 88,903,070 |
| Semiconductors & Semiconductor Equipment - 2.8% | | | |
| Broadcom Ltd. | | 105,100 | 20,967,450 |
| Marvell Technology Group Ltd. | | 729,142 | 10,842,342 |
| Micron Technology, Inc. (a) | | 664,200 | 16,013,862 |
| NVIDIA Corp. | | 170,680 | 18,634,842 |
| ON Semiconductor Corp. (a) | | 1,786,700 | 23,798,844 |
| Qorvo, Inc. (a) | | 846,198 | 54,334,374 |
| Qualcomm, Inc. | | 415,400 | 22,194,822 |
| | | | 166,786,536 |
| Software - 6.5% | | | |
| Activision Blizzard, Inc. | | 748,700 | 30,105,227 |
| Adobe Systems, Inc. (a) | | 171,500 | 19,444,670 |
| Autodesk, Inc. (a) | | 1,882,900 | 153,155,086 |
| Electronic Arts, Inc. (a) | | 74,600 | 6,223,878 |
| Microsoft Corp. | | 1,854,700 | 119,906,355 |
| Parametric Technology Corp. (a) | | 280,900 | 14,766,913 |
| Salesforce.com, Inc. (a) | | 406,663 | 32,167,043 |
| ServiceNow, Inc. (a) | | 56,700 | 5,138,154 |
| SS&C Technologies Holdings, Inc. | | 160,500 | 5,156,865 |
| Tableau Software, Inc. (a) | | 21,700 | 1,038,128 |
| Workday, Inc. Class A (a) | | 24,200 | 2,010,778 |
| | | | 389,113,097 |
| Technology Hardware, Storage & Peripherals - 4.3% | | | |
| Apple, Inc. | | 1,650,142 | 200,244,731 |
| HP, Inc. | | 2,438,600 | 36,700,930 |
| Western Digital Corp. | | 203,476 | 16,223,141 |
| | | | 253,168,802 |
|
| TOTAL INFORMATION TECHNOLOGY | | | 1,221,875,772 |
|
| MATERIALS - 3.2% | | | |
| Chemicals - 2.2% | | | |
| E.I. du Pont de Nemours & Co. | | 590,825 | 44,607,288 |
| Ecolab, Inc. | | 93,879 | 11,277,684 |
| LyondellBasell Industries NV Class A | | 238,300 | 22,226,241 |
| Monsanto Co. | | 169,500 | 18,358,545 |
| PPG Industries, Inc. | | 206,200 | 20,622,062 |
| W.R. Grace & Co. | | 210,100 | 14,568,334 |
| | | | 131,660,154 |
| Construction Materials - 0.3% | | | |
| Eagle Materials, Inc. | | 142,100 | 14,860,818 |
| Containers & Packaging - 0.6% | | | |
| Ball Corp. | | 203,500 | 15,518,910 |
| WestRock Co. | | 396,870 | 21,176,983 |
| | | | 36,695,893 |
| Metals & Mining - 0.1% | | | |
| Freeport-McMoRan, Inc. (a) | | 360,100 | 5,995,665 |
|
| TOTAL MATERIALS | | | 189,212,530 |
|
| REAL ESTATE - 3.5% | | | |
| Equity Real Estate Investment Trusts (REITs) - 3.4% | | | |
| American Tower Corp. | | 338,800 | 35,065,800 |
| Boston Properties, Inc. | | 148,500 | 19,438,650 |
| Colony NorthStar, Inc. | | 552,219 | 7,686,888 |
| Corrections Corp. of America | | 148,000 | 4,297,920 |
| Duke Realty LP | | 566,700 | 13,787,811 |
| Equinix, Inc. | | 67,600 | 26,024,648 |
| Equity Lifestyle Properties, Inc. | | 252,300 | 18,655,062 |
| Extra Space Storage, Inc. | | 357,600 | 25,765,080 |
| Gaming & Leisure Properties | | 300,700 | 9,511,141 |
| Omega Healthcare Investors, Inc. (c) | | 213,700 | 6,853,359 |
| Store Capital Corp. | | 611,300 | 14,463,358 |
| The Macerich Co. | | 69,900 | 4,801,431 |
| VEREIT, Inc. | | 1,900,300 | 16,209,559 |
| | | | 202,560,707 |
| Real Estate Management & Development - 0.1% | | | |
| CBRE Group, Inc. (a) | | 178,400 | 5,416,224 |
|
| TOTAL REAL ESTATE | | | 207,976,931 |
|
| TELECOMMUNICATION SERVICES - 2.5% | | | |
| Diversified Telecommunication Services - 2.0% | | | |
| AT&T, Inc. | | 1,794,100 | 75,639,256 |
| CenturyLink, Inc. | | 168,300 | 4,352,238 |
| Level 3 Communications, Inc. (a) | | 265,530 | 15,788,414 |
| SBA Communications Corp. Class A (a) | | 94,300 | 9,926,018 |
| Verizon Communications, Inc. | | 76,093 | 3,729,318 |
| Zayo Group Holdings, Inc. (a) | | 260,100 | 8,312,796 |
| | | | 117,748,040 |
| Wireless Telecommunication Services - 0.5% | | | |
| T-Mobile U.S., Inc. (a) | | 386,663 | 24,077,505 |
| Telephone & Data Systems, Inc. | | 129,343 | 3,964,363 |
| | | | 28,041,868 |
|
| TOTAL TELECOMMUNICATION SERVICES | | | 145,789,908 |
|
| UTILITIES - 3.0% | | | |
| Electric Utilities - 2.2% | | | |
| Edison International | | 114,373 | 8,335,504 |
| Exelon Corp. | | 618,200 | 22,181,016 |
| FirstEnergy Corp. | | 275,500 | 8,353,160 |
| Great Plains Energy, Inc. | | 338,700 | 9,331,185 |
| NextEra Energy, Inc. | | 427,700 | 52,915,044 |
| PG&E Corp. | | 461,467 | 28,560,193 |
| | | | 129,676,102 |
| Independent Power and Renewable Electricity Producers - 0.1% | | | |
| Calpine Corp. (a) | | 481,200 | 5,678,160 |
| Multi-Utilities - 0.7% | | | |
| Sempra Energy | | 439,844 | 45,035,627 |
|
| TOTAL UTILITIES | | | 180,389,889 |
|
| TOTAL COMMON STOCKS | | | |
| (Cost $4,170,052,203) | | | 5,749,309,710 |
| | | Principal Amount | Value |
|
| U.S. Treasury Obligations - 0.1% | | | |
| U.S. Treasury Bills, yield at date of purchase 0.35% to 0.47% 2/2/17 to 3/2/17 (d) | | | |
| (Cost $6,398,827) | | 6,400,000 | 6,398,795 |
| | | Shares | Value |
|
| Money Market Funds - 3.3% | | | |
| Fidelity Cash Central Fund, 0.62% (e) | | 192,525,856 | $192,564,361 |
| Fidelity Securities Lending Cash Central Fund 0.65% (e)(f) | | 2,368,798 | 2,369,271 |
| TOTAL MONEY MARKET FUNDS | | | |
| (Cost $194,921,987) | | | 194,933,632 |
| TOTAL INVESTMENT PORTFOLIO - 99.9% | | | |
| (Cost $4,371,373,017) | | | 5,950,642,137 |
| NET OTHER ASSETS (LIABILITIES) - 0.1% | | | 5,962,290 |
| NET ASSETS - 100% | | | $5,956,604,427 |
| Futures Contracts | | | |
| | Expiration Date | Underlying Face Amount at Value | Unrealized Appreciation/(Depreciation) |
| Purchased | | | |
| Equity Index Contracts | | | |
| 584 CME E-mini S&P 500 Index Contracts (United States) | March 2017 | 66,415,400 | $234,637 |
The face value of futures purchased as a percentage of Net Assets is 1.1%.
Legend
(a) Non-income producing
(b) A portion of the security is subject to a forward commitment to sell.
(c) Security or a portion of the security is on loan at period end.
(d) Security or a portion of the security was pledged to cover margin requirements for futures contracts. At period end, the value of securities pledged amounted to $2,519,529.
(e) Affiliated fund that is generally available only to investment companies and other accounts managed by Fidelity Investments. The rate quoted is the annualized seven-day yield of the fund at period end. A complete unaudited listing of the fund's holdings as of its most recent quarter end is available upon request. In addition, each Fidelity Central Fund's financial statements, which are not covered by the Fund's Report of Independent Registered Public Accounting Firm, are available on the SEC's website or upon request.
(f) Investment made with cash collateral received from securities on loan.
Affiliated Central Funds
Information regarding fiscal year to date income earned by the Fund from investments in Fidelity Central Funds is as follows:
| Fund | Income earned |
| Fidelity Cash Central Fund | $957,289 |
| Fidelity Securities Lending Cash Central Fund | 567,024 |
| Total | $1,524,313 |
Investment Valuation
The following is a summary of the inputs used, as of January 31, 2017, involving the Fund's assets and liabilities carried at fair value. The inputs or methodology used for valuing securities may not be an indication of the risk associated with investing in those securities. For more information on valuation inputs, and their aggregation into the levels used below, please refer to the Investment Valuation section in the accompanying Notes to Financial Statements.
| | Valuation Inputs at Reporting Date: |
| Description | Total | Level 1 | Level 2 | Level 3 |
| Investments in Securities: | | | | |
| Equities: | | | | |
| Consumer Discretionary | $703,064,926 | $703,064,926 | $-- | $-- |
| Consumer Staples | 499,318,121 | 499,318,121 | -- | -- |
| Energy | 406,822,653 | 406,822,653 | -- | -- |
| Financials | 850,824,007 | 850,824,007 | -- | -- |
| Health Care | 740,615,503 | 740,615,503 | -- | -- |
| Industrials | 603,419,470 | 603,419,470 | -- | -- |
| Information Technology | 1,221,875,772 | 1,221,875,772 | -- | -- |
| Materials | 189,212,530 | 189,212,530 | -- | -- |
| Real Estate | 207,976,931 | 207,976,931 | -- | -- |
| Telecommunication Services | 145,789,908 | 145,789,908 | -- | -- |
| Utilities | 180,389,889 | 180,389,889 | -- | -- |
| U.S. Government and Government Agency Obligations | 6,398,795 | -- | 6,398,795 | -- |
| Money Market Funds | 194,933,632 | 194,933,632 | -- | -- |
| Total Investments in Securities: | $5,950,642,137 | $5,944,243,342 | $6,398,795 | $-- |
| Derivative Instruments: | | | | |
| Assets | | | | |
| Futures Contracts | $234,637 | $234,637 | $-- | $-- |
| Total Assets | $234,637 | $234,637 | $-- | $-- |
| Total Derivative Instruments: | $234,637 | $234,637 | $-- | $-- |
Value of Derivative Instruments
The following table is a summary of the Fund's value of derivative instruments by primary risk exposure as of January 31, 2017. For additional information on derivative instruments, please refer to the Derivative Instruments section in the accompanying Notes to Financial Statements.
| Primary Risk Exposure / Derivative Type | Value |
| | Asset | Liability |
| Equity Risk | | |
| Futures Contracts(a) | $234,637 | $0 |
| Total Equity Risk | 234,637 | 0 |
| Total Value of Derivatives | $234,637 | $0 |
(a) Reflects gross cumulative appreciation (depreciation) on futures contracts as presented in the Schedule of Investments. In the Statement of Assets and Liabilities, the period end daily variation margin is included in receivable or payable for daily variation margin for derivative instruments, and the net cumulative appreciation (depreciation) is included in net unrealized appreciation (depreciation).
See accompanying notes which are an integral part of the financial statements.
Fidelity® Series All-Sector Equity Fund
Financial Statements
Statement of Assets and Liabilities
| | | January 31, 2017 |
| Assets | | |
Investment in securities, at value (including securities loaned of $2,337,903) — See accompanying schedule:
Unaffiliated issuers (cost $4,176,451,030) | $5,755,708,505 | |
| Fidelity Central Funds (cost $194,921,987) | 194,933,632 | |
| Total Investments (cost $4,371,373,017) | | $5,950,642,137 |
| Cash | | 32,271 |
| Receivable for investments sold | | |
| Regular delivery | | 42,840,295 |
| Delayed delivery | | 667,406 |
| Receivable for securities sold on a when-issued basis | | 2,108,341 |
| Receivable for fund shares sold | | 1,590,605 |
| Dividends receivable | | 3,980,844 |
| Distributions receivable from Fidelity Central Funds | | 89,714 |
| Prepaid expenses | | 15,999 |
| Other receivables | | 228,743 |
| Total assets | | 6,002,196,355 |
| Liabilities | | |
| Payable for investments purchased | $27,532,399 | |
| Commitment to sell securities on a when-issued basis | 2,115,000 | |
| Payable for fund shares redeemed | 10,899,274 | |
| Accrued management fee | 2,125,333 | |
| Payable for daily variation margin for derivative instruments | 15,201 | |
| Other affiliated payables | 450,647 | |
| Other payables and accrued expenses | 84,824 | |
| Collateral on Securities Loaned | 2,369,250 | |
| Total liabilities | | 45,591,928 |
| Net Assets | | $5,956,604,427 |
| Net Assets consist of: | | |
| Paid in capital | | $4,182,055,301 |
| Undistributed net investment income | | 1,037,034 |
| Accumulated undistributed net realized gain (loss) on investments | | 194,071,473 |
| Net unrealized appreciation (depreciation) on investments and assets and liabilities in foreign currencies | | 1,579,440,619 |
| Net Assets | | $5,956,604,427 |
| Series All-Sector Equity: | | |
| Net Asset Value, offering price and redemption price per share ($2,736,747,713 ÷ 222,039,436 shares) | | $12.33 |
| Class F: | | |
| Net Asset Value, offering price and redemption price per share ($3,219,856,714 ÷ 261,675,644 shares) | | $12.30 |
See accompanying notes which are an integral part of the financial statements.
Statement of Operations
| | | Year ended January 31, 2017 |
| Investment Income | | |
| Dividends | | $128,492,830 |
| Interest | | 23,784 |
| Income from Fidelity Central Funds | | 1,524,313 |
| Total income | | 130,040,927 |
| Expenses | | |
| Management fee | | |
| Basic fee | $43,836,642 | |
| Performance adjustment | (4,121,962) | |
| Transfer agent fees | 5,983,108 | |
| Accounting and security lending fees | 1,213,958 | |
| Custodian fees and expenses | 135,482 | |
| Independent trustees' fees and expenses | 36,014 | |
| Audit | 69,020 | |
| Legal | 32,658 | |
| Interest | 48,181 | |
| Miscellaneous | 80,505 | |
| Total expenses before reductions | 47,313,606 | |
| Expense reductions | (437,102) | 46,876,504 |
| Net investment income (loss) | | 83,164,423 |
| Realized and Unrealized Gain (Loss) | | |
| Net realized gain (loss) on: | | |
| Investment securities: | | |
| Unaffiliated issuers | 973,052,322 | |
| Fidelity Central Funds | 16,740 | |
| Futures contracts | 12,959,157 | |
| Total net realized gain (loss) | | 986,028,219 |
Change in net unrealized appreciation (depreciation) on:
Investment securities | 553,132,317 | |
| Assets and liabilities in foreign currencies | 592 | |
| Futures contracts | 135,688 | |
| When-issued commitments | (6,659) | |
| Total change in net unrealized appreciation (depreciation) | | 553,261,938 |
| Net gain (loss) | | 1,539,290,157 |
| Net increase (decrease) in net assets resulting from operations | | $1,622,454,580 |
See accompanying notes which are an integral part of the financial statements.
Statement of Changes in Net Assets
| | Year ended January 31, 2017 | Year ended January 31, 2016 |
| Increase (Decrease) in Net Assets | | |
| Operations | | |
| Net investment income (loss) | $83,164,423 | $98,481,981 |
| Net realized gain (loss) | 986,028,219 | 799,355,481 |
| Change in net unrealized appreciation (depreciation) | 553,261,938 | (1,186,678,626) |
| Net increase (decrease) in net assets resulting from operations | 1,622,454,580 | (288,841,164) |
| Distributions to shareholders from net investment income | (83,080,612) | (110,991,357) |
| Distributions to shareholders from net realized gain | (924,487,766) | (903,252,112) |
| Total distributions | (1,007,568,378) | (1,014,243,469) |
| Share transactions - net increase (decrease) | (4,145,029,306) | 390,063,643 |
| Total increase (decrease) in net assets | (3,530,143,104) | (913,020,990) |
| Net Assets | | |
| Beginning of period | 9,486,747,531 | 10,399,768,521 |
| End of period | $5,956,604,427 | $9,486,747,531 |
| Other Information | | |
| Undistributed net investment income end of period | $1,037,034 | $1,686 |
See accompanying notes which are an integral part of the financial statements.
Financial Highlights — Fidelity Series All-Sector Equity Fund
| Years ended January 31, | 2017 | 2016 | 2015 | 2014 | 2013 |
| Selected Per–Share Data | | | | | |
| Net asset value, beginning of period | $12.02 | $13.80 | $13.89 | $12.57 | $11.82 |
| Income from Investment Operations | | | | | |
| Net investment income (loss)A | .12 | .12 | .13 | .12 | .16 |
| Net realized and unrealized gain (loss) | 2.33 | (.54) | 1.63 | 2.86 | 1.72 |
| Total from investment operations | 2.45 | (.42) | 1.76 | 2.98 | 1.88 |
| Distributions from net investment income | (.18) | (.14)B | (.12) | (.14) | (.21) |
| Distributions from net realized gain | (1.96) | (1.22)B | (1.73) | (1.52) | (.92) |
| Total distributions | (2.14) | (1.36) | (1.85) | (1.66) | (1.13) |
| Net asset value, end of period | $12.33 | $12.02 | $13.80 | $13.89 | $12.57 |
| Total ReturnC | 21.03% | (3.55)% | 12.68% | 24.13% | 16.32% |
| Ratios to Average Net AssetsD,E | | | | | |
| Expenses before reductions | .68% | .73% | .67% | .65% | .73% |
| Expenses net of fee waivers, if any | .68% | .73% | .67% | .65% | .73% |
| Expenses net of all reductions | .67% | .73% | .67% | .65% | .71% |
| Net investment income (loss) | .95% | .85% | .92% | .89% | 1.25% |
| Supplemental Data | | | | | |
| Net assets, end of period (000 omitted) | $2,736,748 | $4,418,280 | $4,969,503 | $5,164,386 | $5,293,761 |
| Portfolio turnover rateF | 43% | 66% | 65% | 72% | 124% |
A Calculated based on average shares outstanding during the period.
B The amounts shown reflect certain reclassifications related to book to tax differences that were made in the year shown.
C Total returns would have been lower if certain expenses had not been reduced during the applicable periods shown.
D Fees and expenses of any underlying Fidelity Central Funds are not included in the Fund's expense ratio. The Fund indirectly bears its proportionate share of the expenses of any underlying Fidelity Central Funds.
E Expense ratios reflect operating expenses of the class. Expenses before reductions do not reflect amounts reimbursed by the investment adviser or reductions from brokerage service arrangements or reductions from other expense offset arrangements and do not represent the amount paid by the class during periods when reimbursements or reductions occur. Expenses net of fee waivers reflect expenses after reimbursement by the investment adviser but prior to reductions from brokerage service arrangements or other expense offset arrangements. Expenses net of all reductions represent the net expenses paid by the class.
F Amount does not include the portfolio activity of any underlying Fidelity Central Funds.
See accompanying notes which are an integral part of the financial statements.
Financial Highlights — Fidelity Series All-Sector Equity Fund Class F
| Years ended January 31, | 2017 | 2016 | 2015 | 2014 | 2013 |
| Selected Per–Share Data | | | | | |
| Net asset value, beginning of period | $12.01 | $13.79 | $13.88 | $12.56 | $11.82 |
| Income from Investment Operations | | | | | |
| Net investment income (loss)A | .14 | .14 | .16 | .15 | .18 |
| Net realized and unrealized gain (loss) | 2.32 | (.54) | 1.63 | 2.86 | 1.72 |
| Total from investment operations | 2.46 | (.40) | 1.79 | 3.01 | 1.90 |
| Distributions from net investment income | (.21) | (.16)B | (.15) | (.17) | (.24) |
| Distributions from net realized gain | (1.96) | (1.22)B | (1.73) | (1.52) | (.92) |
| Total distributions | (2.17) | (1.38) | (1.88) | (1.69) | (1.16) |
| Net asset value, end of period | $12.30 | $12.01 | $13.79 | $13.88 | $12.56 |
| Total ReturnC | 21.11% | (3.38)% | 12.88% | 24.37% | 16.54% |
| Ratios to Average Net AssetsD,E | | | | | |
| Expenses before reductions | .52% | .57% | .50% | .47% | .53% |
| Expenses net of fee waivers, if any | .52% | .57% | .50% | .47% | .53% |
| Expenses net of all reductions | .51% | .56% | .50% | .47% | .51% |
| Net investment income (loss) | 1.11% | 1.02% | 1.09% | 1.07% | 1.44% |
| Supplemental Data | | | | | |
| Net assets, end of period (000 omitted) | $3,219,857 | $5,068,468 | $5,430,266 | $5,117,662 | $4,488,699 |
| Portfolio turnover rateF | 43% | 66% | 65% | 72% | 124% |
A Calculated based on average shares outstanding during the period.
B The amounts shown reflect certain reclassifications related to book to tax differences that were made in the year shown.
C Total returns would have been lower if certain expenses had not been reduced during the applicable periods shown.
D Fees and expenses of any underlying Fidelity Central Funds are not included in the Fund's expense ratio. The Fund indirectly bears its proportionate share of the expenses of any underlying Fidelity Central Funds.
E Expense ratios reflect operating expenses of the class. Expenses before reductions do not reflect amounts reimbursed by the investment adviser or reductions from brokerage service arrangements or reductions from other expense offset arrangements and do not represent the amount paid by the class during periods when reimbursements or reductions occur. Expenses net of fee waivers reflect expenses after reimbursement by the investment adviser but prior to reductions from brokerage service arrangements or other expense offset arrangements. Expenses net of all reductions represent the net expenses paid by the class.
F Amount does not include the portfolio activity of any underlying Fidelity Central Funds.
See accompanying notes which are an integral part of the financial statements.
Fidelity® Series Equity-Income Fund
Performance: The Bottom Line
Average annual total return reflects the change in the value of an investment, assuming reinvestment of distributions from dividend income and capital gains (the profits earned upon the sale of securities that have grown in value, if any) and assuming a constant rate of performance each year. The hypothetical investment and the average annual total returns do not reflect the deduction of taxes that a shareholder would pay on fund distributions or the redemption of fund shares. During periods of reimbursement by Fidelity, a fund’s total return will be greater than it would be had the reimbursement not occurred. How a fund did yesterday is no guarantee of how it will do tomorrow.
Average Annual Total Returns
| For the periods ended January 31, 2017 | Past 1 year | Life of fundA |
| Fidelity® Series Equity-Income Fund | 25.40% | 12.44% |
| Class F | 25.69% | 12.64% |
A From December 6, 2012
$10,000 Over Life of Fund
Let's say hypothetically that $10,000 was invested in Fidelity® Series Equity-Income Fund, a class of the fund, on December 6, 2012, when the fund started.
The chart shows how the value of your investment would have changed, and also shows how the Russell 3000® Value Index performed over the same period.
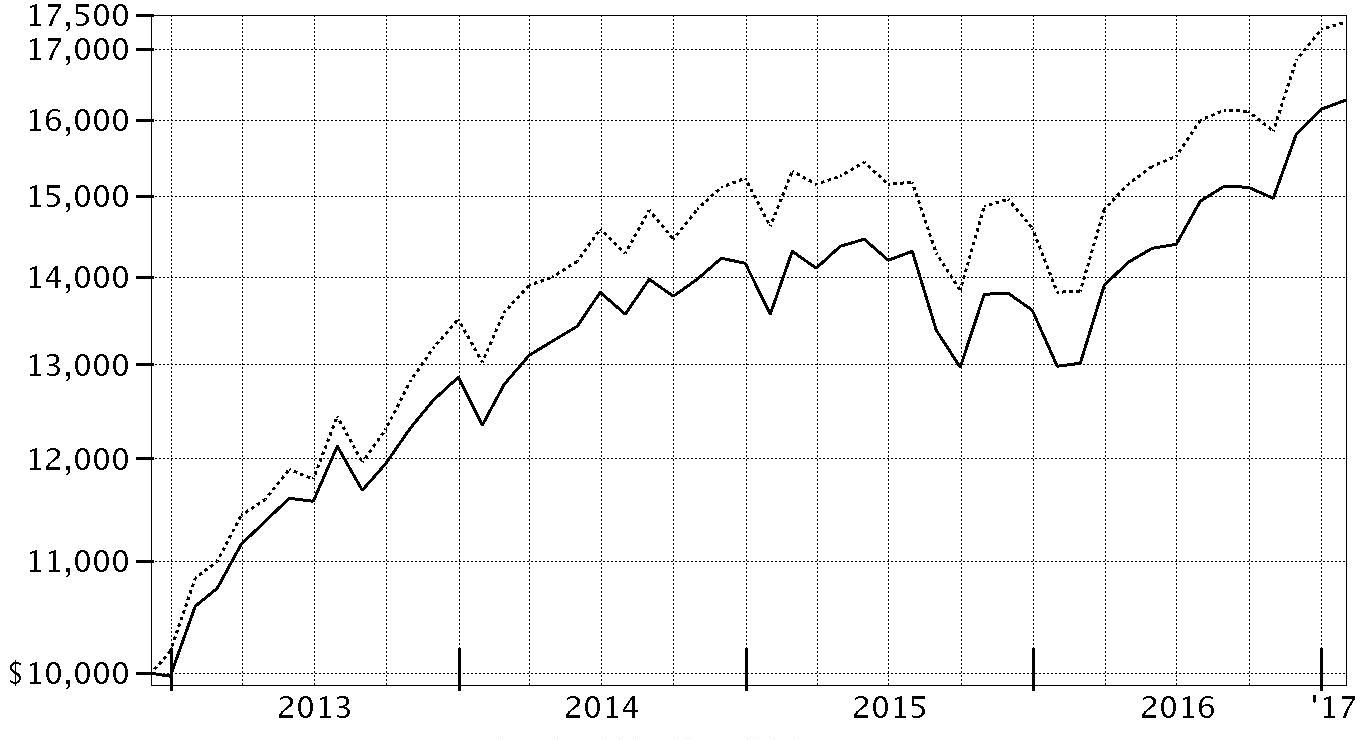
| Period Ending Values |
| $16,278 | Fidelity® Series Equity-Income Fund |
| $17,391 | Russell 3000® Value Index |
Fidelity® Series Equity-Income Fund
Management's Discussion of Fund Performance
Market Recap: The U.S. equity bellwether S&P 500
® index posted a 20.04% gain for the year ending January 31, 2017, rising sharply in the period’s final months on renewed optimism for economic growth. The beginning of the period saw improving investor sentiment amid U.S. job gains, a rally in energy and other stimuli that helped keep the seven-year bull uptrend intact. Markets tumbled briefly following the U.K.’s June 23 vote to exit the European Union (Brexit) – then recovered quickly and settled into a flattish stretch until the November 8 U.S. presidential election. Stocks then broke out in response to Donald Trump’s surprise victory, surging to a series of new all-time highs on expectations for reflation and fiscal stimulus. For the year, industrials (+28%), energy (+27%) and materials (+37%) all did well, the latter two driven by a cyclical rebound in commodity prices. Financials (+35%) also shined, riding an uptick in bond yields and the strong rally in banks (+41%), especially post-election. Information technology rose about 25%, despite cooling off in the fourth quarter of 2016. Conversely, real estate (+8%) lagged on the prospect for rising interest rates. An improved backdrop for riskier assets curbed dividend-rich telecommunication services (+13%), utilities (+12%) and consumer staples (+6%). Health care (+8%) underperformed amid an uncertain political and regulatory outlook.
Comments from Portfolio Manager James Morrow: For the year, the fund’s share classes gained about 25% to 26%, roughly in line with the 25.76% advance of the benchmark Russell 3000
® Value Index. Relative to the benchmark, the fund was hurt by a higher-than-normal amount of cash – reflecting my caution about market volatility leading up to the election. Weak stock selection in industrials and health care also detracted. Within the latter group, an out-of-benchmark stake in Israeli drug manufacturer Teva Pharmaceutical Industries meaningfully detracted. Teva’s multiple challenges this period included overpaying to acquire a competitor, falling earnings and unfavorable patent decisions. Also weighing on results was an overweighting in pharmaceutical and medical-products company Johnson & Johnson, whose shares lagged the index. Elsewhere, the fund’s biggest individual detractor was CVS Health, a retail drugstore chain that reported lighter-than-expected revenue in November. On the positive side, security selection in the energy sector notably helped performance, including energy transportation companies Williams Partners, Energy Transfer Equity and Williams Companies, parent of Williams Partners and the only one of the three in the benchmark. Stock picking in financials, especially banks, also helped. JPMorgan Chase, among the fund’s largest holdings, contributed, as did regional banks M&T and Comerica.
The views expressed above reflect those of the portfolio manager(s) only through the end of the period as stated on the cover of this report and do not necessarily represent the views of Fidelity or any other person in the Fidelity organization. Any such views are subject to change at any time based upon market or other conditions and Fidelity disclaims any responsibility to update such views. These views may not be relied on as investment advice and, because investment decisions for a Fidelity fund are based on numerous factors, may not be relied on as an indication of trading intent on behalf of any Fidelity fund.
Fidelity® Series Equity-Income Fund
Investment Summary (Unaudited)
Top Ten Stocks as of January 31, 2017
| | % of fund's net assets | % of fund's net assets 6 months ago |
| JPMorgan Chase & Co.(a) | 3.6 | 3.3 |
| Cisco Systems, Inc. | 3.5 | 2.8 |
| Johnson & Johnson | 3.1 | 3.2 |
| Procter & Gamble Co. | 3.1 | 2.8 |
| General Electric Co.(a) | 2.7 | 3.1 |
| Verizon Communications, Inc. | 2.3 | 2.4 |
| Comcast Corp. Class A(a) | 2.2 | 1.1 |
| Medtronic PLC | 2.2 | 2.3 |
| M&T Bank Corp.(a) | 2.1 | 1.8 |
| Wells Fargo & Co. | 2.1 | 1.8 |
| | 26.9 | |
(a) Security or a portion of the security is pledged as collateral for call options written.
Top Five Market Sectors as of January 31, 2017
| | % of fund's net assets | % of fund's net assets 6 months ago |
| Financials | 24.3 | 24.4 |
| Energy | 11.0 | 12.3 |
| Industrials | 9.3 | 10.3 |
| Information Technology | 9.3 | 10.9 |
| Consumer Staples | 9.1 | 7.5 |
Prior period industry classifications reflect the categories in place as of the date indicated and have not been adjusted to reflect current industry classifications.
Asset Allocation (% of fund's net assets)
| As of January 31, 2017 *,** |
| | Stocks | 93.6% |
| | Other Investments | 0.2% |
| | Short-Term Investments and Net Other Assets (Liabilities) | 6.2% |

* Foreign investments - 8.1%
** Written options - (0.1)%
| As of July 31, 2016 *,** |
| | Stocks | 92.9% |
| | Short-Term Investments and Net Other Assets (Liabilities) | 7.1% |

* Foreign investments - 6.6%
** Written options - (0.1)%
Fidelity® Series Equity-Income Fund
Investments January 31, 2017
Showing Percentage of Net Assets
| Common Stocks - 93.6% | | | |
| | | Shares | Value |
| CONSUMER DISCRETIONARY - 8.8% | | | |
| Auto Components - 0.2% | | | |
| Delphi Automotive PLC | | 381,400 | $26,720,884 |
| Automobiles - 1.9% | | | |
| Fiat Chrysler Automobiles NV | | 582,500 | 6,401,675 |
| Fiat Chrysler Automobiles NV | | 5,023,000 | 54,765,518 |
| General Motors Co. | | 5,090,800 | 186,374,188 |
| | | | 247,541,381 |
| Hotels, Restaurants & Leisure - 0.8% | | | |
| Dunkin' Brands Group, Inc. | | 1,964,100 | 101,877,867 |
| Household Durables - 0.6% | | | |
| M.D.C. Holdings, Inc. | | 1,711,080 | 46,267,603 |
| Tupperware Brands Corp. | | 623,300 | 37,622,388 |
| | | | 83,889,991 |
| Leisure Products - 0.6% | | | |
| Mattel, Inc. | | 1,549,800 | 40,620,258 |
| Polaris Industries, Inc. (a) | | 404,400 | 33,997,908 |
| | | | 74,618,166 |
| Media - 3.1% | | | |
| Comcast Corp. Class A (b) | | 3,780,503 | 285,125,536 |
| The Walt Disney Co. | | 374,000 | 41,383,100 |
| Time Warner, Inc. | | 710,100 | 68,773,185 |
| | | | 395,281,821 |
| Multiline Retail - 1.2% | | | |
| Kohl's Corp. | | 1,000,535 | 39,851,309 |
| Macy's, Inc. | | 1,506,700 | 44,507,918 |
| Target Corp. | | 1,165,047 | 75,122,231 |
| | | | 159,481,458 |
| Specialty Retail - 0.4% | | | |
| Bed Bath & Beyond, Inc. | | 143,800 | 5,802,330 |
| Foot Locker, Inc. | | 283,500 | 19,431,090 |
| GNC Holdings, Inc. | | 857,347 | 7,604,668 |
| Stage Stores, Inc. | | 1,323,200 | 3,704,960 |
| Williams-Sonoma, Inc. (a) | | 247,400 | 11,927,154 |
| | | | 48,470,202 |
|
| TOTAL CONSUMER DISCRETIONARY | | | 1,137,881,770 |
|
| CONSUMER STAPLES - 9.1% | | | |
| Beverages - 0.8% | | | |
| Molson Coors Brewing Co. Class B | | 368,700 | 35,586,924 |
| The Coca-Cola Co. | | 1,708,900 | 71,038,973 |
| | | | 106,625,897 |
| Food & Staples Retailing - 3.7% | | | |
| CVS Health Corp. | | 2,023,843 | 159,499,067 |
| Kroger Co. | | 448,000 | 15,214,080 |
| Wal-Mart Stores, Inc. | | 2,028,800 | 135,402,112 |
| Walgreens Boots Alliance, Inc. | | 1,658,535 | 135,900,358 |
| Whole Foods Market, Inc. | | 1,046,100 | 31,613,142 |
| | | | 477,628,759 |
| Food Products - 0.8% | | | |
| B&G Foods, Inc. Class A | | 1,178,779 | 52,278,849 |
| The Hain Celestial Group, Inc. (c) | | 248,537 | 9,832,124 |
| The Hershey Co. (b) | | 294,300 | 31,039,821 |
| The J.M. Smucker Co. | | 101,000 | 13,720,850 |
| | | | 106,871,644 |
| Household Products - 3.4% | | | |
| Kimberly-Clark Corp. | | 332,200 | 40,239,386 |
| Procter & Gamble Co. | | 4,467,200 | 391,326,720 |
| | | | 431,566,106 |
| Personal Products - 0.2% | | | |
| Unilever NV (NY Reg.) (a) | | 685,100 | 27,849,315 |
| Tobacco - 0.2% | | | |
| Reynolds American, Inc. | | 409,200 | 24,605,196 |
|
| TOTAL CONSUMER STAPLES | | | 1,175,146,917 |
|
| ENERGY - 10.8% | | | |
| Energy Equipment & Services - 1.2% | | | |
| Baker Hughes, Inc. (b) | | 633,200 | 39,942,256 |
| Halliburton Co. | | 735,400 | 41,601,578 |
| Oceaneering International, Inc. | | 213,000 | 5,932,050 |
| Schlumberger Ltd. | | 894,000 | 74,836,740 |
| | | | 162,312,624 |
| Oil, Gas & Consumable Fuels - 9.6% | | | |
| Anadarko Petroleum Corp. | | 1,951,291 | 135,673,263 |
| Apache Corp. | | 1,438,341 | 86,041,559 |
| Chevron Corp. (b) | | 1,538,203 | 171,278,904 |
| ConocoPhillips Co. | | 3,744,800 | 182,596,448 |
| CONSOL Energy, Inc. | | 1,049,001 | 17,770,077 |
| Energy Transfer Equity LP | | 256,100 | 4,596,995 |
| EQT Midstream Partners LP | | 31,500 | 2,465,190 |
| Golar LNG Ltd. | | 389,944 | 10,083,952 |
| Imperial Oil Ltd. | | 228,800 | 7,522,047 |
| Kinder Morgan, Inc. | | 4,141,200 | 92,514,408 |
| Legacy Reserves LP (c) | | 2,352,000 | 5,527,200 |
| MPLX LP | | 1,327,912 | 50,261,469 |
| Suncor Energy, Inc. | | 211,500 | 6,559,954 |
| The Williams Companies, Inc. | | 8,349,333 | 240,794,764 |
| Williams Partners LP | | 5,352,285 | 219,657,776 |
| | | | 1,233,344,006 |
|
| TOTAL ENERGY | | | 1,395,656,630 |
|
| FINANCIALS - 24.3% | | | |
| Banks - 13.5% | | | |
| Bank of America Corp. (b) | | 9,161,500 | 207,416,360 |
| Comerica, Inc. (b) | | 1,408,700 | 95,129,511 |
| Huntington Bancshares, Inc. | | 845,939 | 11,445,555 |
| JPMorgan Chase & Co. (b) | | 5,482,330 | 463,969,588 |
| KeyCorp (b) | | 4,650,968 | 83,577,895 |
| M&T Bank Corp. (b) | | 1,673,500 | 272,060,895 |
| Prosperity Bancshares, Inc. | | 44,800 | 3,253,824 |
| Regions Financial Corp. (b) | | 5,683,100 | 81,893,471 |
| SunTrust Banks, Inc. (b) | | 1,829,500 | 103,952,190 |
| U.S. Bancorp | | 2,920,000 | 153,738,000 |
| Wells Fargo & Co. | | 4,722,000 | 265,990,260 |
| | | | 1,742,427,549 |
| Capital Markets - 6.0% | | | |
| Apollo Global Management LLC Class A | | 1,706,700 | 36,250,308 |
| Ares Capital Corp. | | 1,978,919 | 33,443,731 |
| Ares Management LP | | 361,908 | 7,111,492 |
| KKR & Co. LP | | 6,707,193 | 116,436,870 |
| Morgan Stanley (b) | | 2,818,500 | 119,758,065 |
| State Street Corp. | | 2,296,000 | 174,955,200 |
| The Blackstone Group LP | | 8,559,939 | 262,190,932 |
| TPG Specialty Lending, Inc. | | 465,752 | 8,509,289 |
| Virtu Financial, Inc. Class A | | 390,200 | 6,848,010 |
| | | | 765,503,897 |
| Insurance - 4.5% | | | |
| American International Group, Inc. | | 98,500 | 6,329,610 |
| Chubb Ltd. | | 1,949,284 | 256,311,353 |
| Marsh & McLennan Companies, Inc. (b) | | 546,000 | 37,138,920 |
| MetLife, Inc. | | 3,326,811 | 181,011,787 |
| Prudential Financial, Inc. | | 882,809 | 92,792,054 |
| | | | 573,583,724 |
| Mortgage Real Estate Investment Trusts - 0.1% | | | |
| Agnc Investment Corp. | | 362,425 | 6,766,475 |
| Two Harbors Investment Corp. | | 1,098,069 | 9,630,065 |
| | | | 16,396,540 |
| Thrifts & Mortgage Finance - 0.2% | | | |
| Radian Group, Inc. | | 1,207,792 | 22,223,373 |
|
| TOTAL FINANCIALS | | | 3,120,135,083 |
|
| HEALTH CARE - 9.1% | | | |
| Biotechnology - 1.7% | | | |
| Amgen, Inc. | | 781,377 | 122,426,148 |
| Gilead Sciences, Inc. | | 1,284,800 | 93,083,760 |
| | | | 215,509,908 |
| Health Care Equipment & Supplies - 2.5% | | | |
| Dentsply Sirona, Inc. | | 691,100 | 39,185,370 |
| Medtronic PLC | | 3,709,702 | 282,011,546 |
| | | | 321,196,916 |
| Health Care Providers & Services - 0.2% | | | |
| AmerisourceBergen Corp. | | 69,100 | 6,031,048 |
| Anthem, Inc. | | 47,400 | 7,306,236 |
| McKesson Corp. | | 77,500 | 10,784,125 |
| | | | 24,121,409 |
| Pharmaceuticals - 4.7% | | | |
| Bristol-Myers Squibb Co. | | 595,300 | 29,264,948 |
| GlaxoSmithKline PLC | | 344,500 | 6,657,463 |
| Johnson & Johnson | | 3,469,900 | 392,966,175 |
| Merck & Co., Inc. | | 1,290,100 | 79,973,299 |
| Pfizer, Inc. | | 1,401,677 | 44,475,211 |
| Teva Pharmaceutical Industries Ltd. sponsored ADR | | 1,681,700 | 56,219,231 |
| | | | 609,556,327 |
|
| TOTAL HEALTH CARE | | | 1,170,384,560 |
|
| INDUSTRIALS - 9.3% | | | |
| Aerospace & Defense - 2.9% | | | |
| General Dynamics Corp. (b) | | 651,500 | 117,973,620 |
| Raytheon Co. (b) | | 426,500 | 61,484,240 |
| The Boeing Co. | | 297,300 | 48,584,766 |
| United Technologies Corp. | | 1,392,500 | 152,715,475 |
| | | | 380,758,101 |
| Air Freight & Logistics - 1.8% | | | |
| C.H. Robinson Worldwide, Inc. | | 195,917 | 14,901,447 |
| United Parcel Service, Inc. Class B | | 1,945,200 | 212,279,676 |
| | | | 227,181,123 |
| Airlines - 0.0% | | | |
| Allegiant Travel Co. | | 28,900 | 4,970,800 |
| Commercial Services & Supplies - 0.8% | | | |
| KAR Auction Services, Inc. | | 1,927,400 | 87,793,070 |
| Waste Connection, Inc. (Canada) | | 193,548 | 15,522,512 |
| | | | 103,315,582 |
| Electrical Equipment - 1.0% | | | |
| AMETEK, Inc. (b) | | 257,500 | 13,158,250 |
| Eaton Corp. PLC | | 1,273,800 | 90,159,564 |
| Regal Beloit Corp. | | 302,100 | 21,932,460 |
| | | | 125,250,274 |
| Industrial Conglomerates - 2.7% | | | |
| General Electric Co. (b) | | 11,545,236 | 342,893,509 |
| Machinery - 0.1% | | | |
| Allison Transmission Holdings, Inc. | | 406,400 | 14,215,872 |
|
| TOTAL INDUSTRIALS | | | 1,198,585,261 |
|
| INFORMATION TECHNOLOGY - 9.3% | | | |
| Communications Equipment - 3.5% | | | |
| Cisco Systems, Inc. | | 14,441,149 | 443,632,097 |
| Electronic Equipment & Components - 0.7% | | | |
| Dell Technologies, Inc. (c) | | 732,395 | 46,133,561 |
| TE Connectivity Ltd. | | 654,008 | 48,625,495 |
| | | | 94,759,056 |
| IT Services - 1.5% | | | |
| First Data Corp. Class A (c) | | 6,872,900 | 105,430,286 |
| Paychex, Inc. (b) | | 981,938 | 59,201,042 |
| Sabre Corp. | | 1,340,300 | 32,837,350 |
| | | | 197,468,678 |
| Semiconductors & Semiconductor Equipment - 1.5% | | | |
| KLA-Tencor Corp. | | 82,300 | 7,004,553 |
| Maxim Integrated Products, Inc. | | 1,105,700 | 49,181,536 |
| Qualcomm, Inc. | | 2,587,081 | 138,227,738 |
| | | | 194,413,827 |
| Software - 1.0% | | | |
| Microsoft Corp. | | 1,807,000 | 116,822,550 |
| SS&C Technologies Holdings, Inc. | | 327,700 | 10,529,001 |
| | | | 127,351,551 |
| Technology Hardware, Storage & Peripherals - 1.1% | | | |
| Apple, Inc. (b) | | 1,108,300 | 134,492,205 |
|
| TOTAL INFORMATION TECHNOLOGY | | | 1,192,117,414 |
|
| MATERIALS - 2.0% | | | |
| Chemicals - 1.4% | | | |
| CF Industries Holdings, Inc. | | 1,053,700 | 37,185,073 |
| LyondellBasell Industries NV Class A | | 589,000 | 54,936,030 |
| The Dow Chemical Co. | | 1,459,100 | 87,006,133 |
| | | | 179,127,236 |
| Containers & Packaging - 0.6% | | | |
| WestRock Co. | | 1,415,100 | 75,509,736 |
|
| TOTAL MATERIALS | | | 254,636,972 |
|
| REAL ESTATE - 2.1% | | | |
| Equity Real Estate Investment Trusts (REITs) - 2.1% | | | |
| American Tower Corp. | | 266,200 | 27,551,700 |
| Cousins Properties, Inc. | | 2,207,100 | 18,760,350 |
| Crown Castle International Corp. | | 696,200 | 61,147,246 |
| Duke Realty LP | | 1,158,900 | 28,196,037 |
| First Potomac Realty Trust | | 1,835,475 | 18,795,264 |
| Piedmont Office Realty Trust, Inc. Class A | | 1,642,137 | 35,667,216 |
| Public Storage | | 220,200 | 47,343,000 |
| Sabra Health Care REIT, Inc. | | 423,700 | 10,761,980 |
| Ventas, Inc. | | 279,300 | 17,224,431 |
| | | | 265,447,224 |
| TELECOMMUNICATION SERVICES - 3.9% | | | |
| Diversified Telecommunication Services - 3.9% | | | |
| AT&T, Inc. | | 4,833,708 | 203,789,129 |
| Verizon Communications, Inc. | | 6,044,639 | 296,247,757 |
| | | | 500,036,886 |
| UTILITIES - 4.9% | | | |
| Electric Utilities - 4.4% | | | |
| American Electric Power Co., Inc. | | 607,701 | 38,929,326 |
| Duke Energy Corp. | | 490,600 | 38,531,724 |
| Entergy Corp. | | 970,900 | 69,555,276 |
| Exelon Corp. | | 6,495,400 | 233,054,952 |
| PPL Corp. | | 2,590,300 | 90,246,052 |
| Southern Co. | | 1,399,038 | 69,154,448 |
| Xcel Energy, Inc. | | 609,200 | 25,172,144 |
| | | | 564,643,922 |
| Multi-Utilities - 0.5% | | | |
| CenterPoint Energy, Inc. | | 1,594,300 | 41,786,603 |
| Public Service Enterprise Group, Inc. | | 622,500 | 27,545,625 |
| | | | 69,332,228 |
|
| TOTAL UTILITIES | | | 633,976,150 |
|
| TOTAL COMMON STOCKS | | | |
| (Cost $10,135,168,276) | | | 12,044,004,867 |
|
| Other - 0.2% | | | |
| ENERGY - 0.2% | | | |
| Oil, Gas, & Consumable Fuels - 0.2% | | | |
| Utica Shale Drilling Program (non-operating revenue interest) (d)(e) | | | |
| (Cost $23,157,786) | | 23,157,786 | 23,157,786 |
|
| Money Market Funds - 6.5% | | | |
| Fidelity Cash Central Fund, 0.62% (f) | | 794,009,420 | 794,168,222 |
| Fidelity Securities Lending Cash Central Fund 0.65% (f)(g) | | 42,226,188 | 42,234,634 |
| TOTAL MONEY MARKET FUNDS | | | |
| (Cost $836,342,922) | | | 836,402,856 |
| TOTAL INVESTMENT PORTFOLIO - 100.3% | | | |
| (Cost $10,994,668,984) | | | 12,903,565,509 |
| NET OTHER ASSETS (LIABILITIES) - (0.3)% | | | (38,640,954) |
| NET ASSETS - 100% | | | $12,864,924,555 |
| Written Options | | | | |
| | Expiration Date/Exercise Price | Number of Contracts | Premium | Value |
| Call Options | | | | |
| AMETEK, Inc. | 3/17/17 - $55.00 | 615 | $34,747 | $(21,525) |
| Apple, Inc. | 3/17/17 - $125.00 | 5,502 | 760,359 | (808,794) |
| AT&T, Inc. | 3/17/17 - $44.00 | 12,066 | 168,924 | (248,135) |
| Baker Hughes, Inc. | 4/21/17 - $67.50 | 1,553 | 181,697 | (166,171) |
| Bank of America Corp. | 3/17/17 - $25.00 | 22,897 | 390,614 | (274,764) |
| Chevron Corp. | 3/17/17 - $120.00 | 3,832 | 425,457 | (55,564) |
| Comcast Corp. Class A | 4/21/17 - $77.50 | 9,423 | 838,661 | (1,295,663) |
| Comerica, Inc. | 4/21/17 - $70.00 | 3,507 | 902,261 | (736,470) |
| Crown Castle International Corp. | 3/17/17 - $92.50 | 1,722 | 108,486 | (108,844) |
| General Dynamics Corp. | 5/19/17 - $185.00 | 1,621 | 536,815 | (875,340) |
| General Electric Co. | 4/21/17 - $32.00 | 28,826 | 518,856 | (461,216) |
| Halliburton Co. | 4/21/17 - $62.50 | 1,808 | 141,024 | (142,382) |
| JPMorgan Chase & Co. | 4/21/17 - $87.50 | 13,680 | 2,681,280 | (2,453,715) |
| KeyCorp | 3/17/17 - $20.00 | 11,615 | 104,532 | (98,728) |
| M&T Bank Corp. | 2/17/17 - $165.00 | 4,156 | 555,479 | (623,400) |
| Marsh & McLennan Companies, Inc. | 4/21/17 - $70.00 | 1,362 | 152,541 | (129,390) |
| MetLife, Inc. | 3/17/17 - $57.50 | 8,311 | 806,167 | (576,609) |
| Morgan Stanley | 4/21/17 - $45.00 | 7,030 | 738,870 | (713,545) |
| Paychex, Inc. | 3/17/17 - $62.50 | 2,444 | 178,432 | (116,090) |
| Prudential Financial, Inc. | 3/17/17 - $110.00 | 2,173 | 532,385 | (416,472) |
| Raytheon Co. | 5/19/17 - $155.00 | 1,056 | 268,809 | (167,904) |
| Regions Financial Corp. | 2/17/17 - $13.00 | 10,044 | 342,159 | (1,456,380) |
| Regions Financial Corp. | 5/19/17 - $16.00 | 14,206 | 454,582 | (447,489) |
| Schlumberger Ltd. | 3/17/17 - $92.50 | 2,215 | 35,440 | (20,752) |
| SunTrust Banks, Inc. | 4/21/17 - $60.00 | 4,562 | 649,660 | (524,630) |
| The Hershey Co. | 5/19/17 - $110.00 | 733 | 202,428 | (185,083) |
| TOTAL WRITTEN OPTIONS | | | $12,710,665 | $(13,125,055) |
Legend
(a) Security or a portion of the security is on loan at period end.
(b) Security or a portion of the security is pledged as collateral for call options written. At period end, the value of securities pledged amounted to $612,690,919.
(c) Non-income producing
(d) Investment is owned by a wholly-owned subsidiary (Subsidiary) that is treated as a corporation for U.S. tax purposes.
(e) Restricted securities - Investment in securities not registered under the Securities Act of 1933 (excluding 144A issues). At the end of the period, the value of restricted securities (excluding 144A issues) amounted to $23,157,786 or 0.2% of net assets.
(f) Affiliated fund that is generally available only to investment companies and other accounts managed by Fidelity Investments. The rate quoted is the annualized seven-day yield of the fund at period end. A complete unaudited listing of the fund's holdings as of its most recent quarter end is available upon request. In addition, each Fidelity Central Fund's financial statements, which are not covered by the Fund's Report of Independent Registered Public Accounting Firm, are available on the SEC's website or upon request.
(g) Investment made with cash collateral received from securities on loan.
Additional information on each restricted holding is as follows:
| Security | Acquisition Date | Acquisition Cost |
| Utica Shale Drilling Program (non-operating revenue interest) | 10/5/16 - 11/4/16 | $23,157,786 |
Affiliated Central Funds
Information regarding fiscal year to date income earned by the Fund from investments in Fidelity Central Funds is as follows:
| Fund | Income earned |
| Fidelity Cash Central Fund | $2,265,720 |
| Fidelity Securities Lending Cash Central Fund | 639,798 |
| Total | $2,905,518 |
Other Affiliated Issuers
An affiliated company is a company in which the Fund has ownership of at least 5% of the voting securities. Fiscal year to date transactions with companies which are or were affiliates are as follows:
| Affiliate | Value, beginning of period | Purchases | Sales Proceeds | Dividend Income | Value, end of period |
| Stage Stores, Inc. | $12,441,542 | $11,997 | $965,731 | $819,969 | $-- |
| Total | $12,441,542 | $11,997 | $965,731 | $819,969 | $-- |
Investment Valuation
The following is a summary of the inputs used, as of January 31, 2017, involving the Fund's assets and liabilities carried at fair value. The inputs or methodology used for valuing securities may not be an indication of the risk associated with investing in those securities. For more information on valuation inputs, and their aggregation into the levels used below, please refer to the Investment Valuation section in the accompanying Notes to Financial Statements.
| | Valuation Inputs at Reporting Date: |
| Description | Total | Level 1 | Level 2 | Level 3 |
| Investments in Securities: | | | | |
| Equities: | | | | |
| Consumer Discretionary | $1,137,881,770 | $1,137,881,770 | $-- | $-- |
| Consumer Staples | 1,175,146,917 | 1,175,146,917 | -- | -- |
| Energy | 1,395,656,630 | 1,395,656,630 | -- | -- |
| Financials | 3,120,135,083 | 3,120,135,083 | -- | -- |
| Health Care | 1,170,384,560 | 1,163,727,097 | 6,657,463 | -- |
| Industrials | 1,198,585,261 | 1,198,585,261 | -- | -- |
| Information Technology | 1,192,117,414 | 1,192,117,414 | -- | -- |
| Materials | 254,636,972 | 254,636,972 | -- | -- |
| Real Estate | 265,447,224 | 265,447,224 | -- | -- |
| Telecommunication Services | 500,036,886 | 500,036,886 | -- | -- |
| Utilities | 633,976,150 | 633,976,150 | -- | -- |
| Other | 23,157,786 | -- | -- | 23,157,786 |
| Money Market Funds | 836,402,856 | 836,402,856 | -- | -- |
| Total Investments in Securities: | $12,903,565,509 | $12,873,750,260 | $6,657,463 | $23,157,786 |
| Derivative Instruments: | | | | |
| Liabilities | | | | |
| Written Options | $(13,125,055) | $(9,158,146) | $(3,966,909) | $-- |
| Total Liabilities | $(13,125,055) | $(9,158,146) | $(3,996,909) | $-- |
| Total Derivative Instruments: | $(13,125,055) | $(9,158,146) | $(3,966,909) | $-- |
Value of Derivative Instruments
The following table is a summary of the Fund's value of derivative instruments by primary risk exposure as of January 31, 2017. For additional information on derivative instruments, please refer to the Derivative Instruments section in the accompanying Notes to Financial Statements.
| Primary Risk Exposure / Derivative Type | Value |
| | Asset | Liability |
| Equity Risk | | |
| Written Options(a) | $0 | $(13,125,055) |
| Total Equity Risk | 0 | (13,125,055) |
| Total Value of Derivatives | $0 | $(13,125,055) |
(a) Gross value is presented in the Statement of Assets and Liabilities in the written options, at value line-item.
See accompanying notes which are an integral part of the financial statements.
Fidelity® Series Equity-Income Fund
Financial Statements
Statement of Assets and Liabilities
| | | January 31, 2017 |
| Assets | | |
Investment in securities, at value (including securities loaned of $41,635,280) — See accompanying schedule:
Unaffiliated issuers (cost $10,158,326,062) | $12,067,162,653 | |
| Fidelity Central Funds (cost $836,342,922) | 836,402,856 | |
| Total Investments (cost $10,994,668,984) | | $12,903,565,509 |
| Receivable for investments sold | | 10,770,680 |
| Receivable for fund shares sold | | 3,854,084 |
| Dividends receivable | | 13,333,840 |
| Distributions receivable from Fidelity Central Funds | | 291,145 |
| Prepaid expenses | | 19,589 |
| Other receivables | | 143,691 |
| Total assets | | 12,931,978,538 |
| Liabilities | | |
| Payable for fund shares redeemed | $6,039,154 | |
| Accrued management fee | 4,797,515 | |
| Written options, at value (premium received $12,710,665) | 13,125,055 | |
| Other affiliated payables | 772,651 | |
| Other payables and accrued expenses | 97,183 | |
| Collateral on Securities Loaned | 42,222,425 | |
| Total liabilities | | 67,053,983 |
| Net Assets | | $12,864,924,555 |
| Net Assets consist of: | | |
| Paid in capital | | $10,916,389,605 |
| Distributions in excess of net investment income | | (91,648,716) |
| Accumulated undistributed net realized gain (loss) on investments and foreign currency transactions | | 131,701,531 |
| Net unrealized appreciation (depreciation) on investments | | 1,908,482,135 |
| Net Assets | | $12,864,924,555 |
| Series Equity-Income: | | |
| Net Asset Value, offering price and redemption price per share ($5,063,706,543 ÷ 388,595,763 shares) | | $13.03 |
| Class F: | | |
| Net Asset Value, offering price and redemption price per share ($7,801,218,012 ÷ 598,431,271 shares) | | $13.04 |
See accompanying notes which are an integral part of the financial statements.
Statement of Operations
| | | Year ended January 31, 2017 |
| Investment Income | | |
| Dividends (including $819,969 earned from other affiliated issuers) | | $338,914,982 |
| Income from Fidelity Central Funds | | 2,905,518 |
| Total income | | 341,820,500 |
| Expenses | | |
| Management fee | $54,204,864 | |
| Transfer agent fees | 7,554,885 | |
| Accounting and security lending fees | 1,387,333 | |
| Custodian fees and expenses | 152,136 | |
| Independent trustees' fees and expenses | 51,368 | |
| Audit | 68,590 | |
| Legal | 32,896 | |
| Interest | 395 | |
| Miscellaneous | 102,821 | |
| Total expenses before reductions | 63,555,288 | |
| Expense reductions | (503,692) | 63,051,596 |
| Net investment income (loss) | | 278,768,904 |
| Realized and Unrealized Gain (Loss) | | |
| Net realized gain (loss) on: | | |
| Investment securities: | | |
| Unaffiliated issuers | 186,549,640 | |
| Fidelity Central Funds | 29,136 | |
| Other affiliated issuers | (2,107,217) | |
| Foreign currency transactions | (49,115) | |
| Written options | 21,305,002 | |
| Total net realized gain (loss) | | 205,727,446 |
Change in net unrealized appreciation (depreciation) on:
Investment securities | 2,238,803,747 | |
| Written options | (2,168,495) | |
| Total change in net unrealized appreciation (depreciation) | | 2,236,635,252 |
| Net gain (loss) | | 2,442,362,698 |
| Net increase (decrease) in net assets resulting from operations | | $2,721,131,602 |
See accompanying notes which are an integral part of the financial statements.
Statement of Changes in Net Assets
| | Year ended January 31, 2017 | Year ended January 31, 2016 |
| Increase (Decrease) in Net Assets | | |
| Operations | | |
| Net investment income (loss) | $278,768,904 | $315,034,962 |
| Net realized gain (loss) | 205,727,446 | 540,335,772 |
| Change in net unrealized appreciation (depreciation) | 2,236,635,252 | (1,339,148,826) |
| Net increase (decrease) in net assets resulting from operations | 2,721,131,602 | (483,778,092) |
| Distributions to shareholders from net investment income | (273,192,794) | (326,379,810) |
| Distributions to shareholders from net realized gain | (244,271,206) | (659,610,044) |
| Total distributions | (517,464,000) | (985,989,854) |
| Share transactions - net increase (decrease) | (361,344,594) | 731,070,543 |
| Total increase (decrease) in net assets | 1,842,323,008 | (738,697,403) |
| Net Assets | | |
| Beginning of period | 11,022,601,547 | 11,761,298,950 |
| End of period | $12,864,924,555 | $11,022,601,547 |
| Other Information | | |
| Distributions in excess of net investment income end of period | $(91,648,716) | $(45,653,798) |
See accompanying notes which are an integral part of the financial statements.
Financial Highlights — Fidelity Series Equity-Income Fund
| Years ended January 31, | 2017 | 2016 | 2015 | 2014 | 2013 A |
| Selected Per–Share Data | | | | | |
| Net asset value, beginning of period | $10.83 | $12.31 | $11.80 | $10.57 | $10.00 |
| Income from Investment Operations | | | | | |
| Net investment income (loss)B | .27 | .31 | .32 | .25 | .03 |
| Net realized and unrealized gain (loss) | 2.44 | (.80) | .87 | 1.50 | .56 |
| Total from investment operations | 2.71 | (.49) | 1.19 | 1.75 | .59 |
| Distributions from net investment income | (.26) | (.32) | (.28) | (.24) | (.02) |
| Distributions from net realized gain | (.25) | (.67) | (.40) | (.28) | – |
| Total distributions | (.51) | (.99) | (.68) | (.52) | (.02) |
| Net asset value, end of period | $13.03 | $10.83 | $12.31 | $11.80 | $10.57 |
| Total ReturnC,D | 25.40% | (4.32)% | 9.91% | 16.57% | 5.89% |
| Ratios to Average Net AssetsE,F | | | | | |
| Expenses before reductions | .62% | .62% | .63% | .65% | .68%G |
| Expenses net of fee waivers, if any | .62% | .62% | .63% | .65% | .68%G |
| Expenses net of all reductions | .62% | .62% | .63% | .65% | .59%G |
| Net investment income (loss) | 2.21% | 2.51% | 2.50% | 2.17% | 2.17%G |
| Supplemental Data | | | | | |
| Net assets, end of period (000 omitted) | $5,063,707 | $4,400,959 | $4,809,405 | $4,826,469 | $2,493,356 |
| Portfolio turnover rateH | 42% | 41% | 38% | 42% | 47%I |
A For the period December 6, 2012 (commencement of operations) to January 31, 2013.
B Calculated based on average shares outstanding during the period.
C Total returns for periods of less than one year are not annualized.
D Total returns would have been lower if certain expenses had not been reduced during the applicable periods shown.
E Fees and expenses of any underlying Fidelity Central Funds are not included in the Fund's expense ratio. The Fund indirectly bears its proportionate share of the expenses of any underlying Fidelity Central Funds.
F Expense ratios reflect operating expenses of the class. Expenses before reductions do not reflect amounts reimbursed by the investment adviser or reductions from brokerage service arrangements or reductions from other expense offset arrangements and do not represent the amount paid by the class during periods when reimbursements or reductions occur. Expense ratios before reductions for start-up periods may not be representative of longer-term operating periods. Expenses net of fee waivers reflect expenses after reimbursement by the investment adviser but prior to reductions from brokerage service arrangements or other expense offset arrangements. Expenses net of all reductions represent the net expenses paid by the class.
G Annualized
H Amount does not include the portfolio activity of any underlying Fidelity Central Funds.
I Amount not annualized.
See accompanying notes which are an integral part of the financial statements.
Financial Highlights — Fidelity Series Equity-Income Fund Class F
| Years ended January 31, | 2017 | 2016 | 2015 | 2014 | 2013 A |
| Selected Per–Share Data | | | | | |
| Net asset value, beginning of period | $10.83 | $12.32 | $11.80 | $10.57 | $10.00 |
| Income from Investment Operations | | | | | |
| Net investment income (loss)B | .29 | .33 | .34 | .28 | .04 |
| Net realized and unrealized gain (loss) | 2.45 | (.81) | .88 | 1.48 | .55 |
| Total from investment operations | 2.74 | (.48) | 1.22 | 1.76 | .59 |
| Distributions from net investment income | (.28) | (.34) | (.30) | (.26) | (.02) |
| Distributions from net realized gain | (.25) | (.67) | (.40) | (.28) | – |
| Total distributions | (.53) | (1.01) | (.70) | (.53)C | (.02) |
| Net asset value, end of period | $13.04 | $10.83 | $12.32 | $11.80 | $10.57 |
| Total ReturnD,E | 25.69% | (4.24)% | 10.19% | 16.75% | 5.90% |
| Ratios to Average Net AssetsF,G | | | | | |
| Expenses before reductions | .46% | .46% | .46% | .47% | .49%H |
| Expenses net of fee waivers, if any | .46% | .46% | .46% | .47% | .49%H |
| Expenses net of all reductions | .46% | .46% | .46% | .47% | .40%H |
| Net investment income (loss) | 2.37% | 2.67% | 2.67% | 2.35% | 2.35%H |
| Supplemental Data | | | | | |
| Net assets, end of period (000 omitted) | $7,801,218 | $6,621,643 | $6,951,894 | $6,295,920 | $2,752,016 |
| Portfolio turnover rateI | 42% | 41% | 38% | 42% | 47%J |
A For the period December 6, 2012 (commencement of operations) to January 31, 2013.
B Calculated based on average shares outstanding during the period.
C Total distributions of $.53 per share is comprised of distributions from net investment income of $.257 and distributions from net realized gain of $.276 per share.
D Total returns for periods of less than one year are not annualized.
E Total returns would have been lower if certain expenses had not been reduced during the applicable periods shown.
F Fees and expenses of any underlying Fidelity Central Funds are not included in the Fund's expense ratio. The Fund indirectly bears its proportionate share of the expenses of any underlying Fidelity Central Funds.
G Expense ratios reflect operating expenses of the class. Expenses before reductions do not reflect amounts reimbursed by the investment adviser or reductions from brokerage service arrangements or reductions from other expense offset arrangements and do not represent the amount paid by the class during periods when reimbursements or reductions occur. Expense ratios before reductions for start-up periods may not be representative of longer-term operating periods. Expenses net of fee waivers reflect expenses after reimbursement by the investment adviser but prior to reductions from brokerage service arrangements or other expense offset arrangements. Expenses net of all reductions represent the net expenses paid by the class.
H Annualized
I Amount does not include the portfolio activity of any underlying Fidelity Central Funds.
J Amount not annualized.
See accompanying notes which are an integral part of the financial statements.
Fidelity® Series Stock Selector Large Cap Value Fund
Performance: The Bottom Line
Average annual total return reflects the change in the value of an investment, assuming reinvestment of distributions from dividend income and capital gains (the profits earned upon the sale of securities that have grown in value, if any) and assuming a constant rate of performance each year. The hypothetical investment and the average annual total returns do not reflect the deduction of taxes that a shareholder would pay on fund distributions or the redemption of fund shares. During periods of reimbursement by Fidelity, a fund’s total return will be greater than it would be had the reimbursement not occurred. How a fund did yesterday is no guarantee of how it will do tomorrow.
Average Annual Total Returns
| For the periods ended January 31, 2017 | Past 1 year | Life of fundA |
| Fidelity® Series Stock Selector Large Cap Value Fund | 23.49% | 13.13% |
| Class F | 23.62% | 13.32% |
A From December 6, 2012
$10,000 Over Life of Fund
Let's say hypothetically that $10,000 was invested in Fidelity® Series Stock Selector Large Cap Value Fund, a class of the fund, on December 6, 2012, when the fund started.
The chart shows how the value of your investment would have changed, and also shows how the Russell 1000® Value Index performed over the same period.

| Period Ending Values |
| $16,697 | Fidelity® Series Stock Selector Large Cap Value Fund |
| $17,378 | Russell 1000® Value Index |
Fidelity® Series Stock Selector Large Cap Value Fund
Management's Discussion of Fund Performance
Market Recap: The U.S. equity bellwether S&P 500
® index posted a 20.04% gain for the year ending January 31, 2017, rising sharply in the period’s final months on renewed optimism for economic growth. The beginning of the period saw improving investor sentiment amid U.S. job gains, a rally in energy and other stimuli that helped keep the seven-year bull uptrend intact. Markets tumbled briefly following the U.K.’s June 23 vote to exit the European Union (Brexit) – then recovered quickly and settled into a flattish stretch until the November 8 U.S. presidential election. Stocks then broke out in response to Donald Trump’s surprise victory, surging to a series of new all-time highs on expectations for reflation and fiscal stimulus. For the year, industrials (+28%), energy (+27%) and materials (+37%) all did well, the latter two driven by a cyclical rebound in commodity prices. Financials (+35%) also shined, riding an uptick in bond yields and the strong rally in banks (+41%), especially post-election. Information technology rose about 25%, despite cooling off in the fourth quarter of 2016. Conversely, real estate (+8%) lagged on the prospect for rising interest rates. An improved backdrop for riskier assets curbed dividend-rich telecommunication services (+13%), utilities (+12%) and consumer staples (+6%). Health care (+8%) underperformed amid an uncertain political and regulatory outlook.
Comments from Lead Portfolio Manager Matthew Friedman: For the year, the fund's share classes gained roughly 23.5%, while the Russell 1000
® Value Index returned 24.62%. Versus the benchmark, the fund’s cash position of 4%, on average, was the biggest drag in a strong up market. Industry positioning also hurt, led by an underweighting in strong-performing banks such as JPMorgan Chase, the fund's biggest individual detractor. Shares of the financial giant surged in November, as investors expected higher interest rates to boost bank profits and a new presidential administration to unwind financial regulations. JPMorgan was not held at period end. Despite favorable stock selection overall, we struggled with picks in materials, health care and retailing. Within health care specifically, investments in Ireland-based Allergan and Jazz Pharmaceuticals, a non-index holding, were hurt by market fear about generic-drug price deflation. Conversely, we had very strong relative results within information technology and energy. On an individual security basis, railroad company CSX was our top contributor. Avoiding lagging index giant Exxon Mobil also helped.
The views expressed above reflect those of the portfolio manager(s) only through the end of the period as stated on the cover of this report and do not necessarily represent the views of Fidelity or any other person in the Fidelity organization. Any such views are subject to change at any time based upon market or other conditions and Fidelity disclaims any responsibility to update such views. These views may not be relied on as investment advice and, because investment decisions for a Fidelity fund are based on numerous factors, may not be relied on as an indication of trading intent on behalf of any Fidelity fund.
Note to shareholders: On June 17, 2016, John Sheehy joined Steve Barwikowski as Co-Manager of the fund's technology and telecom services sleeves, and on January 3, 2017, assumed sole management responsibilities.
Fidelity® Series Stock Selector Large Cap Value Fund
Investment Summary (Unaudited)
Top Ten Stocks as of January 31, 2017
| | % of fund's net assets | % of fund's net assets 6 months ago |
| Chevron Corp. | 4.5 | 4.8 |
| Berkshire Hathaway, Inc. Class B | 3.9 | 3.9 |
| Wells Fargo & Co. | 3.8 | 2.5 |
| Procter & Gamble Co. | 2.7 | 3.1 |
| Johnson & Johnson | 2.3 | 2.8 |
| AT&T, Inc. | 2.2 | 2.4 |
| ConocoPhillips Co. | 2.1 | 1.6 |
| Cisco Systems, Inc. | 2.0 | 1.3 |
| General Electric Co. | 1.9 | 1.7 |
| Goldman Sachs Group, Inc. | 1.8 | 1.6 |
| | 27.2 | |
Top Five Market Sectors as of January 31, 2017
| | % of fund's net assets | % of fund's net assets 6 months ago |
| Financials | 25.8 | 26.9 |
| Energy | 12.8 | 12.9 |
| Health Care | 9.8 | 10.9 |
| Information Technology | 9.3 | 9.5 |
| Industrials | 8.7 | 8.1 |
Prior period industry classifications reflect the categories in place as of the date indicated and have not been adjusted to reflect current industry classifications.
Asset Allocation (% of fund's net assets)
| As of January 31, 2017 * |
| | Stocks and Equity Futures | 96.5% |
| | Short-Term Investments and Net Other Assets (Liabilities) | 3.5% |

* Foreign investments - 6.5%
| As of July 31, 2016 * |
| | Stocks and Equity Futures | 96.3% |
| | Short-Term Investments and Net Other Assets (Liabilities) | 3.7% |

* Foreign investments - 7.5%
Fidelity® Series Stock Selector Large Cap Value Fund
Investments January 31, 2017
Showing Percentage of Net Assets
| Common Stocks - 95.4% | | | |
| | | Shares | Value |
| CONSUMER DISCRETIONARY - 5.0% | | | |
| Auto Components - 0.5% | | | |
| Delphi Automotive PLC | | 642,649 | $45,023,989 |
| Diversified Consumer Services - 0.7% | | | |
| ServiceMaster Global Holdings, Inc. (a) | | 1,734,944 | 64,158,229 |
| Household Durables - 0.7% | | | |
| Whirlpool Corp. | | 351,400 | 61,456,346 |
| Internet & Direct Marketing Retail - 0.4% | | | |
| Liberty Interactive Corp. QVC Group Series A (a) | | 1,962,644 | 37,643,512 |
| Leisure Products - 0.2% | | | |
| Mattel, Inc. | | 709,100 | 18,585,511 |
| Media - 1.8% | | | |
| Charter Communications, Inc. Class A (a) | | 69,376 | 22,474,355 |
| Liberty Broadband Corp. Class C (a) | | 591,811 | 50,505,151 |
| Time Warner, Inc. | | 223,500 | 21,645,975 |
| Twenty-First Century Fox, Inc. Class A | | 2,438,040 | 76,505,695 |
| | | | 171,131,176 |
| Multiline Retail - 0.7% | | | |
| Target Corp. | | 1,006,709 | 64,912,596 |
|
| TOTAL CONSUMER DISCRETIONARY | | | 462,911,359 |
|
| CONSUMER STAPLES - 7.9% | | | |
| Food & Staples Retailing - 1.8% | | | |
| Kroger Co. | | 885,700 | 30,078,372 |
| Wal-Mart Stores, Inc. | | 463,973 | 30,965,558 |
| Walgreens Boots Alliance, Inc. | | 1,286,025 | 105,376,889 |
| | | | 166,420,819 |
| Food Products - 2.3% | | | |
| Mondelez International, Inc. | | 1,139,300 | 50,448,204 |
| The J.M. Smucker Co. | | 594,142 | 80,714,191 |
| The Kraft Heinz Co. | | 845,300 | 75,476,837 |
| | | | 206,639,232 |
| Household Products - 2.7% | | | |
| Procter & Gamble Co. | | 2,854,415 | 250,046,754 |
| Personal Products - 0.3% | | | |
| Coty, Inc. Class A | | 1,554,500 | 29,846,400 |
| Tobacco - 0.8% | | | |
| Philip Morris International, Inc. | | 747,400 | 71,847,562 |
|
| TOTAL CONSUMER STAPLES | | | 724,800,767 |
|
| ENERGY - 12.8% | | | |
| Energy Equipment & Services - 2.3% | | | |
| Baker Hughes, Inc. | | 2,453,100 | 154,741,548 |
| Dril-Quip, Inc. (a) | | 844,730 | 52,542,206 |
| | | | 207,283,754 |
| Oil, Gas & Consumable Fuels - 10.5% | | | |
| Anadarko Petroleum Corp. | | 2,193,100 | 152,486,243 |
| Cabot Oil & Gas Corp. | | 2,127,800 | 45,705,144 |
| Cenovus Energy, Inc. | | 5,420,800 | 73,985,328 |
| Chevron Corp. | | 3,688,414 | 410,704,898 |
| ConocoPhillips Co. | | 3,935,900 | 191,914,484 |
| Phillips 66 Co. | | 1,115,700 | 91,063,434 |
| | | | 965,859,531 |
|
| TOTAL ENERGY | | | 1,173,143,285 |
|
| FINANCIALS - 25.8% | | | |
| Banks - 9.4% | | | |
| Bank of America Corp. | | 3,957,800 | 89,604,592 |
| CIT Group, Inc. | | 2,014,600 | 82,981,374 |
| Citigroup, Inc. | | 585,000 | 32,660,550 |
| PNC Financial Services Group, Inc. | | 923,500 | 111,244,810 |
| Popular, Inc. | | 909,152 | 40,393,623 |
| U.S. Bancorp | | 3,088,192 | 162,593,309 |
| Wells Fargo & Co. | | 6,140,625 | 345,901,406 |
| | | | 865,379,664 |
| Capital Markets - 3.5% | | | |
| Franklin Resources, Inc. | | 2,119,400 | 84,224,956 |
| Goldman Sachs Group, Inc. | | 713,178 | 163,545,979 |
| The Blackstone Group LP | | 2,493,500 | 76,375,905 |
| | | | 324,146,840 |
| Consumer Finance - 3.7% | | | |
| Ally Financial, Inc. | | 950,000 | 20,064,000 |
| American Express Co. | | 284,355 | 21,719,035 |
| Capital One Financial Corp. | | 1,415,914 | 123,736,724 |
| Discover Financial Services | | 2,167,200 | 150,143,616 |
| Synchrony Financial | | 500,000 | 17,910,000 |
| | | | 333,573,375 |
| Diversified Financial Services - 3.9% | | | |
| Berkshire Hathaway, Inc. Class B (a) | | 2,188,061 | 359,148,333 |
| Insurance - 5.3% | | | |
| AFLAC, Inc. | | 1,244,681 | 87,115,223 |
| Chubb Ltd. | | 890,561 | 117,099,866 |
| MetLife, Inc. | | 1,464,249 | 79,669,788 |
| Reinsurance Group of America, Inc. | | 664,100 | 83,324,627 |
| The Travelers Companies, Inc. | | 999,500 | 117,721,110 |
| | | | 484,930,614 |
|
| TOTAL FINANCIALS | | | 2,367,178,826 |
|
| HEALTH CARE - 9.8% | | | |
| Health Care Equipment & Supplies - 2.3% | | | |
| Abbott Laboratories | | 1,869,800 | 78,101,546 |
| Medtronic PLC | | 1,383,136 | 105,145,999 |
| Zimmer Biomet Holdings, Inc. | | 206,400 | 24,423,312 |
| | | | 207,670,857 |
| Health Care Providers & Services - 0.9% | | | |
| Aetna, Inc. | | 229,600 | 27,232,856 |
| Anthem, Inc. | | 180,200 | 27,776,028 |
| Cigna Corp. | | 167,200 | 24,447,984 |
| Humana, Inc. | | 34,300 | 6,808,550 |
| | | | 86,265,418 |
| Life Sciences Tools & Services - 0.4% | | | |
| Thermo Fisher Scientific, Inc. | | 236,300 | 36,009,757 |
| Pharmaceuticals - 6.2% | | | |
| Allergan PLC | | 164,800 | 36,073,072 |
| Jazz Pharmaceuticals PLC (a) | | 488,895 | 59,606,078 |
| Johnson & Johnson | | 1,846,059 | 209,066,182 |
| Merck & Co., Inc. | | 2,216,200 | 137,382,238 |
| Mylan N.V. (a) | | 291,500 | 11,091,575 |
| Pfizer, Inc. | | 3,620,098 | 114,865,710 |
| | | | 568,084,855 |
|
| TOTAL HEALTH CARE | | | 898,030,887 |
|
| INDUSTRIALS - 8.7% | | | |
| Aerospace & Defense - 1.2% | | | |
| Aerojet Rocketdyne Holdings, Inc. (a) | | 1,827,244 | 33,091,389 |
| Raytheon Co. | | 214,723 | 30,954,468 |
| United Technologies Corp. | | 454,537 | 49,849,073 |
| | | | 113,894,930 |
| Airlines - 1.0% | | | |
| American Airlines Group, Inc. | | 1,959,420 | 86,704,335 |
| Commercial Services & Supplies - 0.2% | | | |
| Stericycle, Inc. (a) | | 244,200 | 18,837,588 |
| Construction & Engineering - 1.3% | | | |
| AECOM (a) | | 3,288,255 | 121,435,257 |
| Electrical Equipment - 1.0% | | | |
| AMETEK, Inc. | | 898,780 | 45,927,658 |
| Fortive Corp. | | 830,306 | 45,924,225 |
| | | | 91,851,883 |
| Industrial Conglomerates - 1.9% | | | |
| General Electric Co. | | 5,757,239 | 170,989,998 |
| Machinery - 0.9% | | | |
| Deere & Co. | | 452,618 | 48,452,757 |
| Flowserve Corp. | | 768,495 | 37,779,214 |
| | | | 86,231,971 |
| Road & Rail - 1.2% | | | |
| CSX Corp. | | 2,173,669 | 100,836,505 |
| Union Pacific Corp. | | 85,405 | 9,102,465 |
| | | | 109,938,970 |
|
| TOTAL INDUSTRIALS | | | 799,884,932 |
|
| INFORMATION TECHNOLOGY - 9.3% | | | |
| Communications Equipment - 2.0% | | | |
| Cisco Systems, Inc. | | 6,059,935 | 186,161,203 |
| Electronic Equipment & Components - 0.9% | | | |
| Dell Technologies, Inc. (a) | | 1,251,000 | 78,800,490 |
| Internet Software & Services - 0.4% | | | |
| Alphabet, Inc. Class A (a) | | 46,400 | 38,056,816 |
| IT Services - 1.5% | | | |
| Amdocs Ltd. | | 1,307,169 | 76,743,892 |
| Cognizant Technology Solutions Corp. Class A (a) | | 390,200 | 20,520,618 |
| CoreLogic, Inc. (a) | | 577,300 | 20,361,371 |
| Total System Services, Inc. | | 419,200 | 21,245,056 |
| | | | 138,870,937 |
| Semiconductors & Semiconductor Equipment - 1.0% | | | |
| Qualcomm, Inc. | | 1,661,900 | 88,795,317 |
| Software - 1.8% | | | |
| Oracle Corp. | | 2,716,100 | 108,942,771 |
| SS&C Technologies Holdings, Inc. | | 1,732,000 | 55,649,160 |
| | | | 164,591,931 |
| Technology Hardware, Storage & Peripherals - 1.7% | | | |
| Apple, Inc. | | 970,600 | 117,782,310 |
| HP, Inc. | | 2,671,000 | 40,198,550 |
| | | | 157,980,860 |
|
| TOTAL INFORMATION TECHNOLOGY | | | 853,257,554 |
|
| MATERIALS - 2.9% | | | |
| Chemicals - 2.2% | | | |
| E.I. du Pont de Nemours & Co. | | 1,213,000 | 91,581,500 |
| Eastman Chemical Co. | | 603,800 | 46,794,500 |
| LyondellBasell Industries NV Class A | | 373,800 | 34,864,326 |
| Westlake Chemical Corp. | | 467,400 | 28,936,734 |
| | | | 202,177,060 |
| Containers & Packaging - 0.4% | | | |
| Ball Corp. | | 434,701 | 33,150,298 |
| Metals & Mining - 0.3% | | | |
| Compass Minerals International, Inc. | | 374,400 | 31,299,840 |
|
| TOTAL MATERIALS | | | 266,627,198 |
|
| REAL ESTATE - 3.7% | | | |
| Equity Real Estate Investment Trusts (REITs) - 3.6% | | | |
| American Tower Corp. | | 217,000 | 22,459,500 |
| AvalonBay Communities, Inc. | | 269,383 | 46,686,768 |
| Boston Properties, Inc. | | 303,714 | 39,756,163 |
| Colony NorthStar, Inc. | | 1,576,606 | 21,946,356 |
| Equity Residential (SBI) | | 790,840 | 48,059,347 |
| Essex Property Trust, Inc. | | 105,100 | 23,573,930 |
| General Growth Properties, Inc. | | 545,856 | 13,559,063 |
| Public Storage | | 89,733 | 19,292,595 |
| Simon Property Group, Inc. | | 175,200 | 32,196,504 |
| The Macerich Co. | | 202,500 | 13,909,725 |
| Vornado Realty Trust | | 268,900 | 28,586,759 |
| Welltower, Inc. | | 355,800 | 23,589,540 |
| | | | 333,616,250 |
| Real Estate Management & Development - 0.1% | | | |
| CBRE Group, Inc. (a) | | 219,129 | 6,652,756 |
|
| TOTAL REAL ESTATE | | | 340,269,006 |
|
| TELECOMMUNICATION SERVICES - 3.6% | | | |
| Diversified Telecommunication Services - 3.6% | | | |
| AT&T, Inc. | | 4,756,765 | 200,545,212 |
| SBA Communications Corp. Class A (a) | | 329,500 | 34,683,170 |
| Verizon Communications, Inc. | | 2,019,900 | 98,995,299 |
| | | | 334,223,681 |
| UTILITIES - 5.9% | | | |
| Electric Utilities - 4.0% | | | |
| American Electric Power Co., Inc. | | 1,002,900 | 64,245,774 |
| Edison International | | 833,300 | 60,730,904 |
| NextEra Energy, Inc. | | 697,700 | 86,319,444 |
| OGE Energy Corp. | | 1,179,600 | 39,563,784 |
| PG&E Corp. | | 1,011,900 | 62,626,491 |
| Xcel Energy, Inc. | | 1,337,700 | 55,273,764 |
| | | | 368,760,161 |
| Multi-Utilities - 1.9% | | | |
| CMS Energy Corp. | | 1,054,000 | 44,900,400 |
| DTE Energy Co. | | 573,300 | 56,550,312 |
| Sempra Energy | | 696,768 | 71,342,076 |
| | | | 172,792,788 |
|
| TOTAL UTILITIES | | | 541,552,949 |
|
| TOTAL COMMON STOCKS | | | |
| (Cost $7,417,067,418) | | | 8,761,880,444 |
| | | Principal Amount | Value |
|
| U.S. Treasury Obligations - 0.1% | | | |
| U.S. Treasury Bills, yield at date of purchase 0.35% to 0.52% 2/2/17 to 4/6/17 (b) | | | |
| (Cost $8,624,093) | | 8,630,000 | 8,624,472 |
| | | Shares | Value |
|
| Money Market Funds - 4.8% | | | |
| Fidelity Cash Central Fund, 0.62% (c) | | | |
| (Cost $438,147,522) | | 438,121,834 | 438,209,458 |
| TOTAL INVESTMENT PORTFOLIO - 100.3% | | | |
| (Cost $7,863,839,033) | | | 9,208,714,374 |
| NET OTHER ASSETS (LIABILITIES) - (0.3)% | | | (24,860,979) |
| NET ASSETS - 100% | | | $9,183,853,395 |
| Futures Contracts | | | |
| | Expiration Date | Underlying Face Amount at Value | Unrealized Appreciation/(Depreciation) |
| Purchased | | | |
| Equity Index Contracts | | | |
| 1,804 ICE Russell 1000 Value Index Contracts (United States) | March 2017 | 99,833,360 | $412,181 |
The face value of futures purchased as a percentage of Net Assets is 1.1%.
Legend
(a) Non-income producing
(b) Security or a portion of the security was pledged to cover margin requirements for futures contracts. At period end, the value of securities pledged amounted to $3,833,187.
(c) Affiliated fund that is generally available only to investment companies and other accounts managed by Fidelity Investments. The rate quoted is the annualized seven-day yield of the fund at period end. A complete unaudited listing of the fund's holdings as of its most recent quarter end is available upon request. In addition, each Fidelity Central Fund's financial statements, which are not covered by the Fund's Report of Independent Registered Public Accounting Firm, are available on the SEC's website or upon request.
Affiliated Central Funds
Information regarding fiscal year to date income earned by the Fund from investments in Fidelity Central Funds is as follows:
| Fund | Income earned |
| Fidelity Cash Central Fund | $1,765,924 |
| Fidelity Securities Lending Cash Central Fund | 229,265 |
| Total | $1,995,189 |
Investment Valuation
The following is a summary of the inputs used, as of January 31, 2017, involving the Fund's assets and liabilities carried at fair value. The inputs or methodology used for valuing securities may not be an indication of the risk associated with investing in those securities. For more information on valuation inputs, and their aggregation into the levels used below, please refer to the Investment Valuation section in the accompanying Notes to Financial Statements.
| | Valuation Inputs at Reporting Date: |
| Description | Total | Level 1 | Level 2 | Level 3 |
| Investments in Securities: | | | | |
| Equities: | | | | |
| Consumer Discretionary | $462,911,359 | $462,911,359 | $-- | $-- |
| Consumer Staples | 724,800,767 | 724,800,767 | -- | -- |
| Energy | 1,173,143,285 | 1,173,143,285 | -- | -- |
| Financials | 2,367,178,826 | 2,367,178,826 | -- | -- |
| Health Care | 898,030,887 | 898,030,887 | -- | -- |
| Industrials | 799,884,932 | 799,884,932 | -- | -- |
| Information Technology | 853,257,554 | 853,257,554 | -- | -- |
| Materials | 266,627,198 | 266,627,198 | -- | -- |
| Real Estate | 340,269,006 | 340,269,006 | -- | -- |
| Telecommunication Services | 334,223,681 | 334,223,681 | -- | -- |
| Utilities | 541,552,949 | 541,552,949 | -- | -- |
| U.S. Government and Government Agency Obligations | 8,624,472 | -- | 8,624,472 | -- |
| Money Market Funds | 438,209,458 | 438,209,458 | -- | -- |
| Total Investments in Securities: | $9,208,714,374 | $9,200,089,902 | $8,624,472 | $-- |
| Derivative Instruments: | | | | |
| Assets | | | | |
| Futures Contracts | $412,181 | $412,181 | $-- | $-- |
| Total Assets | $412,181 | $412,181 | $-- | $-- |
| Total Derivative Instruments: | $412,181 | $412,181 | $-- | $-- |
Value of Derivative Instruments
The following table is a summary of the Fund's value of derivative instruments by primary risk exposure as of January 31, 2017. For additional information on derivative instruments, please refer to the Derivative Instruments section in the accompanying Notes to Financial Statements.
| Primary Risk Exposure / Derivative Type | Value |
| | Asset | Liability |
| Equity Risk | | |
| Futures Contracts(a) | $412,181 | $0 |
| Total Equity Risk | 412,181 | 0 |
| Total Value of Derivatives | $412,181 | $0 |
(a) Reflects gross cumulative appreciation (depreciation) on futures contracts as presented in the Schedule of Investments. In the Statement of Assets and Liabilities, the period end daily variation margin is included in receivable or payable for daily variation margin for derivative instruments, and the net cumulative appreciation (depreciation) is included in net unrealized appreciation (depreciation).
See accompanying notes which are an integral part of the financial statements.
Fidelity® Series Stock Selector Large Cap Value Fund
Financial Statements
Statement of Assets and Liabilities
| | | January 31, 2017 |
| Assets | | |
Investment in securities, at value — See accompanying schedule:
Unaffiliated issuers (cost $7,425,691,511) | $8,770,504,916 | |
| Fidelity Central Funds (cost $438,147,522) | 438,209,458 | |
| Total Investments (cost $7,863,839,033) | | $9,208,714,374 |
| Receivable for investments sold | | 55,628,067 |
| Receivable for fund shares sold | | 3,043,295 |
| Dividends receivable | | 7,377,782 |
| Distributions receivable from Fidelity Central Funds | | 232,433 |
| Receivable for daily variation margin for derivative instruments | | 150,928 |
| Prepaid expenses | | 12,923 |
| Other receivables | | 77,954 |
| Total assets | | 9,275,237,756 |
| Liabilities | | |
| Payable for investments purchased | $84,147,015 | |
| Payable for fund shares redeemed | 2,771,245 | |
| Accrued management fee | 3,814,005 | |
| Other affiliated payables | 572,607 | |
| Other payables and accrued expenses | 79,489 | |
| Total liabilities | | 91,384,361 |
| Net Assets | | $9,183,853,395 |
| Net Assets consist of: | | |
| Paid in capital | | $7,823,342,288 |
| Undistributed net investment income | | 4,365,176 |
| Accumulated undistributed net realized gain (loss) on investments and foreign currency transactions | | 10,858,315 |
| Net unrealized appreciation (depreciation) on investments and assets and liabilities in foreign currencies | | 1,345,287,616 |
| Net Assets | | $9,183,853,395 |
| Series Stock Selector Large Cap Value: | | |
| Net Asset Value, offering price and redemption price per share ($3,615,123,031 ÷ 289,359,371 shares) | | $12.49 |
| Class F: | | |
| Net Asset Value, offering price and redemption price per share ($5,568,730,364 ÷ 445,386,641 shares) | | $12.50 |
See accompanying notes which are an integral part of the financial statements.
Statement of Operations
| | | Year ended January 31, 2017 |
| Investment Income | | |
| Dividends | | $175,335,098 |
| Interest | | 14,791 |
| Income from Fidelity Central Funds | | 1,995,189 |
| Total income | | 177,345,078 |
| Expenses | | |
| Management fee | | |
| Basic fee | $44,725,086 | |
| Performance adjustment | (4,707,144) | |
| Transfer agent fees | 5,099,762 | |
| Accounting and security lending fees | 1,221,006 | |
| Custodian fees and expenses | 131,115 | |
| Independent trustees' fees and expenses | 34,336 | |
| Audit | 59,761 | |
| Legal | 22,212 | |
| Miscellaneous | 68,042 | |
| Total expenses before reductions | 46,654,176 | |
| Expense reductions | (367,619) | 46,286,557 |
| Net investment income (loss) | | 131,058,521 |
| Realized and Unrealized Gain (Loss) | | |
| Net realized gain (loss) on: | | |
| Investment securities: | | |
| Unaffiliated issuers | 48,571,486 | |
| Fidelity Central Funds | 99,746 | |
| Foreign currency transactions | 14,758 | |
| Futures contracts | 12,916,219 | |
| Total net realized gain (loss) | | 61,602,209 |
Change in net unrealized appreciation (depreciation) on:
Investment securities | 1,505,292,052 | |
| Assets and liabilities in foreign currencies | 661 | |
| Futures contracts | (514,259) | |
| Total change in net unrealized appreciation (depreciation) | | 1,504,778,454 |
| Net gain (loss) | | 1,566,380,663 |
| Net increase (decrease) in net assets resulting from operations | | $1,697,439,184 |
See accompanying notes which are an integral part of the financial statements.
Statement of Changes in Net Assets
| | Year ended January 31, 2017 | Year ended January 31, 2016 |
| Increase (Decrease) in Net Assets | | |
| Operations | | |
| Net investment income (loss) | $131,058,521 | $121,465,205 |
| Net realized gain (loss) | 61,602,209 | 701,912,943 |
| Change in net unrealized appreciation (depreciation) | 1,504,778,454 | (1,315,435,827) |
| Net increase (decrease) in net assets resulting from operations | 1,697,439,184 | (492,057,679) |
| Distributions to shareholders from net investment income | (126,338,283) | (133,963,226) |
| Distributions to shareholders from net realized gain | (97,954,379) | (821,834,728) |
| Total distributions | (224,292,662) | (955,797,954) |
| Share transactions - net increase (decrease) | 547,108,835 | 721,579,563 |
| Total increase (decrease) in net assets | 2,020,255,357 | (726,276,070) |
| Net Assets | | |
| Beginning of period | 7,163,598,038 | 7,889,874,108 |
| End of period | $9,183,853,395 | $7,163,598,038 |
| Other Information | | |
| Undistributed net investment income end of period | $4,365,176 | $6,650 |
See accompanying notes which are an integral part of the financial statements.
Financial Highlights — Fidelity Series Stock Selector Large Cap Value Fund
| Years ended January 31, | 2017 | 2016 | 2015 | 2014 | 2013 A |
| Selected Per–Share Data | | | | | |
| Net asset value, beginning of period | $10.38 | $12.67 | $11.96 | $10.71 | $10.00 |
| Income from Investment Operations | | | | | |
| Net investment income (loss)B | .17 | .18 | .18 | .15 | .02 |
| Net realized and unrealized gain (loss) | 2.25 | (.96) | 1.48 | 1.87 | .71 |
| Total from investment operations | 2.42 | (.78) | 1.66 | 2.02 | .73 |
| Distributions from net investment income | (.16) | (.20)C | (.16) | (.13) | (.02) |
| Distributions from net realized gain | (.14) | (1.31)C | (.79) | (.64) | – |
| Total distributions | (.31)D | (1.51) | (.95) | (.77) | (.02) |
| Net asset value, end of period | $12.49 | $10.38 | $12.67 | $11.96 | $10.71 |
| Total ReturnE,F | 23.49% | (6.69)% | 13.70% | 18.81% | 7.27% |
| Ratios to Average Net AssetsG,H | | | | | |
| Expenses before reductions | .67% | .73% | .72% | .75% | .78%I |
| Expenses net of fee waivers, if any | .67% | .73% | .72% | .75% | .78%I |
| Expenses net of all reductions | .66% | .72% | .72% | .75% | .70%I |
| Net investment income (loss) | 1.51% | 1.43% | 1.37% | 1.23% | 1.39%I |
| Supplemental Data | | | | | |
| Net assets, end of period (000 omitted) | $3,615,123 | $2,860,230 | $3,226,266 | $3,208,521 | $2,520,689 |
| Portfolio turnover rateJ | 54% | 64% | 55% | 66% | 44%K |
A For the period December 6, 2012 (commencement of operations) to January 31, 2013.
B Calculated based on average shares outstanding during the period.
C The amounts shown reflect certain reclassifications related to book to tax differences that were made in the year shown.
D Total distributions of $.31 per share is comprised of distributions from net investment income of $.162 and distributions from net realized gain of $.144 per share.
E Total returns for periods of less than one year are not annualized.
F Total returns would have been lower if certain expenses had not been reduced during the applicable periods shown.
G Fees and expenses of any underlying Fidelity Central Funds are not included in the Fund's expense ratio. The Fund indirectly bears its proportionate share of the expenses of any underlying Fidelity Central Funds.
H Expense ratios reflect operating expenses of the class. Expenses before reductions do not reflect amounts reimbursed by the investment adviser or reductions from brokerage service arrangements or reductions from other expense offset arrangements and do not represent the amount paid by the class during periods when reimbursements or reductions occur. Expense ratios before reductions for start-up periods may not be representative of longer-term operating periods. Expenses net of fee waivers reflect expenses after reimbursement by the investment adviser but prior to reductions from brokerage service arrangements or other expense offset arrangements. Expenses net of all reductions represent the net expenses paid by the class.
I Annualized
J Amount does not include the portfolio activity of any underlying Fidelity Central Funds.
K Amount not annualized.
See accompanying notes which are an integral part of the financial statements.
Financial Highlights — Fidelity Series Stock Selector Large Cap Value Fund Class F
| Years ended January 31, | 2017 | 2016 | 2015 | 2014 | 2013 A |
| Selected Per–Share Data | | | | | |
| Net asset value, beginning of period | $10.39 | $12.67 | $11.97 | $10.71 | $10.00 |
| Income from Investment Operations | | | | | |
| Net investment income (loss)B | .19 | .20 | .20 | .17 | .02 |
| Net realized and unrealized gain (loss) | 2.24 | (.95) | 1.47 | 1.88 | .71 |
| Total from investment operations | 2.43 | (.75) | 1.67 | 2.05 | .73 |
| Distributions from net investment income | (.18) | (.22)C | (.18) | (.15) | (.02) |
| Distributions from net realized gain | (.14) | (1.31)C | (.79) | (.64) | – |
| Total distributions | (.32) | (1.53) | (.97) | (.79) | (.02) |
| Net asset value, end of period | $12.50 | $10.39 | $12.67 | $11.97 | $10.71 |
| Total ReturnD,E | 23.62% | (6.44)% | 13.79% | 19.09% | 7.28% |
| Ratios to Average Net AssetsF,G | | | | | |
| Expenses before reductions | .51% | .57% | .55% | .57% | .59%H |
| Expenses net of fee waivers, if any | .51% | .57% | .55% | .57% | .59%H |
| Expenses net of all reductions | .50% | .56% | .55% | .57% | .51%H |
| Net investment income (loss) | 1.67% | 1.59% | 1.54% | 1.41% | 1.58%H |
| Supplemental Data | | | | | |
| Net assets, end of period (000 omitted) | $5,568,730 | $4,303,368 | $4,663,608 | $4,176,725 | $2,782,347 |
| Portfolio turnover rateI | 54% | 64% | 55% | 66% | 44%J |
A For the period December 6, 2012 (commencement of operations) to January 31, 2013.
B Calculated based on average shares outstanding during the period.
C The amounts shown reflect certain reclassifications related to book to tax differences that were made in the year shown.
D Total returns for periods of less than one year are not annualized.
E Total returns would have been lower if certain expenses had not been reduced during the applicable periods shown.
F Fees and expenses of any underlying Fidelity Central Funds are not included in the Fund's expense ratio. The Fund indirectly bears its proportionate share of the expenses of any underlying Fidelity Central Funds.
G Expense ratios reflect operating expenses of the class. Expenses before reductions do not reflect amounts reimbursed by the investment adviser or reductions from brokerage service arrangements or reductions from other expense offset arrangements and do not represent the amount paid by the class during periods when reimbursements or reductions occur. Expense ratios before reductions for start-up periods may not be representative of longer-term operating periods. Expenses net of fee waivers reflect expenses after reimbursement by the investment adviser but prior to reductions from brokerage service arrangements or other expense offset arrangements. Expenses net of all reductions represent the net expenses paid by the class.
H Annualized
I Amount does not include the portfolio activity of any underlying Fidelity Central Funds.
J Amount not annualized.
See accompanying notes which are an integral part of the financial statements.
Notes to Financial Statements
For the period ended January 31, 2017
1. Organization.
Fidelity Series All-Sector Equity Fund, Fidelity Series Equity-Income Fund and Fidelity Series Stock Selector Large Cap Value Fund (the Funds) are funds of Fidelity Devonshire Trust (the Trust). The Trust is registered under the Investment Company Act of 1940, as amended (the 1940 Act), as an open-end management investment company organized as a Massachusetts business trust. Each Fund is authorized to issue an unlimited number of shares. Shares of the Funds are only available for purchase by mutual funds for which Fidelity Management & Research Company (FMR) or an affiliate serves as an investment manager. Fidelity Series All-Sector Equity Fund offers Series All-Sector Equity shares and Class F shares. Fidelity Series Equity-Income Fund offers Series Equity-Income shares and Class F shares. Fidelity Series Stock Selector Large Cap Value Fund offers Series Stock Selector Large Cap Value shares and Class F shares. All classes have equal rights as to assets and voting privileges. Each class has exclusive voting rights with respect to matters that affect that class.
2. Investments in Fidelity Central Funds.
The Funds invest in Fidelity Central Funds, which are open-end investment companies generally available only to other investment companies and accounts managed by the investment adviser and its affiliates. The Funds' Schedules of Investments list each of the Fidelity Central Funds held as of period end, if any, as an investment of each Fund, but do not include the underlying holdings of each Fidelity Central Fund. As an Investing Fund, each Fund indirectly bears its proportionate share of the expenses of the underlying Fidelity Central Funds.
The Money Market Central Funds seek preservation of capital and current income and are managed by Fidelity Investments Money Management, Inc. (FIMM), an affiliate of the investment adviser. Annualized expenses of the Money Market Central Funds as of their most recent shareholder report date are less than .005%.
A complete unaudited list of holdings for each Fidelity Central Fund is available upon request or at the Securities and Exchange Commission (the SEC) website at www.sec.gov. In addition, the financial statements of the Fidelity Central Funds, which are not covered by the Funds' Report of Independent Registered Public Accounting Firm, are available on the SEC website or upon request.
3. Significant Accounting Policies.
The financial statements have been prepared in conformity with accounting principles generally accepted in the United States of America (GAAP), which require management to make certain estimates and assumptions at the date of the financial statements. Actual results could differ from those estimates. Subsequent events, if any, through the date that the financial statements were issued have been evaluated in the preparation of the financial statements. The following summarizes the significant accounting policies of the Funds:
Investment Valuation. Investments are valued as of 4:00 p.m. Eastern time on the last calendar day of the period. The Board of Trustees (the Board) has delegated the day to day responsibility for the valuation of each Fund's investments to the Fair Value Committee (the Committee) established by each Fund's investment adviser. In accordance with valuation policies and procedures approved by the Board, each Fund attempts to obtain prices from one or more third party pricing vendors or brokers to value its investments. When current market prices, quotations or currency exchange rates are not readily available or reliable, investments will be fair valued in good faith by the Committee, in accordance with procedures adopted by the Board. Factors used in determining fair value vary by investment type and may include market or investment specific events, changes in interest rates and credit quality. The frequency with which these procedures are used cannot be predicted and they may be utilized to a significant extent. The Committee oversees each Fund's valuation policies and procedures and reports to the Board on the Committee's activities and fair value determinations. The Board monitors the appropriateness of the procedures used in valuing each Fund's investments and ratifies the fair value determinations of the Committee.
Each Fund categorizes the inputs to valuation techniques used to value its investments into a disclosure hierarchy consisting of three levels as shown below:
- Level 1 – quoted prices in active markets for identical investments
- Level 2 – other significant observable inputs (including quoted prices for similar investments, interest rates, prepayment speeds, etc.)
- Level 3 – unobservable inputs (including the Fund's own assumptions based on the best information available)
Valuation techniques used to value each Fund's investments by major category are as follows:
Equity securities, including restricted securities, for which market quotations are readily available, are valued at the last reported sale price or official closing price as reported by a third party pricing vendor on the primary market or exchange on which they are traded and are categorized as Level 1 in the hierarchy. In the event there were no sales during the day or closing prices are not available, securities are valued at the last quoted bid price or may be valued using the last available price and are generally categorized as Level 2 in the hierarchy. For foreign equity securities, when market or security specific events arise, comparisons to the valuation of American Depositary Receipts (ADRs), futures contracts, Exchange-Traded Funds (ETFs) and certain indexes as well as quoted prices for similar securities may be used and would be categorized as Level 2 in the hierarchy. Utilizing these techniques may result in transfers between Level 1 and Level 2. For equity securities, including restricted securities, where observable inputs are limited, assumptions about market activity and risk are used and these securities may be categorized as Level 3 in the hierarchy.
Debt securities, including restricted securities, are valued based on evaluated prices received from third party pricing vendors or from brokers who make markets in such securities. U.S. government and government agency obligations are valued by pricing vendors who utilize matrix pricing which considers yield or price of bonds of comparable quality, coupon, maturity and type or by broker-supplied prices. When independent prices are unavailable or unreliable, debt securities may be valued utilizing pricing methodologies which consider similar factors that would be used by third party pricing vendors. Debt securities are generally categorized as Level 2 in the hierarchy but may be Level 3 depending on the circumstances.
Futures contracts are valued at the settlement price established each day by the board of trade or exchange on which they are traded and are categorized as Level 1 in the hierarchy. Exchange-traded options are valued using the last sale price or, in the absence of a sale, the last offering price and are categorized as Level 1 in the hierarchy. Options traded over-the-counter are valued using broker-supplied valuations and are categorized as Level 2 in the hierarchy. Investments in open-end mutual funds, including the Fidelity Central Funds, are valued at their closing net asset value (NAV) each business day and are categorized as Level 1 in the hierarchy.
Changes in valuation techniques may result in transfers in or out of an assigned level within the disclosure hierarchy. The aggregate value of investments by input level as of January 31, 2017 is included at the end of each Fund's Schedule of Investments.
Foreign Currency. The Funds may use foreign currency contracts to facilitate transactions in foreign-denominated securities. Gains and losses from these transactions may arise from changes in the value of the foreign currency or if the counterparties do not perform under the contracts' terms.
Foreign-denominated assets, including investment securities, and liabilities are translated into U.S. dollars at the exchange rates at period end. Purchases and sales of investment securities, income and dividends received and expenses denominated in foreign currencies are translated into U.S. dollars at the exchange rate in effect on the transaction date.
The effects of exchange rate fluctuations on investments are included with the net realized and unrealized gain (loss) on investment securities. Other foreign currency transactions resulting in realized and unrealized gain (loss) are disclosed separately.
Investment Transactions and Income. For financial reporting purposes, the Funds' investment holdings and NAV include trades executed through the end of the last business day of the period. The NAV per share for processing shareholder transactions is calculated as of the close of business of the New York Stock Exchange (NYSE), normally 4:00 p.m. Eastern time and includes trades executed through the end of the prior business day. Gains and losses on securities sold are determined on the basis of identified cost and may include proceeds received from litigation. Dividend income is recorded on the ex-dividend date, except for certain dividends from foreign securities where the ex-dividend date may have passed, which are recorded as soon as the Funds are informed of the ex-dividend date. Non-cash dividends included in dividend income, if any, are recorded at the fair market value of the securities received. Income and capital gain distributions from Fidelity Central Funds, if any, are recorded on the ex-dividend date. Certain distributions received by the Funds represent a return of capital or capital gain. The Funds determine the components of these distributions subsequent to the ex-dividend date, based upon receipt of tax filings or other correspondence relating to the underlying investment. These distributions are recorded as a reduction of cost of investments and/or as a realized gain. Interest income is accrued as earned and includes coupon interest and amortization of premium and accretion of discount on debt securities as applicable. Investment income is recorded net of foreign taxes withheld where recovery of such taxes is uncertain.
Class Allocations and Expenses. Investment income, realized and unrealized capital gains and losses, common expenses of each Fund, and certain fund-level expense reductions, if any, are allocated daily on a pro-rata basis to each class based on the relative net assets of each class to the total net assets of each Fund. Each class differs with respect to transfer agent fees incurred. Certain expense reductions may also differ by class. For the reporting period, the allocated portion of income and expenses to each class as a percent of its average net assets may vary due to the timing of recording these transactions in relation to fluctuating net assets of the classes. Expenses directly attributable to a fund are charged to that fund. Expenses attributable to more than one fund are allocated among the respective funds on the basis of relative net assets or other appropriate methods. Expense estimates are accrued in the period to which they relate and adjustments are made when actual amounts are known.
Income Tax Information and Distributions to Shareholders. Each year, each Fund intends to qualify as a regulated investment company under Subchapter M of the Internal Revenue Code, including distributing substantially all of its taxable income and realized gains. As a result, no provision for U.S. Federal income taxes is required. As of January 31, 2017, each Fund did not have any unrecognized tax benefits in the financial statements; nor is each Fund aware of any tax positions for which it is reasonably possible that the total amounts of unrecognized tax benefits will significantly change in the next twelve months. Each Fund files a U.S. federal tax return, in addition to state and local tax returns as required. Each Fund's federal income tax returns are subject to examination by the Internal Revenue Service (IRS) for a period of three fiscal years after they are filed. State and local tax returns may be subject to examination for an additional fiscal year depending on the jurisdiction. Foreign taxes are provided for based on each Fund's understanding of the tax rules and rates that exist in the foreign markets in which it invests.
Distributions are declared and recorded on the ex-dividend date. Income dividends and capital gain distributions are declared separately for each class. Income and capital gain distributions are determined in accordance with income tax regulations, which may differ from GAAP. These differences resulted in distribution reclassifications for the period ended January 31, 2016.
Capital accounts within the financial statements are adjusted for permanent book-tax differences. These adjustments have no impact on net assets or the results of operations. Capital accounts are not adjusted for temporary book-tax differences which will reverse in a subsequent period.
Book-tax differences are primarily due to the short-term gain distributions from the Underlying Funds, futures contracts, foreign currency transactions, market discount, partnerships and losses deferred due to wash sales and excise tax regulations.
The federal tax cost of investment securities and unrealized appreciation (depreciation) as of period end were as follows for each Fund:
| | Tax cost | Gross unrealized appreciation | Gross unrealized depreciation | Net unrealized appreciation (depreciation) on securities |
| Fidelity Series All-Sector Equity Fund | $4,379,136,853 | $1,666,295,356 | $(94,790,072) | $1,571,505,284 |
| Fidelity Series Equity-Income Fund | 10,989,361,915 | 2,295,244,441 | (381,040,847) | 1,914,203,594 |
| Fidelity Series Stock Selector Large Cap Value Fund | 7,881,281,420 | 1,521,573,940 | (194,140,986) | 1,327,432,954 |
The tax-based components of distributable earnings as of period end were as follows for each Fund:
| | Undistributed ordinary income | Undistributed long-term capital gain | Net unrealized appreciation (depreciation) on securities and other investments |
| Fidelity Series All-Sector Equity Fund | $3,706,326 | $199,400,653 | $1,571,442,146 |
| Fidelity Series Equity-Income Fund | 50,152,382 | 76,242,081 | 1,822,539,320 |
| Fidelity Series Stock Selector Large Cap Value Fund | 4,361,394 | 28,716,665 | 1,327,433,048 |
The tax character of distributions paid was as follows:
| January 31, 2017 | | | |
| | Ordinary Income | Long-term Capital Gains | Total |
| Fidelity Series All-Sector Equity Fund | $83,080,612 | $924,487,766 | $1,007,568,378 |
| Fidelity Series Equity-Income Fund | 293,872,103 | 223,591,897 | 517,464,000 |
| Fidelity Series Stock Selector Large Cap Value Fund | 126,338,283 | 97,954,379 | 224,292,662 |
| January 31, 2016 | | | |
| | Ordinary Income | Long-term Capital Gains | Total |
| Fidelity Series All-Sector Equity Fund | $209,173,223 | $805,070,246 | $1,014,243,469 |
| Fidelity Series Equity-Income Fund | 394,313,812 | 591,676,042 | 985,989,854 |
| Fidelity Series Stock Selector Large Cap Value Fund | 269,482,468 | 686,315,486 | 955,797,954 |
Delayed Delivery Transactions and When-Issued Securities. During the period, certain Funds transacted in securities on a delayed delivery or when-issued basis. Payment and delivery may take place after the customary settlement period for that security. The price of the underlying securities and the date when the securities will be delivered and paid for are fixed at the time the transaction is negotiated. With respect to purchase commitments, each applicable Fund identifies securities as segregated in its records with a value at least equal to the amount of the commitment. Losses may arise due to changes in the value of the underlying securities or if the counterparty does not perform under the contract's terms, or if the issuer does not issue the securities due to political, economic, or other factors.
Restricted Securities. The Funds may invest in securities that are subject to legal or contractual restrictions on resale. These securities generally may be resold in transactions exempt from registration or to the public if the securities are registered. Disposal of these securities may involve time-consuming negotiations and expense, and prompt sale at an acceptable price may be difficult. Information regarding restricted securities is included at the end of each applicable Fund's Schedule of Investments.
Consolidated Subsidiary. Fidelity Series Equity-Income Fund (the Fund) invests in certain investments through a wholly-owned subsidiary ("Subsidiary"), which may be subject to federal and state taxes upon disposition.
As of period end, the Fund held an investment of $23,157,786 in this Subsidiary, representing .18% of the Fund's net assets. The financial statements have been consolidated and include accounts of the Fund and each Subsidiary. Accordingly, all inter-company transactions and balances have been eliminated.
4. Derivative Instruments.
Risk Exposures and the Use of Derivative Instruments. The Funds' investment objective allows the Funds to enter into various types of derivative contracts, including futures contracts and options. Derivatives are investments whose value is primarily derived from underlying assets, indices or reference rates and may be transacted on an exchange or over-the-counter (OTC). Derivatives may involve a future commitment to buy or sell a specified asset based on specified terms, to exchange future cash flows at periodic intervals based on a notional principal amount, or for one party to make one or more payments upon the occurrence of specified events in exchange for periodic payments from the other party.
The Funds used derivatives to increase returns and to manage exposure to certain risks as defined below. The success of any strategy involving derivatives depends on analysis of numerous economic factors, and if the strategies for investment do not work as intended, the Funds may not achieve their objectives.
The Funds' use of derivatives increased or decreased their exposure to the following risk:
| Equity Risk | Equity risk relates to the fluctuations in the value of financial instruments as a result of changes in market prices (other than those arising from interest rate risk or foreign exchange risk), whether caused by factors specific to an individual investment, its issuer, or all factors affecting all instruments traded in a market or market segment.
|
The Funds are also exposed to additional risks from investing in derivatives, such as liquidity risk and counterparty credit risk. Liquidity risk is the risk that the Funds will be unable to close out the derivative in the open market in a timely manner. Counterparty credit risk is the risk that the counterparty will not be able to fulfill its obligation to the Funds. Derivative counterparty credit risk is managed through formal evaluation of the creditworthiness of all potential counterparties. On certain OTC derivatives such as options, the Funds attempt to reduce their exposure to counterparty credit risk by entering into an International Swaps and Derivatives Association, Inc. (ISDA) Master Agreement with each of its counterparties. The ISDA Master Agreement gives the Funds the right to terminate all transactions traded under such agreement upon the deterioration in the credit quality of the counterparty beyond specified levels. The ISDA Master Agreement gives each party the right, upon an event of default by the other party or a termination of the agreement, to close out all transactions traded under such agreement and to net amounts owed under each transaction to one net payable by one party to the other. To mitigate counterparty credit risk on bi-lateral OTC derivatives, the Funds receive collateral in the form of cash or securities once each Fund's net unrealized appreciation on outstanding derivative contracts under an ISDA Master Agreement exceeds certain applicable thresholds, subject to certain minimum transfer provisions. The collateral received is held in segregated accounts with the Funds' custodian bank in accordance with the collateral agreements entered into between the Funds, the counterparty and the Funds' custodian bank. The Funds could experience delays and costs in gaining access to the collateral even though it is held by the Funds' custodian bank. The Funds' maximum risk of loss from counterparty credit risk related to bi-lateral OTC derivatives is generally the aggregate unrealized appreciation and unpaid counterparty payments in excess of any collateral pledged by the counterparty to the Funds. The Funds may be required to pledge collateral for the benefit of the counterparties on bi-lateral OTC derivatives in an amount not less than each counterparty's unrealized appreciation on outstanding derivative contacts, subject to certain minimum transfer provision, and any such pledged collateral is identified in the Schedule of Investments. Exchange-traded futures contacts and exchange-traded options are not covered by the ISDA Master agreement; however counterparty credit risk related to exchange-traded futures and exchange-traded options may be mitigated by the protection provided by the exchange on which they trade.
Investing in derivatives may involve greater risks than investing in the underlying assets directly and, to varying degrees, may involve risk of loss in excess of any initial investment and collateral received and amounts recognized in the Statement of Assets and Liabilities. In addition, there may be the risk that the change in value of the derivative contract does not correspond to the change in value of the underlying instrument.
Net Realized Gain (Loss) and Change in Net Unrealized Appreciation (Depreciation) on Derivatives. The table below, which reflects the impacts of derivatives on the financial performance of the Funds, summarizes the net realized gain (loss) and change in net unrealized appreciation (depreciation) for derivatives during the period as presented in the Statement of Operations.
| Primary Risk Exposure / Derivative Type | Net Realized Gain (Loss) | Change in Net Unrealized Appreciation (Depreciation) |
| Fidelity Series All-Sector Equity Fund | | |
| Equity Risk | | |
| Futures Contracts | $12,959,157 | $135,688 |
| Fidelity Series Equity-Income Fund | | |
| Equity Risk | | |
| Written Options | $21,305,002 | $(2,168,495) |
| Fidelity Series Stock Selector Large Cap Value Fund | | |
| Equity Risk | | |
| Futures Contracts | $12,916,219 | $(514,259) |
A summary of the value of derivatives by primary risk exposure as of period end, if any, is included at the end of the Schedule of Investments.
Futures Contracts. A futures contract is an agreement between two parties to buy or sell a specified underlying instrument for a fixed price at a specified future date. Fidelity Series All-Sector Equity Fund and Fidelity Series Stock Selector Large Cap Value Fund used futures contracts to manage their exposure to the stock market.
Upon entering into a futures contract, a fund is required to deposit either cash or securities (initial margin) with a clearing broker in an amount equal to a certain percentage of the face value of the contract. Futures contracts are marked-to-market daily and subsequent daily payments (variation margin) are made or received by a fund depending on the daily fluctuations in the value of the futures contracts and are recorded as unrealized appreciation or (depreciation). This receivable and/or payable, if any, is included in daily variation margin for derivative instruments in the Statement of Assets and Liabilities. Realized gain or (loss) is recorded upon the expiration or closing of a futures contract. The net realized gain (loss) and change in net unrealized appreciation (depreciation) on futures contracts during the period is included in the Statement of Operations.
Any open futures contracts at period end are presented in the Schedule of Investments under the caption "Futures Contracts". The underlying face amount at value reflects each contract's exposure to the underlying instrument or index at period end and is representative of volume of activity during the period. Securities deposited to meet initial margin requirements are identified in the Schedule of Investments.
Options. Options give the purchaser the right, but not the obligation, to buy (call) or sell (put) an underlying security or financial instrument at an agreed exercise or strike price between or on certain dates. Options obligate the seller (writer) to buy (put) or sell (call) an underlying instrument at the exercise or strike price or cash settle an underlying derivative instrument if the holder exercises the option on or before the expiration date.
Fidelity Series Equity-Income Fund (the Fund) used exchange-traded and OTC written covered call options to manage its exposure to the market. When the Fund writes a covered call option, the Fund holds the underlying instrument which must be delivered to the holder upon the exercise of the option.
Upon entering into a written options contract, the Fund will receive a premium. Premiums received are reflected as a liability on the Statement of Assets and Liabilities. Options are valued daily and any unrealized appreciation (depreciation) is reflected on the Statement of Assets and Liabilities. When a written option is exercised, the premium is added to the proceeds from the sale of the underlying instrument in determining the gain or loss realized on that investment. When an option is closed the Fund will realize a gain or loss depending on whether the proceeds or amount paid for the closing sale transaction are greater or less than the premium received. When an option expires, gains and losses are realized to the extent of premiums received. The net realized gain (loss) on closed and expired written options and the change in net unrealized appreciation (depreciation) on written options are reflected separately on the Statement of Operations.
Writing call options tends to decrease exposure to the underlying instrument and risk of loss is the change in value in excess of the premium received.
Any open options at period end are presented in the Schedule of Investments under the caption "Written Options".
The following is a summary of the Fund's written options activity:
| | Number of Contracts | Amount of Premiums |
| Outstanding at beginning of period | 43,607 | $2,179,431 |
| Options Opened | 709,913 | 51,704,621 |
| Options Exercised | (272,802) | (17,968,865) |
| Options Closed | (135,497) | (8,925,467) |
| Options Expired | (168,262) | (14,279,055) |
| Outstanding at end of period | 176,959 | $12,710,665 |
5. Purchases and Sales of Investments.
Purchases and sales of securities, other than short-term securities, are noted in the table below.
| | Purchases ($) | Sales ($) |
| Fidelity Series All-Sector Equity Fund | 3,252,716,128 | 8,127,897,172 |
| Fidelity Series Equity-Income Fund | 4,803,399,099 | 5,844,891,947 |
| Fidelity Series Stock Selector Large Cap Value Fund | 4,582,511,091 | 4,203,574,910 |
6. Fees and Other Transactions with Affiliates.
Management Fee. Fidelity Management & Research Company (the investment adviser) and its affiliates provide the Funds with investment management related services for which the Funds pay a monthly management fee. The management fee is the sum of an individual fund fee rate and an annualized group fee rate. The individual fund fee rate is applied to each Fund's average net assets. The group fee rate is based upon the average net assets of all the mutual funds advised by the investment adviser, including any mutual funds previously advised by the investment adviser that are currently advised by Fidelity SelectCo, LLC, an affiliate of the investment adviser. The group fee rate decreases as assets under management increase and increases as assets under management decrease. In addition, the management fee for Fidelity Series All-Sector Equity Fund and Fidelity Series Stock Selector Large Cap Value Funds is subject to a performance adjustment (up to a maximum of +/- .20% of each applicable Fund's average net assets over a 36 month performance period.) The upward or downward adjustment to the management fee is based on Series All- Sector Equity Fund compared to its benchmark index and Series Stock Selector Large Cap Value Fund as compared to its benchmark index over the same 36 month performance period. For the reporting period, each Fund's annual management fee rate expressed as a percentage of each Fund's average net assets, including the performance adjustment, if applicable was as follows: The performance adjustment included in the management fee rate may be higher or lower than the maximum performance adjustment rate due to the difference between the average net asset for the reporting and performance periods.
| | Individual Rate | Group Rate | Total |
| Fidelity Series All-Sector Equity Fund | .30% | .25% | .50% |
| Fidelity Series Equity-Income Fund | .20% | .25% | .45% |
| Fidelity Series Stock Selector Large Cap Value Fund | .30% | .25% | .49% |
| | Performance Benchmark |
| Fidelity Series All-Sector Equity Fund | Russell 1000 Index |
| Fidelity Series Stock Selector Large Cap Value Fund | Russell 1000 Value Index |
Transfer Agent Fees. Fidelity Investments Institutional Operations Company, Inc., (FIIOC), an affiliate of the investment adviser, is the transfer, dividend disbursing and shareholder servicing agent for each class of the Funds. FIIOC receives account fees and asset-based fees that vary according to the account size and type of account of the shareholders of the respective classes of each Fund, except for Class F. FIIOC receives no fees for providing transfer agency services to Class F. FIIOC pays for typesetting, printing and mailing of shareholder reports, except proxy statements. For the period, transfer agent fees for each class were as follows:
| | Amount | % of
Class-Level Average
Net Assets |
| Fidelity Series All-Sector Equity Fund | | |
| Series All-Sector Equity | $5,983,108 | .16 |
| Fidelity Series Equity-Income Fund | | |
| Series Equity-Income | $7,554,885 | .16 |
| Fidelity Series Stock Selector Large Cap Value Fund | | |
| Series Stock Selector Large Cap Value | $5,099,762 | .16 |
Accounting and Security Lending Fees. Fidelity Service Company, Inc. (FSC), an affiliate of the investment adviser, maintains each Fund's accounting records. The accounting fee is based on the level of average net assets for each month. Under a separate contract, FSC administers the security lending program. The security lending fee is based on the number and duration of lending transactions.
Brokerage Commissions. Certain Funds placed a portion of their portfolio transactions with brokerage firms which are affiliates of the investment adviser. Brokerage commissions are included in net realized gain (loss) and change in net unrealized appreciation (depreciation) in the Statement of Operations. The commissions paid to these affiliated firms were as follows:
| | Amount |
| Fidelity Series All-Sector Equity Fund | $180,312 |
| Fidelity Series Equity-Income Fund | 138,094 |
| Fidelity Series Stock Selector Large Cap Value Fund | 144,395 |
Interfund Lending Program. Pursuant to an Exemptive Order issued by the SEC, the Funds, along with other registered investment companies having management contracts with FMR or other affiliated entities of FMR, may participate in an interfund lending program. This program provides an alternative credit facility allowing the funds to borrow from, or lend money to, other participating affiliated funds. At period end, Fidelity Series All-Sector Equity Fund and Fidelity Series Equity-Income Fund had no interfund loans outstanding. Each applicable fund's activity in this program during the period for which loans were outstanding was as follows:
| | Borrower or Lender | Average Loan Balance | Weighted Average Interest Rate | Interest Expense |
| Fidelity Series All-Sector Equity Fund | Borrower | $265,867,091 | .59% | $48,181 |
| Fidelity Series Equity-Income Fund | Borrower | 10,862,000 | .66% | 395 |
Interfund Trades. The Funds may purchase from or sell securities to other Fidelity Funds under procedures adopted by the Board. The procedures have been designed to ensure these interfund trades are executed in accordance with Rule 17a-7 of the 1940 Act. Interfund trades are included within the respective purchases and sales amounts shown in the Purchases and Sales of Investments note.
7. Committed Line of Credit.
Certain Funds participate with other funds managed by the investment adviser or an affiliate in a $4.25 billion credit facility (the "line of credit") to be utilized for temporary or emergency purposes to fund shareholder redemptions or for other short-term liquidity purposes. The participating funds have agreed to pay commitment fees on their pro-rata portion of the line of credit, which are reflected in Miscellaneous expenses on the Statement of Operations, and are as follows:
| Fidelity Series All-Sector Equity Fund | $24,767 |
| Fidelity Series Equity-Income Fund | 36,406 |
| Fidelity Series Stock Selector Large Cap Value Fund | 24,396 |
During the period, the Funds did not borrow on this line of credit.
8. Security Lending.
Certain Funds lend portfolio securities through a lending agent from time to time in order to earn additional income. For equity securities, a lending agent is used and may loan securities to certain qualified borrowers, including Fidelity Capital Markets (FCM), a broker-dealer affiliated with the Funds. On the settlement date of the loan, each applicable Fund receives collateral (in the form of U.S. Treasury obligations, letters of credit and/or cash) against the loaned securities and maintains collateral in an amount not less than 100% of the market value of the loaned securities during the period of the loan. The market value of the loaned securities is determined at the close of business of the Funds and any additional required collateral is delivered to the Funds on the next business day. The Funds or borrower may terminate the loan at any time, and if the borrower defaults on its obligation to return the securities loaned because of insolvency or other reasons, the Funds may apply collateral received from the borrower against the obligation. The Funds may experience delays and costs in recovering the securities loaned. Any cash collateral received is invested in the Fidelity Securities Lending Cash Central Fund. The value of loaned securities and cash collateral at period end are disclosed on each applicable Fund's Statement of Assets and Liabilities. Security lending income represents the income earned on investing cash collateral, less rebates paid to borrowers and any lending agent fees associated with the loan, plus any premium payments received for lending certain types of securities. Security lending income is presented on each applicable Fund's Statement of Operations as a component of income from Fidelity Central Funds. Security lending activity was as follows:
| | Total Security Lending Income | Security Lending Income From Securities Loaned to FCM | Value of Securities Loaned to FCM at Period End |
| Fidelity Series All-Sector Equity Fund | $567,024 | $304 | $– |
| Fidelity Series Equity-Income Fund | 639,798 | 111,669 | 10,802,995 |
| Fidelity Series Stock Selector Large Cap Value Fund | 229,265 | 288 | – |
9. Expense Reductions.
Commissions paid to certain brokers with whom the investment adviser, or its affiliates, places trades on behalf of Certain Funds include an amount in addition to trade execution, which may be rebated back to the Funds to offset certain expenses. In addition, through arrangements with each applicable Fund's custodian, credits realized as a result of certain uninvested cash balances were used to reduce the Fund's expenses. All of the applicable expense reductions are noted in the table below.
| | Brokerage Service reduction | Custody
expense
reduction |
| Fidelity Series All-Sector Equity Fund | $373,586 | $194 |
| Fidelity Series Equity-Income Fund | 399,939 | 2,727 |
| Fidelity Series Stock Selector Large Cap Value Fund | 298,387 | – |
In addition, during the period the investment adviser reimbursed and/or waived a portion of fund-level operating expenses as follows:
| | Fund-level Amount |
| Fidelity Series All-Sector Equity Fund | $63,322 |
| Fidelity Series Equity-Income Fund | 101,026 |
| Fidelity Series Stock Selector Large Cap Value Fund | 69,232 |
10. Distributions to Shareholders.
Distributions to shareholders of each class were as follows:
| | Year ended
January 31, 2017 | Year ended
January 31, 2016 |
| Fidelity Series All-Sector Equity Fund | | |
| From net investment income | | |
| Series All-Sector Equity | $34,765,591 | $47,470,909 |
| Class F | 48,315,021 | 63,520,448 |
| Total | $83,080,612 | $110,991,357 |
| From net realized gain | | |
| Series All-Sector Equity | $422,768,442 | $423,331,845 |
| Class F | 501,719,324 | 479,920,267 |
| Total | $924,487,766 | $903,252,112 |
| Fidelity Series Equity-Income Fund | | |
| From net investment income | | |
| Series Equity-Income | $102,206,696 | $126,940,551 |
| Class F | 170,986,098 | 199,439,259 |
| Total | $273,192,794 | $326,379,810 |
| From net realized gain | | |
| Series Equity-Income | $96,030,059 | $264,896,346 |
| Class F | 148,241,147 | 394,713,698 |
| Total | $244,271,206 | $659,610,044 |
| Fidelity Series Stock Selector Large Cap Value Fund | | |
| From net investment income | | |
| Series Stock Selector Large Cap Value | $46,370,074 | $50,402,320 |
| Class F | 79,968,209 | 83,560,906 |
| Total | $126,338,283 | $133,963,226 |
| From net realized gain | | |
| Series Stock Selector Large Cap Value | $39,189,968 | $329,231,959 |
| Class F | 58,764,411 | 492,602,769 |
| Total | $97,954,379 | $821,834,728 |
11. Share Transactions.
Transactions for each class of shares were as follows:
| | Shares | Shares | Dollars | Dollars |
| | Year ended January 31, 2017 | Year ended January 31, 2016 | Year ended January 31, 2017 | Year ended January 31, 2016 |
| Fidelity Series All-Sector Equity Fund | | | | |
| Series All-Sector Equity | | | | |
| Shares sold | 17,447,715 | 35,141,686 | $222,380,318 | $476,843,174 |
| Reinvestment of distributions | 37,633,076 | 36,428,918 | 457,534,033 | 470,802,754 |
| Shares redeemed | (200,487,503) | (64,306,814) | (2,648,784,288) | (892,167,250) |
| Net increase (decrease) | (145,406,712) | 7,263,790 | $(1,968,869,937) | $55,478,678 |
| Class F | | | | |
| Shares sold | 37,500,429 | 61,014,379 | $476,054,798 | $825,926,852 |
| Reinvestment of distributions | 45,316,663 | 42,150,064 | 550,034,345 | 543,440,715 |
| Shares redeemed | (243,062,018) | (75,106,226) | (3,202,248,512) | (1,034,782,602) |
| Net increase (decrease) | (160,244,926) | 28,058,217 | $(2,176,159,369) | $334,584,965 |
| Fidelity Series Equity-Income Fund | | | | |
| Series Equity-Income | | | | |
| Shares sold | 31,432,432 | 39,867,120 | $384,128,003 | $487,981,645 |
| Reinvestment of distributions | 16,245,329 | 33,811,102 | 198,236,755 | 391,836,897 |
| Shares redeemed | (65,420,830) | (58,004,561) | (784,109,546) | (698,899,540) |
| Net increase (decrease) | (17,743,069) | 15,673,661 | $(201,744,788) | $180,919,002 |
| Class F | | | | |
| Shares sold | 81,750,336 | 94,690,161 | $983,756,162 | $1,151,903,465 |
| Reinvestment of distributions | 26,139,126 | 51,275,477 | 319,227,245 | 594,152,957 |
| Shares redeemed | (120,613,647) | (99,291,395) | (1,462,583,213) | (1,195,904,881) |
| Net increase (decrease) | (12,724,185) | 46,674,243 | $(159,599,806) | $550,151,541 |
| Fidelity Series Stock Selector Large Cap Value Fund | | | | |
| Series Stock Selector Large Cap Value | | | | |
| Shares sold | 38,562,816 | 24,683,092 | $456,534,754 | $305,055,961 |
| Reinvestment of distributions | 7,285,333 | 34,374,961 | 85,560,042 | 379,634,279 |
| Shares redeemed | (32,016,026) | (38,256,262) | (365,140,651) | (471,445,503) |
| Net increase (decrease) | 13,832,123 | 20,801,791 | $176,954,145 | $213,244,737 |
| Class F | | | | |
| Shares sold | 85,332,565 | 58,426,280 | $995,931,948 | $718,282,119 |
| Reinvestment of distributions | 11,754,285 | 52,212,701 | 138,732,620 | 576,163,675 |
| Shares redeemed | (66,070,266) | (64,280,031) | (764,509,878) | (786,110,968) |
| Net increase (decrease) | 31,016,584 | 46,358,950 | $370,154,690 | $508,334,826 |
12. Other.
The Funds' organizational documents provide former and current trustees and officers with a limited indemnification against liabilities arising in connection with the performance of their duties to the Funds. In the normal course of business, the Funds may also enter into contracts that provide general indemnifications. The Funds' maximum exposure under these arrangements is unknown as this would be dependent on future claims that may be made against the Funds. The risk of material loss from such claims is considered remote.
At the end of the period, mutual funds managed by the investment adviser or its affiliates were the owners of record of all of the outstanding shares of the Funds.
Report of Independent Registered Public Accounting Firm
To the Trustees of Fidelity Devonshire Trust and the Shareholders of Fidelity Series All-Sector Equity Fund and Fidelity Series Equity-Income Fund:
We have audited the accompanying statements of assets and liabilities of Fidelity Series All-Sector Equity Fund and Fidelity Series Equity-Income Fund (the Funds), each a fund of the Fidelity Devonshire Trust, including the schedules of investments, as of January 31, 2017, and the related statements of operations for the year then ended, the statements of changes in net assets for each of the two years in the period then ended, and the financial highlights for each of the periods presented. These financial statements and financial highlights are the responsibility of the Funds' management. Our responsibility is to express an opinion on these financial statements and financial highlights based on our audits.
We conducted our audits in accordance with the standards of the Public Company Accounting Oversight Board (United States). Those standards require that we plan and perform the audit to obtain reasonable assurance about whether the financial statements and financial highlights are free of material misstatement. The Funds are not required to have, nor were we engaged to perform, an audit of their internal control over financial reporting. Our audits included consideration of internal control over financial reporting as a basis for designing audit procedures that are appropriate in the circumstances, but not for the purpose of expressing an opinion on the effectiveness of the Funds' internal control over financial reporting. Accordingly, we express no such opinion. An audit also includes examining, on a test basis, evidence supporting the amounts and disclosures in the financial statements, assessing the accounting principles used and significant estimates made by management, as well as evaluating the overall financial statement presentation. Our procedures included confirmation of securities owned as of January 31, 2017, by correspondence with the custodians and brokers; when replies were not received from brokers, we performed other auditing procedures. We believe that our audits provide a reasonable basis for our opinion.
In our opinion, such financial statements and financial highlights referred to above present fairly, in all material respects, the financial position of Fidelity Series All-Sector Equity Fund and Fidelity Series Equity-Income Fund as of January 31, 2017, the results of their operations for the year then ended, the changes in their net assets for each of the two years in the period then ended, and the financial highlights for the periods presented, in conformity with accounting principles generally accepted in the United States of America.
DELOITTE & TOUCHE LLP
Boston, Massachusetts
March 20, 2017
Report of Independent Registered Public Accounting Firm
To the Trustees of Fidelity Devonshire Trust and the Shareholders of Fidelity Series Stock Selector Large Cap Value Fund:
In our opinion, the accompanying statement of assets and liabilities, including the schedule of investments, and the related statements of operations and of changes in net assets and the financial highlights present fairly, in all material respects, the financial position of Fidelity Series Stock Selector Large Cap Value Fund (a fund of Fidelity Devonshire Trust) as of January 31, 2017, the results of its operations for the year then ended, the changes in its net assets for each of the two years in the period then ended and the financial highlights for each of the periods indicated, in conformity with accounting principles generally accepted in the United States of America. These financial statements and financial highlights (hereafter referred to as “financial statements”) are the responsibility of the Fidelity Series Stock Selector Large Cap Value Fund’s management. Our responsibility is to express an opinion on these financial statements based on our audits. We conducted our audits of these financial statements in accordance with the standards of the Public Company Accounting Oversight Board (United States). Those standards require that we plan and perform the audit to obtain reasonable assurance about whether the financial statements are free of material misstatement. An audit includes examining, on a test basis, evidence supporting the amounts and disclosures in the financial statements, assessing the accounting principles used and significant estimates made by management, and evaluating the overall financial statement presentation. We believe that our audits, which included confirmation of securities as of January 31, 2017 by correspondence with the custodian and brokers, provide a reasonable basis for our opinion.
PricewaterhouseCoopers LLP
Boston, Massachusetts
March 20, 2017
Trustees and Officers
The Trustees, Members of the Advisory Board (if any), and officers of the trust and funds, as applicable, are listed below. The Board of Trustees governs each fund and is responsible for protecting the interests of shareholders. The Trustees are experienced executives who meet periodically throughout the year to oversee each fund's activities, review contractual arrangements with companies that provide services to each fund, oversee management of the risks associated with such activities and contractual arrangements, and review each fund's performance. Each of the Trustees oversees 169 funds.
The Trustees hold office without limit in time except that (a) any Trustee may resign; (b) any Trustee may be removed by written instrument, signed by at least two-thirds of the number of Trustees prior to such removal; (c) any Trustee who requests to be retired or who has become incapacitated by illness or injury may be retired by written instrument signed by a majority of the other Trustees; and (d) any Trustee may be removed at any special meeting of shareholders by a two-thirds vote of the outstanding voting securities of the trust. Each Trustee who is not an interested person (as defined in the 1940 Act) of the trust and the funds is referred to herein as an Independent Trustee. Each Independent Trustee shall retire not later than the last day of the calendar year in which his or her 75th birthday occurs. The Independent Trustees may waive this mandatory retirement age policy with respect to individual Trustees. Officers and Advisory Board Members hold office without limit in time, except that any officer or Advisory Board Member may resign or may be removed by a vote of a majority of the Trustees at any regular meeting or any special meeting of the Trustees. Except as indicated, each individual has held the office shown or other offices in the same company for the past five years.
Each fund’s Statement of Additional Information (SAI) includes more information about the Trustees. To request a free copy, call Fidelity at 1-800-544-8544 for Fidelity® Series All-Sector Equity Fund, Fidelity® Series Equity-Income Fund, and Fidelity® Series Stock Selector Large Cap Value Fund or 1-800-835-5092 for Class F.
Experience, Skills, Attributes, and Qualifications of the Trustees. The Governance and Nominating Committee has adopted a statement of policy that describes the experience, qualifications, attributes, and skills that are necessary and desirable for potential Independent Trustee candidates (Statement of Policy). The Board believes that each Trustee satisfied at the time he or she was initially elected or appointed a Trustee, and continues to satisfy, the standards contemplated by the Statement of Policy. The Governance and Nominating Committee also engages professional search firms to help identify potential Independent Trustee candidates who have the experience, qualifications, attributes, and skills consistent with the Statement of Policy. From time to time, additional criteria based on the composition and skills of the current Independent Trustees, as well as experience or skills that may be appropriate in light of future changes to board composition, business conditions, and regulatory or other developments, have also been considered by the professional search firms and the Governance and Nominating Committee. In addition, the Board takes into account the Trustees' commitment and participation in Board and committee meetings, as well as their leadership of standing and ad hoc committees throughout their tenure.
In determining that a particular Trustee was and continues to be qualified to serve as a Trustee, the Board has considered a variety of criteria, none of which, in isolation, was controlling. The Board believes that, collectively, the Trustees have balanced and diverse experience, qualifications, attributes, and skills, which allow the Board to operate effectively in governing each fund and protecting the interests of shareholders. Information about the specific experience, skills, attributes, and qualifications of each Trustee, which in each case led to the Board's conclusion that the Trustee should serve (or continue to serve) as a trustee of the funds, is provided below.
Board Structure and Oversight Function. James C. Curvey is an interested person and currently serves as Chairman. The Trustees have determined that an interested Chairman is appropriate and benefits shareholders because an interested Chairman has a personal and professional stake in the quality and continuity of services provided to the funds. Independent Trustees exercise their informed business judgment to appoint an individual of their choosing to serve as Chairman, regardless of whether the Trustee happens to be independent or a member of management. The Independent Trustees have determined that they can act independently and effectively without having an Independent Trustee serve as Chairman and that a key structural component for assuring that they are in a position to do so is for the Independent Trustees to constitute a substantial majority for the Board. The Independent Trustees also regularly meet in executive session. Ned C. Lautenbach serves as Chairman of the Independent Trustees and as such (i) acts as a liaison between the Independent Trustees and management with respect to matters important to the Independent Trustees and (ii) with management prepares agendas for Board meetings.
Fidelity® funds are overseen by different Boards of Trustees. The funds' Board oversees Fidelity's high income and certain equity funds, and other Boards oversee Fidelity's investment-grade bond, money market, asset allocation, and sector funds. The asset allocation funds may invest in Fidelity® funds overseen by the funds' Board. The use of separate Boards, each with its own committee structure, allows the Trustees of each group of Fidelity® funds to focus on the unique issues of the funds they oversee, including common research, investment, and operational issues. On occasion, the separate Boards establish joint committees to address issues of overlapping consequences for the Fidelity® funds overseen by each Board.
The Trustees operate using a system of committees to facilitate the timely and efficient consideration of all matters of importance to the Trustees, each fund, and fund shareholders and to facilitate compliance with legal and regulatory requirements and oversight of the funds' activities and associated risks. The Board, acting through its committees, has charged FMR and its affiliates with (i) identifying events or circumstances the occurrence of which could have demonstrably adverse effects on the funds' business and/or reputation; (ii) implementing processes and controls to lessen the possibility that such events or circumstances occur or to mitigate the effects of such events or circumstances if they do occur; and (iii) creating and maintaining a system designed to evaluate continuously business and market conditions in order to facilitate the identification and implementation processes described in (i) and (ii) above. Because the day-to-day operations and activities of the funds are carried out by or through FMR, its affiliates, and other service providers, the funds' exposure to risks is mitigated but not eliminated by the processes overseen by the Trustees. While each of the Board's committees has responsibility for overseeing different aspects of the funds' activities, oversight is exercised primarily through the Operations, Audit, and Compliance Committees. In addition, the Independent Trustees have worked with FMR to enhance the Board's oversight of investment and financial risks, legal and regulatory risks, technology risks, and operational risks, including the development of additional risk reporting to the Board. For example, a working group comprised of Independent Trustees and FMR has worked and continues to work to review the Fidelity® funds' valuation-related activities, reporting and risk management. Appropriate personnel, including but not limited to the funds' Chief Compliance Officer (CCO), FMR's internal auditor, the independent accountants, the funds' Treasurer and portfolio management personnel, make periodic reports to the Board's committees, as appropriate, including an annual review of Fidelity's risk management program for the Fidelity® funds. The responsibilities of each standing committee, including their oversight responsibilities, are described further under "Standing Committees of the Trustees."
Interested Trustees*:
Correspondence intended for a Trustee who is an interested person may be sent to Fidelity Investments, 245 Summer Street, Boston, Massachusetts 02210.
Name, Year of Birth; Principal Occupations and Other Relevant Experience+
James C. Curvey (1935)
Year of Election or Appointment: 2007
Trustee
Chairman of the Board of Trustees
Mr. Curvey also serves as Trustee of other Fidelity® funds. Mr. Curvey is a Director of Fidelity Research & Analysis Co. (investment adviser firm, 2009-present), and Vice Chairman (2007-present) and Director of FMR LLC (diversified financial services company). In addition, Mr. Curvey serves as an Overseer for the Boston Symphony Orchestra and a member of the board of Artis-Naples, Naples, Florida, and as a Trustee for Brewster Academy, Wolfeboro, New Hampshire. Previously, Mr. Curvey served as a Director of Fidelity Investments Money Management, Inc. (investment adviser firm, 2009-2014) and a Director of FMR and FMR Co., Inc. (investment adviser firms, 2007-2014).
Charles S. Morrison (1960)
Year of Election or Appointment: 2014
Trustee
Mr. Morrison also serves as Trustee of other funds. He serves as President of Fidelity Management & Research Company (FMR) (investment adviser firm, 2016-present), a Director of Fidelity Investments Money Management, Inc. (FIMM) (investment adviser firm, 2014-present), Director of Fidelity SelectCo, LLC (investment adviser firm, 2014-present), President, Asset Management (2014-present), and is an employee of Fidelity Investments. Previously, Mr. Morrison served as Vice President of Fidelity's Fixed Income and Asset Allocation Funds (2012-2014), President, Fixed Income (2011-2014), Vice President of Fidelity's Money Market Funds (2005-2009), President, Money Market Group Leader of FMR (investment adviser firm, 2009), and Senior Vice President, Money Market Group of FMR (2004-2009). Mr. Morrison also served as Vice President of Fidelity's Bond Funds (2002-2005), certain Balanced Funds (2002-2005), and certain Asset Allocation Funds (2002-2007), and as Senior Vice President (2002-2005) of Fidelity's Bond Division.
* Determined to be an “Interested Trustee” by virtue of, among other things, his or her affiliation with the trust or various entities under common control with FMR.
+ The information includes the Trustee's principal occupation during the last five years and other information relating to the experience, attributes, and skills relevant to the Trustee's qualifications to serve as a Trustee, which led to the conclusion that the Trustee should serve as a Trustee for each fund.
Independent Trustees:
Correspondence intended for an Independent Trustee may be sent to Fidelity Investments, P.O. Box 55235, Boston, Massachusetts 02205-5235.
Name, Year of Birth; Principal Occupations and Other Relevant Experience+
Dennis J. Dirks (1948)
Year of Election or Appointment: 2005
Trustee
Mr. Dirks also serves as Trustee of other Fidelity® funds. Prior to his retirement in May 2003, Mr. Dirks was Chief Operating Officer and a member of the Board of The Depository Trust & Clearing Corporation (DTCC). He also served as President, Chief Operating Officer, and Board member of The Depository Trust Company (DTC) and President and Board member of the National Securities Clearing Corporation (NSCC). In addition, Mr. Dirks served as Chief Executive Officer and Board member of the Government Securities Clearing Corporation, Chief Executive Officer and Board member of the Mortgage-Backed Securities Clearing Corporation, as a Trustee and a member of the Finance Committee of Manhattan College (2005-2008), as a Trustee and a member of the Finance Committee of AHRC of Nassau County (2006-2008), and as a member of the Independent Directors Council (IDC) Governing Council (2010-2015). Mr. Dirks is a member of the Board of Directors for The Brookville Center for Children's Services, Inc. (2009-present) and the Finance Committee of the Asolo Repertory Theatre (2016-present).
Alan J. Lacy (1953)
Year of Election or Appointment: 2008
Trustee
Mr. Lacy also serves as Trustee of other Fidelity® funds. Mr. Lacy serves as Chairman (2014-present) and a member (2010-present) of the Board of Directors of Dave & Buster's Entertainment, Inc. (restaurant and entertainment complexes) and a Director of Bristol-Myers Squibb Company (global pharmaceuticals, 2008-present). He is a Trustee of the California Chapter of The Nature Conservancy (2015-present) and a Director of the Center for Advanced Study in the Behavioral Sciences at Stanford University (2015-present). In addition, Mr. Lacy served as Senior Adviser (2007-2014) of Oak Hill Capital Partners, L.P. (private equity) and also served as Chief Executive Officer (2005) and Vice Chairman (2005-2006) of Sears Holdings Corporation (retail) and Chief Executive Officer and Chairman of the Board of Sears, Roebuck and Co. (retail, 2000-2005). Previously, Mr. Lacy served as Chairman (2008-2011) and a member (2006-2015) of the Board of Trustees of the National Parks Conservation Association and as a member of the Board of Directors for The Western Union Company (global money transfer, 2006-2011), The Hillman Companies, Inc. (hardware wholesalers, 2010-2014), and Earth Fare, Inc. (retail grocery, 2010-2014).
Ned C. Lautenbach (1944)
Year of Election or Appointment: 2000
Trustee
Chairman of the Independent Trustees
Mr. Lautenbach also serves as Trustee of other Fidelity® funds. Mr. Lautenbach currently serves as the Lead Director of the Eaton Corporation Board of Directors (diversified industrial, 1997-present). Mr. Lautenbach is Chairman of the Board of Directors of Artis-Naples in Naples, Florida (2012-present), a member of the Council on Foreign Relations (1994-present), and currently Vice Chair of the Board of Governors, State University System of Florida (2013-present). Previously, Mr. Lautenbach was a Partner and Advisory Partner at Clayton, Dubilier & Rice, LLC (private equity investment, 1998-2010), as well as a Director of Sony Corporation (2006-2007). Mr. Lautenbach also had a 30-year career with IBM (technology company) during which time he served as Senior Vice President and a member of the Corporate Executive Committee (1968-1998).
Joseph Mauriello (1944)
Year of Election or Appointment: 2008
Trustee
Mr. Mauriello also serves as Trustee of other Fidelity® funds. Prior to his retirement in January 2006, Mr. Mauriello served in numerous senior management positions including Deputy Chairman and Chief Operating Officer (2004-2005), and Vice Chairman of Financial Services (2002-2004) of KPMG LLP US (professional services, 1965-2005). Mr. Mauriello currently serves as a member of the Board of Directors of XL Group plc. (global insurance and re-insurance, 2006-present) and the Independent Directors Council (IDC) Governing Council (2015-present). Previously, Mr. Mauriello served as a Director of the Hamilton Funds of the Bank of New York (2006-2007) and of Arcadia Resources Inc. (health care services and products, 2007-2012).
Robert W. Selander (1950)
Year of Election or Appointment: 2011
Trustee
Mr. Selander also serves as Trustee of other Fidelity® funds. Mr. Selander serves as a Director of The Western Union Company (global money transfer, 2014-present) and a non-executive Chairman of Health Equity, Inc. (health savings custodian, 2015-present). Previously, Mr. Selander served as a Member of the Advisory Board of certain Fidelity® funds (2011), and Executive Vice Chairman (2010), Chief Executive Officer (2009-2010), and President and Chief Executive Officer (1997-2009) of Mastercard, Inc.
Cornelia M. Small (1944)
Year of Election or Appointment: 2005
Trustee
Ms. Small also serves as Trustee of other Fidelity® funds. Ms. Small is a member of the Board of Directors (2009-present) and Chair of the Investment Committee (2010-present) of the Teagle Foundation. Ms. Small also serves on the Investment Committee of the Berkshire Taconic Community Foundation (2008-present). Previously, Ms. Small served as Chairperson (2002-2008) and a member of the Investment Committee and Chairperson (2008-2012) and a member of the Board of Trustees of Smith College. In addition, Ms. Small served as Chief Investment Officer, Director of Global Equity Investments, and a member of the Board of Directors of Scudder, Stevens & Clark and Scudder Kemper Investments.
William S. Stavropoulos (1939)
Year of Election or Appointment: 2002
Trustee
Vice Chairman of the Independent Trustees
Mr. Stavropoulos also serves as Trustee of other Fidelity® funds. Mr. Stavropoulos serves as President and Founder of the Michigan Baseball Foundation, the Great Lakes Loons (2007-present). Mr. Stavropoulos is Chairman Emeritus of the Board of Directors of The Dow Chemical Company, where he previously served in numerous senior management positions, including President, CEO (1995-2000; 2002-2004), Chairman of the Executive Committee (2000-2006), and as a member of the Board of Directors (1990-2006). Currently, Mr. Stavropoulos is Chairman of the Board of Directors of Univar Inc. (global distributor of commodity and specialty chemicals), a Director of Teradata Corporation (data warehousing and technology solutions), and a member of the Advisory Board for Metalmark Capital LLC (private equity investment, 2005-present). Mr. Stavropoulos is an operating advisor to Clayton, Dubilier & Rice, LLC (private equity investment). In addition, Mr. Stavropoulos is a member of the University of Notre Dame Advisory Council for the College of Science, a Trustee of the Rollin L. Gerstacker Foundation, and a Director of Artis-Naples in Naples, Florida. Previously, Mr. Stavropoulos served as a Director of Chemical Financial Corporation (bank holding company, 1993-2012) and Tyco International, Ltd. (multinational manufacturing and services, 2007-2012).
David M. Thomas (1949)
Year of Election or Appointment: 2008
Trustee
Mr. Thomas also serves as Trustee of other Fidelity® funds. Mr. Thomas serves as Non-Executive Chairman of the Board of Directors of Fortune Brands Home and Security (home and security products, 2011-present), as a member of the Board of Directors (2004-present) and Presiding Director (2013-present) of Interpublic Group of Companies, Inc. (marketing communication), and as a member of the Board of Trustees of the University of Florida (2013-present). Previously, Mr. Thomas served as Executive Chairman (2005-2006) and Chairman and Chief Executive Officer (2000-2005) of IMS Health, Inc. (pharmaceutical and healthcare information solutions), and a Director of Fortune Brands, Inc. (consumer products, 2000-2011).
+ The information includes the Trustee's principal occupation during the last five years and other information relating to the experience, attributes, and skills relevant to the Trustee's qualifications to serve as a Trustee, which led to the conclusion that the Trustee should serve as a Trustee for each fund.
Advisory Board Members and Officers:
Correspondence intended for an officer or Peter S. Lynch may be sent to Fidelity Investments, 245 Summer Street, Boston, Massachusetts 02210. Officers appear below in alphabetical order.
Name, Year of Birth; Principal Occupation
Peter S. Lynch (1944)
Year of Election or Appointment: 2003
Member of the Advisory Board
Mr. Lynch also serves as Member of the Advisory Board of other Fidelity® funds. Mr. Lynch is Vice Chairman and a Director of FMR (investment adviser firm) and FMR Co., Inc. (investment adviser firm). In addition, Mr. Lynch serves as a Trustee of Boston College and as the Chairman of the Inner-City Scholarship Fund. Previously, Mr. Lynch served on the Special Olympics International Board of Directors (1997-2006).
Elizabeth Paige Baumann (1968)
Year of Election or Appointment: 2017
Interim Anti-Money Laundering (AML) Officer
Ms. Baumann also serves as AML Officer of other funds. She is Chief AML Officer (2012-present) and Senior Vice President (2014-present) of FMR LLC (diversified financial services company) and is an employee of Fidelity Investments. Previously, Ms. Baumann served as AML Officer (2012-2016), Vice President (2007-2014), and Deputy Anti-Money Laundering Officer (2007-2012).
Marc R. Bryant (1966)
Year of Election or Appointment: 2015
Secretary and Chief Legal Officer (CLO)
Mr. Bryant also serves as Secretary and CLO of other funds. Mr. Bryant serves as CLO, Secretary, and Senior Vice President of Fidelity Management & Research Company (investment adviser firm, 2015-present) and FMR Co., Inc. (investment adviser firm, 2015-present); Secretary of Fidelity SelectCo, LLC (investment adviser firm, 2015-present) and Fidelity Investments Money Management, Inc. (investment adviser firm, 2015-present); and CLO of Fidelity Management & Research (Hong Kong) Limited and FMR Investment Management (UK) Limited (investment adviser firms, 2015-present) and Fidelity Management & Research (Japan) Limited (investment adviser firm, 2016-present). He is Senior Vice President and Deputy General Counsel of FMR LLC (diversified financial services company). Previously, Mr. Bryant served as Secretary and CLO of Fidelity Rutland Square Trust II (2010-2014) and Assistant Secretary of Fidelity's Fixed Income and Asset Allocation Funds (2013-2015). Prior to joining Fidelity Investments, Mr. Bryant served as a Senior Vice President and the Head of Global Retail Legal for AllianceBernstein L.P. (2006-2010), and as the General Counsel for ProFund Advisors LLC (2001-2006).
Jeffrey S. Christian (1961)
Year of Election or Appointment: 2016
Assistant Treasurer
Mr. Christian also serves as Assistant Treasurer of other funds. Mr. Christian is an employee of Fidelity Investments (2003-present).
William C. Coffey (1969)
Year of Election or Appointment: 2009
Assistant Secretary
Mr. Coffey also serves as Assistant Secretary of other funds. He is Senior Vice President and Deputy General Counsel of FMR LLC (diversified financial services company, 2010-present), and is an employee of Fidelity Investments. Previously, Mr. Coffey served as Vice President and Associate General Counsel of FMR LLC (2005-2009).
Jonathan Davis (1968)
Year of Election or Appointment: 2010
Assistant Treasurer
Mr. Davis also serves as Assistant Treasurer of other funds, and is an employee of Fidelity Investments. Previously, Mr. Davis served as Vice President and Associate General Counsel of FMR LLC (diversified financial services company, 2003-2010).
Adrien E. Deberghes (1967)
Year of Election or Appointment: 2016
Assistant Treasurer
Mr. Deberghes also serves as an officer of other funds. He serves as Executive Vice President of Fidelity Investments Money Management, Inc. (FIMM) (investment adviser firm, 2016-present) and is an employee of Fidelity Investments (2008-present). Prior to joining Fidelity Investments, Mr. Deberghes was Senior Vice President of Mutual Fund Administration at State Street Corporation (2007-2008), Senior Director of Mutual Fund Administration at Investors Bank & Trust (2005-2007), and Director of Finance for Dunkin' Brands (2000-2005). Previously, Mr. Deberghes served in other fund officer roles.
Stephanie J. Dorsey (1969)
Year of Election or Appointment: 2010
Assistant Treasurer
Ms. Dorsey also serves as an officer of other funds. She is an employee of Fidelity Investments (2008-present) and has served in other fund officer roles. Prior to joining Fidelity Investments, Ms. Dorsey served as Treasurer (2004-2008) of the JPMorgan Mutual Funds and Vice President (2004-2008) of JPMorgan Chase Bank.
Howard J. Galligan III (1966)
Year of Election or Appointment: 2014
Chief Financial Officer
Mr. Galligan also serves as Chief Financial Officer of other funds. Mr. Galligan serves as President of Fidelity Pricing and Cash Management Services (FPCMS) (2014-present) and as a Director of Strategic Advisers, Inc. (investment adviser firm, 2008-present). Previously, Mr. Galligan served as Chief Administrative Officer of Asset Management (2011-2014) and Chief Operating Officer and Senior Vice President of Investment Support for Strategic Advisers, Inc. (2003-2011).
Scott C. Goebel (1968)
Year of Election or Appointment: 2015
Vice President
Mr. Goebel serves as Vice President of other funds and is an employee of Fidelity Investments (2001-present). Previously, Mr. Goebel served as Senior Vice President of Fidelity Management & Research Company (FMR) (investment adviser firm, 2016), Secretary of Fidelity SelectCo, LLC (investment adviser firm, 2013-2015), Fidelity Investments Money Management, Inc. (FIMM) (investment adviser firm, 2010-2015), and Fidelity Research and Analysis Company (FRAC) (investment adviser firm, 2010-2015); General Counsel, Secretary, and Senior Vice President of FMR (investment adviser firm, 2008-2015) and FMR Co., Inc. (investment adviser firm, 2008-2015); Assistant Secretary of Fidelity Management & Research (Japan) Limited (investment adviser firm, 2008-2015) and Fidelity Management & Research (U.K.) Inc. (investment adviser firm, 2008-2015); Chief Legal Officer (CLO) of Fidelity Management & Research (Hong Kong) Limited (investment adviser firm, 2008-2015); Secretary and CLO of certain Fidelity® funds (2008-2015); Assistant Secretary of FIMM (2008-2010), FRAC (2008-2010), and certain funds (2007-2008); and as Vice President and Secretary of Fidelity Distributors Corporation (FDC) (2005-2007).
Thomas C. Hense (1964)
Year of Election or Appointment: 2008, 2010, or 2015
Vice President
Mr. Hense serves as Vice President of Fidelity Advisor® Multi-Asset Income Fund (2015) and other funds (High Income (2008), Small Cap (2008), and Value (2010) funds), and is an employee of Fidelity Investments (1993-present). Previously, Mr. Hense served as a portfolio manager for Fidelity's Institutional Money Management Group (Pyramis) (2003-2008).
Brian B. Hogan (1964)
Year of Election or Appointment: 2009
Vice President
Mr. Hogan also serves as Trustee or Vice President of other funds. Mr. Hogan serves as a Director of FMR Investment Management (UK) Limited (investment adviser firm, 2015-present) and Fidelity SelectCo, LLC (investment adviser firm, 2014-present) and President of the Equity Division of FMR (investment adviser firm, 2009-present). Previously, Mr. Hogan served as Senior Vice President, Equity Research of FMR (2006-2009) and as a portfolio manager. Mr. Brian B. Hogan is not related to Mr. Colm A. Hogan.
Colm A. Hogan (1973)
Year of Election or Appointment: 2016
Deputy Treasurer
Mr. Hogan also serves as an officer of other funds. Mr. Hogan is an employee of Fidelity Investments (2005-present). Mr. Colm A. Hogan is not related to Mr. Brian B. Hogan.
Chris Maher (1972)
Year of Election or Appointment: 2013
Assistant Treasurer
Mr. Maher serves as Assistant Treasurer of other funds. Mr. Maher is Vice President of Valuation Oversight and is an employee of Fidelity Investments. Previously, Mr. Maher served as Vice President of Asset Management Compliance (2013), Vice President of the Program Management Group of FMR (investment adviser firm, 2010-2013), and Vice President of Valuation Oversight (2008-2010).
Melissa M. Reilly (1971)
Year of Election or Appointment: 2014
Vice President of certain Equity Funds
Ms. Reilly also serves as Vice President of other funds. Ms. Reilly is an employee of Fidelity Investments (2004-present).
Kenneth B. Robins (1969)
Year of Election or Appointment: 2016
Chief Compliance Officer
Mr. Robins also serves as an officer of other funds. Mr. Robins serves as Compliance Officer of Fidelity Management & Research Company and FMR Co., Inc. (investment adviser firms, 2016-present) and is an employee of Fidelity Investments (2004-present). Previously, Mr. Robins served as Executive Vice President of Fidelity Investments Money Management, Inc. (investment adviser firm, 2013-2016) and served in other fund officer roles.
Stacie M. Smith (1974)
Year of Election or Appointment: 2016
President and Treasurer
Ms. Smith also serves as an officer of other funds. She is an employee of Fidelity Investments (2009-present) and has served in other fund officer roles. Prior to joining Fidelity Investments, Ms. Smith served as Senior Audit Manager of Ernst & Young LLP (accounting firm, 1996-2009). Previously, Ms. Smith served as Deputy Treasurer of certain Fidelity® funds (2013-2016).
Marc L. Spector (1972)
Year of Election or Appointment: 2016
Assistant Treasurer
Mr. Spector also serves as an officer of other funds. Mr. Spector is an employee of Fidelity Investments (2016-present). Prior to joining Fidelity Investments, Mr. Spector served as Director at the Siegfried Group (accounting firm, 2013-2016), and prior to Siegfried Group as audit senior manager at Deloitte & Touche (accounting firm, 2005-2013).
Renee Stagnone (1975)
Year of Election or Appointment: 2016
Assistant Treasurer
Ms. Stagnone also serves as an officer of other funds. Ms. Stagnone is an employee of Fidelity Investments (1997-present). Previously, Ms. Stagnone served as Deputy Treasurer of certain Fidelity® funds (2013-2016).
Shareholder Expense Example
As a shareholder of the Fund, you incur two types of costs: (1) transaction costs and (2) ongoing costs, including management fees and other Fund expenses. This Example is intended to help you understand your ongoing costs (in dollars) of investing in the Fund and to compare these costs with the ongoing costs of investing in other mutual funds.
The Example is based on an investment of $1,000 invested at the beginning of the period and held for the entire period (August 1, 2016 to January 31, 2017).
Actual Expenses
The first line of the accompanying table for each class of the Fund provides information about actual account values and actual expenses. You may use the information in this line, together with the amount you invested, to estimate the expenses that you paid over the period. Simply divide your account value by $1,000.00 (for example, an $8,600 account value divided by $1,000.00 = 8.6), then multiply the result by the number in the first line for a class of the Fund under the heading entitled "Expenses Paid During Period" to estimate the expenses you paid on your account during this period. In addition, the Fund, as a shareholder in the underlying Fidelity Central Funds, will indirectly bear its pro-rata share of the fees and expenses incurred by the underlying Fidelity Central Funds. These fees and expenses are not included in the Fund's annualized expense ratio used to calculate the expense estimate in the table below.
Hypothetical Example for Comparison Purposes
The second line of the accompanying table for each class of the Fund provides information about hypothetical account values and hypothetical expenses based on a Class' actual expense ratio and an assumed rate of return of 5% per year before expenses, which is not the Class' actual return. The hypothetical account values and expenses may not be used to estimate the actual ending account balance or expenses you paid for the period. You may use this information to compare the ongoing costs of investing in the Fund and other funds. To do so, compare this 5% hypothetical example with the 5% hypothetical examples that appear in the shareholder reports of the other funds. In addition, the Fund, as a shareholder in the underlying Fidelity Central Funds, will indirectly bear its pro-rata share of the fees and expenses incurred by the underlying Fidelity Central Funds. These fees and expenses are not included in the Fund's annualized expense ratio used to calculate the expense estimate in the table below.
Please note that the expenses shown in the table are meant to highlight your ongoing costs only and do not reflect any transaction costs. Therefore, the second line of the table is useful in comparing ongoing costs only, and will not help you determine the relative total costs of owning different funds.
| | Annualized Expense RatioA | Beginning
Account Value
August 1, 2016 | Ending
Account Value
January 31, 2017 | Expenses Paid
During Period-B
August 1, 2016
to January 31, 2017 |
| Fidelity Series All-Sector Equity Fund | | | | |
| Series All-Sector Equity | .63% | | | |
| Actual | | $1,000.00 | $1,066.90 | $3.27 |
| Hypothetical-C | | $1,000.00 | $1,021.97 | $3.20 |
| Class F | .48% | | | |
| Actual | | $1,000.00 | $1,066.80 | $2.49 |
| Hypothetical-C | | $1,000.00 | $1,022.72 | $2.44 |
| Fidelity Series Equity-Income Fund | | | | |
| Series Equity-Income | .62% | | | |
| Actual | | $1,000.00 | $1,090.20 | $3.26 |
| Hypothetical-C | | $1,000.00 | $1,022.02 | $3.15 |
| Class F | .46% | | | |
| Actual | | $1,000.00 | $1,091.00 | $2.42 |
| Hypothetical-C | | $1,000.00 | $1,022.82 | $2.34 |
| Fidelity Series Stock Selector Large Cap Value Fund | | | | |
| Series Stock Selector Large Cap Value | .66% | | | |
| Actual | | $1,000.00 | $1,080.40 | $3.45 |
| Hypothetical-C | | $1,000.00 | $1,021.82 | $3.35 |
| Class F | .50% | | | |
| Actual | | $1,000.00 | $1,080.80 | $2.62 |
| Hypothetical-C | | $1,000.00 | $1,022.62 | $2.54 |
| | | | | |
| | | | | |
| | | | | |
A Annualized expense ratio reflects expenses net of applicable fee waivers.
B Expenses are equal to each Class' annualized expense ratio, multiplied by the average account value over the period, multiplied by 184/ 366 (to reflect the one-half year period).
C 5% return per year before expenses
Distributions (Unaudited)
The Board of Trustees of each fund voted to pay to shareholders of record at the opening of business on record date, the following distributions per share derived from capital gains realized from sales of portfolio securities and dividends derived from net investment income:
| | Pay Date | Record Date | Dividends | Capital Gains |
| Fidelity Series All-Sector Equity Fund | | | | |
| Series All-Sector Equity | 03/13/17 | 03/10/17 | $0.001 | $0.427 |
| Class F | 03/13/17 | 03/10/17 | $0.003 | $0.427 |
| Fidelity Series Equity-Income Fund | | | | |
| Series Equity-Income | 03/13/17 | 03/10/17 | $0.000 | $0.129 |
| Class F | 03/13/17 | 03/10/17 | $0.000 | $0.131 |
| Fidelity Series Stock Selector Large Cap Value Fund | | | | |
| Series Stock Selector Large Cap Value | 03/13/17 | 03/10/17 | $0.007 | $0.039 |
| Class F | 03/13/17 | 03/10/17 | $0.009 | $0.039 |
|
The funds hereby designate as capital gain dividend the amounts noted below for the taxable year ended January 31, 2017, or, if subsequently determined to be different, the net capital gain of such year.
| Fidelity Series All-Sector Equity Fund | $927,060,214 |
| Fidelity Series Equity-Income Fund | $181,969,159 |
| Fidelity Series Stock Selector Large Cap Value Fund | $30,845,071 |
|
A percentage of the dividends distributed during the fiscal year for the following funds were derived from interest on U.S. Government securities which is generally exempt from state income tax:
| Fidelity Series Equity-Income Fund | |
| Series Equity-Income | 0.17% |
| Class F | 0.17% |
|
A percentage of the dividends distributed during the fiscal year for the following funds qualify for the dividends–received deduction for corporate shareholders:
| | April
2016 | July
2016 | October
2016 | December
2016 |
| Fidelity Series All-Sector Equity Fund | | | | |
| Series All-Sector Equity | –% | –% | –% | 100% |
| Class F | –% | –% | –% | 100% |
| Fidelity Series Equity-Income Fund | | | | |
| Series Equity-Income | 100% | 100% | 100% | 99% |
| Class F | 94% | 94% | 94% | 95% |
| Fidelity Series Stock Selector Large Cap Value Fund | | | | |
| Series Stock Selector Large Cap Value | –% | –% | –% | 100% |
| Class F | –% | –% | –% | 100% |
|
A percentage of the dividends distributed during the fiscal year for the following funds may be taken into account as a dividend for purposes of the maximum rate under section 1(h)(11) of the Internal Revenue Code.
| | April
2016 | July
2016 | October
2016 | December
2016 |
| Fidelity Series All-Sector Equity Fund | | | | |
| Series All-Sector Equity | –% | –% | –% | 100% |
Class F
| –% | –% | –% | 100% |
| Fidelity Series Equity-Income Fund | | | | |
| Series Equity-Income | 100% | 100% | 100% | 100% |
| Class F | 100% | 100% | 100% | 100% |
| Fidelity Series Stock Selector Large Cap Value Fund | | | | |
| Series Stock Selector Large Cap Value | –% | –% | –% | 100% |
| Class F | –% | –% | –% | 100% |
|
The funds will notify shareholders in January 2018 of amounts for use in preparing 2017 income tax returns.
EDT-LDT-ANN-0317
1.956971.104
Fidelity® Equity-Income Fund Class K
Annual Report January 31, 2017 |
|
Contents
To view a fund's proxy voting guidelines and proxy voting record for the 12-month period ended June 30, visit http://www.fidelity.com/proxyvotingresults or visit the Securities and Exchange Commission's (SEC) web site at http://www.sec.gov.
You may also call 1-800-835-5092 to request a free copy of the proxy voting guidelines.
Standard & Poor's, S&P and S&P 500 are registered service marks of The McGraw-Hill Companies, Inc. and have been licensed for use by Fidelity Distributors Corporation.
Other third-party marks appearing herein are the property of their respective owners.
All other marks appearing herein are registered or unregistered trademarks or service marks of FMR LLC or an affiliated company. © 2017 FMR LLC. All rights reserved.
This report and the financial statements contained herein are submitted for the general information of the shareholders of the Fund. This report is not authorized for distribution to prospective investors in the Fund unless preceded or accompanied by an effective prospectus.
A fund files its complete schedule of portfolio holdings with the SEC for the first and third quarters of each fiscal year on Form N-Q. Forms N-Q are available on the SEC’s web site at http://www.sec.gov. A fund's Forms N-Q may be reviewed and copied at the SEC’s Public Reference Room in Washington, DC. Information regarding the operation of the SEC's Public Reference Room may be obtained by calling 1-800-SEC-0330.
For a complete list of a fund's portfolio holdings, view the most recent holdings listing, semiannual report, or annual report on Fidelity's web site at http://www.fidelity.com, http://www.institutional.fidelity.com, or http://www.401k.com, as applicable.
NOT FDIC INSURED •MAY LOSE VALUE •NO BANK GUARANTEE
Neither the Fund nor Fidelity Distributors Corporation is a bank.
Performance: The Bottom Line
Average annual total return reflects the change in the value of an investment, assuming reinvestment of distributions from dividend income and capital gains (the profits earned upon the sale of securities that have grown in value, if any) and assuming a constant rate of performance each year. The hypothetical investment and the average annual total returns do not reflect the deduction of taxes that a shareholder would pay on fund distributions or the redemption of fund shares. During periods of reimbursement by Fidelity, a fund’s total return will be greater than it would be had the reimbursement not occurred. How a fund did yesterday is no guarantee of how it will do tomorrow.
Average Annual Total Returns
| For the periods ended January 31, 2017 | Past 1 year | Past 5 years | Past 10 years |
| Class K | 24.56% | 12.53% | 4.55% |
The initial offering of Class K shares took place on May 9, 2008. Returns prior to May 9, 2008 are those of Fidelity® Equity-Income Fund, the original class of the fund.
$10,000 Over 10 Years
Let's say hypothetically that $10,000 was invested in Fidelity® Equity-Income Fund - Class K on January 31, 2007. The chart shows how the value of your investment would have changed, and also shows how the Russell 3000® Value Index performed over the same period. See above for additional information regarding the performance of Class K.

| Period Ending Values |
| $15,610 | Fidelity® Equity-Income Fund - Class K |
| $17,386 | Russell 3000® Value Index |
Management's Discussion of Fund Performance
Market Recap: The U.S. equity bellwether S&P 500
® index posted a 20.04% gain for the year ending January 31, 2017, rising sharply in the period’s final months on renewed optimism for economic growth. The beginning of the period saw improving investor sentiment amid U.S. job gains, a rally in energy and other stimuli that helped keep the seven-year bull uptrend intact. Markets tumbled briefly following the U.K.’s June 23 vote to exit the European Union (Brexit) – then recovered quickly and settled into a flattish stretch until the November 8 U.S. presidential election. Stocks then broke out in response to Donald Trump’s surprise victory, surging to a series of new all-time highs on expectations for reflation and fiscal stimulus. For the year, industrials (+28%), energy (+27%) and materials (+37%) all did well, the latter two driven by a cyclical rebound in commodity prices. Financials (+35%) also shined, riding an uptick in bond yields and the strong rally in banks (+41%), especially post-election. Information technology rose about 25%, despite cooling off in the fourth quarter of 2016. Conversely, real estate (+8%) lagged on the prospect for rising interest rates. An improved backdrop for riskier assets curbed dividend-rich telecommunication services (+13%), utilities (+12%) and consumer staples (+6%). Health care (+8%) underperformed amid an uncertain political and regulatory outlook.
Comments from Portfolio Manager James Morrow: For the year, the fund’s share classes gained roughly 24% to 25%, nearly keeping pace with the 25.76% advance of the benchmark Russell 3000
® Value Index. Relative to the benchmark, the fund was hurt by a higher-than-normal amount of cash. This reflected my caution about market volatility leading up to the election, which did not come to pass. Weak stock selection in health care also detracted, especially an out-of-benchmark stake in Israeli drug manufacturer Teva Pharmaceutical Industries. Teva’s multiple challenges this period included overpaying to acquire a competitor, falling earnings and unfavorable patent decisions. Another drug manufacturer that detracted from relative performance was GlaxoSmithKline, an out-of-benchmark stock hurt mostly by a weaker British pound. Elsewhere, the fund’s biggest individual detractor was CVS, a retail drug store chain that reported lighter-than-expected revenue in November. On the positive side, security selection in the energy sector helped performance – especially energy transportation companies Williams Partners, Energy Transfer Equity and Williams Companies, parent of Williams Partners and the only one of the three in the benchmark. Stock picking in financials, especially banks, also helped. JPMorgan Chase, the fund’s largest holding, was a notable contributor.
The views expressed above reflect those of the portfolio manager(s) only through the end of the period as stated on the cover of this report and do not necessarily represent the views of Fidelity or any other person in the Fidelity organization. Any such views are subject to change at any time based upon market or other conditions and Fidelity disclaims any responsibility to update such views. These views may not be relied on as investment advice and, because investment decisions for a Fidelity fund are based on numerous factors, may not be relied on as an indication of trading intent on behalf of any Fidelity fund.
Investment Summary (Unaudited)
Top Ten Stocks as of January 31, 2017
| | % of fund's net assets | % of fund's net assets 6 months ago |
| JPMorgan Chase & Co.(a) | 4.3 | 3.7 |
| Cisco Systems, Inc. | 3.3 | 2.6 |
| Procter & Gamble Co. | 2.8 | 2.5 |
| Johnson & Johnson | 2.6 | 2.8 |
| General Electric Co.(a) | 2.2 | 2.8 |
| Comcast Corp. Class A(a) | 2.1 | 1.0 |
| Verizon Communications, Inc. | 2.1 | 2.1 |
| Chubb Ltd. | 2.0 | 1.5 |
| The Blackstone Group LP | 1.9 | 1.5 |
| Exelon Corp. | 1.8 | 1.7 |
| | 25.1 | |
(a) Security or a portion of the security is pledged as collateral for call options written.
Top Five Market Sectors as of January 31, 2017
| | % of fund's net assets | % of fund's net assets 6 months ago |
| Financials | 24.7 | 23.8 |
| Energy | 10.9 | 11.8 |
| Information Technology | 9.7 | 11.3 |
| Health Care | 9.6 | 10.2 |
| Industrials | 9.5 | 10.9 |
Prior period industry classifications reflect the categories in place as of the date indicated and have not been adjusted to reflect current industry classifications.
Asset Allocation (% of fund's net assets)
| As of January 31, 2017*,** |
| | Stocks | 94.5% |
| | Convertible Securities | 0.4% |
| | Other Investments | 0.2% |
| | Short-Term Investments and Net Other Assets (Liabilities) | 4.9% |

* Foreign investments - 13.5%
** Written options - (0.1)%
| As of July 31, 2016*,** |
| | Stocks | 92.9% |
| | Bonds | 0.1% |
| | Convertible Securities | 0.6% |
| | Short-Term Investments and Net Other Assets (Liabilities) | 6.4% |

* Written options - (0.1)%
** Foreign investments - 12.1%
Investments January 31, 2017
Showing Percentage of Net Assets
| Common Stocks - 94.5% | | | |
| | | Shares | Value (000s) |
| CONSUMER DISCRETIONARY - 9.3% | | | |
| Auto Components - 0.2% | | | |
| Delphi Automotive PLC | | 240,400 | $16,842 |
| Automobiles - 1.9% | | | |
| Fiat Chrysler Automobiles NV | | 372,400 | 4,093 |
| Fiat Chrysler Automobiles NV | | 3,180,000 | 34,671 |
| General Motors Co. | | 3,312,900 | 121,285 |
| | | | 160,049 |
| Hotels, Restaurants & Leisure - 1.0% | | | |
| Dunkin' Brands Group, Inc. | | 1,261,600 | 65,439 |
| Whitbread PLC | | 381,261 | 18,825 |
| | | | 84,264 |
| Household Durables - 0.6% | | | |
| M.D.C. Holdings, Inc. | | 1,093,580 | 29,570 |
| Tupperware Brands Corp. | | 392,700 | 23,703 |
| | | | 53,273 |
| Leisure Products - 0.5% | | | |
| Mattel, Inc. | | 930,600 | 24,391 |
| Polaris Industries, Inc. (a) | | 242,600 | 20,395 |
| | | | 44,786 |
| Media - 3.5% | | | |
| Comcast Corp. Class A (b) | | 2,347,294 | 177,033 |
| Daiichikosho Co. Ltd. | | 736,000 | 29,235 |
| ITV PLC | | 5,871,300 | 15,009 |
| The Walt Disney Co. | | 239,900 | 26,545 |
| Time Warner, Inc. | | 451,600 | 43,737 |
| | | | 291,559 |
| Multiline Retail - 1.2% | | | |
| Kohl's Corp. | | 643,724 | 25,640 |
| Macy's, Inc. | | 949,200 | 28,039 |
| Target Corp. | | 735,009 | 47,393 |
| | | | 101,072 |
| Specialty Retail - 0.4% | | | |
| Bed Bath & Beyond, Inc. | | 90,600 | 3,656 |
| Foot Locker, Inc. | | 179,100 | 12,276 |
| GNC Holdings, Inc. | | 546,543 | 4,848 |
| Lewis Group Ltd. | | 2,117,300 | 6,419 |
| Stage Stores, Inc. (a) | | 890,500 | 2,493 |
| Williams-Sonoma, Inc. (a) | | 154,700 | 7,458 |
| | | | 37,150 |
|
| TOTAL CONSUMER DISCRETIONARY | | | 788,995 |
|
| CONSUMER STAPLES - 9.1% | | | |
| Beverages - 0.8% | | | |
| Molson Coors Brewing Co. Class B | | 227,295 | 21,939 |
| The Coca-Cola Co. | | 1,082,500 | 45,000 |
| | | | 66,939 |
| Food & Staples Retailing - 3.8% | | | |
| CVS Health Corp. | | 1,288,100 | 101,515 |
| Kroger Co. | | 282,300 | 9,587 |
| Rami Levi Chain Stores Hashikma Marketing 2006 Ltd. | | 189,404 | 7,698 |
| Wal-Mart Stores, Inc. | | 1,385,191 | 92,448 |
| Walgreens Boots Alliance, Inc. | | 1,082,020 | 88,661 |
| Whole Foods Market, Inc. | | 649,800 | 19,637 |
| | | | 319,546 |
| Food Products - 1.0% | | | |
| B&G Foods, Inc. Class A | | 793,367 | 35,186 |
| Hilton Food Group PLC | | 1,240,932 | 10,420 |
| Morinaga & Co. Ltd. | | 198,500 | 8,579 |
| The Hain Celestial Group, Inc. (c) | | 159,200 | 6,298 |
| The Hershey Co. (b) | | 190,600 | 20,103 |
| The J.M. Smucker Co. | | 64,000 | 8,694 |
| | | | 89,280 |
| Household Products - 3.1% | | | |
| Kimberly-Clark Corp. | | 209,200 | 25,340 |
| Procter & Gamble Co. | | 2,691,997 | 235,819 |
| | | | 261,159 |
| Personal Products - 0.2% | | | |
| Unilever NV (NY Reg.) | | 431,100 | 17,524 |
| Tobacco - 0.2% | | | |
| Reynolds American, Inc. | | 251,700 | 15,135 |
|
| TOTAL CONSUMER STAPLES | | | 769,583 |
|
| ENERGY - 10.6% | | | |
| Energy Equipment & Services - 1.0% | | | |
| Baker Hughes, Inc. (b) | | 391,200 | 24,677 |
| Halliburton Co. | | 454,300 | 25,700 |
| Oceaneering International, Inc. | | 115,400 | 3,214 |
| Schlumberger Ltd. | | 349,900 | 29,290 |
| | | | 82,881 |
| Oil, Gas & Consumable Fuels - 9.6% | | | |
| Anadarko Petroleum Corp. | | 598,432 | 41,609 |
| Apache Corp. | | 606,801 | 36,299 |
| Chevron Corp. (b) | | 992,472 | 110,512 |
| ConocoPhillips Co. | | 2,391,100 | 116,590 |
| CONSOL Energy, Inc. | | 624,634 | 10,581 |
| Energy Transfer Equity LP | | 147,200 | 2,642 |
| EQT Midstream Partners LP | | 19,800 | 1,550 |
| Golar LNG Ltd. | | 271,100 | 7,011 |
| Imperial Oil Ltd. | | 386,300 | 12,700 |
| Kinder Morgan, Inc. | | 2,421,600 | 54,099 |
| Legacy Reserves LP (c) | | 1,845,900 | 4,338 |
| MPLX LP | | 832,811 | 31,522 |
| Suncor Energy, Inc. | | 3,294,700 | 102,190 |
| The Williams Companies, Inc. | | 5,110,743 | 147,394 |
| Williams Partners LP | | 3,396,369 | 139,387 |
| | | | 818,424 |
|
| TOTAL ENERGY | | | 901,305 |
|
| FINANCIALS - 24.7% | | | |
| Banks - 13.5% | | | |
| Bank of America Corp. (b) | | 6,081,900 | 137,694 |
| Comerica, Inc. (b) | | 737,372 | 49,795 |
| Huntington Bancshares, Inc. | | 658,168 | 8,905 |
| JPMorgan Chase & Co. | | 4,311,782 | 364,907 |
| KeyCorp (b) | | 2,920,716 | 52,485 |
| Lakeland Financial Corp. | | 357,600 | 15,885 |
| Lloyds Banking Group PLC | | 12,478,000 | 10,234 |
| M&T Bank Corp. (b) | | 836,578 | 136,002 |
| Prosperity Bancshares, Inc. | | 28,600 | 2,077 |
| Regions Financial Corp. (b) | | 3,747,200 | 53,997 |
| Standard Chartered PLC (United Kingdom) (c) | | 1,432,566 | 13,951 |
| SunTrust Banks, Inc. (b) | | 1,183,600 | 67,252 |
| U.S. Bancorp | | 1,876,322 | 98,788 |
| Wells Fargo & Co. | | 2,368,350 | 133,409 |
| | | | 1,145,381 |
| Capital Markets - 6.3% | | | |
| Apollo Global Management LLC Class A | | 280,300 | 5,954 |
| Ares Capital Corp. | | 1,156,574 | 19,546 |
| Ares Management LP | | 266,715 | 5,241 |
| AURELIUS AG | | 258,470 | 16,281 |
| KKR & Co. LP | | 6,632,365 | 115,138 |
| Morgan Stanley (b) | | 1,671,131 | 71,006 |
| S&P Global, Inc. | | 127,300 | 15,299 |
| State Street Corp. | | 1,503,699 | 114,582 |
| The Blackstone Group LP | | 5,278,032 | 161,666 |
| TPG Specialty Lending, Inc. | | 372,293 | 6,802 |
| Virtu Financial, Inc. Class A | | 245,800 | 4,314 |
| | | | 535,829 |
| Consumer Finance - 0.2% | | | |
| Capital One Financial Corp. | | 191,600 | 16,744 |
| Insurance - 4.3% | | | |
| American International Group, Inc. | | 62,100 | 3,991 |
| Chubb Ltd. | | 1,300,000 | 170,937 |
| Marsh & McLennan Companies, Inc. (b) | | 325,700 | 22,154 |
| MetLife, Inc. | | 2,108,738 | 114,736 |
| Prudential Financial, Inc. | | 520,577 | 54,718 |
| | | | 366,536 |
| Mortgage Real Estate Investment Trusts - 0.2% | | | |
| Agnc Investment Corp. | | 214,063 | 3,997 |
| Two Harbors Investment Corp. | | 1,041,178 | 9,131 |
| | | | 13,128 |
| Thrifts & Mortgage Finance - 0.2% | | | |
| Radian Group, Inc. | | 844,727 | 15,543 |
|
| TOTAL FINANCIALS | | | 2,093,161 |
|
| HEALTH CARE - 9.5% | | | |
| Biotechnology - 1.3% | | | |
| Amgen, Inc. | | 364,500 | 57,110 |
| Gilead Sciences, Inc. | | 723,200 | 52,396 |
| | | | 109,506 |
| Health Care Equipment & Supplies - 2.1% | | | |
| Dentsply Sirona, Inc. | | 365,400 | 20,718 |
| Hoya Corp. | | 469,200 | 20,453 |
| Medtronic PLC | | 1,822,656 | 138,558 |
| | | | 179,729 |
| Health Care Providers & Services - 0.2% | | | |
| AmerisourceBergen Corp. | | 43,500 | 3,797 |
| Anthem, Inc. | | 29,900 | 4,609 |
| HealthSouth Corp. | | 3 | 0 |
| McKesson Corp. | | 48,500 | 6,749 |
| | | | 15,155 |
| Pharmaceuticals - 5.9% | | | |
| Astellas Pharma, Inc. | | 1,918,500 | 25,750 |
| Bristol-Myers Squibb Co. | | 375,000 | 18,435 |
| GlaxoSmithKline PLC | | 4,336,000 | 83,793 |
| Johnson & Johnson | | 1,991,248 | 225,509 |
| Merck & Co., Inc. | | 803,400 | 49,803 |
| Pfizer, Inc. | | 879,179 | 27,896 |
| Sanofi SA | | 291,332 | 23,416 |
| Teva Pharmaceutical Industries Ltd. sponsored ADR | | 1,526,000 | 51,014 |
| | | | 505,616 |
|
| TOTAL HEALTH CARE | | | 810,006 |
|
| INDUSTRIALS - 9.5% | | | |
| Aerospace & Defense - 3.1% | | | |
| General Dynamics Corp. (b) | | 406,500 | 73,609 |
| Raytheon Co. (b) | | 258,900 | 37,323 |
| The Boeing Co. | | 158,600 | 25,918 |
| United Technologies Corp. | | 1,124,420 | 123,315 |
| | | | 260,165 |
| Air Freight & Logistics - 2.0% | | | |
| C.H. Robinson Worldwide, Inc. | | 125,556 | 9,550 |
| PostNL NV (c) | | 6,587,500 | 28,829 |
| United Parcel Service, Inc. Class B | | 1,201,773 | 131,149 |
| | | | 169,528 |
| Airlines - 0.3% | | | |
| Allegiant Travel Co. | | 18,200 | 3,130 |
| Copa Holdings SA Class A | | 221,400 | 21,584 |
| | | | 24,714 |
| Commercial Services & Supplies - 0.7% | | | |
| KAR Auction Services, Inc. | | 1,100,200 | 50,114 |
| Mears Group PLC | | 198,400 | 1,265 |
| Waste Connection, Inc. (Canada) | | 116,297 | 9,327 |
| | | | 60,706 |
| Electrical Equipment - 0.8% | | | |
| AMETEK, Inc. (b) | | 162,200 | 8,288 |
| Eaton Corp. PLC | | 622,200 | 44,039 |
| Regal Beloit Corp. | | 189,800 | 13,779 |
| | | | 66,106 |
| Industrial Conglomerates - 2.5% | | | |
| General Electric Co. (b) | | 6,245,455 | 185,490 |
| Roper Technologies, Inc. | | 138,000 | 26,475 |
| | | | 211,965 |
| Machinery - 0.1% | | | |
| Allison Transmission Holdings, Inc. | | 243,700 | 8,525 |
|
| TOTAL INDUSTRIALS | | | 801,709 |
|
| INFORMATION TECHNOLOGY - 9.6% | | | |
| Communications Equipment - 3.3% | | | |
| Cisco Systems, Inc. | | 8,965,686 | 275,426 |
| Electronic Equipment & Components - 0.7% | | | |
| Dell Technologies, Inc. (c) | | 475,603 | 29,958 |
| TE Connectivity Ltd. | | 388,832 | 28,910 |
| | | | 58,868 |
| IT Services - 1.5% | | | |
| First Data Corp. Class A (c) | | 4,371,136 | 67,053 |
| Paychex, Inc. (b) | | 631,757 | 38,089 |
| Sabre Corp. | | 828,600 | 20,301 |
| | | | 125,443 |
| Semiconductors & Semiconductor Equipment - 1.5% | | | |
| KLA-Tencor Corp. | | 50,400 | 4,290 |
| Maxim Integrated Products, Inc. | | 709,900 | 31,576 |
| Qualcomm, Inc. | | 1,644,916 | 87,888 |
| | | | 123,754 |
| Software - 1.5% | | | |
| Micro Focus International PLC | | 1,788,200 | 48,253 |
| Microsoft Corp. | | 1,174,116 | 75,907 |
| SS&C Technologies Holdings, Inc. | | 207,000 | 6,651 |
| | | | 130,811 |
| Technology Hardware, Storage & Peripherals - 1.1% | | | |
| Apple, Inc. (b) | | 718,800 | 87,226 |
| Inventec Corp. | | 13,096,000 | 9,867 |
| | | | 97,093 |
|
| TOTAL INFORMATION TECHNOLOGY | | | 811,395 |
|
| MATERIALS - 1.8% | | | |
| Chemicals - 1.3% | | | |
| LyondellBasell Industries NV Class A | | 382,100 | 35,638 |
| Potash Corp. of Saskatchewan, Inc. | | 922,200 | 17,158 |
| The Dow Chemical Co. | | 924,700 | 55,140 |
| | | | 107,936 |
| Containers & Packaging - 0.5% | | | |
| WestRock Co. | | 781,900 | 41,722 |
| Metals & Mining - 0.0% | | | |
| Walter Energy Guc Trust | | 67 | 18 |
|
| TOTAL MATERIALS | | | 149,676 |
|
| REAL ESTATE - 2.0% | | | |
| Equity Real Estate Investment Trusts (REITs) - 2.0% | | | |
| American Tower Corp. | | 151,100 | 15,639 |
| Cousins Properties, Inc. | | 1,589,400 | 13,510 |
| Crown Castle International Corp. | | 408,500 | 35,879 |
| Duke Realty LP | | 709,700 | 17,267 |
| First Potomac Realty Trust | | 1,743,625 | 17,855 |
| Piedmont Office Realty Trust, Inc. Class A | | 970,000 | 21,068 |
| Public Storage | | 128,700 | 27,671 |
| Sabra Health Care REIT, Inc. | | 256,800 | 6,523 |
| Ventas, Inc. | | 236,203 | 14,567 |
| | | | 169,979 |
| TELECOMMUNICATION SERVICES - 3.7% | | | |
| Diversified Telecommunication Services - 3.6% | | | |
| AT&T, Inc. | | 2,963,089 | 124,924 |
| Verizon Communications, Inc. | | 3,599,960 | 176,434 |
| | | | 301,358 |
| Wireless Telecommunication Services - 0.1% | | | |
| KDDI Corp. | | 354,800 | 9,533 |
|
| TOTAL TELECOMMUNICATION SERVICES | | | 310,891 |
|
| UTILITIES - 4.7% | | | |
| Electric Utilities - 4.2% | | | |
| American Electric Power Co., Inc. | | 396,082 | 25,373 |
| Duke Energy Corp. | | 310,300 | 24,371 |
| Entergy Corp. | | 595,000 | 42,626 |
| Exelon Corp. | | 4,243,800 | 152,268 |
| PPL Corp. | | 1,563,700 | 54,479 |
| Southern Co. | | 818,777 | 40,472 |
| Xcel Energy, Inc. | | 413,500 | 17,086 |
| | | | 356,675 |
| Multi-Utilities - 0.5% | | | |
| CenterPoint Energy, Inc. | | 1,056,800 | 27,699 |
| Public Service Enterprise Group, Inc. | | 387,100 | 17,129 |
| | | | 44,828 |
|
| TOTAL UTILITIES | | | 401,503 |
|
| TOTAL COMMON STOCKS | | | |
| (Cost $6,521,714) | | | 8,008,203 |
|
| Convertible Preferred Stocks - 0.2% | | | |
| CONSUMER STAPLES - 0.0% | | | |
| Food Products - 0.0% | | | |
| Post Holdings, Inc. 5.25% (c) | | 7,700 | 1,117 |
| ENERGY - 0.0% | | | |
| Oil, Gas & Consumable Fuels - 0.0% | | | |
| Southwestern Energy Co. Series B 6.25% | | 98,800 | 2,186 |
| FINANCIALS - 0.0% | | | |
| Banks - 0.0% | | | |
| Wells Fargo & Co. 7.50% | | 2,300 | 2,762 |
| HEALTH CARE - 0.1% | | | |
| Health Care Providers & Services - 0.0% | | | |
| Envision Healthcare Corp. Series A 5.25% | | 10,400 | 1,307 |
| Pharmaceuticals - 0.1% | | | |
| Allergan PLC 5.50% | | 2,928 | 2,317 |
|
| TOTAL HEALTH CARE | | | 3,624 |
|
| TELECOMMUNICATION SERVICES - 0.0% | | | |
| Wireless Telecommunication Services - 0.0% | | | |
| T-Mobile U.S., Inc. Series A 5.50% | | 16,700 | 1,706 |
| UTILITIES - 0.1% | | | |
| Multi-Utilities - 0.1% | | | |
| CenterPoint Energy, Inc. 2.00% ZENS | | 41,400 | 2,880 |
| TOTAL CONVERTIBLE PREFERRED STOCKS | | | |
| (Cost $13,090) | | | 14,275 |
| | | Principal Amount (000s) | Value (000s) |
|
| Corporate Bonds - 0.2% | | | |
| Convertible Bonds - 0.2% | | | |
| CONSUMER DISCRETIONARY - 0.0% | | | |
| Media - 0.0% | | | |
| DISH Network Corp. 3.375% 8/15/26 (d) | | 2,980 | 3,481 |
| ENERGY - 0.1% | | | |
| Energy Equipment & Services - 0.0% | | | |
| Weatherford International Ltd. 5.875% 7/1/21 | | 1,200 | 1,343 |
| Oil, Gas & Consumable Fuels - 0.1% | | | |
| Amyris, Inc. 9.5% 4/15/19 pay-in-kind | | 2,626 | 1,402 |
| Chesapeake Energy Corp. 5.5% 9/15/26 (d) | | 1,630 | 1,737 |
| Scorpio Tankers, Inc. 2.375% 7/1/19 (d) | | 2,330 | 1,959 |
| | | | 5,098 |
| TOTAL ENERGY | | | 6,441 |
| INFORMATION TECHNOLOGY - 0.1% | | | |
| Communications Equipment - 0.0% | | | |
| InterDigital, Inc. 1.5% 3/1/20 | | 1,350 | 1,862 |
| Internet Software & Services - 0.1% | | | |
| Twitter, Inc. 1% 9/15/21 | | 4,955 | 4,518 |
| TOTAL INFORMATION TECHNOLOGY | | | 6,380 |
|
| TOTAL CONVERTIBLE BONDS | | | 16,302 |
|
| Nonconvertible Bonds - 0.0% | | | |
| FINANCIALS - 0.0% | | | |
| Thrifts & Mortgage Finance - 0.0% | | | |
| Prime Securities Services Borrower LLC/Prime Finance, Inc. 9.25% 5/15/23 (d) | | 2,585 | 2,801 |
| TOTAL CORPORATE BONDS | | | |
| (Cost $18,137) | | | 19,103 |
|
| Preferred Securities - 0.0% | | | |
| INDUSTRIALS - 0.0% | | | |
| Industrial Conglomerates - 0.0% | | | |
General Electric Co. 5%
(e)(f) | | | |
| (Cost $4,636) | | $4,410 | $4,615 |
| | | Shares | Value (000s) |
|
| Other - 0.2% | | | |
| Energy - 0.2% | | | |
| Oil, Gas & Consumable Fuels - 0.2% | | | |
| Utica Shale Drilling Program (non-operating revenue interest) (g)(h) | | | |
| (Cost $15,119) | | 15,119,286 | 15,119 |
|
| Money Market Funds - 5.4% | | | |
| Fidelity Cash Central Fund, 0.62% (i) | | 426,357,512 | 426,443 |
| Fidelity Securities Lending Cash Central Fund 0.65% (i)(j) | | 28,288,357 | 28,294 |
| TOTAL MONEY MARKET FUNDS | | | |
| (Cost $454,678) | | | 454,737 |
| TOTAL INVESTMENT PORTFOLIO - 100.5% | | | |
| (Cost $7,027,374) | | | 8,516,052 |
| NET OTHER ASSETS (LIABILITIES) - (0.5)% | | | (39,205) |
| NET ASSETS - 100% | | | $8,476,847 |
| Written Options | | | | |
| | Expiration Date/Exercise Price | Number of Contracts | Premium (000s) | Value (000s) |
| Call Options | | | | |
| AMETEK, Inc. | 3/17/17 - $55.00 | 387 | $22 | $(14) |
| Apple, Inc. | 3/17/17 - $125.00 | 3,568 | 493 | (524) |
| AT&T, Inc. | 3/17/17 - $44.00 | 7,396 | 104 | (152) |
| Baker Hughes, Inc. | 4/21/17 - $67.50 | 959 | 112 | (103) |
| Bank of America Corp. | 3/17/17 - $25.00 | 15,200 | 259 | (182) |
| Chevron Corp. | 3/17/17 - $120.00 | 2,473 | 275 | (36) |
| Comcast Corp. Class A | 4/21/17 - $77.50 | 5,850 | 521 | (804) |
| Comerica, Inc. | 4/21/17 - $70.00 | 1,835 | 472 | (385) |
| Crown Castle International Corp. | 3/17/17 - $92.50 | 1,011 | 64 | (64) |
| General Dynamics Corp. | 5/19/17 - $185.00 | 1,012 | 335 | (546) |
| General Electric Co. | 4/21/17 - $32.00 | 15,593 | 281 | (249) |
| Halliburton Co. | 4/21/17 - $62.50 | 1,116 | 87 | (88) |
| JPMorgan Chase & Co. | 4/21/17 - $87.50 | 9,479 | 1,855 | (1,701) |
| KeyCorp | 3/17/17 - $20.00 | 7,293 | 66 | (62) |
| M&T Bank Corp. | 2/17/17 - $165.00 | 2,077 | 278 | (312) |
| Marsh & McLennan Companies, Inc. | 4/21/17 - $70.00 | 812 | 91 | (77) |
| MetLife, Inc. | 3/17/17 - $57.50 | 5,267 | 511 | (365) |
| Morgan Stanley | 4/21/17 - $45.00 | 4,168 | 438 | (423) |
| Paychex, Inc. | 3/17/17 - $62.50 | 1,573 | 115 | (75) |
| Prudential Financial, Inc. | 3/17/17 - $110.00 | 1,281 | 314 | (246) |
| Raytheon Co. | 5/19/17 - $155.00 | 640 | 163 | (102) |
| Regions Financial Corp. | 2/17/17 - $13.00 | 6,509 | 222 | (944) |
| Regions Financial Corp. | 5/19/17 - $16.00 | 9,367 | 300 | (295) |
| Schlumberger Ltd. | 3/17/17 - $92.50 | 867 | 14 | (8) |
| SunTrust Banks, Inc. | 4/21/17 - $60.00 | 2,952 | 420 | (339) |
| The Hershey Co. | 5/19/17 - $110.00 | 475 | 131 | (120) |
| TOTAL WRITTEN OPTIONS | | | $7,943 | $(8,216) |
Values shown as $0 may reflect amounts less than $500.
Legend
(a) Security or a portion of the security is on loan at period end.
(b) Security or a portion of the security is pledged as collateral for call options written. At period end, the value of securities pledged amounted to $367,898,000.
(c) Non-income producing
(d) Security exempt from registration under Rule 144A of the Securities Act of 1933. These securities may be resold in transactions exempt from registration, normally to qualified institutional buyers. At the end of the period, the value of these securities amounted to $9,978,000 or 0.1% of net assets.
(e) Security is perpetual in nature with no stated maturity date.
(f) Coupon rates for floating and adjustable rate securities reflect the rates in effect at period end.
(g) Investment is owned by a wholly-owned subsidiary (Subsidiary) that is treated as a corporation for U.S. tax purposes.
(h) Restricted securities - Investment in securities not registered under the Securities Act of 1933 (excluding 144A issues). At the end of the period, the value of restricted securities (excluding 144A issues) amounted to $15,119,000 or 0.2% of net assets.
(i) Affiliated fund that is generally available only to investment companies and other accounts managed by Fidelity Investments. The rate quoted is the annualized seven-day yield of the fund at period end. A complete unaudited listing of the fund's holdings as of its most recent quarter end is available upon request. In addition, each Fidelity Central Fund's financial statements, which are not covered by the Fund's Report of Independent Registered Public Accounting Firm, are available on the SEC's website or upon request.
(j) Investment made with cash collateral received from securities on loan.
Additional information on each restricted holding is as follows:
| Security | Acquisition Date | Acquisition Cost (000s) |
| Utica Shale Drilling Program (non-operating revenue interest) | 10/5/16 - 11/4/16 | $15,119 |
Affiliated Central Funds
Information regarding fiscal year to date income earned by the Fund from investments in Fidelity Central Funds is as follows:
| Fund | Income earned |
| | (Amounts in thousands) |
| Fidelity Cash Central Fund | $1,429 |
| Fidelity Securities Lending Cash Central Fund | 502 |
| Total | $1,931 |
Investment Valuation
The following is a summary of the inputs used, as of January 31, 2017, involving the Fund's assets and liabilities carried at fair value. The inputs or methodology used for valuing securities may not be an indication of the risk associated with investing in those securities. For more information on valuation inputs, and their aggregation into the levels used below, please refer to the Investment Valuation section in the accompanying Notes to Financial Statements.
| | Valuation Inputs at Reporting Date: |
| Description | Total | Level 1 | Level 2 | Level 3 |
| (Amounts in thousands) | | | | |
| Investments in Securities: | | | | |
| Equities: | | | | |
| Consumer Discretionary | $788,995 | $788,995 | $-- | $-- |
| Consumer Staples | 770,700 | 769,583 | 1,117 | -- |
| Energy | 903,491 | 903,491 | -- | -- |
| Financials | 2,095,923 | 2,085,689 | 10,234 | -- |
| Health Care | 813,630 | 680,671 | 132,959 | -- |
| Industrials | 801,709 | 801,709 | -- | -- |
| Information Technology | 811,395 | 811,395 | -- | -- |
| Materials | 149,676 | 149,658 | -- | 18 |
| Real Estate | 169,979 | 169,979 | -- | -- |
| Telecommunication Services | 312,597 | 303,064 | 9,533 | -- |
| Utilities | 404,383 | 401,503 | 2,880 | -- |
| Corporate Bonds | 19,103 | -- | 19,103 | -- |
| Preferred Securities | 4,615 | -- | 4,615 | -- |
| Other | 15,119 | | -- | 15,119 |
| Money Market Funds | 454,737 | 454,737 | -- | -- |
| Total Investments in Securities: | $8,516,052 | $8,320,474 | $180,441 | $15,137 |
| Derivative Instruments: | | | | |
| Liabilities | | | | |
| Written Options | $(8,216) | $(5,592) | $(2,624) | $-- |
| Total Liabilities | $(8,216) | $(5,592) | $(2,624) | $-- |
| Total Derivative Instruments: | $(8,216) | $(5,592) | $(2,624) | $-- |
The following is a summary of transfers between Level 1 and Level 2 for the period ended January 31, 2017. Transfers are assumed to have occurred at the beginning of the period, and are primarily attributable to the valuation techniques used for foreign equity securities, as discussed in the accompanying Notes to Financial Statements:
| Transfers | Total (000s) |
| (Amounts in thousands) | |
| Level 1 to Level 2 | $0 |
| Level 2 to Level 1 | $186,858 |
Value of Derivative Instruments
The following table is a summary of the Fund's value of derivative instruments by primary risk exposure as of January 31, 2017. For additional information on derivative instruments, please refer to the Derivative Instruments section in the accompanying Notes to Financial Statements.
| Primary Risk Exposure / Derivative Type | Value |
| | Asset | Liability |
| (Amounts in thousands) | | |
| Equity Risk | | |
| Written Options(a) | $0 | $(8,216) |
| Total Equity Risk | 0 | (8,216) |
| Total Value of Derivatives | $0 | $(8,216) |
(a) Gross value is presented in the Statement of Assets and Liabilities in the written options, at value line-item.
Other Information
Distribution of investments by country or territory of incorporation, as a percentage of Total Net Assets, is as follows (Unaudited):
| United States of America | 86.5% |
| United Kingdom | 2.3% |
| Switzerland | 2.3% |
| Ireland | 2.2% |
| Canada | 1.7% |
| Netherlands | 1.4% |
| Japan | 1.1% |
| Others (Individually Less Than 1%) | 2.5% |
| | 100.0% |
See accompanying notes which are an integral part of the financial statements.
Financial Statements
Statement of Assets and Liabilities
| Amounts in thousands (except per-share amounts) | | January 31, 2017 |
| Assets | | |
Investment in securities, at value (including securities loaned of $27,886) — See accompanying schedule:
Unaffiliated issuers (cost $6,572,696) | $8,061,315 | |
| Fidelity Central Funds (cost $454,678) | 454,737 | |
| Total Investments (cost $7,027,374) | | $8,516,052 |
| Receivable for investments sold | | 6,467 |
| Receivable for fund shares sold | | 4,757 |
| Dividends receivable | | 8,523 |
| Interest receivable | | 251 |
| Distributions receivable from Fidelity Central Funds | | 215 |
| Prepaid expenses | | 13 |
| Other receivables | | 1,081 |
| Total assets | | 8,537,359 |
| Liabilities | | |
| Payable for investments purchased | $459 | |
| Payable for fund shares redeemed | 18,266 | |
| Accrued management fee | 3,209 | |
| Written options, at value (premium received $7,943) | 8,216 | |
| Other affiliated payables | 1,052 | |
| Other payables and accrued expenses | 1,020 | |
| Collateral on Securities Loaned | 28,290 | |
| Total liabilities | | 60,512 |
| Net Assets | | $8,476,847 |
| Net Assets consist of: | | |
| Paid in capital | | $6,969,622 |
| Distributions in excess of net investment income | | (52,348) |
| Accumulated undistributed net realized gain (loss) on investments and foreign currency transactions | | 71,225 |
| Net unrealized appreciation (depreciation) on investments and assets and liabilities in foreign currencies | | 1,488,348 |
| Net Assets | | $8,476,847 |
| Equity-Income: | | |
| Net Asset Value, offering price and redemption price per share ($6,685,798 ÷ 115,758 shares) | | $57.76 |
| Class K: | | |
| Net Asset Value, offering price and redemption price per share ($1,791,049 ÷ 31,027 shares) | | $57.73 |
See accompanying notes which are an integral part of the financial statements.
Statement of Operations
| Amounts in thousands | | Year ended January 31, 2017 |
| Investment Income | | |
| Dividends | | $229,014 |
| Interest | | 1,479 |
| Income from Fidelity Central Funds | | 1,931 |
| Total income | | 232,424 |
| Expenses | | |
| Management fee | $35,936 | |
| Transfer agent fees | 10,726 | |
| Accounting and security lending fees | 1,214 | |
| Custodian fees and expenses | 153 | |
| Independent trustees' fees and expenses | 35 | |
| Appreciation in deferred trustee compensation account | 2 | |
| Registration fees | 159 | |
| Audit | 114 | |
| Legal | 26 | |
| Miscellaneous | 70 | |
| Total expenses before reductions | 48,435 | |
| Expense reductions | (292) | 48,143 |
| Net investment income (loss) | | 184,281 |
| Realized and Unrealized Gain (Loss) | | |
| Net realized gain (loss) on: | | |
| Investment securities: | | |
| Unaffiliated issuers | 128,235 | |
| Fidelity Central Funds | 5 | |
| Foreign currency transactions | (346) | |
| Written options | 12,878 | |
| Total net realized gain (loss) | | 140,772 |
Change in net unrealized appreciation (depreciation) on:
Investment securities | 1,413,409 | |
| Assets and liabilities in foreign currencies | 14 | |
| Written options | (1,373) | |
| Total change in net unrealized appreciation (depreciation) | | 1,412,050 |
| Net gain (loss) | | 1,552,822 |
| Net increase (decrease) in net assets resulting from operations | | $1,737,103 |
See accompanying notes which are an integral part of the financial statements.
Statement of Changes in Net Assets
| Amounts in thousands | Year ended January 31, 2017 | Year ended January 31, 2016 |
| Increase (Decrease) in Net Assets | | |
| Operations | | |
| Net investment income (loss) | $184,281 | $221,310 |
| Net realized gain (loss) | 140,772 | 508,669 |
| Change in net unrealized appreciation (depreciation) | 1,412,050 | (1,074,501) |
| Net increase (decrease) in net assets resulting from operations | 1,737,103 | (344,522) |
| Distributions to shareholders from net investment income | (204,416) | (262,218) |
| Distributions to shareholders from net realized gain | (163,868) | (674,726) |
| Total distributions | (368,284) | (936,944) |
| Share transactions - net increase (decrease) | (289,881) | (278,644) |
| Total increase (decrease) in net assets | 1,078,938 | (1,560,110) |
| Net Assets | | |
| Beginning of period | 7,397,909 | 8,958,019 |
| End of period | $8,476,847 | $7,397,909 |
| Other Information | | |
| Distributions in excess of net investment income end of period | $(52,348) | $(2,420) |
See accompanying notes which are an integral part of the financial statements.
Financial Highlights — Fidelity Equity-Income Fund
| Years ended January 31, | 2017 | 2016 | 2015 | 2014 | 2013 |
| Selected Per–Share Data | | | | | |
| Net asset value, beginning of period | $48.57 | $57.26 | $56.69 | $49.72 | $42.77 |
| Income from Investment Operations | | | | | |
| Net investment income (loss)A | 1.22 | 1.43 | 2.00B | 1.26 | 1.32 |
| Net realized and unrealized gain (loss) | 10.43 | (3.91)C | 2.87 | 6.99 | 6.95 |
| Total from investment operations | 11.65 | (2.48) | 4.87 | 8.25 | 8.27 |
| Distributions from net investment income | (1.36) | (1.71)D | (1.60) | (1.28) | (1.32) |
| Distributions from net realized gain | (1.10) | (4.51)D | (2.70) | – | – |
| Total distributions | (2.46) | (6.21)E | (4.30) | (1.28) | (1.32) |
| Net asset value, end of period | $57.76 | $48.57 | $57.26 | $56.69 | $49.72 |
| Total ReturnF | 24.42% | (4.89)%C | 8.53% | 16.72% | 19.63% |
| Ratios to Average Net AssetsG,H | | | | | |
| Expenses before reductions | .63% | .64% | .63% | .64% | .67% |
| Expenses net of fee waivers, if any | .63% | .64% | .63% | .64% | .67% |
| Expenses net of all reductions | .62% | .63% | .63% | .64% | .66% |
| Net investment income (loss) | 2.27% | 2.55% | 3.30%B | 2.30% | 2.89% |
| Supplemental Data | | | | | |
| Net assets, end of period (in millions) | $6,686 | $5,752 | $6,686 | $6,842 | $6,401 |
| Portfolio turnover rateI | 36% | 46%J | 40% | 43% | 43% |
A Calculated based on average shares outstanding during the period.
B Net Investment income per share reflects a large, non-recurring dividend which amounted to $.48 per share. Excluding this non-recurring dividend, the ratio of net investment income (loss) to average net assets would have been 2.51%.
C Net realized and unrealized gain (loss) per share reflects proceeds received from litigation which amounted to $.13 per share. Excluding these litigation proceeds, the total return would have been (5.12)%
D The amounts shown reflect certain reclassifications related to book to tax differences that were made in the year shown.
E Total distributions of $6.21 per share is comprised of distributions from net investment income of $1.709 and distributions from net realized gain of $4.505 per share.
F Total returns would have been lower if certain expenses had not been reduced during the applicable periods shown.
G Fees and expenses of any underlying Fidelity Central Funds are not included in the Fund's expense ratio. The Fund indirectly bears its proportionate share of the expenses of any underlying Fidelity Central Funds.
H Expense ratios reflect operating expenses of the class. Expenses before reductions do not reflect amounts reimbursed by the investment adviser or reductions from brokerage service arrangements or reductions from other expense offset arrangements and do not represent the amount paid by the class during periods when reimbursements or reductions occur. Expenses net of fee waivers reflect expenses after reimbursement by the investment adviser but prior to reductions from brokerage service arrangements or other expense offset arrangements. Expenses net of all reductions represent the net expenses paid by the class.
I Amount does not include the portfolio activity of any underlying Fidelity Central Funds.
J Portfolio turnover rate excludes securities received or delivered in-kind.
See accompanying notes which are an integral part of the financial statements.
Financial Highlights — Fidelity Equity-Income Fund Class K
| Years ended January 31, | 2017 | 2016 | 2015 | 2014 | 2013 |
| Selected Per–Share Data | | | | | |
| Net asset value, beginning of period | $48.55 | $57.25 | $56.67 | $49.70 | $42.76 |
| Income from Investment Operations | | | | | |
| Net investment income (loss)A | 1.28 | 1.50 | 2.07B | 1.33 | 1.38 |
| Net realized and unrealized gain (loss) | 10.42 | (3.92)C | 2.88 | 6.99 | 6.95 |
| Total from investment operations | 11.70 | (2.42) | 4.95 | 8.32 | 8.33 |
| Distributions from net investment income | (1.42) | (1.78)D | (1.67) | (1.35) | (1.39) |
| Distributions from net realized gain | (1.10) | (4.51)D | (2.70) | – | – |
| Total distributions | (2.52) | (6.28)E | (4.37) | (1.35) | (1.39) |
| Net asset value, end of period | $57.73 | $48.55 | $57.25 | $56.67 | $49.70 |
| Total ReturnF | 24.56% | (4.78)%C | 8.68% | 16.87% | 19.78% |
| Ratios to Average Net AssetsG,H | | | | | |
| Expenses before reductions | .52% | .52% | .52% | .52% | .53% |
| Expenses net of fee waivers, if any | .52% | .52% | .52% | .52% | .53% |
| Expenses net of all reductions | .51% | .51% | .51% | .52% | .52% |
| Net investment income (loss) | 2.39% | 2.67% | 3.41%B | 2.42% | 3.03% |
| Supplemental Data | | | | | |
| Net assets, end of period (in millions) | $1,791 | $1,646 | $2,272 | $2,480 | $2,276 |
| Portfolio turnover rateI | 36% | 46%J | 40% | 43% | 43% |
A Calculated based on average shares outstanding during the period.
B Net Investment income per share reflects a large, non-recurring dividend which amounted to $.48 per share. Excluding this non-recurring dividend, the ratio of net investment income (loss) to average net assets would have been 2.63%.
C Net realized and unrealized gain (loss) per share reflects proceeds received from litigation which amounted to $.13 per share. Excluding these litigation proceeds, the total return would have been (5.01)%
D The amounts shown reflect certain reclassifications related to book to tax differences that were made in the year shown.
E Total distributions of $6.28 per share is comprised of distributions from net investment income of $1.777 and distributions from net realized gain of $4.505 per share.
F Total returns would have been lower if certain expenses had not been reduced during the applicable periods shown.
G Fees and expenses of any underlying Fidelity Central Funds are not included in the Fund's expense ratio. The Fund indirectly bears its proportionate share of the expenses of any underlying Fidelity Central Funds.
H Expense ratios reflect operating expenses of the class. Expenses before reductions do not reflect amounts reimbursed by the investment adviser or reductions from brokerage service arrangements or reductions from other expense offset arrangements and do not represent the amount paid by the class during periods when reimbursements or reductions occur. Expenses net of fee waivers reflect expenses after reimbursement by the investment adviser but prior to reductions from brokerage service arrangements or other expense offset arrangements. Expenses net of all reductions represent the net expenses paid by the class.
I Amount does not include the portfolio activity of any underlying Fidelity Central Funds.
J Portfolio turnover rate excludes securities received or delivered in-kind.
See accompanying notes which are an integral part of the financial statements.
Notes to Financial Statements
For the period ended January 31, 2017
(Amounts in thousands except percentages)
1. Organization.
Fidelity Equity-Income Fund (the Fund) is a fund of Fidelity Devonshire Trust (the Trust) and is authorized to issue an unlimited number of shares. The Trust is registered under the Investment Company Act of 1940, as amended (the 1940 Act), as an open-end management investment company organized as a Massachusetts business trust. The Fund offers Equity Income and Class K shares, each of which has equal rights as to assets and voting privileges. Each class has exclusive voting rights with respect to matters that affect that class.
2. Investments in Fidelity Central Funds.
The Fund invests in Fidelity Central Funds, which are open-end investment companies generally available only to other investment companies and accounts managed by the investment adviser and its affiliates. The Fund's Schedule of Investments lists each of the Fidelity Central Funds held as of period end, if any, as an investment of the Fund, but does not include the underlying holdings of each Fidelity Central Fund. As an Investing Fund, the Fund indirectly bears its proportionate share of the expenses of the underlying Fidelity Central Funds.
The Money Market Central Funds seek preservation of capital and current income and are managed by Fidelity Investments Money Management, Inc. (FIMM), an affiliate of the investment adviser. Annualized expenses of the Money Market Central Funds as of their most recent shareholder report date are less than .005%.
A complete unaudited list of holdings for each Fidelity Central Fund is available upon request or at the Securities and Exchange Commission (the SEC) website at www.sec.gov. In addition, the financial statements of the Fidelity Central Funds, which are not covered by the Fund's Report of Independent Registered Public Accounting Firm, are available on the SEC website or upon request.
3. Significant Accounting Policies.
The financial statements have been prepared in conformity with accounting principles generally accepted in the United States of America (GAAP), which require management to make certain estimates and assumptions at the date of the financial statements. Actual results could differ from those estimates. Subsequent events, if any, through the date that the financial statements were issued have been evaluated in the preparation of the financial statements. The following summarizes the significant accounting policies of the Fund:
Investment Valuation. Investments are valued as of 4:00 p.m. Eastern time on the last calendar day of the period. The Board of Trustees (the Board) has delegated the day to day responsibility for the valuation of the Fund's investments to the Fair Value Committee (the Committee) established by the Fund's investment adviser. In accordance with valuation policies and procedures approved by the Board, the Fund attempts to obtain prices from one or more third party pricing vendors or brokers to value its investments. When current market prices, quotations or currency exchange rates are not readily available or reliable, investments will be fair valued in good faith by the Committee, in accordance with procedures adopted by the Board. Factors used in determining fair value vary by investment type and may include market or investment specific events, changes in interest rates and credit quality. The frequency with which these procedures are used cannot be predicted and they may be utilized to a significant extent. The Committee oversees the Fund's valuation policies and procedures and reports to the Board on the Committee's activities and fair value determinations. The Board monitors the appropriateness of the procedures used in valuing the Fund's investments and ratifies the fair value determinations of the Committee.
The Fund categorizes the inputs to valuation techniques used to value its investments into a disclosure hierarchy consisting of three levels as shown below:
- Level 1 – quoted prices in active markets for identical investments
- Level 2 – other significant observable inputs (including quoted prices for similar investments, interest rates, prepayment speeds, etc.)
- Level 3 – unobservable inputs (including the Fund's own assumptions based on the best information available)
Valuation techniques used to value the Fund's investments by major category are as follows:
Equity securities, including restricted securities, for which market quotations are readily available, are valued at the last reported sale price or official closing price as reported by a third party pricing vendor on the primary market or exchange on which they are traded and are categorized as Level 1 in the hierarchy. In the event there were no sales during the day or closing prices are not available, securities are valued at the last quoted bid price or may be valued using the last available price and are generally categorized as Level 2 in the hierarchy. For foreign equity securities, when market or security specific events arise, comparisons to the valuation of American Depositary Receipts (ADRs), futures contracts, Exchange-Traded Funds (ETFs) and certain indexes as well as quoted prices for similar securities may be used and would be categorized as Level 2 in the hierarchy. Utilizing these techniques may result in transfers between Level 1 and Level 2. For equity securities, including restricted securities, where observable inputs are limited, assumptions about market activity and risk are used and these securities may be categorized as Level 3 in the hierarchy.
Debt securities, including restricted securities, are valued based on evaluated prices received from third party pricing vendors or from brokers who make markets in such securities. Corporate bonds and preferred securities are valued by pricing vendors who utilize matrix pricing which considers yield or price of bonds of comparable quality, coupon, maturity and type or by broker-supplied prices. When independent prices are unavailable or unreliable, debt securities may be valued utilizing pricing methodologies which consider similar factors that would be used by third party pricing vendors. Debt securities are generally categorized as Level 2 in the hierarchy but may be Level 3 depending on the circumstances.
Exchange-traded options are valued using the last sale price or, in the absence of a sale, the last offering price and are categorized as Level 1 in the hierarchy. Options traded over-the-counter are valued using broker-supplied valuations and are categorized as Level 2 in the hierarchy. Investments in open-end mutual funds, including the Fidelity Central Funds, are valued at their closing net asset value (NAV) each business day and are categorized as Level 1 in the hierarchy.
Changes in valuation techniques may result in transfers in or out of an assigned level within the disclosure hierarchy. The aggregate value of investments by input level as of January 31, 2017, including information on transfers between Levels 1 and 2 is included at the end of the Fund's Schedule of Investments.
Foreign Currency. The Fund may use foreign currency contracts to facilitate transactions in foreign-denominated securities. Gains and losses from these transactions may arise from changes in the value of the foreign currency or if the counterparties do not perform under the contracts' terms.
Foreign-denominated assets, including investment securities, and liabilities are translated into U.S. dollars at the exchange rates at period end. Purchases and sales of investment securities, income and dividends received and expenses denominated in foreign currencies are translated into U.S. dollars at the exchange rate in effect on the transaction date.
The effects of exchange rate fluctuations on investments are included with the net realized and unrealized gain (loss) on investment securities. Other foreign currency transactions resulting in realized and unrealized gain (loss) are disclosed separately.
Investment Transactions and Income. For financial reporting purposes, the Fund's investment holdings and NAV include trades executed through the end of the last business day of the period. The NAV per share for processing shareholder transactions is calculated as of the close of business of the New York Stock Exchange (NYSE), normally 4:00 p.m. Eastern time and includes trades executed through the end of the prior business day. Gains and losses on securities sold are determined on the basis of identified cost and may include proceeds received from litigation. Dividend income is recorded on the ex-dividend date, except for certain dividends from foreign securities where the ex-dividend date may have passed, which are recorded as soon as the Fund is informed of the ex-dividend date. Non-cash dividends included in dividend income, if any, are recorded at the fair market value of the securities received. Income and capital gain distributions from Fidelity Central Funds, if any, are recorded on the ex-dividend date. Certain distributions received by the Fund represent a return of capital or capital gain. The Fund determines the components of these distributions subsequent to the ex-dividend date, based upon receipt of tax filings or other correspondence relating to the underlying investment. These distributions are recorded as a reduction of cost of investments and/or as a realized gain. Interest income is accrued as earned and includes coupon interest and amortization of premium and accretion of discount on debt securities as applicable. Investment income is recorded net of foreign taxes withheld where recovery of such taxes is uncertain. Debt obligations may be placed on non-accrual status and related interest income may be reduced by ceasing current accruals and writing off interest receivables when the collection of all or a portion of interest has become doubtful based on consistently applied procedures. A debt obligation is removed from non-accrual status when the issuer resumes interest payments or when collectability of interest is reasonably assured.
Class Allocations and Expenses. Investment income, realized and unrealized capital gains and losses, common expenses of the Fund, and certain fund-level expense reductions, if any, are allocated daily on a pro-rata basis to each class based on the relative net assets of each class to the total net assets of the Fund. Each class differs with respect to transfer agent fees incurred. Certain expense reductions may also differ by class. For the reporting period, the allocated portion of income and expenses to each class as a percent of its average net assets may vary due to the timing of recording these transactions in relation to fluctuating net assets of the classes. Expenses directly attributable to a fund are charged to that fund. Expenses attributable to more than one fund are allocated among the respective funds on the basis of relative net assets or other appropriate methods. Expense estimates are accrued in the period to which they relate and adjustments are made when actual amounts are known.
Deferred Trustee Compensation. Under a Deferred Compensation Plan (the Plan), independent Trustees may elect to defer receipt of a portion of their annual compensation. Deferred amounts are invested in a cross-section of Fidelity funds, are marked-to-market and remain in the Fund until distributed in accordance with the Plan. The investment of deferred amounts and the offsetting payable to the Trustees are included in the accompanying Statement of Assets and Liabilities.
Income Tax Information and Distributions to Shareholders. Each year, the Fund intends to qualify as a regulated investment company under Subchapter M of the Internal Revenue Code, including distributing substantially all of its taxable income and realized gains. As a result, no provision for U.S. Federal income taxes is required. As of January 31, 2017, the Fund did not have any unrecognized tax benefits in the financial statements; nor is the Fund aware of any tax positions for which it is reasonably possible that the total amounts of unrecognized tax benefits will significantly change in the next twelve months. The Fund files a U.S. federal tax return, in addition to state and local tax returns as required. The Fund's federal income tax returns are subject to examination by the Internal Revenue Service (IRS) for a period of three fiscal years after they are filed. State and local tax returns may be subject to examination for an additional fiscal year depending on the jurisdiction. Foreign taxes are provided for based on the Fund's understanding of the tax rules and rates that exist in the foreign markets in which it invests.
Distributions are declared and recorded on the ex-dividend date. Income dividends and capital gain distributions are declared separately for each class. Income and capital gain distributions are determined in accordance with income tax regulations, which may differ from GAAP. In addition, the Fund claimed a portion of the payment made to redeeming shareholders as a distribution for income tax purposes.
Capital accounts within the financial statements are adjusted for permanent book-tax differences. These adjustments have no impact on net assets or the results of operations. Capital accounts are not adjusted for temporary book-tax differences which will reverse in a subsequent period.
Book-tax differences are primarily due to foreign currency transactions, market discount, contingent interest, equity-debt classifications, certain conversion ratio adjustments, partnerships, deferred trustees compensation and losses deferred due to wash sales.
The federal tax cost of investment securities and unrealized appreciation (depreciation) as of period end were as follows:
| Gross unrealized appreciation | $1,842,771 |
| Gross unrealized depreciation | (356,441) |
| Net unrealized appreciation (depreciation) on securities | $1,486,330 |
| Tax Cost | $7,029,722 |
The tax-based components of distributable earnings as of period end were as follows:
| Undistributed ordinary income | $33,199 |
| Undistributed long-term capital gain | $40,570 |
| Net unrealized appreciation (depreciation) on securities and other investments | $1,434,648 |
The tax character of distributions paid was as follows:
| | January 31, 2017 | January 31, 2016 |
| Ordinary Income | $220,676 | $ 285,451 |
| Long-term Capital Gains | 147,608 | 651,493 |
| Total | $368,284 | $ 936,944 |
Restricted Securities. The Fund may invest in securities that are subject to legal or contractual restrictions on resale. These securities generally may be resold in transactions exempt from registration or to the public if the securities are registered. Disposal of these securities may involve time-consuming negotiations and expense, and prompt sale at an acceptable price may be difficult. Information regarding restricted securities is included at the end of the Fund's Schedule of Investments.
Consolidated Subsidiary. The Fund invests in certain investments through a wholly-owned subsidiary ("Subsidiary"), which may be subject to federal and state taxes upon disposition.
As of period end, the Fund held an investment of $15,119 in this Subsidiary, representing .18% of the Fund's net assets. The financial statements have been consolidated and include accounts of the Fund and each Subsidiary. Accordingly, all inter-company transactions and balances have been eliminated.
4. Derivative Instruments.
Risk Exposures and the Use of Derivative Instruments. The Fund's investment objective allows the Fund to enter into various types of derivative contracts, including options. Derivatives are investments whose value is primarily derived from underlying assets, indices or reference rates and may be transacted on an exchange or over-the-counter (OTC). Derivatives may involve a future commitment to buy or sell a specified asset based on specified terms, to exchange future cash flows at periodic intervals based on a notional principal amount, or for one party to make one or more payments upon the occurrence of specified events in exchange for periodic payments from the other party.
The Fund used derivatives to increase returns and to manage exposure to certain risks as defined below. The success of any strategy involving derivatives depends on analysis of numerous economic factors, and if the strategies for investment do not work as intended, the Fund may not achieve its objectives.
The Fund's use of derivatives increased or decreased its exposure to the following risk:
| Equity Risk | Equity risk relates to the fluctuations in the value of financial instruments as a result of changes in market prices (other than those arising from interest rate risk or foreign exchange risk), whether caused by factors specific to an individual investment, its issuer, or all factors affecting all instruments traded in a market or market segment.
|
The Fund is also exposed to additional risks from investing in derivatives, such as liquidity risk and counterparty credit risk. Liquidity risk is the risk that the Fund will be unable to close out the derivative in the open market in a timely manner. Counterparty credit risk is the risk that the counterparty will not be able to fulfill its obligation to the Fund. Derivative counterparty credit risk is managed through formal evaluation of the creditworthiness of all potential counterparties. On certain OTC derivatives such as options, the Fund attempts to reduce its exposure to counterparty credit risk by entering into an International Swaps and Derivatives Association, Inc. (ISDA) Master Agreement with each of its counterparties. The ISDA Master Agreement gives the Fund the right to terminate all transactions traded under such agreement upon the deterioration in the credit quality of the counterparty beyond specified levels. The ISDA Master Agreement gives each party the right, upon an event of default by the other party or a termination of the agreement, to close out all transactions traded under such agreement and to net amounts owed under each transaction to one net payable by one party to the other. To mitigate counterparty credit risk on bi-lateral OTC derivatives, the Fund receives collateral in the form of cash or securities once the Fund's net unrealized appreciation on outstanding derivative contracts under an ISDA Master Agreement exceeds certain applicable thresholds, subject to certain minimum transfer provisions. The collateral received is held in segregated accounts with the Fund's custodian bank in accordance with the collateral agreements entered into between the Fund, the counterparty and the Fund's custodian bank. The Fund could experience delays and costs in gaining access to the collateral even though it is held by the Fund's custodian bank. The Fund's maximum risk of loss from counterparty credit risk related to bi-lateral OTC derivatives is generally the aggregate unrealized appreciation and unpaid counterparty payments in excess of any collateral pledged by the counterparty to the Fund. The Fund may be required to pledge collateral for the benefit of the counterparties on bi-lateral OTC derivatives in an amount not less than each counterparty's unrealized appreciation on outstanding derivative contracts, subject to certain minimum transfer provisions, and any such pledged collateral is identified in the Schedule of Investments. Counterparty credit risk related to exchange-traded options may be mitigated by the protection provided by the exchange on which they trade.
Investing in derivatives may involve greater risks than investing in the underlying assets directly and, to varying degrees, may involve risk of loss in excess of any initial investment and collateral received and amounts recognized in the Statement of Assets and Liabilities. In addition, there may be the risk that the change in value of the derivative contract does not correspond to the change in value of the underlying instrument.
Options. Options give the purchaser the right, but not the obligation, to buy (call) or sell (put) an underlying security or financial instrument at an agreed exercise or strike price between or on certain dates. Options obligate the seller (writer) to buy (put) or sell (call) an underlying instrument at the exercise or strike price or cash settle an underlying derivative instrument if the holder exercises the option on or before the expiration date.
The Fund used exchange-traded and OTC written covered call options to manage its exposure to the market. When the Fund writes a covered call option, the Fund holds the underlying instrument which must be delivered to the holder upon the exercise of the option.
Upon entering into a written options contract, the Fund will receive a premium. Premiums received are reflected as a liability on the Statement of Assets and Liabilities. Options are valued daily and any unrealized appreciation (depreciation) is reflected on the Statement of Assets and Liabilities. When a written option is exercised, the premium is added to the proceeds from the sale of the underlying instrument in determining the gain or loss realized on that investment. When an option is closed the Fund will realize a gain or loss depending on whether the proceeds or amount paid for the closing sale transaction are greater or less than the premium received. When an option expires, gains and losses are realized to the extent of premiums received. The net realized gain (loss) on closed and expired written options and the change in net unrealized appreciation (depreciation) on written options are reflected separately on the Statement of Operations.
Writing call options tends to decrease exposure to the underlying instrument and risk of loss is the change in value in excess of the premium received.
Any open options at period end are presented in the Schedule of Investments under the caption "Written Options".
During the period, the Fund recognized net realized gain (loss) of $12,878 and a change in net unrealized appreciation (depreciation) of $(1,373) related to its investment in written options. This amount is included in the Statement of Operations.
The following is a summary of the Fund's written options activity:
| | Number of Contracts | Amount of Premiums |
| Outstanding at beginning of period | 26 | $1,377 |
| Options Opened | 437 | 31,735 |
| Options Exercised | (171) | (11,204) |
| Options Closed | (80) | (5,152) |
| Options Expired | (103) | (8,813) |
| Outstanding at end of period | 109 | $7,943 |
5. Purchases and Sales of Investments.
Purchases and sales of securities, other than short-term securities, aggregated $2,774,154 and $3,393,199, respectively.
Prior Fiscal Year Redemptions In-Kind. During the prior period, 1,158 shares of the Fund held by an unaffiliated entity were redeemed in-kind for investments and cash, including accrued interest, with a value of $62,186. The Fund had a net realized gain of $14,316 on investments delivered through the in-kind redemptions. The amount of in-kind redemptions is included in share transactions in the accompanying Statement of Changes in Net Assets as well as Note 11: Share Transactions. The Fund recognized no gain or loss for federal income tax purposes.
6. Fees and Other Transactions with Affiliates.
Management Fee. Fidelity Management & Research Company (the investment adviser) and its affiliates provide the Fund with investment management related services for which the Fund pays a monthly management fee. The management fee is the sum of an individual fund fee rate that is based on an annual rate of .20% of the Fund's average net assets and an annualized group fee rate that averaged .25% during the period. The group fee rate is based upon the average net assets of all the mutual funds advised by the investment adviser, including any mutual funds previously advised by the investment adviser that are currently advised by Fidelity SelectCo, LLC, an affiliate of the investment adviser. The group fee rate decreases as assets under management increase and increases as assets under management decrease. For the reporting period, the total annual management fee rate was .45% of the Fund's average net assets.
Transfer Agent Fees. Fidelity Investments Institutional Operations Company, Inc., (FIIOC), an affiliate of the investment adviser, is the transfer, dividend disbursing and shareholder servicing agent for each class of the Fund. FIIOC receives account fees and asset-based fees that vary according to the account size and type of account of the shareholders of Equity Income. FIIOC receives an asset-based fee of Class K's average net assets. FIIOC pays for typesetting, printing and mailing of shareholder reports, except proxy statements.
For the period, transfer agent fees for each class were as follows:
| | Amount | % of
Class-Level Average
Net Assets |
| Equity-Income | $9,919 | .16 |
| Class K | 807 | .05 |
| | $10,726 | |
Accounting and Security Lending Fees. Fidelity Service Company, Inc. (FSC), an affiliate of the investment adviser, maintains the Fund's accounting records. The accounting fee is based on the level of average net assets for each month. Under a separate contract, FSC administers the security lending program. The security lending fee is based on the number and duration of lending transactions.
Brokerage Commissions. The Fund placed a portion of its portfolio transactions with brokerage firms which are affiliates of the investment adviser. Brokerage commissions are included in net realized gain (loss) and change in net unrealized appreciation (depreciation) in the Statement of Operations. The commissions paid to these affiliated firms were $76 for the period.
Interfund Trades. The Fund may purchase from or sell securities to other Fidelity Funds under procedures adopted by the Board. The procedures have been designed to ensure these interfund trades are executed in accordance with Rule 17a-7 of the 1940 Act. Interfund trades are included within the respective purchases and sales amounts shown in the Purchases and Sales of Investments note.
7. Committed Line of Credit.
The Fund participates with other funds managed by the investment adviser or an affiliate in a $4.25 billion credit facility (the "line of credit") to be utilized for temporary or emergency purposes to fund shareholder redemptions or for other short-term liquidity purposes. The Fund has agreed to pay commitment fees on its pro-rata portion of the line of credit, which amounted to $24 and is reflected in Miscellaneous expenses on the Statement of Operations. During the period, the Fund did not borrow on this line of credit.
8. Security Lending.
The Fund lends portfolio securities through a lending agent from time to time in order to earn additional income. For equity securities, a lending agent is used and may loan securities to certain qualified borrowers, including Fidelity Capital Markets (FCM), a broker-dealer affiliated with the Fund. On the settlement date of the loan, the Fund receives collateral (in the form of U.S. Treasury obligations, letters of credit and/or cash) against the loaned securities and maintains collateral in an amount not less than 100% of the market value of the loaned securities during the period of the loan. The market value of the loaned securities is determined at the close of business of the Fund and any additional required collateral is delivered to the Fund on the next business day. The Fund or borrower may terminate the loan at any time, and if the borrower defaults on its obligation to return the securities loaned because of insolvency or other reasons, the Fund may apply collateral received from the borrower against the obligation. The Fund may experience delays and costs in recovering the securities loaned. Any cash collateral received is invested in the Fidelity Securities Lending Cash Central Fund. The value of loaned securities and cash collateral at period end are disclosed on the Fund's Statement of Assets and Liabilities. The value of securities loaned to FCM at period end was $4,515. Security lending income represents the income earned on investing cash collateral, less rebates paid to borrowers and any lending agent fees associated with the loan, plus any premium payments received for lending certain types of securities. Security lending income is presented in the Statement of Operations as a component of income from Fidelity Central Funds. Total security lending income during the period amounted to $502, including $47 from securities loaned to FCM.
9. Expense Reductions.
Commissions paid to certain brokers with whom the investment adviser, or its affiliates, places trades on behalf of the Fund include an amount in addition to trade execution, which may be rebated back to the Fund to offset certain expenses. This amount totaled $223 for the period. Through arrangements with the Fund's custodian, credits realized as a result of certain uninvested cash balances were used to reduce the Fund's expenses. During the period, these credits reduced the Fund's custody expenses by $2.
In addition, during the period the investment adviser reimbursed and/or waived a portion of fund-level operating expenses in the amount of $67.
10. Distributions to Shareholders.
Distributions to shareholders of each class were as follows:
| | Year ended
January 31, 2017 | Year ended
January 31, 2016 |
| From net investment income | | |
| Equity-Income | $158,629 | $199,167 |
| Class K | 45,787 | 63,051 |
| Total | $204,416 | $262,218 |
| From net realized gain | | |
| Equity-Income | $127,710 | $515,493 |
| Class K | 36,158 | 159,233 |
| Total | $163,868 | $674,726 |
11. Share Transactions.
Share transactions for each class were as follows and may contain automatic conversions between classes or exchanges between affiliated funds:
| | Shares | Shares | Dollars | Dollars |
| | Year ended
January 31, 2017 | Year ended January 31, 2016 | Year ended
January 31, 2017 | Year ended January 31, 2016 |
| Equity-Income | | | | |
| Shares sold | 12,430 | 11,557 | $670,860 | $638,905 |
| Reinvestment of distributions | 5,024 | 12,773 | 271,182 | 679,623 |
| Shares redeemed | (20,110) | (22,666) | (1,087,701) | (1,259,206) |
| Net increase (decrease) | (2,656) | 1,664 | $(145,659) | $59,322 |
| Class K | | | | |
| Shares sold | 9,202 | 5,714 | $506,412 | $318,377 |
| Reinvestment of distributions | 1,517 | 4,160 | 81,945 | 222,285 |
| Shares redeemed | (13,599) | (15,663)(a) | (732,579) | (878,628)(a) |
| Net increase (decrease) | (2,880) | (5,789) | $(144,222) | $(337,966) |
(a) Amount includes in-kind redemptions (See note 5: Prior Fiscal Year Redemptions In-Kind)
12. Other.
The Fund's organizational documents provide former and current trustees and officers with a limited indemnification against liabilities arising in connection with the performance of their duties to the Fund. In the normal course of business, the Fund may also enter into contracts that provide general indemnifications. The Fund's maximum exposure under these arrangements is unknown as this would be dependent on future claims that may be made against the Fund. The risk of material loss from such claims is considered remote.
Report of Independent Registered Public Accounting Firm
To the Trustees of Fidelity Devonshire Trust and Shareholders of Fidelity Equity-Income Fund:
In our opinion, the accompanying statement of assets and liabilities, including the schedule of investments, and the related statements of operations and of changes in net assets and the financial highlights present fairly, in all material respects, the financial position of Fidelity Equity-Income Fund (a fund of Fidelity Devonshire Trust) as of January 31, 2017, the results of its operations for the year then ended, the changes in its net assets for each of the two years in the period then ended and the financial highlights for each of the five years in the period then ended, in conformity with accounting principles generally accepted in the United States of America. These financial statements and financial highlights (hereafter referred to as “financial statements”) are the responsibility of the Fidelity Equity-Income Fund’s management. Our responsibility is to express an opinion on these financial statements based on our audits. We conducted our audits of these financial statements in accordance with the standards of the Public Company Accounting Oversight Board (United States). Those standards require that we plan and perform the audit to obtain reasonable assurance about whether the financial statements are free of material misstatement. An audit includes examining, on a test basis, evidence supporting the amounts and disclosures in the financial statements, assessing the accounting principles used and significant estimates made by management, and evaluating the overall financial statement presentation. We believe that our audits, which included confirmation of securities as of January 31, 2017 by correspondence with the custodian and brokers, provide a reasonable basis for our opinion.
PricewaterhouseCoopers LLP
Boston, Massachusetts
March 16, 2017
Trustees and Officers
The Trustees, Members of the Advisory Board (if any), and officers of the trust and fund, as applicable, are listed below. The Board of Trustees governs the fund and is responsible for protecting the interests of shareholders. The Trustees are experienced executives who meet periodically throughout the year to oversee the fund's activities, review contractual arrangements with companies that provide services to the fund, oversee management of the risks associated with such activities and contractual arrangements, and review the fund's performance. Each of the Trustees oversees 169 funds.
The Trustees hold office without limit in time except that (a) any Trustee may resign; (b) any Trustee may be removed by written instrument, signed by at least two-thirds of the number of Trustees prior to such removal; (c) any Trustee who requests to be retired or who has become incapacitated by illness or injury may be retired by written instrument signed by a majority of the other Trustees; and (d) any Trustee may be removed at any special meeting of shareholders by a two-thirds vote of the outstanding voting securities of the trust. Each Trustee who is not an interested person (as defined in the 1940 Act) of the trust and the fund is referred to herein as an Independent Trustee. Each Independent Trustee shall retire not later than the last day of the calendar year in which his or her 75th birthday occurs. The Independent Trustees may waive this mandatory retirement age policy with respect to individual Trustees. Officers and Advisory Board Members hold office without limit in time, except that any officer or Advisory Board Member may resign or may be removed by a vote of a majority of the Trustees at any regular meeting or any special meeting of the Trustees. Except as indicated, each individual has held the office shown or other offices in the same company for the past five years.
The fund’s Statement of Additional Information (SAI) includes more information about the Trustees. To request a free copy, call Fidelity at 1-800-835-5092.
Experience, Skills, Attributes, and Qualifications of the Trustees. The Governance and Nominating Committee has adopted a statement of policy that describes the experience, qualifications, attributes, and skills that are necessary and desirable for potential Independent Trustee candidates (Statement of Policy). The Board believes that each Trustee satisfied at the time he or she was initially elected or appointed a Trustee, and continues to satisfy, the standards contemplated by the Statement of Policy. The Governance and Nominating Committee also engages professional search firms to help identify potential Independent Trustee candidates who have the experience, qualifications, attributes, and skills consistent with the Statement of Policy. From time to time, additional criteria based on the composition and skills of the current Independent Trustees, as well as experience or skills that may be appropriate in light of future changes to board composition, business conditions, and regulatory or other developments, have also been considered by the professional search firms and the Governance and Nominating Committee. In addition, the Board takes into account the Trustees' commitment and participation in Board and committee meetings, as well as their leadership of standing and ad hoc committees throughout their tenure.
In determining that a particular Trustee was and continues to be qualified to serve as a Trustee, the Board has considered a variety of criteria, none of which, in isolation, was controlling. The Board believes that, collectively, the Trustees have balanced and diverse experience, qualifications, attributes, and skills, which allow the Board to operate effectively in governing the fund and protecting the interests of shareholders. Information about the specific experience, skills, attributes, and qualifications of each Trustee, which in each case led to the Board's conclusion that the Trustee should serve (or continue to serve) as a trustee of the fund, is provided below.
Board Structure and Oversight Function. James C. Curvey is an interested person and currently serves as Chairman. The Trustees have determined that an interested Chairman is appropriate and benefits shareholders because an interested Chairman has a personal and professional stake in the quality and continuity of services provided to the fund. Independent Trustees exercise their informed business judgment to appoint an individual of their choosing to serve as Chairman, regardless of whether the Trustee happens to be independent or a member of management. The Independent Trustees have determined that they can act independently and effectively without having an Independent Trustee serve as Chairman and that a key structural component for assuring that they are in a position to do so is for the Independent Trustees to constitute a substantial majority for the Board. The Independent Trustees also regularly meet in executive session. Ned C. Lautenbach serves as Chairman of the Independent Trustees and as such (i) acts as a liaison between the Independent Trustees and management with respect to matters important to the Independent Trustees and (ii) with management prepares agendas for Board meetings.
Fidelity® funds are overseen by different Boards of Trustees. The fund's Board oversees Fidelity's high income and certain equity funds, and other Boards oversee Fidelity's investment-grade bond, money market, asset allocation, and sector funds. The asset allocation funds may invest in Fidelity® funds overseen by the fund's Board. The use of separate Boards, each with its own committee structure, allows the Trustees of each group of Fidelity® funds to focus on the unique issues of the funds they oversee, including common research, investment, and operational issues. On occasion, the separate Boards establish joint committees to address issues of overlapping consequences for the Fidelity® funds overseen by each Board.
The Trustees operate using a system of committees to facilitate the timely and efficient consideration of all matters of importance to the Trustees, the fund, and fund shareholders and to facilitate compliance with legal and regulatory requirements and oversight of the fund's activities and associated risks. The Board, acting through its committees, has charged FMR and its affiliates with (i) identifying events or circumstances the occurrence of which could have demonstrably adverse effects on the fund's business and/or reputation; (ii) implementing processes and controls to lessen the possibility that such events or circumstances occur or to mitigate the effects of such events or circumstances if they do occur; and (iii) creating and maintaining a system designed to evaluate continuously business and market conditions in order to facilitate the identification and implementation processes described in (i) and (ii) above. Because the day-to-day operations and activities of the fund are carried out by or through FMR, its affiliates, and other service providers, the fund's exposure to risks is mitigated but not eliminated by the processes overseen by the Trustees. While each of the Board's committees has responsibility for overseeing different aspects of the fund's activities, oversight is exercised primarily through the Operations, Audit, and Compliance Committees. In addition, the Independent Trustees have worked with FMR to enhance the Board's oversight of investment and financial risks, legal and regulatory risks, technology risks, and operational risks, including the development of additional risk reporting to the Board. For example, a working group comprised of Independent Trustees and FMR has worked and continues to work to review the Fidelity® funds' valuation-related activities, reporting and risk management. Appropriate personnel, including but not limited to the fund's Chief Compliance Officer (CCO), FMR's internal auditor, the independent accountants, the fund's Treasurer and portfolio management personnel, make periodic reports to the Board's committees, as appropriate, including an annual review of Fidelity's risk management program for the Fidelity® funds. The responsibilities of each standing committee, including their oversight responsibilities, are described further under "Standing Committees of the Trustees."
Interested Trustees*:
Correspondence intended for a Trustee who is an interested person may be sent to Fidelity Investments, 245 Summer Street, Boston, Massachusetts 02210.
Name, Year of Birth; Principal Occupations and Other Relevant Experience+
James C. Curvey (1935)
Year of Election or Appointment: 2007
Trustee
Chairman of the Board of Trustees
Mr. Curvey also serves as Trustee of other Fidelity® funds. Mr. Curvey is a Director of Fidelity Research & Analysis Co. (investment adviser firm, 2009-present), and Vice Chairman (2007-present) and Director of FMR LLC (diversified financial services company). In addition, Mr. Curvey serves as an Overseer for the Boston Symphony Orchestra and a member of the board of Artis-Naples, Naples, Florida, and as a Trustee for Brewster Academy, Wolfeboro, New Hampshire. Previously, Mr. Curvey served as a Director of Fidelity Investments Money Management, Inc. (investment adviser firm, 2009-2014) and a Director of FMR and FMR Co., Inc. (investment adviser firms, 2007-2014).
Charles S. Morrison (1960)
Year of Election or Appointment: 2014
Trustee
Mr. Morrison also serves as Trustee of other funds. He serves as President of Fidelity Management & Research Company (FMR) (investment adviser firm, 2016-present), a Director of Fidelity Investments Money Management, Inc. (FIMM) (investment adviser firm, 2014-present), Director of Fidelity SelectCo, LLC (investment adviser firm, 2014-present), President, Asset Management (2014-present), and is an employee of Fidelity Investments. Previously, Mr. Morrison served as Vice President of Fidelity's Fixed Income and Asset Allocation Funds (2012-2014), President, Fixed Income (2011-2014), Vice President of Fidelity's Money Market Funds (2005-2009), President, Money Market Group Leader of FMR (investment adviser firm, 2009), and Senior Vice President, Money Market Group of FMR (2004-2009). Mr. Morrison also served as Vice President of Fidelity's Bond Funds (2002-2005), certain Balanced Funds (2002-2005), and certain Asset Allocation Funds (2002-2007), and as Senior Vice President (2002-2005) of Fidelity's Bond Division.
* Determined to be an “Interested Trustee” by virtue of, among other things, his or her affiliation with the trust or various entities under common control with FMR.
+ The information includes the Trustee's principal occupation during the last five years and other information relating to the experience, attributes, and skills relevant to the Trustee's qualifications to serve as a Trustee, which led to the conclusion that the Trustee should serve as a Trustee for the fund.
Independent Trustees:
Correspondence intended for an Independent Trustee may be sent to Fidelity Investments, P.O. Box 55235, Boston, Massachusetts 02205-5235.
Name, Year of Birth; Principal Occupations and Other Relevant Experience+
Dennis J. Dirks (1948)
Year of Election or Appointment: 2005
Trustee
Mr. Dirks also serves as Trustee of other Fidelity® funds. Prior to his retirement in May 2003, Mr. Dirks was Chief Operating Officer and a member of the Board of The Depository Trust & Clearing Corporation (DTCC). He also served as President, Chief Operating Officer, and Board member of The Depository Trust Company (DTC) and President and Board member of the National Securities Clearing Corporation (NSCC). In addition, Mr. Dirks served as Chief Executive Officer and Board member of the Government Securities Clearing Corporation, Chief Executive Officer and Board member of the Mortgage-Backed Securities Clearing Corporation, as a Trustee and a member of the Finance Committee of Manhattan College (2005-2008), as a Trustee and a member of the Finance Committee of AHRC of Nassau County (2006-2008), and as a member of the Independent Directors Council (IDC) Governing Council (2010-2015). Mr. Dirks is a member of the Board of Directors for The Brookville Center for Children's Services, Inc. (2009-present) and the Finance Committee of the Asolo Repertory Theatre (2016-present).
Alan J. Lacy (1953)
Year of Election or Appointment: 2008
Trustee
Mr. Lacy also serves as Trustee of other Fidelity® funds. Mr. Lacy serves as Chairman (2014-present) and a member (2010-present) of the Board of Directors of Dave & Buster's Entertainment, Inc. (restaurant and entertainment complexes) and a Director of Bristol-Myers Squibb Company (global pharmaceuticals, 2008-present). He is a Trustee of the California Chapter of The Nature Conservancy (2015-present) and a Director of the Center for Advanced Study in the Behavioral Sciences at Stanford University (2015-present). In addition, Mr. Lacy served as Senior Adviser (2007-2014) of Oak Hill Capital Partners, L.P. (private equity) and also served as Chief Executive Officer (2005) and Vice Chairman (2005-2006) of Sears Holdings Corporation (retail) and Chief Executive Officer and Chairman of the Board of Sears, Roebuck and Co. (retail, 2000-2005). Previously, Mr. Lacy served as Chairman (2008-2011) and a member (2006-2015) of the Board of Trustees of the National Parks Conservation Association and as a member of the Board of Directors for The Western Union Company (global money transfer, 2006-2011), The Hillman Companies, Inc. (hardware wholesalers, 2010-2014), and Earth Fare, Inc. (retail grocery, 2010-2014).
Ned C. Lautenbach (1944)
Year of Election or Appointment: 2000
Trustee
Chairman of the Independent Trustees
Mr. Lautenbach also serves as Trustee of other Fidelity® funds. Mr. Lautenbach currently serves as the Lead Director of the Eaton Corporation Board of Directors (diversified industrial, 1997-present). Mr. Lautenbach is Chairman of the Board of Directors of Artis-Naples in Naples, Florida (2012-present), a member of the Council on Foreign Relations (1994-present), and currently Vice Chair of the Board of Governors, State University System of Florida (2013-present). Previously, Mr. Lautenbach was a Partner and Advisory Partner at Clayton, Dubilier & Rice, LLC (private equity investment, 1998-2010), as well as a Director of Sony Corporation (2006-2007). Mr. Lautenbach also had a 30-year career with IBM (technology company) during which time he served as Senior Vice President and a member of the Corporate Executive Committee (1968-1998).
Joseph Mauriello (1944)
Year of Election or Appointment: 2008
Trustee
Mr. Mauriello also serves as Trustee of other Fidelity® funds. Prior to his retirement in January 2006, Mr. Mauriello served in numerous senior management positions including Deputy Chairman and Chief Operating Officer (2004-2005), and Vice Chairman of Financial Services (2002-2004) of KPMG LLP US (professional services, 1965-2005). Mr. Mauriello currently serves as a member of the Board of Directors of XL Group plc. (global insurance and re-insurance, 2006-present) and the Independent Directors Council (IDC) Governing Council (2015-present). Previously, Mr. Mauriello served as a Director of the Hamilton Funds of the Bank of New York (2006-2007) and of Arcadia Resources Inc. (health care services and products, 2007-2012).
Robert W. Selander (1950)
Year of Election or Appointment: 2011
Trustee
Mr. Selander also serves as Trustee of other Fidelity® funds. Mr. Selander serves as a Director of The Western Union Company (global money transfer, 2014-present) and a non-executive Chairman of Health Equity, Inc. (health savings custodian, 2015-present). Previously, Mr. Selander served as a Member of the Advisory Board of certain Fidelity® funds (2011), and Executive Vice Chairman (2010), Chief Executive Officer (2009-2010), and President and Chief Executive Officer (1997-2009) of Mastercard, Inc.
Cornelia M. Small (1944)
Year of Election or Appointment: 2005
Trustee
Ms. Small also serves as Trustee of other Fidelity® funds. Ms. Small is a member of the Board of Directors (2009-present) and Chair of the Investment Committee (2010-present) of the Teagle Foundation. Ms. Small also serves on the Investment Committee of the Berkshire Taconic Community Foundation (2008-present). Previously, Ms. Small served as Chairperson (2002-2008) and a member of the Investment Committee and Chairperson (2008-2012) and a member of the Board of Trustees of Smith College. In addition, Ms. Small served as Chief Investment Officer, Director of Global Equity Investments, and a member of the Board of Directors of Scudder, Stevens & Clark and Scudder Kemper Investments.
William S. Stavropoulos (1939)
Year of Election or Appointment: 2002
Trustee
Vice Chairman of the Independent Trustees
Mr. Stavropoulos also serves as Trustee of other Fidelity® funds. Mr. Stavropoulos serves as President and Founder of the Michigan Baseball Foundation, the Great Lakes Loons (2007-present). Mr. Stavropoulos is Chairman Emeritus of the Board of Directors of The Dow Chemical Company, where he previously served in numerous senior management positions, including President, CEO (1995-2000; 2002-2004), Chairman of the Executive Committee (2000-2006), and as a member of the Board of Directors (1990-2006). Currently, Mr. Stavropoulos is Chairman of the Board of Directors of Univar Inc. (global distributor of commodity and specialty chemicals), a Director of Teradata Corporation (data warehousing and technology solutions), and a member of the Advisory Board for Metalmark Capital LLC (private equity investment, 2005-present). Mr. Stavropoulos is an operating advisor to Clayton, Dubilier & Rice, LLC (private equity investment). In addition, Mr. Stavropoulos is a member of the University of Notre Dame Advisory Council for the College of Science, a Trustee of the Rollin L. Gerstacker Foundation, and a Director of Artis-Naples in Naples, Florida. Previously, Mr. Stavropoulos served as a Director of Chemical Financial Corporation (bank holding company, 1993-2012) and Tyco International, Ltd. (multinational manufacturing and services, 2007-2012).
David M. Thomas (1949)
Year of Election or Appointment: 2008
Trustee
Mr. Thomas also serves as Trustee of other Fidelity® funds. Mr. Thomas serves as Non-Executive Chairman of the Board of Directors of Fortune Brands Home and Security (home and security products, 2011-present), as a member of the Board of Directors (2004-present) and Presiding Director (2013-present) of Interpublic Group of Companies, Inc. (marketing communication), and as a member of the Board of Trustees of the University of Florida (2013-present). Previously, Mr. Thomas served as Executive Chairman (2005-2006) and Chairman and Chief Executive Officer (2000-2005) of IMS Health, Inc. (pharmaceutical and healthcare information solutions), and a Director of Fortune Brands, Inc. (consumer products, 2000-2011).
+ The information includes the Trustee's principal occupation during the last five years and other information relating to the experience, attributes, and skills relevant to the Trustee's qualifications to serve as a Trustee, which led to the conclusion that the Trustee should serve as a Trustee for the fund.
Advisory Board Members and Officers:
Correspondence intended for an officer or Peter S. Lynch may be sent to Fidelity Investments, 245 Summer Street, Boston, Massachusetts 02210. Officers appear below in alphabetical order.
Name, Year of Birth; Principal Occupation
Peter S. Lynch (1944)
Year of Election or Appointment: 2003
Member of the Advisory Board
Mr. Lynch also serves as Member of the Advisory Board of other Fidelity® funds. Mr. Lynch is Vice Chairman and a Director of FMR (investment adviser firm) and FMR Co., Inc. (investment adviser firm). In addition, Mr. Lynch serves as a Trustee of Boston College and as the Chairman of the Inner-City Scholarship Fund. Previously, Mr. Lynch served on the Special Olympics International Board of Directors (1997-2006).
Elizabeth Paige Baumann (1968)
Year of Election or Appointment: 2017
Interim Anti-Money Laundering (AML) Officer
Ms. Baumann also serves as AML Officer of other funds. She is Chief AML Officer (2012-present) and Senior Vice President (2014-present) of FMR LLC (diversified financial services company) and is an employee of Fidelity Investments. Previously, Ms. Baumann served as AML Officer (2012-2016), Vice President (2007-2014), and Deputy Anti-Money Laundering Officer (2007-2012).
Marc R. Bryant (1966)
Year of Election or Appointment: 2015
Secretary and Chief Legal Officer (CLO)
Mr. Bryant also serves as Secretary and CLO of other funds. Mr. Bryant serves as CLO, Secretary, and Senior Vice President of Fidelity Management & Research Company (investment adviser firm, 2015-present) and FMR Co., Inc. (investment adviser firm, 2015-present); Secretary of Fidelity SelectCo, LLC (investment adviser firm, 2015-present) and Fidelity Investments Money Management, Inc. (investment adviser firm, 2015-present); and CLO of Fidelity Management & Research (Hong Kong) Limited and FMR Investment Management (UK) Limited (investment adviser firms, 2015-present) and Fidelity Management & Research (Japan) Limited (investment adviser firm, 2016-present). He is Senior Vice President and Deputy General Counsel of FMR LLC (diversified financial services company). Previously, Mr. Bryant served as Secretary and CLO of Fidelity Rutland Square Trust II (2010-2014) and Assistant Secretary of Fidelity's Fixed Income and Asset Allocation Funds (2013-2015). Prior to joining Fidelity Investments, Mr. Bryant served as a Senior Vice President and the Head of Global Retail Legal for AllianceBernstein L.P. (2006-2010), and as the General Counsel for ProFund Advisors LLC (2001-2006).
Jeffrey S. Christian (1961)
Year of Election or Appointment: 2016
Assistant Treasurer
Mr. Christian also serves as Assistant Treasurer of other funds. Mr. Christian is an employee of Fidelity Investments (2003-present).
William C. Coffey (1969)
Year of Election or Appointment: 2009
Assistant Secretary
Mr. Coffey also serves as Assistant Secretary of other funds. He is Senior Vice President and Deputy General Counsel of FMR LLC (diversified financial services company, 2010-present), and is an employee of Fidelity Investments. Previously, Mr. Coffey served as Vice President and Associate General Counsel of FMR LLC (2005-2009).
Jonathan Davis (1968)
Year of Election or Appointment: 2010
Assistant Treasurer
Mr. Davis also serves as Assistant Treasurer of other funds, and is an employee of Fidelity Investments. Previously, Mr. Davis served as Vice President and Associate General Counsel of FMR LLC (diversified financial services company, 2003-2010).
Adrien E. Deberghes (1967)
Year of Election or Appointment: 2016
Assistant Treasurer
Mr. Deberghes also serves as an officer of other funds. He serves as Executive Vice President of Fidelity Investments Money Management, Inc. (FIMM) (investment adviser firm, 2016-present) and is an employee of Fidelity Investments (2008-present). Prior to joining Fidelity Investments, Mr. Deberghes was Senior Vice President of Mutual Fund Administration at State Street Corporation (2007-2008), Senior Director of Mutual Fund Administration at Investors Bank & Trust (2005-2007), and Director of Finance for Dunkin' Brands (2000-2005). Previously, Mr. Deberghes served in other fund officer roles.
Stephanie J. Dorsey (1969)
Year of Election or Appointment: 2010
Assistant Treasurer
Ms. Dorsey also serves as an officer of other funds. She is an employee of Fidelity Investments (2008-present) and has served in other fund officer roles. Prior to joining Fidelity Investments, Ms. Dorsey served as Treasurer (2004-2008) of the JPMorgan Mutual Funds and Vice President (2004-2008) of JPMorgan Chase Bank.
Howard J. Galligan III (1966)
Year of Election or Appointment: 2014
Chief Financial Officer
Mr. Galligan also serves as Chief Financial Officer of other funds. Mr. Galligan serves as President of Fidelity Pricing and Cash Management Services (FPCMS) (2014-present) and as a Director of Strategic Advisers, Inc. (investment adviser firm, 2008-present). Previously, Mr. Galligan served as Chief Administrative Officer of Asset Management (2011-2014) and Chief Operating Officer and Senior Vice President of Investment Support for Strategic Advisers, Inc. (2003-2011).
Scott C. Goebel (1968)
Year of Election or Appointment: 2015
Vice President
Mr. Goebel serves as Vice President of other funds and is an employee of Fidelity Investments (2001-present). Previously, Mr. Goebel served as Senior Vice President of Fidelity Management & Research Company (FMR) (investment adviser firm, 2016), Secretary of Fidelity SelectCo, LLC (investment adviser firm, 2013-2015), Fidelity Investments Money Management, Inc. (FIMM) (investment adviser firm, 2010-2015), and Fidelity Research and Analysis Company (FRAC) (investment adviser firm, 2010-2015); General Counsel, Secretary, and Senior Vice President of FMR (investment adviser firm, 2008-2015) and FMR Co., Inc. (investment adviser firm, 2008-2015); Assistant Secretary of Fidelity Management & Research (Japan) Limited (investment adviser firm, 2008-2015) and Fidelity Management & Research (U.K.) Inc. (investment adviser firm, 2008-2015); Chief Legal Officer (CLO) of Fidelity Management & Research (Hong Kong) Limited (investment adviser firm, 2008-2015); Secretary and CLO of certain Fidelity® funds (2008-2015); Assistant Secretary of FIMM (2008-2010), FRAC (2008-2010), and certain funds (2007-2008); and as Vice President and Secretary of Fidelity Distributors Corporation (FDC) (2005-2007).
Thomas C. Hense (1964)
Year of Election or Appointment: 2008, 2010, or 2015
Vice President
Mr. Hense serves as Vice President of Fidelity Advisor® Multi-Asset Income Fund (2015) and other funds (High Income (2008), Small Cap (2008), and Value (2010) funds), and is an employee of Fidelity Investments (1993-present). Previously, Mr. Hense served as a portfolio manager for Fidelity's Institutional Money Management Group (Pyramis) (2003-2008).
Brian B. Hogan (1964)
Year of Election or Appointment: 2009
Vice President
Mr. Hogan also serves as Trustee or Vice President of other funds. Mr. Hogan serves as a Director of FMR Investment Management (UK) Limited (investment adviser firm, 2015-present) and Fidelity SelectCo, LLC (investment adviser firm, 2014-present) and President of the Equity Division of FMR (investment adviser firm, 2009-present). Previously, Mr. Hogan served as Senior Vice President, Equity Research of FMR (2006-2009) and as a portfolio manager. Mr. Brian B. Hogan is not related to Mr. Colm A. Hogan.
Colm A. Hogan (1973)
Year of Election or Appointment: 2016
Deputy Treasurer
Mr. Hogan also serves as an officer of other funds. Mr. Hogan is an employee of Fidelity Investments (2005-present). Mr. Colm A. Hogan is not related to Mr. Brian B. Hogan.
Chris Maher (1972)
Year of Election or Appointment: 2013
Assistant Treasurer
Mr. Maher serves as Assistant Treasurer of other funds. Mr. Maher is Vice President of Valuation Oversight and is an employee of Fidelity Investments. Previously, Mr. Maher served as Vice President of Asset Management Compliance (2013), Vice President of the Program Management Group of FMR (investment adviser firm, 2010-2013), and Vice President of Valuation Oversight (2008-2010).
Kenneth B. Robins (1969)
Year of Election or Appointment: 2016
Chief Compliance Officer
Mr. Robins also serves as an officer of other funds. Mr. Robins serves as Compliance Officer of Fidelity Management & Research Company and FMR Co., Inc. (investment adviser firms, 2016-present) and is an employee of Fidelity Investments (2004-present). Previously, Mr. Robins served as Executive Vice President of Fidelity Investments Money Management, Inc. (investment adviser firm, 2013-2016) and served in other fund officer roles.
Stacie M. Smith (1974)
Year of Election or Appointment: 2016
President and Treasurer
Ms. Smith also serves as an officer of other funds. She is an employee of Fidelity Investments (2009-present) and has served in other fund officer roles. Prior to joining Fidelity Investments, Ms. Smith served as Senior Audit Manager of Ernst & Young LLP (accounting firm, 1996-2009). Previously, Ms. Smith served as Deputy Treasurer of certain Fidelity® funds (2013-2016).
Marc L. Spector (1972)
Year of Election or Appointment: 2016
Assistant Treasurer
Mr. Spector also serves as an officer of other funds. Mr. Spector is an employee of Fidelity Investments (2016-present). Prior to joining Fidelity Investments, Mr. Spector served as Director at the Siegfried Group (accounting firm, 2013-2016), and prior to Siegfried Group as audit senior manager at Deloitte & Touche (accounting firm, 2005-2013).
Renee Stagnone (1975)
Year of Election or Appointment: 2016
Assistant Treasurer
Ms. Stagnone also serves as an officer of other funds. Ms. Stagnone is an employee of Fidelity Investments (1997-present). Previously, Ms. Stagnone served as Deputy Treasurer of certain Fidelity® funds (2013-2016).
Shareholder Expense Example
As a shareholder of the Fund, you incur two types of costs: (1) transaction costs, and (2) ongoing costs, including management fees and other Fund expenses. This Example is intended to help you understand your ongoing costs (in dollars) of investing in the Fund and to compare these costs with the ongoing costs of investing in other mutual funds.
The Example is based on an investment of $1,000 invested at the beginning of the period and held for the entire period (August 1, 2016 to January 31, 2017).
Actual Expenses
The first line of the accompanying table for each class of the Fund provides information about actual account values and actual expenses. You may use the information in this line, together with the amount you invested, to estimate the expenses that you paid over the period. Simply divide your account value by $1,000.00 (for example, an $8,600 account value divided by $1,000.00 = 8.6), then multiply the result by the number in the first line for a class of the Fund under the heading entitled "Expenses Paid During Period" to estimate the expenses you paid on your account during this period. A small balance maintenance fee of $12.00 that is charged once a year may apply for certain accounts with a value of less than $2,000. This fee is not included in the table below. If it was, the estimate of expenses you paid during the period would be higher, and your ending account value lower, by this amount. In addition, the Fund, as a shareholder in the underlying Fidelity Central Funds, will indirectly bear its pro-rata share of the fees and expenses incurred by the underlying Fidelity Central Funds. These fees and expenses are not included in the Fund's annualized expense ratio used to calculate the expense estimate in the table below.
Hypothetical Example for Comparison Purposes
The second line of the accompanying table for each class of the Fund provides information about hypothetical account values and hypothetical expenses based on a Class' actual expense ratio and an assumed rate of return of 5% per year before expenses, which is not the Class' actual return. The hypothetical account values and expenses may not be used to estimate the actual ending account balance or expenses you paid for the period. You may use this information to compare the ongoing costs of investing in the Fund and other funds. To do so, compare this 5% hypothetical example with the 5% hypothetical examples that appear in the shareholder reports of the other funds. A small balance maintenance fee of $12.00 that is charged once a year may apply for certain accounts with a value of less than $2,000. This fee is not included in the table below. If it was, the estimate of expenses you paid during the period would be higher, and your ending account value lower, by this amount. In addition, the Fund, as a shareholder in the underlying Fidelity Central Funds, will indirectly bear its pro-rata share of the fees and expenses incurred by the underlying Fidelity Central Funds. These fees and expenses are not included in the Fund's annualized expense ratio used to calculate the expense estimate in the table below.
Please note that the expenses shown in the table are meant to highlight your ongoing costs only and do not reflect any transaction costs. Therefore, the second line of the table is useful in comparing ongoing costs only, and will not help you determine the relative total costs of owning different funds.
| | Annualized Expense Ratio-A | Beginning
Account Value
August 1, 2016 | Ending
Account Value
January 31, 2017 | Expenses Paid
During Period-B
August 1, 2016
to January 31, 2017 |
| Equity-Income | .62% | | | |
| Actual | | $1,000.00 | $1,084.60 | $3.25 |
| Hypothetical-C | | $1,000.00 | $1,022.02 | $3.15 |
| Class K | .52% | | | |
| Actual | | $1,000.00 | $1,085.30 | $2.73 |
| Hypothetical-C | | $1,000.00 | $1,022.52 | $2.64 |
A Annualized expense ratio reflects expenses net of applicable fee waivers.
B Expenses are equal to each Class' annualized expense ratio, multiplied by the average account value over the period, multiplied by 184/366 (to reflect the one-half year period).
C 5% return per year before expenses
Distributions (Unaudited)
The Board of Trustees of Fidelity Equity-Income Fund voted to pay to shareholders of record at the opening of business on record date, the following distributions per share derived from capital gains realized from sales of portfolio securities:
| | Pay Date | Record Date | Capital Gains |
| Fidelity Equity-Income Fund | | | |
| Equity Income | 03/13/2017 | 03/10/2017 | $0.507 |
| Class K | 03/13/2017 | 03/10/2017 | $0.512 |
|
The fund hereby designates as a capital gain dividend with respect to the taxable year ended January 31, 2017, $107,001,300, or, if subsequently determined to be different, the net capital gain of such year.
A total of 0.16% of the dividends distributed during the fiscal year was derived from interest on U.S. Government securities which is generally exempt from state income tax.
Equity Income designates 85%, 85%, 85%, 85% and 84%; Class K designates 71%, 80%, 81%, 81% and 82%; of the dividends distributed in March, April, July, October and December 2016, respectively during the fiscal year as qualifying for the dividends–received deduction for corporate shareholders.
Equity Income designates 71%, 91%, 96%, 96% and 96%; Class K designates 59%, 85%, 92%, 92% and 93%; of the dividends distributed in March, April, July, October and December 2016, respectively during the fiscal year as amounts which may be taken into account as a dividend for purposes of the maximum rate under section 1(h)(11) of the Internal Revenue Code.
The fund will notify shareholders in January 2018 of amounts for use in preparing 2017 income tax returns.
Corporate Headquarters
245 Summer St.
Boston, MA 02210
www.fidelity.com
EQU-K-ANN-0317
1.863282.108
Item 2.
Code of Ethics
As of the end of the period, January 31, 2017, Fidelity Devonshire Trust (the trust) has adopted a code of ethics, as defined in Item 2 of Form N-CSR, that applies to its President and Treasurer and its Chief Financial Officer. A copy of the code of ethics is filed as an exhibit to this Form N-CSR.
Item 3.
Audit Committee Financial Expert
The Board of Trustees of the trust has determined that Joseph Mauriello is an audit committee financial expert, as defined in Item 3 of Form N-CSR. Mr. Mauriello is independent for purposes of Item 3 of Form N-CSR.
Item 4.
Principal Accountant Fees and Services
Fees and Services
The following table presents fees billed by Deloitte & Touche LLP, the member firms of Deloitte Touche Tohmatsu, and their respective affiliates (collectively, “Deloitte Entities”) in each of the last two fiscal years for services rendered to Fidelity Advisor Series Equity-Income Fund, Fidelity Series All-Sector Equity Fund, and Fidelity Series Equity-Income Fund (the “Funds”):
Services Billed by Deloitte Entities
January 31, 2017 FeesA
| | | | |
| Audit Fees | Audit-Related Fees | Tax Fees | All Other Fees |
Fidelity Advisor Series Equity-Income Fund | $48,000 | $- | $7,000 | $1,400 |
Fidelity Series All-Sector Equity Fund | $47,000 | $- | $5,200 | $1,400 |
Fidelity Series Equity-Income Fund | $48,000 | $- | $9,900 | $1,400 |
| | | | |
| Audit Fees | Audit-Related Fees | Tax Fees | All Other Fees |
Fidelity Advisor Series Equity-Income Fund | $50,000 | $- | $6,800 | $1,000 |
Fidelity Series All-Sector Equity Fund | $49,000 | $- | $4,900 | $2,700 |
Fidelity Series Equity-Income Fund | $51,000 | $- | $9,900 | $3,000 |
A Amounts may reflect rounding.
The following table presents fees billed by PricewaterhouseCoopers LLP (“PwC”) in each of the last two fiscal years for services rendered to Fidelity Advisor Series Stock Selector Large Cap Value Fund, Fidelity Equity-Income Fund, Fidelity Mid Cap Value Fund, Fidelity Series Stock Selector Large Cap Value Fund and Fidelity Stock Selector Large Cap Value Fund (the “Funds”):
Services Billed by PwC
January 31, 2017 FeesA
| | | | |
| Audit Fees | Audit-Related Fees | Tax Fees | All Other Fees |
Fidelity Advisor Series Stock Selector Large Cap Value Fund | $47,000 | $- | $3,200 | $2,100 |
Fidelity Equity-Income Fund | $80,000 | $- | $16,200 | $3,300 |
Fidelity Mid Cap Value Fund | $55,000 | $- | $4,100 | $2,500 |
Fidelity Series Stock Selector Large Cap Value Fund | $51,000 | $- | $3,200 | $2,300 |
Fidelity Stock Selector Large Cap Value Fund | $55,000 | $- | $4,300 | $2,500 |
| | | | |
| | | | |
| Audit Fees | Audit-Related Fees | Tax Fees | All Other Fees |
Fidelity Advisor Series Stock Selector Large Cap Value Fund | $47,000 | $- | $2,800 | $2,000 |
Fidelity Equity-Income Fund | $76,000 | $- | $7,600 | $4,500 |
Fidelity Mid Cap Value Fund | $56,000 | $- | $3,500 | $2,800 |
Fidelity Series Stock Selector Large Cap Value Fund | $55,000 | $- | $2,800 | $4,200 |
Fidelity Stock Selector Large Cap Value Fund | $54,000 | $- | $3,500 | $1,900 |
| | | | |
| | | | |
A Amounts may reflect rounding.
The following table presents fees billed by PwC and Deloitte Entities that were required to be approved by the Audit Committee for services that relate directly to the operations and financial reporting of the Funds and that are rendered on behalf of Fidelity Management & Research Company (“FMR”) and entities controlling, controlled by, or under common control with FMR (not including any sub-adviser whose role is primarily portfolio management and is subcontracted with or overseen by another investment adviser) that provide ongoing services to the Funds (“Fund Service Providers”):
Services Billed by Deloitte Entities
| | |
| January 31, 2017A | January 31, 2016A |
Audit-Related Fees | $35,000 | $- |
Tax Fees | $5,000 | $10,000 |
All Other Fees | $- | $- |
A Amounts may reflect rounding.
Services Billed by PwC
| | |
| January 31, 2017A | January 31, 2016A,B |
Audit-Related Fees | $5,835,000 | $5,470,000 |
Tax Fees | $55,000 | $- |
All Other Fees | $- | $- |
A Amounts may reflect rounding.
B Reflects current period presentation.
“Audit-Related Fees” represent fees billed for assurance and related services that are reasonably related to the performance of the fund audit or the review of the fund's financial statements and that are not reported under Audit Fees.
“Tax Fees” represent fees billed for tax compliance, tax advice or tax planning that relate directly to the operations and financial reporting of the fund.
“All Other Fees” represent fees billed for services provided to the fund or Fund Service Provider, a significant portion of which are assurance related, that relate directly to the operations and financial reporting of the fund, excluding those services that are reported under Audit Fees, Audit-Related Fees or Tax Fees.
Assurance services must be performed by an independent public accountant.
* * *
The aggregate non-audit fees billed by PwC and Deloitte Entities for services rendered to the Funds, FMR (not including any sub-adviser whose role is primarily portfolio management and is subcontracted with or overseen by another investment adviser), and any Fund Service Provider for each of the last two fiscal years of the Funds are as follows:
| | |
Billed By | January 31, 2017 A | January 31, 2016 A,B |
Deloitte Entities | $285,000 | $75,000 |
PwC | $7,810,000 | $6,180,000 |
A Amounts may reflect rounding.
B Reflects current period presentation.
The trust's Audit Committee has considered non-audit services that were not pre-approved that were provided by PwC and Deloitte Entities to Fund Service Providers to be compatible with maintaining the independence of PwC and Deloitte Entities in their audits of the Funds, taking into account representations from PwC and Deloitte Entities, in accordance with Public Company Accounting Oversight Board rules, regarding their independence from the Funds and their related entities and FMR’s review of the appropriateness and permissibility under applicable law of such non-audit services prior to their provision to the Fund Service Providers.
Audit Committee Pre-Approval Policies and Procedures
The trust’s Audit Committee must pre-approve all audit and non-audit services provided by a fund’s independent registered public accounting firm relating to the operations or financial reporting of the fund. Prior to the commencement of any audit or non-audit services to a fund, the Audit Committee reviews the services to determine whether they are appropriate and permissible under applicable law.
The Audit Committee has adopted policies and procedures to, among other purposes, provide a framework for the Committee’s consideration of non-audit services by the audit firms that audit the Fidelity funds. The policies and procedures require that any non-audit service provided by a fund audit firm to a Fidelity fund and any non-audit service provided by a fund auditor to a Fund Service Provider that relates directly to the operations and financial reporting of a Fidelity fund (“Covered Service”) are subject to approval by the Audit Committee before such service is provided.
All Covered Services must be approved in advance of provision of the service either: (i) by formal resolution of the Audit Committee, or (ii) by oral or written approval of the service by the Chair of the Audit Committee (or if the Chair is unavailable, such other member of the Audit Committee as may be designated by the Chair to act in the Chair’s absence). The approval contemplated by (ii) above is permitted where the Treasurer determines that action on such an engagement is necessary before the next meeting of the Audit Committee.
Non-audit services provided by a fund audit firm to a Fund Service Provider that do not relate directly to the operations and financial reporting of a Fidelity fund are reported to the Audit Committee on a periodic basis.
Non-Audit Services Approved Pursuant to Rule 2-01(c)(7)(i)(C) and (ii) of Regulation S-X (“De Minimis Exception”)
There were no non-audit services approved or required to be approved by the Audit Committee pursuant to the De Minimis Exception during the Funds’ last two fiscal years relating to services provided to (i) the Funds or (ii) any Fund Service Provider that relate directly to the operations and financial reporting of the Funds.
Item 5.
Audit Committee of Listed Registrants
Not applicable.
Item 6.
Investments
(a)
Not applicable.
(b)
Not applicable
Item 7.
Disclosure of Proxy Voting Policies and Procedures for Closed-End Management Investment Companies
Not applicable.
Item 8.
Portfolio Managers of Closed-End Management Investment Companies
Not applicable.
Item 9.
Purchase of Equity Securities by Closed-End Management Investment Company and Affiliated Purchasers
Not applicable.
Item 10.
Submission of Matters to a Vote of Security Holders
There were no material changes to the procedures by which shareholders may recommend nominees to the trust’s Board of Trustees.
Item 11.
Controls and Procedures
(a)(i) The President and Treasurer and the Chief Financial Officer have concluded that the trust’s disclosure controls and procedures (as defined in Rule 30a-3(c) under the Investment Company Act) provide reasonable assurances that material information relating to the trust is made known to them by the appropriate persons, based on their evaluation of these controls and procedures as of a date within 90 days of the filing date of this report.
(a)(ii) There was no change in the trust’s internal control over financial reporting (as defined in Rule 30a-3(d) under the Investment Company Act) that occurred during the second fiscal quarter of the period covered by this report that has materially affected, or is reasonably likely to materially affect, the trust’s internal control over financial reporting.
Item 12.
Exhibits
| | |
(a) | (1) | Code of Ethics pursuant to Item 2 of Form N-CSR is filed and attached hereto as EX-99.CODE ETH. |
(a) | (2) | Certification pursuant to Rule 30a-2(a) under the Investment Company Act of 1940 (17 CFR 270.30a-2(a)) is filed and attached hereto as Exhibit 99.CERT. |
(a) | (3) | Not applicable. |
(b) | | Certification pursuant to Rule 30a-2(b) under the Investment Company Act of 1940 (17 CFR 270.30a-2(b)) is furnished and attached hereto as Exhibit 99.906CERT. |
SIGNATURES
Pursuant to the requirements of the Securities Exchange Act of 1934 and the Investment Company Act of 1940, the registrant has duly caused this report to be signed on its behalf by the undersigned, thereunto duly authorized.
Fidelity Devonshire Trust
| |
By: | /s/Stacie M. Smith |
| Stacie M. Smith |
| President and Treasurer |
| |
Date: | March 29, 2017 |
Pursuant to the requirements of the Securities Exchange Act of 1934 and the Investment Company Act of 1940, this report has been signed below by the following persons on behalf of the registrant and in the capacities and on the dates indicated.
| |
By: | /s/ Stacie M. Smith |
| Stacie M. Smith |
| President and Treasurer |
| |
Date: | March 29, 2017 |
| |
By: | /s/Howard J. Galligan III |
| Howard J. Galligan III |
| Chief Financial Officer |
| |
Date: | March 29, 2017 |