UNITED STATES
SECURITIES AND EXCHANGE COMMISSION
Washington, D.C. 20549
FORM N-CSR
CERTIFIED SHAREHOLDER REPORT OF REGISTERED
MANAGEMENT INVESTMENT COMPANIES
Investment Company Act file number 811-1352
Fidelity Devonshire Trust
(Exact name of registrant as specified in charter)
245 Summer St., Boston, Massachusetts 02210
(Address of principal executive offices) (Zip code)
William C. Coffey, Secretary
245 Summer St.
Boston, Massachusetts 02210
(Name and address of agent for service)
Registrant's telephone number, including area code:
617-563-7000
Date of fiscal year end: | January 31 |
|
|
Date of reporting period: | January 31, 2019 |
Item 1.
Reports to Stockholders
Fidelity® Equity-Income Fund Annual Report January 31, 2019 |
 |
Beginning on January 1, 2021, as permitted by regulations adopted by the Securities and Exchange Commission, paper copies of a fund’s shareholder reports will no longer be sent by mail, unless you specifically request paper copies of the reports from the fund or from your financial intermediary, such as a financial advisor, broker-dealer or bank. Instead, the reports will be made available on a website, and you will be notified by mail each time a report is posted and provided with a website link to access the report.
If you already elected to receive shareholder reports electronically, you will not be affected by this change and you need not take any action. You may elect to receive shareholder reports and other communications from a fund electronically, by contacting your financial intermediary. For Fidelity customers, visit Fidelity's web site or call Fidelity using the contact information listed below.
You may elect to receive all future reports in paper free of charge. If you wish to continue receiving paper copies of your shareholder reports, you may contact your financial intermediary or, if you are a Fidelity customer, visit Fidelity’s website, or call Fidelity at the applicable toll-free number listed below. Your election to receive reports in paper will apply to all funds held with the fund complex/your financial intermediary.
| Account Type | Website | Phone Number |
| Brokerage, Mutual Fund, or Annuity Contracts: | fidelity.com/mailpreferences | 1-800-343-3548 |
| Employer Provided Retirement Accounts: | netbenefits.fidelity.com/preferences (choose 'no' under Required Disclosures to continue to print) | 1-800-343-0860 |
| Advisor Sold Accounts Serviced Through Your Financial Intermediary: | Contact Your Financial Intermediary | Your Financial Intermediary's phone number |
| Advisor Sold Accounts Serviced by Fidelity: | institutional.fidelity.com | 1-877-208-0098 |
Contents
Board Approval of Investment Advisory Contracts and Management Fees |
To view a fund's proxy voting guidelines and proxy voting record for the 12-month period ended June 30, visit http://www.fidelity.com/proxyvotingresults or visit the Securities and Exchange Commission's (SEC) web site at http://www.sec.gov.
You may also call 1-800-544-8544 if you’re an individual investing directly with Fidelity, call 1-800-835-5092 if you’re a plan sponsor or participant with Fidelity as your recordkeeper or call 1-877-208-0098 on institutional accounts or if you’re an advisor or invest through one to request a free copy of the proxy voting guidelines.
Standard & Poor's, S&P and S&P 500 are registered service marks of The McGraw-Hill Companies, Inc. and have been licensed for use by Fidelity Distributors Corporation.
Other third-party marks appearing herein are the property of their respective owners.
All other marks appearing herein are registered or unregistered trademarks or service marks of FMR LLC or an affiliated company. © 2019 FMR LLC. All rights reserved.
This report and the financial statements contained herein are submitted for the general information of the shareholders of the Fund. This report is not authorized for distribution to prospective investors in the Fund unless preceded or accompanied by an effective prospectus.
A fund files its complete schedule of portfolio holdings with the SEC for the first and third quarters of each fiscal year on Form N-Q. Forms N-Q are available on the SEC’s web site at http://www.sec.gov. A fund's Forms N-Q may be reviewed and copied at the SEC’s Public Reference Room in Washington, DC. Information regarding the operation of the SEC's Public Reference Room may be obtained by calling 1-800-SEC-0330.
For a complete list of a fund's portfolio holdings, view the most recent holdings listing, semiannual report, or annual report on Fidelity's web site at http://www.fidelity.com, http://www.institutional.fidelity.com, or http://www.401k.com, as applicable.
NOT FDIC INSURED •MAY LOSE VALUE •NO BANK GUARANTEE
Neither the Fund nor Fidelity Distributors Corporation is a bank.
Performance: The Bottom Line
Average annual total return reflects the change in the value of an investment, assuming reinvestment of distributions from dividend income and capital gains (the profits earned upon the sale of securities that have grown in value, if any) and assuming a constant rate of performance each year. The hypothetical investment and the average annual total returns do not reflect the deduction of taxes that a shareholder would pay on fund distributions or the redemption of fund shares. During periods of reimbursement by Fidelity, a fund’s total return will be greater than it would be had the reimbursement not occurred. How a fund did yesterday is no guarantee of how it will do tomorrow.
Average Annual Total Returns
| For the periods ended January 31, 2019 | Past 1 year | Past 5 years | Past 10 years |
| Fidelity® Equity-Income Fund | (5.91)% | 7.28% | 12.61% |
| Class K | (5.81)% | 7.40% | 12.76% |
$10,000 Over 10 Years
Let's say hypothetically that $10,000 was invested in Fidelity® Equity-Income Fund, a class of the fund, on January 31, 2009.
The chart shows how the value of your investment would have changed, and also shows how the Russell 3000® Value Index performed over the same period.

| Period Ending Values | ||
| $32,799 | Fidelity® Equity-Income Fund | |
| $35,126 | Russell 3000® Value Index | |
Management's Discussion of Fund Performance
Market Recap: The S&P 500® index returned -2.31% for the 12 months ending January 31, 2019, as the U.S. equity bellwether began the new year on a high note after enduring a final quarter of 2018 in which resurgent volatility upset the aging bull market. In October, rising U.S. Treasury yields and concern about peaking corporate earnings growth sent many investors fleeing from risk assets as they were still dealing with lingering uncertainty related to global trade and the U.S. Federal Reserve picking up the pace of interest rate hikes. The index returned -6.84% in October, at the time its largest monthly drop in seven years. But conditions worsened through Christmas, as jitters about the economy and another hike in rates led to a spike in market volatility and a -9.03% result for December. Sharply reversing course to begin 2019, the S&P 500® gained 8.01% in January, its strongest opening month since 1987, amid upbeat company earnings/outlooks and signs the Fed may pause on rates. For the full period, some economically sensitive sectors were at the bottom of the 12-month performance scale: materials (-14%), energy (-12%), financials (-11%) and industrials (-8%). Meanwhile, communication services – which includes dividend-rich telecom stocks – and consumer staples returned about -5%. In contrast, the defensive utilities (+11%), real estate (+10%) and health care (+5%) sectors led the way. Information technology and consumer discretionary were rattled in the late-2018 downturn, but earlier strength resulted in each advancing about 3%.Comments from Lead Portfolio Manager Ramona Persaud: For the fiscal year, the fund's Retail Class shares returned -5.91%, lagging the -4.76% result of the benchmark Russell 3000® Value Index. The fund’s underperformance of the benchmark was primarily due to my focus on value and downside protection. The fund trailed the benchmark for most of the period, as growth stocks rallied, but outperformed in the fourth quarter of 2018, when volatility hit the markets. For the full year, industry positioning detracted versus the benchmark, as did security selection, but to a lesser extent. Stock picking and an overweighting in consumer staples hurt most, followed by positioning in health care and choices in financials and materials. Conversely, stock choices and an overweighting in information technology helped most versus the benchmark. My picks in energy and consumer discretionary also helped our relative result. The fund's cash position of about 5%, on average, this period was another plus. The fund's foreign holdings detracted overall, hampered in part by a broadly stronger U.S. dollar. Included was an out-of-benchmark position in British American Tobacco. The stock declined due to concerns about competition for tobacco alternatives, as well as the possibility of tighter regulation. Meanwhile, a large position in Chicago-based utilities firm Exelon was the fund's top contributor. The company specializes in nuclear power, as well as solar, wind, gas and hydroelectric generating power plants. As regulatory support for nuclear generation improved the past 12 months, the stock rose.The views expressed above reflect those of the portfolio manager(s) only through the end of the period as stated on the cover of this report and do not necessarily represent the views of Fidelity or any other person in the Fidelity organization. Any such views are subject to change at any time based upon market or other conditions and Fidelity disclaims any responsibility to update such views. These views may not be relied on as investment advice and, because investment decisions for a Fidelity fund are based on numerous factors, may not be relied on as an indication of trading intent on behalf of any Fidelity fund.
Investment Summary (Unaudited)
Top Ten Stocks as of January 31, 2019
| % of fund's net assets | |
| JPMorgan Chase & Co. | 4.1 |
| Verizon Communications, Inc. | 3.8 |
| Cisco Systems, Inc. | 3.6 |
| Johnson & Johnson | 3.5 |
| Bank of America Corp. | 3.2 |
| Wells Fargo & Co. | 3.2 |
| United Technologies Corp. | 2.4 |
| Chevron Corp. | 2.3 |
| Citigroup, Inc. | 2.3 |
| The Blackstone Group LP | 2.3 |
| 30.7 |
Top Five Market Sectors as of January 31, 2019
| % of fund's net assets | |
| Financials | 23.2 |
| Health Care | 14.3 |
| Information Technology | 11.4 |
| Energy | 10.3 |
| Industrials | 8.3 |
Asset Allocation (% of fund's net assets)
| As of January 31, 2019* | ||
| Stocks | 96.5% | |
| Bonds | 0.1% | |
| Convertible Securities | 0.3% | |
| Other Investments | 0.3% | |
| Short-Term Investments and Net Other Assets (Liabilities) | 2.8% | |

* Foreign investments - 12.6%
Schedule of Investments January 31, 2019
Showing Percentage of Net Assets
| Common Stocks - 96.5% | |||
| Shares | Value (000s) | ||
| COMMUNICATION SERVICES - 7.2% | |||
| Diversified Telecommunication Services - 4.2% | |||
| AT&T, Inc. | 892,689 | $26,834 | |
| Verizon Communications, Inc. | 3,977,860 | 219,021 | |
| 245,855 | |||
| Entertainment - 0.6% | |||
| The Walt Disney Co. | 295,700 | 32,976 | |
| Media - 2.4% | |||
| Comcast Corp. Class A | 2,966,088 | 108,470 | |
| Interpublic Group of Companies, Inc. | 832,900 | 18,948 | |
| Omnicom Group, Inc. | 203,900 | 15,880 | |
| 143,298 | |||
| Wireless Telecommunication Services - 0.0% | |||
| T-Mobile U.S., Inc. (a) | 1,443 | 100 | |
| TOTAL COMMUNICATION SERVICES | 422,229 | ||
| CONSUMER DISCRETIONARY - 5.7% | |||
| Automobiles - 0.7% | |||
| General Motors Co. | 1,036,300 | 40,436 | |
| Hotels, Restaurants & Leisure - 3.1% | |||
| Cedar Fair LP (depositary unit) | 353,100 | 19,526 | |
| Dunkin' Brands Group, Inc. | 208,100 | 14,232 | |
| McDonald's Corp. | 614,100 | 109,789 | |
| Royal Caribbean Cruises Ltd. | 157,600 | 18,920 | |
| Wyndham Hotels & Resorts, Inc. | 320,900 | 15,753 | |
| 178,220 | |||
| Multiline Retail - 0.3% | |||
| Macy's, Inc. | 710,000 | 18,673 | |
| Specialty Retail - 1.6% | |||
| Home Depot, Inc. | 160,800 | 29,512 | |
| Lowe's Companies, Inc. | 283,400 | 27,252 | |
| TJX Companies, Inc. | 668,800 | 33,259 | |
| 90,023 | |||
| Textiles, Apparel & Luxury Goods - 0.0% | |||
| PVH Corp. | 19,200 | 2,095 | |
| TOTAL CONSUMER DISCRETIONARY | 329,447 | ||
| CONSUMER STAPLES - 7.6% | |||
| Beverages - 0.5% | |||
| Keurig Dr. Pepper, Inc. | 263,700 | 7,178 | |
| PepsiCo, Inc. | 200,000 | 22,534 | |
| 29,712 | |||
| Food & Staples Retailing - 1.3% | |||
| Walmart, Inc. | 797,491 | 76,424 | |
| Food Products - 2.4% | |||
| Bunge Ltd. | 196,800 | 10,838 | |
| Hilton Food Group PLC | 1,605,322 | 19,539 | |
| Mondelez International, Inc. | 866,300 | 40,075 | |
| Nestle SA (Reg. S) | 217,379 | 18,952 | |
| The J.M. Smucker Co. | 261,800 | 27,458 | |
| The Kraft Heinz Co. | 508,700 | 24,448 | |
| 141,310 | |||
| Household Products - 0.6% | |||
| Kimberly-Clark Corp. | 181,400 | 20,204 | |
| Procter & Gamble Co. | 125,097 | 12,068 | |
| 32,272 | |||
| Personal Products - 0.5% | |||
| Unilever NV (Certificaten Van Aandelen) (Bearer) | 592,300 | 31,718 | |
| Tobacco - 2.3% | |||
| Altria Group, Inc. | 934,500 | 46,118 | |
| British American Tobacco PLC (United Kingdom) | 1,379,200 | 48,617 | |
| Imperial Tobacco Group PLC | 522,867 | 17,316 | |
| Philip Morris International, Inc. | 286,200 | 21,957 | |
| 134,008 | |||
| TOTAL CONSUMER STAPLES | 445,444 | ||
| ENERGY - 10.0% | |||
| Oil, Gas & Consumable Fuels - 10.0% | |||
| BP PLC | 3,921,800 | 26,790 | |
| Chevron Corp. | 1,197,472 | 137,290 | |
| ConocoPhillips Co. | 1,449,000 | 98,083 | |
| Enterprise Products Partners LP | 1,154,400 | 31,942 | |
| Exxon Mobil Corp. | 375,000 | 27,480 | |
| Imperial Oil Ltd. | 995,600 | 28,248 | |
| Phillips 66 Co. | 398,700 | 38,040 | |
| Suncor Energy, Inc. | 1,641,900 | 52,958 | |
| The Williams Companies, Inc. | 3,831,262 | 103,176 | |
| Valero Energy Corp. | 444,000 | 38,992 | |
| 582,999 | |||
| FINANCIALS - 23.2% | |||
| Banks - 13.7% | |||
| Bank of America Corp. | 6,516,900 | 185,536 | |
| Citigroup, Inc. | 2,103,000 | 135,559 | |
| JPMorgan Chase & Co. | 2,308,682 | 238,950 | |
| Lakeland Financial Corp. | 3,200 | 144 | |
| Regions Financial Corp. | 946,700 | 14,361 | |
| SunTrust Banks, Inc. | 680,400 | 40,429 | |
| Wells Fargo & Co. | 3,773,950 | 184,584 | |
| 799,563 | |||
| Capital Markets - 4.9% | |||
| KKR & Co. LP | 5,223,565 | 117,269 | |
| State Street Corp. | 443,099 | 31,416 | |
| The Blackstone Group LP | 3,992,532 | 134,548 | |
| TPG Specialty Lending, Inc. | 1 | 0 | |
| 283,233 | |||
| Consumer Finance - 1.0% | |||
| Capital One Financial Corp. | 445,700 | 35,919 | |
| Discover Financial Services | 306,800 | 20,706 | |
| 56,625 | |||
| Diversified Financial Services - 0.5% | |||
| Berkshire Hathaway, Inc. Class B (a) | 140,000 | 28,776 | |
| Insurance - 3.1% | |||
| Axis Capital Holdings Ltd. | 92,000 | 4,927 | |
| Chubb Ltd. | 606,500 | 80,695 | |
| Marsh & McLennan Companies, Inc. | 203,200 | 17,920 | |
| MetLife, Inc. | 1,103,638 | 50,403 | |
| The Travelers Companies, Inc. | 223,800 | 28,096 | |
| 182,041 | |||
| TOTAL FINANCIALS | 1,350,238 | ||
| HEALTH CARE - 14.3% | |||
| Biotechnology - 1.6% | |||
| Amgen, Inc. | 500,000 | 93,555 | |
| Health Care Equipment & Supplies - 2.6% | |||
| Becton, Dickinson & Co. | 383,300 | 95,618 | |
| Danaher Corp. | 519,700 | 57,645 | |
| 153,263 | |||
| Health Care Providers & Services - 1.9% | |||
| CVS Health Corp. | 647,600 | 42,450 | |
| Encompass Health Corp. | 3 | 0 | |
| UnitedHealth Group, Inc. | 256,000 | 69,171 | |
| 111,621 | |||
| Pharmaceuticals - 8.2% | |||
| AstraZeneca PLC (United Kingdom) | 594,255 | 43,049 | |
| Bristol-Myers Squibb Co. | 575,300 | 28,403 | |
| Eli Lilly & Co. | 310,000 | 37,157 | |
| GlaxoSmithKline PLC | 1,595,900 | 31,000 | |
| Johnson & Johnson | 1,533,248 | 204,045 | |
| Merck & Co., Inc. | 415,000 | 30,888 | |
| Roche Holding AG (participation certificate) | 192,940 | 51,329 | |
| Sanofi SA | 558,519 | 48,545 | |
| 474,416 | |||
| TOTAL HEALTH CARE | 832,855 | ||
| INDUSTRIALS - 8.2% | |||
| Aerospace & Defense - 4.0% | |||
| General Dynamics Corp. | 280,700 | 48,047 | |
| Northrop Grumman Corp. | 30,500 | 8,404 | |
| Raytheon Co. | 214,800 | 35,390 | |
| United Technologies Corp. | 1,176,720 | 138,935 | |
| 230,776 | |||
| Commercial Services & Supplies - 0.2% | |||
| Waste Connection, Inc. (Canada) | 178,145 | 14,866 | |
| Electrical Equipment - 1.7% | |||
| AMETEK, Inc. | 531,200 | 38,724 | |
| Eaton Corp. PLC | 415,500 | 31,682 | |
| Fortive Corp. | 299,700 | 22,475 | |
| Regal Beloit Corp. | 99,700 | 7,653 | |
| 100,534 | |||
| Industrial Conglomerates - 1.5% | |||
| 3M Co. | 30,000 | 6,009 | |
| General Electric Co. | 3,589,755 | 36,472 | |
| Roper Technologies, Inc. | 154,400 | 43,735 | |
| 86,216 | |||
| Machinery - 0.7% | |||
| Allison Transmission Holdings, Inc. | 401,300 | 19,531 | |
| Ingersoll-Rand PLC | 194,200 | 19,428 | |
| 38,959 | |||
| Trading Companies & Distributors - 0.1% | |||
| Fastenal Co. | 114,100 | 6,898 | |
| TOTAL INDUSTRIALS | 478,249 | ||
| INFORMATION TECHNOLOGY - 11.3% | |||
| Communications Equipment - 3.6% | |||
| Cisco Systems, Inc. | 4,399,686 | 208,061 | |
| Electronic Equipment & Components - 0.6% | |||
| Dell Technologies, Inc. (a) | 211,660 | 10,285 | |
| TE Connectivity Ltd. | 343,432 | 27,801 | |
| 38,086 | |||
| IT Services - 1.6% | |||
| First Data Corp. Class A (a) | 1,976,636 | 48,724 | |
| Paychex, Inc. | 610,357 | 43,213 | |
| 91,937 | |||
| Semiconductors & Semiconductor Equipment - 2.0% | |||
| Intel Corp. | 1,266,600 | 59,682 | |
| NXP Semiconductors NV | 210,400 | 18,311 | |
| Qualcomm, Inc. | 240,000 | 11,885 | |
| Taiwan Semiconductor Manufacturing Co. Ltd. sponsored ADR | 677,500 | 25,488 | |
| 115,366 | |||
| Software - 2.5% | |||
| Micro Focus International PLC | 1,430,823 | 27,279 | |
| Microsoft Corp. | 1,158,916 | 121,026 | |
| 148,305 | |||
| Technology Hardware, Storage & Peripherals - 1.0% | |||
| Apple, Inc. | 347,300 | 57,805 | |
| TOTAL INFORMATION TECHNOLOGY | 659,560 | ||
| MATERIALS - 2.9% | |||
| Chemicals - 2.9% | |||
| DowDuPont, Inc. | 2,088,900 | 112,404 | |
| LyondellBasell Industries NV Class A | 535,700 | 46,590 | |
| The Chemours Co. LLC | 223,300 | 7,983 | |
| 166,977 | |||
| REAL ESTATE - 1.9% | |||
| Equity Real Estate Investment Trusts (REITs) - 1.9% | |||
| American Tower Corp. | 454,100 | 78,487 | |
| Public Storage | 145,300 | 30,879 | |
| 109,366 | |||
| UTILITIES - 4.2% | |||
| Electric Utilities - 2.9% | |||
| Exelon Corp. | 2,753,300 | 131,498 | |
| PPL Corp. | 1,102,300 | 34,524 | |
| 166,022 | |||
| Independent Power and Renewable Electricity Producers - 0.2% | |||
| NRG Energy, Inc. | 300,000 | 12,273 | |
| Multi-Utilities - 1.1% | |||
| Ameren Corp. | 354,200 | 24,560 | |
| CenterPoint Energy, Inc. | 816,100 | 25,234 | |
| WEC Energy Group, Inc. | 225,000 | 16,432 | |
| 66,226 | |||
| TOTAL UTILITIES | 244,521 | ||
| TOTAL COMMON STOCKS | |||
| (Cost $4,457,024) | 5,621,885 | ||
| Convertible Preferred Stocks - 0.1% | |||
| CONSUMER STAPLES - 0.0% | |||
| Food Products - 0.0% | |||
| Bunge Ltd. 4.875% | 5,000 | 490 | |
| HEALTH CARE - 0.0% | |||
| Health Care Equipment & Supplies - 0.0% | |||
| Becton, Dickinson & Co. Series A, 6.125% | 7,300 | 453 | |
| INDUSTRIALS - 0.0% | |||
| Electrical Equipment - 0.0% | |||
| Fortive Corp. Series A, 5.00% | 270 | 264 | |
| UTILITIES - 0.1% | |||
| Electric Utilities - 0.1% | |||
| Vistra Energy Corp. 7.00% | 19,400 | 1,873 | |
| Multi-Utilities - 0.0% | |||
| CenterPoint Energy, Inc. 2.00% ZENS (a) | 14,500 | 636 | |
| TOTAL UTILITIES | 2,509 | ||
| TOTAL CONVERTIBLE PREFERRED STOCKS | |||
| (Cost $3,756) | 3,716 | ||
| Principal Amount (000s) | Value (000s) | ||
| Corporate Bonds - 0.3% | |||
| Convertible Bonds - 0.2% | |||
| COMMUNICATION SERVICES - 0.1% | |||
| Interactive Media & Services - 0.0% | |||
| Twitter, Inc. 0.25% 6/15/24 (b) | 1,055 | 980 | |
| Media - 0.1% | |||
| DISH Network Corp. 3.375% 8/15/26 | 601 | 511 | |
| Liberty Media Corp. 1.375% 10/15/23 | 835 | 944 | |
| 1,455 | |||
| TOTAL COMMUNICATION SERVICES | 2,435 | ||
| CONSUMER DISCRETIONARY - 0.0% | |||
| Hotels, Restaurants & Leisure - 0.0% | |||
| Caesars Entertainment Corp. 5% 10/1/24 | 296 | 437 | |
| Internet & Direct Marketing Retail - 0.0% | |||
| MercadoLibre, Inc. 2% 8/15/28 (b) | 492 | 511 | |
| The Booking Holdings, Inc. 0.9% 9/15/21 | 103 | 117 | |
| 628 | |||
| TOTAL CONSUMER DISCRETIONARY | 1,065 | ||
| ENERGY - 0.0% | |||
| Oil, Gas & Consumable Fuels - 0.0% | |||
| Scorpio Tankers, Inc. 3% 5/15/22 | 1,334 | 1,092 | |
| HEALTH CARE - 0.0% | |||
| Health Care Technology - 0.0% | |||
| Teladoc Health, Inc. 1.375% 5/15/25 (b) | 100 | 140 | |
| INDUSTRIALS - 0.0% | |||
| Construction & Engineering - 0.0% | |||
| Dycom Industries, Inc. 0.75% 9/15/21 | 110 | 105 | |
| Electrical Equipment - 0.0% | |||
| SolarCity Corp. 1.625% 11/1/19 | 121 | 115 | |
| TOTAL INDUSTRIALS | 220 | ||
| INFORMATION TECHNOLOGY - 0.1% | |||
| IT Services - 0.0% | |||
| Carbonite, Inc. 2.5% 4/1/22 | 80 | 103 | |
| Okta, Inc. 0.25% 2/15/23 (b) | 192 | 346 | |
| Square, Inc. 0.375% 3/1/22 | 40 | 125 | |
| 574 | |||
| Semiconductors & Semiconductor Equipment - 0.1% | |||
| Advanced Micro Devices, Inc. 2.125% 9/1/26 | 73 | 228 | |
| Intel Corp. 3.25% 8/1/39 | 127 | 291 | |
| Microchip Technology, Inc. 1.625% 2/15/25 | 543 | 855 | |
| Micron Technology, Inc. 3% 11/15/43 | 869 | 1,144 | |
| ON Semiconductor Corp. 1.625% 10/15/23 | 358 | 433 | |
| 2,951 | |||
| Software - 0.0% | |||
| Atlassian, Inc. 0.625% 5/1/23 (b) | 173 | 234 | |
| Citrix Systems, Inc. 0.5% 4/15/19 | 74 | 105 | |
| Coupa Software, Inc. 0.375% 1/15/23 (b) | 139 | 278 | |
| FireEye, Inc. 0.875% 6/1/24 (b) | 112 | 117 | |
| New Relic, Inc. 0.5% 5/1/23 (b) | 104 | 119 | |
| Nutanix, Inc. 0% 1/15/23 (b) | 120 | 149 | |
| Palo Alto Networks, Inc. 0.75% 7/1/23 (b) | 227 | 236 | |
| ServiceNow, Inc. 0% 6/1/22 | 132 | 221 | |
| Splunk, Inc. 1.125% 9/15/25 (b) | 116 | 125 | |
| Workday, Inc. 0.25% 10/1/22 | 91 | 123 | |
| 1,707 | |||
| TOTAL INFORMATION TECHNOLOGY | 5,232 | ||
| TOTAL CONVERTIBLE BONDS | 10,184 | ||
| Nonconvertible Bonds - 0.1% | |||
| COMMUNICATION SERVICES - 0.0% | |||
| Entertainment - 0.0% | |||
| Viacom, Inc. 6.25% 2/28/57 (c) | 965 | 931 | |
| CONSUMER DISCRETIONARY - 0.0% | |||
| Diversified Consumer Services - 0.0% | |||
| Laureate Education, Inc. 8.25% 5/1/25 (b) | 560 | 608 | |
| CONSUMER STAPLES - 0.0% | |||
| Food Products - 0.0% | |||
| CF Industries Holdings, Inc. 4.95% 6/1/43 | 485 | 402 | |
| JBS U.S.A. LLC/JBS U.S.A. Finance, Inc. 6.75% 2/15/28 (b) | 520 | 531 | |
| 933 | |||
| ENERGY - 0.1% | |||
| Oil, Gas & Consumable Fuels - 0.1% | |||
| California Resources Corp. 8% 12/15/22 (b) | 605 | 486 | |
| Southwestern Energy Co. 4.1% 3/15/22 | 590 | 568 | |
| 1,054 | |||
| HEALTH CARE - 0.0% | |||
| Pharmaceuticals - 0.0% | |||
| Valeant Pharmaceuticals International, Inc. 5.875% 5/15/23 (b) | 1,060 | 1,038 | |
| INDUSTRIALS - 0.0% | |||
| Air Freight & Logistics - 0.0% | |||
| Aercap Global Aviation Trust 6.5% 6/15/45 (b)(c) | 185 | 180 | |
| TOTAL NONCONVERTIBLE BONDS | 4,744 | ||
| TOTAL CORPORATE BONDS | |||
| (Cost $14,720) | 14,928 | ||
| Bank Loan Obligations - 0.1% | |||
| FINANCIALS - 0.0% | |||
| Diversified Financial Services - 0.0% | |||
| Avolon TLB Borrower 1 (U.S.) LLC Tranche B3 1LN, term loan 3 month U.S. LIBOR + 2.000% 4.503% 1/15/25 (c)(d) | 831 | 821 | |
| INDUSTRIALS - 0.1% | |||
| Commercial Services & Supplies - 0.1% | |||
| Lineage Logistics Holdings, LLC. Tranche B, term loan 3 month U.S. LIBOR + 3.000% 5.4989% 2/27/25 (c)(d) | 2,302 | 2,239 | |
| TOTAL BANK LOAN OBLIGATIONS | |||
| (Cost $3,086) | 3,060 | ||
| Preferred Securities - 0.0% | |||
| FINANCIALS - 0.0% | |||
| Banks - 0.0% | |||
| Citigroup, Inc. 5.9% (c)(e) | 365 | 378 | |
| INDUSTRIALS - 0.0% | |||
| Industrial Conglomerates - 0.0% | |||
| General Electric Co. 5% (c)(e) | 475 | 421 | |
| TOTAL PREFERRED SECURITIES | |||
| (Cost $724) | 799 | ||
| Shares | Value (000s) | ||
| Other - 0.2% | |||
| Energy - 0.2% | |||
| Oil, Gas & Consumable Fuels - 0.2% | |||
| Utica Shale Drilling Program (non-operating revenue interest) (f)(g)(h) | |||
| (Cost $22,679) | 22,678,929 | 11,373 | |
| Money Market Funds - 2.7% | |||
| Fidelity Cash Central Fund, 2.43% (i) | |||
| (Cost $160,080) | 160,048,172 | 160,080 | |
| TOTAL INVESTMENT IN SECURITIES - 99.9% | |||
| (Cost $4,662,069) | 5,815,841 | ||
| NET OTHER ASSETS (LIABILITIES) - 0.1% | 7,492 | ||
| NET ASSETS - 100% | $5,823,333 |
Values shown as $0 in the Schedule of Investments may reflect amounts less than $500.
Legend
(a) Non-income producing
(b) Security exempt from registration under Rule 144A of the Securities Act of 1933. These securities may be resold in transactions exempt from registration, normally to qualified institutional buyers. At the end of the period, the value of these securities amounted to $6,078,000 or 0.1% of net assets.
(c) Coupon rates for floating and adjustable rate securities reflect the rates in effect at period end.
(d) Coupon is indexed to a floating interest rate which may be multiplied by a specified factor and/or subject to caps or floors.
(e) Security is perpetual in nature with no stated maturity date.
(f) Investment is owned by a wholly-owned subsidiary (Subsidiary) that is treated as a corporation for U.S. tax purposes.
(g) Restricted securities - Investment in securities not registered under the Securities Act of 1933 (excluding 144A issues). At the end of the period, the value of restricted securities (excluding 144A issues) amounted to $11,373,000 or 0.2% of net assets.
(h) Level 3 security
(i) Affiliated fund that is generally available only to investment companies and other accounts managed by Fidelity Investments. The rate quoted is the annualized seven-day yield of the fund at period end. A complete unaudited listing of the fund's holdings as of its most recent quarter end is available upon request. In addition, each Fidelity Central Fund's financial statements, which are not covered by the Fund's Report of Independent Registered Public Accounting Firm, are available on the SEC's website or upon request.
Additional information on each restricted holding is as follows:
| Security | Acquisition Date | Acquisition Cost (000s) |
| Utica Shale Drilling Program (non-operating revenue interest) | 10/5/16 - 9/1/17 | $22,679 |
Affiliated Central Funds
Information regarding fiscal year to date income earned by the Fund from investments in Fidelity Central Funds is as follows:
| Fund | Income earned |
| (Amounts in thousands) | |
| Fidelity Cash Central Fund | $5,693 |
| Fidelity Securities Lending Cash Central Fund | 97 |
| Total | $5,790 |
Amounts in the income column in the above table include any capital gain distributions from underlying funds, which are presented in the corresponding line-item in the Statement of Operations, if applicable.
Investment Valuation
The following is a summary of the inputs used, as of January 31, 2019, involving the Fund's assets and liabilities carried at fair value. The inputs or methodology used for valuing securities may not be an indication of the risk associated with investing in those securities. For more information on valuation inputs, and their aggregation into the levels used below, please refer to the Investment Valuation section in the accompanying Notes to Financial Statements.
| Valuation Inputs at Reporting Date: | ||||
| Description | Total | Level 1 | Level 2 | Level 3 |
| (Amounts in thousands) | ||||
| Investments in Securities: | ||||
| Equities: | ||||
| Communication Services | $422,229 | $422,229 | $-- | $-- |
| Consumer Discretionary | 329,447 | 329,447 | -- | -- |
| Consumer Staples | 445,934 | 346,157 | 99,777 | -- |
| Energy | 582,999 | 556,209 | 26,790 | -- |
| Financials | 1,350,238 | 1,350,238 | -- | -- |
| Health Care | 833,308 | 658,932 | 174,376 | -- |
| Industrials | 478,513 | 478,249 | 264 | -- |
| Information Technology | 659,560 | 632,281 | 27,279 | -- |
| Materials | 166,977 | 166,977 | -- | -- |
| Real Estate | 109,366 | 109,366 | -- | -- |
| Utilities | 247,030 | 244,521 | 2,509 | -- |
| Corporate Bonds | 14,928 | -- | 14,928 | -- |
| Bank Loan Obligations | 3,060 | -- | 3,060 | -- |
| Preferred Securities | 799 | -- | 799 | -- |
| Other | 11,373 | -- | -- | 11,373 |
| Money Market Funds | 160,080 | 160,080 | -- | -- |
| Total Investments in Securities: | $5,815,841 | $5,454,686 | $349,782 | $11,373 |
Other Information
Distribution of investments by country or territory of incorporation, as a percentage of Total Net Assets, is as follows (Unaudited):
| United States of America | 87.4% |
| United Kingdom | 3.6% |
| Switzerland | 3.1% |
| Canada | 1.6% |
| Netherlands | 1.6% |
| Others (Individually Less Than 1%) | 2.7% |
| 100.0% |
See accompanying notes which are an integral part of the financial statements.
Financial Statements
Statement of Assets and Liabilities
| Amounts in thousands (except per-share amounts) | January 31, 2019 | |
| Assets | ||
| Investment in securities, at value — See accompanying schedule: Unaffiliated issuers (cost $4,501,989) | $5,655,761 | |
| Fidelity Central Funds (cost $160,080) | 160,080 | |
| Total Investment in Securities (cost $4,662,069) | $5,815,841 | |
| Cash | 41 | |
| Restricted cash | 1,230 | |
| Receivable for investments sold | 1,790 | |
| Receivable for fund shares sold | 2,152 | |
| Dividends receivable | 8,163 | |
| Interest receivable | 137 | |
| Distributions receivable from Fidelity Central Funds | 374 | |
| Prepaid expenses | 8 | |
| Other receivables | 847 | |
| Total assets | 5,830,583 | |
| Liabilities | ||
| Payable for investments purchased | $228 | |
| Payable for fund shares redeemed | 3,364 | |
| Accrued management fee | 2,084 | |
| Transfer agent fee payable | 619 | |
| Other affiliated payables | 92 | |
| Other payables and accrued expenses | 863 | |
| Total liabilities | 7,250 | |
| Net Assets | $5,823,333 | |
| Net Assets consist of: | ||
| Paid in capital | $4,638,665 | |
| Total distributable earnings (loss) | 1,184,668 | |
| Net Assets | $5,823,333 | |
| Net Asset Value and Maximum Offering Price | ||
| Equity-Income: | ||
| Net Asset Value, offering price and redemption price per share ($5,016,221 ÷ 91,701 shares) | $54.70 | |
| Class K: | ||
| Net Asset Value, offering price and redemption price per share ($807,112 ÷ 14,764 shares) | $54.67 |
See accompanying notes which are an integral part of the financial statements.
Statement of Operations
| Amounts in thousands | Year ended January 31, 2019 | |
| Investment Income | ||
| Dividends | $192,912 | |
| Interest | 613 | |
| Income from Fidelity Central Funds | 5,790 | |
| Total income | 199,315 | |
| Expenses | ||
| Management fee | $28,234 | |
| Transfer agent fees | 8,105 | |
| Accounting and security lending fees | 1,142 | |
| Custodian fees and expenses | 109 | |
| Independent trustees' fees and expenses | 19 | |
| Registration fees | 66 | |
| Audit | 94 | |
| Legal | 15 | |
| Miscellaneous | 49 | |
| Total expenses before reductions | 37,833 | |
| Expense reductions | (298) | |
| Total expenses after reductions | 37,535 | |
| Net investment income (loss) | 161,780 | |
| Realized and Unrealized Gain (Loss) | ||
| Net realized gain (loss) on: | ||
| Investment securities: | ||
| Unaffiliated issuers | 333,935 | |
| Fidelity Central Funds | (2) | |
| Foreign currency transactions | (183) | |
| Total net realized gain (loss) | 333,750 | |
| Change in net unrealized appreciation (depreciation) on: | ||
| Investment securities: | ||
| Unaffiliated issuers | (944,414) | |
| Assets and liabilities in foreign currencies | (42) | |
| Total change in net unrealized appreciation (depreciation) | (944,456) | |
| Net gain (loss) | (610,706) | |
| Net increase (decrease) in net assets resulting from operations | $(448,926) |
See accompanying notes which are an integral part of the financial statements.
Statement of Changes in Net Assets
| Amounts in thousands | Year ended January 31, 2019 | Year ended January 31, 2018 |
| Increase (Decrease) in Net Assets | ||
| Operations | ||
| Net investment income (loss) | $161,780 | $173,761 |
| Net realized gain (loss) | 333,750 | 460,187 |
| Change in net unrealized appreciation (depreciation) | (944,456) | 609,856 |
| Net increase (decrease) in net assets resulting from operations | (448,926) | 1,243,804 |
| Distributions to shareholders | (545,344) | – |
| Distributions to shareholders from net investment income | – | (153,045) |
| Distributions to shareholders from net realized gain | – | (355,004) |
| Total distributions | (545,344) | (508,049) |
| Share transactions - net increase (decrease) | (726,863) | (1,668,136) |
| Total increase (decrease) in net assets | (1,721,133) | (932,381) |
| Net Assets | ||
| Beginning of period | 7,544,466 | 8,476,847 |
| End of period | $5,823,333 | $7,544,466 |
| Other Information | ||
| Distributions in excess of net investment income end of period | $(31,666) |
See accompanying notes which are an integral part of the financial statements.
Financial Highlights
Fidelity Equity-Income Fund
| Years ended January 31, | 2019 | 2018 | 2017 | 2016 | 2015 |
| Selected Per–Share Data | |||||
| Net asset value, beginning of period | $63.45 | $57.76 | $48.57 | $57.26 | $56.69 |
| Income from Investment Operations | |||||
| Net investment income (loss)A | 1.44 | 1.30 | 1.22 | 1.43 | 2.00B |
| Net realized and unrealized gain (loss) | (5.22) | 8.52 | 10.43 | (3.91)C | 2.87 |
| Total from investment operations | (3.78) | 9.82 | 11.65 | (2.48) | 4.87 |
| Distributions from net investment income | (1.39) | (1.20)D | (1.36) | (1.71)D | (1.60) |
| Distributions from net realized gain | (3.58) | (2.93)D | (1.10) | (4.51)D | (2.70) |
| Total distributions | (4.97) | (4.13) | (2.46) | (6.21)E | (4.30) |
| Net asset value, end of period | $54.70 | $63.45 | $57.76 | $48.57 | $57.26 |
| Total ReturnF | (5.91)% | 17.57% | 24.42% | (4.89)%C | 8.53% |
| Ratios to Average Net AssetsG,H | |||||
| Expenses before reductions | .61% | .61% | .63% | .64% | .63% |
| Expenses net of fee waivers, if any | .61% | .61% | .63% | .64% | .63% |
| Expenses net of all reductions | .60% | .61% | .62% | .63% | .63% |
| Net investment income (loss) | 2.50% | 2.18% | 2.27% | 2.55% | 3.30%B |
| Supplemental Data | |||||
| Net assets, end of period (in millions) | $5,016 | $5,921 | $6,686 | $5,752 | $6,686 |
| Portfolio turnover rateI | 24%J | 33% | 36% | 46%J | 40% |
A Calculated based on average shares outstanding during the period.
B Net investment income per share reflects a large, non-recurring dividend which amounted to $.48 per share. Excluding this non-recurring dividend, the ratio of net investment income (loss) to average net assets would have been 2.51%.
C Net realized and unrealized gain (loss) per share reflects proceeds received from litigation which amounted to $.13 per share. Excluding these litigation proceeds, the total return would have been (5.12)%
D The amounts shown reflect certain reclassifications related to book to tax differences that were made in the year shown.
E Total distributions of $6.21 per share is comprised of distributions from net investment income of $1.709 and distributions from net realized gain of $4.505 per share.
F Total returns would have been lower if certain expenses had not been reduced during the applicable periods shown.
G Fees and expenses of any underlying Fidelity Central Funds are not included in the Fund's expense ratio. The Fund indirectly bears its proportionate share of the expenses of any underlying Fidelity Central Funds.
H Expense ratios reflect operating expenses of the class. Expenses before reductions do not reflect amounts reimbursed by the investment adviser or reductions from brokerage service arrangements or reductions from other expense offset arrangements and do not represent the amount paid by the class during periods when reimbursements or reductions occur. Expenses net of fee waivers reflect expenses after reimbursement by the investment adviser but prior to reductions from brokerage service arrangements or other expense offset arrangements. Expenses net of all reductions represent the net expenses paid by the class.
I Amount does not include the portfolio activity of any underlying Fidelity Central Funds.
J Portfolio turnover rate excludes securities received or delivered in-kind.
See accompanying notes which are an integral part of the financial statements.
Fidelity Equity-Income Fund Class K
| Years ended January 31, | 2019 | 2018 | 2017 | 2016 | 2015 |
| Selected Per–Share Data | |||||
| Net asset value, beginning of period | $63.41 | $57.73 | $48.55 | $57.25 | $56.67 |
| Income from Investment Operations | |||||
| Net investment income (loss)A | 1.51 | 1.36 | 1.28 | 1.50 | 2.07B |
| Net realized and unrealized gain (loss) | (5.22) | 8.51 | 10.42 | (3.92)C | 2.88 |
| Total from investment operations | (3.71) | 9.87 | 11.70 | (2.42) | 4.95 |
| Distributions from net investment income | (1.45) | (1.26)D | (1.42) | (1.78)D | (1.67) |
| Distributions from net realized gain | (3.58) | (2.93)D | (1.10) | (4.51)D | (2.70) |
| Total distributions | (5.03) | (4.19) | (2.52) | (6.28)E | (4.37) |
| Net asset value, end of period | $54.67 | $63.41 | $57.73 | $48.55 | $57.25 |
| Total ReturnF | (5.81)% | 17.68% | 24.56% | (4.78)%C | 8.68% |
| Ratios to Average Net AssetsG,H | |||||
| Expenses before reductions | .51% | .51% | .52% | .52% | .52% |
| Expenses net of fee waivers, if any | .51% | .51% | .52% | .52% | .52% |
| Expenses net of all reductions | .50% | .51% | .51% | .51% | .51% |
| Net investment income (loss) | 2.60% | 2.28% | 2.39% | 2.67% | 3.41%B |
| Supplemental Data | |||||
| Net assets, end of period (in millions) | $807 | $1,623 | $1,791 | $1,646 | $2,272 |
| Portfolio turnover rateI | 24%J | 33% | 36% | 46%J | 40% |
A Calculated based on average shares outstanding during the period.
B Net investment income per share reflects a large, non-recurring dividend which amounted to $.48 per share. Excluding this non-recurring dividend, the ratio of net investment income (loss) to average net assets would have been 2.63%.
C Net realized and unrealized gain (loss) per share reflects proceeds received from litigation which amounted to $.13 per share. Excluding these litigation proceeds, the total return would have been (5.01)%
D The amounts shown reflect certain reclassifications related to book to tax differences that were made in the year shown.
E Total distributions of $6.28 per share is comprised of distributions from net investment income of $1.777 and distributions from net realized gain of $4.505 per share.
F Total returns would have been lower if certain expenses had not been reduced during the applicable periods shown.
G Fees and expenses of any underlying Fidelity Central Funds are not included in the Fund's expense ratio. The Fund indirectly bears its proportionate share of the expenses of any underlying Fidelity Central Funds.
H Expense ratios reflect operating expenses of the class. Expenses before reductions do not reflect amounts reimbursed by the investment adviser or reductions from brokerage service arrangements or reductions from other expense offset arrangements and do not represent the amount paid by the class during periods when reimbursements or reductions occur. Expenses net of fee waivers reflect expenses after reimbursement by the investment adviser but prior to reductions from brokerage service arrangements or other expense offset arrangements. Expenses net of all reductions represent the net expenses paid by the class.
I Amount does not include the portfolio activity of any underlying Fidelity Central Funds.
J Portfolio turnover rate excludes securities received or delivered in-kind.
See accompanying notes which are an integral part of the financial statements.
Notes to Financial Statements
For the period ended January 31, 2019
(Amounts in thousands except percentages)
1. Organization.
Fidelity Equity-Income Fund (the Fund) is a fund of Fidelity Devonshire Trust (the Trust) and is authorized to issue an unlimited number of shares. The Trust is registered under the Investment Company Act of 1940, as amended (the 1940 Act), as an open-end management investment company organized as a Massachusetts business trust. The Fund offers Equity-Income and Class K shares, each of which has equal rights as to assets and voting privileges. Each class has exclusive voting rights with respect to matters that affect that class.
2. Investments in Fidelity Central Funds.
The Fund invests in Fidelity Central Funds, which are open-end investment companies generally available only to other investment companies and accounts managed by the investment adviser and its affiliates. The Fund's Schedule of Investments lists each of the Fidelity Central Funds held as of period end, if any, as an investment of the Fund, but does not include the underlying holdings of each Fidelity Central Fund. As an Investing Fund, the Fund indirectly bears its proportionate share of the expenses of the underlying Fidelity Central Funds.
The Money Market Central Funds seek preservation of capital and current income and are managed by Fidelity Investments Money Management, Inc. (FIMM), an affiliate of the investment adviser. Annualized expenses of the Money Market Central Funds as of their most recent shareholder report date are less than .005%.
A complete unaudited list of holdings for each Fidelity Central Fund is available upon request or at the Securities and Exchange Commission (the SEC) website at www.sec.gov. In addition, the financial statements of the Fidelity Central Funds, which are not covered by the Fund's Report of Independent Registered Public Accounting Firm, are available on the SEC website or upon request.
3. Significant Accounting Policies.
The Fund is an investment company and applies the accounting and reporting guidance of the Financial Accounting Standards Board (FASB) Accounting Standards Codification Topic 946 Financial Services – Investments Companies. The financial statements have been prepared in conformity with accounting principles generally accepted in the United States of America (GAAP), which require management to make certain estimates and assumptions at the date of the financial statements. Actual results could differ from those estimates. Subsequent events, if any, through the date that the financial statements were issued have been evaluated in the preparation of the financial statements. The following summarizes the significant accounting policies of the Fund:
Investment Valuation. Investments are valued as of 4:00 p.m. Eastern time on the last calendar day of the period. The Board of Trustees (the Board) has delegated the day to day responsibility for the valuation of the Fund's investments to the Fair Value Committee (the Committee) established by the Fund's investment adviser. In accordance with valuation policies and procedures approved by the Board, the Fund attempts to obtain prices from one or more third party pricing vendors or brokers to value its investments. When current market prices, quotations or currency exchange rates are not readily available or reliable, investments will be fair valued in good faith by the Committee, in accordance with procedures adopted by the Board. Factors used in determining fair value vary by investment type and may include market or investment specific events, changes in interest rates and credit quality. The frequency with which these procedures are used cannot be predicted and they may be utilized to a significant extent. The Committee oversees the Fund's valuation policies and procedures and reports to the Board on the Committee's activities and fair value determinations. The Board monitors the appropriateness of the procedures used in valuing the Fund's investments and ratifies the fair value determinations of the Committee.
The Fund categorizes the inputs to valuation techniques used to value its investments into a disclosure hierarchy consisting of three levels as shown below:
- Level 1 – quoted prices in active markets for identical investments
- Level 2 – other significant observable inputs (including quoted prices for similar investments, interest rates, prepayment speeds, etc.)
- Level 3 – unobservable inputs (including the Fund's own assumptions based on the best information available)
Valuation techniques used to value the Fund's investments by major category are as follows:
Equity securities, including restricted securities, for which market quotations are readily available, are valued at the last reported sale price or official closing price as reported by a third party pricing vendor on the primary market or exchange on which they are traded and are categorized as Level 1 in the hierarchy. In the event there were no sales during the day or closing prices are not available, securities are valued at the last quoted bid price or may be valued using the last available price and are generally categorized as Level 2 in the hierarchy. For foreign equity securities, when market or security specific events arise, comparisons to the valuation of American Depositary Receipts (ADRs), futures contracts, Exchange-Traded Funds (ETFs) and certain indexes as well as quoted prices for similar securities may be used and would be categorized as Level 2 in the hierarchy. For equity securities, including restricted securities, where observable inputs are limited, assumptions about market activity and risk are used and these securities may be categorized as Level 3 in the hierarchy.
Debt securities, including restricted securities, are valued based on evaluated prices received from third party pricing vendors or from brokers who make markets in such securities. Corporate bonds, bank loan obligations and preferred securities are valued by pricing vendors who utilize matrix pricing which considers yield or price of bonds of comparable quality, coupon, maturity and type or by broker-supplied prices. When independent prices are unavailable or unreliable, debt securities may be valued utilizing pricing methodologies which consider similar factors that would be used by third party pricing vendors. Debt securities are generally categorized as Level 2 in the hierarchy but may be Level 3 depending on the circumstances.
Investments in open-end mutual funds, including the Fidelity Central Funds, are valued at their closing net asset value (NAV) each business day and are categorized as Level 1 in the hierarchy.
Changes in valuation techniques may result in transfers in or out of an assigned level within the disclosure hierarchy. The aggregate value of investments by input level as of January 31, 2019 is included at the end of the Fund's Schedule of Investments.
Foreign Currency. The Fund may use foreign currency contracts to facilitate transactions in foreign-denominated securities. Gains and losses from these transactions may arise from changes in the value of the foreign currency or if the counterparties do not perform under the contracts' terms.
Foreign-denominated assets, including investment securities, and liabilities are translated into U.S. dollars at the exchange rates at period end. Purchases and sales of investment securities, income and dividends received and expenses denominated in foreign currencies are translated into U.S. dollars at the exchange rate in effect on the transaction date.
The effects of exchange rate fluctuations on investments are included with the net realized and unrealized gain (loss) on investment securities. Other foreign currency transactions resulting in realized and unrealized gain (loss) are disclosed separately.
Investment Transactions and Income. For financial reporting purposes, the Fund's investment holdings and NAV include trades executed through the end of the last business day of the period. The NAV per share for processing shareholder transactions is calculated as of the close of business of the New York Stock Exchange (NYSE), normally 4:00 p.m. Eastern time and includes trades executed through the end of the prior business day. Gains and losses on securities sold are determined on the basis of identified cost and include proceeds received from litigation. Dividend income is recorded on the ex-dividend date, except for certain dividends from foreign securities where the ex-dividend date may have passed, which are recorded as soon as the Fund is informed of the ex-dividend date. Non-cash dividends included in dividend income, if any, are recorded at the fair market value of the securities received. Income and capital gain distributions from Fidelity Central Funds, if any, are recorded on the ex-dividend date. Certain distributions received by the Fund represent a return of capital or capital gain. The Fund determines the components of these distributions subsequent to the ex-dividend date, based upon receipt of tax filings or other correspondence relating to the underlying investment. These distributions are recorded as a reduction of cost of investments and/or as a realized gain. Interest income is accrued as earned and includes coupon interest and amortization of premium and accretion of discount on debt securities as applicable. Investment income is recorded net of foreign taxes withheld where recovery of such taxes is uncertain. Debt obligations may be placed on non-accrual status and related interest income may be reduced by ceasing current accruals and writing off interest receivables when the collection of all or a portion of interest has become doubtful based on consistently applied procedures. A debt obligation is removed from non-accrual status when the issuer resumes interest payments or when collectability of interest is reasonably assured.
Class Allocations and Expenses. Investment income, realized and unrealized capital gains and losses, common expenses of the Fund, and certain fund-level expense reductions, if any, are allocated daily on a pro-rata basis to each class based on the relative net assets of each class to the total net assets of the Fund. Each class differs with respect to transfer agent fees incurred. Certain expense reductions may also differ by class. For the reporting period, the allocated portion of income and expenses to each class as a percent of its average net assets may vary due to the timing of recording these transactions in relation to fluctuating net assets of the classes. Expenses directly attributable to a fund are charged to that fund. Expenses attributable to more than one fund are allocated among the respective funds on the basis of relative net assets or other appropriate methods. Expense estimates are accrued in the period to which they relate and adjustments are made when actual amounts are known.
Deferred Trustee Compensation. Under a Deferred Compensation Plan (the Plan) for the Fund, certain independent Trustees have elected to defer receipt of a portion of their annual compensation. Deferred amounts are invested in a cross-section of Fidelity funds, are marked-to-market and remain in the Fund until distributed in accordance with the Plan. The investment of deferred amounts and the offsetting payable to the Trustees of $761 are included in the accompanying Statement of Assets and Liabilities in other receivables and other payables and accrued expenses, respectively.
Income Tax Information and Distributions to Shareholders. Each year, the Fund intends to qualify as a regulated investment company under Subchapter M of the Internal Revenue Code, including distributing substantially all of its taxable income and realized gains. As a result, no provision for U.S. Federal income taxes is required. As of January 31, 2019, the Fund did not have any unrecognized tax benefits in the financial statements; nor is the Fund aware of any tax positions for which it is reasonably possible that the total amounts of unrecognized tax benefits will significantly change in the next twelve months. The Fund files a U.S. federal tax return, in addition to state and local tax returns as required. The Fund's federal income tax returns are subject to examination by the Internal Revenue Service (IRS) for a period of three fiscal years after they are filed. State and local tax returns may be subject to examination for an additional fiscal year depending on the jurisdiction. Foreign taxes are provided for based on the Fund's understanding of the tax rules and rates that exist in the foreign markets in which it invests.
Distributions are declared and recorded on the ex-dividend date. Income and capital gain distributions are declared separately for each class. Income and capital gain distributions are determined in accordance with income tax regulations, which may differ from GAAP. In addition, the Fund claimed a portion of the payment made to redeeming shareholders as a distribution for income tax purposes.
Capital accounts within the financial statements are adjusted for permanent book-tax differences. These adjustments have no impact on net assets or the results of operations. Capital accounts are not adjusted for temporary book-tax differences which will reverse in a subsequent period.
Book-tax differences are primarily due to foreign currency transactions, market discount, contingent interest, equity-debt classifications, certain conversion ratio adjustments, redemptions in kind, partnerships, deferred trustees compensation and losses deferred due to wash sales.
As of period end, the cost and unrealized appreciation (depreciation) in securities, and derivatives if applicable, for federal income tax purposes were as follows:
| Gross unrealized appreciation | $1,389,239 |
| Gross unrealized depreciation | (264,505) |
| Net unrealized appreciation (depreciation) | $1,124,734 |
| Tax Cost | $4,691,107 |
The tax-based components of distributable earnings as of period end were as follows:
| Undistributed ordinary income | $5,301 |
| Undistributed long-term capital gain | $58,548 |
| Net unrealized appreciation (depreciation) on securities and other investments | $1,121,585 |
The tax character of distributions paid was as follows:
| January 31, 2019 | January 31, 2018 | |
| Ordinary Income | $165,598 | $ 195,385 |
| Long-term Capital Gains | 379,746 | 312,664 |
| Total | $545,344 | $ 508,049 |
Restricted Securities. The Fund may invest in securities that are subject to legal or contractual restrictions on resale. These securities generally may be resold in transactions exempt from registration or to the public if the securities are registered. Disposal of these securities may involve time-consuming negotiations and expense, and prompt sale at an acceptable price may be difficult. Information regarding restricted securities is included at the end of the Fund's Schedule of Investments.
Loans and Other Direct Debt Instruments. The Fund invests in direct debt instruments which are interests in amounts owed to lenders by corporate or other borrowers. These instruments may be in the form of loans, trade claims or other receivables and may include standby financing commitments such as revolving credit facilities that obligate the Fund to supply additional cash to the borrower on demand. Loans may be acquired through assignment or participation. The Fund did not have any unfunded loan commitments, which are contractual obligations for future funding, at period end.
Consolidated Subsidiary. The Fund invests in certain investments through a wholly-owned subsidiary ("Subsidiary"), which may be subject to federal and state taxes upon disposition.
As of period end, the Fund held an investment of $12,603 in this Subsidiary, representing .22% of the Fund's net assets. The financial statements have been consolidated and include accounts of the Fund and the Subsidiary. Accordingly, all inter-company transactions and balances have been eliminated.
Any cash held by the Subsidiary is restricted as to its use and is presented as Restricted cash in the Statement of Assets and Liabilities.
New Rule Issuance. During August 2018, the U.S. Securities and Exchange Commission issued Final Rule Release No. 33-10532, Disclosure Update and Simplification. This Final Rule includes amendments specific to registered investment companies that are intended to eliminate overlap in disclosure requirements between Regulation S-X and GAAP. In accordance with these amendments, certain line-items in the Fund's financial statements have been combined or removed for the current period as outlined in the table below.
| Financial Statement | Current Line-Item Presentation (As Applicable) | Prior Line-Item Presentation (As Applicable) |
| Statement of Assets and Liabilities | Total distributable earnings (loss) | Undistributed/Distributions in excess of/Accumulated net investment income (loss) Accumulated/Undistributed net realized gain (loss) Net unrealized appreciation (depreciation) |
| Statement of Changes in Net Assets | N/A - removed | Undistributed/Distributions in excess of/Accumulated net investment income (loss) end of period |
| Statement of Changes in Net Assets | Distributions to shareholders | Distributions to shareholders from net investment income Distributions to shareholders from net realized gain |
| Distributions to Shareholders Note to Financial Statements | Distributions to shareholders | Distributions to shareholders from net investment income Distributions to shareholders from net realized gain |
4. Purchases and Sales of Investments.
Purchases and sales of securities, other than short-term securities and in-kind transactions, aggregated $1,467,889 and $2,444,732, respectively.
Unaffiliated Redemptions In-Kind. During the period, 1,109 shares of the Fund were redeemed in-kind for investments and cash with a value of $63,055. The net realized gain of $22,455 on investments delivered through in-kind redemptions is included in the accompanying Statement of Operations. The amount of the in-kind redemptions is included in share transactions in the accompanying Statement of Changes in Net Assets as well as the Notes to Financial Statements. The Fund recognized no gain or loss for federal income tax purposes.
5. Fees and Other Transactions with Affiliates.
Management Fee. Fidelity Management & Research Company (the investment adviser) and its affiliates provide the Fund with investment management related services for which the Fund pays a monthly management fee. The management fee is the sum of an individual fund fee rate that is based on an annual rate of .20% of the Fund's average net assets and an annualized group fee rate that averaged .24% during the period. The group fee rate is based upon the average net assets of all the mutual funds advised by the investment adviser, including any mutual funds previously advised by the investment adviser that are currently advised by Fidelity SelectCo, LLC, an affiliate of the investment adviser. The group fee rate decreases as assets under management increase and increases as assets under management decrease. For the reporting period, the total annual management fee rate was .44% of the Fund's average net assets.
Transfer Agent Fees. Fidelity Investments Institutional Operations Company, Inc., (FIIOC), an affiliate of the investment adviser, is the transfer, dividend disbursing and shareholder servicing agent for each class of the Fund. FIIOC receives account fees and asset-based fees that vary according to the account size and type of account of the shareholders of Equity-Income, except for Class K. FIIOC receives an asset-based fee of Class K's average net assets. FIIOC pays for typesetting, printing and mailing of shareholder reports, except proxy statements.
For the period, transfer agent fees for each class were as follows:
| Amount | % of Class-Level Average Net Assets | |
| Equity-Income | $7,598 | .14 |
| Class K | 507 | .05 |
| $8,105 |
Accounting and Security Lending Fees. Fidelity Service Company, Inc. (FSC), an affiliate of the investment adviser, maintains the Fund's accounting records. The accounting fee is based on the level of average net assets for each month. Under a separate contract, FSC administers the security lending program. The security lending fee is based on the number and duration of lending transactions. For the period, the fees were equivalent to an annual rate of .02%.
Brokerage Commissions. The Fund placed a portion of its portfolio transactions with brokerage firms which are affiliates of the investment adviser. Brokerage commissions are included in net realized gain (loss) and change in net unrealized appreciation (depreciation) in the Statement of Operations. The commissions paid to these affiliated firms were $62 for the period.
Interfund Trades. The Fund may purchase from or sell securities to other Fidelity Funds under procedures adopted by the Board. The procedures have been designed to ensure these interfund trades are executed in accordance with Rule 17a-7 of the 1940 Act. Interfund trades are included within the respective purchases and sales amounts shown in the Purchases and Sales of Investments note.
Other. During the period, the investment adviser reimbursed the Fund for certain losses in the amount of $21.
6. Committed Line of Credit.
The Fund participates with other funds managed by the investment adviser or an affiliate in a $4.25 billion credit facility (the "line of credit") to be utilized for temporary or emergency purposes to fund shareholder redemptions or for other short-term liquidity purposes. The Fund has agreed to pay commitment fees on its pro-rata portion of the line of credit, which amounted to $18 and is reflected in Miscellaneous expenses on the Statement of Operations. During the period, the Fund did not borrow on this line of credit.
7. Security Lending.
The Fund lends portfolio securities through a lending agent from time to time in order to earn additional income. For equity securities, a lending agent is used and may loan securities to certain qualified borrowers, including Fidelity Capital Markets (FCM), a broker-dealer affiliated with the Fund. On the settlement date of the loan, the Fund receives collateral (in the form of U.S. Treasury obligations, letters of credit and/or cash) against the loaned securities and maintains collateral in an amount not less than 100% of the market value of the loaned securities during the period of the loan. The market value of the loaned securities is determined at the close of business of the Fund and any additional required collateral is delivered to the Fund on the next business day. The Fund or borrower may terminate the loan at any time, and if the borrower defaults on its obligation to return the securities loaned because of insolvency or other reasons, the Fund may apply collateral received from the borrower against the obligation. The Fund may experience delays and costs in recovering the securities loaned. Any cash collateral received is invested in the Fidelity Securities Lending Cash Central Fund. At period end, there were no security loans outstanding. Security lending income represents the income earned on investing cash collateral, less rebates paid to borrowers and any lending agent fees associated with the loan, plus any premium payments received for lending certain types of securities. Security lending income is presented in the Statement of Operations as a component of income from Fidelity Central Funds. Total security lending income during the period amounted to $97, including $3 from securities loaned to FCM.
8. Expense Reductions.
Commissions paid to certain brokers with whom the investment adviser, or its affiliates, places trades on behalf of the Fund include an amount in addition to trade execution, which may be rebated back to the Fund to offset certain expenses. This amount totaled $228 for the period. In addition, through arrangements with the Fund's custodian and each class' transfer agent, credits realized as a result of certain uninvested cash balances were used to reduce the Fund's expenses. During the period, these credits reduced the Fund's custody expenses by $1. During the period, credits reduced each class' transfer agent expense as noted in the table below.
| Transfer Agent expense reduction | |
| Equity-Income | $10 |
In addition, during the period the investment adviser reimbursed and/or waived a portion of fund-level operating expenses in the amount of $59.
9. Distributions to Shareholders.
Distributions to shareholders of each class were as follows:
| Year ended January 31, 2019 | Year ended January 31, 2018 | |
| Distributions to shareholders | ||
| Equity-Income | $449,948 | $– |
| Class K | 95,396 | – |
| Total | $545,344 | $– |
| From net investment income | ||
| Equity-Income | $– | $116,026 |
| Class K | – | 37,019 |
| Total | $– | $153,045 |
| From net realized gain | ||
| Equity-Income | $– | $278,349 |
| Class K | – | 76,655 |
| Total | $– | $355,004 |
10. Share Transactions.
Share transactions for each class were as follows and may contain automatic conversions between classes or exchanges between affiliated funds:
| Shares | Shares | Dollars | Dollars | |
| Year ended January 31, 2019 | Year ended January 31, 2018 | Year ended January 31, 2019 | Year ended January 31, 2018 | |
| Equity-Income | ||||
| Shares sold | 3,108 | 9,765 | $177,756 | $585,205 |
| Reinvestment of distributions | 7,538 | 6,203 | 422,015 | 370,841 |
| Shares redeemed | (12,269) | (38,402) | (705,345) | (2,288,604) |
| Net increase (decrease) | (1,623) | (22,434) | $(105,574) | $(1,332,558) |
| Class K | ||||
| Shares sold | 2,167 | 7,660 | $124,052 | $451,462 |
| Reinvestment of distributions | 1,691 | 1,902 | 95,395 | 113,674 |
| Shares redeemed | (14,688)(a) | (14,995) | (840,736)(a) | (900,714) |
| Net increase (decrease) | (10,830) | (5,433) | $(621,289) | $(335,578) |
(a) Amount includes in-kind redemptions (see the Redemptions In-Kind note for additional details)
11. Other.
The Fund's organizational documents provide former and current trustees and officers with a limited indemnification against liabilities arising in connection with the performance of their duties to the Fund. In the normal course of business, the Fund may also enter into contracts that provide general indemnifications. The Fund's maximum exposure under these arrangements is unknown as this would be dependent on future claims that may be made against the Fund. The risk of material loss from such claims is considered remote.
Report of Independent Registered Public Accounting Firm
To the Board of Trustees of Fidelity Devonshire Trust and Shareholders of Fidelity Equity-Income Fund:
Opinion on the Financial Statements
We have audited the accompanying statement of assets and liabilities, including the schedule of investments, of Fidelity Equity-Income Fund (one of the funds constituting Fidelity Devonshire Trust, referred to hereafter as the "Fund") as of January 31, 2019, the related statement of operations for the year ended January 31, 2019, the statement of changes in net assets for each of the two years in the period ended January 31, 2019, including the related notes, and the financial highlights for each of the five years in the period ended January 31, 2019 (collectively referred to as the “financial statements”). In our opinion, the financial statements present fairly, in all material respects, the financial position of the Fund as of January 31, 2019, the results of its operations for the year then ended, the changes in its net assets for each of the two years in the period ended January 31, 2019 and the financial highlights for each of the five years in the period ended January 31, 2019 in conformity with accounting principles generally accepted in the United States of America.
Basis for Opinion
These financial statements are the responsibility of the Fund’s management. Our responsibility is to express an opinion on the Fund’s financial statements based on our audits. We are a public accounting firm registered with the Public Company Accounting Oversight Board (United States) (PCAOB) and are required to be independent with respect to the Fund in accordance with the U.S. federal securities laws and the applicable rules and regulations of the Securities and Exchange Commission and the PCAOB.
We conducted our audits of these financial statements in accordance with the standards of the PCAOB. Those standards require that we plan and perform the audit to obtain reasonable assurance about whether the financial statements are free of material misstatement, whether due to error or fraud.
Our audits included performing procedures to assess the risks of material misstatement of the financial statements, whether due to error or fraud, and performing procedures that respond to those risks. Such procedures included examining, on a test basis, evidence regarding the amounts and disclosures in the financial statements. Our audits also included evaluating the accounting principles used and significant estimates made by management, as well as evaluating the overall presentation of the financial statements. Our procedures included confirmation of securities owned as of January 31, 2019 by correspondence with the custodian, agent banks and brokers; when replies were not received from brokers, we performed other auditing procedures. We believe that our audits provide a reasonable basis for our opinion.
PricewaterhouseCoopers LLP
Boston, Massachusetts
March 14, 2019
We have served as the auditor of one or more investment companies in the Fidelity group of funds since 1932.
Trustees and Officers
The Trustees, Members of the Advisory Board (if any), and officers of the trust and fund, as applicable, are listed below. The Board of Trustees governs the fund and is responsible for protecting the interests of shareholders. The Trustees are experienced executives who meet periodically throughout the year to oversee the fund's activities, review contractual arrangements with companies that provide services to the fund, oversee management of the risks associated with such activities and contractual arrangements, and review the fund's performance. Except for Michael E. Wiley, each of the Trustees oversees 287 funds. Mr. Wiley oversees 195 funds.
The Trustees hold office without limit in time except that (a) any Trustee may resign; (b) any Trustee may be removed by written instrument, signed by at least two-thirds of the number of Trustees prior to such removal; (c) any Trustee who requests to be retired or who has become incapacitated by illness or injury may be retired by written instrument signed by a majority of the other Trustees; and (d) any Trustee may be removed at any special meeting of shareholders by a two-thirds vote of the outstanding voting securities of the trust. Each Trustee who is not an interested person (as defined in the 1940 Act) of the trust and the fund is referred to herein as an Independent Trustee. Each Independent Trustee shall retire not later than the last day of the calendar year in which his or her 75th birthday occurs. The Independent Trustees may waive this mandatory retirement age policy with respect to individual Trustees. Officers and Advisory Board Members hold office without limit in time, except that any officer or Advisory Board Member may resign or may be removed by a vote of a majority of the Trustees at any regular meeting or any special meeting of the Trustees. Except as indicated, each individual has held the office shown or other offices in the same company for the past five years.
The fund’s Statement of Additional Information (SAI) includes more information about the Trustees. To request a free copy, call Fidelity at 1-800-544-8544 if you’re an individual investing directly with Fidelity, call 1-800-835-5092 if you’re a plan sponsor or participant with Fidelity as your recordkeeper or call 1-877-208-0098 on institutional accounts or if you’re an advisor or invest through one.
Experience, Skills, Attributes, and Qualifications of the Trustees. The Governance and Nominating Committee has adopted a statement of policy that describes the experience, qualifications, attributes, and skills that are necessary and desirable for potential Independent Trustee candidates (Statement of Policy). The Board believes that each Trustee satisfied at the time he or she was initially elected or appointed a Trustee, and continues to satisfy, the standards contemplated by the Statement of Policy. The Governance and Nominating Committee also engages professional search firms to help identify potential Independent Trustee candidates who have the experience, qualifications, attributes, and skills consistent with the Statement of Policy. From time to time, additional criteria based on the composition and skills of the current Independent Trustees, as well as experience or skills that may be appropriate in light of future changes to board composition, business conditions, and regulatory or other developments, have also been considered by the professional search firms and the Governance and Nominating Committee. In addition, the Board takes into account the Trustees' commitment and participation in Board and committee meetings, as well as their leadership of standing and ad hoc committees throughout their tenure.
In determining that a particular Trustee was and continues to be qualified to serve as a Trustee, the Board has considered a variety of criteria, none of which, in isolation, was controlling. The Board believes that, collectively, the Trustees have balanced and diverse experience, qualifications, attributes, and skills, which allow the Board to operate effectively in governing the fund and protecting the interests of shareholders. Information about the specific experience, skills, attributes, and qualifications of each Trustee, which in each case led to the Board's conclusion that the Trustee should serve (or continue to serve) as a trustee of the fund, is provided below.
Board Structure and Oversight Function. James C. Curvey is an interested person and currently serves as Chairman. The Trustees have determined that an interested Chairman is appropriate and benefits shareholders because an interested Chairman has a personal and professional stake in the quality and continuity of services provided to the fund. Independent Trustees exercise their informed business judgment to appoint an individual of their choosing to serve as Chairman, regardless of whether the Trustee happens to be independent or a member of management. The Independent Trustees have determined that they can act independently and effectively without having an Independent Trustee serve as Chairman and that a key structural component for assuring that they are in a position to do so is for the Independent Trustees to constitute a substantial majority for the Board. The Independent Trustees also regularly meet in executive session. Ned C. Lautenbach serves as Chairman of the Independent Trustees and as such (i) acts as a liaison between the Independent Trustees and management with respect to matters important to the Independent Trustees and (ii) with management prepares agendas for Board meetings.
Fidelity® funds are overseen by different Boards of Trustees. The fund's Board oversees Fidelity's high income and certain equity funds, and other Boards oversee Fidelity's investment-grade bond, money market, asset allocation, and other equity funds. The asset allocation funds may invest in Fidelity® funds overseen by the fund's Board. The use of separate Boards, each with its own committee structure, allows the Trustees of each group of Fidelity® funds to focus on the unique issues of the funds they oversee, including common research, investment, and operational issues. On occasion, the separate Boards establish joint committees to address issues of overlapping consequences for the Fidelity® funds overseen by each Board.
The Trustees operate using a system of committees to facilitate the timely and efficient consideration of all matters of importance to the Trustees, the fund, and fund shareholders and to facilitate compliance with legal and regulatory requirements and oversight of the fund's activities and associated risks. The Board, acting through its committees, has charged FMR and its affiliates with (i) identifying events or circumstances the occurrence of which could have demonstrably adverse effects on the fund's business and/or reputation; (ii) implementing processes and controls to lessen the possibility that such events or circumstances occur or to mitigate the effects of such events or circumstances if they do occur; and (iii) creating and maintaining a system designed to evaluate continuously business and market conditions in order to facilitate the identification and implementation processes described in (i) and (ii) above. Because the day-to-day operations and activities of the fund are carried out by or through FMR, its affiliates, and other service providers, the fund's exposure to risks is mitigated but not eliminated by the processes overseen by the Trustees. While each of the Board's committees has responsibility for overseeing different aspects of the fund's activities, oversight is exercised primarily through the Operations, Audit, and Compliance Committees. In addition, the Independent Trustees have worked with Fidelity to enhance the Board's oversight of investment and financial risks, legal and regulatory risks, technology risks, and operational risks, including the development of additional risk reporting to the Board. Appropriate personnel, including but not limited to the fund's Chief Compliance Officer (CCO), FMR's internal auditor, the independent accountants, the fund's Treasurer and portfolio management personnel, make periodic reports to the Board's committees, as appropriate, including an annual review of Fidelity's risk management program for the Fidelity® funds. The responsibilities of each standing committee, including their oversight responsibilities, are described further under "Standing Committees of the Trustees."
Interested Trustees*:
Correspondence intended for a Trustee who is an interested person may be sent to Fidelity Investments, 245 Summer Street, Boston, Massachusetts 02210.
Name, Year of Birth; Principal Occupations and Other Relevant Experience+
James C. Curvey (1935)
Year of Election or Appointment: 2007
Trustee
Chairman of the Board of Trustees
Mr. Curvey also serves as Trustee of other Fidelity® funds. Mr. Curvey is Vice Chairman (2007-present) and Director of FMR LLC (diversified financial services company). In addition, Mr. Curvey is an Overseer Emeritus for the Boston Symphony Orchestra, a Director of Artis-Naples, and a Trustee of Brewster Academy in Wolfeboro, New Hampshire. Previously, Mr. Curvey served as a Director of Fidelity Research & Analysis Co. (investment adviser firm, 2009-2018), Director of Fidelity Investments Money Management, Inc. (investment adviser firm, 2009-2014) and a Director of FMR and FMR Co., Inc. (investment adviser firms, 2007-2014).
* Determined to be an “Interested Trustee” by virtue of, among other things, his or her affiliation with the trust or various entities under common control with FMR.
+ The information includes the Trustee's principal occupation during the last five years and other information relating to the experience, attributes, and skills relevant to the Trustee's qualifications to serve as a Trustee, which led to the conclusion that the Trustee should serve as a Trustee for the fund.
Independent Trustees:
Correspondence intended for an Independent Trustee may be sent to Fidelity Investments, P.O. Box 55235, Boston, Massachusetts 02205-5235.
Name, Year of Birth; Principal Occupations and Other Relevant Experience+
Dennis J. Dirks (1948)
Year of Election or Appointment: 2005
Trustee
Mr. Dirks also serves as Trustee of other Fidelity® funds. Prior to his retirement in May 2003, Mr. Dirks was Chief Operating Officer and a member of the Board of The Depository Trust & Clearing Corporation (DTCC). He also served as President, Chief Operating Officer, and Board member of The Depository Trust Company (DTC) and President and Board member of the National Securities Clearing Corporation (NSCC). In addition, Mr. Dirks served as Chief Executive Officer and Board member of the Government Securities Clearing Corporation, Chief Executive Officer and Board member of the Mortgage-Backed Securities Clearing Corporation, as a Trustee and a member of the Finance Committee of Manhattan College (2005-2008), as a Trustee and a member of the Finance Committee of AHRC of Nassau County (2006-2008), as a member of the Independent Directors Council (IDC) Governing Council (2010-2015), and as a member of the Board of Directors for The Brookville Center for Children’s Services, Inc. (2009-2017). Mr. Dirks is a member of the Finance Committee (2016-present) and Board of Directors (2017-present) and is Treasurer (2018-present) of the Asolo Repertory Theatre.
Donald F. Donahue (1950)
Year of Election or Appointment: 2018
Trustee
Mr. Donahue also serves as a Trustee of other Fidelity® funds. Mr. Donahue is President and Chief Executive Officer of Miranda Partners, LLC (risk consulting for the financial services industry, 2012-present). Previously, Mr. Donahue served as a Member of the Advisory Board of certain Fidelity® funds (2015-2018) and Chief Executive Officer (2006-2012), Chief Operating Officer (2003-2006), and Managing Director, Customer Marketing and Development (1999-2003) of The Depository Trust & Clearing Corporation (financial markets infrastructure). Mr. Donahue serves as a Member (2007-present) and Co-Chairman (2016-present) of the Board of Directors of United Way of New York, Member of the Board of Directors of NYC Leadership Academy (2012-present) and Member of the Board of Advisors of Ripple Labs, Inc. (financial services, 2015-present). He also served as Chairman (2010-2012) and Member of the Board of Directors (2012-2013) of Omgeo, LLC (financial services), Treasurer of United Way of New York (2012-2016), and Member of the Board of Directors of XBRL US (financial services non-profit, 2009-2012) and the International Securities Services Association (2009-2012).
Alan J. Lacy (1953)
Year of Election or Appointment: 2008
Trustee
Mr. Lacy also serves as Trustee of other Fidelity® funds. Mr. Lacy serves as a Director of Bristol-Myers Squibb Company (global pharmaceuticals, 2008-present). He is a Trustee of the California Chapter of The Nature Conservancy (2015-present) and a Director of the Center for Advanced Study in the Behavioral Sciences at Stanford University (2015-present). In addition, Mr. Lacy served as Senior Adviser (2007-2014) of Oak Hill Capital Partners, L.P. (private equity) and also served as Chief Executive Officer (2005) and Vice Chairman (2005-2006) of Sears Holdings Corporation (retail) and Chief Executive Officer and Chairman of the Board of Sears, Roebuck and Co. (retail, 2000-2005). Previously, Mr. Lacy served as Chairman (2014-2017) and a member (2010-2017) of the Board of Directors of Dave & Buster’s Entertainment, Inc. (restaurant and entertainment complexes), as Chairman (2008-2011) and a member (2006-2015) of the Board of Trustees of the National Parks Conservation Association, and as a member of the Board of Directors for The Hillman Companies, Inc. (hardware wholesalers, 2010-2014), Earth Fare, Inc. (retail grocery, 2010-2014), and The Western Union Company (global money transfer, 2006-2011).
Ned C. Lautenbach (1944)
Year of Election or Appointment: 2000
Trustee
Chairman of the Independent Trustees
Mr. Lautenbach also serves as Trustee of other Fidelity® funds. Mr. Lautenbach currently serves as Chair (2018-present) and Member (2013-present) of the Board of Governors, State University System of Florida and is a member of the Council on Foreign Relations (1994-present). He is also a member and has most recently served as Chairman of the Board of Directors of Artis-Naples (2012-present). Previously, Mr. Lautenbach served as a member and then Lead Director of the Board of Directors of Eaton Corporation (diversified industrial, 1997-2016). He was also a Partner and Advisory Partner at Clayton, Dubilier & Rice, LLC (private equity investment, 1998-2010), as well as a Director of Sony Corporation (2006-2007). In addition, Mr. Lautenbach also had a 30-year career with IBM (technology company) during which time he served as Senior Vice President and a member of the Corporate Executive Committee (1968-1998).
Joseph Mauriello (1944)
Year of Election or Appointment: 2008
Trustee
Mr. Mauriello also serves as Trustee of other Fidelity® funds. Prior to his retirement in January 2006, Mr. Mauriello served in numerous senior management positions including Deputy Chairman and Chief Operating Officer (2004-2005), and Vice Chairman of Financial Services (2002-2004) of KPMG LLP US (professional services, 1965-2005). Mr. Mauriello currently serves as a member of the Independent Directors Council (IDC) Governing Council (2015-present). Previously, Mr. Mauriello served as a member of the Board of Directors of XL Group plc. (global insurance and re-insurance, 2006-2018).
Cornelia M. Small (1944)
Year of Election or Appointment: 2005
Trustee
Ms. Small also serves as Trustee of other Fidelity® funds. Ms. Small is a member of the Board of Directors (2009-present) and Chair of the Investment Committee (2010-present) of the Teagle Foundation. Ms. Small also serves on the Investment Committee of the Berkshire Taconic Community Foundation (2008-present). Previously, Ms. Small served as Chairperson (2002-2008) and a member of the Investment Committee and Chairperson (2008-2012) and a member of the Board of Trustees of Smith College. In addition, Ms. Small served as Chief Investment Officer, Director of Global Equity Investments, and a member of the Board of Directors of Scudder, Stevens & Clark and Scudder Kemper Investments.
Garnett A. Smith (1947)
Year of Election or Appointment: 2018
Trustee
Mr. Smith also serves as Trustee of other Fidelity® funds. Prior to Mr. Smith's retirement, he served as Chairman and Chief Executive Officer of Inbrand Corp. (manufacturer of personal absorbent products, 1990-1997). He also served as President (1986-1990) of Inbrand Corp. Prior to his employment with Inbrand Corp., he was employed by a retail fabric chain and North Carolina National Bank. In addition, Mr. Smith served as a Member of the Advisory Board of certain Fidelity® funds (2012-2013) and as a board member of the Jackson Hole Land Trust (2009-2012).
David M. Thomas (1949)
Year of Election or Appointment: 2008
Trustee
Mr. Thomas also serves as Trustee of other Fidelity® funds. Mr. Thomas serves as Non-Executive Chairman of the Board of Directors of Fortune Brands Home and Security (home and security products, 2011-present) and as a member of the Board of Directors (2004-present) and Presiding Director (2013-present) of Interpublic Group of Companies, Inc. (marketing communication). Previously, Mr. Thomas served as Executive Chairman (2005-2006) and Chairman and Chief Executive Officer (2000-2005) of IMS Health, Inc. (pharmaceutical and healthcare information solutions), a Director of Fortune Brands, Inc. (consumer products, 2000-2011), and a member of the Board of Trustees of the University of Florida (2013-2018).
Michael E. Wiley (1950)
Year of Election or Appointment: 2018
Trustee
Mr. Wiley also serves as Trustee or Member of the Advisory Board of other Fidelity® funds. Mr. Wiley serves as a Director of High Point Resources (exploration and production, 2005-present). Previously, Mr. Wiley served as a Director of Andeavor Corporation (independent oil refiner and marketer, 2005-2018), a Director of Andeavor Logistics LP (natural resources logistics, 2015-2018), a Director of Post Oak Bank (privately-held bank, 2004-2018), a Director of Asia Pacific Exploration Consolidated (international oil and gas exploration and production, 2008-2013), a member of the Board of Trustees of the University of Tulsa (2000-2006; 2007-2010), a Senior Energy Advisor of Katzenbach Partners, LLC (consulting, 2006-2007), an Advisory Director of Riverstone Holdings (private investment), a Director of Spinnaker Exploration Company (exploration and production, 2001-2005) and Chairman, President, and CEO of Baker Hughes, Inc. (oilfield services, 2000-2004).
+ The information includes the Trustee's principal occupation during the last five years and other information relating to the experience, attributes, and skills relevant to the Trustee's qualifications to serve as a Trustee, which led to the conclusion that the Trustee should serve as a Trustee for the fund.
Advisory Board Members and Officers:
Correspondence intended for a Member of the Advisory Board (if any) may be sent to Fidelity Investments, P.O. Box 55235, Boston, Massachusetts 02205-5235. Correspondence intended for an officer or Peter S. Lynch may be sent to Fidelity Investments, 245 Summer Street, Boston, Massachusetts 02210. Officers appear below in alphabetical order.
Name, Year of Birth; Principal Occupation
Vicki L. Fuller (1957)
Year of Election or Appointment: 2018
Member of the Advisory Board
Ms. Fuller also serves as Member of the Advisory Board of other Fidelity® funds. Ms. Fuller serves as a member of the Board of Directors, Audit Committee, and Nominating and Governance Committee of The Williams Companies, Inc. (natural gas infrastructure, 2018-present). Previously, Ms. Fuller served as the Chief Investment Officer of the New York State Common Retirement Fund (2012-2018) and held a variety of positions at AllianceBernstein L.P. (global asset management, 1985-2012), including Managing Director (2006-2012) and Senior Vice President and Senior Portfolio Manager (2001-2006).
Peter S. Lynch (1944)
Year of Election or Appointment: 2003
Member of the Advisory Board
Mr. Lynch also serves as Member of the Advisory Board of other Fidelity® funds. Mr. Lynch is Vice Chairman and a Director of FMR (investment adviser firm) and FMR Co., Inc. (investment adviser firm). In addition, Mr. Lynch serves as a Trustee of Boston College and as the Chairman of the Inner-City Scholarship Fund. Previously, Mr. Lynch served on the Special Olympics International Board of Directors (1997-2006).
Carol B. Tomé (1957)
Year of Election or Appointment: 2018
Member of the Advisory Board
Ms. Tomé also serves as Member of the Advisory Board of other Fidelity® funds. Ms. Tomé is Chief Financial Officer (2001-present) and Executive Vice President of Corporate Services (2007-present) of The Home Depot, Inc. (home improvement retailer) and a Director (2003-present) and Chair of the Audit Committee (2004-present) of United Parcel Service, Inc. (package delivery and supply chain management). Previously, Ms. Tomé served as Trustee of certain Fidelity® funds (2017), Senior Vice President of Finance and Accounting/Treasurer (2000-2007) and Vice President and Treasurer (1995-2000) of The Home Depot, Inc. and Chair of the Board (2010-2012), Vice Chair of the Board (2009 and 2013), and a Director (2008-2013) of the Federal Reserve Bank of Atlanta. Ms. Tomé is also a director or trustee of many community and professional organizations.
Elizabeth Paige Baumann (1968)
Year of Election or Appointment: 2017
Anti-Money Laundering (AML) Officer
Ms. Baumann also serves as AML Officer of other funds. She is Chief AML Officer (2012-present) and Senior Vice President (2014-present) of FMR LLC (diversified financial services company) and is an employee of Fidelity Investments. Previously, Ms. Baumann served as AML Officer of the funds (2012-2016), and Vice President (2007-2014) and Deputy Anti-Money Laundering Officer (2007-2012) of FMR LLC.
Craig S. Brown (1977)
Year of Election or Appointment: 2019
Assistant Treasurer
Mr. Brown also serves as Assistant Treasurer of other funds. Mr. Brown is an employee of Fidelity Investments (2013-present).
John J. Burke III (1964)
Year of Election or Appointment: 2018
Chief Financial Officer
Mr. Burke also serves as Chief Financial Officer of other funds. Mr. Burke serves as Head of Investment Operations for Fidelity Fund and Investment Operations (2018-present) and is an employee of Fidelity Investments (1998-present). Previously Mr. Burke served as head of Asset Management Investment Operations (2012-2018).
William C. Coffey (1969)
Year of Election or Appointment: 2018
Secretary and Chief Legal Officer (CLO)
Mr. Coffey also serves as Secretary and CLO of other funds. Mr. Coffey serves as CLO, Secretary, and Senior Vice President of Fidelity Management & Research Company and FMR Co., Inc. (investment adviser firms, 2018-present); Secretary of Fidelity SelectCo, LLC and Fidelity Investments Money Management, Inc. (investment adviser firms, 2018-present); and CLO of Fidelity Management & Research (Hong Kong) Limited, FMR Investment Management (UK) Limited, and Fidelity Management & Research (Japan) Limited (investment adviser firms, 2018-present). He is Senior Vice President and Deputy General Counsel of FMR LLC (diversified financial services company, 2010-present), and is an employee of Fidelity Investments. Previously, Mr. Coffey served as Assistant Secretary of certain funds (2009-2018) and as Vice President and Associate General Counsel of FMR LLC (2005-2009).
Timothy M. Cohen (1969)
Year of Election or Appointment: 2018
Vice President
Mr. Cohen also serves as Vice President of other funds. Mr. Cohen serves as Co-Head of Global Equity Research (2016-present), a Director of Fidelity Management & Research (Japan) Limited (investment adviser firm, 2016-present), and is an employee of Fidelity Investments. Previously, Mr. Cohen served as Chief Investment Officer - Equity and a Director of Fidelity Management & Research (U.K.) Inc. (investment adviser firm, 2013-2015) and as a Director of Fidelity Management & Research (Hong Kong) Limited (investment adviser firm, 2017).
Jonathan Davis (1968)
Year of Election or Appointment: 2010
Assistant Treasurer
Mr. Davis also serves as Assistant Treasurer of other funds. Mr. Davis serves as Assistant Treasurer of FMR Capital, Inc. (2017-present) and is an employee of Fidelity Investments. Previously, Mr. Davis served as Vice President and Associate General Counsel of FMR LLC (diversified financial services company, 2003-2010).
Adrien E. Deberghes (1967)
Year of Election or Appointment: 2016
Assistant Treasurer
Mr. Deberghes also serves as an officer of other funds. He serves as Assistant Treasurer of FMR Capital, Inc. (2017-present), Executive Vice President of Fidelity Investments Money Management, Inc. (FIMM) (investment adviser firm, 2016-present), and is an employee of Fidelity Investments (2008-present). Previously, Mr. Deberghes served as President and Treasurer of certain Fidelity® funds (2013-2018). Prior to joining Fidelity Investments, Mr. Deberghes was Senior Vice President of Mutual Fund Administration at State Street Corporation (2007-2008), Senior Director of Mutual Fund Administration at Investors Bank & Trust (2005-2007), and Director of Finance for Dunkin' Brands (2000-2005). Previously, Mr. Deberghes served in other fund officer roles.
Laura M. Del Prato (1964)
Year of Election or Appointment: 2018
Assistant Treasurer
Ms. Del Prato also serves as an officer of other funds. Ms. Del Prato is an employee of Fidelity Investments (2017-present). Prior to joining Fidelity Investments, Ms. Del Prato served as a Managing Director and Treasurer of the JPMorgan Mutual Funds (2014-2017). Prior to JPMorgan, Ms. Del Prato served as a partner at Cohen Fund Audit Services (accounting firm, 2012-2013) and KPMG LLP (accounting firm, 2004-2012).
Colm A. Hogan (1973)
Year of Election or Appointment: 2016
Deputy Treasurer
Mr. Hogan also serves as an officer of other funds. Mr. Hogan serves as Assistant Treasurer of FMR Capital, Inc. (2017-present) and is an employee of Fidelity Investments (2005-present). Previously, Mr. Hogan served as Assistant Treasurer of certain Fidelity® funds (2016-2018).
Pamela R. Holding (1964)
Year of Election or Appointment: 2018
Vice President
Ms. Holding also serves as Vice President of other funds. Ms. Holding serves as Co-Head of Global Equity Research (2018-present) and is an employee of Fidelity Investments (2013-present).
Chris Maher (1972)
Year of Election or Appointment: 2013
Assistant Treasurer
Mr. Maher serves as Assistant Treasurer of other funds. Mr. Maher is Vice President of Valuation Oversight, serves as Assistant Treasurer of FMR Capital, Inc. (2017-present), and is an employee of Fidelity Investments. Previously, Mr. Maher served as Vice President of Asset Management Compliance (2013), Vice President of the Program Management Group of FMR (investment adviser firm, 2010-2013), and Vice President of Valuation Oversight (2008-2010).
Kenneth B. Robins (1969)
Year of Election or Appointment: 2016
Chief Compliance Officer
Mr. Robins also serves as an officer of other funds. Mr. Robins serves as Compliance Officer of Fidelity Management & Research Company and FMR Co., Inc. (investment adviser firms, 2016-present) and is an employee of Fidelity Investments (2004-present). Previously, Mr. Robins served as Executive Vice President of Fidelity Investments Money Management, Inc. (investment adviser firm, 2013-2016) and served in other fund officer roles.
Stacie M. Smith (1974)
Year of Election or Appointment: 2016
President and Treasurer
Ms. Smith also serves as an officer of other funds. Ms. Smith serves as Assistant Treasurer of FMR Capital, Inc. (2017-present), is an employee of Fidelity Investments (2009-present), and has served in other fund officer roles. Prior to joining Fidelity Investments, Ms. Smith served as Senior Audit Manager of Ernst & Young LLP (accounting firm, 1996-2009). Previously, Ms. Smith served as Assistant Treasurer (2013-2018) and Deputy Treasurer (2013-2016) of certain Fidelity® funds.
Marc L. Spector (1972)
Year of Election or Appointment: 2016
Assistant Treasurer
Mr. Spector also serves as an officer of other funds. Mr. Spector serves as Assistant Treasurer of FMR Capital, Inc. (2017-present) and is an employee of Fidelity Investments (2016-present). Prior to joining Fidelity Investments, Mr. Spector served as Director at the Siegfried Group (accounting firm, 2013-2016), and prior to Siegfried Group as audit senior manager at Deloitte & Touche (accounting firm, 2005-2013).
Jim Wegmann (1979)
Year of Election or Appointment: 2019
Assistant Treasurer
Mr. Wegmann also serves as Assistant Treasurer of other funds. Mr. Wegmann is an employee of Fidelity Investments (2011-present).
Shareholder Expense Example
As a shareholder of the Fund, you incur two types of costs: (1) transaction costs and (2) ongoing costs, including management fees and other Fund expenses. This Example is intended to help you understand your ongoing costs (in dollars) of investing in the Fund and to compare these costs with the ongoing costs of investing in other mutual funds.
The Example is based on an investment of $1,000 invested at the beginning of the period and held for the entire period (August 1, 2018 to January 31, 2019).
Actual Expenses
The first line of the accompanying table for each class of the Fund provides information about actual account values and actual expenses. You may use the information in this line, together with the amount you invested, to estimate the expenses that you paid over the period. Simply divide your account value by $1,000.00 (for example, an $8,600 account value divided by $1,000.00 = 8.6), then multiply the result by the number in the first line for a class of the Fund under the heading entitled "Expenses Paid During Period" to estimate the expenses you paid on your account during this period. In addition, the Fund, as a shareholder in the underlying Fidelity Central Funds, will indirectly bear its pro-rata share of the fees and expenses incurred by the underlying Fidelity Central Funds. These fees and expenses are not included in the Fund's annualized expense ratio used to calculate the expense estimate in the table below.
Hypothetical Example for Comparison Purposes
The second line of the accompanying table for each class of the Fund provides information about hypothetical account values and hypothetical expenses based on a Class' actual expense ratio and an assumed rate of return of 5% per year before expenses, which is not the Class' actual return. The hypothetical account values and expenses may not be used to estimate the actual ending account balance or expenses you paid for the period. You may use this information to compare the ongoing costs of investing in the Fund and other funds. To do so, compare this 5% hypothetical example with the 5% hypothetical examples that appear in the shareholder reports of the other funds. In addition, the Fund, as a shareholder in the underlying Fidelity Central Funds, will indirectly bear its pro-rata share of the fees and expenses incurred by the underlying Fidelity Central Funds. These fees and expenses are not included in the Fund's annualized expense ratio used to calculate the expense estimate in the table below.
Please note that the expenses shown in the table are meant to highlight your ongoing costs only and do not reflect any transaction costs. Therefore, the second line of the table is useful in comparing ongoing costs only, and will not help you determine the relative total costs of owning different funds.
| Annualized Expense Ratio-A | Beginning Account Value August 1, 2018 | Ending Account Value January 31, 2019 | Expenses Paid During Period-B August 1, 2018 to January 31, 2019 | |
| Equity-Income | .60% | |||
| Actual | $1,000.00 | $964.10 | $2.97 | |
| Hypothetical-C | $1,000.00 | $1,022.18 | $3.06 | |
| Class K | .51% | |||
| Actual | $1,000.00 | $964.80 | $2.53 | |
| Hypothetical-C | $1,000.00 | $1,022.63 | $2.60 |
A Annualized expense ratio reflects expenses net of applicable fee waivers.
B Expenses are equal to each Class' annualized expense ratio, multiplied by the average account value over the period, multiplied by 184/365 (to reflect the one-half year period).
C 5% return per year before expenses
Distributions (Unaudited)
The Board of Trustees of Fidelity Equity-Income Fund voted to pay to shareholders of record at the opening of business on record date, the following distributions per share derived from capital gains realized from sales of portfolio securities:
| Pay Date | Record Date | Capital Gains | |
| Fidelity Equity-Income Fund | |||
| Equity Income | 03/11/19 | 03/08/19 | $0.556 |
| Class K | 03/11/19 | 03/08/19 | $0.556 |
The fund hereby designates as a capital gain dividend with respect to the taxable year ended January 31, 2019, $303,618,275, or, if subsequently determined to be different, the net capital gain of such year.
A total of 0.76% of the dividends distributed during the fiscal year was derived from interest on U.S. Government securities which is generally exempt from state income tax.
Equity Income designates 51%, 79%, 94%, 94%, and 95%; Class K designates 51%, 75%, 92%, 91%, and 90%; of the dividends distributed in March, April, July, October, and December, respectively during the fiscal year as qualifying for the dividends–received deduction for corporate shareholders.
Equity Income and Class K designate 100% of the dividends distributed during the fiscal year as amounts which may be taken into account as a dividend for purposes of the maximum rate under section 1(h)(11) of the Internal Revenue Code.
The fund will notify shareholders in January 2020 of amounts for use in preparing 2019 income tax returns.
Board Approval of Investment Advisory Contracts and Management Fees
Fidelity Equity-Income Fund
Each year, the Board of Trustees, including the Independent Trustees (together, the Board), votes on the renewal of the management contract with Fidelity Management & Research Company (FMR) and the sub-advisory agreements (together, the Advisory Contracts) for the fund. FMR and the sub-advisers are referred to herein as the Investment Advisers. The Board, assisted by the advice of fund counsel and Independent Trustees' counsel, requests and considers a broad range of information relevant to the renewal of the Advisory Contracts throughout the year.
The Board meets regularly and, at each of its meetings, covers an extensive agenda of topics and materials and considers factors that are relevant to its annual consideration of the renewal of the fund's Advisory Contracts, including the services and support provided to the fund and its shareholders. The Board has established various standing committees (Committees), each composed of and chaired by Independent Trustees with varying backgrounds, to which the Board has assigned specific subject matter responsibilities in order to enhance effective decision-making by the Board. The Board, acting directly and through its Committees, requests and receives information concerning the annual consideration of the renewal of the fund's Advisory Contracts. The Board also meets as needed to review matters specifically related to the Board's annual consideration of the renewal of the Advisory Contracts. Members of the Board may also meet with trustees of other Fidelity funds through joint ad hoc committees to discuss certain matters relevant to all of the Fidelity funds.
At its January 2019 meeting, the Board unanimously determined to renew the fund's Advisory Contracts. In reaching its determination, the Board considered all factors it believed relevant, including (i) the nature, extent, and quality of the services to be provided to the fund and its shareholders (including the investment performance of the fund); (ii) the competitiveness of the fund's management fee and total expense ratio relative to peer funds; (iii) the total costs of the services to be provided by and the profits to be realized by Fidelity from its relationships with the fund; and (iv) the extent to which, if any, economies of scale exist and would be realized as the fund grows, and whether any economies of scale are appropriately shared with fund shareholders.
In considering whether to renew the Advisory Contracts for the fund, the Board reached a determination, with the assistance of fund counsel and Independent Trustees' counsel and through the exercise of its business judgment, that the renewal of the Advisory Contracts was in the best interests of the fund and its shareholders and that the compensation payable under the Advisory Contracts was fair and reasonable. The Board's decision to renew the Advisory Contracts was not based on any single factor, but rather was based on a comprehensive consideration of all the information provided to the Board at its meetings throughout the year. The Board, in reaching its determination to renew the Advisory Contracts, was aware that shareholders of the fund have a broad range of investment choices available to them, including a wide choice among funds offered by Fidelity's competitors, and that the fund's shareholders, who have the opportunity to review and weigh the disclosure provided by the fund in its prospectus and other public disclosures, have chosen to invest in this fund, which is part of the Fidelity family of funds.
Nature, Extent, and Quality of Services Provided. The Board considered Fidelity's staffing as it relates to the fund, including the backgrounds of investment personnel of Fidelity, and also considered the fund's investment objective, strategies, and related investment philosophy. The Independent Trustees also had discussions with senior management of Fidelity's investment operations and investment groups. The Board considered the structure of the investment personnel compensation program and whether this structure provides appropriate incentives to act in the best interests of the fund. Additionally, the Board considered the portfolio managers' investments, if any, in the funds that they manage.Resources Dedicated to Investment Management and Support Services. The Board and the Fund Oversight and Research Committees reviewed the general qualifications and capabilities of Fidelity's investment staff, including its size, education, experience, and resources, as well as Fidelity's approach to recruiting, training, managing, and compensating investment personnel. The Board noted that Fidelity has continued to increase the resources devoted to non-U.S. offices, including expansion of Fidelity's global investment organization. The Board also noted that Fidelity's analysts have extensive resources, tools and capabilities that allow them to conduct sophisticated quantitative and fundamental analysis, as well as credit analysis of issuers, counterparties and guarantors. Further, the Board considered that Fidelity's investment professionals have sufficient access to global information and data so as to provide competitive investment results over time, and that those professionals also have access to sophisticated tools that permit them to assess portfolio construction and risk and performance attribution characteristics continuously, as well as to transmit new information and research conclusions rapidly around the world. Additionally, in its deliberations, the Board considered Fidelity's trading, risk management, compliance, and technology and operations capabilities and resources, which are integral parts of the investment management process.Shareholder and Administrative Services. The Board considered (i) the nature, extent, quality, and cost of advisory, administrative, and shareholder services performed by the Investment Advisers and their affiliates under the Advisory Contracts and under separate agreements covering transfer agency, pricing and bookkeeping, and securities lending services for the fund; (ii) the nature and extent of the supervision of third party service providers, principally custodians, subcustodians, and pricing vendors; and (iii) the resources devoted to, and the record of compliance with, the fund's compliance policies and procedures. The Board also reviewed the allocation of fund brokerage, including allocations to brokers affiliated with the Investment Advisers, the use of brokerage commissions to pay fund expenses, and the use of "soft" commission dollars to pay for research services.The Board noted that the growth of fund assets over time across the complex allows Fidelity to reinvest in the development of services designed to enhance the value and convenience of the Fidelity funds as investment vehicles. These services include 24-hour access to account information and market information through telephone representatives and over the Internet, investor education materials and asset allocation tools, and the expanded availability of Fidelity Investor Centers.The Board noted that it and the boards of certain other Fidelity funds had formed an ad hoc Committee on Transfer Agency Fees to review the variety of transfer agency fee structures throughout the industry and Fidelity's competitive positioning with respect to industry participants.Investment in a Large Fund Family. The Board considered the benefits to shareholders of investing in a Fidelity fund, including the benefits of investing in a fund that is part of a large family of funds offering a variety of investment disciplines and providing a large variety of mutual fund investor services. The Board noted that Fidelity had taken, or had made recommendations that resulted in the Fidelity funds taking, a number of actions over the previous year that benefited particular funds, including: (i) continuing to dedicate additional resources to Fidelity's investment research process, which includes meetings with management of issuers of securities in which the funds invest, and to the support of the senior management team that oversees asset management; (ii) continuing efforts to enhance Fidelity's global research capabilities; (iii) launching new funds and making other enhancements to meet client needs; (iv) launching new share classes of existing funds; (v) eliminating purchase minimums and broadening eligibility requirements for certain funds and share classes; (vi) reducing management fees and total expenses for certain growth equity funds and index funds; (vii) lowering expense caps for certain existing funds and classes, and converting certain voluntary expense caps to contractual caps, to reduce expenses borne by shareholders; (viii) eliminating short-term redemption fees for funds that had such fees; (ix) rationalizing product lines and gaining increased efficiencies from fund mergers and share class consolidations; (x) continuing to develop, acquire and implement systems and technology to improve services to the funds and shareholders, strengthen information security, and increase efficiency; and (xi) continuing to implement enhancements to further strengthen Fidelity's product line to increase investors' probability of success in achieving their investment goals, including retirement income goals.Investment Performance. The Board considered whether the fund has operated in accordance with its investment objective, as well as its record of compliance with its investment restrictions and its performance history. The fund had a portfolio manager change in January 2018. The Board will continue to monitor closely the fund's performance, taking into account the portfolio manager change.The Board took into account discussions that occur at Board meetings throughout the year with representatives of the Investment Advisers about fund investment performance. In this regard the Board noted that as part of regularly scheduled fund reviews and other reports to the Board on fund performance, the Board considers annualized return information for the fund for different time periods, measured against an appropriate securities market index ("benchmark index") and a peer group of funds with similar objectives ("peer group"), if any. In its evaluation of fund investment performance, the Board gave particular attention to information indicating changes in performance of certain Fidelity funds for specific time periods and discussed with the Investment Advisers the reasons for any overperformance or underperformance.In addition to reviewing absolute and relative fund performance, the Independent Trustees periodically consider the appropriateness of fund performance metrics in evaluating the results achieved. In general, the Independent Trustees believe that fund performance should be evaluated based on net performance (after fees and expenses) of both the highest performing and lowest performing fund share classes, where applicable, compared to appropriate benchmark indices, over appropriate time periods that may include full market cycles, and compared to peer groups, as applicable, over the same periods, taking into account relevant factors including the following: general market conditions; issuer-specific information; and fund cash flows and other factors.The Independent Trustees recognize that shareholders evaluate performance on a net basis over their own holding periods, for which one-, three-, and five-year periods are often used as a proxy. For this reason, the performance information reviewed by the Board also included net cumulative total return information for the fund and an appropriate benchmark index and peer group for the most recent one-, three-, and five-year periods ended June 30, 2018, as shown below. Returns are shown compared to the 25th percentile (top of box, 75% beaten) and 75th percentile (bottom of box, 25% beaten) of the peer universe.Fidelity Equity-Income Fund
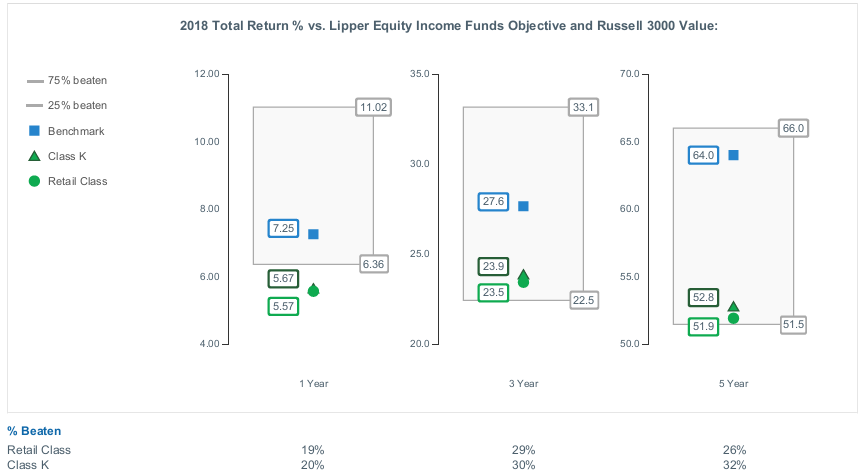
Fidelity Equity-Income Fund

![]()
EQU-ANN-0319
1.471443.122
Fidelity® Series All-Sector Equity Fund Fidelity® Series Stock Selector Large Cap Value Fund Fidelity® Series Value Discovery Fund Annual Report January 31, 2019 |
|
Beginning on January 1, 2021, as permitted by regulations adopted by the Securities and Exchange Commission, paper copies of a fund’s shareholder reports will no longer be sent by mail, unless you specifically request paper copies of the reports from the fund or from your financial intermediary, such as a financial advisor, broker-dealer or bank. Instead, the reports will be made available on a website, and you will be notified by mail each time a report is posted and provided with a website link to access the report.
If you already elected to receive shareholder reports electronically, you will not be affected by this change and you need not take any action. You may elect to receive shareholder reports and other communications from a fund electronically, by contacting your financial intermediary. For Fidelity customers, visit Fidelity's web site or call Fidelity using the contact information listed below.
You may elect to receive all future reports in paper free of charge. If you wish to continue receiving paper copies of your shareholder reports, you may contact your financial intermediary or, if you are a Fidelity customer, visit Fidelity’s website, or call Fidelity at the applicable toll-free number listed below. Your election to receive reports in paper will apply to all funds held with the fund complex/your financial intermediary.
| Account Type | Website | Phone Number |
| Brokerage, Mutual Fund, or Annuity Contracts: | fidelity.com/mailpreferences | 1-800-343-3548 |
| Employer Provided Retirement Accounts: | netbenefits.fidelity.com/preferences (choose 'no' under Required Disclosures to continue to print) | 1-800-343-0860 |
| Advisor Sold Accounts Serviced Through Your Financial Intermediary: | Contact Your Financial Intermediary | Your Financial Intermediary's phone number |
| Advisor Sold Accounts Serviced by Fidelity: | institutional.fidelity.com | 1-877-208-0098 |
Contents
Fidelity® Series All-Sector Equity Fund | |
Fidelity® Series Stock Selector Large Cap Value Fund | |
Fidelity® Series Value Discovery Fund | |
Board Approval of Investment Advisory Contracts and Management Fees |
To view a fund's proxy voting guidelines and proxy voting record for the 12-month period ended June 30, visit http://www.fidelity.com/proxyvotingresults or visit the Securities and Exchange Commission's (SEC) web site at http://www.sec.gov.
You may also call 1-800-544-8544 to request a free copy of the proxy voting guidelines.
Standard & Poor's, S&P and S&P 500 are registered service marks of The McGraw-Hill Companies, Inc. and have been licensed for use by Fidelity Distributors Corporation.
Other third-party marks appearing herein are the property of their respective owners.
All other marks appearing herein are registered or unregistered trademarks or service marks of FMR LLC or an affiliated company. © 2019 FMR LLC. All rights reserved.
This report and the financial statements contained herein are submitted for the general information of the shareholders of the Funds. This report is not authorized for distribution to prospective investors in the Funds unless preceded or accompanied by an effective prospectus.
A fund files its complete schedule of portfolio holdings with the SEC for the first and third quarters of each fiscal year on Form N-Q. Forms N-Q are available on the SEC’s web site at http://www.sec.gov. A fund's Forms N-Q may be reviewed and copied at the SEC’s Public Reference Room in Washington, DC. Information regarding the operation of the SEC's Public Reference Room may be obtained by calling 1-800-SEC-0330.
For a complete list of a fund's portfolio holdings, view the most recent holdings listing, semiannual report, or annual report on Fidelity's web site at http://www.fidelity.com, http://www.institutional.fidelity.com, or http://www.401k.com, as applicable.
NOT FDIC INSURED •MAY LOSE VALUE •NO BANK GUARANTEE
Neither the Funds nor Fidelity Distributors Corporation is a bank.
Note to Shareholders
On October 1, 2018, Brian Lempel assumed portfolio management responsibilities for the fund's telecom services sleeve, succeeding Douglas Simmons.
On December 1, 2018, Co-Portfolio Manager John Mirshekari succeeded Tobias Welo on the fund's industrials sleeve. Also, Nicola Stafford assumed co-management responsibilities for the consumer staples sleeve, joining Co-Manager Robert Lee. The two will manage the subportfolio together until April 2019, at which point Nicola will become sole Portfolio Manager.
Fidelity® Series All-Sector Equity Fund
Performance: The Bottom Line
Average annual total return reflects the change in the value of an investment, assuming reinvestment of distributions from dividend income and capital gains (the profits earned upon the sale of securities that have grown in value, if any) and assuming a constant rate of performance each year. The hypothetical investment and the average annual total returns do not reflect the deduction of taxes that a shareholder would pay on fund distributions or the redemption of fund shares. During periods of reimbursement by Fidelity, a fund’s total return will be greater than it would be had the reimbursement not occurred. How a fund did yesterday is no guarantee of how it will do tomorrow.
Average Annual Total Returns
| For the periods ended January 31, 2019 | Past 1 year | Past 5 years | Past 10 years |
| Fidelity® Series All-Sector Equity Fund | (3.23)% | 9.84% | 14.84% |
$10,000 Over 10 Years
Let's say hypothetically that $10,000 was invested in Fidelity® Series All-Sector Equity Fund on January 31, 2009.
The chart shows how the value of your investment would have changed, and also shows how the Russell 1000® Index performed over the same period.
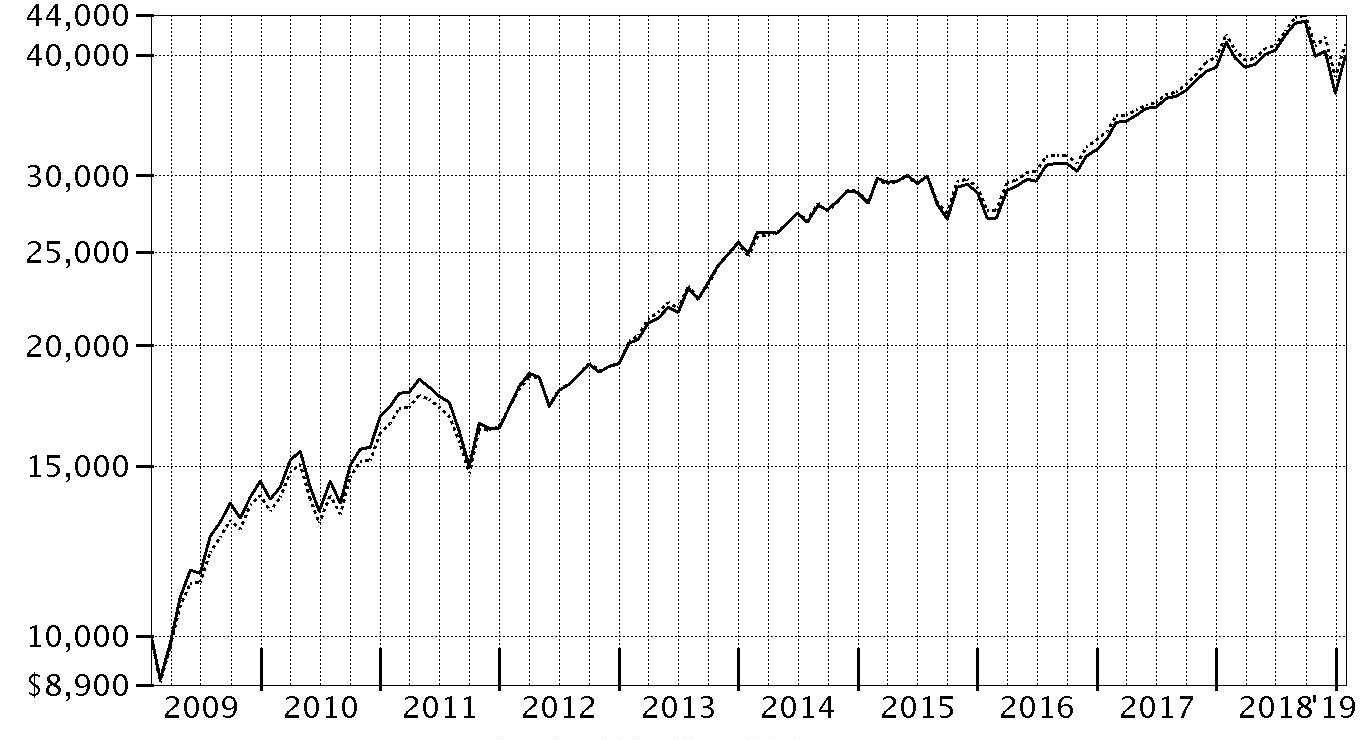
| Period Ending Values | ||
| $39,886 | Fidelity® Series All-Sector Equity Fund | |
| $41,066 | Russell 1000® Index | |
Fidelity® Series All-Sector Equity Fund
Management's Discussion of Fund Performance
Market Recap: The S&P 500® index returned -2.31% for the 12 months ending January 31, 2019, as the U.S. equity bellwether began the new year on a high note after enduring a final quarter of 2018 in which resurgent volatility upset the aging bull market. In October, rising U.S. Treasury yields and concern about peaking corporate earnings growth sent many investors fleeing from risk assets as they were still dealing with lingering uncertainty related to global trade and the U.S. Federal Reserve picking up the pace of interest rate hikes. The index returned -6.84% in October, at the time its largest monthly drop in seven years. But conditions worsened through Christmas, as jitters about the economy and another hike in rates led to a spike in market volatility and a -9.03% result for December. Sharply reversing course to begin 2019, the S&P 500® gained 8.01% in January, its strongest opening month since 1987, amid upbeat company earnings/outlooks and signs the Fed may pause on rates. For the full period, some economically sensitive sectors were at the bottom of the 12-month performance scale: materials (-14%), energy (-12%), financials (-11%) and industrials (-8%). Meanwhile, communication services – which includes dividend-rich telecom stocks – and consumer staples returned about -5%. In contrast, the defensive utilities (+11%), real estate (+10%) and health care (+5%) sectors led the way. Information technology and consumer discretionary were rattled in the late-2018 downturn, but earlier strength resulted in each advancing about 3%.Comments from Co-Portfolio Manager Robert Stansky: For the year, the fund returned -3.23%, trailing the -2.17% result of the benchmark Russell 1000® Index. Versus the benchmark, security selection within the financials sector detracted most, while picks in consumer staples and materials also held back the fund's relative result to a lesser extent. At the individual stock level, the portfolio's positioning in consumer electronics firm Apple (+1%) was a headwind the past year. We were notably underweight the stock earlier in the period, when it performed well, then reduced the fund's underweighting later, when the stock began to struggle. A sizable overweighting in consumer finance company Capital One Financial also hampered relative performance. Shares of the organization returned about -21% for the year, and most of that decline occurred in the fourth quarter as investors became fearful that a U.S. recession was on the near-term horizon, which could potentially lead to a spike in credit delinquencies and defaults. Conversely, choices among information technology stocks were a noteworthy positive this period, while picks in the health care and consumer discretionary sectors added value as well. Specifically, Autodesk (+27%) was the fund’s leading individual relative contributor for the period. The stock rose amid continued optimism related to the computer-aided design software provider's ongoing transition to a cloud-based subscription business model. Lastly, the portfolio's overweighting in Boston Scientific (+36%) also proved timely.The views expressed above reflect those of the portfolio manager(s) only through the end of the period as stated on the cover of this report and do not necessarily represent the views of Fidelity or any other person in the Fidelity organization. Any such views are subject to change at any time based upon market or other conditions and Fidelity disclaims any responsibility to update such views. These views may not be relied on as investment advice and, because investment decisions for a Fidelity fund are based on numerous factors, may not be relied on as an indication of trading intent on behalf of any Fidelity fund.
Fidelity® Series All-Sector Equity Fund
Investment Summary (Unaudited)
Top Ten Stocks as of January 31, 2019
| % of fund's net assets | |
| Microsoft Corp. | 4.0 |
| Apple, Inc. | 3.3 |
| Amazon.com, Inc. | 3.1 |
| Alphabet, Inc. Class C | 2.6 |
| UnitedHealth Group, Inc. | 2.1 |
| Capital One Financial Corp. | 1.7 |
| Facebook, Inc. Class A | 1.6 |
| Bank of America Corp. | 1.5 |
| Boston Scientific Corp. | 1.2 |
| AT&T, Inc. | 1.2 |
| 22.3 |
Top Five Market Sectors as of January 31, 2019
| % of fund's net assets | |
| Information Technology | 18.4 |
| Health Care | 14.7 |
| Financials | 12.5 |
| Consumer Discretionary | 10.4 |
| Industrials | 9.8 |
Asset Allocation (% of fund's net assets)
| As of January 31, 2019 * | ||
| Stocks and Equity Futures | 97.7% | |
| Short-Term Investments and Net Other Assets (Liabilities) | 2.3% | |

* Foreign investments - 4.2%
Fidelity® Series All-Sector Equity Fund
Schedule of Investments January 31, 2019
Showing Percentage of Net Assets
| Common Stocks - 95.8% | |||
| Shares | Value | ||
| COMMUNICATION SERVICES - 9.6% | |||
| Diversified Telecommunication Services - 1.2% | |||
| AT&T, Inc. | 1,394,200 | $41,909,652 | |
| CenturyLink, Inc. | 134,500 | 2,060,540 | |
| 43,970,192 | |||
| Entertainment - 1.8% | |||
| Activision Blizzard, Inc. | 292,921 | 13,837,588 | |
| Electronic Arts, Inc. (a) | 91,000 | 8,393,840 | |
| Netflix, Inc. (a) | 56,100 | 19,045,950 | |
| Take-Two Interactive Software, Inc. (a) | 17,600 | 1,857,680 | |
| The Walt Disney Co. | 203,617 | 22,707,368 | |
| 65,842,426 | |||
| Interactive Media & Services - 4.8% | |||
| Alphabet, Inc.: | |||
| Class A (a) | 9,200 | 10,358,188 | |
| Class C (a) | 85,266 | 95,188,404 | |
| Facebook, Inc. Class A (a) | 339,600 | 56,607,924 | |
| IAC/InterActiveCorp (a) | 30,500 | 6,444,040 | |
| Twitter, Inc. (a) | 98,500 | 3,305,660 | |
| 171,904,216 | |||
| Media - 1.0% | |||
| Comcast Corp. Class A | 980,748 | 35,865,954 | |
| Liberty Media Corp. Liberty SiriusXM Series A (a) | 40,100 | 1,595,178 | |
| 37,461,132 | |||
| Wireless Telecommunication Services - 0.8% | |||
| T-Mobile U.S., Inc. (a) | 391,263 | 27,239,730 | |
| TOTAL COMMUNICATION SERVICES | 346,417,696 | ||
| CONSUMER DISCRETIONARY - 10.4% | |||
| Auto Components - 0.5% | |||
| Aptiv PLC | 158,700 | 12,557,931 | |
| BorgWarner, Inc. | 84,800 | 3,468,320 | |
| 16,026,251 | |||
| Diversified Consumer Services - 0.3% | |||
| Service Corp. International | 247,400 | 10,618,408 | |
| Hotels, Restaurants & Leisure - 2.3% | |||
| Hilton Grand Vacations, Inc. (a) | 208,100 | 6,313,754 | |
| Marriott International, Inc. Class A | 129,341 | 14,813,425 | |
| McDonald's Corp. | 199,600 | 35,684,488 | |
| Royal Caribbean Cruises Ltd. | 144,100 | 17,299,205 | |
| Starbucks Corp. | 148,338 | 10,107,751 | |
| 84,218,623 | |||
| Household Durables - 0.5% | |||
| Lennar Corp. Class A | 203,300 | 9,640,486 | |
| Mohawk Industries, Inc. (a) | 52,000 | 6,697,080 | |
| 16,337,566 | |||
| Internet & Direct Marketing Retail - 3.6% | |||
| Amazon.com, Inc. (a) | 65,060 | 111,820,574 | |
| The Booking Holdings, Inc. (a) | 10,100 | 18,511,381 | |
| 130,331,955 | |||
| Multiline Retail - 0.4% | |||
| Dollar Tree, Inc. (a) | 147,300 | 14,263,059 | |
| Specialty Retail - 2.2% | |||
| Burlington Stores, Inc. (a) | 72,000 | 12,363,120 | |
| Home Depot, Inc. | 223,279 | 40,978,395 | |
| Tiffany & Co., Inc. | 30,200 | 2,679,646 | |
| TJX Companies, Inc. | 458,996 | 22,825,871 | |
| 78,847,032 | |||
| Textiles, Apparel & Luxury Goods - 0.6% | |||
| Carter's, Inc. | 82,700 | 6,855,830 | |
| Tapestry, Inc. | 410,600 | 15,894,326 | |
| 22,750,156 | |||
| TOTAL CONSUMER DISCRETIONARY | 373,393,050 | ||
| CONSUMER STAPLES - 6.5% | |||
| Beverages - 2.0% | |||
| Constellation Brands, Inc. Class A (sub. vtg.) | 53,304 | 9,256,773 | |
| Keurig Dr. Pepper, Inc. | 152,943 | 4,163,108 | |
| Monster Beverage Corp. (a) | 179,498 | 10,274,466 | |
| PepsiCo, Inc. | 83,800 | 9,441,746 | |
| The Coca-Cola Co. | 803,954 | 38,694,306 | |
| 71,830,399 | |||
| Food & Staples Retailing - 0.6% | |||
| Costco Wholesale Corp. | 21,900 | 4,700,397 | |
| Sysco Corp. | 93,900 | 5,995,515 | |
| Walgreens Boots Alliance, Inc. | 9,229 | 666,888 | |
| Walmart, Inc. | 89,000 | 8,528,870 | |
| 19,891,670 | |||
| Food Products - 1.0% | |||
| Bunge Ltd. | 105,700 | 5,820,899 | |
| Mondelez International, Inc. | 528,700 | 24,457,662 | |
| The Kraft Heinz Co. | 151,600 | 7,285,896 | |
| 37,564,457 | |||
| Household Products - 1.4% | |||
| Colgate-Palmolive Co. | 294,984 | 19,079,565 | |
| Procter & Gamble Co. | 338,000 | 32,606,860 | |
| 51,686,425 | |||
| Personal Products - 0.4% | |||
| Coty, Inc. Class A | 487,471 | 3,782,775 | |
| Estee Lauder Companies, Inc. Class A | 74,842 | 10,209,946 | |
| 13,992,721 | |||
| Tobacco - 1.1% | |||
| Altria Group, Inc. | 176,530 | 8,711,756 | |
| Philip Morris International, Inc. | 379,428 | 29,109,716 | |
| 37,821,472 | |||
| TOTAL CONSUMER STAPLES | 232,787,144 | ||
| ENERGY - 4.8% | |||
| Energy Equipment & Services - 0.5% | |||
| Baker Hughes, a GE Co. Class A | 254,200 | 5,991,494 | |
| Halliburton Co. | 41,540 | 1,302,694 | |
| Schlumberger Ltd. | 197,100 | 8,713,791 | |
| 16,007,979 | |||
| Oil, Gas & Consumable Fuels - 4.3% | |||
| Anadarko Petroleum Corp. | 225,681 | 10,681,482 | |
| Cabot Oil & Gas Corp. | 169,200 | 4,221,540 | |
| Chevron Corp. | 175,229 | 20,090,005 | |
| ConocoPhillips Co. | 123,300 | 8,346,177 | |
| Devon Energy Corp. | 330,400 | 8,805,160 | |
| Diamondback Energy, Inc. | 56,100 | 5,785,032 | |
| EOG Resources, Inc. | 197,100 | 19,552,320 | |
| Exxon Mobil Corp. | 275,824 | 20,212,383 | |
| HollyFrontier Corp. | 69,300 | 3,904,362 | |
| Marathon Petroleum Corp. | 56,100 | 3,717,186 | |
| Noble Energy, Inc. | 335,700 | 7,499,538 | |
| Parsley Energy, Inc. Class A (a) | 304,200 | 5,652,036 | |
| Phillips 66 Co. | 133,800 | 12,765,858 | |
| Pioneer Natural Resources Co. | 65,500 | 9,321,960 | |
| Targa Resources Corp. | 75,800 | 3,260,158 | |
| Valero Energy Corp. | 112,200 | 9,853,404 | |
| Whiting Petroleum Corp. (a) | 93,100 | 2,665,453 | |
| 156,334,054 | |||
| TOTAL ENERGY | 172,342,033 | ||
| FINANCIALS - 12.5% | |||
| Banks - 6.1% | |||
| Bank of America Corp. | 1,821,587 | 51,860,582 | |
| Citigroup, Inc. | 627,584 | 40,454,065 | |
| First Horizon National Corp. | 953,900 | 14,003,252 | |
| Huntington Bancshares, Inc. | 2,331,857 | 30,873,787 | |
| KeyCorp | 723,100 | 11,909,457 | |
| M&T Bank Corp. | 83,000 | 13,656,820 | |
| PNC Financial Services Group, Inc. | 94,900 | 11,641,383 | |
| Signature Bank | 32,200 | 4,099,382 | |
| Wells Fargo & Co. | 838,200 | 40,996,362 | |
| 219,495,090 | |||
| Capital Markets - 1.2% | |||
| Bank of New York Mellon Corp. | 178,200 | 9,323,424 | |
| Cboe Global Markets, Inc. | 177,600 | 16,564,752 | |
| E*TRADE Financial Corp. | 389,152 | 18,157,832 | |
| 44,046,008 | |||
| Consumer Finance - 2.4% | |||
| American Express Co. | 113,600 | 11,666,720 | |
| Capital One Financial Corp. | 754,805 | 60,829,735 | |
| SLM Corp. | 1,152,946 | 12,348,052 | |
| 84,844,507 | |||
| Insurance - 2.8% | |||
| American International Group, Inc. | 618,000 | 26,716,140 | |
| Hartford Financial Services Group, Inc. | 174,500 | 8,187,540 | |
| Marsh & McLennan Companies, Inc. | 11,300 | 996,547 | |
| MetLife, Inc. | 663,200 | 30,288,344 | |
| The Travelers Companies, Inc. | 78,700 | 9,879,998 | |
| Willis Group Holdings PLC | 155,900 | 25,378,961 | |
| 101,447,530 | |||
| TOTAL FINANCIALS | 449,833,135 | ||
| HEALTH CARE - 14.7% | |||
| Biotechnology - 2.8% | |||
| Alexion Pharmaceuticals, Inc. (a) | 161,100 | 19,808,856 | |
| Amgen, Inc. | 181,803 | 34,017,159 | |
| Biogen, Inc. (a) | 42,424 | 14,160,283 | |
| Sarepta Therapeutics, Inc. (a) | 55,000 | 7,684,050 | |
| Vertex Pharmaceuticals, Inc. (a) | 128,100 | 24,455,571 | |
| 100,125,919 | |||
| Health Care Equipment & Supplies - 4.4% | |||
| Abbott Laboratories | 495,600 | 36,168,888 | |
| Baxter International, Inc. | 242,100 | 17,549,829 | |
| Becton, Dickinson & Co. | 157,100 | 39,190,166 | |
| Boston Scientific Corp. (a) | 1,129,310 | 43,083,177 | |
| Intuitive Surgical, Inc. (a) | 41,900 | 21,940,516 | |
| 157,932,576 | |||
| Health Care Providers & Services - 4.5% | |||
| AmerisourceBergen Corp. | 91,000 | 7,586,670 | |
| DaVita HealthCare Partners, Inc. (a) | 167,900 | 9,424,227 | |
| HCA Holdings, Inc. | 158,700 | 22,127,541 | |
| Henry Schein, Inc. (a) | 63,074 | 4,900,850 | |
| Humana, Inc. | 80,900 | 24,997,291 | |
| Molina Healthcare, Inc. (a) | 138,800 | 18,457,624 | |
| UnitedHealth Group, Inc. | 276,100 | 74,602,220 | |
| 162,096,423 | |||
| Life Sciences Tools & Services - 0.9% | |||
| Thermo Fisher Scientific, Inc. | 130,600 | 32,084,502 | |
| Pharmaceuticals - 2.1% | |||
| Allergan PLC | 78,604 | 11,317,404 | |
| Bristol-Myers Squibb Co. | 444,700 | 21,954,839 | |
| Eli Lilly & Co. | 341,500 | 40,932,190 | |
| Nektar Therapeutics (a) | 65,000 | 2,752,100 | |
| 76,956,533 | |||
| TOTAL HEALTH CARE | 529,195,953 | ||
| INDUSTRIALS - 9.8% | |||
| Aerospace & Defense - 1.7% | |||
| General Dynamics Corp. | 30,000 | 5,135,100 | |
| Northrop Grumman Corp. | 51,600 | 14,218,380 | |
| The Boeing Co. | 41,500 | 16,003,230 | |
| United Technologies Corp. | 220,948 | 26,087,330 | |
| 61,444,040 | |||
| Air Freight & Logistics - 0.5% | |||
| United Parcel Service, Inc. Class B | 158,400 | 16,695,360 | |
| Airlines - 0.5% | |||
| American Airlines Group, Inc. | 496,165 | 17,747,822 | |
| Building Products - 0.3% | |||
| Allegion PLC | 127,100 | 10,912,806 | |
| Commercial Services & Supplies - 0.1% | |||
| Stericycle, Inc. (a) | 85,700 | 3,777,656 | |
| Construction & Engineering - 0.9% | |||
| AECOM (a) | 680,900 | 20,842,349 | |
| Jacobs Engineering Group, Inc. | 174,700 | 11,320,560 | |
| 32,162,909 | |||
| Electrical Equipment - 0.6% | |||
| Sensata Technologies, Inc. PLC (a) | 467,200 | 22,192,000 | |
| Industrial Conglomerates - 1.2% | |||
| 3M Co. | 16,700 | 3,345,010 | |
| General Electric Co. | 2,748,900 | 27,928,824 | |
| Honeywell International, Inc. | 76,805 | 11,031,502 | |
| 42,305,336 | |||
| Machinery - 1.0% | |||
| Allison Transmission Holdings, Inc. | 331,814 | 16,149,387 | |
| Apergy Corp. (a) | 78,500 | 2,639,170 | |
| WABCO Holdings, Inc. (a) | 157,700 | 18,014,071 | |
| 36,802,628 | |||
| Professional Services - 0.8% | |||
| Nielsen Holdings PLC | 1,109,215 | 28,484,641 | |
| Road & Rail - 1.3% | |||
| CSX Corp. | 322,400 | 21,181,680 | |
| Norfolk Southern Corp. | 142,500 | 23,902,950 | |
| Union Pacific Corp. | 19,500 | 3,101,865 | |
| 48,186,495 | |||
| Trading Companies & Distributors - 0.9% | |||
| HD Supply Holdings, Inc. (a) | 733,800 | 30,775,572 | |
| TOTAL INDUSTRIALS | 351,487,265 | ||
| INFORMATION TECHNOLOGY - 18.4% | |||
| Communications Equipment - 0.1% | |||
| CommScope Holding Co., Inc. (a) | 111,900 | 2,339,829 | |
| Electronic Equipment & Components - 0.1% | |||
| Flextronics International Ltd. (a) | 149,100 | 1,434,342 | |
| Jabil, Inc. | 111,736 | 2,977,764 | |
| 4,412,106 | |||
| IT Services - 3.3% | |||
| Alliance Data Systems Corp. | 110,000 | 19,534,900 | |
| Cognizant Technology Solutions Corp. Class A | 178,300 | 12,423,944 | |
| DXC Technology Co. | 47,000 | 3,013,640 | |
| Global Payments, Inc. | 53,200 | 5,973,296 | |
| GoDaddy, Inc. (a) | 105,900 | 7,267,917 | |
| Leidos Holdings, Inc. | 98,700 | 5,724,600 | |
| MasterCard, Inc. Class A | 186,700 | 39,417,971 | |
| PayPal Holdings, Inc. (a) | 226,100 | 20,068,636 | |
| Worldpay, Inc. (a) | 69,200 | 5,776,816 | |
| 119,201,720 | |||
| Semiconductors & Semiconductor Equipment - 4.2% | |||
| Advanced Micro Devices, Inc. (a) | 143,400 | 3,500,394 | |
| Analog Devices, Inc. | 63,500 | 6,277,610 | |
| Applied Materials, Inc. | 353,400 | 13,810,872 | |
| Broadcom, Inc. | 70,700 | 18,965,275 | |
| Lam Research Corp. | 104,400 | 17,704,152 | |
| Marvell Technology Group Ltd. | 502,300 | 9,307,619 | |
| Microchip Technology, Inc. | 19,100 | 1,535,067 | |
| Micron Technology, Inc. (a) | 285,400 | 10,907,988 | |
| NVIDIA Corp. | 152,780 | 21,962,125 | |
| NXP Semiconductors NV | 71,300 | 6,205,239 | |
| ON Semiconductor Corp. (a) | 1,158,500 | 23,216,340 | |
| Qualcomm, Inc. | 258,504 | 12,801,118 | |
| Xilinx, Inc. | 29,400 | 3,291,036 | |
| 149,484,835 | |||
| Software - 7.4% | |||
| 2U, Inc. (a) | 102,000 | 5,798,700 | |
| Adobe, Inc. (a) | 77,600 | 19,230,832 | |
| Autodesk, Inc. (a) | 175,635 | 25,853,472 | |
| Citrix Systems, Inc. | 89,154 | 9,141,851 | |
| Microsoft Corp. | 1,376,200 | 143,716,566 | |
| Nuance Communications, Inc. (a) | 412,701 | 6,549,565 | |
| Palo Alto Networks, Inc. (a) | 19,400 | 4,167,508 | |
| Parametric Technology Corp. (a) | 94,200 | 7,987,218 | |
| RingCentral, Inc. (a) | 34,700 | 3,207,668 | |
| Salesforce.com, Inc. (a) | 206,363 | 31,360,985 | |
| SS&C Technologies Holdings, Inc. | 95,600 | 4,922,444 | |
| Workday, Inc. Class A (a) | 32,700 | 5,936,031 | |
| 267,872,840 | |||
| Technology Hardware, Storage & Peripherals - 3.3% | |||
| Apple, Inc. | 723,759 | 120,462,448 | |
| TOTAL INFORMATION TECHNOLOGY | 663,773,778 | ||
| MATERIALS - 2.6% | |||
| Chemicals - 2.3% | |||
| Air Products & Chemicals, Inc. | 41,900 | 6,887,941 | |
| Cabot Corp. | 18,100 | 848,709 | |
| DowDuPont, Inc. | 479,822 | 25,819,222 | |
| Element Solutions, Inc. (a) | 216,300 | 2,431,212 | |
| International Flavors & Fragrances, Inc. | 13,500 | 1,914,030 | |
| Linde PLC | 53,900 | 8,786,239 | |
| LyondellBasell Industries NV Class A | 73,347 | 6,378,989 | |
| Olin Corp. | 329,000 | 7,767,690 | |
| Sherwin-Williams Co. | 10,800 | 4,552,416 | |
| The Chemours Co. LLC | 390,100 | 13,946,075 | |
| Westlake Chemical Corp. | 30,921 | 2,285,062 | |
| 81,617,585 | |||
| Construction Materials - 0.1% | |||
| Vulcan Materials Co. | 33,400 | 3,395,110 | |
| Containers & Packaging - 0.1% | |||
| Aptargroup, Inc. | 13,100 | 1,298,472 | |
| Crown Holdings, Inc. (a) | 51,300 | 2,616,300 | |
| 3,914,772 | |||
| Metals & Mining - 0.1% | |||
| Alcoa Corp. (a) | 24,700 | 733,096 | |
| Livent Corp. (b) | 57,300 | 725,418 | |
| Newmont Mining Corp. | 69,600 | 2,374,056 | |
| Royal Gold, Inc. | 9,000 | 786,330 | |
| Steel Dynamics, Inc. | 29,100 | 1,064,769 | |
| 5,683,669 | |||
| TOTAL MATERIALS | 94,611,136 | ||
| REAL ESTATE - 3.7% | |||
| Equity Real Estate Investment Trusts (REITs) - 3.4% | |||
| American Homes 4 Rent Class A | 105,700 | 2,337,027 | |
| American Tower Corp. | 158,200 | 27,343,288 | |
| Boston Properties, Inc. | 76,700 | 10,114,429 | |
| Crown Castle International Corp. | 40,600 | 4,752,636 | |
| Equinix, Inc. | 25,500 | 10,047,000 | |
| Equity Lifestyle Properties, Inc. | 140,900 | 14,918,492 | |
| Outfront Media, Inc. | 110,800 | 2,299,100 | |
| Prologis, Inc. | 228,800 | 15,823,808 | |
| Public Storage | 45,700 | 9,712,164 | |
| Spirit Realty Capital, Inc. | 98,260 | 3,902,887 | |
| Store Capital Corp. | 151,400 | 4,893,248 | |
| The Macerich Co. | 117,200 | 5,409,952 | |
| Welltower, Inc. | 144,000 | 11,158,560 | |
| 122,712,591 | |||
| Real Estate Management & Development - 0.3% | |||
| CBRE Group, Inc. (a) | 65,500 | 2,996,625 | |
| VICI Properties, Inc. | 304,200 | 6,549,426 | |
| 9,546,051 | |||
| TOTAL REAL ESTATE | 132,258,642 | ||
| UTILITIES - 2.8% | |||
| Electric Utilities - 1.6% | |||
| Edison International | 106,900 | 6,090,093 | |
| Exelon Corp. | 278,500 | 13,301,160 | |
| FirstEnergy Corp. | 220,800 | 8,655,360 | |
| NextEra Energy, Inc. | 65,435 | 11,711,556 | |
| PPL Corp. | 296,800 | 9,295,776 | |
| Southern Co. | 107,400 | 5,219,640 | |
| Vistra Energy Corp. (a) | 173,500 | 4,356,585 | |
| 58,630,170 | |||
| Independent Power and Renewable Electricity Producers - 0.2% | |||
| NRG Energy, Inc. | 154,800 | 6,332,868 | |
| Multi-Utilities - 1.0% | |||
| Dominion Resources, Inc. | 251,214 | 17,645,271 | |
| Public Service Enterprise Group, Inc. | 133,000 | 7,255,150 | |
| Sempra Energy | 89,844 | 10,509,951 | |
| 35,410,372 | |||
| TOTAL UTILITIES | 100,373,410 | ||
| TOTAL COMMON STOCKS | |||
| (Cost $2,578,234,655) | 3,446,473,242 | ||
| Principal Amount | Value | ||
| U.S. Treasury Obligations - 0.1% | |||
| U.S. Treasury Bills, yield at date of purchase 2.38% 3/7/19 (c) | |||
| (Cost $4,200,604) | 4,210,000 | 4,200,636 | |
| Shares | Value | ||
| Money Market Funds - 4.3% | |||
| Fidelity Cash Central Fund, 2.43% (d) | 156,207,675 | $156,238,916 | |
| Fidelity Securities Lending Cash Central Fund 2.43% (d)(e) | 184,582 | 184,600 | |
| TOTAL MONEY MARKET FUNDS | |||
| (Cost $156,418,190) | 156,423,516 | ||
| TOTAL INVESTMENT IN SECURITIES - 100.2% | |||
| (Cost $2,738,853,449) | 3,607,097,394 | ||
| NET OTHER ASSETS (LIABILITIES) - (0.2)% | (8,644,379) | ||
| NET ASSETS - 100% | $3,598,453,015 |
| Futures Contracts | |||||
| Number of contracts | Expiration Date | Notional Amount | Value | Unrealized Appreciation/(Depreciation) | |
| Purchased | |||||
| Equity Index Contracts | |||||
| CME E-mini S&P 500 Index Contracts (United States) | 495 | March 2019 | $66,936,375 | $1,562,698 | $1,562,698 |
The notional amount of futures purchased as a percentage of Net Assets is 1.9%
For the period, the average monthly underlying face amount at value for futures contracts in the aggregate was $61,261,486.
Legend
(a) Non-income producing
(b) Security or a portion of the security is on loan at period end.
(c) Security or a portion of the security was pledged to cover margin requirements for futures contracts. At period end, the value of securities pledged amounted to $2,924,481.
(d) Affiliated fund that is generally available only to investment companies and other accounts managed by Fidelity Investments. The rate quoted is the annualized seven-day yield of the fund at period end. A complete unaudited listing of the fund's holdings as of its most recent quarter end is available upon request. In addition, each Fidelity Central Fund's financial statements, which are not covered by the Fund's Report of Independent Registered Public Accounting Firm, are available on the SEC's website or upon request.
(e) Investment made with cash collateral received from securities on loan.
Affiliated Central Funds
Information regarding fiscal year to date income earned by the Fund from investments in Fidelity Central Funds is as follows:
| Fund | Income earned |
| Fidelity Cash Central Fund | $2,501,987 |
| Fidelity Securities Lending Cash Central Fund | 24,847 |
| Total | $2,526,834 |
Amounts in the income column in the above table include any capital gain distributions from underlying funds, which are presented in the corresponding line-item in the Statement of Operations, if applicable.
Investment Valuation
The following is a summary of the inputs used, as of January 31, 2019, involving the Fund's assets and liabilities carried at fair value. The inputs or methodology used for valuing securities may not be an indication of the risk associated with investing in those securities. For more information on valuation inputs, and their aggregation into the levels used below, please refer to the Investment Valuation section in the accompanying Notes to Financial Statements.
| Valuation Inputs at Reporting Date: | ||||
| Description | Total | Level 1 | Level 2 | Level 3 |
| Investments in Securities: | ||||
| Equities: | ||||
| Communication Services | $346,417,696 | $346,417,696 | $-- | $-- |
| Consumer Discretionary | 373,393,050 | 373,393,050 | -- | -- |
| Consumer Staples | 232,787,144 | 232,787,144 | -- | -- |
| Energy | 172,342,033 | 172,342,033 | -- | -- |
| Financials | 449,833,135 | 449,833,135 | -- | -- |
| Health Care | 529,195,953 | 529,195,953 | -- | -- |
| Industrials | 351,487,265 | 351,487,265 | -- | -- |
| Information Technology | 663,773,778 | 663,773,778 | -- | -- |
| Materials | 94,611,136 | 94,611,136 | -- | -- |
| Real Estate | 132,258,642 | 132,258,642 | -- | -- |
| Utilities | 100,373,410 | 100,373,410 | -- | -- |
| U.S. Government and Government Agency Obligations | 4,200,636 | -- | 4,200,636 | -- |
| Money Market Funds | 156,423,516 | 156,423,516 | -- | -- |
| Total Investments in Securities: | $3,607,097,394 | $3,602,896,758 | $4,200,636 | $-- |
| Derivative Instruments: | ||||
| Assets | ||||
| Futures Contracts | $1,562,698 | $1,562,698 | $-- | $-- |
| Total Assets | $1,562,698 | $1,562,698 | $-- | $-- |
| Total Derivative Instruments: | $1,562,698 | $1,562,698 | $-- | $-- |
Value of Derivative Instruments
The following table is a summary of the Fund's value of derivative instruments by primary risk exposure as of January 31, 2019. For additional information on derivative instruments, please refer to the Derivative Instruments section in the accompanying Notes to Financial Statements.
| Primary Risk Exposure / Derivative Type | Value | |
| Asset | Liability | |
| Equity Risk | ||
| Futures Contracts(a) | $1,562,698 | $0 |
| Total Equity Risk | 1,562,698 | 0 |
| Total Value of Derivatives | $1,562,698 | $0 |
(a) Reflects gross cumulative appreciation (depreciation) on futures contracts as presented in the Schedule of Investments. In the Statement of Assets and Liabilities, the period end daily variation margin is included in receivable or payable for daily variation margin on futures contracts, and the net cumulative appreciation (depreciation) is included in net unrealized appreciation (depreciation).
See accompanying notes which are an integral part of the financial statements.
Fidelity® Series All-Sector Equity Fund
Financial Statements
Statement of Assets and Liabilities
| January 31, 2019 | ||
| Assets | ||
| Investment in securities, at value (including securities loaned of $179,772) — See accompanying schedule: Unaffiliated issuers (cost $2,582,435,259) | $3,450,673,878 | |
| Fidelity Central Funds (cost $156,418,190) | 156,423,516 | |
| Total Investment in Securities (cost $2,738,853,449) | $3,607,097,394 | |
| Cash | 64,987 | |
| Receivable for investments sold | 15,688,583 | |
| Receivable for fund shares sold | 1,801,544 | |
| Dividends receivable | 2,308,194 | |
| Distributions receivable from Fidelity Central Funds | 221,892 | |
| Receivable for daily variation margin on futures contracts | 520,623 | |
| Other receivables | 106,145 | |
| Total assets | 3,627,809,362 | |
| Liabilities | ||
| Payable for investments purchased | $27,177,261 | |
| Payable for fund shares redeemed | 1,975,967 | |
| Other payables and accrued expenses | 18,519 | |
| Collateral on securities loaned | 184,600 | |
| Total liabilities | 29,356,347 | |
| Net Assets | $3,598,453,015 | |
| Net Assets consist of: | ||
| Paid in capital | $2,701,795,541 | |
| Total distributable earnings (loss) | 896,657,474 | |
| Net Assets | $3,598,453,015 | |
| Net Asset Value, offering price and redemption price per share ($3,598,453,015 ÷ 385,042,349 shares) | $9.35 |
See accompanying notes which are an integral part of the financial statements.
Statement of Operations
| Year ended January 31, 2019 | ||
| Investment Income | ||
| Dividends | $86,234,264 | |
| Interest | 170,329 | |
| Income from Fidelity Central Funds | 2,526,834 | |
| Total income | 88,931,427 | |
| Expenses | ||
| Custodian fees and expenses | $107,454 | |
| Independent trustees' fees and expenses | 30,689 | |
| Interest | 6,613 | |
| Miscellaneous | 16,668 | |
| Total expenses before reductions | 161,424 | |
| Expense reductions | (173,116) | |
| Total expenses after reductions | (11,692) | |
| Net investment income (loss) | 88,943,119 | |
| Realized and Unrealized Gain (Loss) | ||
| Net realized gain (loss) on: | ||
| Investment securities: | ||
| Unaffiliated issuers | 1,144,674,294 | |
| Fidelity Central Funds | (380) | |
| Foreign currency transactions | (627) | |
| Futures contracts | (3,202,388) | |
| Total net realized gain (loss) | 1,141,470,899 | |
| Change in net unrealized appreciation (depreciation) on: | ||
| Investment securities: | ||
| Unaffiliated issuers | (1,242,106,067) | |
| Fidelity Central Funds | (193) | |
| Assets and liabilities in foreign currencies | (12,409) | |
| Futures contracts | 1,238,825 | |
| Total change in net unrealized appreciation (depreciation) | (1,240,879,844) | |
| Net gain (loss) | (99,408,945) | |
| Net increase (decrease) in net assets resulting from operations | $(10,465,826) |
See accompanying notes which are an integral part of the financial statements.
Statement of Changes in Net Assets
| Year ended January 31, 2019 | Year ended January 31, 2018 | |
| Increase (Decrease) in Net Assets | ||
| Operations | ||
| Net investment income (loss) | $88,943,119 | $85,725,708 |
| Net realized gain (loss) | 1,141,470,899 | 811,779,870 |
| Change in net unrealized appreciation (depreciation) | (1,240,879,844) | 531,184,034 |
| Net increase (decrease) in net assets resulting from operations | (10,465,826) | 1,428,689,612 |
| Distributions to shareholders | (1,124,214,915) | – |
| Distributions to shareholders from net investment income | – | (85,264,515) |
| Distributions to shareholders from net realized gain | – | (756,569,233) |
| Total distributions | (1,124,214,915) | (841,833,748) |
| Share transactions - net increase (decrease) | (1,817,009,303) | 6,682,768 |
| Total increase (decrease) in net assets | (2,951,690,044) | 593,538,632 |
| Net Assets | ||
| Beginning of period | 6,550,143,059 | 5,956,604,427 |
| End of period | $3,598,453,015 | $6,550,143,059 |
| Other Information | ||
| Undistributed net investment income end of period | $403,384 |
See accompanying notes which are an integral part of the financial statements.
Financial Highlights
Fidelity Series All-Sector Equity Fund
| Years ended January 31, | 2019 | 2018 | 2017 | 2016 | 2015 |
| Selected Per–Share Data | |||||
| Net asset value, beginning of period | $13.46 | $12.33 | $12.02 | $13.80 | $13.89 |
| Income from Investment Operations | |||||
| Net investment income (loss)A | .21 | .18 | .12 | .12 | .13 |
| Net realized and unrealized gain (loss) | (.79) | 2.80 | 2.33 | (.54) | 1.63 |
| Total from investment operations | (.58) | 2.98 | 2.45 | (.42) | 1.76 |
| Distributions from net investment income | (.22) | (.19) | (.18) | (.14)B | (.12) |
| Distributions from net realized gain | (3.31) | (1.66) | (1.96) | (1.22)B | (1.73) |
| Total distributions | (3.53) | (1.85) | (2.14) | (1.36) | (1.85) |
| Net asset value, end of period | $9.35 | $13.46 | $12.33 | $12.02 | $13.80 |
| Total ReturnC | (3.23)% | 25.62% | 21.03% | (3.55)% | 12.68% |
| Ratios to Average Net AssetsD,E | |||||
| Expenses before reductions | - %F | .20% | .68% | .73% | .67% |
| Expenses net of fee waivers, if any | - %F | .20% | .68% | .73% | .67% |
| Expenses net of all reductions | - %F | .20% | .67% | .73% | .67% |
| Net investment income (loss) | 1.68% | 1.37% | .95% | .85% | .92% |
| Supplemental Data | |||||
| Net assets, end of period (000 omitted) | $3,598,453 | $6,550,143 | $2,736,748 | $4,418,280 | $4,969,503 |
| Portfolio turnover rateG | 65% | 61% | 43% | 66% | 65% |
A Calculated based on average shares outstanding during the period.
B The amounts shown reflect certain reclassifications related to book to tax differences that were made in the year shown.
C Total returns would have been lower if certain expenses had not been reduced during the applicable periods shown.
D Fees and expenses of any underlying Fidelity Central Funds are not included in the Fund's expense ratio. The Fund indirectly bears its proportionate share of the expenses of any underlying Fidelity Central Funds.
E Expense ratios reflect operating expenses of the Fund. Expenses before reductions do not reflect amounts reimbursed by the investment adviser or reductions from brokerage service arrangements or reductions from other expense offset arrangements and do not represent the amount paid by the Fund during periods when reimbursements or reductions occur. Expenses net of fee waivers reflect expenses after reimbursement by the investment adviser but prior to reductions from brokerage service arrangements or other expense offset arrangements. Expenses net of all reductions represent the net expenses paid by the Fund.
F Amount represents less than .005%.
G Amount does not include the portfolio activity of any underlying Fidelity Central Funds.
See accompanying notes which are an integral part of the financial statements.
Fidelity® Series Stock Selector Large Cap Value Fund
Performance: The Bottom Line
Average annual total return reflects the change in the value of an investment, assuming reinvestment of distributions from dividend income and capital gains (the profits earned upon the sale of securities that have grown in value, if any) and assuming a constant rate of performance each year. The hypothetical investment and the average annual total returns do not reflect the deduction of taxes that a shareholder would pay on fund distributions or the redemption of fund shares. During periods of reimbursement by Fidelity, a fund’s total return will be greater than it would be had the reimbursement not occurred. How a fund did yesterday is no guarantee of how it will do tomorrow.
Average Annual Total Returns
| For the periods ended January 31, 2019 | Past 1 year | Past 5 years | Life of fundA |
| Fidelity® Series Stock Selector Large Cap Value Fund | (5.07)% | 7.53% | 10.34% |
A From December 6, 2012
$10,000 Over Life of Fund
Let's say hypothetically that $10,000 was invested in Fidelity® Series Stock Selector Large Cap Value Fund on December 6, 2012, when the fund started.
The chart shows how the value of your investment would have changed, and also shows how the Russell 1000® Value Index performed over the same period.
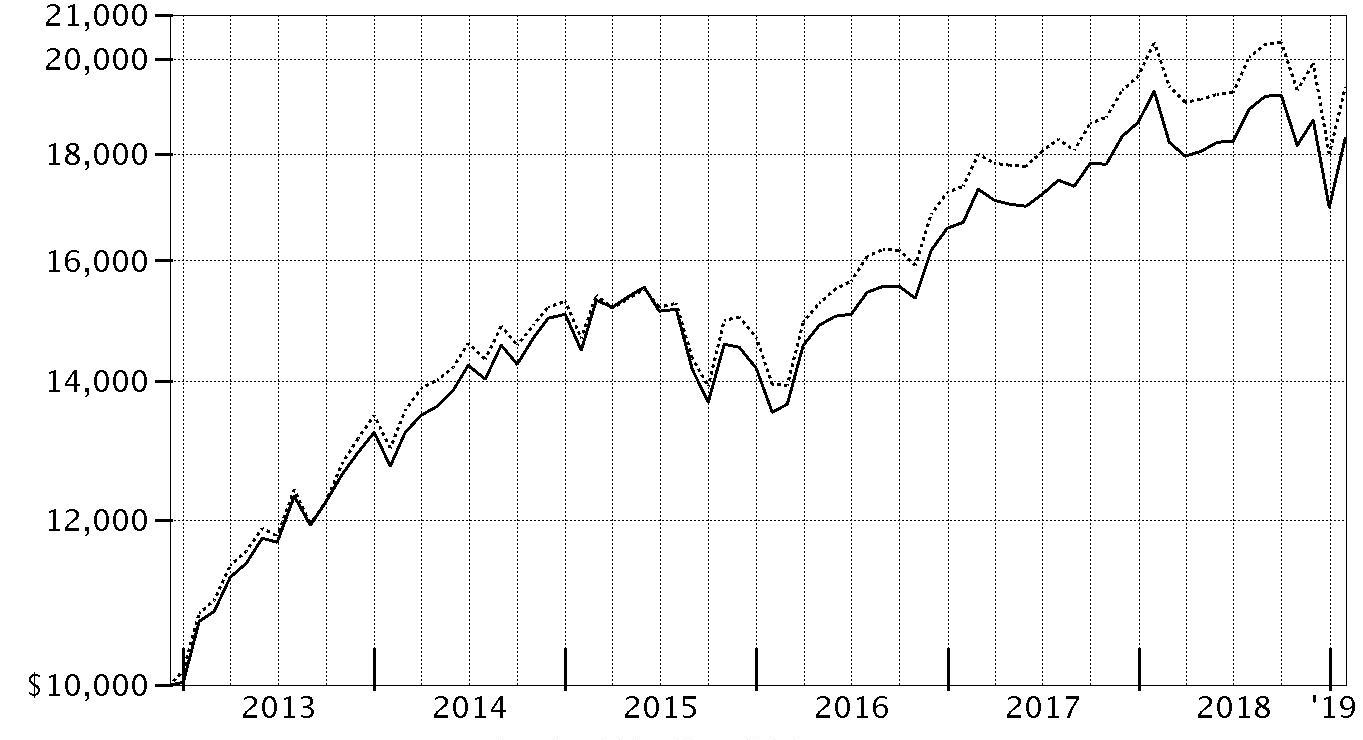
| Period Ending Values | ||
| $18,326 | Fidelity® Series Stock Selector Large Cap Value Fund | |
| $19,392 | Russell 1000® Value Index | |
Fidelity® Series Stock Selector Large Cap Value Fund
Management's Discussion of Fund Performance
Market Recap: The S&P 500® index returned -2.31% for the 12 months ending January 31, 2019, as the U.S. equity bellwether began the new year on a high note after enduring a final quarter of 2018 in which resurgent volatility upset the aging bull market. In October, rising U.S. Treasury yields and concern about peaking corporate earnings growth sent many investors fleeing from risk assets as they were still dealing with lingering uncertainty related to global trade and the U.S. Federal Reserve picking up the pace of interest rate hikes. The index returned -6.84% in October, at the time its largest monthly drop in seven years. But conditions worsened through Christmas, as jitters about the economy and another hike in rates led to a spike in market volatility and a -9.03% result for December. Sharply reversing course to begin 2019, the S&P 500® gained 8.01% in January, its strongest opening month since 1987, amid upbeat company earnings/outlooks and signs the Fed may pause on rates. For the full period, some economically sensitive sectors were at the bottom of the 12-month performance scale: materials (-14%), energy (-12%), financials (-11%) and industrials (-8%). Meanwhile, communication services – which includes dividend-rich telecom stocks – and consumer staples returned about -5%. In contrast, the defensive utilities (+11%), real estate (+10%) and health care (+5%) sectors led the way.Comments from Lead Portfolio Manager Matthew Friedman: For the fiscal year, the fund returned -5.07%, modestly behind the -4.81% result of the benchmark Russell 1000® Value Index. Versus the benchmark, security selection detracted, especially in the financials sector. Conversely, choices within information technology added value. An overweighting, on average, in flooring manufacturer Mohawk Industries (-57%) detracted more than any other fund position for the period, reflecting higher costs that led to disappointing earnings. We sold our stake in Mohawk by period end. An overweighting in insurance company American International Group (-30%) also hurt versus the benchmark. On the positive side, shares of integrated energy company ConocoPhillips (+18%) added value. Also in energy, the fund’s stake in Andeavor contributed, as shares gained due to this company’s merger with Marathon Petroleum, completed in October. As a result of the merger, the fund did not hold Andeavor as of January 31.The views expressed above reflect those of the portfolio manager(s) only through the end of the period as stated on the cover of this report and do not necessarily represent the views of Fidelity or any other person in the Fidelity organization. Any such views are subject to change at any time based upon market or other conditions and Fidelity disclaims any responsibility to update such views. These views may not be relied on as investment advice and, because investment decisions for a Fidelity fund are based on numerous factors, may not be relied on as an indication of trading intent on behalf of any Fidelity fund.
Notes to shareholders: On June 11, 2018, Pierre Sorel assumed management responsibility for the fund’s financials and real estate sleeves, succeeding Justin Bennett, who moved into a new role. On March 31, 2018, Kathy Buck retired from portfolio management, leaving Laurie Mundt as sole manager of the consumer staples sleeve and Chip Perrone as sole manager of the consumer discretionary sleeve.Fidelity® Series Stock Selector Large Cap Value Fund
Investment Summary (Unaudited)
Top Ten Stocks as of January 31, 2019
| % of fund's net assets | |
| Bank of America Corp. | 2.7 |
| Wells Fargo & Co. | 2.5 |
| Verizon Communications, Inc. | 2.4 |
| Johnson & Johnson | 2.4 |
| Comcast Corp. Class A | 2.2 |
| Capital One Financial Corp. | 2.3 |
| Citigroup, Inc. | 2.0 |
| Pfizer, Inc. | 1.9 |
| Procter & Gamble Co. | 1.8 |
| Suncor Energy, Inc. | 1.7 |
| 21.9 |
Top Five Market Sectors as of January 31, 2019
| % of fund's net assets | |
| Financials | 21.3 |
| Health Care | 14.0 |
| Energy | 9.3 |
| Information Technology | 9.1 |
| Industrials | 7.8 |
Asset Allocation (% of fund's net assets)
| As of January 31, 2019 * | ||
| Stocks and Equity Futures | 96.0% | |
| Short-Term Investments and Net Other Assets (Liabilities) | 4.0% | |

* Foreign investments - 12.5%
Fidelity® Series Stock Selector Large Cap Value Fund
Schedule of Investments January 31, 2019
Showing Percentage of Net Assets
| Common Stocks - 95.6% | |||
| Shares | Value | ||
| COMMUNICATION SERVICES - 7.3% | |||
| Diversified Telecommunication Services - 2.4% | |||
| Verizon Communications, Inc. | 4,640,703 | $255,517,107 | |
| Entertainment - 1.4% | |||
| Cinemark Holdings, Inc. | 754,119 | 30,858,549 | |
| The Walt Disney Co. | 1,000,924 | 111,623,044 | |
| 142,481,593 | |||
| Interactive Media & Services - 0.5% | |||
| Alphabet, Inc. Class A (a) | 45,300 | 51,002,817 | |
| Media - 3.0% | |||
| Comcast Corp. Class A | 6,522,100 | 238,513,197 | |
| Interpublic Group of Companies, Inc. | 1,720,100 | 39,132,275 | |
| Omnicom Group, Inc. | 543,200 | 42,304,416 | |
| 319,949,888 | |||
| TOTAL COMMUNICATION SERVICES | 768,951,405 | ||
| CONSUMER DISCRETIONARY - 5.8% | |||
| Auto Components - 0.6% | |||
| Aptiv PLC | 809,400 | 64,047,822 | |
| Hotels, Restaurants & Leisure - 2.6% | |||
| McDonald's Corp. | 957,200 | 171,128,216 | |
| Royal Caribbean Cruises Ltd. | 908,700 | 109,089,435 | |
| 280,217,651 | |||
| Household Durables - 0.7% | |||
| Lennar Corp. Class A | 1,493,100 | 70,802,802 | |
| Multiline Retail - 0.6% | |||
| Dollar Tree, Inc. (a) | 720,100 | 69,727,283 | |
| Specialty Retail - 0.7% | |||
| Burlington Stores, Inc. (a) | 409,200 | 70,263,732 | |
| Textiles, Apparel & Luxury Goods - 0.6% | |||
| Tapestry, Inc. | 1,534,900 | 59,415,979 | |
| TOTAL CONSUMER DISCRETIONARY | 614,475,269 | ||
| CONSUMER STAPLES - 6.8% | |||
| Beverages - 0.4% | |||
| PepsiCo, Inc. | 115,800 | 13,047,186 | |
| The Coca-Cola Co. | 647,500 | 31,164,175 | |
| 44,211,361 | |||
| Food & Staples Retailing - 1.7% | |||
| Kroger Co. | 705,000 | 19,972,650 | |
| Walgreens Boots Alliance, Inc. | 659,200 | 47,633,792 | |
| Walmart, Inc. | 1,146,171 | 109,837,567 | |
| 177,444,009 | |||
| Food Products - 1.6% | |||
| Archer Daniels Midland Co. | 177,100 | 7,951,790 | |
| Bunge Ltd. | 77,300 | 4,256,911 | |
| Conagra Brands, Inc. | 1,353,600 | 29,291,904 | |
| McCormick & Co., Inc. (non-vtg.) | 87,300 | 10,793,772 | |
| Mondelez International, Inc. | 1,402,352 | 64,872,804 | |
| The Kraft Heinz Co. | 764,329 | 36,733,652 | |
| Tyson Foods, Inc. Class A | 236,300 | 14,631,696 | |
| 168,532,529 | |||
| Household Products - 2.1% | |||
| Colgate-Palmolive Co. | 405,800 | 26,247,144 | |
| Kimberly-Clark Corp. | 34,900 | 3,887,162 | |
| Procter & Gamble Co. | 2,006,372 | 193,554,707 | |
| 223,689,013 | |||
| Tobacco - 1.0% | |||
| Altria Group, Inc. | 81,800 | 4,036,830 | |
| Philip Morris International, Inc. | 1,314,846 | 100,874,985 | |
| 104,911,815 | |||
| TOTAL CONSUMER STAPLES | 718,788,727 | ||
| ENERGY - 9.3% | |||
| Energy Equipment & Services - 0.8% | |||
| Baker Hughes, a GE Co. Class A | 3,665,681 | 86,400,101 | |
| Oil, Gas & Consumable Fuels - 8.5% | |||
| Anadarko Petroleum Corp. | 1,549,600 | 73,342,568 | |
| BP PLC sponsored ADR | 2,784,419 | 114,495,309 | |
| Cenovus Energy, Inc. (Canada) | 9,609,683 | 75,037,366 | |
| Cheniere Energy, Inc. (a) | 1,796,100 | 117,913,965 | |
| ConocoPhillips Co. | 2,472,306 | 167,350,393 | |
| Noble Energy, Inc. | 2,547,700 | 56,915,618 | |
| Suncor Energy, Inc. | 5,390,200 | 173,854,923 | |
| Valero Energy Corp. | 1,238,300 | 108,747,506 | |
| 887,657,648 | |||
| TOTAL ENERGY | 974,057,749 | ||
| FINANCIALS - 21.3% | |||
| Banks - 10.6% | |||
| Bank of America Corp. | 9,762,700 | 277,944,067 | |
| Citigroup, Inc. | 3,311,100 | 213,433,506 | |
| First Horizon National Corp. | 4,955,100 | 72,740,868 | |
| Huntington Bancshares, Inc. | 8,839,200 | 117,031,008 | |
| KeyCorp | 4,515,800 | 74,375,226 | |
| U.S. Bancorp | 1,890,800 | 96,733,328 | |
| Wells Fargo & Co. | 5,457,300 | 266,916,543 | |
| 1,119,174,546 | |||
| Capital Markets - 2.5% | |||
| Bank of New York Mellon Corp. | 2,323,200 | 121,549,824 | |
| Cboe Global Markets, Inc. | 368,500 | 34,369,995 | |
| E*TRADE Financial Corp. | 1,719,000 | 80,208,540 | |
| Goldman Sachs Group, Inc. | 160,400 | 31,760,804 | |
| 267,889,163 | |||
| Consumer Finance - 3.0% | |||
| Capital One Financial Corp. | 2,938,400 | 236,805,656 | |
| Discover Financial Services | 514,000 | 34,689,860 | |
| SLM Corp. | 3,739,700 | 40,052,187 | |
| 311,547,703 | |||
| Diversified Financial Services - 1.4% | |||
| Berkshire Hathaway, Inc. Class B (a) | 699,600 | 143,795,784 | |
| Insurance - 3.8% | |||
| American International Group, Inc. | 2,509,500 | 108,485,685 | |
| Hartford Financial Services Group, Inc. | 728,800 | 34,195,296 | |
| MetLife, Inc. | 2,311,451 | 105,563,967 | |
| The Travelers Companies, Inc. | 393,364 | 49,382,917 | |
| Willis Group Holdings PLC | 658,800 | 107,246,052 | |
| 404,873,917 | |||
| TOTAL FINANCIALS | 2,247,281,113 | ||
| HEALTH CARE - 14.0% | |||
| Biotechnology - 0.1% | |||
| Amgen, Inc. | 30,100 | 5,632,011 | |
| Health Care Equipment & Supplies - 3.8% | |||
| Abbott Laboratories | 1,470,700 | 107,331,686 | |
| Baxter International, Inc. | 396,100 | 28,713,289 | |
| Becton, Dickinson & Co. | 307,100 | 76,609,166 | |
| Boston Scientific Corp. (a) | 534,000 | 20,372,100 | |
| Danaher Corp. | 580,200 | 64,355,784 | |
| Medtronic PLC | 1,166,164 | 103,077,236 | |
| 400,459,261 | |||
| Health Care Providers & Services - 2.1% | |||
| Anthem, Inc. | 223,500 | 67,720,500 | |
| Cigna Corp. | 339,976 | 67,930,605 | |
| CVS Health Corp. | 918,536 | 60,210,035 | |
| HCA Holdings, Inc. | 95,000 | 13,245,850 | |
| McKesson Corp. | 123,200 | 15,800,400 | |
| 224,907,390 | |||
| Life Sciences Tools & Services - 1.0% | |||
| Thermo Fisher Scientific, Inc. | 401,900 | 98,734,773 | |
| Pharmaceuticals - 7.0% | |||
| Allergan PLC | 398,100 | 57,318,438 | |
| Bristol-Myers Squibb Co. | 685,200 | 33,828,324 | |
| Jazz Pharmaceuticals PLC (a) | 355,500 | 44,753,895 | |
| Johnson & Johnson | 1,878,306 | 249,964,962 | |
| Merck & Co., Inc. | 2,084,599 | 155,156,704 | |
| Pfizer, Inc. | 4,684,936 | 198,875,533 | |
| 739,897,856 | |||
| TOTAL HEALTH CARE | 1,469,631,291 | ||
| INDUSTRIALS - 7.8% | |||
| Aerospace & Defense - 1.4% | |||
| General Dynamics Corp. | 120,100 | 20,557,517 | |
| United Technologies Corp. | 1,031,653 | 121,807,270 | |
| 142,364,787 | |||
| Airlines - 0.6% | |||
| American Airlines Group, Inc. | 1,742,115 | 62,315,454 | |
| Construction & Engineering - 0.7% | |||
| AECOM (a) | 2,540,320 | 77,759,195 | |
| Electrical Equipment - 0.6% | |||
| Sensata Technologies, Inc. PLC (a) | 1,321,798 | 62,785,405 | |
| Industrial Conglomerates - 1.2% | |||
| General Electric Co. | 10,904,045 | 110,785,097 | |
| Honeywell International, Inc. | 120,871 | 17,360,702 | |
| 128,145,799 | |||
| Machinery - 0.4% | |||
| WABCO Holdings, Inc. (a) | 356,322 | 40,702,662 | |
| Marine - 0.4% | |||
| A.P. Moller - Maersk A/S Series B | 34,776 | 46,508,941 | |
| Professional Services - 0.7% | |||
| Nielsen Holdings PLC | 2,846,585 | 73,100,303 | |
| Road & Rail - 1.1% | |||
| Norfolk Southern Corp. | 656,236 | 110,077,027 | |
| Trading Companies & Distributors - 0.7% | |||
| HD Supply Holdings, Inc. (a) | 1,850,249 | 77,599,443 | |
| TOTAL INDUSTRIALS | 821,359,016 | ||
| INFORMATION TECHNOLOGY - 9.1% | |||
| Communications Equipment - 1.2% | |||
| Cisco Systems, Inc. | 2,778,349 | 131,388,124 | |
| Electronic Equipment & Components - 0.6% | |||
| TE Connectivity Ltd. | 724,700 | 58,664,465 | |
| IT Services - 3.0% | |||
| Amdocs Ltd. | 2,510,569 | 140,290,596 | |
| Cognizant Technology Solutions Corp. Class A | 1,042,700 | 72,655,336 | |
| Conduent, Inc. (a) | 2,287,500 | 29,165,625 | |
| IBM Corp. | 583,700 | 78,460,954 | |
| 320,572,511 | |||
| Semiconductors & Semiconductor Equipment - 2.9% | |||
| Analog Devices, Inc. | 334,700 | 33,088,442 | |
| Broadcom, Inc. | 265,900 | 71,327,675 | |
| Intel Corp. | 1,633,000 | 76,946,960 | |
| NXP Semiconductors NV | 1,085,700 | 94,488,471 | |
| Qualcomm, Inc. | 538,993 | 26,690,933 | |
| 302,542,481 | |||
| Software - 1.2% | |||
| Microsoft Corp. | 399,500 | 41,719,785 | |
| Oracle Corp. | 251,797 | 12,647,763 | |
| SS&C Technologies Holdings, Inc. | 1,356,900 | 69,866,781 | |
| 124,234,329 | |||
| Technology Hardware, Storage & Peripherals - 0.2% | |||
| Western Digital Corp. | 558,300 | 25,117,917 | |
| TOTAL INFORMATION TECHNOLOGY | 962,519,827 | ||
| MATERIALS - 3.5% | |||
| Chemicals - 2.7% | |||
| DowDuPont, Inc. | 2,897,071 | 155,891,391 | |
| LyondellBasell Industries NV Class A | 416,100 | 36,188,217 | |
| Nutrien Ltd. | 1,087,800 | 56,354,158 | |
| Westlake Chemical Corp. | 561,574 | 41,500,319 | |
| 289,934,085 | |||
| Construction Materials - 0.3% | |||
| Eagle Materials, Inc. | 399,100 | 28,336,100 | |
| Containers & Packaging - 0.5% | |||
| Crown Holdings, Inc. (a) | 976,400 | 49,796,400 | |
| TOTAL MATERIALS | 368,066,585 | ||
| REAL ESTATE - 4.8% | |||
| Equity Real Estate Investment Trusts (REITs) - 4.3% | |||
| American Tower Corp. | 319,284 | 55,185,047 | |
| Boston Properties, Inc. | 557,267 | 73,486,799 | |
| Colony Capital, Inc. | 1,785,452 | 10,837,694 | |
| Corporate Office Properties Trust (SBI) | 985,377 | 24,328,958 | |
| DDR Corp. | 1,282,000 | 16,755,740 | |
| Essex Property Trust, Inc. | 159,900 | 43,364,880 | |
| Prologis, Inc. | 1,079,863 | 74,683,325 | |
| Public Storage | 209,657 | 44,556,306 | |
| Spirit Realty Capital, Inc. | 350,575 | 13,924,839 | |
| Store Capital Corp. | 742,255 | 23,989,682 | |
| The Macerich Co. | 257,551 | 11,888,554 | |
| Welltower, Inc. | 819,000 | 63,464,310 | |
| 456,466,134 | |||
| Real Estate Management & Development - 0.5% | |||
| Cushman & Wakefield PLC | 1,324,200 | 22,829,208 | |
| VICI Properties, Inc. | 1,099,300 | 23,667,929 | |
| 46,497,137 | |||
| TOTAL REAL ESTATE | 502,963,271 | ||
| UTILITIES - 5.9% | |||
| Electric Utilities - 4.3% | |||
| Edison International | 647,200 | 36,870,984 | |
| Evergy, Inc. | 1,695,400 | 97,180,328 | |
| NextEra Energy, Inc. | 771,967 | 138,166,654 | |
| PPL Corp. | 3,002,800 | 94,047,696 | |
| Vistra Energy Corp. (a) | 3,299,900 | 82,860,489 | |
| 449,126,151 | |||
| Independent Power and Renewable Electricity Producers - 0.3% | |||
| NRG Energy, Inc. | 666,700 | 27,274,697 | |
| Multi-Utilities - 1.3% | |||
| Ameren Corp. | 990,000 | 68,646,600 | |
| Sempra Energy | 619,599 | 72,480,691 | |
| 141,127,291 | |||
| TOTAL UTILITIES | 617,528,139 | ||
| TOTAL COMMON STOCKS | |||
| (Cost $9,396,853,691) | 10,065,622,392 | ||
| Principal Amount | Value | ||
| U.S. Treasury Obligations - 0.0% | |||
| U.S. Treasury Bills, yield at date of purchase 2.32% to 2.37% 2/7/19 to 2/28/19 (b) | |||
| (Cost $3,974,406) | 3,980,000 | 3,974,316 | |
| Shares | Value | ||
| Money Market Funds - 4.5% | |||
| Fidelity Cash Central Fund, 2.43% (c) | |||
| (Cost $469,847,631) | 469,793,834 | 469,887,793 | |
| TOTAL INVESTMENT IN SECURITIES - 100.1% | |||
| (Cost $9,870,675,728) | 10,539,484,501 | ||
| NET OTHER ASSETS (LIABILITIES) - (0.1)% | (8,466,761) | ||
| NET ASSETS - 100% | $10,531,017,740 |
| Futures Contracts | |||||
| Number of contracts | Expiration Date | Notional Amount | Value | Unrealized Appreciation/(Depreciation) | |
| Purchased | |||||
| Equity Index Contracts | |||||
| CME E-mini Russell 1000 Value Index Contracts (United States) | 805 | March 2019 | $47,362,175 | $1,127,584 | $1,127,584 |
The notional amount of futures purchased as a percentage of Net Assets is 0.4%
Legend
(a) Non-income producing
(b) Security or a portion of the security was pledged to cover margin requirements for futures contracts. At period end, the value of securities pledged amounted to $2,040,378.
(c) Affiliated fund that is generally available only to investment companies and other accounts managed by Fidelity Investments. The rate quoted is the annualized seven-day yield of the fund at period end. A complete unaudited listing of the fund's holdings as of its most recent quarter end is available upon request. In addition, each Fidelity Central Fund's financial statements, which are not covered by the Fund's Report of Independent Registered Public Accounting Firm, are available on the SEC's website or upon request.
Affiliated Central Funds
Information regarding fiscal year to date income earned by the Fund from investments in Fidelity Central Funds is as follows:
| Fund | Income earned |
| Fidelity Cash Central Fund | $8,036,328 |
| Fidelity Securities Lending Cash Central Fund | 10,755 |
| Total | $8,047,083 |
Amounts in the income column in the above table include any capital gain distributions from underlying funds, which are presented in the corresponding line-item in the Statement of Operations, if applicable.
Investment Valuation
The following is a summary of the inputs used, as of January 31, 2019, involving the Fund's assets and liabilities carried at fair value. The inputs or methodology used for valuing securities may not be an indication of the risk associated with investing in those securities. For more information on valuation inputs, and their aggregation into the levels used below, please refer to the Investment Valuation section in the accompanying Notes to Financial Statements.
| Valuation Inputs at Reporting Date: | ||||
| Description | Total | Level 1 | Level 2 | Level 3 |
| Investments in Securities: | ||||
| Equities: | ||||
| Communication Services | $768,951,405 | $768,951,405 | $-- | $-- |
| Consumer Discretionary | 614,475,269 | 614,475,269 | -- | -- |
| Consumer Staples | 718,788,727 | 718,788,727 | -- | -- |
| Energy | 974,057,749 | 974,057,749 | -- | -- |
| Financials | 2,247,281,113 | 2,247,281,113 | -- | -- |
| Health Care | 1,469,631,291 | 1,469,631,291 | -- | -- |
| Industrials | 821,359,016 | 774,850,075 | 46,508,941 | -- |
| Information Technology | 962,519,827 | 962,519,827 | -- | -- |
| Materials | 368,066,585 | 368,066,585 | -- | -- |
| Real Estate | 502,963,271 | 502,963,271 | -- | -- |
| Utilities | 617,528,139 | 617,528,139 | -- | -- |
| U.S. Government and Government Agency Obligations | 3,974,316 | -- | 3,974,316 | -- |
| Money Market Funds | 469,887,793 | 469,887,793 | -- | -- |
| Total Investments in Securities: | $10,539,484,501 | $10,489,001,244 | $50,483,257 | $-- |
| Derivative Instruments: | ||||
| Assets | ||||
| Futures Contracts | $1,127,584 | $1,127,584 | $-- | $-- |
| Total Assets | $1,127,584 | $1,127,584 | $-- | $-- |
| Total Derivative Instruments: | $1,127,584 | $1,127,584 | $-- | $-- |
Value of Derivative Instruments
The following table is a summary of the Fund's value of derivative instruments by primary risk exposure as of January 31, 2019. For additional information on derivative instruments, please refer to the Derivative Instruments section in the accompanying Notes to Financial Statements.
| Primary Risk Exposure / Derivative Type | Value | |
| Asset | Liability | |
| Equity Risk | ||
| Futures Contracts(a) | $1,127,584 | $0 |
| Total Equity Risk | 1,127,584 | 0 |
| Total Value of Derivatives | $1,127,584 | $0 |
(a) Reflects gross cumulative appreciation (depreciation) on futures contracts as presented in the Consolidated Schedule of Investments. In the Consolidated Statement of Assets and Liabilities, the period end daily variation margin is included in receivable or payable for daily variation margin on futures contracts, and the net cumulative appreciation (depreciation) is included in net unrealized appreciation (depreciation).
Other Information
Distribution of investments by country or territory of incorporation, as a percentage of Total Net Assets, is as follows (Unaudited):
| United States of America | 87.5% |
| Canada | 2.9% |
| United Kingdom | 2.6% |
| Ireland | 1.9% |
| Bailiwick of Guernsey | 1.3% |
| Netherlands | 1.2% |
| Liberia | 1.0% |
| Others (Individually Less Than 1%) | 1.6% |
| 100.0% |
See accompanying notes which are an integral part of the financial statements.
Fidelity® Series Stock Selector Large Cap Value Fund
Financial Statements
Statement of Assets and Liabilities
| January 31, 2019 | ||
| Assets | ||
| Investment in securities, at value — See accompanying schedule: Unaffiliated issuers (cost $9,400,828,097) | $10,069,596,708 | |
| Fidelity Central Funds (cost $469,847,631) | 469,887,793 | |
| Total Investment in Securities (cost $9,870,675,728) | $10,539,484,501 | |
| Cash | 3,282 | |
| Receivable for investments sold | 53,852,523 | |
| Receivable for fund shares sold | 5,227,802 | |
| Dividends receivable | 11,097,608 | |
| Distributions receivable from Fidelity Central Funds | 809,370 | |
| Receivable for daily variation margin on futures contracts | 358,225 | |
| Total assets | 10,610,833,311 | |
| Liabilities | ||
| Payable for investments purchased | $74,738,102 | |
| Payable for fund shares redeemed | 5,039,392 | |
| Other payables and accrued expenses | 38,077 | |
| Total liabilities | 79,815,571 | |
| Net Assets | $10,531,017,740 | |
| Net Assets consist of: | ||
| Paid in capital | $9,831,128,787 | |
| Total distributable earnings (loss) | 699,888,953 | |
| Net Assets | $10,531,017,740 | |
| Net Asset Value, offering price and redemption price per share ($10,531,017,740 ÷ 910,557,754 shares) | $11.57 |
See accompanying notes which are an integral part of the financial statements.
Statement of Operations
| Year ended January 31, 2019 | ||
| Investment Income | ||
| Dividends | $229,422,635 | |
| Interest | 90,767 | |
| Income from Fidelity Central Funds | 8,047,083 | |
| Total income | 237,560,485 | |
| Expenses | ||
| Custodian fees and expenses | $152,548 | |
| Independent trustees' fees and expenses | 57,412 | |
| Commitment fees | 28,255 | |
| Total expenses | 238,215 | |
| Net investment income (loss) | 237,322,270 | |
| Realized and Unrealized Gain (Loss) | ||
| Net realized gain (loss) on: | ||
| Investment securities: | ||
| Unaffiliated issuers | 673,774,040 | |
| Fidelity Central Funds | 32,854 | |
| Foreign currency transactions | (230,885) | |
| Futures contracts | (10,692,102) | |
| Total net realized gain (loss) | 662,883,907 | |
| Change in net unrealized appreciation (depreciation) on: | ||
| Investment securities: | ||
| Unaffiliated issuers | (1,478,670,766) | |
| Fidelity Central Funds | (21,774) | |
| Futures contracts | (18,935) | |
| Total change in net unrealized appreciation (depreciation) | (1,478,711,475) | |
| Net gain (loss) | (815,827,568) | |
| Net increase (decrease) in net assets resulting from operations | $(578,505,298) |
See accompanying notes which are an integral part of the financial statements.
Statement of Changes in Net Assets
| Year ended January 31, 2019 | Year ended January 31, 2018 | |
| Increase (Decrease) in Net Assets | ||
| Operations | ||
| Net investment income (loss) | $237,322,270 | $205,567,543 |
| Net realized gain (loss) | 662,883,907 | 563,412,263 |
| Change in net unrealized appreciation (depreciation) | (1,478,711,475) | 648,134,758 |
| Net increase (decrease) in net assets resulting from operations | (578,505,298) | 1,417,114,564 |
| Distributions to shareholders | (975,442,209) | – |
| Distributions to shareholders from net investment income | – | (200,956,092) |
| Distributions to shareholders from net realized gain | – | (475,842,770) |
| Total distributions | (975,442,209) | (676,798,862) |
| Share transactions - net increase (decrease) | 1,599,168,797 | 561,627,353 |
| Total increase (decrease) in net assets | 45,221,290 | 1,301,943,055 |
| Net Assets | ||
| Beginning of period | 10,485,796,450 | 9,183,853,395 |
| End of period | $10,531,017,740 | $10,485,796,450 |
| Other Information | ||
| Undistributed net investment income end of period | $4,980,310 |
See accompanying notes which are an integral part of the financial statements.
Financial Highlights
Fidelity Series Stock Selector Large Cap Value Fund
| Years ended January 31, | 2019 | 2018 | 2017 | 2016 | 2015 |
| Selected Per–Share Data | |||||
| Net asset value, beginning of period | $13.47 | $12.49 | $10.38 | $12.67 | $11.96 |
| Income from Investment Operations | |||||
| Net investment income (loss)A | .29 | .28B | .17 | .18 | .18 |
| Net realized and unrealized gain (loss) | (1.01) | 1.63 | 2.25 | (.96) | 1.48 |
| Total from investment operations | (.72) | 1.91 | 2.42 | (.78) | 1.66 |
| Distributions from net investment income | (.27) | (.28) | (.16) | (.20)C | (.16) |
| Distributions from net realized gain | (.90) | (.65) | (.14) | (1.31)C | (.79) |
| Total distributions | (1.18)D | (.93) | (.31)E | (1.51) | (.95) |
| Net asset value, end of period | $11.57 | $13.47 | $12.49 | $10.38 | $12.67 |
| Total ReturnF | (5.07)% | 15.62% | 23.49% | (6.69)% | 13.70% |
| Ratios to Average Net AssetsG,H | |||||
| Expenses before reductions | - %I | .20% | .67% | .73% | .72% |
| Expenses net of fee waivers, if any | - %I | .20% | .67% | .73% | .72% |
| Expenses net of all reductions | - %I | .20% | .66% | .72% | .72% |
| Net investment income (loss) | 2.33% | 2.13%B | 1.51% | 1.43% | 1.37% |
| Supplemental Data | |||||
| Net assets, end of period (000 omitted) | $10,531,018 | $10,485,796 | $3,615,123 | $2,860,230 | $3,226,266 |
| Portfolio turnover rateJ | 87%K | 61% | 54% | 64% | 55% |
A Calculated based on average shares outstanding during the period.
B Net investment income per share reflects a large, non-recurring dividend which amounted to $.03 per share. Excluding this non-recurring dividend, the ratio of net investment income (loss) to average net assets would have been 1.87%.
C The amounts shown reflect certain reclassifications related to book to tax differences that were made in the year shown.
D Total distributions of $1.18 per share is comprised of distributions from net investment income of $.274 and distributions from net realized gain of $.902 per share.
E Total distributions of $.31 per share is comprised of distributions from net investment income of $.162 and distributions from net realized gain of $.144 per share.
F Total returns would have been lower if certain expenses had not been reduced during the applicable periods shown.
G Fees and expenses of any underlying Fidelity Central Funds are not included in the Fund's expense ratio. The Fund indirectly bears its proportionate share of the expenses of any underlying Fidelity Central Funds.
H Expense ratios reflect operating expenses of the Fund. Expenses before reductions do not reflect amounts reimbursed by the investment adviser or reductions from brokerage service arrangements or reductions from other expense offset arrangements and do not represent the amount paid by the Fund during periods when reimbursements or reductions occur. Expenses net of fee waivers reflect expenses after reimbursement by the investment adviser but prior to reductions from brokerage service arrangements or other expense offset arrangements. Expenses net of all reductions represent the net expenses paid by the Fund.
I Amount represents less than .005%.
J Amount does not include the portfolio activity of any underlying Fidelity Central Funds.
K The portfolio turnover rate does not include the assets acquired in the merger.
See accompanying notes which are an integral part of the financial statements.
Fidelity® Series Value Discovery Fund
Performance: The Bottom Line
Average annual total return reflects the change in the value of an investment, assuming reinvestment of distributions from dividend income and capital gains (the profits earned upon the sale of securities that have grown in value, if any) and assuming a constant rate of performance each year. The hypothetical investment and the average annual total returns do not reflect the deduction of taxes that a shareholder would pay on fund distributions or the redemption of fund shares. During periods of reimbursement by Fidelity, a fund’s total return will be greater than it would be had the reimbursement not occurred. How a fund did yesterday is no guarantee of how it will do tomorrow.
Average Annual Total Returns
| For the periods ended January 31, 2019 | Past 1 year | Past 5 years | Life of fundA |
| Fidelity® Series Value Discovery Fund | (6.12)% | 7.33% | 9.60% |
A From December 6, 2012
$10,000 Over Life of Fund
Let's say hypothetically that $10,000 was invested in Fidelity® Series Value Discovery Fund on December 6, 2012, when the fund started.
The chart shows how the value of your investment would have changed, and also shows how the Russell 3000® Value Index performed over the same period.
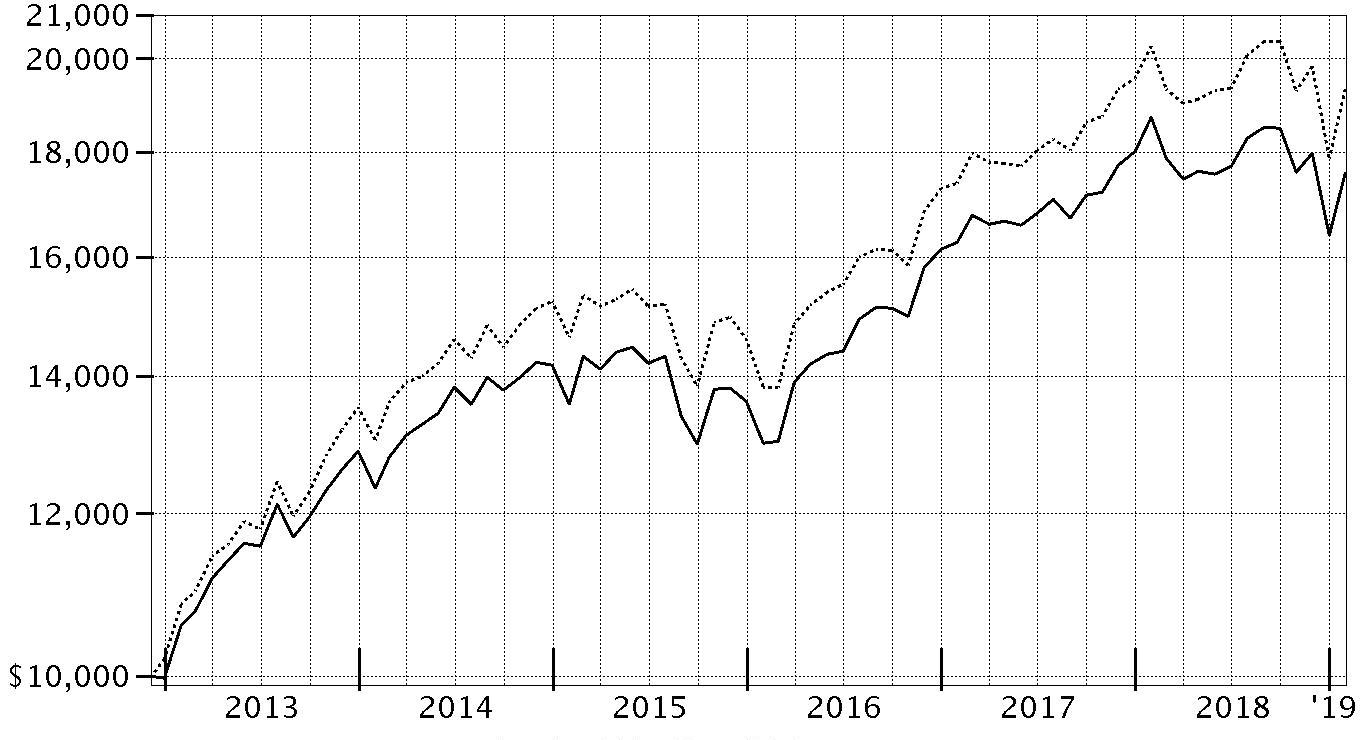
| Period Ending Values | ||
| $17,583 | Fidelity® Series Value Discovery Fund | |
| $19,322 | Russell 3000® Value Index | |
Fidelity® Series Value Discovery Fund
Management's Discussion of Fund Performance
Market Recap: The S&P 500® index returned -2.31% for the 12 months ending January 31, 2019, as the U.S. equity bellwether began the new year on a high note after enduring a final quarter of 2018 in which resurgent volatility upset the aging bull market. In October, rising U.S. Treasury yields and concern about peaking corporate earnings growth sent many investors fleeing from risk assets as they were still dealing with lingering uncertainty related to global trade and the U.S. Federal Reserve picking up the pace of interest rate hikes. The index returned -6.84% in October, at the time its largest monthly drop in seven years. But conditions worsened through Christmas, as jitters about the economy and another hike in rates led to a spike in market volatility and a -9.03% result for December. Sharply reversing course to begin 2019, the S&P 500® gained 8.01% in January, its strongest opening month since 1987, amid upbeat company earnings/outlooks and signs the Fed may pause on rates. For the full period, some economically sensitive sectors were at the bottom of the 12-month performance scale: materials (-14%), energy (-12%), financials (-11%) and industrials (-8%). Meanwhile, communication services – which includes dividend-rich telecom stocks – and consumer staples returned about -5%. In contrast, the defensive utilities (+11%), real estate (+10%) and health care (+5%) sectors led the way. Information technology and consumer discretionary were rattled in the late-2018 downturn, but earlier strength resulted in each advancing about 3%.Comments from Portfolio Manager Sean Gavin: For the fiscal year, the fund returned -6.12%, trailing the -4.76% result of the benchmark Russell 3000® Value Index. Versus the benchmark, security selection in the health care and financials sectors were the biggest detractors. In contrast, an overweighting in communication services contributed to relative performance, as did an underweighting and security selection in industrials. The fund's largest individual relative detractor was British American Tobacco, a non-benchmark stock that faced regulatory and competitive challenges. I eliminated the fund's stake in January. Another non-benchmark holding that detracted was Germany-based pharmaceutical and life sciences company Bayer, which struggled amid investors' concern about the firm's legal liabilities. Also hurting relative performance was our limited exposure to certain defensive holdings that performed well amid challenging market conditions in late 2018. These included pharmaceutical manufacturer Merck and consumer-products company Procter & Gamble – two benchmark components I entirely avoided – as well as Pfizer, a second drugmaker in which the fund was significantly underweighted. On the positive side, the top contributor was an out-of-benchmark position in Irish pharmaceutical company Shire, acquired by Takeda Pharmaceutical during the period. Another contributor was an overweight stake in media company Twenty-First Century Fox, one of our largest holdings on January 31. Other notable contributors included utility provider Exelon and an out-of-benchmark position in Apple, the latter of which I sold from the fund for valuation reasons. Lastly, the fund’s 3% stake in cash, on average, was another positive, given late-2018 market weakness.The views expressed above reflect those of the portfolio manager(s) only through the end of the period as stated on the cover of this report and do not necessarily represent the views of Fidelity or any other person in the Fidelity organization. Any such views are subject to change at any time based upon market or other conditions and Fidelity disclaims any responsibility to update such views. These views may not be relied on as investment advice and, because investment decisions for a Fidelity fund are based on numerous factors, may not be relied on as an indication of trading intent on behalf of any Fidelity fund.
Fidelity® Series Value Discovery Fund
Investment Summary (Unaudited)
Top Ten Stocks as of January 31, 2019
| % of fund's net assets | |
| Berkshire Hathaway, Inc. Class B | 3.9 |
| Wells Fargo & Co. | 3.3 |
| Chevron Corp. | 3.1 |
| Exxon Mobil Corp. | 3.0 |
| Comcast Corp. Class A | 2.9 |
| CVS Health Corp. | 2.5 |
| Verizon Communications, Inc. | 2.3 |
| Amgen, Inc. | 2.2 |
| U.S. Bancorp | 2.2 |
| Twenty-First Century Fox, Inc. Class A | 2.1 |
| 27.5 |
Top Five Market Sectors as of January 31, 2019
| % of fund's net assets | |
| Financials | 25.2 |
| Health Care | 16.3 |
| Communication Services | 14.0 |
| Energy | 12.2 |
| Consumer Staples | 9.0 |
Asset Allocation (% of fund's net assets)
| As of January 31, 2019 * | ||
| Stocks and Equity Futures | 98.3% | |
| Other Investments | 0.2% | |
| Short-Term Investments and Net Other Assets (Liabilities) | 1.5% | |

* Foreign investments - 15.7%
Fidelity® Series Value Discovery Fund
Schedule of Investments January 31, 2019
Showing Percentage of Net Assets
| Common Stocks - 97.3% | |||
| Shares | Value | ||
| COMMUNICATION SERVICES - 14.0% | |||
| Diversified Telecommunication Services - 2.3% | |||
| Verizon Communications, Inc. | 3,209,629 | $176,722,173 | |
| Entertainment - 5.3% | |||
| Cinemark Holdings, Inc. | 1,451,100 | 59,379,012 | |
| Lions Gate Entertainment Corp. Class B | 3,402,600 | 59,647,578 | |
| The Walt Disney Co. | 1,128,100 | 125,805,712 | |
| Twenty-First Century Fox, Inc. Class A | 3,291,300 | 162,294,003 | |
| 407,126,305 | |||
| Interactive Media & Services - 1.4% | |||
| Alphabet, Inc. Class A (a) | 94,000 | 105,833,660 | |
| Media - 5.0% | |||
| Comcast Corp. Class A | 6,199,000 | 226,697,430 | |
| comScore, Inc. (a) | 1,610,363 | 31,708,047 | |
| Entercom Communications Corp. Class A (b) | 4,452,300 | 32,635,359 | |
| Interpublic Group of Companies, Inc. | 4,416,700 | 100,479,925 | |
| 391,520,761 | |||
| TOTAL COMMUNICATION SERVICES | 1,081,202,899 | ||
| CONSUMER DISCRETIONARY - 3.0% | |||
| Auto Components - 0.4% | |||
| Lear Corp. | 207,800 | 31,986,654 | |
| Internet & Direct Marketing Retail - 0.6% | |||
| eBay, Inc. | 1,289,900 | 43,405,135 | |
| Multiline Retail - 1.1% | |||
| Dollar General Corp. | 767,600 | 88,604,068 | |
| Textiles, Apparel & Luxury Goods - 0.9% | |||
| PVH Corp. | 648,900 | 70,801,479 | |
| TOTAL CONSUMER DISCRETIONARY | 234,797,336 | ||
| CONSUMER STAPLES - 9.0% | |||
| Beverages - 2.1% | |||
| Coca-Cola European Partners PLC | 951,000 | 45,248,580 | |
| PepsiCo, Inc. | 1,031,000 | 116,162,770 | |
| 161,411,350 | |||
| Food & Staples Retailing - 1.8% | |||
| Sysco Corp. | 1,346,400 | 85,967,640 | |
| Walmart, Inc. | 584,400 | 56,003,052 | |
| 141,970,692 | |||
| Food Products - 4.6% | |||
| Danone SA | 1,020,100 | 74,234,517 | |
| Mondelez International, Inc. | 923,200 | 42,707,232 | |
| Seaboard Corp. | 1,008 | 3,895,083 | |
| The Hershey Co. | 1,011,200 | 107,288,320 | |
| The J.M. Smucker Co. | 1,172,600 | 122,982,288 | |
| 351,107,440 | |||
| Personal Products - 0.5% | |||
| Coty, Inc. Class A | 1,994,000 | 15,473,440 | |
| Unilever NV (NY Reg.) | 438,100 | 23,442,731 | |
| 38,916,171 | |||
| TOTAL CONSUMER STAPLES | 693,405,653 | ||
| ENERGY - 12.0% | |||
| Energy Equipment & Services - 0.9% | |||
| Baker Hughes, a GE Co. Class A | 3,123,600 | 73,623,252 | |
| Oil, Gas & Consumable Fuels - 11.1% | |||
| Chevron Corp. | 2,116,272 | 242,630,585 | |
| Dynagas LNG Partners LP | 783,700 | 2,115,990 | |
| Exxon Mobil Corp. | 3,130,800 | 229,425,024 | |
| GasLog Ltd. | 1,202,700 | 21,564,411 | |
| GasLog Partners LP (c) | 2,488,800 | 56,470,872 | |
| Golar LNG Ltd. | 1,229,433 | 27,379,473 | |
| Golar LNG Partners LP (c) | 4,059,900 | 54,402,660 | |
| Hoegh LNG Partners LP (c) | 1,241,600 | 21,914,240 | |
| Phillips 66 Co. | 1,028,200 | 98,100,562 | |
| Suncor Energy, Inc. | 1,668,900 | 53,828,519 | |
| Teekay Corp. (b) | 1,367,800 | 4,800,978 | |
| Teekay LNG Partners LP | 2,071,200 | 26,635,632 | |
| Teekay Offshore Partners LP | 15,282,400 | 18,491,704 | |
| 857,760,650 | |||
| TOTAL ENERGY | 931,383,902 | ||
| FINANCIALS - 25.2% | |||
| Banks - 9.3% | |||
| M&T Bank Corp. | 427,200 | 70,291,488 | |
| PNC Financial Services Group, Inc. | 979,500 | 120,155,265 | |
| SunTrust Banks, Inc. | 1,799,100 | 106,902,522 | |
| U.S. Bancorp | 3,332,921 | 170,512,238 | |
| Wells Fargo & Co. | 5,239,449 | 256,261,451 | |
| 724,122,964 | |||
| Capital Markets - 2.8% | |||
| Affiliated Managers Group, Inc. | 205,400 | 21,556,730 | |
| AllianceBernstein Holding LP | 127,400 | 3,884,426 | |
| Goldman Sachs Group, Inc. | 516,700 | 102,311,767 | |
| Invesco Ltd. | 1,175,500 | 21,417,610 | |
| State Street Corp. | 928,200 | 65,809,380 | |
| 214,979,913 | |||
| Consumer Finance - 1.8% | |||
| Capital One Financial Corp. | 734,100 | 59,161,119 | |
| Discover Financial Services | 1,196,500 | 80,751,785 | |
| 139,912,904 | |||
| Diversified Financial Services - 3.9% | |||
| Berkshire Hathaway, Inc. Class B (a) | 1,447,900 | 297,601,367 | |
| Standard Life PLC | 670,256 | 2,212,275 | |
| 299,813,642 | |||
| Insurance - 4.1% | |||
| Allstate Corp. | 501,600 | 44,075,592 | |
| Chubb Ltd. | 636,677 | 84,709,875 | |
| FNF Group | 1,159,300 | 41,920,288 | |
| Prudential PLC | 2,698,047 | 52,763,437 | |
| The Travelers Companies, Inc. | 777,200 | 97,569,688 | |
| 321,038,880 | |||
| Mortgage Real Estate Investment Trusts - 3.3% | |||
| AGNC Investment Corp. | 5,084,600 | 91,065,186 | |
| Annaly Capital Management, Inc. | 9,264,900 | 96,725,556 | |
| MFA Financial, Inc. | 8,966,600 | 65,725,178 | |
| 253,515,920 | |||
| TOTAL FINANCIALS | 1,953,384,223 | ||
| HEALTH CARE - 16.3% | |||
| Biotechnology - 3.1% | |||
| Amgen, Inc. | 926,377 | 173,334,400 | |
| Celgene Corp. (a) | 734,200 | 64,947,332 | |
| 238,281,732 | |||
| Health Care Providers & Services - 6.8% | |||
| Anthem, Inc. | 353,200 | 107,019,600 | |
| Cigna Corp. | 699,100 | 139,687,171 | |
| CVS Health Corp. | 2,937,431 | 192,548,602 | |
| UnitedHealth Group, Inc. | 314,500 | 84,977,900 | |
| 524,233,273 | |||
| Pharmaceuticals - 6.4% | |||
| Allergan PLC | 591,900 | 85,221,762 | |
| Bayer AG | 1,285,238 | 97,415,707 | |
| Bristol-Myers Squibb Co. | 785,600 | 38,785,072 | |
| Johnson & Johnson | 291,893 | 38,845,120 | |
| Pfizer, Inc. | 808,213 | 34,308,642 | |
| Roche Holding AG (participation certificate) | 183,766 | 48,888,325 | |
| Sanofi SA sponsored ADR | 1,627,900 | 70,732,255 | |
| Takeda Pharmaceutical Co. Ltd. ADR | 4,194,741 | 83,768,978 | |
| 497,965,861 | |||
| TOTAL HEALTH CARE | 1,260,480,866 | ||
| INDUSTRIALS - 5.3% | |||
| Aerospace & Defense - 2.4% | |||
| Harris Corp. | 367,400 | 56,278,332 | |
| United Technologies Corp. | 1,128,100 | 133,194,767 | |
| 189,473,099 | |||
| Air Freight & Logistics - 1.2% | |||
| C.H. Robinson Worldwide, Inc. | 1,053,300 | 91,394,841 | |
| Machinery - 1.1% | |||
| Deere & Co. | 529,100 | 86,772,400 | |
| Road & Rail - 0.6% | |||
| Union Pacific Corp. | 280,700 | 44,650,949 | |
| TOTAL INDUSTRIALS | 412,291,289 | ||
| INFORMATION TECHNOLOGY - 3.3% | |||
| Electronic Equipment & Components - 1.0% | |||
| TE Connectivity Ltd. | 981,132 | 79,422,635 | |
| IT Services - 2.3% | |||
| Amdocs Ltd. | 1,107,300 | 61,875,924 | |
| Cognizant Technology Solutions Corp. Class A | 1,237,200 | 86,208,096 | |
| Fiserv, Inc. (a) | 199,700 | 16,561,121 | |
| The Western Union Co. | 751,500 | 13,714,875 | |
| 178,360,016 | |||
| TOTAL INFORMATION TECHNOLOGY | 257,782,651 | ||
| MATERIALS - 1.6% | |||
| Chemicals - 0.9% | |||
| LyondellBasell Industries NV Class A | 320,200 | 27,847,794 | |
| The Scotts Miracle-Gro Co. Class A | 581,123 | 43,206,495 | |
| 71,054,289 | |||
| Containers & Packaging - 0.7% | |||
| Graphic Packaging Holding Co. | 4,390,500 | 52,993,335 | |
| TOTAL MATERIALS | 124,047,624 | ||
| REAL ESTATE - 3.0% | |||
| Equity Real Estate Investment Trusts (REITs) - 1.8% | |||
| American Tower Corp. | 414,300 | 71,607,612 | |
| Simon Property Group, Inc. | 350,200 | 63,778,424 | |
| 135,386,036 | |||
| Real Estate Management & Development - 1.2% | |||
| CBRE Group, Inc. (a) | 2,077,600 | 95,050,200 | |
| TOTAL REAL ESTATE | 230,436,236 | ||
| UTILITIES - 4.6% | |||
| Electric Utilities - 3.6% | |||
| Exelon Corp. | 3,108,400 | 148,457,184 | |
| Xcel Energy, Inc. | 2,500,100 | 130,905,236 | |
| 279,362,420 | |||
| Independent Power and Renewable Electricity Producers - 0.2% | |||
| NRG Yield, Inc. Class C | 766,600 | 11,567,994 | |
| Multi-Utilities - 0.8% | |||
| WEC Energy Group, Inc. | 828,900 | 60,534,568 | |
| TOTAL UTILITIES | 351,464,982 | ||
| TOTAL COMMON STOCKS | |||
| (Cost $7,361,838,690) | 7,530,677,661 | ||
| Other - 0.2% | |||
| Energy - 0.2% | |||
| Oil, Gas & Consumable Fuels - 0.2% | |||
| Utica Shale Drilling Program (non-operating revenue interest) (d)(e)(f) | |||
| (Cost $39,369,027) | 39,369,027 | 19,743,567 | |
| Money Market Funds - 1.9% | |||
| Fidelity Cash Central Fund, 2.43% (g) | 128,710,449 | 128,736,191 | |
| Fidelity Securities Lending Cash Central Fund 2.43% (g)(h) | 17,880,589 | 17,882,377 | |
| TOTAL MONEY MARKET FUNDS | |||
| (Cost $146,615,425) | 146,618,568 | ||
| TOTAL INVESTMENT IN SECURITIES - 99.4% | |||
| (Cost $7,547,823,142) | 7,697,039,796 | ||
| NET OTHER ASSETS (LIABILITIES) - 0.6% | 45,245,415 | ||
| NET ASSETS - 100% | $7,742,285,211 |
| Futures Contracts | |||||
| Number of contracts | Expiration Date | Notional Amount | Value | Unrealized Appreciation/(Depreciation) | |
| Purchased | |||||
| Equity Index Contracts | |||||
| CME E-mini Russell 1000 Value Index Contracts (United States) | 1,373 | March 2019 | $80,780,455 | $5,097,763 | $5,097,763 |
The notional amount of futures purchased as a percentage of Net Assets is 1.0%
Legend
(a) Non-income producing
(b) Security or a portion of the security is on loan at period end.
(c) Affiliated company
(d) Investment is owned by a wholly-owned subsidiary (Subsidiary) that is treated as a corporation for U.S. tax purposes.
(e) Restricted securities - Investment in securities not registered under the Securities Act of 1933 (excluding 144A issues). At the end of the period, the value of restricted securities (excluding 144A issues) amounted to $19,743,567 or 0.3% of net assets.
(f) Level 3 security
(g) Affiliated fund that is generally available only to investment companies and other accounts managed by Fidelity Investments. The rate quoted is the annualized seven-day yield of the fund at period end. A complete unaudited listing of the fund's holdings as of its most recent quarter end is available upon request. In addition, each Fidelity Central Fund's financial statements, which are not covered by the Fund's Report of Independent Registered Public Accounting Firm, are available on the SEC's website or upon request.
(h) Investment made with cash collateral received from securities on loan.
Additional information on each restricted holding is as follows:
| Security | Acquisition Date | Acquisition Cost |
| Utica Shale Drilling Program (non-operating revenue interest) | 10/5/16 - 10/30/18 | $39,369,027 |
Affiliated Central Funds
Information regarding fiscal year to date income earned by the Fund from investments in Fidelity Central Funds is as follows:
| Fund | Income earned |
| Fidelity Cash Central Fund | $4,910,299 |
| Fidelity Securities Lending Cash Central Fund | 157,638 |
| Total | $5,067,937 |
Amounts in the income column in the above table include any capital gain distributions from underlying funds, which are presented in the corresponding line-item in the Statement of Operations, if applicable.
Other Affiliated Issuers
An affiliated company is a company in which the Fund has ownership of at least 5% of the voting securities. Fiscal year to date transactions with companies which are or were affiliates are as follows:
| Affiliate | Value, beginning of period | Purchases | Sales Proceeds | Dividend Income | Realized Gain (loss) | Change in Unrealized appreciation (depreciation) | Value, end of period |
| GasLog Partners LP | $36,320,250 | $23,585,262 | $961,871 | $3,776,059 | $(1,741) | $(2,471,028) | $56,470,872 |
| Golar LNG Partners LP | 56,073,470 | 27,869,972 | 419,258 | 6,775,410 | (126,908) | (28,994,616) | 54,402,660 |
| Hoegh LNG Partners LP | 19,706,065 | 3,277,410 | -- | 2,037,640 | -- | (1,069,235) | 21,914,240 |
| Total | $112,099,785 | $54,732,644 | $1,381,129 | $12,589,109 | $(128,649) | $(32,534,879) | $132,787,772 |
Investment Valuation
The following is a summary of the inputs used, as of January 31, 2019, involving the Fund's assets and liabilities carried at fair value. The inputs or methodology used for valuing securities may not be an indication of the risk associated with investing in those securities. For more information on valuation inputs, and their aggregation into the levels used below, please refer to the Investment Valuation section in the accompanying Notes to Financial Statements.
| Valuation Inputs at Reporting Date: | ||||
| Description | Total | Level 1 | Level 2 | Level 3 |
| Investments in Securities: | ||||
| Equities: | ||||
| Communication Services | $1,081,202,899 | $1,081,202,899 | $-- | $-- |
| Consumer Discretionary | 234,797,336 | 234,797,336 | -- | -- |
| Consumer Staples | 693,405,653 | 619,171,136 | 74,234,517 | -- |
| Energy | 931,383,902 | 931,383,902 | -- | -- |
| Financials | 1,953,384,223 | 1,900,620,786 | 52,763,437 | -- |
| Health Care | 1,260,480,866 | 1,114,176,834 | 146,304,032 | -- |
| Industrials | 412,291,289 | 412,291,289 | -- | -- |
| Information Technology | 257,782,651 | 257,782,651 | -- | -- |
| Materials | 124,047,624 | 124,047,624 | -- | -- |
| Real Estate | 230,436,236 | 230,436,236 | -- | -- |
| Utilities | 351,464,982 | 351,464,982 | -- | -- |
| Other | 19,743,567 | -- | -- | 19,743,567 |
| Money Market Funds | 146,618,568 | 146,618,568 | -- | -- |
| Total Investments in Securities: | $7,697,039,796 | $7,403,994,243 | $273,301,986 | $19,743,567 |
| Derivative Instruments: | ||||
| Assets | ||||
| Futures Contracts | $5,097,763 | $5,097,763 | $-- | $-- |
| Total Assets | $5,097,763 | $5,097,763 | $-- | $-- |
| Total Derivative Instruments: | $5,097,763 | $5,097,763 | $-- | $-- |
Value of Derivative Instruments
The following table is a summary of the Fund's value of derivative instruments by primary risk exposure as of January 31, 2019. For additional information on derivative instruments, please refer to the Derivative Instruments section in the accompanying Notes to Financial Statements.
| Primary Risk Exposure / Derivative Type | Value | |
| Asset | Liability | |
| Equity Risk | ||
| Futures Contracts(a) | $5,097,763 | $0 |
| Total Equity Risk | 5,097,763 | 0 |
| Total Value of Derivatives | $5,097,763 | $0 |
(a) Reflects gross cumulative appreciation (depreciation) on futures contracts as presented in the Schedule of Investments. In the Statement of Assets and Liabilities, the period end daily variation margin is included in receivable or payable for daily variation margin on futures contracts, and the net cumulative appreciation (depreciation) is included in net unrealized appreciation (depreciation).
Other Information
Distribution of investments by country or territory of incorporation, as a percentage of Total Net Assets, is as follows (Unaudited):
| United States of America | 84.3% |
| Switzerland | 2.7% |
| Marshall Islands | 2.3% |
| France | 1.9% |
| Canada | 1.5% |
| United Kingdom | 1.3% |
| Germany | 1.3% |
| Ireland | 1.1% |
| Japan | 1.1% |
| Bermuda | 1.0% |
| Others (Individually Less Than 1%) | 1.5% |
| 100.0% |
See accompanying notes which are an integral part of the financial statements.
Fidelity® Series Value Discovery Fund
Financial Statements
Statement of Assets and Liabilities
| January 31, 2019 | ||
| Assets | ||
| Investment in securities, at value (including securities loaned of $17,282,302) — See accompanying schedule: Unaffiliated issuers (cost $7,235,635,425) | $7,417,633,455 | |
| Fidelity Central Funds (cost $146,615,425) | 146,618,569 | |
| Other affiliated issuers (cost $165,572,292) | 132,787,772 | |
| Total Investment in Securities (cost $7,547,823,142) | $7,697,039,796 | |
| Segregated cash with brokers for derivative instruments | 2,479,200 | |
| Cash | 17,129 | |
| Restricted cash | 2,135,113 | |
| Receivable for investments sold | 50,477,492 | |
| Receivable for fund shares sold | 3,896,355 | |
| Dividends receivable | 9,623,751 | |
| Distributions receivable from Fidelity Central Funds | 475,026 | |
| Receivable for daily variation margin on futures contracts | 482,819 | |
| Other receivables | 553 | |
| Total assets | 7,766,627,234 | |
| Liabilities | ||
| Payable for investments purchased | $1,682,971 | |
| Payable for fund shares redeemed | 4,753,560 | |
| Other payables and accrued expenses | 27,757 | |
| Collateral on securities loaned | 17,877,735 | |
| Total liabilities | 24,342,023 | |
| Net Assets | $7,742,285,211 | |
| Net Assets consist of: | ||
| Paid in capital | $7,626,971,105 | |
| Total distributable earnings (loss) | 115,314,106 | |
| Net Assets | $7,742,285,211 | |
| Net Asset Value, offering price and redemption price per share ($7,742,285,211 ÷ 635,031,822 shares) | $12.19 |
See accompanying notes which are an integral part of the financial statements.
Statement of Operations
| Year ended January 31, 2019 | ||
| Investment Income | ||
| Dividends (including $12,589,109 earned from other affiliated issuers) | $176,318,265 | |
| Income from Fidelity Central Funds | 5,067,937 | |
| Total income | 181,386,202 | |
| Expenses | ||
| Custodian fees and expenses | $105,700 | |
| Independent trustees' fees and expenses | 41,560 | |
| Commitment fees | 19,811 | |
| Total expenses before reductions | 167,071 | |
| Expense reductions | (12,860) | |
| Total expenses after reductions | 154,211 | |
| Net investment income (loss) | 181,231,991 | |
| Realized and Unrealized Gain (Loss) | ||
| Net realized gain (loss) on: | ||
| Investment securities: | ||
| Unaffiliated issuers | 258,131,236 | |
| Fidelity Central Funds | (7,083) | |
| Other affiliated issuers | (128,649) | |
| Foreign currency transactions | (63,060) | |
| Futures contracts | 8,094,452 | |
| Total net realized gain (loss) | 266,026,896 | |
| Change in net unrealized appreciation (depreciation) on: | ||
| Investment securities: | ||
| Unaffiliated issuers | (932,454,446) | |
| Fidelity Central Funds | 3,050 | |
| Other affiliated issuers | (32,534,879) | |
| Assets and liabilities in foreign currencies | (34,604) | |
| Futures contracts | 5,097,763 | |
| Total change in net unrealized appreciation (depreciation) | (959,923,116) | |
| Net gain (loss) | (693,896,220) | |
| Net increase (decrease) in net assets resulting from operations | $(512,664,229) |
See accompanying notes which are an integral part of the financial statements.
Statement of Changes in Net Assets
| Year ended January 31, 2019 | Year ended January 31, 2018 | |
| Increase (Decrease) in Net Assets | ||
| Operations | ||
| Net investment income (loss) | $181,231,991 | $209,753,536 |
| Net realized gain (loss) | 266,026,896 | 1,900,566,903 |
| Change in net unrealized appreciation (depreciation) | (959,923,116) | (924,677,998) |
| Net increase (decrease) in net assets resulting from operations | (512,664,229) | 1,185,642,441 |
| Distributions to shareholders | (488,658,856) | – |
| Distributions to shareholders from net investment income | – | (149,871,066) |
| Distributions to shareholders from net realized gain | – | (462,206,675) |
| Total distributions | (488,658,856) | (612,077,741) |
| Share transactions - net increase (decrease) | 1,312,890,342 | (6,007,771,301) |
| Total increase (decrease) in net assets | 311,567,257 | (5,434,206,601) |
| Net Assets | ||
| Beginning of period | 7,430,717,954 | 12,864,924,555 |
| End of period | $7,742,285,211 | $7,430,717,954 |
| Other Information | ||
| Distributions in excess of net investment income end of period | $(1,287,594) |
See accompanying notes which are an integral part of the financial statements.
Financial Highlights
Fidelity Series Value Discovery Fund
| Years ended January 31, | 2019 | 2018 | 2017 | 2016 | 2015 |
| Selected Per–Share Data | |||||
| Net asset value, beginning of period | $13.89 | $13.03 | $10.83 | $12.31 | $11.80 |
| Income from Investment Operations | |||||
| Net investment income (loss)A | .32 | .31 | .27 | .31 | .32 |
| Net realized and unrealized gain (loss) | (1.20) | 1.58 | 2.44 | (.80) | .87 |
| Total from investment operations | (.88) | 1.89 | 2.71 | (.49) | 1.19 |
| Distributions from net investment income | (.30) | (.25)B | (.26) | (.32) | (.28) |
| Distributions from net realized gain | (.52) | (.78)B | (.25) | (.67) | (.40) |
| Total distributions | (.82) | (1.03) | (.51) | (.99) | (.68) |
| Net asset value, end of period | $12.19 | $13.89 | $13.03 | $10.83 | $12.31 |
| Total ReturnC,D | (6.12)% | 15.05% | 25.40% | (4.32)% | 9.91% |
| Ratios to Average Net AssetsE,F | |||||
| Expenses before reductions | - %G | .27% | .62% | .62% | .63% |
| Expenses net of fee waivers, if any | - %G | .27% | .62% | .62% | .63% |
| Expenses net of all reductions | - %G | .26% | .62% | .62% | .63% |
| Net investment income (loss) | 2.47% | 2.29% | 2.21% | 2.51% | 2.50% |
| Supplemental Data | |||||
| Net assets, end of period (000 omitted) | $7,742,285 | $7,430,718 | $5,063,707 | $4,400,959 | $4,809,405 |
| Portfolio turnover rateH | 40%I | 74%J | 42% | 41% | 38% |
A Calculated based on average shares outstanding during the period.
B The amounts shown reflect certain reclassifications related to book to tax differences that were made in the year shown.
C Total returns for periods of less than one year are not annualized.
D Total returns would have been lower if certain expenses had not been reduced during the applicable periods shown.
E Fees and expenses of any underlying Fidelity Central Funds are not included in the Fund's expense ratio. The Fund indirectly bears its proportionate share of the expenses of any underlying Fidelity Central Funds.
F Expense ratios reflect operating expenses of the Fund. Expenses before reductions do not reflect amounts reimbursed by the investment adviser or reductions from brokerage service arrangements or reductions from other expense offset arrangements and do not represent the amount paid by the Fund during periods when reimbursements or reductions occur. Expenses net of fee waivers reflect expenses after reimbursement by the investment adviser but prior to reductions from brokerage service arrangements or other expense offset arrangements. Expenses net of all reductions represent the net expenses paid by the Fund.
G Amount represents less than .005%.
H Amount does not include the portfolio activity of any underlying Fidelity Central Funds.
I The portfolio turnover rate does not include the assets acquired in the merger.
J Portfolio turnover rate excludes securities received or delivered in-kind.
See accompanying notes which are an integral part of the financial statements.
Notes to Financial Statements
For the period ended January 31, 2019
1. Organization.
Fidelity Series All-Sector Equity Fund, Fidelity Series Stock Selector Large Cap Value Fund and Fidelity Series Value Discovery Fund (the Funds) are funds of Fidelity Devonshire Trust (the Trust). The Trust is registered under the Investment Company Act of 1940, as amended (the 1940 Act), as an open-end management investment company organized as a Massachusetts business trust. Each Fund is authorized to issue an unlimited number of shares. Shares of the Funds are only available for purchase by mutual funds for which Fidelity Management & Research Company (FMR) or an affiliate serves as an investment manager.
Effective August 28, 2017, each Fund no longer offered Class F, and all outstanding shares of Class F were exchanged for shares of Series All-Sector Equity, Series Stock Selector Large Cap Value and Series Value Discovery, respectively.
2. Investments in Fidelity Central Funds.
The Funds invest in Fidelity Central Funds, which are open-end investment companies generally available only to other investment companies and accounts managed by the investment adviser and its affiliates. The Funds' Schedules of Investments list each of the Fidelity Central Funds held as of period end, if any, as an investment of each Fund, but do not include the underlying holdings of each Fidelity Central Fund. As an Investing Fund, each Fund indirectly bears its proportionate share of the expenses of the underlying Fidelity Central Funds.
The Money Market Central Funds seek preservation of capital and current income and are managed by Fidelity Investments Money Management, Inc. (FIMM), an affiliate of the investment adviser. Annualized expenses of the Money Market Central Funds as of their most recent shareholder report date are less than .005%.
A complete unaudited list of holdings for each Fidelity Central Fund is available upon request or at the Securities and Exchange Commission (the SEC) website at www.sec.gov. In addition, the financial statements of the Fidelity Central Funds, which are not covered by the Funds' Report of Independent Registered Public Accounting Firm, are available on the SEC website or upon request.
3. Significant Accounting Policies.
Each Fund is an investment company and applies the accounting and reporting guidance of the Financial Accounting Standards Board (FASB) Accounting Standards Codification Topic 946 Financial Services – Investments Companies. The financial statements have been prepared in conformity with accounting principles generally accepted in the United States of America (GAAP), which require management to make certain estimates and assumptions at the date of the financial statements. Actual results could differ from those estimates. Subsequent events, if any, through the date that the financial statements were issued have been evaluated in the preparation of the financial statements. The following summarizes the significant accounting policies of the Funds:
Investment Valuation. Investments are valued as of 4:00 p.m. Eastern time on the last calendar day of the period. The Board of Trustees (the Board) has delegated the day to day responsibility for the valuation of each Fund's investments to the Fair Value Committee (the Committee) established by each Fund's investment adviser. In accordance with valuation policies and procedures approved by the Board, each Fund attempts to obtain prices from one or more third party pricing vendors or brokers to value its investments. When current market prices, quotations or currency exchange rates are not readily available or reliable, investments will be fair valued in good faith by the Committee, in accordance with procedures adopted by the Board. Factors used in determining fair value vary by investment type and may include market or investment specific events, changes in interest rates and credit quality. The frequency with which these procedures are used cannot be predicted and they may be utilized to a significant extent. The Committee oversees each Fund's valuation policies and procedures and reports to the Board on the Committee's activities and fair value determinations. The Board monitors the appropriateness of the procedures used in valuing each Fund's investments and ratifies the fair value determinations of the Committee.
Each Fund categorizes the inputs to valuation techniques used to value its investments into a disclosure hierarchy consisting of three levels as shown below:
- Level 1 – quoted prices in active markets for identical investments
- Level 2 – other significant observable inputs (including quoted prices for similar investments, interest rates, prepayment speeds, etc.)
- Level 3 – unobservable inputs (including the Fund's own assumptions based on the best information available)
Valuation techniques used to value each Fund's investments by major category are as follows:
Equity securities, including restricted securities, for which market quotations are readily available, are valued at the last reported sale price or official closing price as reported by a third party pricing vendor on the primary market or exchange on which they are traded and are categorized as Level 1 in the hierarchy. In the event there were no sales during the day or closing prices are not available, securities are valued at the last quoted bid price or may be valued using the last available price and are generally categorized as Level 2 in the hierarchy. For foreign equity securities, when market or security specific events arise, comparisons to the valuation of American Depositary Receipts (ADRs), futures contracts, Exchange-Traded Funds (ETFs) and certain indexes as well as quoted prices for similar securities may be used and would be categorized as Level 2 in the hierarchy. For equity securities, including restricted securities, where observable inputs are limited, assumptions about market activity and risk are used and these securities may be categorized as Level 3 in the hierarchy.
Debt securities, including restricted securities, are valued based on evaluated prices received from third party pricing vendors or from brokers who make markets in such securities. U.S. government and government agency obligations are valued by pricing vendors who utilize matrix pricing which considers yield or price of bonds of comparable quality, coupon, maturity and type or by broker-supplied prices. When independent prices are unavailable or unreliable, debt securities may be valued utilizing pricing methodologies which consider similar factors that would be used by third party pricing vendors. Debt securities are generally categorized as Level 2 in the hierarchy but may be Level 3 depending on the circumstances.
Futures contracts are valued at the settlement price established each day by the board of trade or exchange on which they are traded and are categorized as Level 1 in the hierarchy. Investments in open-end mutual funds, including the Fidelity Central Funds, are valued at their closing net asset value (NAV) each business day and are categorized as Level 1 in the hierarchy.
Changes in valuation techniques may result in transfers in or out of an assigned level within the disclosure hierarchy. The aggregate value of investments by input level as of January 31, 2019 is included at the end of each Fund's Schedule of Investments.
Foreign Currency. The Funds may use foreign currency contracts to facilitate transactions in foreign-denominated securities. Gains and losses from these transactions may arise from changes in the value of the foreign currency or if the counterparties do not perform under the contracts' terms.
Foreign-denominated assets, including investment securities, and liabilities are translated into U.S. dollars at the exchange rates at period end. Purchases and sales of investment securities, income and dividends received and expenses denominated in foreign currencies are translated into U.S. dollars at the exchange rate in effect on the transaction date.
The effects of exchange rate fluctuations on investments are included with the net realized and unrealized gain (loss) on investment securities. Other foreign currency transactions resulting in realized and unrealized gain (loss) are disclosed separately.
Investment Transactions and Income. For financial reporting purposes, the Funds' investment holdings and NAV include trades executed through the end of the last business day of the period. The NAV per share for processing shareholder transactions is calculated as of the close of business of the New York Stock Exchange (NYSE), normally 4:00 p.m. Eastern time and includes trades executed through the end of the prior business day. Gains and losses on securities sold are determined on the basis of identified cost and for certain Funds include proceeds received from litigation. Dividend income is recorded on the ex-dividend date, except for certain dividends from foreign securities where the ex-dividend date may have passed, which are recorded as soon as the Funds are informed of the ex-dividend date. Non-cash dividends included in dividend income, if any, are recorded at the fair market value of the securities received. Income and capital gain distributions from Fidelity Central Funds, if any, are recorded on the ex-dividend date. Certain distributions received by the Funds represent a return of capital or capital gain. The Funds determine the components of these distributions subsequent to the ex-dividend date, based upon receipt of tax filings or other correspondence relating to the underlying investment. These distributions are recorded as a reduction of cost of investments and/or as a realized gain. Interest income is accrued as earned and includes coupon interest and amortization of premium and accretion of discount on debt securities as applicable. Investment income is recorded net of foreign taxes withheld where recovery of such taxes is uncertain.
Expenses. Expenses directly attributable to a fund are charged to that fund. Expenses attributable to more than one fund are allocated among the respective funds on the basis of relative net assets or other appropriate methods. Expense estimates are accrued in the period to which they relate and adjustments are made when actual amounts are known.
Income Tax Information and Distributions to Shareholders. Each year, each Fund intends to qualify as a regulated investment company under Subchapter M of the Internal Revenue Code, including distributing substantially all of its taxable income and realized gains. As a result, no provision for U.S. Federal income taxes is required. As of January 31, 2019, each Fund did not have any unrecognized tax benefits in the financial statements; nor is each Fund aware of any tax positions for which it is reasonably possible that the total amounts of unrecognized tax benefits will significantly change in the next twelve months. Each Fund files a U.S. federal tax return, in addition to state and local tax returns as required. Each Fund's federal income tax returns are subject to examination by the Internal Revenue Service (IRS) for a period of three fiscal years after they are filed. State and local tax returns may be subject to examination for an additional fiscal year depending on the jurisdiction. Foreign taxes are provided for based on each Fund's understanding of the tax rules and rates that exist in the foreign markets in which it invests.
Distributions are declared and recorded on the ex-dividend date. Income and capital gain distributions are determined in accordance with income tax regulations, which may differ from GAAP. In addition, the Fidelity Series All-Sector Equity Fund claimed a portion of the payment made to redeeming shareholders as a distribution for income tax purposes.
Capital accounts within the financial statements are adjusted for permanent book-tax differences. These adjustments have no impact on net assets or the results of operations. Capital accounts are not adjusted for temporary book-tax differences which will reverse in a subsequent period.
Book-tax differences are primarily due to the short-term gain distributions from the Underlying Funds, futures contracts, foreign currency transactions, market discount, partnerships, and losses deferred due to wash sales and excise tax regulations.
As of period end, the cost and unrealized appreciation (depreciation) in securities, and derivatives if applicable, for federal income tax purposes were as follows for each Fund:
| Tax cost | Gross unrealized appreciation | Gross unrealized depreciation | Net unrealized appreciation (depreciation) | |
| Fidelity Series All-Sector Equity Fund | $2,752,209,515 | $978,423,323 | $(123,535,444) | $854,887,879 |
| Fidelity Series Stock Selector Large Cap Value Fund | 9,918,887,358 | 1,238,506,461 | (617,909,318) | 620,597,143 |
| Fidelity Series Value Discovery Fund | 7,551,809,435 | 661,500,384 | (516,270,023) | 145,230,361 |
The tax-based components of distributable earnings as of period end were as follows for each Fund:
| Undistributed ordinary income | Undistributed long-term capital gain | Net unrealized appreciation (depreciation) on securities and other investments | |
| Fidelity Series All-Sector Equity Fund | – | $41,831,429 | $854,826,045 |
| Fidelity Series Stock Selector Large Cap Value Fund | 9,336,534 | 69,955,275 | 620,597,143 |
| Fidelity Series Value Discovery Fund | – | – | 145,211,934 |
Fidelity Series Value Discovery Fund intends to elect to defer to the next fiscal year capital losses recognized during the period November 1, 2018 to January 31, 2019, and ordinary losses recognized during the period January 1, 2019 to January 31, 2019. Loss deferrals were as follows:
| Capital losses | Ordinary losses | |
| Fidelity Series Value Discovery Fund | $(26,606,011) | $(3,291,817) |
The tax character of distributions paid was as follows:
| January 31, 2019 | |||
| Ordinary Income | Long-term Capital Gains | Total | |
| Fidelity Series All-Sector Equity Fund | $86,417,134 | $1,037,797,781 | $1,124,214,915 |
| Fidelity Series Stock Selector Large Cap Value Fund | 229,498,154 | 745,944,055 | 975,442,209 |
| Fidelity Series Value Discovery Fund | 184,311,821 | 304,347,035 | 488,658,856 |
| January 31, 2018 | |||
| Ordinary Income | Long-term Capital Gains | Total | |
| Fidelity Series All-Sector Equity Fund | $119,099,937 | $722,733,811 | $841,833,748 |
| Fidelity Series Stock Selector Large Cap Value Fund | 326,806,315 | 349,992,547 | 676,798,862 |
| Fidelity Series Value Discovery Fund | 273,934,484 | 338,143,257 | 612,077,741 |
Restricted Securities. The Funds may invest in securities that are subject to legal or contractual restrictions on resale. These securities generally may be resold in transactions exempt from registration or to the public if the securities are registered. Disposal of these securities may involve time-consuming negotiations and expense, and prompt sale at an acceptable price may be difficult. Information regarding restricted securities is included at the end of each applicable Fund's Schedule of Investments.
Consolidated Subsidiary. Fidelity Series Value Discovery Fund (the Fund) invests in certain investments through a wholly-owned subsidiary ("Subsidiary"), which may be subject to federal and state taxes upon disposition.
As of period end, the Fund held an investment of $21,878,680 in this Subsidiary, representing .28% of the Fund's net assets. The financial statements have been consolidated and include accounts of the Fund and the Subsidiary. Accordingly, all inter-company transactions and balances have been eliminated.
Any cash held by the Subsidiary is restricted as to its use and is presented as Restricted cash in the Statement of Assets and Liabilities.
New Rule Issuance. During August 2018, the U.S. Securities and Exchange Commission issued Final Rule Release No. 33-10532, Disclosure Update and Simplification. This Final Rule includes amendments specific to registered investment companies that are intended to eliminate overlap in disclosure requirements between Regulation S-X and GAAP. In accordance with these amendments, certain line-items in the Fund's financial statements have been combined or removed for the current period as outlined in the table below.
| Financial Statement | Current Line-Item Presentation (As Applicable) | Prior Line-Item Presentation (As Applicable) |
| Statement of Assets and Liabilities | Total distributable earnings (loss) | Undistributed/Distributions in excess of/Accumulated net investment income (loss) Accumulated/Undistributed net realized gain (loss) Net unrealized appreciation (depreciation) |
| Statement of Changes in Net Assets | N/A - removed | Undistributed/Distributions in excess of/Accumulated net investment income (loss) end of period |
| Statement of Changes in Net Assets | Distributions to shareholders | Distributions to shareholders from net investment income Distributions to shareholders from net realized gain |
| Distributions to Shareholders Note to Financial Statements | Distributions to shareholders | Distributions to shareholders from net investment income Distributions to shareholders from net realized gain |
4. Derivative Instruments.
Risk Exposures and the Use of Derivative Instruments. The Funds' investment objective allows the Funds to enter into various types of derivative contracts, including futures contracts and options. Derivatives are investments whose value is primarily derived from underlying assets, indices or reference rates and may be transacted on an exchange or over-the-counter (OTC). Derivatives may involve a future commitment to buy or sell a specified asset based on specified terms, to exchange future cash flows at periodic intervals based on a notional principal amount, or for one party to make one or more payments upon the occurrence of specified events in exchange for periodic payments from the other party.
The Funds used derivatives to increase returns and to manage exposure to certain risks as defined below. The success of any strategy involving derivatives depends on analysis of numerous economic factors, and if the strategies for investment do not work as intended, the Funds may not achieve their objectives.
The Funds' use of derivatives increased or decreased their exposure to the following risk:
| Equity Risk | Equity risk relates to the fluctuations in the value of financial instruments as a result of changes in market prices (other than those arising from interest rate risk or foreign exchange risk), whether caused by factors specific to an individual investment, its issuer, or all factors affecting all instruments traded in a market or market segment. |
The Funds are also exposed to additional risks from investing in derivatives, such as liquidity risk and counterparty credit risk. Liquidity risk is the risk that the Funds will be unable to close out the derivative in the open market in a timely manner. Counterparty credit risk is the risk that the counterparty will not be able to fulfill its obligation to the Funds. Counterparty credit risk related to exchange-traded futures contracts may be mitigated by the protection provided by the exchange on which they trade.
Investing in derivatives may involve greater risks than investing in the underlying assets directly and, to varying degrees, may involve risk of loss in excess of any initial investment and collateral received and amounts recognized in the Statement of Assets and Liabilities. In addition, there may be the risk that the change in value of the derivative contract does not correspond to the change in value of the underlying instrument.
Futures Contracts. A futures contract is an agreement between two parties to buy or sell a specified underlying instrument for a fixed price at a specified future date. The Funds used futures contracts to manage their exposure to the stock market.
Upon entering into a futures contract, a fund is required to deposit either cash or securities (initial margin) with a clearing broker in an amount equal to a certain percentage of the face value of the contract. Futures contracts are marked-to-market daily and subsequent daily payments (variation margin) are made or received by a fund depending on the daily fluctuations in the value of the futures contracts and are recorded as unrealized appreciation or (depreciation). This receivable and/or payable, if any, is included in daily variation margin on futures contracts in the Statement of Assets and Liabilities. Realized gain or (loss) is recorded upon the expiration or closing of a futures contract. The net realized gain (loss) and change in net unrealized appreciation (depreciation) on futures contracts during the period is presented in the Statement of Operations.
Any open futures contracts at period end are presented in the Schedule of Investments under the caption "Futures Contracts". The notional amount at value reflects each contract's exposure to the underlying instrument or index at period end and is representative of volume of activity during the period, except for Fidelity Series All-Sector Equity Fund. Securities deposited to meet initial margin requirements are identified in the Schedule of Investments. Cash deposited to meet initial margin requirements is presented as segregated cash with brokers for derivative instruments in the Statement of Assets and Liabilities.
5. Purchases and Sales of Investments.
Purchases and sales of securities, other than short-term securities and securities acquired in the merger, are noted in the table below.
| Purchases ($) | Sales ($) | |
| Fidelity Series All-Sector Equity Fund | 3,325,002,791 | 6,246,537,608 |
| Fidelity Series Stock Selector Large Cap Value Fund | 8,418,552,365 | 8,653,074,115 |
| Fidelity Series Value Discovery Fund | 2,828,547,908 | 2,862,316,492 |
6. Fees and Other Transactions with Affiliates.
Management Fee. Fidelity Management & Research Company (the investment adviser) and its affiliates provide the Funds with investment management related services for which the Funds do not pay a management fee. Under the management contract, the investment adviser or an affiliate pays all ordinary operating expenses of the Funds, except custody fees, fees and expenses of the independent Trustees, and certain miscellaneous expenses such as proxy and shareholder meeting expenses.
Brokerage Commissions. Certain Funds placed a portion of their portfolio transactions with brokerage firms which are affiliates of the investment adviser. Brokerage commissions are included in net realized gain (loss) and change in net unrealized appreciation (depreciation) in the Statement of Operations. The commissions paid to these affiliated firms were as follows:
| Fidelity Series All-Sector Equity Fund | $88,416 |
| Fidelity Series Stock Selector Large Cap Value Fund | 240,452 |
| Fidelity Series Value Discovery Fund | 43,366 |
Interfund Lending Program. Pursuant to an Exemptive Order issued by the SEC, the Funds, along with other registered investment companies having management contracts with FMR or other affiliated entities of FMR, may participate in an interfund lending program. This program provides an alternative credit facility allowing the funds to borrow from, or lend money to, other participating affiliated funds. At period end, there were no interfund loans outstanding. Each applicable fund's activity in this program during the period for which loans were outstanding was as follows:
| Borrower or Lender | Average Loan Balance | Weighted Average Interest Rate | Interest Expense | |
| Fidelity Series All-Sector Equity Fund | Borrower | $36,702,000 | 2.16% | $6,613 |
Interfund Trades. The Funds may purchase from or sell securities to other Fidelity Funds under procedures adopted by the Board. The procedures have been designed to ensure these interfund trades are executed in accordance with Rule 17a-7 of the 1940 Act. Interfund trades are included within the respective purchases and sales amounts shown in the Purchases and Sales of Investments note.
Prior Fiscal Year Redemptions In-Kind. During the prior period, 454,588,598 shares of Fidelity Series Discovery Value Fund held by affiliated entities were redeemed in kind for investments and cash with a value of $6,049,509,537. The Fund has a net realized gain of $1,529,538,334 on investments delivered through in-kind redemptions. The amount of in-kind redemptions is included in shares transactions in the accompanying State of Changes in Net Assets as well as the Notes to Financial Statements. The Fund recognized no gain or loss for federal income tax purposes.
Other. During the period, the investment adviser reimbursed the Funds for certain losses as follows:
| Fidelity Series All-Sector Equity Fund | $3,249 |
| Fidelity Series Value Discovery Fund | 130,230 |
7. Committed Line of Credit.
Certain Funds participate with other funds managed by the investment adviser or an affiliate in a $4.25 billion credit facility (the "line of credit") to be utilized for temporary or emergency purposes to fund shareholder redemptions or for other short-term liquidity purposes. The participating funds have agreed to pay commitment fees on their pro-rata portion of the line of credit, which are reflected in Miscellaneous expenses on the Statement of Operations, and are as follows:
| Fidelity Series All-Sector Equity Fund | $15,392 |
| Fidelity Series Stock Selector Large Cap Value Fund | 28,255 |
| Fidelity Series Value Discovery Fund | 19,811 |
During the period, the Funds did not borrow on this line of credit.
8. Security Lending.
Certain Funds lend portfolio securities through a lending agent from time to time in order to earn additional income. For equity securities, a lending agent is used and may loan securities to certain qualified borrowers, including Fidelity Capital Markets (FCM), a broker-dealer affiliated with the Funds. On the settlement date of the loan, each applicable Fund receives collateral (in the form of U.S. Treasury obligations, letters of credit and/or cash) against the loaned securities and maintains collateral in an amount not less than 100% of the market value of the loaned securities during the period of the loan. The market value of the loaned securities is determined at the close of business of the Funds and any additional required collateral is delivered to the Funds on the next business day. The Funds or borrower may terminate the loan at any time, and if the borrower defaults on its obligation to return the securities loaned because of insolvency or other reasons, the Funds may apply collateral received from the borrower against the obligation. The Funds may experience delays and costs in recovering the securities loaned. Any cash collateral received is invested in the Fidelity Securities Lending Cash Central Fund. The value of loaned securities and cash collateral at period end are disclosed on each applicable Fund's Statement of Assets and Liabilities. Security lending income represents the income earned on investing cash collateral, less rebates paid to borrowers and any lending agent fees associated with the loan, plus any premium payments received for lending certain types of securities. Security lending income is presented on each applicable Fund's Statement of Operations as a component of income from Fidelity Central Funds. During the period, there were no securities loaned to FCM. Security lending activity was as follows:
| Total Security Lending Income | |
| Fidelity Series All-Sector Equity Fund | $24,847 |
| Fidelity Series Stock Selector Large Cap Value Fund | $10,755 |
| Fidelity Series Value Discovery Fund | $157,638 |
9. Expense Reductions.
Commissions paid to certain brokers with whom the investment adviser, or its affiliates, places trades on behalf of certain Funds include an amount in addition to trade execution, which may be rebated back to the Funds to offset certain expenses. In addition, through arrangements with each applicable Fund's custodian, credits realized as a result of certain uninvested cash balances were used to reduce the Fund's expenses. All of the applicable expense reductions are noted in the table below.
| Brokerage Service reduction | Custody expense reduction | |
| Fidelity Series All-Sector Equity Fund | $173,116 | $– |
| Fidelity Series Value Discovery Fund | – | 12,860 |
10. Distributions to Shareholders.
Distributions to shareholders of each class were as follows:
| Year ended January 31, 2019 | Year ended January 31, 2018 | |
| Fidelity Series All-Sector Equity Fund | ||
| Distributions to shareholders | ||
| Series All-Sector Equity | $1,124,214,915 | $– |
| From net investment income | ||
| Series All-Sector Equity | $– | $84,485,761 |
| Class F | – | 778,754 |
| Total | $– | $85,264,515 |
| From net realized gain | ||
| Series All-Sector Equity | $– | $645,726,540 |
| Class F | – | 110,842,693 |
| Total | $– | $756,569,233 |
| Fidelity Series Stock Selector Large Cap Value Fund | ||
| Distributions to shareholders | ||
| Series Stock Selector Large Cap Value | $975,442,209 | $– |
| From net investment income | ||
| Series Stock Selector Large Cap Value | $– | $196,951,761 |
| Class F | – | 4,004,331 |
| Total | $– | $200,956,092 |
| From net realized gain | ||
| Series Stock Selector Large Cap Value | $– | $458,490,671 |
| Class F | – | 17,352,099 |
| Total | $– | $475,842,770 |
| Fidelity Series Value Discovery Fund | ||
| Distributions to shareholders | ||
| Series Value Discovery | $488,658,856 | $– |
| From net investment income | ||
| Series Value Discovery | $– | $81,449,326 |
| Class F | – | 68,421,740 |
| Total | $– | $149,871,066 |
| From net realized gain | ||
| Series Value Discovery | $– | $383,419,382 |
| Class F | – | 78,787,293 |
| Total | $– | $462,206,675 |
11. Share Transactions.
Transactions for each class of shares were as follows:
| Shares | Shares | Dollars | Dollars | |
| Year ended January 31, 2019 | Year ended January 31, 2018 | Year ended January 31, 2019 | Year ended January 31, 2018 | |
| Fidelity Series All-Sector Equity | ||||
| Shares sold | 30,970,394 | 284,598,389 | $378,787,782 | $3,701,113,864 |
| Reinvestment of distributions | 117,674,923 | 57,825,664 | 1,124,214,915 | 730,212,301 |
| Shares redeemed | (250,295,870) | (77,770,587) | (3,320,012,000) | (1,027,443,751) |
| Net increase (decrease) | (101,650,553) | 264,653,466 | $(1,817,009,303) | $3,403,882,414 |
| Class F | ||||
| Shares sold | – | 17,419,838 | $– | $220,628,351 |
| Reinvestment of distributions | – | 9,008,995 | – | 111,621,447 |
| Shares redeemed | – | (288,104,477) | – | (3,729,449,444) |
| Net increase (decrease) | – | (261,675,644) | $– | $(3,397,199,646) |
| Fidelity Series Stock Selector Large Cap Value | ||||
| Shares sold | 56,636,973 | 506,849,247 | $704,125,905 | $6,538,339,415 |
| Issued in exchange for the shares of Fidelity Adviser Series Stock Selector Large Cap Value Fund | 86,505,464 | – | 1,142,737,823 | – |
| Reinvestment of distributions | 86,317,969 | 50,657,934 | 975,442,209 | 655,442,432 |
| Shares redeemed | (97,345,371) | (68,423,833) | (1,223,137,140) | (894,534,018) |
| Net increase (decrease) | 132,115,035 | 489,083,348 | $1,599,168,797 | $6,299,247,829 |
| Class F | ||||
| Shares sold | – | 32,789,177 | $– | $420,765,409 |
| Reinvestment of distributions | – | 1,658,108 | – | 21,356,430 |
| Shares redeemed | – | (479,833,926) | – | (6,179,742,315) |
| Net increase (decrease) | – | (445,386,641) | $– | $(5,737,620,476) |
| Fidelity Series Value Discovery | ||||
| Shares sold | 37,884,353 | – | $489,756,078 | $4,706,853,232 |
| Issued in exchange for the shares of Fidelity Advisor Series Equity Value Fund | 82,306,891 | – | 1,141,600,514 | – |
| Reinvestment of distributions | 41,468,961 | 34,973,828 | 488,658,856 | 464,868,708 |
| Shares redeemed | (61,689,584) | (248,104,733)(a) | (807,125,106) | (3,299,221,934)(a) |
| Net increase (decrease) | 99,970,621 | 146,465,438 | $1,312,890,342 | $1,872,500,006 |
| Class F | ||||
| Shares sold | – | 33,199,574 | $– | $439,081,260 |
| Reinvestment of distributions | – | 11,137,913 | – | 147,209,033 |
| Shares redeemed | – | (642,768,758)(a) | – | (8,466,561,600)(a) |
| Net increase (decrease) | – | (598,431,271) | $– | $(7,880,271,307) |
(a) Amount includes in-kind redemptions (see the Prior Fiscal Year Redemptions In-Kind note for additional details).
12. Other.
The Funds' organizational documents provide former and current trustees and officers with a limited indemnification against liabilities arising in connection with the performance of their duties to the Funds. In the normal course of business, the Funds may also enter into contracts that provide general indemnifications. The Funds' maximum exposure under these arrangements is unknown as this would be dependent on future claims that may be made against the Funds. The risk of material loss from such claims is considered remote.
At the end of the period, mutual funds managed by the investment adviser or its affiliates were the owners of record of all of the outstanding shares of the Funds.
13. Merger Information.
On September 14, 2018, Fidelity Series Stock Selector Large Cap Value Fund acquired all of the assets and assumed all of the liabilities of Fidelity Advisor Series Stock Selector Large Cap Value Fund ("Target Fund") pursuant to an Agreement and Plan of Reorganization approved by the Board of Trustees ("The Board"). The acquisition was accomplished by an exchange of shares of the Fund for shares then outstanding of the Target Fund at its respective net asset value on the acquisition date.
On September 21, 2018, Fidelity Series Value Discovery Fund acquired all of the assets and assumed all of the liabilities of Fidelity Advisor Series Equity Value Fund ("Target Fund") pursuant to an Agreement and Plan of Reorganization approved by the Board of Trustees ("The Board"). The acquisition was accomplished by an exchange of shares of the Fund for shares then outstanding of the Target Fund at its respective net asset value on the acquisition date.
The reorganizations provide shareholders of each Target Fund access to a larger portfolio with a similar investment objective and lower expenses. The reorganization qualified as a tax-free reorganization for federal income tax purposes with no gain or loss recognized to the funds or their shareholders.
Combined total net assets after the acquisition are as follows:
| Target Funds | Securities | Unrealized appreciation (depreciation) | Net Assets |
| Fidelity Advisor Series Stock Selector Large Cap Value Fund | $1,141,814,114 | $155,225,458 | $1,142,737,823 |
| Fidelity Advisor Series Equity Value Fund | 1,146,283,856 | 130,414,969 | 1,141,600,514 |
| Surviving Funds | Net assets | Total net assets after the acquisition |
| Fidelity Series Stock Selector Large Cap Value Fund | $10,008,538,109 | $11,151,275,932 |
| Fidelity Series Value Discovery Fund | 7,203,814,366 | 8,345,414,880 |
Pro forma results of operations of the combined entity for the entire period ended January 31, 2019, as though each acquisition had occurred as of the beginning of the year (rather than on the actual acquisition date), are as follows:
| Surviving Funds | Net investment income (loss) | Total net realized gain (loss) | Total change in net unrealized appreciation (depreciation) | Net increase (decrease) in net assets resulting from operations |
| Fidelity Series Stock Selector Large Cap Value Fund | $254,718,097 | $741,150,176 | $(1,575,583,949) | $(579,715,676) |
| Fidelity Series Value Discovery Fund | 200,459,630 | 284,494,276 | (998,645,857) | (513,691,951) |
Because each combined investment portfolio have been managed as a single portfolio since each acquisition was completed, it is not practicable to separate the amounts of revenue and earnings of each Target Fund that have been included in each Surviving Fund's accompanying Statement of Operations since the respective acquisition dates.
Report of Independent Registered Public Accounting Firm
To the Trustees of Fidelity Devonshire Trust and Shareholders of Fidelity Series All-Sector Equity Fund and Fidelity Series Value Discovery Fund:
Opinion on the Financial Statements and Financial Highlights
Opinions on the Financial Statements
We have audited the accompanying statements of assets and liabilities of Fidelity Series All-Sector Equity Fund and Fidelity Series Value Discovery Fund (the "Funds"), each a fund of Fidelity Devonshire Trust, including the schedules of investments, as of January 31, 2019, and the related statements of operations for the year then ended, the statements of changes in net assets for each of the two years in the period then ended, the financial highlights for each of the five years in the period then ended, and the related notes. In our opinion, the financial statements and financial highlights present fairly, in all material respects, the financial position of each of the Funds as of January 31, 2019, and the results of their operations for the year then ended, the changes in their net assets for each of the two years in the period then ended, and the financial highlights for each of the five years in the period then ended, in conformity with accounting principles generally accepted in the United States of America.
Basis for Opinion
These financial statements and financial highlights are the responsibility of the Funds' management. Our responsibility is to express an opinion on the Funds' financial statements and financial highlights based on our audits. We are a public accounting firm registered with the Public Company Accounting Oversight Board (United States) (PCAOB) and are required to be independent with respect to the Funds in accordance with the U.S. federal securities laws and the applicable rules and regulations of the Securities and Exchange Commission and the PCAOB.
We conducted our audits in accordance with the standards of the PCAOB. Those standards require that we plan and perform the audit to obtain reasonable assurance about whether the financial statements and financial highlights are free of material misstatement, whether due to error or fraud. The Funds are not required to have, nor were we engaged to perform, an audit of their internal control over financial reporting. As part of our audits we are required to obtain an understanding of internal control over financial reporting but not for the purpose of expressing an opinion on the effectiveness of the Funds' internal control over financial reporting. Accordingly, we express no such opinion.
Our audits included performing procedures to assess the risks of material misstatement of the financial statements and financial highlights, whether due to error or fraud, and performing procedures that respond to those risks. Such procedures included examining, on a test basis, evidence regarding the amounts and disclosures in the financial statements and financial highlights. Our audits also included evaluating the accounting principles used and significant estimates made by management, as well as evaluating the overall presentation of the financial statements and financial highlights. Our procedures included confirmation of securities owned as of January 31, 2019, by correspondence with the custodians and brokers; when replies were not received from brokers, we performed other auditing procedures. We believe that our audits provide a reasonable basis for our opinion.
/s/ Deloitte & Touche LLP
Boston, Massachusetts
March 19, 2019
We have served as the auditor of one or more of the Fidelity investment companies since 1999.
Report of Independent Registered Public Accounting Firm
To the Board of Trustees of Fidelity Devonshire Trust and Shareholders of Fidelity Series Stock Selector Large Cap Value Fund:
Opinion on the Financial Statements
We have audited the accompanying statement of assets and liabilities, including the schedule of investments, of Fidelity Series Stock Selector Large Cap Value Fund (one of the funds constituting Fidelity Devonshire Trust, referred to hereafter as the "Fund") as of January 31, 2019, the related statement of operations for the year ended January 31, 2019, the statement of changes in net assets for each of the two years in the period ended January 31, 2019, including the related notes, and the financial highlights for each of the five years in the period ended January 31, 2019 (collectively referred to as the “financial statements”). In our opinion, the financial statements present fairly, in all material respects, the financial position of the Fund as of January 31, 2019, the results of its operations for the year then ended, the changes in its net assets for each of the two years in the period ended January 31, 2019 and the financial highlights for each of the five years in the period ended January 31, 2019 in conformity with accounting principles generally accepted in the United States of America.
Basis for Opinion
These financial statements are the responsibility of the Fund’s management. Our responsibility is to express an opinion on the Fund’s financial statements based on our audits. We are a public accounting firm registered with the Public Company Accounting Oversight Board (United States) (PCAOB) and are required to be independent with respect to the Fund in accordance with the U.S. federal securities laws and the applicable rules and regulations of the Securities and Exchange Commission and the PCAOB.
We conducted our audits of these financial statements in accordance with the standards of the PCAOB. Those standards require that we plan and perform the audit to obtain reasonable assurance about whether the financial statements are free of material misstatement, whether due to error or fraud.
Our audits included performing procedures to assess the risks of material misstatement of the financial statements, whether due to error or fraud, and performing procedures that respond to those risks. Such procedures included examining, on a test basis, evidence regarding the amounts and disclosures in the financial statements. Our audits also included evaluating the accounting principles used and significant estimates made by management, as well as evaluating the overall presentation of the financial statements. Our procedures included confirmation of securities owned as of January 31, 2019 by correspondence with the custodian and brokers; when replies were not received from brokers, we performed other auditing procedures. We believe that our audits provide a reasonable basis for our opinion.
PricewaterhouseCoopers LLP
Boston, Massachusetts
March 19, 2019
We have served as the auditor of one or more investment companies in the Fidelity group of funds since 1932.
Trustees and Officers
The Trustees, Members of the Advisory Board (if any), and officers of the trust and funds, as applicable, are listed below. The Board of Trustees governs each fund and is responsible for protecting the interests of shareholders. The Trustees are experienced executives who meet periodically throughout the year to oversee each fund's activities, review contractual arrangements with companies that provide services to each fund, oversee management of the risks associated with such activities and contractual arrangements, and review each fund's performance. Except for Michael E. Wiley each of the Trustees oversees 287 funds. Mr. Wiley overseas 195 funds.
The Trustees hold office without limit in time except that (a) any Trustee may resign; (b) any Trustee may be removed by written instrument, signed by at least two-thirds of the number of Trustees prior to such removal; (c) any Trustee who requests to be retired or who has become incapacitated by illness or injury may be retired by written instrument signed by a majority of the other Trustees; and (d) any Trustee may be removed at any special meeting of shareholders by a two-thirds vote of the outstanding voting securities of the trust. Each Trustee who is not an interested person (as defined in the 1940 Act) of the trust and the funds is referred to herein as an Independent Trustee. Each Independent Trustee shall retire not later than the last day of the calendar year in which his or her 75th birthday occurs. The Independent Trustees may waive this mandatory retirement age policy with respect to individual Trustees. Officers and Advisory Board Members hold office without limit in time, except that any officer or Advisory Board Member may resign or may be removed by a vote of a majority of the Trustees at any regular meeting or any special meeting of the Trustees. Except as indicated, each individual has held the office shown or other offices in the same company for the past five years.
Each fund’s Statement of Additional Information (SAI) includes more information about the Trustees. To request a free copy, call Fidelity at 1-800-544-8544.
Experience, Skills, Attributes, and Qualifications of the Trustees. The Governance and Nominating Committee has adopted a statement of policy that describes the experience, qualifications, attributes, and skills that are necessary and desirable for potential Independent Trustee candidates (Statement of Policy). The Board believes that each Trustee satisfied at the time he or she was initially elected or appointed a Trustee, and continues to satisfy, the standards contemplated by the Statement of Policy. The Governance and Nominating Committee also engages professional search firms to help identify potential Independent Trustee candidates who have the experience, qualifications, attributes, and skills consistent with the Statement of Policy. From time to time, additional criteria based on the composition and skills of the current Independent Trustees, as well as experience or skills that may be appropriate in light of future changes to board composition, business conditions, and regulatory or other developments, have also been considered by the professional search firms and the Governance and Nominating Committee. In addition, the Board takes into account the Trustees' commitment and participation in Board and committee meetings, as well as their leadership of standing and ad hoc committees throughout their tenure.
In determining that a particular Trustee was and continues to be qualified to serve as a Trustee, the Board has considered a variety of criteria, none of which, in isolation, was controlling. The Board believes that, collectively, the Trustees have balanced and diverse experience, qualifications, attributes, and skills, which allow the Board to operate effectively in governing each fund and protecting the interests of shareholders. Information about the specific experience, skills, attributes, and qualifications of each Trustee, which in each case led to the Board's conclusion that the Trustee should serve (or continue to serve) as a trustee of the funds, is provided below.
Board Structure and Oversight Function. James C. Curvey is an interested person and currently serves as Chairman. The Trustees have determined that an interested Chairman is appropriate and benefits shareholders because an interested Chairman has a personal and professional stake in the quality and continuity of services provided to the funds. Independent Trustees exercise their informed business judgment to appoint an individual of their choosing to serve as Chairman, regardless of whether the Trustee happens to be independent or a member of management. The Independent Trustees have determined that they can act independently and effectively without having an Independent Trustee serve as Chairman and that a key structural component for assuring that they are in a position to do so is for the Independent Trustees to constitute a substantial majority for the Board. The Independent Trustees also regularly meet in executive session. Ned C. Lautenbach serves as Chairman of the Independent Trustees and as such (i) acts as a liaison between the Independent Trustees and management with respect to matters important to the Independent Trustees and (ii) with management prepares agendas for Board meetings.
Fidelity® funds are overseen by different Boards of Trustees. The funds' Board oversees Fidelity's high income and certain equity funds, and other Boards oversee Fidelity's investment-grade bond, money market, asset allocation, and other equity funds. The asset allocation funds may invest in Fidelity® funds overseen by the funds' Board. The use of separate Boards, each with its own committee structure, allows the Trustees of each group of Fidelity® funds to focus on the unique issues of the funds they oversee, including common research, investment, and operational issues. On occasion, the separate Boards establish joint committees to address issues of overlapping consequences for the Fidelity® funds overseen by each Board.
The Trustees operate using a system of committees to facilitate the timely and efficient consideration of all matters of importance to the Trustees, each fund, and fund shareholders and to facilitate compliance with legal and regulatory requirements and oversight of the funds' activities and associated risks. The Board, acting through its committees, has charged FMR and its affiliates with (i) identifying events or circumstances the occurrence of which could have demonstrably adverse effects on the funds' business and/or reputation; (ii) implementing processes and controls to lessen the possibility that such events or circumstances occur or to mitigate the effects of such events or circumstances if they do occur; and (iii) creating and maintaining a system designed to evaluate continuously business and market conditions in order to facilitate the identification and implementation processes described in (i) and (ii) above. Because the day-to-day operations and activities of the funds are carried out by or through FMR, its affiliates, and other service providers, the funds' exposure to risks is mitigated but not eliminated by the processes overseen by the Trustees. While each of the Board's committees has responsibility for overseeing different aspects of the funds' activities, oversight is exercised primarily through the Operations, Audit, and Compliance Committees. In addition, the Independent Trustees have worked with Fidelity to enhance the Board's oversight of investment and financial risks, legal and regulatory risks, technology risks, and operational risks, including the development of additional risk reporting to the Board. Appropriate personnel, including but not limited to the funds' Chief Compliance Officer (CCO), FMR's internal auditor, the independent accountants, the funds' Treasurer and portfolio management personnel, make periodic reports to the Board's committees, as appropriate, including an annual review of Fidelity's risk management program for the Fidelity® funds. The responsibilities of each standing committee, including their oversight responsibilities, are described further under "Standing Committees of the Trustees."
Interested Trustees*:
Correspondence intended for a Trustee who is an interested person may be sent to Fidelity Investments, 245 Summer Street, Boston, Massachusetts 02210.
Name, Year of Birth; Principal Occupations and Other Relevant Experience+
James C. Curvey (1935)
Year of Election or Appointment: 2007
Trustee
Chairman of the Board of Trustees
Mr. Curvey also serves as Trustee of other Fidelity® funds. Mr. Curvey is Vice Chairman (2007-present) and Director of FMR LLC (diversified financial services company). In addition, Mr. Curvey is an Overseer Emeritus for the Boston Symphony Orchestra, a Director of Artis-Naples, and a Trustee of Brewster Academy in Wolfeboro, New Hampshire. Previously, Mr. Curvey served as a Director of Fidelity Research & Analysis Co. (investment adviser firm, 2009-2018), Director of Fidelity Investments Money Management, Inc. (investment adviser firm, 2009-2014) and a Director of FMR and FMR Co., Inc. (investment adviser firms, 2007-2014).
* Determined to be an “Interested Trustee” by virtue of, among other things, his or her affiliation with the trust or various entities under common control with FMR.
+ The information includes the Trustee's principal occupation during the last five years and other information relating to the experience, attributes, and skills relevant to the Trustee's qualifications to serve as a Trustee, which led to the conclusion that the Trustee should serve as a Trustee for each fund.
Independent Trustees:
Correspondence intended for an Independent Trustee may be sent to Fidelity Investments, P.O. Box 55235, Boston, Massachusetts 02205-5235.
Name, Year of Birth; Principal Occupations and Other Relevant Experience+
Dennis J. Dirks (1948)
Year of Election or Appointment: 2005
Trustee
Mr. Dirks also serves as Trustee of other Fidelity® funds. Prior to his retirement in May 2003, Mr. Dirks was Chief Operating Officer and a member of the Board of The Depository Trust & Clearing Corporation (DTCC). He also served as President, Chief Operating Officer, and Board member of The Depository Trust Company (DTC) and President and Board member of the National Securities Clearing Corporation (NSCC). In addition, Mr. Dirks served as Chief Executive Officer and Board member of the Government Securities Clearing Corporation, Chief Executive Officer and Board member of the Mortgage-Backed Securities Clearing Corporation, as a Trustee and a member of the Finance Committee of Manhattan College (2005-2008), as a Trustee and a member of the Finance Committee of AHRC of Nassau County (2006-2008), as a member of the Independent Directors Council (IDC) Governing Council (2010-2015), and as a member of the Board of Directors for The Brookville Center for Children’s Services, Inc. (2009-2017). Mr. Dirks is a member of the Finance Committee (2016-present) and Board of Directors (2017-present) and is Treasurer (2018-present) of the Asolo Repertory Theatre.
Donald F. Donahue (1950)
Year of Election or Appointment: 2018
Trustee
Mr. Donahue also serves as a Trustee of other Fidelity® funds. Mr. Donahue is President and Chief Executive Officer of Miranda Partners, LLC (risk consulting for the financial services industry, 2012-present). Previously, Mr. Donahue served as a Member of the Advisory Board of certain Fidelity® funds (2015-2018) and Chief Executive Officer (2006-2012), Chief Operating Officer (2003-2006), and Managing Director, Customer Marketing and Development (1999-2003) of The Depository Trust & Clearing Corporation (financial markets infrastructure). Mr. Donahue serves as a Member (2007-present) and Co-Chairman (2016-present) of the Board of Directors of United Way of New York, Member of the Board of Directors of NYC Leadership Academy (2012-present) and Member of the Board of Advisors of Ripple Labs, Inc. (financial services, 2015-present). He also served as Chairman (2010-2012) and Member of the Board of Directors (2012-2013) of Omgeo, LLC (financial services), Treasurer of United Way of New York (2012-2016), and Member of the Board of Directors of XBRL US (financial services non-profit, 2009-2012) and the International Securities Services Association (2009-2012).
Alan J. Lacy (1953)
Year of Election or Appointment: 2008
Trustee
Mr. Lacy also serves as Trustee of other Fidelity® funds. Mr. Lacy serves as a Director of Bristol-Myers Squibb Company (global pharmaceuticals, 2008-present). He is a Trustee of the California Chapter of The Nature Conservancy (2015-present) and a Director of the Center for Advanced Study in the Behavioral Sciences at Stanford University (2015-present). In addition, Mr. Lacy served as Senior Adviser (2007-2014) of Oak Hill Capital Partners, L.P. (private equity) and also served as Chief Executive Officer (2005) and Vice Chairman (2005-2006) of Sears Holdings Corporation (retail) and Chief Executive Officer and Chairman of the Board of Sears, Roebuck and Co. (retail, 2000-2005). Previously, Mr. Lacy served as Chairman (2014-2017) and a member (2010-2017) of the Board of Directors of Dave & Buster’s Entertainment, Inc. (restaurant and entertainment complexes), as Chairman (2008-2011) and a member (2006-2015) of the Board of Trustees of the National Parks Conservation Association, and as a member of the Board of Directors for The Hillman Companies, Inc. (hardware wholesalers, 2010-2014), Earth Fare, Inc. (retail grocery, 2010-2014), and The Western Union Company (global money transfer, 2006-2011).
Ned C. Lautenbach (1944)
Year of Election or Appointment: 2000
Trustee
Chairman of the Independent Trustees
Mr. Lautenbach also serves as Trustee of other Fidelity® funds. Mr. Lautenbach currently serves as Chair (2018-present) and Member (2013-present) of the Board of Governors, State University System of Florida and is a member of the Council on Foreign Relations (1994-present). He is also a member and has most recently served as Chairman of the Board of Directors of Artis-Naples (2012-present). Previously, Mr. Lautenbach served as a member and then Lead Director of the Board of Directors of Eaton Corporation (diversified industrial, 1997-2016). He was also a Partner and Advisory Partner at Clayton, Dubilier & Rice, LLC (private equity investment, 1998-2010), as well as a Director of Sony Corporation (2006-2007). In addition, Mr. Lautenbach also had a 30-year career with IBM (technology company) during which time he served as Senior Vice President and a member of the Corporate Executive Committee (1968-1998).
Joseph Mauriello (1944)
Year of Election or Appointment: 2008
Trustee
Mr. Mauriello also serves as Trustee of other Fidelity® funds. Prior to his retirement in January 2006, Mr. Mauriello served in numerous senior management positions including Deputy Chairman and Chief Operating Officer (2004-2005), and Vice Chairman of Financial Services (2002-2004) of KPMG LLP US (professional services, 1965-2005). Mr. Mauriello currently serves as a member of the Independent Directors Council (IDC) Governing Council (2015-present). Previously, Mr. Mauriello served as a member of the Board of Directors of XL Group plc. (global insurance and re-insurance, 2006-2018).
Cornelia M. Small (1944)
Year of Election or Appointment: 2005
Trustee
Ms. Small also serves as Trustee of other Fidelity® funds. Ms. Small is a member of the Board of Directors (2009-present) and Chair of the Investment Committee (2010-present) of the Teagle Foundation. Ms. Small also serves on the Investment Committee of the Berkshire Taconic Community Foundation (2008-present). Previously, Ms. Small served as Chairperson (2002-2008) and a member of the Investment Committee and Chairperson (2008-2012) and a member of the Board of Trustees of Smith College. In addition, Ms. Small served as Chief Investment Officer, Director of Global Equity Investments, and a member of the Board of Directors of Scudder, Stevens & Clark and Scudder Kemper Investments.
Garnett A. Smith (1947)
Year of Election or Appointment: 2018
Trustee
Mr. Smith also serves as Trustee of other Fidelity® funds. Prior to Mr. Smith's retirement, he served as Chairman and Chief Executive Officer of Inbrand Corp. (manufacturer of personal absorbent products, 1990-1997). He also served as President (1986-1990) of Inbrand Corp. Prior to his employment with Inbrand Corp., he was employed by a retail fabric chain and North Carolina National Bank. In addition, Mr. Smith served as a Member of the Advisory Board of certain Fidelity® funds (2012-2013) and as a board member of the Jackson Hole Land Trust (2009-2012).
David M. Thomas (1949)
Year of Election or Appointment: 2008
Trustee
Mr. Thomas also serves as Trustee of other Fidelity® funds. Mr. Thomas serves as Non-Executive Chairman of the Board of Directors of Fortune Brands Home and Security (home and security products, 2011-present) and as a member of the Board of Directors (2004-present) and Presiding Director (2013-present) of Interpublic Group of Companies, Inc. (marketing communication). Previously, Mr. Thomas served as Executive Chairman (2005-2006) and Chairman and Chief Executive Officer (2000-2005) of IMS Health, Inc. (pharmaceutical and healthcare information solutions), a Director of Fortune Brands, Inc. (consumer products, 2000-2011), and a member of the Board of Trustees of the University of Florida (2013-2018).
Michael E. Wiley (1950)
Year of Election or Appointment: 2018
Trustee
Mr. Wiley also serves as Trustee or Member of the Advisory Board of other Fidelity® funds. Mr. Wiley serves as a Director of High Point Resources (exploration and production, 2005-present). Previously, Mr. Wiley served as a Director of Andeavor Corporation (independent oil refiner and marketer, 2005-2018), a Director of Andeavor Logistics LP (natural resources logistics, 2015-2018), a Director of Post Oak Bank (privately-held bank, 2004-2018), a Director of Asia Pacific Exploration Consolidated (international oil and gas exploration and production, 2008-2013), a member of the Board of Trustees of the University of Tulsa (2000-2006; 2007-2010), a Senior Energy Advisor of Katzenbach Partners, LLC (consulting, 2006-2007), an Advisory Director of Riverstone Holdings (private investment), a Director of Spinnaker Exploration Company (exploration and production, 2001-2005) and Chairman, President, and CEO of Baker Hughes, Inc. (oilfield services, 2000-2004).
+ The information includes the Trustee's principal occupation during the last five years and other information relating to the experience, attributes, and skills relevant to the Trustee's qualifications to serve as a Trustee, which led to the conclusion that the Trustee should serve as a Trustee for each fund.
Advisory Board Members and Officers:
Correspondence intended for a Member of the Advisory Board (if any) may be sent to Fidelity Investments, P.O. Box 55235, Boston, Massachusetts 02205-5235. Correspondence intended for an officer or Peter S. Lynch may be sent to Fidelity Investments, 245 Summer Street, Boston, Massachusetts 02210. Officers appear below in alphabetical order.
Name, Year of Birth; Principal Occupation
Vicki L. Fuller (1957)
Year of Election or Appointment: 2018
Member of the Advisory Board
Ms. Fuller also serves as Member of the Advisory Board of other Fidelity® funds. Ms. Fuller serves as a member of the Board of Directors, Audit Committee, and Nominating and Governance Committee of The Williams Companies, Inc. (natural gas infrastructure, 2018-present). Previously, Ms. Fuller served as the Chief Investment Officer of the New York State Common Retirement Fund (2012-2018) and held a variety of positions at AllianceBernstein L.P. (global asset management, 1985-2012), including Managing Director (2006-2012) and Senior Vice President and Senior Portfolio Manager (2001-2006).
Peter S. Lynch (1944)
Year of Election or Appointment: 2003
Member of the Advisory Board
Mr. Lynch also serves as Member of the Advisory Board of other Fidelity® funds. Mr. Lynch is Vice Chairman and a Director of FMR (investment adviser firm) and FMR Co., Inc. (investment adviser firm). In addition, Mr. Lynch serves as a Trustee of Boston College and as the Chairman of the Inner-City Scholarship Fund. Previously, Mr. Lynch served on the Special Olympics International Board of Directors (1997-2006).
Carol B. Tomé (1957)
Year of Election or Appointment: 2018
Member of the Advisory Board
Ms. Tomé also serves as Member of the Advisory Board of other Fidelity® funds. Ms. Tomé is Chief Financial Officer (2001-present) and Executive Vice President of Corporate Services (2007-present) of The Home Depot, Inc. (home improvement retailer) and a Director (2003-present) and Chair of the Audit Committee (2004-present) of United Parcel Service, Inc. (package delivery and supply chain management). Previously, Ms. Tomé served as Trustee of certain Fidelity® funds (2017), Senior Vice President of Finance and Accounting/Treasurer (2000-2007) and Vice President and Treasurer (1995-2000) of The Home Depot, Inc. and Chair of the Board (2010-2012), Vice Chair of the Board (2009 and 2013), and a Director (2008-2013) of the Federal Reserve Bank of Atlanta. Ms. Tomé is also a director or trustee of many community and professional organizations.
Elizabeth Paige Baumann (1968)
Year of Election or Appointment: 2017
Anti-Money Laundering (AML) Officer
Ms. Baumann also serves as AML Officer of other funds. She is Chief AML Officer (2012-present) and Senior Vice President (2014-present) of FMR LLC (diversified financial services company) and is an employee of Fidelity Investments. Previously, Ms. Baumann served as AML Officer of the funds (2012-2016), and Vice President (2007-2014) and Deputy Anti-Money Laundering Officer (2007-2012) of FMR LLC.
Craig S. Brown (1977)
Year of Election or Appointment: 2019
Assistant Treasurer
Mr. Brown also serves as Assistant Treasurer of other funds. Mr. Brown is an employee of Fidelity Investments (2013-present).
John J. Burke III (1964)
Year of Election or Appointment: 2018
Chief Financial Officer
Mr. Burke also serves as Chief Financial Officer of other funds. Mr. Burke serves as Head of Investment Operations for Fidelity Fund and Investment Operations (2018-present) and is an employee of Fidelity Investments (1998-present). Previously Mr. Burke served as head of Asset Management Investment Operations (2012-2018).
William C. Coffey (1969)
Year of Election or Appointment: 2018
Secretary and Chief Legal Officer (CLO)
Mr. Coffey also serves as Secretary and CLO of other funds. Mr. Coffey serves as CLO, Secretary, and Senior Vice President of Fidelity Management & Research Company and FMR Co., Inc. (investment adviser firms, 2018-present); Secretary of Fidelity SelectCo, LLC and Fidelity Investments Money Management, Inc. (investment adviser firms, 2018-present); and CLO of Fidelity Management & Research (Hong Kong) Limited, FMR Investment Management (UK) Limited, and Fidelity Management & Research (Japan) Limited (investment adviser firms, 2018-present). He is Senior Vice President and Deputy General Counsel of FMR LLC (diversified financial services company, 2010-present), and is an employee of Fidelity Investments. Previously, Mr. Coffey served as Assistant Secretary of certain funds (2009-2018) and as Vice President and Associate General Counsel of FMR LLC (2005-2009).
Timothy M. Cohen (1969)
Year of Election or Appointment: 2018
Vice President
Mr. Cohen also serves as Vice President of other funds. Mr. Cohen serves as Co-Head of Global Equity Research (2016-present), a Director of Fidelity Management & Research (Japan) Limited (investment adviser firm, 2016-present), and is an employee of Fidelity Investments. Previously, Mr. Cohen served as Chief Investment Officer - Equity and a Director of Fidelity Management & Research (U.K.) Inc. (investment adviser firm, 2013-2015) and as a Director of Fidelity Management & Research (Hong Kong) Limited (investment adviser firm, 2017).
Jonathan Davis (1968)
Year of Election or Appointment: 2010
Assistant Treasurer
Mr. Davis also serves as Assistant Treasurer of other funds. Mr. Davis serves as Assistant Treasurer of FMR Capital, Inc. (2017-present) and is an employee of Fidelity Investments. Previously, Mr. Davis served as Vice President and Associate General Counsel of FMR LLC (diversified financial services company, 2003-2010).
Adrien E. Deberghes (1967)
Year of Election or Appointment: 2016
Assistant Treasurer
Mr. Deberghes also serves as an officer of other funds. He serves as Assistant Treasurer of FMR Capital, Inc. (2017-present), Executive Vice President of Fidelity Investments Money Management, Inc. (FIMM) (investment adviser firm, 2016-present), and is an employee of Fidelity Investments (2008-present). Previously, Mr. Deberghes served as President and Treasurer of certain Fidelity® funds (2013-2018). Prior to joining Fidelity Investments, Mr. Deberghes was Senior Vice President of Mutual Fund Administration at State Street Corporation (2007-2008), Senior Director of Mutual Fund Administration at Investors Bank & Trust (2005-2007), and Director of Finance for Dunkin' Brands (2000-2005). Previously, Mr. Deberghes served in other fund officer roles.
Laura M. Del Prato (1964)
Year of Election or Appointment: 2018
Assistant Treasurer
Ms. Del Prato also serves as an officer of other funds. Ms. Del Prato is an employee of Fidelity Investments (2017-present). Prior to joining Fidelity Investments, Ms. Del Prato served as a Managing Director and Treasurer of the JPMorgan Mutual Funds (2014-2017). Prior to JPMorgan, Ms. Del Prato served as a partner at Cohen Fund Audit Services (accounting firm, 2012-2013) and KPMG LLP (accounting firm, 2004-2012).
Colm A. Hogan (1973)
Year of Election or Appointment: 2016
Deputy Treasurer
Mr. Hogan also serves as an officer of other funds. Mr. Hogan serves as Assistant Treasurer of FMR Capital, Inc. (2017-present) and is an employee of Fidelity Investments (2005-present). Previously, Mr. Hogan served as Assistant Treasurer of certain Fidelity® funds (2016-2018).
Pamela R. Holding (1964)
Year of Election or Appointment: 2018
Vice President
Ms. Holding also serves as Vice President of other funds. Ms. Holding serves as Co-Head of Global Equity Research (2018-present) and is an employee of Fidelity Investments (2013-present).
Chris Maher (1972)
Year of Election or Appointment: 2013
Assistant Treasurer
Mr. Maher serves as Assistant Treasurer of other funds. Mr. Maher is Vice President of Valuation Oversight, serves as Assistant Treasurer of FMR Capital, Inc. (2017-present), and is an employee of Fidelity Investments. Previously, Mr. Maher served as Vice President of Asset Management Compliance (2013), Vice President of the Program Management Group of FMR (investment adviser firm, 2010-2013), and Vice President of Valuation Oversight (2008-2010).
Kenneth B. Robins (1969)
Year of Election or Appointment: 2016
Chief Compliance Officer
Mr. Robins also serves as an officer of other funds. Mr. Robins serves as Compliance Officer of Fidelity Management & Research Company and FMR Co., Inc. (investment adviser firms, 2016-present) and is an employee of Fidelity Investments (2004-present). Previously, Mr. Robins served as Executive Vice President of Fidelity Investments Money Management, Inc. (investment adviser firm, 2013-2016) and served in other fund officer roles.
Stacie M. Smith (1974)
Year of Election or Appointment: 2016
President and Treasurer
Ms. Smith also serves as an officer of other funds. Ms. Smith serves as Assistant Treasurer of FMR Capital, Inc. (2017-present), is an employee of Fidelity Investments (2009-present), and has served in other fund officer roles. Prior to joining Fidelity Investments, Ms. Smith served as Senior Audit Manager of Ernst & Young LLP (accounting firm, 1996-2009). Previously, Ms. Smith served as Assistant Treasurer (2013-2018) and Deputy Treasurer (2013-2016) of certain Fidelity® funds.
Marc L. Spector (1972)
Year of Election or Appointment: 2016
Assistant Treasurer
Mr. Spector also serves as an officer of other funds. Mr. Spector serves as Assistant Treasurer of FMR Capital, Inc. (2017-present) and is an employee of Fidelity Investments (2016-present). Prior to joining Fidelity Investments, Mr. Spector served as Director at the Siegfried Group (accounting firm, 2013-2016), and prior to Siegfried Group as audit senior manager at Deloitte & Touche (accounting firm, 2005-2013).
Jim Wegmann (1979)
Year of Election or Appointment: 2019
Assistant Treasurer
Mr. Wegmann also serves as Assistant Treasurer of other funds. Mr. Wegmann is an employee of Fidelity Investments (2011-present).
Shareholder Expense Example
As a shareholder of a Fund, you incur two types of costs: (1) transaction costs and (2) ongoing costs, including management fees and other Fund expenses. This Example is intended to help you understand your ongoing costs (in dollars) of investing in the Funds and to compare these costs with the ongoing costs of investing in other mutual funds.
The Example is based on an investment of $1,000 invested at the beginning of the period and held for the entire period (August 1, 2018 to January 31, 2019).
Actual Expenses
The first line of the accompanying table for each fund provides information about actual account values and actual expenses. You may use the information in this line, together with the amount you invested, to estimate the expenses that you paid over the period. Simply divide your account value by $1,000.00 (for example, an $8,600 account value divided by $1,000.00 = 8.6), then multiply the result by the number in the first line under the heading entitled "Expenses Paid During Period" to estimate the expenses you paid on your account during this period. In addition, the Fund, as a shareholder in the underlying Fidelity Central Funds, will indirectly bear its pro-rata share of the fees and expenses incurred by the underlying Fidelity Central Funds. These fees and expenses are not included in the Fund's annualized expense ratio used to calculate the expense estimate in the table below.
Hypothetical Example for Comparison Purposes
The second line of the accompanying table for each fund provides information about hypothetical account values and hypothetical expenses based on a fund's actual expense ratio and an assumed rate of return of 5% per year before expenses, which is not the Fund's actual return. The hypothetical account values and expenses may not be used to estimate the actual ending account balance or expenses you paid for the period. You may use this information to compare the ongoing costs of investing in the Fund and other funds. To do so, compare this 5% hypothetical example with the 5% hypothetical examples that appear in the shareholder reports of the other funds. In addition, each Fund, as a shareholder in the underlying Fidelity Central Funds, will indirectly bear its pro-rata share of the fees and expenses incurred by the underlying Fidelity Central Funds. These fees and expenses are not included in the Fund's annualized expense ratio used to calculate the expense estimate in the table below.
Please note that the expenses shown in the table are meant to highlight your ongoing costs only and do not reflect any transaction costs. Therefore, the second line of the table is useful in comparing ongoing costs only, and will not help you determine the relative total costs of owning different funds.
| Annualized Expense Ratio-A | Beginning Account Value August 1, 2018 | Ending Account Value January 31, 2019 | Expenses Paid During Period-B August 1, 2018 to January 31, 2019 | |
| Fidelity Series All-Sector Equity Fund | -%-C | |||
| Actual | $1,000.00 | $951.60 | $--D | |
| Hypothetical-E | $1,000.00 | $1,025.21 | $--D | |
| Fidelity Series Stock Selector Large Cap Value Fund | -%-C | |||
| Actual | $1,000.00 | $968.30 | $--D | |
| Hypothetical-E | $1,000.00 | $1,025.21 | $--D | |
| Fidelity Series Value Discovery Fund | .01% | |||
| Actual | $1,000.00 | $961.70 | $.05 | |
| Hypothetical-E | $1,000.00 | $1,025.16 | $.05 | |
A Annualized expense ratio reflects expenses net of applicable fee waivers.
B Expenses are equal to the Fund's annualized expense ratio, multiplied by the average account value over the period, multiplied by 184/ 365 (to reflect the one-half year period).
C Amount represents less than .005%.
D Amount represents less than $.005.
E 5% return per year before expenses
Distributions (Unaudited)
The Board of Trustees of each fund voted to pay to shareholders of record at the opening of business on record date, the following distributions per share derived from capital gains realized from sales of portfolio securities, and dividends derived from net investment income:
| Pay Date | Record Date | Dividends | Capital Gains | |
| Fidelity Series All-Sector Equity Fund | 03/11/19 | 03/08/19 | $0.000 | $0.110 |
| Fidelity Series Stock Selector Large Cap Value Fund | 03/11/19 | 03/08/19 | $0.011 | $0.077 |
| Fidelity Series Value Discovery Fund | 03/11/19 | 03/08/19 | $0.000 | $0.000 |
The funds hereby designate as capital gain dividend the amounts noted below for the taxable year ended January 31, 2019, or, if subsequently determined to be different, the net capital gain of such year.
| Fidelity Series All-Sector Equity Fund | $1,100,299,257 |
| Fidelity Series Stock Selector Large Cap Value Fund | $678,353,829 |
| Fidelity Series Value Discovery Fund | $295,633,024 |
The Fidelity Advisor Series Stock Selector Large Cap Value Fund hereby designates as a capital gain dividend with respect to the taxable year ended September 14, 2018, $76,241,369, or, if subsequently determined to be different, the net capital gain of such year.
The Fidelity Advisor Series Equity Value Fund hereby designates as a capital gain dividend with respect to the taxable year ended September 21, 2018, $18,870,447, or, if subsequently determined to be different, the net capital gain of such year.
A percentage of the dividends distributed during the fiscal year for the following funds qualify for the dividends–received deduction for corporate shareholders:
| Fidelity Series All-Sector Equity Fund | |
| March, 2018 | 10% |
| December, 2018 | 100% |
| Fidelity Series Stock Selector Large Cap Value Fund | |
| March, 2018 | 99% |
| December, 2018 | 79% |
| Fidelity Advisor Series Stock Selector Large Cap Value Fund | |
| March, 2018 | 99% |
| September, 2018 | 64% |
| Fidelity Series Value Discovery Fund | |
| March, 2018 | 64% |
| December, 2018 | 64% |
| Fidelity Advisor Series Equity Value Fund | |
| March, 2018 | 55% |
| September, 2018 | 81% |
A percentage of the dividends distributed during the fiscal year for the following funds may be taken into account as a dividend for purposes of the maximum rate under section 1(h)(11) of the Internal Revenue Code.
| Fidelity Series All-Sector Equity Fund | |
| March, 2018 | 11% |
| December, 2018 | 100% |
| Fidelity Series Stock Selector Large Cap Value Fund | |
| March, 2018 | 100% |
| December, 2018 | 87% |
| Fidelity Advisor Series Stock Selector Large Cap Value Fund | |
| March, 2018 | 100% |
| September, 2018 | 69% |
| Fidelity Series Value Discovery Fund | |
| March, 2018 | 86% |
| December, 2018 | 86% |
| Fidelity Advisor Series Equity Value Fund | |
| March, 2018 | 52% |
| September, 2018 | 82% |
The funds will notify shareholders in January 2020 of amounts for use in preparing 2019 income tax returns.
Board Approval of Investment Advisory Contracts and Management Fees
Fidelity Series All-Sector Equity Fund
Fidelity Series Value Discovery Fund
Fidelity Series Stock Selector Large Cap Value Fund
Each year, the Board of Trustees, including the Independent Trustees (together, the Board), votes on the renewal of the management contract with Fidelity Management & Research Company (FMR) and the sub-advisory agreements (together, the Advisory Contracts) for each fund. FMR and the sub-advisers are referred to herein as the Investment Advisers. The Board, assisted by the advice of fund counsel and Independent Trustees' counsel, requests and considers a broad range of information relevant to the renewal of the Advisory Contracts throughout the year.
The Board meets regularly and, at each of its meetings, covers an extensive agenda of topics and materials and considers factors that are relevant to its annual consideration of the renewal of each fund's Advisory Contracts, including the services and support provided to each fund and its shareholders. The Board has established various standing committees (Committees), each composed of and chaired by Independent Trustees with varying backgrounds, to which the Board has assigned specific subject matter responsibilities in order to enhance effective decision-making by the Board. The Board, acting directly and through its Committees, requests and receives information concerning the annual consideration of the renewal of each fund's Advisory Contracts. The Board also meets as needed to review matters specifically related to the Board's annual consideration of the renewal of the Advisory Contracts. Members of the Board may also meet with trustees of other Fidelity funds through joint ad hoc committees to discuss certain matters relevant to all of the Fidelity funds.
At its January 2019 meeting, the Board unanimously determined to renew each fund's Advisory Contracts. In considering whether to renew the Advisory Contracts for each fund, the Board considered all factors it believed relevant and reached a determination, with the assistance of fund counsel and Independent Trustees' counsel and through the exercise of its business judgment, that the renewal of the Advisory Contracts was in the best interests of each fund and its shareholders and the fact that no fee is payable under the management contracts was fair and reasonable.
Nature, Extent, and Quality of Services Provided. The Board considered Fidelity's staffing as it relates to the funds, including the backgrounds of investment personnel of Fidelity, and also considered the funds' investment objectives, strategies, and related investment philosophies. The Independent Trustees also had discussions with senior management of Fidelity's investment operations and investment groups. The Board considered the structure of the investment personnel compensation program and whether this structure provides appropriate incentives to act in the best interests of each fund.Resources Dedicated to Investment Management and Support Services. The Board and the Fund Oversight and Research Committees reviewed the general qualifications and capabilities of Fidelity's investment staff, including its size, education, experience, and resources, as well as Fidelity's approach to recruiting, training, managing, and compensating investment personnel. The Board noted that Fidelity has continued to increase the resources devoted to non-U.S. offices, including expansion of Fidelity's global investment organization. The Board also noted that Fidelity's analysts have extensive resources, tools and capabilities that allow them to conduct sophisticated quantitative and fundamental analysis, as well as credit analysis of issuers, counterparties and guarantors. Further, the Board considered that Fidelity's investment professionals have sufficient access to global information and data so as to provide competitive investment results over time, and that those professionals also have access to sophisticated tools that permit them to assess portfolio construction and risk and performance attribution characteristics continuously, as well as to transmit new information and research conclusions rapidly around the world. Additionally, in its deliberations, the Board considered Fidelity's trading, risk management, compliance, and technology and operations capabilities and resources, which are integral parts of the investment management process.Administrative Services. The Board considered (i) the nature, extent, quality, and cost of advisory and administrative services performed by the Investment Advisers and their affiliates under the Advisory Contracts and under separate agreements covering transfer agency, pricing and bookkeeping, and securities lending services for each fund; (ii) the nature and extent of the supervision of third party service providers, principally custodians, subcustodians, and pricing vendors; and (iii) the resources devoted to, and the record of compliance with, each fund's compliance policies and procedures. The Board also reviewed the allocation of fund brokerage, including allocations to brokers affiliated with the Investment Advisers, the use of brokerage commissions to pay fund expenses, and the use of "soft" commission dollars to pay for research services.Investment Performance. The Board considered whether each fund has operated in accordance with its investment objective, as well as its record of compliance with its investment restrictions. The Board reviewed each fund's absolute investment performance, as well as each fund's relative investment performance, but did not consider performance to be a material factor in its decision to renew each fund's Advisory Contracts, as the funds are not publicly offered as stand-alone investment products. In this regard, the Board noted that each fund is designed to offer an investment option for other investment companies managed by Fidelity and ultimately to enhance the performance of those investment companies.Based on its review, the Board concluded that the nature, extent, and quality of services provided to each fund under the Advisory Contracts should continue to benefit the shareholders of each fund.Competitiveness of Management Fee and Total Expense Ratio. The Board considered that each fund does not pay FMR a management fee for investment advisory services. The Board also noted that FMR or an affiliate undertakes to pay all operating expenses of each fund with certain exceptions.In connection with the renewal of the Advisory Contracts, the Board also approved amendments to the management contract for each fund to clarify that the fund pays its non-operating expenses, including brokerage commissions and fees and expenses associated with the fund's securities lending program. The Board considered that the amendments would not change the services provided to the funds or the party responsible for making such payments under the current management contracts.The Board further considered that FMR has contractually agreed to reimburse each fund to the extent that total operating expenses, with certain exceptions, as a percentage of its average net assets, exceed 0.014% through March 31, 2021.Based on its review, the Board considered that each fund does not pay a management fee and concluded that the total expense ratio of each class of each fund was reasonable in light of the services that the fund and its shareholders receive and the other factors considered.Costs of the Services and Profitability. The Board considered the level of Fidelity's profits in respect of all the Fidelity funds.PricewaterhouseCoopers LLP (PwC), auditor to Fidelity and certain Fidelity funds, has been engaged annually by the Board as part of the Board's assessment of Fidelity's profitability analysis. PwC's engagement includes the review and assessment of the methodologies used by Fidelity in determining the revenues and expenses attributable to Fidelity's mutual fund business, and completion of agreed-upon procedures in respect of the mathematical accuracy of the fund profitability information and its conformity to established allocation methodologies. After considering PwC's reports issued under the engagement and information provided by Fidelity, the Board concluded that while other allocation methods may also be reasonable, Fidelity's profitability methodologies are reasonable in all material respects.The Board also reviewed Fidelity's non-fund businesses and potential indirect benefits such businesses may have received as a result of their association with Fidelity's mutual fund business (i.e., fall-out benefits) as well as cases where Fidelity's affiliates may benefit from the funds' business. The Board noted that changes to fall-out benefits year-over-year reflect business developments at Fidelity's various businesses.The Board concluded that the costs of the services provided by and the profits realized by Fidelity in connection with the operation of each fund were not relevant to the renewal of the Advisory Contracts because each fund pays no advisory fees and FMR or an affiliate bears all expenses of each fund with certain exceptions.Economies of Scale. The Board concluded that because each fund pays no advisory fees and FMR or an affiliate bears all expenses of each fund with certain exceptions, the realization of economies of scale was not a material factor in the Board's decision to renew each fund's Advisory Contracts.Additional Information Requested by the Board. In order to develop fully the factual basis for consideration of the Fidelity funds' advisory contracts, the Board requested and received additional information on certain topics, including: (i) fund performance trends, in particular the underperformance of certain funds, and Fidelity's long-term strategies for certain funds; (ii) Fidelity's fund profitability methodology, profitability trends for certain funds, and the impact of certain factors on fund profitability results; (iii) metrics for evaluating index fund and ETF performance and information about ETF trading characteristics; (iv) the methodology with respect to the evaluation of competitive fund data and peer group classifications and fee comparisons; (v) the expense structures for different funds and classes; (vi) information regarding other accounts managed by Fidelity, including collective investment trusts; and (vii) Fidelity's philosophies and strategies for evaluating funds and classes with lower or declining asset levels.Based on its evaluation of all of the conclusions noted above, and after considering all factors it believed relevant, the Board concluded that the advisory fee arrangements are fair and reasonable, and that each fund's Advisory Contracts should be renewed.![]()
EDT-LDT-ANN-0319
1.956971.106
Fidelity® Stock Selector Large Cap Value Fund Annual Report January 31, 2019 Includes Fidelity and Fidelity Advisor share classes |
|
Beginning on January 1, 2021, as permitted by regulations adopted by the Securities and Exchange Commission, paper copies of a fund’s shareholder reports will no longer be sent by mail, unless you specifically request paper copies of the reports from the fund or from your financial intermediary, such as a financial advisor, broker-dealer or bank. Instead, the reports will be made available on a website, and you will be notified by mail each time a report is posted and provided with a website link to access the report.
If you already elected to receive shareholder reports electronically, you will not be affected by this change and you need not take any action. You may elect to receive shareholder reports and other communications from a fund electronically, by contacting your financial intermediary. For Fidelity customers, visit Fidelity's web site or call Fidelity using the contact information listed below.
You may elect to receive all future reports in paper free of charge. If you wish to continue receiving paper copies of your shareholder reports, you may contact your financial intermediary or, if you are a Fidelity customer, visit Fidelity’s website, or call Fidelity at the applicable toll-free number listed below. Your election to receive reports in paper will apply to all funds held with the fund complex/your financial intermediary.
| Account Type | Website | Phone Number |
| Brokerage, Mutual Fund, or Annuity Contracts: | fidelity.com/mailpreferences | 1-800-343-3548 |
| Employer Provided Retirement Accounts: | netbenefits.fidelity.com/preferences (choose 'no' under Required Disclosures to continue to print) | 1-800-343-0860 |
| Advisor Sold Accounts Serviced Through Your Financial Intermediary: | Contact Your Financial Intermediary | Your Financial Intermediary's phone number |
| Advisor Sold Accounts Serviced by Fidelity: | institutional.fidelity.com | 1-877-208-0098 |
Contents
Board Approval of Investment Advisory Contracts and Management Fees |
To view a fund's proxy voting guidelines and proxy voting record for the 12-month period ended June 30, visit http://www.fidelity.com/proxyvotingresults or visit the Securities and Exchange Commission's (SEC) web site at http://www.sec.gov.
You may also call 1-800-544-8544 if you’re an individual investing directly with Fidelity, call 1-800-835-5092 if you’re a plan sponsor or participant with Fidelity as your recordkeeper or call 1-877-208-0098 on institutional accounts or if you’re an advisor or invest through one to request a free copy of the proxy voting guidelines.
Standard & Poor's, S&P and S&P 500 are registered service marks of The McGraw-Hill Companies, Inc. and have been licensed for use by Fidelity Distributors Corporation.
Other third-party marks appearing herein are the property of their respective owners.
All other marks appearing herein are registered or unregistered trademarks or service marks of FMR LLC or an affiliated company. © 2019 FMR LLC. All rights reserved.
This report and the financial statements contained herein are submitted for the general information of the shareholders of the Fund. This report is not authorized for distribution to prospective investors in the Fund unless preceded or accompanied by an effective prospectus.
A fund files its complete schedule of portfolio holdings with the SEC for the first and third quarters of each fiscal year on Form N-Q. Forms N-Q are available on the SEC’s web site at http://www.sec.gov. A fund's Forms N-Q may be reviewed and copied at the SEC’s Public Reference Room in Washington, DC. Information regarding the operation of the SEC's Public Reference Room may be obtained by calling 1-800-SEC-0330.
For a complete list of a fund's portfolio holdings, view the most recent holdings listing, semiannual report, or annual report on Fidelity's web site at http://www.fidelity.com, http://www.institutional.fidelity.com, or http://www.401k.com, as applicable.
NOT FDIC INSURED •MAY LOSE VALUE •NO BANK GUARANTEE
Neither the Fund nor Fidelity Distributors Corporation is a bank.
Performance: The Bottom Line
Average annual total return reflects the change in the value of an investment, assuming reinvestment of distributions from dividend income and capital gains (the profits earned upon the sale of securities that have grown in value, if any) and assuming a constant rate of performance each year. The hypothetical investment and the average annual total returns do not reflect the deduction of taxes that a shareholder would pay on fund distributions or the redemption of fund shares. During periods of reimbursement by Fidelity, a fund’s total return will be greater than it would be had the reimbursement not occurred. How a fund did yesterday is no guarantee of how it will do tomorrow.
Average Annual Total Returns
| For the periods ended January 31, 2019 | Past 1 year | Past 5 years | Past 10 years |
| Class A (incl. 5.75% sales charge) | (10.90)% | 5.92% | 10.83% |
| Class M (incl. 3.50% sales charge) | (9.08)% | 6.08% | 10.74% |
| Class C (incl. contingent deferred sales charge) | (7.14)% | 6.30% | 10.61% |
| Fidelity® Stock Selector Large Cap Value Fund | (5.20)% | 7.49% | 11.81% |
| Class I | (5.20)% | 7.46% | 11.78% |
| Class Z | (5.04)% | 7.53% | 11.82% |
Class C shares' contingent deferred sales charges included in the past one year, past five years and past ten years total return figures are 1%, 0% and 0%, respectively.
The initial offering of Class Z shares took place on February 1, 2017. Returns prior to February 1, 2017, are those of Class I.
$10,000 Over 10 Years
Let's say hypothetically that $10,000 was invested in Fidelity® Stock Selector Large Cap Value Fund, a class of the fund, on January 31, 2009.
The chart shows how the value of your investment would have changed, and also shows how the Russell 1000® Value Index performed over the same period.
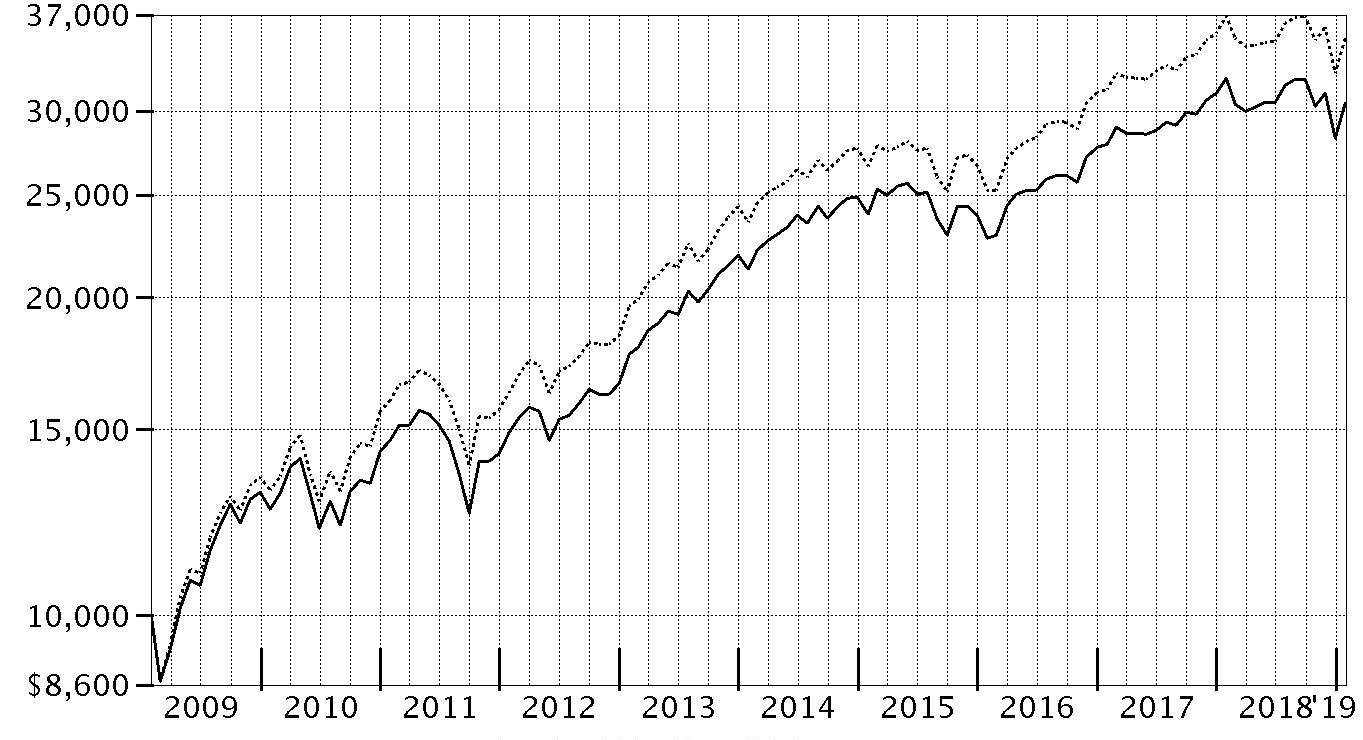
| Period Ending Values | ||
| $30,543 | Fidelity® Stock Selector Large Cap Value Fund | |
| $35,140 | Russell 1000® Value Index | |
Management's Discussion of Fund Performance
Market Recap: The S&P 500® index returned -2.31% for the 12 months ending January 31, 2019, as the U.S. equity bellwether began the new year on a high note after enduring a final quarter of 2018 in which resurgent volatility upset the aging bull market. In October, rising U.S. Treasury yields and concern about peaking corporate earnings growth sent many investors fleeing from risk assets as they were still dealing with lingering uncertainty related to global trade and the U.S. Federal Reserve picking up the pace of interest rate hikes. The index returned -6.84% in October, at the time its largest monthly drop in seven years. But conditions worsened through Christmas, as jitters about the economy and another hike in rates led to a spike in market volatility and a -9.03% result for December. Sharply reversing course to begin 2019, the S&P 500® gained 8.01% in January, its strongest opening month since 1987, amid upbeat company earnings/outlooks and signs the Fed may pause on rates. For the full period, some economically sensitive sectors were at the bottom of the 12-month performance scale: materials (-14%), energy (-12%), financials (-11%) and industrials (-8%). Meanwhile, communication services – which includes dividend-rich telecom stocks – and consumer staples returned about -5%. In contrast, the defensive utilities (+11%), real estate (+10%) and health care (+5%) sectors led the way.Comments from Lead Portfolio Manager Matthew Friedman: For the fiscal year, the fund's share classes posted returns roughly within a range of -5% to -6% (excluding sales charges, if applicable), trailing the -4.81% return of the benchmark Russell 1000® Value Index. Versus the benchmark, security selection detracted, especially in the financials sector. Conversely, choices within information technology added value. An overweighting, on average, in flooring manufacturer Mohawk Industries (-57%) detracted more than any other fund position for the period, reflecting higher costs that led to disappointing earnings. We sold our stake in Mohawk by period end. An overweighting in insurance company American International Group (-30%) also hurt versus the benchmark. On the positive side, shares of integrated energy company ConocoPhillips (+18%) added value. Also in energy, the fund’s stake in Andeavor contributed, as shares gained due to this company’s merger with Marathon Petroleum, completed in October. As a result of the merger, the fund did not hold Andeavor as of January 31.The views expressed above reflect those of the portfolio manager(s) only through the end of the period as stated on the cover of this report and do not necessarily represent the views of Fidelity or any other person in the Fidelity organization. Any such views are subject to change at any time based upon market or other conditions and Fidelity disclaims any responsibility to update such views. These views may not be relied on as investment advice and, because investment decisions for a Fidelity fund are based on numerous factors, may not be relied on as an indication of trading intent on behalf of any Fidelity fund.
Notes to shareholders: On June 11, 2018, Pierre Sorel assumed management responsibility of the financials and real estate sleeves, succeeding Justin Bennett, who moved into a new role. On March 31, 2018, Kathy Buck retired from portfolio management, leaving Laurie Mundt the sole manager of the consumer staples sleeve and Chip Perrone as the sole manager of the consumer discretionary sleeve.Investment Summary (Unaudited)
Top Ten Stocks as of January 31, 2019
| % of fund's net assets | |
| Bank of America Corp. | 2.8 |
| Wells Fargo & Co. | 2.5 |
| Johnson & Johnson | 2.4 |
| Verizon Communications, Inc. | 2.4 |
| Capital One Financial Corp. | 2.3 |
| Comcast Corp. Class A | 2.2 |
| Citigroup, Inc. | 2.0 |
| Pfizer, Inc. | 1.9 |
| Procter & Gamble Co. | 1.9 |
| Suncor Energy, Inc. | 1.7 |
| 22.1 |
Top Five Market Sectors as of January 31, 2019
| % of fund's net assets | |
| Financials | 21.4 |
| Health Care | 14.0 |
| Information Technology | 9.4 |
| Energy | 9.4 |
| Industrials | 7.9 |
Asset Allocation (% of fund's net assets)
| As of January 31, 2019* | ||
| Stocks | 96.4% | |
| Short-Term Investments and Net Other Assets (Liabilities) | 3.6% | |

* Foreign investments - 12.8%
Schedule of Investments January 31, 2019
Showing Percentage of Net Assets
| Common Stocks - 96.4% | |||
| Shares | Value | ||
| COMMUNICATION SERVICES - 7.2% | |||
| Diversified Telecommunication Services - 2.4% | |||
| Verizon Communications, Inc. | 409,763 | $22,561,551 | |
| Entertainment - 1.3% | |||
| Cinemark Holdings, Inc. | 65,300 | 2,672,076 | |
| The Walt Disney Co. | 88,385 | 9,856,695 | |
| 12,528,771 | |||
| Interactive Media & Services - 0.5% | |||
| Alphabet, Inc. Class A (a) | 4,038 | 4,546,344 | |
| Media - 3.0% | |||
| Comcast Corp. Class A | 575,948 | 21,062,418 | |
| Interpublic Group of Companies, Inc. | 152,279 | 3,464,347 | |
| Omnicom Group, Inc. | 48,085 | 3,744,860 | |
| 28,271,625 | |||
| TOTAL COMMUNICATION SERVICES | 67,908,291 | ||
| CONSUMER DISCRETIONARY - 5.7% | |||
| Auto Components - 0.6% | |||
| Aptiv PLC | 71,900 | 5,689,447 | |
| Hotels, Restaurants & Leisure - 2.6% | |||
| McDonald's Corp. | 85,350 | 15,258,873 | |
| Royal Caribbean Cruises Ltd. | 80,560 | 9,671,228 | |
| 24,930,101 | |||
| Household Durables - 0.6% | |||
| Lennar Corp. Class A | 127,300 | 6,036,566 | |
| Multiline Retail - 0.6% | |||
| Dollar Tree, Inc. (a) | 64,310 | 6,227,137 | |
| Specialty Retail - 0.7% | |||
| Burlington Stores, Inc. (a) | 36,551 | 6,276,172 | |
| Textiles, Apparel & Luxury Goods - 0.6% | |||
| Tapestry, Inc. | 137,600 | 5,326,496 | |
| TOTAL CONSUMER DISCRETIONARY | 54,485,919 | ||
| CONSUMER STAPLES - 6.9% | |||
| Beverages - 0.4% | |||
| PepsiCo, Inc. | 10,600 | 1,194,302 | |
| The Coca-Cola Co. | 59,700 | 2,873,361 | |
| 4,067,663 | |||
| Food & Staples Retailing - 1.7% | |||
| Kroger Co. | 64,500 | 1,827,285 | |
| Walgreens Boots Alliance, Inc. | 60,400 | 4,364,504 | |
| Walmart, Inc. | 105,045 | 10,066,462 | |
| 16,258,251 | |||
| Food Products - 1.6% | |||
| Archer Daniels Midland Co. | 16,200 | 727,380 | |
| Bunge Ltd. | 7,100 | 390,997 | |
| Conagra Brands, Inc. | 124,100 | 2,685,524 | |
| McCormick & Co., Inc. (non-vtg.) | 8,000 | 989,120 | |
| Mondelez International, Inc. | 128,600 | 5,949,036 | |
| The Kraft Heinz Co. | 70,100 | 3,369,006 | |
| Tyson Foods, Inc. Class A | 21,800 | 1,349,856 | |
| 15,460,919 | |||
| Household Products - 2.2% | |||
| Colgate-Palmolive Co. | 37,200 | 2,406,096 | |
| Kimberly-Clark Corp. | 3,200 | 356,416 | |
| Procter & Gamble Co. | 183,980 | 17,748,551 | |
| 20,511,063 | |||
| Tobacco - 1.0% | |||
| Altria Group, Inc. | 7,500 | 370,125 | |
| Philip Morris International, Inc. | 120,500 | 9,244,760 | |
| 9,614,885 | |||
| TOTAL CONSUMER STAPLES | 65,912,781 | ||
| ENERGY - 9.4% | |||
| Energy Equipment & Services - 0.8% | |||
| Baker Hughes, a GE Co. Class A | 334,500 | 7,884,165 | |
| Oil, Gas & Consumable Fuels - 8.6% | |||
| Anadarko Petroleum Corp. | 141,400 | 6,692,462 | |
| BP PLC sponsored ADR | 254,104 | 10,448,756 | |
| Cenovus Energy, Inc. (Canada) | 918,600 | 7,172,903 | |
| Cheniere Energy, Inc. (a) | 163,900 | 10,760,035 | |
| ConocoPhillips Co. | 225,600 | 15,270,864 | |
| Noble Energy, Inc. | 231,700 | 5,176,178 | |
| Suncor Energy, Inc. | 491,900 | 15,865,689 | |
| Valero Energy Corp. | 113,000 | 9,923,660 | |
| 81,310,547 | |||
| TOTAL ENERGY | 89,194,712 | ||
| FINANCIALS - 21.4% | |||
| Banks - 10.7% | |||
| Bank of America Corp. | 918,600 | 26,152,544 | |
| Citigroup, Inc. | 300,200 | 19,350,892 | |
| First Horizon National Corp. | 449,200 | 6,594,256 | |
| Huntington Bancshares, Inc. | 801,200 | 10,607,888 | |
| KeyCorp | 409,600 | 6,746,112 | |
| U.S. Bancorp | 171,500 | 8,773,940 | |
| Wells Fargo & Co. | 476,800 | 23,320,288 | |
| 101,545,920 | |||
| Capital Markets - 2.5% | |||
| Bank of New York Mellon Corp. | 210,600 | 11,018,592 | |
| Cboe Global Markets, Inc. | 33,400 | 3,115,218 | |
| E*TRADE Financial Corp. | 155,900 | 7,274,294 | |
| Goldman Sachs Group, Inc. | 14,500 | 2,871,145 | |
| 24,279,249 | |||
| Consumer Finance - 3.0% | |||
| Capital One Financial Corp. | 266,400 | 21,469,176 | |
| Discover Financial Services | 46,700 | 3,151,783 | |
| SLM Corp. | 339,100 | 3,631,761 | |
| 28,252,720 | |||
| Diversified Financial Services - 1.4% | |||
| Berkshire Hathaway, Inc. Class B (a) | 63,357 | 13,022,398 | |
| Insurance - 3.8% | |||
| American International Group, Inc. | 227,400 | 9,830,502 | |
| Hartford Financial Services Group, Inc. | 66,100 | 3,101,412 | |
| MetLife, Inc. | 209,400 | 9,563,298 | |
| The Travelers Companies, Inc. | 37,900 | 4,757,966 | |
| Willis Group Holdings PLC | 56,800 | 9,246,472 | |
| 36,499,650 | |||
| TOTAL FINANCIALS | 203,599,937 | ||
| HEALTH CARE - 14.0% | |||
| Biotechnology - 0.1% | |||
| Amgen, Inc. | 2,700 | 505,197 | |
| Health Care Equipment & Supplies - 3.8% | |||
| Abbott Laboratories | 133,000 | 9,706,340 | |
| Baxter International, Inc. | 35,800 | 2,595,142 | |
| Becton, Dickinson & Co. | 27,800 | 6,934,988 | |
| Boston Scientific Corp. (a) | 48,300 | 1,842,645 | |
| Danaher Corp. | 52,100 | 5,778,932 | |
| Medtronic PLC | 105,520 | 9,326,913 | |
| 36,184,960 | |||
| Health Care Providers & Services - 2.2% | |||
| Anthem, Inc. | 20,200 | 6,120,600 | |
| Cigna Corp. | 30,732 | 6,140,561 | |
| CVS Health Corp. | 83,134 | 5,449,434 | |
| HCA Holdings, Inc. | 8,600 | 1,199,098 | |
| McKesson Corp. | 11,200 | 1,436,400 | |
| 20,346,093 | |||
| Life Sciences Tools & Services - 0.9% | |||
| Thermo Fisher Scientific, Inc. | 36,100 | 8,868,687 | |
| Pharmaceuticals - 7.0% | |||
| Allergan PLC | 36,000 | 5,183,280 | |
| Bristol-Myers Squibb Co. | 62,000 | 3,060,940 | |
| Jazz Pharmaceuticals PLC (a) | 32,198 | 4,053,406 | |
| Johnson & Johnson | 169,985 | 22,621,604 | |
| Merck & Co., Inc. | 188,659 | 14,041,889 | |
| Pfizer, Inc. | 420,371 | 17,844,749 | |
| 66,805,868 | |||
| TOTAL HEALTH CARE | 132,710,805 | ||
| INDUSTRIALS - 7.9% | |||
| Aerospace & Defense - 1.4% | |||
| General Dynamics Corp. | 10,944 | 1,873,284 | |
| United Technologies Corp. | 94,096 | 11,109,915 | |
| 12,983,199 | |||
| Airlines - 0.6% | |||
| American Airlines Group, Inc. | 158,918 | 5,684,497 | |
| Construction & Engineering - 0.8% | |||
| AECOM (a) | 233,230 | 7,139,170 | |
| Electrical Equipment - 0.6% | |||
| Sensata Technologies, Inc. PLC (a) | 120,486 | 5,723,085 | |
| Industrial Conglomerates - 1.2% | |||
| General Electric Co. | 994,652 | 10,105,664 | |
| Honeywell International, Inc. | 11,016 | 1,582,228 | |
| 11,687,892 | |||
| Machinery - 0.4% | |||
| WABCO Holdings, Inc. (a) | 32,500 | 3,712,475 | |
| Marine - 0.4% | |||
| A.P. Moller - Maersk A/S Series B | 3,174 | 4,244,864 | |
| Professional Services - 0.7% | |||
| Nielsen Holdings PLC | 259,600 | 6,666,528 | |
| Road & Rail - 1.1% | |||
| Norfolk Southern Corp. | 59,858 | 10,040,581 | |
| Trading Companies & Distributors - 0.7% | |||
| HD Supply Holdings, Inc. (a) | 168,699 | 7,075,236 | |
| TOTAL INDUSTRIALS | 74,957,527 | ||
| INFORMATION TECHNOLOGY - 9.4% | |||
| Communications Equipment - 1.3% | |||
| Cisco Systems, Inc. | 258,700 | 12,233,923 | |
| Electronic Equipment & Components - 0.6% | |||
| TE Connectivity Ltd. | 67,400 | 5,456,030 | |
| IT Services - 3.1% | |||
| Amdocs Ltd. | 233,750 | 13,061,950 | |
| Cognizant Technology Solutions Corp. Class A | 97,000 | 6,758,960 | |
| Conduent, Inc. (a) | 212,900 | 2,714,475 | |
| IBM Corp. | 54,300 | 7,299,006 | |
| 29,834,391 | |||
| Semiconductors & Semiconductor Equipment - 3.0% | |||
| Analog Devices, Inc. | 31,200 | 3,084,432 | |
| Broadcom, Inc. | 24,700 | 6,625,775 | |
| Intel Corp. | 152,000 | 7,162,240 | |
| NXP Semiconductors NV | 101,100 | 8,798,733 | |
| Qualcomm, Inc. | 50,200 | 2,485,904 | |
| 28,157,084 | |||
| Software - 1.2% | |||
| Microsoft Corp. | 37,200 | 3,884,796 | |
| Oracle Corp. | 23,400 | 1,175,382 | |
| SS&C Technologies Holdings, Inc. | 126,300 | 6,503,187 | |
| 11,563,365 | |||
| Technology Hardware, Storage & Peripherals - 0.2% | |||
| Western Digital Corp. | 52,000 | 2,339,480 | |
| TOTAL INFORMATION TECHNOLOGY | 89,584,273 | ||
| MATERIALS - 3.6% | |||
| Chemicals - 2.8% | |||
| DowDuPont, Inc. | 267,543 | 14,396,489 | |
| LyondellBasell Industries NV Class A | 38,400 | 3,339,648 | |
| Nutrien Ltd. | 100,500 | 5,206,465 | |
| Westlake Chemical Corp. | 51,900 | 3,835,410 | |
| 26,778,012 | |||
| Construction Materials - 0.3% | |||
| Eagle Materials, Inc. | 36,900 | 2,619,900 | |
| Containers & Packaging - 0.5% | |||
| Crown Holdings, Inc. (a) | 90,200 | 4,600,200 | |
| TOTAL MATERIALS | 33,998,112 | ||
| REAL ESTATE - 4.8% | |||
| Equity Real Estate Investment Trusts (REITs) - 4.4% | |||
| American Tower Corp. | 29,100 | 5,029,644 | |
| Boston Properties, Inc. | 50,800 | 6,698,996 | |
| Colony Capital, Inc. | 162,844 | 988,463 | |
| Corporate Office Properties Trust (SBI) | 89,800 | 2,217,162 | |
| DDR Corp. | 118,900 | 1,554,023 | |
| Essex Property Trust, Inc. | 14,900 | 4,040,880 | |
| Prologis, Inc. | 98,500 | 6,812,260 | |
| Public Storage | 19,100 | 4,059,132 | |
| Spirit Realty Capital, Inc. | 32,020 | 1,271,834 | |
| Store Capital Corp. | 67,718 | 2,188,646 | |
| The Macerich Co. | 23,434 | 1,081,713 | |
| Welltower, Inc. | 74,600 | 5,780,754 | |
| 41,723,507 | |||
| Real Estate Management & Development - 0.4% | |||
| Cushman & Wakefield PLC | 120,700 | 2,080,868 | |
| VICI Properties, Inc. | 100,100 | 2,155,153 | |
| 4,236,021 | |||
| TOTAL REAL ESTATE | 45,959,528 | ||
| UTILITIES - 6.1% | |||
| Electric Utilities - 4.4% | |||
| Edison International | 60,200 | 3,429,594 | |
| Evergy, Inc. | 157,900 | 9,050,828 | |
| NextEra Energy, Inc. | 71,810 | 12,852,554 | |
| PPL Corp. | 279,800 | 8,763,336 | |
| Vistra Energy Corp. (a) | 307,500 | 7,721,325 | |
| 41,817,637 | |||
| Independent Power and Renewable Electricity Producers - 0.3% | |||
| NRG Energy, Inc. | 62,100 | 2,540,511 | |
| Multi-Utilities - 1.4% | |||
| Ameren Corp. | 92,100 | 6,386,214 | |
| Sempra Energy | 57,750 | 6,755,595 | |
| 13,141,809 | |||
| TOTAL UTILITIES | 57,499,957 | ||
| TOTAL COMMON STOCKS | |||
| (Cost $914,807,160) | 915,811,842 | ||
| Principal Amount | Value | ||
| U.S. Treasury Obligations - 0.1% | |||
| U.S. Treasury Bills, yield at date of purchase 2.36% to 2.38% 4/4/19 to 5/2/19 (b) | |||
| (Cost $427,564) | 430,000 | 427,564 | |
| Shares | Value | ||
| Money Market Funds - 5.1% | |||
| Fidelity Cash Central Fund, 2.43% (c) | |||
| (Cost $48,397,509) | 48,388,061 | 48,397,739 | |
| TOTAL INVESTMENT IN SECURITIES - 101.6% | |||
| (Cost $963,632,233) | 964,637,145 | ||
| NET OTHER ASSETS (LIABILITIES) - (1.6)% | (14,759,579) | ||
| NET ASSETS - 100% | $949,877,566 |
Legend
(a) Non-income producing
(b) Security or a portion of the security was pledged to cover margin requirements for futures contracts. At period end, the value of securities pledged amounted to $427,564.
(c) Affiliated fund that is generally available only to investment companies and other accounts managed by Fidelity Investments. The rate quoted is the annualized seven-day yield of the fund at period end. A complete unaudited listing of the fund's holdings as of its most recent quarter end is available upon request. In addition, each Fidelity Central Fund's financial statements, which are not covered by the Fund's Report of Independent Registered Public Accounting Firm, are available on the SEC's website or upon request.
Affiliated Central Funds
Information regarding fiscal year to date income earned by the Fund from investments in Fidelity Central Funds is as follows:
| Fund | Income earned |
| Fidelity Cash Central Fund | $772,418 |
| Fidelity Securities Lending Cash Central Fund | 20,878 |
| Total | $793,296 |
Amounts in the income column in the above table include any capital gain distributions from underlying funds, which are presented in the corresponding line-item in the Statement of Operations, if applicable.
Investment Valuation
The following is a summary of the inputs used, as of January 31, 2019, involving the Fund's assets and liabilities carried at fair value. The inputs or methodology used for valuing securities may not be an indication of the risk associated with investing in those securities. For more information on valuation inputs, and their aggregation into the levels used below, please refer to the Investment Valuation section in the accompanying Notes to Financial Statements.
| Valuation Inputs at Reporting Date: | ||||
| Description | Total | Level 1 | Level 2 | Level 3 |
| Investments in Securities: | ||||
| Equities: | ||||
| Communication Services | $67,908,291 | $67,908,291 | $-- | $-- |
| Consumer Discretionary | 54,485,919 | 54,485,919 | -- | -- |
| Consumer Staples | 65,912,781 | 65,912,781 | -- | -- |
| Energy | 89,194,712 | 89,194,712 | -- | -- |
| Financials | 203,599,937 | 203,599,937 | -- | -- |
| Health Care | 132,710,805 | 132,710,805 | -- | -- |
| Industrials | 74,957,527 | 70,712,663 | 4,244,864 | -- |
| Information Technology | 89,584,273 | 89,584,273 | -- | -- |
| Materials | 33,998,112 | 33,998,112 | -- | -- |
| Real Estate | 45,959,528 | 45,959,528 | -- | -- |
| Utilities | 57,499,957 | 57,499,957 | -- | -- |
| U.S. Government and Government Agency Obligations | 427,564 | -- | 427,564 | -- |
| Money Market Funds | 48,397,739 | 48,397,739 | -- | -- |
| Total Investments in Securities: | $964,637,145 | $959,964,717 | $4,672,428 | $-- |
Other Information
Distribution of investments by country or territory of incorporation, as a percentage of Total Net Assets, is as follows (Unaudited):
| United States of America | 87.2% |
| Canada | 3.0% |
| United Kingdom | 2.6% |
| Ireland | 1.9% |
| Bailiwick of Guernsey | 1.4% |
| Netherlands | 1.3% |
| Liberia | 1.0% |
| Others (Individually Less Than 1%) | 1.6% |
| 100.0% |
See accompanying notes which are an integral part of the financial statements.
Financial Statements
Statement of Assets and Liabilities
| January 31, 2019 | ||
| Assets | ||
| Investment in securities, at value — See accompanying schedule: Unaffiliated issuers (cost $915,234,724) | $916,239,406 | |
| Fidelity Central Funds (cost $48,397,509) | 48,397,739 | |
| Total Investment in Securities (cost $963,632,233) | $964,637,145 | |
| Cash | 113,431 | |
| Receivable for investments sold | 4,884,031 | |
| Receivable for fund shares sold | 850,728 | |
| Dividends receivable | 991,058 | |
| Distributions receivable from Fidelity Central Funds | 96,631 | |
| Receivable for daily variation margin on futures contracts | 58,663 | |
| Prepaid expenses | 1,249 | |
| Other receivables | 18,854 | |
| Total assets | 971,651,790 | |
| Liabilities | ||
| Payable for investments purchased | $6,796,114 | |
| Payable for fund shares redeemed | 14,387,560 | |
| Accrued management fee | 350,435 | |
| Distribution and service plan fees payable | 16,116 | |
| Other affiliated payables | 165,257 | |
| Other payables and accrued expenses | 58,742 | |
| Total liabilities | 21,774,224 | |
| Net Assets | $949,877,566 | |
| Net Assets consist of: | ||
| Paid in capital | $959,612,597 | |
| Total distributable earnings (loss) | (9,735,031) | |
| Net Assets | $949,877,566 | |
| Net Asset Value and Maximum Offering Price | ||
| Class A: | ||
| Net Asset Value and redemption price per share ($25,204,413 ÷ 1,340,647 shares) | $18.80 | |
| Maximum offering price per share (100/94.25 of $18.80) | $19.95 | |
| Class M: | ||
| Net Asset Value and redemption price per share ($9,541,813 ÷ 508,377 shares) | $18.77 | |
| Maximum offering price per share (100/96.50 of $18.77) | $19.45 | |
| Class C: | ||
| Net Asset Value and offering price per share ($9,812,535 ÷ 534,177 shares)(a) | $18.37 | |
| Stock Selector Large Cap Value: | ||
| Net Asset Value, offering price and redemption price per share ($806,341,768 ÷ 42,577,655 shares) | $18.94 | |
| Class I: | ||
| Net Asset Value, offering price and redemption price per share ($98,119,491 ÷ 5,213,792 shares) | $18.82 | |
| Class Z: | ||
| Net Asset Value, offering price and redemption price per share ($857,546 ÷ 45,525 shares) | $18.84 |
(a) Redemption price per share is equal to net asset value less any applicable contingent deferred sales charge.
See accompanying notes which are an integral part of the financial statements.
Statement of Operations
| Year ended January 31, 2019 | ||
| Investment Income | ||
| Dividends | $22,243,746 | |
| Interest | 9,200 | |
| Income from Fidelity Central Funds | 793,296 | |
| Total income | 23,046,242 | |
| Expenses | ||
| Management fee | ||
| Basic fee | $5,569,557 | |
| Performance adjustment | (961,866) | |
| Transfer agent fees | 1,835,257 | |
| Distribution and service plan fees | 203,726 | |
| Accounting and security lending fees | 341,368 | |
| Custodian fees and expenses | 53,618 | |
| Independent trustees' fees and expenses | 5,809 | |
| Registration fees | 88,462 | |
| Audit | 63,130 | |
| Legal | 5,318 | |
| Miscellaneous | 7,437 | |
| Total expenses before reductions | 7,211,816 | |
| Expense reductions | (113,146) | |
| Total expenses after reductions | 7,098,670 | |
| Net investment income (loss) | 15,947,572 | |
| Realized and Unrealized Gain (Loss) | ||
| Net realized gain (loss) on: | ||
| Investment securities: | ||
| Unaffiliated issuers | 48,115,563 | |
| Fidelity Central Funds | (477) | |
| Foreign currency transactions | (9,355) | |
| Futures contracts | 669,019 | |
| Total net realized gain (loss) | 48,774,750 | |
| Change in net unrealized appreciation (depreciation) on: | ||
| Investment securities: | ||
| Unaffiliated issuers | (121,646,317) | |
| Fidelity Central Funds | 966 | |
| Assets and liabilities in foreign currencies | (1,072) | |
| Futures contracts | (119,846) | |
| Total change in net unrealized appreciation (depreciation) | (121,766,269) | |
| Net gain (loss) | (72,991,519) | |
| Net increase (decrease) in net assets resulting from operations | $(57,043,947) |
See accompanying notes which are an integral part of the financial statements.
Statement of Changes in Net Assets
| Year ended January 31, 2019 | Year ended January 31, 2018 | |
| Increase (Decrease) in Net Assets | ||
| Operations | ||
| Net investment income (loss) | $15,947,572 | $15,900,448 |
| Net realized gain (loss) | 48,774,750 | 95,916,836 |
| Change in net unrealized appreciation (depreciation) | (121,766,269) | 43,245,181 |
| Net increase (decrease) in net assets resulting from operations | (57,043,947) | 155,062,465 |
| Distributions to shareholders | (62,736,837) | – |
| Distributions to shareholders from net investment income | – | (12,317,467) |
| Total distributions | (62,736,837) | (12,317,467) |
| Share transactions - net increase (decrease) | (87,164,437) | 246,522,959 |
| Total increase (decrease) in net assets | (206,945,221) | 389,267,957 |
| Net Assets | ||
| Beginning of period | 1,156,822,787 | 767,554,830 |
| End of period | $949,877,566 | $1,156,822,787 |
| Other Information | ||
| Undistributed net investment income end of period | $1,245 |
See accompanying notes which are an integral part of the financial statements.
Financial Highlights
Fidelity Stock Selector Large Cap Value Fund Class A
| Years ended January 31, | 2019 | 2018 | 2017 | 2016 | 2015 |
| Selected Per–Share Data | |||||
| Net asset value, beginning of period | $21.26 | $18.63 | $15.37 | $16.41 | $14.72 |
| Income from Investment Operations | |||||
| Net investment income (loss)A | .26 | .25B | .19 | .15 | .15 |
| Net realized and unrealized gain (loss) | (1.45) | 2.54 | 3.27 | (1.03) | 1.65 |
| Total from investment operations | (1.19) | 2.79 | 3.46 | (.88) | 1.80 |
| Distributions from net investment income | (.24) | (.16) | (.20) | (.16) | (.11) |
| Distributions from net realized gain | (1.03) | – | – | – | – |
| Total distributions | (1.27) | (.16) | (.20) | (.16) | (.11) |
| Net asset value, end of period | $18.80 | $21.26 | $18.63 | $15.37 | $16.41 |
| Total ReturnC,D | (5.46)% | 15.02% | 22.48% | (5.40)% | 12.25% |
| Ratios to Average Net AssetsE,F | |||||
| Expenses before reductions | .96% | 1.02% | 1.05% | 1.10% | 1.07% |
| Expenses net of fee waivers, if any | .96% | 1.02% | 1.05% | 1.10% | 1.07% |
| Expenses net of all reductions | .95% | 1.01% | 1.05% | 1.09% | 1.07% |
| Net investment income (loss) | 1.28% | 1.27%B | 1.10% | .90% | .94% |
| Supplemental Data | |||||
| Net assets, end of period (000 omitted) | $25,204 | $27,297 | $31,054 | $24,201 | $26,536 |
| Portfolio turnover rateG | 92% | 90% | 51% | 67% | 60% |
A Calculated based on average shares outstanding during the period.
B Net investment income per share reflects a large, non-recurring dividend which amounted to $.07 per share. Excluding this non-recurring dividend, the ratio of net investment income (loss) to average net assets would have been .90%.
C Total returns would have been lower if certain expenses had not been reduced during the applicable periods shown.
D Total returns do not include the effect of the sales charges.
E Fees and expenses of any underlying Fidelity Central Funds are not included in the Fund's expense ratio. The Fund indirectly bears its proportionate share of the expenses of any underlying Fidelity Central Funds.
F Expense ratios reflect operating expenses of the class. Expenses before reductions do not reflect amounts reimbursed by the investment adviser or reductions from brokerage service arrangements or reductions from other expense offset arrangements and do not represent the amount paid by the class during periods when reimbursements or reductions occur. Expenses net of fee waivers reflect expenses after reimbursement by the investment adviser but prior to reductions from brokerage service arrangements or other expense offset arrangements. Expenses net of all reductions represent the net expenses paid by the class.
G Amount does not include the portfolio activity of any underlying Fidelity Central Funds.
See accompanying notes which are an integral part of the financial statements.
Fidelity Stock Selector Large Cap Value Fund Class M
| Years ended January 31, | 2019 | 2018 | 2017 | 2016 | 2015 |
| Selected Per–Share Data | |||||
| Net asset value, beginning of period | $21.24 | $18.61 | $15.36 | $16.40 | $14.71 |
| Income from Investment Operations | |||||
| Net investment income (loss)A | .19 | .19B | .13 | .10 | .10 |
| Net realized and unrealized gain (loss) | (1.44) | 2.54 | 3.26 | (1.03) | 1.66 |
| Total from investment operations | (1.25) | 2.73 | 3.39 | (.93) | 1.76 |
| Distributions from net investment income | (.18) | (.10) | (.14) | (.11) | (.07) |
| Distributions from net realized gain | (1.03) | – | – | – | – |
| Total distributions | (1.22)C | (.10) | (.14) | (.11) | (.07) |
| Net asset value, end of period | $18.77 | $21.24 | $18.61 | $15.36 | $16.40 |
| Total ReturnD,E | (5.78)% | 14.70% | 22.04% | (5.71)% | 11.95% |
| Ratios to Average Net AssetsF,G | |||||
| Expenses before reductions | 1.28% | 1.34% | 1.39% | 1.42% | 1.39% |
| Expenses net of fee waivers, if any | 1.28% | 1.34% | 1.39% | 1.42% | 1.39% |
| Expenses net of all reductions | 1.27% | 1.33% | 1.39% | 1.41% | 1.39% |
| Net investment income (loss) | .96% | .95%B | .76% | .58% | .62% |
| Supplemental Data | |||||
| Net assets, end of period (000 omitted) | $9,542 | $10,615 | $10,704 | $9,515 | $10,469 |
| Portfolio turnover rateH | 92% | 90% | 51% | 67% | 60% |
A Calculated based on average shares outstanding during the period.
B Net investment income per share reflects a large, non-recurring dividend which amounted to $.07 per share. Excluding this non-recurring dividend, the ratio of net investment income (loss) to average net assets would have been .58%.
C Total distributions of $1.22 per share is comprised of distributions from net investment income of $.183 and distributions from net realized gain of $1.032 per share.
D Total returns would have been lower if certain expenses had not been reduced during the applicable periods shown.
E Total returns do not include the effect of the sales charges.
F Fees and expenses of any underlying Fidelity Central Funds are not included in the Fund's expense ratio. The Fund indirectly bears its proportionate share of the expenses of any underlying Fidelity Central Funds.
G Expense ratios reflect operating expenses of the class. Expenses before reductions do not reflect amounts reimbursed by the investment adviser or reductions from brokerage service arrangements or reductions from other expense offset arrangements and do not represent the amount paid by the class during periods when reimbursements or reductions occur. Expenses net of fee waivers reflect expenses after reimbursement by the investment adviser but prior to reductions from brokerage service arrangements or other expense offset arrangements. Expenses net of all reductions represent the net expenses paid by the class.
H Amount does not include the portfolio activity of any underlying Fidelity Central Funds.
See accompanying notes which are an integral part of the financial statements.
Fidelity Stock Selector Large Cap Value Fund Class C
| Years ended January 31, | 2019 | 2018 | 2017 | 2016 | 2015 |
| Selected Per–Share Data | |||||
| Net asset value, beginning of period | $20.81 | $18.25 | $15.09 | $16.18 | $14.53 |
| Income from Investment Operations | |||||
| Net investment income (loss)A | .09 | .08B | .05 | .01 | .02 |
| Net realized and unrealized gain (loss) | (1.42) | 2.49 | 3.18 | (1.00) | 1.63 |
| Total from investment operations | (1.33) | 2.57 | 3.23 | (.99) | 1.65 |
| Distributions from net investment income | (.08) | (.01) | (.07) | (.10) | – |
| Distributions from net realized gain | (1.03) | – | – | – | – |
| Total distributions | (1.11) | (.01) | (.07) | (.10) | – |
| Net asset value, end of period | $18.37 | $20.81 | $18.25 | $15.09 | $16.18 |
| Total ReturnC,D | (6.26)% | 14.07% | 21.43% | (6.13)% | 11.36% |
| Ratios to Average Net AssetsE,F | |||||
| Expenses before reductions | 1.80% | 1.86% | 1.88% | 1.93% | 1.89% |
| Expenses net of fee waivers, if any | 1.80% | 1.85% | 1.88% | 1.93% | 1.89% |
| Expenses net of all reductions | 1.79% | 1.85% | 1.87% | 1.93% | 1.89% |
| Net investment income (loss) | .44% | .43%B | .27% | .07% | .12% |
| Supplemental Data | |||||
| Net assets, end of period (000 omitted) | $9,813 | $10,703 | $10,802 | $8,956 | $10,118 |
| Portfolio turnover rateG | 92% | 90% | 51% | 67% | 60% |
A Calculated based on average shares outstanding during the period.
B Net investment income per share reflects a large, non-recurring dividend which amounted to $.07 per share. Excluding this non-recurring dividend, the ratio of net investment income (loss) to average net assets would have been .06%.
C Total returns would have been lower if certain expenses had not been reduced during the applicable periods shown.
D Total returns do not include the effect of the contingent deferred sales charge.
E Fees and expenses of any underlying Fidelity Central Funds are not included in the Fund's expense ratio. The Fund indirectly bears its proportionate share of the expenses of any underlying Fidelity Central Funds.
F Expense ratios reflect operating expenses of the class. Expenses before reductions do not reflect amounts reimbursed by the investment adviser or reductions from brokerage service arrangements or reductions from other expense offset arrangements and do not represent the amount paid by the class during periods when reimbursements or reductions occur. Expenses net of fee waivers reflect expenses after reimbursement by the investment adviser but prior to reductions from brokerage service arrangements or other expense offset arrangements. Expenses net of all reductions represent the net expenses paid by the class.
G Amount does not include the portfolio activity of any underlying Fidelity Central Funds.
See accompanying notes which are an integral part of the financial statements.
Fidelity Stock Selector Large Cap Value Fund
| Years ended January 31, | 2019 | 2018 | 2017 | 2016 | 2015 |
| Selected Per–Share Data | |||||
| Net asset value, beginning of period | $21.41 | $18.76 | $15.47 | $16.51 | $14.81 |
| Income from Investment Operations�� | |||||
| Net investment income (loss)A | .32 | .31B | .24 | .20 | .20 |
| Net realized and unrealized gain (loss) | (1.46) | 2.57 | 3.29 | (1.03) | 1.66 |
| Total from investment operations | (1.14) | 2.88 | 3.53 | (.83) | 1.86 |
| Distributions from net investment income | (.29) | (.23) | (.24) | (.21) | (.16) |
| Distributions from net realized gain | (1.03) | – | – | – | – |
| Total distributions | (1.33)C | (.23) | (.24) | (.21) | (.16) |
| Net asset value, end of period | $18.94 | $21.41 | $18.76 | $15.47 | $16.51 |
| Total ReturnD | (5.20)% | 15.39% | 22.82% | (5.10)% | 12.54% |
| Ratios to Average Net AssetsE,F | |||||
| Expenses before reductions | .67% | .73% | .77% | .81% | .78% |
| Expenses net of fee waivers, if any | .67% | .73% | .77% | .81% | .78% |
| Expenses net of all reductions | .66% | .72% | .76% | .80% | .78% |
| Net investment income (loss) | 1.57% | 1.56%B | 1.38% | 1.19% | 1.23% |
| Supplemental Data | |||||
| Net assets, end of period (000 omitted) | $806,342 | $989,001 | $703,722 | $644,182 | $761,542 |
| Portfolio turnover rateG | 92% | 90% | 51% | 67% | 60% |
A Calculated based on average shares outstanding during the period.
B Net investment income per share reflects a large, non-recurring dividend which amounted to $.07 per share. Excluding this non-recurring dividend, the ratio of net investment income (loss) to average net assets would have been 1.19%.
C Total distributions of $1.33 per share is comprised of distributions from net investment income of $.294 and distributions from net realized gain of $1.032 per share.
D Total returns would have been lower if certain expenses had not been reduced during the applicable periods shown.
E Fees and expenses of any underlying Fidelity Central Funds are not included in the Fund's expense ratio. The Fund indirectly bears its proportionate share of the expenses of any underlying Fidelity Central Funds.
F Expense ratios reflect operating expenses of the class. Expenses before reductions do not reflect amounts reimbursed by the investment adviser or reductions from brokerage service arrangements or reductions from other expense offset arrangements and do not represent the amount paid by the class during periods when reimbursements or reductions occur. Expenses net of fee waivers reflect expenses after reimbursement by the investment adviser but prior to reductions from brokerage service arrangements or other expense offset arrangements. Expenses net of all reductions represent the net expenses paid by the class.
G Amount does not include the portfolio activity of any underlying Fidelity Central Funds.
See accompanying notes which are an integral part of the financial statements.
Fidelity Stock Selector Large Cap Value Fund Class I
| Years ended January 31, | 2019 | 2018 | 2017 | 2016 | 2015 |
| Selected Per–Share Data | |||||
| Net asset value, beginning of period | $21.28 | $18.66 | $15.40 | $16.44 | $14.74 |
| Income from Investment Operations | |||||
| Net investment income (loss)A | .31 | .30B | .23 | .20 | .20 |
| Net realized and unrealized gain (loss) | (1.45) | 2.55 | 3.27 | (1.04) | 1.66 |
| Total from investment operations | (1.14) | 2.85 | 3.50 | (.84) | 1.86 |
| Distributions from net investment income | (.29) | (.23) | (.24) | (.20) | (.16) |
| Distributions from net realized gain | (1.03) | – | – | – | – |
| Total distributions | (1.32) | (.23) | (.24) | (.20) | (.16) |
| Net asset value, end of period | $18.82 | $21.28 | $18.66 | $15.40 | $16.44 |
| Total ReturnC | (5.20)% | 15.33% | 22.72% | (5.14)% | 12.58% |
| Ratios to Average Net AssetsD,E | |||||
| Expenses before reductions | .69% | .76% | .84% | .82% | .81% |
| Expenses net of fee waivers, if any | .69% | .76% | .84% | .82% | .81% |
| Expenses net of all reductions | .68% | .75% | .84% | .81% | .81% |
| Net investment income (loss) | 1.55% | 1.53%B | 1.30% | 1.18% | 1.20% |
| Supplemental Data | |||||
| Net assets, end of period (000 omitted) | $98,119 | $118,319 | $11,273 | $6,164 | $9,544 |
| Portfolio turnover rateF | 92% | 90% | 51% | 67% | 60% |
A Calculated based on average shares outstanding during the period.
B Net investment income per share reflects a large, non-recurring dividend which amounted to $.07 per share. Excluding this non-recurring dividend, the ratio of net investment income (loss) to average net assets would have been 1.16%.
C Total returns would have been lower if certain expenses had not been reduced during the applicable periods shown.
D Fees and expenses of any underlying Fidelity Central Funds are not included in the Fund's expense ratio. The Fund indirectly bears its proportionate share of the expenses of any underlying Fidelity Central Funds.
E Expense ratios reflect operating expenses of the class. Expenses before reductions do not reflect amounts reimbursed by the investment adviser or reductions from brokerage service arrangements or reductions from other expense offset arrangements and do not represent the amount paid by the class during periods when reimbursements or reductions occur. Expenses net of fee waivers reflect expenses after reimbursement by the investment adviser but prior to reductions from brokerage service arrangements or other expense offset arrangements. Expenses net of all reductions represent the net expenses paid by the class.
F Amount does not include the portfolio activity of any underlying Fidelity Central Funds.
See accompanying notes which are an integral part of the financial statements.
Fidelity Stock Selector Large Cap Value Fund Class Z
| Years ended January 31, | 2019 | 2018 A |
| Selected Per–Share Data | ||
| Net asset value, beginning of period | $21.30 | $18.64 |
| Income from Investment Operations | ||
| Net investment income (loss)B | .34 | .34C |
| Net realized and unrealized gain (loss) | (1.45) | 2.57 |
| Total from investment operations | (1.11) | 2.91 |
| Distributions from net investment income | (.32) | (.25) |
| Distributions from net realized gain | (1.03) | – |
| Total distributions | (1.35) | (.25) |
| Net asset value, end of period | $18.84 | $21.30 |
| Total ReturnD | (5.04)% | 15.65% |
| Ratios to Average Net AssetsE,F | ||
| Expenses before reductions | .55% | .60% |
| Expenses net of fee waivers, if any | .55% | .60% |
| Expenses net of all reductions | .54% | .59% |
| Net investment income (loss) | 1.70% | 1.68%C |
| Supplemental Data | ||
| Net assets, end of period (000 omitted) | $858 | $888 |
| Portfolio turnover rateG | 92% | 90% |
A For the period February 1, 2017 (commencement of sale of shares) to January 31, 2018.
B Calculated based on average shares outstanding during the period.
C Net investment income per share reflects a large, non-recurring dividend which amounted to $.07 per share. Excluding this non-recurring dividend, the ratio of net investment income (loss) to average net assets would have been 1.31%.
D Total returns would have been lower if certain expenses had not been reduced during the applicable periods shown.
E Fees and expenses of any underlying Fidelity Central Funds are not included in the Fund's expense ratio. The Fund indirectly bears its proportionate share of the expenses of any underlying Fidelity Central Funds.
F Expense ratios reflect operating expenses of the class. Expenses before reductions do not reflect amounts reimbursed by the investment adviser or reductions from brokerage service arrangements or reductions from other expense offset arrangements and do not represent the amount paid by the class during periods when reimbursements or reductions occur. Expense ratios before reductions for start-up periods may not be representative of longer-term operating periods. Expenses net of fee waivers reflect expenses after reimbursement by the investment adviser but prior to reductions from brokerage service arrangements or other expense offset arrangements. Expenses net of all reductions represent the net expenses paid by the class.
G Amount does not include the portfolio activity of any underlying Fidelity Central Funds.
See accompanying notes which are an integral part of the financial statements.
Notes to Financial Statements
For the period ended January 31, 2019
1. Organization.
Fidelity Stock Selector Large Cap Value Fund (the Fund) is a fund of Fidelity Devonshire Trust (the Trust) and is authorized to issue an unlimited number of shares. The Trust is registered under the Investment Company Act of 1940, as amended (the 1940 Act), as an open-end management investment company organized as a Massachusetts business trust. The Fund offers Class A, Class M, Class C, Stock Selector Large Cap Value, Class I and Class Z shares, each of which has equal rights as to assets and voting privileges. Each class has exclusive voting rights with respect to matters that affect that class.
Effective March 1, 2019, Class C shares will automatically convert to Class A shares after a holding period of ten years from the initial date of purchase, with certain exceptions.
2. Investments in Fidelity Central Funds.
The Fund invests in Fidelity Central Funds, which are open-end investment companies generally available only to other investment companies and accounts managed by the investment adviser and its affiliates. The Fund's Schedule of Investments lists each of the Fidelity Central Funds held as of period end, if any, as an investment of the Fund, but does not include the underlying holdings of each Fidelity Central Fund. As an Investing Fund, the Fund indirectly bears its proportionate share of the expenses of the underlying Fidelity Central Funds.
The Money Market Central Funds seek preservation of capital and current income and are managed by Fidelity Investments Money Management, Inc. (FIMM), an affiliate of the investment adviser. Annualized expenses of the Money Market Central Funds as of their most recent shareholder report date are less than .005%.
A complete unaudited list of holdings for each Fidelity Central Fund is available upon request or at the Securities and Exchange Commission (the SEC) website at www.sec.gov. In addition, the financial statements of the Fidelity Central Funds, which are not covered by the Fund's Report of Independent Registered Public Accounting Firm, are available on the SEC website or upon request.
3. Significant Accounting Policies.
The Fund is an investment company and applies the accounting and reporting guidance of the Financial Accounting Standards Board (FASB) Accounting Standards Codification Topic 946 Financial Services – Investments Companies. The financial statements have been prepared in conformity with accounting principles generally accepted in the United States of America (GAAP), which require management to make certain estimates and assumptions at the date of the financial statements. Actual results could differ from those estimates. Subsequent events, if any, through the date that the financial statements were issued have been evaluated in the preparation of the financial statements. The following summarizes the significant accounting policies of the Fund:
Investment Valuation. Investments are valued as of 4:00 p.m. Eastern time on the last calendar day of the period. The Board of Trustees (the Board) has delegated the day to day responsibility for the valuation of the Fund's investments to the Fair Value Committee (the Committee) established by the Fund's investment adviser. In accordance with valuation policies and procedures approved by the Board, the Fund attempts to obtain prices from one or more third party pricing vendors or brokers to value its investments. When current market prices, quotations or currency exchange rates are not readily available or reliable, investments will be fair valued in good faith by the Committee, in accordance with procedures adopted by the Board. Factors used in determining fair value vary by investment type and may include market or investment specific events, changes in interest rates and credit quality. The frequency with which these procedures are used cannot be predicted and they may be utilized to a significant extent. The Committee oversees the Fund's valuation policies and procedures and reports to the Board on the Committee's activities and fair value determinations. The Board monitors the appropriateness of the procedures used in valuing the Fund's investments and ratifies the fair value determinations of the Committee.
The Fund categorizes the inputs to valuation techniques used to value its investments into a disclosure hierarchy consisting of three levels as shown below:
- Level 1 – quoted prices in active markets for identical investments
- Level 2 – other significant observable inputs (including quoted prices for similar investments, interest rates, prepayment speeds, etc.)
- Level 3 – unobservable inputs (including the Fund's own assumptions based on the best information available)
Valuation techniques used to value the Fund's investments by major category are as follows:
Equity securities, including restricted securities, for which market quotations are readily available, are valued at the last reported sale price or official closing price as reported by a third party pricing vendor on the primary market or exchange on which they are traded and are categorized as Level 1 in the hierarchy. In the event there were no sales during the day or closing prices are not available, securities are valued at the last quoted bid price or may be valued using the last available price and are generally categorized as Level 2 in the hierarchy. For foreign equity securities, when market or security specific events arise, comparisons to the valuation of American Depositary Receipts (ADRs), futures contracts, Exchange-Traded Funds (ETFs) and certain indexes as well as quoted prices for similar securities may be used and would be categorized as Level 2 in the hierarchy. For equity securities, including restricted securities, where observable inputs are limited, assumptions about market activity and risk are used and these securities may be categorized as Level 3 in the hierarchy.
Debt securities, including restricted securities, are valued based on evaluated prices received from third party pricing vendors or from brokers who make markets in such securities. U.S. government and government agency obligations are valued by pricing vendors who utilize matrix pricing which considers yield or price of bonds of comparable quality, coupon, maturity and type or by broker-supplied prices. When independent prices are unavailable or unreliable, debt securities may be valued utilizing pricing methodologies which consider similar factors that would be used by third party pricing vendors. Debt securities are generally categorized as Level 2 in the hierarchy but may be Level 3 depending on the circumstances.
Investments in open-end mutual funds, including the Fidelity Central Funds, are valued at their closing net asset value (NAV) each business day and are categorized as Level 1 in the hierarchy.
Changes in valuation techniques may result in transfers in or out of an assigned level within the disclosure hierarchy. The aggregate value of investments by input level as of January 31, 2019 is included at the end of the Fund's Schedule of Investments.
Foreign Currency. The Fund may use foreign currency contracts to facilitate transactions in foreign-denominated securities. Gains and losses from these transactions may arise from changes in the value of the foreign currency or if the counterparties do not perform under the contracts' terms.
Foreign-denominated assets, including investment securities, and liabilities are translated into U.S. dollars at the exchange rates at period end. Purchases and sales of investment securities, income and dividends received and expenses denominated in foreign currencies are translated into U.S. dollars at the exchange rate in effect on the transaction date.
The effects of exchange rate fluctuations on investments are included with the net realized and unrealized gain (loss) on investment securities. Other foreign currency transactions resulting in realized and unrealized gain (loss) are disclosed separately.
Investment Transactions and Income. For financial reporting purposes, the Fund's investment holdings and NAV include trades executed through the end of the last business day of the period. The NAV per share for processing shareholder transactions is calculated as of the close of business of the New York Stock Exchange (NYSE), normally 4:00 p.m. Eastern time and includes trades executed through the end of the prior business day. Gains and losses on securities sold are determined on the basis of identified cost and include proceeds received from litigation. Dividend income is recorded on the ex-dividend date, except for certain dividends from foreign securities where the ex-dividend date may have passed, which are recorded as soon as the Fund is informed of the ex-dividend date. Non-cash dividends included in dividend income, if any, are recorded at the fair market value of the securities received. Income and capital gain distributions from Fidelity Central Funds, if any, are recorded on the ex-dividend date. Certain distributions received by the Fund represent a return of capital or capital gain. The Fund determines the components of these distributions subsequent to the ex-dividend date, based upon receipt of tax filings or other correspondence relating to the underlying investment. These distributions are recorded as a reduction of cost of investments and/or as a realized gain. Interest income is accrued as earned and includes coupon interest and amortization of premium and accretion of discount on debt securities as applicable. Investment income is recorded net of foreign taxes withheld where recovery of such taxes is uncertain.
Class Allocations and Expenses. Investment income, realized and unrealized capital gains and losses, common expenses of the Fund, and certain fund-level expense reductions, if any, are allocated daily on a pro-rata basis to each class based on the relative net assets of each class to the total net assets of the Fund. Each class differs with respect to transfer agent and distribution and service plan fees incurred. Certain expense reductions may also differ by class. For the reporting period, the allocated portion of income and expenses to each class as a percent of its average net assets may vary due to the timing of recording these transactions in relation to fluctuating net assets of the classes. Expenses directly attributable to a fund are charged to that fund. Expenses attributable to more than one fund are allocated among the respective funds on the basis of relative net assets or other appropriate methods. Expense estimates are accrued in the period to which they relate and adjustments are made when actual amounts are known.
Income Tax Information and Distributions to Shareholders. Each year, the Fund intends to qualify as a regulated investment company under Subchapter M of the Internal Revenue Code, including distributing substantially all of its taxable income and realized gains. As a result, no provision for U.S. Federal income taxes is required. As of January 31, 2019, the Fund did not have any unrecognized tax benefits in the financial statements; nor is the Fund aware of any tax positions for which it is reasonably possible that the total amounts of unrecognized tax benefits will significantly change in the next twelve months. The Fund files a U.S. federal tax return, in addition to state and local tax returns as required. The Fund's federal income tax returns are subject to examination by the Internal Revenue Service (IRS) for a period of three fiscal years after they are filed. State and local tax returns may be subject to examination for an additional fiscal year depending on the jurisdiction. Foreign taxes are provided for based on the Fund's understanding of the tax rules and rates that exist in the foreign markets in which it invests.
Distributions are declared and recorded on the ex-dividend date. Income and capital gain distributions are declared separately for each class. Income and capital gain distributions are determined in accordance with income tax regulations, which may differ from GAAP. In addition, the Fund claimed a portion of the payment made to redeeming shareholders as a distribution for income tax purposes.
Capital accounts within the financial statements are adjusted for permanent book-tax differences. These adjustments have no impact on net assets or the results of operations. Capital accounts are not adjusted for temporary book-tax differences which will reverse in a subsequent period.
Book-tax differences are primarily due to futures contracts, foreign currency transactions, partnerships, short-term gain distributions from the Underlying funds, market discount and losses deferred due to wash sales and excise tax regulations.
As of period end, the cost and unrealized appreciation (depreciation) in securities, and derivatives if applicable, for federal income tax purposes were as follows:
| Gross unrealized appreciation | $66,149,175 |
| Gross unrealized depreciation | (72,508,391) |
| Net unrealized appreciation (depreciation) | $(6,359,216) |
| Tax Cost | $970,996,361 |
The tax-based components of distributable earnings as of period end were as follows:
| Net unrealized appreciation (depreciation) on securities and other investments | $(6,359,216) |
The Fund intends to elect to defer to its next fiscal year $3,375,815 of capital losses recognized during the period November 1, 2018 to January 31, 2019.
The tax character of distributions paid was as follows:
| January 31, 2019 | January 31, 2018 | |
| Ordinary Income | $19,901,690 | $ 12,317,467 |
| Long-term Capital Gains | 42,835,147 | – |
| Total | $62,736,837 | $ 12,317,467 |
New Rule Issuance. During August 2018, the U.S. Securities and Exchange Commission issued Final Rule Release No. 33-10532, Disclosure Update and Simplification. This Final Rule includes amendments specific to registered investment companies that are intended to eliminate overlap in disclosure requirements between Regulation S-X and GAAP. In accordance with these amendments, certain line-items in the Fund's financial statements have been combined or removed for the current period as outlined in the table below.
| Financial Statement | Current Line-Item Presentation (As Applicable) | Prior Line-Item Presentation (As Applicable) |
| Statement of Assets and Liabilities | Total distributable earnings (loss) | Undistributed/Distributions in excess of/Accumulated net investment income (loss) Accumulated/Undistributed net realized gain (loss) Net unrealized appreciation (depreciation) |
| Statement of Changes in Net Assets | N/A - removed | Undistributed/Distributions in excess of/Accumulated net investment income (loss) end of period |
| Statement of Changes in Net Assets | Distributions to shareholders | Distributions to shareholders from net investment income Distributions to shareholders from net realized gain |
| Distributions to Shareholders Note to Financial Statements | Distributions to shareholders | Distributions to shareholders from net investment income Distributions to shareholders from net realized gain |
4. Derivative Instruments.
Risk Exposures and the Use of Derivative Instruments. The Fund's investment objective allows the Fund to enter into various types of derivative contracts, including futures contracts. Derivatives are investments whose value is primarily derived from underlying assets, indices or reference rates and may be transacted on an exchange or over-the-counter (OTC). Derivatives may involve a future commitment to buy or sell a specified asset based on specified terms, to exchange future cash flows at periodic intervals based on a notional principal amount, or for one party to make one or more payments upon the occurrence of specified events in exchange for periodic payments from the other party.
The Fund used derivatives to increase returns and to manage exposure to certain risks as defined below. The success of any strategy involving derivatives depends on analysis of numerous economic factors, and if the strategies for investment do not work as intended, the Fund may not achieve its objectives.
The Fund's use of derivatives increased or decreased its exposure to the following risk:
| Equity Risk | Equity risk relates to the fluctuations in the value of financial instruments as a result of changes in market prices (other than those arising from interest rate risk or foreign exchange risk), whether caused by factors specific to an individual investment, its issuer, or all factors affecting all instruments traded in a market or market segment. |
The Fund is also exposed to additional risks from investing in derivatives, such as liquidity risk and counterparty credit risk. Liquidity risk is the risk that the Fund will be unable to close out the derivative in the open market in a timely manner. Counterparty credit risk is the risk that the counterparty will not be able to fulfill its obligation to the Fund. Counterparty credit risk related to exchange-traded futures contracts may be mitigated by the protection provided by the exchange on which they trade.
Investing in derivatives may involve greater risks than investing in the underlying assets directly and, to varying degrees, may involve risk of loss in excess of any initial investment and collateral received and amounts recognized in the Statement of Assets and Liabilities. In addition, there may be the risk that the change in value of the derivative contract does not correspond to the change in value of the underlying instrument.
Futures Contracts. A futures contract is an agreement between two parties to buy or sell a specified underlying instrument for a fixed price at a specified future date. The Fund used futures contracts to manage its exposure to the stock market.
Upon entering into a futures contract, a fund is required to deposit either cash or securities (initial margin) with a clearing broker in an amount equal to a certain percentage of the face value of the contract. Futures contracts are marked-to-market daily and subsequent daily payments (variation margin) are made or received by a fund depending on the daily fluctuations in the value of the futures contracts and are recorded as unrealized appreciation or (depreciation). This receivable and/or payable, if any, is included in daily variation margin on futures contracts in the Statement of Assets and Liabilities. Realized gain or (loss) is recorded upon the expiration or closing of a futures contract. The net realized gain (loss) and change in net unrealized appreciation (depreciation) on futures contracts during the period is presented in the Statement of Operations.
Any open futures contracts at period end are presented in the Schedule of Investments under the caption "Futures Contracts". The notional amount at value reflects each contract's exposure to the underlying instrument or index at period end. Securities deposited to meet initial margin requirements are identified in the Schedule of Investments.
5. Purchases and Sales of Investments.
Purchases and sales of securities, other than short-term securities, aggregated $916,671,290 and $1,026,017,764, respectively.
6. Fees and Other Transactions with Affiliates.
Management Fee. Fidelity Management & Research Company (the investment adviser) and its affiliates provide the Fund with investment management related services for which the Fund pays a monthly management fee. The management fee is the sum of an individual fund fee rate that is based on an annual rate of .30% of the Fund's average net assets and an annualized group fee rate that averaged .24% during the period. The group fee rate is based upon the average net assets of all the mutual funds advised by the investment adviser, including any mutual funds previously advised by the investment adviser that are currently advised by Fidelity SelectCo, LLC, an affiliate of the investment adviser. The group fee rate decreases as assets under management increase and increases as assets under management decrease. In addition, the management fee is subject to a performance adjustment (up to a maximum of +/- .20% of the Fund's average net assets over a 36 month performance period). The upward or downward adjustment to the management fee is based on the relative investment performance of Stock Selector Large Cap Value as compared to its benchmark index, the Russell 1000 Value Index, over the same 36 month performance period. For the reporting period, the total annual management fee rate, including the performance adjustment, was .45% of the Fund's average net assets. The performance adjustment included in the management fee rate may be higher or lower than the maximum performance adjustment rate due to the difference between the average net assets for the reporting and performance periods.
Distribution and Service Plan Fees. In accordance with Rule 12b-1 of the 1940 Act, the Fund has adopted separate Distribution and Service Plans for each class of shares. Certain classes pay Fidelity Distributors Corporation (FDC), an affiliate of the investment adviser, separate Distribution and Service Fees, each of which is based on an annual percentage of each class' average net assets. In addition, FDC may pay financial intermediaries for selling shares of the Fund and providing shareholder support services. For the period, the Distribution and Service Fee rates, total fees and amounts retained by FDC were as follows:
| Distribution Fee | Service Fee | Total Fees | Retained by FDC | |
| Class A | -% | .25% | $62,460 | $1,611 |
| Class M | .25% | .25% | 49,423 | – |
| Class C | .75% | .25% | 91,843 | 7,040 |
| $203,726 | $8,651 |
Sales Load. FDC may receive a front-end sales charge of up to 5.75% for selling Class A shares and 3.50% for selling Class M shares, some of which is paid to financial intermediaries for selling shares of the Fund. Depending on the holding period, FDC may receive contingent deferred sales charges levied on Class A, Class M and Class C redemptions. The deferred sales charges are 1.00% for Class C shares, 1.00% for certain purchases of Class A shares and .25% for certain purchases of Class M shares.
For the period, sales charge amounts retained by FDC were as follows:
| Retained by FDC | |
| Class A | $4,652 |
| Class M | 1,759 |
| Class C(a) | 774 |
| $7,185 |
(a) When Class C shares are initially sold, FDC pays commissions from its own resources to financial intermediaries through which the sales are made.
Transfer Agent Fees. Fidelity Investments Institutional Operations Company, Inc., (FIIOC), an affiliate of the investment adviser, is the transfer, dividend disbursing and shareholder servicing agent for each class of the Fund. FIIOC receives account fees and asset-based fees that vary according to the account size and type of account of the shareholders of the respective classes of the Fund, except for Class Z. FIIOC receives an asset-based fee of Class Z's average net assets. FIIOC pays for typesetting, printing and mailing of shareholder reports, except proxy statements.
For the period, transfer agent fees for each class were as follows:
| Amount | % of Class-Level Average Net Assets | |
| Class A | $52,845 | .21 |
| Class M | 27,747 | .28 |
| Class C | 27,508 | .30 |
| Stock Selector Large Cap Value | 1,520,545 | .17 |
| Class I | 206,335 | .19 |
| Class Z | 277 | .05 |
| $1,835,257 |
Accounting and Security Lending Fees. Fidelity Service Company, Inc. (FSC), an affiliate of the investment adviser, maintains the Fund's accounting records. The accounting fee is based on the level of average net assets for each month. Under a separate contract, FSC administers the security lending program. The security lending fee is based on the number and duration of lending transactions. For the period, the fees were equivalent to an annual rate of .03%.
Brokerage Commissions. The Fund placed a portion of its portfolio transactions with brokerage firms which are affiliates of the investment adviser. Brokerage commissions are included in net realized gain (loss) and change in net unrealized appreciation (depreciation) in the Statement of Operations. The commissions paid to these affiliated firms were $28,094 for the period.
Interfund Trades. The Fund may purchase from or sell securities to other Fidelity Funds under procedures adopted by the Board. The procedures have been designed to ensure these interfund trades are executed in accordance with Rule 17a-7 of the 1940 Act. Interfund trades are included within the respective purchases and sales amounts shown in the Purchases and Sales of Investments note.
Other. During the period, the investment adviser reimbursed the Fund for certain losses in the amount of $9,372.
7. Committed Line of Credit.
The Fund participates with other funds managed by the investment adviser or an affiliate in a $4.25 billion credit facility (the "line of credit") to be utilized for temporary or emergency purposes to fund shareholder redemptions or for other short-term liquidity purposes. The Fund has agreed to pay commitment fees on its pro-rata portion of the line of credit, which amounted to $2,862 and is reflected in Miscellaneous expenses on the Statement of Operations. During the period, the Fund did not borrow on this line of credit.
8. Security Lending.
The Fund lends portfolio securities through a lending agent from time to time in order to earn additional income. For equity securities, a lending agent is used and may loan securities to certain qualified borrowers, including Fidelity Capital Markets (FCM), a broker-dealer affiliated with the Fund. On the settlement date of the loan, the Fund receives collateral (in the form of U.S. Treasury obligations, letters of credit and/or cash) against the loaned securities and maintains collateral in an amount not less than 100% of the market value of the loaned securities during the period of the loan. The market value of the loaned securities is determined at the close of business of the Fund and any additional required collateral is delivered to the Fund on the next business day. The Fund or borrower may terminate the loan at any time, and if the borrower defaults on its obligation to return the securities loaned because of insolvency or other reasons, the Fund may apply collateral received from the borrower against the obligation. The Fund may experience delays and costs in recovering the securities loaned. Any cash collateral received is invested in the Fidelity Securities Lending Cash Central Fund. At period end, there were no security loans outstanding. Security lending income represents the income earned on investing cash collateral, less rebates paid to borrowers and any lending agent fees associated with the loan, plus any premium payments received for lending certain types of securities. Security lending income is presented in the Statement of Operations as a component of income from Fidelity Central Funds. Total security lending income during the period amounted to $20,878, including $606 from securities loaned to FCM.
9. Expense Reductions.
Commissions paid to certain brokers with whom the investment adviser, or its affiliates, places trades on behalf of the Fund include an amount in addition to trade execution, which may be rebated back to the Fund to offset certain expenses. This amount totaled $103,820 for the period.
In addition, during the period the investment adviser reimbursed and/or waived a portion of fund-level operating expenses in the amount of $9,326.
10. Distributions to Shareholders.
Distributions to shareholders of each class were as follows:
| Year ended January 31, 2019 | Year ended January 31, 2018 | |
| Distributions to shareholders | ||
| Class A | $1,484,646 | $– |
| Class M | 591,114 | – |
| Class C | 493,332 | – |
| Stock Selector Large Cap Value | 53,627,596 | – |
| Class I | 6,488,440 | – |
| Class Z | 51,709 | – |
| Total | $62,736,837 | $– |
| From net investment income | ||
| Class A | $– | $213,926 |
| Class M | – | 51,493 |
| Class C | – | 3,631 |
| Stock Selector Large Cap Value | – | 10,768,661 |
| Class I | – | 1,276,155 |
| Class Z | – | 3,601 |
| Total | $– | $12,317,467 |
11. Share Transactions.
Share transactions for each class were as follows and may contain automatic conversions between classes or exchanges between affiliated funds:
| Shares | Shares | Dollars | Dollars | |
| Year ended January 31, 2019 | Year ended January 31, 2018 | Year ended January 31, 2019 | Year ended January 31, 2018 | |
| Class A | ||||
| Shares sold | 234,115 | 142,643 | $4,439,388 | $2,774,911 |
| Reinvestment of distributions | 76,506 | 10,056 | 1,405,420 | 204,781 |
| Shares redeemed | (253,896) | (535,801) | (5,115,380) | (10,491,253) |
| Net increase (decrease) | 56,725 | (383,102) | $729,428 | $(7,511,561) |
| Class M | ||||
| Shares sold | 62,410 | 50,024 | $1,246,554 | $973,280 |
| Reinvestment of distributions | 32,124 | 2,521 | 589,481 | 51,356 |
| Shares redeemed | (86,013) | (127,746) | (1,706,074) | (2,483,907) |
| Net increase (decrease) | 8,521 | (75,201) | $129,961 | $(1,459,271) |
| Class C | ||||
| Shares sold | 121,071 | 70,502 | $2,229,406 | $1,337,012 |
| Reinvestment of distributions | 27,181 | 177 | 488,438 | 3,538 |
| Shares redeemed | (128,443) | (148,280) | (2,505,335) | (2,819,699) |
| Net increase (decrease) | 19,809 | (77,601) | $212,509 | $(1,479,149) |
| Stock Selector Large Cap Value | ||||
| Shares sold | 4,057,401 | 26,144,587 | $79,972,379 | $507,261,485 |
| Reinvestment of distributions | 2,830,522 | 514,761 | 52,364,656 | 10,548,864 |
| Shares redeemed | (10,510,704) | (17,968,756) | (212,617,692) | (356,628,139) |
| Net increase (decrease) | (3,622,781) | 8,690,592 | $(80,280,657) | $161,182,210 |
| Class I | ||||
| Shares sold | 736,639 | 6,091,211 | $14,368,319 | $117,544,858 |
| Reinvestment of distributions | 335,385 | 59,129 | 6,164,368 | 1,206,146 |
| Shares redeemed | (1,417,982) | (1,194,545) | (28,541,232) | (23,802,625) |
| Net increase (decrease) | (345,958) | 4,955,795 | $(8,008,545) | $94,948,379 |
| Class Z | ||||
| Shares sold | 84,527 | 43,042 | $1,680,407 | $869,605 |
| Reinvestment of distributions | 2,600 | 149 | 47,820 | 3,036 |
| Shares redeemed | (83,298) | (1,495) | (1,675,360) | (30,290) |
| Net increase (decrease) | 3,829 | 41,696 | $52,867 | $842,351 |
12. Other.
The Fund's organizational documents provide former and current trustees and officers with a limited indemnification against liabilities arising in connection with the performance of their duties to the Fund. In the normal course of business, the Fund may also enter into contracts that provide general indemnifications. The Fund's maximum exposure under these arrangements is unknown as this would be dependent on future claims that may be made against the Fund. The risk of material loss from such claims is considered remote.
Report of Independent Registered Public Accounting Firm
To the Board of Trustees of Fidelity Devonshire Trust and Shareholders of Fidelity Stock Selector Large Cap Value Fund:
Opinion on the Financial Statements
We have audited the accompanying statement of assets and liabilities, including the schedule of investments, of Fidelity Stock Selector Large Cap Value Fund (one of the funds constituting Fidelity Devonshire Trust, referred to hereafter as the "Fund") as of January 31, 2019, the related statement of operations for the year ended January 31, 2019, the statement of changes in net assets for each of the two years in the period ended January 31, 2019, including the related notes, and the financial highlights for each of the periods indicated therein (collectively referred to as the “financial statements”). In our opinion, the financial statements present fairly, in all material respects, the financial position of the Fund as of January 31, 2019, the results of its operations for the year then ended, the changes in its net assets for each of the two years in the period ended January 31, 2019 and the financial highlights for the periods indicated therein in conformity with accounting principles generally accepted in the United States of America.
Basis for Opinion
These financial statements are the responsibility of the Fund’s management. Our responsibility is to express an opinion on the Fund’s financial statements based on our audits. We are a public accounting firm registered with the Public Company Accounting Oversight Board (United States) (PCAOB) and are required to be independent with respect to the Fund in accordance with the U.S. federal securities laws and the applicable rules and regulations of the Securities and Exchange Commission and the PCAOB.
We conducted our audits of these financial statements in accordance with the standards of the PCAOB. Those standards require that we plan and perform the audit to obtain reasonable assurance about whether the financial statements are free of material misstatement, whether due to error or fraud.
Our audits included performing procedures to assess the risks of material misstatement of the financial statements, whether due to error or fraud, and performing procedures that respond to those risks. Such procedures included examining, on a test basis, evidence regarding the amounts and disclosures in the financial statements. Our audits also included evaluating the accounting principles used and significant estimates made by management, as well as evaluating the overall presentation of the financial statements. Our procedures included confirmation of securities owned as of January 31, 2019 by correspondence with the custodian and brokers; when replies were not received from brokers, we performed other auditing procedures. We believe that our audits provide a reasonable basis for our opinion.
PricewaterhouseCoopers LLP
Boston, Massachusetts
March 13, 2019
We have served as the auditor of one or more investment companies in the Fidelity group of funds since 1932.
Trustees and Officers
The Trustees, Members of the Advisory Board (if any), and officers of the trust and fund, as applicable, are listed below. The Board of Trustees governs the fund and is responsible for protecting the interests of shareholders. The Trustees are experienced executives who meet periodically throughout the year to oversee the fund's activities, review contractual arrangements with companies that provide services to the fund, oversee management of the risks associated with such activities and contractual arrangements, and review the fund's performance. Except for Michael E. Wiley, each of the Trustees oversees 287 funds. Mr. Wiley oversees 195 funds.
The Trustees hold office without limit in time except that (a) any Trustee may resign; (b) any Trustee may be removed by written instrument, signed by at least two-thirds of the number of Trustees prior to such removal; (c) any Trustee who requests to be retired or who has become incapacitated by illness or injury may be retired by written instrument signed by a majority of the other Trustees; and (d) any Trustee may be removed at any special meeting of shareholders by a two-thirds vote of the outstanding voting securities of the trust. Each Trustee who is not an interested person (as defined in the 1940 Act) of the trust and the fund is referred to herein as an Independent Trustee. Each Independent Trustee shall retire not later than the last day of the calendar year in which his or her 75th birthday occurs. The Independent Trustees may waive this mandatory retirement age policy with respect to individual Trustees. Officers and Advisory Board Members hold office without limit in time, except that any officer or Advisory Board Member may resign or may be removed by a vote of a majority of the Trustees at any regular meeting or any special meeting of the Trustees. Except as indicated, each individual has held the office shown or other offices in the same company for the past five years.
The fund’s Statement of Additional Information (SAI) includes more information about the Trustees. To request a free copy, call Fidelity at 1-800-544-8544 if you’re an individual investing directly with Fidelity, call 1-800-835-5092 if you’re a plan sponsor or participant with Fidelity as your recordkeeper or call 1-877-208-0098 on institutional accounts or if you’re an advisor or invest through one.
Experience, Skills, Attributes, and Qualifications of the Trustees. The Governance and Nominating Committee has adopted a statement of policy that describes the experience, qualifications, attributes, and skills that are necessary and desirable for potential Independent Trustee candidates (Statement of Policy). The Board believes that each Trustee satisfied at the time he or she was initially elected or appointed a Trustee, and continues to satisfy, the standards contemplated by the Statement of Policy. The Governance and Nominating Committee also engages professional search firms to help identify potential Independent Trustee candidates who have the experience, qualifications, attributes, and skills consistent with the Statement of Policy. From time to time, additional criteria based on the composition and skills of the current Independent Trustees, as well as experience or skills that may be appropriate in light of future changes to board composition, business conditions, and regulatory or other developments, have also been considered by the professional search firms and the Governance and Nominating Committee. In addition, the Board takes into account the Trustees' commitment and participation in Board and committee meetings, as well as their leadership of standing and ad hoc committees throughout their tenure.
In determining that a particular Trustee was and continues to be qualified to serve as a Trustee, the Board has considered a variety of criteria, none of which, in isolation, was controlling. The Board believes that, collectively, the Trustees have balanced and diverse experience, qualifications, attributes, and skills, which allow the Board to operate effectively in governing the fund and protecting the interests of shareholders. Information about the specific experience, skills, attributes, and qualifications of each Trustee, which in each case led to the Board's conclusion that the Trustee should serve (or continue to serve) as a trustee of the fund, is provided below.
Board Structure and Oversight Function. James C. Curvey is an interested person and currently serves as Chairman. The Trustees have determined that an interested Chairman is appropriate and benefits shareholders because an interested Chairman has a personal and professional stake in the quality and continuity of services provided to the fund. Independent Trustees exercise their informed business judgment to appoint an individual of their choosing to serve as Chairman, regardless of whether the Trustee happens to be independent or a member of management. The Independent Trustees have determined that they can act independently and effectively without having an Independent Trustee serve as Chairman and that a key structural component for assuring that they are in a position to do so is for the Independent Trustees to constitute a substantial majority for the Board. The Independent Trustees also regularly meet in executive session. Ned C. Lautenbach serves as Chairman of the Independent Trustees and as such (i) acts as a liaison between the Independent Trustees and management with respect to matters important to the Independent Trustees and (ii) with management prepares agendas for Board meetings.
Fidelity® funds are overseen by different Boards of Trustees. The fund's Board oversees Fidelity's high income and certain equity funds, and other Boards oversee Fidelity's investment-grade bond, money market, asset allocation, and other equity funds. The asset allocation funds may invest in Fidelity® funds overseen by the fund's Board. The use of separate Boards, each with its own committee structure, allows the Trustees of each group of Fidelity® funds to focus on the unique issues of the funds they oversee, including common research, investment, and operational issues. On occasion, the separate Boards establish joint committees to address issues of overlapping consequences for the Fidelity® funds overseen by each Board.
The Trustees operate using a system of committees to facilitate the timely and efficient consideration of all matters of importance to the Trustees, the fund, and fund shareholders and to facilitate compliance with legal and regulatory requirements and oversight of the fund's activities and associated risks. The Board, acting through its committees, has charged FMR and its affiliates with (i) identifying events or circumstances the occurrence of which could have demonstrably adverse effects on the fund's business and/or reputation; (ii) implementing processes and controls to lessen the possibility that such events or circumstances occur or to mitigate the effects of such events or circumstances if they do occur; and (iii) creating and maintaining a system designed to evaluate continuously business and market conditions in order to facilitate the identification and implementation processes described in (i) and (ii) above. Because the day-to-day operations and activities of the fund are carried out by or through FMR, its affiliates, and other service providers, the fund's exposure to risks is mitigated but not eliminated by the processes overseen by the Trustees. While each of the Board's committees has responsibility for overseeing different aspects of the fund's activities, oversight is exercised primarily through the Operations, Audit, and Compliance Committees. In addition, the Independent Trustees have worked with Fidelity to enhance the Board's oversight of investment and financial risks, legal and regulatory risks, technology risks, and operational risks, including the development of additional risk reporting to the Board. Appropriate personnel, including but not limited to the fund's Chief Compliance Officer (CCO), FMR's internal auditor, the independent accountants, the fund's Treasurer and portfolio management personnel, make periodic reports to the Board's committees, as appropriate, including an annual review of Fidelity's risk management program for the Fidelity® funds. The responsibilities of each standing committee, including their oversight responsibilities, are described further under "Standing Committees of the Trustees."
Interested Trustees*:
Correspondence intended for a Trustee who is an interested person may be sent to Fidelity Investments, 245 Summer Street, Boston, Massachusetts 02210.
Name, Year of Birth; Principal Occupations and Other Relevant Experience+
James C. Curvey (1935)
Year of Election or Appointment: 2007
Trustee
Chairman of the Board of Trustees
Mr. Curvey also serves as Trustee of other Fidelity® funds. Mr. Curvey is Vice Chairman (2007-present) and Director of FMR LLC (diversified financial services company). In addition, Mr. Curvey is an Overseer Emeritus for the Boston Symphony Orchestra, a Director of Artis-Naples, and a Trustee of Brewster Academy in Wolfeboro, New Hampshire. Previously, Mr. Curvey served as a Director of Fidelity Research & Analysis Co. (investment adviser firm, 2009-2018), Director of Fidelity Investments Money Management, Inc. (investment adviser firm, 2009-2014) and a Director of FMR and FMR Co., Inc. (investment adviser firms, 2007-2014).
* Determined to be an “Interested Trustee” by virtue of, among other things, his or her affiliation with the trust or various entities under common control with FMR.
+ The information includes the Trustee's principal occupation during the last five years and other information relating to the experience, attributes, and skills relevant to the Trustee's qualifications to serve as a Trustee, which led to the conclusion that the Trustee should serve as a Trustee for the fund.
Independent Trustees:
Correspondence intended for an Independent Trustee may be sent to Fidelity Investments, P.O. Box 55235, Boston, Massachusetts 02205-5235.
Name, Year of Birth; Principal Occupations and Other Relevant Experience+
Dennis J. Dirks (1948)
Year of Election or Appointment: 2005
Trustee
Mr. Dirks also serves as Trustee of other Fidelity® funds. Prior to his retirement in May 2003, Mr. Dirks was Chief Operating Officer and a member of the Board of The Depository Trust & Clearing Corporation (DTCC). He also served as President, Chief Operating Officer, and Board member of The Depository Trust Company (DTC) and President and Board member of the National Securities Clearing Corporation (NSCC). In addition, Mr. Dirks served as Chief Executive Officer and Board member of the Government Securities Clearing Corporation, Chief Executive Officer and Board member of the Mortgage-Backed Securities Clearing Corporation, as a Trustee and a member of the Finance Committee of Manhattan College (2005-2008), as a Trustee and a member of the Finance Committee of AHRC of Nassau County (2006-2008), as a member of the Independent Directors Council (IDC) Governing Council (2010-2015), and as a member of the Board of Directors for The Brookville Center for Children’s Services, Inc. (2009-2017). Mr. Dirks is a member of the Finance Committee (2016-present) and Board of Directors (2017-present) and is Treasurer (2018-present) of the Asolo Repertory Theatre.
Donald F. Donahue (1950)
Year of Election or Appointment: 2018
Trustee
Mr. Donahue also serves as a Trustee of other Fidelity® funds. Mr. Donahue is President and Chief Executive Officer of Miranda Partners, LLC (risk consulting for the financial services industry, 2012-present). Previously, Mr. Donahue served as a Member of the Advisory Board of certain Fidelity® funds (2015-2018) and Chief Executive Officer (2006-2012), Chief Operating Officer (2003-2006), and Managing Director, Customer Marketing and Development (1999-2003) of The Depository Trust & Clearing Corporation (financial markets infrastructure). Mr. Donahue serves as a Member (2007-present) and Co-Chairman (2016-present) of the Board of Directors of United Way of New York, Member of the Board of Directors of NYC Leadership Academy (2012-present) and Member of the Board of Advisors of Ripple Labs, Inc. (financial services, 2015-present). He also served as Chairman (2010-2012) and Member of the Board of Directors (2012-2013) of Omgeo, LLC (financial services), Treasurer of United Way of New York (2012-2016), and Member of the Board of Directors of XBRL US (financial services non-profit, 2009-2012) and the International Securities Services Association (2009-2012).
Alan J. Lacy (1953)
Year of Election or Appointment: 2008
Trustee
Mr. Lacy also serves as Trustee of other Fidelity® funds. Mr. Lacy serves as a Director of Bristol-Myers Squibb Company (global pharmaceuticals, 2008-present). He is a Trustee of the California Chapter of The Nature Conservancy (2015-present) and a Director of the Center for Advanced Study in the Behavioral Sciences at Stanford University (2015-present). In addition, Mr. Lacy served as Senior Adviser (2007-2014) of Oak Hill Capital Partners, L.P. (private equity) and also served as Chief Executive Officer (2005) and Vice Chairman (2005-2006) of Sears Holdings Corporation (retail) and Chief Executive Officer and Chairman of the Board of Sears, Roebuck and Co. (retail, 2000-2005). Previously, Mr. Lacy served as Chairman (2014-2017) and a member (2010-2017) of the Board of Directors of Dave & Buster’s Entertainment, Inc. (restaurant and entertainment complexes), as Chairman (2008-2011) and a member (2006-2015) of the Board of Trustees of the National Parks Conservation Association, and as a member of the Board of Directors for The Hillman Companies, Inc. (hardware wholesalers, 2010-2014), Earth Fare, Inc. (retail grocery, 2010-2014), and The Western Union Company (global money transfer, 2006-2011).
Ned C. Lautenbach (1944)
Year of Election or Appointment: 2000
Trustee
Chairman of the Independent Trustees
Mr. Lautenbach also serves as Trustee of other Fidelity® funds. Mr. Lautenbach currently serves as Chair (2018-present) and Member (2013-present) of the Board of Governors, State University System of Florida and is a member of the Council on Foreign Relations (1994-present). He is also a member and has most recently served as Chairman of the Board of Directors of Artis-Naples (2012-present). Previously, Mr. Lautenbach served as a member and then Lead Director of the Board of Directors of Eaton Corporation (diversified industrial, 1997-2016). He was also a Partner and Advisory Partner at Clayton, Dubilier & Rice, LLC (private equity investment, 1998-2010), as well as a Director of Sony Corporation (2006-2007). In addition, Mr. Lautenbach also had a 30-year career with IBM (technology company) during which time he served as Senior Vice President and a member of the Corporate Executive Committee (1968-1998).
Joseph Mauriello (1944)
Year of Election or Appointment: 2008
Trustee
Mr. Mauriello also serves as Trustee of other Fidelity® funds. Prior to his retirement in January 2006, Mr. Mauriello served in numerous senior management positions including Deputy Chairman and Chief Operating Officer (2004-2005), and Vice Chairman of Financial Services (2002-2004) of KPMG LLP US (professional services, 1965-2005). Mr. Mauriello currently serves as a member of the Independent Directors Council (IDC) Governing Council (2015-present). Previously, Mr. Mauriello served as a member of the Board of Directors of XL Group plc. (global insurance and re-insurance, 2006-2018).
Cornelia M. Small (1944)
Year of Election or Appointment: 2005
Trustee
Ms. Small also serves as Trustee of other Fidelity® funds. Ms. Small is a member of the Board of Directors (2009-present) and Chair of the Investment Committee (2010-present) of the Teagle Foundation. Ms. Small also serves on the Investment Committee of the Berkshire Taconic Community Foundation (2008-present). Previously, Ms. Small served as Chairperson (2002-2008) and a member of the Investment Committee and Chairperson (2008-2012) and a member of the Board of Trustees of Smith College. In addition, Ms. Small served as Chief Investment Officer, Director of Global Equity Investments, and a member of the Board of Directors of Scudder, Stevens & Clark and Scudder Kemper Investments.
Garnett A. Smith (1947)
Year of Election or Appointment: 2018
Trustee
Mr. Smith also serves as Trustee of other Fidelity® funds. Prior to Mr. Smith's retirement, he served as Chairman and Chief Executive Officer of Inbrand Corp. (manufacturer of personal absorbent products, 1990-1997). He also served as President (1986-1990) of Inbrand Corp. Prior to his employment with Inbrand Corp., he was employed by a retail fabric chain and North Carolina National Bank. In addition, Mr. Smith served as a Member of the Advisory Board of certain Fidelity® funds (2012-2013) and as a board member of the Jackson Hole Land Trust (2009-2012).
David M. Thomas (1949)
Year of Election or Appointment: 2008
Trustee
Mr. Thomas also serves as Trustee of other Fidelity® funds. Mr. Thomas serves as Non-Executive Chairman of the Board of Directors of Fortune Brands Home and Security (home and security products, 2011-present) and as a member of the Board of Directors (2004-present) and Presiding Director (2013-present) of Interpublic Group of Companies, Inc. (marketing communication). Previously, Mr. Thomas served as Executive Chairman (2005-2006) and Chairman and Chief Executive Officer (2000-2005) of IMS Health, Inc. (pharmaceutical and healthcare information solutions), a Director of Fortune Brands, Inc. (consumer products, 2000-2011), and a member of the Board of Trustees of the University of Florida (2013-2018).
Michael E. Wiley (1950)
Year of Election or Appointment: 2018
Trustee
Mr. Wiley also serves as Trustee or Member of the Advisory Board of other Fidelity® funds. Mr. Wiley serves as a Director of High Point Resources (exploration and production, 2005-present). Previously, Mr. Wiley served as a Director of Andeavor Corporation (independent oil refiner and marketer, 2005-2018), a Director of Andeavor Logistics LP (natural resources logistics, 2015-2018), a Director of Post Oak Bank (privately-held bank, 2004-2018), a Director of Asia Pacific Exploration Consolidated (international oil and gas exploration and production, 2008-2013), a member of the Board of Trustees of the University of Tulsa (2000-2006; 2007-2010), a Senior Energy Advisor of Katzenbach Partners, LLC (consulting, 2006-2007), an Advisory Director of Riverstone Holdings (private investment), a Director of Spinnaker Exploration Company (exploration and production, 2001-2005) and Chairman, President, and CEO of Baker Hughes, Inc. (oilfield services, 2000-2004).
+ The information includes the Trustee's principal occupation during the last five years and other information relating to the experience, attributes, and skills relevant to the Trustee's qualifications to serve as a Trustee, which led to the conclusion that the Trustee should serve as a Trustee for the fund.
Advisory Board Members and Officers:
Correspondence intended for a Member of the Advisory Board (if any) may be sent to Fidelity Investments, P.O. Box 55235, Boston, Massachusetts 02205-5235. Correspondence intended for an officer or Peter S. Lynch may be sent to Fidelity Investments, 245 Summer Street, Boston, Massachusetts 02210. Officers appear below in alphabetical order.
Name, Year of Birth; Principal Occupation
Vicki L. Fuller (1957)
Year of Election or Appointment: 2018
Member of the Advisory Board
Ms. Fuller also serves as Member of the Advisory Board of other Fidelity® funds. Ms. Fuller serves as a member of the Board of Directors, Audit Committee, and Nominating and Governance Committee of The Williams Companies, Inc. (natural gas infrastructure, 2018-present). Previously, Ms. Fuller served as the Chief Investment Officer of the New York State Common Retirement Fund (2012-2018) and held a variety of positions at AllianceBernstein L.P. (global asset management, 1985-2012), including Managing Director (2006-2012) and Senior Vice President and Senior Portfolio Manager (2001-2006).
Peter S. Lynch (1944)
Year of Election or Appointment: 2003
Member of the Advisory Board
Mr. Lynch also serves as Member of the Advisory Board of other Fidelity® funds. Mr. Lynch is Vice Chairman and a Director of FMR (investment adviser firm) and FMR Co., Inc. (investment adviser firm). In addition, Mr. Lynch serves as a Trustee of Boston College and as the Chairman of the Inner-City Scholarship Fund. Previously, Mr. Lynch served on the Special Olympics International Board of Directors (1997-2006).
Carol B. Tomé (1957)
Year of Election or Appointment: 2018
Member of the Advisory Board
Ms. Tomé also serves as Member of the Advisory Board of other Fidelity® funds. Ms. Tomé is Chief Financial Officer (2001-present) and Executive Vice President of Corporate Services (2007-present) of The Home Depot, Inc. (home improvement retailer) and a Director (2003-present) and Chair of the Audit Committee (2004-present) of United Parcel Service, Inc. (package delivery and supply chain management). Previously, Ms. Tomé served as Trustee of certain Fidelity® funds (2017), Senior Vice President of Finance and Accounting/Treasurer (2000-2007) and Vice President and Treasurer (1995-2000) of The Home Depot, Inc. and Chair of the Board (2010-2012), Vice Chair of the Board (2009 and 2013), and a Director (2008-2013) of the Federal Reserve Bank of Atlanta. Ms. Tomé is also a director or trustee of many community and professional organizations.
Elizabeth Paige Baumann (1968)
Year of Election or Appointment: 2017
Anti-Money Laundering (AML) Officer
Ms. Baumann also serves as AML Officer of other funds. She is Chief AML Officer (2012-present) and Senior Vice President (2014-present) of FMR LLC (diversified financial services company) and is an employee of Fidelity Investments. Previously, Ms. Baumann served as AML Officer of the funds (2012-2016), and Vice President (2007-2014) and Deputy Anti-Money Laundering Officer (2007-2012) of FMR LLC.
Craig S. Brown (1977)
Year of Election or Appointment: 2019
Assistant Treasurer
Mr. Brown also serves as Assistant Treasurer of other funds. Mr. Brown is an employee of Fidelity Investments (2013-present).
John J. Burke III (1964)
Year of Election or Appointment: 2018
Chief Financial Officer
Mr. Burke also serves as Chief Financial Officer of other funds. Mr. Burke serves as Head of Investment Operations for Fidelity Fund and Investment Operations (2018-present) and is an employee of Fidelity Investments (1998-present). Previously Mr. Burke served as head of Asset Management Investment Operations (2012-2018).
William C. Coffey (1969)
Year of Election or Appointment: 2018
Secretary and Chief Legal Officer (CLO)
Mr. Coffey also serves as Secretary and CLO of other funds. Mr. Coffey serves as CLO, Secretary, and Senior Vice President of Fidelity Management & Research Company and FMR Co., Inc. (investment adviser firms, 2018-present); Secretary of Fidelity SelectCo, LLC and Fidelity Investments Money Management, Inc. (investment adviser firms, 2018-present); and CLO of Fidelity Management & Research (Hong Kong) Limited, FMR Investment Management (UK) Limited, and Fidelity Management & Research (Japan) Limited (investment adviser firms, 2018-present). He is Senior Vice President and Deputy General Counsel of FMR LLC (diversified financial services company, 2010-present), and is an employee of Fidelity Investments. Previously, Mr. Coffey served as Assistant Secretary of certain funds (2009-2018) and as Vice President and Associate General Counsel of FMR LLC (2005-2009).
Timothy M. Cohen (1969)
Year of Election or Appointment: 2018
Vice President
Mr. Cohen also serves as Vice President of other funds. Mr. Cohen serves as Co-Head of Global Equity Research (2016-present), a Director of Fidelity Management & Research (Japan) Limited (investment adviser firm, 2016-present), and is an employee of Fidelity Investments. Previously, Mr. Cohen served as Chief Investment Officer - Equity and a Director of Fidelity Management & Research (U.K.) Inc. (investment adviser firm, 2013-2015) and as a Director of Fidelity Management & Research (Hong Kong) Limited (investment adviser firm, 2017).
Jonathan Davis (1968)
Year of Election or Appointment: 2010
Assistant Treasurer
Mr. Davis also serves as Assistant Treasurer of other funds. Mr. Davis serves as Assistant Treasurer of FMR Capital, Inc. (2017-present) and is an employee of Fidelity Investments. Previously, Mr. Davis served as Vice President and Associate General Counsel of FMR LLC (diversified financial services company, 2003-2010).
Adrien E. Deberghes (1967)
Year of Election or Appointment: 2016
Assistant Treasurer
Mr. Deberghes also serves as an officer of other funds. He serves as Assistant Treasurer of FMR Capital, Inc. (2017-present), Executive Vice President of Fidelity Investments Money Management, Inc. (FIMM) (investment adviser firm, 2016-present), and is an employee of Fidelity Investments (2008-present). Previously, Mr. Deberghes served as President and Treasurer of certain Fidelity® funds (2013-2018). Prior to joining Fidelity Investments, Mr. Deberghes was Senior Vice President of Mutual Fund Administration at State Street Corporation (2007-2008), Senior Director of Mutual Fund Administration at Investors Bank & Trust (2005-2007), and Director of Finance for Dunkin' Brands (2000-2005). Previously, Mr. Deberghes served in other fund officer roles.
Laura M. Del Prato (1964)
Year of Election or Appointment: 2018
Assistant Treasurer
Ms. Del Prato also serves as an officer of other funds. Ms. Del Prato is an employee of Fidelity Investments (2017-present). Prior to joining Fidelity Investments, Ms. Del Prato served as a Managing Director and Treasurer of the JPMorgan Mutual Funds (2014-2017). Prior to JPMorgan, Ms. Del Prato served as a partner at Cohen Fund Audit Services (accounting firm, 2012-2013) and KPMG LLP (accounting firm, 2004-2012).
Colm A. Hogan (1973)
Year of Election or Appointment: 2016
Deputy Treasurer
Mr. Hogan also serves as an officer of other funds. Mr. Hogan serves as Assistant Treasurer of FMR Capital, Inc. (2017-present) and is an employee of Fidelity Investments (2005-present). Previously, Mr. Hogan served as Assistant Treasurer of certain Fidelity® funds (2016-2018).
Pamela R. Holding (1964)
Year of Election or Appointment: 2018
Vice President
Ms. Holding also serves as Vice President of other funds. Ms. Holding serves as Co-Head of Global Equity Research (2018-present) and is an employee of Fidelity Investments (2013-present).
Chris Maher (1972)
Year of Election or Appointment: 2013
Assistant Treasurer
Mr. Maher serves as Assistant Treasurer of other funds. Mr. Maher is Vice President of Valuation Oversight, serves as Assistant Treasurer of FMR Capital, Inc. (2017-present), and is an employee of Fidelity Investments. Previously, Mr. Maher served as Vice President of Asset Management Compliance (2013), Vice President of the Program Management Group of FMR (investment adviser firm, 2010-2013), and Vice President of Valuation Oversight (2008-2010).
Kenneth B. Robins (1969)
Year of Election or Appointment: 2016
Chief Compliance Officer
Mr. Robins also serves as an officer of other funds. Mr. Robins serves as Compliance Officer of Fidelity Management & Research Company and FMR Co., Inc. (investment adviser firms, 2016-present) and is an employee of Fidelity Investments (2004-present). Previously, Mr. Robins served as Executive Vice President of Fidelity Investments Money Management, Inc. (investment adviser firm, 2013-2016) and served in other fund officer roles.
Stacie M. Smith (1974)
Year of Election or Appointment: 2016
President and Treasurer
Ms. Smith also serves as an officer of other funds. Ms. Smith serves as Assistant Treasurer of FMR Capital, Inc. (2017-present), is an employee of Fidelity Investments (2009-present), and has served in other fund officer roles. Prior to joining Fidelity Investments, Ms. Smith served as Senior Audit Manager of Ernst & Young LLP (accounting firm, 1996-2009). Previously, Ms. Smith served as Assistant Treasurer (2013-2018) and Deputy Treasurer (2013-2016) of certain Fidelity® funds.
Marc L. Spector (1972)
Year of Election or Appointment: 2016
Assistant Treasurer
Mr. Spector also serves as an officer of other funds. Mr. Spector serves as Assistant Treasurer of FMR Capital, Inc. (2017-present) and is an employee of Fidelity Investments (2016-present). Prior to joining Fidelity Investments, Mr. Spector served as Director at the Siegfried Group (accounting firm, 2013-2016), and prior to Siegfried Group as audit senior manager at Deloitte & Touche (accounting firm, 2005-2013).
Jim Wegmann (1979)
Year of Election or Appointment: 2019
Assistant Treasurer
Mr. Wegmann also serves as Assistant Treasurer of other funds. Mr. Wegmann is an employee of Fidelity Investments (2011-present).
Shareholder Expense Example
As a shareholder of the Fund, you incur two types of costs: (1) transaction costs, including sales charges (loads) on purchase payments or redemption proceeds, and (2) ongoing costs, including management fees, distribution and/or service (12b-1) fees and other Fund expenses. This Example is intended to help you understand your ongoing costs (in dollars) of investing in the Fund and to compare these costs with the ongoing costs of investing in other mutual funds.
The Example is based on an investment of $1,000 invested at the beginning of the period and held for the entire period (August 1, 2018 to January 31, 2019).
Actual Expenses
The first line of the accompanying table for each class of the Fund provides information about actual account values and actual expenses. You may use the information in this line, together with the amount you invested, to estimate the expenses that you paid over the period. Simply divide your account value by $1,000.00 (for example, an $8,600 account value divided by $1,000.00 = 8.6), then multiply the result by the number in the first line for a class of the Fund under the heading entitled "Expenses Paid During Period" to estimate the expenses you paid on your account during this period. In addition, the Fund, as a shareholder in the underlying Fidelity Central Funds, will indirectly bear its pro-rata share of the fees and expenses incurred by the underlying Fidelity Central Funds. These fees and expenses are not included in the Fund's annualized expense ratio used to calculate the expense estimate in the table below.
Hypothetical Example for Comparison Purposes
The second line of the accompanying table for each class of the Fund provides information about hypothetical account values and hypothetical expenses based on a Class' actual expense ratio and an assumed rate of return of 5% per year before expenses, which is not the Class' actual return. The hypothetical account values and expenses may not be used to estimate the actual ending account balance or expenses you paid for the period. You may use this information to compare the ongoing costs of investing in the Fund and other funds. To do so, compare this 5% hypothetical example with the 5% hypothetical examples that appear in the shareholder reports of the other funds. In addition, the Fund, as a shareholder in the underlying Fidelity Central Funds, will indirectly bear its pro-rata share of the fees and expenses incurred by the underlying Fidelity Central Funds. These fees and expenses are not included in the Fund's annualized expense ratio used to calculate the expense estimate in the table below.
Please note that the expenses shown in the table are meant to highlight your ongoing costs only and do not reflect any transaction costs. Therefore, the second line of the table is useful in comparing ongoing costs only, and will not help you determine the relative total costs of owning different funds. In addition, if these transactional costs were included, your costs would have been higher.
| Annualized Expense Ratio-A | Beginning Account Value August 1, 2018 | Ending Account Value January 31, 2019 | Expenses Paid During Period-B August 1, 2018 to January 31, 2019 | |
| Class A | .97% | |||
| Actual | $1,000.00 | $960.70 | $4.79 | |
| Hypothetical-C | $1,000.00 | $1,020.32 | $4.94 | |
| Class M | 1.28% | |||
| Actual | $1,000.00 | $959.40 | $6.32 | |
| Hypothetical-C | $1,000.00 | $1,018.75 | $6.51 | |
| Class C | 1.80% | |||
| Actual | $1,000.00 | $956.70 | $8.88 | |
| Hypothetical-C | $1,000.00 | $1,016.13 | $9.15 | |
| Stock Selector Large Cap Value | .68% | |||
| Actual | $1,000.00 | $962.40 | $3.36 | |
| Hypothetical-C | $1,000.00 | $1,021.78 | $3.47 | |
| Class I | .70% | |||
| Actual | $1,000.00 | $962.00 | $3.46 | |
| Hypothetical-C | $1,000.00 | $1,021.68 | $3.57 | |
| Class Z | .55% | |||
| Actual | $1,000.00 | $963.10 | $2.72 | |
| Hypothetical-C | $1,000.00 | $1,022.43 | $2.80 |
A Annualized expense ratio reflects expenses net of applicable fee waivers.
B Expenses are equal to each Class' annualized expense ratio, multiplied by the average account value over the period, multiplied by 184/365 (to reflect the one-half year period).
C 5% return per year before expenses
Distributions (Unaudited)
The fund hereby designates as a capital gain dividend with respect to the taxable year ended January 31, 2019, $42,835,402 or, if subsequently determined to be different, the net capital gain of such year.
Class A designates 97%; Class M designates 100%; Class C designates 100%; Stock Selector Large Cap Value designates 84%; Class I designates 85%; and Class Z designates 79%; of the dividends distributed in during the fiscal year as qualifying for the dividends–received deduction for corporate shareholders.
Class A designates 100%; Class M designates 100%; Class C designates 100%; Stock Selector Large Cap Value designates 97%; Class I designates 98%; and Class Z designates 91%; of the dividends distributed during the fiscal year as amounts which may be taken into account as a dividend for purposes of the maximum rate under section 1(h)(11) of the Internal Revenue Code.
The fund will notify shareholders in January 2020 of amounts for use in preparing 2019 income tax returns.
Board Approval of Investment Advisory Contracts and Management Fees
Fidelity Stock Selector Large Cap Value Fund
Each year, the Board of Trustees, including the Independent Trustees (together, the Board), votes on the renewal of the management contract with Fidelity Management & Research Company (FMR) and the sub-advisory agreements (together, the Advisory Contracts) for the fund. FMR and the sub-advisers are referred to herein as the Investment Advisers. The Board, assisted by the advice of fund counsel and Independent Trustees' counsel, requests and considers a broad range of information relevant to the renewal of the Advisory Contracts throughout the year.
The Board meets regularly and, at each of its meetings, covers an extensive agenda of topics and materials and considers factors that are relevant to its annual consideration of the renewal of the fund's Advisory Contracts, including the services and support provided to the fund and its shareholders. The Board has established various standing committees (Committees), each composed of and chaired by Independent Trustees with varying backgrounds, to which the Board has assigned specific subject matter responsibilities in order to enhance effective decision-making by the Board. The Board, acting directly and through its Committees, requests and receives information concerning the annual consideration of the renewal of the fund's Advisory Contracts. The Board also meets as needed to review matters specifically related to the Board's annual consideration of the renewal of the Advisory Contracts. Members of the Board may also meet with trustees of other Fidelity funds through joint ad hoc committees to discuss certain matters relevant to all of the Fidelity funds.
At its January 2019 meeting, the Board unanimously determined to renew the fund's Advisory Contracts. In reaching its determination, the Board considered all factors it believed relevant, including (i) the nature, extent, and quality of the services to be provided to the fund and its shareholders (including the investment performance of the fund); (ii) the competitiveness of the fund's management fee and total expense ratio relative to peer funds; (iii) the total costs of the services to be provided by and the profits to be realized by Fidelity from its relationships with the fund; and (iv) the extent to which, if any, economies of scale exist and would be realized as the fund grows, and whether any economies of scale are appropriately shared with fund shareholders.
In considering whether to renew the Advisory Contracts for the fund, the Board reached a determination, with the assistance of fund counsel and Independent Trustees' counsel and through the exercise of its business judgment, that the renewal of the Advisory Contracts was in the best interests of the fund and its shareholders and that the compensation payable under the Advisory Contracts was fair and reasonable. The Board's decision to renew the Advisory Contracts was not based on any single factor, but rather was based on a comprehensive consideration of all the information provided to the Board at its meetings throughout the year. The Board, in reaching its determination to renew the Advisory Contracts, was aware that shareholders of the fund have a broad range of investment choices available to them, including a wide choice among funds offered by Fidelity's competitors, and that the fund's shareholders, who have the opportunity to review and weigh the disclosure provided by the fund in its prospectus and other public disclosures, have chosen to invest in this fund, which is part of the Fidelity family of funds.
Nature, Extent, and Quality of Services Provided. The Board considered Fidelity's staffing as it relates to the fund, including the backgrounds of investment personnel of Fidelity, and also considered the fund's investment objective, strategies, and related investment philosophy. The Independent Trustees also had discussions with senior management of Fidelity's investment operations and investment groups. The Board considered the structure of the investment personnel compensation program and whether this structure provides appropriate incentives to act in the best interests of the fund. Additionally, the Board considered the portfolio managers' investments, if any, in the funds that they manage.Resources Dedicated to Investment Management and Support Services. The Board and the Fund Oversight and Research Committees reviewed the general qualifications and capabilities of Fidelity's investment staff, including its size, education, experience, and resources, as well as Fidelity's approach to recruiting, training, managing, and compensating investment personnel. The Board noted that Fidelity has continued to increase the resources devoted to non-U.S. offices, including expansion of Fidelity's global investment organization. The Board also noted that Fidelity's analysts have extensive resources, tools and capabilities that allow them to conduct sophisticated quantitative and fundamental analysis, as well as credit analysis of issuers, counterparties and guarantors. Further, the Board considered that Fidelity's investment professionals have sufficient access to global information and data so as to provide competitive investment results over time, and that those professionals also have access to sophisticated tools that permit them to assess portfolio construction and risk and performance attribution characteristics continuously, as well as to transmit new information and research conclusions rapidly around the world. Additionally, in its deliberations, the Board considered Fidelity's trading, risk management, compliance, and technology and operations capabilities and resources, which are integral parts of the investment management process.Shareholder and Administrative Services. The Board considered (i) the nature, extent, quality, and cost of advisory, administrative, and shareholder services performed by the Investment Advisers and their affiliates under the Advisory Contracts and under separate agreements covering transfer agency, pricing and bookkeeping, and securities lending services for the fund; (ii) the nature and extent of the supervision of third party service providers, principally custodians, subcustodians, and pricing vendors; and (iii) the resources devoted to, and the record of compliance with, the fund's compliance policies and procedures. The Board also reviewed the allocation of fund brokerage, including allocations to brokers affiliated with the Investment Advisers, the use of brokerage commissions to pay fund expenses, and the use of "soft" commission dollars to pay for research services.The Board noted that the growth of fund assets over time across the complex allows Fidelity to reinvest in the development of services designed to enhance the value and convenience of the Fidelity funds as investment vehicles. These services include 24-hour access to account information and market information through telephone representatives and over the Internet, investor education materials and asset allocation tools, and the expanded availability of Fidelity Investor Centers.The Board noted that it and the boards of certain other Fidelity funds had formed an ad hoc Committee on Transfer Agency Fees to review the variety of transfer agency fee structures throughout the industry and Fidelity's competitive positioning with respect to industry participants.Investment in a Large Fund Family. The Board considered the benefits to shareholders of investing in a Fidelity fund, including the benefits of investing in a fund that is part of a large family of funds offering a variety of investment disciplines and providing a large variety of mutual fund investor services. The Board noted that Fidelity had taken, or had made recommendations that resulted in the Fidelity funds taking, a number of actions over the previous year that benefited particular funds, including: (i) continuing to dedicate additional resources to Fidelity's investment research process, which includes meetings with management of issuers of securities in which the funds invest, and to the support of the senior management team that oversees asset management; (ii) continuing efforts to enhance Fidelity's global research capabilities; (iii) launching new funds and making other enhancements to meet client needs; (iv) launching new share classes of existing funds; (v) eliminating purchase minimums and broadening eligibility requirements for certain funds and share classes; (vi) reducing management fees and total expenses for certain growth equity funds and index funds; (vii) lowering expense caps for certain existing funds and classes, and converting certain voluntary expense caps to contractual caps, to reduce expenses borne by shareholders; (viii) eliminating short-term redemption fees for funds that had such fees; (ix) rationalizing product lines and gaining increased efficiencies from fund mergers and share class consolidations; (x) continuing to develop, acquire and implement systems and technology to improve services to the funds and shareholders, strengthen information security, and increase efficiency; and (xi) continuing to implement enhancements to further strengthen Fidelity's product line to increase investors' probability of success in achieving their investment goals, including retirement income goals.Investment Performance. The Board considered whether the fund has operated in accordance with its investment objective, as well as its record of compliance with its investment restrictions and its performance history. The fund had portfolio manager changes in June 2016, December 2016, and April 2018. The Board will continue to monitor closely the fund's performance, taking into account the portfolio manager changes.The Board took into account discussions that occur at Board meetings throughout the year with representatives of the Investment Advisers about fund investment performance. In this regard the Board noted that as part of regularly scheduled fund reviews and other reports to the Board on fund performance, the Board considers annualized return information for the fund for different time periods, measured against an appropriate securities market index ("benchmark index") and a peer group of funds with similar objectives ("peer group"), if any. In its evaluation of fund investment performance, the Board gave particular attention to information indicating changes in performance of certain Fidelity funds for specific time periods and discussed with the Investment Advisers the reasons for any overperformance or underperformance.In addition to reviewing absolute and relative fund performance, the Independent Trustees periodically consider the appropriateness of fund performance metrics in evaluating the results achieved. In general, the Independent Trustees believe that fund performance should be evaluated based on net performance (after fees and expenses) of both the highest performing and lowest performing fund share classes, where applicable, compared to appropriate benchmark indices, over appropriate time periods that may include full market cycles, and compared to peer groups, as applicable, over the same periods, taking into account relevant factors including the following: general market conditions; issuer-specific information; and fund cash flows and other factors.The Independent Trustees recognize that shareholders evaluate performance on a net basis over their own holding periods, for which one-, three-, and five-year periods are often used as a proxy. For this reason, the performance information reviewed by the Board also included net cumulative total return information for the fund and an appropriate benchmark index and peer group for the most recent one-, three-, and five-year periods ended June 30, 2018, as shown below. Returns are shown compared to the 25th percentile (top of box, 75% beaten) and 75th percentile (bottom of box, 25% beaten) of the peer universe.Fidelity Stock Selector Large Cap Value Fund

Fidelity Stock Selector Large Cap Value Fund
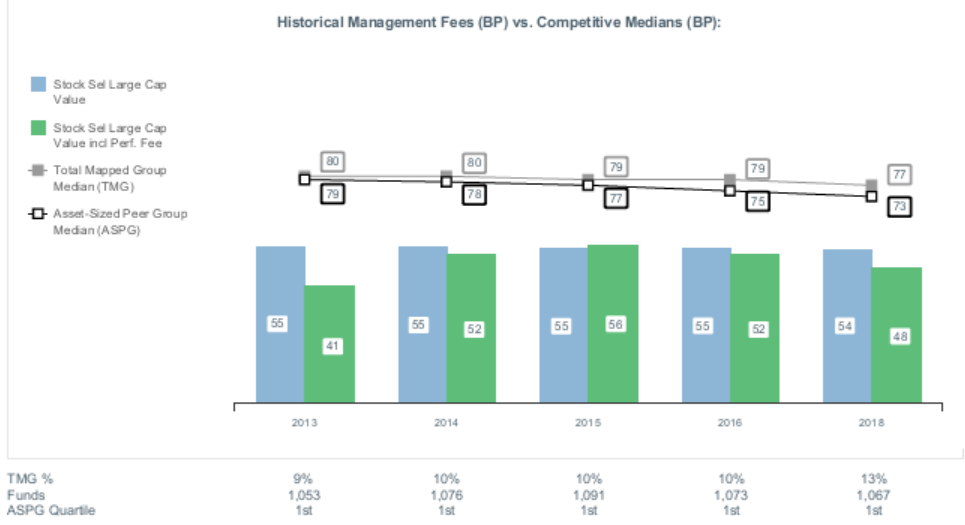
![]()
LCV-ANN-0319
1.900194.109
Fidelity® Mid Cap Value Fund Annual Report January 31, 2019 Includes Fidelity and Fidelity Advisor share classes |
|
Beginning on January 1, 2021, as permitted by regulations adopted by the Securities and Exchange Commission, paper copies of a fund’s shareholder reports will no longer be sent by mail, unless you specifically request paper copies of the reports from the fund or from your financial intermediary, such as a financial advisor, broker-dealer or bank. Instead, the reports will be made available on a website, and you will be notified by mail each time a report is posted and provided with a website link to access the report.
If you already elected to receive shareholder reports electronically, you will not be affected by this change and you need not take any action. You may elect to receive shareholder reports and other communications from a fund electronically, by contacting your financial intermediary. For Fidelity customers, visit Fidelity's web site or call Fidelity using the contact information listed below.
You may elect to receive all future reports in paper free of charge. If you wish to continue receiving paper copies of your shareholder reports, you may contact your financial intermediary or, if you are a Fidelity customer, visit Fidelity’s website, or call Fidelity at the applicable toll-free number listed below. Your election to receive reports in paper will apply to all funds held with the fund complex/your financial intermediary.
| Account Type | Website | Phone Number |
| Brokerage, Mutual Fund, or Annuity Contracts: | fidelity.com/mailpreferences | 1-800-343-3548 |
| Employer Provided Retirement Accounts: | netbenefits.fidelity.com/preferences (choose 'no' under Required Disclosures to continue to print) | 1-800-343-0860 |
| Advisor Sold Accounts Serviced Through Your Financial Intermediary: | Contact Your Financial Intermediary | Your Financial Intermediary's phone number |
| Advisor Sold Accounts Serviced by Fidelity: | institutional.fidelity.com | 1-877-208-0098 |
Contents
Board Approval of Investment Advisory Contracts and Management Fees |
To view a fund's proxy voting guidelines and proxy voting record for the 12-month period ended June 30, visit http://www.fidelity.com/proxyvotingresults or visit the Securities and Exchange Commission's (SEC) web site at http://www.sec.gov.
You may also call 1-800-544-8544 if you’re an individual investing directly with Fidelity, call 1-800-835-5092 if you’re a plan sponsor or participant with Fidelity as your recordkeeper or call 1-877-208-0098 on institutional accounts or if you’re an advisor or invest through one to request a free copy of the proxy voting guidelines.
Standard & Poor's, S&P and S&P 500 are registered service marks of The McGraw-Hill Companies, Inc. and have been licensed for use by Fidelity Distributors Corporation.
Other third-party marks appearing herein are the property of their respective owners.
All other marks appearing herein are registered or unregistered trademarks or service marks of FMR LLC or an affiliated company. © 2019 FMR LLC. All rights reserved.
This report and the financial statements contained herein are submitted for the general information of the shareholders of the Fund. This report is not authorized for distribution to prospective investors in the Fund unless preceded or accompanied by an effective prospectus.
A fund files its complete schedule of portfolio holdings with the SEC for the first and third quarters of each fiscal year on Form N-Q. Forms N-Q are available on the SEC’s web site at http://www.sec.gov. A fund's Forms N-Q may be reviewed and copied at the SEC’s Public Reference Room in Washington, DC. Information regarding the operation of the SEC's Public Reference Room may be obtained by calling 1-800-SEC-0330.
For a complete list of a fund's portfolio holdings, view the most recent holdings listing, semiannual report, or annual report on Fidelity's web site at http://www.fidelity.com, http://www.institutional.fidelity.com, or http://www.401k.com, as applicable.
NOT FDIC INSURED •MAY LOSE VALUE •NO BANK GUARANTEE
Neither the Fund nor Fidelity Distributors Corporation is a bank.
Performance: The Bottom Line
Average annual total return reflects the change in the value of an investment, assuming reinvestment of distributions from dividend income and capital gains (the profits earned upon the sale of securities that have grown in value, if any) and assuming a constant rate of performance each year. The hypothetical investment and the average annual total returns do not reflect the deduction of taxes that a shareholder would pay on fund distributions or the redemption of fund shares. During periods of reimbursement by Fidelity, a fund’s total return will be greater than it would be had the reimbursement not occurred. How a fund did yesterday is no guarantee of how it will do tomorrow.
Average Annual Total Returns
| For the periods ended January 31, 2019 | Past 1 year | Past 5 years | Past 10 years |
| Class A (incl. 5.75% sales charge) | (16.34)% | 4.78% | 13.72% |
| Class M (incl. 3.50% sales charge) | (14.58)% | 4.98% | 13.68% |
| Class C (incl. contingent deferred sales charge) | (12.68)% | 5.25% | 13.53% |
| Fidelity® Mid Cap Value Fund | (10.97)% | 6.35% | 14.73% |
| Class I | (10.99)% | 6.34% | 14.71% |
| Class Z | (10.86)% | 6.40% | 14.74% |
Class C shares' contingent deferred sales charges included in the past one year, past five years and past ten years total return figures are 1%, 0% and 0%, respectively.
The initial offering of Class Z shares took place on February 1, 2017. Returns prior to February 1, 2017, are those of Class I.
$10,000 Over 10 Years
Let's say hypothetically that $10,000 was invested in Fidelity® Mid Cap Value Fund, a class of the fund, on January 31, 2009.
The chart shows how the value of your investment would have changed, and also shows how the Russell Midcap® Value Index performed over the same period.
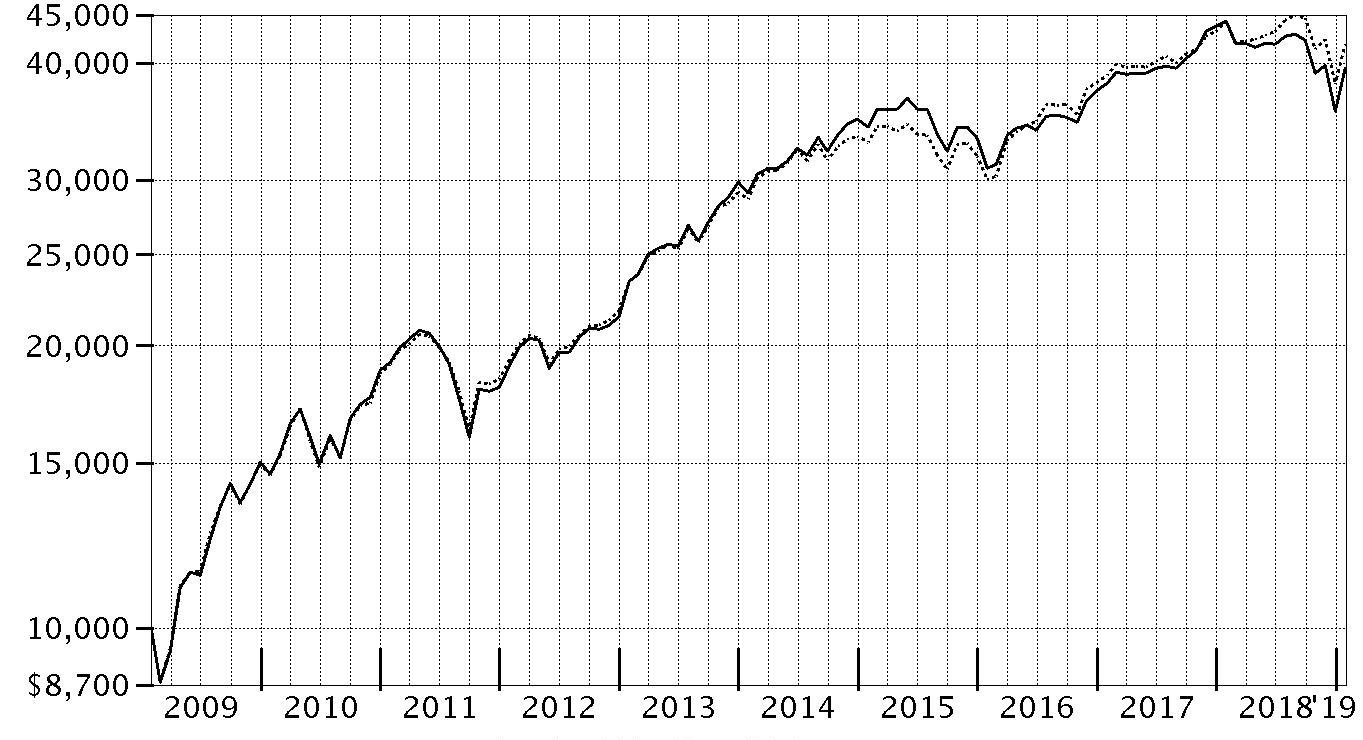
| Period Ending Values | ||
| $39,502 | Fidelity® Mid Cap Value Fund | |
| $41,865 | Russell Midcap® Value Index | |
Management's Discussion of Fund Performance
Market Recap: The S&P 500® index returned -2.31% for the 12 months ending January 31, 2019, as the U.S. equity bellwether began the new year on a high note after enduring a final quarter of 2018 in which resurgent volatility upset the aging bull market. In October, rising U.S. Treasury yields and concern about peaking corporate earnings growth sent many investors fleeing from risk assets as they were still dealing with lingering uncertainty related to global trade and the U.S. Federal Reserve picking up the pace of interest rate hikes. The index returned -6.84% in October, at the time its largest monthly drop in seven years. But conditions worsened through Christmas, as jitters about the economy and another hike in rates led to a spike in market volatility and a -9.03% result for December. Sharply reversing course to begin 2019, the S&P 500® gained 8.01% in January, its strongest opening month since 1987, amid upbeat company earnings/outlooks and signs the Fed may pause on rates. For the full period, some economically sensitive sectors were at the bottom of the 12-month performance scale: materials (-14%), energy (-12%), financials (-11%) and industrials (-8%). Meanwhile, communication services – which includes dividend-rich telecom stocks – and consumer staples returned about -5%. In contrast, the defensive utilities (+11%), real estate (+10%) and health care (+5%) sectors led the way. Information technology and consumer discretionary were rattled in the late-2018 downturn, but earlier strength resulted in each advancing about 3%.Comments from Portfolio Manager Kevin Walenta: For the fiscal year, the fund’s share classes (excluding sales charges, if applicable) returned roughly -11% to -12%, notably trailing the -5.43% result of the benchmark Russell Midcap® Value Index. The fund had more of a value bias than the benchmark, which meant the stocks it owned were generally cheaper than the benchmark average. This hurt relative performance, resulting in particularly disappointing stock picks within the financials, real estate and information technology sectors. Among the biggest individual detractors were overweight stakes in asset management company Invesco (-47%), which was pressured by increased price competition and the late 2018 stock market decline, along with real estate services company Realogy Holdings (-35%), which underperformed amid weaker housing market data. Conversely, security selection in the energy and utilities sectors aided the fund’s relative performance. Specifically, within energy our bias toward refiners was a plus, as declining oil prices aided the group. The portfolio’s top individual contributor was Ameren, an electric utility and the fund’s biggest position at period-end. Its shares gained 26% for the 12-month period, benefiting as an improved regulatory environment in Missouri led investors to anticipate that the company’s ability to deploy more capital in the state would eventually aid revenue and earnings growth.The views expressed above reflect those of the portfolio manager(s) only through the end of the period as stated on the cover of this report and do not necessarily represent the views of Fidelity or any other person in the Fidelity organization. Any such views are subject to change at any time based upon market or other conditions and Fidelity disclaims any responsibility to update such views. These views may not be relied on as investment advice and, because investment decisions for a Fidelity fund are based on numerous factors, may not be relied on as an indication of trading intent on behalf of any Fidelity fund.
Investment Summary (Unaudited)
Top Ten Stocks as of January 31, 2019
| % of fund's net assets | |
| Ameren Corp. | 2.5 |
| CBRE Group, Inc. | 2.4 |
| M&T Bank Corp. | 2.3 |
| Lear Corp. | 2.1 |
| Universal Health Services, Inc. Class B | 2.1 |
| Ingersoll-Rand PLC | 2.0 |
| Synchrony Financial | 2.0 |
| AMETEK, Inc. | 1.9 |
| VEREIT, Inc. | 1.8 |
| HollyFrontier Corp. | 1.8 |
| 20.9 |
Top Five Market Sectors as of January 31, 2019
| % of fund's net assets | |
| Financials | 17.9 |
| Real Estate | 14.3 |
| Industrials | 13.3 |
| Utilities | 11.4 |
| Consumer Discretionary | 8.6 |
Asset Allocation (% of fund's net assets)
| As of January 31, 2019 * | ||
| Stocks | 99.2% | |
| Short-Term Investments and Net Other Assets (Liabilities) | 0.8% | |

* Foreign investments - 6.9%
Schedule of Investments January 31, 2019
Showing Percentage of Net Assets
| Common Stocks - 99.2% | |||
| Shares | Value | ||
| COMMUNICATION SERVICES - 1.7% | |||
| Media - 1.7% | |||
| Omnicom Group, Inc. | 459,700 | $35,801,436 | |
| CONSUMER DISCRETIONARY - 8.6% | |||
| Auto Components - 3.0% | |||
| BorgWarner, Inc. | 283,600 | 11,599,240 | |
| Gentex Corp. | 352,800 | 7,472,304 | |
| Lear Corp. | 276,200 | 42,515,466 | |
| 61,587,010 | |||
| Household Durables - 1.6% | |||
| NVR, Inc. (a) | 2,520 | 6,703,200 | |
| Toll Brothers, Inc. | 689,000 | 25,451,660 | |
| 32,154,860 | |||
| Specialty Retail - 4.0% | |||
| Best Buy Co., Inc. | 548,900 | 32,516,836 | |
| Dick's Sporting Goods, Inc. | 449,200 | 15,861,252 | |
| Williams-Sonoma, Inc. (b) | 592,300 | 32,238,889 | |
| 80,616,977 | |||
| TOTAL CONSUMER DISCRETIONARY | 174,358,847 | ||
| CONSUMER STAPLES - 5.5% | |||
| Beverages - 1.0% | |||
| Molson Coors Brewing Co. Class B | 322,500 | 21,481,725 | |
| Food Products - 4.5% | |||
| Ingredion, Inc. | 274,700 | 27,195,300 | |
| The J.M. Smucker Co. | 272,000 | 28,527,360 | |
| Tyson Foods, Inc. Class A | 573,700 | 35,523,504 | |
| 91,246,164 | |||
| TOTAL CONSUMER STAPLES | 112,727,889 | ||
| ENERGY - 5.8% | |||
| Energy Equipment & Services - 0.5% | |||
| RPC, Inc. (b) | 924,192 | 9,972,032 | |
| Oil, Gas & Consumable Fuels - 5.3% | |||
| Cimarex Energy Co. | 447,700 | 33,729,718 | |
| HollyFrontier Corp. | 653,140 | 36,797,908 | |
| Murphy Oil Corp. | 261,400 | 7,149,290 | |
| PBF Energy, Inc. Class A | 773,677 | 28,332,052 | |
| Peabody Energy Corp. | 56,400 | 2,013,480 | |
| 108,022,448 | |||
| TOTAL ENERGY | 117,994,480 | ||
| FINANCIALS - 17.9% | |||
| Banks - 3.9% | |||
| Huntington Bancshares, Inc. | 768,100 | 10,169,644 | |
| M&T Bank Corp. | 283,600 | 46,663,544 | |
| PacWest Bancorp | 299,500 | 11,557,705 | |
| Umpqua Holdings Corp. | 691,200 | 12,220,416 | |
| 80,611,309 | |||
| Capital Markets - 4.4% | |||
| Affiliated Managers Group, Inc. | 129,600 | 13,601,520 | |
| Franklin Resources, Inc. | 282,700 | 8,370,747 | |
| Invesco Ltd. | 1,168,700 | 21,293,714 | |
| Lazard Ltd. Class A | 650,500 | 25,883,395 | |
| Legg Mason, Inc. | 688,000 | 20,502,400 | |
| 89,651,776 | |||
| Consumer Finance - 3.7% | |||
| Discover Financial Services | 520,700 | 35,142,043 | |
| Synchrony Financial | 1,316,000 | 39,532,640 | |
| 74,674,683 | |||
| Insurance - 5.6% | |||
| Allstate Corp. | 46,800 | 4,112,316 | |
| American Financial Group, Inc. | 99,600 | 9,500,844 | |
| American National Insurance Co. | 130,300 | 18,136,457 | |
| Everest Re Group Ltd. | 33,800 | 7,403,890 | |
| First American Financial Corp. | 701,226 | 35,117,398 | |
| Hartford Financial Services Group, Inc. | 452,000 | 21,207,840 | |
| Torchmark Corp. | 228,800 | 19,164,288 | |
| 114,643,033 | |||
| Mortgage Real Estate Investment Trusts - 0.3% | |||
| Chimera Investment Corp. | 325,200 | 6,188,556 | |
| TOTAL FINANCIALS | 365,769,357 | ||
| HEALTH CARE - 5.5% | |||
| Biotechnology - 1.0% | |||
| United Therapeutics Corp. (a) | 168,800 | 19,467,704 | |
| Health Care Providers & Services - 3.7% | |||
| Laboratory Corp. of America Holdings (a) | 235,700 | 32,844,795 | |
| Universal Health Services, Inc. Class B | 315,800 | 41,852,974 | |
| 74,697,769 | |||
| Pharmaceuticals - 0.8% | |||
| Jazz Pharmaceuticals PLC (a) | 138,100 | 17,385,409 | |
| TOTAL HEALTH CARE | 111,550,882 | ||
| INDUSTRIALS - 13.3% | |||
| Air Freight & Logistics - 0.2% | |||
| C.H. Robinson Worldwide, Inc. | 46,600 | 4,043,482 | |
| Airlines - 0.2% | |||
| Southwest Airlines Co. | 72,900 | 4,137,804 | |
| Building Products - 0.5% | |||
| Masco Corp. | 279,200 | 9,048,872 | |
| Commercial Services & Supplies - 0.7% | |||
| Deluxe Corp. | 282,000 | 13,245,540 | |
| Electrical Equipment - 3.3% | |||
| Acuity Brands, Inc. | 175,300 | 21,195,523 | |
| AMETEK, Inc. | 531,000 | 38,709,900 | |
| Regal Beloit Corp. | 105,500 | 8,098,180 | |
| 68,003,603 | |||
| Machinery - 7.3% | |||
| Allison Transmission Holdings, Inc. | 119,400 | 5,811,198 | |
| Crane Co. | 57,800 | 4,783,528 | |
| Cummins, Inc. | 233,100 | 34,291,341 | |
| Ingersoll-Rand PLC | 417,800 | 41,796,712 | |
| Oshkosh Corp. | 150,400 | 11,287,520 | |
| Parker Hannifin Corp. | 128,200 | 21,128,642 | |
| Snap-On, Inc. | 178,600 | 29,645,814 | |
| 148,744,755 | |||
| Professional Services - 0.4% | |||
| Manpower, Inc. | 102,200 | 8,076,866 | |
| Trading Companies & Distributors - 0.7% | |||
| MSC Industrial Direct Co., Inc. Class A | 177,000 | 14,777,730 | |
| TOTAL INDUSTRIALS | 270,078,652 | ||
| INFORMATION TECHNOLOGY - 8.4% | |||
| Communications Equipment - 1.2% | |||
| F5 Networks, Inc. (a) | 145,200 | 23,369,940 | |
| IT Services - 5.0% | |||
| Amdocs Ltd. | 513,846 | 28,713,714 | |
| Cognizant Technology Solutions Corp. Class A | 77,300 | 5,386,264 | |
| DXC Technology Co. | 554,400 | 35,548,128 | |
| Leidos Holdings, Inc. | 476,700 | 27,648,600 | |
| Maximus, Inc. | 72,400 | 5,077,412 | |
| 102,374,118 | |||
| Semiconductors & Semiconductor Equipment - 0.9% | |||
| Skyworks Solutions, Inc. | 258,100 | 18,851,624 | |
| Technology Hardware, Storage & Peripherals - 1.3% | |||
| Western Digital Corp. | 571,800 | 25,725,282 | |
| TOTAL INFORMATION TECHNOLOGY | 170,320,964 | ||
| MATERIALS - 6.8% | |||
| Chemicals - 4.5% | |||
| Huntsman Corp. | 1,673,200 | 36,760,204 | |
| Innospec, Inc. | 235,426 | 16,543,385 | |
| Olin Corp. | 308,500 | 7,283,685 | |
| Westlake Chemical Corp. | 424,400 | 31,363,160 | |
| 91,950,434 | |||
| Containers & Packaging - 0.7% | |||
| Packaging Corp. of America | 43,800 | 4,131,216 | |
| Sonoco Products Co. | 180,700 | 10,404,706 | |
| 14,535,922 | |||
| Metals & Mining - 1.4% | |||
| Nucor Corp. | 300,900 | 18,427,116 | |
| Steel Dynamics, Inc. | 287,200 | 10,508,648 | |
| 28,935,764 | |||
| Paper & Forest Products - 0.2% | |||
| Louisiana-Pacific Corp. | 124,700 | 3,040,186 | |
| TOTAL MATERIALS | 138,462,306 | ||
| REAL ESTATE - 14.3% | |||
| Equity Real Estate Investment Trusts (REITs) - 8.8% | |||
| Apple Hospitality (REIT), Inc. | 1,730,400 | 28,395,864 | |
| Brixmor Property Group, Inc. | 1,033,900 | 17,710,707 | |
| Gaming & Leisure Properties | 759,400 | 28,477,500 | |
| Hospitality Properties Trust (SBI) | 689,000 | 18,368,740 | |
| Park Hotels & Resorts, Inc. | 1,159,400 | 34,863,158 | |
| Public Storage | 72,500 | 15,407,700 | |
| VEREIT, Inc. | 4,597,100 | 37,144,568 | |
| 180,368,237 | |||
| Real Estate Management & Development - 5.5% | |||
| CBRE Group, Inc. (a) | 1,064,100 | 48,682,575 | |
| Jones Lang LaSalle, Inc. | 236,400 | 33,902,124 | |
| Realogy Holdings Corp. (b) | 1,628,900 | 28,912,975 | |
| 111,497,674 | |||
| TOTAL REAL ESTATE | 291,865,911 | ||
| UTILITIES - 11.4% | |||
| Electric Utilities - 2.0% | |||
| OGE Energy Corp. | 836,700 | 34,262,865 | |
| Otter Tail Corp. | 18,948 | 918,031 | |
| Portland General Electric Co. | 111,900 | 5,407,008 | |
| 40,587,904 | |||
| Gas Utilities - 1.2% | |||
| National Fuel Gas Co. | 126,800 | 7,265,640 | |
| UGI Corp. | 291,900 | 16,647,057 | |
| 23,912,697 | |||
| Independent Power and Renewable Electricity Producers - 1.4% | |||
| NRG Energy, Inc. | 709,300 | 29,017,463 | |
| Multi-Utilities - 6.8% | |||
| Ameren Corp. | 732,300 | 50,777,681 | |
| Avangrid, Inc. | 39,222 | 1,956,001 | |
| CenterPoint Energy, Inc. | 818,500 | 25,308,020 | |
| MDU Resources Group, Inc. | 1,195,900 | 30,746,589 | |
| WEC Energy Group, Inc. | 409,100 | 29,876,573 | |
| 138,664,864 | |||
| TOTAL UTILITIES | 232,182,928 | ||
| TOTAL COMMON STOCKS | |||
| (Cost $2,083,840,039) | 2,021,113,652 | ||
| Money Market Funds - 4.4% | |||
| Fidelity Cash Central Fund, 2.43% (c) | 15,833,008 | 15,836,174 | |
| Fidelity Securities Lending Cash Central Fund 2.43% (c)(d) | 73,253,995 | 73,261,321 | |
| TOTAL MONEY MARKET FUNDS | |||
| (Cost $89,097,495) | 89,097,495 | ||
| TOTAL INVESTMENT IN SECURITIES - 103.6% | |||
| (Cost $2,172,937,534) | 2,110,211,147 | ||
| NET OTHER ASSETS (LIABILITIES) - (3.6)% | (73,077,635) | ||
| NET ASSETS - 100% | $2,037,133,512 |
Legend
(a) Non-income producing
(b) Security or a portion of the security is on loan at period end.
(c) Affiliated fund that is generally available only to investment companies and other accounts managed by Fidelity Investments. The rate quoted is the annualized seven-day yield of the fund at period end. A complete unaudited listing of the fund's holdings as of its most recent quarter end is available upon request. In addition, each Fidelity Central Fund's financial statements, which are not covered by the Fund's Report of Independent Registered Public Accounting Firm, are available on the SEC's website or upon request.
(d) Investment made with cash collateral received from securities on loan.
Affiliated Central Funds
Information regarding fiscal year to date income earned by the Fund from investments in Fidelity Central Funds is as follows:
| Fund | Income earned |
| Fidelity Cash Central Fund | $647,989 |
| Fidelity Securities Lending Cash Central Fund | 305,600 |
| Total | $953,589 |
Amounts in the income column in the above table include any capital gain distributions from underlying funds, which are presented in the corresponding line-item in the Statement of Operations, if applicable.
Investment Valuation
All investments are categorized as Level 1 under the Fair Value Hierarchy. The inputs or methodology used for valuing securities may not be an indication of the risk associated with investing in those securities. For more information on valuation inputs please refer to the Investment Valuation section in the accompanying Notes to Financial Statements.
See accompanying notes which are an integral part of the financial statements.
Financial Statements
Statement of Assets and Liabilities
| January 31, 2019 | ||
| Assets | ||
| Investment in securities, at value (including securities loaned of $72,539,347) — See accompanying schedule: Unaffiliated issuers (cost $2,083,840,039) | $2,021,113,652 | |
| Fidelity Central Funds (cost $89,097,495) | 89,097,495 | |
| Total Investment in Securities (cost $2,172,937,534) | $2,110,211,147 | |
| Receivable for investments sold | 26,379,067 | |
| Receivable for fund shares sold | 1,181,839 | |
| Dividends receivable | 733,331 | |
| Distributions receivable from Fidelity Central Funds | 58,316 | |
| Prepaid expenses | 3,328 | |
| Other receivables | 51,879 | |
| Total assets | 2,138,618,907 | |
| Liabilities | ||
| Payable for investments purchased | $23,792,001 | |
| Payable for fund shares redeemed | 3,508,249 | |
| Accrued management fee | 388,448 | |
| Distribution and service plan fees payable | 121,343 | |
| Other affiliated payables | 365,502 | |
| Other payables and accrued expenses | 55,192 | |
| Collateral on securities loaned | 73,254,660 | |
| Total liabilities | 101,485,395 | |
| Net Assets | $2,037,133,512 | |
| Net Assets consist of: | ||
| Paid in capital | $2,164,273,190 | |
| Total distributable earnings (loss) | (127,139,678) | |
| Net Assets | $2,037,133,512 | |
| Net Asset Value and Maximum Offering Price | ||
| Class A: | ||
| Net Asset Value and redemption price per share ($173,538,257 ÷ 8,297,321 shares) | $20.91 | |
| Maximum offering price per share (100/94.25 of $20.91) | $22.19 | |
| Class M: | ||
| Net Asset Value and redemption price per share ($41,539,801 ÷ 1,995,119 shares) | $20.82 | |
| Maximum offering price per share (100/96.50 of $20.82) | $21.58 | |
| Class C: | ||
| Net Asset Value and offering price per share ($85,519,285 ÷ 4,234,896 shares)(a) | $20.19 | |
| Mid Cap Value: | ||
| Net Asset Value, offering price and redemption price per share ($1,456,509,740 ÷ 68,613,265 shares) | $21.23 | |
| Class I: | ||
| Net Asset Value, offering price and redemption price per share ($244,054,241 ÷ 11,604,068 shares) | $21.03 | |
| Class Z: | ||
| Net Asset Value, offering price and redemption price per share ($35,972,188 ÷ 1,711,996 shares) | $21.01 |
(a) Redemption price per share is equal to net asset value less any applicable contingent deferred sales charge.
See accompanying notes which are an integral part of the financial statements.
Statement of Operations
| Year ended January 31, 2019 | ||
| Investment Income | ||
| Dividends | $63,507,575 | |
| Income from Fidelity Central Funds | 953,589 | |
| Total income | 64,461,164 | |
| Expenses | ||
| Management fee | ||
| Basic fee | $14,056,287 | |
| Performance adjustment | (5,890,864) | |
| Transfer agent fees | 4,732,787 | |
| Distribution and service plan fees | 1,874,731 | |
| Accounting and security lending fees | 789,875 | |
| Custodian fees and expenses | 29,023 | |
| Independent trustees' fees and expenses | 15,008 | |
| Registration fees | 126,258 | |
| Audit | 65,858 | |
| Legal | 10,217 | |
| Interest | 27,922 | |
| Miscellaneous | 20,359 | |
| Total expenses before reductions | 15,857,461 | |
| Expense reductions | (351,187) | |
| Total expenses after reductions | 15,506,274 | |
| Net investment income (loss) | 48,954,890 | |
| Realized and Unrealized Gain (Loss) | ||
| Net realized gain (loss) on: | ||
| Investment securities: | ||
| Unaffiliated issuers | 88,479,586 | |
| Fidelity Central Funds | (2,017) | |
| Total net realized gain (loss) | 88,477,569 | |
| Change in net unrealized appreciation (depreciation) on investment securities | (459,352,496) | |
| Net gain (loss) | (370,874,927) | |
| Net increase (decrease) in net assets resulting from operations | $(321,920,037) |
See accompanying notes which are an integral part of the financial statements.
Statement of Changes in Net Assets
| Year ended January 31, 2019 | Year ended January 31, 2018 | |
| Increase (Decrease) in Net Assets | ||
| Operations | ||
| Net investment income (loss) | $48,954,890 | $61,030,404 |
| Net realized gain (loss) | 88,477,569 | 487,601,104 |
| Change in net unrealized appreciation (depreciation) | (459,352,496) | (59,357,105) |
| Net increase (decrease) in net assets resulting from operations | (321,920,037) | 489,274,403 |
| Distributions to shareholders | (293,130,399) | – |
| Distributions to shareholders from net investment income | – | (54,603,613) |
| Distributions to shareholders from net realized gain | – | (213,044,374) |
| Total distributions | (293,130,399) | (267,647,987) |
| Share transactions - net increase (decrease) | (576,020,015) | (288,117,505) |
| Total increase (decrease) in net assets | (1,191,070,451) | (66,491,089) |
| Net Assets | ||
| Beginning of period | 3,228,203,963 | 3,294,695,052 |
| End of period | $2,037,133,512 | $3,228,203,963 |
| Other Information | ||
| Undistributed net investment income end of period | $3,307,621 |
See accompanying notes which are an integral part of the financial statements.
Financial Highlights
Fidelity Mid Cap Value Fund Class A
| Years ended January 31, | 2019 | 2018 | 2017 | 2016 | 2015 |
| Selected Per–Share Data | |||||
| Net asset value, beginning of period | $26.62 | $24.94 | $20.52 | $23.90 | $21.78 |
| Income from Investment Operations | |||||
| Net investment income (loss)A | .39 | .44B | .29 | .29 | .24 |
| Net realized and unrealized gain (loss) | (3.35) | 3.54 | 4.40 | (2.57) | 3.45 |
| Total from investment operations | (2.96) | 3.98 | 4.69 | (2.28) | 3.69 |
| Distributions from net investment income | (.40) | (.43) | (.27) | (.28) | (.17) |
| Distributions from net realized gain | (2.35) | (1.87) | – | (.82) | (1.40) |
| Total distributions | (2.75) | (2.30) | (.27) | (1.10) | (1.57) |
| Redemption fees added to paid in capitalA | – | – | –C | –C | –C |
| Net asset value, end of period | $20.91 | $26.62 | $24.94 | $20.52 | $23.90 |
| Total ReturnD,E | (11.23)% | 16.13% | 22.87% | (9.83)% | 17.32% |
| Ratios to Average Net AssetsF,G | |||||
| Expenses before reductions | .82% | .98% | 1.01% | 1.14% | 1.15% |
| Expenses net of fee waivers, if any | .82% | .98% | 1.01% | 1.14% | 1.15% |
| Expenses net of all reductions | .81% | .97% | 1.00% | 1.14% | 1.15% |
| Net investment income (loss) | 1.66% | 1.67%B | 1.25% | 1.21% | 1.04% |
| Supplemental Data | |||||
| Net assets, end of period (000 omitted) | $173,538 | $255,907 | $299,124 | $277,462 | $171,263 |
| Portfolio turnover rateH | 80%I | 138%I | 83% | 83% | 69% |
A Calculated based on average shares outstanding during the period.
B Net investment income per share reflects a large, non-recurring dividend which amounted to $.17 per share. Excluding this non-recurring dividend, the ratio of net investment income (loss) to average net assets would have been 1.18%.
C Amount represents less than $.005 per share.
D Total returns would have been lower if certain expenses had not been reduced during the applicable periods shown.
E Total returns do not include the effect of the sales charges.
F Fees and expenses of any underlying Fidelity Central Funds are not included in the Fund's expense ratio. The Fund indirectly bears its proportionate share of the expenses of any underlying Fidelity Central Funds.
G Expense ratios reflect operating expenses of the class. Expenses before reductions do not reflect amounts reimbursed by the investment adviser or reductions from brokerage service arrangements or reductions from other expense offset arrangements and do not represent the amount paid by the class during periods when reimbursements or reductions occur. Expenses net of fee waivers reflect expenses after reimbursement by the investment adviser but prior to reductions from brokerage service arrangements or other expense offset arrangements. Expenses net of all reductions represent the net expenses paid by the class.
H Amount does not include the portfolio activity of any underlying Fidelity Central Funds.
I Portfolio turnover rate excludes securities received or delivered in-kind.
See accompanying notes which are an integral part of the financial statements.
Fidelity Mid Cap Value Fund Class M
| Years ended January 31, | 2019 | 2018 | 2017 | 2016 | 2015 |
| Selected Per–Share Data | |||||
| Net asset value, beginning of period | $26.51 | $24.84 | $20.46 | $23.81 | $21.70 |
| Income from Investment Operations | |||||
| Net investment income (loss)A | .32 | .36B | .22 | .22 | .17 |
| Net realized and unrealized gain (loss) | (3.33) | 3.54 | 4.38 | (2.54) | 3.44 |
| Total from investment operations | (3.01) | 3.90 | 4.60 | (2.32) | 3.61 |
| Distributions from net investment income | (.33) | (.35) | (.22) | (.21) | (.10) |
| Distributions from net realized gain | (2.35) | (1.87) | – | (.82) | (1.40) |
| Total distributions | (2.68) | (2.23)C | (.22) | (1.03) | (1.50) |
| Redemption fees added to paid in capitalA | – | – | –D | –D | –D |
| Net asset value, end of period | $20.82 | $26.51 | $24.84 | $20.46 | $23.81 |
| Total ReturnE,F | (11.48)% | 15.84% | 22.48% | (10.04)% | 16.98% |
| Ratios to Average Net AssetsG,H | |||||
| Expenses before reductions | 1.10% | 1.25% | 1.29% | 1.42% | 1.44% |
| Expenses net of fee waivers, if any | 1.10% | 1.25% | 1.29% | 1.42% | 1.44% |
| Expenses net of all reductions | 1.09% | 1.24% | 1.29% | 1.42% | 1.44% |
| Net investment income (loss) | 1.39% | 1.40%B | .96% | .93% | .74% |
| Supplemental Data | |||||
| Net assets, end of period (000 omitted) | $41,540 | $57,807 | $60,761 | $46,084 | $40,752 |
| Portfolio turnover rateI | 80%J | 138%J | 83% | 83% | 69% |
A Calculated based on average shares outstanding during the period.
B Net investment income per share reflects a large, non-recurring dividend which amounted to $.17 per share. Excluding this non-recurring dividend, the ratio of net investment income (loss) to average net assets would have been .91%.
C Total distributions of $2.23 per share is comprised of distributions from net investment income of $.352 and distributions from net realized gain of $1.873 per share.
D Amount represents less than $.005 per share.
E Total returns would have been lower if certain expenses had not been reduced during the applicable periods shown.
F Total returns do not include the effect of the sales charges.
G Fees and expenses of any underlying Fidelity Central Funds are not included in the Fund's expense ratio. The Fund indirectly bears its proportionate share of the expenses of any underlying Fidelity Central Funds.
H Expense ratios reflect operating expenses of the class. Expenses before reductions do not reflect amounts reimbursed by the investment adviser or reductions from brokerage service arrangements or reductions from other expense offset arrangements and do not represent the amount paid by the class during periods when reimbursements or reductions occur. Expenses net of fee waivers reflect expenses after reimbursement by the investment adviser but prior to reductions from brokerage service arrangements or other expense offset arrangements. Expenses net of all reductions represent the net expenses paid by the class.
I Amount does not include the portfolio activity of any underlying Fidelity Central Funds.
J Portfolio turnover rate excludes securities received or delivered in-kind.
See accompanying notes which are an integral part of the financial statements.
Fidelity Mid Cap Value Fund Class C
| Years ended January 31, | 2019 | 2018 | 2017 | 2016 | 2015 |
| Selected Per–Share Data | |||||
| Net asset value, beginning of period | $25.76 | $24.22 | $19.95 | $23.30 | $21.31 |
| Income from Investment Operations | |||||
| Net investment income (loss)A | .21 | .23B | .11 | .11 | .07 |
| Net realized and unrealized gain (loss) | (3.23) | 3.43 | 4.27 | (2.49) | 3.37 |
| Total from investment operations | (3.02) | 3.66 | 4.38 | (2.38) | 3.44 |
| Distributions from net investment income | (.20) | (.25) | (.11) | (.15) | (.06) |
| Distributions from net realized gain | (2.35) | (1.87) | – | (.81) | (1.39) |
| Total distributions | (2.55) | (2.12) | (.11) | (.97)C | (1.45) |
| Redemption fees added to paid in capitalA | – | – | –D | –D | –D |
| Net asset value, end of period | $20.19 | $25.76 | $24.22 | $19.95 | $23.30 |
| Total ReturnE,F | (11.89)% | 15.28% | 21.97% | (10.52)% | 16.48% |
| Ratios to Average Net AssetsG,H | |||||
| Expenses before reductions | 1.56% | 1.72% | 1.76% | 1.89% | 1.89% |
| Expenses net of fee waivers, if any | 1.56% | 1.72% | 1.76% | 1.89% | 1.89% |
| Expenses net of all reductions | 1.55% | 1.71% | 1.75% | 1.88% | 1.89% |
| Net investment income (loss) | .92% | .93%B | .50% | .47% | .29% |
| Supplemental Data | |||||
| Net assets, end of period (000 omitted) | $85,519 | $138,506 | $144,503 | $130,636 | $71,263 |
| Portfolio turnover rateI | 80%J | 138%J | 83% | 83% | 69% |
A Calculated based on average shares outstanding during the period.
B Net investment income per share reflects a large, non-recurring dividend which amounted to $.16 per share. Excluding this non-recurring dividend, the ratio of net investment income (loss) to average net assets would have been .44%.
C Total distributions of $.97 per share is comprised of distributions from net investment income of $.153 and distributions from net realized gain of $.812 per share.
D Amount represents less than $.005 per share.
E Total returns would have been lower if certain expenses had not been reduced during the applicable periods shown.
F Total returns do not include the effect of the contingent deferred sales charge.
G Fees and expenses of any underlying Fidelity Central Funds are not included in the Fund's expense ratio. The Fund indirectly bears its proportionate share of the expenses of any underlying Fidelity Central Funds.
H Expense ratios reflect operating expenses of the class. Expenses before reductions do not reflect amounts reimbursed by the investment adviser or reductions from brokerage service arrangements or reductions from other expense offset arrangements and do not represent the amount paid by the class during periods when reimbursements or reductions occur. Expenses net of fee waivers reflect expenses after reimbursement by the investment adviser but prior to reductions from brokerage service arrangements or other expense offset arrangements. Expenses net of all reductions represent the net expenses paid by the class.
I Amount does not include the portfolio activity of any underlying Fidelity Central Funds.
J Portfolio turnover rate excludes securities received or delivered in-kind.
See accompanying notes which are an integral part of the financial statements.
Fidelity Mid Cap Value Fund
| Years ended January 31, | 2019 | 2018 | 2017 | 2016 | 2015 |
| Selected Per–Share Data | |||||
| Net asset value, beginning of period | $26.99 | $25.24 | $20.76 | $24.15 | $21.96 |
| Income from Investment Operations | |||||
| Net investment income (loss)A | .47 | .52B | .35 | .36 | .32 |
| Net realized and unrealized gain (loss) | (3.41) | 3.60 | 4.46 | (2.60) | 3.49 |
| Total from investment operations | (2.94) | 4.12 | 4.81 | (2.24) | 3.81 |
| Distributions from net investment income | (.47) | (.50) | (.33) | (.33) | (.22) |
| Distributions from net realized gain | (2.35) | (1.87) | – | (.82) | (1.40) |
| Total distributions | (2.82) | (2.37) | (.33) | (1.15) | (1.62) |
| Redemption fees added to paid in capitalA | – | – | –C | –C | –C |
| Net asset value, end of period | $21.23 | $26.99 | $25.24 | $20.76 | $24.15 |
| Total ReturnD | (10.97)% | 16.51% | 23.19% | (9.58)% | 17.75% |
| Ratios to Average Net AssetsE,F | |||||
| Expenses before reductions | .53% | .69% | .73% | .86% | .83% |
| Expenses net of fee waivers, if any | .53% | .69% | .73% | .85% | .83% |
| Expenses net of all reductions | .52% | .68% | .72% | .85% | .83% |
| Net investment income (loss) | 1.96% | 1.96%B | 1.53% | 1.50% | 1.36% |
| Supplemental Data | |||||
| Net assets, end of period (000 omitted) | $1,456,510 | $2,332,143 | $2,426,359 | $2,331,665 | $2,691,765 |
| Portfolio turnover rateG | 80%H | 138%H | 83% | 83% | 69% |
A Calculated based on average shares outstanding during the period.
B Net investment income per share reflects a large, non-recurring dividend which amounted to $.17 per share. Excluding this non-recurring dividend, the ratio of net investment income (loss) to average net assets would have been 1.47%.
C Amount represents less than $.005 per share.
D Total returns would have been lower if certain expenses had not been reduced during the applicable periods shown.
E Fees and expenses of any underlying Fidelity Central Funds are not included in the Fund's expense ratio. The Fund indirectly bears its proportionate share of the expenses of any underlying Fidelity Central Funds.
F Expense ratios reflect operating expenses of the class. Expenses before reductions do not reflect amounts reimbursed by the investment adviser or reductions from brokerage service arrangements or reductions from other expense offset arrangements and do not represent the amount paid by the class during periods when reimbursements or reductions occur. Expenses net of fee waivers reflect expenses after reimbursement by the investment adviser but prior to reductions from brokerage service arrangements or other expense offset arrangements. Expenses net of all reductions represent the net expenses paid by the class.
G Amount does not include the portfolio activity of any underlying Fidelity Central Funds.
H Portfolio turnover rate excludes securities received or delivered in-kind.
See accompanying notes which are an integral part of the financial statements.
Fidelity Mid Cap Value Fund Class I
| Years ended January 31, | 2019 | 2018 | 2017 | 2016 | 2015 |
| Selected Per–Share Data | |||||
| Net asset value, beginning of period | $26.77 | $25.05 | $20.61 | $24.00 | $21.84 |
| Income from Investment Operations | |||||
| Net investment income (loss)A | .46 | .51B | .35 | .35 | .32 |
| Net realized and unrealized gain (loss) | (3.38) | 3.58 | 4.43 | (2.58) | 3.47 |
| Total from investment operations | (2.92) | 4.09 | 4.78 | (2.23) | 3.79 |
| Distributions from net investment income | (.47) | (.50) | (.34) | (.34) | (.23) |
| Distributions from net realized gain | (2.35) | (1.87) | – | (.82) | (1.40) |
| Total distributions | (2.82) | (2.37) | (.34) | (1.16) | (1.63) |
| Redemption fees added to paid in capitalA | – | – | –C | –C | –C |
| Net asset value, end of period | $21.03 | $26.77 | $25.05 | $20.61 | $24.00 |
| Total ReturnD | (10.99)% | 16.52% | 23.19% | (9.60)% | 17.75% |
| Ratios to Average Net AssetsE,F�� | |||||
| Expenses before reductions | .53% | .69% | .73% | .87% | .85% |
| Expenses net of fee waivers, if any | .53% | .69% | .73% | .86% | .85% |
| Expenses net of all reductions | .52% | .68% | .73% | .86% | .85% |
| Net investment income (loss) | 1.95% | 1.95%B | 1.53% | 1.49% | 1.33% |
| Supplemental Data | |||||
| Net assets, end of period (000 omitted) | $244,054 | $410,868 | $363,949 | $261,686 | $148,390 |
| Portfolio turnover rateG | 80%H | 138%H | 83% | 83% | 69% |
A Calculated based on average shares outstanding during the period.
B Net investment income per share reflects a large, non-recurring dividend which amounted to $.17 per share. Excluding this non-recurring dividend, the ratio of net investment income (loss) to average net assets would have been 1.47%.
C Amount represents less than $.005 per share.
D Total returns would have been lower if certain expenses had not been reduced during the applicable periods shown.
E Fees and expenses of any underlying Fidelity Central Funds are not included in the Fund's expense ratio. The Fund indirectly bears its proportionate share of the expenses of any underlying Fidelity Central Funds.
F Expense ratios reflect operating expenses of the class. Expenses before reductions do not reflect amounts reimbursed by the investment adviser or reductions from brokerage service arrangements or reductions from other expense offset arrangements and do not represent the amount paid by the class during periods when reimbursements or reductions occur. Expenses net of fee waivers reflect expenses after reimbursement by the investment adviser but prior to reductions from brokerage service arrangements or other expense offset arrangements. Expenses net of all reductions represent the net expenses paid by the class.
G Amount does not include the portfolio activity of any underlying Fidelity Central Funds.
H Portfolio turnover rate excludes securities received or delivered in-kind.
See accompanying notes which are an integral part of the financial statements.
Fidelity Mid Cap Value Fund Class Z
| Years ended January 31, | 2019 | 2018A |
| Selected Per–Share Data | ||
| Net asset value, beginning of period | $26.76 | $25.03 |
| Income from Investment Operations | ||
| Net investment income (loss)B | .49 | .56C |
| Net realized and unrealized gain (loss) | (3.38) | 3.59 |
| Total from investment operations | (2.89) | 4.15 |
| Distributions from net investment income | (.51) | (.54) |
| Distributions from net realized gain | (2.35) | (1.87) |
| Total distributions | (2.86) | (2.42)D |
| Net asset value, end of period | $21.01 | $26.76 |
| Total ReturnE | (10.86)% | 16.74% |
| Ratios to Average Net AssetsF,G | ||
| Expenses before reductions | .40% | .56% |
| Expenses net of fee waivers, if any | .40% | .56% |
| Expenses net of all reductions | .39% | .55% |
| Net investment income (loss) | 2.09% | 2.09%C |
| Supplemental Data | ||
| Net assets, end of period (000 omitted) | $35,972 | $32,974 |
| Portfolio turnover rateH | 80%I | 138%I |
A For the period February 1, 2017 (commencement of sale of shares) to January 31, 2018.
B Calculated based on average shares outstanding during the period.
C Net investment income per share reflects a large, non-recurring dividend which amounted to $.17 per share. Excluding this non-recurring dividend, the ratio of net investment income (loss) to average net assets would have been 1.60%.
D Total distributions of $2.42 per share is comprised of distributions from net investment income of $.542 and distributions from net realized gain of $1.873 per share.
E Total returns would have been lower if certain expenses had not been reduced during the applicable periods shown.
F Fees and expenses of any underlying Fidelity Central Funds are not included in the Fund's expense ratio. The Fund indirectly bears its proportionate share of the expenses of any underlying Fidelity Central Funds.
G Expense ratios reflect operating expenses of the class. Expenses before reductions do not reflect amounts reimbursed by the investment adviser or reductions from brokerage service arrangements or reductions from other expense offset arrangements and do not represent the amount paid by the class during periods when reimbursements or reductions occur. Expense ratios before reductions for start-up periods may not be representative of longer-term operating periods. Expenses net of fee waivers reflect expenses after reimbursement by the investment adviser but prior to reductions from brokerage service arrangements or other expense offset arrangements. Expenses net of all reductions represent the net expenses paid by the class.
H Amount does not include the portfolio activity of any underlying Fidelity Central Funds.
I Portfolio turnover rate excludes securities received or delivered in-kind.
See accompanying notes which are an integral part of the financial statements.
Notes to Financial Statements
For the period ended January 31, 2019
1. Organization.
Fidelity Mid Cap Value Fund (the Fund) is a fund of Fidelity Devonshire Trust (the Trust) and is authorized to issue an unlimited number of shares. The Trust is registered under the Investment Company Act of 1940, as amended (the 1940 Act), as an open-end management investment company organized as a Massachusetts business trust. The Fund offers Class A, Class M, Class C, Mid Cap Value, Class I and Class Z shares, each of which has equal rights as to assets and voting privileges. Each class has exclusive voting rights with respect to matters that affect that class.
Effective March 1, 2019, Class C shares will automatically convert to Class A shares after a holding period of ten years from the initial date of purchase, with certain exceptions.
2. Investments in Fidelity Central Funds.
The Fund invests in Fidelity Central Funds, which are open-end investment companies generally available only to other investment companies and accounts managed by the investment adviser and its affiliates. The Fund's Schedule of Investments lists each of the Fidelity Central Funds held as of period end, if any, as an investment of the Fund, but does not include the underlying holdings of each Fidelity Central Fund. As an Investing Fund, the Fund indirectly bears its proportionate share of the expenses of the underlying Fidelity Central Funds.
The Money Market Central Funds seek preservation of capital and current income and are managed by Fidelity Investments Money Management, Inc. (FIMM), an affiliate of the investment adviser. Annualized expenses of the Money Market Central Funds as of their most recent shareholder report date are less than .005%.
A complete unaudited list of holdings for each Fidelity Central Fund is available upon request or at the Securities and Exchange Commission (the SEC) website at www.sec.gov. In addition, the financial statements of the Fidelity Central Funds, which are not covered by the Fund's Report of Independent Registered Public Accounting Firm, are available on the SEC website or upon request.
3. Significant Accounting Policies.
The Fund is an investment company and applies the accounting and reporting guidance of the Financial Accounting Standards Board (FASB) Accounting Standards Codification Topic 946 Financial Services – Investments Companies. The financial statements have been prepared in conformity with accounting principles generally accepted in the United States of America (GAAP), which require management to make certain estimates and assumptions at the date of the financial statements. Actual results could differ from those estimates. Subsequent events, if any, through the date that the financial statements were issued have been evaluated in the preparation of the financial statements. The following summarizes the significant accounting policies of the Fund:
Investment Valuation. Investments are valued as of 4:00 p.m. Eastern time on the last calendar day of the period. The Board of Trustees (the Board) has delegated the day to day responsibility for the valuation of the Fund's investments to the Fair Value Committee (the Committee) established by the Fund's investment adviser. In accordance with valuation policies and procedures approved by the Board, the Fund attempts to obtain prices from one or more third party pricing vendors or brokers to value its investments. When current market prices, quotations or currency exchange rates are not readily available or reliable, investments will be fair valued in good faith by the Committee, in accordance with procedures adopted by the Board. Factors used in determining fair value vary by investment type and may include market or investment specific events. The frequency with which these procedures are used cannot be predicted and they may be utilized to a significant extent. The Committee oversees the Fund's valuation policies and procedures and reports to the Board on the Committee's activities and fair value determinations. The Board monitors the appropriateness of the procedures used in valuing the Fund's investments and ratifies the fair value determinations of the Committee.
The Fund categorizes the inputs to valuation techniques used to value its investments into a disclosure hierarchy consisting of three levels as shown below:
- Level 1 – quoted prices in active markets for identical investments
- Level 2 – other significant observable inputs (including quoted prices for similar investments, interest rates, prepayment speeds, etc.)
- Level 3 – unobservable inputs (including the Fund's own assumptions based on the best information available)
Valuation techniques used to value the Fund's investments by major category are as follows:
Equity securities, including restricted securities, for which market quotations are readily available, are valued at the last reported sale price or official closing price as reported by a third party pricing vendor on the primary market or exchange on which they are traded and are categorized as Level 1 in the hierarchy. In the event there were no sales during the day or closing prices are not available, securities are valued at the last quoted bid price or may be valued using the last available price and are generally categorized as Level 2 in the hierarchy. For foreign equity securities, when market or security specific events arise, comparisons to the valuation of American Depositary Receipts (ADRs), futures contracts, Exchange-Traded Funds (ETFs) and certain indexes as well as quoted prices for similar securities may be used and would be categorized as Level 2 in the hierarchy. For equity securities, including restricted securities, where observable inputs are limited, assumptions about market activity and risk are used and these securities may be categorized as Level 3 in the hierarchy.
Investments in open-end mutual funds, including the Fidelity Central Funds, are valued at their closing net asset value (NAV) each business day and are categorized as Level 1 in the hierarchy.
Changes in valuation techniques may result in transfers in or out of an assigned level within the disclosure hierarchy.
Investment Transactions and Income. For financial reporting purposes, the Fund's investment holdings and NAV include trades executed through the end of the last business day of the period. The NAV per share for processing shareholder transactions is calculated as of the close of business of the New York Stock Exchange (NYSE), normally 4:00 p.m. Eastern time and include trades executed through the end of the prior business day. Gains and losses on securities sold are determined on the basis of identified cost and include proceeds received from litigation. Dividend income is recorded on the ex-dividend date, except for certain dividends from foreign securities where the ex-dividend date may have passed, which are recorded as soon as the Fund is informed of the ex-dividend date. Non-cash dividends included in dividend income, if any, are recorded at the fair market value of the securities received. Income and capital gain distributions from Fidelity Central Funds, if any, are recorded on the ex-dividend date. Certain distributions received by the Fund represent a return of capital or capital gain. The Fund determines the components of these distributions subsequent to the ex-dividend date, based upon receipt of tax filings or other correspondence relating to the underlying investment. These distributions are recorded as a reduction of cost of investments and/or as a realized gain.
Class Allocations and Expenses. Investment income, realized and unrealized capital gains and losses, common expenses of the Fund, and certain fund-level expense reductions, if any, are allocated daily on a pro-rata basis to each class based on the relative net assets of each class to the total net assets of the Fund. Each class differs with respect to transfer agent and distribution and service plan fees incurred. Certain expense reductions may also differ by class. For the reporting period, the allocated portion of income and expenses to each class as a percent of its average net assets may vary due to the timing of recording these transactions in relation to fluctuating net assets of the classes. Expenses directly attributable to a fund are charged to that fund. Expenses attributable to more than one fund are allocated among the respective funds on the basis of relative net assets or other appropriate methods. Expense estimates are accrued in the period to which they relate and adjustments are made when actual amounts are known.
Income Tax Information and Distributions to Shareholders. Each year, the Fund intends to qualify as a regulated investment company under Subchapter M of the Internal Revenue Code, including distributing substantially all of its taxable income and realized gains. As a result, no provision for U.S. Federal income taxes is required. As of January 31, 2019, the Fund did not have any unrecognized tax benefits in the financial statements; nor is the Fund aware of any tax positions for which it is reasonably possible that the total amounts of unrecognized tax benefits will significantly change in the next twelve months. The Fund files a U.S. federal tax return, in addition to state and local tax returns as required. The Fund's federal income tax returns are subject to examination by the Internal Revenue Service (IRS) for a period of three fiscal years after they are filed. State and local tax returns may be subject to examination for an additional fiscal year depending on the jurisdiction.
Distributions are declared and recorded on the ex-dividend date. Income and capital gain distributions are declared separately for each class. Income and capital gain distributions are determined in accordance with income tax regulations, which may differ from GAAP. In addition, the Fund claimed a portion of the payment made to redeeming shareholders as a distribution for income tax purposes.
Capital accounts within the financial statements are adjusted for permanent book-tax differences. These adjustments have no impact on net assets or the results of operations. Capital accounts are not adjusted for temporary book-tax differences which will reverse in a subsequent period.
Book-tax differences are primarily due to partnerships, redemptions in-kind and losses deferred due to wash sales and excise tax regulations.
As of period end, the cost and unrealized appreciation (depreciation) in securities, and derivatives if applicable, for federal income tax purposes were as follows:
| Gross unrealized appreciation | $137,125,523 |
| Gross unrealized depreciation | (203,223,588) |
| Net unrealized appreciation (depreciation) | $(66,098,065) |
| Tax Cost | $2,176,309,212 |
The tax-based components of distributable earnings as of period end were as follows:
| Net unrealized appreciation (depreciation) on securities and other investments | $(66,098,065) |
The Fund intends to elect to defer to its next fiscal year $2,687,473 of ordinary losses recognized during the period January 1, 2019 to January 31, 2019.
The Fund intends to elect to defer to its next fiscal year $58,354,138 of capital losses recognized during the period November 1, 2018 to January 31, 2019.
The tax character of distributions paid was as follows:
| January 31, 2019 | January 31, 2018 | |
| Ordinary Income | $46,445,545 | $ 54,603,613 |
| Long-term Capital Gains | 246,684,854 | 213,044,374 |
| Total | $293,130,399 | $ 267,647,987 |
New Rule Issuance. During August 2018, the U.S. Securities and Exchange Commission issued Final Rule Release No. 33-10532, Disclosure Update and Simplification. This Final Rule includes amendments specific to registered investment companies that are intended to eliminate overlap in disclosure requirements between Regulation S-X and GAAP. In accordance with these amendments, certain line-items in the Fund's financial statements have been combined or removed for the current period as outlined in the table below.
| Financial Statement | Current Line-Item Presentation (As Applicable) | Prior Line-Item Presentation (As Applicable) |
| Statement of Assets and Liabilities | Total distributable earnings (loss) | Undistributed/Distributions in excess of/Accumulated net investment income (loss) Accumulated/Undistributed net realized gain (loss) Net unrealized appreciation (depreciation) |
| Statement of Changes in Net Assets | N/A - removed | Undistributed/Distributions in excess of/Accumulated net investment income (loss) end of period |
| Statement of Changes in Net Assets | Distributions to shareholders | Distributions to shareholders from net investment income Distributions to shareholders from net realized gain |
| Distributions to Shareholders Note to Financial Statements | Distributions to shareholders | Distributions to shareholders from net investment income Distributions to shareholders from net realized gain |
4. Purchases and Sales of Investments.
Purchases and sales of securities, other than short-term securities and in-kind transactions, aggregated $2,074,319,007 and $2,854,208,496, respectively.
Unaffiliated Redemptions In-Kind. During the period, 876,174 shares of the Fund were redeemed in-kind for investments and cash with a value of $21,501,311. The net realized gain of $2,657,810 on investments delivered through in-kind redemptions is included in the accompanying Statement of Operations. The amount of the in-kind redemptions is included in share transactions in the accompanying Statement of Changes in Net Assets as well as the Notes to Financial Statements. The Fund recognized no gain or loss for federal income tax purposes.
Prior Fiscal Year Redemptions In-Kind. During the prior period, 339,737 shares of the Fund held by an unaffiliated entity were redeemed in-kind for investments and cash, with a value of $9,318,982. The Fund had a net realized gain of $1,830,856 on investments delivered through the in-kind redemptions. The amount of the in-kind redemptions is included in share transactions in the accompanying Statement of Changes in Net Assets as well as the Notes to Financial Statements. The Fund recognized no gain or loss for federal income tax purposes.
5. Fees and Other Transactions with Affiliates.
Management Fee. Fidelity Management & Research Company (the investment adviser) and its affiliates provide the Fund with investment management related services for which the Fund pays a monthly management fee. The management fee is the sum of an individual fund fee rate that is based on an annual rate of .30% of the Fund's average net assets and an annualized group fee rate that averaged .24% during the period. The group fee rate is based upon the average net assets of all the mutual funds advised by the investment adviser, including any mutual funds previously advised by the investment adviser that are currently advised by Fidelity SelectCo, LLC, an affiliate of the investment adviser. The group fee rate decreases as assets under management increase and increases as assets under management decrease. In addition, the management fee is subject to a performance adjustment (up to a maximum of +/- .20% of the Fund's average net assets over a 36 month performance period). The upward or downward adjustment to the management fee is based on the relative investment performance of Midcap Value as compared to its benchmark index, the Russell Mid Cap Value Index, over the same 36 month performance period. For the reporting period, the total annual management fee rate, including the performance adjustment, was .31% of the Fund's average net assets. The performance adjustment included in the management fee rate may be higher or lower than the maximum performance adjustment rate due to the difference between the average net assets for the reporting and performance periods.
Distribution and Service Plan Fees. In accordance with Rule 12b-1 of the 1940 Act, the Fund has adopted separate Distribution and Service Plans for each class of shares. Certain classes pay Fidelity Distributors Corporation (FDC), an affiliate of the investment adviser, separate Distribution and Service Fees, each of which is based on an annual percentage of each class' average net assets. In addition, FDC may pay financial intermediaries for selling shares of the Fund and providing shareholder support services. For the period, the Distribution and Service Fee rates, total fees and amounts retained by FDC were as follows:
| Distribution Fee | Service Fee | Total Fees | Retained by FDC | |
| Class A | -% | .25% | $530,832 | $4,942 |
| Class M | .25% | .25% | 234,808 | – |
| Class C | .75% | .25% | 1,109,091 | 104,175 |
| $1,874,731 | $109,117 |
Sales Load. FDC may receive a front-end sales charge of up to 5.75% for selling Class A shares and 3.50% for selling Class M shares, some of which is paid to financial intermediaries for selling shares of the Fund. Depending on the holding period, FDC may receive contingent deferred sales charges levied on Class A, Class M and Class C redemptions. The deferred sales charges are 1.00% for Class C shares, 1.00% for certain purchases of Class A shares and .25% for certain purchases of Class M shares.
For the period, sales charge amounts retained by FDC were as follows:
| Retained by FDC | |
| Class A | $43,132 |
| Class M | 6,301 |
| Class C(a) | 8,198 |
| $57,631 |
(a) When Class C shares are initially sold, FDC pays commissions from its own resources to financial intermediaries through which the sales are made.
Transfer Agent Fees. Fidelity Investments Institutional Operations Company, Inc., (FIIOC), an affiliate of the investment adviser, is the transfer, dividend disbursing and shareholder servicing agent for each class of the Fund. FIIOC receives account fees and asset-based fees that vary according to the account size and type of account of the shareholders of the respective classes of the Fund, except for Class Z. FIIOC receives an asset-based fee of Class Z's average net assets. FIIOC pays for typesetting, printing and mailing of shareholder reports, except proxy statements.
For the period, transfer agent fees for each class were as follows:
| Amount | % of Class-Level Average Net Assets | |
| Class A | $465,141 | .22 |
| Class M | 114,665 | .24 |
| Class C | 232,490 | .21 |
| Mid Cap Value | 3,313,061 | .18 |
| Class I | 592,352 | .18 |
| Class Z | 15,078 | .05 |
| $4,732,787 |
Accounting and Security Lending Fees. Fidelity Service Company, Inc. (FSC), an affiliate of the investment adviser, maintains the Fund's accounting records. The accounting fee is based on the level of average net assets for each month. Under a separate contract, FSC administers the security lending program. The security lending fee is based on the number and duration of lending transactions. For the period, the fees were equivalent to an annual rate of .03%.
Brokerage Commissions. The Fund placed a portion of its portfolio transactions with brokerage firms which are affiliates of the investment adviser. Brokerage commissions are included in net realized gain (loss) and change in net unrealized appreciation (depreciation) in the Statement of Operations. The commissions paid to these affiliated firms were $78,014 for the period.
Interfund Lending Program. Pursuant to an Exemptive Order issued by the SEC, the Fund, along with other registered investment companies having management contracts with Fidelity Management & Research Company (FMR) or other affiliated entities of FMR, may participate in an interfund lending program. This program provides an alternative credit facility allowing the funds to borrow from, or lend money to, other participating affiliated funds. At period end, there were no interfund loans outstanding. The Fund's activity in this program during the period for which loans were outstanding was as follows:
| Borrower or Lender | Average Loan Balance | Weighted Average Interest Rate | Interest Expense |
| Borrower | $65,391,857 | 2.20% | $27,922 |
Interfund Trades. The Fund may purchase from or sell securities to other Fidelity Funds under procedures adopted by the Board. The procedures have been designed to ensure these interfund trades are executed in accordance with Rule 17a-7 of the 1940 Act. Interfund trades are included within the respective purchases and sales amounts shown in the Purchases and Sales of Investments note.
Prior Fiscal Year Redemptions In-Kind. During the prior period, 1,289,800 shares of the Fund held by an affiliated entity were redeemed in-kind for investments and cash, with a value of $33,895,948. The Fund had a net realized gain of $5,708,374 on investments delivered through in-kind redemptions. The amount of the in-kind redemptions is included in share transactions in the accompanying Statement of Changes in Net Assets as well as the Notes to Financial Statements. The Fund recognized no gain or loss for federal income tax purposes.
6. Committed Line of Credit.
The Fund participates with other funds managed by the investment adviser or an affiliate in a $4.25 billion credit facility (the "line of credit") to be utilized for temporary or emergency purposes to fund shareholder redemptions or for other short-term liquidity purposes. The Fund has agreed to pay commitment fees on its pro-rata portion of the line of credit, which amounted to $7,461 and is reflected in Miscellaneous expenses on the Statement of Operations. During the period, the Fund did not borrow on this line of credit.
7. Security Lending.
The Fund lends portfolio securities through a lending agent from time to time in order to earn additional income. For equity securities, a lending agent is used and may loan securities to certain qualified borrowers, including Fidelity Capital Markets (FCM), a broker-dealer affiliated with the Fund. On the settlement date of the loan, the Fund receives collateral (in the form of U.S. Treasury obligations, letters of credit and/or cash) against the loaned securities and maintains collateral in an amount not less than 100% of the market value of the loaned securities during the period of the loan. The market value of the loaned securities is determined at the close of business of the Fund and any additional required collateral is delivered to the Fund on the next business day. The Fund or borrower may terminate the loan at any time, and if the borrower defaults on its obligation to return the securities loaned because of insolvency or other reasons, the Fund may apply collateral received from the borrower against the obligation. The Fund may experience delays and costs in recovering the securities loaned. Any cash collateral received is invested in the Fidelity Securities Lending Cash Central Fund. The value of loaned securities and cash collateral at period end are disclosed on the Fund's Statement of Assets and Liabilities. At period end, there were no security loans outstanding with FCM. Security lending income represents the income earned on investing cash collateral, less rebates paid to borrowers and any lending agent fees associated with the loan, plus any premium payments received for lending certain types of securities. Security lending income is presented in the Statement of Operations as a component of income from Fidelity Central Funds. Total security lending income during the period amounted to $305,600, including $953 from securities loaned to FCM.
8. Expense Reductions.
Commissions paid to certain brokers with whom the investment adviser, or its affiliates, places trades on behalf of the Fund include an amount in addition to trade execution, which may be rebated back to the Fund to offset certain expenses. This amount totaled $325,590 for the period. In addition, through arrangements with the Fund's custodian, credits realized as a result of certain uninvested cash balances were used to reduce the Fund's expenses. During the period, these credits reduced the Fund's custody expenses by $1,501.
In addition, during the period the investment adviser reimbursed and/or waived a portion of fund-level operating expenses in the amount of $24,096.
9. Distributions to Shareholders.
Distributions to shareholders of each class were as follows:
| Year ended January 31, 2019 | Year ended January 31, 2018 | |
| Distributions to shareholders | ||
| Class A | $24,177,514 | $– |
| Class M | 5,348,381 | – |
| Class C | 12,076,102 | – |
| Mid Cap Value | 210,242,141 | – |
| Class I | 36,984,577 | – |
| Class Z | 4,301,684 | – |
| Total | $293,130,399 | $– |
| From net investment income | ||
| Class A | $– | $3,842,007 |
| Class M | – | 738,141 |
| Class C | – | 1,381,368 |
| Mid Cap Value | – | 40,728,436 |
| Class I | – | 7,342,642 |
| Class Z | – | 571,019 |
| Total | $– | $54,603,613 |
| From net realized gain | ||
| Class A | $– | $16,772,494 |
| Class M | – | 3,919,760 |
| Class C | – | 10,304,692 |
| Mid Cap Value | – | 152,568,612 |
| Class I | – | 27,505,536 |
| Class Z | – | 1,973,280 |
| Total | $– | $213,044,374 |
10. Share Transactions.
Share transactions for each class were as follows and may contain automatic conversions between classes or exchanges between affiliated funds:
| Shares | Shares | Dollars | Dollars | |
| Year ended January 31, 2019 | Year ended January 31, 2018 | Year ended January 31, 2019 | Year ended January 31, 2018 | |
| Class A | ||||
| Shares sold | 1,111,101 | 2,274,304 | $26,179,746 | $59,043,864 |
| Reinvestment of distributions | 1,090,741 | 778,331 | 23,882,423 | 20,353,335 |
| Shares redeemed | (3,516,152) | (5,434,078) | (80,987,072) | (140,309,711) |
| Net increase (decrease) | (1,314,310) | (2,381,443) | $(30,924,903) | $(60,912,512) |
| Class M | ||||
| Shares sold | 328,890 | 384,088 | $7,376,153 | $9,897,586 |
| Reinvestment of distributions | 242,648 | 177,219 | 5,307,008 | 4,616,549 |
| Shares redeemed | (757,165) | (826,528) | (17,585,718) | (21,629,388) |
| Net increase (decrease) | (185,627) | (265,221) | $(4,902,557) | $(7,115,253) |
| Class C | ||||
| Shares sold | 352,125 | 1,098,519 | $7,860,127 | $27,338,918 |
| Reinvestment of distributions | 545,524 | 444,532 | 11,655,287 | 11,259,992 |
| Shares redeemed | (2,039,444) | (2,132,994) | (45,351,086) | (53,838,984) |
| Net increase (decrease) | (1,141,795) | (589,943) | $(25,835,672) | $(15,240,074) |
| Mid Cap Value | ||||
| Shares sold | 5,324,150 | 10,422,988 | $126,674,668 | $274,556,299 |
| Reinvestment of distributions | 9,003,439 | 6,952,016 | 200,688,042 | 184,228,438 |
| Shares redeemed | (32,131,599)(a) | (27,076,600)(b) | (765,003,490)(a) | (716,090,892)(b) |
| Net increase (decrease) | (17,804,010) | (9,701,596) | $(437,640,780) | $(257,306,155) |
| Class I | ||||
| Shares sold | 3,178,396 | 6,767,714 | $75,426,021 | $175,618,477 |
| Reinvestment of distributions | 1,607,734 | 1,268,528 | 35,521,968 | 33,336,905 |
| Shares redeemed | (8,532,865) | (7,211,785) | (198,881,148) | (188,764,174) |
| Net increase (decrease) | (3,746,735) | 824,457 | $(87,933,159) | $20,191,208 |
| Class Z | ||||
| Shares sold | 1,511,067 | 1,341,663 | $35,624,073 | $35,340,459 |
| Reinvestment of distributions | 159,287 | 84,138 | 3,423,612 | 2,210,303 |
| Shares redeemed | (1,190,688) | (193,471) | (27,830,629) | (5,285,481) |
| Net increase (decrease) | 479,666 | 1,232,330 | $11,217,056 | $32,265,281 |
(a) Amount includes in-kind redemptions (see the Redemptions In-Kind notes for additional details).
(b) Amount includes in-kind redemptions (see the Prior Fiscal Year Redemptions In-Kind notes for additional details).
11. Other.
The Fund's organizational documents provide former and current trustees and officers with a limited indemnification against liabilities arising in connection with the performance of their duties to the Fund. In the normal course of business, the Fund may also enter into contracts that provide general indemnifications. The Fund's maximum exposure under these arrangements is unknown as this would be dependent on future claims that may be made against the Fund. The risk of material loss from such claims is considered remote.
Report of Independent Registered Public Accounting Firm
To the Board of Trustees of Fidelity Devonshire Trust and Shareholders of Fidelity Mid Cap Value Fund:
Opinion on the Financial Statements
We have audited the accompanying statement of assets and liabilities, including the schedule of investments, of Fidelity Mid Cap Value Fund (one of the funds constituting Fidelity Devonshire Trust, referred to hereafter as the "Fund") as of January 31, 2019, the related statement of operations for the year ended January 31, 2019, the statement of changes in net assets for each of the two years in the period ended January 31, 2019, including the related notes, and the financial highlights for each of the periods indicated therein (collectively referred to as the “financial statements”). In our opinion, the financial statements present fairly, in all material respects, the financial position of the Fund as of January 31, 2019, the results of its operations for the year then ended, the changes in its net assets for each of the two years in the period ended January 31, 2019 and the financial highlights for the periods indicated therein in conformity with accounting principles generally accepted in the United States of America.
Basis for Opinion
These financial statements are the responsibility of the Fund’s management. Our responsibility is to express an opinion on the Fund’s financial statements based on our audits. We are a public accounting firm registered with the Public Company Accounting Oversight Board (United States) (PCAOB) and are required to be independent with respect to the Fund in accordance with the U.S. federal securities laws and the applicable rules and regulations of the Securities and Exchange Commission and the PCAOB.
We conducted our audits of these financial statements in accordance with the standards of the PCAOB. Those standards require that we plan and perform the audit to obtain reasonable assurance about whether the financial statements are free of material misstatement, whether due to error or fraud.
Our audits included performing procedures to assess the risks of material misstatement of the financial statements, whether due to error or fraud, and performing procedures that respond to those risks. Such procedures included examining, on a test basis, evidence regarding the amounts and disclosures in the financial statements. Our audits also included evaluating the accounting principles used and significant estimates made by management, as well as evaluating the overall presentation of the financial statements. Our procedures included confirmation of securities owned as of January 31, 2019 by correspondence with the custodian and brokers; when replies were not received from brokers, we performed other auditing procedures. We believe that our audits provide a reasonable basis for our opinion.
PricewaterhouseCoopers LLP
Boston, Massachusetts
March 13, 2019
We have served as the auditor of one or more investment companies in the Fidelity group of funds since 1932.
Trustees and Officers
The Trustees, Members of the Advisory Board (if any), and officers of the trust and fund, as applicable, are listed below. The Board of Trustees governs the fund and is responsible for protecting the interests of shareholders. The Trustees are experienced executives who meet periodically throughout the year to oversee the fund's activities, review contractual arrangements with companies that provide services to the fund, oversee management of the risks associated with such activities and contractual arrangements, and review the fund's performance. Except for Michael E. Wiley, each of the Trustees oversees 287 funds. Mr. Wiley oversees 195 funds.
The Trustees hold office without limit in time except that (a) any Trustee may resign; (b) any Trustee may be removed by written instrument, signed by at least two-thirds of the number of Trustees prior to such removal; (c) any Trustee who requests to be retired or who has become incapacitated by illness or injury may be retired by written instrument signed by a majority of the other Trustees; and (d) any Trustee may be removed at any special meeting of shareholders by a two-thirds vote of the outstanding voting securities of the trust. Each Trustee who is not an interested person (as defined in the 1940 Act) of the trust and the fund is referred to herein as an Independent Trustee. Each Independent Trustee shall retire not later than the last day of the calendar year in which his or her 75th birthday occurs. The Independent Trustees may waive this mandatory retirement age policy with respect to individual Trustees. Officers and Advisory Board Members hold office without limit in time, except that any officer or Advisory Board Member may resign or may be removed by a vote of a majority of the Trustees at any regular meeting or any special meeting of the Trustees. Except as indicated, each individual has held the office shown or other offices in the same company for the past five years.
The fund’s Statement of Additional Information (SAI) includes more information about the Trustees. To request a free copy, call Fidelity at 1-800-544-8544 if you’re an individual investing directly with Fidelity, call 1-800-835-5092 if you’re a plan sponsor or participant with Fidelity as your recordkeeper or call 1-877-208-0098 on institutional accounts or if you’re an advisor or invest through one.
Experience, Skills, Attributes, and Qualifications of the Trustees. The Governance and Nominating Committee has adopted a statement of policy that describes the experience, qualifications, attributes, and skills that are necessary and desirable for potential Independent Trustee candidates (Statement of Policy). The Board believes that each Trustee satisfied at the time he or she was initially elected or appointed a Trustee, and continues to satisfy, the standards contemplated by the Statement of Policy. The Governance and Nominating Committee also engages professional search firms to help identify potential Independent Trustee candidates who have the experience, qualifications, attributes, and skills consistent with the Statement of Policy. From time to time, additional criteria based on the composition and skills of the current Independent Trustees, as well as experience or skills that may be appropriate in light of future changes to board composition, business conditions, and regulatory or other developments, have also been considered by the professional search firms and the Governance and Nominating Committee. In addition, the Board takes into account the Trustees' commitment and participation in Board and committee meetings, as well as their leadership of standing and ad hoc committees throughout their tenure.
In determining that a particular Trustee was and continues to be qualified to serve as a Trustee, the Board has considered a variety of criteria, none of which, in isolation, was controlling. The Board believes that, collectively, the Trustees have balanced and diverse experience, qualifications, attributes, and skills, which allow the Board to operate effectively in governing the fund and protecting the interests of shareholders. Information about the specific experience, skills, attributes, and qualifications of each Trustee, which in each case led to the Board's conclusion that the Trustee should serve (or continue to serve) as a trustee of the fund, is provided below.
Board Structure and Oversight Function. James C. Curvey is an interested person and currently serves as Chairman. The Trustees have determined that an interested Chairman is appropriate and benefits shareholders because an interested Chairman has a personal and professional stake in the quality and continuity of services provided to the fund. Independent Trustees exercise their informed business judgment to appoint an individual of their choosing to serve as Chairman, regardless of whether the Trustee happens to be independent or a member of management. The Independent Trustees have determined that they can act independently and effectively without having an Independent Trustee serve as Chairman and that a key structural component for assuring that they are in a position to do so is for the Independent Trustees to constitute a substantial majority for the Board. The Independent Trustees also regularly meet in executive session. Ned C. Lautenbach serves as Chairman of the Independent Trustees and as such (i) acts as a liaison between the Independent Trustees and management with respect to matters important to the Independent Trustees and (ii) with management prepares agendas for Board meetings.
Fidelity® funds are overseen by different Boards of Trustees. The fund's Board oversees Fidelity's high income and certain equity funds, and other Boards oversee Fidelity's investment-grade bond, money market, asset allocation, and other equity funds. The asset allocation funds may invest in Fidelity® funds overseen by the fund's Board. The use of separate Boards, each with its own committee structure, allows the Trustees of each group of Fidelity® funds to focus on the unique issues of the funds they oversee, including common research, investment, and operational issues. On occasion, the separate Boards establish joint committees to address issues of overlapping consequences for the Fidelity® funds overseen by each Board.
The Trustees operate using a system of committees to facilitate the timely and efficient consideration of all matters of importance to the Trustees, the fund, and fund shareholders and to facilitate compliance with legal and regulatory requirements and oversight of the fund's activities and associated risks. The Board, acting through its committees, has charged FMR and its affiliates with (i) identifying events or circumstances the occurrence of which could have demonstrably adverse effects on the fund's business and/or reputation; (ii) implementing processes and controls to lessen the possibility that such events or circumstances occur or to mitigate the effects of such events or circumstances if they do occur; and (iii) creating and maintaining a system designed to evaluate continuously business and market conditions in order to facilitate the identification and implementation processes described in (i) and (ii) above. Because the day-to-day operations and activities of the fund are carried out by or through FMR, its affiliates, and other service providers, the fund's exposure to risks is mitigated but not eliminated by the processes overseen by the Trustees. While each of the Board's committees has responsibility for overseeing different aspects of the fund's activities, oversight is exercised primarily through the Operations, Audit, and Compliance Committees. In addition, the Independent Trustees have worked with Fidelity to enhance the Board's oversight of investment and financial risks, legal and regulatory risks, technology risks, and operational risks, including the development of additional risk reporting to the Board. Appropriate personnel, including but not limited to the fund's Chief Compliance Officer (CCO), FMR's internal auditor, the independent accountants, the fund's Treasurer and portfolio management personnel, make periodic reports to the Board's committees, as appropriate, including an annual review of Fidelity's risk management program for the Fidelity® funds. The responsibilities of each standing committee, including their oversight responsibilities, are described further under "Standing Committees of the Trustees."
Interested Trustees*:
Correspondence intended for a Trustee who is an interested person may be sent to Fidelity Investments, 245 Summer Street, Boston, Massachusetts 02210.
Name, Year of Birth; Principal Occupations and Other Relevant Experience+
James C. Curvey (1935)
Year of Election or Appointment: 2007
Trustee
Chairman of the Board of Trustees
Mr. Curvey also serves as Trustee of other Fidelity® funds. Mr. Curvey is Vice Chairman (2007-present) and Director of FMR LLC (diversified financial services company). In addition, Mr. Curvey is an Overseer Emeritus for the Boston Symphony Orchestra, a Director of Artis-Naples, and a Trustee of Brewster Academy in Wolfeboro, New Hampshire. Previously, Mr. Curvey served as a Director of Fidelity Research & Analysis Co. (investment adviser firm, 2009-2018), Director of Fidelity Investments Money Management, Inc. (investment adviser firm, 2009-2014) and a Director of FMR and FMR Co., Inc. (investment adviser firms, 2007-2014).
* Determined to be an “Interested Trustee” by virtue of, among other things, his or her affiliation with the trust or various entities under common control with FMR.
+ The information includes the Trustee's principal occupation during the last five years and other information relating to the experience, attributes, and skills relevant to the Trustee's qualifications to serve as a Trustee, which led to the conclusion that the Trustee should serve as a Trustee for the fund.
Independent Trustees:
Correspondence intended for an Independent Trustee may be sent to Fidelity Investments, P.O. Box 55235, Boston, Massachusetts 02205-5235.
Name, Year of Birth; Principal Occupations and Other Relevant Experience+
Dennis J. Dirks (1948)
Year of Election or Appointment: 2005
Trustee
Mr. Dirks also serves as Trustee of other Fidelity® funds. Prior to his retirement in May 2003, Mr. Dirks was Chief Operating Officer and a member of the Board of The Depository Trust & Clearing Corporation (DTCC). He also served as President, Chief Operating Officer, and Board member of The Depository Trust Company (DTC) and President and Board member of the National Securities Clearing Corporation (NSCC). In addition, Mr. Dirks served as Chief Executive Officer and Board member of the Government Securities Clearing Corporation, Chief Executive Officer and Board member of the Mortgage-Backed Securities Clearing Corporation, as a Trustee and a member of the Finance Committee of Manhattan College (2005-2008), as a Trustee and a member of the Finance Committee of AHRC of Nassau County (2006-2008), as a member of the Independent Directors Council (IDC) Governing Council (2010-2015), and as a member of the Board of Directors for The Brookville Center for Children’s Services, Inc. (2009-2017). Mr. Dirks is a member of the Finance Committee (2016-present) and Board of Directors (2017-present) and is Treasurer (2018-present) of the Asolo Repertory Theatre.
Donald F. Donahue (1950)
Year of Election or Appointment: 2018
Trustee
Mr. Donahue also serves as a Trustee of other Fidelity® funds. Mr. Donahue is President and Chief Executive Officer of Miranda Partners, LLC (risk consulting for the financial services industry, 2012-present). Previously, Mr. Donahue served as a Member of the Advisory Board of certain Fidelity® funds (2015-2018) and Chief Executive Officer (2006-2012), Chief Operating Officer (2003-2006), and Managing Director, Customer Marketing and Development (1999-2003) of The Depository Trust & Clearing Corporation (financial markets infrastructure). Mr. Donahue serves as a Member (2007-present) and Co-Chairman (2016-present) of the Board of Directors of United Way of New York, Member of the Board of Directors of NYC Leadership Academy (2012-present) and Member of the Board of Advisors of Ripple Labs, Inc. (financial services, 2015-present). He also served as Chairman (2010-2012) and Member of the Board of Directors (2012-2013) of Omgeo, LLC (financial services), Treasurer of United Way of New York (2012-2016), and Member of the Board of Directors of XBRL US (financial services non-profit, 2009-2012) and the International Securities Services Association (2009-2012).
Alan J. Lacy (1953)
Year of Election or Appointment: 2008
Trustee
Mr. Lacy also serves as Trustee of other Fidelity® funds. Mr. Lacy serves as a Director of Bristol-Myers Squibb Company (global pharmaceuticals, 2008-present). He is a Trustee of the California Chapter of The Nature Conservancy (2015-present) and a Director of the Center for Advanced Study in the Behavioral Sciences at Stanford University (2015-present). In addition, Mr. Lacy served as Senior Adviser (2007-2014) of Oak Hill Capital Partners, L.P. (private equity) and also served as Chief Executive Officer (2005) and Vice Chairman (2005-2006) of Sears Holdings Corporation (retail) and Chief Executive Officer and Chairman of the Board of Sears, Roebuck and Co. (retail, 2000-2005). Previously, Mr. Lacy served as Chairman (2014-2017) and a member (2010-2017) of the Board of Directors of Dave & Buster’s Entertainment, Inc. (restaurant and entertainment complexes), as Chairman (2008-2011) and a member (2006-2015) of the Board of Trustees of the National Parks Conservation Association, and as a member of the Board of Directors for The Hillman Companies, Inc. (hardware wholesalers, 2010-2014), Earth Fare, Inc. (retail grocery, 2010-2014), and The Western Union Company (global money transfer, 2006-2011).
Ned C. Lautenbach (1944)
Year of Election or Appointment: 2000
Trustee
Chairman of the Independent Trustees
Mr. Lautenbach also serves as Trustee of other Fidelity® funds. Mr. Lautenbach currently serves as Chair (2018-present) and Member (2013-present) of the Board of Governors, State University System of Florida and is a member of the Council on Foreign Relations (1994-present). He is also a member and has most recently served as Chairman of the Board of Directors of Artis-Naples (2012-present). Previously, Mr. Lautenbach served as a member and then Lead Director of the Board of Directors of Eaton Corporation (diversified industrial, 1997-2016). He was also a Partner and Advisory Partner at Clayton, Dubilier & Rice, LLC (private equity investment, 1998-2010), as well as a Director of Sony Corporation (2006-2007). In addition, Mr. Lautenbach also had a 30-year career with IBM (technology company) during which time he served as Senior Vice President and a member of the Corporate Executive Committee (1968-1998).
Joseph Mauriello (1944)
Year of Election or Appointment: 2008
Trustee
Mr. Mauriello also serves as Trustee of other Fidelity® funds. Prior to his retirement in January 2006, Mr. Mauriello served in numerous senior management positions including Deputy Chairman and Chief Operating Officer (2004-2005), and Vice Chairman of Financial Services (2002-2004) of KPMG LLP US (professional services, 1965-2005). Mr. Mauriello currently serves as a member of the Independent Directors Council (IDC) Governing Council (2015-present). Previously, Mr. Mauriello served as a member of the Board of Directors of XL Group plc. (global insurance and re-insurance, 2006-2018).
Cornelia M. Small (1944)
Year of Election or Appointment: 2005
Trustee
Ms. Small also serves as Trustee of other Fidelity® funds. Ms. Small is a member of the Board of Directors (2009-present) and Chair of the Investment Committee (2010-present) of the Teagle Foundation. Ms. Small also serves on the Investment Committee of the Berkshire Taconic Community Foundation (2008-present). Previously, Ms. Small served as Chairperson (2002-2008) and a member of the Investment Committee and Chairperson (2008-2012) and a member of the Board of Trustees of Smith College. In addition, Ms. Small served as Chief Investment Officer, Director of Global Equity Investments, and a member of the Board of Directors of Scudder, Stevens & Clark and Scudder Kemper Investments.
Garnett A. Smith (1947)
Year of Election or Appointment: 2018
Trustee
Mr. Smith also serves as Trustee of other Fidelity® funds. Prior to Mr. Smith's retirement, he served as Chairman and Chief Executive Officer of Inbrand Corp. (manufacturer of personal absorbent products, 1990-1997). He also served as President (1986-1990) of Inbrand Corp. Prior to his employment with Inbrand Corp., he was employed by a retail fabric chain and North Carolina National Bank. In addition, Mr. Smith served as a Member of the Advisory Board of certain Fidelity® funds (2012-2013) and as a board member of the Jackson Hole Land Trust (2009-2012).
David M. Thomas (1949)
Year of Election or Appointment: 2008
Trustee
Mr. Thomas also serves as Trustee of other Fidelity® funds. Mr. Thomas serves as Non-Executive Chairman of the Board of Directors of Fortune Brands Home and Security (home and security products, 2011-present) and as a member of the Board of Directors (2004-present) and Presiding Director (2013-present) of Interpublic Group of Companies, Inc. (marketing communication). Previously, Mr. Thomas served as Executive Chairman (2005-2006) and Chairman and Chief Executive Officer (2000-2005) of IMS Health, Inc. (pharmaceutical and healthcare information solutions), a Director of Fortune Brands, Inc. (consumer products, 2000-2011), and a member of the Board of Trustees of the University of Florida (2013-2018).
Michael E. Wiley (1950)
Year of Election or Appointment: 2018
Trustee
Mr. Wiley also serves as Trustee or Member of the Advisory Board of other Fidelity® funds. Mr. Wiley serves as a Director of High Point Resources (exploration and production, 2005-present). Previously, Mr. Wiley served as a Director of Andeavor Corporation (independent oil refiner and marketer, 2005-2018), a Director of Andeavor Logistics LP (natural resources logistics, 2015-2018), a Director of Post Oak Bank (privately-held bank, 2004-2018), a Director of Asia Pacific Exploration Consolidated (international oil and gas exploration and production, 2008-2013), a member of the Board of Trustees of the University of Tulsa (2000-2006; 2007-2010), a Senior Energy Advisor of Katzenbach Partners, LLC (consulting, 2006-2007), an Advisory Director of Riverstone Holdings (private investment), a Director of Spinnaker Exploration Company (exploration and production, 2001-2005) and Chairman, President, and CEO of Baker Hughes, Inc. (oilfield services, 2000-2004).
+ The information includes the Trustee's principal occupation during the last five years and other information relating to the experience, attributes, and skills relevant to the Trustee's qualifications to serve as a Trustee, which led to the conclusion that the Trustee should serve as a Trustee for the fund.
Advisory Board Members and Officers:
Correspondence intended for a Member of the Advisory Board (if any) may be sent to Fidelity Investments, P.O. Box 55235, Boston, Massachusetts 02205-5235. Correspondence intended for an officer or Peter S. Lynch may be sent to Fidelity Investments, 245 Summer Street, Boston, Massachusetts 02210. Officers appear below in alphabetical order.
Name, Year of Birth; Principal Occupation
Vicki L. Fuller (1957)
Year of Election or Appointment: 2018
Member of the Advisory Board
Ms. Fuller also serves as Member of the Advisory Board of other Fidelity® funds. Ms. Fuller serves as a member of the Board of Directors, Audit Committee, and Nominating and Governance Committee of The Williams Companies, Inc. (natural gas infrastructure, 2018-present). Previously, Ms. Fuller served as the Chief Investment Officer of the New York State Common Retirement Fund (2012-2018) and held a variety of positions at AllianceBernstein L.P. (global asset management, 1985-2012), including Managing Director (2006-2012) and Senior Vice President and Senior Portfolio Manager (2001-2006).
Peter S. Lynch (1944)
Year of Election or Appointment: 2003
Member of the Advisory Board
Mr. Lynch also serves as Member of the Advisory Board of other Fidelity® funds. Mr. Lynch is Vice Chairman and a Director of FMR (investment adviser firm) and FMR Co., Inc. (investment adviser firm). In addition, Mr. Lynch serves as a Trustee of Boston College and as the Chairman of the Inner-City Scholarship Fund. Previously, Mr. Lynch served on the Special Olympics International Board of Directors (1997-2006).
Carol B. Tomé (1957)
Year of Election or Appointment: 2018
Member of the Advisory Board
Ms. Tomé also serves as Member of the Advisory Board of other Fidelity® funds. Ms. Tomé is Chief Financial Officer (2001-present) and Executive Vice President of Corporate Services (2007-present) of The Home Depot, Inc. (home improvement retailer) and a Director (2003-present) and Chair of the Audit Committee (2004-present) of United Parcel Service, Inc. (package delivery and supply chain management). Previously, Ms. Tomé served as Trustee of certain Fidelity® funds (2017), Senior Vice President of Finance and Accounting/Treasurer (2000-2007) and Vice President and Treasurer (1995-2000) of The Home Depot, Inc. and Chair of the Board (2010-2012), Vice Chair of the Board (2009 and 2013), and a Director (2008-2013) of the Federal Reserve Bank of Atlanta. Ms. Tomé is also a director or trustee of many community and professional organizations.
Elizabeth Paige Baumann (1968)
Year of Election or Appointment: 2017
Anti-Money Laundering (AML) Officer
Ms. Baumann also serves as AML Officer of other funds. She is Chief AML Officer (2012-present) and Senior Vice President (2014-present) of FMR LLC (diversified financial services company) and is an employee of Fidelity Investments. Previously, Ms. Baumann served as AML Officer of the funds (2012-2016), and Vice President (2007-2014) and Deputy Anti-Money Laundering Officer (2007-2012) of FMR LLC.
Craig S. Brown (1977)
Year of Election or Appointment: 2019
Assistant Treasurer
Mr. Brown also serves as Assistant Treasurer of other funds. Mr. Brown is an employee of Fidelity Investments (2013-present).
John J. Burke III (1964)
Year of Election or Appointment: 2018
Chief Financial Officer
Mr. Burke also serves as Chief Financial Officer of other funds. Mr. Burke serves as Head of Investment Operations for Fidelity Fund and Investment Operations (2018-present) and is an employee of Fidelity Investments (1998-present). Previously Mr. Burke served as head of Asset Management Investment Operations (2012-2018).
William C. Coffey (1969)
Year of Election or Appointment: 2018
Secretary and Chief Legal Officer (CLO)
Mr. Coffey also serves as Secretary and CLO of other funds. Mr. Coffey serves as CLO, Secretary, and Senior Vice President of Fidelity Management & Research Company and FMR Co., Inc. (investment adviser firms, 2018-present); Secretary of Fidelity SelectCo, LLC and Fidelity Investments Money Management, Inc. (investment adviser firms, 2018-present); and CLO of Fidelity Management & Research (Hong Kong) Limited, FMR Investment Management (UK) Limited, and Fidelity Management & Research (Japan) Limited (investment adviser firms, 2018-present). He is Senior Vice President and Deputy General Counsel of FMR LLC (diversified financial services company, 2010-present), and is an employee of Fidelity Investments. Previously, Mr. Coffey served as Assistant Secretary of certain funds (2009-2018) and as Vice President and Associate General Counsel of FMR LLC (2005-2009).
Timothy M. Cohen (1969)
Year of Election or Appointment: 2018
Vice President
Mr. Cohen also serves as Vice President of other funds. Mr. Cohen serves as Co-Head of Global Equity Research (2016-present), a Director of Fidelity Management & Research (Japan) Limited (investment adviser firm, 2016-present), and is an employee of Fidelity Investments. Previously, Mr. Cohen served as Chief Investment Officer - Equity and a Director of Fidelity Management & Research (U.K.) Inc. (investment adviser firm, 2013-2015) and as a Director of Fidelity Management & Research (Hong Kong) Limited (investment adviser firm, 2017).
Jonathan Davis (1968)
Year of Election or Appointment: 2010
Assistant Treasurer
Mr. Davis also serves as Assistant Treasurer of other funds. Mr. Davis serves as Assistant Treasurer of FMR Capital, Inc. (2017-present) and is an employee of Fidelity Investments. Previously, Mr. Davis served as Vice President and Associate General Counsel of FMR LLC (diversified financial services company, 2003-2010).
Adrien E. Deberghes (1967)
Year of Election or Appointment: 2016
Assistant Treasurer
Mr. Deberghes also serves as an officer of other funds. He serves as Assistant Treasurer of FMR Capital, Inc. (2017-present), Executive Vice President of Fidelity Investments Money Management, Inc. (FIMM) (investment adviser firm, 2016-present), and is an employee of Fidelity Investments (2008-present). Previously, Mr. Deberghes served as President and Treasurer of certain Fidelity® funds (2013-2018). Prior to joining Fidelity Investments, Mr. Deberghes was Senior Vice President of Mutual Fund Administration at State Street Corporation (2007-2008), Senior Director of Mutual Fund Administration at Investors Bank & Trust (2005-2007), and Director of Finance for Dunkin' Brands (2000-2005). Previously, Mr. Deberghes served in other fund officer roles.
Laura M. Del Prato (1964)
Year of Election or Appointment: 2018
Assistant Treasurer
Ms. Del Prato also serves as an officer of other funds. Ms. Del Prato is an employee of Fidelity Investments (2017-present). Prior to joining Fidelity Investments, Ms. Del Prato served as a Managing Director and Treasurer of the JPMorgan Mutual Funds (2014-2017). Prior to JPMorgan, Ms. Del Prato served as a partner at Cohen Fund Audit Services (accounting firm, 2012-2013) and KPMG LLP (accounting firm, 2004-2012).
Colm A. Hogan (1973)
Year of Election or Appointment: 2016
Deputy Treasurer
Mr. Hogan also serves as an officer of other funds. Mr. Hogan serves as Assistant Treasurer of FMR Capital, Inc. (2017-present) and is an employee of Fidelity Investments (2005-present). Previously, Mr. Hogan served as Assistant Treasurer of certain Fidelity® funds (2016-2018).
Pamela R. Holding (1964)
Year of Election or Appointment: 2018
Vice President
Ms. Holding also serves as Vice President of other funds. Ms. Holding serves as Co-Head of Global Equity Research (2018-present) and is an employee of Fidelity Investments (2013-present).
Chris Maher (1972)
Year of Election or Appointment: 2013
Assistant Treasurer
Mr. Maher serves as Assistant Treasurer of other funds. Mr. Maher is Vice President of Valuation Oversight, serves as Assistant Treasurer of FMR Capital, Inc. (2017-present), and is an employee of Fidelity Investments. Previously, Mr. Maher served as Vice President of Asset Management Compliance (2013), Vice President of the Program Management Group of FMR (investment adviser firm, 2010-2013), and Vice President of Valuation Oversight (2008-2010).
Kenneth B. Robins (1969)
Year of Election or Appointment: 2016
Chief Compliance Officer
Mr. Robins also serves as an officer of other funds. Mr. Robins serves as Compliance Officer of Fidelity Management & Research Company and FMR Co., Inc. (investment adviser firms, 2016-present) and is an employee of Fidelity Investments (2004-present). Previously, Mr. Robins served as Executive Vice President of Fidelity Investments Money Management, Inc. (investment adviser firm, 2013-2016) and served in other fund officer roles.
Stacie M. Smith (1974)
Year of Election or Appointment: 2016
President and Treasurer
Ms. Smith also serves as an officer of other funds. Ms. Smith serves as Assistant Treasurer of FMR Capital, Inc. (2017-present), is an employee of Fidelity Investments (2009-present), and has served in other fund officer roles. Prior to joining Fidelity Investments, Ms. Smith served as Senior Audit Manager of Ernst & Young LLP (accounting firm, 1996-2009). Previously, Ms. Smith served as Assistant Treasurer (2013-2018) and Deputy Treasurer (2013-2016) of certain Fidelity® funds.
Marc L. Spector (1972)
Year of Election or Appointment: 2016
Assistant Treasurer
Mr. Spector also serves as an officer of other funds. Mr. Spector serves as Assistant Treasurer of FMR Capital, Inc. (2017-present) and is an employee of Fidelity Investments (2016-present). Prior to joining Fidelity Investments, Mr. Spector served as Director at the Siegfried Group (accounting firm, 2013-2016), and prior to Siegfried Group as audit senior manager at Deloitte & Touche (accounting firm, 2005-2013).
Jim Wegmann (1979)
Year of Election or Appointment: 2019
Assistant Treasurer
Mr. Wegmann also serves as Assistant Treasurer of other funds. Mr. Wegmann is an employee of Fidelity Investments (2011-present).
Shareholder Expense Example
As a shareholder of the Fund, you incur two types of costs: (1) transaction costs, including sales charges (loads) on purchase payments or redemption proceeds, and (2) ongoing costs, including management fees, distribution and/or service (12b-1) fees and other Fund expenses. This Example is intended to help you understand your ongoing costs (in dollars) of investing in the Fund and to compare these costs with the ongoing costs of investing in other mutual funds.
The Example is based on an investment of $1,000 invested at the beginning of the period and held for the entire period (August 1, 2018 to January 31, 2019).
Actual Expenses
The first line of the accompanying table for each class of the Fund provides information about actual account values and actual expenses. You may use the information in this line, together with the amount you invested, to estimate the expenses that you paid over the period. Simply divide your account value by $1,000.00 (for example, an $8,600 account value divided by $1,000.00 = 8.6), then multiply the result by the number in the first line for a class of the Fund under the heading entitled "Expenses Paid During Period" to estimate the expenses you paid on your account during this period. In addition, the Fund, as a shareholder in the underlying Fidelity Central Funds, will indirectly bear its pro-rata share of the fees and expenses incurred by the underlying Fidelity Central Funds. These fees and expenses are not included in the Fund's annualized expense ratio used to calculate the expense estimate in the table below.
Hypothetical Example for Comparison Purposes
The second line of the accompanying table for each class of the Fund provides information about hypothetical account values and hypothetical expenses based on a Class' actual expense ratio and an assumed rate of return of 5% per year before expenses, which is not the Class' actual return. The hypothetical account values and expenses may not be used to estimate the actual ending account balance or expenses you paid for the period. You may use this information to compare the ongoing costs of investing in the Fund and other funds. To do so, compare this 5% hypothetical example with the 5% hypothetical examples that appear in the shareholder reports of the other funds. In addition, the Fund, as a shareholder in the underlying Fidelity Central Funds, will indirectly bear its pro-rata share of the fees and expenses incurred by the underlying Fidelity Central Funds. These fees and expenses are not included in the Fund's annualized expense ratio used to calculate the expense estimate in the table below.
Please note that the expenses shown in the table are meant to highlight your ongoing costs only and do not reflect any transaction costs. Therefore, the second line of the table is useful in comparing ongoing costs only, and will not help you determine the relative total costs of owning different funds. In addition, if these transactional costs were included, your costs would have been higher.
| Annualized Expense Ratio-A | Beginning Account Value August 1, 2018 | Ending Account Value January 31, 2019 | Expenses Paid During Period-B August 1, 2018 to January 31, 2019 | |
| Class A | .79% | |||
| Actual | $1,000.00 | $923.10 | $3.83 | |
| Hypothetical-C | $1,000.00 | $1,021.22 | $4.02 | |
| Class M | 1.06% | |||
| Actual | $1,000.00 | $922.00 | $5.14 | |
| Hypothetical-C | $1,000.00 | $1,019.86 | $5.40 | |
| Class C | 1.52% | |||
| Actual | $1,000.00 | $920.10 | $7.36 | |
| Hypothetical-C | $1,000.00 | $1,017.54 | $7.73 | |
| Mid Cap Value | .49% | |||
| Actual | $1,000.00 | $925.10 | $2.38 | |
| Hypothetical-C | $1,000.00 | $1,022.74 | $2.50 | |
| Class I | .49% | |||
| Actual | $1,000.00 | $924.80 | $2.38 | |
| Hypothetical-C | $1,000.00 | $1,022.74 | $2.50 | |
| Class Z | .37% | |||
| Actual | $1,000.00 | $925.60 | $1.80 | |
| Hypothetical-C | $1,000.00 | $1,023.34 | $1.89 |
A Annualized expense ratio reflects expenses net of applicable fee waivers.
B Expenses are equal to each Class' annualized expense ratio, multiplied by the average account value over the period, multiplied by 184/365 (to reflect the one-half year period).
C 5% return per year before expenses
Distributions (Unaudited)
The fund hereby designates as a capital gain dividend with respect to the taxable year ended January 31, 2019, $112,966,722, or, if subsequently determined to be different, the net capital gain of such year.
Class A, Class M, Class C, Mid Cap Value, Class I, and Class Z designate 100% of the dividends distributed during the fiscal year as qualifying for the dividends–received deduction for corporate shareholders.
Class A, Class M, Class C, Mid Cap Value, Class I, and Class Z designate 100% of the dividends distributed during the fiscal year as amounts which may be taken into account as a dividend for purposes of the maximum rate under section 1(h)(11) of the Internal Revenue Code.
The fund will notify shareholders in January 2020 of amounts for use in preparing 2019 income tax returns.
Board Approval of Investment Advisory Contracts and Management Fees
Fidelity Mid Cap Value Fund
Each year, the Board of Trustees, including the Independent Trustees (together, the Board), votes on the renewal of the management contract with Fidelity Management & Research Company (FMR) and the sub-advisory agreements (together, the Advisory Contracts) for the fund. FMR and the sub-advisers are referred to herein as the Investment Advisers. The Board, assisted by the advice of fund counsel and Independent Trustees' counsel, requests and considers a broad range of information relevant to the renewal of the Advisory Contracts throughout the year.
The Board meets regularly and, at each of its meetings, covers an extensive agenda of topics and materials and considers factors that are relevant to its annual consideration of the renewal of the fund's Advisory Contracts, including the services and support provided to the fund and its shareholders. The Board has established various standing committees (Committees), each composed of and chaired by Independent Trustees with varying backgrounds, to which the Board has assigned specific subject matter responsibilities in order to enhance effective decision-making by the Board. The Board, acting directly and through its Committees, requests and receives information concerning the annual consideration of the renewal of the fund's Advisory Contracts. The Board also meets as needed to review matters specifically related to the Board's annual consideration of the renewal of the Advisory Contracts. Members of the Board may also meet with trustees of other Fidelity funds through joint ad hoc committees to discuss certain matters relevant to all of the Fidelity funds.
At its January 2019 meeting, the Board unanimously determined to renew the fund's Advisory Contracts. In reaching its determination, the Board considered all factors it believed relevant, including (i) the nature, extent, and quality of the services to be provided to the fund and its shareholders (including the investment performance of the fund); (ii) the competitiveness of the fund's management fee and total expense ratio relative to peer funds; (iii) the total costs of the services to be provided by and the profits to be realized by Fidelity from its relationships with the fund; and (iv) the extent to which, if any, economies of scale exist and would be realized as the fund grows, and whether any economies of scale are appropriately shared with fund shareholders.
In considering whether to renew the Advisory Contracts for the fund, the Board reached a determination, with the assistance of fund counsel and Independent Trustees' counsel and through the exercise of its business judgment, that the renewal of the Advisory Contracts was in the best interests of the fund and its shareholders and that the compensation payable under the Advisory Contracts was fair and reasonable. The Board's decision to renew the Advisory Contracts was not based on any single factor, but rather was based on a comprehensive consideration of all the information provided to the Board at its meetings throughout the year. The Board, in reaching its determination to renew the Advisory Contracts, was aware that shareholders of the fund have a broad range of investment choices available to them, including a wide choice among funds offered by Fidelity's competitors, and that the fund's shareholders, who have the opportunity to review and weigh the disclosure provided by the fund in its prospectus and other public disclosures, have chosen to invest in this fund, which is part of the Fidelity family of funds.
Nature, Extent, and Quality of Services Provided. The Board considered Fidelity's staffing as it relates to the fund, including the backgrounds of investment personnel of Fidelity, and also considered the fund's investment objective, strategies, and related investment philosophy. The Independent Trustees also had discussions with senior management of Fidelity's investment operations and investment groups. The Board considered the structure of the investment personnel compensation program and whether this structure provides appropriate incentives to act in the best interests of the fund. Additionally, the Board considered the portfolio managers' investments, if any, in the funds that they manage.Resources Dedicated to Investment Management and Support Services. The Board and the Fund Oversight and Research Committees reviewed the general qualifications and capabilities of Fidelity's investment staff, including its size, education, experience, and resources, as well as Fidelity's approach to recruiting, training, managing, and compensating investment personnel. The Board noted that Fidelity has continued to increase the resources devoted to non-U.S. offices, including expansion of Fidelity's global investment organization. The Board also noted that Fidelity's analysts have extensive resources, tools and capabilities that allow them to conduct sophisticated quantitative and fundamental analysis, as well as credit analysis of issuers, counterparties and guarantors. Further, the Board considered that Fidelity's investment professionals have sufficient access to global information and data so as to provide competitive investment results over time, and that those professionals also have access to sophisticated tools that permit them to assess portfolio construction and risk and performance attribution characteristics continuously, as well as to transmit new information and research conclusions rapidly around the world. Additionally, in its deliberations, the Board considered Fidelity's trading, risk management, compliance, and technology and operations capabilities and resources, which are integral parts of the investment management process.Shareholder and Administrative Services. The Board considered (i) the nature, extent, quality, and cost of advisory, administrative, and shareholder services performed by the Investment Advisers and their affiliates under the Advisory Contracts and under separate agreements covering transfer agency, pricing and bookkeeping, and securities lending services for the fund; (ii) the nature and extent of the supervision of third party service providers, principally custodians, subcustodians, and pricing vendors; and (iii) the resources devoted to, and the record of compliance with, the fund's compliance policies and procedures. The Board also reviewed the allocation of fund brokerage, including allocations to brokers affiliated with the Investment Advisers, the use of brokerage commissions to pay fund expenses, and the use of "soft" commission dollars to pay for research services.The Board noted that the growth of fund assets over time across the complex allows Fidelity to reinvest in the development of services designed to enhance the value and convenience of the Fidelity funds as investment vehicles. These services include 24-hour access to account information and market information through telephone representatives and over the Internet, investor education materials and asset allocation tools, and the expanded availability of Fidelity Investor Centers.The Board noted that it and the boards of certain other Fidelity funds had formed an ad hoc Committee on Transfer Agency Fees to review the variety of transfer agency fee structures throughout the industry and Fidelity's competitive positioning with respect to industry participants.Investment in a Large Fund Family. The Board considered the benefits to shareholders of investing in a Fidelity fund, including the benefits of investing in a fund that is part of a large family of funds offering a variety of investment disciplines and providing a large variety of mutual fund investor services. The Board noted that Fidelity had taken, or had made recommendations that resulted in the Fidelity funds taking, a number of actions over the previous year that benefited particular funds, including: (i) continuing to dedicate additional resources to Fidelity's investment research process, which includes meetings with management of issuers of securities in which the funds invest, and to the support of the senior management team that oversees asset management; (ii) continuing efforts to enhance Fidelity's global research capabilities; (iii) launching new funds and making other enhancements to meet client needs; (iv) launching new share classes of existing funds; (v) eliminating purchase minimums and broadening eligibility requirements for certain funds and share classes; (vi) reducing management fees and total expenses for certain growth equity funds and index funds; (vii) lowering expense caps for certain existing funds and classes, and converting certain voluntary expense caps to contractual caps, to reduce expenses borne by shareholders; (viii) eliminating short-term redemption fees for funds that had such fees; (ix) rationalizing product lines and gaining increased efficiencies from fund mergers and share class consolidations; (x) continuing to develop, acquire and implement systems and technology to improve services to the funds and shareholders, strengthen information security, and increase efficiency; and (xi) continuing to implement enhancements to further strengthen Fidelity's product line to increase investors' probability of success in achieving their investment goals, including retirement income goals.Investment Performance. The Board considered whether the fund has operated in accordance with its investment objective, as well as its record of compliance with its investment restrictions and its performance history. The fund had a portfolio manager change in June 2017. The Board will continue to monitor closely the fund's performance, taking into account the portfolio manager change.The Board took into account discussions that occur at Board meetings throughout the year with representatives of the Investment Advisers about fund investment performance. In this regard the Board noted that as part of regularly scheduled fund reviews and other reports to the Board on fund performance, the Board considers annualized return information for the fund for different time periods, measured against an appropriate securities market index ("benchmark index") and a peer group of funds with similar objectives ("peer group"), if any. In its evaluation of fund investment performance, the Board gave particular attention to information indicating changes in performance of certain Fidelity funds for specific time periods and discussed with the Investment Advisers the reasons for any overperformance or underperformance.In addition to reviewing absolute and relative fund performance, the Independent Trustees periodically consider the appropriateness of fund performance metrics in evaluating the results achieved. In general, the Independent Trustees believe that fund performance should be evaluated based on net performance (after fees and expenses) of both the highest performing and lowest performing fund share classes, where applicable, compared to appropriate benchmark indices, over appropriate time periods that may include full market cycles, and compared to peer groups, as applicable, over the same periods, taking into account relevant factors including the following: general market conditions; issuer-specific information; and fund cash flows and other factors.The Independent Trustees recognize that shareholders evaluate performance on a net basis over their own holding periods, for which one-, three-, and five-year periods are often used as a proxy. For this reason, the performance information reviewed by the Board also included net cumulative total return information for the fund and an appropriate benchmark index and peer group for the most recent one-, three-, and five-year periods ended June 30, 2018, as shown below. Returns are shown compared to the 25th percentile (top of box, 75% beaten) and 75th percentile (bottom of box, 25% beaten) of the peer universe.Fidelity Mid Cap Value Fund
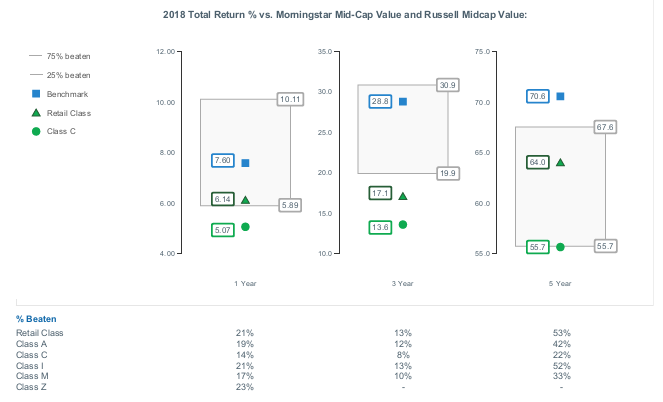
Fidelity Mid Cap Value Fund

![]()
MCV-ANN-0319
1.900180.109
Fidelity Flex℠ Funds Fidelity Flex℠ Mid Cap Value Fund Annual Report January 31, 2019 |
|
Beginning on January 1, 2021, as permitted by regulations adopted by the Securities and Exchange Commission, paper copies of a fund’s shareholder reports will no longer be sent by mail, unless you specifically request paper copies of the reports from the fund or from your financial intermediary, such as a financial advisor, broker-dealer or bank. Instead, the reports will be made available on a website, and you will be notified by mail each time a report is posted and provided with a website link to access the report.
If you already elected to receive shareholder reports electronically, you will not be affected by this change and you need not take any action. You may elect to receive shareholder reports and other communications from a fund electronically, by contacting your financial intermediary. For Fidelity customers, visit Fidelity's web site or call Fidelity using the contact information listed below.
You may elect to receive all future reports in paper free of charge. If you wish to continue receiving paper copies of your shareholder reports, you may contact your financial intermediary or, if you are a Fidelity customer, visit Fidelity’s website, or call Fidelity at the applicable toll-free number listed below. Your election to receive reports in paper will apply to all funds held with the fund complex/your financial intermediary.
| Account Type | Website | Phone Number |
| Brokerage, Mutual Fund, or Annuity Contracts: | fidelity.com/mailpreferences | 1-800-343-3548 |
| Employer Provided Retirement Accounts: | netbenefits.fidelity.com/preferences (choose 'no' under Required Disclosures to continue to print) | 1-800-343-0860 |
| Advisor Sold Accounts Serviced Through Your Financial Intermediary: | Contact Your Financial Intermediary | Your Financial Intermediary's phone number |
| Advisor Sold Accounts Serviced by Fidelity: | institutional.fidelity.com | 1-877-208-0098 |
Contents
Board Approval of Investment Advisory Contracts and Management Fees |
To view a fund's proxy voting guidelines and proxy voting record for the 12-month period ended June 30, visit http://www.fidelity.com/proxyvotingresults or visit the Securities and Exchange Commission's (SEC) web site at http://www.sec.gov.
You may also call 1-800-835-5092 to request a free copy of the proxy voting guidelines.
Standard & Poor's, S&P and S&P 500 are registered service marks of The McGraw-Hill Companies, Inc. and have been licensed for use by Fidelity Distributors Corporation.
Other third-party marks appearing herein are the property of their respective owners.
All other marks appearing herein are registered or unregistered trademarks or service marks of FMR LLC or an affiliated company. © 2019 FMR LLC. All rights reserved.
This report and the financial statements contained herein are submitted for the general information of the shareholders of the Fund. This report is not authorized for distribution to prospective investors in the Fund unless preceded or accompanied by an effective prospectus.
A fund files its complete schedule of portfolio holdings with the SEC for the first and third quarters of each fiscal year on Form N-Q. Forms N-Q are available on the SEC’s web site at http://www.sec.gov. A fund's Forms N-Q may be reviewed and copied at the SEC’s Public Reference Room in Washington, DC. Information regarding the operation of the SEC's Public Reference Room may be obtained by calling 1-800-SEC-0330.
For a complete list of a fund's portfolio holdings, view the most recent holdings listing, semiannual report, or annual report on Fidelity's web site at http://www.fidelity.com, http://www.institutional.fidelity.com, or http://www.401k.com, as applicable.
NOT FDIC INSURED •MAY LOSE VALUE •NO BANK GUARANTEE
Neither the Fund nor Fidelity Distributors Corporation is a bank.
Performance: The Bottom Line
Average annual total return reflects the change in the value of an investment, assuming reinvestment of distributions from dividend income and capital gains (the profits earned upon the sale of securities that have grown in value, if any) and assuming a constant rate of performance each year. The hypothetical investment and the average annual total returns do not reflect the deduction of taxes that a shareholder would pay on fund distributions or the redemption of fund shares. During periods of reimbursement by Fidelity, a fund’s total return will be greater than it would be had the reimbursement not occurred. How a fund did yesterday is no guarantee of how it will do tomorrow.
Average Annual Total Returns
| For the periods ended January 31, 2019 | Past 1 year | Life of fundA |
| Fidelity Flex℠ Mid Cap Value Fund | (8.60)% | 1.58% |
A From March 8, 2017
$10,000 Over Life of Fund
Let's say hypothetically that $10,000 was invested in Fidelity Flex℠ Mid Cap Value Fund on March 8, 2017, when the fund started.
The chart shows how the value of your investment would have changed, and also shows how the Russell Midcap® Value Index performed over the same period.
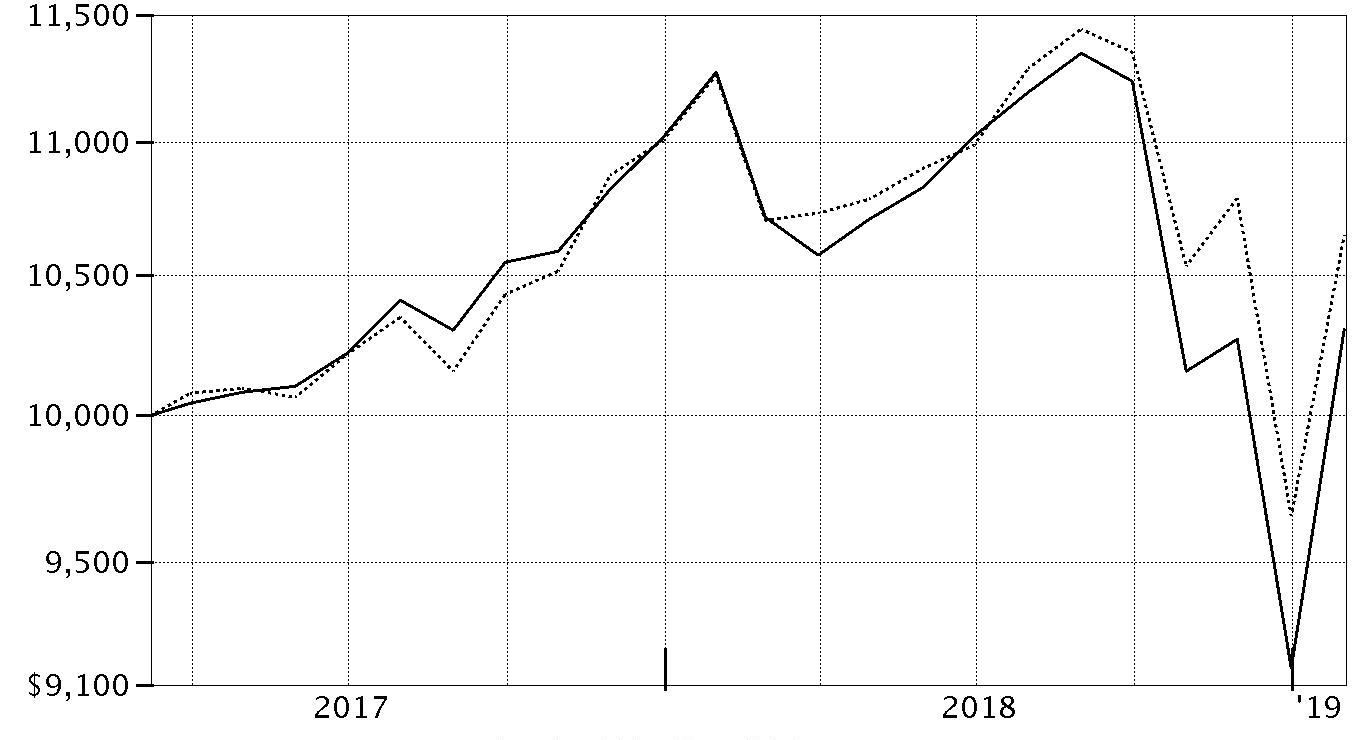
| Period Ending Values | ||
| $10,303 | Fidelity Flex℠ Mid Cap Value Fund | |
| $10,648 | Russell Midcap® Value Index | |
Management's Discussion of Fund Performance
Market Recap: The S&P 500® index returned -2.31% for the 12 months ending January 31, 2019, as the U.S. equity bellwether began the new year on a high note after enduring a final quarter of 2018 in which resurgent volatility upset the aging bull market. In October, rising U.S. Treasury yields and concern about peaking corporate earnings growth sent many investors fleeing from risk assets as they were still dealing with lingering uncertainty related to global trade and the U.S. Federal Reserve picking up the pace of interest rate hikes. The index returned -6.84% in October, at the time its largest monthly drop in seven years. But conditions worsened through Christmas, as jitters about the economy and another hike in rates led to a spike in market volatility and a -9.03% result for December. Sharply reversing course to begin 2019, the S&P 500® gained 8.01% in January, its strongest opening month since 1987, amid upbeat company earnings/outlooks and signs the Fed may pause on rates. For the full period, some economically sensitive sectors were at the bottom of the 12-month performance scale: materials (-14%), energy (-12%), financials (-11%) and industrials (-8%). Meanwhile, communication services – which includes dividend-rich telecom stocks – and consumer staples returned about -5%. In contrast, the defensive utilities (+11%), real estate (+10%) and health care (+5%) sectors led the way. Information technology and consumer discretionary were rattled in the late-2018 downturn, but earlier strength resulted in each advancing about 3%.Comments from Portfolio Manager Matthew Friedman: The fund returned -8.60% for the fiscal year, behind the -5.43% return of the benchmark Russell Midcap® Value Index. Versus the benchmark, security selection detracted overall, especially within the financials sector. Picks within consumer staples and communication services also hurt on a relative basis, as did positioning in energy. Conversely, picks in consumer discretionary, industrials and utilities added value. Among individual stocks, untimely ownership of Spectrum Brands Holdings, owner of the the Iams® pet food and Armor All® car-care brands, detracted more than any other position, largely due to disappointing earnings. Energy transportation firm Encana, a non-benchmark holding, also hurt versus the benchmark. On the positive side, real estate holdings National Retail Properties and Equity Lifestyle Properties added value. Real estate stocks generally benefited from investors’ late-period rotation into market segments historically considered more-defensive.The views expressed above reflect those of the portfolio manager(s) only through the end of the period as stated on the cover of this report and do not necessarily represent the views of Fidelity or any other person in the Fidelity organization. Any such views are subject to change at any time based upon market or other conditions and Fidelity disclaims any responsibility to update such views. These views may not be relied on as investment advice and, because investment decisions for a Fidelity fund are based on numerous factors, may not be relied on as an indication of trading intent on behalf of any Fidelity fund.
Notes to shareholders: On May 18, 2018, Justin Bennett, John Mirshekari, Laurie Mundt and Shadman Riaz all came off of the fund, leaving Matt Friedman as the sole manager. On March 31, 2018, Kathy Buck retired from portfolio management, leaving Matt Friedman as the sole manager of the consumer staples and consumer discretionary sleeves.Investment Summary (Unaudited)
Top Ten Stocks as of January 31, 2019
| % of fund's net assets | |
| PPL Corp. | 2.6 |
| Sempra Energy | 2.5 |
| American Tower Corp. | 2.3 |
| National Retail Properties, Inc. | 2.3 |
| Synchrony Financial | 2.2 |
| Ameren Corp. | 2.1 |
| Equity Lifestyle Properties, Inc. | 2.0 |
| AECOM | 1.8 |
| Equinix, Inc. | 1.8 |
| U.S. Foods Holding Corp. | 1.8 |
| 21.4 |
Top Five Market Sectors as of January 31, 2019
| % of fund's net assets | |
| Financials | 17.2 |
| Real Estate | 12.8 |
| Consumer Discretionary | 12.0 |
| Industrials | 11.7 |
| Information Technology | 10.0 |
Asset Allocation (% of fund's net assets)
| As of January 31, 2019* | ||
| Stocks | 98.4% | |
| Short-Term Investments and Net Other Assets (Liabilities) | 1.6% | |

* Foreign investments - 16.9%
Schedule of Investments January 31, 2019
Showing Percentage of Net Assets
| Common Stocks - 98.4% | |||
| Shares | Value | ||
| COMMUNICATION SERVICES - 3.6% | |||
| Media - 3.6% | |||
| Discovery Communications, Inc. Class A (a) | 786 | $22,307 | |
| GCI Liberty, Inc. (a) | 688 | 35,019 | |
| Liberty Global PLC Class C (a) | 545 | 12,840 | |
| Nexstar Broadcasting Group, Inc. Class A | 331 | 27,629 | |
| 97,795 | |||
| CONSUMER DISCRETIONARY - 12.0% | |||
| Distributors - 0.9% | |||
| LKQ Corp. (a) | 927 | 24,306 | |
| Diversified Consumer Services - 0.7% | |||
| Houghton Mifflin Harcourt Co. (a) | 1,698 | 17,778 | |
| Hotels, Restaurants & Leisure - 4.2% | |||
| Eldorado Resorts, Inc. (a) | 880 | 41,026 | |
| The Stars Group, Inc. (a) | 1,387 | 25,119 | |
| U.S. Foods Holding Corp. (a) | 1,432 | 48,287 | |
| 114,432 | |||
| Household Durables - 2.2% | |||
| D.R. Horton, Inc. | 856 | 32,913 | |
| Mohawk Industries, Inc. (a) | 212 | 27,303 | |
| 60,216 | |||
| Internet & Direct Marketing Retail - 0.9% | |||
| Liberty Interactive Corp. QVC Group Series A (a) | 1,082 | 23,534 | |
| Leisure Products - 0.8% | |||
| Mattel, Inc. (a) | 1,866 | 22,093 | |
| Multiline Retail - 1.5% | |||
| Dollar Tree, Inc. (a) | 436 | 42,218 | |
| Specialty Retail - 0.8% | |||
| Lowe's Companies, Inc. | 218 | 20,963 | |
| TOTAL CONSUMER DISCRETIONARY | 325,540 | ||
| CONSUMER STAPLES - 5.3% | |||
| Food Products - 2.5% | |||
| Conagra Brands, Inc. | 883 | 19,108 | |
| Darling International, Inc. (a) | 2,246 | 47,772 | |
| 66,880 | |||
| Household Products - 1.2% | |||
| Spectrum Brands Holdings, Inc. | 595 | 33,249 | |
| Personal Products - 0.6% | |||
| Coty, Inc. Class A | 2,034 | 15,784 | |
| Tobacco - 1.0% | |||
| British American Tobacco PLC (United Kingdom) | 764 | 26,931 | |
| TOTAL CONSUMER STAPLES | 142,844 | ||
| ENERGY - 7.4% | |||
| Energy Equipment & Services - 0.7% | |||
| Baker Hughes, a GE Co. Class A | 829 | 19,540 | |
| Oil, Gas & Consumable Fuels - 6.7% | |||
| Anadarko Petroleum Corp. | 634 | 30,007 | |
| Cheniere Energy, Inc. (a) | 614 | 40,309 | |
| Encana Corp. | 2,212 | 15,185 | |
| Lundin Petroleum AB | 1,093 | 34,970 | |
| Noble Energy, Inc. | 1,550 | 34,627 | |
| Valero Energy Corp. | 308 | 27,049 | |
| 182,147 | |||
| TOTAL ENERGY | 201,687 | ||
| FINANCIALS - 17.2% | |||
| Banks - 3.3% | |||
| U.S. Bancorp | 922 | 47,170 | |
| Wells Fargo & Co. | 869 | 42,503 | |
| 89,673 | |||
| Capital Markets - 7.5% | |||
| Ameriprise Financial, Inc. | 321 | 40,639 | |
| Apollo Global Management LLC Class A | 1,425 | 41,724 | |
| Ares Management Corp. | 837 | 17,460 | |
| Invesco Ltd. | 1,207 | 21,992 | |
| State Street Corp. | 479 | 33,961 | |
| The Blackstone Group LP | 1,428 | 48,124 | |
| 203,900 | |||
| Consumer Finance - 4.4% | |||
| OneMain Holdings, Inc. (a) | 1,033 | 30,876 | |
| SLM Corp. | 2,639 | 28,264 | |
| Synchrony Financial | 2,023 | 60,771 | |
| 119,911 | |||
| Insurance - 2.0% | |||
| American International Group, Inc. | 489 | 21,139 | |
| Chubb Ltd. | 239 | 31,799 | |
| 52,938 | |||
| TOTAL FINANCIALS | 466,422 | ||
| HEALTH CARE - 3.8% | |||
| Health Care Providers & Services - 1.6% | |||
| Cigna Corp. | 106 | 21,180 | |
| CVS Health Corp. | 352 | 23,074 | |
| 44,254 | |||
| Pharmaceuticals - 2.2% | |||
| Allergan PLC | 133 | 19,149 | |
| Jazz Pharmaceuticals PLC (a) | 323 | 40,662 | |
| 59,811 | |||
| TOTAL HEALTH CARE | 104,065 | ||
| INDUSTRIALS - 11.7% | |||
| Aerospace & Defense - 2.0% | |||
| Huntington Ingalls Industries, Inc. | 176 | 36,335 | |
| United Technologies Corp. | 147 | 17,356 | |
| 53,691 | |||
| Airlines - 1.0% | |||
| American Airlines Group, Inc. | 729 | 26,076 | |
| Commercial Services & Supplies - 1.3% | |||
| The Brink's Co. | 489 | 36,210 | |
| Construction & Engineering - 1.8% | |||
| AECOM (a) | 1,644 | 50,323 | |
| Machinery - 1.1% | |||
| WABCO Holdings, Inc. (a) | 263 | 30,042 | |
| Professional Services - 0.7% | |||
| Nielsen Holdings PLC | 739 | 18,978 | |
| Trading Companies & Distributors - 3.2% | |||
| AerCap Holdings NV (a) | 705 | 33,318 | |
| Fortress Transportation & Infrastructure Investors LLC | 1,162 | 17,140 | |
| HD Supply Holdings, Inc. (a) | 861 | 36,110 | |
| 86,568 | |||
| Transportation Infrastructure - 0.6% | |||
| Macquarie Infrastructure Co. LLC | 402 | 17,354 | |
| TOTAL INDUSTRIALS | 319,242 | ||
| INFORMATION TECHNOLOGY - 10.0% | |||
| Communications Equipment - 0.7% | |||
| CommScope Holding Co., Inc. (a) | 951 | 19,885 | |
| Electronic Equipment & Components - 0.6% | |||
| Flextronics International Ltd. (a) | 1,809 | 17,403 | |
| IT Services - 5.2% | |||
| Cognizant Technology Solutions Corp. Class A | 238 | 16,584 | |
| Conduent, Inc. (a) | 1,816 | 23,154 | |
| DXC Technology Co. | 460 | 29,495 | |
| First Data Corp. Class A (a) | 1,473 | 36,309 | |
| Leidos Holdings, Inc. | 601 | 34,858 | |
| 140,400 | |||
| Semiconductors & Semiconductor Equipment - 2.0% | |||
| Marvell Technology Group Ltd. | 1,546 | 28,647 | |
| NXP Semiconductors NV | 294 | 25,587 | |
| 54,234 | |||
| Software - 1.5% | |||
| Micro Focus International PLC | 2,101 | 40,056 | |
| TOTAL INFORMATION TECHNOLOGY | 271,978 | ||
| MATERIALS - 7.4% | |||
| Chemicals - 5.0% | |||
| DowDuPont, Inc. | 582 | 31,317 | |
| LyondellBasell Industries NV Class A | 402 | 34,962 | |
| Nutrien Ltd. | 607 | 31,446 | |
| Westlake Chemical Corp. | 533 | 39,389 | |
| 137,114 | |||
| Construction Materials - 0.9% | |||
| Eagle Materials, Inc. | 332 | 23,572 | |
| Containers & Packaging - 1.5% | |||
| Crown Holdings, Inc. (a) | 815 | 41,565 | |
| TOTAL MATERIALS | 202,251 | ||
| REAL ESTATE - 12.8% | |||
| Equity Real Estate Investment Trusts (REITs) - 11.5% | |||
| American Tower Corp. | 369 | 63,778 | |
| Douglas Emmett, Inc. | 988 | 37,376 | |
| Equinix, Inc. | 126 | 49,644 | |
| Equity Lifestyle Properties, Inc. | 521 | 55,163 | |
| National Retail Properties, Inc. | 1,169 | 61,618 | |
| Public Storage | 218 | 46,329 | |
| 313,908 | |||
| Real Estate Management & Development - 1.3% | |||
| CBRE Group, Inc. (a) | 737 | 33,718 | |
| TOTAL REAL ESTATE | 347,626 | ||
| UTILITIES - 7.2% | |||
| Electric Utilities - 2.6% | |||
| PPL Corp. | 2,301 | 72,068 | |
| Multi-Utilities - 4.6% | |||
| Ameren Corp. | 822 | 56,997 | |
| Sempra Energy | 581 | 67,965 | |
| 124,962 | |||
| TOTAL UTILITIES | 197,030 | ||
| TOTAL COMMON STOCKS | |||
| (Cost $2,776,379) | 2,676,480 | ||
| Money Market Funds - 0.5% | |||
| Fidelity Cash Central Fund, 2.43% (b) | |||
| (Cost $14,709) | 14,706 | 14,709 | |
| TOTAL INVESTMENT IN SECURITIES - 98.9% | |||
| (Cost $2,791,088) | 2,691,189 | ||
| NET OTHER ASSETS (LIABILITIES) - 1.1% | 29,823 | ||
| NET ASSETS - 100% | $2,721,012 |
Legend
(a) Non-income producing
(b) Affiliated fund that is generally available only to investment companies and other accounts managed by Fidelity Investments. The rate quoted is the annualized seven-day yield of the fund at period end. A complete unaudited listing of the fund's holdings as of its most recent quarter end is available upon request. In addition, each Fidelity Central Fund's financial statements, which are not covered by the Fund's Report of Independent Registered Public Accounting Firm, are available on the SEC's website or upon request.
Affiliated Central Funds
Information regarding fiscal year to date income earned by the Fund from investments in Fidelity Central Funds is as follows:
| Fund | Income earned |
| Fidelity Cash Central Fund | $789 |
| Total | $789 |
Amounts in the income column in the above table include any capital gain distributions from underlying funds, which are presented in the corresponding line-item in the Statement of Operations, if applicable.
Investment Valuation
The following is a summary of the inputs used, as of January 31, 2019, involving the Fund's assets and liabilities carried at fair value. The inputs or methodology used for valuing securities may not be an indication of the risk associated with investing in those securities. For more information on valuation inputs, and their aggregation into the levels used below, please refer to the Investment Valuation section in the accompanying Notes to Financial Statements.
| Valuation Inputs at Reporting Date: | ||||
| Description | Total | Level 1 | Level 2 | Level 3 |
| Investments in Securities: | ||||
| Equities: | ||||
| Communication Services | $97,795 | $97,795 | $-- | $-- |
| Consumer Discretionary | 325,540 | 325,540 | -- | -- |
| Consumer Staples | 142,844 | 115,913 | 26,931 | -- |
| Energy | 201,687 | 201,687 | -- | -- |
| Financials | 466,422 | 466,422 | -- | -- |
| Health Care | 104,065 | 104,065 | -- | -- |
| Industrials | 319,242 | 319,242 | -- | -- |
| Information Technology | 271,978 | 231,922 | 40,056 | -- |
| Materials | 202,251 | 202,251 | -- | -- |
| Real Estate | 347,626 | 347,626 | -- | -- |
| Utilities | 197,030 | 197,030 | -- | -- |
| Money Market Funds | 14,709 | 14,709 | -- | -- |
| Total Investments in Securities: | $2,691,189 | $2,624,202 | $66,987 | $-- |
Other Information
Distribution of investments by country or territory of incorporation, as a percentage of Total Net Assets, is as follows (Unaudited):
| United States of America | 83.1% |
| United Kingdom | 3.7% |
| Netherlands | 3.4% |
| Canada | 2.6% |
| Ireland | 2.2% |
| Bermuda | 1.9% |
| Sweden | 1.3% |
| Switzerland | 1.2% |
| Others (Individually Less Than 1%) | 0.6% |
| 100.0% |
See accompanying notes which are an integral part of the financial statements.
Financial Statements
Statement of Assets and Liabilities
| January 31, 2019 | ||
| Assets | ||
| Investment in securities, at value — See accompanying schedule: Unaffiliated issuers (cost $2,776,379) | $2,676,480 | |
| Fidelity Central Funds (cost $14,709) | 14,709 | |
| Total Investment in Securities (cost $2,791,088) | $2,691,189 | |
| Cash | 39,196 | |
| Foreign currency held at value (cost $105) | 106 | |
| Receivable for fund shares sold | 595 | |
| Dividends receivable | 1,972 | |
| Distributions receivable from Fidelity Central Funds | 30 | |
| Total assets | 2,733,088 | |
| Liabilities | ||
| Payable for fund shares redeemed | $12,076 | |
| Total liabilities | 12,076 | |
| Net Assets | $2,721,012 | |
| Net Assets consist of: | ||
| Paid in capital | $2,934,312 | |
| Total distributable earnings (loss) | (213,300) | |
| Net Assets, for 286,245 shares outstanding | $2,721,012 | |
| Net Asset Value, offering price and redemption price per share ($2,721,012 ÷ 286,245 shares) | $9.51 |
See accompanying notes which are an integral part of the financial statements.
Statement of Operations
| Year ended January 31, 2019 | ||
| Investment Income | ||
| Dividends | $61,867 | |
| Income from Fidelity Central Funds | 789 | |
| Total income | 62,656 | |
| Expenses | ||
| Independent trustees' fees and expenses | $18 | |
| Commitment fees | 9 | |
| Total expenses | 27 | |
| Net investment income (loss) | 62,629 | |
| Realized and Unrealized Gain (Loss) | ||
| Net realized gain (loss) on: | ||
| Investment securities: | ||
| Unaffiliated issuers | 14,269 | |
| Foreign currency transactions | (163) | |
| Futures contracts | 1,909 | |
| Total net realized gain (loss) | 16,015 | |
| Change in net unrealized appreciation (depreciation) on: | ||
| Investment securities: | ||
| Unaffiliated issuers | (338,258) | |
| Assets and liabilities in foreign currencies | 17 | |
| Total change in net unrealized appreciation (depreciation) | (338,241) | |
| Net gain (loss) | (322,226) | |
| Net increase (decrease) in net assets resulting from operations | $(259,597) |
See accompanying notes which are an integral part of the financial statements.
Statement of Changes in Net Assets
| Year ended January 31, 2019 | For the period March 8, 2017 (commencement of operations) to January 31, 2018 | |
| Increase (Decrease) in Net Assets | ||
| Operations | ||
| Net investment income (loss) | $62,629 | $30,522 |
| Net realized gain (loss) | 16,015 | 7,093 |
| Change in net unrealized appreciation (depreciation) | (338,241) | 238,362 |
| Net increase (decrease) in net assets resulting from operations | (259,597) | 275,977 |
| Distributions to shareholders | (192,570) | – |
| Distributions to shareholders from net investment income | – | (29,513) |
| Distributions to shareholders from net realized gain | – | (7,597) |
| Total distributions | (192,570) | (37,110) |
| Share transactions | ||
| Proceeds from sales of shares | 2,556,315 | 3,725,242 |
| Reinvestment of distributions | 192,570 | 37,110 |
| Cost of shares redeemed | (2,444,930) | (1,131,995) |
| Net increase (decrease) in net assets resulting from share transactions | 303,955 | 2,630,357 |
| Total increase (decrease) in net assets | (148,212) | 2,869,224 |
| Net Assets | ||
| Beginning of period | 2,869,224 | – |
| End of period | $2,721,012 | $2,869,224 |
| Other Information | ||
| Undistributed net investment income end of period | $728 | |
| Shares | ||
| Sold | 240,625 | 360,007 |
| Issued in reinvestment of distributions | 20,748 | 3,462 |
| Redeemed | (232,742) | (105,855) |
| Net increase (decrease) | 28,631 | 257,614 |
See accompanying notes which are an integral part of the financial statements.
Financial Highlights
Fidelity Flex Mid Cap Value Fund
| Years ended January 31, | 2019 | 2018 A |
| Selected Per–Share Data | ||
| Net asset value, beginning of period | $11.14 | $10.00 |
| Income from Investment Operations | ||
| Net investment income (loss)B | .20 | .17 |
| Net realized and unrealized gain (loss) | (1.18) | 1.10 |
| Total from investment operations | (.98) | 1.27 |
| Distributions from net investment income | (.21) | (.10) |
| Distributions from net realized gain | (.44) | (.03) |
| Total distributions | (.65) | (.13) |
| Net asset value, end of period | $9.51 | $11.14 |
| Total ReturnC | (8.60)% | 12.72% |
| Ratios to Average Net AssetsD,E | ||
| Expenses before reductionsF | -% | - %G |
| Expenses net of fee waivers, if anyF | -% | - %G |
| Expenses net of all reductionsF | -% | - %G |
| Net investment income (loss) | 1.88% | 1.76%G |
| Supplemental Data | ||
| Net assets, end of period (000 omitted) | $2,721 | $2,869 |
| Portfolio turnover rateH | 218% | 137%G |
A For the period March 8, 2017 (commencement of operations) to January 31, 2018.
B Calculated based on average shares outstanding during the period.
C Total returns for periods of less than one year are not annualized.
D Fees and expenses of any underlying Fidelity Central Funds are not included in the Fund's expense ratio. The Fund indirectly bears its proportionate share of the expenses of any underlying Fidelity Central Funds.
E Expense ratios reflect operating expenses of the Fund. Expenses before reductions do not reflect amounts reimbursed by the investment adviser or reductions from expense offset arrangements and do not represent the amount paid by the Fund during periods when reimbursements or reductions occur. Expense ratios before reductions for start-up periods may not be representative of longer term operating periods. Expenses net of fee waivers reflect expenses after reimbursement by the investment adviser but prior to reductions from expense offset arrangements. Expenses net of all reductions represent the net expenses paid by the Fund.
F Amount represents less than .005%.
G Annualized
H Amount does not include the portfolio activity of any underlying Fidelity Central Funds.
See accompanying notes which are an integral part of the financial statements.
Notes to Financial Statements
For the period ended January 31, 2019
1. Organization.
Fidelity Flex Mid Cap Value Fund (the Fund) is a fund of Fidelity Devonshire Trust (the Trust) and is authorized to issue an unlimited number of shares. Share transactions on the Statement of Changes in Net Assets may contain exchanges between affiliated funds. The Trust is registered under the Investment Company Act of 1940, as amended (the 1940 Act), as an open-end management investment company organized as a Massachusetts business trust. The Fund is available only to certain fee-based accounts offered by Fidelity.
2. Investments in Fidelity Central Funds.
The Fund invests in Fidelity Central Funds, which are open-end investment companies generally available only to other investment companies and accounts managed by the investment adviser and its affiliates. The Fund's Schedule of Investments lists each of the Fidelity Central Funds held as of period end, if any, as an investment of the Fund, but does not include the underlying holdings of each Fidelity Central Fund. As an Investing Fund, the Fund indirectly bears its proportionate share of the expenses of the underlying Fidelity Central Funds.
The Money Market Central Funds seek preservation of capital and current income and are managed by Fidelity Investments Money Management, Inc. (FIMM), an affiliate of the investment adviser. Annualized expenses of the Money Market Central Funds as of their most recent shareholder report date are less than .005%.
A complete unaudited list of holdings for each Fidelity Central Fund is available upon request or at the Securities and Exchange Commission (the SEC) website at www.sec.gov. In addition, the financial statements of the Fidelity Central Funds, which are not covered by the Fund's Report of Independent Registered Public Accounting Firm, are available on the SEC website or upon request.
3. Significant Accounting Policies.
The Fund is an investment company and applies the accounting and reporting guidance of the Financial Accounting Standards Board (FASB) Accounting Standards Codification Topic 946 Financial Services – Investments Companies. The financial statements have been prepared in conformity with accounting principles generally accepted in the United States of America (GAAP), which require management to make certain estimates and assumptions at the date of the financial statements. Actual results could differ from those estimates. Subsequent events, if any, through the date that the financial statements were issued have been evaluated in the preparation of the financial statements. The following summarizes the significant accounting policies of the Fund:
Investment Valuation. Investments are valued as of 4:00 p.m. Eastern time on the last calendar day of the period. The Board of Trustees (the Board) has delegated the day to day responsibility for the valuation of the Fund's investments to the Fair Value Committee (the Committee) established by the Fund's investment adviser. In accordance with valuation policies and procedures approved by the Board, the Fund attempts to obtain prices from one or more third party pricing vendors or brokers to value its investments. When current market prices, quotations or currency exchange rates are not readily available or reliable, investments will be fair valued in good faith by the Committee, in accordance with procedures adopted by the Board. Factors used in determining fair value vary by investment type and may include market or investment specific events. The frequency with which these procedures are used cannot be predicted and they may be utilized to a significant extent. The Committee oversees the Fund's valuation policies and procedures and reports to the Board on the Committee's activities and fair value determinations. The Board monitors the appropriateness of the procedures used in valuing the Fund's investments and ratifies the fair value determinations of the Committee.
The Fund categorizes the inputs to valuation techniques used to value its investments into a disclosure hierarchy consisting of three levels as shown below:
- Level 1 – quoted prices in active markets for identical investments
- Level 2 – other significant observable inputs (including quoted prices for similar investments, interest rates, prepayment speeds, etc.)
- Level 3 – unobservable inputs (including the Fund's own assumptions based on the best information available)
Valuation techniques used to value the Fund's investments by major category are as follows:
Equity securities, including restricted securities, for which market quotations are readily available, are valued at the last reported sale price or official closing price as reported by a third party pricing vendor on the primary market or exchange on which they are traded and are categorized as Level 1 in the hierarchy. In the event there were no sales during the day or closing prices are not available, securities are valued at the last quoted bid price or may be valued using the last available price and are generally categorized as Level 2 in the hierarchy. For foreign equity securities, when market or security specific events arise, comparisons to the valuation of American Depositary Receipts (ADRs), futures contracts, Exchange-Traded Funds (ETFs) and certain indexes as well as quoted prices for similar securities may be used and would be categorized as Level 2 in the hierarchy. For equity securities, including restricted securities, where observable inputs are limited, assumptions about market activity and risk are used and these securities may be categorized as Level 3 in the hierarchy.
Investments in open-end mutual funds, including the Fidelity Central Funds, are valued at their closing net asset value (NAV) each business day and are categorized as Level 1 in the hierarchy.
Changes in valuation techniques may result in transfers in or out of an assigned level within the disclosure hierarchy. The aggregate value of investments by input level as of January 31, 2019 is included at the end of the Fund's Schedule of Investments.
Foreign Currency. The Fund may use foreign currency contracts to facilitate transactions in foreign-denominated securities. Gains and losses from these transactions may arise from changes in the value of the foreign currency or if the counterparties do not perform under the contracts' terms.
Foreign-denominated assets, including investment securities, and liabilities are translated into U.S. dollars at the exchange rates at period end. Purchases and sales of investment securities, income and dividends received and expenses denominated in foreign currencies are translated into U.S. dollars at the exchange rate in effect on the transaction date.
The effects of exchange rate fluctuations on investments are included with the net realized and unrealized gain (loss) on investment securities. Other foreign currency transactions resulting in realized and unrealized gain (loss) are disclosed separately.
Investment Transactions and Income. For financial reporting purposes, the Fund's investment holdings and NAV include trades executed through the end of the last business day of the period. The NAV per share for processing shareholder transactions is calculated as of the close of business of the New York Stock Exchange (NYSE), normally 4:00 p.m. Eastern time and includes trades executed through the end of the prior business day. Gains and losses on securities sold are determined on the basis of identified cost. Dividend income is recorded on the ex-dividend date, except for certain dividends from foreign securities where the ex-dividend date may have passed, which are recorded as soon as the Fund is informed of the ex-dividend date. Non-cash dividends included in dividend income, if any, are recorded at the fair market value of the securities received. Income and capital gain distributions from Fidelity Central Funds, if any, are recorded on the ex-dividend date. Certain distributions received by the Fund represent a return of capital or capital gain. The Fund determines the components of these distributions subsequent to the ex-dividend date, based upon receipt of tax filings or other correspondence relating to the underlying investment. These distributions are recorded as a reduction of cost of investments and/or as a realized gain. Investment income is recorded net of foreign taxes withheld where recovery of such taxes is uncertain.
Expenses. Expenses directly attributable to a fund are charged to that fund. Expenses attributable to more than one fund are allocated among the respective funds on the basis of relative net assets or other appropriate methods. Expense estimates are accrued in the period to which they relate and adjustments are made when actual amounts are known.
Income Tax Information and Distributions to Shareholders. Each year, the Fund intends to qualify as a regulated investment company under Subchapter M of the Internal Revenue Code, including distributing substantially all of its taxable income and realized gains. As a result, no provision for U.S. Federal income taxes is required. As of January 31, 2019, the Fund did not have any unrecognized tax benefits in the financial statements; nor is the Fund aware of any tax positions for which it is reasonably possible that the total amounts of unrecognized tax benefits will significantly change in the next twelve months. The Fund files a U.S. federal tax return, in addition to state and local tax returns as required. The Fund's federal income tax returns are subject to examination by the Internal Revenue Service (IRS) for a period of three fiscal years after they are filed. State and local tax returns may be subject to examination for an additional fiscal year depending on the jurisdiction. Foreign taxes are provided for based on the Fund's understanding of the tax rules and rates that exist in the foreign markets in which it invests.
Distributions are declared and recorded on the ex-dividend date. Income and capital gain distributions are determined in accordance with income tax regulations, which may differ from GAAP.
Capital accounts within the financial statements are adjusted for permanent book-tax differences. These adjustments have no impact on net assets or the results of operations. Capital accounts are not adjusted for temporary book-tax differences which will reverse in a subsequent period.
Book-tax differences are primarily due to futures contracts, foreign currency transactions, market discount, partnerships and losses deferred due to wash sales and excise tax regulations.
As of period end, the cost and unrealized appreciation (depreciation) in securities, and derivatives if applicable, for federal income tax purposes were as follows:
| Gross unrealized appreciation | $156,826 |
| Gross unrealized depreciation | (299,750) |
| Net unrealized appreciation (depreciation) | $(142,924) |
| Tax Cost | $2,834,113 |
The tax-based components of distributable earnings as of period end were as follows:
| Net unrealized appreciation (depreciation) on securities and other investments | $(142,905) |
The Fund intends to elect to defer to its next fiscal year $69,181 of capital losses recognized during the period November 1, 2018 to January 31, 2019.
The Fund intends to elect to defer to its next fiscal year $71 of ordinary losses recognized during the period January 1, 2019 to January 31, 2019.
The tax character of distributions paid was as follows:
| January 31, 2019 | January 31, 2018(a) | |
| Ordinary Income | $190,954 | $ 36,526 |
| Long-term Capital Gains | 1,616 | 584 |
| Total | $192,570 | $ 37,110 |
(a) For the period March 8, 2017 (commencement of operations) to January 31, 2018.
New Rule Issuance. During August 2018, the U.S. Securities and Exchange Commission issued Final Rule Release No. 33-10532, Disclosure Update and Simplification. This Final Rule includes amendments specific to registered investment companies that are intended to eliminate overlap in disclosure requirements between Regulation S-X and GAAP. In accordance with these amendments, certain line-items in the Fund's financial statements have been combined or removed for the current period as outlined in the table below.
| Financial Statement | Current Line-Item Presentation (As Applicable) | Prior Line-Item Presentation (As Applicable) |
| Statement of Assets and Liabilities | Total distributable earnings (loss) | Undistributed/Distributions in excess of/Accumulated net investment income (loss) Accumulated/Undistributed net realized gain (loss) Net unrealized appreciation (depreciation) |
| Statement of Changes in Net Assets | N/A - removed | Undistributed/Distributions in excess of/Accumulated net investment income (loss) end of period |
| Statement of Changes in Net Assets | Distributions to shareholders | Distributions to shareholders from net investment income Distributions to shareholders from net realized gain |
4. Derivative Instruments.
Risk Exposures and the Use of Derivative Instruments. The Fund's investment objective allows the Fund to enter into various types of derivative contracts, including futures contracts. Derivatives are investments whose value is primarily derived from underlying assets, indices or reference rates and may be transacted on an exchange or over-the-counter (OTC). Derivatives may involve a future commitment to buy or sell a specified asset based on specified terms, to exchange future cash flows at periodic intervals based on a notional principal amount, or for one party to make one or more payments upon the occurrence of specified events in exchange for periodic payments from the other party.
The Fund used derivatives to increase returns and to manage exposure to certain risks as defined below. The success of any strategy involving derivatives depends on analysis of numerous economic factors, and if the strategies for investment do not work as intended, the Fund may not achieve its objectives.
The Fund's use of derivatives increased or decreased its exposure to the following risk:
| Equity Risk | Equity risk relates to the fluctuations in the value of financial instruments as a result of changes in market prices (other than those arising from interest rate risk or foreign exchange risk), whether caused by factors specific to an individual investment, its issuer, or all factors affecting all instruments traded in a market or market segment. |
The Fund is also exposed to additional risks from investing in derivatives, such as liquidity risk and counterparty credit risk. Liquidity risk is the risk that the Fund will be unable to close out the derivative in the open market in a timely manner. Counterparty credit risk is the risk that the counterparty will not be able to fulfill its obligation to the Fund. Counterparty credit risk related to exchange-traded futures contracts may be mitigated by the protection provided by the exchange on which they trade.
Investing in derivatives may involve greater risks than investing in the underlying assets directly and, to varying degrees, may involve risk of loss in excess of any initial investment and collateral received and amounts recognized in the Statement of Assets and Liabilities. In addition, there may be the risk that the change in value of the derivative contract does not correspond to the change in value of the underlying instrument.
Futures Contracts. A futures contract is an agreement between two parties to buy or sell a specified underlying instrument for a fixed price at a specified future date. The Fund used futures contracts to manage its exposure to the stock market.
Upon entering into a futures contract, a fund is required to deposit either cash or securities (initial margin) with a clearing broker in an amount equal to a certain percentage of the face value of the contract. Futures contracts are marked-to-market daily and subsequent daily payments (variation margin) are made or received by a fund depending on the daily fluctuations in the value of the futures contracts and are recorded as unrealized appreciation or (depreciation). This receivable and/or payable, if any, is included in daily variation margin on futures contracts in the Statement of Assets and Liabilities. Realized gain or (loss) is recorded upon the expiration or closing of a futures contract. The net realized gain (loss) and change in net unrealized appreciation (depreciation) on futures contracts during the period is presented in the Statement of Operations.
Any open futures contracts at period end are presented in the Schedule of Investments under the caption "Futures Contracts". The notional amount at value reflects each contract's exposure to the underlying instrument or index at period end.
5. Purchases and Sales of Investments.
Purchases and sales of securities, other than short-term securities, aggregated $7,099,734 and $6,907,584, respectively.
6. Fees and Other Transactions with Affiliates.
Management Fee. Fidelity Management & Research Company (the investment adviser) and its affiliates provide the Fund with investment management related services and the Fund does not pay any fees for these services. Under the management contract, the investment adviser or an affiliate pays all other expenses of the Fund, excluding fees and expenses of the independent Trustees, and certain miscellaneous expenses such as proxy and shareholder meeting expenses.
Brokerage Commissions. The Fund placed a portion of its portfolio transactions with brokerage firms which are affiliates of the investment adviser. Brokerage commissions are included in net realized gain (loss) and change in net unrealized appreciation (depreciation) in the Statement of Operations. The commissions paid to these affiliated firms were $349 for the period.
Interfund Trades. The Fund may purchase from or sell securities to other Fidelity Funds under procedures adopted by the Board. The procedures have been designed to ensure these interfund trades are executed in accordance with Rule 17a-7 of the 1940 Act. Interfund trades are included within the respective purchases and sales amounts shown in the Purchases and Sales of Investments note.
7. Committed Line of Credit.
The Fund participates with other funds managed by the investment adviser or an affiliate in a $4.25 billion credit facility (the "line of credit") to be utilized for temporary or emergency purposes to fund shareholder redemptions or for other short-term liquidity purposes. The Fund has agreed to pay commitment fees on its pro-rata portion of the line of credit, which amounted to $9 and is reflected in Commitment fees on the Statement of Operations. During the period, the Fund did not borrow on this line of credit.
8. Other.
The Fund's organizational documents provide former and current trustees and officers with a limited indemnification against liabilities arising in connection with the performance of their duties to the Fund. In the normal course of business, the Fund may also enter into contracts that provide general indemnifications. The Fund's maximum exposure under these arrangements is unknown as this would be dependent on future claims that may be made against the Fund. The risk of material loss from such claims is considered remote.
At the end of the period, the investment adviser or its affiliates were the owners of record of 19% of the total outstanding shares of the Fund.
Report of Independent Registered Public Accounting Firm
To the Trustees of Fidelity Devonshire Trust and Shareholders of Fidelity Flex Mid Cap Value Fund:
Opinion on the Financial Statements and Financial Highlights
We have audited the accompanying statement of assets and liabilities of Fidelity Flex Mid Cap Value Fund (the "Fund"), a fund of Fidelity Devonshire Trust, including the schedule of investments, as of January 31, 2019, the related statement of operations for the year then ended, the statement of changes in net assets and the financial highlights for the year then ended and for the period from March 8, 2017 (commencement of operations) to January 31, 2018, and the related notes. In our opinion, the financial statements and financial highlights present fairly, in all material respects, the financial position of the Fund as of January 31, 2019, and the results of its operations for the year then ended, and the changes in its net assets and the financial highlights for the year then ended and for the period from March 8, 2017 (commencement of operations) to January 31, 2018, in conformity with accounting principles generally accepted in the United States of America.
Basis for Opinion
These financial statements and financial highlights are the responsibility of the Fund's management. Our responsibility is to express an opinion on the Fund's financial statements and financial highlights based on our audits. We are a public accounting firm registered with the Public Company Accounting Oversight Board (United States) (PCAOB) and are required to be independent with respect to the Fund in accordance with the U.S. federal securities laws and the applicable rules and regulations of the Securities and Exchange Commission and the PCAOB.
We conducted our audits in accordance with the standards of the PCAOB. Those standards require that we plan and perform the audit to obtain reasonable assurance about whether the financial statements and financial highlights are free of material misstatement, whether due to error or fraud. The Fund is not required to have, nor were we engaged to perform, an audit of its internal control over financial reporting. As part of our audits we are required to obtain an understanding of internal control over financial reporting but not for the purpose of expressing an opinion on the effectiveness of the Fund’s internal control over financial reporting. Accordingly, we express no such opinion.
Our audits included performing procedures to assess the risks of material misstatement of the financial statements and financial highlights, whether due to error or fraud, and performing procedures that respond to those risks. Such procedures included examining, on a test basis, evidence regarding the amounts and disclosures in the financial statements and financial highlights. Our audits also included evaluating the accounting principles used and significant estimates made by management, as well as evaluating the overall presentation of the financial statements and financial highlights. Our procedures included confirmation of securities owned as of January 31, 2019, by correspondence with the custodians and brokers; when replies were not received from brokers, we performed other auditing procedures. We believe that our audits provide a reasonable basis for our opinion.
/s/ Deloitte & Touche LLP
Boston, Massachusetts
March 15, 2019
We have served as the auditor of one or more of the Fidelity investment companies since 1999.
Trustees and Officers
The Trustees, Members of the Advisory Board (if any), and officers of the trust and fund, as applicable, are listed below. The Board of Trustees governs the fund and is responsible for protecting the interests of shareholders. The Trustees are experienced executives who meet periodically throughout the year to oversee the fund's activities, review contractual arrangements with companies that provide services to the fund, oversee management of the risks associated with such activities and contractual arrangements, and review the fund's performance. Except for Michael E. Wiley, each of the Trustees oversees 287 funds. Mr. Wiley oversees 195 funds.
The Trustees hold office without limit in time except that (a) any Trustee may resign; (b) any Trustee may be removed by written instrument, signed by at least two-thirds of the number of Trustees prior to such removal; (c) any Trustee who requests to be retired or who has become incapacitated by illness or injury may be retired by written instrument signed by a majority of the other Trustees; and (d) any Trustee may be removed at any special meeting of shareholders by a two-thirds vote of the outstanding voting securities of the trust. Each Trustee who is not an interested person (as defined in the 1940 Act) of the trust and the fund is referred to herein as an Independent Trustee. Each Independent Trustee shall retire not later than the last day of the calendar year in which his or her 75th birthday occurs. The Independent Trustees may waive this mandatory retirement age policy with respect to individual Trustees. Officers and Advisory Board Members hold office without limit in time, except that any officer or Advisory Board Member may resign or may be removed by a vote of a majority of the Trustees at any regular meeting or any special meeting of the Trustees. Except as indicated, each individual has held the office shown or other offices in the same company for the past five years.
The fund’s Statement of Additional Information (SAI) includes more information about the Trustees. To request a free copy, call Fidelity at 1-800-835-5092.
Experience, Skills, Attributes, and Qualifications of the Trustees. The Governance and Nominating Committee has adopted a statement of policy that describes the experience, qualifications, attributes, and skills that are necessary and desirable for potential Independent Trustee candidates (Statement of Policy). The Board believes that each Trustee satisfied at the time he or she was initially elected or appointed a Trustee, and continues to satisfy, the standards contemplated by the Statement of Policy. The Governance and Nominating Committee also engages professional search firms to help identify potential Independent Trustee candidates who have the experience, qualifications, attributes, and skills consistent with the Statement of Policy. From time to time, additional criteria based on the composition and skills of the current Independent Trustees, as well as experience or skills that may be appropriate in light of future changes to board composition, business conditions, and regulatory or other developments, have also been considered by the professional search firms and the Governance and Nominating Committee. In addition, the Board takes into account the Trustees' commitment and participation in Board and committee meetings, as well as their leadership of standing and ad hoc committees throughout their tenure.
In determining that a particular Trustee was and continues to be qualified to serve as a Trustee, the Board has considered a variety of criteria, none of which, in isolation, was controlling. The Board believes that, collectively, the Trustees have balanced and diverse experience, qualifications, attributes, and skills, which allow the Board to operate effectively in governing the fund and protecting the interests of shareholders. Information about the specific experience, skills, attributes, and qualifications of each Trustee, which in each case led to the Board's conclusion that the Trustee should serve (or continue to serve) as a trustee of the fund, is provided below.
Board Structure and Oversight Function. James C. Curvey is an interested person and currently serves as Chairman. The Trustees have determined that an interested Chairman is appropriate and benefits shareholders because an interested Chairman has a personal and professional stake in the quality and continuity of services provided to the fund. Independent Trustees exercise their informed business judgment to appoint an individual of their choosing to serve as Chairman, regardless of whether the Trustee happens to be independent or a member of management. The Independent Trustees have determined that they can act independently and effectively without having an Independent Trustee serve as Chairman and that a key structural component for assuring that they are in a position to do so is for the Independent Trustees to constitute a substantial majority for the Board. The Independent Trustees also regularly meet in executive session. Ned C. Lautenbach serves as Chairman of the Independent Trustees and as such (i) acts as a liaison between the Independent Trustees and management with respect to matters important to the Independent Trustees and (ii) with management prepares agendas for Board meetings.
Fidelity® funds are overseen by different Boards of Trustees. The fund's Board oversees Fidelity's high income and certain equity funds, and other Boards oversee Fidelity's investment-grade bond, money market, asset allocation, and other equity funds. The asset allocation funds may invest in Fidelity® funds overseen by the fund's Board. The use of separate Boards, each with its own committee structure, allows the Trustees of each group of Fidelity® funds to focus on the unique issues of the funds they oversee, including common research, investment, and operational issues. On occasion, the separate Boards establish joint committees to address issues of overlapping consequences for the Fidelity® funds overseen by each Board.
The Trustees operate using a system of committees to facilitate the timely and efficient consideration of all matters of importance to the Trustees, the fund, and fund shareholders and to facilitate compliance with legal and regulatory requirements and oversight of the fund's activities and associated risks. The Board, acting through its committees, has charged FMR and its affiliates with (i) identifying events or circumstances the occurrence of which could have demonstrably adverse effects on the fund's business and/or reputation; (ii) implementing processes and controls to lessen the possibility that such events or circumstances occur or to mitigate the effects of such events or circumstances if they do occur; and (iii) creating and maintaining a system designed to evaluate continuously business and market conditions in order to facilitate the identification and implementation processes described in (i) and (ii) above. Because the day-to-day operations and activities of the fund are carried out by or through FMR, its affiliates, and other service providers, the fund's exposure to risks is mitigated but not eliminated by the processes overseen by the Trustees. While each of the Board's committees has responsibility for overseeing different aspects of the fund's activities, oversight is exercised primarily through the Operations, Audit, and Compliance Committees. In addition, the Independent Trustees have worked with Fidelity to enhance the Board's oversight of investment and financial risks, legal and regulatory risks, technology risks, and operational risks, including the development of additional risk reporting to the Board. Appropriate personnel, including but not limited to the fund's Chief Compliance Officer (CCO), FMR's internal auditor, the independent accountants, the fund's Treasurer and portfolio management personnel, make periodic reports to the Board's committees, as appropriate, including an annual review of Fidelity's risk management program for the Fidelity® funds. The responsibilities of each standing committee, including their oversight responsibilities, are described further under "Standing Committees of the Trustees."
Interested Trustees*:
Correspondence intended for a Trustee who is an interested person may be sent to Fidelity Investments, 245 Summer Street, Boston, Massachusetts 02210.
Name, Year of Birth; Principal Occupations and Other Relevant Experience+
James C. Curvey (1935)
Year of Election or Appointment: 2007
Trustee
Chairman of the Board of Trustees
Mr. Curvey also serves as Trustee of other Fidelity® funds. Mr. Curvey is Vice Chairman (2007-present) and Director of FMR LLC (diversified financial services company). In addition, Mr. Curvey is an Overseer Emeritus for the Boston Symphony Orchestra, a Director of Artis-Naples, and a Trustee of Brewster Academy in Wolfeboro, New Hampshire. Previously, Mr. Curvey served as a Director of Fidelity Research & Analysis Co. (investment adviser firm, 2009-2018), Director of Fidelity Investments Money Management, Inc. (investment adviser firm, 2009-2014) and a Director of FMR and FMR Co., Inc. (investment adviser firms, 2007-2014).
* Determined to be an “Interested Trustee” by virtue of, among other things, his or her affiliation with the trust or various entities under common control with FMR.
+ The information includes the Trustee's principal occupation during the last five years and other information relating to the experience, attributes, and skills relevant to the Trustee's qualifications to serve as a Trustee, which led to the conclusion that the Trustee should serve as a Trustee for the fund.
Independent Trustees:
Correspondence intended for an Independent Trustee may be sent to Fidelity Investments, P.O. Box 55235, Boston, Massachusetts 02205-5235.
Name, Year of Birth; Principal Occupations and Other Relevant Experience+
Dennis J. Dirks (1948)
Year of Election or Appointment: 2005
Trustee
Mr. Dirks also serves as Trustee of other Fidelity® funds. Prior to his retirement in May 2003, Mr. Dirks was Chief Operating Officer and a member of the Board of The Depository Trust & Clearing Corporation (DTCC). He also served as President, Chief Operating Officer, and Board member of The Depository Trust Company (DTC) and President and Board member of the National Securities Clearing Corporation (NSCC). In addition, Mr. Dirks served as Chief Executive Officer and Board member of the Government Securities Clearing Corporation, Chief Executive Officer and Board member of the Mortgage-Backed Securities Clearing Corporation, as a Trustee and a member of the Finance Committee of Manhattan College (2005-2008), as a Trustee and a member of the Finance Committee of AHRC of Nassau County (2006-2008), as a member of the Independent Directors Council (IDC) Governing Council (2010-2015), and as a member of the Board of Directors for The Brookville Center for Children’s Services, Inc. (2009-2017). Mr. Dirks is a member of the Finance Committee (2016-present) and Board of Directors (2017-present) and is Treasurer (2018-present) of the Asolo Repertory Theatre.
Donald F. Donahue (1950)
Year of Election or Appointment: 2018
Trustee
Mr. Donahue also serves as a Trustee of other Fidelity® funds. Mr. Donahue is President and Chief Executive Officer of Miranda Partners, LLC (risk consulting for the financial services industry, 2012-present). Previously, Mr. Donahue served as a Member of the Advisory Board of certain Fidelity® funds (2015-2018) and Chief Executive Officer (2006-2012), Chief Operating Officer (2003-2006), and Managing Director, Customer Marketing and Development (1999-2003) of The Depository Trust & Clearing Corporation (financial markets infrastructure). Mr. Donahue serves as a Member (2007-present) and Co-Chairman (2016-present) of the Board of Directors of United Way of New York, Member of the Board of Directors of NYC Leadership Academy (2012-present) and Member of the Board of Advisors of Ripple Labs, Inc. (financial services, 2015-present). He also served as Chairman (2010-2012) and Member of the Board of Directors (2012-2013) of Omgeo, LLC (financial services), Treasurer of United Way of New York (2012-2016), and Member of the Board of Directors of XBRL US (financial services non-profit, 2009-2012) and the International Securities Services Association (2009-2012).
Alan J. Lacy (1953)
Year of Election or Appointment: 2008
Trustee
Mr. Lacy also serves as Trustee of other Fidelity® funds. Mr. Lacy serves as a Director of Bristol-Myers Squibb Company (global pharmaceuticals, 2008-present). He is a Trustee of the California Chapter of The Nature Conservancy (2015-present) and a Director of the Center for Advanced Study in the Behavioral Sciences at Stanford University (2015-present). In addition, Mr. Lacy served as Senior Adviser (2007-2014) of Oak Hill Capital Partners, L.P. (private equity) and also served as Chief Executive Officer (2005) and Vice Chairman (2005-2006) of Sears Holdings Corporation (retail) and Chief Executive Officer and Chairman of the Board of Sears, Roebuck and Co. (retail, 2000-2005). Previously, Mr. Lacy served as Chairman (2014-2017) and a member (2010-2017) of the Board of Directors of Dave & Buster’s Entertainment, Inc. (restaurant and entertainment complexes), as Chairman (2008-2011) and a member (2006-2015) of the Board of Trustees of the National Parks Conservation Association, and as a member of the Board of Directors for The Hillman Companies, Inc. (hardware wholesalers, 2010-2014), Earth Fare, Inc. (retail grocery, 2010-2014), and The Western Union Company (global money transfer, 2006-2011).
Ned C. Lautenbach (1944)
Year of Election or Appointment: 2000
Trustee
Chairman of the Independent Trustees
Mr. Lautenbach also serves as Trustee of other Fidelity® funds. Mr. Lautenbach currently serves as Chair (2018-present) and Member (2013-present) of the Board of Governors, State University System of Florida and is a member of the Council on Foreign Relations (1994-present). He is also a member and has most recently served as Chairman of the Board of Directors of Artis-Naples (2012-present). Previously, Mr. Lautenbach served as a member and then Lead Director of the Board of Directors of Eaton Corporation (diversified industrial, 1997-2016). He was also a Partner and Advisory Partner at Clayton, Dubilier & Rice, LLC (private equity investment, 1998-2010), as well as a Director of Sony Corporation (2006-2007). In addition, Mr. Lautenbach also had a 30-year career with IBM (technology company) during which time he served as Senior Vice President and a member of the Corporate Executive Committee (1968-1998).
Joseph Mauriello (1944)
Year of Election or Appointment: 2008
Trustee
Mr. Mauriello also serves as Trustee of other Fidelity® funds. Prior to his retirement in January 2006, Mr. Mauriello served in numerous senior management positions including Deputy Chairman and Chief Operating Officer (2004-2005), and Vice Chairman of Financial Services (2002-2004) of KPMG LLP US (professional services, 1965-2005). Mr. Mauriello currently serves as a member of the Independent Directors Council (IDC) Governing Council (2015-present). Previously, Mr. Mauriello served as a member of the Board of Directors of XL Group plc. (global insurance and re-insurance, 2006-2018).
Cornelia M. Small (1944)
Year of Election or Appointment: 2005
Trustee
Ms. Small also serves as Trustee of other Fidelity® funds. Ms. Small is a member of the Board of Directors (2009-present) and Chair of the Investment Committee (2010-present) of the Teagle Foundation. Ms. Small also serves on the Investment Committee of the Berkshire Taconic Community Foundation (2008-present). Previously, Ms. Small served as Chairperson (2002-2008) and a member of the Investment Committee and Chairperson (2008-2012) and a member of the Board of Trustees of Smith College. In addition, Ms. Small served as Chief Investment Officer, Director of Global Equity Investments, and a member of the Board of Directors of Scudder, Stevens & Clark and Scudder Kemper Investments.
Garnett A. Smith (1947)
Year of Election or Appointment: 2018
Trustee
Mr. Smith also serves as Trustee of other Fidelity® funds. Prior to Mr. Smith's retirement, he served as Chairman and Chief Executive Officer of Inbrand Corp. (manufacturer of personal absorbent products, 1990-1997). He also served as President (1986-1990) of Inbrand Corp. Prior to his employment with Inbrand Corp., he was employed by a retail fabric chain and North Carolina National Bank. In addition, Mr. Smith served as a Member of the Advisory Board of certain Fidelity® funds (2012-2013) and as a board member of the Jackson Hole Land Trust (2009-2012).
David M. Thomas (1949)
Year of Election or Appointment: 2008
Trustee
Mr. Thomas also serves as Trustee of other Fidelity® funds. Mr. Thomas serves as Non-Executive Chairman of the Board of Directors of Fortune Brands Home and Security (home and security products, 2011-present) and as a member of the Board of Directors (2004-present) and Presiding Director (2013-present) of Interpublic Group of Companies, Inc. (marketing communication). Previously, Mr. Thomas served as Executive Chairman (2005-2006) and Chairman and Chief Executive Officer (2000-2005) of IMS Health, Inc. (pharmaceutical and healthcare information solutions), a Director of Fortune Brands, Inc. (consumer products, 2000-2011), and a member of the Board of Trustees of the University of Florida (2013-2018).
Michael E. Wiley (1950)
Year of Election or Appointment: 2018
Trustee
Mr. Wiley also serves as Trustee or Member of the Advisory Board of other Fidelity® funds. Mr. Wiley serves as a Director of High Point Resources (exploration and production, 2005-present). Previously, Mr. Wiley served as a Director of Andeavor Corporation (independent oil refiner and marketer, 2005-2018), a Director of Andeavor Logistics LP (natural resources logistics, 2015-2018), a Director of Post Oak Bank (privately-held bank, 2004-2018), a Director of Asia Pacific Exploration Consolidated (international oil and gas exploration and production, 2008-2013), a member of the Board of Trustees of the University of Tulsa (2000-2006; 2007-2010), a Senior Energy Advisor of Katzenbach Partners, LLC (consulting, 2006-2007), an Advisory Director of Riverstone Holdings (private investment), a Director of Spinnaker Exploration Company (exploration and production, 2001-2005) and Chairman, President, and CEO of Baker Hughes, Inc. (oilfield services, 2000-2004).
+ The information includes the Trustee's principal occupation during the last five years and other information relating to the experience, attributes, and skills relevant to the Trustee's qualifications to serve as a Trustee, which led to the conclusion that the Trustee should serve as a Trustee for the fund.
Advisory Board Members and Officers:
Correspondence intended for a Member of the Advisory Board (if any) may be sent to Fidelity Investments, P.O. Box 55235, Boston, Massachusetts 02205-5235. Correspondence intended for an officer or Peter S. Lynch may be sent to Fidelity Investments, 245 Summer Street, Boston, Massachusetts 02210. Officers appear below in alphabetical order.
Name, Year of Birth; Principal Occupation
Vicki L. Fuller (1957)
Year of Election or Appointment: 2018
Member of the Advisory Board
Ms. Fuller also serves as Member of the Advisory Board of other Fidelity® funds. Ms. Fuller serves as a member of the Board of Directors, Audit Committee, and Nominating and Governance Committee of The Williams Companies, Inc. (natural gas infrastructure, 2018-present). Previously, Ms. Fuller served as the Chief Investment Officer of the New York State Common Retirement Fund (2012-2018) and held a variety of positions at AllianceBernstein L.P. (global asset management, 1985-2012), including Managing Director (2006-2012) and Senior Vice President and Senior Portfolio Manager (2001-2006).
Peter S. Lynch (1944)
Year of Election or Appointment: 2003
Member of the Advisory Board
Mr. Lynch also serves as Member of the Advisory Board of other Fidelity® funds. Mr. Lynch is Vice Chairman and a Director of FMR (investment adviser firm) and FMR Co., Inc. (investment adviser firm). In addition, Mr. Lynch serves as a Trustee of Boston College and as the Chairman of the Inner-City Scholarship Fund. Previously, Mr. Lynch served on the Special Olympics International Board of Directors (1997-2006).
Carol B. Tomé (1957)
Year of Election or Appointment: 2018
Member of the Advisory Board
Ms. Tomé also serves as Member of the Advisory Board of other Fidelity® funds. Ms. Tomé is Chief Financial Officer (2001-present) and Executive Vice President of Corporate Services (2007-present) of The Home Depot, Inc. (home improvement retailer) and a Director (2003-present) and Chair of the Audit Committee (2004-present) of United Parcel Service, Inc. (package delivery and supply chain management). Previously, Ms. Tomé served as Trustee of certain Fidelity® funds (2017), Senior Vice President of Finance and Accounting/Treasurer (2000-2007) and Vice President and Treasurer (1995-2000) of The Home Depot, Inc. and Chair of the Board (2010-2012), Vice Chair of the Board (2009 and 2013), and a Director (2008-2013) of the Federal Reserve Bank of Atlanta. Ms. Tomé is also a director or trustee of many community and professional organizations.
Elizabeth Paige Baumann (1968)
Year of Election or Appointment: 2017
Anti-Money Laundering (AML) Officer
Ms. Baumann also serves as AML Officer of other funds. She is Chief AML Officer (2012-present) and Senior Vice President (2014-present) of FMR LLC (diversified financial services company) and is an employee of Fidelity Investments. Previously, Ms. Baumann served as AML Officer of the funds (2012-2016), and Vice President (2007-2014) and Deputy Anti-Money Laundering Officer (2007-2012) of FMR LLC.
Craig S. Brown (1977)
Year of Election or Appointment: 2019
Assistant Treasurer
Mr. Brown also serves as Assistant Treasurer of other funds. Mr. Brown is an employee of Fidelity Investments (2013-present).
John J. Burke III (1964)
Year of Election or Appointment: 2018
Chief Financial Officer
Mr. Burke also serves as Chief Financial Officer of other funds. Mr. Burke serves as Head of Investment Operations for Fidelity Fund and Investment Operations (2018-present) and is an employee of Fidelity Investments (1998-present). Previously Mr. Burke served as head of Asset Management Investment Operations (2012-2018).
William C. Coffey (1969)
Year of Election or Appointment: 2018
Secretary and Chief Legal Officer (CLO)
Mr. Coffey also serves as Secretary and CLO of other funds. Mr. Coffey serves as CLO, Secretary, and Senior Vice President of Fidelity Management & Research Company and FMR Co., Inc. (investment adviser firms, 2018-present); Secretary of Fidelity SelectCo, LLC and Fidelity Investments Money Management, Inc. (investment adviser firms, 2018-present); and CLO of Fidelity Management & Research (Hong Kong) Limited, FMR Investment Management (UK) Limited, and Fidelity Management & Research (Japan) Limited (investment adviser firms, 2018-present). He is Senior Vice President and Deputy General Counsel of FMR LLC (diversified financial services company, 2010-present), and is an employee of Fidelity Investments. Previously, Mr. Coffey served as Assistant Secretary of certain funds (2009-2018) and as Vice President and Associate General Counsel of FMR LLC (2005-2009).
Timothy M. Cohen (1969)
Year of Election or Appointment: 2018
Vice President
Mr. Cohen also serves as Vice President of other funds. Mr. Cohen serves as Co-Head of Global Equity Research (2016-present), a Director of Fidelity Management & Research (Japan) Limited (investment adviser firm, 2016-present), and is an employee of Fidelity Investments. Previously, Mr. Cohen served as Chief Investment Officer - Equity and a Director of Fidelity Management & Research (U.K.) Inc. (investment adviser firm, 2013-2015) and as a Director of Fidelity Management & Research (Hong Kong) Limited (investment adviser firm, 2017).
Jonathan Davis (1968)
Year of Election or Appointment: 2010
Assistant Treasurer
Mr. Davis also serves as Assistant Treasurer of other funds. Mr. Davis serves as Assistant Treasurer of FMR Capital, Inc. (2017-present) and is an employee of Fidelity Investments. Previously, Mr. Davis served as Vice President and Associate General Counsel of FMR LLC (diversified financial services company, 2003-2010).
Adrien E. Deberghes (1967)
Year of Election or Appointment: 2016
Assistant Treasurer
Mr. Deberghes also serves as an officer of other funds. He serves as Assistant Treasurer of FMR Capital, Inc. (2017-present), Executive Vice President of Fidelity Investments Money Management, Inc. (FIMM) (investment adviser firm, 2016-present), and is an employee of Fidelity Investments (2008-present). Previously, Mr. Deberghes served as President and Treasurer of certain Fidelity® funds (2013-2018). Prior to joining Fidelity Investments, Mr. Deberghes was Senior Vice President of Mutual Fund Administration at State Street Corporation (2007-2008), Senior Director of Mutual Fund Administration at Investors Bank & Trust (2005-2007), and Director of Finance for Dunkin' Brands (2000-2005). Previously, Mr. Deberghes served in other fund officer roles.
Laura M. Del Prato (1964)
Year of Election or Appointment: 2018
Assistant Treasurer
Ms. Del Prato also serves as an officer of other funds. Ms. Del Prato is an employee of Fidelity Investments (2017-present). Prior to joining Fidelity Investments, Ms. Del Prato served as a Managing Director and Treasurer of the JPMorgan Mutual Funds (2014-2017). Prior to JPMorgan, Ms. Del Prato served as a partner at Cohen Fund Audit Services (accounting firm, 2012-2013) and KPMG LLP (accounting firm, 2004-2012).
Colm A. Hogan (1973)
Year of Election or Appointment: 2016
Deputy Treasurer
Mr. Hogan also serves as an officer of other funds. Mr. Hogan serves as Assistant Treasurer of FMR Capital, Inc. (2017-present) and is an employee of Fidelity Investments (2005-present). Previously, Mr. Hogan served as Assistant Treasurer of certain Fidelity® funds (2016-2018).
Pamela R. Holding (1964)
Year of Election or Appointment: 2018
Vice President
Ms. Holding also serves as Vice President of other funds. Ms. Holding serves as Co-Head of Global Equity Research (2018-present) and is an employee of Fidelity Investments (2013-present).
Chris Maher (1972)
Year of Election or Appointment: 2013
Assistant Treasurer
Mr. Maher serves as Assistant Treasurer of other funds. Mr. Maher is Vice President of Valuation Oversight, serves as Assistant Treasurer of FMR Capital, Inc. (2017-present), and is an employee of Fidelity Investments. Previously, Mr. Maher served as Vice President of Asset Management Compliance (2013), Vice President of the Program Management Group of FMR (investment adviser firm, 2010-2013), and Vice President of Valuation Oversight (2008-2010).
Kenneth B. Robins (1969)
Year of Election or Appointment: 2016
Chief Compliance Officer
Mr. Robins also serves as an officer of other funds. Mr. Robins serves as Compliance Officer of Fidelity Management & Research Company and FMR Co., Inc. (investment adviser firms, 2016-present) and is an employee of Fidelity Investments (2004-present). Previously, Mr. Robins served as Executive Vice President of Fidelity Investments Money Management, Inc. (investment adviser firm, 2013-2016) and served in other fund officer roles.
Stacie M. Smith (1974)
Year of Election or Appointment: 2016
President and Treasurer
Ms. Smith also serves as an officer of other funds. Ms. Smith serves as Assistant Treasurer of FMR Capital, Inc. (2017-present), is an employee of Fidelity Investments (2009-present), and has served in other fund officer roles. Prior to joining Fidelity Investments, Ms. Smith served as Senior Audit Manager of Ernst & Young LLP (accounting firm, 1996-2009). Previously, Ms. Smith served as Assistant Treasurer (2013-2018) and Deputy Treasurer (2013-2016) of certain Fidelity® funds.
Marc L. Spector (1972)
Year of Election or Appointment: 2016
Assistant Treasurer
Mr. Spector also serves as an officer of other funds. Mr. Spector serves as Assistant Treasurer of FMR Capital, Inc. (2017-present) and is an employee of Fidelity Investments (2016-present). Prior to joining Fidelity Investments, Mr. Spector served as Director at the Siegfried Group (accounting firm, 2013-2016), and prior to Siegfried Group as audit senior manager at Deloitte & Touche (accounting firm, 2005-2013).
Jim Wegmann (1979)
Year of Election or Appointment: 2019
Assistant Treasurer
Mr. Wegmann also serves as Assistant Treasurer of other funds. Mr. Wegmann is an employee of Fidelity Investments (2011-present).
Shareholder Expense Example
As a shareholder of the Fund, you incur two types of costs: (1) transaction costs, and (2) ongoing costs, including other Fund expenses. This Example is intended to help you understand your ongoing costs (in dollars) of investing in the Fund and to compare these costs with the ongoing costs of investing in other mutual funds.
The Example is based on an investment of $1,000 invested at the beginning of the period and held for the entire period (August 1, 2018 to January 31, 2019).
Actual Expenses
The first line of the accompanying table provides information about actual account values and actual expenses. You may use the information in this line, together with the amount you invested, to estimate the expenses that you paid over the period. Simply divide your account value by $1,000.00 (for example, an $8,600 account value divided by $1,000.00 = 8.6), then multiply the result by the number in the first line under the heading entitled "Expenses Paid During Period" to estimate the expenses you paid on your account during this period. In addition, the Fund, as a shareholder in the underlying Fidelity Central Funds, will indirectly bear its pro-rata share of the fees and expenses incurred by the underlying Fidelity Central Funds. These fees and expenses are not included in the Fund's annualized expense ratio used to calculate the expense estimate in the table below.
Hypothetical Example for Comparison Purposes
The second line of the accompanying table provides information about hypothetical account values and hypothetical expenses based on the Fund's actual expense ratio and an assumed rate of return of 5% per year before expenses, which is not the Fund's actual return. The hypothetical account values and expenses may not be used to estimate the actual ending account balance or expenses you paid for the period. You may use this information to compare the ongoing costs of investing in the Fund and other funds. To do so, compare this 5% hypothetical example with the 5% hypothetical examples that appear in the shareholder reports of the other funds. In addition, the Fund, as a shareholder in the underlying Fidelity Central Funds, will indirectly bear its pro-rata share of the fees and expenses incurred by the underlying Fidelity Central Funds. These fees and expenses are not included in the Fund's annualized expense ratio used to calculate the expense estimate in the table below.
Please note that the expenses shown in the table are meant to highlight your ongoing costs only and do not reflect any transaction costs. Therefore, the second line of the table is useful in comparing ongoing costs only, and will not help you determine the relative total costs of owning different funds.
| Annualized Expense Ratio-A | Beginning Account Value August 1, 2018 | Ending Account Value January 31, 2019 | Expenses Paid During Period-B August 1, 2018 to January 31, 2019 | |
| Actual | - %-C | $1,000.00 | $920.30 | $--D |
| Hypothetical-E | $1,000.00 | $1,025.21 | $--D |
A Annualized expense ratio reflects expenses net of applicable fee waivers.
B Expenses are equal to the Fund's annualized expense ratio, multiplied by the average account value over the period, multiplied by 184/365 (to reflect the one-half year period).
C Amount represents less than .005%.
D Amount represents less than $.005.
E 5% return per year before expenses
Distributions (Unaudited)
The fund designates 2% and 20% of the dividends distributed in March and December, respectively during the fiscal year as qualifying for the dividends–received deduction for corporate shareholders.
The fund designates 1% and 25% of the dividends distributed in March and December, respectively during the fiscal year as amounts which may be taken into account as a dividend for the purposes of the maximum rate under section 1(h)(11) of the Internal Revenue Code.
The fund will notify shareholders in January 2020 of amounts for use in preparing 2019 income tax returns.
Board Approval of Investment Advisory Contracts and Management Fees
Fidelity Flex Mid Cap Value Fund
Each year, the Board of Trustees, including the Independent Trustees (together, the Board), votes on the renewal of the management contract with Fidelity Management & Research Company (FMR) and the sub-advisory agreements (together, the Advisory Contracts) for the fund. FMR and the sub-advisers are referred to herein as the Investment Advisers. The Board, assisted by the advice of fund counsel and Independent Trustees' counsel, requests and considers a broad range of information relevant to the renewal of the Advisory Contracts throughout the year.
The Board meets regularly and, at each of its meetings, covers an extensive agenda of topics and materials and considers factors that are relevant to its annual consideration of the renewal of the fund's Advisory Contracts, including the services and support provided to the fund and its shareholders. The Board has established various standing committees (Committees), each composed of and chaired by Independent Trustees with varying backgrounds, to which the Board has assigned specific subject matter responsibilities in order to enhance effective decision-making by the Board. The Board, acting directly and through its Committees, requests and receives information concerning the annual consideration of the renewal of the fund's Advisory Contracts. The Board also meets as needed to review matters specifically related to the Board's annual consideration of the renewal of the Advisory Contracts. Members of the Board may also meet with trustees of other Fidelity funds through joint ad hoc committees to discuss certain matters relevant to all of the Fidelity funds.
At its January 2019 meeting, the Board unanimously determined to renew the fund's Advisory Contracts. In considering whether to renew the Advisory Contracts for the fund, the Board considered all factors it believed relevant and reached a determination, with the assistance of fund counsel and Independent Trustees' counsel and through the exercise of its business judgment, that the renewal of the Advisory Contracts was in the best interests of the fund and its shareholders and the fact that no fee is payable under the management contract was fair and reasonable.
Nature, Extent, and Quality of Services Provided. The Board considered Fidelity’s staffing as it relates to the fund, including the backgrounds of investment personnel of Fidelity, and also considered the fund’s investment objective, strategies, and related investment philosophy. The Independent Trustees also had discussions with senior management of Fidelity’s investment operations and investment groups. The Board considered the structure of the investment personnel compensation program and whether this structure provides appropriate incentives to act in the best interests of the fund. Additionally, the Board considered the portfolio managers’ investments, if any, in the funds that they manage.Resources Dedicated to Investment Management and Support Services. The Board and the Fund Oversight and Research Committees reviewed the general qualifications and capabilities of Fidelity’s investment staff, including its size, education, experience, and resources, as well as Fidelity’s approach to recruiting, training, managing, and compensating investment personnel. The Board noted that Fidelity has continued to increase the resources devoted to non-U.S. offices, including expansion of Fidelity’s global investment organization. The Board also noted that Fidelity’s analysts have extensive resources, tools and capabilities that allow them to conduct sophisticated quantitative and fundamental analysis, as well as credit analysis of issuers, counterparties and guarantors. Further, the Board considered that Fidelity’s investment professionals have sufficient access to global information and data so as to provide competitive investment results over time, and that those professionals also have access to sophisticated tools that permit them to assess portfolio construction and risk and performance attribution characteristics continuously, as well as to transmit new information and research conclusions rapidly around the world. Additionally, in its deliberations, the Board considered Fidelity’s trading, risk management, compliance, and technology and operations capabilities and resources, which are integral parts of the investment management process.Shareholder and Administrative Services. The Board considered (i) the nature, extent, quality, and cost of advisory, administrative, and shareholder services performed by the Investment Advisers and their affiliates under the Advisory Contracts and under separate agreements covering transfer agency, pricing and bookkeeping, and securities lending services for the fund; (ii) the nature and extent of the supervision of third party service providers, principally custodians, subcustodians, and pricing vendors; and (iii) the resources devoted to, and the record of compliance with, the fund’s compliance policies and procedures. The Board also reviewed the allocation of fund brokerage, including allocations to brokers affiliated with the Investment Advisers, the use of brokerage commissions to pay fund expenses, and the use of “soft” commission dollars to pay for research services.The Board noted that the growth of fund assets over time across the complex allows Fidelity to reinvest in the development of services designed to enhance the value and convenience of the Fidelity funds as investment vehicles. These services include 24-hour access to account information and market information through telephone representatives and over the Internet, investor education materials and asset allocation tools, and the expanded availability of Fidelity Investor Centers.Investment in a Large Fund Family. The Board considered the benefits to shareholders of investing in a Fidelity fund, including the benefits of investing in a fund that is part of a large family of funds offering a variety of investment disciplines and providing a large variety of mutual fund investor services. The Board noted that Fidelity had taken, or had made recommendations that resulted in the Fidelity funds taking, a number of actions over the previous year that benefited particular funds, including: (i) continuing to dedicate additional resources to Fidelity’s investment research process, which includes meetings with management of issuers of securities in which the funds invest, and to the support of the senior management team that oversees asset management; (ii) continuing efforts to enhance Fidelity’s global research capabilities; (iii) launching new funds and making other enhancements to meet client needs; (iv) launching new share classes of existing funds; (v) eliminating purchase minimums and broadening eligibility requirements for certain funds and share classes; (vi) reducing management fees and total expenses for certain growth equity funds and index funds; (vii) lowering expense caps for certain existing funds and classes, and converting certain voluntary expense caps to contractual caps, to reduce expenses borne by shareholders; (viii) eliminating short-term redemption fees for funds that had such fees; (ix) rationalizing product lines and gaining increased efficiencies from fund mergers and share class consolidations; (x) continuing to develop, acquire and implement systems and technology to improve services to the funds and shareholders, strengthen information security, and increase efficiency; and (xi) continuing to implement enhancements to further strengthen Fidelity’s product line to increase investors’ probability of success in achieving their investment goals, including retirement income goals.Investment Performance. The Board considered whether the fund has operated in accordance with its investment objective, as well as its record of compliance with its investment restrictions. As the fund recently commenced operations, the Board did not believe that it was appropriate to assign significant weight to its limited investment performance.Based on its review, the Board concluded that the nature, extent, and quality of services provided to the fund under the Advisory Contracts should continue to benefit the shareholders of the fund.Competitiveness of Management Fee and Total Expense Ratio. The Board noted that the fund is available exclusively to certain Fidelity fee-based programs. The Board considered that the fund does not pay FMR a management fee for investment advisory services, but that FMR is indirectly compensated for its services out of the program fees. The Board also noted that FMR or an affiliate undertakes to pay all operating expenses of the fund with limited exceptions.In connection with the renewal of the Advisory Contracts, the Board also approved amendments to the management contract for the fund to clarify that the fund pays its non-operating expenses, including brokerage commissions and fees and expenses associated with the fund's securities lending program. The Board considered that the amendments would not change the services provided to the fund or the party responsible for making such payments under the current management contract.Based on its review, the Board considered that the fund does not pay a management fee and concluded that the total expense ratio of the fund was reasonable in light of the services that the fund and its shareholders receive and the other factors considered.Costs of the Services and Profitability. The Board considered the level of Fidelity's profits in respect of all the Fidelity funds.PricewaterhouseCoopers LLP (PwC), auditor to Fidelity and certain Fidelity funds, has been engaged annually by the Board as part of the Board's assessment of Fidelity's profitability analysis. PwC's engagement includes the review and assessment of the methodologies used by Fidelity in determining the revenues and expenses attributable to Fidelity's mutual fund business, and completion of agreed-upon procedures in respect of the mathematical accuracy of the fund profitability information and its conformity to established allocation methodologies. After considering PwC's reports issued under the engagement and information provided by Fidelity, the Board concluded that while other allocation methods may also be reasonable, Fidelity's profitability methodologies are reasonable in all material respects.The Board also reviewed Fidelity's non-fund businesses and potential indirect benefits such businesses may have received as a result of their association with Fidelity's mutual fund business (i.e., fall-out benefits) as well as cases where Fidelity's affiliates may benefit from the fund's business. The Board noted that changes to fall-out benefits year-over-year reflect business developments at Fidelity's various businesses.The Board concluded that the costs of the services provided by and the profits realized by Fidelity in connection with the operation of the fund were not relevant to the renewal of the Advisory Contracts because the fund pays no advisory fees and FMR or an affiliate bears all expenses of the fund with limited exceptions.Economies of Scale. The Board concluded that because the fund pays no advisory fees and FMR bears all expenses of the fund with limited exceptions, the realization of economies of scale was not a material factor in the Board's decision to renew the fund's Advisory Contract.Additional Information Requested by the Board. In order to develop fully the factual basis for consideration of the Fidelity funds' advisory contracts, the Board requested and received additional information on certain topics, including: (i) fund performance trends, in particular the underperformance of certain funds, and Fidelity's long-term strategies for certain funds; (ii) Fidelity's fund profitability methodology, profitability trends for certain funds, and the impact of certain factors on fund profitability results; (iii) metrics for evaluating index fund and ETF performance and information about ETF trading characteristics; (iv) the methodology with respect to the evaluation of competitive fund data and peer group classifications and fee comparisons; (v) the expense structures for different funds and classes; (vi) information regarding other accounts managed by Fidelity, including collective investment trusts; and (vii) Fidelity's philosophies and strategies for evaluating funds and classes with lower or declining asset levels.Based on its evaluation of all of the conclusions noted above, and after considering all factors it believed relevant, the Board concluded that the advisory fee arrangements are fair and reasonable, and that the fund's Advisory Contracts should be renewed.![]()
ZMV-ANN-0319
1.9881567.101
Fidelity Flex℠ Funds Fidelity Flex℠ Large Cap Value Fund Annual Report January 31, 2019 |
|
Beginning on January 1, 2021, as permitted by regulations adopted by the Securities and Exchange Commission, paper copies of a fund’s shareholder reports will no longer be sent by mail, unless you specifically request paper copies of the reports from the fund or from your financial intermediary, such as a financial advisor, broker-dealer or bank. Instead, the reports will be made available on a website, and you will be notified by mail each time a report is posted and provided with a website link to access the report.
If you already elected to receive shareholder reports electronically, you will not be affected by this change and you need not take any action. You may elect to receive shareholder reports and other communications from a fund electronically, by contacting your financial intermediary. For Fidelity customers, visit Fidelity's web site or call Fidelity using the contact information listed below.
You may elect to receive all future reports in paper free of charge. If you wish to continue receiving paper copies of your shareholder reports, you may contact your financial intermediary or, if you are a Fidelity customer, visit Fidelity’s website, or call Fidelity at the applicable toll-free number listed below. Your election to receive reports in paper will apply to all funds held with the fund complex/your financial intermediary.
| Account Type | Website | Phone Number |
| Brokerage, Mutual Fund, or Annuity Contracts: | fidelity.com/mailpreferences | 1-800-343-3548 |
| Employer Provided Retirement Accounts: | netbenefits.fidelity.com/preferences (choose 'no' under Required Disclosures to continue to print) | 1-800-343-0860 |
| Advisor Sold Accounts Serviced Through Your Financial Intermediary: | Contact Your Financial Intermediary | Your Financial Intermediary's phone number |
| Advisor Sold Accounts Serviced by Fidelity: | institutional.fidelity.com | 1-877-208-0098 |
Contents
Board Approval of Investment Advisory Contracts and Management Fees |
To view a fund's proxy voting guidelines and proxy voting record for the 12-month period ended June 30, visit http://www.fidelity.com/proxyvotingresults or visit the Securities and Exchange Commission's (SEC) web site at http://www.sec.gov.
You may also call 1-800-835-5092 to request a free copy of the proxy voting guidelines.
Standard & Poor's, S&P and S&P 500 are registered service marks of The McGraw-Hill Companies, Inc. and have been licensed for use by Fidelity Distributors Corporation.
Other third-party marks appearing herein are the property of their respective owners.
All other marks appearing herein are registered or unregistered trademarks or service marks of FMR LLC or an affiliated company. © 2019 FMR LLC. All rights reserved.
This report and the financial statements contained herein are submitted for the general information of the shareholders of the Fund. This report is not authorized for distribution to prospective investors in the Fund unless preceded or accompanied by an effective prospectus.
A fund files its complete schedule of portfolio holdings with the SEC for the first and third quarters of each fiscal year on Form N-Q. Forms N-Q are available on the SEC’s web site at http://www.sec.gov. A fund's Forms N-Q may be reviewed and copied at the SEC’s Public Reference Room in Washington, DC. Information regarding the operation of the SEC's Public Reference Room may be obtained by calling 1-800-SEC-0330.
For a complete list of a fund's portfolio holdings, view the most recent holdings listing, semiannual report, or annual report on Fidelity's web site at http://www.fidelity.com, http://www.institutional.fidelity.com, or http://www.401k.com, as applicable.
NOT FDIC INSURED •MAY LOSE VALUE •NO BANK GUARANTEE
Neither the Fund nor Fidelity Distributors Corporation is a bank.
Performance: The Bottom Line
Average annual total return reflects the change in the value of an investment, assuming reinvestment of distributions from dividend income and capital gains (the profits earned upon the sale of securities that have grown in value, if any) and assuming a constant rate of performance each year. The hypothetical investment and the average annual total returns do not reflect the deduction of taxes that a shareholder would pay on fund distributions or the redemption of fund shares. During periods of reimbursement by Fidelity, a fund’s total return will be greater than it would be had the reimbursement not occurred. How a fund did yesterday is no guarantee of how it will do tomorrow.
Average Annual Total Returns
| For the periods ended January 31, 2019 | Past 1 year | Life of fundA |
| Fidelity Flex℠ Large Cap Value Fund | (4.49)% | 3.66% |
A From March 7, 2017
$10,000 Over Life of Fund
Let's say hypothetically that $10,000 was invested in Fidelity Flex℠ Large Cap Value Fund on March 7, 2017, when the fund started.
The chart shows how the value of your investment would have changed, and also shows how the Russell 1000® Value Index performed over the same period.
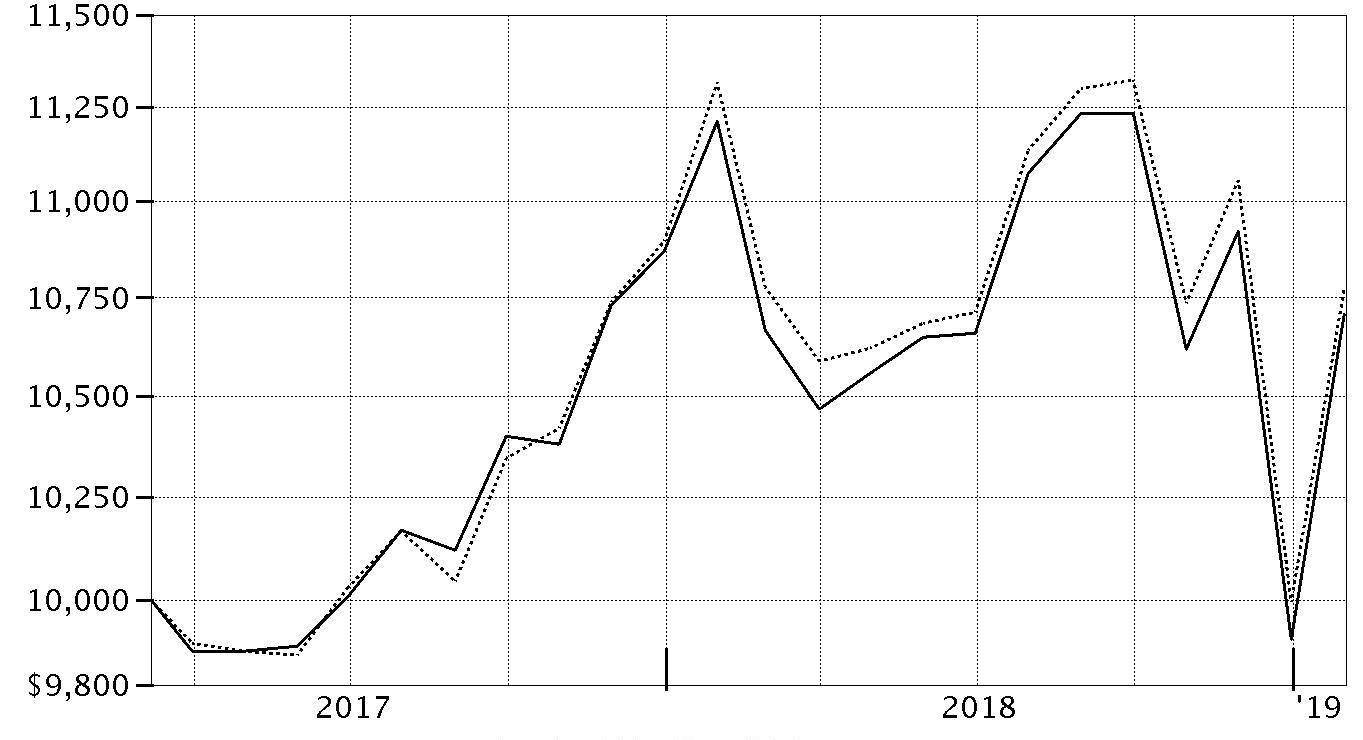
| Period Ending Values | ||
| $10,708 | Fidelity Flex℠ Large Cap Value Fund | |
| $10,773 | Russell 1000® Value Index | |
Management's Discussion of Fund Performance
Market Recap: The S&P 500® index returned -2.31% for the 12 months ending January 31, 2019, as the U.S. equity bellwether began the new year on a high note after enduring a final quarter of 2018 in which resurgent volatility upset the aging bull market. In October, rising U.S. Treasury yields and concern about peaking corporate earnings growth sent many investors fleeing from risk assets as they were still dealing with lingering uncertainty related to global trade and the U.S. Federal Reserve picking up the pace of interest rate hikes. The index returned -6.84% in October, at the time its largest monthly drop in seven years. But conditions worsened through Christmas, as jitters about the economy and another hike in rates led to a spike in market volatility and a -9.03% result for December. Sharply reversing course to begin 2019, the S&P 500® gained 8.01% in January, its strongest opening month since 1987, amid upbeat company earnings/outlooks and signs the Fed may pause on rates. For the full period, some economically sensitive sectors were at the bottom of the 12-month performance scale: materials (-14%), energy (-12%), financials (-11%) and industrials (-8%). Meanwhile, communication services – which includes dividend-rich telecom stocks – and consumer staples returned about -5%. In contrast, the defensive utilities (+11%), real estate (+10%) and health care (+5%) sectors led the way.Comments from Lead Portfolio Manager Matthew Friedman: For the fiscal year, the fund returned -4.49%, modestly ahead of the -4.81% result of the benchmark Russell 1000® Value Index. Choices within information technology added value versus the benchmark. Picks in health care and energy contributed to a lesser degree. Notably, the fund’s cash position of 4%, on average, also helped on a relative basis. However, security selection detracted slightly overall, largely due to unhelpful picks in financials, materials and consumer staples. Among individual holdings, shares of integrated energy company ConocoPhillips (+18%) added value. Also in energy, the fund’s stake in Andeavor contributed, as shares gained due to this company’s merger with Marathon Petroleum, completed in October. As a result of the merger, the fund did not hold Andeavor as of January 31. Conversely, an overweighting, on average, in flooring manufacturer Mohawk Industries (-57%) detracted. We sold our stake in Mohawk by period end. An overweighting in multinational insurance company American International Group (-30%) also hurt.The views expressed above reflect those of the portfolio manager(s) only through the end of the period as stated on the cover of this report and do not necessarily represent the views of Fidelity or any other person in the Fidelity organization. Any such views are subject to change at any time based upon market or other conditions and Fidelity disclaims any responsibility to update such views. These views may not be relied on as investment advice and, because investment decisions for a Fidelity fund are based on numerous factors, may not be relied on as an indication of trading intent on behalf of any Fidelity fund.
Notes to shareholders: On March 31, 2018, Kathy Buck retired from portfolio management, leaving Laurie Mundt the sole manager of the consumer staples sleeve and Chip Perrone as the sole manager of the consumer discretionary sleeve. On June 11, 2018, Pierre Sorel assumed management responsibility of the financials and real estate sleeves, succeeding Justin Bennett, who moved into a new role.Investment Summary (Unaudited)
Top Ten Stocks as of January 31, 2019
| % of fund's net assets | |
| Bank of America Corp. | 2.6 |
| Wells Fargo & Co. | 2.4 |
| Johnson & Johnson | 2.3 |
| Verizon Communications, Inc. | 2.3 |
| Comcast Corp. Class A | 2.2 |
| Capital One Financial Corp. | 2.1 |
| Citigroup, Inc. | 2.0 |
| Procter & Gamble Co. | 1.9 |
| Pfizer, Inc. | 1.9 |
| Suncor Energy, Inc. | 1.7 |
| 21.4 |
Top Five Market Sectors as of January 31, 2019
| % of fund's net assets | |
| Financials | 21.9 |
| Health Care | 13.6 |
| Energy | 9.4 |
| Information Technology | 9.0 |
| Industrials | 7.5 |
Asset Allocation (% of fund's net assets)
| As of January 31, 2019* | ||
| Stocks and Equity Futures | 96.1% | |
| Short-Term Investments and Net Other Assets (Liabilities) | 3.9% | |

* Foreign investments - 12.7%
Schedule of Investments January 31, 2019
Showing Percentage of Net Assets
| Common Stocks - 95.4% | |||
| Shares | Value | ||
| COMMUNICATION SERVICES - 7.0% | |||
| Diversified Telecommunication Services - 2.3% | |||
| Verizon Communications, Inc. | 7,183 | $395,496 | |
| Entertainment - 1.3% | |||
| Cinemark Holdings, Inc. | 1,167 | 47,754 | |
| The Walt Disney Co. | 1,549 | 172,744 | |
| 220,498 | |||
| Interactive Media & Services - 0.5% | |||
| Alphabet, Inc. Class A (a) | 70 | 78,812 | |
| Media - 2.9% | |||
| Comcast Corp. Class A | 10,095 | 369,174 | |
| Interpublic Group of Companies, Inc. | 2,662 | 60,561 | |
| Omnicom Group, Inc. | 841 | 65,497 | |
| 495,232 | |||
| TOTAL COMMUNICATION SERVICES | 1,190,038 | ||
| CONSUMER DISCRETIONARY - 5.5% | |||
| Auto Components - 0.6% | |||
| Aptiv PLC | 1,231 | 97,409 | |
| Hotels, Restaurants & Leisure - 2.5% | |||
| McDonald's Corp. | 1,455 | 260,125 | |
| Royal Caribbean Cruises Ltd. | 1,382 | 165,909 | |
| 426,034 | |||
| Household Durables - 0.7% | |||
| Lennar Corp. Class A | 2,266 | 107,454 | |
| Multiline Retail - 0.6% | |||
| Dollar Tree, Inc. (a) | 1,095 | 106,029 | |
| Specialty Retail - 0.6% | |||
| Burlington Stores, Inc. (a) | 622 | 106,804 | |
| Textiles, Apparel & Luxury Goods - 0.5% | |||
| Tapestry, Inc. | 2,334 | 90,349 | |
| TOTAL CONSUMER DISCRETIONARY | 934,079 | ||
| CONSUMER STAPLES - 6.9% | |||
| Beverages - 0.4% | |||
| PepsiCo, Inc. | 168 | 18,929 | |
| The Coca-Cola Co. | 1,073 | 51,643 | |
| 70,572 | |||
| Food & Staples Retailing - 1.7% | |||
| Kroger Co. | 1,124 | 31,843 | |
| Walgreens Boots Alliance, Inc. | 1,028 | 74,283 | |
| Walmart, Inc. | 1,900 | 182,077 | |
| 288,203 | |||
| Food Products - 1.6% | |||
| Archer Daniels Midland Co. | 294 | 13,201 | |
| Bunge Ltd. | 128 | 7,049 | |
| Conagra Brands, Inc. | 2,223 | 48,106 | |
| McCormick & Co., Inc. (non-vtg.) | 100 | 12,364 | |
| Mondelez International, Inc. | 2,279 | 105,427 | |
| The Kraft Heinz Co. | 1,267 | 60,892 | |
| Tyson Foods, Inc. Class A | 392 | 24,273 | |
| 271,312 | |||
| Household Products - 2.2% | |||
| Colgate-Palmolive Co. | 673 | 43,530 | |
| Kimberly-Clark Corp. | 100 | 11,138 | |
| Procter & Gamble Co. | 3,325 | 320,763 | |
| 375,431 | |||
| Tobacco - 1.0% | |||
| Altria Group, Inc. | 100 | 4,935 | |
| Philip Morris International, Inc. | 2,197 | 168,554 | |
| 173,489 | |||
| TOTAL CONSUMER STAPLES | 1,179,007 | ||
| ENERGY - 9.4% | |||
| Energy Equipment & Services - 0.8% | |||
| Baker Hughes, a GE Co. Class A | 6,038 | 142,316 | |
| Oil, Gas & Consumable Fuels - 8.6% | |||
| Anadarko Petroleum Corp. | 2,552 | 120,786 | |
| BP PLC sponsored ADR | 4,587 | 188,617 | |
| Cenovus Energy, Inc. (Canada) | 16,580 | 129,465 | |
| Cheniere Energy, Inc. (a) | 2,958 | 194,193 | |
| ConocoPhillips Co. | 4,072 | 275,634 | |
| Noble Energy, Inc. | 4,182 | 93,426 | |
| Suncor Energy, Inc. | 8,879 | 286,382 | |
| Valero Energy Corp. | 2,040 | 179,153 | |
| 1,467,656 | |||
| TOTAL ENERGY | 1,609,972 | ||
| FINANCIALS - 21.9% | |||
| Banks - 10.9% | |||
| Bank of America Corp. | 15,486 | 440,882 | |
| Citigroup, Inc. | 5,365 | 345,828 | |
| First Horizon National Corp. | 10,425 | 153,039 | |
| Huntington Bancshares, Inc. | 10,858 | 143,760 | |
| KeyCorp | 11,300 | 186,111 | |
| U.S. Bancorp | 3,631 | 185,762 | |
| Wells Fargo & Co. | 8,247 | 403,361 | |
| 1,858,743 | |||
| Capital Markets - 2.7% | |||
| Bank of New York Mellon Corp. | 3,781 | 197,822 | |
| Cboe Global Markets, Inc. | 744 | 69,393 | |
| E*TRADE Financial Corp. | 3,368 | 157,151 | |
| Goldman Sachs Group, Inc. | 223 | 44,156 | |
| 468,522 | |||
| Consumer Finance - 2.8% | |||
| Capital One Financial Corp. | 4,367 | 351,937 | |
| Discover Financial Services | 551 | 37,187 | |
| SLM Corp. | 8,277 | 88,647 | |
| 477,771 | |||
| Diversified Financial Services - 1.2% | |||
| Berkshire Hathaway, Inc. Class B (a) | 979 | 201,224 | |
| Insurance - 4.3% | |||
| American International Group, Inc. | 3,044 | 131,592 | |
| Hartford Financial Services Group, Inc. | 1,661 | 77,934 | |
| MetLife, Inc. | 2,881 | 131,575 | |
| The Travelers Companies, Inc. | 1,150 | 144,371 | |
| Willis Group Holdings PLC | 1,588 | 258,511 | |
| 743,983 | |||
| TOTAL FINANCIALS | 3,750,243 | ||
| HEALTH CARE - 13.6% | |||
| Biotechnology - 0.1% | |||
| Amgen, Inc. | 100 | 18,711 | |
| Health Care Equipment & Supplies - 3.7% | |||
| Abbott Laboratories | 2,330 | 170,043 | |
| Baxter International, Inc. | 663 | 48,061 | |
| Becton, Dickinson & Co. | 486 | 121,238 | |
| Boston Scientific Corp. (a) | 846 | 32,275 | |
| Danaher Corp. | 919 | 101,935 | |
| Medtronic PLC | 1,762 | 155,743 | |
| 629,295 | |||
| Health Care Providers & Services - 2.1% | |||
| Anthem, Inc. | 354 | 107,262 | |
| Cigna Corp. | 539 | 107,698 | |
| CVS Health Corp. | 1,455 | 95,375 | |
| HCA Holdings, Inc. | 141 | 19,660 | |
| McKesson Corp. | 175 | 22,444 | |
| 352,439 | |||
| Life Sciences Tools & Services - 0.9% | |||
| Thermo Fisher Scientific, Inc. | 637 | 156,492 | |
| Pharmaceuticals - 6.8% | |||
| Allergan PLC | 631 | 90,851 | |
| Bristol-Myers Squibb Co. | 1,084 | 53,517 | |
| Jazz Pharmaceuticals PLC (a) | 563 | 70,876 | |
| Johnson & Johnson | 2,976 | 396,046 | |
| Merck & Co., Inc. | 3,302 | 245,768 | |
| Pfizer, Inc. | 7,422 | 315,064 | |
| 1,172,122 | |||
| TOTAL HEALTH CARE | 2,329,059 | ||
| INDUSTRIALS - 7.5% | |||
| Aerospace & Defense - 1.3% | |||
| General Dynamics Corp. | 190 | 32,522 | |
| United Technologies Corp. | 1,668 | 196,941 | |
| 229,463 | |||
| Airlines - 0.6% | |||
| American Airlines Group, Inc. | 2,781 | 99,476 | |
| Construction & Engineering - 0.6% | |||
| AECOM (a) | 3,383 | 103,554 | |
| Electrical Equipment - 0.6% | |||
| Sensata Technologies, Inc. PLC (a) | 2,092 | 99,370 | |
| Industrial Conglomerates - 1.2% | |||
| General Electric Co. | 17,267 | 175,433 | |
| Honeywell International, Inc. | 191 | 27,433 | |
| 202,866 | |||
| Machinery - 0.4% | |||
| WABCO Holdings, Inc. (a) | 572 | 65,340 | |
| Marine - 0.4% | |||
| A.P. Moller - Maersk A/S Series B | 55 | 73,556 | |
| Professional Services - 0.7% | |||
| Nielsen Holdings PLC | 4,503 | 115,637 | |
| Road & Rail - 1.0% | |||
| Norfolk Southern Corp. | 1,019 | 170,927 | |
| Trading Companies & Distributors - 0.7% | |||
| HD Supply Holdings, Inc. (a) | 2,928 | 122,800 | |
| TOTAL INDUSTRIALS | 1,282,989 | ||
| INFORMATION TECHNOLOGY - 9.0% | |||
| Communications Equipment - 1.1% | |||
| Cisco Systems, Inc. | 4,151 | 196,301 | |
| Electronic Equipment & Components - 0.6% | |||
| TE Connectivity Ltd. | 1,194 | 96,654 | |
| IT Services - 3.1% | |||
| Amdocs Ltd. | 4,027 | 225,029 | |
| Cognizant Technology Solutions Corp. Class A | 1,707 | 118,944 | |
| Conduent, Inc. (a) | 3,700 | 47,175 | |
| IBM Corp. | 994 | 133,613 | |
| 524,761 | |||
| Semiconductors & Semiconductor Equipment - 2.8% | |||
| Analog Devices, Inc. | 506 | 50,023 | |
| Broadcom, Inc. | 399 | 107,032 | |
| Intel Corp. | 2,601 | 122,559 | |
| NXP Semiconductors NV | 1,745 | 151,867 | |
| Qualcomm, Inc. | 859 | 42,538 | |
| 474,019 | |||
| Software - 1.2% | |||
| Microsoft Corp. | 642 | 67,044 | |
| Oracle Corp. | 408 | 20,494 | |
| SS&C Technologies Holdings, Inc. | 2,173 | 111,888 | |
| 199,426 | |||
| Technology Hardware, Storage & Peripherals - 0.2% | |||
| Western Digital Corp. | 889 | 39,996 | |
| TOTAL INFORMATION TECHNOLOGY | 1,531,157 | ||
| MATERIALS - 3.9% | |||
| Chemicals - 3.1% | |||
| DowDuPont, Inc. | 5,233 | 281,588 | |
| LyondellBasell Industries NV Class A | 753 | 65,488 | |
| Nutrien Ltd. | 1,966 | 101,850 | |
| Westlake Chemical Corp. | 982 | 72,570 | |
| 521,496 | |||
| Construction Materials - 0.3% | |||
| Eagle Materials, Inc. | 722 | 51,262 | |
| Containers & Packaging - 0.5% | |||
| Crown Holdings, Inc. (a) | 1,764 | 89,964 | |
| TOTAL MATERIALS | 662,722 | ||
| REAL ESTATE - 4.7% | |||
| Equity Real Estate Investment Trusts (REITs) - 4.2% | |||
| American Tower Corp. | 609 | 105,260 | |
| Boston Properties, Inc. | 821 | 108,265 | |
| Colony Capital, Inc. | 2,080 | 12,626 | |
| Corporate Office Properties Trust (SBI) | 2,350 | 58,022 | |
| DDR Corp. | 3,167 | 41,393 | |
| Essex Property Trust, Inc. | 222 | 60,206 | |
| Prologis, Inc. | 1,580 | 109,273 | |
| Public Storage | 268 | 56,955 | |
| Spirit Realty Capital, Inc. | 374 | 14,855 | |
| Store Capital Corp. | 878 | 28,377 | |
| The Macerich Co. | 838 | 38,682 | |
| Welltower, Inc. | 1,083 | 83,922 | |
| 717,836 | |||
| Real Estate Management & Development - 0.5% | |||
| Cushman & Wakefield PLC | 2,247 | 38,738 | |
| VICI Properties, Inc. | 2,323 | 50,014 | |
| 88,752 | |||
| TOTAL REAL ESTATE | 806,588 | ||
| UTILITIES - 6.0% | |||
| Electric Utilities - 4.4% | |||
| Edison International | 1,075 | 61,243 | |
| Evergy, Inc. | 2,819 | 161,585 | |
| NextEra Energy, Inc. | 1,282 | 229,452 | |
| PPL Corp. | 4,996 | 156,475 | |
| Vistra Energy Corp. (a) | 5,491 | 137,879 | |
| 746,634 | |||
| Independent Power and Renewable Electricity Producers - 0.2% | |||
| NRG Energy, Inc. | 1,109 | 45,369 | |
| Multi-Utilities - 1.4% | |||
| Ameren Corp. | 1,645 | 114,064 | |
| Sempra Energy | 1,031 | 120,606 | |
| 234,670 | |||
| TOTAL UTILITIES | 1,026,673 | ||
| TOTAL COMMON STOCKS | |||
| (Cost $15,896,382) | 16,302,527 | ||
| Principal Amount | Value | ||
| U.S. Treasury Obligations - 0.1% | |||
| U.S. Treasury Bills, yield at date of purchase 2.36% to 2.38% 3/21/19 to 4/11/19 (b) | |||
| (Cost $19,923) | 20,000 | 19,924 | |
| Shares | Value | ||
| Money Market Funds - 4.1% | |||
| Fidelity Cash Central Fund, 2.43% (c) | |||
| (Cost $693,702) | 693,575 | 693,713 | |
| TOTAL INVESTMENT IN SECURITIES - 99.6% | |||
| (Cost $16,610,007) | 17,016,164 | ||
| NET OTHER ASSETS (LIABILITIES) - 0.4% | 73,644 | ||
| NET ASSETS - 100% | $17,089,808 |
| Futures Contracts | |||||
| Number of contracts | Expiration Date | Notional Amount | Value | Unrealized Appreciation/(Depreciation) | |
| Purchased | |||||
| Equity Index Contracts | |||||
| CME E-mini Russell 1000 Value Index Contracts (United States) | 2 | March 2019 | $117,670 | $9,583 | $9,583 |
The notional amount of futures purchased as a percentage of Net Assets is 0.7%
For the period, the average monthly underlying face amount at value for futures contracts in the aggregate was $135,941.
Legend
(a) Non-income producing
(b) Security or a portion of the security was pledged to cover margin requirements for futures contracts. At period end, the value of securities pledged amounted to $19,924.
(c) Affiliated fund that is generally available only to investment companies and other accounts managed by Fidelity Investments. The rate quoted is the annualized seven-day yield of the fund at period end. A complete unaudited listing of the fund's holdings as of its most recent quarter end is available upon request. In addition, each Fidelity Central Fund's financial statements, which are not covered by the Fund's Report of Independent Registered Public Accounting Firm, are available on the SEC's website or upon request.
Affiliated Central Funds
Information regarding fiscal year to date income earned by the Fund from investments in Fidelity Central Funds is as follows:
| Fund | Income earned |
| Fidelity Cash Central Fund | $13,204 |
| Total | $13,204 |
Amounts in the income column in the above table include any capital gain distributions from underlying funds, which are presented in the corresponding line-item in the Statement of Operations, if applicable.
Investment Valuation
The following is a summary of the inputs used, as of January 31, 2019, involving the Fund's assets and liabilities carried at fair value. The inputs or methodology used for valuing securities may not be an indication of the risk associated with investing in those securities. For more information on valuation inputs, and their aggregation into the levels used below, please refer to the Investment Valuation section in the accompanying Notes to Financial Statements.
| Valuation Inputs at Reporting Date: | ||||
| Description | Total | Level 1 | Level 2 | Level 3 |
| Investments in Securities: | ||||
| Equities: | ||||
| Communication Services | $1,190,038 | $1,190,038 | $-- | $-- |
| Consumer Discretionary | 934,079 | 934,079 | -- | -- |
| Consumer Staples | 1,179,007 | 1,179,007 | -- | -- |
| Energy | 1,609,972 | 1,609,972 | -- | -- |
| Financials | 3,750,243 | 3,750,243 | -- | -- |
| Health Care | 2,329,059 | 2,329,059 | -- | -- |
| Industrials | 1,282,989 | 1,209,433 | 73,556 | -- |
| Information Technology | 1,531,157 | 1,531,157 | -- | -- |
| Materials | 662,722 | 662,722 | -- | -- |
| Real Estate | 806,588 | 806,588 | -- | -- |
| Utilities | 1,026,673 | 1,026,673 | -- | -- |
| U.S. Government and Government Agency Obligations | 19,924 | -- | 19,924 | -- |
| Money Market Funds | 693,713 | 693,713 | -- | -- |
| Total Investments in Securities: | $17,016,164 | $16,922,684 | $93,480 | $-- |
| Derivative Instruments: | ||||
| Assets | ||||
| Futures Contracts | $9,583 | $9,583 | $-- | $-- |
| Total Assets | $9,583 | $9,583 | $-- | $-- |
| Total Derivative Instruments: | $9,583 | $9,583 | $-- | $-- |
Value of Derivative Instruments
The following table is a summary of the Fund's value of derivative instruments by primary risk exposure as of January 31, 2019. For additional information on derivative instruments, please refer to the Derivative Instruments section in the accompanying Notes to Financial Statements.
| Primary Risk Exposure / Derivative Type | Value | |
| Asset | Liability | |
| Equity Risk | ||
| Futures Contracts(a) | $9,583 | $0 |
| Total Equity Risk | 9,583 | 0 |
| Total Value of Derivatives | $9,583 | $0 |
(a) Reflects gross cumulative appreciation (depreciation) on futures contracts as presented in the Schedule of Investments. In the Statement of Assets and Liabilities, the period end daily variation margin is included in receivable or payable for daily variation margin on futures contracts, and the net cumulative appreciation (depreciation) is included in net unrealized appreciation (depreciation).
Other Information
Distribution of investments by country or territory of incorporation, as a percentage of Total Net Assets, is as follows (Unaudited):
| United States of America | 87.3% |
| Canada | 3.1% |
| United Kingdom | 2.6% |
| Ireland | 1.8% |
| Bailiwick of Guernsey | 1.3% |
| Netherlands | 1.3% |
| Liberia | 1.0% |
| Others (Individually Less Than 1%) | 1.6% |
| 100.0% |
See accompanying notes which are an integral part of the financial statements.
Financial Statements
Statement of Assets and Liabilities
| January 31, 2019 | ||
| Assets | ||
| Investment in securities, at value — See accompanying schedule: Unaffiliated issuers (cost $15,916,305) | $16,322,451 | |
| Fidelity Central Funds (cost $693,702) | 693,713 | |
| Total Investment in Securities (cost $16,610,007) | $17,016,164 | |
| Cash | 86,017 | |
| Receivable for investments sold | 75,411 | |
| Receivable for fund shares sold | 7,965 | |
| Dividends receivable | 17,207 | |
| Distributions receivable from Fidelity Central Funds | 1,628 | |
| Receivable for daily variation margin on futures contracts | 890 | |
| Total assets | 17,205,282 | |
| Liabilities | ||
| Payable for investments purchased | $115,324 | |
| Payable for fund shares redeemed | 148 | |
| Other payables and accrued expenses | 2 | |
| Total liabilities | 115,474 | |
| Net Assets | $17,089,808 | |
| Net Assets consist of: | ||
| Paid in capital | $16,857,030 | |
| Total distributable earnings (loss) | 232,778 | |
| Net Assets, for 1,659,231 shares outstanding | $17,089,808 | |
| Net Asset Value, offering price and redemption price per share ($17,089,808 ÷ 1,659,231 shares) | $10.30 |
See accompanying notes which are an integral part of the financial statements.
Statement of Operations
| Year ended January 31, 2019 | ||
| Investment Income | ||
| Dividends | $322,939 | |
| Interest | 365 | |
| Income from Fidelity Central Funds | 13,204 | |
| Total income | 336,508 | |
| Expenses | ||
| Independent trustees' fees and expenses | $84 | |
| Commitment fees | 41 | |
| Total expenses | 125 | |
| Net investment income (loss) | 336,383 | |
| Realized and Unrealized Gain (Loss) | ||
| Net realized gain (loss) on: | ||
| Investment securities: | ||
| Unaffiliated issuers | (58,927) | |
| Fidelity Central Funds | (5) | |
| Foreign currency transactions | (108) | |
| Futures contracts | (31,786) | |
| Total net realized gain (loss) | (90,826) | |
| Change in net unrealized appreciation (depreciation) on: | ||
| Investment securities: | ||
| Unaffiliated issuers | (393,905) | |
| Fidelity Central Funds | 11 | |
| Futures contracts | 8,342 | |
| Total change in net unrealized appreciation (depreciation) | (385,552) | |
| Net gain (loss) | (476,378) | |
| Net increase (decrease) in net assets resulting from operations | $(139,995) |
See accompanying notes which are an integral part of the financial statements.
Statement of Changes in Net Assets
| Year ended January 31, 2019 | For the period March 7, 2017 (commencement of operations) to January 31, 2018 | |
| Increase (Decrease) in Net Assets | ||
| Operations | ||
| Net investment income (loss) | $336,383 | $78,257 |
| Net realized gain (loss) | (90,826) | (12,783) |
| Change in net unrealized appreciation (depreciation) | (385,552) | 801,292 |
| Net increase (decrease) in net assets resulting from operations | (139,995) | 866,766 |
| Distributions to shareholders | (399,106) | – |
| Distributions to shareholders from net investment income | – | (70,439) |
| Distributions to shareholders from net realized gain | – | (8,025) |
| Total distributions | (399,106) | (78,464) |
| Share transactions | ||
| Proceeds from sales of shares | 20,702,647 | 10,990,695 |
| Reinvestment of distributions | 399,106 | 78,464 |
| Cost of shares redeemed | (14,140,048) | (1,190,257) |
| Net increase (decrease) in net assets resulting from share transactions | 6,961,705 | 9,878,902 |
| Total increase (decrease) in net assets | 6,422,604 | 10,667,204 |
| Net Assets | ||
| Beginning of period | 10,667,204 | – |
| End of period | $17,089,808 | $10,667,204 |
| Other Information | ||
| Undistributed net investment income end of period | $7,814 | |
| Shares | ||
| Sold | 1,984,561 | 1,065,066 |
| Issued in reinvestment of distributions | 39,595 | 7,354 |
| Redeemed | (1,324,028) | (113,317) |
| Net increase (decrease) | 700,128 | 959,103 |
See accompanying notes which are an integral part of the financial statements.
Financial Highlights
Fidelity Flex Large Cap Value Fund
| Years ended January 31, | 2019 | 2018 A |
| Selected Per–Share Data | ||
| Net asset value, beginning of period | $11.12 | $10.00 |
| Income from Investment Operations | ||
| Net investment income (loss)B | .23 | .18 |
| Net realized and unrealized gain (loss) | (.74) | 1.03 |
| Total from investment operations | (.51) | 1.21 |
| Distributions from net investment income | (.26) | (.08) |
| Distributions from net realized gain | (.06) | (.01) |
| Total distributions | (.31)C | (.09) |
| Net asset value, end of period | $10.30 | $11.12 |
| Total ReturnD | (4.49)% | 12.12% |
| Ratios to Average Net AssetsE,F | ||
| Expenses before reductions | - %G | - %G,H |
| Expenses net of fee waivers, if any | - %G | - %G,H |
| Expenses net of all reductions | - %G | - %G,H |
| Net investment income (loss) | 2.16% | 1.95%H |
| Supplemental Data | ||
| Net assets, end of period (000 omitted) | $17,090 | $10,667 |
| Portfolio turnover rateI | 130% | 56%H |
A For the period March 7, 2017 (commencement of operations) to January 31, 2018.
B Calculated based on average shares outstanding during the period.
C Total distributions of $.31 per share is comprised of distributions from net investment income of $.255 and distributions from net realized gain of $.058 per share.
D Total returns for periods of less than one year are not annualized.
E Fees and expenses of any underlying Fidelity Central Funds are not included in the Fund's expense ratio. The Fund indirectly bears its proportionate share of the expenses of any underlying Fidelity Central Funds.
F Expense ratios reflect operating expenses of the Fund. Expenses before reductions do not reflect amounts reimbursed by the investment adviser or reductions from expense offset arrangements and do not represent the amount paid by the Fund during periods when reimbursements or reductions occur. Expenses net of fee waivers reflect expenses after reimbursement by the investment adviser but prior to reductions from expense offset arrangements. Expenses net of all reductions represent the net expenses paid by the Fund.
G Amount represents less than .005%.
H Annualized
I Amount does not include the portfolio activity of any underlying Fidelity Central Funds.
See accompanying notes which are an integral part of the financial statements.
Notes to Financial Statements
For the period ended January 31, 2019
1. Organization.
Fidelity Flex Large Cap Value Fund (the Fund) is a fund of Fidelity Devonshire Trust (the Trust) and is authorized to issue an unlimited number of shares. Share transactions on the Statement of Changes in Net Assets may contain exchanges between affiliated funds. The Trust is registered under the Investment Company Act of 1940, as amended (the 1940 Act), as an open-end management investment company organized as a Massachusetts business trust. The Fund is available only to certain fee-based accounts offered by Fidelity.
2. Investments in Fidelity Central Funds.
The Fund invests in Fidelity Central Funds, which are open-end investment companies generally available only to other investment companies and accounts managed by the investment adviser and its affiliates. The Fund's Schedule of Investments lists each of the Fidelity Central Funds held as of period end, if any, as an investment of the Fund, but does not include the underlying holdings of each Fidelity Central Fund. As an Investing Fund, the Fund indirectly bears its proportionate share of the expenses of the underlying Fidelity Central Funds.
The Money Market Central Funds seek preservation of capital and current income and are managed by Fidelity Investments Money Management, Inc. (FIMM), an affiliate of the investment adviser. Annualized expenses of the Money Market Central Funds as of their most recent shareholder report date are less than .005%.
A complete unaudited list of holdings for each Fidelity Central Fund is available upon request or at the Securities and Exchange Commission (the SEC) website at www.sec.gov. In addition, the financial statements of the Fidelity Central Funds, which are not covered by the Fund's Report of Independent Registered Public Accounting Firm, are available on the SEC website or upon request.
3. Significant Accounting Policies.
The Fund is an investment company and applies the accounting and reporting guidance of the Financial Accounting Standards Board (FASB) Accounting Standards Codification Topic 946 Financial Services – Investments Companies. The financial statements have been prepared in conformity with accounting principles generally accepted in the United States of America (GAAP), which require management to make certain estimates and assumptions at the date of the financial statements. Actual results could differ from those estimates. Subsequent events, if any, through the date that the financial statements were issued have been evaluated in the preparation of the financial statements. The following summarizes the significant accounting policies of the Fund:
Investment Valuation. Investments are valued as of 4:00 p.m. Eastern time on the last calendar day of the period. The Board of Trustees (the Board) has delegated the day to day responsibility for the valuation of the Fund's investments to the Fair Value Committee (the Committee) established by the Fund's investment adviser. In accordance with valuation policies and procedures approved by the Board, the Fund attempts to obtain prices from one or more third party pricing vendors or brokers to value its investments. When current market prices, quotations or currency exchange rates are not readily available or reliable, investments will be fair valued in good faith by the Committee, in accordance with procedures adopted by the Board. Factors used in determining fair value vary by investment type and may include market or investment specific events, changes in interest rates and credit quality. The frequency with which these procedures are used cannot be predicted and they may be utilized to a significant extent. The Committee oversees the Fund's valuation policies and procedures and reports to the Board on the Committee's activities and fair value determinations. The Board monitors the appropriateness of the procedures used in valuing the Fund's investments and ratifies the fair value determinations of the Committee.
The Fund categorizes the inputs to valuation techniques used to value its investments into a disclosure hierarchy consisting of three levels as shown below:
- Level 1 – quoted prices in active markets for identical investments
- Level 2 – other significant observable inputs (including quoted prices for similar investments, interest rates, prepayment speeds, etc.)
- Level 3 – unobservable inputs (including the Fund's own assumptions based on the best information available)
Valuation techniques used to value the Fund's investments by major category are as follows:
Equity securities, including restricted securities, for which market quotations are readily available, are valued at the last reported sale price or official closing price as reported by a third party pricing vendor on the primary market or exchange on which they are traded and are categorized as Level 1 in the hierarchy. In the event there were no sales during the day or closing prices are not available, securities are valued at the last quoted bid price or may be valued using the last available price and are generally categorized as Level 2 in the hierarchy. For foreign equity securities, when market or security specific events arise, comparisons to the valuation of American Depositary Receipts (ADRs), futures contracts, Exchange-Traded Funds (ETFs) and certain indexes as well as quoted prices for similar securities may be used and would be categorized as Level 2 in the hierarchy. For equity securities, including restricted securities, where observable inputs are limited, assumptions about market activity and risk are used and these securities may be categorized as Level 3 in the hierarchy.
Debt securities, including restricted securities, are valued based on evaluated prices received from third party pricing vendors or from brokers who make markets in such securities. U.S. government and government agency obligations are valued by pricing vendors who utilize matrix pricing which considers yield or price of bonds of comparable quality, coupon, maturity and type or by broker-supplied prices. When independent prices are unavailable or unreliable, debt securities may be valued utilizing pricing methodologies which consider similar factors that would be used by third party pricing vendors. Debt securities are generally categorized as Level 2 in the hierarchy but may be Level 3 depending on the circumstances.
Futures contracts are valued at the settlement price established each day by the board of trade or exchange on which they are traded and are categorized as Level 1 in the hierarchy. Investments in open-end mutual funds, including the Fidelity Central Funds, are valued at their closing net asset value (NAV) each business day and are categorized as Level 1 in the hierarchy.
Changes in valuation techniques may result in transfers in or out of an assigned level within the disclosure hierarchy. The aggregate value of investments by input level as of January 31, 2019 is included at the end of the Fund's Schedule of Investments.
Foreign Currency. The Fund may use foreign currency contracts to facilitate transactions in foreign-denominated securities. Gains and losses from these transactions may arise from changes in the value of the foreign currency or if the counterparties do not perform under the contracts' terms.
Foreign-denominated assets, including investment securities, and liabilities are translated into U.S. dollars at the exchange rates at period end. Purchases and sales of investment securities, income and dividends received and expenses denominated in foreign currencies are translated into U.S. dollars at the exchange rate in effect on the transaction date.
The effects of exchange rate fluctuations on investments are included with the net realized and unrealized gain (loss) on investment securities. Other foreign currency transactions resulting in realized and unrealized gain (loss) are disclosed separately.
Investment Transactions and Income. For financial reporting purposes, the Fund's investment holdings and NAV include trades executed through the end of the last business day of the period. The NAV per share for processing shareholder transactions is calculated as of the close of business of the New York Stock Exchange (NYSE), normally 4:00 p.m. Eastern time and includes trades executed through the end of the prior business day. Gains and losses on securities sold are determined on the basis of identified cost. Dividend income is recorded on the ex-dividend date, except for certain dividends from foreign securities where the ex-dividend date may have passed, which are recorded as soon as the Fund is informed of the ex-dividend date. Non-cash dividends included in dividend income, if any, are recorded at the fair market value of the securities received. Income and capital gain distributions from Fidelity Central Funds, if any, are recorded on the ex-dividend date. Certain distributions received by the Fund represent a return of capital or capital gain. The Fund determines the components of these distributions subsequent to the ex-dividend date, based upon receipt of tax filings or other correspondence relating to the underlying investment. These distributions are recorded as a reduction of cost of investments and/or as a realized gain. Interest income is accrued as earned and includes coupon interest and amortization of premium and accretion of discount on debt securities as applicable. Investment income is recorded net of foreign taxes withheld where recovery of such taxes is uncertain.
Expenses. Expenses directly attributable to a fund are charged to that fund. Expenses attributable to more than one fund are allocated among the respective funds on the basis of relative net assets or other appropriate methods. Expense estimates are accrued in the period to which they relate and adjustments are made when actual amounts are known.
Income Tax Information and Distributions to Shareholders. Each year, the Fund intends to qualify as a regulated investment company under Subchapter M of the Internal Revenue Code, including distributing substantially all of its taxable income and realized gains. As a result, no provision for U.S. Federal income taxes is required. As of January 31, 2019, the Fund did not have any unrecognized tax benefits in the financial statements; nor is the Fund aware of any tax positions for which it is reasonably possible that the total amounts of unrecognized tax benefits will significantly change in the next twelve months. The Fund files a U.S. federal tax return, in addition to state and local tax returns as required. The Fund's federal income tax returns are subject to examination by the Internal Revenue Service (IRS) for a period of three fiscal years after they are filed. State and local tax returns may be subject to examination for an additional fiscal year depending on the jurisdiction. Foreign taxes are provided for based on the Fund's understanding of the tax rules and rates that exist in the foreign markets in which it invests.
Distributions are declared and recorded on the ex-dividend date. Income and capital gain distributions are determined in accordance with income tax regulations, which may differ from GAAP. These differences resulted in distribution reclassifications. In addition, the Fund claimed a portion of the payment made to redeeming shareholders as a distribution for income tax purposes.
Capital accounts within the financial statements are adjusted for permanent book-tax differences. These adjustments have no impact on net assets or the results of operations. Capital accounts are not adjusted for temporary book-tax differences which will reverse in a subsequent period.
Book-tax differences are primarily due to the short-term gain distributions from the Underlying Funds, futures contracts, foreign currency transactions, market discount, losses deferred due to wash sales and excise tax regulations.
As of period end, the cost and unrealized appreciation (depreciation) in securities, and derivatives if applicable, for federal income tax purposes were as follows:
| Gross unrealized appreciation | $1,098,230 |
| Gross unrealized depreciation | (854,868) |
| Net unrealized appreciation (depreciation) | $243,362 |
| Tax Cost | $16,772,802 |
The tax-based components of distributable earnings as of period end were as follows:
| Net unrealized appreciation (depreciation) on securities and other investments | $243,362 |
The Fund intends to elect to defer to its next fiscal year $10,582 of capital losses recognized during the period November 1, 2018 to January 31, 2019.
The tax character of distributions paid was as follows:
| January 31, 2019 | January 31, 2018(a) | |
| Ordinary Income | $327,510 | $ 77,572 |
| Long-term Capital Gains | 71,596 | 892 |
| Total | $399,106 | $ 78,464 |
(a) For the period March 7, 2017 (commencement of operations) to January 31, 2018.
New Rule Issuance. During August 2018, the U.S. Securities and Exchange Commission issued Final Rule Release No. 33-10532, Disclosure Update and Simplification. This Final Rule includes amendments specific to registered investment companies that are intended to eliminate overlap in disclosure requirements between Regulation S-X and GAAP. In accordance with these amendments, certain line-items in the Fund's financial statements have been combined or removed for the current period as outlined in the table below.
| Financial Statement | Current Line-Item Presentation (As Applicable) | Prior Line-Item Presentation (As Applicable) |
| Statement of Assets and Liabilities | Total distributable earnings (loss) | Undistributed/Distributions in excess of/Accumulated net investment income (loss) Accumulated/Undistributed net realized gain (loss) Net unrealized appreciation (depreciation) |
| Statement of Changes in Net Assets | N/A - removed | Undistributed/Distributions in excess of/Accumulated net investment income (loss) end of period |
| Statement of Changes in Net Assets | Distributions to shareholders | Distributions to shareholders from net investment income Distributions to shareholders from net realized gain |
4. Derivative Instruments.
Risk Exposures and the Use of Derivative Instruments. The Fund's investment objective allows the Fund to enter into various types of derivative contracts, including futures contracts. Derivatives are investments whose value is primarily derived from underlying assets, indices or reference rates and may be transacted on an exchange or over-the-counter (OTC). Derivatives may involve a future commitment to buy or sell a specified asset based on specified terms, to exchange future cash flows at periodic intervals based on a notional principal amount, or for one party to make one or more payments upon the occurrence of specified events in exchange for periodic payments from the other party.
The Fund used derivatives to increase returns and to manage exposure to certain risks as defined below. The success of any strategy involving derivatives depends on analysis of numerous economic factors, and if the strategies for investment do not work as intended, the Fund may not achieve its objectives.
The Fund's use of derivatives increased or decreased its exposure to the following risk:
| Equity Risk | Equity risk relates to the fluctuations in the value of financial instruments as a result of changes in market prices (other than those arising from interest rate risk or foreign exchange risk), whether caused by factors specific to an individual investment, its issuer, or all factors affecting all instruments traded in a market or market segment. |
The Fund is also exposed to additional risks from investing in derivatives, such as liquidity risk and counterparty credit risk. Liquidity risk is the risk that the Fund will be unable to close out the derivative in the open market in a timely manner. Counterparty credit risk is the risk that the counterparty will not be able to fulfill its obligation to the Fund. Counterparty credit risk related to exchange-traded futures contracts may be mitigated by the protection provided by the exchange on which they trade.
Investing in derivatives may involve greater risks than investing in the underlying assets directly and, to varying degrees, may involve risk of loss in excess of any initial investment and collateral received and amounts recognized in the Statement of Assets and Liabilities. In addition, there may be the risk that the change in value of the derivative contract does not correspond to the change in value of the underlying instrument.
Futures Contracts. A futures contract is an agreement between two parties to buy or sell a specified underlying instrument for a fixed price at a specified future date. The Fund used futures contracts to manage its exposure to the stock market.
Upon entering into a futures contract, a fund is required to deposit either cash or securities (initial margin) with a clearing broker in an amount equal to a certain percentage of the face value of the contract. Futures contracts are marked-to-market daily and subsequent daily payments (variation margin) are made or received by a fund depending on the daily fluctuations in the value of the futures contracts and are recorded as unrealized appreciation or (depreciation). This receivable and/or payable, if any, is included in daily variation margin on futures contracts in the Statement of Assets and Liabilities. Realized gain or (loss) is recorded upon the expiration or closing of a futures contract. The net realized gain (loss) and change in net unrealized appreciation (depreciation) on futures contracts during the period is presented in the Statement of Operations.
Any open futures contracts at period end are presented in the Schedule of Investments under the caption "Futures Contracts". The notional amount at value reflects each contract's exposure to the underlying instrument or index at period end. Securities deposited to meet initial margin requirements are identified in the Schedule of Investments.
5. Purchases and Sales of Investments.
Purchases and sales of securities, other than short-term securities, aggregated $26,074,262 and $19,112,557, respectively.
6. Fees and Other Transactions with Affiliates.
Management Fee. Fidelity Management & Research Company (the investment adviser) and its affiliates provide the Fund with investment management related services and the Fund does not pay any fees for these services. Under the management contract, the investment adviser or an affiliate pays all other expenses of the Fund, excluding fees and expenses of the independent Trustees, and certain miscellaneous expenses such as proxy and shareholder meeting expenses.
Brokerage Commissions. The Fund placed a portion of its portfolio transactions with brokerage firms which are affiliates of the investment adviser. Brokerage commissions are included in net realized gain (loss) and change in net unrealized appreciation (depreciation) in the Statement of Operations. The commissions paid to these affiliated firms were $670 for the period.
Interfund Trades. The Fund may purchase from or sell securities to other Fidelity Funds under procedures adopted by the Board. The procedures have been designed to ensure these interfund trades are executed in accordance with Rule 17a-7 of the 1940 Act. Interfund trades are included within the respective purchases and sales amounts shown in the Purchases and Sales of Investments note.
7. Committed Line of Credit.
The Fund participates with other funds managed by the investment adviser or an affiliate in a $4.25 billion credit facility (the "line of credit") to be utilized for temporary or emergency purposes to fund shareholder redemptions or for other short-term liquidity purposes. The Fund has agreed to pay commitment fees on its pro-rata portion of the line of credit, which amounted to $41 and is reflected in Commitment fees on the Statement of Operations. During the period, the Fund did not borrow on this line of credit.
8. Other.
The Fund's organizational documents provide former and current trustees and officers with a limited indemnification against liabilities arising in connection with the performance of their duties to the Fund. In the normal course of business, the Fund may also enter into contracts that provide general indemnifications. The Fund's maximum exposure under these arrangements is unknown as this would be dependent on future claims that may be made against the Fund. The risk of material loss from such claims is considered remote.
In March 2019, the Fund's Board of Trustees approved a Plan of Liquidation and Dissolution whereby the Fund will distribute all of its net assets and those proceeds will be used to purchase shares of Fidelity Flex Large Cap Value II Fund on or about June 27, 2019.
Report of Independent Registered Public Accounting Firm
To the Board of Trustees of Fidelity Devonshire Trust and Shareholders of Fidelity Flex Large Cap Value Fund:
Opinion on the Financial Statements
We have audited the accompanying statement of assets and liabilities, including the schedule of investments, of Fidelity Flex Large Cap Value Fund (one of the funds constituting Fidelity Devonshire Trust, referred to hereafter as the "Fund") as of January 31, 2019, the related statement of operations for the year ended January 31, 2019 and the statement of changes in net assets and the financial highlights for the year ended January 31, 2019 and for the period March 7, 2017 (commencement of operations) through January 31, 2018, including the related notes (collectively referred to as the "financial statements"). In our opinion, the financial statements present fairly, in all material respects, the financial position of the Fund as of January 31, 2019, the results of its operations for the year ended January 31, 2019, and the changes in its net assets and the financial highlights for the year ended January 31, 2019 and for the period March 7, 2017 (commencement of operations) through January 31, 2018 in conformity with accounting principles generally accepted in the United States of America.
Basis for Opinion
These financial statements are the responsibility of the Fund’s management. Our responsibility is to express an opinion on the Fund’s financial statements based on our audits. We are a public accounting firm registered with the Public Company Accounting Oversight Board (United States) (PCAOB) and are required to be independent with respect to the Fund in accordance with the U.S. federal securities laws and the applicable rules and regulations of the Securities and Exchange Commission and the PCAOB.
We conducted our audits of these financial statements in accordance with the standards of the PCAOB. Those standards require that we plan and perform the audit to obtain reasonable assurance about whether the financial statements are free of material misstatement, whether due to error or fraud.
Our audits included performing procedures to assess the risks of material misstatement of the financial statements, whether due to error or fraud, and performing procedures that respond to those risks. Such procedures included examining, on a test basis, evidence regarding the amounts and disclosures in the financial statements. Our audits also included evaluating the accounting principles used and significant estimates made by management, as well as evaluating the overall presentation of the financial statements. Our procedures included confirmation of securities owned as of January 31, 2019 by correspondence with the custodian and brokers; when replies were not received from brokers, we performed other auditing procedures. We believe that our audits provide a reasonable basis for our opinion.
PricewaterhouseCoopers LLP
Boston, Massachusetts
March 15, 2019
We have served as the auditor of one or more investment companies in the Fidelity group of funds since 1932.
Trustees and Officers
The Trustees, Members of the Advisory Board (if any), and officers of the trust and fund, as applicable, are listed below. The Board of Trustees governs the fund and is responsible for protecting the interests of shareholders. The Trustees are experienced executives who meet periodically throughout the year to oversee the fund's activities, review contractual arrangements with companies that provide services to the fund, oversee management of the risks associated with such activities and contractual arrangements, and review the fund's performance. Except for Michael E. Wiley, each of the Trustees oversees 287 funds. Mr. Wiley oversees 195 funds.
The Trustees hold office without limit in time except that (a) any Trustee may resign; (b) any Trustee may be removed by written instrument, signed by at least two-thirds of the number of Trustees prior to such removal; (c) any Trustee who requests to be retired or who has become incapacitated by illness or injury may be retired by written instrument signed by a majority of the other Trustees; and (d) any Trustee may be removed at any special meeting of shareholders by a two-thirds vote of the outstanding voting securities of the trust. Each Trustee who is not an interested person (as defined in the 1940 Act) of the trust and the fund is referred to herein as an Independent Trustee. Each Independent Trustee shall retire not later than the last day of the calendar year in which his or her 75th birthday occurs. The Independent Trustees may waive this mandatory retirement age policy with respect to individual Trustees. Officers and Advisory Board Members hold office without limit in time, except that any officer or Advisory Board Member may resign or may be removed by a vote of a majority of the Trustees at any regular meeting or any special meeting of the Trustees. Except as indicated, each individual has held the office shown or other offices in the same company for the past five years.
The fund’s Statement of Additional Information (SAI) includes more information about the Trustees. To request a free copy, call Fidelity at 1-800-835-5092.
Experience, Skills, Attributes, and Qualifications of the Trustees. The Governance and Nominating Committee has adopted a statement of policy that describes the experience, qualifications, attributes, and skills that are necessary and desirable for potential Independent Trustee candidates (Statement of Policy). The Board believes that each Trustee satisfied at the time he or she was initially elected or appointed a Trustee, and continues to satisfy, the standards contemplated by the Statement of Policy. The Governance and Nominating Committee also engages professional search firms to help identify potential Independent Trustee candidates who have the experience, qualifications, attributes, and skills consistent with the Statement of Policy. From time to time, additional criteria based on the composition and skills of the current Independent Trustees, as well as experience or skills that may be appropriate in light of future changes to board composition, business conditions, and regulatory or other developments, have also been considered by the professional search firms and the Governance and Nominating Committee. In addition, the Board takes into account the Trustees' commitment and participation in Board and committee meetings, as well as their leadership of standing and ad hoc committees throughout their tenure.
In determining that a particular Trustee was and continues to be qualified to serve as a Trustee, the Board has considered a variety of criteria, none of which, in isolation, was controlling. The Board believes that, collectively, the Trustees have balanced and diverse experience, qualifications, attributes, and skills, which allow the Board to operate effectively in governing the fund and protecting the interests of shareholders. Information about the specific experience, skills, attributes, and qualifications of each Trustee, which in each case led to the Board's conclusion that the Trustee should serve (or continue to serve) as a trustee of the fund, is provided below.
Board Structure and Oversight Function. James C. Curvey is an interested person and currently serves as Chairman. The Trustees have determined that an interested Chairman is appropriate and benefits shareholders because an interested Chairman has a personal and professional stake in the quality and continuity of services provided to the fund. Independent Trustees exercise their informed business judgment to appoint an individual of their choosing to serve as Chairman, regardless of whether the Trustee happens to be independent or a member of management. The Independent Trustees have determined that they can act independently and effectively without having an Independent Trustee serve as Chairman and that a key structural component for assuring that they are in a position to do so is for the Independent Trustees to constitute a substantial majority for the Board. The Independent Trustees also regularly meet in executive session. Ned C. Lautenbach serves as Chairman of the Independent Trustees and as such (i) acts as a liaison between the Independent Trustees and management with respect to matters important to the Independent Trustees and (ii) with management prepares agendas for Board meetings.
Fidelity® funds are overseen by different Boards of Trustees. The fund's Board oversees Fidelity's high income and certain equity funds, and other Boards oversee Fidelity's investment-grade bond, money market, asset allocation, and other equity funds. The asset allocation funds may invest in Fidelity® funds overseen by the fund's Board. The use of separate Boards, each with its own committee structure, allows the Trustees of each group of Fidelity® funds to focus on the unique issues of the funds they oversee, including common research, investment, and operational issues. On occasion, the separate Boards establish joint committees to address issues of overlapping consequences for the Fidelity® funds overseen by each Board.
The Trustees operate using a system of committees to facilitate the timely and efficient consideration of all matters of importance to the Trustees, the fund, and fund shareholders and to facilitate compliance with legal and regulatory requirements and oversight of the fund's activities and associated risks. The Board, acting through its committees, has charged FMR and its affiliates with (i) identifying events or circumstances the occurrence of which could have demonstrably adverse effects on the fund's business and/or reputation; (ii) implementing processes and controls to lessen the possibility that such events or circumstances occur or to mitigate the effects of such events or circumstances if they do occur; and (iii) creating and maintaining a system designed to evaluate continuously business and market conditions in order to facilitate the identification and implementation processes described in (i) and (ii) above. Because the day-to-day operations and activities of the fund are carried out by or through FMR, its affiliates, and other service providers, the fund's exposure to risks is mitigated but not eliminated by the processes overseen by the Trustees. While each of the Board's committees has responsibility for overseeing different aspects of the fund's activities, oversight is exercised primarily through the Operations, Audit, and Compliance Committees. In addition, the Independent Trustees have worked with Fidelity to enhance the Board's oversight of investment and financial risks, legal and regulatory risks, technology risks, and operational risks, including the development of additional risk reporting to the Board. Appropriate personnel, including but not limited to the fund's Chief Compliance Officer (CCO), FMR's internal auditor, the independent accountants, the fund's Treasurer and portfolio management personnel, make periodic reports to the Board's committees, as appropriate, including an annual review of Fidelity's risk management program for the Fidelity® funds. The responsibilities of each standing committee, including their oversight responsibilities, are described further under "Standing Committees of the Trustees."
Interested Trustees*:
Correspondence intended for a Trustee who is an interested person may be sent to Fidelity Investments, 245 Summer Street, Boston, Massachusetts 02210.
Name, Year of Birth; Principal Occupations and Other Relevant Experience+
James C. Curvey (1935)
Year of Election or Appointment: 2007
Trustee
Chairman of the Board of Trustees
Mr. Curvey also serves as Trustee of other Fidelity® funds. Mr. Curvey is Vice Chairman (2007-present) and Director of FMR LLC (diversified financial services company). In addition, Mr. Curvey is an Overseer Emeritus for the Boston Symphony Orchestra, a Director of Artis-Naples, and a Trustee of Brewster Academy in Wolfeboro, New Hampshire. Previously, Mr. Curvey served as a Director of Fidelity Research & Analysis Co. (investment adviser firm, 2009-2018), Director of Fidelity Investments Money Management, Inc. (investment adviser firm, 2009-2014) and a Director of FMR and FMR Co., Inc. (investment adviser firms, 2007-2014).
* Determined to be an “Interested Trustee” by virtue of, among other things, his or her affiliation with the trust or various entities under common control with FMR.
+ The information includes the Trustee's principal occupation during the last five years and other information relating to the experience, attributes, and skills relevant to the Trustee's qualifications to serve as a Trustee, which led to the conclusion that the Trustee should serve as a Trustee for the fund.
Independent Trustees:
Correspondence intended for an Independent Trustee may be sent to Fidelity Investments, P.O. Box 55235, Boston, Massachusetts 02205-5235.
Name, Year of Birth; Principal Occupations and Other Relevant Experience+
Dennis J. Dirks (1948)
Year of Election or Appointment: 2005
Trustee
Mr. Dirks also serves as Trustee of other Fidelity® funds. Prior to his retirement in May 2003, Mr. Dirks was Chief Operating Officer and a member of the Board of The Depository Trust & Clearing Corporation (DTCC). He also served as President, Chief Operating Officer, and Board member of The Depository Trust Company (DTC) and President and Board member of the National Securities Clearing Corporation (NSCC). In addition, Mr. Dirks served as Chief Executive Officer and Board member of the Government Securities Clearing Corporation, Chief Executive Officer and Board member of the Mortgage-Backed Securities Clearing Corporation, as a Trustee and a member of the Finance Committee of Manhattan College (2005-2008), as a Trustee and a member of the Finance Committee of AHRC of Nassau County (2006-2008), as a member of the Independent Directors Council (IDC) Governing Council (2010-2015), and as a member of the Board of Directors for The Brookville Center for Children’s Services, Inc. (2009-2017). Mr. Dirks is a member of the Finance Committee (2016-present) and Board of Directors (2017-present) and is Treasurer (2018-present) of the Asolo Repertory Theatre.
Donald F. Donahue (1950)
Year of Election or Appointment: 2018
Trustee
Mr. Donahue also serves as a Trustee of other Fidelity® funds. Mr. Donahue is President and Chief Executive Officer of Miranda Partners, LLC (risk consulting for the financial services industry, 2012-present). Previously, Mr. Donahue served as a Member of the Advisory Board of certain Fidelity® funds (2015-2018) and Chief Executive Officer (2006-2012), Chief Operating Officer (2003-2006), and Managing Director, Customer Marketing and Development (1999-2003) of The Depository Trust & Clearing Corporation (financial markets infrastructure). Mr. Donahue serves as a Member (2007-present) and Co-Chairman (2016-present) of the Board of Directors of United Way of New York, Member of the Board of Directors of NYC Leadership Academy (2012-present) and Member of the Board of Advisors of Ripple Labs, Inc. (financial services, 2015-present). He also served as Chairman (2010-2012) and Member of the Board of Directors (2012-2013) of Omgeo, LLC (financial services), Treasurer of United Way of New York (2012-2016), and Member of the Board of Directors of XBRL US (financial services non-profit, 2009-2012) and the International Securities Services Association (2009-2012).
Alan J. Lacy (1953)
Year of Election or Appointment: 2008
Trustee
Mr. Lacy also serves as Trustee of other Fidelity® funds. Mr. Lacy serves as a Director of Bristol-Myers Squibb Company (global pharmaceuticals, 2008-present). He is a Trustee of the California Chapter of The Nature Conservancy (2015-present) and a Director of the Center for Advanced Study in the Behavioral Sciences at Stanford University (2015-present). In addition, Mr. Lacy served as Senior Adviser (2007-2014) of Oak Hill Capital Partners, L.P. (private equity) and also served as Chief Executive Officer (2005) and Vice Chairman (2005-2006) of Sears Holdings Corporation (retail) and Chief Executive Officer and Chairman of the Board of Sears, Roebuck and Co. (retail, 2000-2005). Previously, Mr. Lacy served as Chairman (2014-2017) and a member (2010-2017) of the Board of Directors of Dave & Buster’s Entertainment, Inc. (restaurant and entertainment complexes), as Chairman (2008-2011) and a member (2006-2015) of the Board of Trustees of the National Parks Conservation Association, and as a member of the Board of Directors for The Hillman Companies, Inc. (hardware wholesalers, 2010-2014), Earth Fare, Inc. (retail grocery, 2010-2014), and The Western Union Company (global money transfer, 2006-2011).
Ned C. Lautenbach (1944)
Year of Election or Appointment: 2000
Trustee
Chairman of the Independent Trustees
Mr. Lautenbach also serves as Trustee of other Fidelity® funds. Mr. Lautenbach currently serves as Chair (2018-present) and Member (2013-present) of the Board of Governors, State University System of Florida and is a member of the Council on Foreign Relations (1994-present). He is also a member and has most recently served as Chairman of the Board of Directors of Artis-Naples (2012-present). Previously, Mr. Lautenbach served as a member and then Lead Director of the Board of Directors of Eaton Corporation (diversified industrial, 1997-2016). He was also a Partner and Advisory Partner at Clayton, Dubilier & Rice, LLC (private equity investment, 1998-2010), as well as a Director of Sony Corporation (2006-2007). In addition, Mr. Lautenbach also had a 30-year career with IBM (technology company) during which time he served as Senior Vice President and a member of the Corporate Executive Committee (1968-1998).
Joseph Mauriello (1944)
Year of Election or Appointment: 2008
Trustee
Mr. Mauriello also serves as Trustee of other Fidelity® funds. Prior to his retirement in January 2006, Mr. Mauriello served in numerous senior management positions including Deputy Chairman and Chief Operating Officer (2004-2005), and Vice Chairman of Financial Services (2002-2004) of KPMG LLP US (professional services, 1965-2005). Mr. Mauriello currently serves as a member of the Independent Directors Council (IDC) Governing Council (2015-present). Previously, Mr. Mauriello served as a member of the Board of Directors of XL Group plc. (global insurance and re-insurance, 2006-2018).
Cornelia M. Small (1944)
Year of Election or Appointment: 2005
Trustee
Ms. Small also serves as Trustee of other Fidelity® funds. Ms. Small is a member of the Board of Directors (2009-present) and Chair of the Investment Committee (2010-present) of the Teagle Foundation. Ms. Small also serves on the Investment Committee of the Berkshire Taconic Community Foundation (2008-present). Previously, Ms. Small served as Chairperson (2002-2008) and a member of the Investment Committee and Chairperson (2008-2012) and a member of the Board of Trustees of Smith College. In addition, Ms. Small served as Chief Investment Officer, Director of Global Equity Investments, and a member of the Board of Directors of Scudder, Stevens & Clark and Scudder Kemper Investments.
Garnett A. Smith (1947)
Year of Election or Appointment: 2018
Trustee
Mr. Smith also serves as Trustee of other Fidelity® funds. Prior to Mr. Smith's retirement, he served as Chairman and Chief Executive Officer of Inbrand Corp. (manufacturer of personal absorbent products, 1990-1997). He also served as President (1986-1990) of Inbrand Corp. Prior to his employment with Inbrand Corp., he was employed by a retail fabric chain and North Carolina National Bank. In addition, Mr. Smith served as a Member of the Advisory Board of certain Fidelity® funds (2012-2013) and as a board member of the Jackson Hole Land Trust (2009-2012).
David M. Thomas (1949)
Year of Election or Appointment: 2008
Trustee
Mr. Thomas also serves as Trustee of other Fidelity® funds. Mr. Thomas serves as Non-Executive Chairman of the Board of Directors of Fortune Brands Home and Security (home and security products, 2011-present) and as a member of the Board of Directors (2004-present) and Presiding Director (2013-present) of Interpublic Group of Companies, Inc. (marketing communication). Previously, Mr. Thomas served as Executive Chairman (2005-2006) and Chairman and Chief Executive Officer (2000-2005) of IMS Health, Inc. (pharmaceutical and healthcare information solutions), a Director of Fortune Brands, Inc. (consumer products, 2000-2011), and a member of the Board of Trustees of the University of Florida (2013-2018).
Michael E. Wiley (1950)
Year of Election or Appointment: 2018
Trustee
Mr. Wiley also serves as Trustee or Member of the Advisory Board of other Fidelity® funds. Mr. Wiley serves as a Director of High Point Resources (exploration and production, 2005-present). Previously, Mr. Wiley served as a Director of Andeavor Corporation (independent oil refiner and marketer, 2005-2018), a Director of Andeavor Logistics LP (natural resources logistics, 2015-2018), a Director of Post Oak Bank (privately-held bank, 2004-2018), a Director of Asia Pacific Exploration Consolidated (international oil and gas exploration and production, 2008-2013), a member of the Board of Trustees of the University of Tulsa (2000-2006; 2007-2010), a Senior Energy Advisor of Katzenbach Partners, LLC (consulting, 2006-2007), an Advisory Director of Riverstone Holdings (private investment), a Director of Spinnaker Exploration Company (exploration and production, 2001-2005) and Chairman, President, and CEO of Baker Hughes, Inc. (oilfield services, 2000-2004).
+ The information includes the Trustee's principal occupation during the last five years and other information relating to the experience, attributes, and skills relevant to the Trustee's qualifications to serve as a Trustee, which led to the conclusion that the Trustee should serve as a Trustee for the fund.
Advisory Board Members and Officers:
Correspondence intended for a Member of the Advisory Board (if any) may be sent to Fidelity Investments, P.O. Box 55235, Boston, Massachusetts 02205-5235. Correspondence intended for an officer or Peter S. Lynch may be sent to Fidelity Investments, 245 Summer Street, Boston, Massachusetts 02210. Officers appear below in alphabetical order.
Name, Year of Birth; Principal Occupation
Vicki L. Fuller (1957)
Year of Election or Appointment: 2018
Member of the Advisory Board
Ms. Fuller also serves as Member of the Advisory Board of other Fidelity® funds. Ms. Fuller serves as a member of the Board of Directors, Audit Committee, and Nominating and Governance Committee of The Williams Companies, Inc. (natural gas infrastructure, 2018-present). Previously, Ms. Fuller served as the Chief Investment Officer of the New York State Common Retirement Fund (2012-2018) and held a variety of positions at AllianceBernstein L.P. (global asset management, 1985-2012), including Managing Director (2006-2012) and Senior Vice President and Senior Portfolio Manager (2001-2006).
Peter S. Lynch (1944)
Year of Election or Appointment: 2003
Member of the Advisory Board
Mr. Lynch also serves as Member of the Advisory Board of other Fidelity® funds. Mr. Lynch is Vice Chairman and a Director of FMR (investment adviser firm) and FMR Co., Inc. (investment adviser firm). In addition, Mr. Lynch serves as a Trustee of Boston College and as the Chairman of the Inner-City Scholarship Fund. Previously, Mr. Lynch served on the Special Olympics International Board of Directors (1997-2006).
Carol B. Tomé (1957)
Year of Election or Appointment: 2018
Member of the Advisory Board
Ms. Tomé also serves as Member of the Advisory Board of other Fidelity® funds. Ms. Tomé is Chief Financial Officer (2001-present) and Executive Vice President of Corporate Services (2007-present) of The Home Depot, Inc. (home improvement retailer) and a Director (2003-present) and Chair of the Audit Committee (2004-present) of United Parcel Service, Inc. (package delivery and supply chain management). Previously, Ms. Tomé served as Trustee of certain Fidelity® funds (2017), Senior Vice President of Finance and Accounting/Treasurer (2000-2007) and Vice President and Treasurer (1995-2000) of The Home Depot, Inc. and Chair of the Board (2010-2012), Vice Chair of the Board (2009 and 2013), and a Director (2008-2013) of the Federal Reserve Bank of Atlanta. Ms. Tomé is also a director or trustee of many community and professional organizations.
Elizabeth Paige Baumann (1968)
Year of Election or Appointment: 2017
Anti-Money Laundering (AML) Officer
Ms. Baumann also serves as AML Officer of other funds. She is Chief AML Officer (2012-present) and Senior Vice President (2014-present) of FMR LLC (diversified financial services company) and is an employee of Fidelity Investments. Previously, Ms. Baumann served as AML Officer of the funds (2012-2016), and Vice President (2007-2014) and Deputy Anti-Money Laundering Officer (2007-2012) of FMR LLC.
Craig S. Brown (1977)
Year of Election or Appointment: 2019
Assistant Treasurer
Mr. Brown also serves as Assistant Treasurer of other funds. Mr. Brown is an employee of Fidelity Investments (2013-present).
John J. Burke III (1964)
Year of Election or Appointment: 2018
Chief Financial Officer
Mr. Burke also serves as Chief Financial Officer of other funds. Mr. Burke serves as Head of Investment Operations for Fidelity Fund and Investment Operations (2018-present) and is an employee of Fidelity Investments (1998-present). Previously Mr. Burke served as head of Asset Management Investment Operations (2012-2018).
William C. Coffey (1969)
Year of Election or Appointment: 2018
Secretary and Chief Legal Officer (CLO)
Mr. Coffey also serves as Secretary and CLO of other funds. Mr. Coffey serves as CLO, Secretary, and Senior Vice President of Fidelity Management & Research Company and FMR Co., Inc. (investment adviser firms, 2018-present); Secretary of Fidelity SelectCo, LLC and Fidelity Investments Money Management, Inc. (investment adviser firms, 2018-present); and CLO of Fidelity Management & Research (Hong Kong) Limited, FMR Investment Management (UK) Limited, and Fidelity Management & Research (Japan) Limited (investment adviser firms, 2018-present). He is Senior Vice President and Deputy General Counsel of FMR LLC (diversified financial services company, 2010-present), and is an employee of Fidelity Investments. Previously, Mr. Coffey served as Assistant Secretary of certain funds (2009-2018) and as Vice President and Associate General Counsel of FMR LLC (2005-2009).
Timothy M. Cohen (1969)
Year of Election or Appointment: 2018
Vice President
Mr. Cohen also serves as Vice President of other funds. Mr. Cohen serves as Co-Head of Global Equity Research (2016-present), a Director of Fidelity Management & Research (Japan) Limited (investment adviser firm, 2016-present), and is an employee of Fidelity Investments. Previously, Mr. Cohen served as Chief Investment Officer - Equity and a Director of Fidelity Management & Research (U.K.) Inc. (investment adviser firm, 2013-2015) and as a Director of Fidelity Management & Research (Hong Kong) Limited (investment adviser firm, 2017).
Jonathan Davis (1968)
Year of Election or Appointment: 2010
Assistant Treasurer
Mr. Davis also serves as Assistant Treasurer of other funds. Mr. Davis serves as Assistant Treasurer of FMR Capital, Inc. (2017-present) and is an employee of Fidelity Investments. Previously, Mr. Davis served as Vice President and Associate General Counsel of FMR LLC (diversified financial services company, 2003-2010).
Adrien E. Deberghes (1967)
Year of Election or Appointment: 2016
Assistant Treasurer
Mr. Deberghes also serves as an officer of other funds. He serves as Assistant Treasurer of FMR Capital, Inc. (2017-present), Executive Vice President of Fidelity Investments Money Management, Inc. (FIMM) (investment adviser firm, 2016-present), and is an employee of Fidelity Investments (2008-present). Previously, Mr. Deberghes served as President and Treasurer of certain Fidelity® funds (2013-2018). Prior to joining Fidelity Investments, Mr. Deberghes was Senior Vice President of Mutual Fund Administration at State Street Corporation (2007-2008), Senior Director of Mutual Fund Administration at Investors Bank & Trust (2005-2007), and Director of Finance for Dunkin' Brands (2000-2005). Previously, Mr. Deberghes served in other fund officer roles.
Laura M. Del Prato (1964)
Year of Election or Appointment: 2018
Assistant Treasurer
Ms. Del Prato also serves as an officer of other funds. Ms. Del Prato is an employee of Fidelity Investments (2017-present). Prior to joining Fidelity Investments, Ms. Del Prato served as a Managing Director and Treasurer of the JPMorgan Mutual Funds (2014-2017). Prior to JPMorgan, Ms. Del Prato served as a partner at Cohen Fund Audit Services (accounting firm, 2012-2013) and KPMG LLP (accounting firm, 2004-2012).
Colm A. Hogan (1973)
Year of Election or Appointment: 2016
Deputy Treasurer
Mr. Hogan also serves as an officer of other funds. Mr. Hogan serves as Assistant Treasurer of FMR Capital, Inc. (2017-present) and is an employee of Fidelity Investments (2005-present). Previously, Mr. Hogan served as Assistant Treasurer of certain Fidelity® funds (2016-2018).
Pamela R. Holding (1964)
Year of Election or Appointment: 2018
Vice President
Ms. Holding also serves as Vice President of other funds. Ms. Holding serves as Co-Head of Global Equity Research (2018-present) and is an employee of Fidelity Investments (2013-present).
Chris Maher (1972)
Year of Election or Appointment: 2013
Assistant Treasurer
Mr. Maher serves as Assistant Treasurer of other funds. Mr. Maher is Vice President of Valuation Oversight, serves as Assistant Treasurer of FMR Capital, Inc. (2017-present), and is an employee of Fidelity Investments. Previously, Mr. Maher served as Vice President of Asset Management Compliance (2013), Vice President of the Program Management Group of FMR (investment adviser firm, 2010-2013), and Vice President of Valuation Oversight (2008-2010).
Kenneth B. Robins (1969)
Year of Election or Appointment: 2016
Chief Compliance Officer
Mr. Robins also serves as an officer of other funds. Mr. Robins serves as Compliance Officer of Fidelity Management & Research Company and FMR Co., Inc. (investment adviser firms, 2016-present) and is an employee of Fidelity Investments (2004-present). Previously, Mr. Robins served as Executive Vice President of Fidelity Investments Money Management, Inc. (investment adviser firm, 2013-2016) and served in other fund officer roles.
Stacie M. Smith (1974)
Year of Election or Appointment: 2016
President and Treasurer
Ms. Smith also serves as an officer of other funds. Ms. Smith serves as Assistant Treasurer of FMR Capital, Inc. (2017-present), is an employee of Fidelity Investments (2009-present), and has served in other fund officer roles. Prior to joining Fidelity Investments, Ms. Smith served as Senior Audit Manager of Ernst & Young LLP (accounting firm, 1996-2009). Previously, Ms. Smith served as Assistant Treasurer (2013-2018) and Deputy Treasurer (2013-2016) of certain Fidelity® funds.
Marc L. Spector (1972)
Year of Election or Appointment: 2016
Assistant Treasurer
Mr. Spector also serves as an officer of other funds. Mr. Spector serves as Assistant Treasurer of FMR Capital, Inc. (2017-present) and is an employee of Fidelity Investments (2016-present). Prior to joining Fidelity Investments, Mr. Spector served as Director at the Siegfried Group (accounting firm, 2013-2016), and prior to Siegfried Group as audit senior manager at Deloitte & Touche (accounting firm, 2005-2013).
Jim Wegmann (1979)
Year of Election or Appointment: 2019
Assistant Treasurer
Mr. Wegmann also serves as Assistant Treasurer of other funds. Mr. Wegmann is an employee of Fidelity Investments (2011-present).
Shareholder Expense Example
As a shareholder of the Fund, you incur two types of costs: (1) transaction costs and (2) ongoing costs, including other Fund expenses. This Example is intended to help you understand your ongoing costs (in dollars) of investing in the Fund and to compare these costs with the ongoing costs of investing in other mutual funds.
The Example is based on an investment of $1,000 invested at the beginning of the period and held for the entire period (August 1, 2018 to January 31, 2019).
Actual Expenses
The first line of the accompanying table provides information about actual account values and actual expenses. You may use the information in this line, together with the amount you invested, to estimate the expenses that you paid over the period. Simply divide your account value by $1,000.00 (for example, an $8,600 account value divided by $1,000.00 = 8.6), then multiply the result by the number in the first line under the heading entitled "Expenses Paid During Period" to estimate the expenses you paid on your account during this period. In addition, the Fund, as a shareholder in the underlying Fidelity Central Funds, will indirectly bear its pro-rata share of the fees and expenses incurred by the underlying Fidelity Central Funds. These fees and expenses are not included in the Fund's annualized expense ratio used to calculate the expense estimate in the table below.
Hypothetical Example for Comparison Purposes
The second line of the accompanying table provides information about hypothetical account values and hypothetical expenses based on the Fund's actual expense ratio and an assumed rate of return of 5% per year before expenses, which is not the Fund's actual return. The hypothetical account values and expenses may not be used to estimate the actual ending account balance or expenses you paid for the period. You may use this information to compare the ongoing costs of investing in the Fund and other funds. To do so, compare this 5% hypothetical example with the 5% hypothetical examples that appear in the shareholder reports of the other funds. In addition, the Fund, as a shareholder in the underlying Fidelity Central Funds, will indirectly bear its pro-rata share of the fees and expenses incurred by the underlying Fidelity Central Funds. These fees and expenses are not included in the Fund's annualized expense ratio used to calculate the expense estimate in the table below.
Please note that the expenses shown in the table are meant to highlight your ongoing costs only and do not reflect any transaction costs. Therefore, the second line of the table is useful in comparing ongoing costs only, and will not help you determine the relative total costs of owning different funds.
| Annualized Expense Ratio-A | Beginning Account Value August 1, 2018 | Ending Account Value January 31, 2019 | Expenses Paid During Period-B August 1, 2018 to January 31, 2019 | |
| Actual | - %-C | $1,000.00 | $967.00 | $--D |
| Hypothetical-E | $1,000.00 | $1,025.21 | $--D |
A Annualized expense ratio reflects expenses net of applicable fee waivers.
B Expenses are equal to the Fund's annualized expense ratio, multiplied by the average account value over the period, multiplied by 184/365 (to reflect the one-half year period).
C Amount represents less than .005%.
D Amount represents less than $.005.
E 5% return per year before expenses
Distributions (Unaudited)
The fund hereby designates as a capital gain dividend with respect to the taxable year ended January 31, 2019, $65,468, or, if subsequently determined to be different, the net capital gain of such year.
The fund designates 85% and 78% of the dividends distributed in March and December, respectively during the fiscal year as qualifying for the dividends–received deduction for corporate shareholders.
The fund designates 88% of the dividends distributed in March and December during the fiscal year as amounts which may be taken into account as a dividend for the purposes of the maximum rate under section 1(h)(11) of the Internal Revenue Code.
The fund will notify shareholders in January 2020 of amounts for use in preparing 2019 income tax returns.
Board Approval of Investment Advisory Contracts and Management Fees
Fidelity Flex Large Cap Value Fund
Each year, the Board of Trustees, including the Independent Trustees (together, the Board), votes on the renewal of the management contract with Fidelity Management & Research Company (FMR) and the sub-advisory agreements (together, the Advisory Contracts) for the fund. FMR and the sub-advisers are referred to herein as the Investment Advisers. The Board, assisted by the advice of fund counsel and Independent Trustees' counsel, requests and considers a broad range of information relevant to the renewal of the Advisory Contracts throughout the year.
The Board meets regularly and, at each of its meetings, covers an extensive agenda of topics and materials and considers factors that are relevant to its annual consideration of the renewal of the fund's Advisory Contracts, including the services and support provided to the fund and its shareholders. The Board has established various standing committees (Committees), each composed of and chaired by Independent Trustees with varying backgrounds, to which the Board has assigned specific subject matter responsibilities in order to enhance effective decision-making by the Board. The Board, acting directly and through its Committees, requests and receives information concerning the annual consideration of the renewal of the fund's Advisory Contracts. The Board also meets as needed to review matters specifically related to the Board's annual consideration of the renewal of the Advisory Contracts. Members of the Board may also meet with trustees of other Fidelity funds through joint ad hoc committees to discuss certain matters relevant to all of the Fidelity funds.
At its January 2019 meeting, the Board unanimously determined to renew the fund's Advisory Contracts. In considering whether to renew the Advisory Contracts for the fund, the Board considered all factors it believed relevant and reached a determination, with the assistance of fund counsel and Independent Trustees' counsel and through the exercise of its business judgment, that the renewal of the Advisory Contracts was in the best interests of the fund and its shareholders and the fact that no fee is payable under the management contract was fair and reasonable.
Nature, Extent, and Quality of Services Provided. The Board considered Fidelity's staffing as it relates to the fund, including the backgrounds of investment personnel of Fidelity, and also considered the fund's investment objective, strategies, and related investment philosophy. The Independent Trustees also had discussions with senior management of Fidelity's investment operations and investment groups. The Board considered the structure of the investment personnel compensation program and whether this structure provides appropriate incentives to act in the best interests of the fund. Additionally, the Board considered the portfolio managers' investments, if any, in the funds that they manage.
Resources Dedicated to Investment Management and Support Services. The Board and the Fund Oversight and Research Committees reviewed the general qualifications and capabilities of Fidelity's investment staff, including its size, education, experience, and resources, as well as Fidelity's approach to recruiting, training, managing, and compensating investment personnel. The Board noted that Fidelity has continued to increase the resources devoted to non-U.S. offices, including expansion of Fidelity's global investment organization. The Board also noted that Fidelity's analysts have extensive resources, tools and capabilities that allow them to conduct sophisticated quantitative and fundamental analysis, as well as credit analysis of issuers, counterparties and guarantors. Further, the Board considered that Fidelity's investment professionals have sufficient access to global information and data so as to provide competitive investment results over time, and that those professionals also have access to sophisticated tools that permit them to assess portfolio construction and risk and performance attribution characteristics continuously, as well as to transmit new information and research conclusions rapidly around the world. Additionally, in its deliberations, the Board considered Fidelity's trading, risk management, compliance, and technology and operations capabilities and resources, which are integral parts of the investment management process.
Shareholder and Administrative Services. The Board considered (i) the nature, extent, quality, and cost of advisory, administrative, and shareholder services performed by the Investment Advisers and their affiliates under the Advisory Contracts and under separate agreements covering transfer agency, pricing and bookkeeping, and securities lending services for the fund; (ii) the nature and extent of the supervision of third party service providers, principally custodians, subcustodians, and pricing vendors; and (iii) the resources devoted to, and the record of compliance with, the fund's compliance policies and procedures. The Board also reviewed the allocation of fund brokerage, including allocations to brokers affiliated with the Investment Advisers, the use of brokerage commissions to pay fund expenses, and the use of "soft" commission dollars to pay for research services.
The Board noted that the growth of fund assets over time across the complex allows Fidelity to reinvest in the development of services designed to enhance the value and convenience of the Fidelity funds as investment vehicles. These services include 24-hour access to account information and market information through telephone representatives and over the Internet, investor education materials and asset allocation tools, and the expanded availability of Fidelity Investor Centers.
Investment in a Large Fund Family. The Board considered the benefits to shareholders of investing in a Fidelity fund, including the benefits of investing in a fund that is part of a large family of funds offering a variety of investment disciplines and providing a large variety of mutual fund investor services. The Board noted that Fidelity had taken, or had made recommendations that resulted in the Fidelity funds taking, a number of actions over the previous year that benefited particular funds, including: (i) continuing to dedicate additional resources to Fidelity's investment research process, which includes meetings with management of issuers of securities in which the funds invest, and to the support of the senior management team that oversees asset management; (ii) continuing efforts to enhance Fidelity's global research capabilities; (iii) launching new funds and making other enhancements to meet client needs; (iv) launching new share classes of existing funds; (v) eliminating purchase minimums and broadening eligibility requirements for certain funds and share classes; (vi) reducing management fees and total expenses for certain growth equity funds and index funds; (vii) lowering expense caps for certain existing funds and classes, and converting certain voluntary expense caps to contractual caps, to reduce expenses borne by shareholders; (viii) eliminating short-term redemption fees for funds that had such fees; (ix) rationalizing product lines and gaining increased efficiencies from fund mergers and share class consolidations; (x) continuing to develop, acquire and implement systems and technology to improve services to the funds and shareholders, strengthen information security, and increase efficiency; and (xi) continuing to implement enhancements to further strengthen Fidelity's product line to increase investors' probability of success in achieving their investment goals, including retirement income goals.
Investment Performance. The Board considered whether the fund has operated in accordance with its investment objective, as well as its record of compliance with its investment restrictions. As the fund recently commenced operations, the Board did not believe that it was appropriate to assign significant weight to its limited investment performance.
Based on its review, the Board concluded that the nature, extent, and quality of services provided to the fund under the Advisory Contracts should continue to benefit the shareholders of the fund.
Competitiveness of Management Fee and Total Expense Ratio. The Board noted that the fund is available exclusively to certain Fidelity fee-based programs. The Board considered that the fund does not pay FMR a management fee for investment advisory services, but that FMR is indirectly compensated for its services out of the program fees. The Board also noted that FMR or an affiliate undertakes to pay all operating expenses of the fund with limited exceptions.In connection with the renewal of the Advisory Contracts, the Board also approved amendments to the management contract for the fund to clarify that the fund pays its non-operating expenses, including brokerage commissions and fees and expenses associated with the fund's securities lending program. The Board considered that the amendments would not change the services provided to the fund or the party responsible for making such payments under the current management contract.Based on its review, the Board considered that the fund does not pay a management fee and concluded that the total expense ratio of the fund was reasonable in light of the services that the fund and its shareholders receive and the other factors considered.Costs of the Services and Profitability. The Board considered the level of Fidelity's profits in respect of all the Fidelity funds.PricewaterhouseCoopers LLP (PwC), auditor to Fidelity and certain Fidelity funds, has been engaged annually by the Board as part of the Board's assessment of Fidelity's profitability analysis. PwC's engagement includes the review and assessment of the methodologies used by Fidelity in determining the revenues and expenses attributable to Fidelity's mutual fund business, and completion of agreed-upon procedures in respect of the mathematical accuracy of the fund profitability information and its conformity to established allocation methodologies. After considering PwC's reports issued under the engagement and information provided by Fidelity, the Board concluded that while other allocation methods may also be reasonable, Fidelity's profitability methodologies are reasonable in all material respects.The Board also reviewed Fidelity's non-fund businesses and potential indirect benefits such businesses may have received as a result of their association with Fidelity's mutual fund business (i.e., fall-out benefits) as well as cases where Fidelity's affiliates may benefit from the fund's business. The Board noted that changes to fall-out benefits year-over-year reflect business developments at Fidelity's various businesses.The Board concluded that the costs of the services provided by and the profits realized by Fidelity in connection with the operation of the fund were not relevant to the renewal of the Advisory Contracts because the fund pays no advisory fees and FMR or an affiliate bears all expenses of the fund with limited exceptions.Economies of Scale. The Board concluded that because the fund pays no advisory fees and FMR bears all expenses of the fund with limited exceptions, the realization of economies of scale was not a material factor in the Board's decision to renew the fund's Advisory Contract.Additional Information Requested by the Board. In order to develop fully the factual basis for consideration of the Fidelity funds' advisory contracts, the Board requested and received additional information on certain topics, including: (i) fund performance trends, in particular the underperformance of certain funds, and Fidelity's long-term strategies for certain funds; (ii) Fidelity's fund profitability methodology, profitability trends for certain funds, and the impact of certain factors on fund profitability results; (iii) metrics for evaluating index fund and ETF performance and information about ETF trading characteristics; (iv) the methodology with respect to the evaluation of competitive fund data and peer group classifications and fee comparisons; (v) the expense structures for different funds and classes; (vi) information regarding other accounts managed by Fidelity, including collective investment trusts; and (vii) Fidelity's philosophies and strategies for evaluating funds and classes with lower or declining asset levels.Based on its evaluation of all of the conclusions noted above, and after considering all factors it believed relevant, the Board concluded that the advisory fee arrangements are fair and reasonable, and that the fund's Advisory Contracts should be renewed.![]()
ZXU-ANN-0319
1.9881563.101
Fidelity® Mid Cap Value K6 Fund Annual Report January 31, 2019 |
|
Beginning on January 1, 2021, as permitted by regulations adopted by the Securities and Exchange Commission, paper copies of a fund’s shareholder reports will no longer be sent by mail, unless you specifically request paper copies of the reports from the fund or from your financial intermediary, such as a financial advisor, broker-dealer or bank. Instead, the reports will be made available on a website, and you will be notified by mail each time a report is posted and provided with a website link to access the report.
If you already elected to receive shareholder reports electronically, you will not be affected by this change and you need not take any action. You may elect to receive shareholder reports and other communications from a fund electronically, by contacting your financial intermediary. For Fidelity customers, visit Fidelity's web site or call Fidelity using the contact information listed below.
You may elect to receive all future reports in paper free of charge. If you wish to continue receiving paper copies of your shareholder reports, you may contact your financial intermediary or, if you are a Fidelity customer, visit Fidelity’s website, or call Fidelity at the applicable toll-free number listed below. Your election to receive reports in paper will apply to all funds held with the fund complex/your financial intermediary.
| Account Type | Website | Phone Number |
| Brokerage, Mutual Fund, or Annuity Contracts: | fidelity.com/mailpreferences | 1-800-343-3548 |
| Employer Provided Retirement Accounts: | netbenefits.fidelity.com/preferences (choose 'no' under Required Disclosures to continue to print) | 1-800-343-0860 |
| Advisor Sold Accounts Serviced Through Your Financial Intermediary: | Contact Your Financial Intermediary | Your Financial Intermediary's phone number |
| Advisor Sold Accounts Serviced by Fidelity: | institutional.fidelity.com | 1-877-208-0098 |
Contents
Board Approval of Investment Advisory Contracts and Management Fees |
To view a fund's proxy voting guidelines and proxy voting record for the 12-month period ended June 30, visit http://www.fidelity.com/proxyvotingresults or visit the Securities and Exchange Commission's (SEC) web site at http://www.sec.gov.
You may also call 1-800-835-5092 to request a free copy of the proxy voting guidelines.
Standard & Poor's, S&P and S&P 500 are registered service marks of The McGraw-Hill Companies, Inc. and have been licensed for use by Fidelity Distributors Corporation.
Other third-party marks appearing herein are the property of their respective owners.
All other marks appearing herein are registered or unregistered trademarks or service marks of FMR LLC or an affiliated company. © 2019 FMR LLC. All rights reserved.
This report and the financial statements contained herein are submitted for the general information of the shareholders of the Fund. This report is not authorized for distribution to prospective investors in the Fund unless preceded or accompanied by an effective prospectus.
A fund files its complete schedule of portfolio holdings with the SEC for the first and third quarters of each fiscal year on Form N-Q. Forms N-Q are available on the SEC’s web site at http://www.sec.gov. A fund's Forms N-Q may be reviewed and copied at the SEC’s Public Reference Room in Washington, DC. Information regarding the operation of the SEC's Public Reference Room may be obtained by calling 1-800-SEC-0330.
For a complete list of a fund's portfolio holdings, view the most recent holdings listing, semiannual report, or annual report on Fidelity's web site at http://www.fidelity.com, http://www.institutional.fidelity.com, or http://www.401k.com, as applicable.
NOT FDIC INSURED •MAY LOSE VALUE •NO BANK GUARANTEE
Neither the Fund nor Fidelity Distributors Corporation is a bank.
Performance: The Bottom Line
Average annual total return reflects the change in the value of an investment, assuming reinvestment of distributions from dividend income and capital gains (the profits earned upon the sale of securities that have grown in value, if any) and assuming a constant rate of performance each year. The hypothetical investment and the average annual total returns do not reflect the deduction of taxes that a shareholder would pay on fund distributions or the redemption of fund shares. During periods of reimbursement by Fidelity, a fund’s total return will be greater than it would be had the reimbursement not occurred. How a fund did yesterday is no guarantee of how it will do tomorrow.
Average Annual Total Returns
| For the periods ended January 31, 2019 | Past 1 year | Life of fundA |
| Fidelity® Mid Cap Value K6 Fund | (10.82)% | 1.18% |
A From May 25, 2017
$10,000 Over Life of Fund
Let's say hypothetically that $10,000 was invested in Fidelity® Mid Cap Value K6 Fund on May 25, 2017, when the fund started.
The chart shows how the value of your investment would have changed, and also shows how the Russell Midcap® Value Index performed over the same period.
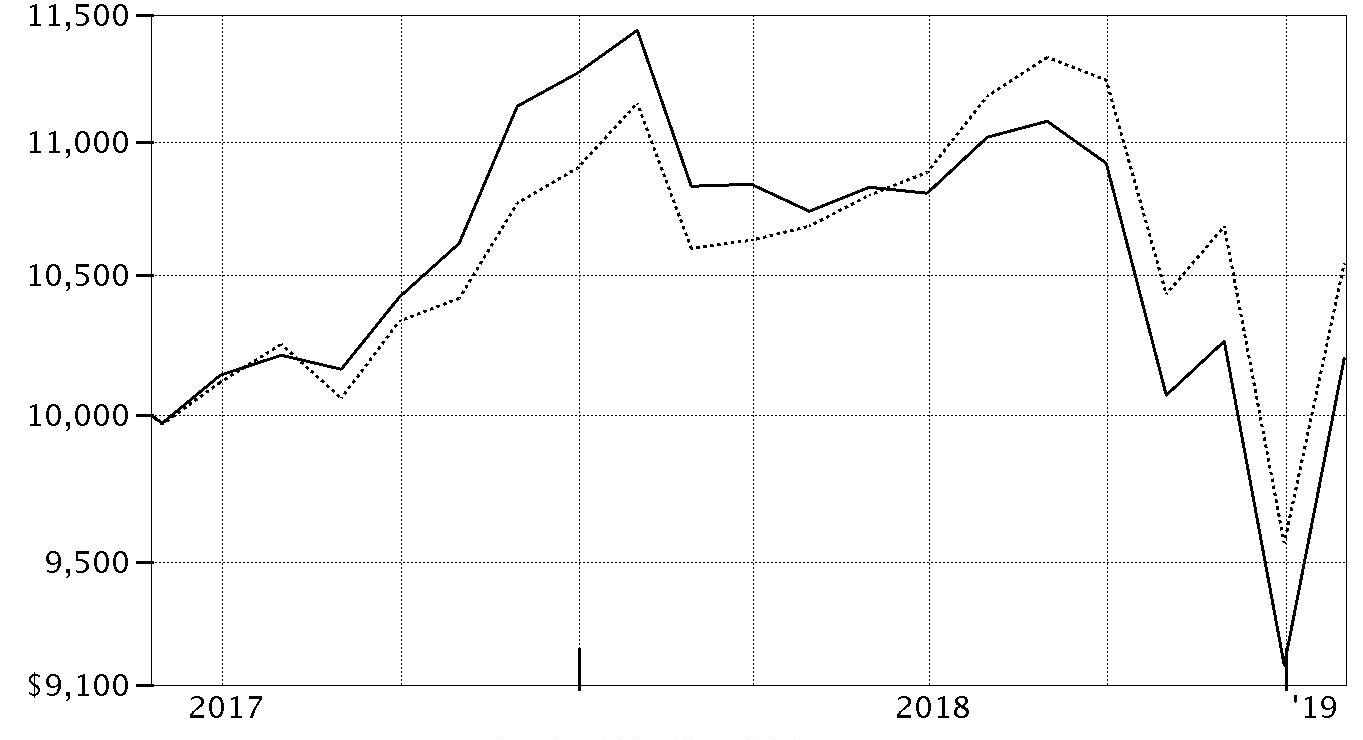
| Period Ending Values | ||
| $10,200 | Fidelity® Mid Cap Value K6 Fund | |
| $10,545 | Russell Midcap® Value Index | |
Management's Discussion of Fund Performance
Market Recap: The S&P 500® index returned -2.31% for the 12 months ending January 31, 2019, as the U.S. equity bellwether began the new year on a high note after enduring a final quarter of 2018 in which resurgent volatility upset the aging bull market. In October, rising U.S. Treasury yields and concern about peaking corporate earnings growth sent many investors fleeing from risk assets as they were still dealing with lingering uncertainty related to global trade and the U.S. Federal Reserve picking up the pace of interest rate hikes. The index returned -6.84% in October, at the time its largest monthly drop in seven years. But conditions worsened through Christmas, as jitters about the economy and another hike in rates led to a spike in market volatility and a -9.03% result for December. Sharply reversing course to begin 2019, the S&P 500® gained 8.01% in January, its strongest opening month since 1987, amid upbeat company earnings/outlooks and signs the Fed may pause on rates. For the full period, some economically sensitive sectors were at the bottom of the 12-month performance scale: materials (-14%), energy (-12%), financials (-11%) and industrials (-8%). Meanwhile, communication services – which includes dividend-rich telecom stocks – and consumer staples returned about -5%. In contrast, the defensive utilities (+11%), real estate (+10%) and health care (+5%) sectors led the way. Information technology and consumer discretionary were rattled in the late-2018 downturn, but earlier strength resulted in each advancing about 3%.Comments from Portfolio Manager Kevin Walenta: For the fiscal year, the fund returned -10.82%, notably trailing the -5.43% result of the benchmark Russell Midcap® Value Index. The fund had more of a value bias than the benchmark, which meant the stocks it owned were generally cheaper than the benchmark average. This hurt relative performance in a period where value was out of favor. We had particularly disappointing stock picks within the financials, real estate and information technology sectors. Among the biggest individual detractors were overweight stakes in asset management company Invesco (-47%), which was pressured by increased price competition and the late-2018 stock market decline, as well as real estate services company Realogy Holdings (-35%), which underperformed amid weaker housing market data. Conversely, security selection in the energy and utilities sectors aided the fund’s relative performance. Specifically within energy, our bias toward refiners was a plus, as declining oil prices helped the group. The portfolio’s top individual contributor was Ameren, an electric utility and the fund’s biggest position at period-end. Its shares gained 26% for the year, benefiting from an improved regulatory environment in Missouri that fueled expectations for more capital deployment in the state and stronger future revenue and earnings growth.The views expressed above reflect those of the portfolio manager(s) only through the end of the period as stated on the cover of this report and do not necessarily represent the views of Fidelity or any other person in the Fidelity organization. Any such views are subject to change at any time based upon market or other conditions and Fidelity disclaims any responsibility to update such views. These views may not be relied on as investment advice and, because investment decisions for a Fidelity fund are based on numerous factors, may not be relied on as an indication of trading intent on behalf of any Fidelity fund.
Investment Summary (Unaudited)
Top Ten Stocks as of January 31, 2019
| % of fund's net assets | |
| Ameren Corp. | 2.5 |
| CBRE Group, Inc. | 2.4 |
| M&T Bank Corp. | 2.2 |
| Lear Corp. | 2.0 |
| Universal Health Services, Inc. Class B | 2.0 |
| Ingersoll-Rand PLC | 2.0 |
| Synchrony Financial | 1.9 |
| AMETEK, Inc. | 1.9 |
| HollyFrontier Corp. | 1.8 |
| VEREIT, Inc. | 1.8 |
| 20.5 |
Top Five Market Sectors as of January 31, 2019
| % of fund's net assets | |
| Financials | 17.7 |
| Real Estate | 14.1 |
| Industrials | 13.1 |
| Utilities | 11.3 |
| Consumer Discretionary | 8.5 |
Asset Allocation (% of fund's net assets)
| As of January 31, 2019 * | ||
| Stocks | 98.1% | |
| Short-Term Investments and Net Other Assets (Liabilities) | 1.9% | |

* Foreign investments - 6.9%
Schedule of Investments January 31, 2019
Showing Percentage of Net Assets
| Common Stocks - 98.1% | |||
| Shares | Value | ||
| COMMUNICATION SERVICES - 1.7% | |||
| Media - 1.7% | |||
| Omnicom Group, Inc. | 10,879 | $847,257 | |
| CONSUMER DISCRETIONARY - 8.5% | |||
| Auto Components - 3.0% | |||
| BorgWarner, Inc. | 6,673 | 272,926 | |
| Gentex Corp. | 8,350 | 176,853 | |
| Lear Corp. | 6,537 | 1,006,240 | |
| 1,456,019 | |||
| Household Durables - 1.6% | |||
| NVR, Inc. (a) | 60 | 159,600 | |
| Toll Brothers, Inc. | 16,306 | 602,344 | |
| 761,944 | |||
| Specialty Retail - 3.9% | |||
| Best Buy Co., Inc. | 12,991 | 769,587 | |
| Dick's Sporting Goods, Inc. | 10,631 | 375,381 | |
| Williams-Sonoma, Inc. (b) | 14,018 | 763,000 | |
| 1,907,968 | |||
| TOTAL CONSUMER DISCRETIONARY | 4,125,931 | ||
| CONSUMER STAPLES - 5.5% | |||
| Beverages - 1.1% | |||
| Molson Coors Brewing Co. Class B | 7,632 | 508,368 | |
| Food Products - 4.4% | |||
| Ingredion, Inc. | 6,475 | 641,025 | |
| The J.M. Smucker Co. | 6,437 | 675,113 | |
| Tyson Foods, Inc. Class A | 13,577 | 840,688 | |
| 2,156,826 | |||
| TOTAL CONSUMER STAPLES | 2,665,194 | ||
| ENERGY - 5.7% | |||
| Energy Equipment & Services - 0.5% | |||
| RPC, Inc. (b) | 21,086 | 227,518 | |
| Oil, Gas & Consumable Fuels - 5.2% | |||
| Cimarex Energy Co. | 10,596 | 798,303 | |
| HollyFrontier Corp. | 15,624 | 880,256 | |
| Murphy Oil Corp. | 6,268 | 171,430 | |
| PBF Energy, Inc. Class A | 18,310 | 670,512 | |
| Peabody Energy Corp. | 1,300 | 46,410 | |
| 2,566,911 | |||
| TOTAL ENERGY | 2,794,429 | ||
| FINANCIALS - 17.7% | |||
| Banks - 3.9% | |||
| Huntington Bancshares, Inc. | 18,300 | 242,292 | |
| M&T Bank Corp. | 6,712 | 1,104,392 | |
| PacWest Bancorp | 7,088 | 273,526 | |
| Umpqua Holdings Corp. | 16,472 | 291,225 | |
| 1,911,435 | |||
| Capital Markets - 4.3% | |||
| Affiliated Managers Group, Inc. | 3,067 | 321,882 | |
| Franklin Resources, Inc. | 6,600 | 195,426 | |
| Invesco Ltd. | 27,659 | 503,947 | |
| Lazard Ltd. Class A | 15,395 | 612,567 | |
| Legg Mason, Inc. | 16,283 | 485,233 | |
| 2,119,055 | |||
| Consumer Finance - 3.6% | |||
| Discover Financial Services | 12,323 | 831,679 | |
| Synchrony Financial | 31,145 | 935,596 | |
| 1,767,275 | |||
| Insurance - 5.6% | |||
| Allstate Corp. | 1,100 | 96,657 | |
| American Financial Group, Inc. | 2,400 | 228,936 | |
| American National Insurance Co. | 3,084 | 429,262 | |
| Everest Re Group Ltd. | 800 | 175,240 | |
| First American Financial Corp. | 16,596 | 831,128 | |
| Hartford Financial Services Group, Inc. | 10,697 | 501,903 | |
| Torchmark Corp. | 5,415 | 453,560 | |
| 2,716,686 | |||
| Mortgage Real Estate Investment Trusts - 0.3% | |||
| Chimera Investment Corp. | 7,600 | 144,628 | |
| TOTAL FINANCIALS | 8,659,079 | ||
| HEALTH CARE - 5.4% | |||
| Biotechnology - 0.9% | |||
| United Therapeutics Corp. (a) | 3,995 | 460,743 | |
| Health Care Providers & Services - 3.6% | |||
| Laboratory Corp. of America Holdings (a) | 5,578 | 777,294 | |
| Universal Health Services, Inc. Class B | 7,474 | 990,529 | |
| 1,767,823 | |||
| Pharmaceuticals - 0.9% | |||
| Jazz Pharmaceuticals PLC (a) | 3,310 | 416,696 | |
| TOTAL HEALTH CARE | 2,645,262 | ||
| INDUSTRIALS - 13.1% | |||
| Air Freight & Logistics - 0.2% | |||
| C.H. Robinson Worldwide, Inc. | 1,100 | 95,447 | |
| Airlines - 0.2% | |||
| Southwest Airlines Co. | 1,700 | 96,492 | |
| Building Products - 0.4% | |||
| Masco Corp. | 6,608 | 214,165 | |
| Commercial Services & Supplies - 0.7% | |||
| Deluxe Corp. | 6,674 | 313,478 | |
| Electrical Equipment - 3.3% | |||
| Acuity Brands, Inc. | 4,149 | 501,656 | |
| AMETEK, Inc. | 12,567 | 916,134 | |
| Regal Beloit Corp. | 2,500 | 191,900 | |
| 1,609,690 | |||
| Machinery - 7.2% | |||
| Allison Transmission Holdings, Inc. | 3,300 | 160,611 | |
| Crane Co. | 1,335 | 110,485 | |
| Cummins, Inc. | 5,507 | 810,135 | |
| Ingersoll-Rand PLC | 9,888 | 989,196 | |
| Oshkosh Corp. | 3,559 | 267,103 | |
| Parker Hannifin Corp. | 3,003 | 494,924 | |
| Snap-On, Inc. | 4,227 | 701,640 | |
| 3,534,094 | |||
| Professional Services - 0.4% | |||
| Manpower, Inc. | 2,419 | 191,174 | |
| Trading Companies & Distributors - 0.7% | |||
| MSC Industrial Direct Co., Inc. Class A | 4,189 | 349,740 | |
| TOTAL INDUSTRIALS | 6,404,280 | ||
| INFORMATION TECHNOLOGY - 8.2% | |||
| Communications Equipment - 1.1% | |||
| F5 Networks, Inc. (a) | 3,436 | 553,024 | |
| IT Services - 5.0% | |||
| Amdocs Ltd. | 12,161 | 679,557 | |
| Cognizant Technology Solutions Corp. Class A | 1,800 | 125,424 | |
| DXC Technology Co. | 13,121 | 841,319 | |
| Leidos Holdings, Inc. | 11,282 | 654,356 | |
| Maximus, Inc. | 1,700 | 119,221 | |
| 2,419,877 | |||
| Semiconductors & Semiconductor Equipment - 0.9% | |||
| Skyworks Solutions, Inc. | 6,108 | 446,128 | |
| Technology Hardware, Storage & Peripherals - 1.2% | |||
| Western Digital Corp. | 13,533 | 608,850 | |
| TOTAL INFORMATION TECHNOLOGY | 4,027,879 | ||
| MATERIALS - 6.9% | |||
| Chemicals - 4.7% | |||
| Huntsman Corp. | 39,599 | 869,990 | |
| Innospec, Inc. | 7,098 | 498,776 | |
| Olin Corp. | 7,301 | 172,377 | |
| Westlake Chemical Corp. | 10,044 | 742,252 | |
| 2,283,395 | |||
| Containers & Packaging - 0.7% | |||
| Packaging Corp. of America | 1,000 | 94,320 | |
| Sonoco Products Co. | 4,277 | 246,270 | |
| 340,590 | |||
| Metals & Mining - 1.4% | |||
| Nucor Corp. | 7,121 | 436,090 | |
| Steel Dynamics, Inc. | 6,797 | 248,702 | |
| 684,792 | |||
| Paper & Forest Products - 0.1% | |||
| Louisiana-Pacific Corp. | 3,000 | 73,140 | |
| TOTAL MATERIALS | 3,381,917 | ||
| REAL ESTATE - 14.1% | |||
| Equity Real Estate Investment Trusts (REITs) - 8.7% | |||
| Apple Hospitality (REIT), Inc. | 40,953 | 672,039 | |
| Brixmor Property Group, Inc. | 24,469 | 419,154 | |
| Gaming & Leisure Properties | 17,972 | 673,950 | |
| Hospitality Properties Trust (SBI) | 16,306 | 434,718 | |
| Park Hotels & Resorts, Inc. | 27,410 | 824,219 | |
| Public Storage | 1,716 | 364,684 | |
| VEREIT, Inc. | 108,797 | 879,080 | |
| 4,267,844 | |||
| Real Estate Management & Development - 5.4% | |||
| CBRE Group, Inc. (a) | 25,184 | 1,152,168 | |
| Jones Lang LaSalle, Inc. | 5,595 | 802,379 | |
| Realogy Holdings Corp. (b) | 38,550 | 684,263 | |
| 2,638,810 | |||
| TOTAL REAL ESTATE | 6,906,654 | ||
| UTILITIES - 11.3% | |||
| Electric Utilities - 2.0% | |||
| OGE Energy Corp. | 19,802 | 810,892 | |
| Otter Tail Corp. | 800 | 38,760 | |
| Portland General Electric Co. | 2,648 | 127,951 | |
| 977,603 | |||
| Gas Utilities - 1.1% | |||
| National Fuel Gas Co. | 3,001 | 171,957 | |
| UGI Corp. | 6,908 | 393,963 | |
| 565,920 | |||
| Independent Power and Renewable Electricity Producers - 1.4% | |||
| NRG Energy, Inc. | 16,787 | 686,756 | |
| Multi-Utilities - 6.8% | |||
| Ameren Corp. | 17,331 | 1,201,727 | |
| Avangrid, Inc. | 1,400 | 69,818 | |
| CenterPoint Energy, Inc. | 19,371 | 598,951 | |
| MDU Resources Group, Inc. | 28,303 | 727,670 | |
| WEC Energy Group, Inc. | 9,788 | 714,818 | |
| 3,312,984 | |||
| TOTAL UTILITIES | 5,543,263 | ||
| TOTAL COMMON STOCKS | |||
| (Cost $49,703,893) | 48,001,145 | ||
| Money Market Funds - 6.0% | |||
| Fidelity Cash Central Fund, 2.43% (c) | 895,434 | 895,613 | |
| Fidelity Securities Lending Cash Central Fund 2.43% (c)(d) | 2,008,767 | 2,008,968 | |
| TOTAL MONEY MARKET FUNDS | |||
| (Cost $2,904,581) | 2,904,581 | ||
| TOTAL INVESTMENT IN SECURITIES - 104.1% | |||
| (Cost $52,608,474) | 50,905,726 | ||
| NET OTHER ASSETS (LIABILITIES) - (4.1)% | (1,981,607) | ||
| NET ASSETS - 100% | $48,924,119 |
Legend
(a) Non-income producing
(b) Security or a portion of the security is on loan at period end.
(c) Affiliated fund that is generally available only to investment companies and other accounts managed by Fidelity Investments. The rate quoted is the annualized seven-day yield of the fund at period end. A complete unaudited listing of the fund's holdings as of its most recent quarter end is available upon request. In addition, each Fidelity Central Fund's financial statements, which are not covered by the Fund's Report of Independent Registered Public Accounting Firm, are available on the SEC's website or upon request.
(d) Investment made with cash collateral received from securities on loan.
Affiliated Central Funds
Information regarding fiscal year to date income earned by the Fund from investments in Fidelity Central Funds is as follows:
| Fund | Income earned |
| Fidelity Cash Central Fund | $24,201 |
| Fidelity Securities Lending Cash Central Fund | 6,447 |
| Total | $30,648 |
Amounts in the income column in the above table include any capital gain distributions from underlying funds, which are presented in the corresponding line-item in the Statement of Operations, if applicable.
Investment Valuation
All investments are categorized as Level 1 under the Fair Value Hierarchy. The inputs or methodology used for valuing securities may not be an indication of the risk associated with investing in those securities. For more information on valuation inputs please refer to the Investment Valuation section in the accompanying Notes to Financial Statements.
See accompanying notes which are an integral part of the financial statements.
Financial Statements
Statement of Assets and Liabilities
| January 31, 2019 | ||
| Assets | ||
| Investment in securities, at value (including securities loaned of $1,994,606) — See accompanying schedule: Unaffiliated issuers (cost $49,703,893) | $48,001,145 | |
| Fidelity Central Funds (cost $2,904,581) | 2,904,581 | |
| Total Investment in Securities (cost $52,608,474) | $50,905,726 | |
| Receivable for investments sold | 621,886 | |
| Receivable for fund shares sold | 149,236 | |
| Dividends receivable | 17,821 | |
| Distributions receivable from Fidelity Central Funds | 2,288 | |
| Other receivables | 1,486 | |
| Total assets | 51,698,443 | |
| Liabilities | ||
| Payable for investments purchased | $611,311 | |
| Payable for fund shares redeemed | 134,097 | |
| Accrued management fee | 20,001 | |
| Collateral on securities loaned | 2,008,915 | |
| Total liabilities | 2,774,324 | |
| Net Assets | $48,924,119 | |
| Net Assets consist of: | ||
| Paid in capital | $55,457,053 | |
| Total distributable earnings (loss) | (6,532,934) | |
| Net Assets, for 4,968,964 shares outstanding | $48,924,119 | |
| Net Asset Value, offering price and redemption price per share ($48,924,119 ÷ 4,968,964 shares) | $9.85 |
See accompanying notes which are an integral part of the financial statements.
Statement of Operations
| Year ended January 31, 2019 | ||
| Investment Income | ||
| Dividends | $1,704,743 | |
| Income from Fidelity Central Funds | 30,648 | |
| Total income | 1,735,391 | |
| Expenses | ||
| Management fee | $313,684 | |
| Independent trustees' fees and expenses | 386 | |
| Commitment fees | 156 | |
| Total expenses before reductions | 314,226 | |
| Expense reductions | (8,793) | |
| Total expenses after reductions | 305,433 | |
| Net investment income (loss) | 1,429,958 | |
| Realized and Unrealized Gain (Loss) | ||
| Net realized gain (loss) on: | ||
| Investment securities: | ||
| Unaffiliated issuers | (4,723,138) | |
| Fidelity Central Funds | 155 | |
| Total net realized gain (loss) | (4,722,983) | |
| Change in net unrealized appreciation (depreciation) on investment securities | (5,421,187) | |
| Net gain (loss) | (10,144,170) | |
| Net increase (decrease) in net assets resulting from operations | $(8,714,212) |
See accompanying notes which are an integral part of the financial statements.
Statement of Changes in Net Assets
| Year ended January 31, 2019 | For the period May 25, 2017 (commencement of operations) to January 31, 2018 | |
| Increase (Decrease) in Net Assets | ||
| Operations | ||
| Net investment income (loss) | $1,429,958 | $309,300 |
| Net realized gain (loss) | (4,722,983) | 208,072 |
| Change in net unrealized appreciation (depreciation) | (5,421,187) | 3,718,439 |
| Net increase (decrease) in net assets resulting from operations | (8,714,212) | 4,235,811 |
| Distributions to shareholders | (1,713,265) | – |
| Distributions to shareholders from net investment income | – | (341,268) |
| Total distributions | (1,713,265) | (341,268) |
| Share transactions | ||
| Proceeds from sales of shares | 31,073,572 | 72,219,816 |
| Reinvestment of distributions | 1,713,265 | 341,268 |
| Cost of shares redeemed | (40,998,020) | (8,892,848) |
| Net increase (decrease) in net assets resulting from share transactions | (8,211,183) | 63,668,236 |
| Total increase (decrease) in net assets | (18,638,660) | 67,562,779 |
| Net Assets | ||
| Beginning of period | 67,562,779 | – |
| End of period | $48,924,119 | $67,562,779 |
| Other Information | ||
| Distributions in excess of net investment income end of period | $(18,318) | |
| Shares | ||
| Sold | 2,915,882 | 6,754,384 |
| Issued in reinvestment of distributions | 177,982 | 30,662 |
| Redeemed | (4,080,030) | (829,916) |
| Net increase (decrease) | (986,166) | 5,955,130 |
See accompanying notes which are an integral part of the financial statements.
Financial Highlights
Fidelity Mid Cap Value K6 Fund
| Years ended January 31, | 2019 | 2018 A |
| Selected Per–Share Data | ||
| Net asset value, beginning of period | $11.35 | $10.00 |
| Income from Investment Operations | ||
| Net investment income (loss)B | .21 | .11 |
| Net realized and unrealized gain (loss) | (1.44) | 1.33 |
| Total from investment operations | (1.23) | 1.44 |
| Distributions from net investment income | (.22) | (.09) |
| Distributions from net realized gain | (.05) | – |
| Total distributions | (.27) | (.09) |
| Net asset value, end of period | $9.85 | $11.35 |
| Total ReturnC,D | (10.82)% | 14.38% |
| Ratios to Average Net AssetsE,F | ||
| Expenses before reductions | .45% | .45%G |
| Expenses net of fee waivers, if any | .45% | .45%G |
| Expenses net of all reductions | .44% | .45%G |
| Net investment income (loss) | 2.05% | 1.52%G |
| Supplemental Data | ||
| Net assets, end of period (000 omitted) | $48,924 | $67,563 |
| Portfolio turnover rateH | 89%I | 142%G,I |
A For the period May 25, 2017 (commencement of operations) to January 31, 2018.
B Calculated based on average shares outstanding during the period.
C Total returns for periods of less than one year are not annualized.
D Total returns would have been lower if certain expenses had not been reduced during the applicable periods shown.
E Fees and expenses of any underlying Fidelity Central Funds are not included in the Fund's expense ratio. The Fund indirectly bears its proportionate share of the expenses of any underlying Fidelity Central Funds.
F Expense ratios reflect operating expenses of the Fund. Expenses before reductions do not reflect amounts reimbursed by the investment adviser or reductions from brokerage service arrangements or reductions from other expense offset arrangements and do not represent the amount paid by the Fund during periods when reimbursements or reductions occur. Expense ratios before reductions for start-up periods may not be representative of longer term operating periods. Expenses net of fee waivers reflect expenses after reimbursement by the investment adviser but prior to reductions from brokerage service arrangements or other expense offset arrangements. Expenses net of all reductions represent the net expenses paid by the Fund.
G Annualized
H Amount does not include the portfolio activity of any underlying Fidelity Central Funds.
I Portfolio turnover rate excludes securities received or delivered in-kind.
See accompanying notes which are an integral part of the financial statements.
Notes to Financial Statements
For the period ended January 31, 2019
1. Organization.
Fidelity Mid Cap Value K6 Fund (the Fund) is a fund of Fidelity Devonshire Trust (the Trust) and is authorized to issue an unlimited number of shares. Share transactions on the Statement of Changes in Net Assets may contain exchanges between affiliated funds. The Trust is registered under the Investment Company Act of 1940, as amended (the 1940 Act), as an open-end management investment company organized as a Massachusetts business trust. Shares generally are available only to employer-sponsored retirement plans that are recordkept by Fidelity, or to certain employer-sponsored retirement plans that are not recordkept by Fidelity.
2. Investments in Fidelity Central Funds.
The Fund invests in Fidelity Central Funds, which are open-end investment companies generally available only to other investment companies and accounts managed by the investment adviser and its affiliates. The Fund's Schedule of Investments lists each of the Fidelity Central Funds held as of period end, if any, as an investment of the Fund, but does not include the underlying holdings of each Fidelity Central Fund. As an Investing Fund, the Fund indirectly bears its proportionate share of the expenses of the underlying Fidelity Central Funds.
The Money Market Central Funds seek preservation of capital and current income and are managed by Fidelity Investments Money Management, Inc. (FIMM), an affiliate of the investment adviser. Annualized expenses of the Money Market Central Funds as of their most recent shareholder report date are less than .005%.
A complete unaudited list of holdings for each Fidelity Central Fund is available upon request or at the Securities and Exchange Commission (the SEC) website at www.sec.gov. In addition, the financial statements of the Fidelity Central Funds, which are not covered by the Fund's Report of Independent Registered Public Accounting Firm, are available on the SEC website or upon request.
3. Significant Accounting Policies.
The Fund is an investment company and applies the accounting and reporting guidance of the Financial Accounting Standards Board (FASB) Accounting Standards Codification Topic 946 Financial Services – Investments Companies. The financial statements have been prepared in conformity with accounting principles generally accepted in the United States of America (GAAP), which require management to make certain estimates and assumptions at the date of the financial statements. Actual results could differ from those estimates. Subsequent events, if any, through the date that the financial statements were issued have been evaluated in the preparation of the financial statements. The following summarizes the significant accounting policies of the Fund:
Investment Valuation. Investments are valued as of 4:00 p.m. Eastern time on the last calendar day of the period. The Board of Trustees (the Board) has delegated the day to day responsibility for the valuation of the Fund's investments to the Fair Value Committee (the Committee) established by the Fund's investment adviser. In accordance with valuation policies and procedures approved by the Board, the Fund attempts to obtain prices from one or more third party pricing vendors or brokers to value its investments. When current market prices, quotations or currency exchange rates are not readily available or reliable, investments will be fair valued in good faith by the Committee, in accordance with procedures adopted by the Board. Factors used in determining fair value vary by investment type and may include market or investment specific events. The frequency with which these procedures are used cannot be predicted and they may be utilized to a significant extent. The Committee oversees the Fund's valuation policies and procedures and reports to the Board on the Committee's activities and fair value determinations. The Board monitors the appropriateness of the procedures used in valuing the Fund's investments and ratifies the fair value determinations of the Committee.
The Fund categorizes the inputs to valuation techniques used to value its investments into a disclosure hierarchy consisting of three levels as shown below:
- Level 1 – quoted prices in active markets for identical investments
- Level 2 – other significant observable inputs (including quoted prices for similar investments, interest rates, prepayment speeds, etc.)
- Level 3 – unobservable inputs (including the Fund's own assumptions based on the best information available)
Valuation techniques used to value the Fund's investments by major category are as follows:
Equity securities, including restricted securities, for which market quotations are readily available, are valued at the last reported sale price or official closing price as reported by a third party pricing vendor on the primary market or exchange on which they are traded and are categorized as Level 1 in the hierarchy. In the event there were no sales during the day or closing prices are not available, securities are valued at the last quoted bid price or may be valued using the last available price and are generally categorized as Level 2 in the hierarchy. For foreign equity securities, when market or security specific events arise, comparisons to the valuation of American Depositary Receipts (ADRs), futures contracts, Exchange-Traded Funds (ETFs) and certain indexes as well as quoted prices for similar securities may be used and would be categorized as Level 2 in the hierarchy. For equity securities, including restricted securities, where observable inputs are limited, assumptions about market activity and risk are used and these securities may be categorized as Level 3 in the hierarchy.
Investments in open-end mutual funds, including the Fidelity Central Funds, are valued at their closing net asset value (NAV) each business day and are categorized as Level 1 in the hierarchy.
Changes in valuation techniques may result in transfers in or out of an assigned level within the disclosure hierarchy.
Investment Transactions and Income. For financial reporting purposes, the Fund's investment holdings and NAV include trades executed through the end of the last business day of the period. The NAV per share for processing shareholder transactions is calculated as of the close of business of the New York Stock Exchange (NYSE), normally 4:00 p.m. Eastern time and includes trades executed through the end of the prior business day. Gains and losses on securities sold are determined on the basis of identified cost. Dividend income is recorded on the ex-dividend date, except for certain dividends from foreign securities where the ex-dividend date may have passed, which are recorded as soon as the Fund is informed of the ex-dividend date. Non-cash dividends included in dividend income, if any, are recorded at the fair market value of the securities received. Income and capital gain distributions from Fidelity Central Funds, if any, are recorded on the ex-dividend date. Certain distributions received by the Fund represent a return of capital or capital gain. The Fund determines the components of these distributions subsequent to the ex-dividend date, based upon receipt of tax filings or other correspondence relating to the underlying investment. These distributions are recorded as a reduction of cost of investments and/or as a realized gain.
Expenses. Expenses directly attributable to a fund are charged to that fund. Expenses attributable to more than one fund are allocated among the respective funds on the basis of relative net assets or other appropriate methods. Expense estimates are accrued in the period to which they relate and adjustments are made when actual amounts are known.
Income Tax Information and Distributions to Shareholders. Each year, the Fund intends to qualify as a regulated investment company under Subchapter M of the Internal Revenue Code, including distributing substantially all of its taxable income and realized gains. As a result, no provision for U.S. Federal income taxes is required. As of January 31, 2019, the Fund did not have any unrecognized tax benefits in the financial statements; nor is the Fund aware of any tax positions for which it is reasonably possible that the total amounts of unrecognized tax benefits will significantly change in the next twelve months. The Fund files a U.S. federal tax return, in addition to state and local tax returns as required. The Fund's federal income tax returns are subject to examination by the Internal Revenue Service (IRS) for a period of three fiscal years after they are filed. State and local tax returns may be subject to examination for an additional fiscal year depending on the jurisdiction.
Distributions are declared and recorded on the ex-dividend date. Income and capital gain distributions are determined in accordance with income tax regulations, which may differ from GAAP.
Capital accounts within the financial statements are adjusted for permanent book-tax differences. These adjustments have no impact on net assets or the results of operations. Capital accounts are not adjusted for temporary book-tax differences which will reverse in a subsequent period.
Book-tax differences are primarily due to partnerships, capital loss carryforwards and losses deferred due to wash sales and excise tax regulations.
As of period end, the cost and unrealized appreciation (depreciation) in securities, and derivatives if applicable, for federal income tax purposes were as follows:
| Gross unrealized appreciation | $2,553,785 |
| Gross unrealized depreciation | (4,599,486) |
| Net unrealized appreciation (depreciation) | $(2,045,701) |
| Tax Cost | $52,951,427 |
The tax-based components of distributable earnings as of period end were as follows:
| Capital loss carryforward | $(4,435,593) |
| Net unrealized appreciation (depreciation) on securities and other investments | $(2,045,701) |
Capital loss carryforwards are only available to offset future capital gains of the Fund to the extent provided by regulations and may be limited. Under the Regulated Investment Company Modernization Act of 2010 (the Act), the Fund is permitted to carry forward capital losses incurred in taxable years beginning after December 22, 2010 for an unlimited period and such capital losses are required to be used prior to any losses that expire. The capital loss carryforward information presented below, including any applicable limitation, is estimated as of fiscal period end and is subject to adjustment.
| Fiscal year of expiration | |
| No expiration | |
| Short-term | $(3,994,076) |
| Long-term | (441,517) |
| Total capital loss carryforward | $(4,435,593) |
Due to large redemptions in the period, approximately $4,189,850 of the Fund's realized capital losses are subject to limitation. Due to this limitation, the Fund will only be permitted to use approximately $1,170,413 of those capital losses per year to offset capital gains.
The Fund intends to elect to defer to its next fiscal year $51,640 of capital losses recognized during the period January 1, 2019 to January 31, 2019.
The tax character of distributions paid was as follows:
| January 31, 2019 | January 31, 2018 (a) | |
| Ordinary Income | $1,713,265 | $ 341,268 |
| Total | $1,713,265 | $ 341,268 |
New Rule Issuance. During August 2018, the U.S. Securities and Exchange Commission issued Final Rule Release No. 33-10532, Disclosure Update and Simplification. This Final Rule includes amendments specific to registered investment companies that are intended to eliminate overlap in disclosure requirements between Regulation S-X and GAAP. In accordance with these amendments, certain line-items in the Fund's financial statements have been combined or removed for the current period as outlined in the table below.
| Financial Statement | Current Line-Item Presentation (As Applicable) | Prior Line-Item Presentation (As Applicable) |
| Statement of Assets and Liabilities | Total distributable earnings (loss) | Undistributed/Distributions in excess of/Accumulated net investment income (loss) Accumulated/Undistributed net realized gain (loss) Net unrealized appreciation (depreciation) |
| Statement of Changes in Net Assets | N/A - removed | Undistributed/Distributions in excess of/Accumulated net investment income (loss) end of period |
| Statement of Changes in Net Assets | Distributions to shareholders | Distributions to shareholders from net investment income Distributions to shareholders from net realized gain |
4. Purchases and Sales of Investments.
Purchases and sales of securities, other than short-term securities and in-kind transactions, aggregated $59,017,041 and $88,341,007, respectively.
Unaffiliated Exchanges In-Kind. During the period, the Fund received investments and cash valued at $21,501,311 in exchange for 1,998,263 shares of the Fund. The amount of in-kind exchanges is included in share transactions in the accompanying Statement of Changes in Net Assets.
Prior Fiscal Year Exchanges In-Kind. During the prior period, an unaffiliated entity completed an exchange in-kind with the Fund. The unaffiliated entity delivered investments and cash, valued at $9,318,982 in exchange for 874,201 shares of the Fund. The amount of in-kind exchanges is included in share transactions in the accompanying Statement of Changes in Net Assets. The Fund recognized no gain or loss for federal income tax purposes.
5. Fees and Other Transactions with Affiliates.
Management Fee. Fidelity Management & Research Company (the investment adviser) and its affiliates provide the Fund with investment management related services for which the Fund pays a monthly management fee that is based on an annual rate of .45% of average net assets. Under the management contract, the investment adviser or an affiliate pays all other expenses of the Fund, excluding fees and expenses of the independent Trustees, and certain miscellaneous expenses such as proxy and shareholder meeting expenses.
Brokerage Commissions. The Fund placed a portion of its portfolio transactions with brokerage firms which are affiliates of the investment adviser. Brokerage commissions are included in net realized gain (loss) and change in net unrealized appreciation (depreciation) in the Statement of Operations. The commissions paid to these affiliated firms were $2,141 for the period.
Interfund Trades. The Fund may purchase from or sell securities to other Fidelity Funds under procedures adopted by the Board. The procedures have been designed to ensure these interfund trades are executed in accordance with Rule 17a-7 of the 1940 Act. Interfund trades are included within the respective purchases and sales amounts shown in the Purchases and Sales of Investments note.
Prior Fiscal Year Exchanges In-Kind. During the prior period, an affiliated entity completed an exchange in-kind with the Fund. The affiliated entity delivered investments and cash valued at $33,895,948 in exchange for 3,323,132 shares of the Fund. The amount of in-kind exchanges is included in share transactions in the accompanying Statement of Changes in Net Assets. The Fund recognized no gain or loss for federal income tax purposes.
6. Committed Line of Credit.
The Fund participates with other funds managed by the investment adviser or an affiliate in a $4.25 billion credit facility (the "line of credit") to be utilized for temporary or emergency purposes to fund shareholder redemptions or for other short-term liquidity purposes. The Fund has agreed to pay commitment fees on its pro-rata portion of the line of credit, which amounted to $156 and is reflected in Commitment fees on the Statement of Operations. During the period, the Fund did not borrow on this line of credit.
7. Security Lending.
The Fund lends portfolio securities through a lending agent from time to time in order to earn additional income. For equity securities, a lending agent is used and may loan securities to certain qualified borrowers, including Fidelity Capital Markets (FCM), a broker-dealer affiliated with the Fund. On the settlement date of the loan, the Fund receives collateral (in the form of U.S. Treasury obligations, letters of credit and/or cash) against the loaned securities and maintains collateral in an amount not less than 100% of the market value of the loaned securities during the period of the loan. The market value of the loaned securities is determined at the close of business of the Fund and any additional required collateral is delivered to the Fund on the next business day. The Fund or borrower may terminate the loan at any time, and if the borrower defaults on its obligation to return the securities loaned because of insolvency or other reasons, the Fund may apply collateral received from the borrower against the obligation. The Fund may experience delays and costs in recovering the securities loaned. Any cash collateral received is invested in the Fidelity Securities Lending Cash Central Fund. The value of loaned securities and cash collateral at period end are disclosed on the Fund's Statement of Assets and Liabilities. At period end, there were no security loans outstanding with FCM. Security lending income represents the income earned on investing cash collateral, less rebates paid to borrowers and any lending agent fees associated with the loan, plus any premium payments received for lending certain types of securities. Security lending income is presented in the Statement of Operations as a component of income from Fidelity Central Funds. Total security lending income during the period amounted to $6,447, including $102 from securities loaned to FCM.
8. Expense Reductions.
Commissions paid to certain brokers with whom the investment adviser, or its affiliates, places trades on behalf of the Fund include an amount in addition to trade execution, which may be rebated back to the Fund to offset certain expenses. This amount totaled $8,749 for the period. In addition, through arrangements with the Fund's custodian, credits realized as a result of certain uninvested cash balances were used to reduce the Fund's expenses. During the period, these credits reduced the Fund's custody expenses by $44.
9. Other.
The Fund's organizational documents provide former and current trustees and officers with a limited indemnification against liabilities arising in connection with the performance of their duties to the Fund. In the normal course of business, the Fund may also enter into contracts that provide general indemnifications. The Fund's maximum exposure under these arrangements is unknown as this would be dependent on future claims that may be made against the Fund. The risk of material loss from such claims is considered remote.
Report of Independent Registered Public Accounting Firm
To the Trustees of Fidelity Devonshire Trust and Shareholders of Fidelity Mid Cap Value K6 Fund:
Opinion on the Financial Statements and Financial Highlights
We have audited the accompanying statement of assets and liabilities of Fidelity Mid Cap Value K6 Fund (the "Fund"), a fund of Fidelity Devonshire Trust, including the schedule of investments, as of January 31, 2019, the related statement of operations for the year then ended, the statement of changes in net assets and the financial highlights for the year then ended and for the period from May 5, 2017 (commencement of operations) to January 31, 2018, and the related notes. In our opinion, the financial statements and financial highlights present fairly, in all material respects, the financial position of the Fund as of January 31, 2019, and the results of its operations for the year then ended, and the changes in its net assets and the financial highlights for the year then ended and for the period from May 5, 2017 (commencement of operations) to January 31, 2018, in conformity with accounting principles generally accepted in the United States of America.
Basis for Opinion
These financial statements and financial highlights are the responsibility of the Fund's management. Our responsibility is to express an opinion on the Fund's financial statements and financial highlights based on our audits. We are a public accounting firm registered with the Public Company Accounting Oversight Board (United States) (PCAOB) and are required to be independent with respect to the Fund in accordance with the U.S. federal securities laws and the applicable rules and regulations of the Securities and Exchange Commission and the PCAOB.
We conducted our audits in accordance with the standards of the PCAOB. Those standards require that we plan and perform the audit to obtain reasonable assurance about whether the financial statements and financial highlights are free of material misstatement, whether due to error or fraud. The Fund is not required to have, nor were we engaged to perform, an audit of its internal control over financial reporting. As part of our audits we are required to obtain an understanding of internal control over financial reporting but not for the purpose of expressing an opinion on the effectiveness of the Fund’s internal control over financial reporting. Accordingly, we express no such opinion.
Our audits included performing procedures to assess the risks of material misstatement of the financial statements and financial highlights, whether due to error or fraud, and performing procedures that respond to those risks. Such procedures included examining, on a test basis, evidence regarding the amounts and disclosures in the financial statements and financial highlights. Our audits also included evaluating the accounting principles used and significant estimates made by management, as well as evaluating the overall presentation of the financial statements and financial highlights. Our procedures included confirmation of securities owned as of January 31, 2019, by correspondence with the custodians and brokers; when replies were not received from brokers, we performed other auditing procedures. We believe that our audits provide a reasonable basis for our opinion.
/s/ Deloitte & Touche LLP
Boston, Massachusetts
March 15, 2019
We have served as the auditor of one or more of the Fidelity investment companies since 1999.
Trustees and Officers
The Trustees, Members of the Advisory Board (if any), and officers of the trust and fund, as applicable, are listed below. The Board of Trustees governs the fund and is responsible for protecting the interests of shareholders. The Trustees are experienced executives who meet periodically throughout the year to oversee the fund's activities, review contractual arrangements with companies that provide services to the fund, oversee management of the risks associated with such activities and contractual arrangements, and review the fund's performance. Except for Michael E. Wiley, each of the Trustees oversees 287 funds. Mr. Wiley oversees 195 funds.
The Trustees hold office without limit in time except that (a) any Trustee may resign; (b) any Trustee may be removed by written instrument, signed by at least two-thirds of the number of Trustees prior to such removal; (c) any Trustee who requests to be retired or who has become incapacitated by illness or injury may be retired by written instrument signed by a majority of the other Trustees; and (d) any Trustee may be removed at any special meeting of shareholders by a two-thirds vote of the outstanding voting securities of the trust. Each Trustee who is not an interested person (as defined in the 1940 Act) of the trust and the fund is referred to herein as an Independent Trustee. Each Independent Trustee shall retire not later than the last day of the calendar year in which his or her 75th birthday occurs. The Independent Trustees may waive this mandatory retirement age policy with respect to individual Trustees. Officers and Advisory Board Members hold office without limit in time, except that any officer or Advisory Board Member may resign or may be removed by a vote of a majority of the Trustees at any regular meeting or any special meeting of the Trustees. Except as indicated, each individual has held the office shown or other offices in the same company for the past five years.
The fund’s Statement of Additional Information (SAI) includes more information about the Trustees. To request a free copy, call Fidelity at 1-800-835-5092.
Experience, Skills, Attributes, and Qualifications of the Trustees. The Governance and Nominating Committee has adopted a statement of policy that describes the experience, qualifications, attributes, and skills that are necessary and desirable for potential Independent Trustee candidates (Statement of Policy). The Board believes that each Trustee satisfied at the time he or she was initially elected or appointed a Trustee, and continues to satisfy, the standards contemplated by the Statement of Policy. The Governance and Nominating Committee also engages professional search firms to help identify potential Independent Trustee candidates who have the experience, qualifications, attributes, and skills consistent with the Statement of Policy. From time to time, additional criteria based on the composition and skills of the current Independent Trustees, as well as experience or skills that may be appropriate in light of future changes to board composition, business conditions, and regulatory or other developments, have also been considered by the professional search firms and the Governance and Nominating Committee. In addition, the Board takes into account the Trustees' commitment and participation in Board and committee meetings, as well as their leadership of standing and ad hoc committees throughout their tenure.
In determining that a particular Trustee was and continues to be qualified to serve as a Trustee, the Board has considered a variety of criteria, none of which, in isolation, was controlling. The Board believes that, collectively, the Trustees have balanced and diverse experience, qualifications, attributes, and skills, which allow the Board to operate effectively in governing the fund and protecting the interests of shareholders. Information about the specific experience, skills, attributes, and qualifications of each Trustee, which in each case led to the Board's conclusion that the Trustee should serve (or continue to serve) as a trustee of the fund, is provided below.
Board Structure and Oversight Function. James C. Curvey is an interested person and currently serves as Chairman. The Trustees have determined that an interested Chairman is appropriate and benefits shareholders because an interested Chairman has a personal and professional stake in the quality and continuity of services provided to the fund. Independent Trustees exercise their informed business judgment to appoint an individual of their choosing to serve as Chairman, regardless of whether the Trustee happens to be independent or a member of management. The Independent Trustees have determined that they can act independently and effectively without having an Independent Trustee serve as Chairman and that a key structural component for assuring that they are in a position to do so is for the Independent Trustees to constitute a substantial majority for the Board. The Independent Trustees also regularly meet in executive session. Ned C. Lautenbach serves as Chairman of the Independent Trustees and as such (i) acts as a liaison between the Independent Trustees and management with respect to matters important to the Independent Trustees and (ii) with management prepares agendas for Board meetings.
Fidelity® funds are overseen by different Boards of Trustees. The fund's Board oversees Fidelity's high income and certain equity funds, and other Boards oversee Fidelity's investment-grade bond, money market, asset allocation, and other equity funds. The asset allocation funds may invest in Fidelity® funds overseen by the fund's Board. The use of separate Boards, each with its own committee structure, allows the Trustees of each group of Fidelity® funds to focus on the unique issues of the funds they oversee, including common research, investment, and operational issues. On occasion, the separate Boards establish joint committees to address issues of overlapping consequences for the Fidelity® funds overseen by each Board.
The Trustees operate using a system of committees to facilitate the timely and efficient consideration of all matters of importance to the Trustees, the fund, and fund shareholders and to facilitate compliance with legal and regulatory requirements and oversight of the fund's activities and associated risks. The Board, acting through its committees, has charged FMR and its affiliates with (i) identifying events or circumstances the occurrence of which could have demonstrably adverse effects on the fund's business and/or reputation; (ii) implementing processes and controls to lessen the possibility that such events or circumstances occur or to mitigate the effects of such events or circumstances if they do occur; and (iii) creating and maintaining a system designed to evaluate continuously business and market conditions in order to facilitate the identification and implementation processes described in (i) and (ii) above. Because the day-to-day operations and activities of the fund are carried out by or through FMR, its affiliates, and other service providers, the fund's exposure to risks is mitigated but not eliminated by the processes overseen by the Trustees. While each of the Board's committees has responsibility for overseeing different aspects of the fund's activities, oversight is exercised primarily through the Operations, Audit, and Compliance Committees. In addition, the Independent Trustees have worked with Fidelity to enhance the Board's oversight of investment and financial risks, legal and regulatory risks, technology risks, and operational risks, including the development of additional risk reporting to the Board. Appropriate personnel, including but not limited to the fund's Chief Compliance Officer (CCO), FMR's internal auditor, the independent accountants, the fund's Treasurer and portfolio management personnel, make periodic reports to the Board's committees, as appropriate, including an annual review of Fidelity's risk management program for the Fidelity® funds. The responsibilities of each standing committee, including their oversight responsibilities, are described further under "Standing Committees of the Trustees."
Interested Trustees*:
Correspondence intended for a Trustee who is an interested person may be sent to Fidelity Investments, 245 Summer Street, Boston, Massachusetts 02210.
Name, Year of Birth; Principal Occupations and Other Relevant Experience+
James C. Curvey (1935)
Year of Election or Appointment: 2007
Trustee
Chairman of the Board of Trustees
Mr. Curvey also serves as Trustee of other Fidelity® funds. Mr. Curvey is Vice Chairman (2007-present) and Director of FMR LLC (diversified financial services company). In addition, Mr. Curvey is an Overseer Emeritus for the Boston Symphony Orchestra, a Director of Artis-Naples, and a Trustee of Brewster Academy in Wolfeboro, New Hampshire. Previously, Mr. Curvey served as a Director of Fidelity Research & Analysis Co. (investment adviser firm, 2009-2018), Director of Fidelity Investments Money Management, Inc. (investment adviser firm, 2009-2014) and a Director of FMR and FMR Co., Inc. (investment adviser firms, 2007-2014).
* Determined to be an “Interested Trustee” by virtue of, among other things, his or her affiliation with the trust or various entities under common control with FMR.
+ The information includes the Trustee's principal occupation during the last five years and other information relating to the experience, attributes, and skills relevant to the Trustee's qualifications to serve as a Trustee, which led to the conclusion that the Trustee should serve as a Trustee for the fund.
Independent Trustees:
Correspondence intended for an Independent Trustee may be sent to Fidelity Investments, P.O. Box 55235, Boston, Massachusetts 02205-5235.
Name, Year of Birth; Principal Occupations and Other Relevant Experience+
Dennis J. Dirks (1948)
Year of Election or Appointment: 2005
Trustee
Mr. Dirks also serves as Trustee of other Fidelity® funds. Prior to his retirement in May 2003, Mr. Dirks was Chief Operating Officer and a member of the Board of The Depository Trust & Clearing Corporation (DTCC). He also served as President, Chief Operating Officer, and Board member of The Depository Trust Company (DTC) and President and Board member of the National Securities Clearing Corporation (NSCC). In addition, Mr. Dirks served as Chief Executive Officer and Board member of the Government Securities Clearing Corporation, Chief Executive Officer and Board member of the Mortgage-Backed Securities Clearing Corporation, as a Trustee and a member of the Finance Committee of Manhattan College (2005-2008), as a Trustee and a member of the Finance Committee of AHRC of Nassau County (2006-2008), as a member of the Independent Directors Council (IDC) Governing Council (2010-2015), and as a member of the Board of Directors for The Brookville Center for Children’s Services, Inc. (2009-2017). Mr. Dirks is a member of the Finance Committee (2016-present) and Board of Directors (2017-present) and is Treasurer (2018-present) of the Asolo Repertory Theatre.
Donald F. Donahue (1950)
Year of Election or Appointment: 2018
Trustee
Mr. Donahue also serves as a Trustee of other Fidelity® funds. Mr. Donahue is President and Chief Executive Officer of Miranda Partners, LLC (risk consulting for the financial services industry, 2012-present). Previously, Mr. Donahue served as a Member of the Advisory Board of certain Fidelity® funds (2015-2018) and Chief Executive Officer (2006-2012), Chief Operating Officer (2003-2006), and Managing Director, Customer Marketing and Development (1999-2003) of The Depository Trust & Clearing Corporation (financial markets infrastructure). Mr. Donahue serves as a Member (2007-present) and Co-Chairman (2016-present) of the Board of Directors of United Way of New York, Member of the Board of Directors of NYC Leadership Academy (2012-present) and Member of the Board of Advisors of Ripple Labs, Inc. (financial services, 2015-present). He also served as Chairman (2010-2012) and Member of the Board of Directors (2012-2013) of Omgeo, LLC (financial services), Treasurer of United Way of New York (2012-2016), and Member of the Board of Directors of XBRL US (financial services non-profit, 2009-2012) and the International Securities Services Association (2009-2012).
Alan J. Lacy (1953)
Year of Election or Appointment: 2008
Trustee
Mr. Lacy also serves as Trustee of other Fidelity® funds. Mr. Lacy serves as a Director of Bristol-Myers Squibb Company (global pharmaceuticals, 2008-present). He is a Trustee of the California Chapter of The Nature Conservancy (2015-present) and a Director of the Center for Advanced Study in the Behavioral Sciences at Stanford University (2015-present). In addition, Mr. Lacy served as Senior Adviser (2007-2014) of Oak Hill Capital Partners, L.P. (private equity) and also served as Chief Executive Officer (2005) and Vice Chairman (2005-2006) of Sears Holdings Corporation (retail) and Chief Executive Officer and Chairman of the Board of Sears, Roebuck and Co. (retail, 2000-2005). Previously, Mr. Lacy served as Chairman (2014-2017) and a member (2010-2017) of the Board of Directors of Dave & Buster’s Entertainment, Inc. (restaurant and entertainment complexes), as Chairman (2008-2011) and a member (2006-2015) of the Board of Trustees of the National Parks Conservation Association, and as a member of the Board of Directors for The Hillman Companies, Inc. (hardware wholesalers, 2010-2014), Earth Fare, Inc. (retail grocery, 2010-2014), and The Western Union Company (global money transfer, 2006-2011).
Ned C. Lautenbach (1944)
Year of Election or Appointment: 2000
Trustee
Chairman of the Independent Trustees
Mr. Lautenbach also serves as Trustee of other Fidelity® funds. Mr. Lautenbach currently serves as Chair (2018-present) and Member (2013-present) of the Board of Governors, State University System of Florida and is a member of the Council on Foreign Relations (1994-present). He is also a member and has most recently served as Chairman of the Board of Directors of Artis-Naples (2012-present). Previously, Mr. Lautenbach served as a member and then Lead Director of the Board of Directors of Eaton Corporation (diversified industrial, 1997-2016). He was also a Partner and Advisory Partner at Clayton, Dubilier & Rice, LLC (private equity investment, 1998-2010), as well as a Director of Sony Corporation (2006-2007). In addition, Mr. Lautenbach also had a 30-year career with IBM (technology company) during which time he served as Senior Vice President and a member of the Corporate Executive Committee (1968-1998).
Joseph Mauriello (1944)
Year of Election or Appointment: 2008
Trustee
Mr. Mauriello also serves as Trustee of other Fidelity® funds. Prior to his retirement in January 2006, Mr. Mauriello served in numerous senior management positions including Deputy Chairman and Chief Operating Officer (2004-2005), and Vice Chairman of Financial Services (2002-2004) of KPMG LLP US (professional services, 1965-2005). Mr. Mauriello currently serves as a member of the Independent Directors Council (IDC) Governing Council (2015-present). Previously, Mr. Mauriello served as a member of the Board of Directors of XL Group plc. (global insurance and re-insurance, 2006-2018).
Cornelia M. Small (1944)
Year of Election or Appointment: 2005
Trustee
Ms. Small also serves as Trustee of other Fidelity® funds. Ms. Small is a member of the Board of Directors (2009-present) and Chair of the Investment Committee (2010-present) of the Teagle Foundation. Ms. Small also serves on the Investment Committee of the Berkshire Taconic Community Foundation (2008-present). Previously, Ms. Small served as Chairperson (2002-2008) and a member of the Investment Committee and Chairperson (2008-2012) and a member of the Board of Trustees of Smith College. In addition, Ms. Small served as Chief Investment Officer, Director of Global Equity Investments, and a member of the Board of Directors of Scudder, Stevens & Clark and Scudder Kemper Investments.
Garnett A. Smith (1947)
Year of Election or Appointment: 2018
Trustee
Mr. Smith also serves as Trustee of other Fidelity® funds. Prior to Mr. Smith's retirement, he served as Chairman and Chief Executive Officer of Inbrand Corp. (manufacturer of personal absorbent products, 1990-1997). He also served as President (1986-1990) of Inbrand Corp. Prior to his employment with Inbrand Corp., he was employed by a retail fabric chain and North Carolina National Bank. In addition, Mr. Smith served as a Member of the Advisory Board of certain Fidelity® funds (2012-2013) and as a board member of the Jackson Hole Land Trust (2009-2012).
David M. Thomas (1949)
Year of Election or Appointment: 2008
Trustee
Mr. Thomas also serves as Trustee of other Fidelity® funds. Mr. Thomas serves as Non-Executive Chairman of the Board of Directors of Fortune Brands Home and Security (home and security products, 2011-present) and as a member of the Board of Directors (2004-present) and Presiding Director (2013-present) of Interpublic Group of Companies, Inc. (marketing communication). Previously, Mr. Thomas served as Executive Chairman (2005-2006) and Chairman and Chief Executive Officer (2000-2005) of IMS Health, Inc. (pharmaceutical and healthcare information solutions), a Director of Fortune Brands, Inc. (consumer products, 2000-2011), and a member of the Board of Trustees of the University of Florida (2013-2018).
Michael E. Wiley (1950)
Year of Election or Appointment: 2018
Trustee
Mr. Wiley also serves as Trustee or Member of the Advisory Board of other Fidelity® funds. Mr. Wiley serves as a Director of High Point Resources (exploration and production, 2005-present). Previously, Mr. Wiley served as a Director of Andeavor Corporation (independent oil refiner and marketer, 2005-2018), a Director of Andeavor Logistics LP (natural resources logistics, 2015-2018), a Director of Post Oak Bank (privately-held bank, 2004-2018), a Director of Asia Pacific Exploration Consolidated (international oil and gas exploration and production, 2008-2013), a member of the Board of Trustees of the University of Tulsa (2000-2006; 2007-2010), a Senior Energy Advisor of Katzenbach Partners, LLC (consulting, 2006-2007), an Advisory Director of Riverstone Holdings (private investment), a Director of Spinnaker Exploration Company (exploration and production, 2001-2005) and Chairman, President, and CEO of Baker Hughes, Inc. (oilfield services, 2000-2004).
+ The information includes the Trustee's principal occupation during the last five years and other information relating to the experience, attributes, and skills relevant to the Trustee's qualifications to serve as a Trustee, which led to the conclusion that the Trustee should serve as a Trustee for the fund.
Advisory Board Members and Officers:
Correspondence intended for a Member of the Advisory Board (if any) may be sent to Fidelity Investments, P.O. Box 55235, Boston, Massachusetts 02205-5235. Correspondence intended for an officer or Peter S. Lynch may be sent to Fidelity Investments, 245 Summer Street, Boston, Massachusetts 02210. Officers appear below in alphabetical order.
Name, Year of Birth; Principal Occupation
Vicki L. Fuller (1957)
Year of Election or Appointment: 2018
Member of the Advisory Board
Ms. Fuller also serves as Member of the Advisory Board of other Fidelity® funds. Ms. Fuller serves as a member of the Board of Directors, Audit Committee, and Nominating and Governance Committee of The Williams Companies, Inc. (natural gas infrastructure, 2018-present). Previously, Ms. Fuller served as the Chief Investment Officer of the New York State Common Retirement Fund (2012-2018) and held a variety of positions at AllianceBernstein L.P. (global asset management, 1985-2012), including Managing Director (2006-2012) and Senior Vice President and Senior Portfolio Manager (2001-2006).
Peter S. Lynch (1944)
Year of Election or Appointment: 2003
Member of the Advisory Board
Mr. Lynch also serves as Member of the Advisory Board of other Fidelity® funds. Mr. Lynch is Vice Chairman and a Director of FMR (investment adviser firm) and FMR Co., Inc. (investment adviser firm). In addition, Mr. Lynch serves as a Trustee of Boston College and as the Chairman of the Inner-City Scholarship Fund. Previously, Mr. Lynch served on the Special Olympics International Board of Directors (1997-2006).
Carol B. Tomé (1957)
Year of Election or Appointment: 2018
Member of the Advisory Board
Ms. Tomé also serves as Member of the Advisory Board of other Fidelity® funds. Ms. Tomé is Chief Financial Officer (2001-present) and Executive Vice President of Corporate Services (2007-present) of The Home Depot, Inc. (home improvement retailer) and a Director (2003-present) and Chair of the Audit Committee (2004-present) of United Parcel Service, Inc. (package delivery and supply chain management). Previously, Ms. Tomé served as Trustee of certain Fidelity® funds (2017), Senior Vice President of Finance and Accounting/Treasurer (2000-2007) and Vice President and Treasurer (1995-2000) of The Home Depot, Inc. and Chair of the Board (2010-2012), Vice Chair of the Board (2009 and 2013), and a Director (2008-2013) of the Federal Reserve Bank of Atlanta. Ms. Tomé is also a director or trustee of many community and professional organizations.
Elizabeth Paige Baumann (1968)
Year of Election or Appointment: 2017
Anti-Money Laundering (AML) Officer
Ms. Baumann also serves as AML Officer of other funds. She is Chief AML Officer (2012-present) and Senior Vice President (2014-present) of FMR LLC (diversified financial services company) and is an employee of Fidelity Investments. Previously, Ms. Baumann served as AML Officer of the funds (2012-2016), and Vice President (2007-2014) and Deputy Anti-Money Laundering Officer (2007-2012) of FMR LLC.
Craig S. Brown (1977)
Year of Election or Appointment: 2019
Assistant Treasurer
Mr. Brown also serves as Assistant Treasurer of other funds. Mr. Brown is an employee of Fidelity Investments (2013-present).
John J. Burke III (1964)
Year of Election or Appointment: 2018
Chief Financial Officer
Mr. Burke also serves as Chief Financial Officer of other funds. Mr. Burke serves as Head of Investment Operations for Fidelity Fund and Investment Operations (2018-present) and is an employee of Fidelity Investments (1998-present). Previously Mr. Burke served as head of Asset Management Investment Operations (2012-2018).
William C. Coffey (1969)
Year of Election or Appointment: 2018
Secretary and Chief Legal Officer (CLO)
Mr. Coffey also serves as Secretary and CLO of other funds. Mr. Coffey serves as CLO, Secretary, and Senior Vice President of Fidelity Management & Research Company and FMR Co., Inc. (investment adviser firms, 2018-present); Secretary of Fidelity SelectCo, LLC and Fidelity Investments Money Management, Inc. (investment adviser firms, 2018-present); and CLO of Fidelity Management & Research (Hong Kong) Limited, FMR Investment Management (UK) Limited, and Fidelity Management & Research (Japan) Limited (investment adviser firms, 2018-present). He is Senior Vice President and Deputy General Counsel of FMR LLC (diversified financial services company, 2010-present), and is an employee of Fidelity Investments. Previously, Mr. Coffey served as Assistant Secretary of certain funds (2009-2018) and as Vice President and Associate General Counsel of FMR LLC (2005-2009).
Timothy M. Cohen (1969)
Year of Election or Appointment: 2018
Vice President
Mr. Cohen also serves as Vice President of other funds. Mr. Cohen serves as Co-Head of Global Equity Research (2016-present), a Director of Fidelity Management & Research (Japan) Limited (investment adviser firm, 2016-present), and is an employee of Fidelity Investments. Previously, Mr. Cohen served as Chief Investment Officer - Equity and a Director of Fidelity Management & Research (U.K.) Inc. (investment adviser firm, 2013-2015) and as a Director of Fidelity Management & Research (Hong Kong) Limited (investment adviser firm, 2017).
Jonathan Davis (1968)
Year of Election or Appointment: 2010
Assistant Treasurer
Mr. Davis also serves as Assistant Treasurer of other funds. Mr. Davis serves as Assistant Treasurer of FMR Capital, Inc. (2017-present) and is an employee of Fidelity Investments. Previously, Mr. Davis served as Vice President and Associate General Counsel of FMR LLC (diversified financial services company, 2003-2010).
Adrien E. Deberghes (1967)
Year of Election or Appointment: 2016
Assistant Treasurer
Mr. Deberghes also serves as an officer of other funds. He serves as Assistant Treasurer of FMR Capital, Inc. (2017-present), Executive Vice President of Fidelity Investments Money Management, Inc. (FIMM) (investment adviser firm, 2016-present), and is an employee of Fidelity Investments (2008-present). Previously, Mr. Deberghes served as President and Treasurer of certain Fidelity® funds (2013-2018). Prior to joining Fidelity Investments, Mr. Deberghes was Senior Vice President of Mutual Fund Administration at State Street Corporation (2007-2008), Senior Director of Mutual Fund Administration at Investors Bank & Trust (2005-2007), and Director of Finance for Dunkin' Brands (2000-2005). Previously, Mr. Deberghes served in other fund officer roles.
Laura M. Del Prato (1964)
Year of Election or Appointment: 2018
Assistant Treasurer
Ms. Del Prato also serves as an officer of other funds. Ms. Del Prato is an employee of Fidelity Investments (2017-present). Prior to joining Fidelity Investments, Ms. Del Prato served as a Managing Director and Treasurer of the JPMorgan Mutual Funds (2014-2017). Prior to JPMorgan, Ms. Del Prato served as a partner at Cohen Fund Audit Services (accounting firm, 2012-2013) and KPMG LLP (accounting firm, 2004-2012).
Colm A. Hogan (1973)
Year of Election or Appointment: 2016
Deputy Treasurer
Mr. Hogan also serves as an officer of other funds. Mr. Hogan serves as Assistant Treasurer of FMR Capital, Inc. (2017-present) and is an employee of Fidelity Investments (2005-present). Previously, Mr. Hogan served as Assistant Treasurer of certain Fidelity® funds (2016-2018).
Pamela R. Holding (1964)
Year of Election or Appointment: 2018
Vice President
Ms. Holding also serves as Vice President of other funds. Ms. Holding serves as Co-Head of Global Equity Research (2018-present) and is an employee of Fidelity Investments (2013-present).
Chris Maher (1972)
Year of Election or Appointment: 2013
Assistant Treasurer
Mr. Maher serves as Assistant Treasurer of other funds. Mr. Maher is Vice President of Valuation Oversight, serves as Assistant Treasurer of FMR Capital, Inc. (2017-present), and is an employee of Fidelity Investments. Previously, Mr. Maher served as Vice President of Asset Management Compliance (2013), Vice President of the Program Management Group of FMR (investment adviser firm, 2010-2013), and Vice President of Valuation Oversight (2008-2010).
Kenneth B. Robins (1969)
Year of Election or Appointment: 2016
Chief Compliance Officer
Mr. Robins also serves as an officer of other funds. Mr. Robins serves as Compliance Officer of Fidelity Management & Research Company and FMR Co., Inc. (investment adviser firms, 2016-present) and is an employee of Fidelity Investments (2004-present). Previously, Mr. Robins served as Executive Vice President of Fidelity Investments Money Management, Inc. (investment adviser firm, 2013-2016) and served in other fund officer roles.
Stacie M. Smith (1974)
Year of Election or Appointment: 2016
President and Treasurer
Ms. Smith also serves as an officer of other funds. Ms. Smith serves as Assistant Treasurer of FMR Capital, Inc. (2017-present), is an employee of Fidelity Investments (2009-present), and has served in other fund officer roles. Prior to joining Fidelity Investments, Ms. Smith served as Senior Audit Manager of Ernst & Young LLP (accounting firm, 1996-2009). Previously, Ms. Smith served as Assistant Treasurer (2013-2018) and Deputy Treasurer (2013-2016) of certain Fidelity® funds.
Marc L. Spector (1972)
Year of Election or Appointment: 2016
Assistant Treasurer
Mr. Spector also serves as an officer of other funds. Mr. Spector serves as Assistant Treasurer of FMR Capital, Inc. (2017-present) and is an employee of Fidelity Investments (2016-present). Prior to joining Fidelity Investments, Mr. Spector served as Director at the Siegfried Group (accounting firm, 2013-2016), and prior to Siegfried Group as audit senior manager at Deloitte & Touche (accounting firm, 2005-2013).
Jim Wegmann (1979)
Year of Election or Appointment: 2019
Assistant Treasurer
Mr. Wegmann also serves as Assistant Treasurer of other funds. Mr. Wegmann is an employee of Fidelity Investments (2011-present).
Shareholder Expense Example
As a shareholder of the Fund, you incur two types of costs: (1) transaction costs and (2) ongoing costs, including management fees and other Fund expenses. This Example is intended to help you understand your ongoing costs (in dollars) of investing in the Fund and to compare these costs with the ongoing costs of investing in other mutual funds.
The Example is based on an investment of $1,000 invested at the beginning of the period and held for the entire period (August 1, 2018 to January 31, 2019).
Actual Expenses
The first line of the accompanying table provides information about actual account values and actual expenses. You may use the information in this line, together with the amount you invested, to estimate the expenses that you paid over the period. Simply divide your account value by $1,000.00 (for example, an $8,600 account value divided by $1,000.00 = 8.6), then multiply the result by the number in the first line under the heading entitled "Expenses Paid During Period" to estimate the expenses you paid on your account during this period. In addition, the Fund, as a shareholder in the underlying Fidelity Central Funds, will indirectly bear its pro-rata share of the fees and expenses incurred by the underlying Fidelity Central Funds. These fees and expenses are not included in the Fund's annualized expense ratio used to calculate the expense estimate in the table below.
Hypothetical Example for Comparison Purposes
The second line of the accompanying table provides information about hypothetical account values and hypothetical expenses based on the Fund's actual expense ratio and an assumed rate of return of 5% per year before expenses, which is not the Fund's actual return. The hypothetical account values and expenses may not be used to estimate the actual ending account balance or expenses you paid for the period. You may use this information to compare the ongoing costs of investing in the Fund and other funds. To do so, compare this 5% hypothetical example with the 5% hypothetical examples that appear in the shareholder reports of the other funds. In addition, the Fund, as a shareholder in the underlying Fidelity Central Funds, will indirectly bear its pro-rata share of the fees and expenses incurred by the underlying Fidelity Central Funds. These fees and expenses are not included in the Fund's annualized expense ratio used to calculate the expense estimate in the table below.
Please note that the expenses shown in the table are meant to highlight your ongoing costs only and do not reflect any transaction costs. Therefore, the second line of the table is useful in comparing ongoing costs only, and will not help you determine the relative total costs of owning different funds.
| Annualized Expense Ratio-A | Beginning Account Value August 1, 2018 | Ending Account Value January 31, 2019 | Expenses Paid During Period-B August 1, 2018 to January 31, 2019 | |
| Actual | .45% | $1,000.00 | $925.60 | $2.18 |
| Hypothetical-C | $1,000.00 | $1,022.94 | $2.29 |
A Annualized expense ratio reflects expenses net of applicable fee waivers.
B Expenses are equal to the Fund's annualized expense ratio, multiplied by the average account value over the period, multiplied by 184/365 (to reflect the one-half year period).
C 5% return per year before expenses
Distributions (Unaudited)
The fund designates 3% and 80% of the dividends distributed in March and December, respectively during the fiscal year as qualifying for the dividends–received deduction for corporate shareholders.
The fund designates 2% and 88% of the dividends distributed in March and December, respectively during the fiscal year as amounts which may be taken into account as a dividend for the purposes of the maximum rate under section 1(h)(11) of the Internal Revenue Code.
The fund will notify shareholders in January 2020 of amounts for use in preparing 2019 income tax returns.
Board Approval of Investment Advisory Contracts and Management Fees
Fidelity Mid Cap Value K6 Fund
Each year, the Board of Trustees, including the Independent Trustees (together, the Board), votes on the renewal of the management contract with Fidelity Management & Research Company (FMR) and the sub-advisory agreements (together, the Advisory Contracts) for the fund. FMR and the sub-advisers are referred to herein as the Investment Advisers. The Board, assisted by the advice of fund counsel and Independent Trustees' counsel, requests and considers a broad range of information relevant to the renewal of the Advisory Contracts throughout the year.
The Board meets regularly and, at each of its meetings, covers an extensive agenda of topics and materials and considers factors that are relevant to its annual consideration of the renewal of the fund's Advisory Contracts, including the services and support provided to the fund and its shareholders. The Board has established various standing committees (Committees), each composed of and chaired by Independent Trustees with varying backgrounds, to which the Board has assigned specific subject matter responsibilities in order to enhance effective decision-making by the Board. The Board, acting directly and through its Committees, requests and receives information concerning the annual consideration of the renewal of the fund's Advisory Contracts. The Board also meets as needed to review matters specifically related to the Board's annual consideration of the renewal of the Advisory Contracts. Members of the Board may also meet with trustees of other Fidelity funds through joint ad hoc committees to discuss certain matters relevant to all of the Fidelity funds.
At its January 2019 meeting, the Board unanimously determined to renew the fund's Advisory Contracts. In reaching its determination, the Board considered all factors it believed relevant, including (i) the nature, extent, and quality of the services to be provided to the fund and its shareholders (including the investment performance of the fund); (ii) the competitiveness of the fund's management fee and total expense ratio relative to peer funds; (iii) the total costs of the services to be provided by and the profits to be realized by Fidelity from its relationships with the fund; and (iv) the extent to which, if any, economies of scale exist and would be realized as the fund grows, and whether any economies of scale are appropriately shared with fund shareholders.
In considering whether to renew the Advisory Contracts for the fund, the Board reached a determination, with the assistance of fund counsel and Independent Trustees' counsel and through the exercise of its business judgment, that the renewal of the Advisory Contracts was in the best interests of the fund and its shareholders and that the compensation payable under the Advisory Contracts was fair and reasonable. The Board's decision to renew the Advisory Contracts was not based on any single factor, but rather was based on a comprehensive consideration of all the information provided to the Board at its meetings throughout the year. The Board, in reaching its determination to renew the Advisory Contracts, was aware that shareholders of the fund have a broad range of investment choices available to them, including a wide choice among funds offered by Fidelity's competitors, and that the fund's shareholders, who have the opportunity to review and weigh the disclosure provided by the fund in its prospectus and other public disclosures, have chosen to invest in this fund, which is part of the Fidelity family of funds.
Nature, Extent, and Quality of Services Provided. The Board considered Fidelity's staffing as it relates to the fund, including the backgrounds of investment personnel of Fidelity, and also considered the fund's investment objective, strategies, and related investment philosophy. The Independent Trustees also had discussions with senior management of Fidelity's investment operations and investment groups. The Board considered the structure of the investment personnel compensation program and whether this structure provides appropriate incentives to act in the best interests of the fund. Additionally, the Board considered the portfolio managers' investments, if any, in the funds that they manage.Resources Dedicated to Investment Management and Support Services. The Board and the Fund Oversight and Research Committees reviewed the general qualifications and capabilities of Fidelity's investment staff, including its size, education, experience, and resources, as well as Fidelity's approach to recruiting, training, managing, and compensating investment personnel. The Board noted that Fidelity has continued to increase the resources devoted to non-U.S. offices, including expansion of Fidelity's global investment organization. The Board also noted that Fidelity's analysts have extensive resources, tools and capabilities that allow them to conduct sophisticated quantitative and fundamental analysis, as well as credit analysis of issuers, counterparties and guarantors. Further, the Board considered that Fidelity's investment professionals have sufficient access to global information and data so as to provide competitive investment results over time, and that those professionals also have access to sophisticated tools that permit them to assess portfolio construction and risk and performance attribution characteristics continuously, as well as to transmit new information and research conclusions rapidly around the world. Additionally, in its deliberations, the Board considered Fidelity's trading, risk management, compliance, and technology and operations capabilities and resources, which are integral parts of the investment management process.Shareholder and Administrative Services. The Board considered (i) the nature, extent, quality, and cost of advisory, administrative, and shareholder services performed by the Investment Advisers and their affiliates under the Advisory Contracts and under separate agreements covering transfer agency, pricing and bookkeeping, and securities lending services for the fund; (ii) the nature and extent of the supervision of third party service providers, principally custodians, subcustodians, and pricing vendors; and (iii) the resources devoted to, and the record of compliance with, the fund's compliance policies and procedures. The Board also reviewed the allocation of fund brokerage, including allocations to brokers affiliated with the Investment Advisers, the use of brokerage commissions to pay fund expenses, and the use of "soft" commission dollars to pay for research services.The Board noted that the growth of fund assets over time across the complex allows Fidelity to reinvest in the development of services designed to enhance the value and convenience of the Fidelity funds as investment vehicles. These services include 24-hour access to account information and market information through telephone representatives and over the Internet, investor education materials and asset allocation tools, and the expanded availability of Fidelity Investor Centers.The Board noted that it and the boards of certain other Fidelity funds had formed an ad hoc Committee on Transfer Agency Fees to review the variety of transfer agency fee structures throughout the industry and Fidelity's competitive positioning with respect to industry participants.Investment in a Large Fund Family. The Board considered the benefits to shareholders of investing in a Fidelity fund, including the benefits of investing in a fund that is part of a large family of funds offering a variety of investment disciplines and providing a large variety of mutual fund investor services. The Board noted that Fidelity had taken, or had made recommendations that resulted in the Fidelity funds taking, a number of actions over the previous year that benefited particular funds, including: (i) continuing to dedicate additional resources to Fidelity's investment research process, which includes meetings with management of issuers of securities in which the funds invest, and to the support of the senior management team that oversees asset management; (ii) continuing efforts to enhance Fidelity's global research capabilities; (iii) launching new funds and making other enhancements to meet client needs; (iv) launching new share classes of existing funds; (v) eliminating purchase minimums and broadening eligibility requirements for certain funds and share classes; (vi) reducing management fees and total expenses for certain growth equity funds and index funds; (vii) lowering expense caps for certain existing funds and classes, and converting certain voluntary expense caps to contractual caps, to reduce expenses borne by shareholders; (viii) eliminating short-term redemption fees for funds that had such fees; (ix) rationalizing product lines and gaining increased efficiencies from fund mergers and share class consolidations; (x) continuing to develop, acquire and implement systems and technology to improve services to the funds and shareholders, strengthen information security, and increase efficiency; and (xi) continuing to implement enhancements to further strengthen Fidelity's product line to increase investors' probability of success in achieving their investment goals, including retirement income goals.Investment Performance. The Board considered whether the fund has operated in accordance with its investment objective, as well as its record of compliance with its investment restrictions and its performance history.The Board took into account discussions that occur at Board meetings throughout the year with representatives of the Investment Advisers about fund investment performance. In this regard the Board noted that as part of regularly scheduled fund reviews and other reports to the Board on fund performance, the Board considers annualized return information for the fund for different time periods, measured against an appropriate securities market index ("benchmark index") and a peer group of funds with similar objectives ("peer group"), if any. In its evaluation of fund investment performance, the Board gave particular attention to information indicating changes in performance of certain Fidelity funds for specific time periods and discussed with the Investment Advisers the reasons for any overperformance or underperformance.In addition to reviewing absolute and relative fund performance, the Independent Trustees periodically consider the appropriateness of fund performance metrics in evaluating the results achieved. In general, the Independent Trustees believe that fund performance should be evaluated based on net performance (after fees and expenses) of both the highest performing and lowest performing fund share classes, where applicable, compared to appropriate benchmark indices, over appropriate time periods that may include full market cycles, and compared to peer groups, as applicable, over the same periods, taking into account relevant factors including the following: general market conditions; issuer-specific information; and fund cash flows and other factors.The Independent Trustees recognize that shareholders evaluate performance on a net basis over their own holding periods, for which one-, three-, and five-year periods are often used as a proxy. For this reason, the performance information reviewed by the Board also included net total return information for the fund and an appropriate benchmark index and peer group for the most recent one-year period ended June 30, 2018, as shown below. Returns are shown compared to the 25th percentile (top of box, 75% beaten) and 75th percentile (bottom of box, 25% beaten) of the peer universe.Fidelity Mid Cap Value K6 Fund

Fidelity Mid Cap Value K6 Fund

![]()
MCVK6-ANN-0319
1.9883983.101
Item 2.
Code of Ethics
As of the end of the period, January 31, 2019, Fidelity Devonshire Trust (the trust) has adopted a code of ethics, as defined in Item 2 of Form N-CSR, that applies to its President and Treasurer and its Chief Financial Officer. A copy of the code of ethics is filed as an exhibit to this Form N-CSR.
Item 3.
Audit Committee Financial Expert
The Board of Trustees of the trust has determined that Joseph Mauriello is an audit committee financial expert, as defined in Item 3 of Form N-CSR. Mr. Mauriello is independent for purposes of Item 3 of Form N-CSR.
Item 4.
Principal Accountant Fees and Services
Fees and Services
The following table presents fees billed by Deloitte & Touche LLP, the member firms of Deloitte Touche Tohmatsu, and their respective affiliates (collectively, “Deloitte Entities”) in each of the last two fiscal years for services rendered to Fidelity Flex Mid Cap Value Fund, Fidelity Mid Cap Value K6 Fund, Fidelity Series All-Sector Equity Fund and Fidelity Series Value Discovery Fund (the “Funds”):
Services Billed by Deloitte Entities
January 31, 2019 FeesA
| Audit Fees | Audit-Related Fees | Tax Fees | All Other Fees |
Fidelity Flex Mid Cap Value Fund | $37,000 | $100 | $5,200 | $1,000 |
Fidelity Mid Cap Value K6 Fund | $50,000 | $100 | $5,200 | $1,000 |
Fidelity Series All-Sector Equity Fund | $44,000 | $100 | $5,100 | $1,300 |
Fidelity Series Value Discovery Fund | $53,000 | $100 | $9,200 | $1,400 |
January 31, 2018 FeesA,B
| Audit Fees | Audit-Related Fees | Tax Fees | All Other Fees |
Fidelity Flex Mid Cap Value Fund | $33,000 | $- | $4,800 | $800 |
Fidelity Mid Cap Value K6 Fund | $33,000 | $- | $4,800 | $600 |
Fidelity Series All-Sector Equity Fund | $45,000 | $100 | $5,100 | $1,300 |
Fidelity Series Value Discovery Fund | $47,000 | $100 | $9,100 | $1,400 |
AAmounts may reflect rounding.
BFidelity Flex Mid Cap Value Fund commenced operations on March 8, 2017 and Fidelity Mid Cap Value K6 Fund commenced operations on May 25, 2017.
The following table presents fees billed by PricewaterhouseCoopers LLP (“PwC”) in each of the last two fiscal years for services rendered to Fidelity Equity-Income Fund, Fidelity Flex Large Cap Value Fund, Fidelity Mid Cap Value Fund, Fidelity Series Stock Selector Large Cap Value Fund and Fidelity Stock Selector Large Cap Value Fund (the “Funds”):
Services Billed by PwC
January 31, 2019 FeesA
| Audit Fees | Audit-Related Fees | Tax Fees | All Other Fees |
Fidelity Equity-Income Fund | $64,000 | $5,700 | $4,500 | $2,800 |
Fidelity Flex Large Cap Value Fund | $42,000 | $3,200 | $2,600 | $1,600 |
Fidelity Mid Cap Value Fund | $49,000 | $4,300 | $5,700 | $2,100 |
Fidelity Series Stock Selector Large Cap Value Fund | $43,000 | $2,500 | $2,600 | $1,200 |
Fidelity Stock Selector Large Cap Value Fund | $49,000 | $4,300 | $3,300 | $2,100 |
|
|
|
|
|
January 31, 2018 FeesA,B
| Audit Fees | Audit-Related Fees | Tax Fees | All Other Fees |
Fidelity Equity-Income Fund | $66,000 | $6,000 | $7,800 | $2,900 |
Fidelity Flex Large Cap Value Fund | $37,000 | $2,800 | $2,600 | $1,300 |
Fidelity Mid Cap Value Fund | $61,000 | $4,500 | $3,500 | $2,200 |
Fidelity Series Stock Selector Large Cap Value Fund | $45,000 | $4,100 | $3,700 | $2,000 |
Fidelity Stock Selector Large Cap Value Fund | $51,000 | $4,500 | $3,300 | $2,200 |
|
|
|
|
|
|
|
|
|
|
AAmounts may reflect rounding.
BFidelity Flex Large Cap Value Fund commenced operations on March 7, 2017.
The following table presents fees billed by PwC and Deloitte Entities that were required to be approved by the Audit Committee for services that relate directly to the operations and financial reporting of the Funds and that are rendered on behalf of Fidelity Management & Research Company (“FMR”) and entities controlling, controlled by, or under common control with FMR (not including any sub-adviser whose role is primarily portfolio management and is subcontracted with or overseen by another investment adviser) that provide ongoing services to the Funds (“Fund Service Providers”):
Services Billed by Deloitte Entities
| January 31, 2019A | January 31, 2018A,B |
Audit-Related Fees | $290,000 | $3,000 |
Tax Fees | $5,000 | $20,000 |
All Other Fees | $- | $- |
A Amounts may reflect rounding.
BMay include amounts billed prior to the Fidelity Flex Mid Cap Value Fund and Fidelity Mid Cap Value K6 Fund’s commencement of operations.
Services Billed by PwC
| January 31, 2019A | January 31, 2018A,B |
Audit-Related Fees | $7,930,000 | $8,510,000 |
Tax Fees | $20,000 | $115,000 |
All Other Fees | $- | $- |
A Amounts may reflect rounding.
BMay include amounts billed prior to the Fidelity Flex Large Cap Value Fund’s commencement of operations.
“Audit-Related Fees” represent fees billed for assurance and related services that are reasonably related to the performance of the fund audit or the review of the fund's financial statements and that are not reported under Audit Fees.
“Tax Fees” represent fees billed for tax compliance, tax advice or tax planning that relate directly to the operations and financial reporting of the fund.
“All Other Fees” represent fees billed for services provided to the fund or Fund Service Provider, a significant portion of which are assurance related, that relate directly to the operations and financial reporting of the fund, excluding those services that are reported under Audit Fees, Audit-Related Fees or Tax Fees.
Assurance services must be performed by an independent public accountant.
* * *
The aggregate non-audit fees billed by PwC and Deloitte Entities for services rendered to the Funds, FMR (not including any sub-adviser whose role is primarily portfolio management and is subcontracted with or overseen by another investment adviser), and any Fund Service Provider for each of the last two fiscal years of the Funds are as follows:
Billed By | January 31, 2019A | January 31, 2018A,B |
Deloitte Entities | $785,000 | $335,000 |
PwC | $11,175,000 | $10,865,000 |
|
|
|
A Amounts may reflect rounding.
BMay include amounts billed prior to the Fidelity Flex Mid Cap Value Fund, Fidelity Mid Cap Value K6 Fund and Fidelity Flex Large Cap Value Fund’s commencement of operations.
The trust's Audit Committee has considered non-audit services that were not pre-approved that were provided by PwC and Deloitte Entities to Fund Service Providers to be compatible with maintaining the independence of PwC and Deloitte Entities in their audits of the Funds, taking into account representations from PwC and Deloitte Entities, in accordance with Public Company Accounting Oversight Board rules, regarding their independence from the Funds and their related entities and FMR’s review of the appropriateness and permissibility under applicable law of such non-audit services prior to their provision to the Fund Service Providers.
Audit Committee Pre-Approval Policies and Procedures
The trust’s Audit Committee must pre-approve all audit and non-audit services provided by a fund’s independent registered public accounting firm relating to the operations or financial reporting of the fund. Prior to the commencement of any audit or non-audit services to a fund, the Audit Committee reviews the services to determine whether they are appropriate and permissible under applicable law.
The Audit Committee has adopted policies and procedures to, among other purposes, provide a framework for the Committee’s consideration of non-audit services by the audit firms that audit the Fidelity funds. The policies and procedures require that any non-audit service provided by a fund audit firm to a Fidelity fund and any non-audit service provided by a fund auditor to a Fund Service Provider that relates directly to the operations and financial reporting of a Fidelity fund (“Covered Service”) are subject to approval by the Audit Committee before such service is provided.
All Covered Services must be approved in advance of provision of the service either: (i) by formal resolution of the Audit Committee, or (ii) by oral or written approval of the service by the Chair of the Audit Committee (or if the Chair is unavailable, such other member of the Audit Committee as may be designated by the Chair to act in the Chair’s absence). The approval contemplated by (ii) above is permitted where the Treasurer determines that action on such an engagement is necessary before the next meeting of the Audit Committee.
Non-audit services provided by a fund audit firm to a Fund Service Provider that do not relate directly to the operations and financial reporting of a Fidelity fund are reported to the Audit Committee periodically.
Non-Audit Services Approved Pursuant to Rule 2-01(c)(7)(i)(C) and (ii) of Regulation S-X (“De Minimis Exception”)
There were no non-audit services approved or required to be approved by the Audit Committee pursuant to the De Minimis Exception during the Funds’ last two fiscal years relating to services provided to (i) the Funds or (ii) any Fund Service Provider that relate directly to the operations and financial reporting of the Funds.
Item 5.
Audit Committee of Listed Registrants
Not applicable.
Item 6.
Investments
(a)
Not applicable.
(b)
Not applicable
Item 7.
Disclosure of Proxy Voting Policies and Procedures for Closed-End Management Investment Companies
Not applicable.
Item 8.
Portfolio Managers of Closed-End Management Investment Companies
Not applicable.
Item 9.
Purchase of Equity Securities by Closed-End Management Investment Company and Affiliated Purchasers
Not applicable.
Item 10.
Submission of Matters to a Vote of Security Holders
There were no material changes to the procedures by which shareholders may recommend nominees to the trust’s Board of Trustees.
Item 11.
Controls and Procedures
(a)(i) The President and Treasurer and the Chief Financial Officer have concluded that the trust’s disclosure controls and procedures (as defined in Rule 30a-3(c) under the Investment Company Act) provide reasonable assurances that material information relating to the trust is made known to them by the appropriate persons, based on their evaluation of these controls and procedures as of a date within 90 days of the filing date of this report.
(a)(ii) There was no change in the trust’s internal control over financial reporting (as defined in Rule 30a-3(d) under the Investment Company Act) that occurred during the period covered by this report that has materially affected, or is reasonably likely to materially affect, the trust’s internal control over financial reporting.
Item 12.
Disclosure of Securities Lending Activities for Closed-End Management
Investment Companies
Not applicable.
Item 13.
Exhibits
(a) | (1) | Code of Ethics pursuant to Item 2 of Form N-CSR is filed and attached hereto as EX-99.CODE ETH. |
(a) | (2) | Certification pursuant to Rule 30a-2(a) under the Investment Company Act of 1940 (17 CFR 270.30a-2(a)) is filed and attached hereto as Exhibit 99.CERT. |
(a) | (3) | Not applicable. |
(b) |
| Certification pursuant to Rule 30a-2(b) under the Investment Company Act of 1940 (17 CFR 270.30a-2(b)) is furnished and attached hereto as Exhibit 99.906CERT. |
SIGNATURES
Pursuant to the requirements of the Securities Exchange Act of 1934 and the Investment Company Act of 1940, the registrant has duly caused this report to be signed on its behalf by the undersigned, thereunto duly authorized.
Fidelity Devonshire Trust
By: | /s/Stacie M. Smith |
| Stacie M. Smith |
| President and Treasurer |
|
|
Date: | March 27, 2019 |
Pursuant to the requirements of the Securities Exchange Act of 1934 and the Investment Company Act of 1940, this report has been signed below by the following persons on behalf of the registrant and in the capacities and on the dates indicated.
By: | /s/Stacie M. Smith |
| Stacie M. Smith |
| President and Treasurer |
|
|
Date: | March 27, 2019 |
By: | /s/John J. Burke III |
| John J. Burke III |
| Chief Financial Officer |
|
|
Date: | March 27, 2019 |