UNITED STATES
SECURITIES AND EXCHANGE COMMISSION
Washington, D.C. 20549
FORM N-CSR
CERTIFIED SHAREHOLDER REPORT OF REGISTERED
MANAGEMENT INVESTMENT COMPANIES
Investment Company Act file number 811-00215
Fidelity Hastings Street Trust
(Exact name of registrant as specified in charter)
245 Summer St., Boston, MA 02210
(Address of principal executive offices) (Zip code)
Cynthia Lo Bessette, Secretary
245 Summer St.
Boston, Massachusetts 02210
(Name and address of agent for service)
Registrant's telephone number, including area code:
617-563-7000
| |
Date of fiscal year end: | June 30 |
|
|
Date of reporting period: | December 31, 2022 |
Item 1.
Reports to Stockholders
Fidelity® Mega Cap Stock Fund
Semi-Annual Report
December 31, 2022
Includes Fidelity and Fidelity Advisor share classes
Contents
To view a fund's proxy voting guidelines and proxy voting record for the 12-month period ended June 30, visit http://www.fidelity.com/proxyvotingresults or visit the Securities and Exchange Commission's (SEC) web site at http://www.sec.gov.
You may also call 1-800-544-8544 if you're an individual investing directly with Fidelity, call 1-800-835-5092 if you're a plan sponsor or participant with Fidelity as your recordkeeper or call 1-877-208-0098 on institutional accounts or if you're an advisor or invest through one to request a free copy of the proxy voting guidelines.
Standard & Poor's, S&P and S&P 500 are registered service marks of The McGraw-Hill Companies, Inc. and have been licensed for use by Fidelity Distributors Corporation.
Other third-party marks appearing herein are the property of their respective owners.
All other marks appearing herein are registered or unregistered trademarks or service marks of FMR LLC or an affiliated company. © 2023 FMR LLC. All rights reserved.
This report and the financial statements contained herein are submitted for the general information of the shareholders of the Fund. This report is not authorized for distribution to prospective investors in the Fund unless preceded or accompanied by an effective prospectus.
A fund files its complete schedule of portfolio holdings with the SEC for the first and third quarters of each fiscal year on Form N-PORT. Forms N-PORT are available on the SEC's web site at http://www.sec.gov. A fund's Forms N-PORT may be reviewed and copied at the SEC's Public Reference Room in Washington, DC. Information regarding the operation of the SEC's Public Reference Room may be obtained by calling 1-800-SEC-0330.
For a complete list of a fund's portfolio holdings, view the most recent holdings listing, semiannual report, or annual report on Fidelity's web site at http://www.fidelity.com, http://www.institutional.fidelity.com, or http://www.401k.com, as applicable.
NOT FDIC INSURED •MAY LOSE VALUE •NO BANK GUARANTEE
Neither the Fund nor Fidelity Distributors Corporation is a bank.
Top Holdings (% of Fund's net assets) |
| |
| Exxon Mobil Corp.* | 9.4 | |
| General Electric Co. | 6.7 | |
| Microsoft Corp. | 6.2 | |
| Wells Fargo & Co. | 5.7 | |
| Apple, Inc. | 4.4 | |
| Bank of America Corp. | 4.2 | |
| JPMorgan Chase & Co. | 2.8 | |
| The Boeing Co. | 2.5 | |
| Alphabet, Inc. Class A | 2.5 | |
| Alphabet, Inc. Class C | 2.4 | |
| | 46.8 | |
| |
*Security or a portion of the security is pledged as collateral for call options written.
| Market Sectors (% of Fund's net assets) |
| |
| Information Technology | 19.4 | |
| Financials | 15.9 | |
| Industrials | 15.0 | |
| Energy | 13.8 | |
| Health Care | 12.0 | |
| Communication Services | 8.7 | |
| Consumer Staples | 4.5 | |
| Consumer Discretionary | 4.0 | |
| Materials | 3.7 | |
| Real Estate | 0.8 | |
| Utilities | 0.2 | |
| |
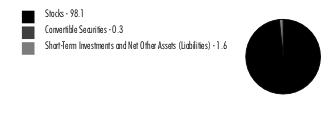
Asset Allocation (% of Fund's net assets) |
|
Foreign investments - 10% |
Written options - (0.0)% |
Percentages shown as 0.0% may reflect amounts less than 0.05%. |
|
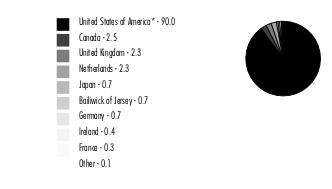
Geographic Diversification (% of Fund's net assets) |
|
* Includes Short-Term investments and Net Other Assets (Liabilities). Percentages are based on country or territory of incorporation and are adjusted for the effect of derivatives, if applicable. |
| |
Showing Percentage of Net Assets
| Common Stocks - 98.0% |
| | | Shares | Value ($) |
| COMMUNICATION SERVICES - 8.7% | | | |
| Entertainment - 1.5% | | | |
| The Walt Disney Co. (a) | | 111,099 | 9,652,281 |
| Universal Music Group NV | | 421,599 | 10,195,398 |
| | | | 19,847,679 |
| Interactive Media & Services - 5.8% | | | |
| Alphabet, Inc.: | | | |
| Class A (a) | | 357,100 | 31,506,933 |
| Class C (a) | | 339,900 | 30,159,327 |
| Meta Platforms, Inc. Class A (a) | | 99,900 | 12,021,966 |
| | | | 73,688,226 |
| Media - 1.4% | | | |
| Charter Communications, Inc. Class A (a) | | 1,600 | 542,560 |
| Comcast Corp. Class A | | 485,297 | 16,970,836 |
| | | | 17,513,396 |
TOTAL COMMUNICATION SERVICES | | | 111,049,301 |
| CONSUMER DISCRETIONARY - 4.0% | | | |
| Hotels, Restaurants & Leisure - 1.8% | | | |
| Booking Holdings, Inc. (a) | | 8,948 | 18,032,725 |
| Marriott International, Inc. Class A | | 23,600 | 3,513,804 |
| Starbucks Corp. | | 6,100 | 605,120 |
| | | | 22,151,649 |
| Household Durables - 0.7% | | | |
| Sony Group Corp. sponsored ADR | | 121,000 | 9,229,880 |
| Internet & Direct Marketing Retail - 0.2% | | | |
| Amazon.com, Inc. (a) | | 28,800 | 2,419,200 |
| Specialty Retail - 1.2% | | | |
| Lowe's Companies, Inc. | | 66,311 | 13,211,804 |
| TJX Companies, Inc. | | 17,700 | 1,408,920 |
| | | | 14,620,724 |
| Textiles, Apparel & Luxury Goods - 0.1% | | | |
| NIKE, Inc. Class B | | 15,100 | 1,766,851 |
TOTAL CONSUMER DISCRETIONARY | | | 50,188,304 |
| CONSUMER STAPLES - 4.5% | | | |
| Beverages - 2.6% | | | |
| Diageo PLC | | 364,862 | 15,970,694 |
| Keurig Dr. Pepper, Inc. | | 163,700 | 5,837,542 |
| The Coca-Cola Co. | | 178,500 | 11,354,385 |
| | | | 33,162,621 |
| Food & Staples Retailing - 1.3% | | | |
| Costco Wholesale Corp. | | 1,300 | 593,450 |
| Sysco Corp. | | 119,799 | 9,158,634 |
| Walmart, Inc. | | 51,900 | 7,358,901 |
| | | | 17,110,985 |
| Food Products - 0.1% | | | |
| Mondelez International, Inc. | | 17,900 | 1,193,035 |
| Personal Products - 0.3% | | | |
| Estee Lauder Companies, Inc. Class A | | 500 | 124,055 |
| Haleon PLC ADR (a) | | 402,633 | 3,221,064 |
| | | | 3,345,119 |
| Tobacco - 0.2% | | | |
| Altria Group, Inc. | | 52,390 | 2,394,747 |
TOTAL CONSUMER STAPLES | | | 57,206,507 |
| ENERGY - 13.8% | | | |
| Oil, Gas & Consumable Fuels - 13.8% | | | |
| Canadian Natural Resources Ltd. | | 361,500 | 20,074,095 |
| Exxon Mobil Corp. (b) | | 1,079,987 | 119,122,569 |
| Hess Corp. | | 177,316 | 25,146,955 |
| Imperial Oil Ltd. | | 231,700 | 11,285,535 |
| | | | 175,629,154 |
| FINANCIALS - 15.9% | | | |
| Banks - 14.3% | | | |
| Bank of America Corp. | | 1,626,751 | 53,877,993 |
| JPMorgan Chase & Co. | | 260,430 | 34,923,663 |
| PNC Financial Services Group, Inc. | | 76,131 | 12,024,130 |
| U.S. Bancorp | | 184,312 | 8,037,846 |
| Wells Fargo & Co. | | 1,753,406 | 72,398,134 |
| | | | 181,261,766 |
| Capital Markets - 0.4% | | | |
| Charles Schwab Corp. | | 58,800 | 4,895,688 |
| Consumer Finance - 0.1% | | | |
| American Express Co. | | 9,500 | 1,403,625 |
| Diversified Financial Services - 1.1% | | | |
| Berkshire Hathaway, Inc. Class B (a) | | 45,900 | 14,178,510 |
TOTAL FINANCIALS | | | 201,739,589 |
| HEALTH CARE - 12.0% | | | |
| Health Care Equipment & Supplies - 2.4% | | | |
| Abbott Laboratories | | 24,900 | 2,733,771 |
| Boston Scientific Corp. (a) | | 460,219 | 21,294,333 |
| Koninklijke Philips Electronics NV (depositary receipt) (NY Reg.) | | 123,212 | 1,846,948 |
| Medtronic PLC | | 54,296 | 4,219,885 |
| | | | 30,094,937 |
| Health Care Providers & Services - 3.4% | | | |
| Cigna Corp. | | 34,262 | 11,352,371 |
| Humana, Inc. | | 5,000 | 2,560,950 |
| UnitedHealth Group, Inc. | | 55,298 | 29,317,894 |
| | | | 43,231,215 |
| Life Sciences Tools & Services - 0.8% | | | |
| Danaher Corp. | | 39,410 | 10,460,202 |
| Pharmaceuticals - 5.4% | | | |
| Bristol-Myers Squibb Co. | | 301,899 | 21,721,633 |
| Eli Lilly & Co. | | 27,000 | 9,877,680 |
| GSK PLC sponsored ADR | | 277,466 | 9,750,155 |
| Johnson & Johnson | | 131,213 | 23,178,776 |
| Sanofi SA sponsored ADR | | 74,173 | 3,592,198 |
| | | | 68,120,442 |
TOTAL HEALTH CARE | | | 151,906,796 |
| INDUSTRIALS - 15.0% | | | |
| Aerospace & Defense - 4.6% | | | |
| Airbus Group NV | | 118,200 | 14,054,276 |
| Raytheon Technologies Corp. | | 123,130 | 12,426,280 |
| The Boeing Co. (a) | | 166,000 | 31,621,340 |
| | | | 58,101,896 |
| Air Freight & Logistics - 1.8% | | | |
| FedEx Corp. | | 5,500 | 952,600 |
| United Parcel Service, Inc. Class B | | 124,279 | 21,604,661 |
| | | | 22,557,261 |
| Building Products - 0.0% | | | |
| Johnson Controls International PLC | | 8,500 | 544,000 |
| Electrical Equipment - 0.4% | | | |
| Rockwell Automation, Inc. | | 18,100 | 4,662,017 |
| Industrial Conglomerates - 6.7% | | | |
| General Electric Co. | | 1,017,594 | 85,264,201 |
| Machinery - 1.5% | | | |
| Caterpillar, Inc. | | 51,000 | 12,217,560 |
| Deere & Co. | | 17,380 | 7,451,849 |
| | | | 19,669,409 |
TOTAL INDUSTRIALS | | | 190,798,784 |
| INFORMATION TECHNOLOGY - 19.4% | | | |
| IT Services - 3.9% | | | |
| Fidelity National Information Services, Inc. | | 49,800 | 3,378,930 |
| Fiserv, Inc. (a) | | 23,000 | 2,324,610 |
| Kyndryl Holdings, Inc. (a) | | 220 | 2,446 |
| MasterCard, Inc. Class A | | 25,352 | 8,815,651 |
| PayPal Holdings, Inc. (a) | | 49,200 | 3,504,024 |
| Twilio, Inc. Class A (a) | | 22,900 | 1,121,184 |
| Visa, Inc. Class A | | 142,788 | 29,665,635 |
| | | | 48,812,480 |
| Semiconductors & Semiconductor Equipment - 3.4% | | | |
| Applied Materials, Inc. | | 131,674 | 12,822,414 |
| ASML Holding NV | | 5,136 | 2,806,310 |
| Intel Corp. | | 121,500 | 3,211,245 |
| Lam Research Corp. | | 20,100 | 8,448,030 |
| NVIDIA Corp. | | 20,000 | 2,922,800 |
| Qualcomm, Inc. | | 106,316 | 11,688,381 |
| Taiwan Semiconductor Manufacturing Co. Ltd. sponsored ADR | | 19,900 | 1,482,351 |
| | | | 43,381,531 |
| Software - 7.7% | | | |
| Adobe, Inc. (a) | | 17,210 | 5,791,681 |
| Intuit, Inc. | | 6,300 | 2,452,086 |
| Microsoft Corp. | | 327,466 | 78,532,896 |
| Salesforce.com, Inc. (a) | | 17,900 | 2,373,361 |
| SAP SE sponsored ADR | | 83,300 | 8,595,727 |
| | | | 97,745,751 |
| Technology Hardware, Storage & Peripherals - 4.4% | | | |
| Apple, Inc. | | 430,942 | 55,992,294 |
TOTAL INFORMATION TECHNOLOGY | | | 245,932,056 |
| MATERIALS - 3.7% | | | |
| Chemicals - 0.8% | | | |
| DuPont de Nemours, Inc. | | 124,118 | 8,518,218 |
| Linde PLC | | 4,500 | 1,467,810 |
| | | | 9,986,028 |
| Metals & Mining - 2.9% | | | |
| Freeport-McMoRan, Inc. | | 730,200 | 27,747,600 |
| Glencore PLC | | 1,361,900 | 9,082,031 |
| | | | 36,829,631 |
TOTAL MATERIALS | | | 46,815,659 |
| REAL ESTATE - 0.8% | | | |
| Equity Real Estate Investment Trusts (REITs) - 0.8% | | | |
| American Tower Corp. | | 9,700 | 2,055,042 |
| Crown Castle International Corp. | | 2,700 | 366,228 |
| Simon Property Group, Inc. | | 66,100 | 7,765,428 |
| | | | 10,186,698 |
| UTILITIES - 0.2% | | | |
| Electric Utilities - 0.2% | | | |
| NextEra Energy, Inc. | | 2,600 | 217,360 |
| Southern Co. | | 29,100 | 2,078,031 |
| | | | 2,295,391 |
| TOTAL COMMON STOCKS (Cost $807,687,612) | | | 1,243,748,239 |
| | | | |
| Money Market Funds - 1.7% |
| | | Shares | Value ($) |
Fidelity Cash Central Fund 4.37% (c) (Cost $21,869,058) | | 21,864,685 | 21,869,058 |
| | | | |
| TOTAL INVESTMENT IN SECURITIES - 99.7% (Cost $829,556,670) | 1,265,617,297 |
NET OTHER ASSETS (LIABILITIES) - 0.3% | 3,989,892 |
| NET ASSETS - 100.0% | 1,269,607,189 |
| | |
| Written Options |
| | Counterparty | Number of Contracts | Notional Amount ($) | Exercise Price ($) | Expiration Date | Value ($) |
| Call Options | | | | | | |
| Exxon Mobil Corp. | Chicago Board Options Exchange | 500 | 5,515,000 | 110.00 | 01/20/23 | (163,750) |
| Exxon Mobil Corp. | Chicago Board Options Exchange | 1,000 | 11,030,000 | 115.00 | 03/17/23 | (410,877) |
| | | | | | | |
| TOTAL WRITTEN OPTIONS | | | | | | (574,627) |
Legend
| (b) | Security or a portion of the security is pledged as collateral for call options written. At period end, the value of securities pledged amounted to $16,545,000. |
| (c) | Affiliated fund that is generally available only to investment companies and other accounts managed by Fidelity Investments. The rate quoted is the annualized seven-day yield of the fund at period end. A complete unaudited listing of the fund's holdings as of its most recent quarter end is available upon request. In addition, each Fidelity Central Fund's financial statements are available on the SEC's website or upon request. |
Affiliated Central Funds
Fiscal year to date information regarding the Fund's investments in Fidelity Central Funds, including the ownership percentage, is presented below.
| Affiliate | Value, beginning of period ($) | Purchases ($) | Sales Proceeds ($) | Dividend Income ($) | Realized Gain (loss) ($) | Change in Unrealized appreciation (depreciation) ($) | Value, end of period ($) | % ownership, end of period |
| Fidelity Cash Central Fund 4.37% | 23,229,078 | 39,049,306 | 40,409,326 | 146,791 | - | - | 21,869,058 | 0.1% |
| Fidelity Securities Lending Cash Central Fund 4.37% | - | 65,879,024 | 65,879,024 | 1,999 | - | - | - | 0.0% |
| Total | 23,229,078 | 104,928,330 | 106,288,350 | 148,790 | - | - | 21,869,058 | |
| | | | | | | | | |
Amounts in the dividend income column in the above table include any capital gain distributions from underlying funds, which are presented in the corresponding line item in the Statement of Operations, if applicable.
Amount for Fidelity Securities Lending Cash Central Fund represents the income earned on investing cash collateral, less rebates paid to borrowers and any lending agent fees associated with the loan, plus any premium payments received for lending certain types of securities.
Amounts included in the purchases and sales proceeds columns may include in-kind transactions, if applicable.
Investment Valuation
The following is a summary of the inputs used, as of December 31, 2022, involving the Fund's assets and liabilities carried at fair value. The inputs or methodology used for valuing securities may not be an indication of the risk associated with investing in those securities. For more information on valuation inputs, and their aggregation into the levels used below, please refer to the Investment Valuation section in the accompanying Notes to Financial Statements.
| Valuation Inputs at Reporting Date: |
| Description | Total ($) | Level 1 ($) | Level 2 ($) | Level 3 ($) |
Investments in Securities: | | | | |
|
| Equities: | | | | |
Communication Services | 111,049,301 | 100,853,903 | 10,195,398 | - |
Consumer Discretionary | 50,188,304 | 50,188,304 | - | - |
Consumer Staples | 57,206,507 | 41,235,813 | 15,970,694 | - |
Energy | 175,629,154 | 175,629,154 | - | - |
Financials | 201,739,589 | 201,739,589 | - | - |
Health Care | 151,906,796 | 151,906,796 | - | - |
Industrials | 190,798,784 | 176,744,508 | 14,054,276 | - |
Information Technology | 245,932,056 | 245,932,056 | - | - |
Materials | 46,815,659 | 37,733,628 | 9,082,031 | - |
Real Estate | 10,186,698 | 10,186,698 | - | - |
Utilities | 2,295,391 | 2,295,391 | - | - |
|
| Money Market Funds | 21,869,058 | 21,869,058 | - | - |
| Total Investments in Securities: | 1,265,617,297 | 1,216,314,898 | 49,302,399 | - |
Derivative Instruments: | | | | |
|
| Liabilities | | | | |
Written Options | (574,627) | (574,627) | - | - |
| Total Liabilities | (574,627) | (574,627) | - | - |
| Total Derivative Instruments: | (574,627) | (574,627) | - | - |
Value of Derivative Instruments
The following table is a summary of the Fund's value of derivative instruments by primary risk exposure as of December 31, 2022. For additional information on derivative instruments, please refer to the Derivative Instruments section in the accompanying Notes to Financial Statements.
Primary Risk Exposure / Derivative Type | Value |
| Asset ($) | Liability ($) |
| Equity Risk | | |
Written Options (a) | 0 | (574,627) |
| Total Equity Risk | 0 | (574,627) |
| Total Value of Derivatives | 0 | (574,627) |
(a)Gross value is presented in the Statement of Assets and Liabilities in the written options, at value line-item.
| Statement of Assets and Liabilities |
| | | | December 31, 2022 (Unaudited) |
| | | | | |
| Assets | | | | |
| Investment in securities, at value - See accompanying schedule: | $ | | | |
Unaffiliated issuers (cost $807,687,612) | | 1,243,748,239 | | |
Fidelity Central Funds (cost $21,869,058) | | 21,869,058 | | |
| | | | | |
| | | | | |
| Total Investment in Securities (cost $829,556,670) | | | $ | 1,265,617,297 |
| Cash | | | | 333 |
| Restricted cash | | | | 551,989 |
| Receivable for investments sold | | | | |
Regular delivery | | | $ | 661,255 |
Delayed delivery | | | | 2,660,841 |
| Receivable for fund shares sold | | | | 790,096 |
| Dividends receivable | | | | 1,364,789 |
| Distributions receivable from Fidelity Central Funds | | | | 72,535 |
| Prepaid expenses | | | | 1,594 |
| Other receivables | | | | 4,674 |
Total assets | | | | 1,271,725,403 |
| Liabilities | | | | |
| Payable for investments purchased | | $341,674 | | |
| Payable for fund shares redeemed | | 479,302 | | |
| Accrued management fee | | 455,020 | | |
| Transfer agent fee payable | | 148,548 | | |
| Distribution and service plan fees payable | | 49,852 | | |
| Written options, at value (premium received $597,286) | | 574,627 | | |
| Other affiliated payables | | 30,301 | | |
| Other payables and accrued expenses | | 38,890 | | |
| Total Liabilities | | | | 2,118,214 |
| Net Assets | | | $ | 1,269,607,189 |
| Net Assets consist of: | | | | |
| Paid in capital | | | $ | 847,897,117 |
| Total accumulated earnings (loss) | | | | 421,710,072 |
| Net Assets | | | $ | 1,269,607,189 |
| | | | | |
| Net Asset Value and Maximum Offering Price | | | | |
| Class A : | | | | |
Net Asset Value and redemption price per share ($102,646,295 ÷ 6,175,655 shares) (a) | | | $ | 16.62 |
| Maximum offering price per share (100/94.25 of $16.62) | | | $ | 17.63 |
| Class M : | | | | |
Net Asset Value and redemption price per share ($27,299,207 ÷ 1,641,236 shares) (a) | | | $ | 16.63 |
| Maximum offering price per share (100/96.50 of $16.63) | | | $ | 17.23 |
| Class C : | | | | |
Net Asset Value and offering price per share ($20,681,936 ÷ 1,271,778 shares) (a) | | | $ | 16.26 |
| Mega Cap Stock : | | | | |
Net Asset Value , offering price and redemption price per share ($899,761,689 ÷ 53,242,403 shares) | | | $ | 16.90 |
| Class I : | | | | |
Net Asset Value , offering price and redemption price per share ($61,649,053 ÷ 3,642,410 shares) | | | $ | 16.93 |
| Class Z : | | | | |
Net Asset Value , offering price and redemption price per share ($157,569,009 ÷ 9,383,181 shares) | | | $ | 16.79 |
(a)Redemption price per share is equal to net asset value less any applicable contingent deferred sales charge. |
| Statement of Operations |
| | | | Six months ended December 31, 2022 (Unaudited) |
| Investment Income | | | | |
| Dividends | | | $ | 12,038,504 |
| Income from Fidelity Central Funds (including $1,999 from security lending) | | | | 148,790 |
| Total Income | | | | 12,187,294 |
| Expenses | | | | |
| Management fee | $ | 2,790,750 | | |
| Transfer agent fees | | 890,635 | | |
| Distribution and service plan fees | | 287,832 | | |
| Accounting fees | | 185,175 | | |
| Custodian fees and expenses | | 13,434 | | |
| Independent trustees' fees and expenses | | 2,313 | | |
| Registration fees | | 60,772 | | |
| Audit | | 31,948 | | |
| Legal | | 1,912 | | |
| Interest | | 20,022 | | |
| Miscellaneous | | 3,850 | | |
| Total expenses before reductions | | 4,288,643 | | |
| Expense reductions | | (24,774) | | |
| Total expenses after reductions | | | | 4,263,869 |
| Net Investment income (loss) | | | | 7,923,425 |
| Realized and Unrealized Gain (Loss) | | | | |
| Net realized gain (loss) on: | | | | |
| Investment Securities: | | | | |
| Unaffiliated issuers | | 1,609,354 | | |
| Foreign currency transactions | | (50,988) | | |
| Written options | | 321,505 | | |
| Total net realized gain (loss) | | | | 1,879,871 |
| Change in net unrealized appreciation (depreciation) on: | | | | |
| Investment Securities: | | | | |
| Unaffiliated issuers | | 77,115,641 | | |
| Assets and liabilities in foreign currencies | | 9,588 | | |
| Written options | | (64,145) | | |
| Total change in net unrealized appreciation (depreciation) | | | | 77,061,084 |
| Net gain (loss) | | | | 78,940,955 |
| Net increase (decrease) in net assets resulting from operations | | | $ | 86,864,380 |
| Statement of Changes in Net Assets |
| |
| | Six months ended December 31, 2022 (Unaudited) | | Year ended June 30, 2022 |
| Increase (Decrease) in Net Assets | | | | |
| Operations | | | | |
| Net investment income (loss) | $ | 7,923,425 | $ | 16,810,761 |
| Net realized gain (loss) | | 1,879,871 | | 59,966,322 |
| Change in net unrealized appreciation (depreciation) | | 77,061,084 | | (243,469,369) |
| Net increase (decrease) in net assets resulting from operations | | 86,864,380 | | (166,692,286) |
| Distributions to shareholders | | (58,426,986) | | (82,065,696) |
| Share transactions - net increase (decrease) | | (95,011,738) | | (79,071,772) |
| Total increase (decrease) in net assets | | (66,574,344) | | (327,829,754) |
| | | | | |
| Net Assets | | | | |
| Beginning of period | | 1,336,181,533 | | 1,664,011,287 |
| End of period | $ | 1,269,607,189 | $ | 1,336,181,533 |
| | | | | |
| | | | | |
Financial Highlights
| Fidelity Advisor® Mega Cap Stock Fund Class A |
| |
| | Six months ended (Unaudited) December 31, 2022 | | Years ended June 30, 2022 | | 2021 | | 2020 | | 2019 | | 2018 |
Selected Per-Share Data | | | | | | | | | | | | |
| Net asset value, beginning of period | $ | 16.14 | $ | 19.05 | $ | 13.83 | $ | 15.51 | $ | 17.34 | $ | 18.42 |
| Income from Investment Operations | | | | | | | | | | | | |
Net investment income (loss) A,B | | .08 | | .14 | | .15 | | .22 | | .29 | | .23 |
| Net realized and unrealized gain (loss) | | 1.09 | | (2.17) | | 6.31 | | .08 | | .77 | | 1.49 |
| Total from investment operations | | 1.17 | | (2.03) | | 6.46 | | .30 | | 1.06 | | 1.72 |
| Distributions from net investment income | | (.18) | | (.29) | | (.24) | | (.27) | | (.26) | | (.24) |
| Distributions from net realized gain | | (.51) | | (.59) | | (1.00) | | (1.70) | | (2.63) | | (2.56) |
| Total distributions | | (.69) | | (.88) | | (1.24) | | (1.98) C | | (2.89) | | (2.80) |
| Net asset value, end of period | $ | 16.62 | $ | 16.14 | $ | 19.05 | $ | 13.83 | $ | 15.51 | $ | 17.34 |
Total Return D,E,F | | 7.26% | | (11.25)% G | | 49.60% | | 1.78% | | 6.99% | | 10.60% |
Ratios to Average Net Assets B,H,I | | | | | | | | | | | | |
| Expenses before reductions | | .90% J | | .90% | | .91% | | .93% | | .93% | | .93% |
| Expenses net of fee waivers, if any | | .90% J | | .89% | | .91% | | .93% | | .93% | | .93% |
| Expenses net of all reductions | | .90% J | | .89% | | .91% | | .92% | | .93% | | .93% |
| Net investment income (loss) | | .96% J | | .78% | | .95% | | 1.56% | | 1.88% | | 1.33% |
| Supplemental Data | | | | | | | | | | | | |
| Net assets, end of period (000 omitted) | $ | 102,646 | $ | 88,064 | $ | 87,302 | $ | 54,948 | $ | 64,311 | $ | 62,333 |
Portfolio turnover rate K | | 3% J | | 13% | | 43% | | 49% L | | 36% | | 39% |
A Calculated based on average shares outstanding during the period.
B Net investment income (loss) is affected by the timing of the declaration of dividends by any underlying mutual funds or exchange-traded funds (ETFs). Net investment income (loss) of any mutual funds or ETFs is not included in the Fund's net investment income (loss) ratio.
C Total distributions per share do not sum due to rounding.
D Total returns for periods of less than one year are not annualized.
E Total returns would have been lower if certain expenses had not been reduced during the applicable periods shown.
F Total returns do not include the effect of the sales charges.
G Amount includes a reimbursement from the investment adviser for an operational error which amounted to less than $.01 per share. Excluding this reimbursement, the total return would have been (11.29)%.
H Fees and expenses of any underlying mutual funds or exchange-traded funds (ETFs) are not included in the Fund's expense ratio. The Fund indirectly bears its proportionate share of these expenses. For additional expense information related to investments in Fidelity Central Funds, please refer to the "Investments in Fidelity Central Funds" note found in the Notes to Financial Statements section of the most recent Annual or Semi-Annual report.
I Expense ratios reflect operating expenses of the class. Expenses before reductions do not reflect amounts reimbursed, waived, or reduced through arrangements with the investment adviser, brokerage services, or other offset arrangements, if applicable, and do not represent the amount paid by the class during periods when reimbursements, waivers or reductions occur.
J Annualized.
K Amount does not include the portfolio activity of any underlying mutual funds or exchange-traded funds (ETFs).
L Portfolio turnover rate excludes securities received or delivered in-kind.
| Fidelity Advisor® Mega Cap Stock Fund Class M |
| |
| | Six months ended (Unaudited) December 31, 2022 | | Years ended June 30, 2022 | | 2021 | | 2020 | | 2019 | | 2018 |
Selected Per-Share Data | | | | | | | | | | | | |
| Net asset value, beginning of period | $ | 16.13 | $ | 19.03 | $ | 13.82 | $ | 15.50 | $ | 17.31 | $ | 18.39 |
| Income from Investment Operations | | | | | | | | | | | | |
Net investment income (loss) A,B | | .06 | | .10 | | .11 | | .19 | | .25 | | .19 |
| Net realized and unrealized gain (loss) | | 1.09 | | (2.17) | | 6.31 | | .06 | | .78 | | 1.48 |
| Total from investment operations | | 1.15 | | (2.07) | | 6.42 | | .25 | | 1.03 | | 1.67 |
| Distributions from net investment income | | (.13) | | (.24) | | (.20) | | (.23) | | (.21) | | (.19) |
| Distributions from net realized gain | | (.51) | | (.59) | | (1.00) | | (1.70) | | (2.63) | | (2.56) |
| Total distributions | | (.65) C | | (.83) | | (1.21) C | | (1.93) | | (2.84) | | (2.75) |
| Net asset value, end of period | $ | 16.63 | $ | 16.13 | $ | 19.03 | $ | 13.82 | $ | 15.50 | $ | 17.31 |
Total Return D,E,F | | 7.08% | | (11.45)% G | | 49.19% | | 1.50% | | 6.79% | | 10.33% |
Ratios to Average Net Assets B,H,I | | | | | | | | | | | | |
| Expenses before reductions | | 1.16% J | | 1.15% | | 1.17% | | 1.18% | | 1.19% | | 1.19% |
| Expenses net of fee waivers, if any | | 1.16% J | | 1.15% | | 1.17% | | 1.18% | | 1.19% | | 1.19% |
| Expenses net of all reductions | | 1.16% J | | 1.15% | | 1.16% | | 1.18% | | 1.18% | | 1.18% |
| Net investment income (loss) | | .71% J | | .52% | | .69% | | 1.31% | | 1.63% | | 1.07% |
| Supplemental Data | | | | | | | | | | | | |
| Net assets, end of period (000 omitted) | $ | 27,299 | $ | 25,617 | $ | 28,266 | $ | 21,208 | $ | 25,031 | $ | 26,446 |
Portfolio turnover rate K | | 3% J | | 13% | | 43% | | 49% L | | 36% | | 39% |
A Calculated based on average shares outstanding during the period.
B Net investment income (loss) is affected by the timing of the declaration of dividends by any underlying mutual funds or exchange-traded funds (ETFs). Net investment income (loss) of any mutual funds or ETFs is not included in the Fund's net investment income (loss) ratio.
C Total distributions per share do not sum due to rounding.
D Total returns for periods of less than one year are not annualized.
E Total returns would have been lower if certain expenses had not been reduced during the applicable periods shown.
F Total returns do not include the effect of the sales charges.
G Amount includes a reimbursement from the investment adviser for an operational error which amounted to less than $.01 per share. Excluding this reimbursement, the total return would have been (11.49)%.
H Fees and expenses of any underlying mutual funds or exchange-traded funds (ETFs) are not included in the Fund's expense ratio. The Fund indirectly bears its proportionate share of these expenses. For additional expense information related to investments in Fidelity Central Funds, please refer to the "Investments in Fidelity Central Funds" note found in the Notes to Financial Statements section of the most recent Annual or Semi-Annual report.
I Expense ratios reflect operating expenses of the class. Expenses before reductions do not reflect amounts reimbursed, waived, or reduced through arrangements with the investment adviser, brokerage services, or other offset arrangements, if applicable, and do not represent the amount paid by the class during periods when reimbursements, waivers or reductions occur.
J Annualized.
K Amount does not include the portfolio activity of any underlying mutual funds or exchange-traded funds (ETFs).
L Portfolio turnover rate excludes securities received or delivered in-kind.
| Fidelity Advisor® Mega Cap Stock Fund Class C |
| |
| | Six months ended (Unaudited) December 31, 2022 | | Years ended June 30, 2022 | | 2021 | | 2020 | | 2019 | | 2018 |
Selected Per-Share Data | | | | | | | | | | | | |
| Net asset value, beginning of period | $ | 15.74 | $ | 18.58 | $ | 13.53 | $ | 15.20 | $ | 17.03 | $ | 18.13 |
| Income from Investment Operations | | | | | | | | | | | | |
Net investment income (loss) A,B | | .01 | | - C | | .03 | | .11 | | .17 | | .10 |
| Net realized and unrealized gain (loss) | | 1.07 | | (2.12) | | 6.15 | | .08 | | .77 | | 1.47 |
| Total from investment operations | | 1.08 | | (2.12) | | 6.18 | | .19 | | .94 | | 1.57 |
| Distributions from net investment income | | (.04) | | (.15) | | (.13) | | (.15) | | (.13) | | (.11) |
| Distributions from net realized gain | | (.51) | | (.58) | | (1.00) | | (1.70) | | (2.63) | | (2.56) |
| Total distributions | | (.56) D | | (.72) D | | (1.13) | | (1.86) D | | (2.77) D | | (2.67) |
| Net asset value, end of period | $ | 16.26 | $ | 15.74 | $ | 18.58 | $ | 13.53 | $ | 15.20 | $ | 17.03 |
Total Return E,F,G | | 6.82% | | (11.90)% H | | 48.31% | | 1.05% | | 6.23% | | 9.81% |
Ratios to Average Net Assets B,I,J | | | | | | | | | | | | |
| Expenses before reductions | | 1.68% K | | 1.67% | | 1.69% | | 1.69% | | 1.68% | | 1.68% |
| Expenses net of fee waivers, if any | | 1.68% K | | 1.67% | | 1.69% | | 1.69% | | 1.67% | | 1.68% |
| Expenses net of all reductions | | 1.68% K | | 1.67% | | 1.69% | | 1.69% | | 1.67% | | 1.68% |
| Net investment income (loss) | | .18% K | | -% L | | .17% | | .80% | | 1.14% | | .58% |
| Supplemental Data | | | | | | | | | | | | |
| Net assets, end of period (000 omitted) | $ | 20,682 | $ | 20,255 | $ | 27,727 | $ | 24,283 | $ | 28,459 | $ | 33,640 |
Portfolio turnover rate M | | 3% K | | 13% | | 43% | | 49% N | | 36% | | 39% |
A Calculated based on average shares outstanding during the period.
B Net investment income (loss) is affected by the timing of the declaration of dividends by any underlying mutual funds or exchange-traded funds (ETFs). Net investment income (loss) of any mutual funds or ETFs is not included in the Fund's net investment income (loss) ratio.
C Amount represents less than $.005 per share.
D Total distributions per share do not sum due to rounding.
E Total returns for periods of less than one year are not annualized.
F Total returns would have been lower if certain expenses had not been reduced during the applicable periods shown.
G Total returns do not include the effect of the contingent deferred sales charge.
H Amount includes a reimbursement from the investment adviser for an operational error which amounted to less than $.01 per share. Excluding this reimbursement, the total return would have been (11.94)%.
I Fees and expenses of any underlying mutual funds or exchange-traded funds (ETFs) are not included in the Fund's expense ratio. The Fund indirectly bears its proportionate share of these expenses. For additional expense information related to investments in Fidelity Central Funds, please refer to the "Investments in Fidelity Central Funds" note found in the Notes to Financial Statements section of the most recent Annual or Semi-Annual report.
J Expense ratios reflect operating expenses of the class. Expenses before reductions do not reflect amounts reimbursed, waived, or reduced through arrangements with the investment adviser, brokerage services, or other offset arrangements, if applicable, and do not represent the amount paid by the class during periods when reimbursements, waivers or reductions occur.
K Annualized.
L Amount represents less than .005%.
M Amount does not include the portfolio activity of any underlying mutual funds or exchange-traded funds (ETFs).
N Portfolio turnover rate excludes securities received or delivered in-kind.
| Fidelity® Mega Cap Stock Fund |
| |
| | Six months ended (Unaudited) December 31, 2022 | | Years ended June 30, 2022 | | 2021 | | 2020 | | 2019 | | 2018 |
Selected Per-Share Data | | | | | | | | | | | | |
| Net asset value, beginning of period | $ | 16.42 | $ | 19.36 | $ | 14.04 | $ | 15.71 | $ | 17.52 | $ | 18.58 |
| Income from Investment Operations | | | | | | | | | | | | |
Net investment income (loss) A,B | | .10 | | .20 | | .20 | | .27 | | .34 | | .28 |
| Net realized and unrealized gain (loss) | | 1.12 | | (2.21) | | 6.40 | | .07 | | .78 | | 1.50 |
| Total from investment operations | | 1.22 | | (2.01) | | 6.60 | | .34 | | 1.12 | | 1.78 |
| Distributions from net investment income | | (.23) | | (.34) | | (.28) | | (.31) | | (.30) | | (.27) |
| Distributions from net realized gain | | (.51) | | (.59) | | (1.00) | | (1.70) | | (2.63) | | (2.56) |
| Total distributions | | (.74) | | (.93) | | (1.28) | | (2.01) | | (2.93) | | (2.84) C |
| Net asset value, end of period | $ | 16.90 | $ | 16.42 | $ | 19.36 | $ | 14.04 | $ | 15.71 | $ | 17.52 |
Total Return D,E | | 7.42% | | (10.99)% F | | 49.96% | | 2.09% | | 7.33% | | 10.86% |
Ratios to Average Net Assets B,G,H | | | | | | | | | | | | |
| Expenses before reductions | | .62% I | | .61% | | .63% | | .65% | | .65% | | .68% |
| Expenses net of fee waivers, if any | | .62% I | | .61% | | .63% | | .64% | | .65% | | .68% |
| Expenses net of all reductions | | .62% I | | .61% | | .63% | | .64% | | .65% | | .68% |
| Net investment income (loss) | | 1.25% I | | 1.06% | | 1.23% | | 1.84% | | 2.16% | | 1.58% |
| Supplemental Data | | | | | | | | | | | | |
| Net assets, end of period (000 omitted) | $ | 899,762 | $ | 927,217 | $ | 1,166,988 | $ | 773,080 | $ | 1,488,549 | $ | 1,715,822 |
Portfolio turnover rate J | | 3% I | | 13% | | 43% | | 49% K | | 36% | | 39% |
A Calculated based on average shares outstanding during the period.
B Net investment income (loss) is affected by the timing of the declaration of dividends by any underlying mutual funds or exchange-traded funds (ETFs). Net investment income (loss) of any mutual funds or ETFs is not included in the Fund's net investment income (loss) ratio.
C Total distributions per share do not sum due to rounding.
D Total returns for periods of less than one year are not annualized.
E Total returns would have been lower if certain expenses had not been reduced during the applicable periods shown.
F Amount includes a reimbursement from the investment adviser for an operational error which amounted to less than $.01 per share. Excluding this reimbursement, the total return would have been (11.03)%.
G Fees and expenses of any underlying mutual funds or exchange-traded funds (ETFs) are not included in the Fund's expense ratio. The Fund indirectly bears its proportionate share of these expenses. For additional expense information related to investments in Fidelity Central Funds, please refer to the "Investments in Fidelity Central Funds" note found in the Notes to Financial Statements section of the most recent Annual or Semi-Annual report.
H Expense ratios reflect operating expenses of the class. Expenses before reductions do not reflect amounts reimbursed, waived, or reduced through arrangements with the investment adviser, brokerage services, or other offset arrangements, if applicable, and do not represent the amount paid by the class during periods when reimbursements, waivers or reductions occur.
I Annualized.
J Amount does not include the portfolio activity of any underlying mutual funds or exchange-traded funds (ETFs).
K Portfolio turnover rate excludes securities received or delivered in-kind.
| Fidelity Advisor® Mega Cap Stock Fund Class I |
| |
| | Six months ended (Unaudited) December 31, 2022 | | Years ended June 30, 2022 | | 2021 | | 2020 | | 2019 | | 2018 |
Selected Per-Share Data | | | | | | | | | | | | |
| Net asset value, beginning of period | $ | 16.45 | $ | 19.39 | $ | 14.07 | $ | 15.72 | $ | 17.53 | $ | 18.60 |
| Income from Investment Operations | | | | | | | | | | | | |
Net investment income (loss) A,B | | .10 | | .19 | | .20 | | .27 | | .34 | | .28 |
| Net realized and unrealized gain (loss) | | 1.12 | | (2.21) | | 6.42 | | .06 | | .79 | | 1.50 |
| Total from investment operations | | 1.22 | | (2.02) | | 6.62 | | .33 | | 1.13 | | 1.78 |
| Distributions from net investment income | | (.23) | | (.34) | | (.29) | | (.28) | | (.30) | | (.29) |
| Distributions from net realized gain | | (.51) | | (.59) | | (1.00) | | (1.70) | | (2.63) | | (2.56) |
| Total distributions | | (.74) | | (.92) C | | (1.30) C | | (1.98) | | (2.94) C | | (2.85) |
| Net asset value, end of period | $ | 16.93 | $ | 16.45 | $ | 19.39 | $ | 14.07 | $ | 15.72 | $ | 17.53 |
Total Return D,E | | 7.42% | | (11.00)% F | | 49.97% | | 2.04% | | 7.33% | | 10.87% |
Ratios to Average Net Assets B,G,H | | | | | | | | | | | | |
| Expenses before reductions | | .64% I | | .65% | | .65% | | .66% | | .66% | | .67% |
| Expenses net of fee waivers, if any | | .63% I | | .64% | | .65% | | .66% | | .66% | | .67% |
| Expenses net of all reductions | | .63% I | | .64% | | .64% | | .65% | | .66% | | .66% |
| Net investment income (loss) | | 1.23% I | | 1.03% | | 1.21% | | 1.83% | | 2.15% | | 1.60% |
| Supplemental Data | | | | | | | | | | | | |
| Net assets, end of period (000 omitted) | $ | 61,649 | $ | 52,884 | $ | 39,876 | $ | 20,725 | $ | 147,465 | $ | 143,472 |
Portfolio turnover rate J | | 3% I | | 13% | | 43% | | 49% K | | 36% | | 39% |
A Calculated based on average shares outstanding during the period.
B Net investment income (loss) is affected by the timing of the declaration of dividends by any underlying mutual funds or exchange-traded funds (ETFs). Net investment income (loss) of any mutual funds or ETFs is not included in the Fund's net investment income (loss) ratio.
C Total distributions per share do not sum due to rounding.
D Total returns for periods of less than one year are not annualized.
E Total returns would have been lower if certain expenses had not been reduced during the applicable periods shown.
F Amount includes a reimbursement from the investment adviser for an operational error which amounted to less than $.01 per share. Excluding this reimbursement, the total return would have been (11.04)%.
G Fees and expenses of any underlying mutual funds or exchange-traded funds (ETFs) are not included in the Fund's expense ratio. The Fund indirectly bears its proportionate share of these expenses. For additional expense information related to investments in Fidelity Central Funds, please refer to the "Investments in Fidelity Central Funds" note found in the Notes to Financial Statements section of the most recent Annual or Semi-Annual report.
H Expense ratios reflect operating expenses of the class. Expenses before reductions do not reflect amounts reimbursed, waived, or reduced through arrangements with the investment adviser, brokerage services, or other offset arrangements, if applicable, and do not represent the amount paid by the class during periods when reimbursements, waivers or reductions occur.
I Annualized.
J Amount does not include the portfolio activity of any underlying mutual funds or exchange-traded funds (ETFs).
K Portfolio turnover rate excludes securities received or delivered in-kind.
| Fidelity Advisor® Mega Cap Stock Fund Class Z |
| |
| | Six months ended (Unaudited) December 31, 2022 | | Years ended June 30, 2022 | | 2021 | | 2020 | | 2019 | | 2018 |
Selected Per-Share Data | | | | | | | | | | | | |
| Net asset value, beginning of period | $ | 16.32 | $ | 19.25 | $ | 13.97 | $ | 15.65 | $ | 17.46 | $ | 18.53 |
| Income from Investment Operations | | | | | | | | | | | | |
Net investment income (loss) A,B | | .11 | | .22 | | .22 | | .28 | | .35 | | .30 |
| Net realized and unrealized gain (loss) | | 1.12 | | (2.20) | | 6.36 | | .08 | | .79 | | 1.51 |
| Total from investment operations | | 1.23 | | (1.98) | | 6.58 | | .36 | | 1.14 | | 1.81 |
| Distributions from net investment income | | (.25) | | (.36) | | (.30) | | (.33) | | (.32) | | (.31) |
| Distributions from net realized gain | | (.51) | | (.59) | | (1.00) | | (1.70) | | (2.63) | | (2.56) |
| Total distributions | | (.76) | | (.95) | | (1.30) | | (2.04) C | | (2.95) | | (2.88) C |
| Net asset value, end of period | $ | 16.79 | $ | 16.32 | $ | 19.25 | $ | 13.97 | $ | 15.65 | $ | 17.46 |
Total Return D,E | | 7.52% | | (10.92)% F | | 50.14% | | 2.18% | | 7.47% | | 11.09% |
Ratios to Average Net Assets B,G,H | | | | | | | | | | | | |
| Expenses before reductions | | .52% I | | .51% | | .52% | | .53% | | .53% | | .53% |
| Expenses net of fee waivers, if any | | .51% I | | .51% | | .52% | | .52% | | .53% | | .53% |
| Expenses net of all reductions | | .51% I | | .51% | | .52% | | .52% | | .53% | | .53% |
| Net investment income (loss) | | 1.35% I | | 1.16% | | 1.34% | | 1.96% | | 2.29% | | 1.73% |
| Supplemental Data | | | | | | | | | | | | |
| Net assets, end of period (000 omitted) | $ | 157,569 | $ | 222,146 | $ | 313,854 | $ | 213,832 | $ | 193,889 | $ | 81,817 |
Portfolio turnover rate J | | 3% I | | 13% | | 43% | | 49% K | | 36% | | 39% |
A Calculated based on average shares outstanding during the period.
B Net investment income (loss) is affected by the timing of the declaration of dividends by any underlying mutual funds or exchange-traded funds (ETFs). Net investment income (loss) of any mutual funds or ETFs is not included in the Fund's net investment income (loss) ratio.
C Total distributions per share do not sum due to rounding.
D Total returns for periods of less than one year are not annualized.
E Total returns would have been lower if certain expenses had not been reduced during the applicable periods shown.
F Amount includes a reimbursement from the investment adviser for an operational error which amounted to less than $.01 per share. Excluding this reimbursement, the total return would have been (10.96)%.
G Fees and expenses of any underlying mutual funds or exchange-traded funds (ETFs) are not included in the Fund's expense ratio. The Fund indirectly bears its proportionate share of these expenses. For additional expense information related to investments in Fidelity Central Funds, please refer to the "Investments in Fidelity Central Funds" note found in the Notes to Financial Statements section of the most recent Annual or Semi-Annual report.
H Expense ratios reflect operating expenses of the class. Expenses before reductions do not reflect amounts reimbursed, waived, or reduced through arrangements with the investment adviser, brokerage services, or other offset arrangements, if applicable, and do not represent the amount paid by the class during periods when reimbursements, waivers or reductions occur.
I Annualized.
J Amount does not include the portfolio activity of any underlying mutual funds or exchange-traded funds (ETFs).
K Portfolio turnover rate excludes securities received or delivered in-kind.
For the period ended December 31, 2022
1. Organization.
Fidelity Mega Cap Stock Fund (the Fund) is a fund of Fidelity Hastings Street Trust (the Trust) and is authorized to issue an unlimited number of shares. The Trust is registered under the Investment Company Act of 1940, as amended (the 1940 Act), as an open-end management investment company organized as a Massachusetts business trust. The Fund offers Class A, Class M, Class C, Mega Cap Stock, Class I and Class Z shares, each of which has equal rights as to assets and voting privileges. Each class has exclusive voting rights with respect to matters that affect that class. Class C shares will automatically convert to Class A shares after a holding period of eight years from the initial date of purchase, with certain exceptions.
2. Investments in Fidelity Central Funds.
Funds may invest in Fidelity Central Funds, which are open-end investment companies generally available only to other investment companies and accounts managed by the investment adviser and its affiliates. The Schedule of Investments lists any Fidelity Central Funds held as an investment as of period end, but does not include the underlying holdings of each Fidelity Central Fund. An investing fund indirectly bears its proportionate share of the expenses of the underlying Fidelity Central Funds.
Based on its investment objective, each Fidelity Central Fund may invest or participate in various investment vehicles or strategies that are similar to those of the investing fund. These strategies are consistent with the investment objectives of the investing fund and may involve certain economic risks which may cause a decline in value of each of the Fidelity Central Funds and thus a decline in the value of the investing fund.
| Fidelity Central Fund | Investment Manager | Investment Objective | Investment Practices | Expense Ratio A |
| Fidelity Money Market Central Funds | Fidelity Management & Research Company LLC (FMR) | Each fund seeks to obtain a high level of current income consistent with the preservation of capital and liquidity. | Short-term Investments | Less than .005% |
A Expenses expressed as a percentage of average net assets and are as of each underlying Central Fund's most recent annual or semi-annual shareholder report.
A complete unaudited list of holdings for each Fidelity Central Fund is available upon request or at the Securities and Exchange Commission website at www.sec.gov. In addition, the financial statements of the Fidelity Central Funds which contain the significant accounting policies (including investment valuation policies) of those funds, and are not covered by the Report of Independent Registered Public Accounting Firm, are available on the Securities and Exchange Commission website or upon request.
3. Significant Accounting Policies.
The Fund is an investment company and applies the accounting and reporting guidance of the Financial Accounting Standards Board (FASB) Accounting Standards Codification Topic 946 Financial Services - Investment Companies . The financial statements have been prepared in conformity with accounting principles generally accepted in the United States of America (GAAP), which require management to make certain estimates and assumptions at the date of the financial statements. Actual results could differ from those estimates. Subsequent events, if any, through the date that the financial statements were issued have been evaluated in the preparation of the financial statements. The Fund's Schedule of Investments lists any underlying mutual funds or exchange-traded funds (ETFs) but does not include the underlying holdings of these funds. The following summarizes the significant accounting policies of the Fund:
Investment Valuation. Investments are valued as of 4:00 p.m. Eastern time on the last calendar day of the period. The Board of Trustees (the Board) has designated the Fund's investment adviser as the valuation designee responsible for the fair valuation function and performing fair value determinations as needed. The investment adviser has established a Fair Value Committee (the Committee) to carry out the day-to-day fair valuation responsibilities and has adopted policies and procedures to govern the fair valuation process and the activities of the Committee. In accordance with these fair valuation policies and procedures, which have been approved by the Board, the Fund attempts to obtain prices from one or more third party pricing services or brokers to value its investments. When current market prices, quotations or currency exchange rates are not readily available or reliable, investments will be fair valued in good faith by the Committee, in accordance with the policies and procedures. Factors used in determining fair value vary by investment type and may include market or investment specific events, transaction data, estimated cash flows, and market observations of comparable investments. The frequency that the fair valuation procedures are used cannot be predicted and they may be utilized to a significant extent. The Committee manages the Fund's fair valuation practices and maintains the fair valuation policies and procedures. The Fund's investment adviser reports to the Board information regarding the fair valuation process and related material matters.
The Fund categorizes the inputs to valuation techniques used to value its investments into a disclosure hierarchy consisting of three levels as shown below:
Level 1 - unadjusted quoted prices in active markets for identical investments
Level 2 - other significant observable inputs (including quoted prices for similar investments, interest rates, prepayment speeds, etc.)
Level 3 - unobservable inputs (including the Fund's own assumptions based on the best information available)
Valuation techniques used to value the Fund's investments by major category are as follows:
Equity securities, including restricted securities, for which market quotations are readily available, are valued at the last reported sale price or official closing price as reported by a third party pricing service on the primary market or exchange on which they are traded and are categorized as Level 1 in the hierarchy. In the event there were no sales during the day or closing prices are not available, securities are valued at the last quoted bid price or may be valued using the last available price and are generally categorized as Level 2 in the hierarchy. For foreign equity securities, when market or security specific events arise, comparisons to the valuation of American Depositary Receipts (ADRs), futures contracts, ETFs and certain indexes as well as quoted prices for similar securities may be used and would be categorized as Level 2 in the hierarchy. For equity securities, including restricted securities, where observable inputs are limited, assumptions about market activity and risk are used and these securities may be categorized as Level 3 in the hierarchy.
Exchange-traded options are valued using the last sale price or, in the absence of a sale, the last offering price and are categorized as Level 1 in the hierarchy. Investments in open-end mutual funds, including the Fidelity Central Funds, are valued at their closing net asset value (NAV) each business day and are categorized as Level 1 in the hierarchy.
Changes in valuation techniques may result in transfers in or out of an assigned level within the disclosure hierarchy. The aggregate value of investments by input level as of December 31, 2022 is included at the end of the Fund's Schedule of Investments.
Foreign Currency. Certain Funds may use foreign currency contracts to facilitate transactions in foreign-denominated securities. Gains and losses from these transactions may arise from changes in the value of the foreign currency or if the counterparties do not perform under the contracts' terms.
Foreign-denominated assets, including investment securities, and liabilities are translated into U.S. dollars at the exchange rates at period end. Purchases and sales of investment securities, income and dividends received, and expenses denominated in foreign currencies are translated into U.S. dollars at the exchange rate in effect on the transaction date.
The effects of exchange rate fluctuations on investments are included with the net realized and unrealized gain (loss) on investment securities. Other foreign currency transactions resulting in realized and unrealized gain (loss) are disclosed separately.
Investment Transactions and Income. For financial reporting purposes, the Fund's investment holdings and NAV include trades executed through the end of the last business day of the period. The NAV per share for processing shareholder transactions is calculated as of the close of business of the New York Stock Exchange (NYSE), normally 4:00 p.m. Eastern time and includes trades executed through the end of the prior business day. Gains and losses on securities sold are determined on the basis of identified cost and include proceeds received from litigation. Commissions paid to certain brokers with whom the investment adviser, or its affiliates, places trades on behalf of a fund include an amount in addition to trade execution, which may be rebated back to a fund. Any such rebates are included in net realized gain (loss) on investments in the Statement of Operations. Dividend income is recorded on the ex-dividend date, except for certain dividends from foreign securities where the ex-dividend date may have passed, which are recorded as soon as the Fund is informed of the ex-dividend date. Non-cash dividends included in dividend income, if any, are recorded at the fair market value of the securities received. Income and capital gain distributions from Fidelity Central Funds, if any, are recorded on the ex-dividend date. Certain distributions received by the Fund represent a return of capital or capital gain. The Fund determines the components of these distributions subsequent to the ex-dividend date, based upon receipt of tax filings or other correspondence relating to the underlying investment. These distributions are recorded as a reduction of cost of investments and/or as a realized gain. Investment income is recorded net of foreign taxes withheld where recovery of such taxes is uncertain. Funds may file withholding tax reclaims in certain jurisdictions to recover a portion of amounts previously withheld. Any withholding tax reclaims income is included in the Statement of Operations in dividends. Any receivables for withholding tax reclaims are included in the Statement of Assets and Liabilities in dividends receivable.
Class Allocations and Expenses. Investment income, realized and unrealized capital gains and losses, common expenses of a fund, and certain fund-level expense reductions, if any, are allocated daily on a pro-rata basis to each class based on the relative net assets of each class to the total net assets of a fund. Each class differs with respect to transfer agent and distribution and service plan fees incurred, as applicable. Certain expense reductions may also differ by class, if applicable. For the reporting period, the allocated portion of income and expenses to each class as a percent of its average net assets may vary due to the timing of recording these transactions in relation to fluctuating net assets of the classes. Expenses directly attributable to a fund are charged to that fund. Expenses attributable to more than one fund are allocated among the respective funds on the basis of relative net assets or other appropriate methods. Expenses included in the accompanying financial statements reflect the expenses of that fund and do not include any expenses associated with any underlying mutual funds or exchange-traded funds. Although not included in a fund's expenses, a fund indirectly bears its proportionate share of these expenses through the net asset value of each underlying mutual fund or exchange-traded fund. Expense estimates are accrued in the period to which they relate and adjustments are made when actual amounts are known.
Income Tax Information and Distributions to Shareholders. Each year, the Fund intends to qualify as a regulated investment company under Subchapter M of the Internal Revenue Code, including distributing substantially all of its taxable income and realized gains. As a result, no provision for U.S. Federal income taxes is required. The Fund files a U.S. federal tax return, in addition to state and local tax returns as required. The Fund's federal income tax returns are subject to examination by the Internal Revenue Service (IRS) for a period of three fiscal years after they are filed. State and local tax returns may be subject to examination for an additional fiscal year depending on the jurisdiction. Foreign taxes are provided for based on the Fund's understanding of the tax rules and rates that exist in the foreign markets in which it invests.
Distributions are declared and recorded on the ex-dividend date. Income and capital gain distributions are declared separately for each class. Income and capital gain distributions are determined in accordance with income tax regulations, which may differ from GAAP.
Capital accounts within the financial statements are adjusted for permanent book-tax differences. These adjustments have no impact on net assets or the results of operations. Capital accounts are not adjusted for temporary book-tax differences which will reverse in a subsequent period.
Book-tax differences are primarily due to foreign currency transactions, certain corporate actions and losses deferred due to wash sales.
As of period end, the cost and unrealized appreciation (depreciation) in securities, and derivatives if applicable, for federal income tax purposes were as follows:
| Gross unrealized appreciation | $500,027,493 |
| Gross unrealized depreciation | (69,486,000) |
| Net unrealized appreciation (depreciation) | $430,541,493 |
| Tax cost | $835,098,463 |
Delayed Delivery Transactions and When-Issued Securities. During the period, certain Funds transacted in securities on a delayed delivery or when-issued basis. Payment and delivery may take place after the customary settlement period for that security. The price of the underlying securities and the date when the securities will be delivered and paid for are fixed at the time the transaction is negotiated. Securities purchased on a delayed delivery or when-issued basis are identified as such in the Schedule of Investments. Compensation for interest forgone in the purchase of a delayed delivery or when-issued debt security may be received. With respect to purchase commitments, each applicable Fund identifies securities as segregated in its records with a value at least equal to the amount of the commitment. Payables and receivables associated with the purchases and sales of delayed delivery securities having the same coupon, settlement date and broker are offset. Delayed delivery or when-issued securities that have been purchased from and sold to different brokers are reflected as both payables and receivables in the Statement of Assets and Liabilities under the caption "Delayed delivery", as applicable. Losses may arise due to changes in the value of the underlying securities or if the counterparty does not perform under the contract's terms, or if the issuer does not issue the securities due to political, economic, or other factors.
4. Derivative Instruments.
Risk Exposures and the Use of Derivative Instruments. The Fund's investment objectives allow for various types of derivative instruments, including options. Derivatives are investments whose value is primarily derived from underlying assets, indices or reference rates and may be transacted on an exchange or over-the-counter (OTC). Derivatives may involve a future commitment to buy or sell a specified asset based on specified terms, to exchange future cash flows at periodic intervals based on a notional principal amount, or for one party to make one or more payments upon the occurrence of specified events in exchange for periodic payments from the other party.
Derivatives were used to increase returns and to manage exposure to certain risks as defined below. The success of any strategy involving derivatives depends on analysis of numerous economic factors, and if the strategies for investment do not work as intended, the objectives may not be achieved.
Derivatives were used to increase or decrease exposure to the following risk(s):
| | |
| Equity Risk | Equity risk relates to the fluctuations in the value of financial instruments as a result of changes in market prices (other than those arising from interest rate risk or foreign exchange risk), whether caused by factors specific to an individual investment, its issuer, or all factors affecting all instruments traded in a market or market segment. |
Funds are also exposed to additional risks from investing in derivatives, such as liquidity risk and counterparty credit risk. Liquidity risk is the risk that a fund will be unable to close out the derivative in the open market in a timely manner. Counterparty credit risk is the risk that the counterparty will not be able to fulfill its obligation to a fund. Counterparty credit risk related to exchange-traded contracts may be mitigated by the protection provided by the exchange on which they trade.
Investing in derivatives may involve greater risks than investing in the underlying assets directly and, to varying degrees, may involve risk of loss in excess of any initial investment and collateral received and amounts recognized in the Statement of Assets and Liabilities. In addition, there may be the risk that the change in value of the derivative contract does not correspond to the change in value of the underlying instrument.
Options. Options give the purchaser the right, but not the obligation, to buy (call) or sell (put) an underlying security or financial instrument at an agreed exercise or strike price between or on certain dates. Options obligate the seller (writer) to buy (put) or sell (call) an underlying instrument at the exercise or strike price or cash settle an underlying derivative instrument if the holder exercises the option on or before the expiration date.
Exchange-traded written covered call options were used to manage exposure to the market. When a fund writes a covered call option, a fund holds the underlying instrument which must be delivered to the holder upon the exercise of the option.
Upon entering into a written options contract, a fund will receive a premium. Premiums received are reflected as a liability on the Statement of Assets and Liabilities. Options are valued daily and any unrealized appreciation (depreciation) is reflected on the Statement of Assets and Liabilities. When a written option is exercised, the premium is added to the proceeds from the sale of the underlying instrument in determining the gain or loss realized on that investment. When an option is closed, a gain or loss is realized depending on whether the proceeds or amount paid for the closing sale transaction are greater or less than the premium received. When an option expires, gains and losses are realized to the extent of premiums received. The net realized gain (loss) on closed and expired written options and the change in net unrealized appreciation (depreciation) on written options are presented in the Statement of Operations.
Writing call options tends to decrease exposure to the underlying instrument and risk of loss is the change in value in excess of the premium received.
Any open options at period end are presented in the Schedule of Investments under the caption "Written Options", and are representative of volume of activity during the period unless an average contracts amount is presented.
5. Purchases and Sales of Investments.
Purchases and sales of securities, other than short-term securities and in-kind transactions, as applicable, are noted in the table below.
| | Purchases ($) | Sales ($) |
| Fidelity Mega Cap Stock Fund | 20,813,412 | 168,267,820 |
6. Fees and Other Transactions with Affiliates.
Management Fee. Fidelity Management & Research Company LLC (the investment adviser) and its affiliates provide the Fund with investment management related services for which the Fund pays a monthly management fee. The management fee is the sum of an individual fund fee rate that is based on an annual rate of .20% of the Fund's average net assets and an annualized group fee rate that averaged .23% during the period. The group fee rate is based upon the monthly average net assets of a group of registered investment companies with which the investment adviser has management contracts. The group fee rate decreases as assets under management increase and increases as assets under management decrease. For the reporting period, the total annualized management fee rate was .43% of the Fund's average net assets.
Distribution and Service Plan Fees. In accordance with Rule 12b-1 of the 1940 Act, the Fund has adopted separate Distribution and Service Plans for each class of shares. Certain classes pay Fidelity Distributors Company LLC (FDC), an affiliate of the investment adviser, separate Distribution and Service Fees, each of which is based on an annual percentage of each class' average net assets. In addition, FDC may pay financial intermediaries for selling shares of the Fund and providing shareholder support services. For the period, the Distribution and Service Fee rates, total fees and amounts retained by FDC were as follows:
| | Distribution Fee | Service Fee | Total Fees | Retained by FDC |
| Class A | - % | .25% | $118,207 | $3,106 |
| Class M | .25% | .25% | 67,254 | - |
| Class C | .75% | .25% | 102,371 | 13,746 |
| | | | $287,832 | $16,852 |
Sales Load. FDC may receive a front-end sales charge of up to 5.75% for selling Class A shares and 3.50% for selling Class M shares, some of which is paid to financial intermediaries for selling shares of the Fund. Depending on the holding period, FDC may receive contingent deferred sales charges levied on Class A, Class M and Class C redemptions. The deferred sales charges are 1.00% for Class C shares, 1.00% for certain purchases of Class A shares and .25% for certain purchases of Class M shares.
For the period, sales charge amounts retained by FDC were as follows:
| | Retained by FDC |
| Class A | $15,746 |
| Class M | 979 |
Class C A | 131 |
| | $16,856 |
A When Class C shares are initially sold, FDC pays commissions from its own resources to financial intermediaries through which the sales are made.
Transfer Agent Fees. Fidelity Investments Institutional Operations Company LLC (FIIOC), an affiliate of the investment adviser, is the transfer, dividend disbursing and shareholder servicing agent for each class of the Fund. FIIOC receives account fees and asset-based fees that vary according to the account size and type of account of the shareholders of the respective classes of the Fund, except for Class Z. FIIOC receives an asset-based fee of Class Z's average net assets. FIIOC pays for typesetting, printing and mailing of shareholder reports, except proxy statements.
For the period, transfer agent fees for each class were as follows:
| | Amount | % of Class-Level Average Net Assets A |
| Class A | $84,714 | .18 |
| Class M | 25,215 | .19 |
| Class C | 21,441 | .21 |
| Mega Cap Stock | 677,777 | .15 |
| Class I | 42,268 | .16 |
| Class Z | 39,220 | .04 |
| | $890,635 | |
A Annualized
Accounting Fees. Fidelity Service Company, Inc. (FSC), an affiliate of the investment adviser, maintains the Fund's accounting records. The accounting fee is based on the level of average net assets for each month. For the period, the fees were equivalent to the following annualized rates:
| | % of Average Net Assets |
| Fidelity Mega Cap Stock Fund | .03 |
Brokerage Commissions. A portion of portfolio transactions were placed with brokerage firms which are affiliates of the investment adviser. Brokerage commissions are included in net realized gain (loss) and change in net unrealized appreciation (depreciation) in the Statement of Operations. The commissions paid to these affiliated firms were as follows:
| | Amount |
| Fidelity Mega Cap Stock Fund | $1,216 |
Interfund Lending Program. Pursuant to an Exemptive Order issued by the Securities and Exchange Commission (the SEC), the Fund, along with other registered investment companies having management contracts with Fidelity Management & Research Company LLC (FMR), or other affiliated entities of FMR, may participate in an interfund lending program. This program provides an alternative credit facility allowing the Fund to borrow from, or lend money to, other participating affiliated funds. At period end, there were no interfund loans outstanding. Activity in this program during the period for which loans were outstanding was as follows:
| | Borrower or Lender | Average Loan Balance | Weighted Average Interest Rate | Interest Expense |
| Fidelity Mega Cap Stock Fund | Borrower | $6,447,229 | 3.16% | $19,829 |
Interfund Trades. Funds may purchase from or sell securities to other Fidelity Funds under procedures adopted by the Board. The procedures have been designed to ensure these interfund trades are executed in accordance with Rule 17a-7 of the 1940 Act. Any interfund trades are included within the respective purchases and sales amounts shown in the Purchases and Sales of Investments note. Interfund trades during the period are noted in the table below.
| | Purchases ($) | Sales ($) | Realized Gain (Loss) ($) |
| Fidelity Mega Cap Stock Fund | 2,041,122 | 7,813,313 | 1,716,350 |
7. Committed Line of Credit.
Certain Funds participate with other funds managed by the investment adviser or an affiliate in a $4.25 billion credit facility (the "line of credit") to be utilized for temporary or emergency purposes to fund shareholder redemptions or for other short-term liquidity purposes. The participating funds have agreed to pay commitment fees on their pro-rata portion of the line of credit, which are reflected in Miscellaneous expenses on the Statement of Operations, and are listed below. During the period, there were no borrowings on this line of credit.
| | Amount |
| Fidelity Mega Cap Stock Fund | $1,247 |
8. Security Lending.
Funds lend portfolio securities from time to time in order to earn additional income. Lending agents are used, including National Financial Services (NFS), an affiliate of the investment adviser. Pursuant to a securities lending agreement, NFS will receive a fee, which is capped at 9.9% of a fund's daily lending revenue, for its services as lending agent. A fund may lend securities to certain qualified borrowers, including NFS. On the settlement date of the loan, a fund receives collateral (in the form of U.S. Treasury obligations, letters of credit and/or cash) against the loaned securities and maintains collateral in an amount not less than 100% of the market value of the loaned securities during the period of the loan. The market value of the loaned securities is determined at the close of business of a fund and any additional required collateral is delivered to a fund on the next business day. A fund or borrower may terminate the loan at any time, and if the borrower defaults on its obligation to return the securities loaned because of insolvency or other reasons, a fund may apply collateral received from the borrower against the obligation. A fund may experience delays and costs in recovering the securities loaned. Any cash collateral received is invested in the Fidelity Securities Lending Cash Central Fund. Any loaned securities are identified as such in the Schedule of Investments, and the value of loaned securities and cash collateral at period end, as applicable, are presented in the Statement of Assets and Liabilities. Security lending income represents the income earned on investing cash collateral, less rebates paid to borrowers and any lending agent fees associated with the loan, plus any premium payments received for lending certain types of securities. Security lending income is presented in the Statement of Operations as a component of income from Fidelity Central Funds. Affiliated security lending activity, if any, was as follows:
| | Total Security Lending Fees Paid to NFS | Security Lending Income From Securities Loaned to NFS | Value of Securities Loaned to NFS at Period End |
| Fidelity Mega Cap Stock Fund | $208 | $- | $- |
9. Bank Borrowings.
The Fund is permitted to have bank borrowings for temporary or emergency purposes to fund shareholder redemptions or for other short-term liquidity requirements. The Fund has established borrowing arrangements with certain banks. The interest rate on the borrowings is the bank's base rate, as revised from time to time. Any open loans, including accrued interest, at period end are presented under the caption "Notes payable" in the Statement of Assets and Liabilities, if applicable. Activity in this program during the period for which loans were outstanding was as follows:
| | Average Loan Balance | Weighted Average Interest Rate | Interest Expense |
| Fidelity Mega Cap Stock Fund | $466,200 | 2.98% | $193 |
10. Expense Reductions.
Through arrangements each class' transfer agent, credits realized as a result of certain uninvested cash balances were used to reduce the Fund's expenses. During the period, transfer agent credits reduced each class' expenses as noted in the table below.
| | Expense reduction |
| Class M | $28 |
In addition, during the period the investment adviser or an affiliate reimbursed and/or waived a portion of fund-level operating expenses in the amount of $24,746.
11. Distributions to Shareholders.
Distributions to shareholders of each class were as follows:
| | Six months ended December 31, 2022 | Year ended June 30, 2022 |
| Fidelity Mega Cap Stock Fund | | |
| Distributions to shareholders | | |
| Class A | $3,853,964 | $4,168,848 |
| Class M | 1,033,161 | 1,236,079 |
| Class C | 718,884 | 1,054,574 |
| Mega Cap Stock | 41,036,146 | 56,066,052 |
| Class I | 2,435,167 | 1,998,583 |
| Class Z | 9,349,664 | 17,541,560 |
| Total | $58,426,986 | $82,065,696 |
12. Share Transactions.
Share transactions for each class were as follows and may contain in-kind transactions, automatic conversions between classes or exchanges between affiliated funds:
| | Shares | Shares | Dollars | Dollars |
| | Six months ended December 31, 2022 | Year ended June 30, 2022 | Six months ended December 31, 2022 | Year ended June 30, 2022 |
| Fidelity Mega Cap Stock Fund | | | | |
| Class A | | | | |
| Shares sold | 918,202 | 1,492,302 | $15,307,263 | $27,642,806 |
| Reinvestment of distributions | 228,217 | 221,711 | 3,827,310 | 4,140,030 |
| Shares redeemed | (427,622) | (840,067) | (7,012,528) | (15,338,731) |
| Net increase (decrease) | 718,797 | 873,946 | $12,122,045 | $16,444,105 |
| Class M | | | | |
| Shares sold | 100,981 | 292,638 | $1,676,718 | $5,511,563 |
| Reinvestment of distributions | 61,536 | 66,120 | 1,032,772 | 1,234,490 |
| Shares redeemed | (109,887) | (255,295) | (1,808,234) | (4,693,563) |
| Net increase (decrease) | 52,630 | 103,463 | $901,256 | $2,052,490 |
| Class C | | | | |
| Shares sold | 144,876 | 260,842 | $2,349,706 | $4,755,232 |
| Reinvestment of distributions | 43,647 | 57,728 | 716,292 | 1,053,354 |
| Shares redeemed | (203,811) | (523,457) | (3,303,213) | (9,487,326) |
| Net increase (decrease) | (15,288) | (204,887) | $(237,215) | $(3,678,740) |
| Mega Cap Stock | | | | |
| Shares sold | 2,104,962 | 7,598,334 | $35,784,166 | $146,062,944 |
| Reinvestment of distributions | 2,240,783 | 2,797,662 | 38,208,143 | 53,068,612 |
| Shares redeemed | (7,576,580) | (14,201,219) | (121,462,689) | (268,561,849) |
| Net increase (decrease) | (3,230,835) | (3,805,223) | $(47,470,380) | $(69,430,293) |
| Class I | | | | |
| Shares sold | 1,203,326 | 2,965,041 | $20,737,610 | $57,337,133 |
| Reinvestment of distributions | 141,083 | 103,482 | 2,409,447 | 1,967,233 |
| Shares redeemed | (917,290) | (1,909,760) | (15,629,114) | (36,447,458) |
| Net increase (decrease) | 427,119 | 1,158,763 | $7,517,943 | $22,856,908 |
| Class Z | | | | |
| Shares sold | 6,043,187 | 17,477,193 | $95,585,894 | $318,523,898 |
| Reinvestment of distributions | 80,256 | 547,391 | 1,360,444 | 10,313,549 |
| Shares redeemed | (10,349,365) | (20,717,755) | (164,791,725) | (376,153,689) |
| Net increase (decrease) | (4,225,922) | (2,693,171) | $(67,845,387) | $(47,316,242) |
13. Other.
A fund's organizational documents provide former and current trustees and officers with a limited indemnification against liabilities arising in connection with the performance of their duties to the fund. In the normal course of business, a fund may also enter into contracts that provide general indemnifications. A fund's maximum exposure under these arrangements is unknown as this would be dependent on future claims that may be made against a fund. The risk of material loss from such claims is considered remote.
14. Risk and Uncertainties.
Many factors affect a fund's performance. Developments that disrupt global economies and financial markets, such as pandemics, epidemics, outbreaks of infectious diseases, war, terrorism, and environmental disasters, may significantly affect a fund's investment performance. The effects of these developments to a fund will be impacted by the types of securities in which a fund invests, the financial condition, industry, economic sector, and geographic location of an issuer, and a fund's level of investment in the securities of that issuer.
As a shareholder, you incur two types of costs: (1) transaction costs, which may include sales charges (loads) on purchase payments or redemption proceeds, as applicable and (2) ongoing costs, which generally include management fees, distribution and/or service (12b-1) fees and other Fund expenses. This Example is intended to help you understand your ongoing costs (in dollars) of investing in a fund and to compare these costs with the ongoing costs of investing in other mutual funds.
| The Example is based on an investment of $1,000 invested at the beginning of the period and held for the entire period (July 1, 2022 to December 31, 2022). |
Actual Expenses
The first line of the accompanying table provides information about actual account values and actual expenses. You may use the information in this line, together with the amount you invested, to estimate the expenses that you paid over the period. Simply divide your account value by $1,000.00 (for example, an $8,600 account value divided by $1,000.00 = 8.6), then multiply the result by the number in the first line for a class/Fund under the heading entitled "Expenses Paid During Period" to estimate the expenses you paid on your account during this period. If any fund is a shareholder of any underlying mutual funds or exchange-traded funds (ETFs) (the Underlying Funds), such fund indirectly bears its proportional share of the expenses of the Underlying Funds in addition to the direct expenses incurred presented in the table. These fees and expenses are not included in the annualized expense ratio used to calculate the expense estimate in the table below.
Hypothetical Example for Comparison Purposes
The second line of the accompanying table provides information about hypothetical account values and hypothetical expenses based on the actual expense ratio and an assumed rate of return of 5% per year before expenses, which is not the actual return. The hypothetical account values and expenses may not be used to estimate the actual ending account balance or expenses you paid for the period. You may use this information to compare the ongoing costs of investing in the Fund and other funds. To do so, compare this 5% hypothetical example with the 5% hypothetical examples that appear in the shareholder reports of the other funds. If any fund is a shareholder of any Underlying Funds, such fund indirectly bears its proportional share of the expenses of the Underlying Funds in addition to the direct expenses as presented in the table. These fees and expenses are not included in the annualized expense ratio used to calculate the expense estimate in the table below.
Please note that the expenses shown in the table are meant to highlight your ongoing costs only and do not reflect any transaction costs. Therefore, the second line of the table is useful in comparing ongoing costs only, and will not help you determine the relative total costs of owning different funds. In addition, if these transactional costs were included, your costs would have been higher.
| | | | | Annualized Expense Ratio- A | | Beginning Account Value July 1, 2022 | | Ending Account Value December 31, 2022 | | Expenses Paid During Period- C July 1, 2022 to December 31, 2022 |
| Fidelity® Mega Cap Stock Fund | | | | | | | | | | |
| Class A | | | | .90% | | | | | | |
| Actual | | | | | | $ 1,000 | | $ 1,072.60 | | $ 4.70 |
Hypothetical- B | | | | | | $ 1,000 | | $ 1,020.67 | | $ 4.58 |
| Class M | | | | 1.16% | | | | | | |
| Actual | | | | | | $ 1,000 | | $ 1,070.80 | | $ 6.05 |
Hypothetical- B | | | | | | $ 1,000 | | $ 1,019.36 | | $ 5.90 |
| Class C | | | | 1.68% | | | | | | |
| Actual | | | | | | $ 1,000 | | $ 1,068.20 | | $ 8.76 |
Hypothetical- B | | | | | | $ 1,000 | | $ 1,016.74 | | $ 8.54 |
| Fidelity® Mega Cap Stock Fund | | | | .62% | | | | | | |
| Actual | | | | | | $ 1,000 | | $ 1,074.20 | | $ 3.24 |
Hypothetical- B | | | | | | $ 1,000 | | $ 1,022.08 | | $ 3.16 |
| Class I | | | | .63% | | | | | | |
| Actual | | | | | | $ 1,000 | | $ 1,074.20 | | $ 3.29 |
Hypothetical- B | | | | | | $ 1,000 | | $ 1,022.03 | | $ 3.21 |
| Class Z | | | | .51% | | | | | | |
| Actual | | | | | | $ 1,000 | | $ 1,075.20 | | $ 2.67 |
Hypothetical- B | | | | | | $ 1,000 | | $ 1,022.63 | | $ 2.60 |
| |
A Annualized expense ratio reflects expenses net of applicable fee waivers.
B 5% return per year before expenses
C Expenses are equal to the annualized expense ratio, multiplied by the average account value over the period, multiplied by 184/ 365 (to reflect the one-half year period). The fees and expenses of any Underlying Funds are not included in each annualized expense ratio.
1.714809.126
GII-SANN-0323
Fidelity® Growth Discovery Fund
Semi-Annual Report
December 31, 2022
Contents
To view a fund's proxy voting guidelines and proxy voting record for the 12-month period ended June 30, visit http://www.fidelity.com/proxyvotingresults or visit the Securities and Exchange Commission's (SEC) web site at http://www.sec.gov.
You may also call 1-800-544-8544 if you're an individual investing directly with Fidelity, call 1-800-835-5092 if you're a plan sponsor or participant with Fidelity as your recordkeeper or call 1-877-208-0098 on institutional accounts or if you're an advisor or invest through one to request a free copy of the proxy voting guidelines.
Standard & Poor's, S&P and S&P 500 are registered service marks of The McGraw-Hill Companies, Inc. and have been licensed for use by Fidelity Distributors Corporation.
Other third-party marks appearing herein are the property of their respective owners.
All other marks appearing herein are registered or unregistered trademarks or service marks of FMR LLC or an affiliated company. © 2023 FMR LLC. All rights reserved.
This report and the financial statements contained herein are submitted for the general information of the shareholders of the Fund. This report is not authorized for distribution to prospective investors in the Fund unless preceded or accompanied by an effective prospectus.
A fund files its complete schedule of portfolio holdings with the SEC for the first and third quarters of each fiscal year on Form N-PORT. Forms N-PORT are available on the SEC's web site at http://www.sec.gov. A fund's Forms N-PORT may be reviewed and copied at the SEC's Public Reference Room in Washington, DC. Information regarding the operation of the SEC's Public Reference Room may be obtained by calling 1-800-SEC-0330.
For a complete list of a fund's portfolio holdings, view the most recent holdings listing, semiannual report, or annual report on Fidelity's web site at http://www.fidelity.com, http://www.institutional.fidelity.com, or http://www.401k.com, as applicable.
NOT FDIC INSURED •MAY LOSE VALUE •NO BANK GUARANTEE
Neither the Fund nor Fidelity Distributors Corporation is a bank.
Top Holdings (% of Fund's net assets) |
| |
| Microsoft Corp. | 10.0 | |
| UnitedHealth Group, Inc. | 5.5 | |
| Alphabet, Inc. Class A | 4.5 | |
| Apple, Inc. | 3.7 | |
| Amazon.com, Inc. | 3.0 | |
| Vertex Pharmaceuticals, Inc. | 2.7 | |
| Universal Music Group NV | 2.3 | |
| Warner Music Group Corp. Class A | 2.0 | |
| The Coca-Cola Co. | 1.9 | |
| Eli Lilly & Co. | 1.9 | |
| | 37.5 | |
| |
| Market Sectors (% of Fund's net assets) |
| |
| Information Technology | 26.0 | |
| Health Care | 20.1 | |
| Communication Services | 11.9 | |
| Consumer Discretionary | 10.5 | |
| Industrials | 10.0 | |
| Financials | 6.2 | |
| Energy | 5.4 | |
| Consumer Staples | 4.5 | |
| Materials | 3.7 | |
| Real Estate | 0.1 | |
| Utilities | 0.0 | |
| |
Asset Allocation (% of Fund's net assets) |
|
Foreign investments - 10.8% |
|
Geographic Diversification (% of Fund's net assets) |
|
* Includes Short-Term investments and Net Other Assets (Liabilities). Percentages are based on country or territory of incorporation and are adjusted for the effect of derivatives, if applicable. |
| |
Showing Percentage of Net Assets
| Common Stocks - 98.1% |
| | | Shares | Value ($) (000s) |
| COMMUNICATION SERVICES - 11.9% | | | |
| Entertainment - 4.7% | | | |
| Liberty Media Corp. Liberty Formula One Series C (a) | | 104,872 | 6,269 |
| Netflix, Inc. (a) | | 16,700 | 4,924 |
| Universal Music Group NV | | 2,570,267 | 62,156 |
| Warner Music Group Corp. Class A (b) | | 1,573,563 | 55,106 |
| | | | 128,455 |
| Interactive Media & Services - 6.4% | | | |
| Alphabet, Inc. Class A (a) | | 1,401,853 | 123,685 |
| Bumble, Inc. (a) | | 251,436 | 5,293 |
| Epic Games, Inc. (a)(c)(d) | | 2,244 | 1,830 |
| Meta Platforms, Inc. Class A (a) | | 308,801 | 37,161 |
| Zoominfo Technologies, Inc. (a) | | 155,695 | 4,688 |
| | | | 172,657 |
| Media - 0.8% | | | |
| Charter Communications, Inc. Class A (a) | | 62,899 | 21,329 |
| Innovid Corp. (a)(c) | | 166,306 | 284 |
| | | | 21,613 |
TOTAL COMMUNICATION SERVICES | | | 322,725 |
| CONSUMER DISCRETIONARY - 10.5% | | | |
| Auto Components - 0.0% | | | |
| Mobileye Global, Inc. (b) | | 24,200 | 848 |
| Automobiles - 0.7% | | | |
| Ferrari NV | | 83,785 | 17,948 |
| XPeng, Inc. ADR (a)(b) | | 13,400 | 133 |
| | | | 18,081 |
| Diversified Consumer Services - 0.2% | | | |
| Laureate Education, Inc. Class A | | 667,546 | 6,422 |
| Hotels, Restaurants & Leisure - 1.3% | | | |
| Airbnb, Inc. Class A (a) | | 174,882 | 14,952 |
| Chipotle Mexican Grill, Inc. (a) | | 4,500 | 6,244 |
| Flutter Entertainment PLC (a) | | 114,487 | 15,626 |
| | | | 36,822 |
| Household Durables - 0.0% | | | |
| Blu Investments LLC (a)(c)(d) | | 3,320,224 | 1 |
| Internet & Direct Marketing Retail - 4.8% | | | |
| Amazon.com, Inc. (a) | | 973,339 | 81,760 |
| Uber Technologies, Inc. (a) | | 1,944,742 | 48,093 |
| | | | 129,853 |
| Multiline Retail - 0.1% | | | |
| Dollarama, Inc. | | 31,500 | 1,842 |
| Specialty Retail - 2.2% | | | |
| Aritzia, Inc. (a) | | 53,069 | 1,856 |
| Five Below, Inc. (a) | | 126,188 | 22,319 |
| TJX Companies, Inc. | | 286,145 | 22,777 |
| Victoria's Secret & Co. (a) | | 364,588 | 13,045 |
| | | | 59,997 |
| Textiles, Apparel & Luxury Goods - 1.2% | | | |
| LVMH Moet Hennessy Louis Vuitton SE | | 23,463 | 17,074 |
| On Holding AG (a) | | 7,900 | 136 |
| Samsonite International SA (a)(e) | | 5,448,387 | 14,306 |
| | | | 31,516 |
TOTAL CONSUMER DISCRETIONARY | | | 285,382 |
| CONSUMER STAPLES - 4.5% | | | |
| Beverages - 4.5% | | | |
| Boston Beer Co., Inc. Class A (a) | | 30,100 | 9,919 |
| Constellation Brands, Inc. Class A (sub. vtg.) | | 68,387 | 15,849 |
| Keurig Dr. Pepper, Inc. | | 441,545 | 15,745 |
| Monster Beverage Corp. (a) | | 268,112 | 27,221 |
| The Coca-Cola Co. | | 827,214 | 52,619 |
| | | | 121,353 |
| Household Products - 0.0% | | | |
| Energizer Holdings, Inc. | | 16,200 | 544 |
TOTAL CONSUMER STAPLES | | | 121,897 |
| ENERGY - 5.4% | | | |
| Energy Equipment & Services - 1.2% | | | |
| Baker Hughes Co. Class A | | 494,993 | 14,617 |
| Cactus, Inc. | | 78,900 | 3,966 |
| Championx Corp. | | 298,489 | 8,653 |
| Helmerich & Payne, Inc. (b) | | 78,900 | 3,911 |
| TechnipFMC PLC (a) | | 46,419 | 566 |
| | | | 31,713 |
| Oil, Gas & Consumable Fuels - 4.2% | | | |
| Canadian Natural Resources Ltd. | | 188,667 | 10,477 |
| Cheniere Energy, Inc. | | 241,600 | 36,230 |
| Denbury, Inc. (a) | | 66,309 | 5,770 |
| New Fortress Energy, Inc. | | 176,882 | 7,503 |
| Ovintiv, Inc. | | 50,200 | 2,546 |
| Range Resources Corp. | | 350,000 | 8,757 |
| Reliance Industries Ltd. | | 1,377,335 | 42,278 |
| | | | 113,561 |
TOTAL ENERGY | | | 145,274 |
| FINANCIALS - 6.2% | | | |
| Banks - 1.1% | | | |
| Bank of America Corp. | | 742,430 | 24,589 |
| HDFC Bank Ltd. (a) | | 75,673 | 1,484 |
| Signature Bank | | 25,938 | 2,989 |
| | | | 29,062 |
| Capital Markets - 2.4% | | | |
| CME Group, Inc. | | 303,996 | 51,120 |
| MSCI, Inc. | | 28,488 | 13,252 |
| | | | 64,372 |
| Insurance - 2.7% | | | |
| American Financial Group, Inc. | | 113,462 | 15,576 |
| Arthur J. Gallagher & Co. | | 172,603 | 32,543 |
| BRP Group, Inc. (a) | | 181,783 | 4,570 |
| Marsh & McLennan Companies, Inc. | | 127,893 | 21,164 |
| | | | 73,853 |
| Thrifts & Mortgage Finance - 0.0% | | | |
| Rocket Companies, Inc. (b) | | 247,200 | 1,730 |
TOTAL FINANCIALS | | | 169,017 |
| HEALTH CARE - 20.1% | | | |
| Biotechnology - 6.7% | | | |
| 2seventy bio, Inc. (a)(b) | | 34,400 | 322 |
| Adamas Pharmaceuticals, Inc.: | | | |
| rights (a)(d) | | 678,800 | 183 |
| rights (a)(d) | | 678,800 | 61 |
| Affimed NV (a)(b) | | 251,902 | 312 |
| Alnylam Pharmaceuticals, Inc. (a) | | 77,333 | 18,378 |
| Applied Therapeutics, Inc. (a) | | 56,523 | 43 |
| Arcellx, Inc. | | 25,300 | 784 |
| Beam Therapeutics, Inc. (a)(b) | | 25,400 | 993 |
| Cytokinetics, Inc. (a) | | 74,200 | 3,400 |
| EQRx, Inc. (a) | | 168,650 | 415 |
| Erasca, Inc. (a) | | 65,800 | 284 |
| Evelo Biosciences, Inc. (a) | | 187,600 | 302 |
| Galapagos NV sponsored ADR (a)(b) | | 190,059 | 8,435 |
| Gamida Cell Ltd. (a)(b) | | 976,186 | 1,259 |
| Genmab A/S (a) | | 7,100 | 3,002 |
| Hookipa Pharma, Inc. (a) | | 454,700 | 368 |
| Immunocore Holdings PLC ADR (a) | | 68,900 | 3,932 |
| Innovent Biologics, Inc. (a)(e) | | 409,342 | 1,742 |
| Insmed, Inc. (a) | | 304,997 | 6,094 |
| Legend Biotech Corp. ADR (a) | | 55,700 | 2,781 |
| Prelude Therapeutics, Inc. (a) | | 11,400 | 69 |
| Regeneron Pharmaceuticals, Inc. (a) | | 45,769 | 33,022 |
| Rubius Therapeutics, Inc. (a)(b) | | 54,080 | 9 |
| Seagen, Inc. (a) | | 124,426 | 15,990 |
| Seres Therapeutics, Inc. (a) | | 161,000 | 902 |
| Synlogic, Inc. (a) | | 458,100 | 348 |
| Vertex Pharmaceuticals, Inc. (a) | | 256,122 | 73,963 |
| Vor Biopharma, Inc. (a)(b) | | 298,222 | 1,983 |
| XOMA Corp. (a)(b) | | 162,100 | 2,983 |
| | | | 182,359 |
| Health Care Equipment & Supplies - 1.0% | | | |
| Boston Scientific Corp. (a) | | 416,900 | 19,290 |
| Insulet Corp. (a) | | 3,700 | 1,089 |
| Nevro Corp. (a) | | 20,700 | 820 |
| Penumbra, Inc. (a) | | 23,000 | 5,117 |
| | | | 26,316 |
| Health Care Providers & Services - 6.7% | | | |
| Guardant Health, Inc. (a) | | 187,713 | 5,106 |
| HealthEquity, Inc. (a) | | 468,285 | 28,865 |
| Option Care Health, Inc. (a) | | 31,000 | 933 |
| UnitedHealth Group, Inc. | | 279,382 | 148,123 |
| | | | 183,027 |
| Health Care Technology - 0.3% | | | |
| Certara, Inc. (a)(b) | | 260,358 | 4,184 |
| Doximity, Inc. (a)(b) | | 47,336 | 1,589 |
| Simulations Plus, Inc. (b) | | 50,400 | 1,843 |
| | | | 7,616 |
| Life Sciences Tools & Services - 2.6% | | | |
| Bio-Techne Corp. | | 89,188 | 7,392 |
| Bruker Corp. | | 213,552 | 14,596 |
| Charles River Laboratories International, Inc. (a) | | 15,000 | 3,269 |
| Codexis, Inc. (a) | | 213,101 | 993 |
| Danaher Corp. | | 115,314 | 30,607 |
| Nanostring Technologies, Inc. (a) | | 45,596 | 363 |
| Thermo Fisher Scientific, Inc. | | 23,199 | 12,775 |
| | | | 69,995 |
| Pharmaceuticals - 2.8% | | | |
| Aclaris Therapeutics, Inc. (a) | | 89,364 | 1,407 |
| AstraZeneca PLC sponsored ADR | | 264,607 | 17,940 |
| Eli Lilly & Co. | | 140,601 | 51,437 |
| Nuvation Bio, Inc. (a) | | 119,094 | 229 |
| Revance Therapeutics, Inc. (a) | | 259,981 | 4,799 |
| | | | 75,812 |
TOTAL HEALTH CARE | | | 545,125 |
| INDUSTRIALS - 10.0% | | | |
| Aerospace & Defense - 3.2% | | | |
| Axon Enterprise, Inc. (a) | | 43,698 | 7,251 |
| Northrop Grumman Corp. | | 47,520 | 25,927 |
| Spirit AeroSystems Holdings, Inc. Class A (b) | | 474,700 | 14,051 |
| The Boeing Co. (a) | | 205,286 | 39,105 |
| | | | 86,334 |
| Electrical Equipment - 1.5% | | | |
| AMETEK, Inc. | | 67,700 | 9,459 |
| Bloom Energy Corp. Class A (a)(b) | | 58,800 | 1,124 |
| Eaton Corp. PLC | | 24,097 | 3,782 |
| Hubbell, Inc. Class B (b) | | 26,572 | 6,236 |
| Rockwell Automation, Inc. (b) | | 77,135 | 19,868 |
| | | | 40,469 |
| Industrial Conglomerates - 0.8% | | | |
| General Electric Co. | | 253,000 | 21,199 |
| Machinery - 1.8% | | | |
| Chart Industries, Inc. (a)(b) | | 30,532 | 3,518 |
| Ingersoll Rand, Inc. | | 502,900 | 26,277 |
| Parker Hannifin Corp. | | 40,116 | 11,674 |
| Westinghouse Air Brake Tech Co. | | 81,004 | 8,085 |
| | | | 49,554 |
| Professional Services - 1.5% | | | |
| ASGN, Inc. (a) | | 66,920 | 5,453 |
| KBR, Inc. | | 596,045 | 31,471 |
| Kforce, Inc. | | 24,400 | 1,338 |
| Upwork, Inc. (a) | | 204,772 | 2,138 |
| | | | 40,400 |
| Road & Rail - 0.3% | | | |
| Old Dominion Freight Lines, Inc. | | 31,239 | 8,865 |
| Trading Companies & Distributors - 0.9% | | | |
| Ferguson PLC | | 179,726 | 22,684 |
TOTAL INDUSTRIALS | | | 269,505 |
| INFORMATION TECHNOLOGY - 26.0% | | | |
| IT Services - 1.6% | | | |
| Cloudflare, Inc. (a) | | 140,276 | 6,342 |
| MasterCard, Inc. Class A | | 62,482 | 21,727 |
| MongoDB, Inc. Class A (a) | | 73,317 | 14,432 |
| Snowflake, Inc. (a) | | 5,100 | 732 |
| | | | 43,233 |
| Semiconductors & Semiconductor Equipment - 4.9% | | | |
| Aixtron AG | | 309,465 | 8,934 |
| Allegro MicroSystems LLC (a) | | 79,500 | 2,387 |
| ASML Holding NV | | 24,332 | 13,295 |
| eMemory Technology, Inc. | | 24,000 | 1,037 |
| Enphase Energy, Inc. (a) | | 90,310 | 23,929 |
| Monolithic Power Systems, Inc. | | 4,600 | 1,627 |
| NVIDIA Corp. | | 228,229 | 33,353 |
| NXP Semiconductors NV | | 34,254 | 5,413 |
| Qualcomm, Inc. | | 196,918 | 21,649 |
| Silicon Laboratories, Inc. (a) | | 5,000 | 678 |
| SiTime Corp. (a) | | 82,885 | 8,423 |
| Universal Display Corp. | | 106,768 | 11,535 |
| | | | 132,260 |
| Software - 15.8% | | | |
| Adobe, Inc. (a) | | 152,079 | 51,179 |
| Confluent, Inc. (a) | | 149,192 | 3,318 |
| Elastic NV (a) | | 1,800 | 93 |
| HashiCorp, Inc. (b) | | 120,110 | 3,284 |
| HubSpot, Inc. (a) | | 15,161 | 4,383 |
| Intuit, Inc. | | 59,866 | 23,301 |
| Manhattan Associates, Inc. (a) | | 111,308 | 13,513 |
| Microsoft Corp. | | 1,130,882 | 271,209 |
| Oracle Corp. | | 371,743 | 30,386 |
| Palo Alto Networks, Inc. (a) | | 189,103 | 26,387 |
| Volue A/S (a) | | 579,724 | 1,666 |
| | | | 428,719 |
| Technology Hardware, Storage & Peripherals - 3.7% | | | |
| Apple, Inc. | | 758,458 | 98,546 |
TOTAL INFORMATION TECHNOLOGY | | | 702,758 |
| MATERIALS - 3.4% | | | |
| Chemicals - 3.0% | | | |
| Albemarle Corp. | | 103,599 | 22,466 |
| Aspen Aerogels, Inc. (a) | | 274,400 | 3,235 |
| CF Industries Holdings, Inc. | | 236,561 | 20,155 |
| Sherwin-Williams Co. | | 146,845 | 34,851 |
| | | | 80,707 |
| Metals & Mining - 0.4% | | | |
| Lynas Rare Earths Ltd. (a) | | 1,122,285 | 5,916 |
| MP Materials Corp. (a)(b) | | 202,380 | 4,914 |
| | | | 10,830 |
TOTAL MATERIALS | | | 91,537 |
| REAL ESTATE - 0.1% | | | |
| Real Estate Management & Development - 0.1% | | | |
| Doma Holdings, Inc. (a)(c) | | 331,286 | 150 |
| WeWork, Inc. (a)(b) | | 1,628,500 | 2,329 |
| | | | 2,479 |
| UTILITIES - 0.0% | | | |
| Independent Power and Renewable Electricity Producers - 0.0% | | | |
| Brookfield Renewable Partners LP | | 47,500 | 1,204 |
| TOTAL COMMON STOCKS (Cost $1,966,643) | | | 2,656,903 |
| | | | |
| Convertible Preferred Stocks - 0.3% |
| | | Shares | Value ($) (000s) |
| HEALTH CARE - 0.0% | | | |
| Biotechnology - 0.0% | | | |
| ElevateBio LLC Series C (a)(c)(d) | | 75,700 | 277 |
| INFORMATION TECHNOLOGY - 0.0% | | | |
| IT Services - 0.0% | | | |
| AppNexus, Inc. Series E (Escrow) (a)(c)(d) | | 48,212 | 2 |
| Software - 0.0% | | | |
| ASAPP, Inc. Series C (a)(c)(d) | | 250,763 | 1,053 |
TOTAL INFORMATION TECHNOLOGY | | | 1,055 |
| MATERIALS - 0.3% | | | |
| Metals & Mining - 0.3% | | | |
| Illuminated Holdings, Inc.: | | | |
| Series C2 (a)(c)(d) | | 50,974 | 2,415 |
| Series C3 (a)(c)(d) | | 63,718 | 3,018 |
| Series C4 (a)(c)(d) | | 18,303 | 867 |
| Series C5 (a)(c)(d) | | 36,887 | 1,747 |
| | | | 8,047 |
| TOTAL CONVERTIBLE PREFERRED STOCKS (Cost $7,411) | | | 9,379 |
| | | | |
| Money Market Funds - 3.5% |
| | | Shares | Value ($) (000s) |
| Fidelity Cash Central Fund 4.37% (f) | | 66,502,838 | 66,516 |
| Fidelity Securities Lending Cash Central Fund 4.37% (f)(g) | | 28,030,963 | 28,034 |
| TOTAL MONEY MARKET FUNDS (Cost $94,550) | | | 94,550 |
| | | | |
| TOTAL INVESTMENT IN SECURITIES - 101.9% (Cost $2,068,604) | 2,760,832 |
NET OTHER ASSETS (LIABILITIES) - (1.9)% | (52,279) |
| NET ASSETS - 100.0% | 2,708,553 |
| | |
Any values shown as $0 in the Schedule of Investments may reflect amounts less than $500.
Legend
| (b) | Security or a portion of the security is on loan at period end. |
| (c) | Restricted securities (including private placements) - Investment in securities not registered under the Securities Act of 1933 (excluding 144A issues). At the end of the period, the value of restricted securities (excluding 144A issues) amounted to $11,644,000 or 0.4% of net assets. |
| (e) | Security exempt from registration under Rule 144A of the Securities Act of 1933. These securities may be resold in transactions exempt from registration, normally to qualified institutional buyers. At the end of the period, the value of these securities amounted to $16,048,000 or 0.6% of net assets. |
| (f) | Affiliated fund that is generally available only to investment companies and other accounts managed by Fidelity Investments. The rate quoted is the annualized seven-day yield of the fund at period end. A complete unaudited listing of the fund's holdings as of its most recent quarter end is available upon request. In addition, each Fidelity Central Fund's financial statements are available on the SEC's website or upon request. |
| (g) | Investment made with cash collateral received from securities on loan. |
| Additional information on each restricted holding is as follows: |
| Security | Acquisition Date | Acquisition Cost ($) (000s) |
| AppNexus, Inc. Series E (Escrow) | 8/01/14 | 0 |
| | | |
| ASAPP, Inc. Series C | 4/30/21 | 1,654 |
| | | |
| Blu Investments LLC | 5/21/20 | 6 |
| | | |
| Doma Holdings, Inc. | 3/02/21 | 3,313 |
| | | |
| ElevateBio LLC Series C | 3/09/21 | 318 |
| | | |
| Epic Games, Inc. | 3/29/21 | 1,986 |
| | | |
| Illuminated Holdings, Inc. Series C2 | 7/07/20 | 1,274 |
| | | |
| Illuminated Holdings, Inc. Series C3 | 7/07/20 | 1,912 |
| | | |
| Illuminated Holdings, Inc. Series C4 | 1/08/21 | 659 |
| | | |
| Illuminated Holdings, Inc. Series C5 | 6/16/21 | 1,594 |
| | | |
| Innovid Corp. | 6/24/21 | 1,663 |
| | | |
Affiliated Central Funds
Fiscal year to date information regarding the Fund's investments in Fidelity Central Funds, including the ownership percentage, is presented below.
| Affiliate (Amounts in thousands) | Value, beginning of period ($) | Purchases ($) | Sales Proceeds ($) | Dividend Income ($) | Realized Gain (loss) ($) | Change in Unrealized appreciation (depreciation) ($) | Value, end of period ($) | % ownership, end of period |
| Fidelity Cash Central Fund 4.37% | 6,259 | 363,548 | 303,291 | 604 | - | - | 66,516 | 0.2% |
| Fidelity Securities Lending Cash Central Fund 4.37% | 109,945 | 163,875 | 245,786 | 271 | - | - | 28,034 | 0.1% |
| Total | 116,204 | 527,423 | 549,077 | 875 | - | - | 94,550 | |
| | | | | | | | | |
Amounts in the dividend income column in the above table include any capital gain distributions from underlying funds, which are presented in the corresponding line item in the Statement of Operations, if applicable.
Amount for Fidelity Securities Lending Cash Central Fund represents the income earned on investing cash collateral, less rebates paid to borrowers and any lending agent fees associated with the loan, plus any premium payments received for lending certain types of securities.
Amounts included in the purchases and sales proceeds columns may include in-kind transactions, if applicable.
Investment Valuation
The following is a summary of the inputs used, as of December 31, 2022, involving the Fund's assets and liabilities carried at fair value. The inputs or methodology used for valuing securities may not be an indication of the risk associated with investing in those securities. For more information on valuation inputs, and their aggregation into the levels used below, please refer to the Investment Valuation section in the accompanying Notes to Financial Statements.
| Valuation Inputs at Reporting Date: |
Description (Amounts in thousands) | Total ($) | Level 1 ($) | Level 2 ($) | Level 3 ($) |
Investments in Securities: | | | | |
|
| Equities: | | | | |
Communication Services | 322,725 | 258,739 | 62,156 | 1,830 |
Consumer Discretionary | 285,382 | 254,001 | 31,380 | 1 |
Consumer Staples | 121,897 | 121,897 | - | - |
Energy | 145,274 | 102,996 | 42,278 | - |
Financials | 169,017 | 167,533 | 1,484 | - |
Health Care | 545,402 | 540,137 | 4,744 | 521 |
Industrials | 269,505 | 269,505 | - | - |
Information Technology | 703,813 | 701,721 | 1,037 | 1,055 |
Materials | 99,584 | 85,621 | 5,916 | 8,047 |
Real Estate | 2,479 | 2,479 | - | - |
Utilities | 1,204 | 1,204 | - | - |
|
| Money Market Funds | 94,550 | 94,550 | - | - |
| Total Investments in Securities: | 2,760,832 | 2,600,383 | 148,995 | 11,454 |
| Statement of Assets and Liabilities |
| Amounts in thousands (except per-share amounts) | | | | December 31, 2022 (Unaudited) |
| | | | | |
| Assets | | | | |
| Investment in securities, at value (including securities loaned of $27,596) - See accompanying schedule: | $ | | | |
Unaffiliated issuers (cost $1,974,054) | | 2,666,282 | | |
Fidelity Central Funds (cost $94,550) | | 94,550 | | |
| | | | | |
| | | | | |
| Total Investment in Securities (cost $2,068,604) | | | $ | 2,760,832 |
| Foreign currency held at value (cost $58) | | | | 59 |
| Receivable for investments sold | | | | 2,723 |
| Receivable for fund shares sold | | | | 2,821 |
| Dividends receivable | | | | 1,847 |
| Distributions receivable from Fidelity Central Funds | | | | 232 |
| Prepaid expenses | | | | 3 |
| Other receivables | | | | 18 |
Total assets | | | | 2,768,535 |
| Liabilities | | | | |
| Payable for investments purchased | | $25,542 | | |
| Payable for fund shares redeemed | | 2,138 | | |
| Accrued management fee | | 1,690 | | |
| Other affiliated payables | | 371 | | |
| Other payables and accrued expenses | | 2,213 | | |
| Collateral on securities loaned | | 28,028 | | |
| Total Liabilities | | | | 59,982 |
| Net Assets | | | $ | 2,708,553 |
| Net Assets consist of: | | | | |
| Paid in capital | | | $ | 2,024,844 |
| Total accumulated earnings (loss) | | | | 683,709 |
| Net Assets | | | $ | 2,708,553 |
| | | | | |
| Net Asset Value and Maximum Offering Price | | | | |
| Growth Discovery : | | | | |
Net Asset Value , offering price and redemption price per share ($2,402,169 ÷ 58,845 shares) | | | $ | 40.82 |
| Class K : | | | | |
Net Asset Value , offering price and redemption price per share ($306,384 ÷ 7,492 shares) | | | $ | 40.89 |
| Statement of Operations |
| Amounts in thousands | | | | Six months ended December 31, 2022 (Unaudited) |
| Investment Income | | | | |
| Dividends | | | $ | 21,866 |
| Income from Fidelity Central Funds (including $271 from security lending) | | | | 875 |
| Total Income | | | | 22,741 |
| Expenses | | | | |
| Management fee | | | | |
| Basic fee | $ | 7,396 | | |
| Performance adjustment | | 2,566 | | |
| Transfer agent fees | | 1,858 | | |
| Accounting fees | | 365 | | |
| Custodian fees and expenses | | 26 | | |
| Independent trustees' fees and expenses | | 5 | | |
| Registration fees | | 52 | | |
| Audit | | 33 | | |
| Legal | | 5 | | |
| Interest | | 17 | | |
| Miscellaneous | | 7 | | |
| Total expenses before reductions | | 12,330 | | |
| Expense reductions | | (52) | | |
| Total expenses after reductions | | | | 12,278 |
| Net Investment income (loss) | | | | 10,463 |
| Realized and Unrealized Gain (Loss) | | | | |
| Net realized gain (loss) on: | | | | |
| Investment Securities: | | | | |
| Unaffiliated issuers (net of foreign taxes of $419) | | (2,673) | | |
| Foreign currency transactions | | 34 | | |
| Total net realized gain (loss) | | | | (2,639) |
| Change in net unrealized appreciation (depreciation) on: | | | | |
| Investment Securities: | | | | |
| Unaffiliated issuers (net of decrease in deferred foreign taxes of $648) | | (36,771) | | |
| Assets and liabilities in foreign currencies | | 3 | | |
| Total change in net unrealized appreciation (depreciation) | | | | (36,768) |
| Net gain (loss) | | | | (39,407) |
| Net increase (decrease) in net assets resulting from operations | | | $ | (28,944) |
| Statement of Changes in Net Assets |
| |
| Amount in thousands | | Six months ended December 31, 2022 (Unaudited) | | Year ended June 30, 2022 |
| Increase (Decrease) in Net Assets | | | | |
| Operations | | | | |
| Net investment income (loss) | $ | 10,463 | $ | (4,098) |
| Net realized gain (loss) | | (2,639) | | 226,790 |
| Change in net unrealized appreciation (depreciation) | | (36,768) | | (774,350) |
| Net increase (decrease) in net assets resulting from operations | | (28,944) | | (551,658) |
| Distributions to shareholders | | (98,036) | | (443,712) |
| Share transactions - net increase (decrease) | | 67,118 | | 389,486 |
| Total increase (decrease) in net assets | | (59,862) | | (605,884) |
| | | | | |
| Net Assets | | | | |
| Beginning of period | | 2,768,415 | | 3,374,299 |
| End of period | $ | 2,708,553 | $ | 2,768,415 |
| | | | | |
| | | | | |
Financial Highlights
| Fidelity® Growth Discovery Fund |
| |
| | Six months ended (Unaudited) December 31, 2022 | | Years ended June 30, 2022 | | 2021 | | 2020 | | 2019 | | 2018 |
Selected Per-Share Data | | | | | | | | | | | | |
| Net asset value, beginning of period | $ | 42.65 | $ | 58.70 | $ | 45.22 | $ | 37.74 | $ | 35.75 | $ | 30.58 |
| Income from Investment Operations | | | | | | | | | | | | |
Net investment income (loss) A,B | | .16 | | (.07) | | (.07) | | .03 | | .04 | | .07 |
| Net realized and unrealized gain (loss) | | (.50) | | (8.48) | | 18.53 | | 9.15 | | 3.51 | | 6.71 |
| Total from investment operations | | (.34) | | (8.55) | | 18.46 | | 9.18 | | 3.55 | | 6.78 |
| Distributions from net investment income | | (.01) | | (.13) | | (.01) | | (.02) | | (.06) | | (.05) |
| Distributions from net realized gain | | (1.48) | | (7.37) | | (4.98) | | (1.68) | | (1.50) | | (1.56) |
| Total distributions | | (1.49) | | (7.50) | | (4.98) C | | (1.70) | | (1.56) | | (1.61) |
| Net asset value, end of period | $ | 40.82 | $ | 42.65 | $ | 58.70 | $ | 45.22 | $ | 37.74 | $ | 35.75 |
Total Return D,E | | (1.19)% | | (17.10)% | | 43.10% | | 25.33% | | 10.33% | | 22.94% |
Ratios to Average Net Assets B,F,G | | | | | | | | | | | | |
| Expenses before reductions | | .89% H | | .77% | | .79% | | .79% | | .77% | | .74% |
| Expenses net of fee waivers, if any | | .89% H | | .77% | | .79% | | .79% | | .77% | | .74% |
| Expenses net of all reductions | | .89% H | | .77% | | .78% | | .78% | | .76% | | .73% |
| Net investment income (loss) | | .73% H | | (.14)% | | (.12)% | | .06% | | .11% | | .22% |
| Supplemental Data | | | | | | | | | | | | |
| Net assets, end of period (in millions) | $ | 2,402 | $ | 2,339 | $ | 2,944 | $ | 2,094 | $ | 1,707 | $ | 1,546 |
Portfolio turnover rate I | | 38% H | | 45% | | 51% | | 54% | | 49% | | 45% |
A Calculated based on average shares outstanding during the period.
B Net investment income (loss) is affected by the timing of the declaration of dividends by any underlying mutual funds or exchange-traded funds (ETFs). Net investment income (loss) of any mutual funds or ETFs is not included in the Fund's net investment income (loss) ratio.
C Total distributions per share do not sum due to rounding.
D Total returns for periods of less than one year are not annualized.
E Total returns would have been lower if certain expenses had not been reduced during the applicable periods shown.
F Fees and expenses of any underlying mutual funds or exchange-traded funds (ETFs) are not included in the Fund's expense ratio. The Fund indirectly bears its proportionate share of these expenses. For additional expense information related to investments in Fidelity Central Funds, please refer to the "Investments in Fidelity Central Funds" note found in the Notes to Financial Statements section of the most recent Annual or Semi-Annual report.
G Expense ratios reflect operating expenses of the class. Expenses before reductions do not reflect amounts reimbursed, waived, or reduced through arrangements with the investment adviser, brokerage services, or other offset arrangements, if applicable, and do not represent the amount paid by the class during periods when reimbursements, waivers or reductions occur.
H Annualized.
I Amount does not include the portfolio activity of any underlying mutual funds or exchange-traded funds (ETFs).
| Fidelity® Growth Discovery Fund Class K |
| |
| | Six months ended (Unaudited) December 31, 2022 | | Years ended June 30, 2022 | | 2021 | | 2020 | | 2019 | | 2018 |
Selected Per-Share Data | | | | | | | | | | | | |
| Net asset value, beginning of period | $ | 42.71 | $ | 58.78 | $ | 45.27 | $ | 37.78 | $ | 35.78 | $ | 30.61 |
| Income from Investment Operations | | | | | | | | | | | | |
Net investment income (loss) A,B | | .18 | | (.02) | | (.02) | | .06 | | .08 | | .11 |
| Net realized and unrealized gain (loss) | | (.49) | | (8.50) | | 18.56 | | 9.17 | | 3.52 | | 6.71 |
| Total from investment operations | | (.31) | | (8.52) | | 18.54 | | 9.23 | | 3.60 | | 6.82 |
| Distributions from net investment income | | (.03) | | (.16) | | (.03) | | (.06) | | (.10) | | (.09) |
| Distributions from net realized gain | | (1.48) | | (7.40) | | (5.00) | | (1.68) | | (1.50) | | (1.56) |
| Total distributions | | (1.51) | | (7.55) C | | (5.03) | | (1.74) | | (1.60) | | (1.65) |
| Net asset value, end of period | $ | 40.89 | $ | 42.71 | $ | 58.78 | $ | 45.27 | $ | 37.78 | $ | 35.78 |
Total Return D,E | | (1.12)% | | (17.04)% | | 43.25% | | 25.46% | | 10.47% | | 23.05% |
Ratios to Average Net Assets B,F,G | | | | | | | | | | | | |
| Expenses before reductions | | .79% H | | .68% | | .69% | | .69% | | .66% | | .63% |
| Expenses net of fee waivers, if any | | .78% H | | .68% | | .69% | | .69% | | .66% | | .63% |
| Expenses net of all reductions | | .78% H | | .68% | | .69% | | .68% | | .66% | | .63% |
| Net investment income (loss) | | .84% H | | (.05)% | | (.03)% | | .17% | | .22% | | .32% |
| Supplemental Data | | | | | | | | | | | | |
| Net assets, end of period (in millions) | $ | 306 | $ | 430 | $ | 430 | $ | 316 | $ | 366 | $ | 361 |
Portfolio turnover rate I | | 38% H | | 45% | | 51% | | 54% | | 49% | | 45% |
A Calculated based on average shares outstanding during the period.
B Net investment income (loss) is affected by the timing of the declaration of dividends by any underlying mutual funds or exchange-traded funds (ETFs). Net investment income (loss) of any mutual funds or ETFs is not included in the Fund's net investment income (loss) ratio.
C Total distributions per share do not sum due to rounding.
D Total returns for periods of less than one year are not annualized.
E Total returns would have been lower if certain expenses had not been reduced during the applicable periods shown.
F Fees and expenses of any underlying mutual funds or exchange-traded funds (ETFs) are not included in the Fund's expense ratio. The Fund indirectly bears its proportionate share of these expenses. For additional expense information related to investments in Fidelity Central Funds, please refer to the "Investments in Fidelity Central Funds" note found in the Notes to Financial Statements section of the most recent Annual or Semi-Annual report.
G Expense ratios reflect operating expenses of the class. Expenses before reductions do not reflect amounts reimbursed, waived, or reduced through arrangements with the investment adviser, brokerage services, or other offset arrangements, if applicable, and do not represent the amount paid by the class during periods when reimbursements, waivers or reductions occur.
H Annualized.
I Amount does not include the portfolio activity of any underlying mutual funds or exchange-traded funds (ETFs).
For the period ended December 31, 2022
( Amounts in thousands except percentages)
1. Organization.
Fidelity Growth Discovery Fund (the Fund) is a fund of Fidelity Hastings Street Trust (the Trust) and is authorized to issue an unlimited number of shares. The Trust is registered under the Investment Company Act of 1940, as amended (the 1940 Act), as an open-end management investment company organized as a Massachusetts business trust. The Fund offers Growth Discovery and Class K shares, each of which has equal rights as to assets and voting privileges. Each class has exclusive voting rights with respect to matters that affect that class.
The Board of Trustees has approved, subject to shareholder approval, a proposal to reclassify the Fund as a non-diversified fund.
2. Investments in Fidelity Central Funds.
Funds may invest in Fidelity Central Funds, which are open-end investment companies generally available only to other investment companies and accounts managed by the investment adviser and its affiliates. The Schedule of Investments lists any Fidelity Central Funds held as an investment as of period end, but does not include the underlying holdings of each Fidelity Central Fund. An investing fund indirectly bears its proportionate share of the expenses of the underlying Fidelity Central Funds.
Based on its investment objective, each Fidelity Central Fund may invest or participate in various investment vehicles or strategies that are similar to those of the investing fund. These strategies are consistent with the investment objectives of the investing fund and may involve certain economic risks which may cause a decline in value of each of the Fidelity Central Funds and thus a decline in the value of the investing fund.
| Fidelity Central Fund | Investment Manager | Investment Objective | Investment Practices | Expense Ratio A |
| Fidelity Money Market Central Funds | Fidelity Management & Research Company LLC (FMR) | Each fund seeks to obtain a high level of current income consistent with the preservation of capital and liquidity. | Short-term Investments | Less than .005% |
A Expenses expressed as a percentage of average net assets and are as of each underlying Central Fund's most recent annual or semi-annual shareholder report.
A complete unaudited list of holdings for each Fidelity Central Fund is available upon request or at the Securities and Exchange Commission website at www.sec.gov. In addition, the financial statements of the Fidelity Central Funds which contain the significant accounting policies (including investment valuation policies) of those funds, and are not covered by the Report of Independent Registered Public Accounting Firm, are available on the Securities and Exchange Commission website or upon request.
3. Significant Accounting Policies.
The Fund is an investment company and applies the accounting and reporting guidance of the Financial Accounting Standards Board (FASB) Accounting Standards Codification Topic 946 Financial Services - Investment Companies . The financial statements have been prepared in conformity with accounting principles generally accepted in the United States of America (GAAP), which require management to make certain estimates and assumptions at the date of the financial statements. Actual results could differ from those estimates. Subsequent events, if any, through the date that the financial statements were issued have been evaluated in the preparation of the financial statements. The Fund's Schedule of Investments lists any underlying mutual funds or exchange-traded funds (ETFs) but does not include the underlying holdings of these funds. The following summarizes the significant accounting policies of the Fund:
Investment Valuation. Investments are valued as of 4:00 p.m. Eastern time on the last calendar day of the period. The Board of Trustees (the Board) has designated the Fund's investment adviser as the valuation designee responsible for the fair valuation function and performing fair value determinations as needed. The investment adviser has established a Fair Value Committee (the Committee) to carry out the day-to-day fair valuation responsibilities and has adopted policies and procedures to govern the fair valuation process and the activities of the Committee. In accordance with these fair valuation policies and procedures, which have been approved by the Board, the Fund attempts to obtain prices from one or more third party pricing services or brokers to value its investments. When current market prices, quotations or currency exchange rates are not readily available or reliable, investments will be fair valued in good faith by the Committee, in accordance with the policies and procedures. Factors used in determining fair value vary by investment type and may include market or investment specific events, transaction data, estimated cash flows, and market observations of comparable investments. The frequency that the fair valuation procedures are used cannot be predicted and they may be utilized to a significant extent. The Committee manages the Fund's fair valuation practices and maintains the fair valuation policies and procedures. The Fund's investment adviser reports to the Board information regarding the fair valuation process and related material matters.
The Fund categorizes the inputs to valuation techniques used to value its investments into a disclosure hierarchy consisting of three levels as shown below:
Level 1 - unadjusted quoted prices in active markets for identical investments
Level 2 - other significant observable inputs (including quoted prices for similar investments, interest rates, prepayment speeds, etc.)
Level 3 - unobservable inputs (including the Fund's own assumptions based on the best information available)
Valuation techniques used to value the Fund's investments by major category are as follows:
Equity securities, including restricted securities, for which market quotations are readily available, are valued at the last reported sale price or official closing price as reported by a third party pricing service on the primary market or exchange on which they are traded and are categorized as Level 1 in the hierarchy. In the event there were no sales during the day or closing prices are not available, securities are valued at the last quoted bid price or may be valued using the last available price and are generally categorized as Level 2 in the hierarchy. For foreign equity securities, when market or security specific events arise, comparisons to the valuation of American Depositary Receipts (ADRs), futures contracts, ETFs and certain indexes as well as quoted prices for similar securities may be used and would be categorized as Level 2 in the hierarchy. For equity securities, including restricted securities, where observable inputs are limited, assumptions about market activity and risk are used and these securities may be categorized as Level 3 in the hierarchy.
Investments in open-end mutual funds, including the Fidelity Central Funds, are valued at their closing net asset value (NAV) each business day and are categorized as Level 1 in the hierarchy.
Changes in valuation techniques may result in transfers in or out of an assigned level within the disclosure hierarchy. The aggregate value of investments by input level as of December 31, 2022 is included at the end of the Fund's Schedule of Investments.
Foreign Currency. Certain Funds may use foreign currency contracts to facilitate transactions in foreign-denominated securities. Gains and losses from these transactions may arise from changes in the value of the foreign currency or if the counterparties do not perform under the contracts' terms.
Foreign-denominated assets, including investment securities, and liabilities are translated into U.S. dollars at the exchange rates at period end. Purchases and sales of investment securities, income and dividends received, and expenses denominated in foreign currencies are translated into U.S. dollars at the exchange rate in effect on the transaction date.
The effects of exchange rate fluctuations on investments are included with the net realized and unrealized gain (loss) on investment securities. Other foreign currency transactions resulting in realized and unrealized gain (loss) are disclosed separately.
Investment Transactions and Income. For financial reporting purposes, the Fund's investment holdings and NAV include trades executed through the end of the last business day of the period. The NAV per share for processing shareholder transactions is calculated as of the close of business of the New York Stock Exchange (NYSE), normally 4:00 p.m. Eastern time and includes trades executed through the end of the prior business day. Gains and losses on securities sold are determined on the basis of identified cost and include proceeds received from litigation. Commissions paid to certain brokers with whom the investment adviser, or its affiliates, places trades on behalf of a fund include an amount in addition to trade execution, which may be rebated back to a fund. Any such rebates are included in net realized gain (loss) on investments in the Statement of Operations. Dividend income is recorded on the ex-dividend date, except for certain dividends from foreign securities where the ex-dividend date may have passed, which are recorded as soon as the Fund is informed of the ex-dividend date. Non-cash dividends included in dividend income, if any, are recorded at the fair market value of the securities received. Income and capital gain distributions from Fidelity Central Funds, if any, are recorded on the ex-dividend date. Certain distributions received by the Fund represent a return of capital or capital gain. The Fund determines the components of these distributions subsequent to the ex-dividend date, based upon receipt of tax filings or other correspondence relating to the underlying investment. These distributions are recorded as a reduction of cost of investments and/or as a realized gain. During the period, dividend income and net realized appreciation (depreciation) were adjusted as presented in the table below as a result of a change in the prior period estimate, which had no impact on the total net assets or total return.
| | Dividend Income | Net Unrealized Appreciation (Depreciation) |
| Fidelity Growth Discovery Fund | $ 8,427 | $ (8,427) |
Investment income is recorded net of foreign taxes withheld where recovery of such taxes is uncertain. Funds may file withholding tax reclaims in certain jurisdictions to recover a portion of amounts previously withheld. Any withholding tax reclaims income is included in the Statement of Operations in dividends. Any receivables for withholding tax reclaims are included in the Statement of Assets and Liabilities in dividends receivable.
Class Allocations and Expenses. Investment income, realized and unrealized capital gains and losses, common expenses of a fund, and certain fund-level expense reductions, if any, are allocated daily on a pro-rata basis to each class based on the relative net assets of each class to the total net assets of a fund. Each class differs with respect to transfer agent and distribution and service plan fees incurred, as applicable. Certain expense reductions may also differ by class, if applicable. For the reporting period, the allocated portion of income and expenses to each class as a percent of its average net assets may vary due to the timing of recording these transactions in relation to fluctuating net assets of the classes. Expenses directly attributable to a fund are charged to that fund. Expenses attributable to more than one fund are allocated among the respective funds on the basis of relative net assets or other appropriate methods. Expenses included in the accompanying financial statements reflect the expenses of that fund and do not include any expenses associated with any underlying mutual funds or exchange-traded funds. Although not included in a fund's expenses, a fund indirectly bears its proportionate share of these expenses through the net asset value of each underlying mutual fund or exchange-traded fund. Expense estimates are accrued in the period to which they relate and adjustments are made when actual amounts are known.
Income Tax Information and Distributions to Shareholders. Each year, the Fund intends to qualify as a regulated investment company under Subchapter M of the Internal Revenue Code, including distributing substantially all of its taxable income and realized gains. As a result, no provision for U.S. Federal income taxes is required. The Fund files a U.S. federal tax return, in addition to state and local tax returns as required. The Fund's federal income tax returns are subject to examination by the Internal Revenue Service (IRS) for a period of three fiscal years after they are filed. State and local tax returns may be subject to examination for an additional fiscal year depending on the jurisdiction. Foreign taxes are provided for based on the Fund's understanding of the tax rules and rates that exist in the foreign markets in which it invests. The Fund is subject to a tax imposed on capital gains by certain countries in which it invests. An estimated deferred tax liability for net unrealized appreciation on the applicable securities is included in Other payables and accrued expenses on the Statement of Assets & Liabilities.
Distributions are declared and recorded on the ex-dividend date. Income and capital gain distributions are declared separately for each class. Income and capital gain distributions are determined in accordance with income tax regulations, which may differ from GAAP.
Capital accounts within the financial statements are adjusted for permanent book-tax differences. These adjustments have no impact on net assets or the results of operations. Capital accounts are not adjusted for temporary book-tax differences which will reverse in a subsequent period.
Book-tax differences are primarily due to foreign currency transactions, passive foreign investment companies (PFIC), partnerships and losses deferred due to wash sales and excise tax regulations.
As of period end, the cost and unrealized appreciation (depreciation) in securities, and derivatives if applicable, for federal income tax purposes were as follows:
| Gross unrealized appreciation | $851,194 |
| Gross unrealized depreciation | (168,533) |
| Net unrealized appreciation (depreciation) | $682,661 |
| Tax cost | $2,078,171 |
The Fund elected to defer to its next fiscal year approximately $1,699 of ordinary losses recognized during the period January 1, 2022 to June 30, 2022.
Restricted Securities (including Private Placements). Funds may invest in securities that are subject to legal or contractual restrictions on resale. These securities generally may be resold in transactions exempt from registration or to the public if the securities are registered. Disposal of these securities may involve time-consuming negotiations and expense, and prompt sale at an acceptable price may be difficult. Information regarding restricted securities held at period end is included at the end of the Schedule of Investments, if applicable.
4. Purchases and Sales of Investments.
Purchases and sales of securities, other than short-term securities and in-kind transactions, as applicable, are noted in the table below.
| | Purchases ($) | Sales ($) |
| Fidelity Growth Discovery Fund | 519,257 | 588,433 |
5. Fees and Other Transactions with Affiliates.
Management Fee. Fidelity Management & Research Company LLC (the investment adviser) and its affiliates provide the Fund with investment management related services for which the Fund pays a monthly management fee. The management fee is the sum of an individual fund fee rate that is based on an annual rate of .30% of the Fund's average net assets and an annualized group fee rate that averaged .23% during the period. The group fee rate is based upon the monthly average net assets of a group of registered investment companies with which the investment adviser has management contracts. The group fee rate decreases as assets under management increase and increases as assets under management decrease. In addition, the management fee is subject to a performance adjustment (up to a maximum of +/- .20% of the Fund's average net assets over a 36 month performance period). The upward or downward adjustment to the management fee is based on the relative investment performance of Growth Discovery as compared to its benchmark index, the Russell 3000 Growth Index, over the same 36 month performance period. For the reporting period, the total annualized management fee rate, including the performance adjustment, was .71% of the Fund's average net assets. The performance adjustment included in the management fee rate may be higher or lower than the maximum performance adjustment rate due to the difference between the average net assets for the reporting and performance periods.
Transfer Agent Fees. Fidelity Investments Institutional Operations Company LLC (FIIOC), an affiliate of the investment adviser, is the transfer, dividend disbursing and shareholder servicing agent for each class of the Fund. FIIOC receives account fees and asset-based fees that vary according to the account size and type of account of the shareholders of Growth Discovery, except for Class K. FIIOC receives an asset-based fee of Class K's average net assets. FIIOC pays for typesetting, printing and mailing of shareholder reports, except proxy statements.
For the period, transfer agent fees for each class were as follows:
| | Amount | % of Class-Level Average Net Assets A |
| Growth Discovery | $1,784 | .15 |
| Class K | 74 | .04 |
| | $1,858 | |
A Annualized
Accounting Fees. Fidelity Service Company, Inc. (FSC), an affiliate of the investment adviser, maintains the Fund's accounting records. The accounting fee is based on the level of average net assets for each month. For the period, the fees were equivalent to the following annualized rates:
| | % of Average Net Assets |
| Fidelity Growth Discovery Fund | .03 |
Brokerage Commissions. A portion of portfolio transactions were placed with brokerage firms which are affiliates of the investment adviser. Brokerage commissions are included in net realized gain (loss) and change in net unrealized appreciation (depreciation) in the Statement of Operations. The commissions paid to these affiliated firms were as follows:
| | Amount |
| Fidelity Growth Discovery Fund | $ 10 |
Interfund Lending Program. Pursuant to an Exemptive Order issued by the Securities and Exchange Commission (the SEC), the Fund, along with other registered investment companies having management contracts with Fidelity Management & Research Company LLC (FMR), or other affiliated entities of FMR, may participate in an interfund lending program. This program provides an alternative credit facility allowing the Fund to borrow from, or lend money to, other participating affiliated funds. At period end, there were no interfund loans outstanding. Activity in this program during the period for which loans were outstanding was as follows:
| | Borrower or Lender | Average Loan Balance | Weighted Average Interest Rate | Interest Expense |
| Fidelity Growth Discovery Fund | Borrower | $16,173 | 3.01% | $15 |
Interfund Trades. Funds may purchase from or sell securities to other Fidelity Funds under procedures adopted by the Board. The procedures have been designed to ensure these interfund trades are executed in accordance with Rule 17a-7 of the 1940 Act. Any interfund trades are included within the respective purchases and sales amounts shown in the Purchases and Sales of Investments note. Interfund trades during the period are noted in the table below.
| | Purchases ($) | Sales ($) | Realized Gain (Loss) ($) |
| Fidelity Growth Discovery Fund | 28,555 | 39,783 | (2,512) |
6. Committed Line of Credit.
Certain Funds participate with other funds managed by the investment adviser or an affiliate in a $4.25 billion credit facility (the "line of credit") to be utilized for temporary or emergency purposes to fund shareholder redemptions or for other short-term liquidity purposes. The participating funds have agreed to pay commitment fees on their pro-rata portion of the line of credit, which are reflected in Miscellaneous expenses on the Statement of Operations, and are listed below. During the period, there were no borrowings on this line of credit.
| | Amount |
| Fidelity Growth Discovery Fund | $ 3 |
7. Security Lending.
Funds lend portfolio securities from time to time in order to earn additional income. Lending agents are used, including National Financial Services (NFS), an affiliate of the investment adviser. Pursuant to a securities lending agreement, NFS will receive a fee, which is capped at 9.9% of a fund's daily lending revenue, for its services as lending agent. A fund may lend securities to certain qualified borrowers, including NFS. On the settlement date of the loan, a fund receives collateral (in the form of U.S. Treasury obligations, letters of credit and/or cash) against the loaned securities and maintains collateral in an amount not less than 100% of the market value of the loaned securities during the period of the loan. The market value of the loaned securities is determined at the close of business of a fund and any additional required collateral is delivered to a fund on the next business day. A fund or borrower may terminate the loan at any time, and if the borrower defaults on its obligation to return the securities loaned because of insolvency or other reasons, a fund may apply collateral received from the borrower against the obligation. A fund may experience delays and costs in recovering the securities loaned. Any cash collateral received is invested in the Fidelity Securities Lending Cash Central Fund. Any loaned securities are identified as such in the Schedule of Investments, and the value of loaned securities and cash collateral at period end, as applicable, are presented in the Statement of Assets and Liabilities. Security lending income represents the income earned on investing cash collateral, less rebates paid to borrowers and any lending agent fees associated with the loan, plus any premium payments received for lending certain types of securities. Security lending income is presented in the Statement of Operations as a component of income from Fidelity Central Funds. Affiliated security lending activity, if any, was as follows:
| | Total Security Lending Fees Paid to NFS | Security Lending Income From Securities Loaned to NFS | Value of Securities Loaned to NFS at Period End |
| Fidelity Growth Discovery Fund | $ 28 | $ 2 | $162 |
8. Bank Borrowings.
The Fund is permitted to have bank borrowings for temporary or emergency purposes to fund shareholder redemptions or for other short-term liquidity requirements. The Fund has established borrowing arrangements with certain banks. The interest rate on the borrowings is the bank's base rate, as revised from time to time. Any open loans, including accrued interest, at period end are presented under the caption "Notes payable" in the Statement of Assets and Liabilities, if applicable. Activity in this program during the period for which loans were outstanding was as follows:
| | Average Loan Balance | Weighted Average Interest Rate | Interest Expense |
| Fidelity Growth Discovery Fund | $ 1,639 | 3.58% | $ 2 |
9. Expense Reductions.
During the period the investment adviser or an affiliate reimbursed and/or waived a portion of fund-level operating expenses in the amount of $52.
10. Distributions to Shareholders.
Distributions to shareholders of each class were as follows:
| | Six months ended December 31, 2022 | Year ended June 30, 2022 |
| Fidelity Growth Discovery Fund | | |
| Distributions to shareholders | | |
| Growth Discovery | $82,690 | $386,457 |
| Class K | 15,346 | 57,255 |
Total | $98,036 | $443,712 |
11. Share Transactions.
Share transactions for each class were as follows and may contain in-kind transactions, automatic conversions between classes or exchanges between affiliated funds:
| | Shares | Shares | Dollars | Dollars |
| | Six months ended December 31, 2022 | Year ended June 30, 2022 | Six months ended December 31, 2022 | Year ended June 30, 2022 |
| Fidelity Growth Discovery Fund | | | | |
| Growth Discovery | | | | |
| Shares sold | 7,256 | 7,475 | $311,633 | $391,110 |
| Reinvestment of distributions | 1,665 | 6,660 | 76,651 | 364,307 |
| Shares redeemed | (4,910) | (9,455) | (208,807) | (488,310) |
| Net increase (decrease) | 4,011 | 4,680 | $179,477 | $267,107 |
| Class K | | | | |
| Shares sold | 2,288 | 4,366 | $97,316 | $204,465 |
| Reinvestment of distributions | 333 | 1,046 | 15,346 | 57,255 |
| Shares redeemed | (5,192) | (2,667) | (225,021) | (139,341) |
| Net increase (decrease) | (2,571) | 2,745 | $(112,359) | $122,379 |
12. Other.
A fund's organizational documents provide former and current trustees and officers with a limited indemnification against liabilities arising in connection with the performance of their duties to the fund. In the normal course of business, a fund may also enter into contracts that provide general indemnifications. A fund's maximum exposure under these arrangements is unknown as this would be dependent on future claims that may be made against a fund. The risk of material loss from such claims is considered remote.
13. Risk and Uncertainties.
Many factors affect a fund's performance. Developments that disrupt global economies and financial markets, such as pandemics, epidemics, outbreaks of infectious diseases, war, terrorism, and environmental disasters, may significantly affect a fund's investment performance. The effects of these developments to a fund will be impacted by the types of securities in which a fund invests, the financial condition, industry, economic sector, and geographic location of an issuer, and a fund's level of investment in the securities of that issuer.
As a shareholder, you incur two types of costs: (1) transaction costs, which may include sales charges (loads) on purchase payments or redemption proceeds, as applicable and (2) ongoing costs, which generally include management fees, distribution and/or service (12b-1) fees and other Fund expenses. This Example is intended to help you understand your ongoing costs (in dollars) of investing in a fund and to compare these costs with the ongoing costs of investing in other mutual funds.
| The Example is based on an investment of $1,000 invested at the beginning of the period and held for the entire period (July 1, 2022 to December 31, 2022). |
Actual Expenses
The first line of the accompanying table provides information about actual account values and actual expenses. You may use the information in this line, together with the amount you invested, to estimate the expenses that you paid over the period. Simply divide your account value by $1,000.00 (for example, an $8,600 account value divided by $1,000.00 = 8.6), then multiply the result by the number in the first line for a class/Fund under the heading entitled "Expenses Paid During Period" to estimate the expenses you paid on your account during this period. If any fund is a shareholder of any underlying mutual funds or exchange-traded funds (ETFs) (the Underlying Funds), such fund indirectly bears its proportional share of the expenses of the Underlying Funds in addition to the direct expenses incurred presented in the table. These fees and expenses are not included in the annualized expense ratio used to calculate the expense estimate in the table below.
Hypothetical Example for Comparison Purposes
The second line of the accompanying table provides information about hypothetical account values and hypothetical expenses based on the actual expense ratio and an assumed rate of return of 5% per year before expenses, which is not the actual return. The hypothetical account values and expenses may not be used to estimate the actual ending account balance or expenses you paid for the period. You may use this information to compare the ongoing costs of investing in the Fund and other funds. To do so, compare this 5% hypothetical example with the 5% hypothetical examples that appear in the shareholder reports of the other funds. If any fund is a shareholder of any Underlying Funds, such fund indirectly bears its proportional share of the expenses of the Underlying Funds in addition to the direct expenses as presented in the table. These fees and expenses are not included in the annualized expense ratio used to calculate the expense estimate in the table below.
Please note that the expenses shown in the table are meant to highlight your ongoing costs only and do not reflect any transaction costs. Therefore, the second line of the table is useful in comparing ongoing costs only, and will not help you determine the relative total costs of owning different funds. In addition, if these transactional costs were included, your costs would have been higher.
| | | | | Annualized Expense Ratio- A | | Beginning Account Value July 1, 2022 | | Ending Account Value December 31, 2022 | | Expenses Paid During Period- C July 1, 2022 to December 31, 2022 |
| Fidelity® Growth Discovery Fund | | | | | | | | | | |
| Fidelity® Growth Discovery Fund | | | | .89% | | | | | | |
| Actual | | | | | | $ 1,000 | | $ 988.10 | | $ 4.46 |
Hypothetical- B | | | | | | $ 1,000 | | $ 1,020.72 | | $ 4.53 |
| Class K | | | | .78% | | | | | | |
| Actual | | | | | | $ 1,000 | | $ 988.80 | | $ 3.91 |
Hypothetical- B | | | | | | $ 1,000 | | $ 1,021.27 | | $ 3.97 |
| |
A Annualized expense ratio reflects expenses net of applicable fee waivers.
B 5% return per year before expenses
C Expenses are equal to the annualized expense ratio, multiplied by the average account value over the period, multiplied by 184/ 365 (to reflect the one-half year period). The fees and expenses of any Underlying Funds are not included in each annualized expense ratio.
1.714430.124
CII-SANN-0323
Fidelity® Fund
Semi-Annual Report
December 31, 2022
Contents
To view a fund's proxy voting guidelines and proxy voting record for the 12-month period ended June 30, visit http://www.fidelity.com/proxyvotingresults or visit the Securities and Exchange Commission's (SEC) web site at http://www.sec.gov.
You may also call 1-800-544-8544 if you're an individual investing directly with Fidelity, call 1-800-835-5092 if you're a plan sponsor or participant with Fidelity as your recordkeeper or call 1-877-208-0098 on institutional accounts or if you're an advisor or invest through one to request a free copy of the proxy voting guidelines.
Standard & Poor's, S&P and S&P 500 are registered service marks of The McGraw-Hill Companies, Inc. and have been licensed for use by Fidelity Distributors Corporation.
Other third-party marks appearing herein are the property of their respective owners.
All other marks appearing herein are registered or unregistered trademarks or service marks of FMR LLC or an affiliated company. © 2023 FMR LLC. All rights reserved.
This report and the financial statements contained herein are submitted for the general information of the shareholders of the Fund. This report is not authorized for distribution to prospective investors in the Fund unless preceded or accompanied by an effective prospectus.
A fund files its complete schedule of portfolio holdings with the SEC for the first and third quarters of each fiscal year on Form N-PORT. Forms N-PORT are available on the SEC's web site at http://www.sec.gov. A fund's Forms N-PORT may be reviewed and copied at the SEC's Public Reference Room in Washington, DC. Information regarding the operation of the SEC's Public Reference Room may be obtained by calling 1-800-SEC-0330.
For a complete list of a fund's portfolio holdings, view the most recent holdings listing, semiannual report, or annual report on Fidelity's web site at http://www.fidelity.com, http://www.institutional.fidelity.com, or http://www.401k.com, as applicable.
NOT FDIC INSURED •MAY LOSE VALUE •NO BANK GUARANTEE
Neither the Fund nor Fidelity Distributors Corporation is a bank.
Top Holdings (% of Fund's net assets) |
| |
| Apple, Inc. | 10.3 | |
| Microsoft Corp. | 9.4 | |
| Alphabet, Inc. Class A | 6.7 | |
| UnitedHealth Group, Inc. | 3.5 | |
| The Home Depot, Inc. | 2.2 | |
| Costco Wholesale Corp. | 2.1 | |
| Danaher Corp. | 2.0 | |
| Eli Lilly & Co. | 2.0 | |
| JPMorgan Chase & Co. | 1.9 | |
| Visa, Inc. Class A | 1.8 | |
| | 41.9 | |
| |
| Market Sectors (% of Fund's net assets) |
| |
| Information Technology | 36.0 | |
| Health Care | 16.6 | |
| Communication Services | 10.7 | |
| Financials | 9.2 | |
| Consumer Discretionary | 8.7 | |
| Energy | 6.0 | |
| Consumer Staples | 4.5 | |
| Industrials | 3.2 | |
| Materials | 1.4 | |
| Utilities | 1.3 | |
| Real Estate | 0.1 | |
| |
Asset Allocation (% of Fund's net assets) |
|
Foreign investments - 1.3% |
|
Showing Percentage of Net Assets
| Common Stocks - 97.7% |
| | | Shares | Value ($) (000s) |
| COMMUNICATION SERVICES - 10.7% | | | |
| Diversified Telecommunication Services - 0.9% | | | |
| Verizon Communications, Inc. | | 1,225,600 | 48,289 |
| Entertainment - 0.7% | | | |
| Activision Blizzard, Inc. | | 503,800 | 38,566 |
| Interactive Media & Services - 7.9% | | | |
| Alphabet, Inc.: | | | |
| Class A (a) | | 4,194,200 | 370,054 |
| Class C (a) | | 430,000 | 38,154 |
| Meta Platforms, Inc. Class A (a) | | 225,000 | 27,077 |
| | | | 435,285 |
| Media - 1.2% | | | |
| Comcast Corp. Class A | | 1,820,500 | 63,663 |
TOTAL COMMUNICATION SERVICES | | | 585,803 |
| CONSUMER DISCRETIONARY - 8.7% | | | |
| Distributors - 0.2% | | | |
| Genuine Parts Co. | | 77,500 | 13,447 |
| Hotels, Restaurants & Leisure - 0.1% | | | |
| Airbnb, Inc. Class A (a) | | 20,400 | 1,744 |
| Domino's Pizza, Inc. | | 9,700 | 3,360 |
| | | | 5,104 |
| Household Durables - 0.2% | | | |
| NVR, Inc. (a) | | 2,520 | 11,624 |
| Internet & Direct Marketing Retail - 1.7% | | | |
| Amazon.com, Inc. (a) | | 1,116,000 | 93,744 |
| Multiline Retail - 1.3% | | | |
| Dollar General Corp. | | 289,400 | 71,265 |
| Specialty Retail - 5.2% | | | |
| AutoZone, Inc. (a) | | 21,100 | 52,036 |
| Lowe's Companies, Inc. | | 243,400 | 48,495 |
| O'Reilly Automotive, Inc. (a) | | 67,700 | 57,141 |
| The Home Depot, Inc. | | 382,000 | 120,659 |
| Tractor Supply Co. | | 16,100 | 3,622 |
| | | | 281,953 |
TOTAL CONSUMER DISCRETIONARY | | | 477,137 |
| CONSUMER STAPLES - 4.5% | | | |
| Food & Staples Retailing - 2.2% | | | |
| Costco Wholesale Corp. | | 250,000 | 114,125 |
| Walmart, Inc. | | 45,700 | 6,480 |
| | | | 120,605 |
| Household Products - 1.7% | | | |
| Procter & Gamble Co. | | 600,000 | 90,936 |
| Personal Products - 0.6% | | | |
| Estee Lauder Companies, Inc. Class A | | 138,700 | 34,413 |
TOTAL CONSUMER STAPLES | | | 245,954 |
| ENERGY - 6.0% | | | |
| Oil, Gas & Consumable Fuels - 6.0% | | | |
| Chevron Corp. | | 285,800 | 51,298 |
| Exxon Mobil Corp. | | 699,500 | 77,155 |
| Marathon Petroleum Corp. | | 490,800 | 57,124 |
| Occidental Petroleum Corp. | | 1,044,800 | 65,812 |
| PDC Energy, Inc. | | 546,173 | 34,671 |
| Valero Energy Corp. | | 317,900 | 40,329 |
| | | | 326,389 |
| FINANCIALS - 9.2% | | | |
| Banks - 3.4% | | | |
| Bank of America Corp. | | 2,243,811 | 74,315 |
| JPMorgan Chase & Co. | | 762,800 | 102,291 |
| Wells Fargo & Co. | | 264,400 | 10,917 |
| | | | 187,523 |
| Capital Markets - 4.2% | | | |
| Ameriprise Financial, Inc. | | 48,000 | 14,946 |
| Morgan Stanley | | 351,800 | 29,910 |
| MSCI, Inc. | | 186,559 | 86,782 |
| Raymond James Financial, Inc. | | 416,300 | 44,482 |
| S&P Global, Inc. | | 114,900 | 38,485 |
| T. Rowe Price Group, Inc. | | 115,100 | 12,553 |
| | | | 227,158 |
| Insurance - 1.6% | | | |
| Arthur J. Gallagher & Co. | | 303,600 | 57,241 |
| Hartford Financial Services Group, Inc. | | 299,000 | 22,673 |
| Progressive Corp. | | 57,200 | 7,419 |
| | | | 87,333 |
TOTAL FINANCIALS | | | 502,014 |
| HEALTH CARE - 16.6% | | | |
| Biotechnology - 3.0% | | | |
| Gilead Sciences, Inc. | | 624,200 | 53,588 |
| Regeneron Pharmaceuticals, Inc. (a) | | 80,000 | 57,719 |
| Vertex Pharmaceuticals, Inc. (a) | | 190,400 | 54,984 |
| | | | 166,291 |
| Health Care Equipment & Supplies - 1.2% | | | |
| Edwards Lifesciences Corp. (a) | | 336,300 | 25,091 |
| Intuitive Surgical, Inc. (a) | | 70,100 | 18,601 |
| ResMed, Inc. | | 102,000 | 21,229 |
| | | | 64,921 |
| Health Care Providers & Services - 5.0% | | | |
| McKesson Corp. | | 126,800 | 47,565 |
| Molina Healthcare, Inc. (a) | | 108,500 | 35,829 |
| UnitedHealth Group, Inc. | | 359,100 | 190,388 |
| | | | 273,782 |
| Health Care Technology - 0.2% | | | |
| Doximity, Inc. (a)(b) | | 260,000 | 8,726 |
| Life Sciences Tools & Services - 3.8% | | | |
| Danaher Corp. | | 405,000 | 107,495 |
| Mettler-Toledo International, Inc. (a) | | 6,800 | 9,829 |
| Thermo Fisher Scientific, Inc. | | 162,000 | 89,212 |
| | | | 206,536 |
| Pharmaceuticals - 3.4% | | | |
| Eli Lilly & Co. | | 293,000 | 107,191 |
| Merck & Co., Inc. | | 548,412 | 60,846 |
| Zoetis, Inc. Class A | | 127,900 | 18,744 |
| | | | 186,781 |
TOTAL HEALTH CARE | | | 907,037 |
| INDUSTRIALS - 3.2% | | | |
| Building Products - 0.5% | | | |
| Carrier Global Corp. | | 651,000 | 26,854 |
| Commercial Services & Supplies - 0.5% | | | |
| Copart, Inc. (a) | | 130,000 | 7,916 |
| Waste Management, Inc. | | 130,000 | 20,394 |
| | | | 28,310 |
| Construction & Engineering - 0.2% | | | |
| Quanta Services, Inc. | | 63,600 | 9,063 |
| Electrical Equipment - 0.2% | | | |
| AMETEK, Inc. | | 93,051 | 13,001 |
| Machinery - 1.1% | | | |
| Caterpillar, Inc. | | 44,200 | 10,589 |
| IDEX Corp. | | 21,756 | 4,968 |
| Otis Worldwide Corp. | | 339,700 | 26,602 |
| Parker Hannifin Corp. | | 72,700 | 21,156 |
| | | | 63,315 |
| Road & Rail - 0.5% | | | |
| Old Dominion Freight Lines, Inc. | | 93,000 | 26,392 |
| Trading Companies & Distributors - 0.2% | | | |
| W.W. Grainger, Inc. | | 15,700 | 8,733 |
TOTAL INDUSTRIALS | | | 175,668 |
| INFORMATION TECHNOLOGY - 36.0% | | | |
| Electronic Equipment & Components - 1.1% | | | |
| Amphenol Corp. Class A | | 610,000 | 46,445 |
| Keysight Technologies, Inc. (a) | | 75,000 | 12,830 |
| | | | 59,275 |
| IT Services - 4.8% | | | |
| Accenture PLC Class A | | 116,400 | 31,060 |
| Adyen BV (a)(c) | | 2,400 | 3,332 |
| Automatic Data Processing, Inc. | | 169,200 | 40,415 |
| MasterCard, Inc. Class A | | 232,300 | 80,778 |
| Snowflake, Inc. (a) | | 77,100 | 11,067 |
| Visa, Inc. Class A | | 470,000 | 97,647 |
| | | | 264,299 |
| Semiconductors & Semiconductor Equipment - 6.6% | | | |
| Analog Devices, Inc. | | 288,700 | 47,355 |
| ASML Holding NV | | 74,200 | 40,543 |
| Broadcom, Inc. | | 137,000 | 76,601 |
| Enphase Energy, Inc. (a) | | 31,900 | 8,452 |
| KLA Corp. | | 170,000 | 64,095 |
| Lam Research Corp. | | 106,100 | 44,594 |
| Monolithic Power Systems, Inc. | | 56,800 | 20,085 |
| onsemi (a) | | 848,998 | 52,952 |
| Texas Instruments, Inc. | | 50,000 | 8,261 |
| | | | 362,938 |
| Software - 13.2% | | | |
| Adobe, Inc. (a) | | 95,000 | 31,970 |
| Autodesk, Inc. (a) | | 69,100 | 12,913 |
| Cadence Design Systems, Inc. (a) | | 262,500 | 42,168 |
| Fortinet, Inc. (a) | | 1,270,000 | 62,090 |
| Microsoft Corp. | | 2,135,000 | 512,016 |
| Roper Technologies, Inc. | | 66,000 | 28,518 |
| Synopsys, Inc. (a) | | 50,000 | 15,965 |
| Zoom Video Communications, Inc. Class A (a) | | 239,300 | 16,210 |
| | | | 721,850 |
| Technology Hardware, Storage & Peripherals - 10.3% | | | |
| Apple, Inc. | | 4,311,500 | 560,189 |
TOTAL INFORMATION TECHNOLOGY | | | 1,968,551 |
| MATERIALS - 1.4% | | | |
| Chemicals - 1.0% | | | |
| CF Industries Holdings, Inc. | | 233,700 | 19,911 |
| Sherwin-Williams Co. | | 153,200 | 36,359 |
| | | | 56,270 |
| Metals & Mining - 0.4% | | | |
| Steel Dynamics, Inc. | | 210,500 | 20,566 |
TOTAL MATERIALS | | | 76,836 |
| REAL ESTATE - 0.1% | | | |
| Equity Real Estate Investment Trusts (REITs) - 0.1% | | | |
| VICI Properties, Inc. | | 187,000 | 6,059 |
| UTILITIES - 1.3% | | | |
| Electric Utilities - 1.3% | | | |
| NextEra Energy, Inc. | | 850,000 | 71,060 |
| TOTAL COMMON STOCKS (Cost $2,704,673) | | | 5,342,508 |
| | | | |
| Money Market Funds - 2.3% |
| | | Shares | Value ($) (000s) |
| Fidelity Cash Central Fund 4.37% (d) | | 118,159,065 | 118,183 |
| Fidelity Securities Lending Cash Central Fund 4.37% (d)(e) | | 5,326,642 | 5,327 |
| TOTAL MONEY MARKET FUNDS (Cost $123,508) | | | 123,510 |
| | | | |
| TOTAL INVESTMENT IN SECURITIES - 100.0% (Cost $2,828,181) | 5,466,018 |
NET OTHER ASSETS (LIABILITIES) - 0.0% | (866) |
| NET ASSETS - 100.0% | 5,465,152 |
| | |
Any values shown as $0 in the Schedule of Investments may reflect amounts less than $500.
Legend
| (b) | Security or a portion of the security is on loan at period end. |
| (c) | Security exempt from registration under Rule 144A of the Securities Act of 1933. These securities may be resold in transactions exempt from registration, normally to qualified institutional buyers. At the end of the period, the value of these securities amounted to $3,332,000 or 0.1% of net assets. |
| (d) | Affiliated fund that is generally available only to investment companies and other accounts managed by Fidelity Investments. The rate quoted is the annualized seven-day yield of the fund at period end. A complete unaudited listing of the fund's holdings as of its most recent quarter end is available upon request. In addition, each Fidelity Central Fund's financial statements are available on the SEC's website or upon request. |
| (e) | Investment made with cash collateral received from securities on loan. |
Affiliated Central Funds
Fiscal year to date information regarding the Fund's investments in Fidelity Central Funds, including the ownership percentage, is presented below.
| Affiliate (Amounts in thousands) | Value, beginning of period ($) | Purchases ($) | Sales Proceeds ($) | Dividend Income ($) | Realized Gain (loss) ($) | Change in Unrealized appreciation (depreciation) ($) | Value, end of period ($) | % ownership, end of period |
| Fidelity Cash Central Fund 4.37% | 102,346 | 1,323,391 | 1,307,554 | 2,186 | - | - | 118,183 | 0.3% |
| Fidelity Securities Lending Cash Central Fund 4.37% | - | 37,592 | 32,265 | 2 | - | - | 5,327 | 0.0% |
| Total | 102,346 | 1,360,983 | 1,339,819 | 2,188 | - | - | 123,510 | |
| | | | | | | | | |
Amounts in the dividend income column in the above table include any capital gain distributions from underlying funds, which are presented in the corresponding line item in the Statement of Operations, if applicable.
Amount for Fidelity Securities Lending Cash Central Fund represents the income earned on investing cash collateral, less rebates paid to borrowers and any lending agent fees associated with the loan, plus any premium payments received for lending certain types of securities.
Amounts included in the purchases and sales proceeds columns may include in-kind transactions, if applicable.
Investment Valuation
The following is a summary of the inputs used, as of December 31, 2022, involving the Fund's assets and liabilities carried at fair value. The inputs or methodology used for valuing securities may not be an indication of the risk associated with investing in those securities. For more information on valuation inputs, and their aggregation into the levels used below, please refer to the Investment Valuation section in the accompanying Notes to Financial Statements.
| Valuation Inputs at Reporting Date: |
Description (Amounts in thousands) | Total ($) | Level 1 ($) | Level 2 ($) | Level 3 ($) |
Investments in Securities: | | | | |
|
| Equities: | | | | |
Communication Services | 585,803 | 585,803 | - | - |
Consumer Discretionary | 477,137 | 477,137 | - | - |
Consumer Staples | 245,954 | 245,954 | - | - |
Energy | 326,389 | 326,389 | - | - |
Financials | 502,014 | 502,014 | - | - |
Health Care | 907,037 | 907,037 | - | - |
Industrials | 175,668 | 175,668 | - | - |
Information Technology | 1,968,551 | 1,965,219 | 3,332 | - |
Materials | 76,836 | 76,836 | - | - |
Real Estate | 6,059 | 6,059 | - | - |
Utilities | 71,060 | 71,060 | - | - |
|
| Money Market Funds | 123,510 | 123,510 | - | - |
| Total Investments in Securities: | 5,466,018 | 5,462,686 | 3,332 | - |
| Statement of Assets and Liabilities |
| Amounts in thousands (except per-share amounts) | | | | December 31, 2022 (Unaudited) |
| | | | | |
| Assets | | | | |
| Investment in securities, at value (including securities loaned of $5,145) - See accompanying schedule: | $ | | | |
Unaffiliated issuers (cost $2,704,673) | | 5,342,508 | | |
Fidelity Central Funds (cost $123,508) | | 123,510 | | |
| | | | | |
| | | | | |
| Total Investment in Securities (cost $2,828,181) | | | $ | 5,466,018 |
| Cash | | | | 3 |
| Receivable for investments sold | | | | 4,704 |
| Receivable for fund shares sold | | | | 1,595 |
| Dividends receivable | | | | 2,284 |
| Distributions receivable from Fidelity Central Funds | | | | 469 |
| Prepaid expenses | | | | 7 |
| Other receivables | | | | 34 |
Total assets | | | | 5,475,114 |
| Liabilities | | | | |
| Payable for fund shares redeemed | | $2,392 | | |
| Accrued management fee | | 1,484 | | |
| Transfer agent fee payable | | 593 | | |
| Other affiliated payables | | 82 | | |
| Other payables and accrued expenses | | 84 | | |
| Collateral on securities loaned | | 5,327 | | |
| Total Liabilities | | | | 9,962 |
| Net Assets | | | $ | 5,465,152 |
| Net Assets consist of: | | | | |
| Paid in capital | | | $ | 2,822,503 |
| Total accumulated earnings (loss) | | | | 2,642,649 |
| Net Assets | | | $ | 5,465,152 |
| | | | | |
| Net Asset Value and Maximum Offering Price | | | | |
| Fidelity Fund : | | | | |
Net Asset Value , offering price and redemption price per share ($5,263,442 ÷ 90,262 shares) | | | $ | 58.31 |
| Class K : | | | | |
Net Asset Value , offering price and redemption price per share ($201,710 ÷ 3,459 shares) | | | $ | 58.31 |
| Statement of Operations |
| Amounts in thousands | | | | Six months ended December 31, 2022 (Unaudited) |
| Investment Income | | | | |
| Dividends | | | $ | 32,113 |
| Income from Fidelity Central Funds (including $2 from security lending) | | | | 2,188 |
| Total Income | | | | 34,301 |
| Expenses | | | | |
| Management fee | $ | 9,402 | | |
| Transfer agent fees | | 3,626 | | |
| Accounting fees | | 498 | | |
| Custodian fees and expenses | | 26 | | |
| Independent trustees' fees and expenses | | 11 | | |
| Registration fees | | 37 | | |
| Audit | | 43 | | |
| Legal | | 10 | | |
| Miscellaneous | | 4 | | |
| Total expenses before reductions | | 13,657 | | |
| Expense reductions | | (112) | | |
| Total expenses after reductions | | | | 13,545 |
| Net Investment income (loss) | | | | 20,756 |
| Realized and Unrealized Gain (Loss) | | | | |
| Net realized gain (loss) on: | | | | |
| Investment Securities: | | | | |
| Unaffiliated issuers | | 192,927 | | |
| Foreign currency transactions | | (2) | | |
| Total net realized gain (loss) | | | | 192,925 |
| Change in net unrealized appreciation (depreciation) on: | | | | |
| Investment Securities: | | | | |
| Unaffiliated issuers | | (102,259) | | |
| Assets and liabilities in foreign currencies | | (3) | | |
| Total change in net unrealized appreciation (depreciation) | | | | (102,262) |
| Net gain (loss) | | | | 90,663 |
| Net increase (decrease) in net assets resulting from operations | | | $ | 111,419 |
| Statement of Changes in Net Assets |
| |
| Amount in thousands | | Six months ended December 31, 2022 (Unaudited) | | Year ended June 30, 2022 |
| Increase (Decrease) in Net Assets | | | | |
| Operations | | | | |
| Net investment income (loss) | $ | 20,756 | $ | 27,117 |
| Net realized gain (loss) | | 192,925 | | (83,073) |
| Change in net unrealized appreciation (depreciation) | | (102,262) | | (1,118,766) |
| Net increase (decrease) in net assets resulting from operations | | 111,419 | | (1,174,722) |
| Distributions to shareholders | | (38,569) | | (363,444) |
| Share transactions - net increase (decrease) | | (749,367) | | 510,634 |
| Total increase (decrease) in net assets | | (676,517) | | (1,027,532) |
| | | | | |
| Net Assets | | | | |
| Beginning of period | | 6,141,669 | | 7,169,201 |
| End of period | $ | 5,465,152 | $ | 6,141,669 |
| | | | | |
| | | | | |
Financial Highlights
| | Six months ended (Unaudited) December 31, 2022 | | Years ended June 30, 2022 | | 2021 | | 2020 | | 2019 | | 2018 |
Selected Per-Share Data | | | | | | | | | | | | |
| Net asset value, beginning of period | $ | 58.06 | $ | 72.20 | $ | 54.21 | $ | 47.60 | $ | 46.86 | $ | 44.92 |
| Income from Investment Operations | | | | | | | | | | | | |
Net investment income (loss) A,B | | .21 | | .25 | | .28 | | .39 | | .46 | | .45 |
| Net realized and unrealized gain (loss) | | .43 | | (10.75) | | 19.40 | | 8.96 | | 3.26 | | 6.74 |
| Total from investment operations | | .64 | | (10.50) | | 19.68 | | 9.35 | | 3.72 | | 7.19 |
| Distributions from net investment income | | (.39) | | (.21) | | (.32) | | (.42) | | (.44) | | (.45) |
| Distributions from net realized gain | | - | | (3.44) | | (1.38) | | (2.32) | | (2.54) | | (4.80) |
| Total distributions | | (.39) | | (3.64) C | | (1.69) C | | (2.74) | | (2.98) | | (5.25) |
| Net asset value, end of period | $ | 58.31 | $ | 58.06 | $ | 72.20 | $ | 54.21 | $ | 47.60 | $ | 46.86 |
Total Return D,E | | 1.06% | | (15.60)% | | 36.94% | | 20.51% | | 8.27% | | 17.51% |
Ratios to Average Net Assets B,F,G | | | | | | | | | | | | |
| Expenses before reductions | | .47% H | | .45% | | .47% | | .48% | | .50% | | .50% |
| Expenses net of fee waivers, if any | | .46% H | | .45% | | .47% | | .48% | | .49% | | .50% |
| Expenses net of all reductions | | .46% H | | .45% | | .46% | | .48% | | .49% | | .50% |
| Net investment income (loss) | | .69% H | | .35% | | .44% | | .79% | | 1.01% | | .99% |
| Supplemental Data | | | | | | | | | | | | |
| Net assets, end of period (in millions) | $ | 5,263 | $ | 5,468 | $ | 6,758 | $ | 4,402 | $ | 4,019 | $ | 4,129 |
Portfolio turnover rate I | | 40% H | | 39% | | 34% J | | 51% | | 45% | | 38% |
A Calculated based on average shares outstanding during the period.
B Net investment income (loss) is affected by the timing of the declaration of dividends by any underlying mutual funds or exchange-traded funds (ETFs). Net investment income (loss) of any mutual funds or ETFs is not included in the Fund's net investment income (loss) ratio.
C Total distributions per share do not sum due to rounding.
D Total returns for periods of less than one year are not annualized.
E Total returns would have been lower if certain expenses had not been reduced during the applicable periods shown.
F Fees and expenses of any underlying mutual funds or exchange-traded funds (ETFs) are not included in the Fund's expense ratio. The Fund indirectly bears its proportionate share of these expenses. For additional expense information related to investments in Fidelity Central Funds, please refer to the "Investments in Fidelity Central Funds" note found in the Notes to Financial Statements section of the most recent Annual or Semi-Annual report.
G Expense ratios reflect operating expenses of the class. Expenses before reductions do not reflect amounts reimbursed, waived, or reduced through arrangements with the investment adviser, brokerage services, or other offset arrangements, if applicable, and do not represent the amount paid by the class during periods when reimbursements, waivers or reductions occur.
H Annualized.
I Amount does not include the portfolio activity of any underlying mutual funds or exchange-traded funds (ETFs).
J The portfolio turnover rate does not include the assets acquired in the merger.
| | Six months ended (Unaudited) December 31, 2022 | | Years ended June 30, 2022 | | 2021 | | 2020 | | 2019 | | 2018 |
Selected Per-Share Data | | | | | | | | | | | | |
| Net asset value, beginning of period | $ | 58.07 | $ | 72.21 | $ | 54.20 | $ | 47.60 | $ | 46.86 | $ | 44.92 |
| Income from Investment Operations | | | | | | | | | | | | |
Net investment income (loss) A,B | | .24 | | .30 | | .33 | | .43 | | .50 | | .49 |
| Net realized and unrealized gain (loss) | | .43 | | (10.74) | | 19.41 | | 8.96 | | 3.26 | | 6.74 |
| Total from investment operations | | .67 | | (10.44) | | 19.74 | | 9.39 | | 3.76 | | 7.23 |
| Distributions from net investment income | | (.43) | | (.26) | | (.35) | | (.46) | | (.48) | | (.49) |
| Distributions from net realized gain | | - | | (3.44) | | (1.38) | | (2.32) | | (2.54) | | (4.80) |
| Total distributions | | (.43) | | (3.70) | | (1.73) | | (2.79) C | | (3.02) | | (5.29) |
| Net asset value, end of period | $ | 58.31 | $ | 58.07 | $ | 72.21 | $ | 54.20 | $ | 47.60 | $ | 46.86 |
Total Return D,E | | 1.11% | | (15.54)% | | 37.07% | | 20.60% | | 8.37% | | 17.63% |
Ratios to Average Net Assets B,F,G | | | | | | | | | | | | |
| Expenses before reductions | | .38% H | | .38% | | .39% | | .40% | | .40% | | .41% |
| Expenses net of fee waivers, if any | | .38% H | | .37% | | .39% | | .40% | | .40% | | .41% |
| Expenses net of all reductions | | .38% H | | .37% | | .38% | | .39% | | .40% | | .40% |
| Net investment income (loss) | | .78% H | | .43% | | .52% | | .87% | | 1.10% | | 1.08% |
| Supplemental Data | | | | | | | | | | | | |
| Net assets, end of period (in millions) | $ | 202 | $ | 674 | $ | 411 | $ | 522 | $ | 326 | $ | 450 |
Portfolio turnover rate I | | 40% H | | 39% | | 34% J | | 51% | | 45% | | 38% |
A Calculated based on average shares outstanding during the period.
B Net investment income (loss) is affected by the timing of the declaration of dividends by any underlying mutual funds or exchange-traded funds (ETFs). Net investment income (loss) of any mutual funds or ETFs is not included in the Fund's net investment income (loss) ratio.
C Total distributions per share do not sum due to rounding.
D Total returns for periods of less than one year are not annualized.
E Total returns would have been lower if certain expenses had not been reduced during the applicable periods shown.
F Fees and expenses of any underlying mutual funds or exchange-traded funds (ETFs) are not included in the Fund's expense ratio. The Fund indirectly bears its proportionate share of these expenses. For additional expense information related to investments in Fidelity Central Funds, please refer to the "Investments in Fidelity Central Funds" note found in the Notes to Financial Statements section of the most recent Annual or Semi-Annual report.
G Expense ratios reflect operating expenses of the class. Expenses before reductions do not reflect amounts reimbursed, waived, or reduced through arrangements with the investment adviser, brokerage services, or other offset arrangements, if applicable, and do not represent the amount paid by the class during periods when reimbursements, waivers or reductions occur.
H Annualized.
I Amount does not include the portfolio activity of any underlying mutual funds or exchange-traded funds (ETFs).
J The portfolio turnover rate does not include the assets acquired in the merger.
For the period ended December 31, 2022
( Amounts in thousands except percentages)
1. Organization.
Fidelity Fund (the Fund) is a fund of Fidelity Hastings Street Trust (the Trust) and is authorized to issue an unlimited number of shares. The Trust is registered under the Investment Company Act of 1940, as amended (the 1940 Act), as an open-end management investment company organized as a Massachusetts business trust. The Fund offers Fidelity Fund and Class K shares, each of which has equal rights as to assets and voting privileges. Each class has exclusive voting rights with respect to matters that affect that class.
2. Investments in Fidelity Central Funds.
Funds may invest in Fidelity Central Funds, which are open-end investment companies generally available only to other investment companies and accounts managed by the investment adviser and its affiliates. The Schedule of Investments lists any Fidelity Central Funds held as an investment as of period end, but does not include the underlying holdings of each Fidelity Central Fund. An investing fund indirectly bears its proportionate share of the expenses of the underlying Fidelity Central Funds.
Based on its investment objective, each Fidelity Central Fund may invest or participate in various investment vehicles or strategies that are similar to those of the investing fund. These strategies are consistent with the investment objectives of the investing fund and may involve certain economic risks which may cause a decline in value of each of the Fidelity Central Funds and thus a decline in the value of the investing fund.
| Fidelity Central Fund | Investment Manager | Investment Objective | Investment Practices | Expense Ratio A |
| Fidelity Money Market Central Funds | Fidelity Management & Research Company LLC (FMR) | Each fund seeks to obtain a high level of current income consistent with the preservation of capital and liquidity. | Short-term Investments | Less than .005% |
A Expenses expressed as a percentage of average net assets and are as of each underlying Central Fund's most recent annual or semi-annual shareholder report.
A complete unaudited list of holdings for each Fidelity Central Fund is available upon request or at the Securities and Exchange Commission website at www.sec.gov. In addition, the financial statements of the Fidelity Central Funds which contain the significant accounting policies (including investment valuation policies) of those funds, and are not covered by the Report of Independent Registered Public Accounting Firm, are available on the Securities and Exchange Commission website or upon request.
3. Significant Accounting Policies.
The Fund is an investment company and applies the accounting and reporting guidance of the Financial Accounting Standards Board (FASB) Accounting Standards Codification Topic 946 Financial Services - Investment Companies . The financial statements have been prepared in conformity with accounting principles generally accepted in the United States of America (GAAP), which require management to make certain estimates and assumptions at the date of the financial statements. Actual results could differ from those estimates. Subsequent events, if any, through the date that the financial statements were issued have been evaluated in the preparation of the financial statements. The Fund's Schedule of Investments lists any underlying mutual funds or exchange-traded funds (ETFs) but does not include the underlying holdings of these funds. The following summarizes the significant accounting policies of the Fund:
Investment Valuation. Investments are valued as of 4:00 p.m. Eastern time on the last calendar day of the period. The Board of Trustees (the Board) has designated the Fund's investment adviser as the valuation designee responsible for the fair valuation function and performing fair value determinations as needed. The investment adviser has established a Fair Value Committee (the Committee) to carry out the day-to-day fair valuation responsibilities and has adopted policies and procedures to govern the fair valuation process and the activities of the Committee. In accordance with these fair valuation policies and procedures, which have been approved by the Board, the Fund attempts to obtain prices from one or more third party pricing services or brokers to value its investments. When current market prices, quotations or currency exchange rates are not readily available or reliable, investments will be fair valued in good faith by the Committee, in accordance with the policies and procedures. Factors used in determining fair value vary by investment type and may include market or investment specific events, transaction data, estimated cash flows, and market observations of comparable investments. The frequency that the fair valuation procedures are used cannot be predicted and they may be utilized to a significant extent. The Committee manages the Fund's fair valuation practices and maintains the fair valuation policies and procedures. The Fund's investment adviser reports to the Board information regarding the fair valuation process and related material matters.
The Fund categorizes the inputs to valuation techniques used to value its investments into a disclosure hierarchy consisting of three levels as shown below:
Level 1 - unadjusted quoted prices in active markets for identical investments
Level 2 - other significant observable inputs (including quoted prices for similar investments, interest rates, prepayment speeds, etc.)
Level 3 - unobservable inputs (including the Fund's own assumptions based on the best information available)
Valuation techniques used to value the Fund's investments by major category are as follows:
Equity securities, including restricted securities, for which market quotations are readily available, are valued at the last reported sale price or official closing price as reported by a third party pricing service on the primary market or exchange on which they are traded and are categorized as Level 1 in the hierarchy. In the event there were no sales during the day or closing prices are not available, securities are valued at the last quoted bid price or may be valued using the last available price and are generally categorized as Level 2 in the hierarchy. For foreign equity securities, when market or security specific events arise, comparisons to the valuation of American Depositary Receipts (ADRs), futures contracts, ETFs and certain indexes as well as quoted prices for similar securities may be used and would be categorized as Level 2 in the hierarchy. For equity securities, including restricted securities, where observable inputs are limited, assumptions about market activity and risk are used and these securities may be categorized as Level 3 in the hierarchy.
Investments in open-end mutual funds, including the Fidelity Central Funds, are valued at their closing net asset value (NAV) each business day and are categorized as Level 1 in the hierarchy.
Changes in valuation techniques may result in transfers in or out of an assigned level within the disclosure hierarchy. The aggregate value of investments by input level as of December 31, 2022 is included at the end of the Fund's Schedule of Investments.
Foreign Currency. Certain Funds may use foreign currency contracts to facilitate transactions in foreign-denominated securities. Gains and losses from these transactions may arise from changes in the value of the foreign currency or if the counterparties do not perform under the contracts' terms.
Foreign-denominated assets, including investment securities, and liabilities are translated into U.S. dollars at the exchange rates at period end. Purchases and sales of investment securities, income and dividends received, and expenses denominated in foreign currencies are translated into U.S. dollars at the exchange rate in effect on the transaction date.
The effects of exchange rate fluctuations on investments are included with the net realized and unrealized gain (loss) on investment securities. Other foreign currency transactions resulting in realized and unrealized gain (loss) are disclosed separately.
Investment Transactions and Income. For financial reporting purposes, the Fund's investment holdings and NAV include trades executed through the end of the last business day of the period. The NAV per share for processing shareholder transactions is calculated as of the close of business of the New York Stock Exchange (NYSE), normally 4:00 p.m. Eastern time and includes trades executed through the end of the prior business day. Gains and losses on securities sold are determined on the basis of identified cost and include proceeds received from litigation. Commissions paid to certain brokers with whom the investment adviser, or its affiliates, places trades on behalf of a fund include an amount in addition to trade execution, which may be rebated back to a fund. Any such rebates are included in net realized gain (loss) on investments in the Statement of Operations. Dividend income is recorded on the ex-dividend date, except for certain dividends from foreign securities where the ex-dividend date may have passed, which are recorded as soon as the Fund is informed of the ex-dividend date. Non-cash dividends included in dividend income, if any, are recorded at the fair market value of the securities received. Income and capital gain distributions from Fidelity Central Funds, if any, are recorded on the ex-dividend date. Certain distributions received by the Fund represent a return of capital or capital gain. The Fund determines the components of these distributions subsequent to the ex-dividend date, based upon receipt of tax filings or other correspondence relating to the underlying investment. These distributions are recorded as a reduction of cost of investments and/or as a realized gain. Investment income is recorded net of foreign taxes withheld where recovery of such taxes is uncertain. Funds may file withholding tax reclaims in certain jurisdictions to recover a portion of amounts previously withheld. Any withholding tax reclaims income is included in the Statement of Operations in dividends. Any receivables for withholding tax reclaims are included in the Statement of Assets and Liabilities in dividends receivable.
Class Allocations and Expenses. Investment income, realized and unrealized capital gains and losses, common expenses of a fund, and certain fund-level expense reductions, if any, are allocated daily on a pro-rata basis to each class based on the relative net assets of each class to the total net assets of a fund. Each class differs with respect to transfer agent and distribution and service plan fees incurred, as applicable. Certain expense reductions may also differ by class, if applicable. For the reporting period, the allocated portion of income and expenses to each class as a percent of its average net assets may vary due to the timing of recording these transactions in relation to fluctuating net assets of the classes. Expenses directly attributable to a fund are charged to that fund. Expenses attributable to more than one fund are allocated among the respective funds on the basis of relative net assets or other appropriate methods. Expenses included in the accompanying financial statements reflect the expenses of that fund and do not include any expenses associated with any underlying mutual funds or exchange-traded funds. Although not included in a fund's expenses, a fund indirectly bears its proportionate share of these expenses through the net asset value of each underlying mutual fund or exchange-traded fund. Expense estimates are accrued in the period to which they relate and adjustments are made when actual amounts are known.
Deferred Trustee Compensation. Under a Deferred Compensation Plan (the Plan) for certain Funds, certain independent Trustees have elected to defer receipt of a portion of their annual compensation. Deferred amounts are invested in affiliated mutual funds, are marked-to-market and remain in a fund until distributed in accordance with the Plan. The investment of deferred amounts and the offsetting payable to the Trustees presented below are included in the accompanying Statement of Assets and Liabilities in other receivables and other payables and accrued expenses, as applicable.
Income Tax Information and Distributions to Shareholders. Each year, the Fund intends to qualify as a regulated investment company under Subchapter M of the Internal Revenue Code, including distributing substantially all of its taxable income and realized gains. As a result, no provision for U.S. Federal income taxes is required. The Fund files a U.S. federal tax return, in addition to state and local tax returns as required. The Fund's federal income tax returns are subject to examination by the Internal Revenue Service (IRS) for a period of three fiscal years after they are filed. State and local tax returns may be subject to examination for an additional fiscal year depending on the jurisdiction. Foreign taxes are provided for based on the Fund's understanding of the tax rules and rates that exist in the foreign markets in which it invests.
Distributions are declared and recorded on the ex-dividend date. Income and capital gain distributions are declared separately for each class. Income and capital gain distributions are determined in accordance with income tax regulations, which may differ from GAAP.
Capital accounts within the financial statements are adjusted for permanent book-tax differences. These adjustments have no impact on net assets or the results of operations. Capital accounts are not adjusted for temporary book-tax differences which will reverse in a subsequent period.
Book-tax differences are primarily due to foreign currency transactions, passive foreign investment companies (PFIC), capital loss carryforwards and losses deferred due to wash sales and excise tax regulations.
As of period end, the cost and unrealized appreciation (depreciation) in securities, and derivatives if applicable, for federal income tax purposes were as follows:
| Gross unrealized appreciation | $2,650,948 |
| Gross unrealized depreciation | (15,154) |
| Net unrealized appreciation (depreciation) | $2,635,794 |
| Tax cost | $2,830,224 |
The Fund elected to defer to its next fiscal year approximately $180,829 of capital losses recognized during the period November 1,2021 to June 30,2022.
Restricted Securities (including Private Placements). Funds may invest in securities that are subject to legal or contractual restrictions on resale. These securities generally may be resold in transactions exempt from registration or to the public if the securities are registered. Disposal of these securities may involve time-consuming negotiations and expense, and prompt sale at an acceptable price may be difficult. Information regarding restricted securities held at period end is included at the end of the Schedule of Investments, if applicable.
4. Purchases and Sales of Investments.
Purchases and sales of securities, other than short-term securities and in-kind transactions, as applicable, are noted in the table below.
| | Purchases ($) | Sales ($) |
| Fidelity Fund | 1,165,424 | 1,953,095 |
5. Fees and Other Transactions with Affiliates.
Management Fee. Fidelity Management & Research Company LLC (the investment adviser) and its affiliates provide the Fund with investment management related services for which the Fund pays a monthly management fee. The management fee is the sum of an individual fund fee rate that is based on an annual rate of .09% of the Fund's average net assets and an annualized group fee rate that averaged .23% during the period. The group fee rate is based upon the monthly average net assets of a group of registered investment companies with which the investment adviser has management contracts. The group fee rate decreases as assets under management increase and increases as assets under management decrease. For the reporting period, the total annualized management fee rate was .32% of the Fund's average net assets.
Transfer Agent Fees. Fidelity Investments Institutional Operations Company LLC (FIIOC), an affiliate of the investment adviser, is the transfer, dividend disbursing and shareholder servicing agent for each class of the Fund. FIIOC receives account fees and asset-based fees that vary according to the account size and type of account of the shareholders of the respective classes of the Fund, except for Class K. FIIOC receives an asset-based fee of Class K's average net assets. FIIOC pays for typesetting, printing and mailing of shareholder reports, except proxy statements.
For the period, transfer agent fees for each class were as follows:
| | Amount | % of Class-Level Average Net Assets A |
| Fidelity Fund | $3,548 | .13 |
| Class K | 78 | .04 |
| | $3,626 | |
A Annualized
Accounting Fees. Fidelity Service Company, Inc. (FSC), an affiliate of the investment adviser, maintains the Fund's accounting records. The accounting fee is based on the level of average net assets for each month. For the period, the fees were equivalent to the following annualized rates:
| | % of Average Net Assets |
| Fidelity Fund | .02 |
| |
Brokerage Commissions. A portion of portfolio transactions were placed with brokerage firms which are affiliates of the investment adviser. Brokerage commissions are included in net realized gain (loss) and change in net unrealized appreciation (depreciation) in the Statement of Operations. The commissions paid to these affiliated firms were as follows:
Interfund Trades. Funds may purchase from or sell securities to other Fidelity Funds under procedures adopted by the Board. The procedures have been designed to ensure these interfund trades are executed in accordance with Rule 17a-7 of the 1940 Act. Any interfund trades are included within the respective purchases and sales amounts shown in the Purchases and Sales of Investments note. Interfund trades during the period are noted in the table below.
| | Purchases ($) | Sales ($) | Realized Gain (Loss) ($) |
| Fidelity Fund | 47,651 | 61,405 | 681 |
6. Committed Line of Credit.
Certain Funds participate with other funds managed by the investment adviser or an affiliate in a $4.25 billion credit facility (the "line of credit") to be utilized for temporary or emergency purposes to fund shareholder redemptions or for other short-term liquidity purposes. The participating funds have agreed to pay commitment fees on their pro-rata portion of the line of credit, which are reflected in Miscellaneous expenses on the Statement of Operations, and are listed below. During the period, there were no borrowings on this line of credit.
7. Security Lending.
Funds lend portfolio securities from time to time in order to earn additional income. Lending agents are used, including National Financial Services (NFS), an affiliate of the investment adviser. Pursuant to a securities lending agreement, NFS will receive a fee, which is capped at 9.9% of a fund's daily lending revenue, for its services as lending agent. A fund may lend securities to certain qualified borrowers, including NFS. On the settlement date of the loan, a fund receives collateral (in the form of U.S. Treasury obligations, letters of credit and/or cash) against the loaned securities and maintains collateral in an amount not less than 100% of the market value of the loaned securities during the period of the loan. The market value of the loaned securities is determined at the close of business of a fund and any additional required collateral is delivered to a fund on the next business day. A fund or borrower may terminate the loan at any time, and if the borrower defaults on its obligation to return the securities loaned because of insolvency or other reasons, a fund may apply collateral received from the borrower against the obligation. A fund may experience delays and costs in recovering the securities loaned. Any cash collateral received is invested in the Fidelity Securities Lending Cash Central Fund. Any loaned securities are identified as such in the Schedule of Investments, and the value of loaned securities and cash collateral at period end, as applicable, are presented in the Statement of Assets and Liabilities. Security lending income represents the income earned on investing cash collateral, less rebates paid to borrowers and any lending agent fees associated with the loan, plus any premium payments received for lending certain types of securities. Security lending income is presented in the Statement of Operations as a component of income from Fidelity Central Funds. Affiliated security lending activity, if any, was as follows:
| | Total Security Lending Fees Paid to NFS | Security Lending Income From Securities Loaned to NFS | Value of Securities Loaned to NFS at Period End |
| Fidelity Fund | $ - A | $ - | $- |
A In the amount of less than five hundred dollars
8. Expense Reductions.
During the period the investment adviser or an affiliate reimbursed and/or waived a portion of fund-level operating expenses in the amount of $112.
9. Distributions to Shareholders.
Distributions to shareholders of each class were as follows:
| | Six months ended December 31, 2022 | Year ended June 30, 2022 |
| Fidelity Fund | | |
| Distributions to shareholders | | |
| Fidelity Fund | $35,624 | $341,399 |
| Class K | 2,945 | 22,045 |
Total | 38,569 | $363,444 |
10. Share Transactions.
Share transactions for each class were as follows and may contain in-kind transactions, automatic conversions between classes or exchanges between affiliated funds:
| | Shares | Shares | Dollars | Dollars |
| | Six months ended December 31, 2022 | Year ended June 30, 2022 | Six months ended December 31, 2022 | Year ended June 30, 2022 |
| Fidelity Fund | | | | |
| Fidelity Fund | | | | |
| Shares sold | 1,228 | 6,458 | $74,685 | $468,923 |
| Reinvestment of distributions | 522 | 4,251 | 32,237 | 314,473 |
| Shares redeemed | (5,668) | (10,130) | (345,572) | (715,852) |
| Net increase (decrease) | (3,918) | 579 | $(238,650) | $67,544 |
| Class K | | | | |
| Shares sold | 358 | 11,006 | $21,975 | $775,725 |
| Reinvestment of distributions | 47 | 296 | 2,945 | 22,045 |
| Shares redeemed | (8,551) | (5,394) | (535,637) | (354,680) |
| Net increase (decrease) | (8,146) | 5,908 | $(510,717) | $443,090 |
11. Other.
A fund's organizational documents provide former and current trustees and officers with a limited indemnification against liabilities arising in connection with the performance of their duties to the fund. In the normal course of business, a fund may also enter into contracts that provide general indemnifications. A fund's maximum exposure under these arrangements is unknown as this would be dependent on future claims that may be made against a fund. The risk of material loss from such claims is considered remote.
12. Risk and Uncertainties.
Many factors affect a fund's performance. Developments that disrupt global economies and financial markets, such as pandemics, epidemics, outbreaks of infectious diseases, war, terrorism, and environmental disasters, may significantly affect a fund's investment performance. The effects of these developments to a fund will be impacted by the types of securities in which a fund invests, the financial condition, industry, economic sector, and geographic location of an issuer, and a fund's level of investment in the securities of that issuer.
As a shareholder, you incur two types of costs: (1) transaction costs, which may include sales charges (loads) on purchase payments or redemption proceeds, as applicable and (2) ongoing costs, which generally include management fees, distribution and/or service (12b-1) fees and other Fund expenses. This Example is intended to help you understand your ongoing costs (in dollars) of investing in a fund and to compare these costs with the ongoing costs of investing in other mutual funds.
| The Example is based on an investment of $1,000 invested at the beginning of the period and held for the entire period (July 1, 2022 to December 31, 2022). |
Actual Expenses
The first line of the accompanying table provides information about actual account values and actual expenses. You may use the information in this line, together with the amount you invested, to estimate the expenses that you paid over the period. Simply divide your account value by $1,000.00 (for example, an $8,600 account value divided by $1,000.00 = 8.6), then multiply the result by the number in the first line for a class/Fund under the heading entitled "Expenses Paid During Period" to estimate the expenses you paid on your account during this period. If any fund is a shareholder of any underlying mutual funds or exchange-traded funds (ETFs) (the Underlying Funds), such fund indirectly bears its proportional share of the expenses of the Underlying Funds in addition to the direct expenses incurred presented in the table. These fees and expenses are not included in the annualized expense ratio used to calculate the expense estimate in the table below.
Hypothetical Example for Comparison Purposes
The second line of the accompanying table provides information about hypothetical account values and hypothetical expenses based on the actual expense ratio and an assumed rate of return of 5% per year before expenses, which is not the actual return. The hypothetical account values and expenses may not be used to estimate the actual ending account balance or expenses you paid for the period. You may use this information to compare the ongoing costs of investing in the Fund and other funds. To do so, compare this 5% hypothetical example with the 5% hypothetical examples that appear in the shareholder reports of the other funds. If any fund is a shareholder of any Underlying Funds, such fund indirectly bears its proportional share of the expenses of the Underlying Funds in addition to the direct expenses as presented in the table. These fees and expenses are not included in the annualized expense ratio used to calculate the expense estimate in the table below.
Please note that the expenses shown in the table are meant to highlight your ongoing costs only and do not reflect any transaction costs. Therefore, the second line of the table is useful in comparing ongoing costs only, and will not help you determine the relative total costs of owning different funds. In addition, if these transactional costs were included, your costs would have been higher.
| | | | | Annualized Expense Ratio- A | | Beginning Account Value July 1, 2022 | | Ending Account Value December 31, 2022 | | Expenses Paid During Period- C July 1, 2022 to December 31, 2022 |
| Fidelity® Fund | | | | | | | | | | |
| Fidelity® Fund | | | | .46% | | | | | | |
| Actual | | | | | | $ 1,000 | | $ 1,010.60 | | $ 2.33 |
Hypothetical- B | | | | | | $ 1,000 | | $ 1,022.89 | | $ 2.35 |
| Class K | | | | .38% | | | | | | |
| Actual | | | | | | $ 1,000 | | $ 1,011.10 | | $ 1.93 |
Hypothetical- B | | | | | | $ 1,000 | | $ 1,023.29 | | $ 1.94 |
| |
A Annualized expense ratio reflects expenses net of applicable fee waivers.
B 5% return per year before expenses
C Expenses are equal to the annualized expense ratio, multiplied by the average account value over the period, multiplied by 184/ 365 (to reflect the one-half year period). The fees and expenses of any Underlying Funds are not included in each annualized expense ratio.
1.540016.125
FID-SANN-0323
Fidelity® Series Large Cap Stock Fund
Semi-Annual Report
December 31, 2022
Contents
To view a fund's proxy voting guidelines and proxy voting record for the 12-month period ended June 30, visit http://www.fidelity.com/proxyvotingresults or visit the Securities and Exchange Commission's (SEC) web site at http://www.sec.gov.
You may also call 1-800-544-8544 to request a free copy of the proxy voting guidelines.
Standard & Poor's, S&P and S&P 500 are registered service marks of The McGraw-Hill Companies, Inc. and have been licensed for use by Fidelity Distributors Corporation.
Other third-party marks appearing herein are the property of their respective owners.
All other marks appearing herein are registered or unregistered trademarks or service marks of FMR LLC or an affiliated company. © 2023 FMR LLC. All rights reserved.
This report and the financial statements contained herein are submitted for the general information of the shareholders of the Fund. This report is not authorized for distribution to prospective investors in the Fund unless preceded or accompanied by an effective prospectus.
A fund files its complete schedule of portfolio holdings with the SEC for the first and third quarters of each fiscal year on Form N-PORT. Forms N-PORT are available on the SEC's web site at http://www.sec.gov. A fund's Forms N-PORT may be reviewed and copied at the SEC's Public Reference Room in Washington, DC. Information regarding the operation of the SEC's Public Reference Room may be obtained by calling 1-800-SEC-0330.
For a complete list of a fund's portfolio holdings, view the most recent holdings listing, semiannual report, or annual report on Fidelity's web site at http://www.fidelity.com, http://www.institutional.fidelity.com, or http://www.401k.com, as applicable.
NOT FDIC INSURED •MAY LOSE VALUE •NO BANK GUARANTEE
Neither the Fund nor Fidelity Distributors Corporation is a bank.
Top Holdings (% of Fund's net assets) |
| |
| Exxon Mobil Corp. | 7.7 | |
| General Electric Co. | 6.1 | |
| Microsoft Corp. | 5.8 | |
| Wells Fargo & Co. | 5.0 | |
| Bank of America Corp. | 2.9 | |
| Apple, Inc. | 2.8 | |
| Hess Corp. | 2.3 | |
| The Boeing Co. | 2.1 | |
| Bristol-Myers Squibb Co. | 2.0 | |
| Comcast Corp. Class A | 1.9 | |
| | 38.6 | |
| |
| Market Sectors (% of Fund's net assets) |
| |
| Information Technology | 17.2 | |
| Financials | 15.2 | |
| Industrials | 14.8 | |
| Energy | 13.8 | |
| Health Care | 13.3 | |
| Communication Services | 7.4 | |
| Consumer Staples | 4.7 | |
| Consumer Discretionary | 3.6 | |
| Materials | 3.1 | |
| Real Estate | 0.8 | |
| Utilities | 0.6 | |
| |
Asset Allocation (% of Fund's net assets) |
|
Foreign investments - 9.7% |
|
Showing Percentage of Net Assets
| Common Stocks - 94.3% |
| | | Shares | Value ($) |
| COMMUNICATION SERVICES - 7.4% | | | |
| Diversified Telecommunication Services - 0.3% | | | |
| Cellnex Telecom SA (a) | | 611,700 | 20,290,855 |
| Verizon Communications, Inc. | | 710,633 | 27,998,940 |
| | | | 48,289,795 |
| Entertainment - 1.3% | | | |
| Activision Blizzard, Inc. | | 232,322 | 17,784,249 |
| Nintendo Co. Ltd. ADR | | 1,920,600 | 20,012,652 |
| The Walt Disney Co. (b) | | 820,893 | 71,319,184 |
| Universal Music Group NV | | 2,865,781 | 69,302,294 |
| | | | 178,418,379 |
| Interactive Media & Services - 3.4% | | | |
| Alphabet, Inc.: | | | |
| Class A (b) | | 1,978,425 | 174,556,438 |
| Class C (b) | | 1,803,260 | 160,003,260 |
| Match Group, Inc. (b) | | 129,400 | 5,368,806 |
| Meta Platforms, Inc. Class A (b) | | 886,700 | 106,705,478 |
| Snap, Inc. Class A (b) | | 2,273,000 | 20,343,350 |
| | | | 466,977,332 |
| Media - 2.4% | | | |
| Charter Communications, Inc. Class A (b) | | 21,400 | 7,256,740 |
| Comcast Corp. Class A | | 7,542,742 | 263,769,688 |
| Interpublic Group of Companies, Inc. | | 1,944,570 | 64,773,627 |
| | | | 335,800,055 |
TOTAL COMMUNICATION SERVICES | | | 1,029,485,561 |
| CONSUMER DISCRETIONARY - 3.6% | | | |
| Auto Components - 0.3% | | | |
| BorgWarner, Inc. | | 883,062 | 35,543,246 |
| Automobiles - 0.1% | | | |
| General Motors Co. | | 297,400 | 10,004,536 |
| Hotels, Restaurants & Leisure - 1.4% | | | |
| Booking Holdings, Inc. (b) | | 57,837 | 116,557,749 |
| Expedia, Inc. (b) | | 218,600 | 19,149,360 |
| Marriott International, Inc. Class A | | 268,500 | 39,976,965 |
| Starbucks Corp. | | 166,000 | 16,467,200 |
| | | | 192,151,274 |
| Household Durables - 0.4% | | | |
| Mohawk Industries, Inc. (b) | | 314,489 | 32,147,066 |
| Sony Group Corp. sponsored ADR | | 194,500 | 14,836,460 |
| Whirlpool Corp. | | 45,063 | 6,374,612 |
| | | | 53,358,138 |
| Internet & Direct Marketing Retail - 0.2% | | | |
| Amazon.com, Inc. (b) | | 325,400 | 27,333,600 |
| Multiline Retail - 0.1% | | | |
| Target Corp. | | 95,300 | 14,203,512 |
| Specialty Retail - 1.0% | | | |
| Lowe's Companies, Inc. | | 715,907 | 142,637,311 |
| Textiles, Apparel & Luxury Goods - 0.1% | | | |
| NIKE, Inc. Class B | | 163,100 | 19,084,331 |
TOTAL CONSUMER DISCRETIONARY | | | 494,315,948 |
| CONSUMER STAPLES - 4.7% | | | |
| Beverages - 1.8% | | | |
| Diageo PLC sponsored ADR (c) | | 353,000 | 62,901,070 |
| Keurig Dr. Pepper, Inc. | | 1,345,700 | 47,987,662 |
| The Coca-Cola Co. | | 2,190,895 | 139,362,831 |
| | | | 250,251,563 |
| Food & Staples Retailing - 1.5% | | | |
| Costco Wholesale Corp. | | 17,500 | 7,988,750 |
| Performance Food Group Co. (b) | | 501,900 | 29,305,941 |
| Sysco Corp. | | 1,196,000 | 91,434,200 |
| U.S. Foods Holding Corp. (b) | | 595,600 | 20,262,312 |
| Walmart, Inc. | | 394,100 | 55,879,439 |
| | | | 204,870,642 |
| Household Products - 0.1% | | | |
| Colgate-Palmolive Co. | | 17,300 | 1,363,067 |
| Spectrum Brands Holdings, Inc. | | 257,382 | 15,679,711 |
| | | | 17,042,778 |
| Personal Products - 0.3% | | | |
| Estee Lauder Companies, Inc. Class A | | 12,400 | 3,076,564 |
| Haleon PLC ADR (b)(c) | | 5,555,736 | 44,445,888 |
| | | | 47,522,452 |
| Tobacco - 1.0% | | | |
| Altria Group, Inc. | | 2,950,159 | 134,851,768 |
TOTAL CONSUMER STAPLES | | | 654,539,203 |
| ENERGY - 13.8% | | | |
| Energy Equipment & Services - 0.0% | | | |
| Baker Hughes Co. Class A | | 110,100 | 3,251,253 |
| Oil, Gas & Consumable Fuels - 13.8% | | | |
| Canadian Natural Resources Ltd. | | 464,800 | 25,811,161 |
| Cenovus Energy, Inc. (Canada) | | 10,777,081 | 209,094,474 |
| EQT Corp. | | 349,400 | 11,820,202 |
| Exxon Mobil Corp. | | 9,728,943 | 1,073,102,406 |
| Hess Corp. | | 2,250,772 | 319,204,485 |
| Imperial Oil Ltd. | | 1,595,600 | 77,717,740 |
| Kosmos Energy Ltd. (b) | | 13,462,455 | 85,621,214 |
| Phillips 66 Co. | | 202,300 | 21,055,384 |
| Tourmaline Oil Corp. | | 1,709,900 | 86,277,968 |
| | | | 1,909,705,034 |
TOTAL ENERGY | | | 1,912,956,287 |
| FINANCIALS - 15.2% | | | |
| Banks - 11.5% | | | |
| Bank of America Corp. | | 12,004,594 | 397,592,153 |
| Comerica, Inc. | | 118,400 | 7,915,040 |
| JPMorgan Chase & Co. | | 1,142,571 | 153,218,771 |
| M&T Bank Corp. | | 170,920 | 24,793,655 |
| PNC Financial Services Group, Inc. | | 886,221 | 139,969,745 |
| Truist Financial Corp. | | 2,177,423 | 93,694,512 |
| U.S. Bancorp | | 1,844,119 | 80,422,030 |
| Wells Fargo & Co. | | 16,661,437 | 687,950,734 |
| | | | 1,585,556,640 |
| Capital Markets - 2.4% | | | |
| CME Group, Inc. | | 19,900 | 3,346,384 |
| KKR & Co. LP (c) | | 1,452,051 | 67,404,207 |
| Morgan Stanley | | 844,424 | 71,792,928 |
| Northern Trust Corp. | | 1,444,946 | 127,863,272 |
| Raymond James Financial, Inc. | | 373,403 | 39,898,111 |
| State Street Corp. | | 244,341 | 18,953,531 |
| | | | 329,258,433 |
| Consumer Finance - 0.2% | | | |
| Discover Financial Services | | 327,900 | 32,078,457 |
| Insurance - 0.2% | | | |
| Chubb Ltd. | | 140,597 | 31,015,698 |
| Thrifts & Mortgage Finance - 0.9% | | | |
| MGIC Investment Corp. | | 5,656,977 | 73,540,701 |
| Radian Group, Inc. | | 2,718,408 | 51,840,041 |
| | | | 125,380,742 |
TOTAL FINANCIALS | | | 2,103,289,970 |
| HEALTH CARE - 13.3% | | | |
| Biotechnology - 0.6% | | | |
| ADC Therapeutics SA (b) | | 243,209 | 933,923 |
| Alnylam Pharmaceuticals, Inc. (b) | | 169,950 | 40,388,618 |
| Argenx SE ADR (b) | | 14,700 | 5,568,801 |
| Crinetics Pharmaceuticals, Inc. (b) | | 389,800 | 7,133,340 |
| Insmed, Inc. (b) | | 691,829 | 13,822,743 |
| Vaxcyte, Inc. (b) | | 251,200 | 12,045,040 |
| Verve Therapeutics, Inc. (b) | | 172,200 | 3,332,070 |
| | | | 83,224,535 |
| Health Care Equipment & Supplies - 1.7% | | | |
| Abbott Laboratories | | 54,500 | 5,983,555 |
| Becton, Dickinson & Co. | | 144,706 | 36,798,736 |
| Boston Scientific Corp. (b) | | 3,798,319 | 175,748,220 |
| iRhythm Technologies, Inc. (b) | | 1,100 | 103,037 |
| Koninklijke Philips Electronics NV (depositary receipt) (NY Reg.) | | 739,476 | 11,084,745 |
| | | | 229,718,293 |
| Health Care Providers & Services - 6.2% | | | |
| Cardinal Health, Inc. | | 1,202,558 | 92,440,633 |
| Centene Corp. (b) | | 111,200 | 9,119,512 |
| Cigna Corp. | | 637,411 | 211,199,761 |
| CVS Health Corp. | | 1,351,552 | 125,951,131 |
| Guardant Health, Inc. (b) | | 351,300 | 9,555,360 |
| Humana, Inc. | | 45,600 | 23,355,864 |
| McKesson Corp. | | 432,621 | 162,284,790 |
| Oak Street Health, Inc. (b) | | 188,700 | 4,058,937 |
| UnitedHealth Group, Inc. | | 422,481 | 223,990,977 |
| | | | 861,956,965 |
| Life Sciences Tools & Services - 0.3% | | | |
| Danaher Corp. | | 156,100 | 41,432,062 |
| Pharmaceuticals - 4.5% | | | |
| Bayer AG | | 238,672 | 12,284,473 |
| Bristol-Myers Squibb Co. | | 3,893,460 | 280,134,447 |
| Eli Lilly & Co. | | 147,300 | 53,888,232 |
| GSK PLC sponsored ADR | | 2,840,028 | 99,798,584 |
| Johnson & Johnson | | 924,571 | 163,325,467 |
| Pliant Therapeutics, Inc. (b) | | 234,300 | 4,529,019 |
| Sanofi SA sponsored ADR | | 241,600 | 11,700,688 |
| Viatris, Inc. | | 185,500 | 2,064,615 |
| | | | 627,725,525 |
TOTAL HEALTH CARE | | | 1,844,057,380 |
| INDUSTRIALS - 14.6% | | | |
| Aerospace & Defense - 3.6% | | | |
| Airbus Group NV | | 716,700 | 85,217,424 |
| General Dynamics Corp. | | 178,160 | 44,203,278 |
| Huntington Ingalls Industries, Inc. | | 111,550 | 25,732,354 |
| MTU Aero Engines AG | | 51,600 | 11,168,561 |
| Raytheon Technologies Corp. | | 212,969 | 21,492,831 |
| Safran SA | | 121,500 | 15,218,361 |
| The Boeing Co. (b) | | 1,535,896 | 292,572,829 |
| | | | 495,605,638 |
| Air Freight & Logistics - 1.8% | | | |
| FedEx Corp. | | 348,747 | 60,402,980 |
| United Parcel Service, Inc. Class B | | 1,114,756 | 193,789,183 |
| | | | 254,192,163 |
| Airlines - 0.1% | | | |
| Copa Holdings SA Class A (b) | | 48,500 | 4,033,745 |
| Ryanair Holdings PLC sponsored ADR (b) | | 113,400 | 8,477,784 |
| | | | 12,511,529 |
| Building Products - 0.1% | | | |
| Johnson Controls International PLC | | 327,700 | 20,972,800 |
| Commercial Services & Supplies - 0.1% | | | |
| ACV Auctions, Inc. Class A (b) | | 1,219,100 | 10,008,811 |
| Electrical Equipment - 1.2% | | | |
| Acuity Brands, Inc. | | 227,969 | 37,753,946 |
| Hubbell, Inc. Class B | | 159,914 | 37,528,618 |
| Regal Rexnord Corp. | | 227,500 | 27,295,450 |
| Vertiv Holdings Co. | | 4,293,200 | 58,645,112 |
| | | | 161,223,126 |
| Industrial Conglomerates - 6.2% | | | |
| 3M Co. | | 147,273 | 17,660,978 |
| General Electric Co. | | 10,070,364 | 843,795,800 |
| | | | 861,456,778 |
| Machinery - 0.9% | | | |
| Cummins, Inc. | | 79,200 | 19,189,368 |
| Flowserve Corp. | | 844,685 | 25,914,936 |
| Fortive Corp. | | 386,500 | 24,832,625 |
| Otis Worldwide Corp. | | 238,884 | 18,707,006 |
| Stanley Black & Decker, Inc. | | 111,500 | 8,375,880 |
| Westinghouse Air Brake Tech Co. | | 291,985 | 29,143,023 |
| | | | 126,162,838 |
| Professional Services - 0.1% | | | |
| Equifax, Inc. | | 52,400 | 10,184,464 |
| Road & Rail - 0.5% | | | |
| Knight-Swift Transportation Holdings, Inc. Class A | | 1,275,115 | 66,828,777 |
| Trading Companies & Distributors - 0.0% | | | |
| Beijer Ref AB (B Shares) (c) | | 228,600 | 3,222,572 |
TOTAL INDUSTRIALS | | | 2,022,369,496 |
| INFORMATION TECHNOLOGY - 17.2% | | | |
| Electronic Equipment & Components - 0.2% | | | |
| Mirion Technologies, Inc. (b)(d) | | 3,311,098 | 21,886,358 |
| IT Services - 3.8% | | | |
| Amadeus IT Holding SA Class A (b) | | 371,500 | 19,272,593 |
| Edenred SA | | 897,000 | 48,854,653 |
| Fidelity National Information Services, Inc. | | 589,900 | 40,024,715 |
| Genpact Ltd. | | 496,200 | 22,983,984 |
| Global Payments, Inc. | | 75,200 | 7,468,864 |
| IBM Corp. | | 140,100 | 19,738,689 |
| MasterCard, Inc. Class A | | 144,889 | 50,382,252 |
| PayPal Holdings, Inc. (b) | | 373,900 | 26,629,158 |
| Sabre Corp. (b)(c) | | 2,134,300 | 13,189,974 |
| Snowflake, Inc. (b) | | 7,500 | 1,076,550 |
| Twilio, Inc. Class A (b) | | 331,700 | 16,240,032 |
| Unisys Corp. (b) | | 1,905,099 | 9,735,056 |
| Visa, Inc. Class A | | 1,197,093 | 248,708,042 |
| | | | 524,304,562 |
| Semiconductors & Semiconductor Equipment - 2.3% | | | |
| Analog Devices, Inc. | | 145,938 | 23,938,210 |
| Applied Materials, Inc. | | 368,402 | 35,874,987 |
| Intel Corp. | | 884,800 | 23,385,264 |
| Lam Research Corp. | | 70,200 | 29,505,060 |
| Marvell Technology, Inc. | | 1,042,991 | 38,632,387 |
| NVIDIA Corp. | | 188,800 | 27,591,232 |
| Qualcomm, Inc. | | 1,214,031 | 133,470,568 |
| Taiwan Semiconductor Manufacturing Co. Ltd. sponsored ADR | | 102,700 | 7,650,123 |
| | | | 320,047,831 |
| Software - 8.0% | | | |
| Adobe, Inc. (b) | | 193,400 | 65,084,902 |
| Autodesk, Inc. (b) | | 173,228 | 32,371,116 |
| DoubleVerify Holdings, Inc. (b) | | 224,600 | 4,932,216 |
| Dynatrace, Inc. (b) | | 489,394 | 18,743,790 |
| Elastic NV (b) | | 510,700 | 26,301,050 |
| Intuit, Inc. | | 90,300 | 35,146,566 |
| Microsoft Corp. | | 3,340,405 | 801,095,927 |
| PTC, Inc. (b) | | 132,800 | 15,941,312 |
| Salesforce.com, Inc. (b) | | 98,500 | 13,060,115 |
| SAP SE sponsored ADR (c) | | 919,746 | 94,908,590 |
| Workday, Inc. Class A (b) | | 42,900 | 7,178,457 |
| | | | 1,114,764,041 |
| Technology Hardware, Storage & Peripherals - 2.9% | | | |
| Apple, Inc. | | 2,997,814 | 389,505,973 |
| Samsung Electronics Co. Ltd. | | 271,740 | 11,934,939 |
| | | | 401,440,912 |
TOTAL INFORMATION TECHNOLOGY | | | 2,382,443,704 |
| MATERIALS - 3.1% | | | |
| Chemicals - 0.6% | | | |
| Axalta Coating Systems Ltd. (b) | | 225,300 | 5,738,391 |
| DuPont de Nemours, Inc. | | 1,192,800 | 81,861,864 |
| | | | 87,600,255 |
| Metals & Mining - 2.5% | | | |
| First Quantum Minerals Ltd. | | 4,115,700 | 85,991,989 |
| Freeport-McMoRan, Inc. | | 5,059,942 | 192,277,796 |
| Glencore PLC | | 10,030,600 | 66,890,532 |
| | | | 345,160,317 |
TOTAL MATERIALS | | | 432,760,572 |
| REAL ESTATE - 0.8% | | | |
| Equity Real Estate Investment Trusts (REITs) - 0.8% | | | |
| American Tower Corp. | | 172,681 | 36,584,197 |
| Crown Castle International Corp. | | 49,400 | 6,700,616 |
| Equinix, Inc. | | 4,422 | 2,896,543 |
| Simon Property Group, Inc. | | 592,400 | 69,595,152 |
| | | | 115,776,508 |
| UTILITIES - 0.6% | | | |
| Electric Utilities - 0.6% | | | |
| Entergy Corp. | | 110,700 | 12,453,750 |
| PG&E Corp. (b) | | 969,300 | 15,760,818 |
| Southern Co. | | 748,300 | 53,436,103 |
| | | | 81,650,671 |
| Multi-Utilities - 0.0% | | | |
| Sempra Energy | | 34,380 | 5,313,085 |
TOTAL UTILITIES | | | 86,963,756 |
| TOTAL COMMON STOCKS (Cost $8,996,242,204) | | | 13,078,958,385 |
| | | | |
| Preferred Stocks - 0.2% |
| | | Shares | Value ($) |
| Convertible Preferred Stocks - 0.0% | | | |
| COMMUNICATION SERVICES - 0.0% | | | |
| Interactive Media & Services - 0.0% | | | |
| Reddit, Inc. Series E (b)(d)(e) | | 17,600 | 659,296 |
| | | | |
| Nonconvertible Preferred Stocks - 0.2% | | | |
| INDUSTRIALS - 0.2% | | | |
| Aerospace & Defense - 0.2% | | | |
| Embraer SA sponsored ADR (b) | | 1,749,000 | 19,116,570 |
| | | | |
| TOTAL PREFERRED STOCKS (Cost $20,367,805) | | | 19,775,866 |
| | | | |
| Money Market Funds - 4.8% |
| | | Shares | Value ($) |
| Fidelity Cash Central Fund 4.37% (f) | | 589,465,230 | 589,583,123 |
| Fidelity Securities Lending Cash Central Fund 4.37% (f)(g) | | 77,422,943 | 77,430,686 |
| TOTAL MONEY MARKET FUNDS (Cost $667,013,809) | | | 667,013,809 |
| | | | |
| TOTAL INVESTMENT IN SECURITIES - 99.3% (Cost $9,683,623,818) | 13,765,748,060 |
NET OTHER ASSETS (LIABILITIES) - 0.7% | 98,607,276 |
| NET ASSETS - 100.0% | 13,864,355,336 |
| | |
Legend
| (a) | Security exempt from registration under Rule 144A of the Securities Act of 1933. These securities may be resold in transactions exempt from registration, normally to qualified institutional buyers. At the end of the period, the value of these securities amounted to $20,290,855 or 0.1% of net assets. |
| (c) | Security or a portion of the security is on loan at period end. |
| (d) | Restricted securities (including private placements) - Investment in securities not registered under the Securities Act of 1933 (excluding 144A issues). At the end of the period, the value of restricted securities (excluding 144A issues) amounted to $22,545,654 or 0.2% of net assets. |
| (f) | Affiliated fund that is generally available only to investment companies and other accounts managed by Fidelity Investments. The rate quoted is the annualized seven-day yield of the fund at period end. A complete unaudited listing of the fund's holdings as of its most recent quarter end is available upon request. In addition, each Fidelity Central Fund's financial statements are available on the SEC's website or upon request. |
| (g) | Investment made with cash collateral received from securities on loan. |
| Additional information on each restricted holding is as follows: |
| Security | Acquisition Date | Acquisition Cost ($) |
| Mirion Technologies, Inc. | 6/16/21 | 33,110,980 |
| | | |
| Reddit, Inc. Series E | 5/18/21 | 747,546 |
| | | |
Affiliated Central Funds
Fiscal year to date information regarding the Fund's investments in Fidelity Central Funds, including the ownership percentage, is presented below.
| Affiliate | Value, beginning of period ($) | Purchases ($) | Sales Proceeds ($) | Dividend Income ($) | Realized Gain (loss) ($) | Change in Unrealized appreciation (depreciation) ($) | Value, end of period ($) | % ownership, end of period |
| Fidelity Cash Central Fund 4.37% | 761,480,223 | 1,878,238,957 | 2,050,136,057 | 8,420,461 | - | - | 589,583,123 | 1.4% |
| Fidelity Securities Lending Cash Central Fund 4.37% | 21,387,036 | 438,373,914 | 382,330,264 | 83,996 | - | - | 77,430,686 | 0.2% |
| Total | 782,867,259 | 2,316,612,871 | 2,432,466,321 | 8,504,457 | - | - | 667,013,809 | |
| | | | | | | | | |
Amounts in the dividend income column in the above table include any capital gain distributions from underlying funds, which are presented in the corresponding line item in the Statement of Operations, if applicable.
Amount for Fidelity Securities Lending Cash Central Fund represents the income earned on investing cash collateral, less rebates paid to borrowers and any lending agent fees associated with the loan, plus any premium payments received for lending certain types of securities.
Amounts included in the purchases and sales proceeds columns may include in-kind transactions, if applicable.
Investment Valuation
The following is a summary of the inputs used, as of December 31, 2022, involving the Fund's assets and liabilities carried at fair value. The inputs or methodology used for valuing securities may not be an indication of the risk associated with investing in those securities. For more information on valuation inputs, and their aggregation into the levels used below, please refer to the Investment Valuation section in the accompanying Notes to Financial Statements.
| Valuation Inputs at Reporting Date: |
| Description | Total ($) | Level 1 ($) | Level 2 ($) | Level 3 ($) |
Investments in Securities: | | | | |
|
| Equities: | | | | |
Communication Services | 1,030,144,857 | 939,892,412 | 89,593,149 | 659,296 |
Consumer Discretionary | 494,315,948 | 494,315,948 | - | - |
Consumer Staples | 654,539,203 | 654,539,203 | - | - |
Energy | 1,912,956,287 | 1,912,956,287 | - | - |
Financials | 2,103,289,970 | 2,103,289,970 | - | - |
Health Care | 1,844,057,380 | 1,831,772,907 | 12,284,473 | - |
Industrials | 2,041,486,066 | 1,941,050,281 | 100,435,785 | - |
Information Technology | 2,382,443,704 | 2,363,171,111 | 19,272,593 | - |
Materials | 432,760,572 | 365,870,040 | 66,890,532 | - |
Real Estate | 115,776,508 | 115,776,508 | - | - |
Utilities | 86,963,756 | 86,963,756 | - | - |
|
| Money Market Funds | 667,013,809 | 667,013,809 | - | - |
| Total Investments in Securities: | 13,765,748,060 | 13,476,612,232 | 288,476,532 | 659,296 |
| Statement of Assets and Liabilities |
| | | | December 31, 2022 (Unaudited) |
| | | | | |
| Assets | | | | |
| Investment in securities, at value (including securities loaned of $75,061,170) - See accompanying schedule: | | | | |
Unaffiliated issuers (cost $9,016,610,009) | | $13,098,734,251 | | |
Fidelity Central Funds (cost $667,013,809) | | 667,013,809 | | |
| | | | | |
| Total Investment in Securities (cost $9,683,623,818) | | | $ | 13,765,748,060 |
| Restricted cash | | | | 1,729,160 |
| Foreign currency held at value (cost $978,864) | | | | 978,865 |
| Receivable for securities sold on a delayed delivery basis | | | | 8,335,435 |
| Receivable for fund shares sold | | | | 175,687,922 |
| Dividends receivable | | | | 13,943,042 |
| Distributions receivable from Fidelity Central Funds | | | | 2,169,237 |
Total assets | | | | 13,968,591,721 |
| Liabilities | | | | |
| Payable for investments purchased | | $26,467,368 | | |
| Payable for fund shares redeemed | | 283,184 | | |
| Other payables and accrued expenses | | 71,958 | | |
| Collateral on securities loaned | | 77,413,875 | | |
| Total Liabilities | | | | 104,236,385 |
| Net Assets | | | $ | 13,864,355,336 |
| Net Assets consist of: | | | | |
| Paid in capital | | | $ | 9,803,023,360 |
| Total accumulated earnings (loss) | | | | 4,061,331,976 |
| Net Assets | | | $ | 13,864,355,336 |
Net Asset Value , offering price and redemption price per share ($13,864,355,336 ÷ 838,973,866 shares) | | | $ | 16.53 |
| | | | | |
| Statement of Operations |
| | | | Six months ended December 31, 2022 (Unaudited) |
| Investment Income | | | | |
| Dividends | | | $ | 156,401,864 |
| Income from Fidelity Central Funds (including $83,996 from security lending) | | | | 8,504,457 |
| Total Income | | | | 164,906,321 |
| Expenses | | | | |
| Custodian fees and expenses | | 91,962 | | |
| Independent trustees' fees and expenses | | 23,375 | | |
| Total expenses before reductions | | 115,337 | | |
| Expense reductions | | (540) | | |
| Total expenses after reductions | | | | 114,797 |
| Net Investment income (loss) | | | | 164,791,524 |
| Realized and Unrealized Gain (Loss) | | | | |
| Net realized gain (loss) on: | | | | |
| Investment Securities: | | | | |
| Unaffiliated issuers | | 12,162,078 | | |
| Foreign currency transactions | | 1,393,848 | | |
| Total net realized gain (loss) | | | | 13,555,926 |
| Change in net unrealized appreciation (depreciation) on: | | | | |
| Investment Securities: | | | | |
| Unaffiliated issuers | | 800,793,000 | | |
| Assets and liabilities in foreign currencies | | 69,385 | | |
| Total change in net unrealized appreciation (depreciation) | | | | 800,862,385 |
| Net gain (loss) | | | | 814,418,311 |
| Net increase (decrease) in net assets resulting from operations | | | $ | 979,209,835 |
| Statement of Changes in Net Assets |
| |
| | Six months ended December 31, 2022 (Unaudited) | | Year ended June 30, 2022 |
| Increase (Decrease) in Net Assets | | | | |
| Operations | | | | |
| Net investment income (loss) | $ | 164,791,524 | $ | 260,692,749 |
| Net realized gain (loss) | | 13,555,926 | | 899,500,742 |
| Change in net unrealized appreciation (depreciation) | | 800,862,385 | | (2,398,185,195) |
| Net increase (decrease) in net assets resulting from operations | | 979,209,835 | | (1,237,991,704) |
| Distributions to shareholders | | (859,194,238) | | (1,309,838,257) |
| Share transactions | | | | |
| Proceeds from sales of shares | | 2,072,551,833 | | 2,398,883,246 |
| Reinvestment of distributions | | 859,194,238 | | 1,309,838,257 |
| Cost of shares redeemed | | (1,985,893,783) | | (3,155,193,754) |
Net increase (decrease) in net assets resulting from share transactions | | 945,852,288 | | 553,527,749 |
| Total increase (decrease) in net assets | | 1,065,867,885 | | (1,994,302,212) |
| | | | | |
| Net Assets | | | | |
| Beginning of period | | 12,798,487,451 | | 14,792,789,663 |
| End of period | $ | 13,864,355,336 | $ | 12,798,487,451 |
| | | | | |
| Other Information | | | | |
| Shares | | | | |
| Sold | | 124,834,875 | | 131,892,724 |
| Issued in reinvestment of distributions | | 51,636,302 | | 69,841,877 |
| Redeemed | | (119,298,053) | | (166,893,726) |
| Net increase (decrease) | | 57,173,124 | | 34,840,875 |
| | | | | |
Financial Highlights
| Fidelity® Series Large Cap Stock Fund |
| |
| | Six months ended (Unaudited) December 31, 2022 | | Years ended June 30, 2022 | | 2021 | | 2020 | | 2019 | | 2018 |
Selected Per-Share Data | | | | | | | | | | | | |
| Net asset value, beginning of period | $ | 16.37 | $ | 19.80 | $ | 14.07 | $ | 14.98 | $ | 15.76 | $ | 15.00 |
| Income from Investment Operations | | | | | | | | | | | | |
Net investment income (loss) A,B | | .20 | | .34 | | .34 | | .37 | | .42 | | .38 |
| Net realized and unrealized gain (loss) | | 1.04 | | (2.02) | | 6.27 | | (.32) | | .42 | | 1.26 |
| Total from investment operations | | 1.24 | | (1.68) | | 6.61 | | .05 | | .84 | | 1.64 |
| Distributions from net investment income | | (.33) | | (.47) | | (.37) | | (.28) | | (.39) | | (.34) |
| Distributions from net realized gain | | (.76) | | (1.28) | | (.52) | | (.68) | | (1.22) | | (.54) |
| Total distributions | | (1.08) C | | (1.75) | | (.88) C | | (.96) | | (1.62) C | | (.88) |
| Net asset value, end of period | $ | 16.53 | $ | 16.37 | $ | 19.80 | $ | 14.07 | $ | 14.98 | $ | 15.76 |
Total Return D,E | | 7.60% | | (9.44)% | | 49.05% | | .17% | | 5.83% | | 11.35% |
Ratios to Average Net Assets B,F,G | | | | | | | | | | | | |
Expenses before reductions H | | -% I | | -% | | -% | | -% | | -% | | -% |
Expenses net of fee waivers, if any H | | -% I | | -% | | -% | | -% | | -% | | -% |
Expenses net of all reductions H | | -% I | | -% | | -% | | -% | | -% | | -% |
| Net investment income (loss) | | 2.43% I | | 1.84% | | 2.04% | | 2.58% | | 2.80% | | 2.47% |
| Supplemental Data | | | | | | | | | | | | |
| Net assets, end of period (000 omitted) | $ | 13,864,355 | $ | 12,798,487 | $ | 14,792,790 | $ | 11,937,391 | $ | 14,114,096 | $ | 13,059,805 |
Portfolio turnover rate J | | 10% I | | 17% | | 15% | | 28% K | | 41% L | | 44% |
A Calculated based on average shares outstanding during the period.
B Net investment income (loss) is affected by the timing of the declaration of dividends by any underlying mutual funds or exchange-traded funds (ETFs). Net investment income (loss) of any mutual funds or ETFs is not included in the Fund's net investment income (loss) ratio.
C Total distributions per share do not sum due to rounding.
D Total returns for periods of less than one year are not annualized.
E Total returns would have been lower if certain expenses had not been reduced during the applicable periods shown.
F Fees and expenses of any underlying mutual funds or exchange-traded funds (ETFs) are not included in the Fund's expense ratio. The Fund indirectly bears its proportionate share of these expenses. For additional expense information related to investments in Fidelity Central Funds, please refer to the "Investments in Fidelity Central Funds" note found in the Notes to Financial Statements section of the most recent Annual or Semi-Annual report.
G Expense ratios reflect operating expenses of the class. Expenses before reductions do not reflect amounts reimbursed, waived, or reduced through arrangements with the investment adviser, brokerage services, or other offset arrangements, if applicable, and do not represent the amount paid by the class during periods when reimbursements, waivers or reductions occur.
H Amount represents less than .005%.
I Annualized.
J Amount does not include the portfolio activity of any underlying mutual funds or exchange-traded funds (ETFs).
K Portfolio turnover rate excludes securities received or delivered in-kind.
L The portfolio turnover rate does not include the assets acquired in the merger.
For the period ended December 31, 2022
1. Organization.
Fidelity Series Large Cap Stock Fund (the Fund) is a fund of Fidelity Hastings Street Trust (the Trust) and is authorized to issue an unlimited number of shares. Shares are offered only to certain other Fidelity funds, Fidelity managed 529 plans, and Fidelity managed collective investment trusts. The Trust is registered under the Investment Company Act of 1940, as amended (the 1940 Act), as an open-end management investment company organized as a Massachusetts business trust.
2. Investments in Fidelity Central Funds.
Funds may invest in Fidelity Central Funds, which are open-end investment companies generally available only to other investment companies and accounts managed by the investment adviser and its affiliates. The Schedule of Investments lists any Fidelity Central Funds held as an investment as of period end, but does not include the underlying holdings of each Fidelity Central Fund. An investing fund indirectly bears its proportionate share of the expenses of the underlying Fidelity Central Funds.
Based on its investment objective, each Fidelity Central Fund may invest or participate in various investment vehicles or strategies that are similar to those of the investing fund. These strategies are consistent with the investment objectives of the investing fund and may involve certain economic risks which may cause a decline in value of each of the Fidelity Central Funds and thus a decline in the value of the investing fund.
| Fidelity Central Fund | Investment Manager | Investment Objective | Investment Practices | Expense Ratio A |
| Fidelity Money Market Central Funds | Fidelity Management & Research Company LLC (FMR) | Each fund seeks to obtain a high level of current income consistent with the preservation of capital and liquidity. | Short-term Investments | Less than .005% |
A Expenses expressed as a percentage of average net assets and are as of each underlying Central Fund's most recent annual or semi-annual shareholder report.
A complete unaudited list of holdings for each Fidelity Central Fund is available upon request or at the Securities and Exchange Commission website at www.sec.gov. In addition, the financial statements of the Fidelity Central Funds which contain the significant accounting policies (including investment valuation policies) of those funds, and are not covered by the Report of Independent Registered Public Accounting Firm, are available on the Securities and Exchange Commission website or upon request.
3. Significant Accounting Policies.
The Fund is an investment company and applies the accounting and reporting guidance of the Financial Accounting Standards Board (FASB) Accounting Standards Codification Topic 946 Financial Services - Investment Companies . The financial statements have been prepared in conformity with accounting principles generally accepted in the United States of America (GAAP), which require management to make certain estimates and assumptions at the date of the financial statements. Actual results could differ from those estimates. Subsequent events, if any, through the date that the financial statements were issued have been evaluated in the preparation of the financial statements. The Fund's Schedule of Investments lists any underlying mutual funds or exchange-traded funds (ETFs) but does not include the underlying holdings of these funds. The following summarizes the significant accounting policies of the Fund:
Investment Valuation. Investments are valued as of 4:00 p.m. Eastern time on the last calendar day of the period. The Board of Trustees (the Board) has designated the Fund's investment adviser as the valuation designee responsible for the fair valuation function and performing fair value determinations as needed. The investment adviser has established a Fair Value Committee (the Committee) to carry out the day-to-day fair valuation responsibilities and has adopted policies and procedures to govern the fair valuation process and the activities of the Committee. In accordance with these fair valuation policies and procedures, which have been approved by the Board, the Fund attempts to obtain prices from one or more third party pricing services or brokers to value its investments. When current market prices, quotations or currency exchange rates are not readily available or reliable, investments will be fair valued in good faith by the Committee, in accordance with the policies and procedures. Factors used in determining fair value vary by investment type and may include market or investment specific events, transaction data, estimated cash flows, and market observations of comparable investments. The frequency that the fair valuation procedures are used cannot be predicted and they may be utilized to a significant extent. The Committee manages the Fund's fair valuation practices and maintains the fair valuation policies and procedures. The Fund's investment adviser reports to the Board information regarding the fair valuation process and related material matters.
The Fund categorizes the inputs to valuation techniques used to value its investments into a disclosure hierarchy consisting of three levels as shown below:
Level 1 - unadjusted quoted prices in active markets for identical investments
Level 2 - other significant observable inputs (including quoted prices for similar investments, interest rates, prepayment speeds, etc.)
Level 3 - unobservable inputs (including the Fund's own assumptions based on the best information available)
Valuation techniques used to value the Fund's investments by major category are as follows:
Equity securities, including restricted securities, for which market quotations are readily available, are valued at the last reported sale price or official closing price as reported by a third party pricing service on the primary market or exchange on which they are traded and are categorized as Level 1 in the hierarchy. In the event there were no sales during the day or closing prices are not available, securities are valued at the last quoted bid price or may be valued using the last available price and are generally categorized as Level 2 in the hierarchy. For foreign equity securities, when market or security specific events arise, comparisons to the valuation of American Depositary Receipts (ADRs), futures contracts, ETFs and certain indexes as well as quoted prices for similar securities may be used and would be categorized as Level 2 in the hierarchy. For equity securities, including restricted securities, where observable inputs are limited, assumptions about market activity and risk are used and these securities may be categorized as Level 3 in the hierarchy.
Investments in open-end mutual funds, including the Fidelity Central Funds, are valued at their closing net asset value (NAV) each business day and are categorized as Level 1 in the hierarchy.
Changes in valuation techniques may result in transfers in or out of an assigned level within the disclosure hierarchy. The aggregate value of investments by input level as of December 31, 2022 is included at the end of the Fund's Schedule of Investments.
Foreign Currency. Certain Funds may use foreign currency contracts to facilitate transactions in foreign-denominated securities. Gains and losses from these transactions may arise from changes in the value of the foreign currency or if the counterparties do not perform under the contracts' terms.
Foreign-denominated assets, including investment securities, and liabilities are translated into U.S. dollars at the exchange rates at period end. Purchases and sales of investment securities, income and dividends received, and expenses denominated in foreign currencies are translated into U.S. dollars at the exchange rate in effect on the transaction date.
The effects of exchange rate fluctuations on investments are included with the net realized and unrealized gain (loss) on investment securities. Other foreign currency transactions resulting in realized and unrealized gain (loss) are disclosed separately.
Investment Transactions and Income. For financial reporting purposes, the Fund's investment holdings and NAV include trades executed through the end of the last business day of the period. The NAV per share for processing shareholder transactions is calculated as of the close of business of the New York Stock Exchange (NYSE), normally 4:00 p.m. Eastern time and includes trades executed through the end of the prior business day. Gains and losses on securities sold are determined on the basis of identified cost and include proceeds received from litigation. Commissions paid to certain brokers with whom the investment adviser, or its affiliates, places trades on behalf of a fund include an amount in addition to trade execution, which may be rebated back to a fund. Any such rebates are included in net realized gain (loss) on investments in the Statement of Operations. Dividend income is recorded on the ex-dividend date, except for certain dividends from foreign securities where the ex-dividend date may have passed, which are recorded as soon as the Fund is informed of the ex-dividend date. Non-cash dividends included in dividend income, if any, are recorded at the fair market value of the securities received. Income and capital gain distributions from Fidelity Central Funds, if any, are recorded on the ex-dividend date. Certain distributions received by the Fund represent a return of capital or capital gain. The Fund determines the components of these distributions subsequent to the ex-dividend date, based upon receipt of tax filings or other correspondence relating to the underlying investment. These distributions are recorded as a reduction of cost of investments and/or as a realized gain. Investment income is recorded net of foreign taxes withheld where recovery of such taxes is uncertain. Funds may file withholding tax reclaims in certain jurisdictions to recover a portion of amounts previously withheld. Any withholding tax reclaims income is included in the Statement of Operations in dividends. Any receivables for withholding tax reclaims are included in the Statement of Assets and Liabilities in dividends receivable.
Expenses. Expenses directly attributable to a fund are charged to that fund. Expenses attributable to more than one fund are allocated among the respective funds on the basis of relative net assets or other appropriate methods. Expenses included in the accompanying financial statements reflect the expenses of that fund and do not include any expenses associated with any underlying mutual funds or exchange-traded funds. Although not included in a fund's expenses, a fund indirectly bears its proportionate share of these expenses through the net asset value of each underlying mutual fund or exchange-traded fund. Expense estimates are accrued in the period to which they relate and adjustments are made when actual amounts are known.
Income Tax Information and Distributions to Shareholders. Each year, the Fund intends to qualify as a regulated investment company under Subchapter M of the Internal Revenue Code, including distributing substantially all of its taxable income and realized gains. As a result, no provision for U.S. Federal income taxes is required. The Fund files a U.S. federal tax return, in addition to state and local tax returns as required. The Fund's federal income tax returns are subject to examination by the Internal Revenue Service (IRS) for a period of three fiscal years after they are filed. State and local tax returns may be subject to examination for an additional fiscal year depending on the jurisdiction. Foreign taxes are provided for based on the Fund's understanding of the tax rules and rates that exist in the foreign markets in which it invests.
Distributions are declared and recorded on the ex-dividend date. Income and capital gain distributions are determined in accordance with income tax regulations, which may differ from GAAP.
Capital accounts within the financial statements are adjusted for permanent book-tax differences. These adjustments have no impact on net assets or the results of operations. Capital accounts are not adjusted for temporary book-tax differences which will reverse in a subsequent period.
Book-tax differences are primarily due to foreign currency transactions, certain corporate actions and losses deferred due to wash sales.
As of period end, the cost and unrealized appreciation (depreciation) in securities, and derivatives if applicable, for federal income tax purposes were as follows:
| Gross unrealized appreciation | $4,742,438,269 |
| Gross unrealized depreciation | (700,560,955) |
| Net unrealized appreciation (depreciation) | $4,041,877,314 |
| Tax cost | $9,723,870,746 |
Delayed Delivery Transactions and When-Issued Securities. During the period, certain Funds transacted in securities on a delayed delivery or when-issued basis. Payment and delivery may take place after the customary settlement period for that security. The price of the underlying securities and the date when the securities will be delivered and paid for are fixed at the time the transaction is negotiated. Securities purchased on a delayed delivery or when-issued basis are identified as such in the Schedule of Investments. Compensation for interest forgone in the purchase of a delayed delivery or when-issued debt security may be received. With respect to purchase commitments, each applicable Fund identifies securities as segregated in its records with a value at least equal to the amount of the commitment. Payables and receivables associated with the purchases and sales of delayed delivery securities having the same coupon, settlement date and broker are offset. Delayed delivery or when-issued securities that have been purchased from and sold to different brokers are reflected as both payables and receivables in the Statement of Assets and Liabilities under the caption "Delayed delivery", as applicable. Losses may arise due to changes in the value of the underlying securities or if the counterparty does not perform under the contract's terms, or if the issuer does not issue the securities due to political, economic, or other factors.
Restricted Securities (including Private Placements). Funds may invest in securities that are subject to legal or contractual restrictions on resale. These securities generally may be resold in transactions exempt from registration or to the public if the securities are registered. Disposal of these securities may involve time-consuming negotiations and expense, and prompt sale at an acceptable price may be difficult. Information regarding restricted securities held at period end is included at the end of the Schedule of Investments, if applicable.
4. Purchases and Sales of Investments.
Purchases and sales of securities, other than short-term securities and in-kind transactions, as applicable, are noted in the table below.
| | Purchases ($) | Sales ($) |
| Fidelity Series Large Cap Stock Fund | 1,014,312,125 | 660,692,842 |
5. Fees and Other Transactions with Affiliates.
Management Fee. Fidelity Management & Research Company LLC (the investment adviser) and its affiliates provide the Fund with investment management related services for which the Fund does not pay a management fee. Under the management contract, the investment adviser or an affiliate pays all ordinary operating expenses of the Fund, except custody fees, fees and expenses of the independent Trustees, and certain miscellaneous expenses such as proxy and shareholder meeting expenses.
Brokerage Commissions. A portion of portfolio transactions were placed with brokerage firms which are affiliates of the investment adviser. Brokerage commissions are included in net realized gain (loss) and change in net unrealized appreciation (depreciation) in the Statement of Operations. The commissions paid to these affiliated firms were as follows:
| | Amount |
| Fidelity Series Large Cap Stock Fund | $11,205 |
Interfund Trades. Funds may purchase from or sell securities to other Fidelity Funds under procedures adopted by the Board. The procedures have been designed to ensure these interfund trades are executed in accordance with Rule 17a-7 of the 1940 Act. Any interfund trades are included within the respective purchases and sales amounts shown in the Purchases and Sales of Investments note. Interfund trades during the period are noted in the table below.
| | Purchases ($) | Sales ($) | Realized Gain (Loss) ($) |
| Fidelity Series Large Cap Stock Fund | 129,488,175 | 45,213,870 | 9,066,681 |
6. Committed Line of Credit.
Certain Funds participate with other funds managed by the investment adviser or an affiliate in a $4.25 billion credit facility (the "line of credit") to be utilized for temporary or emergency purposes to fund shareholder redemptions or for other short-term liquidity purposes. The commitment fees on the pro-rata portion of the line of credit are borne by the investment adviser. During the period, there were no borrowings on this line of credit.
7. Security Lending.
Funds lend portfolio securities from time to time in order to earn additional income. Lending agents are used, including National Financial Services (NFS), an affiliate of the investment adviser. Pursuant to a securities lending agreement, NFS will receive a fee, which is capped at 9.9% of a fund's daily lending revenue, for its services as lending agent. A fund may lend securities to certain qualified borrowers, including NFS. On the settlement date of the loan, a fund receives collateral (in the form of U.S. Treasury obligations, letters of credit and/or cash) against the loaned securities and maintains collateral in an amount not less than 100% of the market value of the loaned securities during the period of the loan. The market value of the loaned securities is determined at the close of business of a fund and any additional required collateral is delivered to a fund on the next business day. A fund or borrower may terminate the loan at any time, and if the borrower defaults on its obligation to return the securities loaned because of insolvency or other reasons, a fund may apply collateral received from the borrower against the obligation. A fund may experience delays and costs in recovering the securities loaned. Any cash collateral received is invested in the Fidelity Securities Lending Cash Central Fund. Any loaned securities are identified as such in the Schedule of Investments, and the value of loaned securities and cash collateral at period end, as applicable, are presented in the Statement of Assets and Liabilities. Security lending income represents the income earned on investing cash collateral, less rebates paid to borrowers and any lending agent fees associated with the loan, plus any premium payments received for lending certain types of securities. Security lending income is presented in the Statement of Operations as a component of income from Fidelity Central Funds. Affiliated security lending activity, if any, was as follows:
| | Total Security Lending Fees Paid to NFS | Security Lending Income From Securities Loaned to NFS | Value of Securities Loaned to NFS at Period End |
| Fidelity Series Large Cap Stock Fund | $8,759 | $- | $- |
8. Expense Reductions.
Through arrangements with the Fund's custodian, credits realized as a result of certain uninvested cash balances were used to reduce the Fund's expenses by $540.
9. Other.
A fund's organizational documents provide former and current trustees and officers with a limited indemnification against liabilities arising in connection with the performance of their duties to the fund. In the normal course of business, a fund may also enter into contracts that provide general indemnifications. A fund's maximum exposure under these arrangements is unknown as this would be dependent on future claims that may be made against a fund. The risk of material loss from such claims is considered remote.
At the end of the period, mutual funds and accounts managed by the investment adviser or its affiliates were the owners of record of all of the outstanding shares of the Fund.
10. Risk and Uncertainties.
Many factors affect a fund's performance. Developments that disrupt global economies and financial markets, such as pandemics, epidemics, outbreaks of infectious diseases, war, terrorism, and environmental disasters, may significantly affect a fund's investment performance. The effects of these developments to a fund will be impacted by the types of securities in which a fund invests, the financial condition, industry, economic sector, and geographic location of an issuer, and a fund's level of investment in the securities of that issuer.
As a shareholder, you incur two types of costs: (1) transaction costs, which may include sales charges (loads) on purchase payments or redemption proceeds, as applicable and (2) ongoing costs, which generally include management fees, distribution and/or service (12b-1) fees and other Fund expenses. This Example is intended to help you understand your ongoing costs (in dollars) of investing in a fund and to compare these costs with the ongoing costs of investing in other mutual funds.
| The Example is based on an investment of $1,000 invested at the beginning of the period and held for the entire period (July 1, 2022 to December 31, 2022). |
Actual Expenses
The first line of the accompanying table provides information about actual account values and actual expenses. You may use the information in this line, together with the amount you invested, to estimate the expenses that you paid over the period. Simply divide your account value by $1,000.00 (for example, an $8,600 account value divided by $1,000.00 = 8.6), then multiply the result by the number in the first line for a class/Fund under the heading entitled "Expenses Paid During Period" to estimate the expenses you paid on your account during this period. If any fund is a shareholder of any underlying mutual funds or exchange-traded funds (ETFs) (the Underlying Funds), such fund indirectly bears its proportional share of the expenses of the Underlying Funds in addition to the direct expenses incurred presented in the table. These fees and expenses are not included in the annualized expense ratio used to calculate the expense estimate in the table below.
Hypothetical Example for Comparison Purposes
The second line of the accompanying table provides information about hypothetical account values and hypothetical expenses based on the actual expense ratio and an assumed rate of return of 5% per year before expenses, which is not the actual return. The hypothetical account values and expenses may not be used to estimate the actual ending account balance or expenses you paid for the period. You may use this information to compare the ongoing costs of investing in the Fund and other funds. To do so, compare this 5% hypothetical example with the 5% hypothetical examples that appear in the shareholder reports of the other funds. If any fund is a shareholder of any Underlying Funds, such fund indirectly bears its proportional share of the expenses of the Underlying Funds in addition to the direct expenses as presented in the table. These fees and expenses are not included in the annualized expense ratio used to calculate the expense estimate in the table below.
Please note that the expenses shown in the table are meant to highlight your ongoing costs only and do not reflect any transaction costs. Therefore, the second line of the table is useful in comparing ongoing costs only, and will not help you determine the relative total costs of owning different funds. In addition, if these transactional costs were included, your costs would have been higher.
| | | | | Annualized Expense Ratio- A | | Beginning Account Value July 1, 2022 | | Ending Account Value December 31, 2022 | | Expenses Paid During Period- C July 1, 2022 to December 31, 2022 |
| | | | | | | | | | |
| Fidelity® Series Large Cap Stock Fund | | | | -%- D | | | | | | |
| Actual | | | | | | $ 1,000 | | $ 1,076.00 | | $- E |
Hypothetical- B | | | | | | $ 1,000 | | $ 1,025.21 | | $- E |
| |
A Annualized expense ratio reflects expenses net of applicable fee waivers.
B 5% return per year before expenses
C Expenses are equal to the annualized expense ratio, multiplied by the average account value over the period, multiplied by 184/ 365 (to reflect the one-half year period). The fees and expenses of any Underlying Funds are not included in each annualized expense ratio.
D Amount represents less than .005%.
E Amount represents less than $.005.
1.951032.110
MHT-SANN-0323
Item 2.
Code of Ethics
Not applicable.
Item 3.
Audit Committee Financial Expert
Not applicable.
Item 4.
Principal Accountant Fees and Services
Not applicable.
Item 5.
Audit Committee of Listed Registrants
Not applicable.
Item 6.
Investments
(a)
Not applicable.
(b)
Not applicable
Item 7.
Disclosure of Proxy Voting Policies and Procedures for Closed-End Management Investment Companies
Not applicable.
Item 8.
Portfolio Managers of Closed-End Management Investment Companies
Not applicable.
Item 9.
Purchase of Equity Securities by Closed-End Management Investment Company and Affiliated Purchasers
Not applicable.
Item 10.
Submission of Matters to a Vote of Security Holders
There were no material changes to the procedures by which shareholders may recommend nominees to the Fidelity Hastings Street Trust’s Board of Trustees.
Item 11.
Controls and Procedures
(a)(i) The President and Treasurer and the Chief Financial Officer have concluded that the Fidelity Hastings Street Trust’s (the “Trust”) disclosure controls and procedures (as defined in Rule 30a-3(c) under the Investment Company Act) provide reasonable assurances that material information relating to the Trust is made known to them by the appropriate persons, based on their evaluation of these controls and procedures as of a date within 90 days of the filing date of this report.
(a)(ii) There was no change in the Trust’s internal control over financial reporting (as defined in Rule 30a-3(d) under the Investment Company Act) that occurred during the period covered by this report that has materially affected, or is reasonably likely to materially affect, the Trust’s internal control over financial reporting.
Item 12.
Disclosure of Securities Lending Activities for Closed-End Management
Investment Companies
Not applicable.
Item 13.
Exhibits
SIGNATURES
Pursuant to the requirements of the Securities Exchange Act of 1934 and the Investment Company Act of 1940, the registrant has duly caused this report to be signed on its behalf by the undersigned, thereunto duly authorized.
Fidelity Hastings Street Trust
| |
By: | /s/Stacie M. Smith |
| Stacie M. Smith |
| President and Treasurer |
|
|
Date: | February 21, 2023 |
Pursuant to the requirements of the Securities Exchange Act of 1934 and the Investment Company Act of 1940, this report has been signed below by the following persons on behalf of the registrant and in the capacities and on the dates indicated.
| |
By: | /s/Stacie M. Smith |
| Stacie M. Smith |
| President and Treasurer |
|
|
Date: | February 21, 2023 |
| |
By: | /s/John J. Burke III |
| John J. Burke III |
| Chief Financial Officer |
|
|
Date: | February 21, 2023 |