Fidelity® Series Emerging Markets Debt Fund
Fidelity® Series Emerging Markets Debt Local Currency Fund
Semi-Annual Report
June 30, 2022


Contents
To view a fund's proxy voting guidelines and proxy voting record for the 12-month period ended June 30, visit http://www.fidelity.com/proxyvotingresults or visit the Securities and Exchange Commission's (SEC) web site at http://www.sec.gov.
You may also call 1-800-544-8544 to request a free copy of the proxy voting guidelines.
Standard & Poor's, S&P and S&P 500 are registered service marks of The McGraw-Hill Companies, Inc. and have been licensed for use by Fidelity Distributors Corporation.
Other third-party marks appearing herein are the property of their respective owners.
All other marks appearing herein are registered or unregistered trademarks or service marks of FMR LLC or an affiliated company. © 2022 FMR LLC. All rights reserved.
This report and the financial statements contained herein are submitted for the general information of the shareholders of the Funds. This report is not authorized for distribution to prospective investors in the Funds unless preceded or accompanied by an effective prospectus.
A fund files its complete schedule of portfolio holdings with the SEC for the first and third quarters of each fiscal year on Form N-PORT. Forms N-PORT are available on the SEC’s web site at http://www.sec.gov. A fund's Forms N-PORT may be reviewed and copied at the SEC’s Public Reference Room in Washington, DC. Information regarding the operation of the SEC's Public Reference Room may be obtained by calling 1-800-SEC-0330.
For a complete list of a fund's portfolio holdings, view the most recent holdings listing, semiannual report, or annual report on Fidelity's web site at http://www.fidelity.com, http://www.institutional.fidelity.com, or http://www.401k.com, as applicable.
NOT FDIC INSURED •MAY LOSE VALUE •NO BANK GUARANTEE
Neither the Funds nor Fidelity Distributors Corporation is a bank.
Note to Shareholders:
Early in 2020, the outbreak and spread of COVID-19 emerged as a public health emergency that had a major influence on financial markets, primarily based on its impact on the global economy and corporate earnings. On March 11, 2020, the World Health Organization declared the COVID-19 outbreak a pandemic, citing sustained risk of further global spread. The pandemic prompted a number of measures to limit the spread of COVID-19, including travel and border restrictions, quarantines, and restrictions on large gatherings. In turn, these resulted in lower consumer activity, diminished demand for a wide range of products and services, disruption in manufacturing and supply chains, and – given the wide variability in outcomes regarding the outbreak – significant market uncertainty and volatility. To help stem the turmoil, the U.S. government took unprecedented action – in concert with the U.S. Federal Reserve and central banks around the world – to help support consumers, businesses, and the broader economy, and to limit disruption to the financial system.
In general, the overall impact of the pandemic lessened in 2021, amid a resilient economy and widespread distribution of three COVID-19 vaccines granted emergency use authorization from the U.S. Food and Drug Administration (FDA) early in the year. Still, the situation remains dynamic, and the extent and duration of its influence on financial markets and the economy is highly uncertain, due in part to a recent spike in cases based on highly contagious variants of the coronavirus.
Extreme events such as the COVID-19 crisis are exogenous shocks that can have significant adverse effects on mutual funds and their investments. Although multiple asset classes may be affected by market disruption, the duration and impact may not be the same for all types of assets. Fidelity is committed to helping you stay informed amid news about COVID-19 and during increased market volatility, and we continue to take extra steps to be responsive to customer needs. We encourage you to visit us online, where we offer ongoing updates, commentary, and analysis on the markets and our funds.
Fidelity® Series Emerging Markets Debt Fund
Investment Summary (Unaudited)
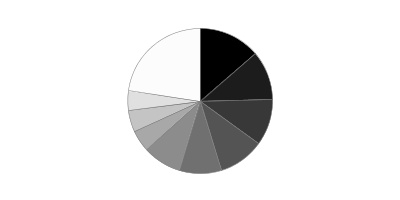
Geographic Diversification (% of fund's net assets)
| As of June 30, 2022 |
| | Mexico | 9.5% |
| | United States of America* | 9.0% |
| | Indonesia | 4.9% |
| | Qatar | 4.6% |
| | Cayman Islands | 4.3% |
| | Turkey | 4.2% |
| | Saudi Arabia | 3.5% |
| | Argentina | 3.1% |
| | Egypt | 2.7% |
| | Other | 54.2% |

* Includes Short-Term investments and Net Other Assets (Liabilities).
Percentages are based on country or territory of incorporation and are adjusted for the effect of futures contracts, if applicable.
Top Holdings as of June 30, 2022
| (by issuer, excluding cash equivalents) | % of fund's net assets |
| Petroleos Mexicanos | 6.4 |
| Turkish Republic | 4.2 |
| Indonesian Republic | 4.0 |
| State of Qatar | 3.2 |
| Arab Republic of Egypt | 2.7 |
| Dominican Republic | 2.6 |
| Sultanate of Oman | 2.5 |
| Brazilian Federative Republic | 2.1 |
| Saudi Arabian Oil Co. | 2.1 |
| Colombian Republic | 2.0 |
| | 31.8 |
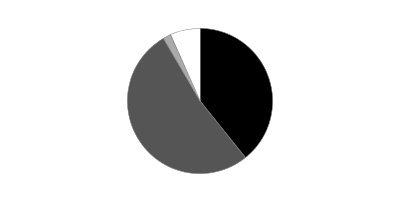
Asset Allocation (% of fund's net assets)
| As of June 30, 2022 |
| | Corporate Bonds | 39.3% |
| | Government Obligations | 52.3% |
| | Preferred Securities | 1.8% |
| | Short-Term Investments and Net Other Assets (Liabilities) | 6.6% |
Fidelity® Series Emerging Markets Debt Fund
Schedule of Investments June 30, 2022 (Unaudited)
Showing Percentage of Net Assets
| Nonconvertible Bonds - 39.3% | | | |
| | | Principal Amount(a) | Value |
| Argentina - 0.6% | | | |
| YPF SA: | | | |
| 8.5% 3/23/25 (b) | | $2,660,250 | $2,057,205 |
| 8.75% 4/4/24 (b) | | 5,787,600 | 4,694,467 |
|
| TOTAL ARGENTINA | | | 6,751,672 |
|
| Azerbaijan - 1.1% | | | |
| Southern Gas Corridor CJSC 6.875% 3/24/26 (b) | | 8,201,000 | 8,047,231 |
| State Oil Co. of Azerbaijan Republic: | | | |
| 4.75% 3/13/23 (Reg. S) | | 1,655,000 | 1,648,070 |
| 6.95% 3/18/30 (Reg. S) | | 3,015,000 | 2,852,341 |
|
| TOTAL AZERBAIJAN | | | 12,547,642 |
|
| Bahrain - 1.1% | | | |
| The Oil and Gas Holding Co.: | | | |
| 7.5% 10/25/27 (b) | | 5,624,000 | 5,661,962 |
| 7.625% 11/7/24 (b) | | 5,235,000 | 5,384,852 |
| 8.375% 11/7/28 (b) | | 1,065,000 | 1,123,775 |
|
| TOTAL BAHRAIN | | | 12,170,589 |
|
| Bailiwick of Jersey - 0.3% | | | |
| Galaxy Pipeline Assets BidCo Ltd. 2.625% 3/31/36 (b) | | 4,480,000 | 3,621,240 |
| Bermuda - 0.9% | | | |
| GeoPark Ltd.: | | | |
| 5.5% 1/17/27 (b) | | 1,975,000 | 1,642,459 |
| 6.5% 9/21/24 (b) | | 1,405,000 | 1,425,460 |
| Investment Energy Resources Ltd. 6.25% 4/26/29 (b) | | 2,970,000 | 2,518,560 |
| Qtel International Finance Ltd. 2.625% 4/8/31 (b) | | 2,755,000 | 2,383,075 |
| Tengizchevroil Finance Co. International Ltd. 3.25% 8/15/30 (b) | | 3,800,000 | 2,802,500 |
|
| TOTAL BERMUDA | | | 10,772,054 |
|
| Brazil - 0.3% | | | |
| Natura Cosmeticos SA 4.125% 5/3/28 (b) | | 4,090,000 | 3,374,659 |
| British Virgin Islands - 2.1% | | | |
| 1MDB Global Investments Ltd. 4.4% 3/9/23 | | 21,100,000 | 20,457,769 |
| ENN Clean Energy International Investment Ltd. 3.375% 5/12/26 (b) | | 3,775,000 | 3,423,019 |
|
| TOTAL BRITISH VIRGIN ISLANDS | | | 23,880,788 |
|
| Canada - 0.3% | | | |
| Gcm Mining Corp. 6.875% 8/9/26 (b) | | 3,895,000 | 3,033,231 |
| Cayman Islands - 3.2% | | | |
| Baidu, Inc.: | | | |
| 1.72% 4/9/26 | | 2,540,000 | 2,320,328 |
| 2.375% 10/9/30 | | 1,395,000 | 1,175,218 |
| DP World Crescent Ltd.: | | | |
| 3.7495% 1/30/30 (b) | | 1,075,000 | 986,514 |
| 3.875% 7/18/29 (Reg. S) | | 3,090,000 | 2,858,250 |
| ENN Energy Holdings Ltd. 4.625% 5/17/27 (b) | | 3,430,000 | 3,451,266 |
| IHS Holding Ltd. 5.625% 11/29/26 (b) | | 3,475,000 | 2,846,894 |
| Lamar Funding Ltd. 3.958% 5/7/25 (b) | | 1,015,000 | 963,806 |
| Meituan: | | | |
| 2.125% 10/28/25 (b) | | 4,740,000 | 4,268,607 |
| 3.05% 10/28/30 (b) | | 1,995,000 | 1,483,103 |
| NagaCorp Ltd. 7.95% 7/6/24 (Reg. S) | | 4,420,000 | 3,963,635 |
| QNB Finance Ltd. 2.625% 5/12/25 (Reg. S) | | 3,305,000 | 3,156,606 |
| SA Global Sukuk Ltd. 1.602% 6/17/26 (b) | | 4,445,000 | 4,058,285 |
| Sable International Finance Ltd. 5.75% 9/7/27 (b) | | 2,287,000 | 2,086,430 |
| Sparc Em Spc 0% 12/5/22 (b) | | 57,671 | 56,727 |
| Termocandelaria Power Ltd. 7.875% 1/30/29 (b) | | 3,336,250 | 2,986,569 |
|
| TOTAL CAYMAN ISLANDS | | | 36,662,238 |
|
| Chile - 0.7% | | | |
| Corporacion Nacional del Cobre de Chile (Codelco): | | | |
| 3.15% 1/14/30 (b) | | 1,645,000 | 1,437,113 |
| 3.15% 1/15/51 (b) | | 1,865,000 | 1,279,856 |
| 3.7% 1/30/50 (b) | | 2,130,000 | 1,587,915 |
| VTR Comunicaciones SpA: | | | |
| 4.375% 4/15/29 (b) | | 933,000 | 632,108 |
| 5.125% 1/15/28 (b) | | 3,749,000 | 2,778,478 |
|
| TOTAL CHILE | | | 7,715,470 |
|
| Colombia - 0.3% | | | |
| Oleoducto Central SA 4% 7/14/27 (b) | | 4,925,000 | 4,074,999 |
| Georgia - 0.4% | | | |
| Georgia Bank Joint Stock Co. 6% 7/26/23 (b) | | 4,515,000 | 4,408,898 |
| Guatemala - 0.2% | | | |
| CT Trust 5.125% 2/3/32 (b) | | 3,455,000 | 2,768,319 |
| Hong Kong - 0.3% | | | |
| Lenovo Group Ltd. 3.421% 11/2/30 (b) | | 3,615,000 | 3,082,465 |
| India - 0.3% | | | |
| JSW Steel Ltd. 3.95% 4/5/27 (b) | | 2,710,000 | 2,174,775 |
| Shriram Transport Finance Co. Ltd. 5.1% 7/16/23 (b) | | 1,900,000 | 1,824,000 |
|
| TOTAL INDIA | | | 3,998,775 |
|
| Indonesia - 0.9% | | | |
| PT Adaro Indonesia 4.25% 10/31/24 (b) | | 3,515,000 | 3,321,236 |
| PT Freeport Indonesia: | | | |
| 4.763% 4/14/27 (b) | | 1,225,000 | 1,172,938 |
| 5.315% 4/14/32 (b) | | 2,085,000 | 1,892,138 |
| 6.2% 4/14/52 (b) | | 1,420,000 | 1,221,200 |
| PT Indonesia Asahan Aluminium Tbk: | | | |
| 4.75% 5/15/25 (b) | | 670,000 | 664,211 |
| 5.45% 5/15/30 (b) | | 2,205,000 | 2,059,332 |
|
| TOTAL INDONESIA | | | 10,331,055 |
|
| Ireland - 0.5% | | | |
| C&W Senior Financing Designated Activity Co. 6.875% 9/15/27 (b) | | 2,060,000 | 1,848,850 |
| LCPR Senior Secured Financing DAC 5.125% 7/15/29 (b) | | 3,810,000 | 3,181,350 |
| SUEK Securities DAC 3.375% 9/15/26 (b)(c) | | 5,220,000 | 261,000 |
|
| TOTAL IRELAND | | | 5,291,200 |
|
| Israel - 0.7% | | | |
| Energean Israel Finance Ltd. 4.875% 3/30/26 (Reg. S) (b) | | 3,470,000 | 3,062,622 |
| Leviathan Bond Ltd.: | | | |
| 5.75% 6/30/23 (Reg. S) (b) | | 2,220,000 | 2,187,419 |
| 6.125% 6/30/25 (Reg. S) (b) | | 3,000,000 | 2,816,100 |
|
| TOTAL ISRAEL | | | 8,066,141 |
|
| Kazakhstan - 0.2% | | | |
| KazMunaiGaz National Co.: | | | |
| 3.5% 4/14/33 (b) | | 2,010,000 | 1,439,160 |
| 5.75% 4/19/47 (b) | | 1,010,000 | 767,600 |
|
| TOTAL KAZAKHSTAN | | | 2,206,760 |
|
| Luxembourg - 1.9% | | | |
| Adecoagro SA 6% 9/21/27 (b) | | 4,185,000 | 3,822,213 |
| B2W Digital Lux SARL 4.375% 12/20/30 (b) | | 4,480,000 | 3,393,040 |
| EIG Pearl Holdings SARL 3.545% 8/31/36 (b) | | 4,680,000 | 4,013,100 |
| JBS Finance Luxembourg SARL 2.5% 1/15/27 (b) | | 1,565,000 | 1,358,013 |
| MC Brazil Downstream Trading SARL 7.25% 6/30/31 (b) | | 3,735,000 | 2,988,000 |
| Millicom International Cellular SA 4.5% 4/27/31 (b) | | 2,770,000 | 2,049,800 |
| Usiminas International SARL 5.875% 7/18/26 (b) | | 3,475,000 | 3,407,238 |
| VM Holding SA 6.5% 1/18/28 (b) | | 1,580,000 | 1,509,196 |
|
| TOTAL LUXEMBOURG | | | 22,540,600 |
|
| Malaysia - 0.7% | | | |
| GENM Capital Labuan Ltd. 3.882% 4/19/31 (b) | | 3,610,000 | 2,884,164 |
| MISC Capital Two (Labuan) Ltd.: | | | |
| 3.625% 4/6/25 (b) | | 945,000 | 917,916 |
| 3.75% 4/6/27 (b) | | 3,090,000 | 2,905,960 |
| Petronas Capital Ltd. 3.5% 4/21/30 (b) | | 1,730,000 | 1,634,677 |
|
| TOTAL MALAYSIA | | | 8,342,717 |
|
| Mauritius - 0.9% | | | |
| AXIAN Telecom 7.375% 2/16/27 (b) | | 2,870,000 | 2,669,100 |
| CA Magnum Holdings 5.375% (b)(d) | | 3,545,000 | 3,066,425 |
| HTA Group Ltd. 7% 12/18/25 (b) | | 3,305,000 | 2,756,163 |
| MTN (Mauritius) Investments Ltd. 4.755% 11/11/24 (b) | | 1,860,000 | 1,805,130 |
|
| TOTAL MAURITIUS | | | 10,296,818 |
|
| Mexico - 7.2% | | | |
| Axtel S.A.B. de CV 6.375% 11/14/24 (b) | | 130,000 | 114,465 |
| CEMEX S.A.B. de CV 5.45% 11/19/29 (b) | | 1,420,000 | 1,278,000 |
| Comision Federal de Electricid: | | | |
| 3.348% 2/9/31 (b) | | 735,000 | 562,643 |
| 4.688% 5/15/29 (b) | | 3,085,000 | 2,761,653 |
| Petroleos Mexicanos: | | | |
| 3.5% 1/30/23 | | 4,187,000 | 4,108,494 |
| 4.625% 9/21/23 | | 800,000 | 780,320 |
| 4.875% 1/18/24 | | 10,977,000 | 10,680,621 |
| 6.5% 3/13/27 | | 1,725,000 | 1,489,106 |
| 6.5% 6/2/41 | | 2,587,000 | 1,611,701 |
| 6.625% 6/15/35 | | 18,441,000 | 12,599,813 |
| 6.7% 2/16/32 | | 6,367,000 | 4,823,003 |
| 6.75% 9/21/47 | | 10,407,000 | 6,374,288 |
| 6.875% 10/16/25 | | 2,295,000 | 2,134,350 |
| 6.95% 1/28/60 | | 9,575,000 | 5,893,413 |
| 7.69% 1/23/50 | | 34,193,000 | 22,823,808 |
| 8.625% 12/1/23 (e) | | 320,000 | 317,000 |
| TV Azteca SA de CV 8.25% 8/9/24 (Reg. S) (c) | | 10,535,000 | 5,056,800 |
|
| TOTAL MEXICO | | | 83,409,478 |
|
| Mongolia - 0.1% | | | |
| Development Bank of Mongolia 7.25% 10/23/23 (b) | | 720,000 | 695,160 |
| Morocco - 0.3% | | | |
| OCP SA: | | | |
| 3.75% 6/23/31 (b) | | 3,150,000 | 2,378,250 |
| 4.5% 10/22/25 (b) | | 1,360,000 | 1,336,455 |
|
| TOTAL MOROCCO | | | 3,714,705 |
|
| Multi-National - 0.2% | | | |
| GEMS MENASA Cayman Ltd. 7.125% 7/31/26 (b) | | 2,095,000 | 1,965,765 |
| Netherlands - 1.9% | | | |
| Embraer Netherlands Finance BV 5.05% 6/15/25 | | 3,625,000 | 3,501,070 |
| Equate Petrochemical BV 4.25% 11/3/26 (b) | | 1,930,000 | 1,891,400 |
| IHS Netherlands Holdco BV 8% 9/18/27 (b) | | 2,975,000 | 2,587,878 |
| Kazakhstan Temir Zholy Finance BV 6.95% 7/10/42 (b) | | 710,000 | 636,693 |
| Metinvest BV 7.75% 4/23/23 (b) | | 1,369,000 | 800,865 |
| Mong Duong Finance Holdings BV 5.125% 5/7/29 (b) | | 2,770,000 | 2,228,638 |
| Nostrum Oil & Gas Finance BV 8% 12/31/49 (b)(c) | | 15,783,000 | 3,874,727 |
| Prosus NV: | | | |
| 3.061% 7/13/31 (b) | | 760,000 | 558,980 |
| 3.832% 2/8/51 (b) | | 1,590,000 | 961,950 |
| 4.027% 8/3/50 (b) | | 650,000 | 405,763 |
| 4.193% 1/19/32 (b) | | 3,505,000 | 2,821,525 |
| VimpelCom Holdings BV 7.25% 4/26/23 (b) | | 1,375,000 | 1,161,016 |
|
| TOTAL NETHERLANDS | | | 21,430,505 |
|
| Nigeria - 0.2% | | | |
| Access Bank PLC 6.125% 9/21/26 (b) | | 3,475,000 | 2,796,941 |
| Panama - 0.5% | | | |
| Aeropuerto Internacional de Tocumen SA: | | | |
| 4% 8/11/41 (b) | | 2,915,000 | 2,368,073 |
| 5.125% 8/11/61 (b) | | 1,230,000 | 968,087 |
| Cable Onda SA 4.5% 1/30/30 (b) | | 3,385,000 | 2,792,625 |
|
| TOTAL PANAMA | | | 6,128,785 |
|
| Paraguay - 0.3% | | | |
| Telefonica Celular del Paraguay SA 5.875% 4/15/27 (b) | | 3,800,000 | 3,429,500 |
| Peru - 0.2% | | | |
| Camposol SA 6% 2/3/27 (b) | | 855,000 | 718,360 |
| Compania de Minas Buenaventura SA 5.5% 7/23/26 (b) | | 1,350,000 | 1,217,430 |
|
| TOTAL PERU | | | 1,935,790 |
|
| Qatar - 1.4% | | | |
| Qatar Petroleum: | | | |
| 1.375% 9/12/26 (b) | | 3,255,000 | 2,938,451 |
| 2.25% 7/12/31 (b) | | 6,745,000 | 5,766,975 |
| 3.3% 7/12/51 (b) | | 9,800,000 | 7,584,588 |
|
| TOTAL QATAR | | | 16,290,014 |
|
| Saudi Arabia - 2.1% | | | |
| Saudi Arabian Oil Co.: | | | |
| 1.625% 11/24/25 (b) | | 3,815,000 | 3,528,398 |
| 3.5% 4/16/29 (b) | | 16,814,000 | 16,036,353 |
| 4.25% 4/16/39 (b) | | 2,385,000 | 2,202,548 |
| 4.375% 4/16/49 (b) | | 2,321,000 | 2,058,147 |
|
| TOTAL SAUDI ARABIA | | | 23,825,446 |
|
| Singapore - 0.6% | | | |
| Indika Energy Capital IV Pte Ltd. 8.25% 10/22/25 (b) | | 2,060,000 | 1,993,050 |
| Medco Bell Pte Ltd. 6.375% 1/30/27 (b) | | 1,620,000 | 1,368,900 |
| Medco Laurel Tree Pte Ltd. 6.95% 11/12/28 (b) | | 3,730,000 | 3,095,900 |
|
| TOTAL SINGAPORE | | | 6,457,850 |
|
| South Africa - 1.4% | | | |
| Eskom Holdings SOC Ltd.: | | | |
| 6.35% 8/10/28 (b) | | 1,925,000 | 1,720,469 |
| 6.75% 8/6/23 (b) | | 15,782,000 | 14,349,784 |
| 7.125% 2/11/25 (b) | | 565,000 | 474,706 |
|
| TOTAL SOUTH AFRICA | | | 16,544,959 |
|
| Spain - 0.3% | | | |
| EnfraGen Energia Sur SA 5.375% 12/30/30 (b) | | 5,545,000 | 3,742,875 |
| United Arab Emirates - 0.0% | | | |
| Abu Dhabi National Energy Co. PJSC 4% 10/3/49 (b) | | 670,000 | 599,985 |
| United Kingdom - 1.9% | | | |
| Antofagasta PLC: | | | |
| 2.375% 10/14/30 (b) | | 3,865,000 | 3,000,206 |
| 5.625% 5/13/32 (b) | | 1,390,000 | 1,334,400 |
| Biz Finance PLC 9.75% 1/22/25 (b) | | 1,761,000 | 845,280 |
| Endeavour Mining PLC 5% 10/14/26 (b) | | 2,015,000 | 1,615,778 |
| Liquid Telecommunications Financing PLC 5.5% 9/4/26 (b) | | 3,665,000 | 3,206,875 |
| NAK Naftogaz Ukraine: | | | |
| 7.375% 7/19/22 (Reg. S) | | 3,687,000 | 2,783,685 |
| 7.625% 11/8/26 (b) | | 1,235,000 | 372,661 |
| Oschadbank Via SSB #1 PLC 9.375% 3/10/23 (b) | | 403,600 | 221,980 |
| The Bidvest Group UK PLC 3.625% 9/23/26 (b) | | 1,985,000 | 1,742,210 |
| Tullow Oil PLC: | | | |
| 7% 3/1/25 (b) | | 1,060,000 | 874,500 |
| 10.25% 5/15/26 (b) | | 6,070,000 | 5,796,850 |
|
| TOTAL UNITED KINGDOM | | | 21,794,425 |
|
| United States of America - 2.4% | | | |
| Azul Investments LLP: | | | |
| 5.875% 10/26/24 (b) | | 4,565,000 | 3,451,711 |
| 7.25% 6/15/26 (b) | | 1,600,000 | 1,111,300 |
| DAE Funding LLC 1.55% 8/1/24 (b) | | 3,570,000 | 3,329,025 |
| Kosmos Energy Ltd. 7.125% 4/4/26 (b) | | 9,060,000 | 7,626,255 |
| NBM U.S. Holdings, Inc. 6.625% 8/6/29 (b) | | 4,355,000 | 4,176,173 |
| Sasol Financing U.S.A. LLC: | | | |
| 4.375% 9/18/26 | | 3,760,000 | 3,276,765 |
| 5.875% 3/27/24 | | 1,705,000 | 1,664,506 |
| Stillwater Mining Co. 4% 11/16/26 (b) | | 4,430,000 | 3,676,900 |
|
| TOTAL UNITED STATES OF AMERICA | | | 28,312,635 |
|
| Uzbekistan - 0.2% | | | |
| National Bank of Uzbekistan 4.85% 10/21/25 (Reg. S) | | 1,725,000 | 1,577,620 |
| Uzbekneftegaz JSC 4.75% 11/16/28 (b) | | 1,145,000 | 894,531 |
|
| TOTAL UZBEKISTAN | | | 2,472,151 |
|
| Venezuela - 0.2% | | | |
| Petroleos de Venezuela SA: | | | |
| 5.375% 4/12/27 (c) | | 6,115,000 | 336,325 |
| 5.5% 4/12/37 (c) | | 3,475,000 | 191,125 |
| 6% 5/16/24 (b)(c) | | 8,980,000 | 493,900 |
| 6% 11/15/26 (b)(c) | | 15,840,000 | 871,200 |
| 9.75% 5/17/35 (b)(c) | | 12,585,000 | 692,175 |
| 12.75% 12/31/49 (b)(c) | | 3,065,000 | 168,575 |
|
| TOTAL VENEZUELA | | | 2,753,300 |
|
| TOTAL NONCONVERTIBLE BONDS | | | |
| (Cost $571,135,216) | | | 454,238,599 |
|
| Government Obligations - 52.3% | | | |
| Angola - 1.3% | | | |
| Angola Republic: | | | |
| 8.25% 5/9/28 (b) | | 4,415,000 | 3,664,450 |
| 8.75% 4/14/32 (b) | | 2,575,000 | 2,060,000 |
| 9.375% 5/8/48 (b) | | 2,020,000 | 1,474,600 |
| 9.5% 11/12/25 (b) | | 8,285,000 | 7,611,844 |
|
| TOTAL ANGOLA | | | 14,810,894 |
|
| Argentina - 2.5% | | | |
| Argentine Republic: | | | |
| 0.5% 7/9/30 (f) | | 52,879,632 | 11,554,200 |
| 1% 7/9/29 | | 5,953,783 | 1,390,208 |
| 1.125% 7/9/35 (f) | | 17,033,027 | 3,559,903 |
| 2% 1/9/38 (f) | | 10,211,997 | 2,961,479 |
| Buenos Aires Province 3.9% 9/1/37 (b)(f) | | 3,235,000 | 986,271 |
| Province of Santa Fe 7% 3/23/23 (b) | | 2,112,500 | 1,964,625 |
| Provincia de Cordoba: | | | |
| 6.875% 12/10/25 (b) | | 6,475,408 | 4,934,666 |
| 6.99% 6/1/27 (b) | | 3,097,152 | 1,998,244 |
|
| TOTAL ARGENTINA | | | 29,349,596 |
|
| Armenia - 0.1% | | | |
| Republic of Armenia 7.15% 3/26/25 (b) | | 1,610,000 | 1,584,139 |
| Bahrain - 0.1% | | | |
| Bahrain Kingdom 5.625% 5/18/34 (b) | | 1,790,000 | 1,463,101 |
| Barbados - 0.5% | | | |
| Barbados Government 6.5% 10/1/29 (b) | | 5,915,000 | 5,673,964 |
| Benin - 0.3% | | | |
| Republic of Benin: | | | |
| 4.875% 1/19/32 (b) | EUR | 3,090,000 | 2,306,788 |
| 5.75% 3/26/26 (b) | EUR | 1,530,000 | 1,569,092 |
|
| TOTAL BENIN | | | 3,875,880 |
|
| Bermuda - 0.4% | | | |
| Bermuda Government: | | | |
| 2.375% 8/20/30 (b) | | 525,000 | 438,473 |
| 3.375% 8/20/50 (b) | | 965,000 | 701,917 |
| 3.717% 1/25/27 (b) | | 620,000 | 598,029 |
| 4.75% 2/15/29 (b) | | 2,270,000 | 2,267,588 |
|
| TOTAL BERMUDA | | | 4,006,007 |
|
| Brazil - 2.1% | | | |
| Brazilian Federative Republic: | | | |
| 2.875% 6/6/25 | | 1,525,000 | 1,438,075 |
| 3.875% 6/12/30 | | 9,550,000 | 8,002,900 |
| 5.625% 1/7/41 | | 4,146,000 | 3,337,012 |
| 5.625% 2/21/47 | | 2,183,000 | 1,692,234 |
| 7.125% 1/20/37 | | 2,080,000 | 2,068,690 |
| 8.25% 1/20/34 | | 6,754,000 | 7,320,914 |
|
| TOTAL BRAZIL | | | 23,859,825 |
|
| Cameroon - 0.2% | | | |
| Cameroon Republic 5.95% 7/7/32 (b) | EUR | 3,570,000 | 2,763,330 |
| Chile - 1.0% | | | |
| Chilean Republic: | | | |
| 2.45% 1/31/31 | | 7,745,000 | 6,601,644 |
| 2.75% 1/31/27 | | 1,710,000 | 1,598,850 |
| 3.5% 1/31/34 | | 1,775,000 | 1,576,200 |
| 4% 1/31/52 | | 985,000 | 816,073 |
| 4.34% 3/7/42 | | 1,410,000 | 1,258,425 |
|
| TOTAL CHILE | | | 11,851,192 |
|
| China - 0.2% | | | |
| Peoples Republic of China 1.2% 10/21/30 (b) | | 2,535,000 | 2,178,706 |
| Colombia - 2.0% | | | |
| Colombian Republic: | | | |
| 3% 1/30/30 | | 8,280,000 | 6,309,878 |
| 3.125% 4/15/31 | | 4,300,000 | 3,189,525 |
| 3.25% 4/22/32 | | 2,410,000 | 1,748,455 |
| 3.875% 2/15/61 | | 1,490,000 | 856,098 |
| 4.125% 5/15/51 | | 1,315,000 | 789,658 |
| 4.5% 3/15/29 | | 2,065,000 | 1,784,031 |
| 5% 6/15/45 | | 7,235,000 | 4,842,024 |
| 5.2% 5/15/49 | | 3,225,000 | 2,191,589 |
| 6.125% 1/18/41 | | 1,475,000 | 1,155,847 |
| 7.375% 9/18/37 | | 845,000 | 780,463 |
|
| TOTAL COLOMBIA | | | 23,647,568 |
|
| Costa Rica - 0.4% | | | |
| Costa Rican Republic: | | | |
| 5.625% 4/30/43 (b) | | 1,995,000 | 1,501,612 |
| 6.125% 2/19/31 (b) | | 2,535,000 | 2,358,025 |
| 7% 4/4/44 (b) | | 305,000 | 261,881 |
|
| TOTAL COSTA RICA | | | 4,121,518 |
|
| Dominican Republic - 2.6% | | | |
| Dominican Republic: | | | |
| 4.875% 9/23/32 (b) | | 6,360,000 | 4,888,455 |
| 5.875% 1/30/60 (b) | | 3,525,000 | 2,405,372 |
| 5.95% 1/25/27 (b) | | 4,186,000 | 3,997,107 |
| 6% 7/19/28 (b) | | 2,999,000 | 2,779,323 |
| 6.4% 6/5/49 (b) | | 1,662,000 | 1,235,905 |
| 6.5% 2/15/48 (b) | | 1,845,000 | 1,386,402 |
| 6.85% 1/27/45 (b) | | 4,046,000 | 3,216,064 |
| 6.875% 1/29/26 (b) | | 4,946,000 | 5,038,119 |
| 7.45% 4/30/44 (b) | | 6,031,000 | 5,151,982 |
|
| TOTAL DOMINICAN REPUBLIC | | | 30,098,729 |
|
| Ecuador - 1.0% | | | |
| Ecuador Republic: | | | |
| 1% 7/31/35 (b)(f) | | 8,980,000 | 4,435,559 |
| 5% 7/31/30 (b)(f) | | 11,260,000 | 7,373,893 |
|
| TOTAL ECUADOR | | | 11,809,452 |
|
| Egypt - 2.7% | | | |
| Arab Republic of Egypt: | | | |
| 5.8% 9/30/27 (b) | | 3,530,000 | 2,479,825 |
| 5.875% 2/16/31 (b) | | 2,625,000 | 1,614,375 |
| 7.0529% 1/15/32 (b) | | 830,000 | 531,200 |
| 7.5% 1/31/27 (b) | | 15,486,000 | 12,040,365 |
| 7.6003% 3/1/29 (b) | | 9,841,000 | 7,159,328 |
| 7.903% 2/21/48 (b) | | 2,940,000 | 1,661,100 |
| 8.5% 1/31/47 (b) | | 7,939,000 | 4,664,163 |
| 8.7002% 3/1/49 (b) | | 2,010,000 | 1,185,900 |
|
| TOTAL EGYPT | | | 31,336,256 |
|
| El Salvador - 0.4% | | | |
| El Salvador Republic: | | | |
| 6.375% 1/18/27 (b) | | 435,000 | 145,807 |
| 7.1246% 1/20/50 (b) | | 3,292,000 | 999,534 |
| 7.625% 2/1/41 (b) | | 1,035,000 | 321,044 |
| 7.65% 6/15/35 (b) | | 1,185,000 | 376,089 |
| 7.75% 1/24/23 (b) | | 3,280,000 | 2,305,840 |
|
| TOTAL EL SALVADOR | | | 4,148,314 |
|
| Gabon - 0.2% | | | |
| Gabonese Republic 7% 11/24/31 (b) | | 2,970,000 | 2,145,825 |
| Georgia - 0.2% | | | |
| Georgia Republic 2.75% 4/22/26 (b) | | 2,915,000 | 2,416,353 |
| Ghana - 0.5% | | | |
| Ghana Republic: | | | |
| 7.75% 4/7/29 (b) | | 3,695,000 | 1,819,326 |
| 8.125% 1/18/26 (b) | | 3,118,076 | 2,236,830 |
| 8.627% 6/16/49 (b) | | 165,000 | 77,138 |
| 10.75% 10/14/30 (b) | | 2,125,000 | 1,806,250 |
|
| TOTAL GHANA | | | 5,939,544 |
|
| Guatemala - 0.3% | | | |
| Guatemalan Republic: | | | |
| 4.9% 6/1/30 (b) | | 485,000 | 442,199 |
| 5.375% 4/24/32 (b) | | 2,015,000 | 1,855,437 |
| 6.125% 6/1/50 (b) | | 1,355,000 | 1,136,337 |
|
| TOTAL GUATEMALA | | | 3,433,973 |
|
| Hungary - 0.4% | | | |
| Hungarian Republic: | | | |
| 2.125% 9/22/31 (b) | | 1,515,000 | 1,169,675 |
| 5.25% 6/16/29 (b) | | 1,585,000 | 1,579,226 |
| 5.5% 6/16/34 (b) | | 1,650,000 | 1,600,728 |
|
| TOTAL HUNGARY | | | 4,349,629 |
|
| Indonesia - 4.0% | | | |
| Indonesian Republic: | | | |
| 3.85% 10/15/30 | | 2,650,000 | 2,516,341 |
| 4.1% 4/24/28 | | 5,340,000 | 5,245,883 |
| 5.125% 1/15/45 (b) | | 3,353,000 | 3,202,484 |
| 5.25% 1/17/42 (b) | | 3,000,000 | 2,919,000 |
| 5.95% 1/8/46 (b) | | 2,100,000 | 2,188,988 |
| 6.625% 2/17/37 (b) | | 3,549,000 | 3,872,403 |
| 6.75% 1/15/44 (b) | | 5,105,000 | 5,839,405 |
| 7.75% 1/17/38 (b) | | 8,743,000 | 10,414,006 |
| 8.5% 10/12/35 (b) | | 8,199,000 | 10,314,342 |
|
| TOTAL INDONESIA | | | 46,512,852 |
|
| Iraq - 0.2% | | | |
| Republic of Iraq 5.8% 1/15/28 (Reg. S) | | 2,042,250 | 1,833,941 |
| Ivory Coast - 0.6% | | | |
| Ivory Coast: | | | |
| 5.875% 10/17/31 (b) | EUR | 3,125,000 | 2,559,086 |
| 6.125% 6/15/33 (b) | | 2,050,000 | 1,596,822 |
| 6.375% 3/3/28 (b) | | 3,135,000 | 2,771,144 |
|
| TOTAL IVORY COAST | | | 6,927,052 |
|
| Jamaica - 0.3% | | | |
| Jamaican Government: | | | |
| 6.75% 4/28/28 | | 1,725,000 | 1,777,073 |
| 7.875% 7/28/45 | | 1,685,000 | 1,781,045 |
|
| TOTAL JAMAICA | | | 3,558,118 |
|
| Jordan - 0.6% | | | |
| Jordanian Kingdom: | | | |
| 4.95% 7/7/25 (b) | | 4,170,000 | 3,757,691 |
| 5.85% 7/7/30 (b) | | 980,000 | 774,996 |
| 6.125% 1/29/26 (b) | | 985,000 | 900,536 |
| 7.75% 1/15/28 (b) | | 1,725,000 | 1,612,659 |
|
| TOTAL JORDAN | | | 7,045,882 |
|
| Kenya - 0.5% | | | |
| Republic of Kenya: | | | |
| 6.875% 6/24/24 (b) | | 3,015,000 | 2,532,600 |
| 7% 5/22/27 (b) | | 3,875,000 | 2,848,125 |
|
| TOTAL KENYA | | | 5,380,725 |
|
| Lebanon - 0.1% | | | |
| Lebanese Republic: | | | |
| 5.8% 12/31/49 (c) | | 5,875,000 | 384,813 |
| 6% 1/27/23 (c) | | 1,587,000 | 97,501 |
| 6.1% 10/4/22 (c) | | 685,000 | 45,296 |
| 6.375% 12/31/49 (c) | | 7,072,000 | 463,216 |
|
| TOTAL LEBANON | | | 990,826 |
|
| Mexico - 2.0% | | | |
| United Mexican States: | | | |
| 3.25% 4/16/30 | | 4,960,000 | 4,362,630 |
| 3.75% 1/11/28 | | 3,415,000 | 3,276,693 |
| 4.5% 4/22/29 | | 2,040,000 | 1,980,840 |
| 4.75% 4/27/32 | | 970,000 | 932,170 |
| 5.75% 10/12/2110 | | 3,295,000 | 2,758,121 |
| 6.05% 1/11/40 | | 10,222,000 | 10,038,643 |
|
| TOTAL MEXICO | | | 23,349,097 |
|
| Mongolia - 0.3% | | | |
| Mongolia Government: | | | |
| 3.5% 7/7/27 (b) | | 1,055,000 | 844,116 |
| 5.125% 4/7/26 (b) | | 2,480,000 | 2,207,473 |
|
| TOTAL MONGOLIA | | | 3,051,589 |
|
| Morocco - 0.4% | | | |
| Moroccan Kingdom: | | | |
| 2.375% 12/15/27 (b) | | 3,675,000 | 2,993,288 |
| 4% 12/15/50 (b) | | 735,000 | 444,675 |
| 5.5% 12/11/42 (b) | | 920,000 | 668,610 |
|
| TOTAL MOROCCO | | | 4,106,573 |
|
| Nigeria - 1.5% | | | |
| Republic of Nigeria: | | | |
| 6.125% 9/28/28 (b) | | 3,195,000 | 2,257,068 |
| 6.5% 11/28/27 (b) | | 3,892,000 | 2,948,190 |
| 7.143% 2/23/30 (b) | | 1,955,000 | 1,368,500 |
| 7.625% 11/21/25 (b) | | 12,623,000 | 11,108,240 |
|
| TOTAL NIGERIA | | | 17,681,998 |
|
| Oman - 2.5% | | | |
| Sultanate of Oman: | | | |
| 4.75% 6/15/26 (b) | | 3,347,000 | 3,179,650 |
| 4.875% 2/1/25 (b) | | 1,460,000 | 1,427,150 |
| 5.375% 3/8/27 (b) | | 3,921,000 | 3,798,469 |
| 5.625% 1/17/28 (b) | | 6,505,000 | 6,244,800 |
| 6% 8/1/29 (b) | | 3,625,000 | 3,484,531 |
| 6.25% 1/25/31 (b) | | 1,610,000 | 1,555,663 |
| 6.5% 3/8/47 (b) | | 2,280,000 | 1,912,350 |
| 6.75% 10/28/27 (b) | | 1,585,000 | 1,612,738 |
| 6.75% 1/17/48 (b) | | 5,980,000 | 5,142,800 |
|
| TOTAL OMAN | | | 28,358,151 |
|
| Pakistan - 0.6% | | | |
| Islamic Republic of Pakistan: | | | |
| 6% 4/8/26 (b) | | 6,130,000 | 4,107,774 |
| 6.875% 12/5/27 (b) | | 2,665,000 | 1,791,879 |
| 8.25% 4/15/24 (b) | | 1,180,000 | 912,878 |
| The Third Pakistan International Sukuk Co. Ltd. 5.625% 12/5/22 (b) | | 675,000 | 628,931 |
|
| TOTAL PAKISTAN | | | 7,441,462 |
|
| Panama - 1.5% | | | |
| Panamanian Republic: | | | |
| 2.252% 9/29/32 | | 5,065,000 | 3,959,564 |
| 3.16% 1/23/30 | | 2,370,000 | 2,111,226 |
| 3.298% 1/19/33 | | 5,355,000 | 4,589,235 |
| 3.87% 7/23/60 | | 3,880,000 | 2,753,103 |
| 4.5% 5/15/47 | | 2,005,000 | 1,655,754 |
| 4.5% 4/16/50 | | 2,680,000 | 2,189,728 |
|
| TOTAL PANAMA | | | 17,258,610 |
|
| Paraguay - 0.6% | | | |
| Republic of Paraguay: | | | |
| 2.739% 1/29/33 (b) | | 1,305,000 | 970,431 |
| 4.95% 4/28/31 (b) | | 3,865,000 | 3,566,187 |
| 5.4% 3/30/50 (b) | | 1,950,000 | 1,507,959 |
| 5.6% 3/13/48 (b) | | 445,000 | 349,826 |
|
| TOTAL PARAGUAY | | | 6,394,403 |
|
| Peru - 1.7% | | | |
| Peruvian Republic: | | | |
| 2.783% 1/23/31 | | 11,820,000 | 10,060,298 |
| 3% 1/15/34 | | 5,225,000 | 4,287,113 |
| 3.3% 3/11/41 | | 7,295,000 | 5,493,135 |
|
| TOTAL PERU | | | 19,840,546 |
|
| Qatar - 3.2% | | | |
| State of Qatar: | | | |
| 3.75% 4/16/30 (b) | | 12,765,000 | 12,637,350 |
| 4% 3/14/29 (b) | | 5,455,000 | 5,509,550 |
| 4.4% 4/16/50 (b) | | 5,585,000 | 5,354,619 |
| 4.5% 4/23/28 (b) | | 2,565,000 | 2,657,981 |
| 4.817% 3/14/49 (b) | | 8,149,000 | 8,189,745 |
| 5.103% 4/23/48 (b) | | 2,960,000 | 3,096,900 |
|
| TOTAL QATAR | | | 37,446,145 |
|
| Romania - 1.0% | | | |
| Romanian Republic: | | | |
| 3% 2/27/27 (b) | | 2,618,000 | 2,308,422 |
| 3% 2/14/31 (b) | | 8,211,000 | 6,316,312 |
| 3.375% 1/28/50 (Reg. S) | EUR | 1,255,000 | 777,434 |
| 3.625% 3/27/32 (b) | | 2,618,000 | 2,044,167 |
|
| TOTAL ROMANIA | | | 11,446,335 |
|
| Russia - 0.1% | | | |
| Ministry of Finance of the Russian Federation: | | | |
| 4.375% 3/21/29(Reg. S) (c) | | 2,800,000 | 728,000 |
| 5.1% 3/28/35(Reg. S) (c) | | 3,400,000 | 850,000 |
|
| TOTAL RUSSIA | | | 1,578,000 |
|
| Rwanda - 0.2% | | | |
| Rwanda Republic 5.5% 8/9/31 (b) | | 3,410,000 | 2,677,489 |
| Saudi Arabia - 1.4% | | | |
| Kingdom of Saudi Arabia: | | | |
| 2.25% 2/2/33 (b) | | 4,030,000 | 3,344,900 |
| 3.625% 3/4/28 (b) | | 1,770,000 | 1,743,450 |
| 3.75% 1/21/55 (b) | | 3,755,000 | 3,074,406 |
| 4.5% 10/26/46 (b) | | 3,471,000 | 3,162,949 |
| 4.5% 4/22/60 (b) | | 2,055,000 | 1,890,600 |
| 4.625% 10/4/47 (b) | | 3,040,000 | 2,812,000 |
|
| TOTAL SAUDI ARABIA | | | 16,028,305 |
|
| Serbia - 0.2% | | | |
| Republic of Serbia 2.125% 12/1/30 (b) | | 3,235,000 | 2,357,506 |
| South Africa - 0.2% | | | |
| South African Republic 4.85% 9/30/29 | | 2,130,000 | 1,818,221 |
| Sri Lanka - 0.2% | | | |
| Democratic Socialist Republic of Sri Lanka: | | | |
| 6.2% 5/11/27 (b)(c) | | 2,425,000 | 679,267 |
| 7.55% 3/28/30 (b)(c) | | 1,825,000 | 511,201 |
| 7.85% 3/14/29 (b)(c) | | 4,493,000 | 1,258,534 |
|
| TOTAL SRI LANKA | | | 2,449,002 |
|
| Turkey - 4.2% | | | |
| Turkish Republic: | | | |
| 4.25% 3/13/25 | | 7,075,000 | 6,063,717 |
| 4.75% 1/26/26 | | 4,660,000 | 3,844,500 |
| 4.875% 10/9/26 | | 5,970,000 | 4,773,388 |
| 4.875% 4/16/43 | | 4,735,000 | 2,793,058 |
| 5.125% 2/17/28 | | 3,070,000 | 2,337,613 |
| 5.6% 11/14/24 | | 3,295,000 | 2,949,643 |
| 5.75% 3/22/24 | | 1,020,000 | 944,648 |
| 5.75% 5/11/47 | | 4,880,000 | 2,999,065 |
| 5.95% 1/15/31 | | 2,685,000 | 1,953,841 |
| 6% 1/14/41 | | 4,622,000 | 2,927,170 |
| 6.125% 10/24/28 | | 2,140,000 | 1,679,633 |
| 6.35% 8/10/24 | | 5,170,000 | 4,771,910 |
| 6.375% 10/14/25 | | 3,475,000 | 3,068,425 |
| 6.75% 5/30/40 | | 3,112,000 | 2,160,506 |
| 7.25% 12/23/23 | | 4,138,000 | 4,027,567 |
| 7.375% 2/5/25 | | 841,000 | 780,185 |
|
| TOTAL TURKEY | | | 48,074,869 |
|
| Ukraine - 1.2% | | | |
| Ukraine Government: | | | |
| 1.258% 5/31/40 (b)(e) | | 2,230,000 | 546,350 |
| 6.876% 5/21/29 (b) | | 3,585,000 | 860,400 |
| 7.253% 3/15/33 (b) | | 3,445,000 | 844,025 |
| 7.375% 9/25/32 (b) | | 2,130,000 | 521,850 |
| 7.75% 9/1/22 (b) | | 9,099,000 | 4,913,460 |
| 7.75% 9/1/23 (b) | | 9,100,000 | 2,821,000 |
| 7.75% 9/1/24 (b) | | 5,364,000 | 1,341,000 |
| 7.75% 9/1/25 (b) | | 1,750,000 | 433,125 |
| 7.75% 9/1/26 (b) | | 1,895,000 | 478,488 |
| 7.75% 9/1/27 (b) | | 2,594,000 | 654,985 |
| 9.75% 11/1/28 (b) | | 425,000 | 104,125 |
|
| TOTAL UKRAINE | | | 13,518,808 |
|
| United Arab Emirates - 1.6% | | | |
| Emirate of Abu Dhabi: | | | |
| 1.7% 3/2/31 (b) | | 3,465,000 | 2,906,918 |
| 3.125% 4/16/30 (b) | | 5,190,000 | 4,931,473 |
| 3.125% 9/30/49 (b) | | 8,072,000 | 6,269,926 |
| 3.875% 4/16/50 (b) | | 2,990,000 | 2,659,792 |
| United Arab Emirates 4.05% 7/7/32 (b)(g) | | 1,415,000 | 1,423,844 |
|
| TOTAL UNITED ARAB EMIRATES | | | 18,191,953 |
|
| Uruguay - 0.3% | | | |
| Uruguay Republic 5.1% 6/18/50 | | 3,930,000 | 3,941,790 |
| Uzbekistan - 0.3% | | | |
| Republic of Uzbekistan: | | | |
| 3.7% 11/25/30 (b) | | 1,595,000 | 1,142,419 |
| 3.9% 10/19/31 (b) | | 2,360,000 | 1,669,700 |
| 4.75% 2/20/24 (b) | | 1,110,000 | 1,058,177 |
|
| TOTAL UZBEKISTAN | | | 3,870,296 |
|
| Venezuela - 0.4% | | | |
| Venezuelan Republic: | | | |
| 9.25% 9/15/27 (c) | | 27,915,000 | 2,372,775 |
| 11.95% 8/5/31 (Reg. S) (c) | | 17,015,000 | 1,446,275 |
| 12.75% 8/23/22 (c) | | 3,625,000 | 312,656 |
|
| TOTAL VENEZUELA | | | 4,131,706 |
|
| Vietnam - 0.9% | | | |
| Vietnamese Socialist Republic 5.5% 3/12/28 | | 10,912,833 | 10,812,572 |
| Zambia - 0.1% | | | |
| Republic of Zambia 8.97% 7/30/27 (b) | | 1,970,000 | 1,144,816 |
| TOTAL GOVERNMENT OBLIGATIONS | | | |
| (Cost $822,329,903) | | | 604,083,433 |
|
| Preferred Securities - 1.8% | | | |
| Cayman Islands - 1.1% | | | |
| Banco Mercantil del Norte SA: | | | |
| 6.75% (b)(d)(e) | | 2,130,000 | 2,001,100 |
| 6.875% (b)(d)(e) | | 2,145,000 | 2,164,156 |
| 7.625% (b)(d)(e) | | 1,285,000 | 1,216,433 |
| DP World Salaam 6% (Reg. S) (d)(e) | | 3,215,000 | 3,319,421 |
| Itau Unibanco Holding SA 6.125% (b)(d)(e) | | 3,575,000 | 3,437,405 |
|
| TOTAL CAYMAN ISLANDS | | | 12,138,515 |
|
| Ireland - 0.0% | | | |
| Tinkoff Credit Systems 6% (b)(d)(e) | | 1,625,000 | 376,664 |
| Mexico - 0.3% | | | |
| CEMEX S.A.B. de CV 5.125% (b)(d)(e) | | 3,625,000 | 3,134,775 |
| United Arab Emirates - 0.4% | | | |
| Emirates NBD Bank PJSC 6.125% (Reg. S) (d)(e) | | 3,255,000 | 3,310,253 |
| NBK Tier 1 Financing 2 Ltd. 4.5% (b)(d)(e) | | 1,890,000 | 1,765,789 |
|
| TOTAL UNITED ARAB EMIRATES | | | 5,076,042 |
|
| TOTAL PREFERRED SECURITIES | | | |
| (Cost $23,827,492) | | | 20,725,996 |
| | | Shares | Value |
|
| Money Market Funds - 5.3% | | | |
| Fidelity Cash Central Fund 1.58% (h) | | | |
| (Cost $61,038,522) | | 61,030,881 | 61,043,087 |
| TOTAL INVESTMENT IN SECURITIES - 98.7% | | | |
| (Cost $1,478,331,133) | | | 1,140,091,115 |
| NET OTHER ASSETS (LIABILITIES) - 1.3% | | | 15,565,412 |
| NET ASSETS - 100% | | | $1,155,656,527 |
Currency Abbreviations
EUR – European Monetary Unit
Categorizations in the Schedule of Investments are based on country or territory of incorporation.
Legend
(a) Amount is stated in United States dollars unless otherwise noted.
(b) Security exempt from registration under Rule 144A of the Securities Act of 1933. These securities may be resold in transactions exempt from registration, normally to qualified institutional buyers. At the end of the period, the value of these securities amounted to $717,409,995 or 62.1% of net assets.
(c) Non-income producing - Security is in default.
(d) Security is perpetual in nature with no stated maturity date.
(e) Coupon rates for floating and adjustable rate securities reflect the rates in effect at period end.
(f) Security initially issued at one coupon which converts to a higher coupon at a specified date. The rate shown is the rate at period end.
(g) Security or a portion of the security purchased on a delayed delivery or when-issued basis.
(h) Affiliated fund that is generally available only to investment companies and other accounts managed by Fidelity Investments. The rate quoted is the annualized seven-day yield of the fund at period end. A complete unaudited listing of the fund's holdings as of its most recent quarter end is available upon request. In addition, each Fidelity Central Fund's financial statements are available on the SEC's website or upon request.
Affiliated Central Funds
Fiscal year to date information regarding the Fund's investments in Fidelity Central Funds, including the ownership percentage, is presented below.
| Fund | Value, beginning of period | Purchases | Sales Proceeds | Dividend Income | Realized Gain/Loss | Change in Unrealized appreciation (depreciation) | Value, end of period | % ownership, end of period |
| Fidelity Cash Central Fund 1.58% | $67,457,687 | $237,359,149 | $243,773,749 | $140,613 | $-- | $-- | $61,043,087 | 0.1% |
| Total | $67,457,687 | $237,359,149 | $243,773,749 | $140,613 | $-- | $-- | $61,043,087 | |
Amounts in the income column in the above table include any capital gain distributions from underlying funds, which are presented in the corresponding line-item in the Statement of Operations, if applicable.
Investment Valuation
The following is a summary of the inputs used, as of June 30, 2022, involving the Fund's assets and liabilities carried at fair value. The inputs or methodology used for valuing securities may not be an indication of the risk associated with investing in those securities. For more information on valuation inputs, and their aggregation into the levels used below, please refer to the Investment Valuation section in the accompanying Notes to Financial Statements.
| | Valuation Inputs at Reporting Date: |
| Description | Total | Level 1 | Level 2 | Level 3 |
| Investments in Securities: | | | | |
| Corporate Bonds | $454,238,599 | $-- | $454,238,599 | $-- |
| Government Obligations | 604,083,433 | -- | 604,083,433 | -- |
| Preferred Securities | 20,725,996 | -- | 20,725,996 | -- |
| Money Market Funds | 61,043,087 | 61,043,087 | -- | -- |
| Total Investments in Securities: | $1,140,091,115 | $61,043,087 | $1,079,048,028 | $-- |
Other Information
The composition of credit quality ratings as a percentage of Total Net Assets is as follows (Unaudited):
| AAA,AA,A | 13.5% |
| BBB | 18.5% |
| BB | 28.5% |
| B | 20.3% |
| CCC,CC,C | 8.0% |
| D | 0.2% |
| Not Rated | 4.4% |
| Short-Term Investments and Net Other Assets | 6.6% |
| | 100% |
We have used ratings from Moody's Investors Service, Inc. Where Moody's® ratings are not available, we have used S&P® ratings. All ratings are as of the date indicated and do not reflect subsequent changes.
See accompanying notes which are an integral part of the financial statements.
Fidelity® Series Emerging Markets Debt Fund
Financial Statements
Statement of Assets and Liabilities
| | | June 30, 2022 (Unaudited) |
| Assets | | |
Investment in securities, at value — See accompanying schedule:
Unaffiliated issuers (cost $1,417,292,611) | $1,079,048,028 | |
| Fidelity Central Funds (cost $61,038,522) | 61,043,087 | |
| Total Investment in Securities (cost $1,478,331,133) | | $1,140,091,115 |
| Cash | | 429,395 |
| Foreign currency held at value (cost $42) | | 35 |
| Receivable for investments sold | | 1,722,188 |
| Receivable for fund shares sold | | 3,326,741 |
| Interest receivable | | 20,894,829 |
| Distributions receivable from Fidelity Central Funds | | 61,064 |
| Total assets | | 1,166,525,367 |
| Liabilities | | |
| Payable for investments purchased | | |
| Regular delivery | $373,202 | |
| Delayed delivery | 1,415,000 | |
| Payable for fund shares redeemed | 9,079,096 | |
| Other payables and accrued expenses | 1,542 | |
| Total liabilities | | 10,868,840 |
| Net Assets | | $1,155,656,527 |
| Net Assets consist of: | | |
| Paid in capital | | $1,588,837,758 |
| Total accumulated earnings (loss) | | (433,181,231) |
| Net Assets | | $1,155,656,527 |
| Net Asset Value, offering price and redemption price per share ($1,155,656,527 ÷ 158,752,066 shares) | | $7.28 |
See accompanying notes which are an integral part of the financial statements.
Statement of Operations
| | | Six months ended June 30, 2022 (Unaudited) |
| Investment Income | | |
| Dividends | | $881,056 |
| Interest | | 35,138,768 |
| Income from Fidelity Central Funds | | 140,613 |
| Income before foreign taxes withheld | | 36,160,437 |
| Less foreign taxes withheld | | (97,165) |
| Total income | | 36,063,272 |
| Expenses | | |
| Custodian fees and expenses | $1,073 | |
| Independent trustees' fees and expenses | 2,257 | |
| Legal | 544 | |
| Total expenses before reductions | 3,874 | |
| Expense reductions | (299) | |
| Total expenses after reductions | | 3,575 |
| Net investment income (loss) | | 36,059,697 |
| Realized and Unrealized Gain (Loss) | | |
| Net realized gain (loss) on: | | |
| Investment securities: | | |
| Unaffiliated issuers | (23,774,021) | |
| Foreign currency transactions | (19,001) | |
| Total net realized gain (loss) | | (23,793,022) |
| Change in net unrealized appreciation (depreciation) on: | | |
| Investment securities: | | |
| Unaffiliated issuers | (262,248,869) | |
| Assets and liabilities in foreign currencies | (15,812) | |
| Total change in net unrealized appreciation (depreciation) | | (262,264,681) |
| Net gain (loss) | | (286,057,703) |
| Net increase (decrease) in net assets resulting from operations | | $(249,998,006) |
See accompanying notes which are an integral part of the financial statements.
Statement of Changes in Net Assets
| | Six months ended June 30, 2022 (Unaudited) | Year ended December 31, 2021 |
| Increase (Decrease) in Net Assets | | |
| Operations | | |
| Net investment income (loss) | $36,059,697 | $72,598,690 |
| Net realized gain (loss) | (23,793,022) | (16,006,513) |
| Change in net unrealized appreciation (depreciation) | (262,264,681) | (64,398,178) |
| Net increase (decrease) in net assets resulting from operations | (249,998,006) | (7,806,001) |
| Distributions to shareholders | (32,260,714) | (65,337,661) |
| Share transactions | | |
| Proceeds from sales of shares | 49,794,070 | 278,270,150 |
| Reinvestment of distributions | 32,260,373 | 65,320,232 |
| Cost of shares redeemed | (86,704,048) | (284,123,371) |
| Net increase (decrease) in net assets resulting from share transactions | (4,649,605) | 59,467,011 |
| Total increase (decrease) in net assets | (286,908,325) | (13,676,651) |
| Net Assets | | |
| Beginning of period | 1,442,564,852 | 1,456,241,503 |
| End of period | $1,155,656,527 | $1,442,564,852 |
| Other Information | | |
| Shares | | |
| Sold | 6,160,128 | 30,067,459 |
| Issued in reinvestment of distributions | 4,019,087 | 7,082,687 |
| Redeemed | (10,457,404) | (30,784,076) |
| Net increase (decrease) | (278,189) | 6,366,070 |
See accompanying notes which are an integral part of the financial statements.
Financial Highlights
Fidelity Series Emerging Markets Debt Fund
| | Six months ended (Unaudited) June 30, | Years endedDecember 31, | | | | |
| | 2022 | 2021 | 2020 | 2019 | 2018 | 2017 |
| Selected Per–Share Data | | | | | | |
| Net asset value, beginning of period | $9.07 | $9.54 | $9.60 | $9.22 | $10.25 | $9.96 |
| Income from Investment Operations | | | | | | |
| Net investment income (loss)A,B | .229 | .456 | .519 | .604 | .576 | .672 |
| Net realized and unrealized gain (loss) | (1.814) | (.515) | (.103) | .341 | (1.045) | .369 |
| Total from investment operations | (1.585) | (.059) | .416 | .945 | (.469) | 1.041 |
| Distributions from net investment income | (.205) | (.411) | (.476) | (.565) | (.561) | (.709) |
| Distributions from net realized gain | – | – | – | – | – | (.042) |
| Total distributions | (.205) | (.411) | (.476) | (.565) | (.561) | (.751) |
| Net asset value, end of period | $7.28 | $9.07 | $9.54 | $9.60 | $9.22 | $10.25 |
| Total ReturnC,D | (17.67)% | (.60)% | 4.75% | 10.46% | (4.66)% | 10.66% |
| Ratios to Average Net AssetsB,E,F | | | | | | |
| Expenses before reductions | - %G,H | - %H | - %H | - %H | - %H | .32% |
| Expenses net of fee waivers, if any | - %G,H | - %H | - %H | - %H | - %H | .32% |
| Expenses net of all reductions | - %G,H | - %H | - %H | - %H | - %H | .32% |
| Net investment income (loss) | 5.65%G | 4.93% | 5.73% | 6.35% | 5.95% | 6.53% |
| Supplemental Data | | | | | | |
| Net assets, end of period (000 omitted) | $1,155,657 | $1,442,565 | $1,456,242 | $1,463,941 | $1,254,003 | $1,366,805 |
| Portfolio turnover rateI | 20%G | 29% | 84% | 61%J | 43% | 57% |
A Calculated based on average shares outstanding during the period.
B Net investment income (loss) is affected by the timing of the declaration of dividends by any underlying mutual funds or exchange-traded funds (ETFs). Net investment income (loss) of any such underlying funds is not included in the Fund's net investment income (loss) ratio.
C Total returns for periods of less than one year are not annualized.
D Total returns would have been lower if certain expenses had not been reduced during the applicable periods shown.
E Fees and expenses of any underlying mutual funds or exchange-traded funds (ETFs) are not included in the Fund's expense ratio. The Fund indirectly bears its proportionate share of these expenses. For additional expense information related to investments in Fidelity Central Funds, please refer to the "Investments in Fidelity Central Funds" note found in the Notes to Financial Statements section of the most recent Annual or Semi-Annual report.
F Expense ratios reflect operating expenses of the class. Expenses before reductions do not reflect amounts reimbursed, waived, or reduced through arrangements with the investment adviser, brokerage services, or other offset arrangements, if applicable, and do not represent the amount paid by the class during periods when reimbursements, waivers or reductions occur.
G Annualized
H Amount represents less than .005%.
I Amount does not include the portfolio activity of any underlying mutual funds or exchange-traded funds (ETFs).
J Portfolio turnover rate excludes securities received or delivered in-kind.
See accompanying notes which are an integral part of the financial statements.
Fidelity® Series Emerging Markets Debt Local Currency Fund
Investment Summary (Unaudited)
Geographic Diversification (% of fund's net assets)
| As of June 30, 2022 |
| | United States of America* | 13.7% |
| | Brazil | 10.9% |
| | Indonesia | 10.4% |
| | China | 10.2% |
| | South Africa | 9.4% |
| | Mexico | 8.7% |
| | Thailand | 4.8% |
| | Malaysia | 4.8% |
| | Colombia | 4.3% |
| | Other | 22.8% |
* Includes Short-Term investments and Net Other Assets (Liabilities).
Percentages are based on country or territory of incorporation and are adjusted for the effect of futures contracts, if applicable.
Top Holdings as of June 30, 2022
| (by issuer, excluding cash equivalents) | % of fund's net assets |
| Indonesian Republic | 10.4 |
| Peoples Republic of China | 10.2 |
| South African Republic | 9.4 |
| United Mexican States | 8.7 |
| Brazil Letras Do Tesouro Nacio | 5.6 |
| Brazilian Federative Republic | 5.3 |
| Kingdom of Thailand | 4.8 |
| Malaysian Government | 4.8 |
| Colombian Republic | 4.3 |
| Polish Government | 4.1 |
| | 67.6 |
Asset Allocation (% of fund's net assets)
| As of June 30, 2022 |
| | Government Obligations | 85.2% |
| | Supranational Obligations | 1.1% |
| | Short-Term Investments and Net Other Assets (Liabilities) | 13.7% |

Fidelity® Series Emerging Markets Debt Local Currency Fund
Schedule of Investments June 30, 2022 (Unaudited)
Showing Percentage of Net Assets
| Foreign Government and Government Agency Obligations - 85.2% | | | |
| | | Principal Amount(a) | Value |
| Brazil - 10.9% | | | |
| Brazil Letras Do Tesouro Nacio, yield at date of purchase 5.8628% to 6.2765% 7/1/23 to 1/1/24 | BRL | $129,750,000 | $21,687,824 |
| Brazilian Federative Republic: | | | |
| 10% 1/1/23 | BRL | 30,500,000 | 5,727,643 |
| 10% 1/1/25 | BRL | 23,500,000 | 4,231,317 |
| 10% 1/1/27 | BRL | 38,000,000 | 6,588,756 |
| 10% 1/1/29 | BRL | 11,500,000 | 1,923,961 |
| 10% 1/1/31 | BRL | 14,500,000 | 2,361,838 |
|
| TOTAL BRAZIL | | | 42,521,339 |
|
| Chile - 1.9% | | | |
| Chilean Republic: | | | |
| 4.5% 3/1/26 | CLP | 3,050,000,000 | 3,124,643 |
| 4.7% 9/1/30 (Reg. S) (b) | CLP | 1,000,000,000 | 976,622 |
| 5% 3/1/35 | CLP | 1,825,000,000 | 1,751,293 |
| 6% 1/1/43 | CLP | 1,275,000,000 | 1,333,315 |
|
| TOTAL CHILE | | | 7,185,873 |
|
| China - 10.2% | | | |
| Peoples Republic of China: | | | |
| 2.36% 7/2/23 | CNY | 11,500,000 | 1,721,565 |
| 2.68% 5/21/30 | CNY | 76,250,000 | 11,199,732 |
| 2.88% 11/5/23 | CNY | 71,000,000 | 10,695,922 |
| 3.28% 12/3/27 | CNY | 88,750,000 | 13,650,049 |
| 3.81% 9/14/50 | CNY | 15,250,000 | 2,447,990 |
|
| TOTAL CHINA | | | 39,715,258 |
|
| Colombia - 4.3% | | | |
| Colombian Republic: | | | |
| 5.75% 11/3/27 | COP | 31,100,000,000 | 5,884,126 |
| 6% 4/28/28 | COP | 1,850,000,000 | 347,413 |
| 7% 6/30/32 | COP | 22,800,000,000 | 4,025,206 |
| 7.25% 10/26/50 | COP | 8,500,000,000 | 1,278,807 |
| 7.5% 8/26/26 | COP | 13,650,000,000 | 2,916,618 |
| 9.25% 5/28/42 | COP | 1,750,000,000 | 335,139 |
| 10% 7/24/24 | COP | 8,300,000,000 | 1,991,063 |
|
| TOTAL COLOMBIA | | | 16,778,372 |
|
| Czech Republic - 2.8% | | | |
| Czech Republic: | | | |
| 0.95% 5/15/30 (Reg. S) | CZK | 146,000,000 | 4,576,662 |
| 1.2% 3/13/31 | CZK | 45,000,000 | 1,405,678 |
| 2% 10/13/33 | CZK | 149,250,000 | 4,760,726 |
|
| TOTAL CZECH REPUBLIC | | | 10,743,066 |
|
| Dominican Republic - 0.7% | | | |
| Dominican Republic: | | | |
| 8.9% 2/15/23(Reg. S) | DOP | 116,250,000 | 2,107,630 |
| 9.75% 6/5/26 (Reg. S) | DOP | 26,500,000 | 466,265 |
|
| TOTAL DOMINICAN REPUBLIC | | | 2,573,895 |
|
| Egypt - 1.4% | | | |
| Arab Republic of Egypt: | | | |
| 14.06% 1/12/26 | EGP | 18,000,000 | 920,932 |
| 14.531% 9/14/24 | EGP | 18,000,000 | 941,227 |
| 14.556% 10/13/27 | EGP | 36,000,000 | 1,823,896 |
| 15.9% 7/2/24 | EGP | 18,000,000 | 965,404 |
| 16.1% 5/7/29 | EGP | 12,000,000 | 632,717 |
|
| TOTAL EGYPT | | | 5,284,176 |
|
| Hungary - 2.4% | | | |
| Hungarian Republic: | | | |
| 2.25% 6/22/34 | HUF | 470,000,000 | 709,446 |
| 3% 6/26/24 | HUF | 365,000,000 | 875,314 |
| 3% 10/27/38 | HUF | 1,110,000,000 | 1,629,908 |
| 3.25% 10/22/31 | HUF | 937,000,000 | 1,725,481 |
| 5.5% 6/24/25 | HUF | 675,000,000 | 1,652,076 |
| 6.75% 10/22/28 | HUF | 1,118,000,000 | 2,738,751 |
|
| TOTAL HUNGARY | | | 9,330,976 |
|
| Indonesia - 10.4% | | | |
| Indonesian Republic: | | | |
| 6.375% 4/15/32 | IDR | 35,000,000,000 | 2,214,298 |
| 6.5% 6/15/25 | IDR | 34,750,000,000 | 2,390,921 |
| 7.5% 4/15/40 | IDR | 47,750,000,000 | 3,189,210 |
| 8.125% 5/15/24 | IDR | 85,000,000,000 | 6,005,202 |
| 8.25% 5/15/29 | IDR | 102,000,000,000 | 7,281,557 |
| 8.25% 5/15/36 | IDR | 44,750,000,000 | 3,169,072 |
| 8.375% 9/15/26 | IDR | 120,750,000,000 | 8,761,923 |
| 8.375% 3/15/34 | IDR | 71,788,000,000 | 5,124,789 |
| 8.375% 4/15/39 | IDR | 30,000,000,000 | 2,142,641 |
|
| TOTAL INDONESIA | | | 40,279,613 |
|
| Kazakhstan - 1.0% | | | |
| Kazakhstan Republic: | | | |
| 7.2% 5/27/25 | KZT | 825,851,000 | 1,432,827 |
| 8.05% 5/20/24 | KZT | 830,000,000 | 1,609,946 |
| 10.5% 8/4/26 | KZT | 440,000,000 | 847,143 |
|
| TOTAL KAZAKHSTAN | | | 3,889,916 |
|
| Malaysia - 4.8% | | | |
| Malaysian Government: | | | |
| 3.757% 5/22/40 | MYR | 10,000,000 | 1,964,901 |
| 3.828% 7/5/34 | MYR | 14,300,000 | 2,993,607 |
| 3.885% 8/15/29 | MYR | 16,100,000 | 3,565,817 |
| 4.065% 6/15/50 | MYR | 14,500,000 | 2,832,920 |
| 4.696% 10/15/42 | MYR | 9,000,000 | 2,020,758 |
| 4.762% 4/7/37 | MYR | 22,500,000 | 5,152,239 |
|
| TOTAL MALAYSIA | | | 18,530,242 |
|
| Mexico - 8.7% | | | |
| United Mexican States: | | | |
| 5.75% 3/5/26 | MXN | 275,000,000 | 12,153,771 |
| 7.75% 11/23/34 | MXN | 65,000,000 | 2,917,655 |
| 7.75% 11/13/42 | MXN | 167,750,000 | 7,297,807 |
| 8% 12/7/23 | MXN | 10,750,000 | 524,716 |
| 8.5% 5/31/29 | MXN | 223,000,000 | 10,770,469 |
|
| TOTAL MEXICO | | | 33,664,418 |
|
| Peru - 2.3% | | | |
| Peruvian Republic: | | | |
| 5.35% 8/12/40 | PEN | 2,250,000 | 439,680 |
| 5.4% 8/12/34(Reg. S) | PEN | 15,250,000 | 3,201,675 |
| 6.35% 8/12/28 | PEN | 9,900,000 | 2,432,734 |
| 6.95% 8/12/31 | PEN | 11,500,000 | 2,845,380 |
|
| TOTAL PERU | | | 8,919,469 |
|
| Philippines - 0.3% | | | |
| Philippine Republic: | | | |
| 3.9% 11/26/22 | PHP | 30,000,000 | 532,036 |
| 6.25% 1/14/36 | PHP | 30,000,000 | 525,659 |
|
| TOTAL PHILIPPINES | | | 1,057,695 |
|
| Poland - 4.1% | | | |
| Polish Government: | | | |
| 1.25% 10/25/30 | PLN | 5,400,000 | 789,335 |
| 1.75% 4/25/32 | PLN | 9,250,000 | 1,322,646 |
| 2.5% 7/25/26 | PLN | 53,250,000 | 9,900,336 |
| 2.75% 10/25/29 | PLN | 23,750,000 | 4,066,341 |
|
| TOTAL POLAND | | | 16,078,658 |
|
| Romania - 3.1% | | | |
| Romanian Republic: | | | |
| 3.65% 9/24/31 | RON | 23,550,000 | 3,403,283 |
| 4% 10/25/23 | RON | 9,750,000 | 1,948,244 |
| 4.25% 6/28/23 | RON | 20,250,000 | 4,118,316 |
| 4.75% 2/24/25 | RON | 5,550,000 | 1,067,637 |
| 4.75% 10/11/34 | RON | 2,500,000 | 364,779 |
| 5% 2/12/29 | RON | 5,500,000 | 950,325 |
|
| TOTAL ROMANIA | | | 11,852,584 |
|
| Russia - 0.6% | | | |
| Ministry of Finance of the Russian Federation: | | | |
| 6.9% 5/23/29 (c)(d) | RUB | 98,000,000 | 151,455 |
| 7.05% 1/19/28 (c)(d) | RUB | 200,000,000 | 309,091 |
| 7.25% 5/10/34 (c)(d) | RUB | 335,000,000 | 517,727 |
| 7.7% 3/16/39 (c)(d) | RUB | 142,500,000 | 220,227 |
| 8.5% 9/17/31 (c)(d) | RUB | 794,750,000 | 1,228,250 |
|
| TOTAL RUSSIA | | | 2,426,750 |
|
| South Africa - 9.4% | | | |
| South African Republic: | | | |
| 6.5% 2/28/41 | ZAR | 107,500,000 | 4,053,232 |
| 7% 2/28/31 | ZAR | 56,750,000 | 2,742,000 |
| 8% 1/31/30 | ZAR | 208,500,000 | 11,134,030 |
| 8.75% 2/28/48 | ZAR | 83,000,000 | 3,928,777 |
| 8.875% 2/28/35 | ZAR | 215,000,000 | 11,071,335 |
| 10.5% 12/21/26 | ZAR | 57,500,000 | 3,741,400 |
|
| TOTAL SOUTH AFRICA | | | 36,670,774 |
|
| Thailand - 4.8% | | | |
| Kingdom of Thailand: | | | |
| 1.585% 12/17/35 | THB | 123,750,000 | 2,829,576 |
| 1.6% 12/17/29 | THB | 75,500,000 | 1,973,846 |
| 1.6% 6/17/35 | THB | 180,750,000 | 4,160,680 |
| 2% 12/17/31 | THB | 76,000,000 | 2,012,265 |
| 2.875% 6/17/46 | THB | 23,000,000 | 521,882 |
| 3.3% 6/17/38 | THB | 195,000,000 | 5,291,124 |
| 4.875% 6/22/29 | THB | 61,750,000 | 1,979,733 |
|
| TOTAL THAILAND | | | 18,769,106 |
|
| Turkey - 0.8% | | | |
| Turkish Republic: | | | |
| 8% 3/12/25 | TRY | 38,250,000 | 1,652,258 |
| 11% 2/24/27 | TRY | 16,250,000 | 710,702 |
| 11.7% 11/13/30 | TRY | 12,500,000 | 527,971 |
| 12.4% 3/8/28 | TRY | 7,750,000 | 360,309 |
|
| TOTAL TURKEY | | | 3,251,240 |
|
| Ukraine - 0.1% | | | |
| Ukraine Government 11.15% 8/26/22 (d) | UAH | 45,000,000 | 405,596 |
| Uruguay - 0.2% | | | |
| Uruguay Republic: | | | |
| 8.25% 5/21/31 | UYU | 31,500,000 | 682,876 |
| 8.5% 3/15/28 (Reg. S) | UYU | 5,500,000 | 126,006 |
|
| TOTAL URUGUAY | | | 808,882 |
|
| TOTAL FOREIGN GOVERNMENT AND GOVERNMENT AGENCY OBLIGATIONS | | | |
| (Cost $400,303,888) | | | 330,737,898 |
|
| Supranational Obligations - 1.1% | | | |
| Asian Infrastructure Investment Bank 2.375% 2/10/25 (Reg. S) | PHP | 57,900,000 | 968,083 |
| Inter-American Development Bank: | | | |
| 5.1% 11/17/26 | IDR | 15,000,000,000 | 962,034 |
| 5.7% 11/12/24 | INR | 105,000,000 | 1,268,426 |
| International Finance Corp. 5.85% 11/25/22 | INR | 90,000,000 | 1,136,018 |
| TOTAL SUPRANATIONAL OBLIGATIONS | | | |
| (Cost $4,870,367) | | | 4,334,561 |
| | | Shares | Value |
|
| Money Market Funds - 14.1% | | | |
| Fidelity Cash Central Fund 1.58% (e) | | | |
| (Cost $54,917,965) | | 54,906,984 | 54,917,965 |
| TOTAL INVESTMENT IN SECURITIES - 100.4% | | | |
| (Cost $460,092,220) | | | 389,990,424 |
| NET OTHER ASSETS (LIABILITIES) - (0.4)% | | | (1,556,655) |
| NET ASSETS - 100% | | | $388,433,769 |
| Forward Foreign Currency Contracts | | | | | | |
| Currency Purchased | Currency Sold | Counterparty | Settlement Date | Unrealized Appreciation/(Depreciation) |
| BRL | 5,155,000 | USD | 981,344 | Citibank, N. A. | 8/4/22 | $(5,674) |
| BRL | 5,219,000 | USD | 1,026,770 | Citibank, N. A. | 8/4/22 | (38,987) |
| BRL | 5,043,000 | USD | 1,031,605 | Citibank, N. A. | 8/4/22 | (77,133) |
| BRL | 5,616,000 | USD | 1,085,322 | Citibank, N. A. | 8/4/22 | (22,401) |
| CLP | 2,385,839,000 | USD | 2,708,872 | Citibank, N. A. | 8/4/22 | (127,214) |
| CLP | 900,985,000 | USD | 1,081,745 | Citibank, N. A. | 8/4/22 | (106,811) |
| CLP | 879,854,000 | USD | 961,589 | Citibank, N. A. | 8/4/22 | (9,521) |
| CNY | 13,192,000 | USD | 1,952,346 | HSBC Bank | 8/4/22 | 16,661 |
| CNY | 15,108,000 | USD | 2,261,778 | JPMorgan Chase Bank, N.A. | 8/4/22 | (6,794) |
| COP | 4,817,800,000 | USD | 1,156,110 | Citibank, N. A. | 8/4/22 | (2,250) |
| COP | 3,883,400,000 | USD | 946,940 | Citibank, N. A. | 8/4/22 | (16,868) |
| COP | 4,070,100,000 | USD | 987,289 | Citibank, N. A. | 8/4/22 | (12,503) |
| COP | 4,789,400,000 | USD | 1,158,755 | Goldman Sachs Bank USA | 8/4/22 | (11,696) |
| CZK | 159,947,000 | USD | 6,589,352 | BNP Paribas S.A. | 8/4/22 | 155,087 |
| CZK | 7,362,000 | USD | 316,137 | Goldman Sachs Bank USA | 8/4/22 | (5,706) |
| CZK | 29,755,000 | USD | 1,274,325 | Goldman Sachs Bank USA | 8/4/22 | (19,655) |
| CZK | 23,825,000 | USD | 1,003,313 | State Street Bank And Trust Co | 8/4/22 | 1,309 |
| EGP | 14,655,000 | USD | 763,281 | Citibank, N. A. | 8/4/22 | 111 |
| HUF | 1,323,215,000 | USD | 3,540,137 | Goldman Sachs Bank USA | 8/4/22 | (60,043) |
| HUF | 577,255,000 | USD | 1,564,504 | JPMorgan Chase Bank, N.A. | 8/4/22 | (46,307) |
| IDR | 38,871,000,000 | USD | 2,640,693 | BNP Paribas S.A. | 8/4/22 | (32,514) |
| IDR | 28,470,300,000 | USD | 1,933,467 | HSBC Bank | 8/4/22 | (23,157) |
| IDR | 30,380,000,000 | USD | 2,087,973 | HSBC Bank | 8/4/22 | (49,525) |
| IDR | 3,809,600,000 | USD | 256,657 | State Street Bank And Trust Co | 8/4/22 | (1,039) |
| MXN | 78,799,000 | USD | 3,818,631 | BNP Paribas S.A. | 8/4/22 | 77,892 |
| MXN | 21,430,000 | USD | 1,049,550 | BNP Paribas S.A. | 8/4/22 | 10,140 |
| MXN | 25,140,000 | USD | 1,217,991 | HSBC Bank | 8/4/22 | 25,154 |
| MXN | 62,044,000 | USD | 3,107,484 | JPMorgan Chase Bank, N.A. | 8/4/22 | (39,477) |
| MXN | 103,413,000 | USD | 5,152,673 | JPMorgan Chase Bank, N.A. | 8/4/22 | (39,015) |
| MYR | 83,573,000 | USD | 19,008,984 | Goldman Sachs Bank USA | 8/4/22 | (49,592) |
| MYR | 4,021,000 | USD | 920,032 | Goldman Sachs Bank USA | 8/4/22 | (7,827) |
| MYR | 4,622,000 | USD | 1,050,455 | Goldman Sachs Bank USA | 8/4/22 | (1,906) |
| PEN | 1,053,000 | USD | 274,369 | Citibank, N. A. | 8/4/22 | (257) |
| PEN | 3,896,000 | USD | 1,043,944 | Citibank, N. A. | 8/4/22 | (29,757) |
| PEN | 3,800,000 | USD | 1,024,121 | State Street Bank And Trust Co | 8/4/22 | (34,924) |
| PLN | 43,162,000 | USD | 9,499,433 | BNP Paribas S.A. | 8/4/22 | 89,071 |
| PLN | 1,609,000 | USD | 374,611 | Goldman Sachs Bank USA | 8/4/22 | (17,169) |
| PLN | 18,990,000 | USD | 4,233,830 | Goldman Sachs Bank USA | 8/4/22 | (15,172) |
| PLN | 8,909,000 | USD | 2,005,640 | Goldman Sachs Bank USA | 8/4/22 | (26,492) |
| PLN | 4,939,000 | USD | 1,146,244 | HSBC Bank | 8/4/22 | (49,037) |
| PLN | 8,315,000 | USD | 1,873,317 | JPMorgan Chase Bank, N.A. | 8/4/22 | (26,127) |
| RON | 6,542,000 | USD | 1,406,505 | BNP Paribas S.A. | 8/4/22 | (26,693) |
| RON | 4,767,000 | USD | 1,017,154 | BNP Paribas S.A. | 8/4/22 | (11,718) |
| RON | 822,000 | USD | 174,192 | Citibank, N. A. | 8/4/22 | (819) |
| RON | 9,946,000 | USD | 2,145,847 | HSBC Bank | 8/4/22 | (48,078) |
| THB | 562,612,000 | USD | 16,229,973 | JPMorgan Chase Bank, N.A. | 8/4/22 | (271,612) |
| THB | 71,245,000 | USD | 2,075,601 | JPMorgan Chase Bank, N.A. | 8/4/22 | (54,753) |
| THB | 27,297,000 | USD | 774,383 | JPMorgan Chase Bank, N.A. | 8/4/22 | (110) |
| THB | 110,054,000 | USD | 3,118,561 | JPMorgan Chase Bank, N.A. | 8/4/22 | 3,096 |
| THB | 69,344,000 | USD | 1,977,303 | JPMorgan Chase Bank, N.A. | 8/4/22 | (10,376) |
| TRY | 23,089,000 | USD | 1,354,450 | Citibank, N. A. | 8/4/22 | 3,680 |
| USD | 1,061,612 | BRL | 5,531,000 | Bank of America, N.A. | 8/4/22 | 14,778 |
| USD | 3,703,781 | BRL | 19,453,000 | Citibank, N. A. | 8/4/22 | 21,976 |
| USD | 1,310,145 | BRL | 6,328,000 | Citibank, N. A. | 8/4/22 | 112,465 |
| USD | 997,957 | BRL | 4,884,000 | Citibank, N. A. | 8/4/22 | 73,578 |
| USD | 209,662 | BRL | 1,009,000 | HSBC Bank | 8/4/22 | 18,692 |
| USD | 1,013,455 | BRL | 4,896,000 | JPMorgan Chase Bank, N.A. | 8/4/22 | 86,805 |
| USD | 3,942,903 | CLP | 3,343,582,000 | Citibank, N. A. | 8/4/22 | 324,895 |
| USD | 923,271 | CLP | 823,096,000 | Citibank, N. A. | 8/4/22 | 32,619 |
| USD | 2,403,161 | CNY | 16,118,000 | HSBC Bank | 8/4/22 | (2,574) |
| USD | 1,272,591 | CNY | 8,520,000 | HSBC Bank | 8/4/22 | 916 |
| USD | 1,876,937 | CNY | 12,598,000 | JPMorgan Chase Bank, N.A. | 8/4/22 | (3,411) |
| USD | 685,867 | COP | 2,730,300,000 | BNP Paribas S.A. | 8/4/22 | 31,962 |
| USD | 379,589 | COP | 1,459,900,000 | BNP Paribas S.A. | 8/4/22 | 29,944 |
| USD | 863,446 | COP | 3,307,000,000 | Citibank, N. A. | 8/4/22 | 71,422 |
| USD | 2,061,288 | COP | 8,240,000,000 | State Street Bank And Trust Co | 8/4/22 | 87,813 |
| USD | 1,080,223 | CZK | 25,012,000 | BNP Paribas S.A. | 8/4/22 | 25,549 |
| USD | 1,073,197 | CZK | 25,304,000 | Goldman Sachs Bank USA | 8/4/22 | 6,210 |
| USD | 755,921 | HUF | 289,620,000 | BNP Paribas S.A. | 8/4/22 | (5,788) |
| USD | 2,001,004 | HUF | 736,648,000 | JPMorgan Chase Bank, N.A. | 8/4/22 | 63,599 |
| USD | 2,148,538 | IDR | 31,642,600,000 | BNP Paribas S.A. | 8/4/22 | 25,373 |
| USD | 2,486,038 | IDR | 36,216,600,000 | Goldman Sachs Bank USA | 8/4/22 | 55,964 |
| USD | 248,114 | IDR | 3,590,700,000 | Goldman Sachs Bank USA | 8/4/22 | 7,184 |
| USD | 2,033,198 | IDR | 30,441,300,000 | HSBC Bank | 8/4/22 | (9,363) |
| USD | 1,061,057 | IDR | 15,598,600,000 | HSBC Bank | 8/4/22 | 14,417 |
| USD | 536,854 | INR | 41,880,000 | Citibank, N. A. | 8/4/22 | 7,732 |
| USD | 3,456,715 | KZT | 1,551,028,000 | Citibank, N. A. | 8/4/22 | 192,525 |
| USD | 726,736 | KZT | 320,854,000 | JPMorgan Chase Bank, N.A. | 8/4/22 | 51,488 |
| USD | 2,067,839 | MXN | 41,804,000 | BNP Paribas S.A. | 8/4/22 | 677 |
| USD | 2,055,964 | MXN | 40,767,000 | Citibank, N. A. | 8/4/22 | 40,081 |
| USD | 1,331,232 | MXN | 27,012,000 | Goldman Sachs Bank USA | 8/4/22 | (4,482) |
| USD | 938,546 | MXN | 18,882,000 | Goldman Sachs Bank USA | 8/4/22 | 4,852 |
| USD | 1,063,968 | MXN | 22,049,000 | Goldman Sachs Bank USA | 8/4/22 | (26,330) |
| USD | 1,998,323 | MXN | 39,829,000 | HSBC Bank | 8/4/22 | 28,823 |
| USD | 898,110 | MXN | 18,113,000 | State Street Bank And Trust Co | 8/4/22 | 2,442 |
| USD | 28,951,000 | MYR | 9,615,000 | Goldman Sachs Bank USA | 8/4/22 | (8,822) |
| USD | 1,505,447 | MYR | 6,633,000 | Goldman Sachs Bank USA | 8/4/22 | 683 |
| USD | 2,007,257 | MYR | 8,851,000 | Goldman Sachs Bank USA | 8/4/22 | (683) |
| USD | 998,803 | PEN | 3,754,000 | Citibank, N. A. | 8/4/22 | 21,580 |
| USD | 762,010 | PHP | 40,638,000 | BNP Paribas S.A. | 8/4/22 | 23,708 |
| USD | 1,040,683 | PHP | 55,458,000 | HSBC Bank | 8/4/22 | 33,134 |
| USD | 976,627 | PHP | 53,109,000 | State Street Bank And Trust Co | 8/4/22 | 11,755 |
| USD | 2,062,557 | PLN | 9,015,000 | BNP Paribas S.A. | 8/4/22 | 59,861 |
| USD | 1,983,244 | PLN | 8,975,000 | Bank of America, N.A. | 8/4/22 | (10,566) |
| USD | 1,762,252 | PLN | 7,866,000 | Citibank, N. A. | 8/4/22 | 14,808 |
| USD | 1,036,938 | PLN | 4,512,000 | Goldman Sachs Bank USA | 8/4/22 | 34,590 |
| USD | 3,112,703 | PLN | 14,066,000 | HSBC Bank | 8/4/22 | (12,080) |
| USD | 953,375 | PLN | 4,154,000 | JPMorgan Chase Bank, N.A. | 8/4/22 | 30,557 |
| USD | 1,049,492 | RON | 4,980,000 | BNP Paribas S.A. | 8/4/22 | (869) |
| USD | 932,377 | RON | 4,370,000 | BNP Paribas S.A. | 8/4/22 | 10,675 |
| USD | 1,939,364 | RON | 9,283,000 | BNP Paribas S.A. | 8/4/22 | (18,568) |
| USD | 451,179 | RON | 2,103,000 | Citibank, N. A. | 8/4/22 | 7,623 |
| USD | 637,076 | RON | 3,003,000 | Goldman Sachs Bank USA | 8/4/22 | 3,696 |
| USD | 375,521 | RON | 1,816,000 | HSBC Bank | 8/4/22 | (7,503) |
| USD | 818,912 | THB | 28,951,000 | JPMorgan Chase Bank, N.A. | 8/4/22 | (2,276) |
| USD | 2,650,523 | THB | 90,833,000 | JPMorgan Chase Bank, N.A. | 8/4/22 | 74,066 |
| USD | 1,982,255 | THB | 68,031,000 | JPMorgan Chase Bank, N.A. | 8/4/22 | 52,572 |
| USD | 1,307,280 | THB | 44,741,000 | JPMorgan Chase Bank, N.A. | 8/4/22 | 38,212 |
| USD | 839,517 | TRY | 14,360,000 | JPMorgan Chase Bank, N.A. | 8/4/22 | (5,159) |
| USD | 493,917 | TRY | 8,729,000 | JPMorgan Chase Bank, N.A. | 8/4/22 | (19,536) |
| USD | 1,055,849 | ZAR | 16,973,000 | Brown Brothers Harriman & Co | 8/4/22 | 15,888 |
| USD | 983,344 | ZAR | 15,849,000 | Brown Brothers Harriman & Co | 8/4/22 | 12,252 |
| USD | 1,103,937 | ZAR | 17,521,000 | Goldman Sachs Bank USA | 8/4/22 | 30,399 |
| USD | 1,083,708 | ZAR | 17,829,000 | HSBC Bank | 8/4/22 | (8,701) |
| USD | 1,027,712 | ZAR | 16,540,000 | HSBC Bank | 8/4/22 | 14,281 |
| USD | 760,547 | ZAR | 12,240,000 | JPMorgan Chase Bank, N.A. | 8/4/22 | 10,584 |
| ZAR | 16,973,000 | USD | 1,041,821 | BNP Paribas S.A. | 8/4/22 | (1,859) |
| ZAR | 12,380,000 | USD | 789,026 | HSBC Bank | 8/4/22 | (30,485) |
| ZAR | 27,959,000 | USD | 1,778,959 | HSBC Bank | 8/4/22 | (65,869) |
| ZAR | 18,782,000 | USD | 1,194,800 | JPMorgan Chase Bank, N.A. | 8/4/22 | (43,999) |
| TOTAL FORWARD FOREIGN CURRENCY CONTRACTS | | | | | | $592,274 |
| | | | | | Unrealized Appreciation | 2,317,906 |
| | | | | | Unrealized Depreciation | (1,725,632) |
For the period, the average contract value for forward foreign currency contracts was $238,774,548. Contract value represents contract amount in United States dollars plus or minus unrealized appreciation or depreciation, respectively
Currency Abbreviations
BRL – Brazilian real
CLP – Chilean peso
CNY – Chinese yuan
COP – Colombian peso
CZK – Czech koruna
DOP – Dominican Republic peso
EGP – Egyptian pound
HUF – Hungarian forint
IDR – Indonesian rupiah
INR – Indian rupee
KZT – Kazakhstan tenge
MXN – Mexican peso
MYR – Malyasian ringgit
PEN – Peruvian new sol
PHP – Philippine peso
PLN – Polish zloty
RON – Romanian leu (new)
RUB – Russian ruble
THB – Thai baht
TRY – Turkish Lira
UAH – Ukrainian hryvnia
USD – United States dollar
UYU – Uruguay peso
ZAR – South African rand
Categorizations in the Schedule of Investments are based on country or territory of incorporation.
Legend
(a) Amount is stated in United States dollars unless otherwise noted.
(b) Security exempt from registration under Rule 144A of the Securities Act of 1933. These securities may be resold in transactions exempt from registration, normally to qualified institutional buyers. At the end of the period, the value of these securities amounted to $976,622 or 0.3% of net assets.
(c) Non-income producing - Security is in default.
(d) Level 3 security
(e) Affiliated fund that is generally available only to investment companies and other accounts managed by Fidelity Investments. The rate quoted is the annualized seven-day yield of the fund at period end. A complete unaudited listing of the fund's holdings as of its most recent quarter end is available upon request. In addition, each Fidelity Central Fund's financial statements are available on the SEC's website or upon request.
Affiliated Central Funds
Fiscal year to date information regarding the Fund's investments in Fidelity Central Funds, including the ownership percentage, is presented below.
| Fund | Value, beginning of period | Purchases | Sales Proceeds | Dividend Income | Realized Gain/Loss | Change in Unrealized appreciation (depreciation) | Value, end of period | % ownership, end of period |
| Fidelity Cash Central Fund 1.58% | $54,451,175 | $115,890,096 | $115,423,306 | $105,027 | $-- | $-- | $54,917,965 | 0.1% |
| Total | $54,451,175 | $115,890,096 | $115,423,306 | $105,027 | $-- | $-- | $54,917,965 | |
Amounts in the income column in the above table include any capital gain distributions from underlying funds, which are presented in the corresponding line-item in the Statement of Operations, if applicable.
Investment Valuation
The following is a summary of the inputs used, as of June 30, 2022, involving the Fund's assets and liabilities carried at fair value. The inputs or methodology used for valuing securities may not be an indication of the risk associated with investing in those securities. For more information on valuation inputs, and their aggregation into the levels used below, please refer to the Investment Valuation section in the accompanying Notes to Financial Statements.
| | Valuation Inputs at Reporting Date: |
| Description | Total | Level 1 | Level 2 | Level 3 |
| Investments in Securities: | | | | |
| Foreign Government and Government Agency Obligations | $330,737,898 | $-- | $327,905,552 | $2,832,346 |
| Supranational Obligations | 4,334,561 | -- | 4,334,561 | -- |
| Money Market Funds | 54,917,965 | 54,917,965 | -- | -- |
| Total Investments in Securities: | $389,990,424 | $54,917,965 | $332,240,113 | $2,832,346 |
| Derivative Instruments: | | | | |
| Assets | | | | |
| Forward Foreign Currency Contracts | $ 2,317,906 | $-- | $ 2,317,906 | $-- |
| Total Assets | $ 2,317,906 | $-- | $ 2,317,906 | $-- |
| Liabilities | | | | |
| Forward Foreign Currency Contracts | $( 1,725,632) | $-- | $( 1,725,632) | $-- |
| Total Liabilities | $( 1,725,632) | $-- | $( 1,725,632) | $-- |
| Total Derivatives Instruments: | $ 592,274 | $-- | $ 592,274 | $-- |
The following is a reconciliation of Investments in Securities for which Level 3 inputs were used in determining value:
| Investments in Securities: | |
| Foreign Government and Government Agency Obligations | |
| Beginning Balance | $-- |
| Net Realized Gain (Loss) on Investment Securities | (333,498) |
| Net Unrealized Gain (Loss) on Investment Securities | (18,512,804) |
| Cost of Purchases | 3,759,492 |
| Proceeds of Sales | (1,813,264) |
| Amortization/Accretion | (125,033) |
| Transfers into Level 3 | 19,857,453 |
| Transfers out of Level 3 | -- |
| Ending Balance | $2,832,346 |
| The change in unrealized gain (loss) for the period attributable to Level 3 securities held at June 30, 2022 | $(18,512,804) |
| Other Investments in Securities | |
| Beginning Balance | $1,093,413 |
| Net Realized Gain (Loss) on Investment Securities | -- |
| Net Unrealized Gain (Loss) on Investment Securities | -- |
| Cost of Purchases | -- |
| Proceeds of Sales | -- |
| Amortization/Accretion | -- |
| Transfers into Level 3 | -- |
| Transfers out of Level 3 | (1,093,413) |
| Ending Balance | $-- |
| The change in unrealized gain (loss) for the period attributable to Level 3 securities held at June 30, 2022 | $-- |
The information used in the above reconciliations represents fiscal year to date activity for any Investments in Securities identified as using Level 3 inputs at either the beginning or the end of the current fiscal period. Transfers into Level 3 were attributable to a lack of observable market data resulting from decreases in market activity, decreases in liquidity, security restructurings or corporate actions. Transfers out of Level 3 were attributable to observable market data becoming available for those securities. Cost of purchases and proceeds of sales may include securities received and/or delivered through in-kind transactions. Transfers in or out of Level 3 represent the beginning value of any Security or Instrument where a change in the pricing level occurred from the beginning to the end of the period. The cost of purchases and the proceeds of sales may include securities received or delivered through corporate actions or exchanges. Realized and unrealized gains (losses) disclosed in the reconciliations are included in Net Gain (Loss) on the Fund's Statement of Operations.
Value of Derivative Instruments
The following table is a summary of the Fund's value of derivative instruments by primary risk exposure as of June 30, 2022. For additional information on derivative instruments, please refer to the Derivative Instruments section in the accompanying Notes to Financial Statements.
| Primary Risk Exposure / Derivative Type | Value |
| | Asset | Liability |
| Foreign Exchange Risk | | |
| Forward Foreign Currency Contracts(a) | $2,317,906 | $(1,725,632) |
| Total Foreign Exchange Risk | 2,317,906 | (1,725,632) |
| Total Value of Derivatives | $2,317,906 | $(1,725,632) |
(a) Gross value is presented in the Statement of Assets and Liabilities in the unrealized appreciation/depreciation on forward foreign currency contracts line-items.
The following table is a summary of the Fund's derivatives inclusive of potential netting arrangements.
| Counterparty | Value of Derivative Assets | Value of Derivative Liabilities | Collateral Received(a) | Collateral Pledged(b) | Net(b) |
| Citibank, N. A. | $925,095 | $(450,195) | $-- | $-- | $474,900 |
| BNP Paribas S.A. | 539,939 | (98,009) | -- | -- | 441,930 |
| JPMorgan Chase Bank, N.A. | 410,979 | (568,952) | -- | -- | (157,973) |
| HSBC Bank | 152,078 | (306,372) | -- | -- | (154,294) |
| Goldman Sachs Bank USA | 143,578 | (255,575) | -- | -- | (111,997) |
| State Street Bank And Trust Co | 103,319 | (35,963) | -- | -- | 67,356 |
| Brown Brothers Harriman & Co | 28,140 | -- | -- | -- | 28,140 |
| Bank of America, N.A. | 14,778 | (10,566) | -- | -- | 4,212 |
| Total | $2,317,906 | $(1,725,632) | | | |
(a) Reflects collateral received from or pledged to an individual counterparty, excluding any excess or initial collateral amounts.
(b) Net represents the receivable / (payable) that would be due from / (to) the counterparty in an event of default. Netting may be allowed across transactions traded under the same legal agreement with the same legal entity. Please refer to Derivative Instruments - Risk Exposures and the Use of Derivative Instruments section in the accompanying Notes to Financial Statements.
Other Information
The composition of credit quality ratings as a percentage of Total Net Assets is as follows (Unaudited):
| AAA,AA,A | 6.0% |
| BBB | 16.6% |
| BB | 14.8% |
| Not Rated | 48.9% |
| Short-Term Investments and Net Other Assets | 13.7% |
| | 100% |
We have used ratings from Moody's Investors Service, Inc. Where Moody's® ratings are not available, we have used S&P® ratings. All ratings are as of the date indicated and do not reflect subsequent changes.
See accompanying notes which are an integral part of the financial statements.
Fidelity® Series Emerging Markets Debt Local Currency Fund
Financial Statements
Statement of Assets and Liabilities
| | | June 30, 2022 (Unaudited) |
| Assets | | |
Investment in securities, at value — See accompanying schedule:
Unaffiliated issuers (cost $405,174,255) | $335,072,459 | |
| Fidelity Central Funds (cost $54,917,965) | 54,917,965 | |
| Total Investment in Securities (cost $460,092,220) | | $389,990,424 |
| Cash | | 3,057 |
| Foreign currency held at value (cost $51,494) | | 50,016 |
| Unrealized appreciation on forward foreign currency contracts | | 2,317,906 |
| Receivable for fund shares sold | | 79,986 |
| Interest receivable | | 7,361,677 |
| Distributions receivable from Fidelity Central Funds | | 43,098 |
| Receivable from investment adviser for expense reductions | | 4,952 |
| Total assets | | 399,851,116 |
| Liabilities | | |
| Unrealized depreciation on forward foreign currency contracts | $1,725,632 | |
| Payable for fund shares redeemed | 9,660,339 | |
| Other payables and accrued expenses | 31,376 | |
| Total liabilities | | 11,417,347 |
| Net Assets | | $388,433,769 |
| Net Assets consist of: | | |
| Paid in capital | | $476,655,865 |
| Total accumulated earnings (loss) | | (88,222,096) |
| Net Assets | | $388,433,769 |
| Net Asset Value, offering price and redemption price per share ($388,433,769 ÷ 46,798,685 shares) | | $8.30 |
See accompanying notes which are an integral part of the financial statements.
Statement of Operations
| | | Six months ended June 30, 2022 (Unaudited) |
| Investment Income | | |
| Interest | | $10,256,318 |
| Income from Fidelity Central Funds | | 105,027 |
| Income before foreign taxes withheld | | 10,361,345 |
| Less foreign taxes withheld | | (288,389) |
| Total income | | 10,072,956 |
| Expenses | | |
| Custodian fees and expenses | $35,241 | |
| Independent trustees' fees and expenses | 752 | |
| Total expenses before reductions | 35,993 | |
| Expense reductions | (28,856) | |
| Total expenses after reductions | | 7,137 |
| Net investment income (loss) | | 10,065,819 |
| Realized and Unrealized Gain (Loss) | | |
| Net realized gain (loss) on: | | |
| Investment securities: | | |
| Unaffiliated issuers (net of foreign taxes of $13,320) | (11,018,911) | |
| Forward foreign currency contracts | (9,128,449) | |
| Foreign currency transactions | (214,953) | |
| Total net realized gain (loss) | | (20,362,313) |
| Change in net unrealized appreciation (depreciation) on: | | |
| Investment securities: | | |
| Unaffiliated issuers (net of decrease in deferred foreign taxes of $22,335) | (44,705,087) | |
| Forward foreign currency contracts | 1,133,574 | |
| Assets and liabilities in foreign currencies | (181,061) | |
| Total change in net unrealized appreciation (depreciation) | | (43,752,574) |
| Net gain (loss) | | (64,114,887) |
| Net increase (decrease) in net assets resulting from operations | | $(54,049,068) |
See accompanying notes which are an integral part of the financial statements.
Statement of Changes in Net Assets
| | Six months ended June 30, 2022 (Unaudited) | Year ended December 31, 2021 |
| Increase (Decrease) in Net Assets | | |
| Operations | | |
| Net investment income (loss) | $10,065,819 | $20,725,189 |
| Net realized gain (loss) | (20,362,313) | (9,408,060) |
| Change in net unrealized appreciation (depreciation) | (43,752,574) | (54,219,787) |
| Net increase (decrease) in net assets resulting from operations | (54,049,068) | (42,902,658) |
| Distributions to shareholders | – | (22,490,689) |
| Share transactions | | |
| Proceeds from sales of shares | 15,043,653 | 102,412,761 |
| Reinvestment of distributions | – | 22,490,402 |
| Cost of shares redeemed | (55,869,421) | (68,949,646) |
| Net increase (decrease) in net assets resulting from share transactions | (40,825,768) | 55,953,517 |
| Total increase (decrease) in net assets | (94,874,836) | (9,439,830) |
| Net Assets | | |
| Beginning of period | 483,308,605 | 492,748,435 |
| End of period | $388,433,769 | $483,308,605 |
| Other Information | | |
| Shares | | |
| Sold | 1,706,444 | 10,055,460 |
| Issued in reinvestment of distributions | – | 2,338,709 |
| Redeemed | (6,146,841) | (6,737,856) |
| Net increase (decrease) | (4,440,397) | 5,656,313 |
See accompanying notes which are an integral part of the financial statements.
Financial Highlights
Fidelity Series Emerging Markets Debt Local Currency Fund
| | Six months ended (Unaudited) June 30, | Years endedDecember 31, | |
| | 2022 | 2021 | 2020 A |
| Selected Per–Share Data | | | |
| Net asset value, beginning of period | $9.43 | $10.81 | $10.00 |
| Income from Investment Operations | | | |
| Net investment income (loss)B,C | .208 | .439 | .067 |
| Net realized and unrealized gain (loss) | (1.338) | (1.358) | .806 |
| Total from investment operations | (1.130) | (.919) | .873 |
| Distributions from net investment income | – | (.456) | (.063) |
| Distributions from net realized gain | – | (.005) | – |
| Total distributions | – | (.461) | (.063) |
| Net asset value, end of period | $8.30 | $9.43 | $10.81 |
| Total ReturnD,E | (11.98)% | (8.56)% | 8.74% |
| Ratios to Average Net AssetsC,F,G | | | |
| Expenses before reductions | .02%H | .03% | .04%H |
| Expenses net of fee waivers, if any | - %H,I | - %I | - %H,I |
| Expenses net of all reductions | - %H,I | - %I | - %H,I |
| Net investment income (loss) | 4.71%H | 4.31% | 3.69%H |
| Supplemental Data | | | |
| Net assets, end of period (000 omitted) | $388,434 | $483,309 | $492,748 |
| Portfolio turnover rateJ | 46%H | 65% | 17%K |
A For the period October 30, 2020 (commencement of operations) through December 31, 2020.
B Calculated based on average shares outstanding during the period.
C Net investment income (loss) is affected by the timing of the declaration of dividends by any underlying mutual funds or exchange-traded funds (ETFs). Net investment income (loss) of any such underlying funds is not included in the Fund's net investment income (loss) ratio.
D Total returns for periods of less than one year are not annualized.
E Total returns would have been lower if certain expenses had not been reduced during the applicable periods shown.
F Fees and expenses of any underlying mutual funds or exchange-traded funds (ETFs) are not included in the Fund's expense ratio. The Fund indirectly bears its proportionate share of these expenses. For additional expense information related to investments in Fidelity Central Funds, please refer to the "Investments in Fidelity Central Funds" note found in the Notes to Financial Statements section of the most recent Annual or Semi-Annual report.
G Expense ratios reflect operating expenses of the class. Expenses before reductions do not reflect amounts reimbursed, waived, or reduced through arrangements with the investment adviser, brokerage services, or other offset arrangements, if applicable, and do not represent the amount paid by the class during periods when reimbursements, waivers or reductions occur.
H Annualized
I Amount represents less than .005%.
J Amount does not include the portfolio activity of any underlying mutual funds or exchange-traded funds (ETFs).
K Amount not annualized.
See accompanying notes which are an integral part of the financial statements.
Notes to Financial Statements (Unaudited)
For the period ended June 30, 2022
1. Organization.
Fidelity Series Emerging Markets Debt Fund and Fidelity Series Emerging Markets Debt Local Currency Fund are non-diversified funds of Fidelity Hastings Street Trust (the Trust). Each Fund is authorized to issue an unlimited number of shares. Shares of the Funds are only available for purchase by mutual funds for which Fidelity Management & Research Company LLC (FMR) or an affiliate serves as an investment manager. The Trust is registered under the Investment Company Act of 1940, as amended (the 1940 Act), as an open-end management investment company organized as a Massachusetts business trust. Investments in emerging markets, if applicable, can be subject to social, economic, regulatory, and political uncertainties and can be extremely volatile.
2. Investments in Fidelity Central Funds.
Funds may invest in Fidelity Central Funds, which are open-end investment companies generally available only to other investment companies and accounts managed by the investment adviser and its affiliates. The Schedule of Investments lists any Fidelity Central Funds held as an investment as of period end, but does not include the underlying holdings of each Fidelity Central Fund. An investing fund indirectly bears its proportionate share of the expenses of the underlying Fidelity Central Funds.
Based on its investment objective, each Fidelity Central Fund may invest or participate in various investment vehicles or strategies that are similar to those of the investing fund. These strategies are consistent with the investment objectives of the investing fund and may involve certain economic risks which may cause a decline in value of each of the Fidelity Central Funds and thus a decline in the value of the investing fund.
| Fidelity Central Fund | Investment Manager | Investment Objective | Investment Practices | Expense Ratio(a) |
| Fidelity Money Market Central Funds | Fidelity Management & Research Company LLC (FMR) | Each fund seeks to obtain a high level of current income consistent with the preservation of capital and liquidity. | Short-term Investments | Less than .005% |
(a) Expenses expressed as a percentage of average net assets and are as of each underlying Central Fund's most recent annual or semi-annual shareholder report.
A complete unaudited list of holdings for each Fidelity Central Fund is available upon request or at the Securities and Exchange Commission website at www.sec.gov. In addition, the financial statements of the Fidelity Central Funds which contain the significant accounting policies (including investment valuation policies) of those funds, and are not covered by the Report of Independent Registered Public Accounting Firm, are available on the Securities and Exchange Commission website or upon request.
3. Significant Accounting Policies.
Each Fund is an investment company and applies the accounting and reporting guidance of the Financial Accounting Standards Board (FASB) Accounting Standards Codification Topic 946 Financial Services - Investment Companies. The financial statements have been prepared in conformity with accounting principles generally accepted in the United States of America (GAAP), which require management to make certain estimates and assumptions at the date of the financial statements. Actual results could differ from those estimates. Subsequent events, if any, through the date that the financial statements were issued have been evaluated in the preparation of the financial statements. Each Fund's Schedule of Investments lists any underlying mutual funds or exchange-traded funds (ETFs) but does not include the underlying holdings of these funds. The following summarizes the significant accounting policies of each Fund:
Investment Valuation. Investments are valued as of 4:00 p.m. Eastern time on the last calendar day of the period. The Board of Trustees (the Board) has delegated the day to day responsibility for the valuation of each Fund's investments to the Fair Value Committee (the Committee) established by each Fund's investment adviser. In accordance with valuation policies and procedures approved by the Board, each Fund attempts to obtain prices from one or more third party pricing vendors or brokers to value its investments. When current market prices, quotations or currency exchange rates are not readily available or reliable, investments will be fair valued in good faith by the Committee, in accordance with procedures adopted by the Board. Factors used in determining fair value vary by investment type and may include market or investment specific events, changes in interest rates and credit quality. The frequency with which these procedures are used cannot be predicted and they may be utilized to a significant extent. The Committee oversees each Fund's valuation policies and procedures and reports to the Board on the Committee's activities and fair value determinations. The Board monitors the appropriateness of the procedures used in valuing each Fund's investments and ratifies the fair value determinations of the Committee.
Each Fund categorizes the inputs to valuation techniques used to value its investments into a disclosure hierarchy consisting of three levels as shown below:
- Level 1 – unadjusted quoted prices in active markets for identical investments
- Level 2 – other significant observable inputs (including quoted prices for similar investments, interest rates, prepayment speeds, etc.)
- Level 3 – unobservable inputs (including the Fund's own assumptions based on the best information available)
Valuation techniques used to value each Fund's investments by major category are as follows:
Debt securities, including restricted securities, are valued based on evaluated prices received from third party pricing vendors or from brokers who make markets in such securities. Corporate bonds, foreign government and government agency obligations, preferred securities and supranational obligations are valued by pricing vendors who utilize matrix pricing which considers yield or price of bonds of comparable quality, coupon, maturity and type or by broker-supplied prices. When independent prices are unavailable or unreliable, debt securities may be valued utilizing pricing methodologies which consider similar factors that would be used by third party pricing vendors. For foreign debt securities, when significant market or security specific events arise, valuations may be determined in good faith in accordance with procedures adopted by the Board. Debt securities are generally categorized as Level 2 in the hierarchy but may be Level 3 depending on the circumstances. Each Fund invests a significant portion of its assets in below investment grade securities. The value of these securities can be more volatile due to changes in the credit quality of the issuer and is sensitive to changes in economic, market and regulatory conditions.
The U.S. dollar value of foreign currency contracts is determined using currency exchange rates supplied by a pricing service and are categorized as Level 2 in the hierarchy. Investments in open-end mutual funds, including the Fidelity Central Funds, are valued at their closing net asset value (NAV) each business day and are categorized as Level 1 in the hierarchy.
Changes in valuation techniques may result in transfers in or out of an assigned level within the disclosure hierarchy. The aggregate value of investments by input level as of June 30, 2022, as well as a roll forward of Level 3 investments, is included at the end of each Fund's Schedule of Investments.
Foreign Currency. Foreign-denominated assets, including investment securities, and liabilities are translated into U.S. dollars at the exchange rates at period end. Purchases and sales of investment securities, income and dividends received, and expenses denominated in foreign currencies are translated into U.S. dollars at the exchange rate in effect on the transaction date.
The effects of exchange rate fluctuations on investments are included with the net realized and unrealized gain (loss) on investment securities. Other foreign currency transactions resulting in realized and unrealized gain (loss) are disclosed separately.
Realized gains and losses on foreign currency transactions arise from the disposition of foreign currency, realized changes in the value of foreign currency between the trade and settlement dates on security transactions, and the difference between the amounts of dividends, interest and foreign withholding taxes recorded on transaction date and the U.S. dollar equivalent of the amounts actually received or paid. Unrealized gains and losses on assets and liabilities in foreign currencies arise from changes in the value of foreign currency, and from assets and liabilities denominated in foreign currencies, other than investments, which are held at period end.
Investment Transactions and Income. For financial reporting purposes, the Funds' investment holdings and NAV include trades executed through the end of the last business day of the period. The NAV per share for processing shareholder transactions is calculated as of the close of business of the New York Stock Exchange (NYSE), normally 4:00 p.m. Eastern time and includes trades executed through the end of the prior business day. Gains and losses on securities sold are determined on the basis of identified cost and for certain Funds include proceeds received from litigation. Commissions paid to certain brokers with whom the investment adviser, or its affiliates, places trades on behalf of a fund include an amount in addition to trade execution, which may be rebated back to a fund. Any such rebates are included in net realized gain (loss) on investments in the Statement of Operations. Income and capital gain distributions from Fidelity Central Funds, if any, are recorded on the ex-dividend date. Interest income is accrued as earned and includes coupon interest and amortization of premium and accretion of discount on debt securities as applicable. Investment income is recorded net of foreign taxes withheld where recovery of such taxes is uncertain. Debt obligations may be placed on non-accrual status and related interest income may be reduced by ceasing current accruals and writing off interest receivables when the collection of all or a portion of interest has become doubtful based on consistently applied procedures. A debt obligation is removed from non-accrual status when the issuer resumes interest payments or when collectability of interest is reasonably assured.
Expenses. Expenses directly attributable to a fund are charged to that fund. Expenses attributable to more than one fund are allocated among the respective funds on the basis of relative net assets or other appropriate methods. Expenses included in the accompanying financial statements reflect the expenses of that fund and do not include any expenses associated with any underlying mutual funds or exchange-traded funds. Although not included in a fund's expenses, a fund indirectly bears its proportionate share of these expenses through the net asset value of each underlying mutual fund or exchange-traded fund. Expense estimates are accrued in the period to which they relate and adjustments are made when actual amounts are known.
Income Tax Information and Distributions to Shareholders. Each year, each Fund intends to qualify as a regulated investment company under Subchapter M of the Internal Revenue Code, including distributing substantially all of its taxable income and realized gains. As a result, no provision for U.S. Federal income taxes is required. Each Fund files a U.S. federal tax return, in addition to state and local tax returns as required. Each Fund's federal income tax returns are subject to examination by the Internal Revenue Service (IRS) for a period of three fiscal years after they are filed. State and local tax returns may be subject to examination for an additional fiscal year depending on the jurisdiction. Foreign taxes are provided for based on each Fund's understanding of the tax rules and rates that exist in the foreign markets in which it invests. Fidelity Series Emerging Markets Debt Local Currency Fund is subject to a tax imposed on capital gains by certain countries in which it invests.
Distributions are declared and recorded daily and paid monthly from net investment income. Distributions from realized gains, if any, are declared and recorded on the ex-dividend date. Income and capital gain distributions are determined in accordance with income tax regulations, which may differ from GAAP.
Capital accounts within the financial statements are adjusted for permanent book-tax differences. These adjustments have no impact on net assets or the results of operations. Capital accounts are not adjusted for temporary book-tax differences which will reverse in a subsequent period.
Book-tax differences are primarily due to foreign currency transactions, certain foreign taxes, market discount, capital loss carryforwards, and losses deferred due to wash sales and excise tax regulations.
As of period end, the cost and unrealized appreciation (depreciation) in securities, and derivatives if applicable, for federal income tax purposes were as follows for each Fund:
| | Tax cost | Gross unrealized appreciation | Gross unrealized depreciation | Net unrealized appreciation (depreciation) |
| Fidelity Series Emerging Markets Debt Fund | $1,463,705,389 | $7,546,394 | $(331,160,668) | $(323,614,274) |
| Fidelity Series Emerging Markets Debt Local Currency Fund | 464,100,901 | 2,706,825 | (76,225,028) | (73,518,203) |
Capital loss carryforwards are only available to offset future capital gains of the Funds to the extent provided by regulations and may be limited. The capital loss carryforward information presented below, including any applicable limitation, is estimated as of prior fiscal period end and is subject to adjustment.
| | | | |
| | Short-term | Long-term | Total capital loss carryforward |
| Fidelity Series Emerging Markets Debt Fund | $(13,730,536) | $(71,944,615) | $(85,675,151) |
| Fidelity Series Emerging Markets Debt Local Currency Fund | (3,485,070) | (616,835) | (4,101,905) |
Certain of the Funds elected to defer to the next fiscal year ordinary losses recognized during the period November 1, 2021 to December 31, 2021. Loss deferrals were as follows:
| | Ordinary losses |
| Fidelity Series Emerging Markets Debt Local Currency Fund | $1,373,226 |
Delayed Delivery Transactions and When-Issued Securities. During the period, certain Funds transacted in securities on a delayed delivery or when-issued basis. Payment and delivery may take place after the customary settlement period for that security. The price of the underlying securities and the date when the securities will be delivered and paid for are fixed at the time the transaction is negotiated. Securities purchased on a delayed delivery or when-issued basis are identified as such in the Schedule of Investments. Compensation for interest forgone in the purchase of a delayed delivery or when-issued debt security may be received. With respect to purchase commitments, each applicable Fund identifies securities as segregated in its records with a value at least equal to the amount of the commitment. Payables and receivables associated with the purchases and sales of delayed delivery securities having the same coupon, settlement date and broker are offset. Delayed delivery or when-issued securities that have been purchased from and sold to different brokers are reflected as both payables and receivables in the Statement of Assets and Liabilities under the caption "Delayed delivery", as applicable. Losses may arise due to changes in the value of the underlying securities or if the counterparty does not perform under the contract's terms, or if the issuer does not issue the securities due to political, economic, or other factors.
Restricted Securities (including Private Placements). Funds may invest in securities that are subject to legal or contractual restrictions on resale. These securities generally may be resold in transactions exempt from registration or to the public if the securities are registered. Disposal of these securities may involve time-consuming negotiations and expense, and prompt sale at an acceptable price may be difficult. Information regarding restricted securities held at period end is included at the end of the Schedule of Investments, if applicable.
4. Derivative Instruments.
Risk Exposures and the Use of Derivative Instruments. Investment objectives allow a fund to enter into various types of derivative contracts, including forward foreign currency contracts. Derivatives are investments whose value is primarily derived from underlying assets, indices or reference rates and may be transacted on an exchange or over-the-counter (OTC). Derivatives may involve a future commitment to buy or sell a specified asset based on specified terms, to exchange future cash flows at periodic intervals based on a notional principal amount, or for one party to make one or more payments upon the occurrence of specified events in exchange for periodic payments from the other party.
Derivatives were used to increase returns, to facilitate transactions in foreign-denominated securities and to manage exposure to certain risks as defined below. The success of any strategy involving derivatives depends on analysis of numerous economic factors, and if the strategies for investment do not work as intended, the objectives may not be achieved.
Derivatives were used to increase or decrease exposure to the following risk(s):
| Foreign Exchange Risk | Foreign exchange rate risk relates to fluctuations in the value of an asset or liability due to changes in currency exchange rates.
|
Funds are also exposed to additional risks from investing in derivatives, such as liquidity risk and counterparty credit risk. Liquidity risk is the risk that a fund will be unable to close out the derivative in the open market in a timely manner. Counterparty credit risk is the risk that the counterparty will not be able to fulfill its obligation to a fund. Derivative counterparty credit risk is managed through formal evaluation of the creditworthiness of all potential counterparties. On certain OTC derivatives such as forward foreign currency contracts, a fund attempts to reduce its exposure to counterparty credit risk by entering into an International Swaps and Derivatives Association, Inc. (ISDA) Master Agreement with each of its counterparties. The ISDA Master Agreement gives a fund the right to terminate all transactions traded under such agreement upon the deterioration in the credit quality of the counterparty beyond specified levels. The ISDA Master Agreement gives each party the right, upon an event of default by the other party or a termination of the agreement, to close out all transactions traded under such agreement and to net amounts owed under each transaction to one net payable by one party to the other. To mitigate counterparty credit risk on bi-lateral OTC derivatives, a fund receives collateral in the form of cash or securities once net unrealized appreciation on outstanding derivative contracts under an ISDA Master Agreement exceeds certain applicable thresholds, subject to certain minimum transfer provisions. The collateral received is held in segregated accounts with the custodian bank in accordance with the collateral agreements entered into between a fund, the counterparty and the custodian bank. A fund could experience delays and costs in gaining access to the collateral even though it is held by the custodian bank. The maximum risk of loss to a fund from counterparty credit risk related to bi-lateral OTC derivatives is generally the aggregate unrealized appreciation and unpaid counterparty payments in excess of any collateral pledged by the counterparty to a fund. A fund may be required to pledge collateral for the benefit of the counterparties on bi-lateral OTC derivatives in an amount not less than each counterparty's unrealized appreciation on outstanding derivative contracts, subject to certain minimum transfer provisions, and any such pledged collateral is identified in the Schedule of Investments. A summary of derivatives inclusive of potential netting arrangements is presented at the end of the Schedule of Investments.
Investing in derivatives may involve greater risks than investing in the underlying assets directly and, to varying degrees, may involve risk of loss in excess of any initial investment and collateral received and amounts recognized in the Statement of Assets and Liabilities. In addition, there may be the risk that the change in value of the derivative contract does not correspond to the change in value of the underlying instrument.
Forward Foreign Currency Contracts. Forward foreign currency contracts represent obligations to purchase or sell foreign currency on a specified future date at a price fixed at the time the contracts are entered into. Forward foreign currency contracts were used to facilitate transactions in foreign-denominated securities and to manage exposure to certain foreign currencies.
Forward foreign currency contracts are valued daily and fluctuations in exchange rates on open contracts are recorded as unrealized appreciation or (depreciation) and reflected in the Statement of Assets and Liabilities. When the contract is closed, a gain or loss is realized equal to the difference between the closing value and the value at the time it was opened. Non-deliverable forward foreign currency exchange contracts are settled with the counterparty in cash without the delivery of foreign currency. The net realized gain (loss) and change in net unrealized appreciation (depreciation) on forward foreign currency contracts during the period is presented in the Statement of Operations.
Any open forward foreign currency contracts at period end are presented in the Schedule of Investments under the caption "Forward Foreign Currency Contracts." The contract amount and unrealized appreciation (depreciation) reflects each contract's exposure to the underlying currency at period end, and is representative of volume of activity during the period unless an average contract value is presented.
5. Purchases and Sales of Investments.
Purchases and sales of securities, other than short-term securities and in-kind transactions, as applicable, are noted in the table below.
| | Purchases ($) | Sales ($) |
| Fidelity Series Emerging Markets Debt Fund | 133,027,381 | 121,551,784 |
| Fidelity Series Emerging Markets Debt Local Currency Fund | 85,753,747 | 118,149,127 |
6. Fees and Other Transactions with Affiliates.
Management Fee. Fidelity Management & Research Company LLC (the investment adviser) and its affiliates provide the Funds with investment management related services for which the Funds do not pay a management fee. Under the management contract, the investment adviser or an affiliate pays all ordinary operating expenses of the Funds, except custody fees, fees and expenses of the independent Trustees, and certain miscellaneous expenses such as proxy and shareholder meeting expenses.
Interfund Trades. Funds may purchase from or sell securities to other Fidelity Funds under procedures adopted by the Board. The procedures have been designed to ensure these interfund trades are executed in accordance with Rule 17a-7 of the 1940 Act. Any interfund trades are included within the respective purchases and sales amounts shown in the Purchases and Sales of Investments note. During the period, there were no interfund trades.
7. Committed Line of Credit.
Certain Funds participate with other funds managed by the investment adviser or an affiliate in a $4.25 billion credit facility (the "line of credit") to be utilized for temporary or emergency purposes to fund shareholder redemptions or for other short-term liquidity purposes. The commitment fees on the pro-rata portion of the line of credit are borne by the investment adviser. During the period, there were no borrowings on this line of credit.
8. Expense Reductions.
The investment adviser contractually agreed to reimburse each Fund to the extent annual operating expenses exceeded certain levels of average net assets as noted in the table below. This reimbursement will remain in place through April 30, 2025. Some expenses, for example the compensation of the independent Trustees, and certain other expenses such as interest expense, are excluded from this reimbursement.
The following Funds were in reimbursement during the period:
| | Expense Limitations | Reimbursement |
| Fidelity Series Emerging Markets Debt Local Currency Fund | .003% | $28,778 |
Through arrangements with each applicable Fund's custodian, credits realized as a result of certain uninvested cash balances were used to reduce each applicable Fund's expenses. All of the applicable expense reductions are noted in the table below.
| | Custodian credits |
| Fidelity Series Emerging Markets Debt Fund | $299 |
| Fidelity Series Emerging Markets Debt Local Currency Fund | 78 |
9. Other.
A fund's organizational documents provide former and current trustees and officers with a limited indemnification against liabilities arising in connection with the performance of their duties to the fund. In the normal course of business, a fund may also enter into contracts that provide general indemnifications. A fund's maximum exposure under these arrangements is unknown as this would be dependent on future claims that may be made against a fund. The risk of material loss from such claims is considered remote.
At the end of the period, mutual funds and accounts managed by the investment adviser or its affiliates were the owners of record of all of the outstanding shares of the Funds.
10. Credit Risk.
The Fund's relatively large investment in countries with limited or developing capital markets may involve greater risks than investments in more developed markets and the prices of such investments may be volatile. The yields of emerging market debt obligations reflect, among other things, perceived credit risk. The consequences of political, social or economic changes in these markets may have disruptive effects on the market prices of the Fund's investments and the income they generate, as well as the Fund's ability to repatriate such amounts.
11. Coronavirus (COVID-19) Pandemic.
An outbreak of COVID-19 first detected in China during December 2019 has since spread globally and was declared a pandemic by the World Health Organization during March 2020. Developments that disrupt global economies and financial markets, such as the COVID-19 pandemic, may magnify factors that affect the Funds' performance.
Shareholder Expense Example
As a shareholder, you incur two types of costs: (1) transaction costs, which may include sales charges (loads) on purchase payments or redemption proceeds, as applicable and (2) ongoing costs, which generally include management fees, distribution and/or service (12b-1) fees and other Fund expenses. This Example is intended to help you understand your ongoing costs (in dollars) of investing in a fund and to compare these costs with the ongoing costs of investing in other mutual funds.
The Example is based on an investment of $1,000 invested at the beginning of the period and held for the entire period (January 1, 2022 to June 30, 2022).
Actual Expenses
The first line of the accompanying table provides information about actual account values and actual expenses. You may use the information in this line, together with the amount you invested, to estimate the expenses that you paid over the period. Simply divide your account value by $1,000.00 (for example, an $8,600 account value divided by $1,000.00 = 8.6), then multiply the result by the number in the first line for a class/Fund under the heading entitled "Expenses Paid During Period" to estimate the expenses you paid on your account during this period. If any fund is a shareholder of any underlying mutual funds or exchange-traded funds (ETFs) (the Underlying Funds), such fund indirectly bears its proportional share of the expenses of the Underlying Funds in addition to the direct expenses incurred presented in the table. These fees and expenses are not included in the annualized expense ratio used to calculate the expense estimate in the table below.
Hypothetical Example for Comparison Purposes
The second line of the accompanying table provides information about hypothetical account values and hypothetical expenses based on the actual expense ratio and an assumed rate of return of 5% per year before expenses, which is not the actual return. The hypothetical account values and expenses may not be used to estimate the actual ending account balance or expenses you paid for the period. You may use this information to compare the ongoing costs of investing in the Fund and other funds. To do so, compare this 5% hypothetical example with the 5% hypothetical examples that appear in the shareholder reports of the other funds. If any fund is a shareholder of any Underlying Funds, such fund indirectly bears its proportional share of the expenses of the Underlying Funds in addition to the direct expenses as presented in the table. These fees and expenses are not included in the annualized expense ratio used to calculate the expense estimate in the table below.
Please note that the expenses shown in the table are meant to highlight your ongoing costs only and do not reflect any transaction costs. Therefore, the second line of the table is useful in comparing ongoing costs only, and will not help you determine the relative total costs of owning different funds. In addition, if these transactional costs were included, your costs would have been higher.
| | Annualized Expense Ratio-A | Beginning
Account Value
January 1, 2022 | Ending
Account Value
June 30, 2022 | Expenses Paid
During Period-B
January 1, 2022
to June 30, 2022 |
| Fidelity Series Emerging Markets Debt Fund | - %-C | | | |
| Actual | | $1,000.00 | $823.30 | $--D |
| Hypothetical-E | | $1,000.00 | $1,024.79 | $--D |
| Fidelity Series Emerging Markets Debt Local Currency Fund | - %-C | | | |
| Actual | | $1,000.00 | $880.20 | $--D |
| Hypothetical-E | | $1,000.00 | $1,024.79 | $--D |
A Annualized expense ratio reflects expenses net of applicable fee waivers.
B Expenses are equal to the annualized expense ratio, multiplied by the average account value over the period, multiplied by 181/ 365 (to reflect the one-half year period). The fees and expenses of any Underlying Funds are not included in each annualized expense ratio.
C Amount represents less than .005%.
D Amount represents less than $.005.
E 5% return per year before expenses
Board Approval of Investment Advisory Contracts and Management Fees
Fidelity Series Emerging Markets Debt Fund
Fidelity Series Emerging Markets Debt Local Currency Fund
Each year, the Board of Trustees, including the Independent Trustees (together, the Board), votes on the renewal of the management contract with Fidelity Management & Research Company LLC (FMR) and the sub-advisory agreements (together, the Advisory Contracts) for each fund. FMR and the sub-advisers are referred to herein as the Investment Advisers. The Board, assisted by the advice of fund counsel and Independent Trustees' counsel, requests and considers a broad range of information relevant to the renewal of the Advisory Contracts throughout the year.
The Board meets regularly and, at each of its meetings, covers an extensive agenda of topics and materials and considers factors that are relevant to its annual consideration of the renewal of each fund's Advisory Contracts, including the services and support provided to each fund and its shareholders. The Board has established various standing committees (Committees), each composed of and chaired by Independent Trustees with varying backgrounds, to which the Board has assigned specific subject matter responsibilities in order to enhance effective decision-making by the Board. The Board, acting directly and through its Committees, requests and receives information concerning the annual consideration of the renewal of each fund's Advisory Contracts. The Board also meets as needed to review matters specifically related to the Board's annual consideration of the renewal of the Advisory Contracts. Members of the Board may also meet with trustees of other Fidelity funds through joint ad hoc committees to discuss certain matters relevant to all of the Fidelity funds.
At its May 2022 meeting, the Board unanimously determined to renew each fund's Advisory Contracts. In considering whether to renew the Advisory Contracts for each fund, the Board considered all factors it believed relevant and reached a determination, with the assistance of fund counsel and Independent Trustees' counsel and through the exercise of its business judgment, that the renewal of the Advisory Contracts was in the best interests of each fund and its shareholders and the fact that no fee is payable under the management contracts was fair and reasonable.
Nature, Extent, and Quality of Services Provided. The Board considered Fidelity's staffing as it relates to the funds, including the backgrounds of investment personnel of Fidelity, and also considered the funds' investment objectives, strategies, and related investment philosophies. The Independent Trustees also had discussions with senior management of Fidelity's investment operations and investment groups. The Board considered the structure of the investment personnel compensation program and whether this structure provides appropriate incentives to act in the best interests of each fund. The Board also considered the steps Fidelity had taken to ensure the continued provision of high quality services to the Fidelity funds during the COVID-19 pandemic, including the expansion of staff in client facing positions to maintain service levels in periods of high volumes and volatility.
Resources Dedicated to Investment Management and Support Services. The Board and the Fund Oversight and Research Committees reviewed the general qualifications and capabilities of Fidelity's investment staff, including its size, education, experience, and resources, as well as Fidelity's approach to recruiting, training, managing, and compensating investment personnel. The Board noted the resources devoted to expansion of Fidelity's global investment organization, and that Fidelity's analysts have extensive resources, tools, and capabilities that allow them to conduct sophisticated quantitative and fundamental analysis, as well as credit analysis of issuers, counterparties, and guarantors. Further, the Board considered that Fidelity's investment professionals have sufficient access to global information and data so as to provide competitive investment results over time, and that those professionals also have access to sophisticated tools that permit them to assess portfolio construction and risk and performance attribution characteristics continuously, as well as to transmit new information and research conclusions rapidly around the world. Additionally, in its deliberations, the Board considered Fidelity's trading, risk management, compliance, and technology and operations capabilities and resources, which are integral parts of the investment management process.
Administrative Services. The Board considered (i) the nature, extent, quality, and cost of advisory and administrative services performed by the Investment Advisers and their affiliates under the Advisory Contracts and under separate agreements covering transfer agency, pricing and bookkeeping, and securities lending services for each fund; (ii) the nature and extent of the supervision of third party service providers, principally custodians, subcustodians, and pricing vendors; and (iii) the resources devoted to, and the record of compliance with, each fund's compliance policies and procedures. The Board also reviewed the allocation of fund brokerage, including allocations to brokers affiliated with the Investment Advisers, the use of brokerage commissions to pay fund expenses, and the use of "soft" commission dollars to pay for research services.
Investment Performance. The Board considered whether each fund has operated in accordance with its investment objective, as well as its record of compliance with its investment restrictions. The Board reviewed each fund's absolute investment performance, as well as each fund's relative investment performance, but did not consider performance to be a material factor in its decision to renew each fund's Advisory Contracts, as the funds are not publicly offered as a stand-alone investment product. In this regard, the Board noted that the fund is designed to offer an investment option for other investment companies, 529 plans, and collective investment trusts managed by Fidelity and ultimately to enhance the performance of those investment companies, 529 plans, and collective investment trusts.
Based on its review, the Board concluded that the nature, extent, and quality of services provided to each fund under the Advisory Contracts should continue to benefit the shareholders of each fund.
Competitiveness of Management Fee and Total Expense Ratio. The Board considered that each fund does not pay FMR a management fee for investment advisory services, but that FMR receives fees for providing services to funds that invest in each fund. The Board noted that FMR or an affiliate undertakes to pay all operating expenses of the fund, except transfer agent fees, 12b-1 fees, Independent Trustee fees and expenses, custodian fees and expenses, proxy and shareholder meeting expenses, interest, taxes, and extraordinary expenses (such as litigation expenses). The Board further noted that each fund pays its non-operating expenses, including brokerage commissions and fees and expenses associated with the fund's securities lending program, if applicable.
The Board further considered that FMR has contractually agreed to reimburse each fund to the extent that total operating expenses, with certain exceptions, as a percentage of its average net assets, exceed 0.003% through April 30, 2025.
Based on its review, the Board considered that each fund does not pay a management fee and concluded that the total expense ratio of each fund was reasonable in light of the services that each fund and its shareholders receive and the other factors considered.
Costs of the Services and Profitability. The Board considered the level of Fidelity's profits in respect of all the Fidelity funds.
A public accounting firm has been engaged annually by the Board as part of the Board's assessment of Fidelity's profitability analysis. The engagement includes the review and assessment of the methodologies used by Fidelity in determining the revenues and expenses attributable to Fidelity's mutual fund business, and completion of agreed-upon procedures in respect of the mathematical accuracy of certain fund profitability information and its conformity to established allocation methodologies. After considering the reports issued under the engagement and information provided by Fidelity, the Board concluded that while other allocation methods may also be reasonable, Fidelity's profitability methodologies are reasonable in all material respects.
The Board also reviewed Fidelity's non-fund businesses and potential indirect benefits such businesses may have received as a result of their association with Fidelity's mutual fund business (i.e., fall-out benefits) as well as cases where Fidelity's affiliates may benefit from the funds' business. The Board considered areas where potential indirect benefits to the Fidelity funds from their relationships with Fidelity may exist. The Board's consideration of these matters was informed by the findings of a joint ad hoc committee created by it and the boards of other Fidelity funds to evaluate potential fall-out benefits.
The Board concluded that the costs of the services provided by and the profits realized by Fidelity in connection with the operation of each fund were not relevant to the renewal of the Advisory Contracts because the fund pays no advisory fees and FMR bears all expenses of each fund with certain exceptions.
Economies of Scale. The Board concluded that because each fund pays no advisory fees and FMR bears all expenses of each fund with certain exceptions, the realization of economies of scale was not a material factor in the Board's decision to renew each fund's Advisory Contracts.
Additional Information Requested by the Board. In order to develop fully the factual basis for consideration of the Fidelity funds' advisory contracts, the Board requested and received additional information on certain topics, including: (i) fund flow and performance trends, in particular the underperformance of certain funds and strategies, and Fidelity's long-term strategies for certain funds, including any consideration of fund liquidations or mergers; (ii) the operation of performance fees, competitor use of performance fees, and consideration of the expansion of performance fees to additional funds; (iii) Fidelity's pricing philosophy compared to competitors; (iv) fund profitability methodology and data; (v) evaluation of competitive fund data and peer group classifications and fee and expense comparisons; (vi) the management fee and expense structures for different funds and classes and information about the differences between various fee and expense structures; (vii) group fee breakpoints and related voluntary fee waivers; and (viii) information regarding other accounts managed by Fidelity and the funds' sub-advisory arrangements.
Based on its evaluation of all of the conclusions noted above, and after considering all factors it believed relevant, the Board concluded that the advisory fee arrangements are fair and reasonable and that each fund's Advisory Contracts should be renewed.
Liquidity Risk Management Program
The Securities and Exchange Commission adopted Rule 22e-4 under the Investment Company Act of 1940 (the Liquidity Rule) to promote effective liquidity risk management throughout the open-end investment company industry, thereby reducing the risk that funds will be unable to meet their redemption obligations and mitigating dilution of the interests of fund shareholders.
The Funds have adopted and implemented a liquidity risk management program pursuant to the Liquidity Rule (the Program) effective December 1, 2018. The Program is reasonably designed to assess and manage each Fund’s liquidity risk and to comply with the requirements of the Liquidity Rule. Each Fund’s Board of Trustees (the Board) has designated each Fund’s investment adviser as administrator of the Program. The Fidelity advisers have established a Liquidity Risk Management Committee (the LRM Committee) to manage the Program for each of the Fidelity Funds. The LRM Committee monitors the adequacy and effectiveness of implementation of the Program and on a periodic basis assesses each Fund’s liquidity risk based on a variety of factors including (1) the Fund’s investment strategy, (2) portfolio liquidity and cash flow projections during normal and reasonably foreseeable stressed conditions, (3) shareholder redemptions, (4) borrowings and other funding sources and (5) in the case of exchange-traded funds, certain additional factors including the effect of the Fund’s prices and spreads, market participants, and basket compositions on the overall liquidity of the Fund’s portfolio, as applicable.
In accordance with the Program, each of the Fund’s portfolio investments is classified into one of four liquidity categories described below based on a determination of a reasonable expectation for how long it would take to convert the investment to cash (or sell or dispose of the investment) without significantly changing its market value.
- Highly liquid investments – cash or convertible to cash within three business days or less
- Moderately liquid investments – convertible to cash in three to seven calendar days
- Less liquid investments – can be sold or disposed of, but not settled, within seven calendar days
- Illiquid investments – cannot be sold or disposed of within seven calendar days
Liquidity classification determinations take into account a variety of factors including various market, trading and investment-specific considerations, as well as market depth, and generally utilize analysis from a third-party liquidity metrics service.
The Liquidity Rule places a 15% limit on a fund’s illiquid investments and requires funds that do not primarily hold assets that are highly liquid investments to determine and maintain a minimum percentage of the fund’s net assets to be invested in highly liquid investments (highly liquid investment minimum or HLIM). The Program includes provisions reasonably designed to comply with the 15% limit on illiquid investments and for determining, periodically reviewing and complying with the HLIM requirement as applicable.
At a recent meeting of the Fund’s Board of Trustees, the LRM Committee provided a written report to the Board pertaining to the operation, adequacy, and effectiveness of implementation of the Program for the annual period from December 1, 2020 through November 30, 2021. The report concluded that the Program has been implemented and is operating effectively and is reasonably designed to assess and manage the Fund’s liquidity risk.

SED-SANN-0822
1.924253.111