UNITED STATES
SECURITIES AND EXCHANGE COMMISSION
Washington, D.C. 20549
FORM N-CSR
CERTIFIED SHAREHOLDER REPORT OF REGISTERED
MANAGEMENT INVESTMENT COMPANIES
Investment Company Act file number 811-00215
Fidelity Hastings Street Trust
(Exact name of registrant as specified in charter)
245 Summer St., Boston, MA 02210
(Address of principal executive offices) (Zip code)
Margaret Carey, Secretary
245 Summer St.
Boston, Massachusetts 02210
(Name and address of agent for service)
Registrant's telephone number, including area code:
617-563-7000
| |
Date of fiscal year end: | June 30 |
|
|
Date of reporting period: | December 31, 2023 |
Item 1.
Reports to Stockholders
Fidelity® Mega Cap Stock Fund
Semi-Annual Report
December 31, 2023
Includes Fidelity and Fidelity Advisor share classes
Contents
To view a fund's proxy voting guidelines and proxy voting record for the 12-month period ended June 30, visit http://www.fidelity.com/proxyvotingresults or visit the Securities and Exchange Commission's (SEC) web site at http://www.sec.gov.
You may also call 1-800-544-8544 if you're an individual investing directly with Fidelity, call 1-800-835-5092 if you're a plan sponsor or participant with Fidelity as your recordkeeper or call 1-877-208-0098 on institutional accounts or if you're an advisor or invest through one to request a free copy of the proxy voting guidelines.
Standard & Poor's, S&P and S&P 500 are registered service marks of The McGraw-Hill Companies, Inc. and have been licensed for use by Fidelity Distributors Corporation.
Other third-party marks appearing herein are the property of their respective owners.
All other marks appearing herein are registered or unregistered trademarks or service marks of FMR LLC or an affiliated company. © 2024 FMR LLC. All rights reserved.
This report and the financial statements contained herein are submitted for the general information of the shareholders of the Fund. This report is not authorized for distribution to prospective investors in the Fund unless preceded or accompanied by an effective prospectus.
A fund files its complete schedule of portfolio holdings with the SEC for the first and third quarters of each fiscal year on Form N-PORT. Forms N-PORT are available on the SEC's web site at http://www.sec.gov. A fund's Forms N-PORT may be reviewed and copied at the SEC's Public Reference Room in Washington, DC. Information regarding the operation of the SEC's Public Reference Room may be obtained by calling 1-800-SEC-0330.
For a complete list of a fund's portfolio holdings, view the most recent holdings listing, semiannual report, or annual report on Fidelity's web site at http://www.fidelity.com, http://www.institutional.fidelity.com, or http://www.401k.com, as applicable.
NOT FDIC INSURED •MAY LOSE VALUE •NO BANK GUARANTEE
Neither the Fund nor Fidelity Distributors Corporation is a bank.
Top Holdings (% of Fund's net assets) |
| |
| Microsoft Corp. | 9.2 | |
| Exxon Mobil Corp. | 6.2 | |
| Wells Fargo & Co. | 4.9 | |
| General Electric Co. | 4.7 | |
| Apple, Inc. | 3.6 | |
| Bank of America Corp. | 3.2 | |
| The Boeing Co. | 2.8 | |
| Meta Platforms, Inc. Class A | 2.4 | |
| Alphabet, Inc. Class A | 2.3 | |
| Alphabet, Inc. Class C | 2.2 | |
| | 41.5 | |
| |
| Market Sectors (% of Fund's net assets) |
| |
| Information Technology | 21.0 | |
| Financials | 15.9 | |
| Industrials | 11.4 | |
| Energy | 9.3 | |
| Health Care | 9.3 | |
| Communication Services | 9.0 | |
| Consumer Staples | 5.4 | |
| Consumer Discretionary | 3.6 | |
| Materials | 2.1 | |
| Real Estate | 0.9 | |
| Utilities | 0.8 | |
| |
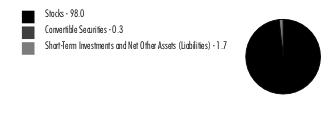
Asset Allocation (% of Fund's net assets) |
|
Written Options - (0.0)% |
Percentages shown as 0.0% may reflect amounts less than 0.05%. |
|
Showing Percentage of Net Assets
| Common Stocks - 88.7% |
| | | Shares | Value ($) |
| COMMUNICATION SERVICES - 9.0% | | | |
| Entertainment - 1.1% | | | |
| The Walt Disney Co. | | 119,199 | 10,762,478 |
| Universal Music Group NV | | 470,999 | 13,445,670 |
| | | | 24,208,148 |
| Interactive Media & Services - 6.9% | | | |
| Alphabet, Inc.: | | | |
| Class A (a) | | 381,400 | 53,277,766 |
| Class C (a) | | 359,900 | 50,720,707 |
| Meta Platforms, Inc. Class A (a) | | 150,600 | 53,306,376 |
| | | | 157,304,849 |
| Media - 1.0% | | | |
| Charter Communications, Inc. Class A (a) | | 3,400 | 1,321,512 |
| Comcast Corp. Class A | | 521,697 | 22,876,413 |
| | | | 24,197,925 |
TOTAL COMMUNICATION SERVICES | | | 205,710,922 |
| CONSUMER DISCRETIONARY - 3.6% | | | |
| Broadline Retail - 0.2% | | | |
| Amazon.com, Inc. (a) | | 25,400 | 3,859,276 |
| Hotels, Restaurants & Leisure - 1.9% | | | |
| Booking Holdings, Inc. (a) | | 9,648 | 34,223,579 |
| Marriott International, Inc. Class A | | 25,500 | 5,750,505 |
| Starbucks Corp. | | 32,500 | 3,120,325 |
| | | | 43,094,409 |
| Household Durables - 0.5% | | | |
| Sony Group Corp. sponsored ADR | | 111,800 | 10,586,342 |
| Specialty Retail - 0.8% | | | |
| Lowe's Companies, Inc. | | 86,811 | 19,319,788 |
| Textiles, Apparel & Luxury Goods - 0.2% | | | |
| Compagnie Financiere Richemont SA Series A | | 14,330 | 1,979,319 |
| NIKE, Inc. Class B | | 25,400 | 2,757,678 |
| | | | 4,736,997 |
TOTAL CONSUMER DISCRETIONARY | | | 81,596,812 |
| CONSUMER STAPLES - 5.4% | | | |
| Beverages - 1.9% | | | |
| Diageo PLC | | 481,562 | 17,478,378 |
| Keurig Dr. Pepper, Inc. | | 312,600 | 10,415,832 |
| The Coca-Cola Co. | | 268,400 | 15,816,812 |
| | | | 43,711,022 |
| Consumer Staples Distribution & Retail - 1.4% | | | |
| Costco Wholesale Corp. | | 1,300 | 858,104 |
| Sysco Corp. | | 131,699 | 9,631,148 |
| Target Corp. | | 56,710 | 8,076,638 |
| Walmart, Inc. | | 91,500 | 14,424,975 |
| | | | 32,990,865 |
| Food Products - 0.1% | | | |
| Mondelez International, Inc. | | 25,900 | 1,875,937 |
| Household Products - 0.1% | | | |
| Procter & Gamble Co. | | 16,310 | 2,390,067 |
| Personal Care Products - 1.6% | | | |
| Estee Lauder Companies, Inc. Class A | | 51,100 | 7,473,375 |
| Haleon PLC ADR | | 1,333,133 | 10,971,685 |
| Kenvue, Inc. | | 880,857 | 18,964,851 |
| | | | 37,409,911 |
| Tobacco - 0.3% | | | |
| Altria Group, Inc. | | 39,690 | 1,601,095 |
| Philip Morris International, Inc. | | 49,400 | 4,647,552 |
| | | | 6,248,647 |
TOTAL CONSUMER STAPLES | | | 124,626,449 |
| ENERGY - 9.3% | | | |
| Oil, Gas & Consumable Fuels - 9.3% | | | |
| Exxon Mobil Corp. | | 1,414,887 | 141,460,402 |
| Hess Corp. | | 166,316 | 23,976,115 |
| Imperial Oil Ltd. | | 365,500 | 20,820,301 |
| Shell PLC ADR | | 416,510 | 27,406,358 |
| | | | 213,663,176 |
| FINANCIALS - 15.9% | | | |
| Banks - 12.0% | | | |
| Bank of America Corp. | | 2,149,251 | 72,365,281 |
| JPMorgan Chase & Co. | | 279,930 | 47,616,093 |
| PNC Financial Services Group, Inc. | | 138,531 | 21,451,525 |
| Truist Financial Corp. | | 37,600 | 1,388,192 |
| U.S. Bancorp | | 419,612 | 18,160,807 |
| Wells Fargo & Co. | | 2,295,536 | 112,986,282 |
| | | | 273,968,180 |
| Capital Markets - 0.2% | | | |
| Charles Schwab Corp. | | 70,000 | 4,816,000 |
| Consumer Finance - 0.1% | | | |
| American Express Co. | | 13,500 | 2,529,090 |
| Financial Services - 3.6% | | | |
| Berkshire Hathaway, Inc. Class B (a) | | 49,500 | 17,654,670 |
| Fidelity National Information Services, Inc. | | 50,200 | 3,015,514 |
| Fiserv, Inc. (a) | | 24,800 | 3,294,432 |
| MasterCard, Inc. Class A | | 29,852 | 12,732,177 |
| PayPal Holdings, Inc. (a) | | 56,100 | 3,445,101 |
| Visa, Inc. Class A | | 158,688 | 41,314,421 |
| | | | 81,456,315 |
TOTAL FINANCIALS | | | 362,769,585 |
| HEALTH CARE - 9.3% | | | |
| Health Care Equipment & Supplies - 1.9% | | | |
| Abbott Laboratories | | 69,200 | 7,616,844 |
| Boston Scientific Corp. (a) | | 519,119 | 30,010,269 |
| Koninklijke Philips Electronics NV (depository receipt) (NY Reg.) (b) | | 147,314 | 3,436,836 |
| Medtronic PLC | | 26,896 | 2,215,692 |
| | | | 43,279,641 |
| Health Care Providers & Services - 3.3% | | | |
| Cigna Group | | 69,162 | 20,710,561 |
| Humana, Inc. | | 7,900 | 3,616,699 |
| UnitedHealth Group, Inc. | | 96,203 | 50,647,993 |
| | | | 74,975,253 |
| Life Sciences Tools & Services - 0.9% | | | |
| Danaher Corp. | | 77,410 | 17,908,029 |
| Thermo Fisher Scientific, Inc. | | 6,900 | 3,662,451 |
| | | | 21,570,480 |
| Pharmaceuticals - 3.2% | | | |
| Bristol-Myers Squibb Co. | | 328,899 | 16,875,808 |
| Eli Lilly & Co. | | 40,700 | 23,724,844 |
| GSK PLC sponsored ADR | | 299,366 | 11,094,504 |
| Johnson & Johnson | | 108,714 | 17,039,832 |
| Sanofi SA sponsored ADR | | 80,073 | 3,982,030 |
| | | | 72,717,018 |
TOTAL HEALTH CARE | | | 212,542,392 |
| INDUSTRIALS - 11.4% | | | |
| Aerospace & Defense - 4.2% | | | |
| Airbus Group NV | | 129,300 | 19,975,349 |
| RTX Corp. (c) | | 127,830 | 10,755,616 |
| The Boeing Co. (a) | | 250,400 | 65,269,264 |
| | | | 96,000,229 |
| Air Freight & Logistics - 1.1% | | | |
| FedEx Corp. | | 6,300 | 1,593,711 |
| United Parcel Service, Inc. Class B | | 153,579 | 24,147,226 |
| | | | 25,740,937 |
| Commercial Services & Supplies - 0.1% | | | |
| GFL Environmental, Inc. | | 5,700 | 196,632 |
| Veralto Corp. | | 20,303 | 1,670,125 |
| | | | 1,866,757 |
| Electrical Equipment - 0.3% | | | |
| Rockwell Automation, Inc. | | 18,400 | 5,712,832 |
| Industrial Conglomerates - 4.7% | | | |
| General Electric Co. | | 848,994 | 108,357,104 |
| Machinery - 1.0% | | | |
| Caterpillar, Inc. | | 50,600 | 14,960,902 |
| Deere & Co. | | 17,780 | 7,109,689 |
| | | | 22,070,591 |
TOTAL INDUSTRIALS | | | 259,748,450 |
| INFORMATION TECHNOLOGY - 21.0% | | | |
| IT Services - 0.1% | | | |
| Kyndryl Holdings, Inc. (a) | | 220 | 4,572 |
| Snowflake, Inc. (a) | | 1,000 | 199,000 |
| Twilio, Inc. Class A (a) | | 25,300 | 1,919,511 |
| | | | 2,123,083 |
| Semiconductors & Semiconductor Equipment - 5.8% | | | |
| Analog Devices, Inc. | | 9,100 | 1,806,896 |
| Applied Materials, Inc. | | 147,474 | 23,901,111 |
| ASML Holding NV (depository receipt) | | 5,536 | 4,190,309 |
| Broadcom, Inc. | | 9,200 | 10,269,500 |
| Lam Research Corp. | | 20,800 | 16,291,808 |
| Marvell Technology, Inc. | | 117,665 | 7,096,376 |
| NVIDIA Corp. | | 88,600 | 43,876,492 |
| Qualcomm, Inc. | | 67,616 | 9,779,302 |
| Taiwan Semiconductor Manufacturing Co. Ltd. sponsored ADR | | 135,300 | 14,071,200 |
| | | | 131,282,994 |
| Software - 11.5% | | | |
| Adobe, Inc. (a) | | 35,710 | 21,304,586 |
| Autodesk, Inc. (a) | | 7,800 | 1,899,144 |
| Intuit, Inc. | | 10,100 | 6,312,803 |
| Microsoft Corp. | | 559,076 | 210,234,940 |
| Oracle Corp. | | 39,100 | 4,122,313 |
| Salesforce, Inc. (a) | | 19,300 | 5,078,602 |
| SAP SE sponsored ADR | | 91,300 | 14,114,067 |
| | | | 263,066,455 |
| Technology Hardware, Storage & Peripherals - 3.6% | | | |
| Apple, Inc. | | 431,942 | 83,161,793 |
TOTAL INFORMATION TECHNOLOGY | | | 479,634,325 |
| MATERIALS - 2.1% | | | |
| Chemicals - 0.6% | | | |
| Air Products & Chemicals, Inc. | | 8,900 | 2,436,820 |
| DuPont de Nemours, Inc. | | 114,818 | 8,832,949 |
| Linde PLC | | 5,000 | 2,053,550 |
| | | | 13,323,319 |
| Metals & Mining - 1.5% | | | |
| Freeport-McMoRan, Inc. | | 793,500 | 33,779,295 |
TOTAL MATERIALS | | | 47,102,614 |
| REAL ESTATE - 0.9% | | | |
| Equity Real Estate Investment Trusts (REITs) - 0.9% | | | |
| American Tower Corp. | | 30,210 | 6,521,735 |
| Crown Castle International Corp. | | 58,900 | 6,784,691 |
| Simon Property Group, Inc. | | 47,400 | 6,761,136 |
| | | | 20,067,562 |
| UTILITIES - 0.8% | | | |
| Electric Utilities - 0.8% | | | |
| Duke Energy Corp. | | 4,200 | 407,568 |
| NextEra Energy, Inc. | | 7,400 | 449,476 |
| Southern Co. | | 253,700 | 17,789,444 |
| | | | 18,646,488 |
| TOTAL COMMON STOCKS (Cost $1,242,856,267) | | | 2,026,108,775 |
| | | | |
| Money Market Funds - 7.8% |
| | | Shares | Value ($) |
| Fidelity Cash Central Fund 5.40% (d) | | 174,333,749 | 174,368,616 |
| Fidelity Securities Lending Cash Central Fund 5.40% (d)(e) | | 2,666,133 | 2,666,400 |
| TOTAL MONEY MARKET FUNDS (Cost $177,035,016) | | | 177,035,016 |
| | | | |
| TOTAL INVESTMENT IN SECURITIES - 96.5% (Cost $1,419,891,283) | 2,203,143,791 |
NET OTHER ASSETS (LIABILITIES) - 3.5% | 80,176,441 |
| NET ASSETS - 100.0% | 2,283,320,232 |
| | |
| Written Options |
| | Counterparty | Number of Contracts | Notional Amount ($) | Exercise Price ($) | Expiration Date | Value ($) |
| Call Options | | | | | | |
| RTX Corp. | Chicago Board Options Exchange | 1,000 | 8,414,000 | 80.00 | 01/19/24 | (475,000) |
| | | | | | | |
Legend
| (b) | Security or a portion of the security is on loan at period end. |
| (c) | Security or a portion of the security is pledged as collateral for options written. At period end, the value of securities pledged amounted to $8,414,000. |
| (d) | Affiliated fund that is generally available only to investment companies and other accounts managed by Fidelity Investments. The rate quoted is the annualized seven-day yield of the fund at period end. A complete unaudited listing of the fund's holdings as of its most recent quarter end is available upon request. In addition, each Fidelity Central Fund's financial statements are available on the SEC's website or upon request. |
| (e) | Investment made with cash collateral received from securities on loan. |
Affiliated Central Funds
Fiscal year to date information regarding the Fund's investments in Fidelity Central Funds, including the ownership percentage, is presented below.
| Affiliate | Value, beginning of period ($) | Purchases ($) | Sales Proceeds ($) | Dividend Income ($) | Realized Gain (loss) ($) | Change in Unrealized appreciation (depreciation) ($) | Value, end of period ($) | % ownership, end of period |
| Fidelity Cash Central Fund 5.40% | 106,272,490 | 176,407,808 | 108,311,682 | 3,707,243 | - | - | 174,368,616 | 0.4% |
| Fidelity Securities Lending Cash Central Fund 5.40% | - | 47,783,941 | 45,117,541 | 87,303 | - | - | 2,666,400 | 0.0% |
| Total | 106,272,490 | 224,191,749 | 153,429,223 | 3,794,546 | - | - | 177,035,016 | |
| | | | | | | | | |
Amounts in the dividend income column in the above table include any capital gain distributions from underlying funds, which are presented in the corresponding line item in the Statement of Operations, if applicable.
Amounts in the dividend income column for Fidelity Securities Lending Cash Central Fund represents the income earned on investing cash collateral, less rebates paid to borrowers and any lending agent fees associated with the loan, plus any premium payments received for lending certain types of securities.
Amounts included in the purchases and sales proceeds columns may include in-kind transactions, if applicable.
Investment Valuation
The following is a summary of the inputs used, as of December 31, 2023, involving the Fund's assets and liabilities carried at fair value. The inputs or methodology used for valuing securities may not be an indication of the risk associated with investing in those securities. For more information on valuation inputs, and their aggregation into the levels used below, please refer to the Investment Valuation section in the accompanying Notes to Financial Statements.
| Valuation Inputs at Reporting Date: |
| Description | Total ($) | Level 1 ($) | Level 2 ($) | Level 3 ($) |
Investments in Securities: | | | | |
|
| Equities: | | | | |
Communication Services | 205,710,922 | 192,265,252 | 13,445,670 | - |
Consumer Discretionary | 81,596,812 | 79,617,493 | 1,979,319 | - |
Consumer Staples | 124,626,449 | 107,148,071 | 17,478,378 | - |
Energy | 213,663,176 | 213,663,176 | - | - |
Financials | 362,769,585 | 362,769,585 | - | - |
Health Care | 212,542,392 | 212,542,392 | - | - |
Industrials | 259,748,450 | 239,773,101 | 19,975,349 | - |
Information Technology | 479,634,325 | 479,634,325 | - | - |
Materials | 47,102,614 | 47,102,614 | - | - |
Real Estate | 20,067,562 | 20,067,562 | - | - |
Utilities | 18,646,488 | 18,646,488 | - | - |
|
| Money Market Funds | 177,035,016 | 177,035,016 | - | - |
| Total Investments in Securities: | 2,203,143,791 | 2,150,265,075 | 52,878,716 | - |
Derivative Instruments: Liabilities | | | | |
Written Options | (475,000) | (475,000) | - | - |
| Total Liabilities | (475,000) | (475,000) | - | - |
| Total Derivative Instruments: | (475,000) | (475,000) | - | - |
Value of Derivative Instruments
The following table is a summary of the Fund's value of derivative instruments by primary risk exposure as of December 31, 2023. For additional information on derivative instruments, please refer to the Derivative Instruments section in the accompanying Notes to Financial Statements.
Primary Risk Exposure / Derivative Type | Value |
| Asset ($) | Liability ($) |
| Equity Risk | | |
Written Options (a) | 0 | (475,000) |
| Total Equity Risk | 0 | (475,000) |
| Total Value of Derivatives | 0 | (475,000) |
(a)Gross value is presented in the Statement of Assets and Liabilities in the written options, at value line-item.
| Statement of Assets and Liabilities |
| | | | December 31, 2023 (Unaudited) |
| | | | | |
| Assets | | | | |
| Investment in securities, at value (including securities loaned of $2,591,963) - See accompanying schedule: | | | | |
Unaffiliated issuers (cost $1,242,856,267) | $ | 2,026,108,775 | | |
Fidelity Central Funds (cost $177,035,016) | | 177,035,016 | | |
| | | | | |
| | | | | |
| Total Investment in Securities (cost $1,419,891,283) | | | $ | 2,203,143,791 |
| Foreign currency held at value (cost $2) | | | | 2 |
| Receivable for investments sold | | | | 216,702 |
| Receivable for fund shares sold | | | | 88,725,795 |
| Dividends receivable | | | | 1,564,046 |
| Distributions receivable from Fidelity Central Funds | | | | 782,918 |
| Prepaid expenses | | | | 1,712 |
| Other receivables | | | | 7,062 |
Total assets | | | | 2,294,442,028 |
| Liabilities | | | | |
| Payable for investments purchased | $ | 5,756,855 | | |
| Payable for fund shares redeemed | | 1,057,672 | | |
| Accrued management fee | | 747,362 | | |
| Distribution and service plan fees payable | | 68,096 | | |
| Written options, at value (premium received $165,075) | | 475,000 | | |
| Other affiliated payables | | 304,680 | | |
| Other payables and accrued expenses | | 45,731 | | |
| Collateral on securities loaned | | 2,666,400 | | |
| Total Liabilities | | | | 11,121,796 |
| Net Assets | | | $ | 2,283,320,232 |
| Net Assets consist of: | | | | |
| Paid in capital | | | $ | 1,508,220,740 |
| Total accumulated earnings (loss) | | | | 775,099,492 |
| Net Assets | | | $ | 2,283,320,232 |
| | | | | |
| Net Asset Value and Maximum Offering Price | | | | |
| Class A : | | | | |
Net Asset Value and redemption price per share ($161,533,590 ÷ 7,850,490 shares)(a) | | | $ | 20.58 |
| Maximum offering price per share (100/94.25 of $20.58) | | | $ | 21.84 |
| Class M : | | | | |
Net Asset Value and redemption price per share ($32,815,269 ÷ 1,593,510 shares)(a) | | | $ | 20.59 |
| Maximum offering price per share (100/96.50 of $20.59) | | | $ | 21.34 |
| Class C : | | | | |
Net Asset Value and offering price per share ($27,523,788 ÷ 1,368,989 shares)(a) | | | $ | 20.11 |
| Mega Cap Stock : | | | | |
Net Asset Value, offering price and redemption price per share ($1,500,674,691 ÷ 71,681,116 shares) | | | $ | 20.94 |
| Class I : | | | | |
Net Asset Value, offering price and redemption price per share ($269,084,793 ÷ 12,837,322 shares) | | | $ | 20.96 |
| Class Z : | | | | |
Net Asset Value, offering price and redemption price per share ($291,688,101 ÷ 14,022,592 shares) | | | $ | 20.80 |
(a)Redemption price per share is equal to net asset value less any applicable contingent deferred sales charge. |
| Statement of Operations |
| | | | Six months ended December 31, 2023 (Unaudited) |
| Investment Income | | | | |
| Dividends | | | $ | 14,552,494 |
| Income from Fidelity Central Funds (including $87,303 from security lending) | | | | 3,794,546 |
| Total Income | | | | 18,347,040 |
| Expenses | | | | |
| Management fee | $ | 4,008,909 | | |
| Transfer agent fees | | 1,412,573 | | |
| Distribution and service plan fees | | 378,232 | | |
| Accounting fees | | 256,915 | | |
| Custodian fees and expenses | | 14,600 | | |
| Independent trustees' fees and expenses | | 5,087 | | |
| Registration fees | | 92,377 | | |
| Audit | | 41,878 | | |
| Legal | | 5,025 | | |
| Miscellaneous | | 3,105 | | |
| Total expenses before reductions | | 6,218,701 | | |
| Expense reductions | | (65,324) | | |
| Total expenses after reductions | | | | 6,153,377 |
| Net Investment income (loss) | | | | 12,193,663 |
| Realized and Unrealized Gain (Loss) | | | | |
| Net realized gain (loss) on: | | | | |
| Investment Securities: | | | | |
| Unaffiliated issuers | | 19,762,115 | | |
| Foreign currency transactions | | (2,477) | | |
| Written options | | 415,252 | | |
| Total net realized gain (loss) | | | | 20,174,890 |
| Change in net unrealized appreciation (depreciation) on: | | | | |
| Investment Securities: | | | | |
| Unaffiliated issuers | | 145,755,997 | | |
| Assets and liabilities in foreign currencies | | 9,369 | | |
| Written options | | (210,619) | | |
| Total change in net unrealized appreciation (depreciation) | | | | 145,554,747 |
| Net gain (loss) | | | | 165,729,637 |
| Net increase (decrease) in net assets resulting from operations | | | $ | 177,923,300 |
| Statement of Changes in Net Assets |
| |
| | Six months ended December 31, 2023 (Unaudited) | | Year ended June 30, 2023 |
| Increase (Decrease) in Net Assets | | | | |
| Operations | | | | |
| Net investment income (loss) | $ | 12,193,663 | $ | 16,976,504 |
| Net realized gain (loss) | | 20,174,890 | | 5,590,921 |
| Change in net unrealized appreciation (depreciation) | | 145,554,747 | | 278,383,701 |
| Net increase (decrease) in net assets resulting from operations | | 177,923,300 | | 300,951,126 |
| Distributions to shareholders | | (42,621,702) | | (58,426,988) |
| | | | | |
| Share transactions - net increase (decrease) | | 431,882,175 | | 137,430,788 |
| Total increase (decrease) in net assets | | 567,183,773 | | 379,954,926 |
| | | | | |
| Net Assets | | | | |
| Beginning of period | | 1,716,136,459 | | 1,336,181,533 |
| End of period | $ | 2,283,320,232 | $ | 1,716,136,459 |
| | | | | |
| | | | | |
Financial Highlights
| Fidelity Advisor® Mega Cap Stock Fund Class A |
| |
| | Six months ended (Unaudited) December 31, 2023 | | Years ended June 30, 2023 | | 2022 | | 2021 | | 2020 | | 2019 |
Selected Per-Share Data | | | | | | | | | | | | |
| Net asset value, beginning of period | $ | 19.23 | $ | 16.14 | $ | 19.05 | $ | 13.83 | $ | 15.51 | $ | 17.34 |
| Income from Investment Operations | | | | | | | | | | | | |
Net investment income (loss) A,B | | .10 | | .17 | | .14 | | .15 | | .22 | | .29 |
| Net realized and unrealized gain (loss) | | 1.63 | | 3.61 | | (2.17) | | 6.31 | | .08 | | .77 |
| Total from investment operations | | 1.73 | | 3.78 | | (2.03) | | 6.46 | | .30 | | 1.06 |
| Distributions from net investment income | | (.17) | | (.18) | | (.29) | | (.24) | | (.27) | | (.26) |
| Distributions from net realized gain | | (.21) | | (.51) | | (.59) | | (1.00) | | (1.70) | | (2.63) |
| Total distributions | | (.38) | | (.69) | | (.88) | | (1.24) | | (1.98) C | | (2.89) |
| Net asset value, end of period | $ | 20.58 | $ | 19.23 | $ | 16.14 | $ | 19.05 | $ | 13.83 | $ | 15.51 |
Total Return D,E,F | | 9.05% | | 24.10% | | (11.25)% G | | 49.60% | | 1.78% | | 6.99% |
Ratios to Average Net Assets B,H,I | | | | | | | | | | | | |
| Expenses before reductions | | .90% J | | .90% | | .90% | | .91% | | .93% | | .93% |
| Expenses net of fee waivers, if any | | .89% J | | .90% | | .89% | | .91% | | .93% | | .93% |
| Expenses net of all reductions | | .89% J | | .90% | | .89% | | .91% | | .92% | | .93% |
| Net investment income (loss) | | 1.05% J | | .99% | | .78% | | .95% | | 1.56% | | 1.88% |
| Supplemental Data | | | | | | | | | | | | |
| Net assets, end of period (000 omitted) | $ | 161,534 | $ | 133,252 | $ | 88,064 | $ | 87,302 | $ | 54,948 | $ | 64,311 |
Portfolio turnover rate K | | 7% J | | 18% | | 13% | | 43% | | 49% L | | 36% |
ACalculated based on average shares outstanding during the period.
BNet investment income (loss) is affected by the timing of the declaration of dividends by any underlying mutual funds or exchange-traded funds (ETFs). Net investment income (loss) of any mutual funds or ETFs is not included in the Fund's net investment income (loss) ratio.
CTotal distributions per share do not sum due to rounding.
DTotal returns for periods of less than one year are not annualized.
ETotal returns would have been lower if certain expenses had not been reduced during the applicable periods shown.
FTotal returns do not include the effect of the sales charges.
GAmount includes a reimbursement from the investment adviser for an operational error which amounted to less than .01 per share. Excluding this reimbursement, the total return would have been (11.29)%.
HFees and expenses of any underlying mutual funds or exchange-traded funds (ETFs) are not included in the Fund's expense ratio. The Fund indirectly bears its proportionate share of these expenses. For additional expense information related to investments in Fidelity Central Funds, please refer to the "Investments in Fidelity Central Funds" note found in the Notes to Financial Statements section of the most recent Annual or Semi-Annual report.
IExpense ratios reflect operating expenses of the class. Expenses before reductions do not reflect amounts reimbursed, waived, or reduced through arrangements with the investment adviser, brokerage services, or other offset arrangements, if applicable, and do not represent the amount paid by the class during periods when reimbursements, waivers or reductions occur.
JAnnualized.
KAmount does not include the portfolio activity of any underlying mutual funds or exchange-traded funds (ETFs).
LPortfolio turnover rate excludes securities received or delivered in-kind.
| Fidelity Advisor® Mega Cap Stock Fund Class M |
| |
| | Six months ended (Unaudited) December 31, 2023 | | Years ended June 30, 2023 | | 2022 | | 2021 | | 2020 | | 2019 |
Selected Per-Share Data | | | | | | | | | | | | |
| Net asset value, beginning of period | $ | 19.22 | $ | 16.13 | $ | 19.03 | $ | 13.82 | $ | 15.50 | $ | 17.31 |
| Income from Investment Operations | | | | | | | | | | | | |
Net investment income (loss) A,B | | .08 | | .13 | | .10 | | .11 | | .19 | | .25 |
| Net realized and unrealized gain (loss) | | 1.62 | | 3.61 | | (2.17) | | 6.31 | | .06 | | .78 |
| Total from investment operations | | 1.70 | | 3.74 | | (2.07) | | 6.42 | | .25 | | 1.03 |
| Distributions from net investment income | | (.12) | | (.13) | | (.24) | | (.20) | | (.23) | | (.21) |
| Distributions from net realized gain | | (.21) | | (.51) | | (.59) | | (1.00) | | (1.70) | | (2.63) |
| Total distributions | | (.33) | | (.65) C | | (.83) | | (1.21) C | | (1.93) | | (2.84) |
| Net asset value, end of period | $ | 20.59 | $ | 19.22 | $ | 16.13 | $ | 19.03 | $ | 13.82 | $ | 15.50 |
Total Return D,E,F | | 8.87% | | 23.76% | | (11.45)% G | | 49.19% | | 1.50% | | 6.79% |
Ratios to Average Net Assets B,H,I | | | | | | | | | | | | |
| Expenses before reductions | | 1.15% J | | 1.16% | | 1.15% | | 1.17% | | 1.18% | | 1.19% |
| Expenses net of fee waivers, if any | | 1.14% J | | 1.16% | | 1.15% | | 1.17% | | 1.18% | | 1.19% |
| Expenses net of all reductions | | 1.14% J | | 1.16% | | 1.15% | | 1.16% | | 1.18% | | 1.18% |
| Net investment income (loss) | | .79% J | | .73% | | .52% | | .69% | | 1.31% | | 1.63% |
| Supplemental Data | | | | | | | | | | | | |
| Net assets, end of period (000 omitted) | $ | 32,815 | $ | 30,973 | $ | 25,617 | $ | 28,266 | $ | 21,208 | $ | 25,031 |
Portfolio turnover rate K | | 7% J | | 18% | | 13% | | 43% | | 49% L | | 36% |
ACalculated based on average shares outstanding during the period.
BNet investment income (loss) is affected by the timing of the declaration of dividends by any underlying mutual funds or exchange-traded funds (ETFs). Net investment income (loss) of any mutual funds or ETFs is not included in the Fund's net investment income (loss) ratio.
CTotal distributions per share do not sum due to rounding.
DTotal returns would have been lower if certain expenses had not been reduced during the applicable periods shown.
ETotal returns do not include the effect of the sales charges.
FTotal returns for periods of less than one year are not annualized.
GAmount includes a reimbursement from the investment adviser for an operational error which amounted to less than .01 per share. Excluding this reimbursement, the total return would have been (11.49)%.
HFees and expenses of any underlying mutual funds or exchange-traded funds (ETFs) are not included in the Fund's expense ratio. The Fund indirectly bears its proportionate share of these expenses. For additional expense information related to investments in Fidelity Central Funds, please refer to the "Investments in Fidelity Central Funds" note found in the Notes to Financial Statements section of the most recent Annual or Semi-Annual report.
IExpense ratios reflect operating expenses of the class. Expenses before reductions do not reflect amounts reimbursed, waived, or reduced through arrangements with the investment adviser, brokerage services, or other offset arrangements, if applicable, and do not represent the amount paid by the class during periods when reimbursements, waivers or reductions occur.
JAnnualized.
KAmount does not include the portfolio activity of any underlying mutual funds or exchange-traded funds (ETFs).
LPortfolio turnover rate excludes securities received or delivered in-kind.
| Fidelity Advisor® Mega Cap Stock Fund Class C |
| |
| | Six months ended (Unaudited) December 31, 2023 | | Years ended June 30, 2023 | | 2022 | | 2021 | | 2020 | | 2019 |
Selected Per-Share Data | | | | | | | | | | | | |
| Net asset value, beginning of period | $ | 18.74 | $ | 15.74 | $ | 18.58 | $ | 13.53 | $ | 15.20 | $ | 17.03 |
| Income from Investment Operations | | | | | | | | | | | | |
Net investment income (loss) A,B | | .03 | | .03 | | - C | | .03 | | .11 | | .17 |
| Net realized and unrealized gain (loss) | | 1.59 | | 3.53 | | (2.12) | | 6.15 | | .08 | | .77 |
| Total from investment operations | | 1.62 | | 3.56 | | (2.12) | | 6.18 | | .19 | | .94 |
| Distributions from net investment income | | (.04) | | (.04) | | (.15) | | (.13) | | (.15) | | (.13) |
| Distributions from net realized gain | | (.21) | | (.51) | | (.58) | | (1.00) | | (1.70) | | (2.63) |
| Total distributions | | (.25) | | (.56) D | | (.72) D | | (1.13) | | (1.86) D | | (2.77) D |
| Net asset value, end of period | $ | 20.11 | $ | 18.74 | $ | 15.74 | $ | 18.58 | $ | 13.53 | $ | 15.20 |
Total Return E,F,G | | 8.64% | | 23.12% | | (11.90)% H | | 48.31% | | 1.05% | | 6.23% |
Ratios to Average Net Assets B,I,J | | | | | | | | | | | | |
| Expenses before reductions | | 1.67% K | | 1.69% | | 1.67% | | 1.69% | | 1.69% | | 1.68% |
| Expenses net of fee waivers, if any | | 1.67% K | | 1.68% | | 1.67% | | 1.69% | | 1.69% | | 1.67% |
| Expenses net of all reductions | | 1.67% K | | 1.68% | | 1.67% | | 1.69% | | 1.69% | | 1.67% |
| Net investment income (loss) | | .27% K | | .21% | | -% L | | .17% | | .80% | | 1.14% |
| Supplemental Data | | | | | | | | | | | | |
| Net assets, end of period (000 omitted) | $ | 27,524 | $ | 23,061 | $ | 20,255 | $ | 27,727 | $ | 24,283 | $ | 28,459 |
Portfolio turnover rate M | | 7% K | | 18% | | 13% | | 43% | | 49% N | | 36% |
ACalculated based on average shares outstanding during the period.
BNet investment income (loss) is affected by the timing of the declaration of dividends by any underlying mutual funds or exchange-traded funds (ETFs). Net investment income (loss) of any mutual funds or ETFs is not included in the Fund's net investment income (loss) ratio.
CAmount represents less than $.005 per share.
DTotal distributions per share do not sum due to rounding.
ETotal returns for periods of less than one year are not annualized.
FTotal returns would have been lower if certain expenses had not been reduced during the applicable periods shown.
GTotal returns do not include the effect of the contingent deferred sales charge.
HAmount includes a reimbursement from the investment adviser for an operational error which amounted to less than .01 per share. Excluding this reimbursement, the total return would have been (11.94)%.
IFees and expenses of any underlying mutual funds or exchange-traded funds (ETFs) are not included in the Fund's expense ratio. The Fund indirectly bears its proportionate share of these expenses. For additional expense information related to investments in Fidelity Central Funds, please refer to the "Investments in Fidelity Central Funds" note found in the Notes to Financial Statements section of the most recent Annual or Semi-Annual report.
JExpense ratios reflect operating expenses of the class. Expenses before reductions do not reflect amounts reimbursed, waived, or reduced through arrangements with the investment adviser, brokerage services, or other offset arrangements, if applicable, and do not represent the amount paid by the class during periods when reimbursements, waivers or reductions occur.
KAnnualized.
LAmount represents less than .005%.
MAmount does not include the portfolio activity of any underlying mutual funds or exchange-traded funds (ETFs).
NPortfolio turnover rate excludes securities received or delivered in-kind.
| Fidelity® Mega Cap Stock Fund |
| |
| | Six months ended (Unaudited) December 31, 2023 | | Years ended June 30, 2023 | | 2022 | | 2021 | | 2020 | | 2019 |
Selected Per-Share Data | | | | | | | | | | | | |
| Net asset value, beginning of period | $ | 19.58 | $ | 16.42 | $ | 19.36 | $ | 14.04 | $ | 15.71 | $ | 17.52 |
| Income from Investment Operations | | | | | | | | | | | | |
Net investment income (loss) A,B | | .13 | | .22 | | .20 | | .20 | | .27 | | .34 |
| Net realized and unrealized gain (loss) | | 1.66 | | 3.68 | | (2.21) | | 6.40 | | .07 | | .78 |
| Total from investment operations | | 1.79 | | 3.90 | | (2.01) | | 6.60 | | .34 | | 1.12 |
| Distributions from net investment income | | (.22) | | (.23) | | (.34) | | (.28) | | (.31) | | (.30) |
| Distributions from net realized gain | | (.21) | | (.51) | | (.59) | | (1.00) | | (1.70) | | (2.63) |
| Total distributions | | (.43) | | (.74) | | (.93) | | (1.28) | | (2.01) | | (2.93) |
| Net asset value, end of period | $ | 20.94 | $ | 19.58 | $ | 16.42 | $ | 19.36 | $ | 14.04 | $ | 15.71 |
Total Return C,D | | 9.20% | | 24.46% | | (10.99)% E | | 49.96% | | 2.09% | | 7.33% |
Ratios to Average Net Assets B,F,G | | | | | | | | | | | | |
| Expenses before reductions | | .63% H | | .63% | | .61% | | .63% | | .65% | | .65% |
| Expenses net of fee waivers, if any | | .62% H | | .62% | | .61% | | .63% | | .64% | | .65% |
| Expenses net of all reductions | | .62% H | | .62% | | .61% | | .63% | | .64% | | .65% |
| Net investment income (loss) | | 1.32% H | | 1.27% | | 1.06% | | 1.23% | | 1.84% | | 2.16% |
| Supplemental Data | | | | | | | | | | | | |
| Net assets, end of period (000 omitted) | $ | 1,500,675 | $ | 1,203,802 | $ | 927,217 | $ | 1,166,988 | $ | 773,080 | $ | 1,488,549 |
Portfolio turnover rate I | | 7% H | | 18% | | 13% | | 43% | | 49% J | | 36% |
ACalculated based on average shares outstanding during the period.
BNet investment income (loss) is affected by the timing of the declaration of dividends by any underlying mutual funds or exchange-traded funds (ETFs). Net investment income (loss) of any mutual funds or ETFs is not included in the Fund's net investment income (loss) ratio.
CTotal returns for periods of less than one year are not annualized.
DTotal returns would have been lower if certain expenses had not been reduced during the applicable periods shown.
EAmount includes a reimbursement from the investment adviser for an operational error which amounted to less than .01 per share. Excluding this reimbursement, the total return would have been (11.03)%.
FFees and expenses of any underlying mutual funds or exchange-traded funds (ETFs) are not included in the Fund's expense ratio. The Fund indirectly bears its proportionate share of these expenses. For additional expense information related to investments in Fidelity Central Funds, please refer to the "Investments in Fidelity Central Funds" note found in the Notes to Financial Statements section of the most recent Annual or Semi-Annual report.
GExpense ratios reflect operating expenses of the class. Expenses before reductions do not reflect amounts reimbursed, waived, or reduced through arrangements with the investment adviser, brokerage services, or other offset arrangements, if applicable, and do not represent the amount paid by the class during periods when reimbursements, waivers or reductions occur.
HAnnualized.
IAmount does not include the portfolio activity of any underlying mutual funds or exchange-traded funds (ETFs).
JPortfolio turnover rate excludes securities received or delivered in-kind.
| Fidelity Advisor® Mega Cap Stock Fund Class I |
| |
| | Six months ended (Unaudited) December 31, 2023 | | Years ended June 30, 2023 | | 2022 | | 2021 | | 2020 | | 2019 |
Selected Per-Share Data | | | | | | | | | | | | |
| Net asset value, beginning of period | $ | 19.61 | $ | 16.45 | $ | 19.39 | $ | 14.07 | $ | 15.72 | $ | 17.53 |
| Income from Investment Operations | | | | | | | | | | | | |
Net investment income (loss) A,B | | .13 | | .22 | | .19 | | .20 | | .27 | | .34 |
| Net realized and unrealized gain (loss) | | 1.66 | | 3.68 | | (2.21) | | 6.42 | | .06 | | .79 |
| Total from investment operations | | 1.79 | | 3.90 | | (2.02) | | 6.62 | | .33 | | 1.13 |
| Distributions from net investment income | | (.23) | | (.23) | | (.34) | | (.29) | | (.28) | | (.30) |
| Distributions from net realized gain | | (.21) | | (.51) | | (.59) | | (1.00) | | (1.70) | | (2.63) |
| Total distributions | | (.44) | | (.74) | | (.92) C | | (1.30) C | | (1.98) | | (2.94) C |
| Net asset value, end of period | $ | 20.96 | $ | 19.61 | $ | 16.45 | $ | 19.39 | $ | 14.07 | $ | 15.72 |
Total Return D,E | | 9.17% | | 24.43% | | (11.00)% F | | 49.97% | | 2.04% | | 7.33% |
Ratios to Average Net Assets B,G,H | | | | | | | | | | | | |
| Expenses before reductions | | .63% I | | .63% | | .65% | | .65% | | .66% | | .66% |
| Expenses net of fee waivers, if any | | .62% I | | .62% | | .64% | | .65% | | .66% | | .66% |
| Expenses net of all reductions | | .62% I | | .62% | | .64% | | .64% | | .65% | | .66% |
| Net investment income (loss) | | 1.31% I | | 1.26% | | 1.03% | | 1.21% | | 1.83% | | 2.15% |
| Supplemental Data | | | | | | | | | | | | |
| Net assets, end of period (000 omitted) | $ | 269,085 | $ | 132,416 | $ | 52,884 | $ | 39,876 | $ | 20,725 | $ | 147,465 |
Portfolio turnover rate J | | 7% I | | 18% | | 13% | | 43% | | 49% K | | 36% |
ACalculated based on average shares outstanding during the period.
BNet investment income (loss) is affected by the timing of the declaration of dividends by any underlying mutual funds or exchange-traded funds (ETFs). Net investment income (loss) of any mutual funds or ETFs is not included in the Fund's net investment income (loss) ratio.
CTotal distributions per share do not sum due to rounding.
DTotal returns for periods of less than one year are not annualized.
ETotal returns would have been lower if certain expenses had not been reduced during the applicable periods shown.
FAmount includes a reimbursement from the investment adviser for an operational error which amounted to less than .01 per share. Excluding this reimbursement, the total return would have been (11.04)%.
GFees and expenses of any underlying mutual funds or exchange-traded funds (ETFs) are not included in the Fund's expense ratio. The Fund indirectly bears its proportionate share of these expenses. For additional expense information related to investments in Fidelity Central Funds, please refer to the "Investments in Fidelity Central Funds" note found in the Notes to Financial Statements section of the most recent Annual or Semi-Annual report.
HExpense ratios reflect operating expenses of the class. Expenses before reductions do not reflect amounts reimbursed, waived, or reduced through arrangements with the investment adviser, brokerage services, or other offset arrangements, if applicable, and do not represent the amount paid by the class during periods when reimbursements, waivers or reductions occur.
IAnnualized.
JAmount does not include the portfolio activity of any underlying mutual funds or exchange-traded funds (ETFs).
KPortfolio turnover rate excludes securities received or delivered in-kind.
| Fidelity Advisor® Mega Cap Stock Fund Class Z |
| |
| | Six months ended (Unaudited) December 31, 2023 | | Years ended June 30, 2023 | | 2022 | | 2021 | | 2020 | | 2019 |
Selected Per-Share Data | | | | | | | | | | | | |
| Net asset value, beginning of period | $ | 19.46 | $ | 16.32 | $ | 19.25 | $ | 13.97 | $ | 15.65 | $ | 17.46 |
| Income from Investment Operations | | | | | | | | | | | | |
Net investment income (loss) A,B | | .14 | | .24 | | .22 | | .22 | | .28 | | .35 |
| Net realized and unrealized gain (loss) | | 1.65 | | 3.66 | | (2.20) | | 6.36 | | .08 | | .79 |
| Total from investment operations | | 1.79 | | 3.90 | | (1.98) | | 6.58 | | .36 | | 1.14 |
| Distributions from net investment income | | (.24) | | (.25) | | (.36) | | (.30) | | (.33) | | (.32) |
| Distributions from net realized gain | | (.21) | | (.51) | | (.59) | | (1.00) | | (1.70) | | (2.63) |
| Total distributions | | (.45) | | (.76) | | (.95) | | (1.30) | | (2.04) C | | (2.95) |
| Net asset value, end of period | $ | 20.80 | $ | 19.46 | $ | 16.32 | $ | 19.25 | $ | 13.97 | $ | 15.65 |
Total Return D,E | | 9.26% | | 24.62% | | (10.92)% F | | 50.14% | | 2.18% | | 7.47% |
Ratios to Average Net Assets B,G,H | | | | | | | | | | | | |
| Expenses before reductions | | .51% I | | .52% | | .51% | | .52% | | .53% | | .53% |
| Expenses net of fee waivers, if any | | .50% I | | .52% | | .51% | | .52% | | .52% | | .53% |
| Expenses net of all reductions | | .50% I | | .52% | | .51% | | .52% | | .52% | | .53% |
| Net investment income (loss) | | 1.43% I | | 1.37% | | 1.16% | | 1.34% | | 1.96% | | 2.29% |
| Supplemental Data | | | | | | | | | | | | |
| Net assets, end of period (000 omitted) | $ | 291,688 | $ | 192,632 | $ | 222,146 | $ | 313,854 | $ | 213,832 | $ | 193,889 |
Portfolio turnover rate J | | 7% I | | 18% | | 13% | | 43% | | 49% K | | 36% |
ACalculated based on average shares outstanding during the period.
BNet investment income (loss) is affected by the timing of the declaration of dividends by any underlying mutual funds or exchange-traded funds (ETFs). Net investment income (loss) of any mutual funds or ETFs is not included in the Fund's net investment income (loss) ratio.
CTotal distributions per share do not sum due to rounding.
DTotal returns for periods of less than one year are not annualized.
ETotal returns would have been lower if certain expenses had not been reduced during the applicable periods shown.
FAmount includes a reimbursement from the investment adviser for an operational error which amounted to less than .01 per share. Excluding this reimbursement, the total return would have been (10.96)%.
GFees and expenses of any underlying mutual funds or exchange-traded funds (ETFs) are not included in the Fund's expense ratio. The Fund indirectly bears its proportionate share of these expenses. For additional expense information related to investments in Fidelity Central Funds, please refer to the "Investments in Fidelity Central Funds" note found in the Notes to Financial Statements section of the most recent Annual or Semi-Annual report.
HExpense ratios reflect operating expenses of the class. Expenses before reductions do not reflect amounts reimbursed, waived, or reduced through arrangements with the investment adviser, brokerage services, or other offset arrangements, if applicable, and do not represent the amount paid by the class during periods when reimbursements, waivers or reductions occur.
IAnnualized.
JAmount does not include the portfolio activity of any underlying mutual funds or exchange-traded funds (ETFs).
KPortfolio turnover rate excludes securities received or delivered in-kind.
For the period ended December 31, 2023
1. Organization.
Fidelity Mega Cap Stock Fund (the Fund) is a fund of Fidelity Hastings Street Trust (the Trust) and is authorized to issue an unlimited number of shares. The Trust is registered under the Investment Company Act of 1940, as amended (the 1940 Act), as an open-end management investment company organized as a Massachusetts business trust. The Fund offers Class A, Class M, Class C, Mega Cap Stock, Class I and Class Z shares, each of which has equal rights as to assets and voting privileges. Class A, Class M, Class C, Class I, and Class Z are Fidelity Advisor classes. Each class has exclusive voting rights with respect to matters that affect that class. Class C shares will automatically convert to Class A shares after a holding period of eight years from the initial date of purchase, with certain exceptions.
2. Investments in Fidelity Central Funds.
Funds may invest in Fidelity Central Funds, which are open-end investment companies generally available only to other investment companies and accounts managed by the investment adviser and its affiliates. The Schedule of Investments lists any Fidelity Central Funds held as an investment as of period end, but does not include the underlying holdings of each Fidelity Central Fund. An investing fund indirectly bears its proportionate share of the expenses of the underlying Fidelity Central Funds.
Based on its investment objective, each Fidelity Central Fund may invest or participate in various investment vehicles or strategies that are similar to those of the investing fund. These strategies are consistent with the investment objectives of the investing fund and may involve certain economic risks which may cause a decline in value of each of the Fidelity Central Funds and thus a decline in the value of the investing fund.
| Fidelity Central Fund | Investment Manager | Investment Objective | Investment Practices | Expense RatioA |
| Fidelity Money Market Central Funds | Fidelity Management & Research Company LLC (FMR) | Each fund seeks to obtain a high level of current income consistent with the preservation of capital and liquidity. | Short-term Investments | Less than .005% |
A Expenses expressed as a percentage of average net assets and are as of each underlying Central Fund's most recent annual or semi-annual shareholder report.
A complete unaudited list of holdings for each Fidelity Central Fund is available upon request or at the Securities and Exchange Commission website at www.sec.gov. In addition, the financial statements of the Fidelity Central Funds which contain the significant accounting policies (including investment valuation policies) of those funds, and are not covered by the Report of Independent Registered Public Accounting Firm, are available on the Securities and Exchange Commission website or upon request.
3. Significant Accounting Policies.
The Fund is an investment company and applies the accounting and reporting guidance of the Financial Accounting Standards Board (FASB) Accounting Standards Codification Topic 946 Financial Services - Investment Companies. The financial statements have been prepared in conformity with accounting principles generally accepted in the United States of America (GAAP), which require management to make certain estimates and assumptions at the date of the financial statements. Actual results could differ from those estimates. Subsequent events, if any, through the date that the financial statements were issued have been evaluated in the preparation of the financial statements. The Fund's Schedule of Investments lists any underlying mutual funds or exchange-traded funds (ETFs) but does not include the underlying holdings of these funds. The following summarizes the significant accounting policies of the Fund:
Investment Valuation. Investments are valued as of 4:00 p.m. Eastern time on the last calendar day of the period. The Board of Trustees (the Board) has designated the Fund's investment adviser as the valuation designee responsible for the fair valuation function and performing fair value determinations as needed. The investment adviser has established a Fair Value Committee (the Committee) to carry out the day-to-day fair valuation responsibilities and has adopted policies and procedures to govern the fair valuation process and the activities of the Committee. In accordance with these fair valuation policies and procedures, which have been approved by the Board, the Fund attempts to obtain prices from one or more third party pricing services or brokers to value its investments. When current market prices, quotations or currency exchange rates are not readily available or reliable, investments will be fair valued in good faith by the Committee, in accordance with the policies and procedures. Factors used in determining fair value vary by investment type and may include market or investment specific events, transaction data, estimated cash flows, and market observations of comparable investments. The frequency that the fair valuation procedures are used cannot be predicted and they may be utilized to a significant extent. The Committee manages the Fund's fair valuation practices and maintains the fair valuation policies and procedures. The Fund's investment adviser reports to the Board information regarding the fair valuation process and related material matters.
The Fund categorizes the inputs to valuation techniques used to value its investments into a disclosure hierarchy consisting of three levels as shown below:
Level 1 - unadjusted quoted prices in active markets for identical investments
Level 2 - other significant observable inputs (including quoted prices for similar investments, interest rates, prepayment speeds, etc.)
Level 3 - unobservable inputs (including the Fund's own assumptions based on the best information available)
Valuation techniques used to value the Fund's investments by major category are as follows:
Equity securities, including restricted securities, for which market quotations are readily available, are valued at the last reported sale price or official closing price as reported by a third party pricing service on the primary market or exchange on which they are traded and are categorized as Level 1 in the hierarchy. In the event there were no sales during the day or closing prices are not available, securities are valued at the last quoted bid price or may be valued using the last available price and are generally categorized as Level 2 in the hierarchy. For foreign equity securities, when market or security specific events arise, comparisons to the valuation of American Depositary Receipts (ADRs), futures contracts, ETFs and certain indexes as well as quoted prices for similar securities may be used and would be categorized as Level 2 in the hierarchy. For equity securities, including restricted securities, where observable inputs are limited, assumptions about market activity and risk are used and these securities may be categorized as Level 3 in the hierarchy.
Exchange-traded options are valued using the last sale price or, in the absence of a sale, the last offering price and are categorized as Level 1 in the hierarchy. Investments in open-end mutual funds, including the Fidelity Central Funds, are valued at their closing net asset value (NAV) each business day and are categorized as Level 1 in the hierarchy.
Changes in valuation techniques may result in transfers in or out of an assigned level within the disclosure hierarchy. The aggregate value of investments by input level as of December 31, 2023 is included at the end of the Fund's Schedule of Investments.
Foreign Currency. Certain Funds may use foreign currency contracts to facilitate transactions in foreign-denominated securities. Gains and losses from these transactions may arise from changes in the value of the foreign currency or if the counterparties do not perform under the contracts' terms.
Foreign-denominated assets, including investment securities, and liabilities are translated into U.S. dollars at the exchange rates at period end. Purchases and sales of investment securities, income and dividends received, and expenses denominated in foreign currencies are translated into U.S. dollars at the exchange rate in effect on the transaction date.
The effects of exchange rate fluctuations on investments are included with the net realized and unrealized gain (loss) on investment securities. Other foreign currency transactions resulting in realized and unrealized gain (loss) are disclosed separately.
Investment Transactions and Income. For financial reporting purposes, the Fund's investment holdings and NAV include trades executed through the end of the last business day of the period. The NAV per share for processing shareholder transactions is calculated as of the close of business of the New York Stock Exchange (NYSE), normally 4:00 p.m. Eastern time and includes trades executed through the end of the prior business day. Gains and losses on securities sold are determined on the basis of identified cost and include proceeds received from litigation. Commissions paid to certain brokers with whom the investment adviser, or its affiliates, places trades on behalf of a fund include an amount in addition to trade execution, which may be rebated back to a fund. Any such rebates are included in net realized gain (loss) on investments in the Statement of Operations. Dividend income is recorded on the ex-dividend date, except for certain dividends from foreign securities where the ex-dividend date may have passed, which are recorded as soon as the Fund is informed of the ex-dividend date. Non-cash dividends included in dividend income, if any, are recorded at the fair market value of the securities received. Income and capital gain distributions from Fidelity Central Funds, if any, are recorded on the ex-dividend date. Certain distributions received by the Fund represent a return of capital or capital gain. The Fund determines the components of these distributions subsequent to the ex-dividend date, based upon receipt of tax filings or other correspondence relating to the underlying investment. These distributions are recorded as a reduction of cost of investments and/or as a realized gain. Interest income is accrued as earned and includes coupon interest and amortization of premium and accretion of discount on debt securities as applicable. Investment income is recorded net of foreign taxes withheld where recovery of such taxes is uncertain. Funds may file withholding tax reclaims in certain jurisdictions to recover a portion of amounts previously withheld. Any withholding tax reclaims income is included in the statement of Operations in dividends. Any receivables for withholding tax reclaims are included in the Statement of Assets and Liabilities in dividends receivable.
Class Allocations and Expenses. Investment income, realized and unrealized capital gains and losses, common expenses of a fund, and certain fund-level expense reductions, if any, are allocated daily on a pro-rata basis to each class based on the relative net assets of each class to the total net assets of a fund. Each class differs with respect to transfer agent and distribution and service plan fees incurred, as applicable. Certain expense reductions may also differ by class, if applicable. For the reporting period, the allocated portion of income and expenses to each class as a percent of its average net assets may vary due to the timing of recording these transactions in relation to fluctuating net assets of the classes. Expenses directly attributable to a fund are charged to that fund. Expenses attributable to more than one fund are allocated among the respective funds on the basis of relative net assets or other appropriate methods. Expenses included in the accompanying financial statements reflect the expenses of that fund and do not include any expenses associated with any underlying mutual funds or exchange-traded funds (ETFs). Although not included in a fund's expenses, a fund indirectly bears its proportionate share of these expenses through the net asset value of each underlying mutual fund or exchange-traded fund (ETF). Expense estimates are accrued in the period to which they relate and adjustments are made when actual amounts are known.
Income Tax Information and Distributions to Shareholders. Each year, the Fund intends to qualify as a regulated investment company under Subchapter M of the Internal Revenue Code, including distributing substantially all of its taxable income and realized gains. As a result, no provision for U.S. Federal income taxes is required. The Fund files a U.S. federal tax return, in addition to state and local tax returns as required. The Fund's federal income tax returns are subject to examination by the Internal Revenue Service (IRS) for a period of three fiscal years after they are filed. State and local tax returns may be subject to examination for an additional fiscal year depending on the jurisdiction. Foreign taxes are provided for based on the Fund's understanding of the tax rules and rates that exist in the foreign markets in which it invests.
Distributions are declared and recorded on the ex-dividend date. Income and capital gain distributions are declared separately for each class. Income and capital gain distributions are determined in accordance with income tax regulations, which may differ from GAAP.
Capital accounts within the financial statements are adjusted for permanent book-tax differences. These adjustments have no impact on net assets or the results of operations. Capital accounts are not adjusted for temporary book-tax differences which will reverse in a subsequent period.
Book-tax differences are primarily due to foreign currency transactions, certain corporate actions and losses deferred due to wash sales.
As of period end, the cost and unrealized appreciation (depreciation) in securities, and derivatives if applicable, for federal income tax purposes were as follows:
| Gross unrealized appreciation | $801,034,306 |
| Gross unrealized depreciation | (22,644,465) |
| Net unrealized appreciation (depreciation) | $778,389,841 |
| Tax cost | $1,424,444,025 |
4. Derivative Instruments.
Risk Exposures and the Use of Derivative Instruments. The Fund's investment objectives allow for various types of derivative instruments, including options. Derivatives are investments whose value is primarily derived from underlying assets, indices or reference rates and may be transacted on an exchange or over-the-counter (OTC). Derivatives may involve a future commitment to buy or sell a specified asset based on specified terms, to exchange future cash flows at periodic intervals based on a notional principal amount, or for one party to make one or more payments upon the occurrence of specified events in exchange for periodic payments from the other party.
Derivatives were used to increase returns and to manage exposure to certain risks as defined below. The success of any strategy involving derivatives depends on analysis of numerous economic factors, and if the strategies for investment do not work as intended, the objectives may not be achieved.
Derivatives were used to increase or decrease exposure to the following risk(s):
| | |
| Equity Risk | Equity risk relates to the fluctuations in the value of financial instruments as a result of changes in market prices (other than those arising from interest rate risk or foreign exchange risk), whether caused by factors specific to an individual investment, its issuer, or all factors affecting all instruments traded in a market or market segment. |
Funds are also exposed to additional risks from investing in derivatives, such as liquidity risk and counterparty credit risk. Liquidity risk is the risk that a fund will be unable to close out the derivative in the open market in a timely manner. Counterparty credit risk is the risk that the counterparty will not be able to fulfill its obligation to a fund. Counterparty credit risk related to exchange-traded contracts may be mitigated by the protection provided by the exchange on which they trade.
Investing in derivatives may involve greater risks than investing in the underlying assets directly and, to varying degrees, may involve risk of loss in excess of any initial investment and collateral received and amounts recognized in the Statement of Assets and Liabilities. In addition, there may be the risk that the change in value of the derivative contract does not correspond to the change in value of the underlying instrument.
Options. Options give the purchaser the right, but not the obligation, to buy (call) or sell (put) an underlying security or financial instrument at an agreed exercise or strike price between or on certain dates. Options obligate the seller (writer) to buy (put) or sell (call) an underlying instrument at the exercise or strike price or cash settle an underlying derivative instrument if the holder exercises the option on or before the expiration date.
Exchange-traded written covered call options were used to manage exposure to the market. When a fund writes a covered call option, a fund holds the underlying instrument which must be delivered to the holder upon the exercise of the option.
Upon entering into a written options contract, a fund will receive a premium. Premiums received are reflected as a liability on the Statement of Assets and Liabilities. Options are valued daily and any unrealized appreciation (depreciation) is reflected in total accumulated earnings (loss) in the Statement of Assets and Liabilities. When a written option is exercised, the premium is added to the proceeds from the sale of the underlying instrument in determining the gain or loss realized on that investment. When an option is closed, a gain or loss is realized depending on whether the proceeds or amount paid for the closing sale transaction are greater or less than the premium received. When an option expires, gains and losses are realized to the extent of premiums received. The net realized gain (loss) on closed and expired written options and the change in net unrealized appreciation (depreciation) on written options are presented in the Statement of Operations.
Writing call options tends to decrease exposure to the underlying instrument and risk of loss is the change in value in excess of the premium received.
Any open options at period end are presented in the Schedule of Investments under the caption "Written Options", and are representative of volume of activity during the period unless an average contracts amount is presented.
5. Purchases and Sales of Investments.
Purchases and sales of securities, other than short-term securities and in-kind transactions, as applicable, are noted in the table below.
| | Purchases ($) | Sales ($) |
| Fidelity Mega Cap Stock Fund | 314,489,878 | 62,246,115 |
6. Fees and Other Transactions with Affiliates.
Management Fee. Fidelity Management & Research Company LLC (the investment adviser) and its affiliates provide the Fund with investment management related services for which the Fund pays a monthly management fee. The management fee is the sum of an individual fund fee rate that is based on an annual rate of .20% of the Fund's average net assets and an annualized group fee rate that averaged .22% during the period. The group fee rate is based upon the monthly average net assets of a group of registered investment companies with which the investment adviser has management contracts. The group fee rate decreases as assets under management increase and increases as assets under management decrease. For the reporting period, the total annualized management fee rate was .42% of the Fund's average net assets.
7. Distribution and Service Plan Fees. In accordance with Rule 12b-1 of the 1940 Act, the Fund has adopted separate Distribution and Service Plans for each class of shares. Certain classes pay Fidelity Distributors Company LLC (FDC), an affiliate of the investment adviser, separate Distribution and Service Fees, each of which is based on an annual percentage of each class' average net assets. In addition, FDC may pay financial intermediaries for selling shares of the Fund and providing shareholder support services. For the period, the Distribution and Service Fee rates, total fees and amounts retained by FDC were as follows:
| | Distribution Fee | Service Fee | Total Fees | Retained by FDC |
| Class A | - % | .25% | $179,367 | $8,030 |
| Class M | .25% | .25% | 78,012 | - |
| Class C | .75% | .25% | 120,853 | 26,555 |
| | | | $378,232 | $34,585 |
Sales Load. FDC may receive a front-end sales charge of up to 5.75% for selling Class A shares and 3.50% for selling Class M shares, some of which is paid to financial intermediaries for selling shares of the Fund. Depending on the holding period, FDC may receive contingent deferred sales charges levied on Class A, Class M and Class C redemptions. The deferred sales charges are 1.00% for Class C shares, 1.00% for certain purchases of Class A shares and .25% for certain purchases of Class M shares.
For the period, sales charge amounts retained by FDC were as follows:
| | Retained by FDC |
| Class A | $57,526 |
| Class M | 1,735 |
Class CA | 79 |
| | $59,340 |
A When Class C shares are initially sold, FDC pays commissions from its own resources to financial intermediaries through which the sales are made.
Transfer Agent Fees. Fidelity Investments Institutional Operations Company LLC (FIIOC), an affiliate of the investment adviser, is the transfer, dividend disbursing and shareholder servicing agent for each class of the Fund.
During November 2023, the Board approved a change in the transfer agent fees effective December 1, 2023 to a fixed annual rate of class-level average net assets as follows:
| | % of Class-Level Average Net Assets |
| Class A | .1754 |
| Class M | .1820 |
| Class C | .2000 |
| Mega Cap Stock | .1549 |
| Class I | .1557 |
Prior to December 1, 2023, FIIOC received account fees and asset-based fees that varied according to the account size and type of account of the shareholders of the respective classes of the Fund, except for Class Z. FIIOC received an asset-based fee of Class Z's average net assets. FIIOC pays for typesetting, printing and mailing of shareholder reports, except proxy statements
For the period, transfer agent fees for each class were as follows:
| | Amount | % of Class-Level Average Net AssetsA |
| Class A | $127,273 | .18 |
| Class M | 28,557 | .18 |
| Class C | 24,887 | .21 |
| Mega Cap Stock | 1,039,058 | .16 |
| Class I | 149,717 | .16 |
| Class Z | 43,081 | .04 |
| | $1,412,573 | |
A Annualized
Accounting Fees. Fidelity Service Company, Inc. (FSC), an affiliate of the investment adviser, maintains the Fund's accounting records.
During November 2023, the Board approved a change in the accounting fees effective December 1, 2023 to a fixed annual rate of average net assets as follows:
| | % of Average Net Assets |
| Fidelity Mega Cap Stock Fund | 0.0272 |
Prior to December 1, 2023, the accounting fee was based on the level of average net assets for each month. For the period, the fees were equivalent to the following annualized rates:
| | % of Average Net Assets |
| Fidelity Mega Cap Stock Fund | .03 |
Subsequent Event - Management Fee. Effective March 1, 2024, the Fund's management contract will be amended to incorporate administrative services previously covered under separate services agreements (Transfer Agent and Accounting agreements). The amended contract incorporates a management fee rate that may vary by class. The investment adviser or an affiliate will pay certain expenses of managing and operating the Fund out of each class's management fee.
Each class of the Fund will pay a management fee to the investment adviser. The management fee will be calculated and paid to the investment adviser every month.
When determining a class's management fee, a mandate rate will be calculated based on the monthly average net assets of a group of funds advised by FMR within a designated asset class. A discount rate will be subtracted from the mandate rate once the Fund's monthly average net assets reach a certain level. The mandate rate and discount rate may vary by class.
The annual management fee rate for a class of shares of the Fund will be the lesser of (1) the class's mandate rate reduced by the class's discount rate (if applicable) or (2) the amount set forth in the following table.
| | Maximum Management Fee Rate % |
| Class A | .60 |
| Class M | .60 |
| Class C | .62 |
| Mega Cap Stock | .57 |
| Class I | .58 |
| Class Z | .46 |
One-twelfth of the management fee rate for a class will be applied to the average net assets of the class for the month, giving a dollar amount which is the management fee for the class for that month.
A different management fee rate may be applicable to each class of the Fund. The difference between classes is the result of separate arrangements for class-level services and/or waivers of certain expenses. It is not the result of any difference in advisory or custodial fees or other expenses related to the management of the Fund's assets, which do not vary by class.
Effective March 1, 2024, the Fund's sub-advisory agreements with FMR Investment Management (UK) Limited, Fidelity Management & Research (Hong Kong) Limited, and Fidelity Management & Research (Japan) Limited will be amended to provide that the investment adviser will pay each sub-adviser monthly fees equal to 110% of the sub-adviser's costs for providing sub-advisory services.
Brokerage Commissions. A portion of portfolio transactions were placed with brokerage firms which are affiliates of the investment adviser. Brokerage commissions are included in net realized gain (loss) and change in net unrealized appreciation (depreciation) in the Statement of Operations. The commissions paid to these affiliated firms were as follows:
| | Amount |
| Fidelity Mega Cap Stock Fund | $ 3,081 |
Interfund Trades. Funds may purchase from or sell securities to other Fidelity Funds under procedures adopted by the Board. The procedures have been designed to ensure these interfund trades are executed in accordance with Rule 17a-7 of the 1940 Act. Any interfund trades are included within the respective purchases and sales amounts shown in the Purchases and Sales of Investments note. Interfund trades during the period are noted in the table below.
| | Purchases ($) | Sales ($) | Realized Gain (Loss) ($) |
| Fidelity Mega Cap Stock Fund | 16,806,797 | 2,856,165 | 1,777,538 |
8. Committed Line of Credit.
Certain Funds participate with other funds managed by the investment adviser or an affiliate in a $4.25 billion credit facility (the "line of credit") to be utilized for temporary or emergency purposes to fund shareholder redemptions or for other short-term liquidity purposes. The participating funds have agreed to pay commitment fees on their pro-rata portion of the line of credit, which are reflected in Miscellaneous expenses on the Statement of Operations, and are listed below. During the period, there were no borrowings on this line of credit.
| | Amount |
| Fidelity Mega Cap Stock Fund | $1,390 |
9. Security Lending.
Funds lend portfolio securities from time to time in order to earn additional income. Lending agents are used, including National Financial Services (NFS), an affiliate of the investment adviser. Pursuant to a securities lending agreement, NFS will receive a fee, which is capped at 9.9% of a fund's daily lending revenue, for its services as lending agent. A fund may lend securities to certain qualified borrowers, including NFS. On the settlement date of the loan, a fund receives collateral (in the form of U.S. Treasury obligations, letters of credit and/or cash) against the loaned securities and maintains collateral in an amount not less than 100% of the market value of the loaned securities during the period of the loan. The market value of the loaned securities is determined at the close of business of a fund and any additional required collateral is delivered to a fund on the next business day. A fund or borrower may terminate the loan at any time, and if the borrower defaults on its obligation to return the securities loaned because of insolvency or other reasons, a fund may apply collateral received from the borrower against the obligation. A fund may experience delays and costs in recovering the securities loaned. Any cash collateral received is invested in the Fidelity Securities Lending Cash Central Fund. Any loaned securities are identified as such in the Schedule of Investments, and the value of loaned securities and cash collateral at period end, as applicable, are presented in the Statement of Assets and Liabilities. Security lending income represents the income earned on investing cash collateral, less rebates paid to borrowers and any lending agent fees associated with the loan, plus any premium payments received for lending certain types of securities. Security lending income is presented in the Statement of Operations as a component of income from Fidelity Central Funds. Affiliated security lending activity, if any, was as follows:
| | Total Security Lending Fees Paid to NFS | Security Lending Income From Securities Loaned to NFS | Value of Securities Loaned to NFS at Period End |
| Fidelity Mega Cap Stock Fund | $8,901 | $- | $- |
10. Expense Reductions.
Through arrangements with the Fund's custodian and each class' transfer agent, credits realized as a result of certain uninvested cash balances were used to reduce the Fund's expenses. During the period, custodian credits reduced the Fund's expenses by $363. During the period, transfer agent credits reduced each class' expenses as noted in the table below.
| | Expense reduction |
| | |
| Class M | $53 |
In addition, during the period the investment adviser or an affiliate reimbursed and/or waived a portion of fund-level operating expenses in the amount of $64,908.
11. Distributions to Shareholders.
Distributions to shareholders of each class were as follows:
| | Six months ended December 31, 2023 | Year ended June 30, 2023 |
| Fidelity Mega Cap Stock Fund | | |
| Distributions to shareholders | | |
| Class A | $ 2,880,657 | $3,853,966 |
| Class M | 523,154 | 1,033,161 |
| Class C | 330,364 | 718,884 |
| Mega Cap Stock | 29,385,508 | 41,036,146 |
| Class I | 4,587,110 | 2,435,167 |
| Class Z | 4,914,909 | 9,349,664 |
Total | $42,621,702 | $58,426,988 |
12. Share Transactions.
Share transactions for each class were as follows and may contain in-kind transactions, automatic conversions between classes or exchanges between affiliated funds:
| | Shares | Shares | Dollars | Dollars |
| | Six months ended December 31, 2023 | Year ended June 30, 2023 | Six months ended December 31, 2023 | Year ended June 30, 2023 |
| Fidelity Mega Cap Stock Fund | | | | |
| Class A | | | | |
| Shares sold | 1,268,709 | 2,157,526 | $24,837,735 | $37,668,977 |
| Reinvestment of distributions | 141,517 | 228,217 | 2,864,554 | 3,827,312 |
| Shares redeemed | (489,579) | (912,758) | (9,549,403) | (15,785,502) |
| Net increase (decrease) | 920,647 | 1,472,985 | $18,152,886 | $25,710,787 |
| Class M | | | | |
| Shares sold | 70,706 | 239,387 | $1,382,535 | $4,183,606 |
| Reinvestment of distributions | 25,773 | 61,536 | 522,636 | 1,032,772 |
| Shares redeemed | (114,636) | (277,862) | (2,242,369) | (4,825,558) |
| Net increase (decrease) | (18,157) | 23,061 | $(337,198) | $390,820 |
| Class C | | | | |
| Shares sold | 333,811 | 328,805 | $6,376,550 | $5,600,248 |
| Reinvestment of distributions | 16,553 | 43,647 | 329,385 | 716,292 |
| Shares redeemed | (211,975) | (428,918) | (4,040,243) | (7,252,603) |
| Net increase (decrease) | 138,389 | (56,466) | $2,665,692 | $(936,063) |
| Mega Cap Stock | | | | |
| Shares sold | 15,419,971 | 14,800,679 | $307,803,102 | $269,976,937 |
| Reinvestment of distributions | 1,300,230 | 2,240,783 | 26,741,325 | 38,208,143 |
| Shares redeemed | (6,528,018) | (12,025,767) | (129,780,271) | (203,167,741) |
| Net increase (decrease) | 10,192,183 | 5,015,695 | $204,764,156 | $105,017,339 |
| Class I | | | | |
| Shares sold | 7,037,539 | 5,717,376 | $142,104,745 | $104,848,193 |
| Reinvestment of distributions | 206,340 | 141,083 | 4,255,654 | 2,409,447 |
| Shares redeemed | (1,159,451) | (2,320,856) | (23,473,528) | (41,167,093) |
| Net increase (decrease) | 6,084,428 | 3,537,603 | $122,886,871 | $66,090,547 |
| Class Z | | | | |
| Shares sold | 5,040,314 | 7,722,491 | $101,687,702 | $125,806,074 |
| Reinvestment of distributions | 41,335 | 80,256 | 845,995 | 1,360,444 |
| Shares redeemed | (956,120) | (11,514,787) | (18,783,929) | (186,009,160) |
| Net increase (decrease) | 4,125,529 | (3,712,040) | $83,749,768 | $(58,842,642) |
13. Other.
A fund's organizational documents provide former and current trustees and officers with a limited indemnification against liabilities arising in connection with the performance of their duties to the fund. In the normal course of business, a fund may also enter into contracts that provide general indemnifications. A fund's maximum exposure under these arrangements is unknown as this would be dependent on future claims that may be made against a fund. The risk of material loss from such claims is considered remote.
14. Risk and Uncertainties.
Many factors affect a fund's performance. Developments that disrupt global economies and financial markets, such as pandemics, epidemics, outbreaks of infectious diseases, war, terrorism, and environmental disasters, may significantly affect a fund's investment performance. The effects of these developments to a fund will be impacted by the types of securities in which a fund invests, the financial condition, industry, economic sector, and geographic location of an issuer, and a fund's level of investment in the securities of that issuer. Significant concentrations in security types, issuers, industries, sectors, and geographic locations may magnify the factors that affect a fund's performance.
As a shareholder, you incur two types of costs: (1) transaction costs, which may include sales charges (loads) on purchase payments or redemption proceeds, as applicable and (2) ongoing costs, which generally include management fees, distribution and/or service (12b-1) fees and other Fund expenses. This Example is intended to help you understand your ongoing costs (in dollars) of investing in a fund and to compare these costs with the ongoing costs of investing in other mutual funds.
| The Example is based on an investment of $1,000 invested at the beginning of the period and held for the entire period (July 1, 2023 to December 31, 2023). |
Actual Expenses
The first line of the accompanying table provides information about actual account values and actual expenses. You may use the information in this line, together with the amount you invested, to estimate the expenses that you paid over the period. Simply divide your account value by $1,000.00 (for example, an $8,600 account value divided by $1,000.00 = 8.6), then multiply the result by the number in the first line for a class/Fund under the heading entitled "Expenses Paid During Period" to estimate the expenses you paid on your account during this period. If any fund is a shareholder of any underlying mutual funds or exchange-traded funds (ETFs) (the Underlying Funds), such fund indirectly bears its proportional share of the expenses of the Underlying Funds in addition to the direct expenses incurred presented in the table. These fees and expenses are not included in the annualized expense ratio used to calculate the expense estimate in the table below.
Hypothetical Example for Comparison Purposes
The second line of the accompanying table provides information about hypothetical account values and hypothetical expenses based on the actual expense ratio and an assumed rate of return of 5% per year before expenses, which is not the actual return. The hypothetical account values and expenses may not be used to estimate the actual ending account balance or expenses you paid for the period. You may use this information to compare the ongoing costs of investing in the Fund and other funds. To do so, compare this 5% hypothetical example with the 5% hypothetical examples that appear in the shareholder reports of the other funds. If any fund is a shareholder of any Underlying Funds, such fund indirectly bears its proportional share of the expenses of the Underlying Funds in addition to the direct expenses as presented in the table. These fees and expenses are not included in the annualized expense ratio used to calculate the expense estimate in the table below.
Please note that the expenses shown in the table are meant to highlight your ongoing costs only and do not reflect any transaction costs. Therefore, the second line of the table is useful in comparing ongoing costs only, and will not help you determine the relative total costs of owning different funds. In addition, if these transactional costs were included, your costs would have been higher.
| | | | | Annualized Expense Ratio- A | | Beginning Account Value July 1, 2023 | | Ending Account Value December 31, 2023 | | Expenses Paid During Period- C July 1, 2023 to December 31, 2023 |
| Fidelity® Mega Cap Stock Fund | | | | | | | | | | |
| Class A | | | | .89% | | | | | | |
| Actual | | | | | | $ 1,000 | | $ 1,090.50 | | $ 4.68 |
Hypothetical-B | | | | | | $ 1,000 | | $ 1,020.66 | | $ 4.52 |
| Class M | | | | 1.14% | | | | | | |
| Actual | | | | | | $ 1,000 | | $ 1,088.70 | | $ 5.99 |
Hypothetical-B | | | | | | $ 1,000 | | $ 1,019.41 | | $ 5.79 |
| Class C | | | | 1.67% | | | | | | |
| Actual | | | | | | $ 1,000 | | $ 1,086.40 | | $ 8.76 |
Hypothetical-B | | | | | | $ 1,000 | | $ 1,016.74 | | $ 8.47 |
Fidelity® Mega Cap Stock Fund ** | | | | .62% | | | | | | |
| Actual | | | | | | $ 1,000 | | $ 1,092.00 | | $ 3.26 |
Hypothetical-B | | | | | | $ 1,000 | | $ 1,022.02 | | $ 3.15 |
Class I ** | | | | .62% | | | | | | |
| Actual | | | | | | $ 1,000 | | $ 1,091.70 | | $ 3.26 |
Hypothetical-B | | | | | | $ 1,000 | | $ 1,022.02 | | $ 3.15 |
Class Z ** | | | | .50% | | | | | | |
| Actual | | | | | | $ 1,000 | | $ 1,092.60 | | $ 2.63 |
Hypothetical-B | | | | | | $ 1,000 | | $ 1,022.62 | | $ 2.54 |
| |
A Annualized expense ratio reflects expenses net of applicable fee waivers.
B 5% return per year before expenses
C Expenses are equal to the annualized expense ratio, multiplied by the average account value over the period, multiplied by 184/ 366 (to reflect the one-half year period). The fees and expenses of any Underlying Funds are not included in each annualized expense ratio.
** If fees and changes to the expense contract and/or expense cap, effective March 1, 2024, had been in effect during the current period, the restated annualized expense ratio and the expenses paid in the actual and hypothetical examples above would have been as shown in table below:
| | | | | Annualized Expense Ratio- A | | Expenses Paid |
| Fidelity® Mega Cap Stock Fund | | | | | | |
| Fidelity® Mega Cap Stock Fund | | | | .58% | | |
| Actual | | | | | | $ 3.05 |
Hypothetical- B | | | | | | $ 2.95 |
| Class I | | | | .59% | | |
| Actual | | | | | | $ 3.10 |
Hypothetical- B | | | | | | $ 3.00 |
| Class Z | | | | .47% | | |
| Actual | | | | | | $ 2.47 |
Hypothetical- B | | | | | | $ 2.39 |
| | | | | | | |
| A Annualized expense ratio reflects expenses net of applicable fee waivers. | | | | | | |
| B 5% return per year before expenses | | | | | | |
Board Approval of Investment Advisory Contracts and Management Fees
Fidelity Mega Cap Stock Fund
Each year, the Board of Trustees, including the Independent Trustees (together, the Board), considers the renewal of the fund's management contract with Fidelity Management & Research Company LLC (FMR) and the sub-advisory agreements (together, the Advisory Contracts) for the fund. FMR and the sub-advisers are referred to herein as the Investment Advisers. The Board, assisted by the advice of fund counsel and Independent Trustees' counsel, requests and considers a broad range of information relevant to the renewal of the Advisory Contracts throughout the year.
The Board meets regularly and, at each of its meetings, covers an extensive agenda of topics and materials and considers factors that are relevant to its annual consideration of the renewal of the fund's Advisory Contracts, including the services and support provided to the fund and its shareholders. The Board, acting directly and through its Committees (each of which is composed of and chaired by Independent Trustees), requests and receives information concerning the annual consideration of the renewal of the fund's Advisory Contracts. The Board also meets as needed to review matters specifically related to the Board's annual consideration of the renewal of the Advisory Contracts. Members of the Board may also meet with trustees of other Fidelity funds through joint ad hoc committees to discuss certain matters relevant to all of the Fidelity funds.
At its July 2023 meeting, the Board unanimously determined to renew the fund's Advisory Contracts. In reaching its determination, the Board considered all factors it believed relevant, including (i) the nature, extent, and quality of the services provided to the fund and its shareholders (including the investment performance of the fund); (ii) the competitiveness relative to peer funds of the fund's management fee and the total expense ratio of a representative class (retail class, which was selected because it is the largest class without 12b-1 fees); (iii) the total costs of the services provided by and the profits realized by FMR and its affiliates (Fidelity) from its relationships with the fund; and (iv) the extent to which, if any, economies of scale exist and are realized as the fund grows, and whether any economies of scale are appropriately shared with fund shareholders. The Board also considered the broad range of investment choices available to shareholders from FMR's competitors and that the fund's shareholders have chosen to invest in the fund, which is part of the Fidelity family of funds. The Board's decision to renew the Advisory Contracts was not based on any single factor.
The Board reached a determination, with the assistance of fund counsel and Independent Trustees' counsel and through the exercise of its business judgment, that the renewal of the Advisory Contracts was in the best interests of the fund and its shareholders and that the compensation payable under the Advisory Contracts was fair and reasonable in light of all of the surrounding circumstances.
Nature, Extent, and Quality of Services Provided. The Board considered staffing as it relates to the fund, including the backgrounds and experience of investment personnel of the Investment Advisers, and also considered the Investment Advisers' implementation of the fund's investment program. The Independent Trustees also had discussions with senior management of Fidelity's investment operations and investment groups. The Board considered the structure of the investment personnel compensation program and whether this structure provides appropriate incentives to act in the best interests of the fund. Additionally, the Board considered the portfolio managers' investments, if any, in the funds that they manage.
Resources Dedicated to Investment Management and Support Services. The Board and the Fund Oversight and Research Committees reviewed the general qualifications and capabilities of Fidelity's investment staff, including its size, education, experience, and resources, as well as Fidelity's approach to recruiting, training, managing, and compensating investment personnel. The Board noted the resources devoted to expansion of Fidelity's global investment organization, and that Fidelity's analysts have extensive resources, tools, and capabilities that allow them to conduct sophisticated quantitative and fundamental analysis, as well as credit analysis of issuers, counterparties, and guarantors. Further, the Board considered that Fidelity's investment professionals have sufficient access to global information and data so as to provide competitive investment results over time, and that those professionals also have access to sophisticated tools that permit them to assess portfolio construction and risk and performance attribution characteristics continuously, as well as to transmit new information and research conclusions rapidly around the world. Additionally, in its deliberations, the Board considered Fidelity's trading, risk management, compliance, and technology and operations capabilities and resources, which are integral parts of the investment management process.
Shareholder and Administrative Services. The Board considered (i) the nature, extent, quality, and cost of advisory, administrative, and shareholder services performed by the Investment Advisers and their affiliates under the Advisory Contracts and under separate agreements covering transfer agency, pricing and bookkeeping, and securities lending services for the fund; (ii) the nature and extent of Fidelity's supervision of third party service providers, principally custodians, subcustodians, and pricing vendors; and (iii) the resources devoted by Fidelity to, and the record of compliance with, the fund's compliance policies and procedures. The Board also reviewed the allocation of fund brokerage, including allocations to brokers affiliated with the Investment Advisers, the use of brokerage commissions to pay fund expenses, and the use of "soft" commission dollars to pay for research services. The Board also considered the fund's securities lending activities and any payments made to Fidelity relating to securities lending.
The Board noted that the growth of fund assets over time across the complex allows Fidelity to reinvest in the development of services designed to enhance the value and convenience of the Fidelity funds as investment vehicles. These services include 24-hour access to account information and market information over the Internet and through telephone representatives, investor education materials, and asset allocation tools. The Board also considered that it reviews customer service metrics such as telephone response times, continuity of services on the website and metrics addressing services at Fidelity Investor Centers.
Investment in a Large Fund Family. The Board considered the benefits to shareholders of investing in a fund that is part of a large family of funds offering a variety of investment disciplines and providing a large variety of fund investor services. The Board noted that Fidelity had taken, or had made recommendations that resulted in the Fidelity funds taking, a number of actions over the previous year that benefited particular funds and/or the Fidelity funds in general.
Investment Performance. The Board took into account discussions that occur with representatives of the Investment Advisers, and reports that it receives, at Board meetings throughout the year, relating to fund investment performance. In this regard the Board noted that as part of regularly scheduled fund reviews and other reports to the Board on fund performance, the Board considered annualized return information for the fund for different time periods, measured against an appropriate securities market index (benchmark index). The Board also considered information about performance attribution. In its ongoing evaluation of fund investment performance, the Board gives particular attention to information indicating changes in performance of the funds over different time periods and discussed with the Investment Advisers the reasons for any overperformance or underperformance.
In addition to reviewing absolute and relative fund performance, the Independent Trustees periodically consider the appropriateness of fund performance metrics in evaluating the results achieved. The Independent Trustees generally give greater weight to fund performance over longer time periods than over shorter time periods. Depending on the circumstances, the Independent Trustees may be satisfied with a fund's performance notwithstanding that it lags its benchmark index for certain periods.
Based on its review, the Board concluded that the nature, extent, and quality of services provided to the fund under the Advisory Contracts should continue to benefit the shareholders of the fund.
Competitiveness of Management Fee and Total Expense Ratio. The Board was provided with information regarding industry trends in management fees and expenses. In its review of the fund's management fee and the total expense ratio of the retail class, the Board considered the fund's management fee rate as well as other fund or class expenses, as applicable, such as transfer agent fees, pricing and bookkeeping fees, fund-paid 12b-1 fees, and custodial, legal, and audit fees. The Board noted that Fidelity may agree to waive fees or reimburse expenses from time to time, and the extent to which, if any, it has done so for the fund.
Comparisons of Management Fees and Total Expense Ratios. Among other things, the Board reviewed data for selected groups of competitive funds and classes (referred to as "mapped groups") that were compiled by Fidelity based on combining similar investment objective categories (as classified by Lipper) that have comparable investment mandates. The data reviewed by the Board included (i) gross management fee comparisons (before taking into account expense reimbursements or caps) relative to the total universe of funds within the mapped group; (ii) gross management fee comparisons relative to a subset of non-Fidelity funds in the mapped group that are similar in size and management fee structure to the fund (referred to as the "asset size peer group"); (iii) total expense comparisons of the retail class of the fund relative to funds and classes in the mapped group that have a similar sales load structure to the retail class of the fund (referred to as the "similar sales load structure group"); and (iv) total expense comparisons of the retail class of the fund relative to funds and classes in the similar sales load structure group that are similar in size and management fee structure to the fund (referred to as the "total expense asset size peer group"). The total expense asset size peer group comparison excludes performance adjustments and fund-paid 12b-1 fees to eliminate variability in fee structures.
The information provided to the Board indicated that the fund's management fee rate ranked below the competitive median of the mapped group for the 12-month period ended September 30, 2022 and below the competitive median of the asset size peer group for the 12-month period ended September 30, 2022. Further, the information provided to the Board indicated that the total expense ratio of the retail class of the fund ranked below the competitive median of the similar sales load structure group for the 12-month period ended September 30, 2022 and below the competitive median of the total expense asset size peer group for the 12-month period ended September 30, 2022.
The Board also considered that, for funds subject to the group fee, FMR agreed to voluntarily waive fees over a specified period of time in amounts designed to account for assets converted from certain funds to certain collective investment trusts.
Fees Charged to Other Fidelity Clients. The Board also considered Fidelity fee structures and other information with respect to clients of Fidelity, such as other funds advised or subadvised by Fidelity, pension plan clients, and other institutional clients with similar mandates. The Board noted that a joint ad hoc committee created by it and the boards of other Fidelity funds periodically reviews and compares Fidelity's institutional investment advisory business with its business of providing services to the Fidelity funds and also noted the most recent findings of the committee. The Board noted that the committee's review included a consideration of the differences in services provided, fees charged, and costs incurred, as well as competition in the markets serving the different categories of clients.
Based on its review, the Board concluded that the fund's management fee is fair and reasonable in light of the services that the fund receives and the other factors considered. Further, based on its review of total expense ratios and fees charged to other Fidelity clients, the Board concluded that the total expense ratio of each class of the fund was reasonable in light of the services that the fund and its shareholders receive and the other factors considered.
Costs of the Services and Profitability. The Board considered the revenues earned and the expenses incurred by Fidelity in conducting the business of developing, marketing, distributing, managing, administering and servicing the fund and servicing the fund's shareholders. The Board also considered the level of Fidelity's profits in respect of all the Fidelity funds.
On an annual basis, Fidelity presents to the Board information about the profitability of its relationships with the fund. Fidelity calculates profitability information for each fund, as well as aggregate profitability information for groups of Fidelity funds and all Fidelity funds, using a series of detailed revenue and cost allocation methodologies which originate with the books and records of Fidelity on which Fidelity's audited financial statements are based. The Audit Committee of the Board reviews any significant changes from the prior year's methodologies and the full Board approves such changes.
A public accounting firm has been engaged annually by the Board as part of the Board's assessment of Fidelity's profitability analysis. The engagement includes the review and assessment of the methodologies used by Fidelity in determining the revenues and expenses attributable to Fidelity's fund business, and completion of agreed-upon procedures in respect of the mathematical accuracy of certain fund profitability information and its conformity to established allocation methodologies. After considering the reports issued under the engagement and information provided by Fidelity, the Board concluded that while other allocation methods may also be reasonable, Fidelity's profitability methodologies are reasonable in all material respects.
The Board also reviewed Fidelity's non-fund businesses and potential indirect benefits such businesses may have received as a result of their association with Fidelity's fund business (i.e., fall-out benefits) as well as cases where Fidelity's affiliates may benefit from the funds' business. The Board considered areas where potential indirect benefits to the Fidelity funds from their relationships with Fidelity may exist. The Board's consideration of these matters was informed by the findings of a joint ad hoc committee created by it and the boards of other Fidelity funds to evaluate potential fall-out benefits.
The Board considered the costs of the services provided by and the profits realized by Fidelity in connection with the operation of the fund and was satisfied that the profitability was not excessive.
Economies of Scale. The Board considered whether there have been economies of scale in respect of the management of the Fidelity funds, whether the Fidelity funds (including the fund) have appropriately benefited from any such economies of scale, and whether there is potential for realization of any further economies of scale. The Board considered the extent to which the fund will benefit from economies of scale as assets grow through increased services to the fund, through waivers or reimbursements, or through fee or expense ratio reductions. The Board also noted that a committee (the Economies of Scale Committee) created by it and the boards of other Fidelity funds periodically analyzes whether Fidelity attains economies of scale in respect of the management and servicing of the Fidelity funds, whether the Fidelity funds have appropriately benefited from such economies of scale, and whether there is potential for realization of any further economies of scale.
The Board recognized that the fund's management contract incorporates a "group fee" structure, which provides for lower group fee rates as total "group assets" increase, and for higher group fee rates as total "group assets" decrease ("group assets" as defined in the management contract). FMR calculates the group fee rates based on a tiered asset "breakpoint" schedule that varies based on asset class. The Board considered that the group fee is designed to deliver the benefits of economies of scale to fund shareholders when total Fidelity fund assets increase, even if assets of any particular fund are unchanged or have declined, because some portion of Fidelity's costs are attributable to services provided to all Fidelity funds, and all funds benefit if those costs can be allocated among more assets. The Board further considered that Fidelity agreed to impose a temporary fee waiver in the form of additional breakpoints to the current breakpoint schedule. The Board concluded that, given the group fee structure, fund shareholders will benefit from lower management fees as "group assets" increase at the fund complex level, regardless of whether Fidelity achieves any such economies of scale.
The Board concluded, taking into account the analysis of the Economies of Scale Committee, that economies of scale, if any, are being appropriately shared between fund shareholders and Fidelity.
Additional Information Requested by the Board. In order to develop fully the factual basis for consideration of the Fidelity funds' advisory contracts, the Board requested and received additional information on certain topics, including: (i) fund flow and performance trends, in particular the underperformance of certain funds and strategies, and Fidelity's long-term strategies for certain funds, including any consideration of fund liquidations or mergers; (ii) the operation of performance fees and competitor use of performance fees; (iii) Fidelity's pricing philosophy compared to competitors; (iv) fund profitability methodology and data; (v) evaluation of competitive fund data and peer group classifications and fee and expense comparisons; (vi) the management fee and expense structures for different funds and classes and information about the differences between various fee and expense structures; (vii) group fee breakpoints and related voluntary fee waivers; and (viii) information regarding other accounts managed by Fidelity and the funds' sub-advisory arrangements.
Conclusion. Based on its evaluation of all of the conclusions noted above, and after considering all factors it believed relevant, the Board, including the Independent Trustees, concluded that the advisory and sub-advisory fee arrangements are fair and reasonable in light of all of the surrounding circumstances and that the fund's Advisory Contracts should be renewed through July 31, 2024.
1.714809.127
GII-SANN-0224
Fidelity® Series Large Cap Stock Fund
Semi-Annual Report
December 31, 2023
Contents
To view a fund's proxy voting guidelines and proxy voting record for the 12-month period ended June 30, visit http://www.fidelity.com/proxyvotingresults or visit the Securities and Exchange Commission's (SEC) web site at http://www.sec.gov.
You may also call 1-800-544-8544 to request a free copy of the proxy voting guidelines.
Standard & Poor's, S&P and S&P 500 are registered service marks of The McGraw-Hill Companies, Inc. and have been licensed for use by Fidelity Distributors Corporation.
Other third-party marks appearing herein are the property of their respective owners.
All other marks appearing herein are registered or unregistered trademarks or service marks of FMR LLC or an affiliated company. © 2024 FMR LLC. All rights reserved.
This report and the financial statements contained herein are submitted for the general information of the shareholders of the Fund. This report is not authorized for distribution to prospective investors in the Fund unless preceded or accompanied by an effective prospectus.
A fund files its complete schedule of portfolio holdings with the SEC for the first and third quarters of each fiscal year on Form N-PORT. Forms N-PORT are available on the SEC's web site at http://www.sec.gov. A fund's Forms N-PORT may be reviewed and copied at the SEC's Public Reference Room in Washington, DC. Information regarding the operation of the SEC's Public Reference Room may be obtained by calling 1-800-SEC-0330.
For a complete list of a fund's portfolio holdings, view the most recent holdings listing, semiannual report, or annual report on Fidelity's web site at http://www.fidelity.com, http://www.institutional.fidelity.com, or http://www.401k.com, as applicable.
NOT FDIC INSURED •MAY LOSE VALUE •NO BANK GUARANTEE
Neither the Fund nor Fidelity Distributors Corporation is a bank.
Top Holdings (% of Fund's net assets) |
| |
| Microsoft Corp. | 7.9 | |
| General Electric Co. | 6.4 | |
| Exxon Mobil Corp. | 5.9 | |
| Wells Fargo & Co. | 5.9 | |
| Apple, Inc. | 3.0 | |
| The Boeing Co. | 2.8 | |
| Bank of America Corp. | 2.7 | |
| Meta Platforms, Inc. Class A | 2.1 | |
| Visa, Inc. Class A | 2.0 | |
| UnitedHealth Group, Inc. | 1.9 | |
| | 40.6 | |
| |
| Market Sectors (% of Fund's net assets) |
| |
| Information Technology | 18.9 | |
| Financials | 17.7 | |
| Industrials | 15.8 | |
| Health Care | 11.9 | |
| Communication Services | 10.0 | |
| Energy | 9.7 | |
| Consumer Staples | 5.3 | |
| Consumer Discretionary | 3.7 | |
| Materials | 2.1 | |
| Real Estate | 1.1 | |
| Utilities | 1.0 | |
| |
Asset Allocation (% of Fund's net assets) |
|
|
Showing Percentage of Net Assets
| Common Stocks - 97.0% |
| | | Shares | Value ($) |
| COMMUNICATION SERVICES - 10.0% | | | |
| Diversified Telecommunication Services - 0.3% | | | |
| Cellnex Telecom SA (a) | | 653,100 | 25,714,505 |
| Verizon Communications, Inc. | | 710,633 | 26,790,864 |
| | | | 52,505,369 |
| Entertainment - 0.9% | | | |
| The Walt Disney Co. | | 731,793 | 66,073,590 |
| Universal Music Group NV | | 2,865,781 | 81,809,827 |
| | | | 147,883,417 |
| Interactive Media & Services - 6.4% | | | |
| Alphabet, Inc.: | | | |
| Class A (b) | | 2,121,625 | 296,369,796 |
| Class C (b) | | 1,962,460 | 276,569,488 |
| Match Group, Inc. (b) | | 1,184,700 | 43,241,550 |
| Meta Platforms, Inc. Class A (b) | | 963,600 | 341,075,856 |
| Snap, Inc. Class A (b) | | 4,095,398 | 69,335,088 |
| | | | 1,026,591,778 |
| Media - 2.4% | | | |
| Charter Communications, Inc. Class A (b) | | 29,300 | 11,388,324 |
| Comcast Corp. Class A | | 6,937,042 | 304,189,292 |
| Interpublic Group of Companies, Inc. | | 1,866,870 | 60,934,637 |
| | | | 376,512,253 |
TOTAL COMMUNICATION SERVICES | | | 1,603,492,817 |
| CONSUMER DISCRETIONARY - 3.7% | | | |
| Automobile Components - 0.1% | | | |
| BorgWarner, Inc. | | 533,462 | 19,124,613 |
| Automobiles - 0.1% | | | |
| General Motors Co. | | 297,400 | 10,682,608 |
| Broadline Retail - 0.1% | | | |
| Amazon.com, Inc. (b) | | 140,900 | 21,408,346 |
| Hotels, Restaurants & Leisure - 2.0% | | | |
| Amadeus IT Holding SA Class A | | 371,500 | 26,608,418 |
| Booking Holdings, Inc. (b) | | 52,437 | 186,005,575 |
| Expedia, Inc. (b) | | 233,500 | 35,442,965 |
| Marriott International, Inc. Class A | | 234,900 | 52,972,299 |
| Starbucks Corp. | | 212,500 | 20,402,125 |
| | | | 321,431,382 |
| Household Durables - 0.4% | | | |
| Mohawk Industries, Inc. (b) | | 314,489 | 32,549,612 |
| Sony Group Corp. sponsored ADR | | 172,000 | 16,286,680 |
| Whirlpool Corp. | | 67,663 | 8,239,324 |
| | | | 57,075,616 |
| Specialty Retail - 0.9% | | | |
| Lowe's Companies, Inc. | | 616,107 | 137,114,613 |
| RH (b) | | 37,900 | 11,047,092 |
| | | | 148,161,705 |
| Textiles, Apparel & Luxury Goods - 0.1% | | | |
| Compagnie Financiere Richemont SA Series A | | 36,540 | 5,047,055 |
| NIKE, Inc. Class B | | 163,300 | 17,729,481 |
| | | | 22,776,536 |
TOTAL CONSUMER DISCRETIONARY | | | 600,660,806 |
| CONSUMER STAPLES - 5.3% | | | |
| Beverages - 1.6% | | | |
| Diageo PLC sponsored ADR | | 372,200 | 54,214,652 |
| Keurig Dr. Pepper, Inc. | | 2,089,600 | 69,625,472 |
| The Coca-Cola Co. | | 2,204,695 | 129,922,676 |
| | | | 253,762,800 |
| Consumer Staples Distribution & Retail - 1.6% | | | |
| Performance Food Group Co. (b) | | 527,100 | 36,448,965 |
| Sysco Corp. | | 1,118,300 | 81,781,279 |
| Target Corp. | | 368,800 | 52,524,496 |
| U.S. Foods Holding Corp. (b) | | 595,600 | 27,046,196 |
| Walmart, Inc. | | 353,400 | 55,713,510 |
| | | | 253,514,446 |
| Household Products - 0.0% | | | |
| Procter & Gamble Co. | | 19,800 | 2,901,492 |
| Personal Care Products - 1.5% | | | |
| Estee Lauder Companies, Inc. Class A | | 294,800 | 43,114,500 |
| Haleon PLC ADR | | 11,135,436 | 91,644,638 |
| Kenvue, Inc. | | 5,085,211 | 109,484,593 |
| | | | 244,243,731 |
| Tobacco - 0.6% | | | |
| Altria Group, Inc. | | 2,263,259 | 91,299,868 |
| Philip Morris International, Inc. | | 146,900 | 13,820,352 |
| | | | 105,120,220 |
TOTAL CONSUMER STAPLES | | | 859,542,689 |
| ENERGY - 9.7% | | | |
| Energy Equipment & Services - 0.1% | | | |
| Tidewater, Inc. (b) | | 186,100 | 13,419,671 |
| Oil, Gas & Consumable Fuels - 9.6% | | | |
| Exxon Mobil Corp. | | 9,489,143 | 948,724,517 |
| Hess Corp. | | 1,612,872 | 232,511,628 |
| Imperial Oil Ltd. | | 2,370,100 | 135,010,111 |
| Kosmos Energy Ltd. (b) | | 11,626,455 | 78,013,513 |
| MEG Energy Corp. (b) | | 2,723,600 | 48,652,966 |
| Shell PLC ADR | | 1,462,600 | 96,239,080 |
| | | | 1,539,151,815 |
TOTAL ENERGY | | | 1,552,571,486 |
| FINANCIALS - 17.7% | | | |
| Banks - 12.2% | | | |
| Bank of America Corp. | | 12,879,294 | 433,645,829 |
| JPMorgan Chase & Co. | | 1,132,171 | 192,582,287 |
| M&T Bank Corp. | | 267,220 | 36,630,518 |
| PNC Financial Services Group, Inc. | | 1,123,721 | 174,008,197 |
| Truist Financial Corp. | | 1,392,623 | 51,415,641 |
| U.S. Bancorp | | 2,989,419 | 129,382,054 |
| Wells Fargo & Co. | | 19,021,137 | 936,220,363 |
| | | | 1,953,884,889 |
| Capital Markets - 2.1% | | | |
| Charles Schwab Corp. | | 158,800 | 10,925,440 |
| CME Group, Inc. | | 19,900 | 4,190,940 |
| KKR & Co. LP | | 1,500,451 | 124,312,365 |
| Moody's Corp. | | 17,600 | 6,873,856 |
| Morgan Stanley | | 455,924 | 42,514,913 |
| Northern Trust Corp. | | 1,479,046 | 124,801,901 |
| Raymond James Financial, Inc. | | 185,303 | 20,661,285 |
| State Street Corp. | | 86,141 | 6,672,482 |
| | | | 340,953,182 |
| Financial Services - 3.2% | | | |
| Edenred SA | | 925,000 | 55,285,264 |
| Fidelity National Information Services, Inc. | | 563,100 | 33,825,417 |
| Global Payments, Inc. | | 120,200 | 15,265,400 |
| MasterCard, Inc. Class A | | 152,889 | 65,208,687 |
| PayPal Holdings, Inc. (b) | | 373,900 | 22,961,199 |
| Visa, Inc. Class A | | 1,209,893 | 314,995,643 |
| | | | 507,541,610 |
| Insurance - 0.2% | | | |
| Arthur J. Gallagher & Co. | | 14,200 | 3,193,296 |
| Chubb Ltd. | | 140,597 | 31,774,922 |
| | | | 34,968,218 |
TOTAL FINANCIALS | | | 2,837,347,899 |
| HEALTH CARE - 11.9% | | | |
| Biotechnology - 0.6% | | | |
| Alnylam Pharmaceuticals, Inc. (b) | | 169,950 | 32,530,130 |
| Argenx SE ADR (b) | | 24,200 | 9,206,406 |
| Insmed, Inc. (b) | | 691,829 | 21,439,781 |
| Vaxcyte, Inc. (b) | | 407,400 | 25,584,720 |
| Verve Therapeutics, Inc. (b)(c) | | 243,400 | 3,392,996 |
| | | | 92,154,033 |
| Health Care Equipment & Supplies - 1.9% | | | |
| Abbott Laboratories | | 99,100 | 10,907,937 |
| Becton, Dickinson & Co. | | 144,706 | 35,283,664 |
| Boston Scientific Corp. (b) | | 3,813,319 | 220,447,971 |
| GE Healthcare Holding LLC | | 202,365 | 15,646,862 |
| Koninklijke Philips Electronics NV (depository receipt) (NY Reg.) (c) | | 772,502 | 18,022,472 |
| | | | 300,308,906 |
| Health Care Providers & Services - 5.5% | | | |
| Cardinal Health, Inc. | | 925,558 | 93,296,246 |
| Centene Corp. (b) | | 111,200 | 8,252,152 |
| Cigna Group | | 664,711 | 199,047,709 |
| CVS Health Corp. | | 1,127,252 | 89,007,818 |
| Guardant Health, Inc. (b) | | 390,000 | 10,549,500 |
| Humana, Inc. | | 52,000 | 23,806,120 |
| McKesson Corp. | | 330,321 | 152,932,017 |
| UnitedHealth Group, Inc. | | 584,881 | 307,922,300 |
| | | | 884,813,862 |
| Life Sciences Tools & Services - 0.4% | | | |
| Danaher Corp. | | 276,400 | 63,942,376 |
| Thermo Fisher Scientific, Inc. | | 13,200 | 7,006,428 |
| | | | 70,948,804 |
| Pharmaceuticals - 3.5% | | | |
| Bristol-Myers Squibb Co. | | 3,486,060 | 178,869,739 |
| Eli Lilly & Co. | | 208,900 | 121,771,988 |
| GSK PLC sponsored ADR | | 2,840,028 | 105,251,438 |
| Johnson & Johnson | | 709,777 | 111,250,447 |
| Sanofi SA sponsored ADR | | 176,400 | 8,772,372 |
| UCB SA | | 384,000 | 33,447,035 |
| | | | 559,363,019 |
TOTAL HEALTH CARE | | | 1,907,588,624 |
| INDUSTRIALS - 15.6% | | | |
| Aerospace & Defense - 4.2% | | | |
| Airbus Group NV | | 711,500 | 109,918,489 |
| General Dynamics Corp. | | 178,160 | 46,262,807 |
| Huntington Ingalls Industries, Inc. | | 117,750 | 30,572,610 |
| Safran SA | | 121,500 | 21,421,715 |
| Textron, Inc. | | 145,700 | 11,717,194 |
| The Boeing Co. (b) | | 1,723,796 | 449,324,665 |
| | | | 669,217,480 |
| Air Freight & Logistics - 1.5% | | | |
| FedEx Corp. | | 317,747 | 80,380,459 |
| United Parcel Service, Inc. Class B | | 1,057,456 | 166,263,807 |
| | | | 246,644,266 |
| Building Products - 0.1% | | | |
| Johnson Controls International PLC | | 201,700 | 11,625,988 |
| Commercial Services & Supplies - 0.2% | | | |
| ACV Auctions, Inc. Class A (b) | | 1,176,300 | 17,820,945 |
| Veralto Corp. | | 101,866 | 8,379,497 |
| | | | 26,200,442 |
| Electrical Equipment - 1.5% | | | |
| Acuity Brands, Inc. | | 224,069 | 45,896,053 |
| Hubbell, Inc. Class B | | 157,614 | 51,843,973 |
| Regal Rexnord Corp. | | 274,800 | 40,675,896 |
| Vertiv Holdings Co. | | 2,243,500 | 107,755,305 |
| | | | 246,171,227 |
| Ground Transportation - 0.4% | | | |
| Knight-Swift Transportation Holdings, Inc. Class A | | 1,077,015 | 62,089,915 |
| Industrial Conglomerates - 6.5% | | | |
| 3M Co. | | 147,273 | 16,099,884 |
| General Electric Co. | | 8,003,106 | 1,021,436,419 |
| | | | 1,037,536,303 |
| Machinery - 0.8% | | | |
| Chart Industries, Inc. (b)(c) | | 163,000 | 22,221,790 |
| Cummins, Inc. | | 91,900 | 22,016,483 |
| Fortive Corp. | | 420,200 | 30,939,326 |
| Nordson Corp. | | 26,500 | 7,000,240 |
| Otis Worldwide Corp. | | 238,884 | 21,372,951 |
| Stanley Black & Decker, Inc. | | 145,300 | 14,253,930 |
| Westinghouse Air Brake Tech Co. | | 116,285 | 14,756,567 |
| | | | 132,561,287 |
| Passenger Airlines - 0.1% | | | |
| Copa Holdings SA Class A | | 48,500 | 5,156,035 |
| Ryanair Holdings PLC sponsored ADR (b) | | 113,400 | 15,123,024 |
| | | | 20,279,059 |
| Professional Services - 0.3% | | | |
| Equifax, Inc. | | 52,400 | 12,957,996 |
| Genpact Ltd. | | 554,700 | 19,253,637 |
| Paycom Software, Inc. | | 42,000 | 8,682,240 |
| | | | 40,893,873 |
| Trading Companies & Distributors - 0.0% | | | |
| Beijer Ref AB (B Shares) | | 563,299 | 7,534,073 |
TOTAL INDUSTRIALS | | | 2,500,753,913 |
| INFORMATION TECHNOLOGY - 18.9% | | | |
| IT Services - 0.4% | | | |
| EPAM Systems, Inc. (b) | | 37,000 | 11,001,580 |
| IBM Corp. | | 140,100 | 22,913,355 |
| Snowflake, Inc. (b) | | 7,500 | 1,492,500 |
| Twilio, Inc. Class A (b) | | 321,900 | 24,422,553 |
| | | | 59,829,988 |
| Semiconductors & Semiconductor Equipment - 4.2% | | | |
| Analog Devices, Inc. | | 162,738 | 32,313,257 |
| Applied Materials, Inc. | | 368,402 | 59,706,912 |
| Broadcom, Inc. | | 53,800 | 60,054,250 |
| Lam Research Corp. | | 70,200 | 54,984,852 |
| Marvell Technology, Inc. | | 1,997,385 | 120,462,289 |
| NVIDIA Corp. | | 477,500 | 236,467,550 |
| Qualcomm, Inc. | | 415,131 | 60,040,397 |
| Taiwan Semiconductor Manufacturing Co. Ltd. sponsored ADR | | 440,000 | 45,760,000 |
| | | | 669,789,507 |
| Software - 11.2% | | | |
| Adobe, Inc. (b) | | 253,300 | 151,118,780 |
| Autodesk, Inc. (b) | | 180,728 | 44,003,653 |
| DoubleVerify Holdings, Inc. (b) | | 224,600 | 8,260,788 |
| Elastic NV (b) | | 385,700 | 43,468,390 |
| Intuit, Inc. | | 98,500 | 61,565,455 |
| Microsoft Corp. | | 3,378,905 | 1,270,603,436 |
| Oracle Corp. | | 92,300 | 9,731,189 |
| PTC, Inc. (b) | | 132,800 | 23,234,688 |
| Sage Group PLC | | 652,900 | 9,757,768 |
| Salesforce, Inc. (b) | | 91,500 | 24,077,310 |
| SAP SE sponsored ADR (c) | | 919,746 | 142,183,534 |
| Workday, Inc. Class A (b) | | 42,900 | 11,842,974 |
| | | | 1,799,847,965 |
| Technology Hardware, Storage & Peripherals - 3.1% | | | |
| Apple, Inc. | | 2,533,614 | 487,796,703 |
| Samsung Electronics Co. Ltd. | | 271,740 | 16,474,051 |
| | | | 504,270,754 |
TOTAL INFORMATION TECHNOLOGY | | | 3,033,738,214 |
| MATERIALS - 2.1% | | | |
| Chemicals - 0.4% | | | |
| Air Products & Chemicals, Inc. | | 5,900 | 1,615,420 |
| DuPont de Nemours, Inc. | | 766,300 | 58,951,459 |
| Sherwin-Williams Co. | | 29,100 | 9,076,290 |
| | | | 69,643,169 |
| Metals & Mining - 1.7% | | | |
| First Quantum Minerals Ltd. | | 8,751,500 | 71,660,522 |
| Freeport-McMoRan, Inc. | | 3,844,442 | 163,657,896 |
| Ivanhoe Mines Ltd. (b) | | 3,085,000 | 29,917,550 |
| | | | 265,235,968 |
TOTAL MATERIALS | | | 334,879,137 |
| REAL ESTATE - 1.1% | | | |
| Equity Real Estate Investment Trusts (REITs) - 1.1% | | | |
| American Tower Corp. | | 208,581 | 45,028,466 |
| Crown Castle International Corp. | | 508,200 | 58,539,558 |
| Equinix, Inc. | | 4,422 | 3,561,435 |
| Simon Property Group, Inc. | | 501,300 | 71,505,432 |
| | | | 178,634,891 |
| UTILITIES - 1.0% | | | |
| Electric Utilities - 1.0% | | | |
| Duke Energy Corp. | | 32,900 | 3,192,616 |
| Entergy Corp. | | 110,700 | 11,201,733 |
| PG&E Corp. | | 796,500 | 14,360,895 |
| Southern Co. | | 1,779,000 | 124,743,480 |
| | | | 153,498,724 |
| Multi-Utilities - 0.0% | | | |
| Sempra | | 68,760 | 5,138,435 |
TOTAL UTILITIES | | | 158,637,159 |
| TOTAL COMMON STOCKS (Cost $9,104,837,577) | | | 15,567,847,635 |
| | | | |
| Preferred Stocks - 0.2% |
| | | Shares | Value ($) |
| Convertible Preferred Stocks - 0.0% | | | |
| COMMUNICATION SERVICES - 0.0% | | | |
| Interactive Media & Services - 0.0% | | | |
| Reddit, Inc. Series E (b)(d)(e) | | 17,600 | 586,784 |
| | | | |
| Nonconvertible Preferred Stocks - 0.2% | | | |
| INDUSTRIALS - 0.2% | | | |
| Aerospace & Defense - 0.2% | | | |
| Embraer SA sponsored ADR (b) | | 1,664,100 | 30,702,645 |
| | | | |
| TOTAL PREFERRED STOCKS (Cost $19,071,382) | | | 31,289,429 |
| | | | |
| Money Market Funds - 3.7% |
| | | Shares | Value ($) |
| Fidelity Cash Central Fund 5.40% (f) | | 523,022,576 | 523,127,180 |
| Fidelity Securities Lending Cash Central Fund 5.40% (f)(g) | | 65,612,324 | 65,618,886 |
| TOTAL MONEY MARKET FUNDS (Cost $588,746,066) | | | 588,746,066 |
| | | | |
| TOTAL INVESTMENT IN SECURITIES - 100.9% (Cost $9,712,655,025) | 16,187,883,130 |
NET OTHER ASSETS (LIABILITIES) - (0.9)% | (141,330,472) |
| NET ASSETS - 100.0% | 16,046,552,658 |
| | |
Legend
| (a) | Security exempt from registration under Rule 144A of the Securities Act of 1933. These securities may be resold in transactions exempt from registration, normally to qualified institutional buyers. At the end of the period, the value of these securities amounted to $25,714,505 or 0.2% of net assets. |
| (c) | Security or a portion of the security is on loan at period end. |
| (d) | Restricted securities (including private placements) - Investment in securities not registered under the Securities Act of 1933 (excluding 144A issues). At the end of the period, the value of restricted securities (excluding 144A issues) amounted to $586,784 or 0.0% of net assets. |
| (f) | Affiliated fund that is generally available only to investment companies and other accounts managed by Fidelity Investments. The rate quoted is the annualized seven-day yield of the fund at period end. A complete unaudited listing of the fund's holdings as of its most recent quarter end is available upon request. In addition, each Fidelity Central Fund's financial statements are available on the SEC's website or upon request. |
| (g) | Investment made with cash collateral received from securities on loan. |
| Additional information on each restricted holding is as follows: |
| Security | Acquisition Date | Acquisition Cost ($) |
| Reddit, Inc. Series E | 5/18/21 | 747,546 |
| | | |
Affiliated Central Funds
Fiscal year to date information regarding the Fund's investments in Fidelity Central Funds, including the ownership percentage, is presented below.
| Affiliate | Value, beginning of period ($) | Purchases ($) | Sales Proceeds ($) | Dividend Income ($) | Realized Gain (loss) ($) | Change in Unrealized appreciation (depreciation) ($) | Value, end of period ($) | % ownership, end of period |
| Fidelity Cash Central Fund 5.40% | 456,325,379 | 1,130,357,471 | 1,063,555,670 | 6,712,771 | - | - | 523,127,180 | 1.1% |
| Fidelity Securities Lending Cash Central Fund 5.40% | 59,612,304 | 462,529,181 | 456,522,599 | 775,314 | - | - | 65,618,886 | 0.2% |
| Total | 515,937,683 | 1,592,886,652 | 1,520,078,269 | 7,488,085 | - | - | 588,746,066 | |
| | | | | | | | | |
Amounts in the dividend income column in the above table include any capital gain distributions from underlying funds, which are presented in the corresponding line item in the Statement of Operations, if applicable.
Amounts in the dividend income column for Fidelity Securities Lending Cash Central Fund represents the income earned on investing cash collateral, less rebates paid to borrowers and any lending agent fees associated with the loan, plus any premium payments received for lending certain types of securities.
Amounts included in the purchases and sales proceeds columns may include in-kind transactions, if applicable.
Investment Valuation
The following is a summary of the inputs used, as of December 31, 2023, involving the Fund's assets and liabilities carried at fair value. The inputs or methodology used for valuing securities may not be an indication of the risk associated with investing in those securities. For more information on valuation inputs, and their aggregation into the levels used below, please refer to the Investment Valuation section in the accompanying Notes to Financial Statements.
| Valuation Inputs at Reporting Date: |
| Description | Total ($) | Level 1 ($) | Level 2 ($) | Level 3 ($) |
Investments in Securities: | | | | |
|
| Equities: | | | | |
Communication Services | 1,604,079,601 | 1,495,968,485 | 107,524,332 | 586,784 |
Consumer Discretionary | 600,660,806 | 595,613,751 | 5,047,055 | - |
Consumer Staples | 859,542,689 | 859,542,689 | - | - |
Energy | 1,552,571,486 | 1,552,571,486 | - | - |
Financials | 2,837,347,899 | 2,837,347,899 | - | - |
Health Care | 1,907,588,624 | 1,907,588,624 | - | - |
Industrials | 2,531,456,558 | 2,400,116,354 | 131,340,204 | - |
Information Technology | 3,033,738,214 | 3,033,738,214 | - | - |
Materials | 334,879,137 | 334,879,137 | - | - |
Real Estate | 178,634,891 | 178,634,891 | - | - |
Utilities | 158,637,159 | 158,637,159 | - | - |
|
| Money Market Funds | 588,746,066 | 588,746,066 | - | - |
| Total Investments in Securities: | 16,187,883,130 | 15,943,384,755 | 243,911,591 | 586,784 |
| Statement of Assets and Liabilities |
| | | | December 31, 2023 (Unaudited) |
| | | | | |
| Assets | | | | |
| Investment in securities, at value (including securities loaned of $64,052,440) - See accompanying schedule: | | | | |
Unaffiliated issuers (cost $9,123,908,959) | $ | 15,599,137,064 | | |
Fidelity Central Funds (cost $588,746,066) | | 588,746,066 | | |
| | | | | |
| | | | | |
| Total Investment in Securities (cost $9,712,655,025) | | | $ | 16,187,883,130 |
| Foreign currency held at value (cost $130) | | | | 132 |
| Receivable for investments sold | | | | 14,464,961 |
| Receivable for fund shares sold | | | | 2,731,050 |
| Dividends receivable | | | | 14,549,079 |
| Distributions receivable from Fidelity Central Funds | | | | 1,993,071 |
| Other receivables | | | | 28,404 |
Total assets | | | | 16,221,649,827 |
| Liabilities | | | | |
| Payable for investments purchased | $ | 2,457,030 | | |
| Payable for fund shares redeemed | | 106,904,244 | | |
| Other payables and accrued expenses | | 133,820 | | |
| Collateral on securities loaned | | 65,602,075 | | |
| Total Liabilities | | | | 175,097,169 |
| Net Assets | | | $ | 16,046,552,658 |
| Net Assets consist of: | | | | |
| Paid in capital | | | $ | 9,476,933,283 |
| Total accumulated earnings (loss) | | | | 6,569,619,375 |
| Net Assets | | | $ | 16,046,552,658 |
Net Asset Value, offering price and redemption price per share ($16,046,552,658 ÷ 821,289,917 shares) | | | $ | 19.54 |
| Statement of Operations |
| | | | Six months ended December 31, 2023 (Unaudited) |
| Investment Income | | | | |
| Dividends | | | $ | 127,437,608 |
| Income from Fidelity Central Funds (including $775,314 from security lending) | | | | 7,488,085 |
| Total Income | | | | 134,925,693 |
| Expenses | | | | |
| Custodian fees and expenses | $ | 95,921 | | |
| Independent trustees' fees and expenses | | 42,955 | | |
| Total expenses before reductions | | 138,876 | | |
| Expense reductions | | (4,431) | | |
| Total expenses after reductions | | | | 134,445 |
| Net Investment income (loss) | | | | 134,791,248 |
| Realized and Unrealized Gain (Loss) | | | | |
| Net realized gain (loss) on: | | | | |
| Investment Securities: | | | | |
| Unaffiliated issuers | | 497,511,915 | | |
| Foreign currency transactions | | 34,468 | | |
| Total net realized gain (loss) | | | | 497,546,383 |
| Change in net unrealized appreciation (depreciation) on: | | | | |
| Investment Securities: | | | | |
| Unaffiliated issuers | | 732,079,831 | | |
| Assets and liabilities in foreign currencies | | 44,607 | | |
| Total change in net unrealized appreciation (depreciation) | | | | 732,124,438 |
| Net gain (loss) | | | | 1,229,670,821 |
| Net increase (decrease) in net assets resulting from operations | | | $ | 1,364,462,069 |
| Statement of Changes in Net Assets |
| |
| | Six months ended December 31, 2023 (Unaudited) | | Year ended June 30, 2023 |
| Increase (Decrease) in Net Assets | | | | |
| Operations | | | | |
| Net investment income (loss) | $ | 134,791,248 | $ | 279,231,241 |
| Net realized gain (loss) | | 497,546,383 | | 209,032,620 |
| Change in net unrealized appreciation (depreciation) | | 732,124,438 | | 2,461,954,725 |
| Net increase (decrease) in net assets resulting from operations | | 1,364,462,069 | | 2,950,218,586 |
| Distributions to shareholders | | (821,641,569) | | (859,194,238) |
| | | | | |
| Share transactions | | | | |
| Proceeds from sales of shares | | 852,428,045 | | 2,951,775,908 |
| Reinvestment of distributions | | 821,641,569 | | 859,194,238 |
| Cost of shares redeemed | | (1,317,680,992) | | (3,553,138,409) |
| | | | | |
Net increase (decrease) in net assets resulting from share transactions | | 356,388,622 | | 257,831,737 |
| Total increase (decrease) in net assets | | 899,209,122 | | 2,348,856,085 |
| | | | | |
| Net Assets | | | | |
| Beginning of period | | 15,147,343,536 | | 12,798,487,451 |
| End of period | $ | 16,046,552,658 | $ | 15,147,343,536 |
| | | | | |
| Other Information | | | | |
| Shares | | | | |
| Sold | | 45,548,493 | | 174,605,044 |
| Issued in reinvestment of distributions | | 43,534,511 | | 51,636,302 |
| Redeemed | | (69,141,680) | | (206,693,495) |
| Net increase (decrease) | | 19,941,324 | | 19,547,851 |
| | | | | |
Financial Highlights
| Fidelity® Series Large Cap Stock Fund |
| |
| | Six months ended (Unaudited) December 31, 2023 | | Years ended June 30, 2023 | | 2022 | | 2021 | | 2020 | | 2019 |
Selected Per-Share Data | | | | | | | | | | | | |
| Net asset value, beginning of period | $ | 18.90 | $ | 16.37 | $ | 19.80 | $ | 14.07 | $ | 14.98 | $ | 15.76 |
| Income from Investment Operations | | | | | | | | | | | | |
Net investment income (loss) A,B | | .17 | | .34 | | .34 | | .34 | | .37 | | .42 |
| Net realized and unrealized gain (loss) | | 1.50 | | 3.27 | | (2.02) | | 6.27 | | (.32) | | .42 |
| Total from investment operations | | 1.67 | | 3.61 | | (1.68) | | 6.61 | | .05 | | .84 |
| Distributions from net investment income | | (.36) | | (.33) | | (.47) | | (.37) | | (.28) | | (.39) |
| Distributions from net realized gain | | (.68) | | (.76) | | (1.28) | | (.52) | | (.68) | | (1.22) |
| Total distributions | | (1.03) C | | (1.08) C | | (1.75) | | (.88) C | | (.96) | | (1.62) C |
| Net asset value, end of period | $ | 19.54 | $ | 18.90 | $ | 16.37 | $ | 19.80 | $ | 14.07 | $ | 14.98 |
Total Return D,E | | 9.12% | | 23.03% | | (9.44)% | | 49.05% | | .17% | | 5.83% |
Ratios to Average Net Assets B,F,G | | | | | | | | | | | | |
Expenses before reductions H | | -% I | | -% | | -% | | -% | | -% | | -% |
Expenses net of fee waivers, if any H | | -% I | | -% | | -% | | -% | | -% | | -% |
Expenses net of all reductions H | | -% I | | -% | | -% | | -% | | -% | | -% |
| Net investment income (loss) | | 1.79% I | | 1.98% | | 1.84% | | 2.04% | | 2.58% | | 2.80% |
| Supplemental Data | | | | | | | | | | | | |
| Net assets, end of period (000 omitted) | $ | 16,046,553 | $ | 15,147,344 | $ | 12,798,487 | $ | 14,792,790 | $ | 11,937,391 | $ | 14,114,096 |
Portfolio turnover rate J | | 13% I | | 12% | | 17% | | 15% | | 28% K | | 41% L |
ACalculated based on average shares outstanding during the period.
BNet investment income (loss) is affected by the timing of the declaration of dividends by any underlying mutual funds or exchange-traded funds (ETFs). Net investment income (loss) of any mutual funds or ETFs is not included in the Fund's net investment income (loss) ratio.
CTotal distributions per share do not sum due to rounding.
DTotal returns for periods of less than one year are not annualized.
ETotal returns would have been lower if certain expenses had not been reduced during the applicable periods shown.
FFees and expenses of any underlying mutual funds or exchange-traded funds (ETFs) are not included in the Fund's expense ratio. The Fund indirectly bears its proportionate share of these expenses. For additional expense information related to investments in Fidelity Central Funds, please refer to the "Investments in Fidelity Central Funds" note found in the Notes to Financial Statements section of the most recent Annual or Semi-Annual report.
GExpense ratios reflect operating expenses of the class. Expenses before reductions do not reflect amounts reimbursed, waived, or reduced through arrangements with the investment adviser, brokerage services, or other offset arrangements, if applicable, and do not represent the amount paid by the class during periods when reimbursements, waivers or reductions occur.
HAmount represents less than .005%.
IAnnualized.
JAmount does not include the portfolio activity of any underlying mutual funds or exchange-traded funds (ETFs).
KPortfolio turnover rate excludes securities received or delivered in-kind.
LThe portfolio turnover rate does not include the assets acquired in the merger.
For the period ended December 31, 2023
1. Organization.
Fidelity Series Large Cap Stock Fund (the Fund) is a fund of Fidelity Hastings Street Trust (the Trust) and is authorized to issue an unlimited number of shares. Shares are offered only to certain other Fidelity funds, Fidelity managed 529 plans, and Fidelity managed collective investment trusts. The Trust is registered under the Investment Company Act of 1940, as amended (the 1940 Act), as an open-end management investment company organized as a Massachusetts business trust.
2. Investments in Fidelity Central Funds.
Funds may invest in Fidelity Central Funds, which are open-end investment companies generally available only to other investment companies and accounts managed by the investment adviser and its affiliates. The Schedule of Investments lists any Fidelity Central Funds held as an investment as of period end, but does not include the underlying holdings of each Fidelity Central Fund. An investing fund indirectly bears its proportionate share of the expenses of the underlying Fidelity Central Funds.
Based on its investment objective, each Fidelity Central Fund may invest or participate in various investment vehicles or strategies that are similar to those of the investing fund. These strategies are consistent with the investment objectives of the investing fund and may involve certain economic risks which may cause a decline in value of each of the Fidelity Central Funds and thus a decline in the value of the investing fund.
| Fidelity Central Fund | Investment Manager | Investment Objective | Investment Practices | Expense RatioA |
| Fidelity Money Market Central Funds | Fidelity Management & Research Company LLC (FMR) | Each fund seeks to obtain a high level of current income consistent with the preservation of capital and liquidity. | Short-term Investments | Less than .005% |
A Expenses expressed as a percentage of average net assets and are as of each underlying Central Fund's most recent annual or semi-annual shareholder report.
A complete unaudited list of holdings for each Fidelity Central Fund is available upon request or at the Securities and Exchange Commission website at www.sec.gov. In addition, the financial statements of the Fidelity Central Funds which contain the significant accounting policies (including investment valuation policies) of those funds, and are not covered by the Report of Independent Registered Public Accounting Firm, are available on the Securities and Exchange Commission website or upon request.
3. Significant Accounting Policies.
The Fund is an investment company and applies the accounting and reporting guidance of the Financial Accounting Standards Board (FASB) Accounting Standards Codification Topic 946 Financial Services - Investment Companies. The financial statements have been prepared in conformity with accounting principles generally accepted in the United States of America (GAAP), which require management to make certain estimates and assumptions at the date of the financial statements. Actual results could differ from those estimates. Subsequent events, if any, through the date that the financial statements were issued have been evaluated in the preparation of the financial statements. The Fund's Schedule of Investments lists any underlying mutual funds or exchange-traded funds (ETFs) but does not include the underlying holdings of these funds. The following summarizes the significant accounting policies of the Fund:
Investment Valuation. Investments are valued as of 4:00 p.m. Eastern time on the last calendar day of the period. The Board of Trustees (the Board) has designated the Fund's investment adviser as the valuation designee responsible for the fair valuation function and performing fair value determinations as needed. The investment adviser has established a Fair Value Committee (the Committee) to carry out the day-to-day fair valuation responsibilities and has adopted policies and procedures to govern the fair valuation process and the activities of the Committee. In accordance with these fair valuation policies and procedures, which have been approved by the Board, the Fund attempts to obtain prices from one or more third party pricing services or brokers to value its investments. When current market prices, quotations or currency exchange rates are not readily available or reliable, investments will be fair valued in good faith by the Committee, in accordance with the policies and procedures. Factors used in determining fair value vary by investment type and may include market or investment specific events, transaction data, estimated cash flows, and market observations of comparable investments. The frequency that the fair valuation procedures are used cannot be predicted and they may be utilized to a significant extent. The Committee manages the Fund's fair valuation practices and maintains the fair valuation policies and procedures. The Fund's investment adviser reports to the Board information regarding the fair valuation process and related material matters.
The Fund categorizes the inputs to valuation techniques used to value its investments into a disclosure hierarchy consisting of three levels as shown below:
Level 1 - unadjusted quoted prices in active markets for identical investments
Level 2 - other significant observable inputs (including quoted prices for similar investments, interest rates, prepayment speeds, etc.)
Level 3 - unobservable inputs (including the Fund's own assumptions based on the best information available)
Valuation techniques used to value the Fund's investments by major category are as follows:
Equity securities, including restricted securities, for which market quotations are readily available, are valued at the last reported sale price or official closing price as reported by a third party pricing service on the primary market or exchange on which they are traded and are categorized as Level 1 in the hierarchy. In the event there were no sales during the day or closing prices are not available, securities are valued at the last quoted bid price or may be valued using the last available price and are generally categorized as Level 2 in the hierarchy. For foreign equity securities, when market or security specific events arise, comparisons to the valuation of American Depositary Receipts (ADRs), futures contracts, ETFs and certain indexes as well as quoted prices for similar securities may be used and would be categorized as Level 2 in the hierarchy. For equity securities, including restricted securities, where observable inputs are limited, assumptions about market activity and risk are used and these securities may be categorized as Level 3 in the hierarchy.
Investments in open-end mutual funds, including the Fidelity Central Funds, are valued at their closing net asset value (NAV) each business day and are categorized as Level 1 in the hierarchy.
Changes in valuation techniques may result in transfers in or out of an assigned level within the disclosure hierarchy. The aggregate value of investments by input level as of December 31, 2023 is included at the end of the Fund's Schedule of Investments.
Foreign Currency. Certain Funds may use foreign currency contracts to facilitate transactions in foreign-denominated securities. Gains and losses from these transactions may arise from changes in the value of the foreign currency or if the counterparties do not perform under the contracts' terms.
Foreign-denominated assets, including investment securities, and liabilities are translated into U.S. dollars at the exchange rates at period end. Purchases and sales of investment securities, income and dividends received, and expenses denominated in foreign currencies are translated into U.S. dollars at the exchange rate in effect on the transaction date.
The effects of exchange rate fluctuations on investments are included with the net realized and unrealized gain (loss) on investment securities. Other foreign currency transactions resulting in realized and unrealized gain (loss) are disclosed separately.
Investment Transactions and Income. For financial reporting purposes, the Fund's investment holdings and NAV include trades executed through the end of the last business day of the period. The NAV per share for processing shareholder transactions is calculated as of the close of business of the New York Stock Exchange (NYSE), normally 4:00 p.m. Eastern time and includes trades executed through the end of the prior business day. Gains and losses on securities sold are determined on the basis of identified cost and include proceeds received from litigation. Commissions paid to certain brokers with whom the investment adviser, or its affiliates, places trades on behalf of a fund include an amount in addition to trade execution, which may be rebated back to a fund. Any such rebates are included in net realized gain (loss) on investments in the Statement of Operations. Dividend income is recorded on the ex-dividend date, except for certain dividends from foreign securities where the ex-dividend date may have passed, which are recorded as soon as the Fund is informed of the ex-dividend date. Non-cash dividends included in dividend income, if any, are recorded at the fair market value of the securities received. Income and capital gain distributions from Fidelity Central Funds, if any, are recorded on the ex-dividend date. Certain distributions received by the Fund represent a return of capital or capital gain. The Fund determines the components of these distributions subsequent to the ex-dividend date, based upon receipt of tax filings or other correspondence relating to the underlying investment. These distributions are recorded as a reduction of cost of investments and/or as a realized gain. Investment income is recorded net of foreign taxes withheld where recovery of such taxes is uncertain. Funds may file withholding tax reclaims in certain jurisdictions to recover a portion of amounts previously withheld. Any withholding tax reclaims income is included in the Statement of Operations in dividends. Any receivables for withholding tax reclaims are included in the Statement of Assets and Liabilities in dividends receivable.
Expenses. Expenses directly attributable to a fund are charged to that fund. Expenses attributable to more than one fund are allocated among the respective funds on the basis of relative net assets or other appropriate methods. Expenses included in the accompanying financial statements reflect the expenses of that fund and do not include any expenses associated with any underlying mutual funds or exchange-traded funds. Although not included in a fund's expenses, a fund indirectly bears its proportionate share of these expenses through the net asset value of each underlying mutual fund or exchange-traded fund. Expense estimates are accrued in the period to which they relate and adjustments are made when actual amounts are known.
Income Tax Information and Distributions to Shareholders. Each year, the Fund intends to qualify as a regulated investment company under Subchapter M of the Internal Revenue Code, including distributing substantially all of its taxable income and realized gains. As a result, no provision for U.S. Federal income taxes is required. The Fund files a U.S. federal tax return, in addition to state and local tax returns as required. The Fund's federal income tax returns are subject to examination by the Internal Revenue Service (IRS) for a period of three fiscal years after they are filed. State and local tax returns may be subject to examination for an additional fiscal year depending on the jurisdiction. Foreign taxes are provided for based on the Fund's understanding of the tax rules and rates that exist in the foreign markets in which it invests.
Distributions are declared and recorded on the ex-dividend date. Income and capital gain distributions are determined in accordance with income tax regulations, which may differ from GAAP.
Capital accounts within the financial statements are adjusted for permanent book-tax differences. These adjustments have no impact on net assets or the results of operations. Capital accounts are not adjusted for temporary book-tax differences which will reverse in a subsequent period.
Book-tax differences are primarily due to foreign currency transactions, certain corporate actions and losses deferred due to wash sales.
As of period end, the cost and unrealized appreciation (depreciation) in securities, and derivatives if applicable, for federal income tax purposes were as follows:
| Gross unrealized appreciation | $6,762,137,507 |
| Gross unrealized depreciation | (325,487,975) |
| Net unrealized appreciation (depreciation) | $6,436,649,532 |
| Tax cost | $9,751,233,598 |
Restricted Securities (including Private Placements). Funds may invest in securities that are subject to legal or contractual restrictions on resale. These securities generally may be resold in transactions exempt from registration or to the public if the securities are registered. Disposal of these securities may involve time-consuming negotiations and expense, and prompt sale at an acceptable price may be difficult. Information regarding restricted securities held at period end is included at the end of the Schedule of Investments, if applicable.
4. Purchases and Sales of Investments.
Purchases and sales of securities, other than short-term securities and in-kind transactions, as applicable, are noted in the table below.
| | Purchases ($) | Sales ($) |
| Fidelity Series Large Cap Stock Fund | 936,581,515 | 1,465,341,801 |
5. Fees and Other Transactions with Affiliates.
Management Fee. Fidelity Management & Research Company LLC (the investment adviser) and its affiliates provide the Fund with investment management related services for which the Fund does not pay a management fee. Under the management contract, the investment adviser or an affiliate pays all ordinary operating expenses of the Fund, except custody fees, fees and expenses of the independent Trustees, and certain miscellaneous expenses such as proxy and shareholder meeting expenses.
Brokerage Commissions. A portion of portfolio transactions were placed with brokerage firms which are affiliates of the investment adviser. Brokerage commissions are included in net realized gain (loss) and change in net unrealized appreciation (depreciation) in the Statement of Operations. The commissions paid to these affiliated firms were as follows:
| | Amount |
| Fidelity Series Large Cap Stock Fund | $16,207 |
Interfund Trades. Funds may purchase from or sell securities to other Fidelity Funds under procedures adopted by the Board. The procedures have been designed to ensure these interfund trades are executed in accordance with Rule 17a-7 of the 1940 Act. Any interfund trades are included within the respective purchases and sales amounts shown in the Purchases and Sales of Investments note. Interfund trades during the period are noted in the table below.
| | Purchases ($) | Sales ($) | Realized Gain (Loss) ($) |
| Fidelity Series Large Cap Stock Fund | 48,233,611 | 66,358,053 | 21,943,914 |
| | | | |
Subsequent Event - Sub-Advisory Arrangements. Effective March 1, 2024, the Fund's sub-advisory agreements with FMR Investment Management (UK) Limited, Fidelity Management & Research (Hong Kong) Limited, and Fidelity Management & Research (Japan) Limited will be amended to provide that the investment adviser will pay each sub-adviser monthly fees equal to 110% of the sub-adviser's costs for providing sub-advisory services.
6. Committed Line of Credit.
Certain Funds participate with other funds managed by the investment adviser or an affiliate in a $4.25 billion credit facility (the "line of credit") to be utilized for temporary or emergency purposes to fund shareholder redemptions or for other short-term liquidity purposes. The commitment fees on the pro-rata portion of the line of credit are borne by the investment adviser. During the period, there were no borrowings on this line of credit.
7. Security Lending.
Funds lend portfolio securities from time to time in order to earn additional income. Lending agents are used, including National Financial Services (NFS), an affiliate of the investment adviser. Pursuant to a securities lending agreement, NFS will receive a fee, which is capped at 9.9% of a fund's daily lending revenue, for its services as lending agent. A fund may lend securities to certain qualified borrowers, including NFS. On the settlement date of the loan, a fund receives collateral (in the form of U.S. Treasury obligations, letters of credit and/or cash) against the loaned securities and maintains collateral in an amount not less than 100% of the market value of the loaned securities during the period of the loan. The market value of the loaned securities is determined at the close of business of a fund and any additional required collateral is delivered to a fund on the next business day. A fund or borrower may terminate the loan at any time, and if the borrower defaults on its obligation to return the securities loaned because of insolvency or other reasons, a fund may apply collateral received from the borrower against the obligation. A fund may experience delays and costs in recovering the securities loaned. Any cash collateral received is invested in the Fidelity Securities Lending Cash Central Fund. Any loaned securities are identified as such in the Schedule of Investments, and the value of loaned securities and cash collateral at period end, as applicable, are presented in the Statement of Assets and Liabilities. Security lending income represents the income earned on investing cash collateral, less rebates paid to borrowers and any lending agent fees associated with the loan, plus any premium payments received for lending certain types of securities. Security lending income is presented in the Statement of Operations as a component of income from Fidelity Central Funds. Affiliated security lending activity, if any, was as follows:
| | Total Security Lending Fees Paid to NFS | Security Lending Income From Securities Loaned to NFS | Value of Securities Loaned to NFS at Period End |
| Fidelity Series Large Cap Stock Fund | $77,933 | $11 | $- |
8. Expense Reductions.
Through arrangements with the Fund's custodian, credits realized as a result of certain uninvested cash balances were used to reduce the Fund's expenses by $4,431.
9. Other.
A fund's organizational documents provide former and current trustees and officers with a limited indemnification against liabilities arising in connection with the performance of their duties to the fund. In the normal course of business, a fund may also enter into contracts that provide general indemnifications. A fund's maximum exposure under these arrangements is unknown as this would be dependent on future claims that may be made against a fund. The risk of material loss from such claims is considered remote.
At the end of the period, mutual funds and accounts managed by the investment adviser or its affiliates were the owners of record of all of the outstanding shares of the Fund.
10. Risk and Uncertainties.
Many factors affect a fund's performance. Developments that disrupt global economies and financial markets, such as pandemics, epidemics, outbreaks of infectious diseases, war, terrorism, and environmental disasters, may significantly affect a fund's investment performance. The effects of these developments to a fund will be impacted by the types of securities in which a fund invests, the financial condition, industry, economic sector, and geographic location of an issuer, and a fund's level of investment in the securities of that issuer. Significant concentrations in security types, issuers, industries, sectors, and geographic locations may magnify the factors that affect a fund's performance.
As a shareholder, you incur two types of costs: (1) transaction costs, which may include sales charges (loads) on purchase payments or redemption proceeds, as applicable and (2) ongoing costs, which generally include management fees, distribution and/or service (12b-1) fees and other Fund expenses. This Example is intended to help you understand your ongoing costs (in dollars) of investing in a fund and to compare these costs with the ongoing costs of investing in other mutual funds.
| The Example is based on an investment of $1,000 invested at the beginning of the period and held for the entire period (July 1, 2023 to December 31, 2023). |
Actual Expenses
The first line of the accompanying table provides information about actual account values and actual expenses. You may use the information in this line, together with the amount you invested, to estimate the expenses that you paid over the period. Simply divide your account value by $1,000.00 (for example, an $8,600 account value divided by $1,000.00 = 8.6), then multiply the result by the number in the first line for a class/Fund under the heading entitled "Expenses Paid During Period" to estimate the expenses you paid on your account during this period. If any fund is a shareholder of any underlying mutual funds or exchange-traded funds (ETFs) (the Underlying Funds), such fund indirectly bears its proportional share of the expenses of the Underlying Funds in addition to the direct expenses incurred presented in the table. These fees and expenses are not included in the annualized expense ratio used to calculate the expense estimate in the table below.
Hypothetical Example for Comparison Purposes
The second line of the accompanying table provides information about hypothetical account values and hypothetical expenses based on the actual expense ratio and an assumed rate of return of 5% per year before expenses, which is not the actual return. The hypothetical account values and expenses may not be used to estimate the actual ending account balance or expenses you paid for the period. You may use this information to compare the ongoing costs of investing in the Fund and other funds. To do so, compare this 5% hypothetical example with the 5% hypothetical examples that appear in the shareholder reports of the other funds. If any fund is a shareholder of any Underlying Funds, such fund indirectly bears its proportional share of the expenses of the Underlying Funds in addition to the direct expenses as presented in the table. These fees and expenses are not included in the annualized expense ratio used to calculate the expense estimate in the table below.
Please note that the expenses shown in the table are meant to highlight your ongoing costs only and do not reflect any transaction costs. Therefore, the second line of the table is useful in comparing ongoing costs only, and will not help you determine the relative total costs of owning different funds. In addition, if these transactional costs were included, your costs would have been higher.
| | | | | Annualized Expense Ratio- A | | Beginning Account Value July 1, 2023 | | Ending Account Value December 31, 2023 | | Expenses Paid During Period- C July 1, 2023 to December 31, 2023 |
| | | | | | | | | | |
| Fidelity® Series Large Cap Stock Fund | | | | -%-D | | | | | | |
| Actual | | | | | | $ 1,000 | | $ 1,091.20 | | $-E |
Hypothetical-B | | | | | | $ 1,000 | | $ 1,025.14 | | $-E |
| |
A Annualized expense ratio reflects expenses net of applicable fee waivers.
B 5% return per year before expenses
C Expenses are equal to the annualized expense ratio, multiplied by the average account value over the period, multiplied by 184/ 366 (to reflect the one-half year period). The fees and expenses of any Underlying Funds are not included in each annualized expense ratio.
D Amount represents less than .005%.
E Amount represents less than $.005.
Board Approval of Investment Advisory Contracts and Management Fees
Fidelity Series Large Cap Stock Fund
Each year, the Board of Trustees, including the Independent Trustees (together, the Board), considers the renewal of the fund's management contract with Fidelity Management & Research Company LLC (FMR) and the sub-advisory agreements (together, the Advisory Contracts) for the fund. FMR and the sub-advisers are referred to herein as the Investment Advisers. The Board, assisted by the advice of fund counsel and Independent Trustees' counsel, requests and considers a broad range of information relevant to the renewal of the Advisory Contracts throughout the year.
The Board meets regularly and, at each of its meetings, covers an extensive agenda of topics and materials and considers factors that are relevant to its annual consideration of the renewal of the fund's Advisory Contracts, including the services and support provided to the fund and its shareholders. The Board, acting directly and through its Committees (each of which is composed of and chaired by Independent Trustees), requests and receives information concerning the annual consideration of the renewal of the fund's Advisory Contracts. The Board also meets as needed to review matters specifically related to the Board's annual consideration of the renewal of the Advisory Contracts. Members of the Board may also meet with trustees of other Fidelity funds through joint ad hoc committees to discuss certain matters relevant to all of the Fidelity funds.
At its July 2023 meeting, the Board unanimously determined to renew the fund's Advisory Contracts. The Board considered all factors it believed relevant and reached a determination, with the assistance of fund counsel and Independent Trustees' counsel and through the exercise of its business judgment, that the renewal of the Advisory Contracts was in the best interests of the fund and its shareholders and the fact that no fee is payable under the management contract was fair and reasonable in light of all of the surrounding circumstances.
Nature, Extent, and Quality of Services Provided. The Board considered staffing as it relates to the fund, including the backgrounds and experience of investment personnel of the Investment Advisers, and also considered the Investment Advisers' implementation of the fund's investment program. The Independent Trustees also had discussions with senior management of Fidelity's investment operations and investment groups. The Board considered the structure of the investment personnel compensation program and whether this structure provides appropriate incentives to act in the best interests of the fund.
Resources Dedicated to Investment Management and Support Services. The Board and the Fund Oversight and Research Committees reviewed the general qualifications and capabilities of Fidelity's investment staff, including its size, education, experience, and resources, as well as Fidelity's approach to recruiting, training, managing, and compensating investment personnel. The Board noted the resources devoted to expansion of Fidelity's global investment organization, and that Fidelity's analysts have extensive resources, tools, and capabilities that allow them to conduct sophisticated quantitative and fundamental analysis, as well as credit analysis of issuers, counterparties, and guarantors. Further, the Board considered that Fidelity's investment professionals have sufficient access to global information and data so as to provide competitive investment results over time, and that those professionals also have access to sophisticated tools that permit them to assess portfolio construction and risk and performance attribution characteristics continuously, as well as to transmit new information and research conclusions rapidly around the world. Additionally, in its deliberations, the Board considered Fidelity's trading, risk management, compliance, and technology and operations capabilities and resources, which are integral parts of the investment management process.
Administrative Services. The Board considered (i) the nature, extent, quality, and cost of advisory and administrative services performed by the Investment Advisers and their affiliates under the Advisory Contracts and under separate agreements covering transfer agency, pricing and bookkeeping, and securities lending services for the fund; (ii) the nature and extent of Fidelity's supervision of third party service providers, principally custodians, subcustodians, and pricing vendors; and (iii) the resources devoted by Fidelity to, and the record of compliance with, the fund's compliance policies and procedures. The Board also reviewed the allocation of fund brokerage, including allocations to brokers affiliated with the Investment Advisers, the use of brokerage commissions to pay fund expenses, and the use of "soft" commission dollars to pay for research services. The Board also considered the fund's securities lending activities and any payments made to Fidelity relating to securities lending.
Investment Performance. The Board reviewed the fund's absolute investment performance, as well as the fund's relative investment performance. The Board did not consider performance to be a material factor in its decision to renew the fund's Advisory Contracts, as the fund is not publicly offered as a stand-alone investment product. In this regard, the Board noted that the fund is designed to offer an investment option for other investment companies, 529 plans, and collective investment trusts managed by Fidelity and ultimately to enhance the performance of those investment companies, 529 plans, and collective investment trusts.
Based on its review, the Board concluded that the nature, extent, and quality of services provided to the fund under the Advisory Contracts should continue to benefit the shareholders of the fund.
Competitiveness of Management Fee and Total Expense Ratio. The Board considered that the fund does not pay FMR a management fee for investment advisory services, but that FMR receives fees for providing services to funds that invest in the fund. The Board noted that FMR or an affiliate undertakes to pay all operating expenses of the fund, except transfer agent fees, 12b-1 fees (if any), Independent Trustee fees and expenses, custodian fees and expenses, proxy and shareholder meeting expenses, interest, taxes, and extraordinary expenses (such as litigation expenses). The Board further noted that the fund pays its non-operating expenses, including brokerage commissions and fees and expenses associated with the fund's securities lending program, if applicable.
The Board further considered that FMR has contractually agreed to reimburse the fund to the extent that total operating expenses, with certain exceptions, as a percentage of its average net assets, exceed 0.003% through October 31, 2025.
Based on its review, the Board considered that the fund does not pay a management fee and concluded that the total expense ratio of the fund was reasonable in light of the services that the fund and its shareholders receive and the other factors considered.
Costs of the Services and Profitability. The Board considered the level of Fidelity's profits in respect of all the Fidelity funds.
A public accounting firm has been engaged annually by the Board as part of the Board's assessment of Fidelity's profitability analysis. The engagement includes the review and assessment of the methodologies used by Fidelity in determining the revenues and expenses attributable to Fidelity's fund business, and completion of agreed-upon procedures in respect of the mathematical accuracy of certain fund profitability information and its conformity to established allocation methodologies. After considering the reports issued under the engagement and information provided by Fidelity, the Board concluded that while other allocation methods may also be reasonable, Fidelity's profitability methodologies are reasonable in all material respects.
The Board also reviewed Fidelity's non-fund businesses and potential indirect benefits such businesses may have received as a result of their association with Fidelity's fund business (i.e., fall-out benefits) as well as cases where Fidelity's affiliates may benefit from the funds' business. The Board considered areas where potential indirect benefits to the Fidelity funds from their relationships with Fidelity may exist. The Board's consideration of these matters was informed by the findings of a joint ad hoc committee created by it and the boards of other Fidelity funds to evaluate potential fall-out benefits.
The Board concluded that the costs of the services provided by and the profits realized by Fidelity in connection with the operation of the fund were not relevant to the renewal of the Advisory Contracts because the fund pays no advisory fees and FMR bears all expenses of the fund with certain exceptions.
Economies of Scale. The Board concluded that because the fund pays no advisory fees and FMR bears all expenses of the fund with certain exceptions, the realization of economies of scale was not a material factor in the Board's decision to renew the fund's Advisory Contracts.
Additional Information Requested by the Board. In order to develop fully the factual basis for consideration of the Fidelity funds' advisory contracts, the Board requested and received additional information on certain topics, including: (i) fund flow and performance trends, in particular the underperformance of certain funds and strategies, and Fidelity's long-term strategies for certain funds, including any consideration of fund liquidations or mergers; (ii) the operation of performance fees and competitor use of performance fees; (iii) Fidelity's pricing philosophy compared to competitors; (iv) fund profitability methodology and data; (v) evaluation of competitive fund data and peer group classifications and fee and expense comparisons; (vi) the management fee and expense structures for different funds and classes and information about the differences between various fee and expense structures; (vii) group fee breakpoints and related voluntary fee waivers; and (viii) information regarding other accounts managed by Fidelity and the funds' sub-advisory arrangements.
Conclusion. Based on its evaluation of all of the conclusions noted above, and after considering all factors it believed relevant, the Board, including the Independent Trustees, concluded that the advisory and sub-advisory fee arrangements are fair and reasonable in light of all of the surrounding circumstances and that the fund's Advisory Contracts should be renewed through July 31, 2024.
1.951032.111
MHT-SANN-0224
Fidelity® Growth Discovery Fund
Semi-Annual Report
December 31, 2023
Contents
To view a fund's proxy voting guidelines and proxy voting record for the 12-month period ended June 30, visit http://www.fidelity.com/proxyvotingresults or visit the Securities and Exchange Commission's (SEC) web site at http://www.sec.gov.
You may also call 1-800-544-8544 if you're an individual investing directly with Fidelity, call 1-800-835-5092 if you're a plan sponsor or participant with Fidelity as your recordkeeper or call 1-877-208-0098 on institutional accounts or if you're an advisor or invest through one to request a free copy of the proxy voting guidelines.
Standard & Poor's, S&P and S&P 500 are registered service marks of The McGraw-Hill Companies, Inc. and have been licensed for use by Fidelity Distributors Corporation.
Other third-party marks appearing herein are the property of their respective owners.
All other marks appearing herein are registered or unregistered trademarks or service marks of FMR LLC or an affiliated company. © 2024 FMR LLC. All rights reserved.
This report and the financial statements contained herein are submitted for the general information of the shareholders of the Fund. This report is not authorized for distribution to prospective investors in the Fund unless preceded or accompanied by an effective prospectus.
A fund files its complete schedule of portfolio holdings with the SEC for the first and third quarters of each fiscal year on Form N-PORT. Forms N-PORT are available on the SEC's web site at http://www.sec.gov. A fund's Forms N-PORT may be reviewed and copied at the SEC's Public Reference Room in Washington, DC. Information regarding the operation of the SEC's Public Reference Room may be obtained by calling 1-800-SEC-0330.
For a complete list of a fund's portfolio holdings, view the most recent holdings listing, semiannual report, or annual report on Fidelity's web site at http://www.fidelity.com, http://www.institutional.fidelity.com, or http://www.401k.com, as applicable.
NOT FDIC INSURED •MAY LOSE VALUE •NO BANK GUARANTEE
Neither the Fund nor Fidelity Distributors Corporation is a bank.
Top Holdings (% of Fund's net assets) |
| |
| Microsoft Corp. | 14.1 | |
| NVIDIA Corp. | 6.5 | |
| Amazon.com, Inc. | 5.0 | |
| Alphabet, Inc. Class A | 4.7 | |
| Uber Technologies, Inc. | 4.4 | |
| Apple, Inc. | 4.4 | |
| Eli Lilly & Co. | 2.2 | |
| Boston Scientific Corp. | 2.1 | |
| Universal Music Group NV | 1.9 | |
| Netflix, Inc. | 1.8 | |
| | 47.1 | |
| |
| Market Sectors (% of Fund's net assets) |
| |
| Information Technology | 38.4 | |
| Health Care | 14.7 | |
| Industrials | 13.6 | |
| Consumer Discretionary | 10.8 | |
| Communication Services | 10.5 | |
| Financials | 5.1 | |
| Energy | 3.7 | |
| Consumer Staples | 1.3 | |
| Materials | 0.2 | |
| |
Asset Allocation (% of Fund's net assets) |
|
|
Geographic Diversification (% of Fund's net assets) |
|
* Includes Short-Term investments and Net Other Assets (Liabilities). Percentages are adjusted for the effect of derivatives, if applicable. |
| |
Showing Percentage of Net Assets
| Common Stocks - 98.0% |
| | | Shares | Value ($) (000s) |
| COMMUNICATION SERVICES - 10.5% | | | |
| Entertainment - 4.9% | | | |
| Netflix, Inc. (a) | | 159,985 | 77,893 |
| Universal Music Group NV | | 2,834,046 | 80,904 |
| Warner Music Group Corp. Class A | | 1,387,046 | 49,642 |
| | | | 208,439 |
| Interactive Media & Services - 5.6% | | | |
| Alphabet, Inc. Class A (a) | | 1,429,794 | 199,728 |
| Epic Games, Inc. (a)(b)(c) | | 2,244 | 1,441 |
| Meta Platforms, Inc. Class A (a) | | 103,700 | 36,706 |
| | | | 237,875 |
TOTAL COMMUNICATION SERVICES | | | 446,314 |
| CONSUMER DISCRETIONARY - 10.8% | | | |
| Automobiles - 0.4% | | | |
| BYD Co. Ltd. (H Shares) | | 521,500 | 14,385 |
| Broadline Retail - 6.3% | | | |
| Amazon.com, Inc. (a) | | 1,381,969 | 209,976 |
| MercadoLibre, Inc. (a) | | 27,201 | 42,747 |
| PDD Holdings, Inc. ADR (a) | | 70,100 | 10,256 |
| Savers Value Village, Inc. (d) | | 349,600 | 6,076 |
| | | | 269,055 |
| Hotels, Restaurants & Leisure - 2.1% | | | |
| Airbnb, Inc. Class A (a) | | 216,653 | 29,495 |
| Booking Holdings, Inc. (a) | | 7,558 | 26,810 |
| Flutter Entertainment PLC (a) | | 156,051 | 27,728 |
| Kura Sushi U.S.A., Inc. Class A (a)(d) | | 58,663 | 4,458 |
| | | | 88,491 |
| Household Durables - 0.0% | | | |
| Blu Investments LLC (a)(b)(c) | | 3,320,224 | 1 |
| Specialty Retail - 1.0% | | | |
| TJX Companies, Inc. | | 466,739 | 43,785 |
| Textiles, Apparel & Luxury Goods - 1.0% | | | |
| LVMH Moet Hennessy Louis Vuitton SE | | 27,317 | 22,196 |
| Samsonite International SA (a)(e) | | 6,564,623 | 21,648 |
| | | | 43,844 |
TOTAL CONSUMER DISCRETIONARY | | | 459,561 |
| CONSUMER STAPLES - 1.3% | | | |
| Beverages - 0.9% | | | |
| Monster Beverage Corp. | | 620,703 | 35,759 |
| Personal Care Products - 0.4% | | | |
| Estee Lauder Companies, Inc. Class A | | 119,115 | 17,421 |
TOTAL CONSUMER STAPLES | | | 53,180 |
| ENERGY - 3.7% | | | |
| Energy Equipment & Services - 0.5% | | | |
| Baker Hughes Co. Class A | | 581,861 | 19,888 |
| Oil, Gas & Consumable Fuels - 3.2% | | | |
| Cheniere Energy, Inc. | | 352,200 | 60,124 |
| New Fortress Energy, Inc. (d) | | 247,089 | 9,323 |
| Range Resources Corp. | | 642,211 | 19,549 |
| Reliance Industries Ltd. | | 1,340,943 | 41,653 |
| Southwestern Energy Co. (a) | | 940,800 | 6,162 |
| | | | 136,811 |
TOTAL ENERGY | | | 156,699 |
| FINANCIALS - 5.1% | | | |
| Capital Markets - 1.2% | | | |
| Ares Management Corp. | | 72,600 | 8,634 |
| CME Group, Inc. | | 206,557 | 43,501 |
| | | | 52,135 |
| Financial Services - 2.9% | | | |
| Apollo Global Management, Inc. | | 42,500 | 3,961 |
| Corebridge Financial, Inc. | | 396,100 | 8,580 |
| Fiserv, Inc. (a) | | 61,800 | 8,210 |
| Global Payments, Inc. | | 163,500 | 20,765 |
| MasterCard, Inc. Class A | | 175,296 | 74,765 |
| Rocket Companies, Inc. (a)(d) | | 613,018 | 8,877 |
| | | | 125,158 |
| Insurance - 1.0% | | | |
| Arthur J. Gallagher & Co. | | 142,184 | 31,974 |
| BRP Group, Inc. (a) | | 358,843 | 8,619 |
| | | | 40,593 |
TOTAL FINANCIALS | | | 217,886 |
| HEALTH CARE - 14.7% | | | |
| Biotechnology - 4.5% | | | |
| Adamas Pharmaceuticals, Inc.: | | | |
| rights (a)(c) | | 678,800 | 163 |
| rights (a)(c) | | 678,800 | 61 |
| Alnylam Pharmaceuticals, Inc. (a) | | 141,766 | 27,135 |
| Arcellx, Inc. (a) | | 31,947 | 1,773 |
| Arrowhead Pharmaceuticals, Inc. (a) | | 51,000 | 1,561 |
| Beam Therapeutics, Inc. (a) | | 39,300 | 1,070 |
| BioMarin Pharmaceutical, Inc. (a) | | 80,100 | 7,723 |
| Blueprint Medicines Corp. (a) | | 20,200 | 1,863 |
| Cerevel Therapeutics Holdings (a) | | 45,600 | 1,933 |
| Cytokinetics, Inc. (a) | | 118,163 | 9,865 |
| Galapagos NV sponsored ADR (a) | | 207,245 | 8,425 |
| Gamida Cell Ltd. (a)(d) | | 996,121 | 411 |
| Gamida Cell Ltd. warrants 4/21/28 (a) | | 182,600 | 10 |
| Hookipa Pharma, Inc. (a) | | 454,700 | 368 |
| Immunocore Holdings PLC ADR (a) | | 89,089 | 6,087 |
| Insmed, Inc. (a) | | 324,506 | 10,056 |
| Krystal Biotech, Inc. (a) | | 10,600 | 1,315 |
| Legend Biotech Corp. ADR (a) | | 85,168 | 5,125 |
| Regeneron Pharmaceuticals, Inc. (a) | | 40,952 | 35,968 |
| Repligen Corp. (a)(d) | | 89,319 | 16,060 |
| Sarepta Therapeutics, Inc. (a) | | 27,300 | 2,633 |
| Seres Therapeutics, Inc. (a) | | 161,000 | 225 |
| Synlogic, Inc. (a)(d) | | 29,513 | 114 |
| Vertex Pharmaceuticals, Inc. (a) | | 117,953 | 47,994 |
| Vor Biopharma, Inc. (a) | | 246,895 | 556 |
| XOMA Corp. (a) | | 147,500 | 2,729 |
| | | | 191,223 |
| Health Care Equipment & Supplies - 3.6% | | | |
| Axonics Modulation Technologies, Inc. (a) | | 140,400 | 8,737 |
| Boston Scientific Corp. (a) | | 1,578,665 | 91,263 |
| Glaukos Corp. (a) | | 72,900 | 5,795 |
| Inspire Medical Systems, Inc. (a) | | 34,100 | 6,937 |
| Lantheus Holdings, Inc. (a) | | 51,700 | 3,205 |
| Masimo Corp. (a) | | 247,300 | 28,986 |
| Penumbra, Inc. (a) | | 26,000 | 6,540 |
| | | | 151,463 |
| Health Care Providers & Services - 0.8% | | | |
| HealthEquity, Inc. (a) | | 542,250 | 35,951 |
| Health Care Technology - 0.1% | | | |
| Evolent Health, Inc. | | 159,100 | 5,255 |
| Life Sciences Tools & Services - 2.9% | | | |
| Agilent Technologies, Inc. | | 62,200 | 8,648 |
| Bio-Techne Corp. | | 125,199 | 9,660 |
| Bruker Corp. | | 254,223 | 18,680 |
| Chemometec A/S | | 45,300 | 2,603 |
| Codexis, Inc. (a) | | 584,001 | 1,781 |
| Danaher Corp. | | 156,814 | 36,277 |
| MaxCyte, Inc. (a) | | 487,900 | 2,293 |
| Sartorius Stedim Biotech | | 53,412 | 14,122 |
| Thermo Fisher Scientific, Inc. | | 52,211 | 27,713 |
| | | | 121,777 |
| Pharmaceuticals - 2.8% | | | |
| Aclaris Therapeutics, Inc. (a) | | 89,364 | 94 |
| AstraZeneca PLC sponsored ADR | | 309,415 | 20,839 |
| Chugai Pharmaceutical Co. Ltd. | | 107,400 | 4,057 |
| Eli Lilly & Co. | | 162,516 | 94,734 |
| | | | 119,724 |
TOTAL HEALTH CARE | | | 625,393 |
| INDUSTRIALS - 13.6% | | | |
| Commercial Services & Supplies - 0.0% | | | |
| Veralto Corp. | | 22,238 | 1,829 |
| Electrical Equipment - 1.3% | | | |
| Eaton Corp. PLC | | 213,383 | 51,387 |
| HD Hyundai Electric Co. Ltd. | | 54,750 | 3,476 |
| | | | 54,863 |
| Ground Transportation - 4.4% | | | |
| Uber Technologies, Inc. (a) | | 3,040,118 | 187,180 |
| Industrial Conglomerates - 1.5% | | | |
| General Electric Co. | | 503,978 | 64,323 |
| Machinery - 2.1% | | | |
| Energy Recovery, Inc. (a) | | 158,000 | 2,977 |
| Ingersoll Rand, Inc. | | 582,196 | 45,027 |
| Parker Hannifin Corp. | | 61,821 | 28,481 |
| Westinghouse Air Brake Tech Co. | | 93,885 | 11,914 |
| | | | 88,399 |
| Passenger Airlines - 0.6% | | | |
| Ryanair Holdings PLC sponsored ADR (a) | | 184,211 | 24,566 |
| Professional Services - 2.7% | | | |
| Equifax, Inc. | | 252,819 | 62,520 |
| KBR, Inc. | | 649,062 | 35,965 |
| TransUnion Holding Co., Inc. | | 232,139 | 15,950 |
| | | | 114,435 |
| Trading Companies & Distributors - 1.0% | | | |
| Ferguson PLC | | 210,946 | 40,561 |
TOTAL INDUSTRIALS | | | 576,156 |
| INFORMATION TECHNOLOGY - 38.2% | | | |
| Electronic Equipment, Instruments & Components - 1.4% | | | |
| Flex Ltd. (a) | | 1,061,129 | 32,322 |
| Jabil, Inc. | | 216,600 | 27,595 |
| | | | 59,917 |
| IT Services - 2.0% | | | |
| Gartner, Inc. (a) | | 40,254 | 18,159 |
| MongoDB, Inc. Class A (a) | | 110,285 | 45,090 |
| Snowflake, Inc. (a) | | 98,718 | 19,645 |
| | | | 82,894 |
| Semiconductors & Semiconductor Equipment - 13.5% | | | |
| Aixtron AG | | 388,675 | 16,588 |
| Allegro MicroSystems LLC (a) | | 176,113 | 5,331 |
| Arm Holdings Ltd. ADR (d) | | 31,300 | 2,352 |
| ASML Holding NV (depository receipt) | | 56,867 | 43,044 |
| BE Semiconductor Industries NV | | 220,800 | 33,260 |
| eMemory Technology, Inc. | | 18,757 | 1,497 |
| KLA Corp. | | 46,700 | 27,147 |
| Marvell Technology, Inc. | | 138,000 | 8,323 |
| Monolithic Power Systems, Inc. | | 23,607 | 14,891 |
| NVIDIA Corp. | | 560,213 | 277,429 |
| NXP Semiconductors NV | | 151,854 | 34,878 |
| SiTime Corp. (a)(d) | | 152,221 | 18,583 |
| Taiwan Semiconductor Manufacturing Co. Ltd. sponsored ADR | | 626,182 | 65,123 |
| Universal Display Corp. | | 136,790 | 26,162 |
| | | | 574,608 |
| Software - 16.9% | | | |
| ASAPP, Inc. warrants 8/28/28 (a)(b)(c) | | 1,014,955 | 2,426 |
| Confluent, Inc. (a) | | 760,475 | 17,795 |
| HubSpot, Inc. (a) | | 54,356 | 31,556 |
| Manhattan Associates, Inc. (a) | | 129,851 | 27,960 |
| Microsoft Corp. | | 1,586,882 | 596,729 |
| Monday.com Ltd. (a) | | 53,900 | 10,123 |
| NICE Ltd. sponsored ADR (a) | | 67,339 | 13,435 |
| ServiceNow, Inc. (a) | | 23,374 | 16,513 |
| Volue A/S (a) | | 725,946 | 1,518 |
| | | | 718,055 |
| Technology Hardware, Storage & Peripherals - 4.4% | | | |
| Apple, Inc. | | 967,481 | 186,269 |
TOTAL INFORMATION TECHNOLOGY | | | 1,621,743 |
| MATERIALS - 0.1% | | | |
| Chemicals - 0.1% | | | |
| Aspen Aerogels, Inc. (a)(d) | | 261,459 | 4,126 |
| TOTAL COMMON STOCKS (Cost $2,605,731) | | | 4,161,058 |
| | | | |
| Convertible Preferred Stocks - 0.3% |
| | | Shares | Value ($) (000s) |
| CONSUMER DISCRETIONARY - 0.0% | | | |
| Textiles, Apparel & Luxury Goods - 0.0% | | | |
| Canva, Inc.: | | | |
| Series A (b)(c) | | 423 | 473 |
| Series A2 (b)(c) | | 77 | 86 |
| | | | 559 |
| HEALTH CARE - 0.0% | | | |
| Biotechnology - 0.0% | | | |
| ElevateBio LLC Series C (a)(b)(c) | | 75,700 | 241 |
| INFORMATION TECHNOLOGY - 0.2% | | | |
| Software - 0.2% | | | |
| ASAPP, Inc.: | | | |
| Series C (a)(b)(c) | | 250,763 | 772 |
| Series D (b)(c) | | 1,768,998 | 4,847 |
| | | | 5,619 |
| MATERIALS - 0.1% | | | |
| Metals & Mining - 0.1% | | | |
| Illuminated Holdings, Inc.: | | | |
| Series C2 (a)(b)(c) | | 50,974 | 1,183 |
| Series C3 (a)(b)(c) | | 63,718 | 1,478 |
| Series C4 (a)(b)(c) | | 18,303 | 425 |
| Series C5 (a)(b)(c) | | 36,887 | 856 |
| | | | 3,942 |
| TOTAL CONVERTIBLE PREFERRED STOCKS (Cost $14,775) | | | 10,361 |
| | | | |
| Convertible Bonds - 0.0% |
| | | Principal Amount (f) (000s) | Value ($) (000s) |
| MATERIALS - 0.0% | | | |
| Metals & Mining - 0.0% | | | |
Illuminated Holdings, Inc. 0% (b)(c)(g) (Cost $810) | | 810 | 815 |
| | | | |
| Preferred Securities - 0.0% |
| | | Principal Amount (f) (000s) | Value ($) (000s) |
| MATERIALS - 0.0% | | | |
| Metals & Mining - 0.0% | | | |
Illuminated Holdings, Inc. 0% (b)(c)(g) (Cost $1,099) | | 1,099 | 1,104 |
| | | | |
| Money Market Funds - 2.9% |
| | | Shares | Value ($) (000s) |
| Fidelity Cash Central Fund 5.40% (h) | | 69,691,943 | 69,706 |
| Fidelity Securities Lending Cash Central Fund 5.40% (h)(i) | | 54,914,164 | 54,920 |
| TOTAL MONEY MARKET FUNDS (Cost $124,626) | | | 124,626 |
| | | | |
| TOTAL INVESTMENT IN SECURITIES - 101.2% (Cost $2,747,041) | 4,297,964 |
NET OTHER ASSETS (LIABILITIES) - (1.2)% | (52,532) |
| NET ASSETS - 100.0% | 4,245,432 |
| | |
Any values shown as $0 in the Schedule of Investments may reflect amounts less than $500.
Legend
| (b) | Restricted securities (including private placements) - Investment in securities not registered under the Securities Act of 1933 (excluding 144A issues). At the end of the period, the value of restricted securities (excluding 144A issues) amounted to $16,148,000 or 0.4% of net assets. |
| (d) | Security or a portion of the security is on loan at period end. |
| (e) | Security exempt from registration under Rule 144A of the Securities Act of 1933. These securities may be resold in transactions exempt from registration, normally to qualified institutional buyers. At the end of the period, the value of these securities amounted to $21,648,000 or 0.5% of net assets. |
| (f) | Amount is stated in United States dollars unless otherwise noted. |
| (g) | Security is perpetual in nature with no stated maturity date. |
| (h) | Affiliated fund that is generally available only to investment companies and other accounts managed by Fidelity Investments. The rate quoted is the annualized seven-day yield of the fund at period end. A complete unaudited listing of the fund's holdings as of its most recent quarter end is available upon request. In addition, each Fidelity Central Fund's financial statements are available on the SEC's website or upon request. |
| (i) | Investment made with cash collateral received from securities on loan. |
| Additional information on each restricted holding is as follows: |
| Security | Acquisition Date | Acquisition Cost ($) (000s) |
| ASAPP, Inc. warrants 8/28/28 | 8/29/23 | 0 |
| | | |
| ASAPP, Inc. Series C | 4/30/21 | 1,654 |
| | | |
| ASAPP, Inc. Series D | 8/29/23 | 6,831 |
| | | |
| Blu Investments LLC | 5/21/20 | 6 |
| | | |
| Canva, Inc. Series A | 9/22/23 | 451 |
| | | |
| Canva, Inc. Series A2 | 9/22/23 | 82 |
| | | |
| ElevateBio LLC Series C | 3/09/21 | 318 |
| | | |
| Epic Games, Inc. | 3/29/21 | 1,986 |
| | | |
| Illuminated Holdings, Inc. Series C2 | 7/07/20 | 1,274 |
| | | |
| Illuminated Holdings, Inc. Series C3 | 7/07/20 | 1,912 |
| | | |
| Illuminated Holdings, Inc. Series C4 | 1/08/21 | 659 |
| | | |
| Illuminated Holdings, Inc. Series C5 | 6/16/21 | 1,594 |
| | | |
| Illuminated Holdings, Inc. 0% | 9/27/23 | 1,099 |
| | | |
| Illuminated Holdings, Inc. 0% | 6/14/23 | 810 |
| | | |
Affiliated Central Funds
Fiscal year to date information regarding the Fund's investments in Fidelity Central Funds, including the ownership percentage, is presented below.
| Affiliate (Amounts in thousands) | Value, beginning of period ($) | Purchases ($) | Sales Proceeds ($) | Dividend Income ($) | Realized Gain (loss) ($) | Change in Unrealized appreciation (depreciation) ($) | Value, end of period ($) | % ownership, end of period |
| Fidelity Cash Central Fund 5.40% | 44,138 | 520,070 | 494,502 | 1,239 | - | - | 69,706 | 0.2% |
| Fidelity Securities Lending Cash Central Fund 5.40% | 22,191 | 161,363 | 128,634 | 118 | - | - | 54,920 | 0.2% |
| Total | 66,329 | 681,433 | 623,136 | 1,357 | - | - | 124,626 | |
| | | | | | | | | |
Amounts in the dividend income column in the above table include any capital gain distributions from underlying funds, which are presented in the corresponding line item in the Statement of Operations, if applicable.
Amounts in the dividend income column for Fidelity Securities Lending Cash Central Fund represents the income earned on investing cash collateral, less rebates paid to borrowers and any lending agent fees associated with the loan, plus any premium payments received for lending certain types of securities.
Amounts included in the purchases and sales proceeds columns may include in-kind transactions, if applicable.
Investment Valuation
The following is a summary of the inputs used, as of December 31, 2023, involving the Fund's assets and liabilities carried at fair value. The inputs or methodology used for valuing securities may not be an indication of the risk associated with investing in those securities. For more information on valuation inputs, and their aggregation into the levels used below, please refer to the Investment Valuation section in the accompanying Notes to Financial Statements.
| Valuation Inputs at Reporting Date: |
Description (Amounts in thousands) | Total ($) | Level 1 ($) | Level 2 ($) | Level 3 ($) |
Investments in Securities: | | | | |
|
| Equities: | | | | |
Communication Services | 446,314 | 363,969 | 80,904 | 1,441 |
Consumer Discretionary | 460,120 | 422,979 | 36,581 | 560 |
Consumer Staples | 53,180 | 53,180 | - | - |
Energy | 156,699 | 156,699 | - | - |
Financials | 217,886 | 217,886 | - | - |
Health Care | 625,634 | 621,102 | 4,067 | 465 |
Industrials | 576,156 | 576,156 | - | - |
Information Technology | 1,627,362 | 1,619,317 | - | 8,045 |
Materials | 8,068 | 4,126 | - | 3,942 |
|
| Corporate Bonds | 815 | - | - | 815 |
|
| Preferred Securities | 1,104 | - | - | 1,104 |
|
| Money Market Funds | 124,626 | 124,626 | - | - |
| Total Investments in Securities: | 4,297,964 | 4,160,040 | 121,552 | 16,372 |
| Statement of Assets and Liabilities |
| Amounts in thousands (except per-share amounts) | | | | December 31, 2023 (Unaudited) |
| | | | | |
| Assets | | | | |
| Investment in securities, at value (including securities loaned of $51,913) - See accompanying schedule: | | | | |
Unaffiliated issuers (cost $2,622,415) | $ | 4,173,338 | | |
Fidelity Central Funds (cost $124,626) | | 124,626 | | |
| | | | | |
| | | | | |
| Total Investment in Securities (cost $2,747,041) | | | $ | 4,297,964 |
| Foreign currency held at value (cost $62) | | | | 64 |
| Receivable for fund shares sold | | | | 7,764 |
| Dividends receivable | | | | 2,040 |
| Distributions receivable from Fidelity Central Funds | | | | 380 |
| Prepaid expenses | | | | 3 |
| Other receivables | | | | 24 |
Total assets | | | | 4,308,239 |
| Liabilities | | | | |
| Payable to custodian bank | $ | 74 | | |
| Payable for fund shares redeemed | | 3,697 | | |
| Accrued management fee | | 1,780 | | |
| Other affiliated payables | | 535 | | |
| Other payables and accrued expenses | | 1,807 | | |
| Collateral on securities loaned | | 54,914 | | |
| Total Liabilities | | | | 62,807 |
| Net Assets | | | $ | 4,245,432 |
| Net Assets consist of: | | | | |
| Paid in capital | | | $ | 2,650,487 |
| Total accumulated earnings (loss) | | | | 1,594,945 |
| Net Assets | | | $ | 4,245,432 |
| | | | | |
| Net Asset Value and Maximum Offering Price | | | | |
| Growth Discovery : | | | | |
Net Asset Value, offering price and redemption price per share ($3,805,151 ÷ 70,655 shares) | | | $ | 53.86 |
| Class K : | | | | |
Net Asset Value, offering price and redemption price per share ($440,281 ÷ 8,161 shares) | | | $ | 53.95 |
| Statement of Operations |
| Amounts in thousands | | | | Six months ended December 31, 2023 (Unaudited) |
| Investment Income | | | | |
| Dividends | | | $ | 10,651 |
| Income from Fidelity Central Funds (including $118 from security lending) | | | | 1,357 |
| Total Income | | | | 12,008 |
| Expenses | | | | |
| Management fee | | | | |
| Basic fee | $ | 9,442 | | |
| Performance adjustment | | (34) | | |
| Transfer agent fees | | 2,395 | | |
| Accounting fees | | 459 | | |
| Custodian fees and expenses | | 35 | | |
| Independent trustees' fees and expenses | | 10 | | |
| Registration fees | | 88 | | |
| Audit | | 36 | | |
| Legal | | 8 | | |
| Miscellaneous | | 5 | | |
| Total expenses before reductions | | 12,444 | | |
| Expense reductions | | (128) | | |
| Total expenses after reductions | | | | 12,316 |
| Net Investment income (loss) | | | | (308) |
| Realized and Unrealized Gain (Loss) | | | | |
| Net realized gain (loss) on: | | | | |
| Investment Securities: | | | | |
| Unaffiliated issuers (net of foreign taxes of $911) | | 54,931 | | |
| Foreign currency transactions | | 56 | | |
| Total net realized gain (loss) | | | | 54,987 |
| Change in net unrealized appreciation (depreciation) on: | | | | |
| Investment Securities: | | | | |
| Unaffiliated issuers(net of decrease in deferred foreign taxes of $554) | | 323,980 | | |
| Assets and liabilities in foreign currencies | | 6 | | |
| Total change in net unrealized appreciation (depreciation) | | | | 323,986 |
| Net gain (loss) | | | | 378,973 |
| Net increase (decrease) in net assets resulting from operations | | | $ | 378,665 |
| Statement of Changes in Net Assets |
| |
| Amount in thousands | | Six months ended December 31, 2023 (Unaudited) | | Year ended June 30, 2023 |
| Increase (Decrease) in Net Assets | | | | |
| Operations | | | | |
| Net investment income (loss) | $ | (308) | $ | 12,023 |
| Net realized gain (loss) | | 54,987 | | 92,946 |
| Change in net unrealized appreciation (depreciation) | | 323,986 | | 498,363 |
| Net increase (decrease) in net assets resulting from operations | | 378,665 | | 603,332 |
| Distributions to shareholders | | (95,883) | | (98,036) |
| | | | | |
| Share transactions - net increase (decrease) | | 509,292 | | 179,647 |
| Total increase (decrease) in net assets | | 792,074 | | 684,943 |
| | | | | |
| Net Assets | | | | |
| Beginning of period | | 3,453,358 | | 2,768,415 |
| End of period | $ | 4,245,432 | $ | 3,453,358 |
| | | | | |
| | | | | |
Financial Highlights
| Fidelity® Growth Discovery Fund |
| |
| | Six months ended (Unaudited) December 31, 2023 | | Years ended June 30, 2023 | | 2022 | | 2021 | | 2020 | | 2019 |
Selected Per-Share Data | | | | | | | | | | | | |
| Net asset value, beginning of period | $ | 50.18 | $ | 42.65 | $ | 58.70 | $ | 45.22 | $ | 37.74 | $ | 35.75 |
| Income from Investment Operations | | | | | | | | | | | | |
Net investment income (loss) A,B | | (.01) | | .18 | | (.07) | | (.07) | | .03 | | .04 |
| Net realized and unrealized gain (loss) | | 5.06 | | 8.84 | | (8.48) | | 18.53 | | 9.15 | | 3.51 |
| Total from investment operations | | 5.05 | | 9.02 | | (8.55) | | 18.46 | | 9.18 | | 3.55 |
| Distributions from net investment income | | (.03) | | (.01) | | (.13) | | (.01) | | (.02) | | (.06) |
| Distributions from net realized gain | | (1.35) | | (1.48) | | (7.37) | | (4.98) | | (1.68) | | (1.50) |
| Total distributions | | (1.37) C | | (1.49) | | (7.50) | | (4.98) C | | (1.70) | | (1.56) |
| Net asset value, end of period | $ | 53.86 | $ | 50.18 | $ | 42.65 | $ | 58.70 | $ | 45.22 | $ | 37.74 |
Total Return D,E | | 10.35% | | 21.46% | | (17.10)% | | 43.10% | | 25.33% | | 10.33% |
Ratios to Average Net Assets B,F,G | | | | | | | | | | | | |
| Expenses before reductions | | .70% H,I | | .83% | | .77% | | .79% | | .79% | | .77% |
| Expenses net of fee waivers, if any | | .69% H,I | | .83% | | .77% | | .79% | | .79% | | .77% |
| Expenses net of all reductions | | .69% H,I | | .83% | | .77% | | .78% | | .78% | | .76% |
| Net investment income (loss) | | (.03)% H,I | | .40% | | (.14)% | | (.12)% | | .06% | | .11% |
| Supplemental Data | | | | | | | | | | | | |
| Net assets, end of period (in millions) | $ | 3,805 | $ | 3,073 | $ | 2,339 | $ | 2,944 | $ | 2,094 | $ | 1,707 |
Portfolio turnover rate J | | 30% I | | 53% | | 45% | | 51% | | 54% | | 49% |
ACalculated based on average shares outstanding during the period.
BNet investment income (loss) is affected by the timing of the declaration of dividends by any underlying mutual funds or exchange-traded funds (ETFs). Net investment income (loss) of any mutual funds or ETFs is not included in the Fund's net investment income (loss) ratio.
CTotal distributions per share do not sum due to rounding.
DTotal returns for periods of less than one year are not annualized.
ETotal returns would have been lower if certain expenses had not been reduced during the applicable periods shown.
FFees and expenses of any underlying mutual funds or exchange-traded funds (ETFs) are not included in the Fund's expense ratio. The Fund indirectly bears its proportionate share of these expenses. For additional expense information related to investments in Fidelity Central Funds, please refer to the "Investments in Fidelity Central Funds" note found in the Notes to Financial Statements section of the most recent Annual or Semi-Annual report.
GExpense ratios reflect operating expenses of the class. Expenses before reductions do not reflect amounts reimbursed, waived, or reduced through arrangements with the investment adviser, brokerage services, or other offset arrangements, if applicable, and do not represent the amount paid by the class during periods when reimbursements, waivers or reductions occur.
HProxy expenses are not annualized.
IAnnualized.
JAmount does not include the portfolio activity of any underlying mutual funds or exchange-traded funds (ETFs).
| Fidelity® Growth Discovery Fund Class K |
| |
| | Six months ended (Unaudited) December 31, 2023 | | Years ended June 30, 2023 | | 2022 | | 2021 | | 2020 | | 2019 |
Selected Per-Share Data | | | | | | | | | | | | |
| Net asset value, beginning of period | $ | 50.29 | $ | 42.71 | $ | 58.78 | $ | 45.27 | $ | 37.78 | $ | 35.78 |
| Income from Investment Operations | | | | | | | | | | | | |
Net investment income (loss) A,B | | .02 | | .22 | | (.02) | | (.02) | | .06 | | .08 |
| Net realized and unrealized gain (loss) | | 5.06 | | 8.87 | | (8.50) | | 18.56 | | 9.17 | | 3.52 |
| Total from investment operations | | 5.08 | | 9.09 | | (8.52) | | 18.54 | | 9.23 | | 3.60 |
| Distributions from net investment income | | (.08) | | (.03) | | (.16) | | (.03) | | (.06) | | (.10) |
| Distributions from net realized gain | | (1.35) | | (1.48) | | (7.40) | | (5.00) | | (1.68) | | (1.50) |
| Total distributions | | (1.42) C | | (1.51) | | (7.55) C | | (5.03) | | (1.74) | | (1.60) |
| Net asset value, end of period | $ | 53.95 | $ | 50.29 | $ | 42.71 | $ | 58.78 | $ | 45.27 | $ | 37.78 |
Total Return D,E | | 10.38% | | 21.61% | | (17.04)% | | 43.25% | | 25.46% | | 10.47% |
Ratios to Average Net Assets B,F,G | | | | | | | | | | | | |
| Expenses before reductions | | .60% H,I | | .73% | | .68% | | .69% | | .69% | | .66% |
| Expenses net of fee waivers, if any | | .59% H,I | | .72% | | .68% | | .69% | | .69% | | .66% |
| Expenses net of all reductions | | .59% H,I | | .72% | | .68% | | .69% | | .68% | | .66% |
| Net investment income (loss) | | .07% H,I | | .50% | | (.05)% | | (.03)% | | .17% | | .22% |
| Supplemental Data | | | | | | | | | | | | |
| Net assets, end of period (in millions) | $ | 440 | $ | 380 | $ | 430 | $ | 430 | $ | 316 | $ | 366 |
Portfolio turnover rate J | | 30% I | | 53% | | 45% | | 51% | | 54% | | 49% |
ACalculated based on average shares outstanding during the period.
BNet investment income (loss) is affected by the timing of the declaration of dividends by any underlying mutual funds or exchange-traded funds (ETFs). Net investment income (loss) of any mutual funds or ETFs is not included in the Fund's net investment income (loss) ratio.
CTotal distributions per share do not sum due to rounding.
DTotal returns for periods of less than one year are not annualized.
ETotal returns would have been lower if certain expenses had not been reduced during the applicable periods shown.
FFees and expenses of any underlying mutual funds or exchange-traded funds (ETFs) are not included in the Fund's expense ratio. The Fund indirectly bears its proportionate share of these expenses. For additional expense information related to investments in Fidelity Central Funds, please refer to the "Investments in Fidelity Central Funds" note found in the Notes to Financial Statements section of the most recent Annual or Semi-Annual report.
GExpense ratios reflect operating expenses of the class. Expenses before reductions do not reflect amounts reimbursed, waived, or reduced through arrangements with the investment adviser, brokerage services, or other offset arrangements, if applicable, and do not represent the amount paid by the class during periods when reimbursements, waivers or reductions occur.
HProxy expenses are not annualized.
IAnnualized.
JAmount does not include the portfolio activity of any underlying mutual funds or exchange-traded funds (ETFs).
For the period ended December 31, 2023
(Amounts in thousands except percentages)
1. Organization.
Fidelity Growth Discovery Fund (the Fund) is a non-diversified fund of Fidelity Hastings Street Trust (the Trust) and is authorized to issue an unlimited number of shares. The Trust is registered under the Investment Company Act of 1940, as amended (the 1940 Act), as an open-end management investment company organized as a Massachusetts business trust. The Fund offers Growth Discovery and Class K shares, each of which has equal rights as to assets and voting privileges. Each class has exclusive voting rights with respect to matters that affect that class.
2. Investments in Fidelity Central Funds.
Funds may invest in Fidelity Central Funds, which are open-end investment companies generally available only to other investment companies and accounts managed by the investment adviser and its affiliates. The Schedule of Investments lists any Fidelity Central Funds held as an investment as of period end, but does not include the underlying holdings of each Fidelity Central Fund. An investing fund indirectly bears its proportionate share of the expenses of the underlying Fidelity Central Funds.
Based on its investment objective, each Fidelity Central Fund may invest or participate in various investment vehicles or strategies that are similar to those of the investing fund. These strategies are consistent with the investment objectives of the investing fund and may involve certain economic risks which may cause a decline in value of each of the Fidelity Central Funds and thus a decline in the value of the investing fund.
| Fidelity Central Fund | Investment Manager | Investment Objective | Investment Practices | Expense RatioA |
| Fidelity Money Market Central Funds | Fidelity Management & Research Company LLC (FMR) | Each fund seeks to obtain a high level of current income consistent with the preservation of capital and liquidity. | Short-term Investments | Less than .005% |
A Expenses expressed as a percentage of average net assets and are as of each underlying Central Fund's most recent annual or semi-annual shareholder report.
A complete unaudited list of holdings for each Fidelity Central Fund is available upon request or at the Securities and Exchange Commission website at www.sec.gov. In addition, the financial statements of the Fidelity Central Funds which contain the significant accounting policies (including investment valuation policies) of those funds, and are not covered by the Report of Independent Registered Public Accounting Firm, are available on the Securities and Exchange Commission website or upon request.
3. Significant Accounting Policies.
The Fund is an investment company and applies the accounting and reporting guidance of the Financial Accounting Standards Board (FASB) Accounting Standards Codification Topic 946 Financial Services - Investment Companies. The financial statements have been prepared in conformity with accounting principles generally accepted in the United States of America (GAAP), which require management to make certain estimates and assumptions at the date of the financial statements. Actual results could differ from those estimates. Subsequent events, if any, through the date that the financial statements were issued have been evaluated in the preparation of the financial statements. The Fund's Schedule of Investments lists any underlying mutual funds or exchange-traded funds (ETFs) but does not include the underlying holdings of these funds. The following summarizes the significant accounting policies of the Fund:
Investment Valuation. Investments are valued as of 4:00 p.m. Eastern time on the last calendar day of the period. The Board of Trustees (the Board) has designated the Fund's investment adviser as the valuation designee responsible for the fair valuation function and performing fair value determinations as needed. The investment adviser has established a Fair Value Committee (the Committee) to carry out the day-to-day fair valuation responsibilities and has adopted policies and procedures to govern the fair valuation process and the activities of the Committee. In accordance with these fair valuation policies and procedures, which have been approved by the Board, the Fund attempts to obtain prices from one or more third party pricing services or brokers to value its investments. When current market prices, quotations or currency exchange rates are not readily available or reliable, investments will be fair valued in good faith by the Committee, in accordance with the policies and procedures. Factors used in determining fair value vary by investment type and may include market or investment specific events, transaction data, estimated cash flows, and market observations of comparable investments. The frequency that the fair valuation procedures are used cannot be predicted and they may be utilized to a significant extent. The Committee manages the Fund's fair valuation practices and maintains the fair valuation policies and procedures. The Fund's investment adviser reports to the Board information regarding the fair valuation process and related material matters.
The Fund categorizes the inputs to valuation techniques used to value its investments into a disclosure hierarchy consisting of three levels as shown below:
Level 1 - unadjusted quoted prices in active markets for identical investments
Level 2 - other significant observable inputs (including quoted prices for similar investments, interest rates, prepayment speeds, etc.)
Level 3 - unobservable inputs (including the Fund's own assumptions based on the best information available)
Valuation techniques used to value the Fund's investments by major category are as follows:
Equity securities, including restricted securities, for which market quotations are readily available, are valued at the last reported sale price or official closing price as reported by a third party pricing service on the primary market or exchange on which they are traded and are categorized as Level 1 in the hierarchy. In the event there were no sales during the day or closing prices are not available, securities are valued at the last quoted bid price or may be valued using the last available price and are generally categorized as Level 2 in the hierarchy. For foreign equity securities, when market or security specific events arise, comparisons to the valuation of American Depositary Receipts (ADRs), futures contracts, ETFs and certain indexes as well as quoted prices for similar securities may be used and would be categorized as Level 2 in the hierarchy. For equity securities, including restricted securities, where observable inputs are limited, assumptions about market activity and risk are used and these securities may be categorized as Level 3 in the hierarchy.
Debt securities, including restricted securities, are valued based on evaluated prices received from third party pricing services or from brokers who make markets in such securities. Corporate bonds and preferred securities are valued by pricing services who utilize matrix pricing which considers yield or price of bonds of comparable quality, coupon, maturity and type or by broker-supplied prices. When independent prices are unavailable or unreliable, debt securities may be valued utilizing pricing methodologies which consider similar factors that would be used by third party pricing services. Debt securities are generally categorized as Level 2 in the hierarchy but may be Level 3 depending on the circumstances.
Investments in open-end mutual funds, including the Fidelity Central Funds, are valued at their closing net asset value (NAV) each business day and are categorized as Level 1 in the hierarchy.
Changes in valuation techniques may result in transfers in or out of an assigned level within the disclosure hierarchy. The aggregate value of investments by input level as of December 31, 2023 is included at the end of the Fund's Schedule of Investments.
Foreign Currency. Certain Funds may use foreign currency contracts to facilitate transactions in foreign-denominated securities. Gains and losses from these transactions may arise from changes in the value of the foreign currency or if the counterparties do not perform under the contracts' terms.
Foreign-denominated assets, including investment securities, and liabilities are translated into U.S. dollars at the exchange rates at period end. Purchases and sales of investment securities, income and dividends received, and expenses denominated in foreign currencies are translated into U.S. dollars at the exchange rate in effect on the transaction date.
The effects of exchange rate fluctuations on investments are included with the net realized and unrealized gain (loss) on investment securities. Other foreign currency transactions resulting in realized and unrealized gain (loss) are disclosed separately.
Investment Transactions and Income. For financial reporting purposes, the Fund's investment holdings and NAV include trades executed through the end of the last business day of the period. The NAV per share for processing shareholder transactions is calculated as of the close of business of the New York Stock Exchange (NYSE) normally 4:00 p.m. Eastern time and includes trades executed through the end of the prior business day. Gains and losses on securities sold are determined on the basis of identified cost and include proceeds received from litigation. Commissions paid to certain brokers with whom the investment adviser, or its affiliates, places trades on behalf of a fund include an amount in addition to trade execution, which may be rebated back to a fund. Any such rebates are included in net realized gain (loss) on investments in the Statement of Operations. Dividend income is recorded on the ex-dividend date except for certain dividends from foreign securities where the ex-dividend date may have passed, which are recorded as soon as the Fund is informed of the ex-dividend date. Non-cash dividends included in dividend income, if any, are recorded at the fair market value of the securities received. Income and capital gain distributions from Fidelity Central Funds, if any, are recorded on the ex-dividend date. Certain distributions received by the Fund represent a return of capital or capital gain. The Fund determines the components of these distributions subsequent to the ex-dividend date, based upon receipt of tax filings or other correspondence relating to the underlying investment. These distributions are recorded as a reduction of cost of investments and/or as a realized gain. Investment income is recorded net of foreign taxes withheld where recovery of such taxes is uncertain. Funds may file withholding tax reclaims in certain jurisdictions to recover a portion of amounts previously withheld. Any withholding tax reclaims income is included in the Statement of Operations in dividends. Any receivables for withholding tax reclaims are included in the Statement of Assets and Liabilities in dividends receivable.
Class Allocations and Expenses. Investment income, realized and unrealized capital gains and losses, common expenses of a fund, and certain fund-level expense reductions, if any, are allocated daily on a pro-rata basis to each class based on the relative net assets of each class to the total net assets of a fund. Each class differs with respect to transfer agent and distribution and service plan fees incurred, as applicable. Certain expense reductions may also differ by class, if applicable. For the reporting period, the allocated portion of income and expenses to each class as a percent of its average net assets may vary due to the timing of recording these transactions in relation to fluctuating net assets of the classes. Expenses directly attributable to a fund are charged to that fund. Expenses attributable to more than one fund are allocated among the respective funds on the basis of relative net assets or other appropriate methods. Expenses included in the accompanying financial statements reflect the expenses of that fund and do not include any expenses associated with any underlying mutual funds or exchange-traded funds (ETFs). Although not included in a fund's expenses, a fund indirectly bears its proportionate share of these expenses through the net asset value of each underlying mutual fund or exchange-traded fund (ETF). Expense estimates are accrued in the period to which they relate and adjustments are made when actual amounts are known.
Income Tax Information and Distributions to Shareholders. Each year, the Fund intends to qualify as a regulated investment company under Subchapter M of the Internal Revenue Code, including distributing substantially all of its taxable income and realized gains. As a result, no provision for U.S. Federal income taxes is required. The Fund files a U.S. federal tax return, in addition to state and local tax returns as required. The Fund's federal income tax returns are subject to examination by the Internal Revenue Service (IRS) for a period of three fiscal years after they are filed. State and local tax returns may be subject to examination for an additional fiscal year depending on the jurisdiction. Foreign taxes are provided for based on the Fund's understanding of the tax rules and rates that exist in the foreign markets in which it invests. The Fund is subject to a tax imposed on capital gains by certain countries in which it invests. An estimated deferred tax liability for net unrealized appreciation on the applicable securities is included in Other payables and accrued expenses on the Statement of Assets & Liabilities.
Distributions are declared and recorded on the ex-dividend date. Income and capital gain distributions are declared separately for each class. Income and capital gain distributions are determined in accordance with income tax regulations, which may differ from GAAP.
Capital accounts within the financial statements are adjusted for permanent book-tax differences. These adjustments have no impact on net assets or the results of operations. Capital accounts are not adjusted for temporary book-tax differences which will reverse in a subsequent period.
Book-tax differences are primarily due to foreign currency transactions, certain foreign taxes, passive foreign investment companies (PFIC), partnerships and losses deferred due to wash sales and excise tax regulations.
As of period end, the cost and unrealized appreciation (depreciation) in securities, and derivatives if applicable, for federal income tax purposes were as follows:
| Gross unrealized appreciation | $1,598,684 |
| Gross unrealized depreciation | (50,751) |
| Net unrealized appreciation (depreciation) | $1,547,933 |
| Tax cost | $2,750,031 |
Restricted Securities (including Private Placements). Funds may invest in securities that are subject to legal or contractual restrictions on resale. These securities generally may be resold in transactions exempt from registration or to the public if the securities are registered. Disposal of these securities may involve time-consuming negotiations and expense, and prompt sale at an acceptable price may be difficult. Information regarding restricted securities held at period end is included at the end of the Schedule of Investments, if applicable.
4. Purchases and Sales of Investments.
Purchases and sales of securities, other than short-term securities and in-kind transactions, as applicable, are noted in the table below.
| | Purchases ($) | Sales ($) |
| Fidelity Growth Discovery Fund | 945,687 | 535,559 |
5. Fees and Other Transactions with Affiliates.
Management Fee. Fidelity Management & Research Company LLC (the investment adviser) and its affiliates provide the Fund with investment management related services for which the Fund pays a monthly management fee. The management fee is the sum of an individual fund fee rate that is based on an annual rate of .30% of the Fund's average net assets and an annualized group fee rate that averaged .22% during the period. The group fee rate is based upon the monthly average net assets of a group of registered investment companies with which the investment adviser has management contracts. The group fee rate decreases as assets under management increase and increases as assets under management decrease. In addition, the management fee is subject to a performance adjustment (up to a maximum of +/- .20% of the Fund's average net assets over a 36 month performance period). The upward or downward adjustment to the management fee is based on the relative investment performance of Growth Discovery as compared to its benchmark index, the Russell 3000 Growth Index, over the same 36 month performance period. For the reporting period, the total annualized management fee rate, including the performance adjustment, was .52% of the Fund's average net assets. The performance adjustment included in the management fee rate may be higher or lower than the maximum performance adjustment rate due to the difference between the average net assets for the reporting and performance periods.
Transfer Agent Fees. Fidelity Investments Institutional Operations Company LLC (FIIOC), an affiliate of the investment adviser, is the transfer, dividend disbursing and shareholder servicing agent for each class of the Fund.
During November 2023, the Board approved a change in the transfer agent fees effective December 1, 2023 to a fixed annual rate of class-level average net assets as follows:
| | % of Class-Level Average Net Assets |
| Growth Discovery | 0.1411 |
Prior to December 1, 2023, FIIOC received account fees and asset-based fees that varied according to the account size and type of account of the shareholders of Growth Discovery, except for Class K. FIIOC received an asset-based fee of Class K's average net assets. FIIOC pays for typesetting, printing and mailing of shareholder reports, except proxy statements.
For the period, transfer agent fees for each class were as follows:
| | Amount | % of Class-Level Average Net AssetsA |
| | | |
| Growth Discovery | $2,312 | .14 |
| Class K | 83 | .04 |
| | $2,395 | |
A Annualized
Accounting Fees. Fidelity Service Company, Inc. (FSC), an affiliate of the investment adviser, maintains the Fund's accounting records.
During November 2023, the Board approved a change in the accounting fees effective December 1, 2023 to a fixed annual rate of average net assets as follows:
| | % of Average Net Assets |
| Fidelity Growth Discovery Fund | 0.0255% |
Prior to December 1, 2023, the accounting fee was based on the level of average net assets for each month. For the period, the fees were equivalent to the following annualized rates:
| | % of Average Net Assets |
| Fidelity Growth Discovery Fund | .03 |
Subsequent Event - Management Fee. Effective March 1, 2024, the Fund's management contract will be amended to incorporate administrative services previously covered under separate services agreements (Transfer Agent and Accounting agreements). The amended contract incorporates a basic fee rate that may vary by class (subject to a performance adjustment). The investment adviser or an affiliate will pay certain expenses of managing and operating the Fund out of each class's management fee.
Each class of the Fund will pay a management fee to the investment adviser. The management fee will be calculated and paid to the investment adviser every month.
The management fee will be determined by calculating a basic fee and then applying a performance adjustment.
When determining a class's basic fee, a mandate rate will be calculated based on the monthly average net assets of a group of funds advised by FMR within a designated asset class. A discount rate will be subtracted from the mandate rate once the Fund's monthly average net assets reach a certain level. The mandate rate and discount rate may vary by class.
The annual basic fee rate for a class of shares of the Fund will be the lesser of (1) the class's mandate rate reduced by the class's discount rate (if applicable) or (2) the amount set forth in the following table.
| | Maximum Management Fee Rate % |
| Growth Discovery | 0.66 |
| Class K | 0.56 |
One-twelfth of the basic fee rate for a class will be applied to the average net assets of the class for the month, giving a dollar amount which is the basic fee for the class for that month.
The performance adjustment rate will be calculated monthly by comparing over the performance period the Fund's performance to that of the performance adjustment index listed below.
| | Performance Adjustment Index |
| Growth Discovery | Russell 3000 Growth Index |
For the purposes of calculating the performance adjustment for the Fund, the Fund's investment performance will be based on the performance of Growth Discovery. To the extent that other classes of the Fund have higher expenses, this could result in those classes bearing a larger positive performance adjustment and smaller negative performance adjustment than would be the case if each class's own performance were considered.
The performance period is the most recent 36 month period.
For the Fund, each percentage point of difference, calculated to the nearest .01% (up to a maximum difference of ±10.00), is multiplied by a performance adjustment rate of .02%. The maximum annualized performance adjustment rate will be ± .20% of the Fund's average net assets over the performance period. The performance adjustment rate will be divided by twelve and multiplied by the Fund's average net assets over the performance period, and the resulting dollar amount will be proportionately added to or subtracted from a class's basic fee.
A different management fee rate may be applicable to each class of the Fund. The difference between classes is the result of separate arrangements for class-level services and/or waivers of certain expenses. It is not the result of any difference in advisory or custodial fees or other expenses related to the management of the Fund's assets, which do not vary by class.
Effective March 1, 2024, the Fund's sub-advisory agreements with FMR Investment Management (UK) Limited, Fidelity Management & Research (Hong Kong) Limited, and Fidelity Management & Research (Japan) Limited will be amended to provide that the investment adviser will pay each sub-adviser monthly fees equal to 110% of the sub-adviser's costs for providing sub-advisory services.
Brokerage Commissions. A portion of portfolio transactions were placed with brokerage firms which are affiliates of the investment adviser. Brokerage commissions are included in net realized gain (loss) and change in net unrealized appreciation (depreciation) in the Statement of Operations. The commissions paid to these affiliated firms were as follows:
| | Amount |
| Fidelity Growth Discovery Fund | $7 |
Interfund Trades. Funds may purchase from or sell securities to other Fidelity Funds under procedures adopted by the Board. The procedures have been designed to ensure these interfund trades are executed in accordance with Rule 17a-7 of the 1940 Act. Any interfund trades are included within the respective purchases and sales amounts shown in the Purchases and Sales of Investments note. Interfund trades during the period are noted in the table below.
| | Purchases ($) | Sales ($) | Realized Gain (Loss) ($) |
| Fidelity Growth Discovery Fund | 85,772 | 19,045 | (4,344) |
6. Committed Line of Credit.
Certain Funds participate with other funds managed by the investment adviser or an affiliate in a $4.25 billion credit facility (the "line of credit") to be utilized for temporary or emergency purposes to fund shareholder redemptions or for other short-term liquidity purposes. The participating funds have agreed to pay commitment fees on their pro-rata portion of the line of credit, which are reflected in Miscellaneous expenses on the Statement of Operations, and are listed below. During the period, there were no borrowings on this line of credit.
| | Amount |
| Fidelity Growth Discovery Fund | $3 |
7. Security Lending.
Funds lend portfolio securities from time to time in order to earn additional income. Lending agents are used, including National Financial Services (NFS), an affiliate of the investment adviser. Pursuant to a securities lending agreement, NFS will receive a fee, which is capped at 9.9% of a fund's daily lending revenue, for its services as lending agent. A fund may lend securities to certain qualified borrowers, including NFS. On the settlement date of the loan, a fund receives collateral (in the form of U.S. Treasury obligations, letters of credit and/or cash) against the loaned securities and maintains collateral in an amount not less than 100% of the market value of the loaned securities during the period of the loan. The market value of the loaned securities is determined at the close of business of a fund and any additional required collateral is delivered to a fund on the next business day. A fund or borrower may terminate the loan at any time, and if the borrower defaults on its obligation to return the securities loaned because of insolvency or other reasons, a fund may apply collateral received from the borrower against the obligation. A fund may experience delays and costs in recovering the securities loaned. Any cash collateral received is invested in the Fidelity Securities Lending Cash Central Fund. Any loaned securities are identified as such in the Schedule of Investments, and the value of loaned securities and cash collateral at period end, as applicable, are presented in the Statement of Assets and Liabilities. Security lending income represents the income earned on investing cash collateral, less rebates paid to borrowers and any lending agent fees associated with the loan, plus any premium payments received for lending certain types of securities. Security lending income is presented in the Statement of Operations as a component of income from Fidelity Central Funds. Affiliated security lending activity, if any, was as follows:
| | Total Security Lending Fees Paid to NFS | Security Lending Income From Securities Loaned to NFS | Value of Securities Loaned to NFS at Period End |
| Fidelity Growth Discovery Fund | $12 | $1 | $422 |
8. Expense Reductions.
Through arrangements with the Fund's custodian, credits realized as a result of certain uninvested cash balances were used to reduce the Fund's expenses. During the period, custodian credits reduced the Fund's expenses by $1.
In addition, during the period the investment adviser or an affiliate reimbursed and/or waived a portion of fund-level operating expenses in the amount of $127.
9. Distributions to Shareholders.
Distributions to shareholders of each class were as follows:
| | Six months ended December 31, 2023 | Year ended June 30, 2023 |
| Fidelity Growth Discovery Fund | | |
| Distributions to shareholders | | |
| Growth Discovery | $85,127 | $82,690 |
| Class K | 10,756 | 15,346 |
Total | $95,883 | $98,036 |
10. Share Transactions.
Share transactions for each class were as follows and may contain in-kind transactions, automatic conversions between classes or exchanges between affiliated funds:
| | Shares | Shares | Dollars | Dollars |
| | Six months ended December 31, 2023 | Year ended June 30, 2023 | Six months ended December 31, 2023 | Year ended June 30, 2023 |
| Fidelity Growth Discovery Fund | | | | |
| Growth Discovery | | | | |
| Shares sold | 12,756 | 14,335 | $647,590 | $631,744 |
| Reinvestment of distributions | 1,573 | 1,665 | 77,139 | 76,651 |
| Shares redeemed | (4,909) | (9,599) | (245,501) | (418,829) |
| Net increase (decrease) | 9,420 | 6,401 | $479,228 | $289,566 |
| Class K | | | | |
| Shares sold | 1,060 | 4,349 | $53,397 | $188,046 |
| Reinvestment of distributions | 219 | 333 | 10,756 | 15,346 |
| Shares redeemed | (681) | (7,182) | (34,090) | (313,311) |
| Net increase (decrease) | 598 | (2,500) | $30,063 | $(109,919) |
11. Other.
A fund's organizational documents provide former and current trustees and officers with a limited indemnification against liabilities arising in connection with the performance of their duties to the fund. In the normal course of business, a fund may also enter into contracts that provide general indemnifications. A fund's maximum exposure under these arrangements is unknown as this would be dependent on future claims that may be made against a fund. The risk of material loss from such claims is considered remote.
12. Risk and Uncertainties.
Many factors affect a fund's performance. Developments that disrupt global economies and financial markets, such as pandemics, epidemics, outbreaks of infectious diseases, war, terrorism, and environmental disasters, may significantly affect a fund's investment performance. The effects of these developments to a fund will be impacted by the types of securities in which a fund invests, the financial condition, industry, economic sector, and geographic location of an issuer, and a fund's level of investment in the securities of that issuer. Significant concentrations in security types, issuers, industries, sectors, and geographic locations may magnify the factors that affect a fund's performance.
As a shareholder, you incur two types of costs: (1) transaction costs, which may include sales charges (loads) on purchase payments or redemption proceeds, as applicable and (2) ongoing costs, which generally include management fees, distribution and/or service (12b-1) fees and other Fund expenses. This Example is intended to help you understand your ongoing costs (in dollars) of investing in a fund and to compare these costs with the ongoing costs of investing in other mutual funds.
| The Example is based on an investment of $1,000 invested at the beginning of the period and held for the entire period (July 1, 2023 to December 31, 2023). |
Actual Expenses
The first line of the accompanying table provides information about actual account values and actual expenses. You may use the information in this line, together with the amount you invested, to estimate the expenses that you paid over the period. Simply divide your account value by $1,000.00 (for example, an $8,600 account value divided by $1,000.00 = 8.6), then multiply the result by the number in the first line for a class/Fund under the heading entitled "Expenses Paid During Period" to estimate the expenses you paid on your account during this period. If any fund is a shareholder of any underlying mutual funds or exchange-traded funds (ETFs) (the Underlying Funds), such fund indirectly bears its proportional share of the expenses of the Underlying Funds in addition to the direct expenses incurred presented in the table. These fees and expenses are not included in the annualized expense ratio used to calculate the expense estimate in the table below.
Hypothetical Example for Comparison Purposes
The second line of the accompanying table provides information about hypothetical account values and hypothetical expenses based on the actual expense ratio and an assumed rate of return of 5% per year before expenses, which is not the actual return. The hypothetical account values and expenses may not be used to estimate the actual ending account balance or expenses you paid for the period. You may use this information to compare the ongoing costs of investing in the Fund and other funds. To do so, compare this 5% hypothetical example with the 5% hypothetical examples that appear in the shareholder reports of the other funds. If any fund is a shareholder of any Underlying Funds, such fund indirectly bears its proportional share of the expenses of the Underlying Funds in addition to the direct expenses as presented in the table. These fees and expenses are not included in the annualized expense ratio used to calculate the expense estimate in the table below.
Please note that the expenses shown in the table are meant to highlight your ongoing costs only and do not reflect any transaction costs. Therefore, the second line of the table is useful in comparing ongoing costs only, and will not help you determine the relative total costs of owning different funds. In addition, if these transactional costs were included, your costs would have been higher.
| | | | | Annualized Expense Ratio- A | | Beginning Account Value July 1, 2023 | | Ending Account Value December 31, 2023 | | Expenses Paid During Period- C July 1, 2023 to December 31, 2023 |
| Fidelity® Growth Discovery Fund | | | | | | | | | | |
Fidelity® Growth Discovery Fund ** | | | | .69% | | | | | | |
| Actual | | | | | | $ 1,000 | | $ 1,103.50 | | $ 3.65 |
Hypothetical-B | | | | | | $ 1,000 | | $ 1,021.67 | | $ 3.51 |
Class K ** | | | | .59% | | | | | | |
| Actual | | | | | | $ 1,000 | | $ 1,103.80 | | $ 3.12 |
Hypothetical-B | | | | | | $ 1,000 | | $ 1,022.17 | | $ 3.00 |
| |
A Annualized expense ratio reflects expenses net of applicable fee waivers.
B 5% return per year before expenses
C Expenses are equal to the annualized expense ratio, multiplied by the average account value over the period, multiplied by 184/ 366 (to reflect the one-half year period). The fees and expenses of any Underlying Funds are not included in each annualized expense ratio.
** If fees and changes to the expense contract and/or expense cap, effective March 1, 2024, had been in effect during the current period, the restated annualized expense ratio and the expenses paid in the actual and hypothetical examples above would have been as shown in table below:
| | | | | Annualized Expense Ratio- A | | Expenses Paid |
| Fidelity® Growth Discovery Fund | | | | | | |
| Fidelity® Growth Discovery Fund | | | | .65% | | |
| Actual | | | | | | $ 3.44 |
Hypothetical- B | | | | | | $ 3.30 |
| Class K | | | | .56% | | |
| Actual | | | | | | $ 2.96 |
Hypothetical- B | | | | | | $ 2.85 |
| | | | | | | |
| A Annualized expense ratio reflects expenses net of applicable fee waivers. | | | | | | |
| B 5% return per year before expenses | | | | | | |
Board Approval of Investment Advisory Contracts and Management Fees
Fidelity Growth Discovery Fund
Each year, the Board of Trustees, including the Independent Trustees (together, the Board), considers the renewal of the fund's management contract with Fidelity Management & Research Company LLC (FMR) and the sub-advisory agreements (together, the Advisory Contracts) for the fund. FMR and the sub-advisers are referred to herein as the Investment Advisers. The Board, assisted by the advice of fund counsel and Independent Trustees' counsel, requests and considers a broad range of information relevant to the renewal of the Advisory Contracts throughout the year.
The Board meets regularly and, at each of its meetings, covers an extensive agenda of topics and materials and considers factors that are relevant to its annual consideration of the renewal of the fund's Advisory Contracts, including the services and support provided to the fund and its shareholders. The Board, acting directly and through its Committees (each of which is composed of and chaired by Independent Trustees), requests and receives information concerning the annual consideration of the renewal of the fund's Advisory Contracts. The Board also meets as needed to review matters specifically related to the Board's annual consideration of the renewal of the Advisory Contracts. Members of the Board may also meet with trustees of other Fidelity funds through joint ad hoc committees to discuss certain matters relevant to all of the Fidelity funds.
At its July 2023 meeting, the Board unanimously determined to renew the fund's Advisory Contracts. In reaching its determination, the Board considered all factors it believed relevant, including (i) the nature, extent, and quality of the services provided to the fund and its shareholders (including the investment performance of the fund); (ii) the competitiveness relative to peer funds of the fund's management fee and the total expense ratio of a representative class (the retail class, which was selected because it is the largest class); (iii) the total costs of the services provided by and the profits realized by FMR and its affiliates (Fidelity) from its relationships with the fund; and (iv) the extent to which, if any, economies of scale exist and are realized as the fund grows, and whether any economies of scale are appropriately shared with fund shareholders. The Board also considered the broad range of investment choices available to shareholders from FMR's competitors and that the fund's shareholders have chosen to invest in the fund, which is part of the Fidelity family of funds. The Board's decision to renew the Advisory Contracts was not based on any single factor.
The Board reached a determination, with the assistance of fund counsel and Independent Trustees' counsel and through the exercise of its business judgment, that the renewal of the Advisory Contracts was in the best interests of the fund and its shareholders and that the compensation payable under the Advisory Contracts was fair and reasonable in light of all of the surrounding circumstances.
Nature, Extent, and Quality of Services Provided. The Board considered staffing as it relates to the fund, including the backgrounds and experience of investment personnel of the Investment Advisers, and also considered the Investment Advisers' implementation of the fund's investment program. The Independent Trustees also had discussions with senior management of Fidelity's investment operations and investment groups. The Board considered the structure of the investment personnel compensation program and whether this structure provides appropriate incentives to act in the best interests of the fund. Additionally, the Board considered the portfolio managers' investments, if any, in the funds that they manage.
Resources Dedicated to Investment Management and Support Services. The Board and the Fund Oversight and Research Committees reviewed the general qualifications and capabilities of Fidelity's investment staff, including its size, education, experience, and resources, as well as Fidelity's approach to recruiting, training, managing, and compensating investment personnel. The Board noted the resources devoted to expansion of Fidelity's global investment organization, and that Fidelity's analysts have extensive resources, tools, and capabilities that allow them to conduct sophisticated quantitative and fundamental analysis, as well as credit analysis of issuers, counterparties, and guarantors. Further, the Board considered that Fidelity's investment professionals have sufficient access to global information and data so as to provide competitive investment results over time, and that those professionals also have access to sophisticated tools that permit them to assess portfolio construction and risk and performance attribution characteristics continuously, as well as to transmit new information and research conclusions rapidly around the world. Additionally, in its deliberations, the Board considered Fidelity's trading, risk management, compliance, and technology and operations capabilities and resources, which are integral parts of the investment management process.
Shareholder and Administrative Services. The Board considered (i) the nature, extent, quality, and cost of advisory, administrative, and shareholder services performed by the Investment Advisers and their affiliates under the Advisory Contracts and under separate agreements covering transfer agency, pricing and bookkeeping, and securities lending services for the fund; (ii) the nature and extent of Fidelity's supervision of third party service providers, principally custodians, subcustodians, and pricing vendors; and (iii) the resources devoted by Fidelity to, and the record of compliance with, the fund's compliance policies and procedures. The Board also reviewed the allocation of fund brokerage, including allocations to brokers affiliated with the Investment Advisers, the use of brokerage commissions to pay fund expenses, and the use of "soft" commission dollars to pay for research services. The Board also considered the fund's securities lending activities and any payments made to Fidelity relating to securities lending.
The Board noted that the growth of fund assets over time across the complex allows Fidelity to reinvest in the development of services designed to enhance the value and convenience of the Fidelity funds as investment vehicles. These services include 24-hour access to account information and market information over the Internet and through telephone representatives, investor education materials, and asset allocation tools. The Board also considered that it reviews customer service metrics such as telephone response times, continuity of services on the website and metrics addressing services at Fidelity Investor Centers.
Investment in a Large Fund Family. The Board considered the benefits to shareholders of investing in a fund that is part of a large family of funds offering a variety of investment disciplines and providing a large variety of fund investor services. The Board noted that Fidelity had taken, or had made recommendations that resulted in the Fidelity funds taking, a number of actions over the previous year that benefited particular funds and/or the Fidelity funds in general.
Investment Performance. The Board took into account discussions that occur with representatives of the Investment Advisers, and reports that it receives, at Board meetings throughout the year, relating to fund investment performance. In this regard the Board noted that as part of regularly scheduled fund reviews and other reports to the Board on fund performance, the Board considered annualized return information for the fund for different time periods, measured against an appropriate securities market index (benchmark index) and an appropriate peer group of funds with similar objectives (peer group). The Board also considered information about performance attribution. In its ongoing evaluation of fund investment performance, the Board gives particular attention to information indicating changes in performance of the funds over different time periods and discussed with the Investment Advisers the reasons for any overperformance or underperformance.
In addition to reviewing absolute and relative fund performance, the Independent Trustees periodically consider the appropriateness of fund performance metrics in evaluating the results achieved. The Independent Trustees generally give greater weight to fund performance over longer time periods than over shorter time periods. Depending on the circumstances, the Independent Trustees may be satisfied with a fund's performance notwithstanding that it lags its benchmark index or peer group for certain periods.
Based on its review, the Board concluded that the nature, extent, and quality of services provided to the fund under the Advisory Contracts should continue to benefit the shareholders of the fund.
Competitiveness of Management Fee and Total Expense Ratio. The Board was provided with information regarding industry trends in management fees and expenses. In its review of the fund's management fee and the total expense ratio of the retail class, the Board considered the fund's management fee rate as well as other fund or class expenses, as applicable, such as transfer agent fees, pricing and bookkeeping fees, and custodial, legal, and audit fees. The Board noted that Fidelity may agree to waive fees or reimburse expenses from time to time, and the extent to which, if any, it has done so for the fund. The Board also considered information about the impact of the fund's performance adjustment.
Comparisons of Management Fees and Total Expense Ratios. Among other things, the Board reviewed data for selected groups of competitive funds and classes (referred to as "mapped groups") that were compiled by Fidelity based on combining similar investment objective categories (as classified by Lipper) that have comparable investment mandates. The data reviewed by the Board included (i) gross management fee comparisons (before taking into account expense reimbursements or caps and without taking into account the fund's performance adjustment) relative to the total universe of funds within the mapped group; (ii) gross management fee comparisons relative to a subset of non-Fidelity funds in the mapped group that are similar in size and management fee structure to the fund (referred to as the "asset size peer group"); (iii) total expense comparisons of the retail class of the fund relative to funds and classes in the mapped group that have a similar sales load structure to the retail class of the fund (referred to as the "similar sales load structure group"); and (iv) total expense comparisons of the retail class of the fund relative to funds and classes in the similar sales load structure group that are similar in size and management fee structure to the fund (referred to as the "total expense asset size peer group"). The total expense asset size peer group comparison excludes performance adjustments and fund-paid 12b-1 fees to eliminate variability in fee structures.
The information provided to the Board indicated that the fund's management fee rate ranked below the competitive median of the mapped group for the 12-month period ended September 30, 2022 and below the competitive median of the asset size peer group for the 12-month period ended September 30, 2022. Further, the information provided to the Board indicated that the total expense ratio of the retail class of the fund ranked below the competitive median of the similar sales load structure group for the 12-month period ended September 30, 2022 and below the competitive median of the total expense asset size peer group for the 12-month period ended September 30, 2022.
The Board also considered that, for funds subject to the group fee, FMR agreed to voluntarily waive fees over a specified period of time in amounts designed to account for assets converted from certain funds to certain collective investment trusts.
The Board also considered that the fund's management fee is subject to upward or downward adjustment depending upon whether, and to what extent, the fund's investment performance for the performance period (a rolling 36-month period) exceeds, or is exceeded by, a securities index, thus leading to a performance adjustment for the same period. The Board noted that the performance adjustment provides FMR with a strong economic incentive to seek to achieve superior long-term performance for the fund's shareholders and helps to more closely align the interests of FMR and the shareholders of the fund.
In connection its consideration of the fund's performance adjustment, the Board noted that the performance of the retail class is used for purposes of determining the performance adjustment. The Board noted that to the extent the performance adjustment was based on the performance of a share class with higher total annual operating expenses, the fund would be subject to a smaller positive and larger negative performance adjustment. The Board considered the appropriateness of the use of the retail class as the basis for the performance adjustment. The Board noted that the retail class is typically the largest class (reflecting the actual investment experience for the plurality of shareholders), employs a standard expense structure, and does not include fund-paid 12b-1 fees, which Fidelity believes makes it a more appropriate measurement of Fidelity's investment skill.
Fees Charged to Other Fidelity Clients. The Board also considered Fidelity fee structures and other information with respect to clients of Fidelity, such as other funds advised or subadvised by Fidelity, pension plan clients, and other institutional clients with similar mandates. The Board noted that a joint ad hoc committee created by it and the boards of other Fidelity funds periodically reviews and compares Fidelity's institutional investment advisory business with its business of providing services to the Fidelity funds and also noted the most recent findings of the committee. The Board noted that the committee's review included a consideration of the differences in services provided, fees charged, and costs incurred, as well as competition in the markets serving the different categories of clients.
Based on its review, the Board concluded that the fund's management fee, including the use of the retail class as the basis for the performance adjustment, is fair and reasonable in light of the services that the fund receives and the other factors considered. Further, based on its review of total expense ratios and fees charged to other Fidelity clients, the Board concluded that the total expense ratio of each class of the fund was reasonable in light of the services that the fund and its shareholders receive and the other factors considered.
Costs of the Services and Profitability. The Board considered the revenues earned and the expenses incurred by Fidelity in conducting the business of developing, marketing, distributing, managing, administering and servicing the fund and servicing the fund's shareholders. The Board also considered the level of Fidelity's profits in respect of all the Fidelity funds.
On an annual basis, Fidelity presents to the Board information about the profitability of its relationships with the fund. Fidelity calculates profitability information for each fund, as well as aggregate profitability information for groups of Fidelity funds and all Fidelity funds, using a series of detailed revenue and cost allocation methodologies which originate with the books and records of Fidelity on which Fidelity's audited financial statements are based. The Audit Committee of the Board reviews any significant changes from the prior year's methodologies and the full Board approves such changes.
A public accounting firm has been engaged annually by the Board as part of the Board's assessment of Fidelity's profitability analysis. The engagement includes the review and assessment of the methodologies used by Fidelity in determining the revenues and expenses attributable to Fidelity's fund business, and completion of agreed-upon procedures in respect of the mathematical accuracy of certain fund profitability information and its conformity to established allocation methodologies. After considering the reports issued under the engagement and information provided by Fidelity, the Board concluded that while other allocation methods may also be reasonable, Fidelity's profitability methodologies are reasonable in all material respects.
The Board also reviewed Fidelity's non-fund businesses and potential indirect benefits such businesses may have received as a result of their association with Fidelity's fund business (i.e., fall-out benefits) as well as cases where Fidelity's affiliates may benefit from the funds' business. The Board considered areas where potential indirect benefits to the Fidelity funds from their relationships with Fidelity may exist. The Board's consideration of these matters was informed by the findings of a joint ad hoc committee created by it and the boards of other Fidelity funds to evaluate potential fall-out benefits.
The Board considered the costs of the services provided by and the profits realized by Fidelity in connection with the operation of the fund and was satisfied that the profitability was not excessive.
Economies of Scale. The Board considered whether there have been economies of scale in respect of the management of the Fidelity funds, whether the Fidelity funds (including the fund) have appropriately benefited from any such economies of scale, and whether there is potential for realization of any further economies of scale. The Board considered the extent to which the fund will benefit from economies of scale as assets grow through increased services to the fund, through waivers or reimbursements, or through fee or expense ratio reductions. The Board also noted that a committee (the Economies of Scale Committee) created by it and the boards of other Fidelity funds periodically analyzes whether Fidelity attains economies of scale in respect of the management and servicing of the Fidelity funds, whether the Fidelity funds have appropriately benefited from such economies of scale, and whether there is potential for realization of any further economies of scale.
The Board recognized that the fund's management contract incorporates a "group fee" structure, which provides for lower group fee rates as total "group assets" increase, and for higher group fee rates as total "group assets" decrease ("group assets" as defined in the management contract). FMR calculates the group fee rates based on a tiered asset "breakpoint" schedule that varies based on asset class. The Board considered that the group fee is designed to deliver the benefits of economies of scale to fund shareholders when total Fidelity fund assets increase, even if assets of any particular fund are unchanged or have declined, because some portion of Fidelity's costs are attributable to services provided to all Fidelity funds, and all funds benefit if those costs can be allocated among more assets. The Board further considered that Fidelity agreed to impose a temporary fee waiver in the form of additional breakpoints to the current breakpoint schedule. The Board concluded that, given the group fee structure, fund shareholders will benefit from lower management fees as "group assets" increase at the fund complex level, regardless of whether Fidelity achieves any such economies of scale.
The Board concluded, taking into account the analysis of the Economies of Scale Committee, that economies of scale, if any, are being appropriately shared between fund shareholders and Fidelity.
Additional Information Requested by the Board. In order to develop fully the factual basis for consideration of the Fidelity funds' advisory contracts, the Board requested and received additional information on certain topics, including: (i) fund flow and performance trends, in particular the underperformance of certain funds and strategies, and Fidelity's long-term strategies for certain funds, including any consideration of fund liquidations or mergers; (ii) the operation of performance fees and competitor use of performance fees; (iii) Fidelity's pricing philosophy compared to competitors; (iv) fund profitability methodology and data; (v) evaluation of competitive fund data and peer group classifications and fee and expense comparisons; (vi) the management fee and expense structures for different funds and classes and information about the differences between various fee and expense structures; (vii) group fee breakpoints and related voluntary fee waivers; and (viii) information regarding other accounts managed by Fidelity and the funds' sub-advisory arrangements.
Conclusion. Based on its evaluation of all of the conclusions noted above, and after considering all factors it believed relevant, the Board, including the Independent Trustees, concluded that the advisory and sub-advisory fee arrangements are fair and reasonable in light of all of the surrounding circumstances and that the fund's Advisory Contracts should be renewed through July 31, 2024.
| A special meeting of shareholders was held on April 19, 2023. The results of votes taken among shareholders on the proposal before them are reported below. Each vote reported represents one dollar of net asset value held on the record date for the meeting. |
| Proposal 1 |
| To reclassify the diversification status of the fund from diversified to non-diversified by eliminating the following fundamental policy: The fund may not with respect to 75% of fund's total assets, purchase the securities of any issuer (other than securities issued or guaranteed by the U.S. Government or any of its agencies or instrumentalities, or securities of other investment companies) if, as a result, (a) more than 5% of fund's total assets would be invested in the securities of that issuer, or (b) the fund would hold more than 10% of outstanding voting securities of issuer. |
| | # of Votes | % of Votes |
| Affirmative | 1,305,869,193.160 | 86.137 |
| Against | 155,973,443.790 | 10.288 |
| Abstain | 54,199,503.650 | 3.575 |
| TOTAL | 1,516,042,140.600 | 100.000 |
| | | |
1.714430.125
CII-SANN-0224
Fidelity® Fund
Semi-Annual Report
December 31, 2023
Contents
To view a fund's proxy voting guidelines and proxy voting record for the 12-month period ended June 30, visit http://www.fidelity.com/proxyvotingresults or visit the Securities and Exchange Commission's (SEC) web site at http://www.sec.gov.
You may also call 1-800-544-8544 if you're an individual investing directly with Fidelity, call 1-800-835-5092 if you're a plan sponsor or participant with Fidelity as your recordkeeper or call 1-877-208-0098 on institutional accounts or if you're an advisor or invest through one to request a free copy of the proxy voting guidelines.
Standard & Poor's, S&P and S&P 500 are registered service marks of The McGraw-Hill Companies, Inc. and have been licensed for use by Fidelity Distributors Corporation.
Other third-party marks appearing herein are the property of their respective owners.
All other marks appearing herein are registered or unregistered trademarks or service marks of FMR LLC or an affiliated company. © 2024 FMR LLC. All rights reserved.
This report and the financial statements contained herein are submitted for the general information of the shareholders of the Fund. This report is not authorized for distribution to prospective investors in the Fund unless preceded or accompanied by an effective prospectus.
A fund files its complete schedule of portfolio holdings with the SEC for the first and third quarters of each fiscal year on Form N-PORT. Forms N-PORT are available on the SEC's web site at http://www.sec.gov. A fund's Forms N-PORT may be reviewed and copied at the SEC's Public Reference Room in Washington, DC. Information regarding the operation of the SEC's Public Reference Room may be obtained by calling 1-800-SEC-0330.
For a complete list of a fund's portfolio holdings, view the most recent holdings listing, semiannual report, or annual report on Fidelity's web site at http://www.fidelity.com, http://www.institutional.fidelity.com, or http://www.401k.com, as applicable.
NOT FDIC INSURED •MAY LOSE VALUE •NO BANK GUARANTEE
Neither the Fund nor Fidelity Distributors Corporation is a bank.
Top Holdings (% of Fund's net assets) |
| |
| Microsoft Corp. | 11.5 | |
| Apple, Inc. | 9.8 | |
| Alphabet, Inc. Class A | 8.6 | |
| NVIDIA Corp. | 3.8 | |
| Amazon.com, Inc. | 2.6 | |
| UnitedHealth Group, Inc. | 2.5 | |
| Eli Lilly & Co. | 2.5 | |
| Costco Wholesale Corp. | 2.3 | |
| Broadcom, Inc. | 2.2 | |
| JPMorgan Chase & Co. | 1.8 | |
| | 47.6 | |
| |
| Market Sectors (% of Fund's net assets) |
| |
| Information Technology | 38.2 | |
| Health Care | 14.6 | |
| Communication Services | 11.1 | |
| Financials | 11.0 | |
| Consumer Discretionary | 7.8 | |
| Industrials | 7.6 | |
| Consumer Staples | 4.0 | |
| Energy | 3.5 | |
| Materials | 0.4 | |
| |
Asset Allocation (% of Fund's net assets) |
|
|
Showing Percentage of Net Assets
| Common Stocks - 98.2% |
| | | Shares | Value ($) (000s) |
| COMMUNICATION SERVICES - 11.1% | | | |
| Interactive Media & Services - 11.1% | | | |
| Alphabet, Inc.: | | | |
| Class A (a) | | 4,194,200 | 585,888 |
| Class C (a) | | 430,000 | 60,600 |
| Meta Platforms, Inc. Class A (a) | | 312,700 | 110,683 |
| | | | 757,171 |
| CONSUMER DISCRETIONARY - 7.8% | | | |
| Broadline Retail - 2.6% | | | |
| Amazon.com, Inc. (a) | | 1,179,700 | 179,244 |
| Hotels, Restaurants & Leisure - 0.1% | | | |
| Airbnb, Inc. Class A (a) | | 20,400 | 2,777 |
| Household Durables - 0.9% | | | |
| NVR, Inc. (a) | | 2,560 | 17,921 |
| PulteGroup, Inc. | | 429,000 | 44,281 |
| | | | 62,202 |
| Specialty Retail - 4.2% | | | |
| AutoZone, Inc. (a) | | 24,600 | 63,606 |
| Lowe's Companies, Inc. | | 243,400 | 54,169 |
| O'Reilly Automotive, Inc. (a) | | 66,400 | 63,085 |
| The Home Depot, Inc. | | 300,200 | 104,034 |
| | | | 284,894 |
TOTAL CONSUMER DISCRETIONARY | | | 529,117 |
| CONSUMER STAPLES - 4.0% | | | |
| Consumer Staples Distribution & Retail - 2.7% | | | |
| Costco Wholesale Corp. | | 240,300 | 158,617 |
| Walmart, Inc. | | 180,000 | 28,377 |
| | | | 186,994 |
| Household Products - 1.3% | | | |
| Procter & Gamble Co. | | 600,000 | 87,924 |
TOTAL CONSUMER STAPLES | | | 274,918 |
| ENERGY - 3.5% | | | |
| Energy Equipment & Services - 0.4% | | | |
| TechnipFMC PLC | | 1,468,530 | 29,576 |
| Oil, Gas & Consumable Fuels - 3.1% | | | |
| APA Corp. | | 1,061,600 | 38,090 |
| Cheniere Energy, Inc. | | 80,000 | 13,657 |
| Chevron Corp. | | 238,100 | 35,515 |
| Exxon Mobil Corp. | | 510,000 | 50,990 |
| Marathon Petroleum Corp. | | 300,000 | 44,508 |
| Occidental Petroleum Corp. | | 459,600 | 27,443 |
| | | | 210,203 |
TOTAL ENERGY | | | 239,779 |
| FINANCIALS - 11.0% | | | |
| Banks - 1.8% | | | |
| JPMorgan Chase & Co. | | 730,000 | 124,173 |
| Capital Markets - 3.6% | | | |
| Ameriprise Financial, Inc. | | 121,521 | 46,157 |
| Cboe Global Markets, Inc. | | 43,500 | 7,767 |
| Morgan Stanley | | 372,700 | 34,754 |
| MSCI, Inc. | | 186,559 | 105,527 |
| S&P Global, Inc. | | 111,000 | 48,898 |
| | | | 243,103 |
| Financial Services - 3.7% | | | |
| Apollo Global Management, Inc. | | 360,000 | 33,548 |
| MasterCard, Inc. Class A | | 232,300 | 99,078 |
| Visa, Inc. Class A | | 470,000 | 122,365 |
| | | | 254,991 |
| Insurance - 1.9% | | | |
| Arthur J. Gallagher & Co. | | 309,200 | 69,533 |
| Marsh & McLennan Companies, Inc. | | 270,400 | 51,233 |
| Progressive Corp. | | 57,200 | 9,111 |
| | | | 129,877 |
TOTAL FINANCIALS | | | 752,144 |
| HEALTH CARE - 14.6% | | | |
| Biotechnology - 2.3% | | | |
| Gilead Sciences, Inc. | | 112,300 | 9,097 |
| Moderna, Inc. (a) | | 66,300 | 6,594 |
| Regeneron Pharmaceuticals, Inc. (a) | | 91,200 | 80,100 |
| Vertex Pharmaceuticals, Inc. (a) | | 145,042 | 59,016 |
| | | | 154,807 |
| Health Care Equipment & Supplies - 1.5% | | | |
| Boston Scientific Corp. (a) | | 422,400 | 24,419 |
| DexCom, Inc. (a) | | 228,000 | 28,293 |
| Insulet Corp. (a) | | 27,727 | 6,016 |
| Intuitive Surgical, Inc. (a) | | 62,968 | 21,243 |
| ResMed, Inc. | | 152,000 | 26,147 |
| | | | 106,118 |
| Health Care Providers & Services - 4.5% | | | |
| Cardinal Health, Inc. | | 263,000 | 26,510 |
| Centene Corp. (a) | | 535,000 | 39,702 |
| McKesson Corp. | | 114,300 | 52,919 |
| Molina Healthcare, Inc. (a) | | 43,000 | 15,536 |
| UnitedHealth Group, Inc. | | 330,198 | 173,839 |
| | | | 308,506 |
| Life Sciences Tools & Services - 2.6% | | | |
| Danaher Corp. | | 350,500 | 81,085 |
| Mettler-Toledo International, Inc. (a) | | 6,400 | 7,763 |
| Thermo Fisher Scientific, Inc. | | 162,000 | 85,988 |
| | | | 174,836 |
| Pharmaceuticals - 3.7% | | | |
| Eli Lilly & Co. | | 291,412 | 169,870 |
| Merck & Co., Inc. | | 544,900 | 59,405 |
| Zoetis, Inc. Class A | | 112,580 | 22,220 |
| | | | 251,495 |
TOTAL HEALTH CARE | | | 995,762 |
| INDUSTRIALS - 7.6% | | | |
| Aerospace & Defense - 1.2% | | | |
| Howmet Aerospace, Inc. | | 588,700 | 31,860 |
| TransDigm Group, Inc. | | 46,200 | 46,736 |
| | | | 78,596 |
| Air Freight & Logistics - 0.2% | | | |
| FedEx Corp. | | 51,425 | 13,009 |
| Building Products - 0.8% | | | |
| Carrier Global Corp. | | 720,000 | 41,364 |
| Trane Technologies PLC | | 48,200 | 11,756 |
| | | | 53,120 |
| Commercial Services & Supplies - 0.3% | | | |
| Copart, Inc. | | 260,000 | 12,740 |
| Veralto Corp. | | 116,833 | 9,611 |
| | | | 22,351 |
| Construction & Engineering - 0.7% | | | |
| EMCOR Group, Inc. | | 72,100 | 15,533 |
| Quanta Services, Inc. | | 144,800 | 31,248 |
| | | | 46,781 |
| Electrical Equipment - 1.3% | | | |
| AMETEK, Inc. | | 103,900 | 17,132 |
| Eaton Corp. PLC | | 157,273 | 37,874 |
| nVent Electric PLC | | 459,000 | 27,122 |
| Vertiv Holdings Co. | | 155,200 | 7,454 |
| | | | 89,582 |
| Ground Transportation - 0.6% | | | |
| Old Dominion Freight Lines, Inc. | | 106,000 | 42,965 |
| Industrial Conglomerates - 0.4% | | | |
| General Electric Co. | | 217,964 | 27,819 |
| Machinery - 1.6% | | | |
| PACCAR, Inc. | | 463,000 | 45,212 |
| Parker Hannifin Corp. | | 139,500 | 64,268 |
| | | | 109,480 |
| Professional Services - 0.1% | | | |
| Verisk Analytics, Inc. | | 18,900 | 4,514 |
| Trading Companies & Distributors - 0.4% | | | |
| W.W. Grainger, Inc. | | 34,500 | 28,590 |
TOTAL INDUSTRIALS | | | 516,807 |
| INFORMATION TECHNOLOGY - 38.2% | | | |
| Communications Equipment - 0.1% | | | |
| Arista Networks, Inc. (a) | | 18,000 | 4,239 |
| Electronic Equipment, Instruments & Components - 0.9% | | | |
| Amphenol Corp. Class A | | 610,000 | 60,469 |
| IT Services - 0.6% | | | |
| Accenture PLC Class A | | 107,400 | 37,688 |
| Gartner, Inc. (a) | | 9,900 | 4,466 |
| | | | 42,154 |
| Semiconductors & Semiconductor Equipment - 10.2% | | | |
| Analog Devices, Inc. | | 267,000 | 53,016 |
| Broadcom, Inc. | | 137,000 | 152,926 |
| KLA Corp. | | 175,000 | 101,728 |
| Lam Research Corp. | | 106,100 | 83,104 |
| NVIDIA Corp. | | 521,900 | 258,455 |
| NXP Semiconductors NV | | 27,777 | 6,380 |
| ON Semiconductor Corp. (a) | | 523,000 | 43,686 |
| | | | 699,295 |
| Software - 16.6% | | | |
| Adobe, Inc. (a) | | 95,000 | 56,677 |
| Autodesk, Inc. (a) | | 85,589 | 20,839 |
| Cadence Design Systems, Inc. (a) | | 262,500 | 71,497 |
| Fortinet, Inc. (a) | | 1,173,000 | 68,656 |
| Microsoft Corp. | | 2,083,000 | 783,292 |
| Roper Technologies, Inc. | | 66,000 | 35,981 |
| Salesforce, Inc. (a) | | 248,800 | 65,469 |
| Synopsys, Inc. (a) | | 61,000 | 31,410 |
| | | | 1,133,821 |
| Technology Hardware, Storage & Peripherals - 9.8% | | | |
| Apple, Inc. | | 3,456,100 | 665,403 |
TOTAL INFORMATION TECHNOLOGY | | | 2,605,381 |
| MATERIALS - 0.4% | | | |
| Metals & Mining - 0.4% | | | |
| Steel Dynamics, Inc. | | 200,000 | 23,620 |
| TOTAL COMMON STOCKS (Cost $2,709,451) | | | 6,694,699 |
| | | | |
| Money Market Funds - 1.8% |
| | | Shares | Value ($) (000s) |
Fidelity Cash Central Fund 5.40% (b) (Cost $119,319) | | 119,297,058 | 119,321 |
| | | | |
| TOTAL INVESTMENT IN SECURITIES - 100.0% (Cost $2,828,770) | 6,814,020 |
NET OTHER ASSETS (LIABILITIES) - 0.0% | 2,076 |
| NET ASSETS - 100.0% | 6,816,096 |
| | |
Any values shown as $0 in the Schedule of Investments may reflect amounts less than $500.
Legend
| (b) | Affiliated fund that is generally available only to investment companies and other accounts managed by Fidelity Investments. The rate quoted is the annualized seven-day yield of the fund at period end. A complete unaudited listing of the fund's holdings as of its most recent quarter end is available upon request. In addition, each Fidelity Central Fund's financial statements are available on the SEC's website or upon request. |
Affiliated Central Funds
Fiscal year to date information regarding the Fund's investments in Fidelity Central Funds, including the ownership percentage, is presented below.
| Affiliate (Amounts in thousands) | Value, beginning of period ($) | Purchases ($) | Sales Proceeds ($) | Dividend Income ($) | Realized Gain (loss) ($) | Change in Unrealized appreciation (depreciation) ($) | Value, end of period ($) | % ownership, end of period |
| Fidelity Cash Central Fund 5.40% | 155,558 | 678,666 | 714,903 | 2,820 | - | - | 119,321 | 0.3% |
| Fidelity Securities Lending Cash Central Fund 5.40% | - | 45,131 | 45,131 | 12 | - | - | - | 0.0% |
| Total | 155,558 | 723,797 | 760,034 | 2,832 | - | - | 119,321 | |
| | | | | | | | | |
Amounts in the dividend income column in the above table include any capital gain distributions from underlying funds, which are presented in the corresponding line item in the Statement of Operations, if applicable.
Amounts in the dividend income column for Fidelity Securities Lending Cash Central Fund represents the income earned on investing cash collateral, less rebates paid to borrowers and any lending agent fees associated with the loan, plus any premium payments received for lending certain types of securities.
Amounts included in the purchases and sales proceeds columns may include in-kind transactions, if applicable.
Investment Valuation
The following is a summary of the inputs used, as of December 31, 2023, involving the Fund's assets and liabilities carried at fair value. The inputs or methodology used for valuing securities may not be an indication of the risk associated with investing in those securities. For more information on valuation inputs, and their aggregation into the levels used below, please refer to the Investment Valuation section in the accompanying Notes to Financial Statements.
| Valuation Inputs at Reporting Date: |
Description (Amounts in thousands) | Total ($) | Level 1 ($) | Level 2 ($) | Level 3 ($) |
Investments in Securities: | | | | |
|
| Equities: | | | | |
Communication Services | 757,171 | 757,171 | - | - |
Consumer Discretionary | 529,117 | 529,117 | - | - |
Consumer Staples | 274,918 | 274,918 | - | - |
Energy | 239,779 | 239,779 | - | - |
Financials | 752,144 | 752,144 | - | - |
Health Care | 995,762 | 995,762 | - | - |
Industrials | 516,807 | 516,807 | - | - |
Information Technology | 2,605,381 | 2,605,381 | - | - |
Materials | 23,620 | 23,620 | - | - |
|
| Money Market Funds | 119,321 | 119,321 | - | - |
| Total Investments in Securities: | 6,814,020 | 6,814,020 | - | - |
| Statement of Assets and Liabilities |
| Amounts in thousands (except per-share amounts) | | | | December 31, 2023 (Unaudited) |
| | | | | |
| Assets | | | | |
| Investment in securities, at value - See accompanying schedule: | | | | |
Unaffiliated issuers (cost $2,709,451) | $ | 6,694,699 | | |
Fidelity Central Funds (cost $119,319) | | 119,321 | | |
| | | | | |
| | | | | |
| Total Investment in Securities (cost $2,828,770) | | | $ | 6,814,020 |
| Receivable for investments sold | | | | 3,637 |
| Receivable for fund shares sold | | | | 2,601 |
| Dividends receivable | | | | 7,021 |
| Distributions receivable from Fidelity Central Funds | | | | 495 |
| Prepaid expenses | | | | 6 |
| Other receivables | | | | 45 |
Total assets | | | | 6,827,825 |
| Liabilities | | | | |
| Payable to custodian bank | $ | 35 | | |
| Payable for investments purchased | | 5,381 | | |
| Payable for fund shares redeemed | | 3,715 | | |
| Accrued management fee | | 1,748 | | |
| Transfer agent fee payable | | 674 | | |
| Other affiliated payables | | 88 | | |
| Other payables and accrued expenses | | 88 | | |
| Total Liabilities | | | | 11,729 |
| Net Assets | | | $ | 6,816,096 |
| Net Assets consist of: | | | | |
| Paid in capital | | | $ | 2,801,268 |
| Total accumulated earnings (loss) | | | | 4,014,828 |
| Net Assets | | | $ | 6,816,096 |
| | | | | |
| Net Asset Value and Maximum Offering Price | | | | |
| Fidelity Fund : | | | | |
Net Asset Value, offering price and redemption price per share ($6,557,161 ÷ 88,034 shares) | | | $ | 74.48 |
| Class K : | | | | |
Net Asset Value, offering price and redemption price per share ($258,935 ÷ 3,476 shares)(a) | | | $ | 74.48 |
(a)Corresponding Net Asset Value does not calculate due to rounding of fractional net assets and/or shares. |
| Statement of Operations |
| Amounts in thousands | | | | Six months ended December 31, 2023 (Unaudited) |
| Investment Income | | | | |
| Dividends | | | $ | 34,855 |
| Income from Fidelity Central Funds (including $12 from security lending) | | | | 2,832 |
| Total Income | | | | 37,687 |
| Expenses | | | | |
| Management fee | $ | 10,029 | | |
| Transfer agent fees | | 3,891 | | |
| Accounting fees | | 511 | | |
| Custodian fees and expenses | | 26 | | |
| Independent trustees' fees and expenses | | 18 | | |
| Registration fees | | 43 | | |
| Audit | | 48 | | |
| Legal | | 17 | | |
| Miscellaneous | | 11 | | |
| Total expenses before reductions | | 14,594 | | |
| Expense reductions | | (234) | | |
| Total expenses after reductions | | | | 14,360 |
| Net Investment income (loss) | | | | 23,327 |
| Realized and Unrealized Gain (Loss) | | | | |
| Net realized gain (loss) on: | | | | |
| Investment Securities: | | | | |
| Unaffiliated issuers | | 78,992 | | |
| Redemptions in-kind | | 35,976 | | |
| Foreign currency transactions | | 18 | | |
| Total net realized gain (loss) | | | | 114,986 |
| Change in net unrealized appreciation (depreciation) on: | | | | |
| Investment Securities: | | | | |
| Unaffiliated issuers | | 444,405 | | |
| Assets and liabilities in foreign currencies | | (15) | | |
| Total change in net unrealized appreciation (depreciation) | | | | 444,390 |
| Net gain (loss) | | | | 559,376 |
| Net increase (decrease) in net assets resulting from operations | | | $ | 582,703 |
| Statement of Changes in Net Assets |
| |
| Amount in thousands | | Six months ended December 31, 2023 (Unaudited) | | Year ended June 30, 2023 |
| Increase (Decrease) in Net Assets | | | | |
| Operations | | | | |
| Net investment income (loss) | $ | 23,327 | $ | 42,099 |
| Net realized gain (loss) | | 114,986 | | 333,957 |
| Change in net unrealized appreciation (depreciation) | | 444,390 | | 800,751 |
| Net increase (decrease) in net assets resulting from operations | | 582,703 | | 1,176,807 |
| Distributions to shareholders | | (162,281) | | (38,569) |
| | | | | |
| Share transactions - net increase (decrease) | | 32,923 | | (917,156) |
| Total increase (decrease) in net assets | | 453,345 | | 221,082 |
| | | | | |
| Net Assets | | | | |
| Beginning of period | | 6,362,751 | | 6,141,669 |
| End of period | $ | 6,816,096 | $ | 6,362,751 |
| | | | | |
| | | | | |
Financial Highlights
| | Six months ended (Unaudited) December 31, 2023 | | Years ended June 30, 2023 | | 2022 | | 2021 | | 2020 | | 2019 |
Selected Per-Share Data | | | | | | | | | | | | |
| Net asset value, beginning of period | $ | 69.85 | $ | 58.06 | $ | 72.20 | $ | 54.21 | $ | 47.60 | $ | 46.86 |
| Income from Investment Operations | | | | | | | | | | | | |
Net investment income (loss) A,B | | .26 | | .44 | | .25 | | .28 | | .39 | | .46 |
| Net realized and unrealized gain (loss) | | 6.16 | | 11.74 | | (10.75) | | 19.40 | | 8.96 | | 3.26 |
| Total from investment operations | | 6.42 | | 12.18 | | (10.50) | | 19.68 | | 9.35 | | 3.72 |
| Distributions from net investment income | | (.49) | | (.39) | | (.21) | | (.32) | | (.42) | | (.44) |
| Distributions from net realized gain | | (1.31) | | - | | (3.44) | | (1.38) | | (2.32) | | (2.54) |
| Total distributions | | (1.79) C | | (.39) | | (3.64) C | | (1.69) C | | (2.74) | | (2.98) |
| Net asset value, end of period | $ | 74.48 | $ | 69.85 | $ | 58.06 | $ | 72.20 | $ | 54.21 | $ | 47.60 |
Total Return D,E | | 9.29% | | 21.06% | | (15.60)% | | 36.94% | | 20.51% | | 8.27% |
Ratios to Average Net Assets B,F,G | | | | | | | | | | | | |
| Expenses before reductions | | .46% H | | .46% | | .45% | | .47% | | .48% | | .50% |
| Expenses net of fee waivers, if any | | .45% H | | .46% | | .45% | | .47% | | .48% | | .49% |
| Expenses net of all reductions | | .45% H | | .46% | | .45% | | .46% | | .48% | | .49% |
| Net investment income (loss) | | .73% H | | .71% | | .35% | | .44% | | .79% | | 1.01% |
| Supplemental Data | | | | | | | | | | | | |
| Net assets, end of period (in millions) | $ | 6,557 | $ | 6,125 | $ | 5,468 | $ | 6,758 | $ | 4,402 | $ | 4,019 |
Portfolio turnover rate I | | 35% H,J | | 43% J | | 39% | | 34% K | | 51% | | 45% |
ACalculated based on average shares outstanding during the period.
BNet investment income (loss) is affected by the timing of the declaration of dividends by any underlying mutual funds or exchange-traded funds (ETFs). Net investment income (loss) of any mutual funds or ETFs is not included in the Fund's net investment income (loss) ratio.
CTotal distributions per share do not sum due to rounding.
DTotal returns for periods of less than one year are not annualized.
ETotal returns would have been lower if certain expenses had not been reduced during the applicable periods shown.
FFees and expenses of any underlying mutual funds or exchange-traded funds (ETFs) are not included in the Fund's expense ratio. The Fund indirectly bears its proportionate share of these expenses. For additional expense information related to investments in Fidelity Central Funds, please refer to the "Investments in Fidelity Central Funds" note found in the Notes to Financial Statements section of the most recent Annual or Semi-Annual report.
GExpense ratios reflect operating expenses of the class. Expenses before reductions do not reflect amounts reimbursed, waived, or reduced through arrangements with the investment adviser, brokerage services, or other offset arrangements, if applicable, and do not represent the amount paid by the class during periods when reimbursements, waivers or reductions occur.
HAnnualized.
IAmount does not include the portfolio activity of any underlying mutual funds or exchange-traded funds (ETFs).
JPortfolio turnover rate excludes securities received or delivered in-kind.
KThe portfolio turnover rate does not include the assets acquired in the merger.
| | Six months ended (Unaudited) December 31, 2023 | | Years ended June 30, 2023 | | 2022 | | 2021 | | 2020 | | 2019 |
Selected Per-Share Data | | | | | | | | | | | | |
| Net asset value, beginning of period | $ | 69.88 | $ | 58.07 | $ | 72.21 | $ | 54.20 | $ | 47.60 | $ | 46.86 |
| Income from Investment Operations | | | | | | | | | | | | |
Net investment income (loss) A,B | | .28 | | .50 | | .30 | | .33 | | .43 | | .50 |
| Net realized and unrealized gain (loss) | | 6.17 | | 11.74 | | (10.74) | | 19.41 | | 8.96 | | 3.26 |
| Total from investment operations | | 6.45 | | 12.24 | | (10.44) | | 19.74 | | 9.39 | | 3.76 |
| Distributions from net investment income | | (.55) | | (.43) | | (.26) | | (.35) | | (.46) | | (.48) |
| Distributions from net realized gain | | (1.31) | | - | | (3.44) | | (1.38) | | (2.32) | | (2.54) |
| Total distributions | | (1.85) C | | (.43) | | (3.70) | | (1.73) | | (2.79) C | | (3.02) |
| Net asset value, end of period | $ | 74.48 | $ | 69.88 | $ | 58.07 | $ | 72.21 | $ | 54.20 | $ | 47.60 |
Total Return D,E | | 9.33% | | 21.18% | | (15.54)% | | 37.07% | | 20.60% | | 8.37% |
Ratios to Average Net Assets B,F,G | | | | | | | | | | | | |
| Expenses before reductions | | .38% H | | .38% | | .38% | | .39% | | .40% | | .40% |
| Expenses net of fee waivers, if any | | .37% H | | .37% | | .37% | | .39% | | .40% | | .40% |
| Expenses net of all reductions | | .37% H | | .37% | | .37% | | .38% | | .39% | | .40% |
| Net investment income (loss) | | .81% H | | .79% | | .43% | | .52% | | .87% | | 1.10% |
| Supplemental Data | | | | | | | | | | | | |
| Net assets, end of period (in millions) | $ | 259 | $ | 237 | $ | 674 | $ | 411 | $ | 522 | $ | 326 |
Portfolio turnover rate I | | 35% H,J | | 43% J | | 39% | | 34% K | | 51% | | 45% |
ACalculated based on average shares outstanding during the period.
BNet investment income (loss) is affected by the timing of the declaration of dividends by any underlying mutual funds or exchange-traded funds (ETFs). Net investment income (loss) of any mutual funds or ETFs is not included in the Fund's net investment income (loss) ratio.
CTotal distributions per share do not sum due to rounding.
DTotal returns for periods of less than one year are not annualized.
ETotal returns would have been lower if certain expenses had not been reduced during the applicable periods shown.
FFees and expenses of any underlying mutual funds or exchange-traded funds (ETFs) are not included in the Fund's expense ratio. The Fund indirectly bears its proportionate share of these expenses. For additional expense information related to investments in Fidelity Central Funds, please refer to the "Investments in Fidelity Central Funds" note found in the Notes to Financial Statements section of the most recent Annual or Semi-Annual report.
GExpense ratios reflect operating expenses of the class. Expenses before reductions do not reflect amounts reimbursed, waived, or reduced through arrangements with the investment adviser, brokerage services, or other offset arrangements, if applicable, and do not represent the amount paid by the class during periods when reimbursements, waivers or reductions occur.
HAnnualized.
IAmount does not include the portfolio activity of any underlying mutual funds or exchange-traded funds (ETFs).
JPortfolio turnover rate excludes securities received or delivered in-kind.
KThe portfolio turnover rate does not include the assets acquired in the merger.
For the period ended December 31, 2023
(Amounts in thousands except percentages)
1. Organization.
Fidelity Fund (the Fund) is a fund of Fidelity Hastings Street Trust (the Trust) and is authorized to issue an unlimited number of shares. The Trust is registered under the Investment Company Act of 1940, as amended (the 1940 Act), as an open-end management investment company organized as a Massachusetts business trust. The Fund offers Fidelity Fund and Class K shares, each of which has equal rights as to assets and voting privileges.
2. Investments in Fidelity Central Funds.
Funds may invest in Fidelity Central Funds, which are open-end investment companies generally available only to other investment companies and accounts managed by the investment adviser and its affiliates. The Schedule of Investments lists any Fidelity Central Funds held as an investment as of period end, but does not include the underlying holdings of each Fidelity Central Fund. An investing fund indirectly bears its proportionate share of the expenses of the underlying Fidelity Central Funds.
Based on its investment objective, each Fidelity Central Fund may invest or participate in various investment vehicles or strategies that are similar to those of the investing fund. These strategies are consistent with the investment objectives of the investing fund and may involve certain economic risks which may cause a decline in value of each of the Fidelity Central Funds and thus a decline in the value of the investing fund.
| Fidelity Central Fund | Investment Manager | Investment Objective | Investment Practices | Expense RatioA |
| Fidelity Money Market Central Funds | Fidelity Management & Research Company LLC (FMR) | Each fund seeks to obtain a high level of current income consistent with the preservation of capital and liquidity. | Short-term Investments | Less than .005% |
A Expenses expressed as a percentage of average net assets and are as of each underlying Central Fund's most recent annual or semi-annual shareholder report.
A complete unaudited list of holdings for each Fidelity Central Fund is available upon request or at the Securities and Exchange Commission website at www.sec.gov. In addition, the financial statements of the Fidelity Central Funds which contain the significant accounting policies (including investment valuation policies) of those funds, and are not covered by the Report of Independent Registered Public Accounting Firm, are available on the Securities and Exchange Commission website or upon request.
3. Significant Accounting Policies.
The Fund is an investment company and applies the accounting and reporting guidance of the Financial Accounting Standards Board (FASB) Accounting Standards Codification Topic 946 Financial Services - Investment Companies. The financial statements have been prepared in conformity with accounting principles generally accepted in the United States of America (GAAP), which require management to make certain estimates and assumptions at the date of the financial statements. Actual results could differ from those estimates. Subsequent events, if any, through the date that the financial statements were issued have been evaluated in the preparation of the financial statements. The Fund's Schedule of Investments lists any underlying mutual funds or exchange-traded funds (ETFs) but does not include the underlying holdings of these funds. The following summarizes the significant accounting policies of the Fund:
Investment Valuation. Investments are valued as of 4:00 p.m. Eastern time on the last calendar day of the period. The Board of Trustees (the Board) has designated the Fund's investment adviser as the valuation designee responsible for the fair valuation function and performing fair value determinations as needed. The investment adviser has established a Fair Value Committee (the Committee) to carry out the day-to-day fair valuation responsibilities and has adopted policies and procedures to govern the fair valuation process and the activities of the Committee. In accordance with these fair valuation policies and procedures, which have been approved by the Board, the Fund attempts to obtain prices from one or more third party pricing services or brokers to value its investments. When current market prices, quotations or currency exchange rates are not readily available or reliable, investments will be fair valued in good faith by the Committee, in accordance with the policies and procedures. Factors used in determining fair value vary by investment type and may include market or investment specific events, transaction data, estimated cash flows, and market observations of comparable investments. The frequency that the fair valuation procedures are used cannot be predicted and they may be utilized to a significant extent. The Committee manages the Fund's fair valuation practices and maintains the fair valuation policies and procedures. The Fund's investment adviser reports to the Board information regarding the fair valuation process and related material matters.
The Fund categorizes the inputs to valuation techniques used to value its investments into a disclosure hierarchy consisting of three levels as shown below:
Level 1 - unadjusted quoted prices in active markets for identical investments
Level 2 - other significant observable inputs (including quoted prices for similar investments, interest rates, prepayment speeds, etc.)
Level 3 - unobservable inputs (including the Fund's own assumptions based on the best information available)
Valuation techniques used to value the Fund's investments by major category are as follows:
Equity securities, including restricted securities, for which market quotations are readily available, are valued at the last reported sale price or official closing price as reported by a third party pricing service on the primary market or exchange on which they are traded and are categorized as Level 1 in the hierarchy. In the event there were no sales during the day or closing prices are not available, securities are valued at the last quoted bid price or may be valued using the last available price and are generally categorized as Level 2 in the hierarchy. For foreign equity securities, when market or security specific events arise, comparisons to the valuation of American Depositary Receipts (ADRs), futures contracts, ETFs and certain indexes as well as quoted prices for similar securities may be used and would be categorized as Level 2 in the hierarchy. For equity securities, including restricted securities, where observable inputs are limited, assumptions about market activity and risk are used and these securities may be categorized as Level 3 in the hierarchy.
Investments in open-end mutual funds, including the Fidelity Central Funds, are valued at their closing net asset value (NAV) each business day and are categorized as Level 1 in the hierarchy.
Changes in valuation techniques may result in transfers in or out of an assigned level within the disclosure hierarchy. The aggregate value of investments by input level as of December 31, 2023 is included at the end of the Fund's Schedule of Investments.
Foreign Currency. Certain Funds may use foreign currency contracts to facilitate transactions in foreign-denominated securities. Gains and losses from these transactions may arise from changes in the value of the foreign currency or if the counterparties do not perform under the contracts' terms.
Foreign-denominated assets, including investment securities, and liabilities are translated into U.S. dollars at the exchange rates at period end. Purchases and sales of investment securities, income and dividends received, and expenses denominated in foreign currencies are translated into U.S. dollars at the exchange rate in effect on the transaction date.
The effects of exchange rate fluctuations on investments are included with the net realized and unrealized gain (loss) on investment securities. Other foreign currency transactions resulting in realized and unrealized gain (loss) are disclosed separately.
Investment Transactions and Income. For financial reporting purposes, the Fund's investment holdings and NAV include trades executed through the end of the last business day of the period. The NAV per share for processing shareholder transactions is calculated as of the close of business of the New York Stock Exchange (NYSE), normally 4:00 p.m. Eastern time and includes trades executed through the end of the prior business day. Gains and losses on securities sold are determined on the basis of identified cost and include proceeds received from litigation. Commissions paid to certain brokers with whom the investment adviser, or its affiliates, places trades on behalf of a fund include an amount in addition to trade execution, which may be rebated back to a fund. Any such rebates are included in net realized gain (loss) on investments in the Statement of Operations. Dividend income is recorded on the ex-dividend date, except for certain dividends from foreign securities where the ex-dividend date may have passed, which are recorded as soon as the Fund is informed of the ex-dividend date. Non-cash dividends included in dividend income, if any, are recorded at the fair market value of the securities received. Income and capital gain distributions from Fidelity Central Funds, if any, are recorded on the ex-dividend date. Investment income is recorded net of foreign taxes withheld where recovery of such taxes is uncertain. Funds may file withholding tax reclaims in certain jurisdictions to recover a portion of amounts previously withheld. Any withholding tax reclaims income is included in the Statement of Operations in dividends. Any receivables for withholding tax reclaims are included in the Statement of Assets and Liabilities in dividends receivable.
Class Allocations and Expenses. Investment income, realized and unrealized capital gains and losses, common expenses of a fund, and certain fund-level expense reductions, if any, are allocated daily on a pro-rata basis to each class based on the relative net assets of each class to the total net assets of a fund. Each class differs with respect to transfer agent and distribution and service plan fees incurred, as applicable. Certain expense reductions may also differ by class, if applicable. For the reporting period, the allocated portion of income and expenses to each class as a percent of its average net assets may vary due to the timing of recording these transactions in relation to fluctuating net assets of the classes. Expenses directly attributable to a fund are charged to that fund. Expenses attributable to more than one fund are allocated among the respective funds on the basis of relative net assets or other appropriate methods. Expenses included in the accompanying financial statements reflect the expenses of that fund and do not include any expenses associated with any underlying mutual funds or exchange-traded funds (ETFs). Although not included in a fund's expenses, a fund indirectly bears its proportionate share of these expenses through the net asset value of each underlying mutual fund or exchange-traded fund (ETF). Expense estimates are accrued in the period to which they relate and adjustments are made when actual amounts are known.
Deferred Trustee Compensation. Under a Deferred Compensation Plan (the Plan) for certain Funds, certain independent Trustees have elected to defer receipt of a portion of their annual compensation. Deferred amounts are invested in affiliated mutual funds, are marked-to-market and remain in a fund until distributed in accordance with the Plan. The investment of deferred amounts and the offsetting payable to the Trustees presented below are included in the accompanying Statement of Assets and Liabilities in other receivables and other payables and accrued expenses, as applicable.
Income Tax Information and Distributions to Shareholders. Each year, the Fund intends to qualify as a regulated investment company under Subchapter M of the Internal Revenue Code, including distributing substantially all of its taxable income and realized gains. As a result, no provision for U.S. Federal income taxes is required. The Fund files a U.S. federal tax return, in addition to state and local tax returns as required. The Fund's federal income tax returns are subject to examination by the Internal Revenue Service (IRS) for a period of three fiscal years after they are filed. State and local tax returns may be subject to examination for an additional fiscal year depending on the jurisdiction. Foreign taxes are provided for based on the Fund's understanding of the tax rules and rates that exist in the foreign markets in which it invests.
Distributions are declared and recorded on the ex-dividend date. Income and capital gain distributions are declared separately for each class. Income and capital gain distributions are determined in accordance with income tax regulations, which may differ from GAAP.
Capital accounts within the financial statements are adjusted for permanent book-tax differences. These adjustments have no impact on net assets or the results of operations. Capital accounts are not adjusted for temporary book-tax differences which will reverse in a subsequent period.
Book-tax differences are primarily due to foreign currency transactions, redemptions in-kind and losses deferred due to wash sales and excise tax regulations.
As of period end, the cost and unrealized appreciation (depreciation) in securities, and derivatives if applicable, for federal income tax purposes were as follows:
| Gross unrealized appreciation | $3,985,793 |
| Gross unrealized depreciation | (2,586) |
| Net unrealized appreciation (depreciation) | $3,983,207 |
| Tax cost | $2,830,813 |
4. Purchases and Sales of Investments.
Purchases and sales of securities, other than short-term securities and in-kind transactions, as applicable, are noted in the table below.
| | Purchases ($) | Sales ($) |
| Fidelity Fund | 1,109,959 | 1,104,021 |
Unaffiliated Redemptions In-Kind. Shares that were redeemed in-kind for investments, including accrued interest and cash, if any, are shown in the table below. The net realized gain or loss on investments delivered through in-kind redemptions is included in the "Net realized gain (loss) on: Redemptions in-kind" line in the accompanying Statement of Operations. The amount of the in-kind redemptions is included in share transactions in the accompanying Statement of Changes in Net Assets. There was no gain or loss for federal income tax purposes.
| | Shares | Total net realized gain or loss ($) | Total Proceeds ($) | Participating classes |
| Fidelity Fund | 775 | 35,976 | 56,759 | Fidelity Fund |
Prior Fiscal Year Unaffiliated Redemptions In-Kind. Shares that were redeemed in-kind for investments, including accrued interest and cash, if any, are shown in the table below; along with realized gain or loss on investments delivered through in-kind redemptions. The amount of the in-kind redemptions is included in share transactions in the accompanying Statement of Changes in Net Assets. There was no gain or loss for federal income tax purposes.
| | Shares | Total net realized gain or loss ($) | Total Proceeds ($) | Participating classes |
| Fidelity Fund | 1,769 | 115,227 | 121,521 | Fidelity Fund |
5. Fees and Other Transactions with Affiliates.
Management Fee. Fidelity Management & Research Company LLC (the investment adviser) and its affiliates provide the Fund with investment management related services for which the Fund pays a monthly management fee. The management fee is the sum of an individual fund fee rate that is based on an annual rate of .09% of the Fund's average net assets and an annualized group fee rate that averaged .22% during the period. The group fee rate is based upon the monthly average net assets of a group of registered investment companies with which the investment adviser has management contracts. The group fee rate decreases as assets under management increase and increases as assets under management decrease. For the reporting period, the total annualized management fee rate was .31% of the Fund's average net assets.
Transfer Agent Fees. Fidelity Investments Institutional Operations Company LLC (FIIOC), an affiliate of the investment adviser, is the transfer, dividend disbursing and shareholder servicing agent for each class of the Fund.
During November 2023, the Board approved a change in the transfer agent fees effective December 1, 2023 to a fixed annual rate of class-level average net assets as follows:
| | % of Class-Level Average Net Assets |
| Fidelity Fund | 0.1236 |
Prior to December 1, 2023, FIIOC received account fees and asset-based fees that varied according to the account size and type of account of the shareholders of the respective classes of the Fund, except for Class K. FIIOC received an asset-based fee of Class K's average net assets. FIIOC pays for typesetting, printing and mailing of shareholder reports, except proxy statements
For the period, transfer agent fees for each class were as follows:
| | Amount | % of Class-Level Average Net AssetsA |
| Fidelity Fund | $3,840 | .12 |
| Class K | 51 | .04 |
| | $3,891 | |
A Annualized
Accounting Fees. Fidelity Service Company, Inc. (FSC), an affiliate of the investment adviser, maintains the Fund's accounting records.
During November 2023, the Board approved a change in the accounting fees effective December 1, 2023 to a fixed annual rate of average net assets as follows:
| | % of Average Net Assets |
| Fidelity Fund | 0.0158 |
Prior to December 1, 2023, the accounting fee was based on the level of average net assets for each month. For the period, the fees were equivalent to the following annualized rates:
| | % of Average Net Assets |
| Fidelity Fund | .02 |
Subsequent Event - Management Fee. Effective March 1, 2024, the Fund's management contract will be amended to incorporate administrative services previously covered under separate services agreements (Transfer Agent and Accounting agreements). The amended contract incorporates a management fee rate that may vary by class. The investment adviser or an affiliate will pay certain expenses of managing and operating the Fund out of each class's management fee.
Each class of the Fund will pay a management fee to the investment adviser. The management fee will be calculated and paid to the investment adviser every month.
When determining a class's management fee, a mandate rate will be calculated based on the monthly average net assets of a group of funds advised by FMR within a designated asset class. A discount rate will be subtracted from the mandate rate once the Fund's monthly average net assets reach a certain level. The mandate rate and discount rate may vary by class.
The annual management fee rate for a class of shares of the Fund will be the lesser of (1) the class's mandate rate reduced by the class's discount rate (if applicable) or (2) the amount set forth in the following table.
| | Maximum Management Fee Rate % |
| Fidelity Fund | .42 |
| Class K | .34 |
One-twelfth of the management fee rate for a class will be applied to the average net assets of the class for the month, giving a dollar amount which is the management fee for the class for that month.
A different management fee rate may be applicable to each class of the Fund. The difference between classes is the result of separate arrangements for class-level services and/or waivers of certain expenses. It is not the result of any difference in advisory or custodial fees or other expenses related to the management of the Fund's assets, which do not vary by class.
Effective March 1, 2024, the Fund's sub-advisory agreements with FMR Investment Management (UK) Limited, Fidelity Management & Research (Hong Kong) Limited, and Fidelity Management & Research (Japan) Limited will be amended to provide that the investment adviser will pay each sub-adviser monthly fees equal to 110% of the sub-adviser's costs for providing sub-advisory services.
Brokerage Commissions. A portion of portfolio transactions were placed with brokerage firms which are affiliates of the investment adviser. Brokerage commissions are included in net realized gain (loss) and change in net unrealized appreciation (depreciation) in the Statement of Operations. The commissions paid to these affiliated firms were as follows:
Interfund Trades. Funds may purchase from or sell securities to other Fidelity Funds under procedures adopted by the Board. The procedures have been designed to ensure these interfund trades are executed in accordance with Rule 17a-7 of the 1940 Act. Any interfund trades are included within the respective purchases and sales amounts shown in the Purchases and Sales of Investments note. Interfund trades during the period are noted in the table below.
| | Purchases ($) | Sales ($) | Realized Gain (Loss) ($) |
| Fidelity Fund | 57,303 | 15,803 | 460 |
6. Committed Line of Credit.
Certain Funds participate with other funds managed by the investment adviser or an affiliate in a $4.25 billion credit facility (the "line of credit") to be utilized for temporary or emergency purposes to fund shareholder redemptions or for other short-term liquidity purposes. The participating funds have agreed to pay commitment fees on their pro-rata portion of the line of credit, which are reflected in Miscellaneous expenses on the Statement of Operations, and are listed below. During the period, there were no borrowings on this line of credit.
7. Security Lending.
Funds lend portfolio securities from time to time in order to earn additional income. Lending agents are used, including National Financial Services (NFS), an affiliate of the investment adviser. Pursuant to a securities lending agreement, NFS will receive a fee, which is capped at 9.9% of a fund's daily lending revenue, for its services as lending agent. A fund may lend securities to certain qualified borrowers, including NFS. On the settlement date of the loan, a fund receives collateral (in the form of U.S. Treasury obligations, letters of credit and/or cash) against the loaned securities and maintains collateral in an amount not less than 100% of the market value of the loaned securities during the period of the loan. The market value of the loaned securities is determined at the close of business of a fund and any additional required collateral is delivered to a fund on the next business day. A fund or borrower may terminate the loan at any time, and if the borrower defaults on its obligation to return the securities loaned because of insolvency or other reasons, a fund may apply collateral received from the borrower against the obligation. A fund may experience delays and costs in recovering the securities loaned. Any cash collateral received is invested in the Fidelity Securities Lending Cash Central Fund. Any loaned securities are identified as such in the Schedule of Investments, and the value of loaned securities and cash collateral at period end, as applicable, are presented in the Statement of Assets and Liabilities. Security lending income represents the income earned on investing cash collateral, less rebates paid to borrowers and any lending agent fees associated with the loan, plus any premium payments received for lending certain types of securities. Security lending income is presented in the Statement of Operations as a component of income from Fidelity Central Funds. Affiliated security lending activity, if any, was as follows:
| | Total Security Lending Fees Paid to NFS | Security Lending Income From Securities Loaned to NFS | Value of Securities Loaned to NFS at Period End |
| Fidelity Fund | $1 | $- | $- |
8. Expense Reductions.
During the period the investment adviser or an affiliate reimbursed and/or waived a portion of fund-level operating expenses in the amount of $234.
9. Distributions to Shareholders.
Distributions to shareholders of each class were as follows:
| | Six months ended December 31, 2023 | Year ended June 30, 2023 |
| Fidelity Fund | | |
| Distributions to shareholders | | |
| Fidelity Fund | $155,989 | $35,624 |
| Class K | 6,292 | 2,945 |
Total | $162,281 | $38,569 |
10. Share Transactions.
Share transactions for each class were as follows and may contain in-kind transactions, automatic conversions between classes or exchanges between affiliated funds:
| | Shares | Shares | Dollars | Dollars |
| | Six months ended December 31, 2023 | Year ended June 30, 2023 | Six months ended December 31, 2023 | Year ended June 30, 2023 |
| Fidelity Fund | | | | |
| Fidelity Fund | | | | |
| Shares sold | 2,980 | 4,202 | $213,366 | $272,154 |
| Reinvestment of distributions | 1,951 | 522 | 140,752 | 32,237 |
| Shares redeemed | (4,591) | (11,210) | (326,950) | (706,252) |
| Net increase (decrease) | 340 | (6,486) | $27,168 | $(401,861) |
| Class K | | | | |
| Shares sold | 246 | 661 | $17,352 | $40,690 |
| Reinvestment of distributions | 87 | 47 | 6,292 | 2,945 |
| Shares redeemed | (253) | (8,917) | (17,889) | (558,930) |
| Net increase (decrease) | 80 | (8,209) | $5,755 | $(515,295) |
11. Other.
A fund's organizational documents provide former and current trustees and officers with a limited indemnification against liabilities arising in connection with the performance of their duties to the fund. In the normal course of business, a fund may also enter into contracts that provide general indemnifications. A fund's maximum exposure under these arrangements is unknown as this would be dependent on future claims that may be made against a fund. The risk of material loss from such claims is considered remote.
12. Risk and Uncertainties.
Many factors affect a fund's performance. Developments that disrupt global economies and financial markets, such as pandemics, epidemics, outbreaks of infectious diseases, war, terrorism, and environmental disasters, may significantly affect a fund's investment performance. The effects of these developments to a fund will be impacted by the types of securities in which a fund invests, the financial condition, industry, economic sector, and geographic location of an issuer, and a fund's level of investment in the securities of that issuer. Significant concentrations in security types, issuers, industries, sectors, and geographic locations may magnify the factors that affect a fund's performance.
As a shareholder, you incur two types of costs: (1) transaction costs, which may include sales charges (loads) on purchase payments or redemption proceeds, as applicable and (2) ongoing costs, which generally include management fees, distribution and/or service (12b-1) fees and other Fund expenses. This Example is intended to help you understand your ongoing costs (in dollars) of investing in a fund and to compare these costs with the ongoing costs of investing in other mutual funds.
| The Example is based on an investment of $1,000 invested at the beginning of the period and held for the entire period (July 1, 2023 to December 31, 2023). |
Actual Expenses
The first line of the accompanying table provides information about actual account values and actual expenses. You may use the information in this line, together with the amount you invested, to estimate the expenses that you paid over the period. Simply divide your account value by $1,000.00 (for example, an $8,600 account value divided by $1,000.00 = 8.6), then multiply the result by the number in the first line for a class/Fund under the heading entitled "Expenses Paid During Period" to estimate the expenses you paid on your account during this period. If any fund is a shareholder of any underlying mutual funds or exchange-traded funds (ETFs) (the Underlying Funds), such fund indirectly bears its proportional share of the expenses of the Underlying Funds in addition to the direct expenses incurred presented in the table. These fees and expenses are not included in the annualized expense ratio used to calculate the expense estimate in the table below.
Hypothetical Example for Comparison Purposes
The second line of the accompanying table provides information about hypothetical account values and hypothetical expenses based on the actual expense ratio and an assumed rate of return of 5% per year before expenses, which is not the actual return. The hypothetical account values and expenses may not be used to estimate the actual ending account balance or expenses you paid for the period. You may use this information to compare the ongoing costs of investing in the Fund and other funds. To do so, compare this 5% hypothetical example with the 5% hypothetical examples that appear in the shareholder reports of the other funds. If any fund is a shareholder of any Underlying Funds, such fund indirectly bears its proportional share of the expenses of the Underlying Funds in addition to the direct expenses as presented in the table. These fees and expenses are not included in the annualized expense ratio used to calculate the expense estimate in the table below.
Please note that the expenses shown in the table are meant to highlight your ongoing costs only and do not reflect any transaction costs. Therefore, the second line of the table is useful in comparing ongoing costs only, and will not help you determine the relative total costs of owning different funds. In addition, if these transactional costs were included, your costs would have been higher.
| | | | | Annualized Expense Ratio- A | | Beginning Account Value July 1, 2023 | | Ending Account Value December 31, 2023 | | Expenses Paid During Period- C July 1, 2023 to December 31, 2023 |
| Fidelity® Fund | | | | | | | | | | |
Fidelity® Fund ** | | | | .45% | | | | | | |
| Actual | | | | | | $ 1,000 | | $ 1,092.90 | | $ 2.37 |
Hypothetical-B | | | | | | $ 1,000 | | $ 1,022.87 | | $ 2.29 |
Class K ** | | | | .37% | | | | | | |
| Actual | | | | | | $ 1,000 | | $ 1,093.30 | | $ 1.95 |
Hypothetical-B | | | | | | $ 1,000 | | $ 1,023.28 | | $ 1.88 |
| |
A Annualized expense ratio reflects expenses net of applicable fee waivers.
B 5% return per year before expenses
C Expenses are equal to the annualized expense ratio, multiplied by the average account value over the period, multiplied by 184/ 366 (to reflect the one-half year period). The fees and expenses of any Underlying Funds are not included in each annualized expense ratio.
** If fees and changes to the expense contract and/or expense cap, effective March 1, 2024, had been in effect during the current period, the restated annualized expense ratio and the expenses paid in the actual and hypothetical examples above would have been as shown in table below:
| | | | | Annualized Expense Ratio- A | | Expenses Paid |
| Fidelity® Fund | | | | | | |
| Fidelity® Fund | | | | .41% | | |
| Actual | | | | | | $ 2.16 |
Hypothetical- B | | | | | | $ 2.08 |
| Class K | | | | .33% | | |
| Actual | | | | | | $ 1.74 |
Hypothetical- B | | | | | | $ 1.68 |
| | | | | | | |
| A Annualized expense ratio reflects expenses net of applicable fee waivers. | | | | | | |
| B 5% return per year before expenses | | | | | | |
Board Approval of Investment Advisory Contracts and Management Fees
Fidelity Fund
Each year, the Board of Trustees, including the Independent Trustees (together, the Board), considers the renewal of the fund's management contract with Fidelity Management & Research Company LLC (FMR) and the sub-advisory agreements (together, the Advisory Contracts) for the fund. FMR and the sub-advisers are referred to herein as the Investment Advisers. The Board, assisted by the advice of fund counsel and Independent Trustees' counsel, requests and considers a broad range of information relevant to the renewal of the Advisory Contracts throughout the year.
The Board meets regularly and, at each of its meetings, covers an extensive agenda of topics and materials and considers factors that are relevant to its annual consideration of the renewal of the fund's Advisory Contracts, including the services and support provided to the fund and its shareholders. The Board, acting directly and through its Committees (each of which is composed of and chaired by Independent Trustees), requests and receives information concerning the annual consideration of the renewal of the fund's Advisory Contracts. The Board also meets as needed to review matters specifically related to the Board's annual consideration of the renewal of the Advisory Contracts. Members of the Board may also meet with trustees of other Fidelity funds through joint ad hoc committees to discuss certain matters relevant to all of the Fidelity funds.
At its July 2023 meeting, the Board unanimously determined to renew the fund's Advisory Contracts. In reaching its determination, the Board considered all factors it believed relevant, including (i) the nature, extent, and quality of the services provided to the fund and its shareholders (including the investment performance of the fund); (ii) the competitiveness relative to peer funds of the fund's management fee and the total expense ratio of a representative class (the retail class, which was selected because it is the largest class); (iii) the total costs of the services provided by and the profits realized by FMR and its affiliates (Fidelity) from its relationships with the fund; and (iv) the extent to which, if any, economies of scale exist and are realized as the fund grows, and whether any economies of scale are appropriately shared with fund shareholders. The Board also considered the broad range of investment choices available to shareholders from FMR's competitors and that the fund's shareholders have chosen to invest in the fund, which is part of the Fidelity family of funds. The Board's decision to renew the Advisory Contracts was not based on any single factor.
The Board reached a determination, with the assistance of fund counsel and Independent Trustees' counsel and through the exercise of its business judgment, that the renewal of the Advisory Contracts was in the best interests of the fund and its shareholders and that the compensation payable under the Advisory Contracts was fair and reasonable in light of all of the surrounding circumstances.
Nature, Extent, and Quality of Services Provided. The Board considered staffing as it relates to the fund, including the backgrounds and experience of investment personnel of the Investment Advisers, and also considered the Investment Advisers' implementation of the fund's investment program. The Independent Trustees also had discussions with senior management of Fidelity's investment operations and investment groups. The Board considered the structure of the investment personnel compensation program and whether this structure provides appropriate incentives to act in the best interests of the fund. Additionally, the Board considered the portfolio managers' investments, if any, in the funds that they manage.
Resources Dedicated to Investment Management and Support Services. The Board and the Fund Oversight and Research Committees reviewed the general qualifications and capabilities of Fidelity's investment staff, including its size, education, experience, and resources, as well as Fidelity's approach to recruiting, training, managing, and compensating investment personnel. The Board noted the resources devoted to expansion of Fidelity's global investment organization, and that Fidelity's analysts have extensive resources, tools, and capabilities that allow them to conduct sophisticated quantitative and fundamental analysis, as well as credit analysis of issuers, counterparties, and guarantors. Further, the Board considered that Fidelity's investment professionals have sufficient access to global information and data so as to provide competitive investment results over time, and that those professionals also have access to sophisticated tools that permit them to assess portfolio construction and risk and performance attribution characteristics continuously, as well as to transmit new information and research conclusions rapidly around the world. Additionally, in its deliberations, the Board considered Fidelity's trading, risk management, compliance, and technology and operations capabilities and resources, which are integral parts of the investment management process.
Shareholder and Administrative Services. The Board considered (i) the nature, extent, quality, and cost of advisory, administrative, and shareholder services performed by the Investment Advisers and their affiliates under the Advisory Contracts and under separate agreements covering transfer agency, pricing and bookkeeping, and securities lending services for the fund; (ii) the nature and extent of Fidelity's supervision of third party service providers, principally custodians, subcustodians, and pricing vendors; and (iii) the resources devoted by Fidelity to, and the record of compliance with, the fund's compliance policies and procedures. The Board also reviewed the allocation of fund brokerage, including allocations to brokers affiliated with the Investment Advisers, the use of brokerage commissions to pay fund expenses, and the use of "soft" commission dollars to pay for research services. The Board also considered the fund's securities lending activities and any payments made to Fidelity relating to securities lending.
The Board noted that the growth of fund assets over time across the complex allows Fidelity to reinvest in the development of services designed to enhance the value and convenience of the Fidelity funds as investment vehicles. These services include 24-hour access to account information and market information over the Internet and through telephone representatives, investor education materials, and asset allocation tools. The Board also considered that it reviews customer service metrics such as telephone response times, continuity of services on the website and metrics addressing services at Fidelity Investor Centers.
Investment in a Large Fund Family. The Board considered the benefits to shareholders of investing in a fund that is part of a large family of funds offering a variety of investment disciplines and providing a large variety of fund investor services. The Board noted that Fidelity had taken, or had made recommendations that resulted in the Fidelity funds taking, a number of actions over the previous year that benefited particular funds and/or the Fidelity funds in general.
Investment Performance. The Board took into account discussions that occur with representatives of the Investment Advisers, and reports that it receives, at Board meetings throughout the year, relating to fund investment performance. In this regard the Board noted that as part of regularly scheduled fund reviews and other reports to the Board on fund performance, the Board considered annualized return information for the fund for different time periods, measured against an appropriate securities market index (benchmark index) and an appropriate peer group of funds with similar objectives (peer group). The Board also considered information about performance attribution. In its ongoing evaluation of fund investment performance, the Board gives particular attention to information indicating changes in performance of the funds over different time periods and discussed with the Investment Advisers the reasons for any overperformance or underperformance. The fund underperformed its benchmark and peers for the one- and three-year periods ended February 28, 2023, and as a result, the Board continues to engage in discussions with FMR about the steps it is taking to address the fund's performance.
In addition to reviewing absolute and relative fund performance, the Independent Trustees periodically consider the appropriateness of fund performance metrics in evaluating the results achieved. The Independent Trustees generally give greater weight to fund performance over longer time periods than over shorter time periods. Depending on the circumstances, the Independent Trustees may be satisfied with a fund's performance notwithstanding that it lags its benchmark index or peer group for certain periods.
Based on its review, the Board concluded that the nature, extent, and quality of services provided to the fund under the Advisory Contracts should continue to benefit the shareholders of the fund.
Competitiveness of Management Fee and Total Expense Ratio. The Board was provided with information regarding industry trends in management fees and expenses. In its review of the fund's management fee and the total expense ratio of the retail class, the Board considered the fund's management fee rate as well as other fund or class expenses, as applicable, such as transfer agent fees, pricing and bookkeeping fees, and custodial, legal, and audit fees. The Board noted that Fidelity may agree to waive fees or reimburse expenses from time to time, and the extent to which, if any, it has done so for the fund.
Comparisons of Management Fees and Total Expense Ratios. Among other things, the Board reviewed data for selected groups of competitive funds and classes (referred to as "mapped groups") that were compiled by Fidelity based on combining similar investment objective categories (as classified by Lipper) that have comparable investment mandates. The data reviewed by the Board included (i) gross management fee comparisons (before taking into account expense reimbursements or caps) relative to the total universe of funds within the mapped group; (ii) gross management fee comparisons relative to a subset of non-Fidelity funds in the mapped group that are similar in size and management fee structure to the fund (referred to as the "asset size peer group"); (iii) total expense comparisons of the retail class of the fund relative to funds and classes in the mapped group that have a similar sales load structure to the retail class of the fund (referred to as the "similar sales load structure group"); and (iv) total expense comparisons of the retail class of the fund relative to funds and classes in the similar sales load structure group that are similar in size and management fee structure to the fund (referred to as the "total expense asset size peer group"). The total expense asset size peer group comparison excludes performance adjustments and fund-paid 12b-1 fees to eliminate variability in fee structures.
The information provided to the Board indicated that the fund's management fee rate ranked below the competitive median of the mapped group for the 12-month period ended September 30, 2022 and below the competitive median of the asset size peer group for the 12-month period ended September 30, 2022. Further, the information provided to the Board indicated that the total expense ratio of the retail class of the fund ranked below the competitive median of the similar sales load structure group for the 12-month period ended September 30, 2022 and below the competitive median of the total expense asset size peer group for the 12-month period ended September 30, 2022.
The Board also considered that, for funds subject to the group fee, FMR agreed to voluntarily waive fees over a specified period of time in amounts designed to account for assets converted from certain funds to certain collective investment trusts.
Fees Charged to Other Fidelity Clients. The Board also considered Fidelity fee structures and other information with respect to clients of Fidelity, such as other funds advised or subadvised by Fidelity, pension plan clients, and other institutional clients with similar mandates. The Board noted that a joint ad hoc committee created by it and the boards of other Fidelity funds periodically reviews and compares Fidelity's institutional investment advisory business with its business of providing services to the Fidelity funds and also noted the most recent findings of the committee. The Board noted that the committee's review included a consideration of the differences in services provided, fees charged, and costs incurred, as well as competition in the markets serving the different categories of clients.
Based on its review, the Board concluded that the fund's management fee is fair and reasonable in light of the services that the fund receives and the other factors considered. Further, based on its review of total expense ratios and fees charged to other Fidelity clients, the Board concluded that the total expense ratio of each class of the fund was reasonable in light of the services that the fund and its shareholders receive and the other factors considered.
Costs of the Services and Profitability. The Board considered the revenues earned and the expenses incurred by Fidelity in conducting the business of developing, marketing, distributing, managing, administering and servicing the fund and servicing the fund's shareholders. The Board also considered the level of Fidelity's profits in respect of all the Fidelity funds.
On an annual basis, Fidelity presents to the Board information about the profitability of its relationships with the fund. Fidelity calculates profitability information for each fund, as well as aggregate profitability information for groups of Fidelity funds and all Fidelity funds, using a series of detailed revenue and cost allocation methodologies which originate with the books and records of Fidelity on which Fidelity's audited financial statements are based. The Audit Committee of the Board reviews any significant changes from the prior year's methodologies and the full Board approves such changes.
A public accounting firm has been engaged annually by the Board as part of the Board's assessment of Fidelity's profitability analysis. The engagement includes the review and assessment of the methodologies used by Fidelity in determining the revenues and expenses attributable to Fidelity's fund business, and completion of agreed-upon procedures in respect of the mathematical accuracy of certain fund profitability information and its conformity to established allocation methodologies. After considering the reports issued under the engagement and information provided by Fidelity, the Board concluded that while other allocation methods may also be reasonable, Fidelity's profitability methodologies are reasonable in all material respects.
The Board also reviewed Fidelity's non-fund businesses and potential indirect benefits such businesses may have received as a result of their association with Fidelity's fund business (i.e., fall-out benefits) as well as cases where Fidelity's affiliates may benefit from the funds' business. The Board considered areas where potential indirect benefits to the Fidelity funds from their relationships with Fidelity may exist. The Board's consideration of these matters was informed by the findings of a joint ad hoc committee created by it and the boards of other Fidelity funds to evaluate potential fall-out benefits.
The Board considered the costs of the services provided by and the profits realized by Fidelity in connection with the operation of the fund, and was satisfied that the profitability was not excessive.
Economies of Scale. The Board considered whether there have been economies of scale in respect of the management of the Fidelity funds, whether the Fidelity funds (including the fund) have appropriately benefited from any such economies of scale, and whether there is potential for realization of any further economies of scale. The Board considered the extent to which the fund will benefit from economies of scale as assets grow through increased services to the fund, through waivers or reimbursements, or through fee or expense ratio reductions. The Board also noted that a committee (the Economies of Scale Committee) created by it and the boards of other Fidelity funds periodically analyzes whether Fidelity attains economies of scale in respect of the management and servicing of the Fidelity funds, whether the Fidelity funds have appropriately benefited from such economies of scale, and whether there is potential for realization of any further economies of scale.
The Board recognized that the fund's management contract incorporates a "group fee" structure, which provides for lower group fee rates as total "group assets" increase, and for higher group fee rates as total "group assets" decrease ("group assets" as defined in the management contract). FMR calculates the group fee rates based on a tiered asset "breakpoint" schedule that varies based on asset class. The Board considered that the group fee is designed to deliver the benefits of economies of scale to fund shareholders when total Fidelity fund assets increase, even if assets of any particular fund are unchanged or have declined, because some portion of Fidelity's costs are attributable to services provided to all Fidelity funds, and all funds benefit if those costs can be allocated among more assets. The Board further considered that Fidelity agreed to impose a temporary fee waiver in the form of additional breakpoints to the current breakpoint schedule. The Board concluded that, given the group fee structure, fund shareholders will benefit from lower management fees as "group assets" increase at the fund complex level, regardless of whether Fidelity achieves any such economies of scale.
The Board concluded, taking into account the analysis of the Economies of Scale Committee, that economies of scale, if any, are being appropriately shared between fund shareholders and Fidelity.
Additional Information Requested by the Board. In order to develop fully the factual basis for consideration of the Fidelity funds' advisory contracts, the Board requested and received additional information on certain topics, including: (i) fund flow and performance trends, in particular the underperformance of certain funds and strategies, and Fidelity's long-term strategies for certain funds, including any consideration of fund liquidations or mergers; (ii) the operation of performance fees and competitor use of performance fees; (iii) Fidelity's pricing philosophy compared to competitors; (iv) fund profitability methodology and data; (v) evaluation of competitive fund data and peer group classifications and fee and expense comparisons; (vi) the management fee and expense structures for different funds and classes and information about the differences between various fee and expense structures; (vii) group fee breakpoints and related voluntary fee waivers; and (viii) information regarding other accounts managed by Fidelity and the funds' sub-advisory arrangements.
Conclusion. Based on its evaluation of all of the conclusions noted above, and after considering all factors it believed relevant, the Board, including the Independent Trustees, concluded that the advisory and sub-advisory fee arrangements are fair and reasonable in light of all of the surrounding circumstances and that the fund's Advisory Contracts should be renewed through July 31, 2024.
1.540016.126
FID-SANN-0224
Item 2.
Code of Ethics
Not applicable.
Item 3.
Audit Committee Financial Expert
Not applicable.
Item 4.
Principal Accountant Fees and Services
Not applicable.
Item 5.
Audit Committee of Listed Registrants
Not applicable.
Item 6.
Investments
(a)
Not applicable.
(b)
Not applicable
Item 7.
Disclosure of Proxy Voting Policies and Procedures for Closed-End Management Investment Companies
Not applicable.
Item 8.
Portfolio Managers of Closed-End Management Investment Companies
Not applicable.
Item 9.
Purchase of Equity Securities by Closed-End Management Investment Company and Affiliated Purchasers
Not applicable.
Item 10.
Submission of Matters to a Vote of Security Holders
There were no material changes to the procedures by which shareholders may recommend nominees to the Fidelity Hastings Street Trust’s Board of Trustees.
Item 11.
Controls and Procedures
(a)(i) The President and Treasurer and the Chief Financial Officer have concluded that the Fidelity Hastings Street Trust’s (the ��Trust”) disclosure controls and procedures (as defined in Rule 30a-3(c) under the Investment Company Act) provide reasonable
assurances that material information relating to the Trust is made known to them by the appropriate persons, based on their evaluation of these controls and procedures as of a date within 90 days of the filing date of this report.
(a)(ii) There was no change in the Trust’s internal control over financial reporting (as defined in Rule 30a-3(d) under the Investment Company Act) that occurred during the period covered by this report that has materially affected, or is reasonably likely to materially affect, the Trust’s internal control over financial reporting.
Item 12.
Disclosure of Securities Lending Activities for Closed-End Management
Investment Companies
Not applicable.
Item 18.
Recovery of Erroneously Awarded Compensation
(a) Not applicable.
(b) Not applicable.
Item 19.
Exhibits
SIGNATURES
Pursuant to the requirements of the Securities Exchange Act of 1934 and the Investment Company Act of 1940, the registrant has duly caused this report to be signed on its behalf by the undersigned, thereunto duly authorized.
Fidelity Hastings Street Trust
| |
By: | /s/Stacie M. Smith |
| Stacie M. Smith |
| President and Treasurer |
|
|
Date: | February 22, 2024 |
Pursuant to the requirements of the Securities Exchange Act of 1934 and the Investment Company Act of 1940, this report has been signed below by the following persons on behalf of the registrant and in the capacities and on the dates indicated.
| |
By: | /s/Stacie M. Smith |
| Stacie M. Smith |
| President and Treasurer |
|
|
Date: | February 22, 2024 |
| |
By: | /s/John J. Burke III |
| John J. Burke III |
| Chief Financial Officer |
|
|
Date: | February 22, 2024 |