UNITED STATES
SECURITIES AND EXCHANGE COMMISSION
Washington, D.C. 20549
FORM N-CSR
CERTIFIED SHAREHOLDER REPORT OF REGISTERED
MANAGEMENT INVESTMENT COMPANIES
Investment Company Act file number 811-00215
Fidelity Hastings Street Trust
(Exact name of registrant as specified in charter)
245 Summer St., Boston, Massachusetts 02210
(Address of principal executive offices) (Zip code)
Margaret Carey, Secretary
245 Summer St.
Boston, Massachusetts 02210
(Name and address of agent for service)
Registrant's telephone number, including area code:
617-563-7000
Date of fiscal year end: | June 30 |
Date of reporting period: | June 30, 2024 |
Item 1.
Reports to Stockholders
ANNUAL SHAREHOLDER REPORT | AS OF JUNE 30, 2024 | This report describes changes to the Fund that occurred during the reporting period. | |
| | Fidelity® Growth Discovery Fund Fidelity® Growth Discovery Fund : FDSVX | |
prospectus/sec. You can also request this information by contacting us at 1-800-544-8544 or by sending an e-mail to fidfunddocuments@fidelity.com.
| Costs of a $10,000 investment | Costs paid as a percentage of a $10,000 investment | ||
| Fidelity® Growth Discovery Fund | $ 81 | 0.69% |
- •U.S. equities gained considerably for the 12 months ending June 30, 2024, driven by resilient corporate profits, a frenzy over generative artificial intelligence and the Federal Reserve's likely pivot to cutting interest rates later this year. Amid this favorable backdrop for higher-risk assets, stocks continued their late-2023 momentum, powered by signs of continued U.S. economic strength.
- •Against this backdrop, security selection was the primary contributor versus the benchmark, especially within industrials. Stock picking in information technology also helped, as did stock picks and an underweight in consumer discretionary, primarily within the automobiles & components industry. Also helping our relative result was stock selection in health care, primarily within the health care equipment & services industry.
- •The top individual relative contributor was Nvidia (+204%), one of the fund's largest holdings. This period we decreased our position in Nvidia. The second-largest relative contributor was an underweight in Apple (+9%). Apple was one of our biggest holdings. This period we increased our investment in Apple. Not owning Tesla, a benchmark component that returned approximately -24%, was another notable relative contributor.
- •In contrast, the biggest detractor from performance versus the benchmark was an overweight in industrials. Also hurting our result were stock picks in communication services and financials.
- •The largest individual relative detractor was an overweight in MongoDB (-39%). This period we increased our stake in MongoDB. A second notable relative detractor was an underweight in Meta Platforms (+76%). This was an investment we established this period. Not owning Broadcom, a benchmark component that gained approximately 88%, was another notable relative detractor.
- •Notable changes in positioning include decreased exposure to energy and a higher allocation to information technology.
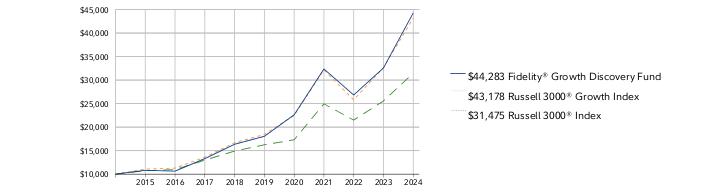
Fidelity® Growth Discovery Fund | $10,000 | $10,817 | $10,635 | $13,303 | $16,354 | $18,044 | $22,616 | $32,364 | $26,828 | $32,586 | $44,283 |
Russell 3000® Growth Index | $10,000 | $11,069 | $11,277 | $13,614 | $16,673 | $18,441 | $22,487 | $32,154 | $25,795 | $32,657 | $43,178 |
Russell 3000® Index | $10,000 | $10,729 | $10,959 | $12,987 | $14,907 | $16,246 | $17,306 | $24,950 | $21,490 | $25,563 | $31,475 |
| 2014 | 2015 | 2016 | 2017 | 2018 | 2019 | 2020 | 2021 | 2022 | 2023 | 2024 |
 |
| 1 Year | 5 Year | 10 Year | |
| Fidelity® Growth Discovery Fund | 35.89% | 19.67% | 16.04% |
| Russell 3000® Growth Index | 32.22% | 18.55% | 15.75% |
| Russell 3000® Index | 23.13% | 14.14% | 12.15% |
Visit www.fidelity.com for more recent performance information. |
The Fund's past performance is not a good predictor of the Fund's future performance. The graph and table do not reflect the deduction of taxes that a shareholder would pay on fund distributions or redemption of fund shares. |
KEY FACTS | ||
| Fund Size | $5,889,059,506 | |
| Number of Holdings | 148 | |
| Total Advisory Fee | $25,128,455 | |
| Portfolio Turnover | 41% |
(as of June 30, 2024)
MARKET SECTORS (% of Fund's net assets) | ||
| Information Technology | 43.5 | |
| Health Care | 14.9 | |
| Industrials | 12.2 | |
| Communication Services | 10.9 | |
| Consumer Discretionary | 9.0 | |
| Financials | 5.6 | |
| Energy | 2.5 | |
| Consumer Staples | 0.6 | |
| Materials | 0.2 | |
| Common Stocks | 99.3 |
| Preferred Stocks | 0.1 |
| Preferred Securities | 0.0 |
| Bonds | 0.0 |
| Short-Term Investments and Net Other Assets (Liabilities) | 0.6 |
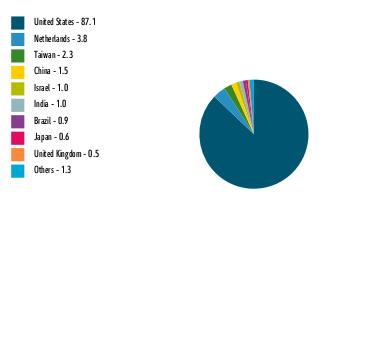
ASSET ALLOCATION (% of Fund's net assets) |
 |
| United States | 87.1 |
| Netherlands | 3.8 |
| Taiwan | 2.3 |
| China | 1.5 |
| Israel | 1.0 |
| India | 1.0 |
| Brazil | 0.9 |
| Japan | 0.6 |
| United Kingdom | 0.5 |
| Others | 1.3 |
GEOGRAPHIC DIVERSIFICATION (% of Fund's net assets) |
 |
TOP HOLDINGS (% of Fund's net assets) | ||
| Microsoft Corp | 12.9 | |
| Apple Inc | 12.3 | |
| Alphabet Inc Class A | 5.1 | |
| Amazon.com Inc | 5.0 | |
| NVIDIA Corp | 4.7 | |
| Uber Technologies Inc | 4.1 | |
| Eli Lilly & Co | 2.8 | |
| Boston Scientific Corp | 2.5 | |
| Taiwan Semiconductor Manufacturing Co Ltd ADR | 2.3 | |
| Netflix Inc | 1.9 | |
| 53.6 | ||
The fees associated with this class changed during the reporting year. The variations in class fees are primarily the result of the following changes:
|
| Fidelity, the Fidelity Investments Logo and all other Fidelity trademarks or service marks used herein are trademarks or service marks of FMR LLC. Any third-party marks that are used herein are trademarks or service marks of their respective owners. © 2024 FMR LLC. All rights reserved. | ||
 | For additional information about the Fund; including its prospectus, financial information, holdings and proxy information, scan the QR code or visit fundresearch.fidelity.com/prospectus/sec 1.9913353.100 339-TSRA-0824 | |
ANNUAL SHAREHOLDER REPORT | AS OF JUNE 30, 2024 | This report describes changes to the Fund that occurred during the reporting period. | |
| | Fidelity® Mega Cap Stock Fund Fidelity Advisor® Mega Cap Stock Fund Class M : FTGRX | |
prospectus/sec. You can also request this information by contacting us at 1-877-208-0098 or by sending an e-mail to fidfunddocuments@fidelity.com.
| Costs of a $10,000 investment | Costs paid as a percentage of a $10,000 investment | ||
| Class M | $ 127 | 1.11% |
Class M | $9,650 | $10,184 | $9,896 | $11,892 | $13,120 | $14,011 | $14,220 | $21,215 | $18,787 | $23,251 | $29,716 |
Russell Top 200® Index | $10,000 | $10,770 | $11,197 | $13,285 | $15,334 | $17,003 | $18,907 | $26,623 | $23,573 | $28,494 | $36,307 |
S&P 500® Index | $10,000 | $10,742 | $11,171 | $13,170 | $15,064 | $16,633 | $17,881 | $25,175 | $22,503 | $26,912 | $33,521 |
| 2014 | 2015 | 2016 | 2017 | 2018 | 2019 | 2020 | 2021 | 2022 | 2023 | 2024 |
 |
| 1 Year | 5 Year | 10 Year | |
| Class M (incl. 3.50% sales charge) | 23.33% | 15.40% | 11.51% |
| Class M (without 3.50% sales charge) | 27.81% | 16.23% | 11.90% |
| Russell Top 200® Index | 27.42% | 16.38% | 13.76% |
| S&P 500® Index | 24.56% | 15.05% | 12.86% |
Visit institutional.fidelity.com for more recent performance information. |
The Fund's past performance is not a good predictor of the Fund's future performance. The graph and table do not reflect the deduction of taxes that a shareholder would pay on fund distributions or redemption of fund shares. |
KEY FACTS | ||
| Fund Size | $3,058,386,375 | |
| Number of Holdings | 107 | |
| Total Advisory Fee | $10,683,074 | |
| Portfolio Turnover | 9% |
(as of June 30, 2024)
MARKET SECTORS (% of Fund's net assets) | ||
| Information Technology | 26.9 | |
| Financials | 14.7 | |
| Industrials | 11.8 | |
| Communication Services | 10.2 | |
| Energy | 9.1 | |
| Health Care | 8.5 | |
| Consumer Staples | 5.0 | |
| Consumer Discretionary | 3.2 | |
| Materials | 1.4 | |
| Utilities | 0.9 | |
| Real Estate | 0.8 | |
| Common Stocks | 92.5 |
| Short-Term Investments and Net Other Assets (Liabilities) | 7.5 |
ASSET ALLOCATION (% of Fund's net assets) |
 |
| United States | 94.1 |
| Canada | 1.1 |
| Germany | 0.9 |
| Taiwan | 0.8 |
| Netherlands | 0.8 |
| United Kingdom | 0.7 |
| France | 0.5 |
| Zambia | 0.5 |
| Japan | 0.3 |
| Others | 0.3 |
GEOGRAPHIC DIVERSIFICATION (% of Fund's net assets) |
 |
TOP HOLDINGS (% of Fund's net assets) | ||
| Microsoft Corp | 8.8 | |
| Exxon Mobil Corp | 6.3 | |
| NVIDIA Corp | 5.6 | |
| Wells Fargo & Co | 5.1 | |
| General Electric Co | 4.8 | |
| Apple Inc | 3.6 | |
| Meta Platforms Inc Class A | 3.3 | |
| Bank of America Corp | 3.0 | |
| Boeing Co | 2.7 | |
| Alphabet Inc Class A | 2.5 | |
| 45.7 | ||
The fees associated with this class changed during the reporting year. The variations in class fees are primarily the result of the following changes:
|
| Fidelity, the Fidelity Investments Logo and all other Fidelity trademarks or service marks used herein are trademarks or service marks of FMR LLC. Any third-party marks that are used herein are trademarks or service marks of their respective owners. © 2024 FMR LLC. All rights reserved. | ||
 | For additional information about the Fund; including its prospectus, financial information, holdings and proxy information, scan the QR code or visit fundresearch.fidelity.com/prospectus/sec 1.9913356.100 2037-TSRA-0824 | |
ANNUAL SHAREHOLDER REPORT | AS OF JUNE 30, 2024 | This report describes changes to the Fund that occurred during the reporting period. | |
| | Fidelity® Mega Cap Stock Fund Fidelity® Mega Cap Stock Fund : FGRTX | |
prospectus/sec. You can also request this information by contacting us at 1-800-544-8544 or by sending an e-mail to fidfunddocuments@fidelity.com.
| Costs of a $10,000 investment | Costs paid as a percentage of a $10,000 investment | ||
| Fidelity® Mega Cap Stock Fund | $ 69 | 0.60% |
Fidelity® Mega Cap Stock Fund | $10,000 | $10,613 | $10,362 | $12,526 | $13,886 | $14,904 | $15,215 | $22,817 | $20,308 | $25,275 | $32,464 |
Russell Top 200® Index | $10,000 | $10,770 | $11,197 | $13,285 | $15,334 | $17,003 | $18,907 | $26,623 | $23,573 | $28,494 | $36,307 |
S&P 500® Index | $10,000 | $10,742 | $11,171 | $13,170 | $15,064 | $16,633 | $17,881 | $25,175 | $22,503 | $26,912 | $33,521 |
| 2014 | 2015 | 2016 | 2017 | 2018 | 2019 | 2020 | 2021 | 2022 | 2023 | 2024 |
 |
| 1 Year | 5 Year | 10 Year | |
| Fidelity® Mega Cap Stock Fund | 28.44% | 16.85% | 12.50% |
| Russell Top 200® Index | 27.42% | 16.38% | 13.76% |
| S&P 500® Index | 24.56% | 15.05% | 12.86% |
Visit www.fidelity.com for more recent performance information. |
The Fund's past performance is not a good predictor of the Fund's future performance. The graph and table do not reflect the deduction of taxes that a shareholder would pay on fund distributions or redemption of fund shares. |
KEY FACTS | ||
| Fund Size | $3,058,386,375 | |
| Number of Holdings | 107 | |
| Total Advisory Fee | $10,683,074 | |
| Portfolio Turnover | 9% |
(as of June 30, 2024)
MARKET SECTORS (% of Fund's net assets) | ||
| Information Technology | 26.9 | |
| Financials | 14.7 | |
| Industrials | 11.8 | |
| Communication Services | 10.2 | |
| Energy | 9.1 | |
| Health Care | 8.5 | |
| Consumer Staples | 5.0 | |
| Consumer Discretionary | 3.2 | |
| Materials | 1.4 | |
| Utilities | 0.9 | |
| Real Estate | 0.8 | |
| Common Stocks | 92.5 |
| Short-Term Investments and Net Other Assets (Liabilities) | 7.5 |
ASSET ALLOCATION (% of Fund's net assets) |
|
| United States | 94.1 |
| Canada | 1.1 |
| Germany | 0.9 |
| Taiwan | 0.8 |
| Netherlands | 0.8 |
| United Kingdom | 0.7 |
| France | 0.5 |
| Zambia | 0.5 |
| Japan | 0.3 |
| Others | 0.3 |
GEOGRAPHIC DIVERSIFICATION (% of Fund's net assets) |
|
TOP HOLDINGS (% of Fund's net assets) | ||
| Microsoft Corp | 8.8 | |
| Exxon Mobil Corp | 6.3 | |
| NVIDIA Corp | 5.6 | |
| Wells Fargo & Co | 5.1 | |
| General Electric Co | 4.8 | |
| Apple Inc | 3.6 | |
| Meta Platforms Inc Class A | 3.3 | |
| Bank of America Corp | 3.0 | |
| Boeing Co | 2.7 | |
| Alphabet Inc Class A | 2.5 | |
| 45.7 | ||
The fund's transfer agent and pricing & bookkeeping fees were changed to a fixed rate effective December 1, 2023, through February 29, 2024, in anticipation of the transition to a new management fee structure. Effective March 1, 2024, the fund's management contract was amended to incorporate administrative services previously covered under separate services agreements (transfer agent and pricing & bookkeeping). The amended contract incorporates a management fee rate that may vary by class. The Adviser or an affiliate pays certain expenses of managing and operating the fund out of each class's management fee. |
| Fidelity, the Fidelity Investments Logo and all other Fidelity trademarks or service marks used herein are trademarks or service marks of FMR LLC. Any third-party marks that are used herein are trademarks or service marks of their respective owners. © 2024 FMR LLC. All rights reserved. | ||
 | For additional information about the Fund; including its prospectus, financial information, holdings and proxy information, scan the QR code or visit fundresearch.fidelity.com/prospectus/sec 1.9913359.100 361-TSRA-0824 | |
ANNUAL SHAREHOLDER REPORT | AS OF JUNE 30, 2024 | This report describes changes to the Fund that occurred during the reporting period. | |
| | Fidelity® Mega Cap Stock Fund Fidelity Advisor® Mega Cap Stock Fund Class Z : FZALX | |
prospectus/sec. You can also request this information by contacting us at 1-877-208-0098 or by sending an e-mail to fidfunddocuments@fidelity.com.
| Costs of a $10,000 investment | Costs paid as a percentage of a $10,000 investment | ||
| Class Z | $ 58 | 0.51% |
Class Z | $10,000 | $10,633 | $10,397 | $12,577 | $13,971 | $15,015 | $15,342 | $23,034 | $20,519 | $25,570 | $32,880 |
Russell Top 200® Index | $10,000 | $10,770 | $11,197 | $13,285 | $15,334 | $17,003 | $18,907 | $26,623 | $23,573 | $28,494 | $36,307 |
S&P 500® Index | $10,000 | $10,742 | $11,171 | $13,170 | $15,064 | $16,633 | $17,881 | $25,175 | $22,503 | $26,912 | $33,521 |
| 2014 | 2015 | 2016 | 2017 | 2018 | 2019 | 2020 | 2021 | 2022 | 2023 | 2024 |
 |
| 1 Year | 5 Year | 10 Year | |
| Class Z | 28.59% | 16.97% | 12.64% |
| Russell Top 200® Index | 27.42% | 16.38% | 13.76% |
| S&P 500® Index | 24.56% | 15.05% | 12.86% |
Visit institutional.fidelity.com for more recent performance information. |
The Fund's past performance is not a good predictor of the Fund's future performance. The graph and table do not reflect the deduction of taxes that a shareholder would pay on fund distributions or redemption of fund shares. |
KEY FACTS | ||
| Fund Size | $3,058,386,375 | |
| Number of Holdings | 107 | |
| Total Advisory Fee | $10,683,074 | |
| Portfolio Turnover | 9% |
(as of June 30, 2024)
MARKET SECTORS (% of Fund's net assets) | ||
| Information Technology | 26.9 | |
| Financials | 14.7 | |
| Industrials | 11.8 | |
| Communication Services | 10.2 | |
| Energy | 9.1 | |
| Health Care | 8.5 | |
| Consumer Staples | 5.0 | |
| Consumer Discretionary | 3.2 | |
| Materials | 1.4 | |
| Utilities | 0.9 | |
| Real Estate | 0.8 | |
| Common Stocks | 92.5 |
| Short-Term Investments and Net Other Assets (Liabilities) | 7.5 |
ASSET ALLOCATION (% of Fund's net assets) |
|
| United States | 94.1 |
| Canada | 1.1 |
| Germany | 0.9 |
| Taiwan | 0.8 |
| Netherlands | 0.8 |
| United Kingdom | 0.7 |
| France | 0.5 |
| Zambia | 0.5 |
| Japan | 0.3 |
| Others | 0.3 |
GEOGRAPHIC DIVERSIFICATION (% of Fund's net assets) |
|
TOP HOLDINGS (% of Fund's net assets) | ||
| Microsoft Corp | 8.8 | |
| Exxon Mobil Corp | 6.3 | |
| NVIDIA Corp | 5.6 | |
| Wells Fargo & Co | 5.1 | |
| General Electric Co | 4.8 | |
| Apple Inc | 3.6 | |
| Meta Platforms Inc Class A | 3.3 | |
| Bank of America Corp | 3.0 | |
| Boeing Co | 2.7 | |
| Alphabet Inc Class A | 2.5 | |
| 45.7 | ||
The fund's transfer agent and pricing & bookkeeping fees were changed to a fixed rate effective December 1, 2023, through February 29, 2024, in anticipation of the transition to a new management fee structure. Effective March 1, 2024, the fund's management contract was amended to incorporate administrative services previously covered under separate services agreements (transfer agent and pricing & bookkeeping). The amended contract incorporates a management fee rate that may vary by class. The Adviser or an affiliate pays certain expenses of managing and operating the fund out of each class's management fee. |
| Fidelity, the Fidelity Investments Logo and all other Fidelity trademarks or service marks used herein are trademarks or service marks of FMR LLC. Any third-party marks that are used herein are trademarks or service marks of their respective owners. © 2024 FMR LLC. All rights reserved. | ||
 | For additional information about the Fund; including its prospectus, financial information, holdings and proxy information, scan the QR code or visit fundresearch.fidelity.com/prospectus/sec 1.9913358.100 2537-TSRA-0824 | |
ANNUAL SHAREHOLDER REPORT | AS OF JUNE 30, 2024 | This report describes changes to the Fund that occurred during the reporting period. | |
| | Fidelity® Mega Cap Stock Fund Fidelity Advisor® Mega Cap Stock Fund Class C : FGRCX | |
prospectus/sec. You can also request this information by contacting us at 1-877-208-0098 or by sending an e-mail to fidfunddocuments@fidelity.com.
| Costs of a $10,000 investment | Costs paid as a percentage of a $10,000 investment | ||
| Class C | $ 188 | 1.65% |
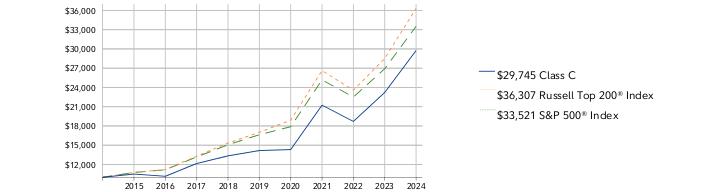
Class C | $10,000 | $10,505 | $10,156 | $12,146 | $13,337 | $14,169 | $14,318 | $21,234 | $18,707 | $23,215 | $29,745 |
Russell Top 200® Index | $10,000 | $10,770 | $11,197 | $13,285 | $15,334 | $17,003 | $18,907 | $26,623 | $23,573 | $28,494 | $36,307 |
S&P 500® Index | $10,000 | $10,742 | $11,171 | $13,170 | $15,064 | $16,633 | $17,881 | $25,175 | $22,503 | $26,912 | $33,521 |
| 2014 | 2015 | 2016 | 2017 | 2018 | 2019 | 2020 | 2021 | 2022 | 2023 | 2024 |
 |
| 1 Year | 5 Year | 10 Year | |
| Class C (incl. contingent deferred sales charge) | 26.12% | 15.62% | 11.52% |
| Class C | 27.12% | 15.62% | 11.52% |
| Russell Top 200® Index | 27.42% | 16.38% | 13.76% |
| S&P 500® Index | 24.56% | 15.05% | 12.86% |
Visit institutional.fidelity.com for more recent performance information. |
The Fund's past performance is not a good predictor of the Fund's future performance. The graph and table do not reflect the deduction of taxes that a shareholder would pay on fund distributions or redemption of fund shares. |
KEY FACTS | ||
| Fund Size | $3,058,386,375 | |
| Number of Holdings | 107 | |
| Total Advisory Fee | $10,683,074 | |
| Portfolio Turnover | 9% |
(as of June 30, 2024)
MARKET SECTORS (% of Fund's net assets) | ||
| Information Technology | 26.9 | |
| Financials | 14.7 | |
| Industrials | 11.8 | |
| Communication Services | 10.2 | |
| Energy | 9.1 | |
| Health Care | 8.5 | |
| Consumer Staples | 5.0 | |
| Consumer Discretionary | 3.2 | |
| Materials | 1.4 | |
| Utilities | 0.9 | |
| Real Estate | 0.8 | |
| Common Stocks | 92.5 |
| Short-Term Investments and Net Other Assets (Liabilities) | 7.5 |
ASSET ALLOCATION (% of Fund's net assets) |
|
| United States | 94.1 |
| Canada | 1.1 |
| Germany | 0.9 |
| Taiwan | 0.8 |
| Netherlands | 0.8 |
| United Kingdom | 0.7 |
| France | 0.5 |
| Zambia | 0.5 |
| Japan | 0.3 |
| Others | 0.3 |
GEOGRAPHIC DIVERSIFICATION (% of Fund's net assets) |
|
TOP HOLDINGS (% of Fund's net assets) | ||
| Microsoft Corp | 8.8 | |
| Exxon Mobil Corp | 6.3 | |
| NVIDIA Corp | 5.6 | |
| Wells Fargo & Co | 5.1 | |
| General Electric Co | 4.8 | |
| Apple Inc | 3.6 | |
| Meta Platforms Inc Class A | 3.3 | |
| Bank of America Corp | 3.0 | |
| Boeing Co | 2.7 | |
| Alphabet Inc Class A | 2.5 | |
| 45.7 | ||
The fund's transfer agent and pricing & bookkeeping fees were changed to a fixed rate effective December 1, 2023, through February 29, 2024, in anticipation of the transition to a new management fee structure. Effective March 1, 2024, the fund's management contract was amended to incorporate administrative services previously covered under separate services agreements (transfer agent and pricing & bookkeeping). The amended contract incorporates a management fee rate that may vary by class. The Adviser or an affiliate pays certain expenses of managing and operating the fund out of each class's management fee. |
| Fidelity, the Fidelity Investments Logo and all other Fidelity trademarks or service marks used herein are trademarks or service marks of FMR LLC. Any third-party marks that are used herein are trademarks or service marks of their respective owners. © 2024 FMR LLC. All rights reserved. | ||
 | For additional information about the Fund; including its prospectus, financial information, holdings and proxy information, scan the QR code or visit fundresearch.fidelity.com/prospectus/sec 1.9913355.100 2036-TSRA-0824 | |
ANNUAL SHAREHOLDER REPORT | AS OF JUNE 30, 2024 | This report describes changes to the Fund that occurred during the reporting period. | |
| | Fidelity® Mega Cap Stock Fund Fidelity Advisor® Mega Cap Stock Fund Class I : FTRIX | |
prospectus/sec. You can also request this information by contacting us at 1-877-208-0098 or by sending an e-mail to fidfunddocuments@fidelity.com.
| Costs of a $10,000 investment | Costs paid as a percentage of a $10,000 investment | ||
| Class I | $ 71 | 0.62% |
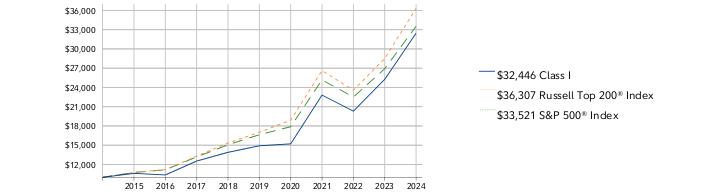
Class I | $10,000 | $10,611 | $10,366 | $12,527 | $13,888 | $14,907 | $15,211 | $22,812 | $20,302 | $25,261 | $32,446 |
Russell Top 200® Index | $10,000 | $10,770 | $11,197 | $13,285 | $15,334 | $17,003 | $18,907 | $26,623 | $23,573 | $28,494 | $36,307 |
S&P 500® Index | $10,000 | $10,742 | $11,171 | $13,170 | $15,064 | $16,633 | $17,881 | $25,175 | $22,503 | $26,912 | $33,521 |
| 2014 | 2015 | 2016 | 2017 | 2018 | 2019 | 2020 | 2021 | 2022 | 2023 | 2024 |
 |
| 1 Year | 5 Year | 10 Year | |
| Class I | 28.45% | 16.83% | 12.49% |
| Russell Top 200® Index | 27.42% | 16.38% | 13.76% |
| S&P 500® Index | 24.56% | 15.05% | 12.86% |
Visit institutional.fidelity.com for more recent performance information. |
The Fund's past performance is not a good predictor of the Fund's future performance. The graph and table do not reflect the deduction of taxes that a shareholder would pay on fund distributions or redemption of fund shares. |
KEY FACTS | ||
| Fund Size | $3,058,386,375 | |
| Number of Holdings | 107 | |
| Total Advisory Fee | $10,683,074 | |
| Portfolio Turnover | 9% |
(as of June 30, 2024)
MARKET SECTORS (% of Fund's net assets) | ||
| Information Technology | 26.9 | |
| Financials | 14.7 | |
| Industrials | 11.8 | |
| Communication Services | 10.2 | |
| Energy | 9.1 | |
| Health Care | 8.5 | |
| Consumer Staples | 5.0 | |
| Consumer Discretionary | 3.2 | |
| Materials | 1.4 | |
| Utilities | 0.9 | |
| Real Estate | 0.8 | |
| Common Stocks | 92.5 |
| Short-Term Investments and Net Other Assets (Liabilities) | 7.5 |
ASSET ALLOCATION (% of Fund's net assets) |
|
| United States | 94.1 |
| Canada | 1.1 |
| Germany | 0.9 |
| Taiwan | 0.8 |
| Netherlands | 0.8 |
| United Kingdom | 0.7 |
| France | 0.5 |
| Zambia | 0.5 |
| Japan | 0.3 |
| Others | 0.3 |
GEOGRAPHIC DIVERSIFICATION (% of Fund's net assets) |
|
TOP HOLDINGS (% of Fund's net assets) | ||
| Microsoft Corp | 8.8 | |
| Exxon Mobil Corp | 6.3 | |
| NVIDIA Corp | 5.6 | |
| Wells Fargo & Co | 5.1 | |
| General Electric Co | 4.8 | |
| Apple Inc | 3.6 | |
| Meta Platforms Inc Class A | 3.3 | |
| Bank of America Corp | 3.0 | |
| Boeing Co | 2.7 | |
| Alphabet Inc Class A | 2.5 | |
| 45.7 | ||
The fund's transfer agent and pricing & bookkeeping fees were changed to a fixed rate effective December 1, 2023, through February 29, 2024, in anticipation of the transition to a new management fee structure. Effective March 1, 2024, the fund's management contract was amended to incorporate administrative services previously covered under separate services agreements (transfer agent and pricing & bookkeeping). The amended contract incorporates a management fee rate that may vary by class. The Adviser or an affiliate pays certain expenses of managing and operating the fund out of each class's management fee. |
| Fidelity, the Fidelity Investments Logo and all other Fidelity trademarks or service marks used herein are trademarks or service marks of FMR LLC. Any third-party marks that are used herein are trademarks or service marks of their respective owners. © 2024 FMR LLC. All rights reserved. | ||
 | For additional information about the Fund; including its prospectus, financial information, holdings and proxy information, scan the QR code or visit fundresearch.fidelity.com/prospectus/sec 1.9913357.100 2038-TSRA-0824 | |
ANNUAL SHAREHOLDER REPORT | AS OF JUNE 30, 2024 | ||
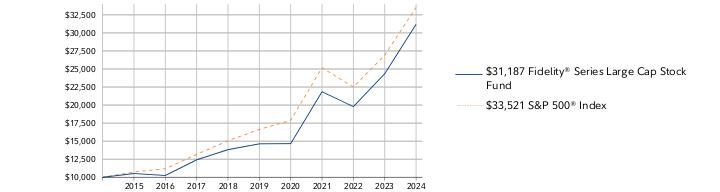
| | Fidelity® Series Large Cap Stock Fund Fidelity® Series Large Cap Stock Fund : FGLGX | |
prospectus/sec. You can also request this information by contacting us at 1-800-544-8544.
| Costs of a $10,000 investment | Costs paid as a percentage of a $10,000 investment | ||
| Fidelity® Series Large Cap Stock Fund | $ 0 A | 0.00%B |
- •U.S. equities gained considerably for the 12 months ending June 30, 2024, driven by resilient corporate profits, a frenzy over generative artificial intelligence and the Federal Reserve's likely pivot to cutting interest rates later this year. Amid this favorable backdrop for higher-risk assets, stocks continued their late-2023 momentum, powered by signs of continued U.S. economic strength.
- •Against this backdrop, security selection was the primary contributor versus the benchmark, led by industrials, where our stock picks in capital goods helped most. Stock selection in financials also contributed, as did an underweight in consumer discretionary, primarily within the automobiles & components industry. Also lifting the fund's relative result was stock picking in health care, primarily within the health care equipment & services industry.
- •The top individual relative contributor was an overweight in General Electric (+83%), one of the fund's largest holdings. The second-biggest relative contributor was an overweight in Wells Fargo (+43%), which was among our biggest holdings. Not owning Tesla, a benchmark component that returned roughly -24%, was another notable relative contributor.
- •In contrast, the biggest detractor from performance versus the benchmark was an underweight in information technology, primarily within the semiconductors & semiconductor equipment industry. Stock selection in communication services also hampered the fund's result, as did an overweight in industrials.
- •The largest individual relative detractor was an underweight in Nvidia (+192%), one of the fund's biggest holdings. This period we increased Nvidia. A second notable relative detractor was an overweight in Boeing (-14%), which was among the largest holdings. An overweight in Exxon Mobil (+11%) also detracted. Exxon Mobil was one of the fund's biggest holdings.
- •Notable changes in positioning include increased exposure to information technology.
Fidelity® Series Large Cap Stock Fund | $10,000 | $10,521 | $10,251 | $12,419 | $13,828 | $14,635 | $14,660 | $21,851 | $19,787 | $24,345 | $31,187 |
S&P 500® Index | $10,000 | $10,742 | $11,171 | $13,170 | $15,064 | $16,633 | $17,881 | $25,175 | $22,503 | $26,912 | $33,521 |
| 2014 | 2015 | 2016 | 2017 | 2018 | 2019 | 2020 | 2021 | 2022 | 2023 | 2024 |
 |
| 1 Year | 5 Year | 10 Year | |
| Fidelity® Series Large Cap Stock Fund | 28.11% | 16.34% | 12.05% |
| S&P 500® Index | 24.56% | 15.05% | 12.86% |
Visit www.fidelity.com for more recent performance information. |
The Fund's past performance is not a good predictor of the Fund's future performance. The graph and table do not reflect the deduction of taxes that a shareholder would pay on fund distributions or redemption of fund shares. |
KEY FACTS | ||
| Fund Size | $18,663,863,249 | |
| Number of Holdings | 180 | |
| Total Advisory Fee | $0 | |
| Portfolio Turnover | 18% |
(as of June 30, 2024)
MARKET SECTORS (% of Fund's net assets) | ||
| Information Technology | 23.7 | |
| Financials | 16.1 | |
| Industrials | 15.6 | |
| Health Care | 11.5 | |
| Communication Services | 10.2 | |
| Energy | 9.4 | |
| Consumer Staples | 4.9 | |
| Consumer Discretionary | 3.2 | |
| Materials | 1.9 | |
| Utilities | 1.0 | |
| Real Estate | 0.9 | |
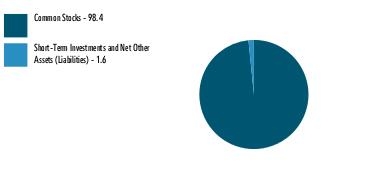
| Common Stocks | 98.4 |
| Short-Term Investments and Net Other Assets (Liabilities) | 1.6 |
ASSET ALLOCATION (% of Fund's net assets) |
 |
| United States | 92.1 |
| Canada | 1.9 |
| Germany | 1.0 |
| Zambia | 0.9 |
| Belgium | 0.7 |
| Netherlands | 0.7 |
| France | 0.6 |
| United Kingdom | 0.6 |
| Taiwan | 0.4 |
| Others | 1.1 |
GEOGRAPHIC DIVERSIFICATION (% of Fund's net assets) |
 |
TOP HOLDINGS (% of Fund's net assets) | ||
| Microsoft Corp | 8.0 | |
| Exxon Mobil Corp | 6.2 | |
| Wells Fargo & Co | 5.5 | |
| General Electric Co | 5.2 | |
| NVIDIA Corp | 4.8 | |
| Meta Platforms Inc Class A | 2.8 | |
| Apple Inc | 2.8 | |
| Bank of America Corp | 2.7 | |
| Boeing Co | 2.5 | |
| Alphabet Inc Class A | 2.1 | |
| 42.6 | ||
| Fidelity, the Fidelity Investments Logo and all other Fidelity trademarks or service marks used herein are trademarks or service marks of FMR LLC. Any third-party marks that are used herein are trademarks or service marks of their respective owners. © 2024 FMR LLC. All rights reserved. | ||
 | For additional information about the Fund; including its prospectus, financial information, holdings and proxy information, scan the QR code or visit fundresearch.fidelity.com/prospectus/sec 1.9913361.100 2457-TSRA-0824 | |
ANNUAL SHAREHOLDER REPORT | AS OF JUNE 30, 2024 | This report describes changes to the Fund that occurred during the reporting period. | |
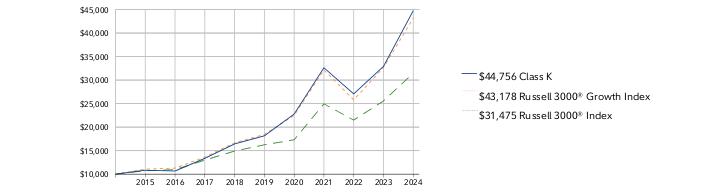
| | Fidelity® Growth Discovery Fund Fidelity® Growth Discovery Fund Class K : FGDKX | |
prospectus/sec. You can also request this information by contacting us at 1-800-835-5092 or by sending an e-mail to fidfunddocuments@fidelity.com.
| Costs of a $10,000 investment | Costs paid as a percentage of a $10,000 investment | ||
| Class K | $ 69 | 0.59% |
- •U.S. equities gained considerably for the 12 months ending June 30, 2024, driven by resilient corporate profits, a frenzy over generative artificial intelligence and the Federal Reserve's likely pivot to cutting interest rates later this year. Amid this favorable backdrop for higher-risk assets, stocks continued their late-2023 momentum, powered by signs of continued U.S. economic strength.
- •Against this backdrop, security selection was the primary contributor versus the benchmark, especially within industrials. Stock picking in information technology also helped, as did stock picks and an underweight in consumer discretionary, primarily within the automobiles & components industry. Also helping our relative result was stock selection in health care, primarily within the health care equipment & services industry.
- •The top individual relative contributor was Nvidia (+204%), one of the fund's largest holdings. This period we decreased our position in Nvidia. The second-largest relative contributor was an underweight in Apple (+9%). Apple was one of our biggest holdings. This period we increased our investment in Apple. Not owning Tesla, a benchmark component that returned approximately -24%, was another notable relative contributor.
- •In contrast, the biggest detractor from performance versus the benchmark was an overweight in industrials. Also hurting our result were stock picks in communication services and financials.
- •The largest individual relative detractor was an overweight in MongoDB (-39%). This period we increased our stake in MongoDB. A second notable relative detractor was an underweight in Meta Platforms (+76%). This was an investment we established this period. Not owning Broadcom, a benchmark component that gained approximately 88%, was another notable relative detractor.
- •Notable changes in positioning include decreased exposure to energy and a higher allocation to information technology.
Class K | $10,000 | $10,832 | $10,663 | $13,353 | $16,432 | $18,151 | $22,773 | $32,622 | $27,062 | $32,909 | $44,756 |
Russell 3000® Growth Index | $10,000 | $11,069 | $11,277 | $13,614 | $16,673 | $18,441 | $22,487 | $32,154 | $25,795 | $32,657 | $43,178 |
Russell 3000® Index | $10,000 | $10,729 | $10,959 | $12,987 | $14,907 | $16,246 | $17,306 | $24,950 | $21,490 | $25,563 | $31,475 |
| 2014 | 2015 | 2016 | 2017 | 2018 | 2019 | 2020 | 2021 | 2022 | 2023 | 2024 |
 |
| 1 Year | 5 Year | 10 Year | |
| Class K | 36.00% | 19.78% | 16.17% |
| Russell 3000® Growth Index | 32.22% | 18.55% | 15.75% |
| Russell 3000® Index | 23.13% | 14.14% | 12.15% |
Visit www.401k.com for more recent performance information. |
The Fund's past performance is not a good predictor of the Fund's future performance. The graph and table do not reflect the deduction of taxes that a shareholder would pay on fund distributions or redemption of fund shares. |
KEY FACTS | ||
| Fund Size | $5,889,059,506 | |
| Number of Holdings | 148 | |
| Total Advisory Fee | $25,128,455 | |
| Portfolio Turnover | 41% |
(as of June 30, 2024)
MARKET SECTORS (% of Fund's net assets) | ||
| Information Technology | 43.5 | |
| Health Care | 14.9 | |
| Industrials | 12.2 | |
| Communication Services | 10.9 | |
| Consumer Discretionary | 9.0 | |
| Financials | 5.6 | |
| Energy | 2.5 | |
| Consumer Staples | 0.6 | |
| Materials | 0.2 | |
| Common Stocks | 99.3 |
| Preferred Stocks | 0.1 |
| Preferred Securities | 0.0 |
| Bonds | 0.0 |
| Short-Term Investments and Net Other Assets (Liabilities) | 0.6 |
ASSET ALLOCATION (% of Fund's net assets) |
|
| United States | 87.1 |
| Netherlands | 3.8 |
| Taiwan | 2.3 |
| China | 1.5 |
| Israel | 1.0 |
| India | 1.0 |
| Brazil | 0.9 |
| Japan | 0.6 |
| United Kingdom | 0.5 |
| Others | 1.3 |
GEOGRAPHIC DIVERSIFICATION (% of Fund's net assets) |
|
TOP HOLDINGS (% of Fund's net assets) | ||
| Microsoft Corp | 12.9 | |
| Apple Inc | 12.3 | |
| Alphabet Inc Class A | 5.1 | |
| Amazon.com Inc | 5.0 | |
| NVIDIA Corp | 4.7 | |
| Uber Technologies Inc | 4.1 | |
| Eli Lilly & Co | 2.8 | |
| Boston Scientific Corp | 2.5 | |
| Taiwan Semiconductor Manufacturing Co Ltd ADR | 2.3 | |
| Netflix Inc | 1.9 | |
| 53.6 | ||
The fees associated with this class changed during the reporting year. The variations in class fees are primarily the result of the following changes:
|
| Fidelity, the Fidelity Investments Logo and all other Fidelity trademarks or service marks used herein are trademarks or service marks of FMR LLC. Any third-party marks that are used herein are trademarks or service marks of their respective owners. © 2024 FMR LLC. All rights reserved. | ||
 | For additional information about the Fund; including its prospectus, financial information, holdings and proxy information, scan the QR code or visit fundresearch.fidelity.com/prospectus/sec 1.9913352.100 2091-TSRA-0824 | |
ANNUAL SHAREHOLDER REPORT | AS OF JUNE 30, 2024 | This report describes changes to the Fund that occurred during the reporting period. | |
| | Fidelity® Mega Cap Stock Fund Fidelity Advisor® Mega Cap Stock Fund Class A : FGTAX | |
prospectus/sec. You can also request this information by contacting us at 1-877-208-0098 or by sending an e-mail to fidfunddocuments@fidelity.com.
| Costs of a $10,000 investment | Costs paid as a percentage of a $10,000 investment | ||
| Class A | $ 100 | 0.88% |
Class A | $9,425 | $9,962 | $9,707 | $11,696 | $12,937 | $13,841 | $14,087 | $21,075 | $18,705 | $23,213 | $29,742 |
Russell Top 200® Index | $10,000 | $10,770 | $11,197 | $13,285 | $15,334 | $17,003 | $18,907 | $26,623 | $23,573 | $28,494 | $36,307 |
S&P 500® Index | $10,000 | $10,742 | $11,171 | $13,170 | $15,064 | $16,633 | $17,881 | $25,175 | $22,503 | $26,912 | $33,521 |
| 2014 | 2015 | 2016 | 2017 | 2018 | 2019 | 2020 | 2021 | 2022 | 2023 | 2024 |
 |
| 1 Year | 5 Year | 10 Year | |
| Class A (incl. 5.75% sales charge) | 20.76% | 15.16% | 11.52% |
| Class A (without 5.75% sales charge) | 28.13% | 16.53% | 12.18% |
| Russell Top 200® Index | 27.42% | 16.38% | 13.76% |
| S&P 500® Index | 24.56% | 15.05% | 12.86% |
Visit institutional.fidelity.com for more recent performance information. |
The Fund's past performance is not a good predictor of the Fund's future performance. The graph and table do not reflect the deduction of taxes that a shareholder would pay on fund distributions or redemption of fund shares. |
KEY FACTS | ||
| Fund Size | $3,058,386,375 | |
| Number of Holdings | 107 | |
| Total Advisory Fee | $10,683,074 | |
| Portfolio Turnover | 9% |
(as of June 30, 2024)
MARKET SECTORS (% of Fund's net assets) | ||
| Information Technology | 26.9 | |
| Financials | 14.7 | |
| Industrials | 11.8 | |
| Communication Services | 10.2 | |
| Energy | 9.1 | |
| Health Care | 8.5 | |
| Consumer Staples | 5.0 | |
| Consumer Discretionary | 3.2 | |
| Materials | 1.4 | |
| Utilities | 0.9 | |
| Real Estate | 0.8 | |
| Common Stocks | 92.5 |
| Short-Term Investments and Net Other Assets (Liabilities) | 7.5 |
ASSET ALLOCATION (% of Fund's net assets) |
|
| United States | 94.1 |
| Canada | 1.1 |
| Germany | 0.9 |
| Taiwan | 0.8 |
| Netherlands | 0.8 |
| United Kingdom | 0.7 |
| France | 0.5 |
| Zambia | 0.5 |
| Japan | 0.3 |
| Others | 0.3 |
GEOGRAPHIC DIVERSIFICATION (% of Fund's net assets) |
|
TOP HOLDINGS (% of Fund's net assets) | ||
| Microsoft Corp | 8.8 | |
| Exxon Mobil Corp | 6.3 | |
| NVIDIA Corp | 5.6 | |
| Wells Fargo & Co | 5.1 | |
| General Electric Co | 4.8 | |
| Apple Inc | 3.6 | |
| Meta Platforms Inc Class A | 3.3 | |
| Bank of America Corp | 3.0 | |
| Boeing Co | 2.7 | |
| Alphabet Inc Class A | 2.5 | |
| 45.7 | ||
The fund's transfer agent and pricing & bookkeeping fees were changed to a fixed rate effective December 1, 2023, through February 29, 2024, in anticipation of the transition to a new management fee structure. Effective March 1, 2024, the fund's management contract was amended to incorporate administrative services previously covered under separate services agreements (transfer agent and pricing & bookkeeping). The amended contract incorporates a management fee rate that may vary by class. The Adviser or an affiliate pays certain expenses of managing and operating the fund out of each class's management fee. |
| Fidelity, the Fidelity Investments Logo and all other Fidelity trademarks or service marks used herein are trademarks or service marks of FMR LLC. Any third-party marks that are used herein are trademarks or service marks of their respective owners. © 2024 FMR LLC. All rights reserved. | ||
 | For additional information about the Fund; including its prospectus, financial information, holdings and proxy information, scan the QR code or visit fundresearch.fidelity.com/prospectus/sec 1.9913354.100 2034-TSRA-0824 | |
ANNUAL SHAREHOLDER REPORT | AS OF JUNE 30, 2024 | This report describes changes to the Fund that occurred during the reporting period. | |
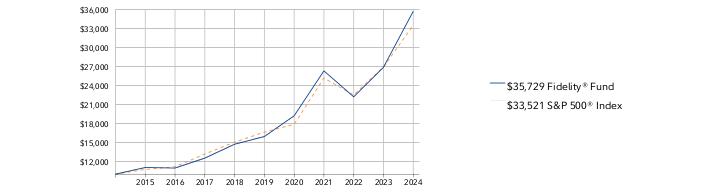
| | Fidelity® Fund Fidelity® Fund : FFIDX | |
prospectus/sec. You can also request this information by contacting us at 1-800-544-8544 or by sending an e-mail to fidfunddocuments@fidelity.com.
| Costs of a $10,000 investment | Costs paid as a percentage of a $10,000 investment | ||
| Fidelity® Fund | $ 51 | 0.44% |
- •U.S. equities gained considerably for the 12 months ending June 30, 2024, driven by resilient corporate profits, a frenzy over generative artificial intelligence and the Federal Reserve's likely pivot to cutting interest rates later this year. Amid this favorable backdrop for higher-risk assets, stocks continued their late-2023 momentum, powered by signs of continued U.S. economic strength.
- •Against this backdrop, the top contributor to performance versus the benchmark was stock selection in health care, primarily within the pharmaceuticals, biotechnology & life sciences industry. Stock picking in consumer discretionary also boosted relative performance, as did an overweight in information technology, primarily within the semiconductors & semiconductor equipment industry.
- •The top individual relative contributor was an overweight in Alphabet (+52%), one of our largest holdings. A second notable relative contributor this period was avoiding Tesla, a benchmark component that returned about -24%. An overweight in Nvidia (+192%) also helped. Nvidia was among our largest holdings.
- •In contrast, the biggest detractor from performance versus the benchmark was security selection in financials. An overweight in health care also hampered the fund's result, as did stock selection in energy. Lastly, the fund's position in cash detracted.
- •The fund's stake in Fortinet returned -23% and was the largest individual relative detractor. Fortinet was not held at period end. The second-largest relative detractor was an overweight in Apple (+10%). Apple was one of our largest holdings. An overweight in Builders FirstSource (-17%), established this period, also hurt.
- •Notable changes in positioning include increased exposure to industrials and a lower allocation to consumer staples.
Fidelity® Fund | $10,000 | $11,052 | $10,960 | $12,531 | $14,726 | $15,944 | $19,215 | $26,312 | $22,208 | $26,886 | $35,729 |
S&P 500® Index | $10,000 | $10,742 | $11,171 | $13,170 | $15,064 | $16,633 | $17,881 | $25,175 | $22,503 | $26,912 | $33,521 |
| 2014 | 2015 | 2016 | 2017 | 2018 | 2019 | 2020 | 2021 | 2022 | 2023 | 2024 |
 |
| 1 Year | 5 Year | 10 Year | |
| Fidelity® Fund | 32.89% | 17.51% | 13.58% |
| S&P 500® Index | 24.56% | 15.05% | 12.86% |
Visit www.fidelity.com for more recent performance information. |
The Fund's past performance is not a good predictor of the Fund's future performance. The graph and table do not reflect the deduction of taxes that a shareholder would pay on fund distributions or redemption of fund shares. |
KEY FACTS | ||
| Fund Size | $8,230,743,288 | |
| Number of Holdings | 93 | |
| Total Advisory Fee | $24,048,200 | |
| Portfolio Turnover | 25% |
(as of June 30, 2024)
MARKET SECTORS (% of Fund's net assets) | ||
| Information Technology | 36.4 | |
| Communication Services | 14.6 | |
| Health Care | 12.7 | |
| Consumer Discretionary | 11.3 | |
| Industrials | 9.7 | |
| Financials | 8.7 | |
| Consumer Staples | 3.0 | |
| Energy | 1.2 | |
| Utilities | 1.0 | |
| Materials | 0.6 | |
| Common Stocks | 99.2 |
| Short-Term Investments and Net Other Assets (Liabilities) | 0.8 |
ASSET ALLOCATION (% of Fund's net assets) |
 |
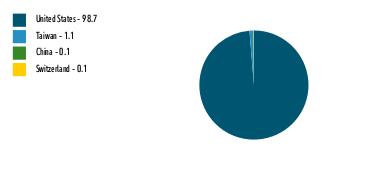
| United States | 98.7 |
| Taiwan | 1.1 |
| China | 0.1 |
| Switzerland | 0.1 |
GEOGRAPHIC DIVERSIFICATION (% of Fund's net assets) |
 |
TOP HOLDINGS (% of Fund's net assets) | ||
| Microsoft Corp | 11.3 | |
| Alphabet Inc Class A | 9.3 | |
| Apple Inc | 7.7 | |
| NVIDIA Corp | 7.7 | |
| Amazon.com Inc | 5.4 | |
| Meta Platforms Inc Class A | 4.9 | |
| Eli Lilly & Co | 2.9 | |
| Broadcom Inc | 2.8 | |
| Costco Wholesale Corp | 2.0 | |
| Unitedhealth Group Inc | 1.6 | |
| 55.6 | ||
The fund's transfer agent and pricing & bookkeeping fees were changed to a fixed rate effective December 1, 2023, through February 29, 2024, in anticipation of the transition to a new management fee structure. Effective March 1, 2024, the fund's management contract was amended to incorporate administrative services previously covered under separate services agreements (transfer agent and pricing & bookkeeping). The amended contract incorporates a management fee rate that may vary by class. The Adviser or an affiliate pays certain expenses of managing and operating the fund out of each class's management fee. |
| Fidelity, the Fidelity Investments Logo and all other Fidelity trademarks or service marks used herein are trademarks or service marks of FMR LLC. Any third-party marks that are used herein are trademarks or service marks of their respective owners. © 2024 FMR LLC. All rights reserved. | ||
 | For additional information about the Fund; including its prospectus, financial information, holdings and proxy information, scan the QR code or visit fundresearch.fidelity.com/prospectus/sec 1.9913350.100 3-TSRA-0824 | |
ANNUAL SHAREHOLDER REPORT | AS OF JUNE 30, 2024 | This report describes changes to the Fund that occurred during the reporting period. | |
| | Fidelity® Fund Fidelity® Fund Class K : FFDKX | |
prospectus/sec. You can also request this information by contacting us at 1-800-835-5092 or by sending an e-mail to fidfunddocuments@fidelity.com.
| Costs of a $10,000 investment | Costs paid as a percentage of a $10,000 investment | ||
| Class K | $ 42 | 0.36% |
- •U.S. equities gained considerably for the 12 months ending June 30, 2024, driven by resilient corporate profits, a frenzy over generative artificial intelligence and the Federal Reserve's likely pivot to cutting interest rates later this year. Amid this favorable backdrop for higher-risk assets, stocks continued their late-2023 momentum, powered by signs of continued U.S. economic strength.
- •Against this backdrop, the top contributor to performance versus the benchmark was stock selection in health care, primarily within the pharmaceuticals, biotechnology & life sciences industry. Stock picking in consumer discretionary also boosted relative performance, as did an overweight in information technology, primarily within the semiconductors & semiconductor equipment industry.
- •The top individual relative contributor was an overweight in Alphabet (+52%), one of our largest holdings. A second notable relative contributor this period was avoiding Tesla, a benchmark component that returned about -24%. An overweight in Nvidia (+192%) also helped. Nvidia was among our largest holdings.
- •In contrast, the biggest detractor from performance versus the benchmark was security selection in financials. An overweight in health care also hampered the fund's result, as did stock selection in energy. Lastly, the fund's position in cash detracted.
- •The fund's stake in Fortinet returned -23% and was the largest individual relative detractor. Fortinet was not held at period end. The second-largest relative detractor was an overweight in Apple (+10%). Apple was one of our largest holdings. An overweight in Builders FirstSource (-17%), established this period, also hurt.
- •Notable changes in positioning include increased exposure to industrials and a lower allocation to consumer staples.
Class K | $10,000 | $11,065 | $10,985 | $12,573 | $14,790 | $16,029 | $19,331 | $26,497 | $22,380 | $27,119 | $36,068 |
S&P 500® Index | $10,000 | $10,742 | $11,171 | $13,170 | $15,064 | $16,633 | $17,881 | $25,175 | $22,503 | $26,912 | $33,521 |
| 2014 | 2015 | 2016 | 2017 | 2018 | 2019 | 2020 | 2021 | 2022 | 2023 | 2024 |
 |
| 1 Year | 5 Year | 10 Year | |
| Class K | 33.00% | 17.61% | 13.69% |
| S&P 500® Index | 24.56% | 15.05% | 12.86% |
Visit www.401k.com for more recent performance information. |
The Fund's past performance is not a good predictor of the Fund's future performance. The graph and table do not reflect the deduction of taxes that a shareholder would pay on fund distributions or redemption of fund shares. |
KEY FACTS | ||
| Fund Size | $8,230,743,288 | |
| Number of Holdings | 93 | |
| Total Advisory Fee | $24,048,200 | |
| Portfolio Turnover | 25% |
(as of June 30, 2024)
MARKET SECTORS (% of Fund's net assets) | ||
| Information Technology | 36.4 | |
| Communication Services | 14.6 | |
| Health Care | 12.7 | |
| Consumer Discretionary | 11.3 | |
| Industrials | 9.7 | |
| Financials | 8.7 | |
| Consumer Staples | 3.0 | |
| Energy | 1.2 | |
| Utilities | 1.0 | |
| Materials | 0.6 | |
| Common Stocks | 99.2 |
| Short-Term Investments and Net Other Assets (Liabilities) | 0.8 |
ASSET ALLOCATION (% of Fund's net assets) |
|
| United States | 98.7 |
| Taiwan | 1.1 |
| China | 0.1 |
| Switzerland | 0.1 |
GEOGRAPHIC DIVERSIFICATION (% of Fund's net assets) |
|
TOP HOLDINGS (% of Fund's net assets) | ||
| Microsoft Corp | 11.3 | |
| Alphabet Inc Class A | 9.3 | |
| Apple Inc | 7.7 | |
| NVIDIA Corp | 7.7 | |
| Amazon.com Inc | 5.4 | |
| Meta Platforms Inc Class A | 4.9 | |
| Eli Lilly & Co | 2.9 | |
| Broadcom Inc | 2.8 | |
| Costco Wholesale Corp | 2.0 | |
| Unitedhealth Group Inc | 1.6 | |
| 55.6 | ||
The fund's transfer agent and pricing & bookkeeping fees were changed to a fixed rate effective December 1, 2023, through February 29, 2024, in anticipation of the transition to a new management fee structure. Effective March 1, 2024, the fund's management contract was amended to incorporate administrative services previously covered under separate services agreements (transfer agent and pricing & bookkeeping). The amended contract incorporates a management fee rate that may vary by class. The Adviser or an affiliate pays certain expenses of managing and operating the fund out of each class's management fee. |
| Fidelity, the Fidelity Investments Logo and all other Fidelity trademarks or service marks used herein are trademarks or service marks of FMR LLC. Any third-party marks that are used herein are trademarks or service marks of their respective owners. © 2024 FMR LLC. All rights reserved. | ||
 | For additional information about the Fund; including its prospectus, financial information, holdings and proxy information, scan the QR code or visit fundresearch.fidelity.com/prospectus/sec 1.9913349.100 2088-TSRA-0824 | |
Item 2.
Code of Ethics
As of the end of the period, June 30, 2024, Fidelity Hastings Street Trust (the trust) has adopted a code of ethics, as defined in Item 2 of Form N-CSR, that applies to its President and Treasurer and its Chief Financial Officer. A copy of the code of ethics is filed as an exhibit to this Form N-CSR.
Item 3.
Audit Committee Financial Expert
The Board of Trustees of the trust has determined that Donald F. Donahue is an audit committee financial expert, as defined in Item 3 of Form N-CSR. Mr. Donahue is independent for purposes of Item 3 of Form N-CSR.
Item 4.
Principal Accountant Fees and Services
Fees and Services
The following table presents fees billed by PricewaterhouseCoopers LLP (“PwC”) in each of the last two fiscal years for services rendered to Fidelity Fund, Fidelity Growth Discovery Fund, Fidelity Mega Cap Stock Fund and Fidelity Series Large Cap Stock Fund (the “Funds”):
Services Billed by PwC
June 30, 2024 FeesA
Audit Fees | Audit-Related Fees | Tax Fees | All Other Fees | |
Fidelity Fund | $49,100 | $4,400 | $11,400 | $1,500 |
Fidelity Growth Discovery Fund | $36,700 | $3,500 | $8,800 | $1,200 |
Fidelity Mega Cap Stock Fund | $44,200 | $4,100 | $9,000 | $1,400 |
Fidelity Series Large Cap Stock Fund | $41,800 | $3,900 | $9,300 | $1,300 |
June 30, 2023 FeesA
Audit Fees | Audit-Related Fees | Tax Fees | All Other Fees | |
Fidelity Fund | $48,900 | $4,200 | $10,900 | $1,400 |
Fidelity Growth Discovery Fund | $36,800 | $3,300 | $12,600 | $1,100 |
Fidelity Mega Cap Stock Fund | $44,400 | $3,900 | $17,900 | $1,300 |
Fidelity Series Large Cap Stock Fund | $41,600 | $3,700 | $16,600 | $1,200 |
A Amounts may reflect rounding.
The following table(s) present(s) fees billed by PwC that were required to be approved by the Audit Committee for services that relate directly to the operations and financial reporting of the Fund(s) and that are rendered on behalf of Fidelity Management & Research Company LLC ("FMR") and entities controlling, controlled by, or under common control with FMR (not including any sub-adviser whose role is primarily portfolio management and is subcontracted with or overseen by another investment adviser) that provide ongoing services to the Fund(s) (“Fund Service Providers”):
Services Billed by PwC
June 30, 2024A | June 30, 2023A | |
Audit-Related Fees | $9,437,800 | $8,699,200 |
Tax Fees | $61,000 | $1,000 |
All Other Fees | $35,000 | $- |
A Amounts may reflect rounding.
“Audit-Related Fees” represent fees billed for assurance and related services that are reasonably related to the performance of the fund audit or the review of the fund's financial statements and that are not reported under Audit Fees.
“Tax Fees” represent fees billed for tax compliance, tax advice or tax planning that relate directly to the operations and financial reporting of the fund.
“All Other Fees” represent fees billed for services provided to the fund or Fund Service Provider, a significant portion of which are assurance related, that relate directly to the operations and financial reporting of the fund, excluding those services that are reported under Audit Fees, Audit-Related Fees or Tax Fees.
Assurance services must be performed by an independent public accountant.
* * *
The aggregate non-audit fees billed by PwC for services rendered to the Fund(s), FMR (not including any sub-adviser whose role is primarily portfolio management and is subcontracted with or overseen by another investment adviser), and any Fund Service Provider for each of the last two fiscal years of the Fund(s) are as follows:
Billed By | June 30, 2024A | June 30, 2023A |
PwC | $15,068,200 | $14,231,100 |
A Amounts may reflect rounding.
The trust's Audit Committee has considered non-audit services that were not pre-approved that were provided by PwC to Fund Service Providers to be compatible with maintaining the independence of PwC in its(their) audit of the Fund(s), taking into account representations from PwC, in accordance with Public Company Accounting Oversight Board rules, regarding its independence from the Fund(s) and its(their) related entities and FMR’s review of the appropriateness and permissibility under applicable law of such non-audit services prior to their provision to the Fund(s) Service Providers.
Audit Committee Pre-Approval Policies and Procedures
The trust’s Audit Committee must pre-approve all audit and non-audit services provided by a fund’s independent registered public accounting firm relating to the operations or financial reporting of the fund. Prior to the commencement of any audit or non-audit services to a fund, the Audit Committee reviews the services to determine whether they are appropriate and permissible under applicable law.
The Audit Committee has adopted policies and procedures to, among other purposes, provide a framework for the Committee’s consideration of non-audit services by the audit firms that audit the Fidelity funds. The policies and procedures require that any non-audit service provided by a fund audit firm to a Fidelity fund and any non-audit service provided by a fund auditor to a Fund Service Provider that relates directly to the operations and financial reporting of a Fidelity fund (“Covered Service”) are subject to approval by the Audit Committee before such service is provided.
All Covered Services must be approved in advance of provision of the service either: (i) by formal resolution of the Audit Committee, or (ii) by oral or written approval of the service by the Chair of the Audit Committee (or if the Chair is unavailable, such other member of the Audit Committee as may be designated by the Chair to act in the Chair’s absence). The approval contemplated by (ii) above is permitted where the Treasurer determines that action on such an engagement is necessary before the next meeting of the Audit Committee.
Non-audit services provided by a fund audit firm to a Fund Service Provider that do not relate directly to the operations and financial reporting of a Fidelity fund are reported to the Audit Committee periodically.
Non-Audit Services Approved Pursuant to Rule 2-01(c)(7)(i)(C) and (ii) of Regulation S-X (“De Minimis Exception”)
There were no non-audit services approved or required to be approved by the Audit Committee pursuant to the De Minimis Exception during the Fund’s(s’) last two fiscal
years relating to services provided to (i) the Fund(s) or (ii) any Fund Service Provider that relate directly to the operations and financial reporting of the Fund(s).
The Registrant has not retained, for the preparation of the audit report on the financial statements included in the Form N-CSR, a registered public accounting firm that has a branch or office that is located in a foreign jurisdiction and that the Public Company Accounting Oversight Board (the “PCAOB”) has determined that the PCAOB is unable to inspect or investigate completely because of a position taken by an authority in the foreign jurisdiction.
The Registrant is not a “foreign issuer,” as defined in 17 CFR 240.3b-4.
Item 5.
Audit Committee of Listed Registrants
Not applicable.
Item 6.
Investments
(a)
Not applicable.
(b)
Not applicable.
Item 7.
Financial Statements and Financial Highlights for Open-End Management Investment Companies


Contents
| Common Stocks - 92.5% | |||
| Shares | Value ($) | ||
| COMMUNICATION SERVICES - 10.1% | |||
| Entertainment - 1.0% | |||
| The Walt Disney Co. | 162,899 | 16,174,242 | |
| Universal Music Group NV | 479,399 | 14,261,286 | |
| 30,435,528 | |||
| Interactive Media & Services - 8.0% | |||
| Alphabet, Inc.: | |||
| Class A | 421,600 | 76,794,440 | |
| Class C | 383,900 | 70,414,938 | |
| Meta Platforms, Inc. Class A | 197,200 | 99,432,184 | |
| 246,641,562 | |||
| Media - 1.1% | |||
| Charter Communications, Inc. Class A (a) | 3,400 | 1,016,464 | |
| Comcast Corp. Class A | 806,897 | 31,598,087 | |
| 32,614,551 | |||
TOTAL COMMUNICATION SERVICES | 309,691,641 | ||
| CONSUMER DISCRETIONARY - 3.2% | |||
| Broadline Retail - 0.2% | |||
| Amazon.com, Inc. (a) | 24,000 | 4,638,000 | |
| Hotels, Restaurants & Leisure - 1.9% | |||
| Booking Holdings, Inc. | 11,048 | 43,766,652 | |
| Marriott International, Inc. Class A | 26,600 | 6,431,082 | |
| Starbucks Corp. | 108,700 | 8,462,295 | |
| 58,660,029 | |||
| Household Durables - 0.3% | |||
| Sony Group Corp. sponsored ADR (b) | 115,700 | 9,828,715 | |
| Specialty Retail - 0.6% | |||
| Lowe's Companies, Inc. | 89,811 | 19,799,733 | |
| Textiles, Apparel & Luxury Goods - 0.2% | |||
| Compagnie Financiere Richemont SA Series A | 15,930 | 2,489,588 | |
| NIKE, Inc. Class B | 39,000 | 2,939,430 | |
| 5,429,018 | |||
TOTAL CONSUMER DISCRETIONARY | 98,355,495 | ||
| CONSUMER STAPLES - 5.0% | |||
| Beverages - 1.8% | |||
| Diageo PLC | 578,062 | 18,147,684 | |
| Keurig Dr. Pepper, Inc. | 500,600 | 16,720,040 | |
| The Coca-Cola Co. | 325,600 | 20,724,440 | |
| 55,592,164 | |||
| Consumer Staples Distribution & Retail - 1.4% | |||
| Costco Wholesale Corp. | 1,300 | 1,104,987 | |
| Sysco Corp. | 131,299 | 9,373,436 | |
| Target Corp. | 60,710 | 8,987,508 | |
| Walmart, Inc. | 331,500 | 22,445,865 | |
| 41,911,796 | |||
| Food Products - 0.0% | |||
| Mondelez International, Inc. | 25,900 | 1,694,896 | |
| Household Products - 0.1% | |||
| Procter & Gamble Co. | 16,310 | 2,689,845 | |
| Personal Care Products - 1.4% | |||
| Estee Lauder Companies, Inc. Class A | 60,300 | 6,415,920 | |
| Haleon PLC ADR | 1,856,133 | 15,331,659 | |
| Kenvue, Inc. | 1,091,057 | 19,835,416 | |
| 41,582,995 | |||
| Tobacco - 0.3% | |||
| British American Tobacco PLC sponsored ADR | 95,300 | 2,947,629 | |
| Philip Morris International, Inc. | 56,900 | 5,765,677 | |
| 8,713,306 | |||
TOTAL CONSUMER STAPLES | 152,185,002 | ||
| ENERGY - 9.1% | |||
| Oil, Gas & Consumable Fuels - 9.1% | |||
| Exxon Mobil Corp. | 1,684,364 | 193,903,984 | |
| Imperial Oil Ltd. | 478,200 | 32,605,896 | |
| Shell PLC ADR | 708,610 | 51,147,470 | |
| 277,657,350 | |||
| FINANCIALS - 14.7% | |||
| Banks - 11.4% | |||
| Bank of America Corp. | 2,339,251 | 93,032,012 | |
| JPMorgan Chase & Co. | 281,330 | 56,901,806 | |
| PNC Financial Services Group, Inc. | 150,231 | 23,357,916 | |
| U.S. Bancorp | 457,112 | 18,147,346 | |
| Wells Fargo & Co. (c) | 2,645,636 | 157,124,322 | |
| 348,563,402 | |||
| Capital Markets - 0.2% | |||
| Charles Schwab Corp. | 73,400 | 5,408,846 | |
| CME Group, Inc. | 10,800 | 2,123,280 | |
| 7,532,126 | |||
| Consumer Finance - 0.1% | |||
| American Express Co. | 13,500 | 3,125,925 | |
| Financial Services - 3.0% | |||
| Berkshire Hathaway, Inc. Class B (a) | 51,200 | 20,828,160 | |
| Fiserv, Inc. (a) | 26,600 | 3,964,464 | |
| MasterCard, Inc. Class A | 38,052 | 16,787,020 | |
| PayPal Holdings, Inc. (a) | 60,000 | 3,481,800 | |
| Visa, Inc. Class A | 176,788 | 46,401,546 | |
| 91,462,990 | |||
TOTAL FINANCIALS | 450,684,443 | ||
| HEALTH CARE - 8.6% | |||
| Health Care Equipment & Supplies - 1.9% | |||
| Abbott Laboratories | 101,600 | 10,557,256 | |
| Boston Scientific Corp. (a) | 541,019 | 41,663,873 | |
| Koninklijke Philips Electronics NV (depository receipt) (NY Reg.) | 162,792 | 4,102,358 | |
| Medtronic PLC | 26,896 | 2,116,984 | |
| 58,440,471 | |||
| Health Care Providers & Services - 3.1% | |||
| Cigna Group | 72,262 | 23,887,649 | |
| Humana, Inc. | 30,800 | 11,508,420 | |
| UnitedHealth Group, Inc. | 114,403 | 58,260,872 | |
| 93,656,941 | |||
| Life Sciences Tools & Services - 0.8% | |||
| Danaher Corp. | 85,310 | 21,314,704 | |
| Thermo Fisher Scientific, Inc. | 7,400 | 4,092,200 | |
| 25,406,904 | |||
| Pharmaceuticals - 2.8% | |||
| Bristol-Myers Squibb Co. | 308,099 | 12,795,351 | |
| Eli Lilly & Co. (c) | 41,300 | 37,392,194 | |
| GSK PLC sponsored ADR | 447,966 | 17,246,691 | |
| Johnson & Johnson | 112,514 | 16,445,046 | |
| 83,879,282 | |||
TOTAL HEALTH CARE | 261,383,598 | ||
| INDUSTRIALS - 11.8% | |||
| Aerospace & Defense - 8.0% | |||
| Airbus Group NV | 120,900 | 16,593,127 | |
| General Electric Co. (c) | 910,294 | 144,709,437 | |
| The Boeing Co. (a) | 459,300 | 83,597,193 | |
| 244,899,757 | |||
| Air Freight & Logistics - 1.0% | |||
| FedEx Corp. | 6,300 | 1,888,992 | |
| United Parcel Service, Inc. Class B | 219,079 | 29,980,961 | |
| 31,869,953 | |||
| Commercial Services & Supplies - 0.1% | |||
| Veralto Corp. | 17,403 | 1,661,464 | |
| Electrical Equipment - 1.7% | |||
| GE Vernova LLC | 269,673 | 46,251,616 | |
| Rockwell Automation, Inc. | 19,700 | 5,423,016 | |
| 51,674,632 | |||
| Machinery - 1.0% | |||
| Caterpillar, Inc. | 52,400 | 17,454,440 | |
| Deere & Co. | 37,680 | 14,078,378 | |
| 31,532,818 | |||
TOTAL INDUSTRIALS | 361,638,624 | ||
| INFORMATION TECHNOLOGY - 27.0% | |||
| IT Services - 0.1% | |||
| IBM Corp. | 2,900 | 501,555 | |
| Kyndryl Holdings, Inc. (a) | 220 | 5,788 | |
| Snowflake, Inc. (a) | 25,351 | 3,424,667 | |
| 3,932,010 | |||
| Semiconductors & Semiconductor Equipment - 10.3% | |||
| Analog Devices, Inc. | 9,100 | 2,077,166 | |
| Applied Materials, Inc. | 136,974 | 32,324,494 | |
| ASML Holding NV (depository receipt) | 5,936 | 6,070,925 | |
| Broadcom, Inc. | 20,500 | 32,913,365 | |
| Lam Research Corp. | 20,600 | 21,935,910 | |
| Marvell Technology, Inc. | 138,765 | 9,699,674 | |
| NVIDIA Corp. | 1,375,200 | 169,892,208 | |
| Qualcomm, Inc. | 68,616 | 13,666,935 | |
| Taiwan Semiconductor Manufacturing Co. Ltd. sponsored ADR | 143,700 | 24,976,497 | |
| 313,557,174 | |||
| Software - 12.8% | |||
| Adobe, Inc. (a) | 58,810 | 32,671,307 | |
| Autodesk, Inc. (a) | 28,800 | 7,126,560 | |
| Intuit, Inc. | 11,600 | 7,623,636 | |
| Microsoft Corp. | 595,876 | 266,326,780 | |
| Oracle Corp. | 298,800 | 42,190,560 | |
| Salesforce, Inc. | 28,400 | 7,301,640 | |
| SAP SE sponsored ADR | 135,600 | 27,351,876 | |
| 390,592,359 | |||
| Technology Hardware, Storage & Peripherals - 3.8% | |||
| Apple, Inc. | 520,342 | 109,594,432 | |
| Samsung Electronics Co. Ltd. | 110,400 | 6,519,835 | |
| 116,114,267 | |||
TOTAL INFORMATION TECHNOLOGY | 824,195,810 | ||
| MATERIALS - 1.3% | |||
| Chemicals - 0.2% | |||
| Air Products & Chemicals, Inc. | 19,500 | 5,031,975 | |
| Linde PLC | 5,000 | 2,194,050 | |
| 7,226,025 | |||
| Metals & Mining - 1.1% | |||
| First Quantum Minerals Ltd. | 1,100,900 | 14,460,855 | |
| Freeport-McMoRan, Inc. | 397,500 | 19,318,500 | |
| 33,779,355 | |||
TOTAL MATERIALS | 41,005,380 | ||
| REAL ESTATE - 0.8% | |||
| Equity Real Estate Investment Trusts (REITs) - 0.8% | |||
| American Tower Corp. | 61,310 | 11,917,438 | |
| Crown Castle, Inc. | 95,700 | 9,349,890 | |
| Prologis, Inc. | 22,800 | 2,560,668 | |
| 23,827,996 | |||
| UTILITIES - 0.9% | |||
| Electric Utilities - 0.9% | |||
| Duke Energy Corp. | 15,200 | 1,523,496 | |
| NextEra Energy, Inc. | 37,900 | 2,683,699 | |
| Southern Co. | 314,600 | 24,403,522 | |
| 28,610,717 | |||
| TOTAL COMMON STOCKS (Cost $1,673,486,299) | 2,829,236,056 | ||
| U.S. Treasury Obligations - 0.5% | |||
Principal Amount (d) | Value ($) | ||
U.S. Treasury Bills, yield at date of purchase 5.31% to 5.32% 8/8/24 to 9/12/24 (c) (Cost $15,948,767) | 16,083,000 | 15,948,859 | |
| Money Market Funds - 6.2% | |||
| Shares | Value ($) | ||
| Fidelity Cash Central Fund 5.38% (e) | 186,515,799 | 186,553,102 | |
| Fidelity Securities Lending Cash Central Fund 5.38% (e)(f) | 2,072,393 | 2,072,600 | |
| TOTAL MONEY MARKET FUNDS (Cost $188,625,702) | 188,625,702 | ||
| TOTAL INVESTMENT IN SECURITIES - 99.2% (Cost $1,878,060,768) | 3,033,810,617 |
NET OTHER ASSETS (LIABILITIES) - 0.8% | 24,575,758 |
| NET ASSETS - 100.0% | 3,058,386,375 |
| Written Options | ||||||
| Counterparty | Number of Contracts | Notional Amount ($) | Exercise Price ($) | Expiration Date | Value ($) | |
| Call Options | ||||||
| Eli Lilly & Co. | Chicago Board Options Exchange | 20 | 1,810,760 | 850.00 | 08/16/24 | (154,400) |
| General Electric Co. | Chicago Board Options Exchange | 400 | 6,358,800 | 185.00 | 08/16/24 | (39,600) |
| General Electric Co. | Chicago Board Options Exchange | 400 | 6,358,800 | 185.00 | 09/20/24 | (82,000) |
| (276,000) | ||||||
| Put Options | ||||||
| The Boeing Co. | Chicago Board Options Exchange | 500 | 9,100,500 | 170.00 | 08/16/24 | (178,750) |
| TOTAL WRITTEN OPTIONS | (454,750) | |||||
| (a) | Non-income producing |
| (b) | Security or a portion of the security is on loan at period end. |
| (c) | Security or a portion of the security is pledged as collateral for options written. At period end, the value of securities pledged amounted to $36,307,210. |
| (d) | Amount is stated in United States dollars unless otherwise noted. |
| (e) | Affiliated fund that is generally available only to investment companies and other accounts managed by Fidelity Investments. The rate quoted is the annualized seven-day yield of the fund at period end. A complete unaudited listing of the fund's holdings as of its most recent quarter end is available upon request. In addition, each Fidelity Central Fund's financial statements, which are not covered by the Fund's Report of Independent Registered Public Accounting Firm, are available on the SEC's website or upon request. |
| (f) | Investment made with cash collateral received from securities on loan. |
| Affiliate | Value, beginning of period ($) | Purchases ($) | Sales Proceeds ($) | Dividend Income ($) | Realized Gain (loss) ($) | Change in Unrealized appreciation (depreciation) ($) | Value, end of period ($) | % ownership, end of period |
| Fidelity Cash Central Fund 5.38% | 106,272,490 | 504,610,817 | 424,329,341 | 8,129,248 | (864) | - | 186,553,102 | 0.4% |
| Fidelity Securities Lending Cash Central Fund 5.38% | - | 73,047,809 | 70,975,209 | 89,268 | - | - | 2,072,600 | 0.0% |
| Total | 106,272,490 | 577,658,626 | 495,304,550 | 8,218,516 | (864) | - | 188,625,702 | |
| Valuation Inputs at Reporting Date: | ||||
| Description | Total ($) | Level 1 ($) | Level 2 ($) | Level 3 ($) |
Investments in Securities: | ||||
| Equities: | ||||
Communication Services | 309,691,641 | 295,430,355 | 14,261,286 | - |
Consumer Discretionary | 98,355,495 | 95,865,907 | 2,489,588 | - |
Consumer Staples | 152,185,002 | 134,037,318 | 18,147,684 | - |
Energy | 277,657,350 | 277,657,350 | - | - |
Financials | 450,684,443 | 450,684,443 | - | - |
Health Care | 261,383,598 | 261,383,598 | - | - |
Industrials | 361,638,624 | 345,045,497 | 16,593,127 | - |
Information Technology | 824,195,810 | 824,195,810 | - | - |
Materials | 41,005,380 | 41,005,380 | - | - |
Real Estate | 23,827,996 | 23,827,996 | - | - |
Utilities | 28,610,717 | 28,610,717 | - | - |
| U.S. Government and Government Agency Obligations | 15,948,859 | - | 15,948,859 | - |
| Money Market Funds | 188,625,702 | 188,625,702 | - | - |
| Total Investments in Securities: | 3,033,810,617 | 2,966,370,073 | 67,440,544 | - |
Derivative Instruments: Liabilities | ||||
Written Options | (454,750) | (454,750) | - | - |
| Total Liabilities | (454,750) | (454,750) | - | - |
| Total Derivative Instruments: | (454,750) | (454,750) | - | - |
Primary Risk Exposure / Derivative Type | Value | |
| Asset ($) | Liability ($) | |
| Equity Risk | ||
Written Options (a) | 0 | (454,750) |
| Total Equity Risk | 0 | (454,750) |
| Total Value of Derivatives | 0 | (454,750) |
| Statement of Assets and Liabilities | ||||
| June 30, 2024 | ||||
| Assets | ||||
| Investment in securities, at value (including securities loaned of $2,047,295) - See accompanying schedule: | ||||
Unaffiliated issuers (cost $1,689,435,066) | $ | 2,845,184,915 | ||
Fidelity Central Funds (cost $188,625,702) | 188,625,702 | |||
| Total Investment in Securities (cost $1,878,060,768) | $ | 3,033,810,617 | ||
| Receivable for fund shares sold | 32,323,073 | |||
| Dividends receivable | 2,025,593 | |||
| Distributions receivable from Fidelity Central Funds | 783,703 | |||
| Other receivables | 178,838 | |||
Total assets | 3,069,121,824 | |||
| Liabilities | ||||
| Payable for investments purchased | $ | 4,279,762 | ||
| Payable for fund shares redeemed | 2,310,322 | |||
| Accrued management fee | 1,381,979 | |||
| Distribution and service plan fees payable | 86,328 | |||
| Written options, at value (premium received $610,605) | 454,750 | |||
| Other payables and accrued expenses | 149,708 | |||
| Collateral on securities loaned | 2,072,600 | |||
| Total liabilities | 10,735,449 | |||
| Net Assets | $ | 3,058,386,375 | ||
| Net Assets consist of: | ||||
| Paid in capital | $ | 1,861,650,126 | ||
| Total accumulated earnings (loss) | 1,196,736,249 | |||
| Net Assets | $ | 3,058,386,375 | ||
| Net Asset Value and Maximum Offering Price | ||||
| Class A : | ||||
Net Asset Value and redemption price per share ($208,006,951 ÷ 8,603,845 shares)(a) | $ | 24.18 | ||
| Maximum offering price per share (100/94.25 of $24.18) | $ | 25.66 | ||
| Class M : | ||||
Net Asset Value and redemption price per share ($36,230,912 ÷ 1,499,280 shares)(a) | $ | 24.17 | ||
| Maximum offering price per share (100/96.50 of $24.17) | $ | 25.05 | ||
| Class C : | ||||
Net Asset Value and offering price per share ($34,772,468 ÷ 1,477,691 shares)(a) | $ | 23.53 | ||
| Mega Cap Stock : | ||||
Net Asset Value, offering price and redemption price per share ($1,973,946,452 ÷ 80,136,817 shares) | $ | 24.63 | ||
| Class I : | ||||
Net Asset Value, offering price and redemption price per share ($382,994,890 ÷ 15,529,584 shares) | $ | 24.66 | ||
| Class Z : | ||||
Net Asset Value, offering price and redemption price per share ($422,434,702 ÷ 17,253,914 shares) | $ | 24.48 | ||
(a)Redemption price per share is equal to net asset value less any applicable contingent deferred sales charge. | ||||
| Statement of Operations | ||||
Year ended June 30, 2024 | ||||
| Investment Income | ||||
| Dividends | $ | 34,219,671 | ||
| Interest | 387,625 | |||
| Income from Fidelity Central Funds (including $89,268 from security lending) | 8,218,516 | |||
| Total income | 42,825,812 | |||
| Expenses | ||||
| Management fee | $ | 10,849,629 | ||
| Transfer agent fees | 1,983,500 | |||
| Distribution and service plan fees | 853,613 | |||
| Accounting fees | 366,150 | |||
| Custodian fees and expenses | 111,332 | |||
| Independent trustees' fees and expenses | 10,384 | |||
| Registration fees | 232,277 | |||
| Audit | 71,167 | |||
| Legal | 5,310 | |||
| Miscellaneous | 57,863 | |||
| Total expenses before reductions | 14,541,225 | |||
| Expense reductions | (168,392) | |||
| Total expenses after reductions | 14,372,833 | |||
| Net Investment income (loss) | 28,452,979 | |||
| Realized and Unrealized Gain (Loss) | ||||
| Net realized gain (loss) on: | ||||
| Investment Securities: | ||||
| Unaffiliated issuers | 57,957,933 | |||
| Fidelity Central Funds | (864) | |||
| Foreign currency transactions | (5,950) | |||
| Written options | (1,410,089) | |||
| Total net realized gain (loss) | 56,541,030 | |||
| Change in net unrealized appreciation (depreciation) on: | ||||
| Investment Securities: | ||||
| Unaffiliated issuers | 518,253,338 | |||
| Assets and liabilities in foreign currencies | (7,284) | |||
| Written options | 255,161 | |||
| Total change in net unrealized appreciation (depreciation) | 518,501,215 | |||
| Net gain (loss) | 575,042,245 | |||
| Net increase (decrease) in net assets resulting from operations | $ | 603,495,224 | ||
| Statement of Changes in Net Assets | ||||
Year ended June 30, 2024 | Year ended June 30, 2023 | |||
| Increase (Decrease) in Net Assets | ||||
| Operations | ||||
| Net investment income (loss) | $ | 28,452,979 | $ | 16,976,504 |
| Net realized gain (loss) | 56,541,030 | 5,590,921 | ||
| Change in net unrealized appreciation (depreciation) | 518,501,215 | 278,383,701 | ||
| Net increase (decrease) in net assets resulting from operations | 603,495,224 | 300,951,126 | ||
| Distributions to shareholders | (42,621,700) | (58,426,988) | ||
| Share transactions - net increase (decrease) | 781,376,392 | 137,430,788 | ||
| Total increase (decrease) in net assets | 1,342,249,916 | 379,954,926 | ||
| Net Assets | ||||
| Beginning of period | 1,716,136,459 | 1,336,181,533 | ||
| End of period | $ | 3,058,386,375 | $ | 1,716,136,459 |
Fidelity Advisor® Mega Cap Stock Fund Class A |
| Years ended June 30, | 2024 | 2023 | 2022 | 2021 | 2020 | |||||
Selected Per-Share Data | ||||||||||
| Net asset value, beginning of period | $ | 19.23 | $ | 16.14 | $ | 19.05 | $ | 13.83 | $ | 15.51 |
| Income from Investment Operations | ||||||||||
Net investment income (loss) A,B | .21 | .17 | .14 | .15 | .22 | |||||
| Net realized and unrealized gain (loss) | 5.12 | 3.61 | (2.17) | 6.31 | .08 | |||||
| Total from investment operations | 5.33 | 3.78 | (2.03) | 6.46 | .30 | |||||
| Distributions from net investment income | (.17) | (.18) | (.29) | (.24) | (.27) | |||||
| Distributions from net realized gain | (.21) | (.51) | (.59) | (1.00) | (1.70) | |||||
| Total distributions | (.38) | (.69) | (.88) | (1.24) | (1.98) C | |||||
| Net asset value, end of period | $ | 24.18 | $ | 19.23 | $ | 16.14 | $ | 19.05 | $ | 13.83 |
Total Return D,E | 28.13 % | 24.10% | (11.25)% F | 49.60% | 1.78% | |||||
Ratios to Average Net Assets B,G,H | ||||||||||
| Expenses before reductions | .88% | .90% | .90% | .91% | .93% | |||||
| Expenses net of fee waivers, if any | .88 % | .90% | .89% | .91% | .93% | |||||
| Expenses net of all reductions | .88% | .90% | .89% | .91% | .92% | |||||
| Net investment income (loss) | 1.01% | .99% | .78% | .95% | 1.56% | |||||
| Supplemental Data | ||||||||||
| Net assets, end of period (000 omitted) | $ | 208,007 | $ | 133,252 | $ | 88,064 | $ | 87,302 | $ | 54,948 |
Portfolio turnover rate I | 9 % | 18% | 13% | 43% | 49% J |
Fidelity Advisor® Mega Cap Stock Fund Class M |
| Years ended June 30, | 2024 | 2023 | 2022 | 2021 | 2020 | |||||
Selected Per-Share Data | ||||||||||
| Net asset value, beginning of period | $ | 19.22 | $ | 16.13 | $ | 19.03 | $ | 13.82 | $ | 15.50 |
| Income from Investment Operations | ||||||||||
Net investment income (loss) A,B | .16 | .13 | .10 | .11 | .19 | |||||
| Net realized and unrealized gain (loss) | 5.12 | 3.61 | (2.17) | 6.31 | .06 | |||||
| Total from investment operations | 5.28 | 3.74 | (2.07) | 6.42 | .25 | |||||
| Distributions from net investment income | (.12) | (.13) | (.24) | (.20) | (.23) | |||||
| Distributions from net realized gain | (.21) | (.51) | (.59) | (1.00) | (1.70) | |||||
| Total distributions | (.33) | (.65) C | (.83) | (1.21) C | (1.93) | |||||
| Net asset value, end of period | $ | 24.17 | $ | 19.22 | $ | 16.13 | $ | 19.03 | $ | 13.82 |
Total Return D,E | 27.81 % | 23.76% | (11.45)% F | 49.19% | 1.50% | |||||
Ratios to Average Net Assets B,G,H | ||||||||||
| Expenses before reductions | 1.12% | 1.16% | 1.15% | 1.17% | 1.18% | |||||
| Expenses net of fee waivers, if any | 1.11 % | 1.16% | 1.15% | 1.17% | 1.18% | |||||
| Expenses net of all reductions | 1.11% | 1.16% | 1.15% | 1.16% | 1.18% | |||||
| Net investment income (loss) | .78% | .73% | .52% | .69% | 1.31% | |||||
| Supplemental Data | ||||||||||
| Net assets, end of period (000 omitted) | $ | 36,231 | $ | 30,973 | $ | 25,617 | $ | 28,266 | $ | 21,208 |
Portfolio turnover rate I | 9 % | 18% | 13% | 43% | 49% J |
Fidelity Advisor® Mega Cap Stock Fund Class C |
| Years ended June 30, | 2024 | 2023 | 2022 | 2021 | 2020 | |||||
Selected Per-Share Data | ||||||||||
| Net asset value, beginning of period | $ | 18.74 | $ | 15.74 | $ | 18.58 | $ | 13.53 | $ | 15.20 |
| Income from Investment Operations | ||||||||||
Net investment income (loss) A,B | .05 | .03 | - C | .03 | .11 | |||||
| Net realized and unrealized gain (loss) | 4.99 | 3.53 | (2.12) | 6.15 | .08 | |||||
| Total from investment operations | 5.04 | 3.56 | (2.12) | 6.18 | .19 | |||||
| Distributions from net investment income | (.04) | (.04) | (.15) | (.13) | (.15) | |||||
| Distributions from net realized gain | (.21) | (.51) | (.58) | (1.00) | (1.70) | |||||
| Total distributions | (.25) | (.56) D | (.72) D | (1.13) | (1.86) D | |||||
| Net asset value, end of period | $ | 23.53 | $ | 18.74 | $ | 15.74 | $ | 18.58 | $ | 13.53 |
Total Return E,F | 27.12 % | 23.12% | (11.90)% G | 48.31% | 1.05% | |||||
Ratios to Average Net Assets B,H,I | ||||||||||
| Expenses before reductions | 1.66% | 1.69% | 1.67% | 1.69% | 1.69% | |||||
| Expenses net of fee waivers, if any | 1.65 % | 1.68% | 1.67% | 1.69% | 1.69% | |||||
| Expenses net of all reductions | 1.65% | 1.68% | 1.67% | 1.69% | 1.69% | |||||
| Net investment income (loss) | .24% | .21% | -% C | .17% | .80% | |||||
| Supplemental Data | ||||||||||
| Net assets, end of period (000 omitted) | $ | 34,772 | $ | 23,061 | $ | 20,255 | $ | 27,727 | $ | 24,283 |
Portfolio turnover rate J | 9 % | 18% | 13% | 43% | 49% K |
Fidelity® Mega Cap Stock Fund |
| Years ended June 30, | 2024 | 2023 | 2022 | 2021 | 2020 | |||||
Selected Per-Share Data | ||||||||||
| Net asset value, beginning of period | $ | 19.58 | $ | 16.42 | $ | 19.36 | $ | 14.04 | $ | 15.71 |
| Income from Investment Operations | ||||||||||
Net investment income (loss) A,B | .28 | .22 | .20 | .20 | .27 | |||||
| Net realized and unrealized gain (loss) | 5.20 | 3.68 | (2.21) | 6.40 | .07 | |||||
| Total from investment operations | 5.48 | 3.90 | (2.01) | 6.60 | .34 | |||||
| Distributions from net investment income | (.22) | (.23) | (.34) | (.28) | (.31) | |||||
| Distributions from net realized gain | (.21) | (.51) | (.59) | (1.00) | (1.70) | |||||
| Total distributions | (.43) | (.74) | (.93) | (1.28) | (2.01) | |||||
| Net asset value, end of period | $ | 24.63 | $ | 19.58 | $ | 16.42 | $ | 19.36 | $ | 14.04 |
Total Return C | 28.44 % | 24.46% | (10.99)% D | 49.96% | 2.09% | |||||
Ratios to Average Net Assets B,E,F | ||||||||||
| Expenses before reductions | .61% | .63% | .61% | .63% | .65% | |||||
| Expenses net of fee waivers, if any | .60 % | .62% | .61% | .63% | .64% | |||||
| Expenses net of all reductions | .60% | .62% | .61% | .63% | .64% | |||||
| Net investment income (loss) | 1.29% | 1.27% | 1.06% | 1.23% | 1.84% | |||||
| Supplemental Data | ||||||||||
| Net assets, end of period (000 omitted) | $ | 1,973,946 | $ | 1,203,802 | $ | 927,217 | $ | 1,166,988 | $ | 773,080 |
Portfolio turnover rate G | 9 % | 18% | 13% | 43% | 49% H |
Fidelity Advisor® Mega Cap Stock Fund Class I |
| Years ended June 30, | 2024 | 2023 | 2022 | 2021 | 2020 | |||||
Selected Per-Share Data | ||||||||||
| Net asset value, beginning of period | $ | 19.61 | $ | 16.45 | $ | 19.39 | $ | 14.07 | $ | 15.72 |
| Income from Investment Operations | ||||||||||
Net investment income (loss) A,B | .27 | .22 | .19 | .20 | .27 | |||||
| Net realized and unrealized gain (loss) | 5.22 | 3.68 | (2.21) | 6.42 | .06 | |||||
| Total from investment operations | 5.49 | 3.90 | (2.02) | 6.62 | .33 | |||||
| Distributions from net investment income | (.23) | (.23) | (.34) | (.29) | (.28) | |||||
| Distributions from net realized gain | (.21) | (.51) | (.59) | (1.00) | (1.70) | |||||
| Total distributions | (.44) | (.74) | (.92) C | (1.30) C | (1.98) | |||||
| Net asset value, end of period | $ | 24.66 | $ | 19.61 | $ | 16.45 | $ | 19.39 | $ | 14.07 |
Total Return D | 28.45 % | 24.43% | (11.00)% E | 49.97% | 2.04% | |||||
Ratios to Average Net Assets B,F,G | ||||||||||
| Expenses before reductions | .63% | .63% | .65% | .65% | .66% | |||||
| Expenses net of fee waivers, if any | .62 % | .62% | .64% | .65% | .66% | |||||
| Expenses net of all reductions | .62% | .62% | .64% | .64% | .65% | |||||
| Net investment income (loss) | 1.27% | 1.26% | 1.03% | 1.21% | 1.83% | |||||
| Supplemental Data | ||||||||||
| Net assets, end of period (000 omitted) | $ | 382,995 | $ | 132,416 | $ | 52,884 | $ | 39,876 | $ | 20,725 |
Portfolio turnover rate H | 9 % | 18% | 13% | 43% | 49% I |
Fidelity Advisor® Mega Cap Stock Fund Class Z |
| Years ended June 30, | 2024 | 2023 | 2022 | 2021 | 2020 | |||||
Selected Per-Share Data | ||||||||||
| Net asset value, beginning of period | $ | 19.46 | $ | 16.32 | $ | 19.25 | $ | 13.97 | $ | 15.65 |
| Income from Investment Operations | ||||||||||
Net investment income (loss) A,B | .30 | .24 | .22 | .22 | .28 | |||||
| Net realized and unrealized gain (loss) | 5.17 | 3.66 | (2.20) | 6.36 | .08 | |||||
| Total from investment operations | 5.47 | 3.90 | (1.98) | 6.58 | .36 | |||||
| Distributions from net investment income | (.24) | (.25) | (.36) | (.30) | (.33) | |||||
| Distributions from net realized gain | (.21) | (.51) | (.59) | (1.00) | (1.70) | |||||
| Total distributions | (.45) | (.76) | (.95) | (1.30) | (2.04) C | |||||
| Net asset value, end of period | $ | 24.48 | $ | 19.46 | $ | 16.32 | $ | 19.25 | $ | 13.97 |
Total Return D | 28.59 % | 24.62% | (10.92)% E | 50.14% | 2.18% | |||||
Ratios to Average Net Assets B,F,G | ||||||||||
| Expenses before reductions | .52% | .52% | .51% | .52% | .53% | |||||
| Expenses net of fee waivers, if any | .51 % | .52% | .51% | .52% | .52% | |||||
| Expenses net of all reductions | .51% | .52% | .51% | .52% | .52% | |||||
| Net investment income (loss) | 1.38% | 1.37% | 1.16% | 1.34% | 1.96% | |||||
| Supplemental Data | ||||||||||
| Net assets, end of period (000 omitted) | $ | 422,435 | $ | 192,632 | $ | 222,146 | $ | 313,854 | $ | 213,832 |
Portfolio turnover rate H | 9 % | 18% | 13% | 43% | 49% I |
| Fidelity Central Fund | Investment Manager | Investment Objective | Investment Practices | Expense RatioA |
| Fidelity Money Market Central Funds | Fidelity Management & Research Company LLC (FMR) | Each fund seeks to obtain a high level of current income consistent with the preservation of capital and liquidity. | Short-term Investments | Less than .005% |
Gross unrealized appreciation | $1,183,686,132 |
Gross unrealized depreciation | (36,852,193) |
Net unrealized appreciation (depreciation) | $1,146,833,939 |
Tax Cost | $1,886,521,928 |
Undistributed ordinary income | $16,097,713 |
Undistributed long-term capital gain | $33,818,449 |
| Net unrealized appreciation (depreciation) on securities and other investments | $1,146,820,088 |
| June 30, 2024 | June 30,2023 | |
Ordinary Income | $21,144,621 | $ 17,258,351 |
Long-term Capital Gains | 21,477,079 | 41,168,637 |
Total | $42,621,700 | $ 58,426,988 |
| Equity Risk | Equity risk relates to the fluctuations in the value of financial instruments as a result of changes in market prices (other than those arising from interest rate risk or foreign exchange risk), whether caused by factors specific to an individual investment, its issuer, or all factors affecting all instruments traded in a market or market segment. |
| Purchases ($) | Sales ($) | |
Fidelity Mega Cap Stock Fund | 833,771,925 | 186,697,609 |
| Maximum Management Fee Rate % | |
| Class A | .60 |
| Class M | .60 |
| Class C | .62 |
| Mega Cap Stock | .57 |
| Class I | .58 |
| Class Z | .46 |
| Total Management Fee Rate % | |
| Class A | .60 |
| Class M | .60 |
| Class C | .62 |
| Mega Cap Stock | .57 |
| Class I | .58 |
| Class Z | .46 |
| Distribution Fee | Service Fee | Total Fees ($) | Retained by FDC ($) | |
Class A | - % | .25% | 411,788 | 24,780 |
Class M | .25% | .25% | 164,461 | - |
| Class C | .75% | .25% | 277,364 | 76,432 |
| 853,613 | 101,212 |
| Retained by FDC ($) | |
Class A | 125,833 |
Class M | 4,311 |
Class CA | 390 |
| 130,534 |
| % of Class-Level Average Net Assets | ||
Class A | .1754 | |
Class M | .1820 | |
Class C | .2000 | |
Mega Cap Stock | .1549 | |
Class I | .1557 | |
Class Z | .0420 | |
| Amount ($) | % of Class-Level Average Net Assets | |
Class A | 176,518 | .18 |
Class M | 38,606 | .18 |
Class C | 34,406 | .20 |
Mega Cap Stock | 1,445,731 | .16 |
Class I | 222,413 | .16 |
Class Z | 65,826 | .04 |
| 1,983,500 |
| % of Average Net Assets | |
Fidelity Mega Cap Stock Fund | .0272 |
| % of Average Net Assets | |
Fidelity Mega Cap Stock Fund | .03 |
| Amount ($) | |
Fidelity Mega Cap Stock Fund | 6,514 |
| Purchases ($) | Sales ($) | Realized Gain (Loss)($) | |
Fidelity Mega Cap Stock Fund | 44,362,111 | 5,861,942 | 2,668,072 |
| Amount ($) | |
Fidelity Mega Cap Stock Fund | 3,512 |
| Total Security Lending Fees Paid to NFS ($) | Security Lending Income From Securities Loaned to NFS ($) | Value of Securities Loaned to NFS at Period End ($) | |
Fidelity Mega Cap Stock Fund | 9,109 | - | - |
| Expense reduction ($) | |
Class M | 64 |
Year ended June 30, 2024 | Year ended June 30, 2023 | |
| Fidelity Mega Cap Stock Fund | ||
| Distributions to shareholders | ||
Class A | $2,880,657 | $3,853,966 |
Class M | 523,154 | 1,033,161 |
Class C | 330,364 | 718,884 |
Mega Cap Stock | 29,385,506 | 41,036,146 |
Class I | 4,587,110 | 2,435,167 |
Class Z | 4,914,909 | 9,349,664 |
Total | $42,621,700 | $58,426,988 |
| Shares | Shares | Dollars | Dollars | |
Year ended June 30, 2024 | Year ended June 30, 2023 | Year ended June 30, 2024 | Year ended June 30, 2023 | |
| Fidelity Mega Cap Stock Fund | ||||
| Class A | ||||
| Shares sold | 2,587,179 | 2,157,526 | $54,276,718 | $37,668,977 |
| Reinvestment of distributions | 141,517 | 228,217 | 2,864,554 | 3,827,312 |
| Shares redeemed | (1,054,694) | (912,758) | (22,201,323) | (15,785,502) |
| Net increase (decrease) | 1,674,002 | 1,472,985 | $34,939,949 | $25,710,787 |
| Class M | ||||
| Shares sold | 174,545 | 239,387 | $3,699,988 | $4,183,606 |
| Reinvestment of distributions | 25,773 | 61,536 | 522,636 | 1,032,772 |
| Shares redeemed | (312,705) | (277,862) | (6,645,422) | (4,825,558) |
| Net increase (decrease) | (112,387) | 23,061 | $(2,422,798) | $390,820 |
| Class C | ||||
| Shares sold | 608,294 | 328,805 | $12,377,132 | $5,600,248 |
| Reinvestment of distributions | 16,553 | 43,647 | 329,385 | 716,292 |
| Shares redeemed | (377,756) | (428,918) | (7,660,004) | (7,252,603) |
| Net increase (decrease) | 247,091 | (56,466) | $5,046,513 | $(936,063) |
| Mega Cap Stock | ||||
| Shares sold | 31,449,352 | 14,800,679 | $674,293,692 | $269,976,937 |
| Reinvestment of distributions | 1,300,230 | 2,240,783 | 26,741,328 | 38,208,143 |
| Shares redeemed | (14,101,698) | (12,025,767) | (301,970,898) | (203,167,741) |
| Net increase (decrease) | 18,647,884 | 5,015,695 | $399,064,122 | $105,017,339 |
| Class I | ||||
| Shares sold | 13,309,313 | 5,717,376 | $287,136,361 | $104,848,193 |
| Reinvestment of distributions | 206,340 | 141,083 | 4,255,654 | 2,409,447 |
| Shares redeemed | (4,738,963) | (2,320,856) | (103,276,376) | (41,167,093) |
| Net increase (decrease) | 8,776,690 | 3,537,603 | $188,115,639 | $66,090,547 |
| Class Z | ||||
| Shares sold | 9,232,769 | 7,722,491 | $196,402,260 | $125,806,074 |
| Reinvestment of distributions | 41,335 | 80,256 | 845,995 | 1,360,444 |
| Shares redeemed | (1,917,253) | (11,514,787) | (40,615,288) | (186,009,160) |
| Net increase (decrease) | 7,356,851 | (3,712,040) | $156,632,967 | $(58,842,642) |
 |


Contents
| Common Stocks - 98.4% | |||
| Shares | Value ($) | ||
| COMMUNICATION SERVICES - 10.2% | |||
| Diversified Telecommunication Services - 0.2% | |||
| Cellnex Telecom SA (a) | 856,200 | 27,847,450 | |
| Entertainment - 0.8% | |||
| The Walt Disney Co. | 749,393 | 74,407,231 | |
| Universal Music Group NV | 2,806,081 | 83,476,027 | |
| 157,883,258 | |||
| Interactive Media & Services - 7.4% | |||
| Alphabet, Inc.: | |||
| Class A | 2,167,925 | 394,887,539 | |
| Class C | 1,893,860 | 347,371,801 | |
| Match Group, Inc. (b) | 1,229,300 | 37,346,134 | |
| Meta Platforms, Inc. Class A | 1,053,500 | 531,195,770 | |
| Reddit, Inc. Class B (g) | 17,600 | 1,124,464 | |
| Snap, Inc. Class A (b) | 4,531,898 | 75,274,826 | |
| 1,387,200,534 | |||
| Media - 1.8% | |||
| Charter Communications, Inc. Class A (b) | 29,300 | 8,759,528 | |
| Comcast Corp. Class A | 7,055,642 | 276,298,941 | |
| Interpublic Group of Companies, Inc. | 1,866,870 | 54,307,248 | |
| 339,365,717 | |||
TOTAL COMMUNICATION SERVICES | 1,912,296,959 | ||
| CONSUMER DISCRETIONARY - 3.2% | |||
| Automobiles - 0.1% | |||
| Rivian Automotive, Inc. (b) | 1,054,900 | 14,156,758 | |
| Broadline Retail - 0.1% | |||
| Amazon.com, Inc. (b) | 106,000 | 20,484,500 | |
| Hotels, Restaurants & Leisure - 1.7% | |||
| Booking Holdings, Inc. | 54,737 | 216,840,626 | |
| Expedia Group, Inc. (b) | 233,500 | 29,418,665 | |
| Marriott International, Inc. Class A | 234,900 | 56,791,773 | |
| Starbucks Corp. | 326,700 | 25,433,595 | |
| 328,484,659 | |||
| Household Durables - 0.3% | |||
| Mohawk Industries, Inc. (b) | 284,389 | 32,303,747 | |
| Sony Group Corp. sponsored ADR | 104,200 | 8,851,790 | |
| Whirlpool Corp. (c) | 114,363 | 11,687,899 | |
| 52,843,436 | |||
| Specialty Retail - 0.9% | |||
| JD Sports Fashion PLC | 11,706,900 | 17,684,437 | |
| Lowe's Companies, Inc. | 616,107 | 135,826,949 | |
| RH (b) | 60,400 | 14,764,176 | |
| 168,275,562 | |||
| Textiles, Apparel & Luxury Goods - 0.1% | |||
| Compagnie Financiere Richemont SA Series A | 48,800 | 7,626,608 | |
| NIKE, Inc. Class B | 163,300 | 12,307,921 | |
| 19,934,529 | |||
TOTAL CONSUMER DISCRETIONARY | 604,179,444 | ||
| CONSUMER STAPLES - 4.8% | |||
| Beverages - 1.8% | |||
| Diageo PLC sponsored ADR | 394,900 | 49,788,992 | |
| Keurig Dr. Pepper, Inc. | 3,873,700 | 129,381,580 | |
| Pernod Ricard SA | 75,500 | 10,244,547 | |
| The Coca-Cola Co. | 2,204,695 | 140,328,837 | |
| 329,743,956 | |||
| Consumer Staples Distribution & Retail - 1.4% | |||
| Performance Food Group Co. (b) | 452,400 | 29,908,164 | |
| Sysco Corp. | 1,048,800 | 74,873,832 | |
| Target Corp. | 331,200 | 49,030,848 | |
| U.S. Foods Holding Corp. (b) | 560,700 | 29,705,886 | |
| Walmart, Inc. | 1,161,900 | 78,672,249 | |
| 262,190,979 | |||
| Personal Care Products - 1.4% | |||
| Estee Lauder Companies, Inc. Class A | 307,900 | 32,760,560 | |
| Haleon PLC ADR (c) | 14,034,436 | 115,924,441 | |
| Kenvue, Inc. | 5,895,311 | 107,176,754 | |
| 255,861,755 | |||
| Tobacco - 0.2% | |||
| Altria Group, Inc. | 692,459 | 31,541,507 | |
| Philip Morris International, Inc. | 146,900 | 14,885,377 | |
| 46,426,884 | |||
TOTAL CONSUMER STAPLES | 894,223,574 | ||
| ENERGY - 9.3% | |||
| Energy Equipment & Services - 0.1% | |||
| Tidewater, Inc. (b) | 235,400 | 22,412,434 | |
| Oil, Gas & Consumable Fuels - 9.2% | |||
| Cameco Corp. | 68,200 | 3,355,440 | |
| Exxon Mobil Corp. | 10,083,718 | 1,160,837,616 | |
| Galp Energia SGPS SA | 1,556,100 | 32,866,209 | |
| Imperial Oil Ltd. | 3,121,200 | 212,817,906 | |
| Kosmos Energy Ltd. (b) | 5,439,855 | 30,136,797 | |
| MEG Energy Corp. (b) | 2,659,750 | 56,906,460 | |
| Shell PLC ADR | 3,046,200 | 219,874,716 | |
| 1,716,795,144 | |||
TOTAL ENERGY | 1,739,207,578 | ||
| FINANCIALS - 16.2% | |||
| Banks - 11.2% | |||
| Bank of America Corp. | 12,480,294 | 496,341,292 | |
| HDFC Bank Ltd. sponsored ADR | 62,300 | 4,007,759 | |
| JPMorgan Chase & Co. | 1,049,571 | 212,286,230 | |
| M&T Bank Corp. | 456,820 | 69,144,275 | |
| PNC Financial Services Group, Inc. | 1,135,421 | 176,535,257 | |
| U.S. Bancorp | 3,030,919 | 120,327,484 | |
| Wells Fargo & Co. | 17,057,337 | 1,013,035,244 | |
| 2,091,677,541 | |||
| Capital Markets - 2.1% | |||
| 3i Group PLC | 219,700 | 8,467,438 | |
| Charles Schwab Corp. | 158,800 | 11,701,972 | |
| CME Group, Inc. | 19,900 | 3,912,340 | |
| KKR & Co. LP | 1,453,351 | 152,950,659 | |
| Moody's Corp. | 31,500 | 13,259,295 | |
| Morgan Stanley | 455,924 | 44,311,254 | |
| MSCI, Inc. | 11,300 | 5,443,775 | |
| Northern Trust Corp. | 1,617,546 | 135,841,513 | |
| Raymond James Financial, Inc. | 141,203 | 17,454,103 | |
| 393,342,349 | |||
| Financial Services - 2.5% | |||
| Corpay, Inc. (b) | 69,600 | 18,542,136 | |
| Edenred SA | 589,200 | 24,867,857 | |
| Fidelity National Information Services, Inc. | 129,900 | 9,789,264 | |
| Global Payments, Inc. | 156,300 | 15,114,210 | |
| MasterCard, Inc. Class A | 152,889 | 67,448,511 | |
| PayPal Holdings, Inc. (b) | 373,900 | 21,697,417 | |
| Visa, Inc. Class A | 1,178,493 | 309,319,058 | |
| 466,778,453 | |||
| Insurance - 0.4% | |||
| Arthur J. Gallagher & Co. | 127,500 | 33,062,025 | |
| Chubb Ltd. | 140,597 | 35,863,483 | |
| 68,925,508 | |||
TOTAL FINANCIALS | 3,020,723,851 | ||
| HEALTH CARE - 11.5% | |||
| Biotechnology - 0.5% | |||
| Alnylam Pharmaceuticals, Inc. (b) | 165,850 | 40,301,550 | |
| Argenx SE ADR (b) | 24,200 | 10,406,968 | |
| Merus BV (b) | 203,100 | 12,017,427 | |
| Vaxcyte, Inc. (b) | 432,100 | 32,627,871 | |
| 95,353,816 | |||
| Health Care Equipment & Supplies - 2.0% | |||
| Abbott Laboratories | 157,200 | 16,334,652 | |
| Becton, Dickinson & Co. | 144,706 | 33,819,239 | |
| Boston Scientific Corp. (b) | 3,748,219 | 288,650,345 | |
| Koninklijke Philips Electronics NV (depository receipt) (NY Reg.) | 798,894 | 20,132,129 | |
| Solventum Corp. | 223,718 | 11,830,208 | |
| 370,766,573 | |||
| Health Care Providers & Services - 5.0% | |||
| Cardinal Health, Inc. | 908,958 | 89,368,751 | |
| Cigna Group | 659,711 | 218,080,665 | |
| CVS Health Corp. | 646,752 | 38,197,173 | |
| Guardant Health, Inc. (b) | 390,000 | 11,263,200 | |
| Humana, Inc. | 226,800 | 84,743,820 | |
| McKesson Corp. | 295,621 | 172,654,489 | |
| UnitedHealth Group, Inc. | 604,181 | 307,685,216 | |
| 921,993,314 | |||
| Life Sciences Tools & Services - 0.4% | |||
| Danaher Corp. | 283,300 | 70,782,505 | |
| Thermo Fisher Scientific, Inc. | 13,200 | 7,299,600 | |
| 78,082,105 | |||
| Pharmaceuticals - 3.6% | |||
| Bristol-Myers Squibb Co. | 2,960,960 | 122,968,669 | |
| Eli Lilly & Co. | 196,200 | 177,635,556 | |
| Galderma Group AG | 264,600 | 21,781,753 | |
| GSK PLC sponsored ADR | 3,149,428 | 121,252,978 | |
| Johnson & Johnson | 709,777 | 103,741,006 | |
| UCB SA | 879,200 | 130,597,040 | |
| 677,977,002 | |||
TOTAL HEALTH CARE | 2,144,172,810 | ||
| INDUSTRIALS - 15.7% | |||
| Aerospace & Defense - 9.4% | |||
| Airbus Group NV | 474,200 | 65,082,390 | |
| Bombardier, Inc. Class B (sub. vtg.) (b) | 526,900 | 33,788,924 | |
| Embraer SA sponsored ADR (b) | 935,300 | 24,130,740 | |
| General Dynamics Corp. | 203,360 | 59,002,870 | |
| General Electric Co. (d) | 6,127,906 | 974,153,217 | |
| Huntington Ingalls Industries, Inc. | 140,150 | 34,523,150 | |
| Loar Holdings, Inc. (c) | 17,900 | 956,039 | |
| Rolls-Royce Holdings PLC (b) | 3,000,200 | 17,230,869 | |
| Spirit AeroSystems Holdings, Inc. Class A (b) | 2,155,100 | 70,838,137 | |
| Textron, Inc. | 166,200 | 14,269,932 | |
| The Boeing Co. (b) | 2,556,746 | 465,353,339 | |
| 1,759,329,607 | |||
| Air Freight & Logistics - 1.5% | |||
| FedEx Corp. | 303,247 | 90,925,580 | |
| United Parcel Service, Inc. Class B | 1,357,656 | 185,795,224 | |
| 276,720,804 | |||
| Commercial Services & Supplies - 0.3% | |||
| ACV Auctions, Inc. Class A (b) | 1,078,600 | 19,684,450 | |
| GFL Environmental, Inc. | 501,800 | 19,543,075 | |
| Veralto Corp. | 101,866 | 9,725,147 | |
| 48,952,672 | |||
| Construction & Engineering - 0.0% | |||
| Centuri Holdings, Inc. | 71,000 | 1,383,080 | |
| Electrical Equipment - 3.0% | |||
| Acuity Brands, Inc. | 113,469 | 27,395,955 | |
| GE Vernova LLC | 1,765,726 | 302,839,666 | |
| Hubbell, Inc. (d) | 144,114 | 52,670,785 | |
| Regal Rexnord Corp. | 308,400 | 41,701,848 | |
| Vertiv Holdings Co. | 1,688,000 | 146,130,160 | |
| 570,738,414 | |||
| Ground Transportation - 0.3% | |||
| Knight-Swift Transportation Holdings, Inc. | 1,077,015 | 53,764,589 | |
| Machinery - 1.0% | |||
| Allison Transmission Holdings, Inc. | 237,300 | 18,011,070 | |
| Chart Industries, Inc. (b) | 163,000 | 23,527,420 | |
| Cummins, Inc. | 91,900 | 25,449,867 | |
| Deere & Co. | 39,000 | 14,571,570 | |
| Fortive Corp. | 420,200 | 31,136,820 | |
| Mitsubishi Heavy Industries Ltd. | 1,003,500 | 10,802,755 | |
| Nordson Corp. | 27,900 | 6,471,126 | |
| Otis Worldwide Corp. | 238,884 | 22,994,974 | |
| Stanley Black & Decker, Inc. | 145,300 | 11,608,017 | |
| Westinghouse Air Brake Tech Co. | 103,585 | 16,371,609 | |
| 180,945,228 | |||
| Passenger Airlines - 0.1% | |||
| Ryanair Holdings PLC sponsored ADR | 113,400 | 13,204,296 | |
| Professional Services - 0.1% | |||
| Equifax, Inc. | 52,400 | 12,704,904 | |
| Trading Companies & Distributors - 0.0% | |||
| Watsco, Inc. | 24,100 | 11,164,084 | |
TOTAL INDUSTRIALS | 2,928,907,678 | ||
| INFORMATION TECHNOLOGY - 23.6% | |||
| IT Services - 0.2% | |||
| EPAM Systems, Inc. (b) | 37,000 | 6,960,070 | |
| IBM Corp. | 140,100 | 24,230,295 | |
| Twilio, Inc. Class A (b) | 316,700 | 17,991,727 | |
| 49,182,092 | |||
| Semiconductors & Semiconductor Equipment - 8.3% | |||
| Analog Devices, Inc. | 162,738 | 37,146,576 | |
| Applied Materials, Inc. | 334,402 | 78,915,528 | |
| BE Semiconductor Industries NV | 14,164 | 2,368,629 | |
| Broadcom, Inc. | 88,600 | 142,249,958 | |
| Lam Research Corp. | 66,400 | 70,706,040 | |
| Marvell Technology, Inc. | 2,102,385 | 146,956,712 | |
| NVIDIA Corp. | 7,222,000 | 892,205,880 | |
| Qualcomm, Inc. | 341,131 | 67,946,473 | |
| Taiwan Semiconductor Manufacturing Co. Ltd. sponsored ADR | 433,500 | 75,346,635 | |
| Teradyne, Inc. | 217,000 | 32,178,930 | |
| 1,546,021,361 | |||
| Software - 12.2% | |||
| Adobe, Inc. (b) | 295,700 | 164,273,178 | |
| Autodesk, Inc. (b) | 221,828 | 54,891,339 | |
| Dassault Systemes SA | 272,700 | 10,253,786 | |
| DoubleVerify Holdings, Inc. (b) | 224,600 | 4,372,962 | |
| Elastic NV (b) | 267,600 | 30,482,316 | |
| Intuit, Inc. | 91,300 | 60,003,273 | |
| Microsoft Corp. | 3,339,805 | 1,492,725,844 | |
| Oracle Corp. | 1,442,100 | 203,624,520 | |
| PTC, Inc. (b) | 122,900 | 22,327,243 | |
| Sage Group PLC | 1,186,800 | 16,330,046 | |
| Salesforce, Inc. | 91,500 | 23,524,650 | |
| SAP SE sponsored ADR | 904,446 | 182,435,803 | |
| Workday, Inc. Class A (b) | 42,900 | 9,590,724 | |
| 2,274,835,684 | |||
| Technology Hardware, Storage & Peripherals - 2.9% | |||
| Apple, Inc. | 2,437,114 | 513,304,951 | |
| Samsung Electronics Co. Ltd. | 433,230 | 25,585,036 | |
| 538,889,987 | |||
TOTAL INFORMATION TECHNOLOGY | 4,408,929,124 | ||
| MATERIALS - 2.0% | |||
| Chemicals - 0.2% | |||
| Air Products & Chemicals, Inc. | 130,700 | 33,727,135 | |
| Sherwin-Williams Co. | 29,100 | 8,684,313 | |
| 42,411,448 | |||
| Metals & Mining - 1.8% | |||
| First Quantum Minerals Ltd. | 13,405,500 | 176,087,742 | |
| Freeport-McMoRan, Inc. | 1,870,842 | 90,922,921 | |
| Ivanhoe Mines Ltd. (b) | 4,347,600 | 56,090,888 | |
| 323,101,551 | |||
TOTAL MATERIALS | 365,512,999 | ||
| REAL ESTATE - 0.9% | |||
| Equity Real Estate Investment Trusts (REITs) - 0.9% | |||
| American Tower Corp. | 265,981 | 51,701,387 | |
| Crown Castle, Inc. | 671,500 | 65,605,550 | |
| Equinix, Inc. | 4,422 | 3,345,685 | |
| Simon Property Group, Inc. | 154,200 | 23,407,560 | |
| Terreno Realty Corp. | 254,600 | 15,067,228 | |
| 159,127,410 | |||
| UTILITIES - 1.0% | |||
| Electric Utilities - 1.0% | |||
| Duke Energy Corp. | 71,400 | 7,156,422 | |
| Edison International | 154,200 | 11,073,102 | |
| Entergy Corp. | 110,700 | 11,844,900 | |
| Southern Co. | 2,021,000 | 156,768,970 | |
| 186,843,394 | |||
| Independent Power and Renewable Electricity Producers - 0.0% | |||
| Vistra Corp. | 63,200 | 5,433,936 | |
TOTAL UTILITIES | 192,277,330 | ||
| TOTAL COMMON STOCKS (Cost $9,965,631,478) | 18,369,558,757 | ||
| Money Market Funds - 1.7% | |||
| Shares | Value ($) | ||
| Fidelity Cash Central Fund 5.38% (e) | 285,031,252 | 285,088,259 | |
| Fidelity Securities Lending Cash Central Fund 5.38% (e)(f) | 33,067,904 | 33,071,211 | |
| TOTAL MONEY MARKET FUNDS (Cost $318,159,470) | 318,159,470 | ||
| TOTAL INVESTMENT IN SECURITIES - 100.1% (Cost $10,283,790,948) | 18,687,718,227 |
NET OTHER ASSETS (LIABILITIES) - (0.1)% | (23,854,978) |
| NET ASSETS - 100.0% | 18,663,863,249 |
| Written Options | ||||||
| Counterparty | Number of Contracts | Notional Amount ($) | Exercise Price ($) | Expiration Date | Value ($) | |
| Call Options | ||||||
| General Electric Co. | Chicago Board Options Exchange | 3,000 | 47,691,000 | 185.00 | 09/20/24 | (615,000) |
| Hubbell, Inc. | Chicago Board Options Exchange | 700 | 25,583,600 | 470.00 | 09/20/24 | (175,000) |
| TOTAL WRITTEN OPTIONS | (790,000) | |||||
| (a) | Security exempt from registration under Rule 144A of the Securities Act of 1933. These securities may be resold in transactions exempt from registration, normally to qualified institutional buyers. At the end of the period, the value of these securities amounted to $27,847,450 or 0.1% of net assets. |
| (b) | Non-income producing |
| (c) | Security or a portion of the security is on loan at period end. |
| (d) | Security or a portion of the security is pledged as collateral for options written. At period end, the value of securities pledged amounted to $73,274,600. |
| (e) | Affiliated fund that is generally available only to investment companies and other accounts managed by Fidelity Investments. The rate quoted is the annualized seven-day yield of the fund at period end. A complete unaudited listing of the fund's holdings as of its most recent quarter end is available upon request. In addition, each Fidelity Central Fund's financial statements, which are not covered by the Fund's Report of Independent Registered Public Accounting Firm, are available on the SEC's website or upon request. |
| (f) | Investment made with cash collateral received from securities on loan. |
| (g) | Equity security is subject to lock-up or market standoff agreement. Fair value is based on the unadjusted market price of the equivalent equity security. As of period end, the total fair value of unadjusted equity securities subject to contractual sale restrictions is $1,124,464 and all restrictions are set to expire on or before September 30, 2024. Under normal market conditions, there are no circumstances that could cause the restrictions to lapse. |
| Affiliate | Value, beginning of period ($) | Purchases ($) | Sales Proceeds ($) | Dividend Income ($) | Realized Gain (loss) ($) | Change in Unrealized appreciation (depreciation) ($) | Value, end of period ($) | % ownership, end of period |
| Fidelity Cash Central Fund 5.38% | 456,325,379 | 2,345,521,723 | 2,516,757,693 | 17,207,276 | (1,150) | - | 285,088,259 | 0.5% |
| Fidelity Securities Lending Cash Central Fund 5.38% | 59,612,304 | 959,205,383 | 985,746,476 | 923,480 | - | - | 33,071,211 | 0.1% |
| Total | 515,937,683 | 3,304,727,106 | 3,502,504,169 | 18,130,756 | (1,150) | - | 318,159,470 | |
| Valuation Inputs at Reporting Date: | ||||
| Description | Total ($) | Level 1 ($) | Level 2 ($) | Level 3 ($) |
Investments in Securities: | ||||
| Equities: | ||||
Communication Services | 1,912,296,959 | 1,800,973,482 | 111,323,477 | - |
Consumer Discretionary | 604,179,444 | 596,552,836 | 7,626,608 | - |
Consumer Staples | 894,223,574 | 894,223,574 | - | - |
Energy | 1,739,207,578 | 1,706,341,369 | 32,866,209 | - |
Financials | 3,020,723,851 | 3,012,256,413 | 8,467,438 | - |
Health Care | 2,144,172,810 | 2,144,172,810 | - | - |
Industrials | 2,928,907,678 | 2,835,791,664 | 93,116,014 | - |
Information Technology | 4,408,929,124 | 4,398,675,338 | 10,253,786 | - |
Materials | 365,512,999 | 365,512,999 | - | - |
Real Estate | 159,127,410 | 159,127,410 | - | - |
Utilities | 192,277,330 | 192,277,330 | - | - |
| Money Market Funds | 318,159,470 | 318,159,470 | - | - |
| Total Investments in Securities: | 18,687,718,227 | 18,424,064,695 | 263,653,532 | - |
Derivative Instruments: Liabilities | ||||
Written Options | (790,000) | (790,000) | - | - |
| Total Liabilities | (790,000) | (790,000) | - | - |
| Total Derivative Instruments: | (790,000) | (790,000) | - | - |
Primary Risk Exposure / Derivative Type | Value | |
| Asset ($) | Liability ($) | |
| Equity Risk | ||
Written Options (a) | 0 | (790,000) |
| Total Equity Risk | 0 | (790,000) |
| Total Value of Derivatives | 0 | (790,000) |
| Statement of Assets and Liabilities | ||||
| June 30, 2024 | ||||
| Assets | ||||
| Investment in securities, at value (including securities loaned of $31,617,782) - See accompanying schedule: | ||||
Unaffiliated issuers (cost $9,965,631,478) | $ | 18,369,558,757 | ||
Fidelity Central Funds (cost $318,159,470) | 318,159,470 | |||
| Total Investment in Securities (cost $10,283,790,948) | $ | 18,687,718,227 | ||
| Foreign currency held at value (cost $86,340) | 86,340 | |||
| Receivable for investments sold | 206,878 | |||
| Receivable for fund shares sold | 25,389,570 | |||
| Dividends receivable | 14,937,175 | |||
| Distributions receivable from Fidelity Central Funds | 1,358,709 | |||
| Other receivables | 324,460 | |||
Total assets | 18,730,021,359 | |||
| Liabilities | ||||
| Payable for investments purchased | $ | 12,742,805 | ||
| Payable for fund shares redeemed | 19,107,947 | |||
| Accrued management fee | 361,073 | |||
| Written options, at value (premium received $2,324,019) | 790,000 | |||
| Other payables and accrued expenses | 101,885 | |||
| Collateral on securities loaned | 33,054,400 | |||
| Total liabilities | 66,158,110 | |||
| Net Assets | $ | 18,663,863,249 | ||
| Net Assets consist of: | ||||
| Paid in capital | $ | 9,349,118,068 | ||
| Total accumulated earnings (loss) | 9,314,745,181 | |||
| Net Assets | $ | 18,663,863,249 | ||
Net Asset Value, offering price and redemption price per share ($18,663,863,249 ÷ 813,736,035 shares) | $ | 22.94 | ||
| Statement of Operations | ||||
Year ended June 30, 2024 | ||||
| Investment Income | ||||
| Dividends | $ | 264,096,458 | ||
| Interest | 3,046 | |||
| Income from Fidelity Central Funds (including $923,480 from security lending) | 18,130,756 | |||
| Total income | 282,230,260 | |||
| Expenses | ||||
| Custodian fees and expenses | $ | 511,247 | ||
| Independent trustees' fees and expenses | 79,653 | |||
| Interest | 12,187 | |||
| Miscellaneous | 86 | |||
| Total expenses before reductions | 603,173 | |||
| Expense reductions | (41,661) | |||
| Total expenses after reductions | 561,512 | |||
| Net Investment income (loss) | 281,668,748 | |||
| Realized and Unrealized Gain (Loss) | ||||
| Net realized gain (loss) on: | ||||
| Investment Securities: | ||||
| Unaffiliated issuers | 1,225,810,020 | |||
| Fidelity Central Funds | (1,150) | |||
| Foreign currency transactions | (128,823) | |||
| Written options | 4,077,576 | |||
| Total net realized gain (loss) | 1,229,757,623 | |||
| Change in net unrealized appreciation (depreciation) on: | ||||
| Investment Securities: | ||||
| Unaffiliated issuers | 2,660,779,005 | |||
| Assets and liabilities in foreign currencies | (94,167) | |||
| Written options | 1,534,019 | |||
| Total change in net unrealized appreciation (depreciation) | 2,662,218,857 | |||
| Net gain (loss) | 3,891,976,480 | |||
| Net increase (decrease) in net assets resulting from operations | $ | 4,173,645,228 | ||
| Statement of Changes in Net Assets | ||||
Year ended June 30, 2024 | Year ended June 30, 2023 | |||
| Increase (Decrease) in Net Assets | ||||
| Operations | ||||
| Net investment income (loss) | $ | 281,668,748 | $ | 279,231,241 |
| Net realized gain (loss) | 1,229,757,623 | 209,032,620 | ||
| Change in net unrealized appreciation (depreciation) | 2,662,218,857 | 2,461,954,725 | ||
| Net increase (decrease) in net assets resulting from operations | 4,173,645,228 | 2,950,218,586 | ||
| Distributions to shareholders | (821,641,569) | (859,194,238) | ||
| Share transactions | ||||
| Proceeds from sales of shares | 2,385,418,960 | 2,951,775,908 | ||
| Reinvestment of distributions | 821,641,569 | 859,194,238 | ||
| Cost of shares redeemed | (3,042,544,475) | (3,553,138,409) | ||
Net increase (decrease) in net assets resulting from share transactions | 164,516,054 | 257,831,737 | ||
| Total increase (decrease) in net assets | 3,516,519,713 | 2,348,856,085 | ||
| Net Assets | ||||
| Beginning of period | 15,147,343,536 | 12,798,487,451 | ||
| End of period | $ | 18,663,863,249 | $ | 15,147,343,536 |
| Other Information | ||||
| Shares | ||||
| Sold | 119,339,539 | 174,605,044 | ||
| Issued in reinvestment of distributions | 43,534,511 | 51,636,302 | ||
| Redeemed | (150,486,608) | (206,693,495) | ||
| Net increase (decrease) | 12,387,442 | 19,547,851 | ||
Fidelity® Series Large Cap Stock Fund |
| Years ended June 30, | 2024 | 2023 | 2022 | 2021 | 2020 | |||||
Selected Per-Share Data | ||||||||||
| Net asset value, beginning of period | $ | 18.90 | $ | 16.37 | $ | 19.80 | $ | 14.07 | $ | 14.98 |
| Income from Investment Operations | ||||||||||
Net investment income (loss) A,B | .35 | .34 | .34 | .34 | .37 | |||||
| Net realized and unrealized gain (loss) | 4.72 | 3.27 | (2.02) | 6.27 | (.32) | |||||
| Total from investment operations | 5.07 | 3.61 | (1.68) | 6.61 | .05 | |||||
| Distributions from net investment income | (.36) | (.33) | (.47) | (.37) | (.28) | |||||
| Distributions from net realized gain | (.68) | (.76) | (1.28) | (.52) | (.68) | |||||
| Total distributions | (1.03) C | (1.08) C | (1.75) | (.88) C | (.96) | |||||
| Net asset value, end of period | $ | 22.94 | $ | 18.90 | $ | 16.37 | $ | 19.80 | $ | 14.07 |
Total Return D | 28.11 % | 23.03% | (9.44)% | 49.05% | .17% | |||||
Ratios to Average Net Assets B,E,F | ||||||||||
Expenses before reductions G | -% | -% | -% | -% | -% | |||||
Expenses net of fee waivers, if any G | - % | -% | -% | -% | -% | |||||
Expenses net of all reductions G | -% | -% | -% | -% | -% | |||||
| Net investment income (loss) | 1.73% | 1.98% | 1.84% | 2.04% | 2.58% | |||||
| Supplemental Data | ||||||||||
| Net assets, end of period (000 omitted) | $ | 18,663,863 | $ | 15,147,344 | $ | 12,798,487 | $ | 14,792,790 | $ | 11,937,391 |
Portfolio turnover rate H | 18 % | 12% | 17% | 15% | 28% I |
| Fidelity Central Fund | Investment Manager | Investment Objective | Investment Practices | Expense RatioA |
| Fidelity Money Market Central Funds | Fidelity Management & Research Company LLC (FMR) | Each fund seeks to obtain a high level of current income consistent with the preservation of capital and liquidity. | Short-term Investments | Less than .005% |
| Gross unrealized appreciation | $8,688,548,304 |
| Gross unrealized depreciation | (346,566,141) |
| Net unrealized appreciation (depreciation) | $8,341,982,163 |
| Tax Cost | $10,344,946,064 |
| Undistributed ordinary income | $147,648,578 |
| Undistributed long-term capital gain | $825,276,623 |
| Net unrealized appreciation (depreciation) on securities and other investments | $8,341,819,981 |
| June 30, 2024 | June 30, 2023 | |
| Ordinary Income | $284,242,652 | $ 262,838,082 |
| Long-term Capital Gains | 537,398,917 | 596,356,156 |
| Total | $821,641,569 | $ 859,194,238 |
| Equity Risk | Equity risk relates to the fluctuations in the value of financial instruments as a result of changes in market prices (other than those arising from interest rate risk or foreign exchange risk), whether caused by factors specific to an individual investment, its issuer, or all factors affecting all instruments traded in a market or market segment. |
| Purchases ($) | Sales ($) | |
| Fidelity Series Large Cap Stock Fund | 2,919,268,910 | 3,332,845,389 |
| Amount ($) | |
| Fidelity Series Large Cap Stock Fund | 40,853 |
| Borrower or Lender | Average Loan Balance ($) | Weighted Average Interest Rate | Interest Expense ($) | |
| Fidelity Series Large Cap Stock Fund | Borrower | 39,383,500 | 5.57% | 12,187 |
| Purchases ($) | Sales ($) | Realized Gain (Loss)($) | |
| Fidelity Series Large Cap Stock Fund | 183,734,783 | 154,502,562 | 51,030,918 |
| Total Security Lending Fees Paid to NFS ($) | Security Lending Income From Securities Loaned to NFS ($) | Value of Securities Loaned to NFS at Period End ($) | |
| Fidelity Series Large Cap Stock Fund | 93,963 | 11 | - |
 |


Contents
| Common Stocks - 99.2% | |||
| Shares | Value ($) (000s) | ||
| COMMUNICATION SERVICES - 14.5% | |||
| Interactive Media & Services - 14.5% | |||
| Alphabet, Inc.: | |||
| Class A | 4,194,200 | 763,974 | |
| Class C | 171,500 | 31,457 | |
| Meta Platforms, Inc. Class A | 791,901 | 399,292 | |
| 1,194,723 | |||
| CONSUMER DISCRETIONARY - 11.4% | |||
| Broadline Retail - 5.4% | |||
| Amazon.com, Inc. (a) | 2,307,300 | 445,886 | |
| Hotels, Restaurants & Leisure - 0.8% | |||
| Airbnb, Inc. Class A (a) | 20,400 | 3,093 | |
| Chipotle Mexican Grill, Inc. (a) | 780,000 | 48,867 | |
| Expedia Group, Inc. (a) | 90,500 | 11,402 | |
| 63,362 | |||
| Household Durables - 1.1% | |||
| NVR, Inc. (a) | 5,350 | 40,599 | |
| PulteGroup, Inc. | 403,300 | 44,403 | |
| 85,002 | |||
| Specialty Retail - 3.3% | |||
| AutoZone, Inc. (a) | 670 | 1,986 | |
| Lowe's Companies, Inc. | 243,400 | 53,660 | |
| Murphy U.S.A., Inc. | 90,401 | 42,440 | |
| O'Reilly Automotive, Inc. (a) | 66,400 | 70,122 | |
| The Home Depot, Inc. | 300,200 | 103,341 | |
| 271,549 | |||
| Textiles, Apparel & Luxury Goods - 0.8% | |||
| Crocs, Inc. (a) | 410,000 | 59,835 | |
| lululemon athletica, Inc. (a) | 26,900 | 8,035 | |
| 67,870 | |||
TOTAL CONSUMER DISCRETIONARY | 933,669 | ||
| CONSUMER STAPLES - 3.1% | |||
| Consumer Staples Distribution & Retail - 2.0% | |||
| Costco Wholesale Corp. | 192,700 | 163,793 | |
| Household Products - 1.1% | |||
| Procter & Gamble Co. | 524,800 | 86,550 | |
TOTAL CONSUMER STAPLES | 250,343 | ||
| ENERGY - 1.2% | |||
| Oil, Gas & Consumable Fuels - 1.2% | |||
| Exxon Mobil Corp. | 155,000 | 17,844 | |
| Marathon Petroleum Corp. | 123,800 | 21,477 | |
| Occidental Petroleum Corp. | 319,600 | 20,144 | |
| Valero Energy Corp. | 254,200 | 39,848 | |
| 99,313 | |||
| FINANCIALS - 8.7% | |||
| Banks - 1.3% | |||
| JPMorgan Chase & Co. | 162,000 | 32,766 | |
| Wells Fargo & Co. | 1,298,700 | 77,130 | |
| 109,896 | |||
| Capital Markets - 1.2% | |||
| Ameriprise Financial, Inc. | 127,900 | 54,638 | |
| MSCI, Inc. | 84,259 | 40,592 | |
| 95,230 | |||
| Consumer Finance - 0.8% | |||
| American Express Co. | 300,000 | 69,465 | |
| Financial Services - 3.3% | |||
| Apollo Global Management, Inc. | 360,000 | 42,505 | |
| MasterCard, Inc. Class A | 232,300 | 102,481 | |
| Visa, Inc. Class A | 470,000 | 123,361 | |
| 268,347 | |||
| Insurance - 2.1% | |||
| Arthur J. Gallagher & Co. | 245,000 | 63,531 | |
| Kinsale Capital Group, Inc. | 4,689 | 1,807 | |
| Marsh & McLennan Companies, Inc. | 208,287 | 43,890 | |
| Progressive Corp. | 311,300 | 64,660 | |
| 173,888 | |||
TOTAL FINANCIALS | 716,826 | ||
| HEALTH CARE - 12.7% | |||
| Biotechnology - 1.5% | |||
| Regeneron Pharmaceuticals, Inc. (a) | 54,300 | 57,071 | |
| Vertex Pharmaceuticals, Inc. (a) | 145,042 | 67,984 | |
| 125,055 | |||
| Health Care Equipment & Supplies - 1.2% | |||
| Boston Scientific Corp. (a) | 650,000 | 50,057 | |
| DexCom, Inc. (a) | 161,800 | 18,345 | |
| ResMed, Inc. (b) | 152,000 | 29,096 | |
| 97,498 | |||
| Health Care Providers & Services - 4.4% | |||
| Cardinal Health, Inc. | 240,000 | 23,597 | |
| Cencora, Inc. | 267,000 | 60,155 | |
| Centene Corp. (a) | 515,000 | 34,145 | |
| McKesson Corp. | 112,800 | 65,880 | |
| Molina Healthcare, Inc. (a) | 168,500 | 50,095 | |
| UnitedHealth Group, Inc. | 252,000 | 128,334 | |
| 362,206 | |||
| Health Care Technology - 0.4% | |||
| Doximity, Inc. (a)(b) | 1,200,072 | 33,566 | |
| Life Sciences Tools & Services - 1.0% | |||
| Mettler-Toledo International, Inc. (a) | 6,400 | 8,945 | |
| Thermo Fisher Scientific, Inc. | 132,300 | 73,162 | |
| 82,107 | |||
| Pharmaceuticals - 4.2% | |||
| Eli Lilly & Co. | 266,300 | 241,103 | |
| Galderma Group AG | 70,000 | 5,762 | |
| Merck & Co., Inc. | 784,000 | 97,059 | |
| 343,924 | |||
TOTAL HEALTH CARE | 1,044,356 | ||
| INDUSTRIALS - 9.7% | |||
| Aerospace & Defense - 1.7% | |||
| General Electric Co. | 217,964 | 34,650 | |
| Howmet Aerospace, Inc. | 588,700 | 45,701 | |
| TransDigm Group, Inc. | 46,200 | 59,026 | |
| 139,377 | |||
| Building Products - 1.6% | |||
| Builders FirstSource, Inc. (a) | 292,700 | 40,513 | |
| Carrier Global Corp. | 487,800 | 30,770 | |
| Trane Technologies PLC | 181,700 | 59,767 | |
| 131,050 | |||
| Commercial Services & Supplies - 0.7% | |||
| Cintas Corp. | 44,100 | 30,881 | |
| Copart, Inc. | 580,700 | 31,451 | |
| 62,332 | |||
| Construction & Engineering - 1.4% | |||
| Centuri Holdings, Inc. | 17,500 | 341 | |
| EMCOR Group, Inc. | 200,000 | 73,016 | |
| Quanta Services, Inc. | 159,654 | 40,566 | |
| 113,923 | |||
| Electrical Equipment - 2.2% | |||
| AMETEK, Inc. | 198,223 | 33,046 | |
| Eaton Corp. PLC | 185,100 | 58,038 | |
| Nextracker, Inc. Class A (a) | 471,321 | 22,096 | |
| nVent Electric PLC | 596,040 | 45,663 | |
| Vertiv Holdings Co. | 228,000 | 19,738 | |
| 178,581 | |||
| Ground Transportation - 0.2% | |||
| Old Dominion Freight Lines, Inc. | 112,000 | 19,779 | |
| Machinery - 1.5% | |||
| PACCAR, Inc. | 498,967 | 51,364 | |
| Parker Hannifin Corp. | 145,600 | 73,646 | |
| 125,010 | |||
| Trading Companies & Distributors - 0.4% | |||
| W.W. Grainger, Inc. | 35,000 | 31,578 | |
TOTAL INDUSTRIALS | 801,630 | ||
| INFORMATION TECHNOLOGY - 36.3% | |||
| Communications Equipment - 0.1% | |||
| Arista Networks, Inc. (a) | 18,000 | 6,309 | |
| IT Services - 0.2% | |||
| Accenture PLC Class A | 57,300 | 17,385 | |
| Semiconductors & Semiconductor Equipment - 14.8% | |||
| Astera Labs, Inc. | 14,100 | 853 | |
| Broadcom, Inc. | 144,600 | 232,160 | |
| KLA Corp. | 150,900 | 124,419 | |
| Lam Research Corp. | 106,100 | 112,981 | |
| NVIDIA Corp. | 5,088,000 | 628,572 | |
| NXP Semiconductors NV | 27,677 | 7,448 | |
| Qorvo, Inc. (a) | 173,900 | 20,179 | |
| Taiwan Semiconductor Manufacturing Co. Ltd. sponsored ADR | 543,900 | 94,535 | |
| 1,221,147 | |||
| Software - 13.6% | |||
| Adobe, Inc. (a) | 38,500 | 21,388 | |
| Cadence Design Systems, Inc. (a) | 218,300 | 67,182 | |
| Microsoft Corp. | 2,083,000 | 930,993 | |
| Roper Technologies, Inc. | 600 | 338 | |
| Salesforce, Inc. | 248,800 | 63,966 | |
| Synopsys, Inc. (a) | 53,700 | 31,955 | |
| 1,115,822 | |||
| Technology Hardware, Storage & Peripherals - 7.6% | |||
| Apple, Inc. | 2,989,800 | 629,712 | |
TOTAL INFORMATION TECHNOLOGY | 2,990,375 | ||
| MATERIALS - 0.6% | |||
| Chemicals - 0.3% | |||
| Air Products & Chemicals, Inc. | 99,400 | 25,650 | |
| Metals & Mining - 0.3% | |||
| Steel Dynamics, Inc. | 200,000 | 25,900 | |
TOTAL MATERIALS | 51,550 | ||
| UTILITIES - 1.0% | |||
| Independent Power and Renewable Electricity Producers - 1.0% | |||
| Vistra Corp. | 930,000 | 79,961 | |
| TOTAL COMMON STOCKS (Cost $3,559,657) | 8,162,746 | ||
| Money Market Funds - 1.0% | |||
| Shares | Value ($) (000s) | ||
| Fidelity Cash Central Fund 5.38% (c) | 76,951,697 | 76,967 | |
| Fidelity Securities Lending Cash Central Fund 5.38% (c)(d) | 9,383,212 | 9,384 | |
| TOTAL MONEY MARKET FUNDS (Cost $86,349) | 86,351 | ||
| TOTAL INVESTMENT IN SECURITIES - 100.2% (Cost $3,646,006) | 8,249,097 |
NET OTHER ASSETS (LIABILITIES) - (0.2)% | (18,354) |
| NET ASSETS - 100.0% | 8,230,743 |
| (a) | Non-income producing |
| (b) | Security or a portion of the security is on loan at period end. |
| (c) | Affiliated fund that is generally available only to investment companies and other accounts managed by Fidelity Investments. The rate quoted is the annualized seven-day yield of the fund at period end. A complete unaudited listing of the fund's holdings as of its most recent quarter end is available upon request. In addition, each Fidelity Central Fund's financial statements, which are not covered by the Fund's Report of Independent Registered Public Accounting Firm, are available on the SEC's website or upon request. |
| (d) | Investment made with cash collateral received from securities on loan. |
| Affiliate (Amounts in thousands) | Value, beginning of period ($) | Purchases ($) | Sales Proceeds ($) | Dividend Income ($) | Realized Gain (loss) ($) | Change in Unrealized appreciation (depreciation) ($) | Value, end of period ($) | % ownership, end of period |
| Fidelity Cash Central Fund 5.38% | 155,558 | 2,616,113 | 2,694,703 | 6,457 | (1) | - | 76,967 | 0.1% |
| Fidelity Securities Lending Cash Central Fund 5.38% | - | 107,055 | 97,671 | 14 | - | - | 9,384 | 0.0% |
| Total | 155,558 | 2,723,168 | 2,792,374 | 6,471 | (1) | - | 86,351 | |
| Valuation Inputs at Reporting Date: | ||||
Description (Amounts in thousands) | Total ($) | Level 1 ($) | Level 2 ($) | Level 3 ($) |
Investments in Securities: | ||||
| Equities: | ||||
Communication Services | 1,194,723 | 1,194,723 | - | - |
Consumer Discretionary | 933,669 | 933,669 | - | - |
Consumer Staples | 250,343 | 250,343 | - | - |
Energy | 99,313 | 99,313 | - | - |
Financials | 716,826 | 716,826 | - | - |
Health Care | 1,044,356 | 1,044,356 | - | - |
Industrials | 801,630 | 801,630 | - | - |
Information Technology | 2,990,375 | 2,990,375 | - | - |
Materials | 51,550 | 51,550 | - | - |
Utilities | 79,961 | 79,961 | - | - |
| Money Market Funds | 86,351 | 86,351 | - | - |
| Total Investments in Securities: | 8,249,097 | 8,249,097 | - | - |
| Statement of Assets and Liabilities | ||||
| Amounts in thousands (except per-share amounts) | June 30, 2024 | |||
| Assets | ||||
| Investment in securities, at value (including securities loaned of $9,192) - See accompanying schedule: | ||||
Unaffiliated issuers (cost $3,559,657) | $ | 8,162,746 | ||
Fidelity Central Funds (cost $86,349) | 86,351 | |||
| Total Investment in Securities (cost $3,646,006) | $ | 8,249,097 | ||
| Cash | 3 | |||
| Receivable for fund shares sold | 1,586 | |||
| Dividends receivable | 1,433 | |||
| Distributions receivable from Fidelity Central Funds | 651 | |||
| Other receivables | 90 | |||
Total assets | 8,252,860 | |||
| Liabilities | ||||
| Payable for investments purchased | $ | 8,052 | ||
| Payable for fund shares redeemed | 1,665 | |||
| Accrued management fee | 2,854 | |||
| Other payables and accrued expenses | 162 | |||
| Collateral on securities loaned | 9,384 | |||
| Total liabilities | 22,117 | |||
| Net Assets | $ | 8,230,743 | ||
| Net Assets consist of: | ||||
| Paid in capital | $ | 3,628,969 | ||
| Total accumulated earnings (loss) | 4,601,774 | |||
| Net Assets | $ | 8,230,743 | ||
| Net Asset Value and Maximum Offering Price | ||||
| Fidelity Fund : | ||||
Net Asset Value, offering price and redemption price per share ($7,905,243 ÷ 87,294 shares) | $ | 90.56 | ||
| Class K : | ||||
Net Asset Value, offering price and redemption price per share ($325,500 ÷ 3,593 shares)(a) | $ | 90.60 | ||
(a)Corresponding Net Asset Value does not calculate due to rounding of fractional net assets and/or shares. | ||||
| Statement of Operations | ||||
| Amounts in thousands | Year ended June 30, 2024 | |||
| Investment Income | ||||
| Dividends | $ | 62,705 | ||
| Income from Fidelity Central Funds (including $14 from security lending) | 6,471 | |||
| Total income | 69,176 | |||
| Expenses | ||||
| Management fee | $ | 24,595 | ||
| Transfer agent fees | 5,328 | |||
| Accounting fees | 699 | |||
| Custodian fees and expenses | 50 | |||
| Independent trustees' fees and expenses | 34 | |||
| Registration fees | 93 | |||
| Audit | 88 | |||
| Legal | 22 | |||
| Miscellaneous | 84 | |||
| Total expenses before reductions | 30,993 | |||
| Expense reductions | (550) | |||
| Total expenses after reductions | 30,443 | |||
| Net Investment income (loss) | 38,733 | |||
| Realized and Unrealized Gain (Loss) | ||||
| Net realized gain (loss) on: | ||||
| Investment Securities: | ||||
| Unaffiliated issuers | 92,018 | |||
| Redemptions in-kind | 860,923 | |||
| Fidelity Central Funds | (1) | |||
| Foreign currency transactions | (4) | |||
| Futures contracts | (219) | |||
| Total net realized gain (loss) | 952,717 | |||
| Change in net unrealized appreciation (depreciation) on: | ||||
| Investment Securities: | ||||
| Unaffiliated issuers | 1,062,246 | |||
| Assets and liabilities in foreign currencies | (15) | |||
| Total change in net unrealized appreciation (depreciation) | 1,062,231 | |||
| Net gain (loss) | 2,014,948 | |||
| Net increase (decrease) in net assets resulting from operations | $ | 2,053,681 | ||
| Statement of Changes in Net Assets | ||||
| Amount in thousands | Year ended June 30, 2024 | Year ended June 30, 2023 | ||
| Increase (Decrease) in Net Assets | ||||
| Operations | ||||
| Net investment income (loss) | $ | 38,733 | $ | 42,099 |
| Net realized gain (loss) | 952,717 | 333,957 | ||
| Change in net unrealized appreciation (depreciation) | 1,062,231 | 800,751 | ||
| Net increase (decrease) in net assets resulting from operations | 2,053,681 | 1,176,807 | ||
| Distributions to shareholders | (162,281) | (38,569) | ||
| Share transactions - net increase (decrease) | (23,408) | (917,156) | ||
| Total increase (decrease) in net assets | 1,867,992 | 221,082 | ||
| Net Assets | ||||
| Beginning of period | 6,362,751 | 6,141,669 | ||
| End of period | $ | 8,230,743 | $ | 6,362,751 |
Fidelity® Fund |
| Years ended June 30, | 2024 | 2023 | 2022 | 2021 | 2020 | |||||
Selected Per-Share Data | ||||||||||
| Net asset value, beginning of period | $ | 69.85 | $ | 58.06 | $ | 72.20 | $ | 54.21 | $ | 47.60 |
| Income from Investment Operations | ||||||||||
Net investment income (loss) A,B | .42 | .44 | .25 | .28 | .39 | |||||
| Net realized and unrealized gain (loss) | 22.08 | 11.74 | (10.75) | 19.40 | 8.96 | |||||
| Total from investment operations | 22.50 | 12.18 | (10.50) | 19.68 | 9.35 | |||||
| Distributions from net investment income | (.49) | (.39) | (.21) | (.32) | (.42) | |||||
| Distributions from net realized gain | (1.31) | - | (3.44) | (1.38) | (2.32) | |||||
| Total distributions | (1.79) C | (.39) | (3.64) C | (1.69) C | (2.74) | |||||
| Net asset value, end of period | $ | 90.56 | $ | 69.85 | $ | 58.06 | $ | 72.20 | $ | 54.21 |
Total Return D | 32.89 % | 21.06% | (15.60)% | 36.94% | 20.51% | |||||
Ratios to Average Net Assets B,E,F | ||||||||||
| Expenses before reductions | .45% | .46% | .45% | .47% | .48% | |||||
| Expenses net of fee waivers, if any | .44 % | .46% | .45% | .47% | .48% | |||||
| Expenses net of all reductions | .44% | .46% | .45% | .46% | .48% | |||||
| Net investment income (loss) | .55% | .71% | .35% | .44% | .79% | |||||
| Supplemental Data | ||||||||||
| Net assets, end of period (in millions) | $ | 7,905 | $ | 6,125 | $ | 5,468 | $ | 6,758 | $ | 4,402 |
Portfolio turnover rate G | 25 % H | 43% H | 39% | 34% I | 51% |
Fidelity® Fund Class K |
| Years ended June 30, | 2024 | 2023 | 2022 | 2021 | 2020 | |||||
Selected Per-Share Data | ||||||||||
| Net asset value, beginning of period | $ | 69.88 | $ | 58.07 | $ | 72.21 | $ | 54.20 | $ | 47.60 |
| Income from Investment Operations | ||||||||||
Net investment income (loss) A,B | .48 | .50 | .30 | .33 | .43 | |||||
| Net realized and unrealized gain (loss) | 22.09 | 11.74 | (10.74) | 19.41 | 8.96 | |||||
| Total from investment operations | 22.57 | 12.24 | (10.44) | 19.74 | 9.39 | |||||
| Distributions from net investment income | (.55) | (.43) | (.26) | (.35) | (.46) | |||||
| Distributions from net realized gain | (1.31) | - | (3.44) | (1.38) | (2.32) | |||||
| Total distributions | (1.85) C | (.43) | (3.70) | (1.73) | (2.79) C | |||||
| Net asset value, end of period | $ | 90.60 | $ | 69.88 | $ | 58.07 | $ | 72.21 | $ | 54.20 |
Total Return D | 33.00 % | 21.18% | (15.54)% | 37.07% | 20.60% | |||||
Ratios to Average Net Assets B,E,F | ||||||||||
| Expenses before reductions | .37% | .38% | .38% | .39% | .40% | |||||
| Expenses net of fee waivers, if any | .36 % | .37% | .37% | .39% | .40% | |||||
| Expenses net of all reductions | .36% | .37% | .37% | .38% | .39% | |||||
| Net investment income (loss) | .63% | .79% | .43% | .52% | .87% | |||||
| Supplemental Data | ||||||||||
| Net assets, end of period (in millions) | $ | 326 | $ | 237 | $ | 674 | $ | 411 | $ | 522 |
Portfolio turnover rate G | 25 % H | 43% H | 39% | 34% I | 51% |
| Fidelity Central Fund | Investment Manager | Investment Objective | Investment Practices | Expense RatioA |
| Fidelity Money Market Central Funds | Fidelity Management & Research Company LLC (FMR) | Each fund seeks to obtain a high level of current income consistent with the preservation of capital and liquidity. | Short-term Investments | Less than .005% |
| Fidelity Fund | $30 |
| Gross unrealized appreciation | $4,642,107 |
| Gross unrealized depreciation | (40,333) |
| Net unrealized appreciation (depreciation) | $4,601,774 |
| Tax Cost | $3,647,323 |
| Undistributed ordinary income | $- |
| Net unrealized appreciation (depreciation) on securities and other investments | $4,601,774 |
| June 30, 2024 | June 30, 2023 | |
| Ordinary Income | $44,336 | $ 38,569 |
| Long-term Capital Gains | 117,945 | - |
| Total | $162,281 | $ 38,569 |
| Equity Risk | Equity risk relates to the fluctuations in the value of financial instruments as a result of changes in market prices (other than those arising from interest rate risk or foreign exchange risk), whether caused by factors specific to an individual investment, its issuer, or all factors affecting all instruments traded in a market or market segment. |
| Purchases ($) | Sales ($) | |
| Fidelity Fund | 2,965,530 | 1,723,878 |
| Shares | Total net realized gain or loss ($) | Total Proceeds ($) | |
| Fidelity Fund | 15,264 | 860,923 | 1,290,078 |
| Shares | Total net realized gain or loss ($) | Total Proceeds ($) | |
| Fidelity Fund | 1,769 | 115,227 | 121,521 |
| Maximum Management Fee Rate % | |
| Fidelity Fund | .42 |
| Class K | .34 |
| Total Management Fee Rate % | |
| Fidelity Fund | .42 |
| Class K | .34 |
| % of Class-Level Average Net Assets | |||
| Fidelity Fund | .1236 | ||
| Class K | .0420 | ||
| Amount ($) | % of Class-Level Average Net Assets | |
| Fidelity Fund | 5,258 | .12 |
| Class K | 70 | .04 |
5,328 |
| % of Average Net Assets | |
| Fidelity Fund | .0158 |
| % of Average Net Assets | |
| Fidelity Fund | .02 |
| Amount ($) | |
| Fidelity Fund | 9 |
| Purchases ($) | Sales ($) | Realized Gain (Loss)($) | |
| Fidelity Fund | 112,849 | 28,966 | 762 |
| Amount ($) | |
| Fidelity Fund | 12 |
| Total Security Lending Fees Paid to NFS ($) | Security Lending Income From Securities Loaned to NFS ($) | Value of Securities Loaned to NFS at Period End ($) | |
| Fidelity Fund | 2 | - | - |
Year ended June 30, 2024 | Year ended June 30, 2023 | |
| Fidelity Fund | ||
| Distributions to shareholders | ||
| Fidelity Fund | $155,989 | $35,624 |
| Class K | 6,292 | 2,945 |
Total | $162,281 | $38,569 |
| Shares | Shares | Dollars | Dollars | |
Year ended June 30, 2024 | Year ended June 30, 2023 | Year ended June 30, 2024 | Year ended June 30, 2023 | |
| Fidelity Fund | ||||
| Fidelity Fund | ||||
| Shares sold | 20,591 | 4,202 | $1,698,667 | $272,154 |
| Reinvestment of distributions | 1,951 | 522 | 140,752 | 32,237 |
| Shares redeemed | (22,942) | (11,210) | (1,878,184) | (706,252) |
| Net increase (decrease) | (400) | (6,486) | $(38,765) | $(401,861) |
| Class K | ||||
| Shares sold | 630 | 661 | $49,062 | $40,690 |
| Reinvestment of distributions | 87 | 47 | 6,292 | 2,945 |
| Shares redeemed | (520) | (8,917) | (39,997) | (558,930) |
| Net increase (decrease) | 197 | (8,209) | $15,357 | $(515,295) |
 |


Contents
| Common Stocks - 99.3% | |||
| Shares | Value ($) (000s) | ||
| COMMUNICATION SERVICES - 10.9% | |||
| Entertainment - 4.3% | |||
| Live Nation Entertainment, Inc. (a) | 172,700 | 16,189 | |
| Netflix, Inc. (a) | 168,661 | 113,826 | |
| Universal Music Group NV | 3,218,242 | 95,737 | |
| Warner Music Group Corp. Class A (b) | 1,005,174 | 30,809 | |
| 256,561 | |||
| Interactive Media & Services - 6.6% | |||
| Alphabet, Inc. Class A | 1,623,508 | 295,722 | |
| Epic Games, Inc. (a)(c)(d) | 2,244 | 1,346 | |
| Meta Platforms, Inc. Class A | 177,924 | 89,713 | |
| 386,781 | |||
TOTAL COMMUNICATION SERVICES | 643,342 | ||
| CONSUMER DISCRETIONARY - 9.1% | |||
| Automobile Components - 0.1% | |||
| Mobileye Global, Inc. Class A (a)(b) | 180,200 | 5,061 | |
| Automobiles - 0.3% | |||
| BYD Co. Ltd. (H Shares) | 609,108 | 18,090 | |
| Broadline Retail - 6.3% | |||
| Amazon.com, Inc. (a) | 1,513,478 | 292,480 | |
| MercadoLibre, Inc. (a) | 30,829 | 50,664 | |
| PDD Holdings, Inc. ADR (a) | 186,478 | 24,792 | |
| Savers Value Village, Inc. (b) | 427,882 | 5,237 | |
| 373,173 | |||
| Diversified Consumer Services - 0.1% | |||
| Duolingo, Inc. (a)(b) | 30,700 | 6,406 | |
| Hotels, Restaurants & Leisure - 1.9% | |||
| Airbnb, Inc. Class A (a) | 453,994 | 68,839 | |
| Domino's Pizza, Inc. | 64,105 | 33,099 | |
| Kura Sushi U.S.A., Inc. Class A (a)(b) | 64,019 | 4,039 | |
| Trip.com Group Ltd. ADR (a) | 99,000 | 4,653 | |
| 110,630 | |||
| Household Durables - 0.1% | |||
| Blu Investments LLC (a)(c)(d) | 3,320,224 | 1 | |
| TopBuild Corp. (a) | 6,900 | 2,658 | |
| 2,659 | |||
| Textiles, Apparel & Luxury Goods - 0.3% | |||
| LVMH Moet Hennessy Louis Vuitton SE | 25,844 | 19,843 | |
TOTAL CONSUMER DISCRETIONARY | 535,862 | ||
| CONSUMER STAPLES - 0.7% | |||
| Beverages - 0.6% | |||
| Monster Beverage Corp. (a) | 703,559 | 35,143 | |
| Personal Care Products - 0.1% | |||
| Puig Brands SA Class B | 97,400 | 2,723 | |
TOTAL CONSUMER STAPLES | 37,866 | ||
| ENERGY - 2.5% | |||
| Oil, Gas & Consumable Fuels - 2.5% | |||
| Canadian Natural Resources Ltd. | 268,600 | 9,562 | |
| Cheniere Energy, Inc. | 286,829 | 50,146 | |
| Range Resources Corp. | 811,111 | 27,197 | |
| Reliance Industries Ltd. | 1,521,443 | 57,141 | |
| 144,046 | |||
| FINANCIALS - 5.6% | |||
| Capital Markets - 0.2% | |||
| LPL Financial | 20,900 | 5,837 | |
| Morgan Stanley | 27,500 | 2,673 | |
| MSCI, Inc. | 5,000 | 2,409 | |
| 10,919 | |||
| Consumer Finance - 0.4% | |||
| Capital One Financial Corp. | 179,400 | 24,838 | |
| Financial Services - 4.1% | |||
| Corebridge Financial, Inc. (b) | 453,241 | 13,198 | |
| Fiserv, Inc. (a) | 71,633 | 10,676 | |
| Global Payments, Inc. | 264,730 | 25,599 | |
| MasterCard, Inc. Class A | 210,432 | 92,834 | |
| Rocket Companies, Inc. (a)(b) | 715,818 | 9,807 | |
| Visa, Inc. Class A | 330,031 | 86,623 | |
| 238,737 | |||
| Insurance - 0.9% | |||
| Arthur J. Gallagher & Co. | 160,907 | 41,725 | |
| The Baldwin Insurance Group, Inc. Class A, (a) | 375,422 | 13,316 | |
| 55,041 | |||
TOTAL FINANCIALS | 329,535 | ||
| HEALTH CARE - 14.8% | |||
| Biotechnology - 4.1% | |||
| Adamas Pharmaceuticals, Inc.: | |||
| rights (a)(d) | 678,800 | 115 | |
| rights (a)(d) | 678,800 | 48 | |
| Alnylam Pharmaceuticals, Inc. (a) | 218,990 | 53,215 | |
| Arcellx, Inc. (a) | 39,869 | 2,200 | |
| Arrowhead Pharmaceuticals, Inc. (a) | 136,275 | 3,542 | |
| Beam Therapeutics, Inc. (a) | 39,204 | 919 | |
| BioNTech SE ADR (a) | 86,900 | 6,983 | |
| Blueprint Medicines Corp. (a) | 26,237 | 2,828 | |
| Cytokinetics, Inc. (a) | 122,589 | 6,642 | |
| Exact Sciences Corp. (a) | 757,500 | 32,004 | |
| Galapagos NV sponsored ADR (a) | 252,681 | 6,261 | |
| Gamida Cell Ltd. (b)(d) | 993,684 | 0 | |
| Gamida Cell Ltd. warrants 4/21/28 (a)(d) | 182,600 | 0 | |
| Hookipa Pharma, Inc. (a) | 453,587 | 268 | |
| Immunocore Holdings PLC ADR (a) | 95,155 | 3,225 | |
| Insmed, Inc. (a)(b) | 585,436 | 39,224 | |
| Janux Therapeutics, Inc. (a) | 11,800 | 494 | |
| Krystal Biotech, Inc. (a) | 17,258 | 3,169 | |
| Legend Biotech Corp. ADR (a) | 121,690 | 5,390 | |
| Moderna, Inc. (a) | 57,200 | 6,793 | |
| Regeneron Pharmaceuticals, Inc. (a) | 54,425 | 57,202 | |
| Repligen Corp. (a) | 22,182 | 2,796 | |
| Sarepta Therapeutics, Inc. (a) | 31,024 | 4,902 | |
| Seres Therapeutics, Inc. (a) | 160,606 | 116 | |
| Synlogic, Inc. (a) | 29,441 | 44 | |
| Vor Biopharma, Inc. (a)(b) | 246,291 | 246 | |
| XOMA Corp. (a) | 169,285 | 4,010 | |
| 242,636 | |||
| Health Care Equipment & Supplies - 3.7% | |||
| Align Technology, Inc. (a) | 96,300 | 23,250 | |
| Boston Scientific Corp. (a) | 1,914,700 | 147,451 | |
| Glaukos Corp. (a) | 120,218 | 14,228 | |
| Hologic, Inc. (a) | 219,300 | 16,283 | |
| Lantheus Holdings, Inc. (a) | 51,573 | 4,141 | |
| Penumbra, Inc. (a) | 39,536 | 7,115 | |
| Pulmonx Corp. (a) | 102,449 | 650 | |
| RxSight, Inc. (a) | 27,931 | 1,681 | |
| 214,799 | |||
| Health Care Providers & Services - 0.9% | |||
| HealthEquity, Inc. (a) | 613,714 | 52,902 | |
| Life Sciences Tools & Services - 2.4% | |||
| Bio-Techne Corp. | 139,177 | 9,972 | |
| Bruker Corp. | 587,920 | 37,515 | |
| Chemometec A/S | 69,230 | 3,028 | |
| Codexis, Inc. (a) | 582,572 | 1,806 | |
| Danaher Corp. | 177,798 | 44,423 | |
| MaxCyte, Inc. (a)(b) | 669,259 | 2,623 | |
| Sartorius Stedim Biotech | 36,442 | 5,983 | |
| Thermo Fisher Scientific, Inc. | 67,852 | 37,522 | |
| 142,872 | |||
| Pharmaceuticals - 3.7% | |||
| Aclaris Therapeutics, Inc. (a) | 89,145 | 98 | |
| Chugai Pharmaceutical Co. Ltd. | 327,641 | 11,667 | |
| Eli Lilly & Co. | 184,586 | 167,120 | |
| Teva Pharmaceutical Industries Ltd. sponsored ADR (a) | 2,017,300 | 32,781 | |
| UCB SA | 41,286 | 6,133 | |
| 217,799 | |||
TOTAL HEALTH CARE | 871,008 | ||
| INDUSTRIALS - 12.2% | |||
| Aerospace & Defense - 1.4% | |||
| General Electric Co. | 517,743 | 82,306 | |
| Loar Holdings, Inc. (b) | 5,300 | 283 | |
| 82,589 | |||
| Commercial Services & Supplies - 0.0% | |||
| Montrose Environmental Group, Inc. (a)(b) | 45,700 | 2,036 | |
| Electrical Equipment - 2.0% | |||
| Eaton Corp. PLC | 207,818 | 65,161 | |
| GE Vernova LLC | 224,685 | 38,536 | |
| HD Hyundai Electric Co. Ltd. | 56,130 | 12,609 | |
| 116,306 | |||
| Ground Transportation - 4.0% | |||
| Uber Technologies, Inc. (a) | 3,276,369 | 238,126 | |
| Machinery - 1.4% | |||
| Chart Industries, Inc. (a) | 40,300 | 5,817 | |
| Energy Recovery, Inc. (a) | 157,613 | 2,095 | |
| Ingersoll Rand, Inc. | 631,054 | 57,325 | |
| Westinghouse Air Brake Tech Co. | 111,829 | 17,675 | |
| 82,912 | |||
| Professional Services - 2.6% | |||
| Equifax, Inc. | 287,149 | 69,622 | |
| KBR, Inc. | 644,858 | 41,361 | |
| RELX PLC sponsored ADR | 555,300 | 25,477 | |
| UL Solutions, Inc. Class A | 360,300 | 15,201 | |
| 151,661 | |||
| Trading Companies & Distributors - 0.8% | |||
| Ferguson PLC | 238,988 | 46,026 | |
TOTAL INDUSTRIALS | 719,656 | ||
| INFORMATION TECHNOLOGY - 43.3% | |||
| Electronic Equipment, Instruments & Components - 1.2% | |||
| Coherent Corp. (a) | 85,100 | 6,166 | |
| Fabrinet (a) | 23,800 | 5,826 | |
| Flex Ltd. (a) | 1,047,232 | 30,883 | |
| Jabil, Inc. | 246,423 | 26,808 | |
| 69,683 | |||
| IT Services - 1.6% | |||
| Gartner, Inc. (a) | 47,547 | 21,351 | |
| MongoDB, Inc. Class A (a) | 288,223 | 72,044 | |
| 93,395 | |||
| Semiconductors & Semiconductor Equipment - 12.7% | |||
| Allegro MicroSystems LLC (a) | 834,796 | 23,575 | |
| ASML Holding NV (depository receipt) | 84,281 | 86,197 | |
| Astera Labs, Inc. | 9,700 | 587 | |
| BE Semiconductor Industries NV | 236,826 | 39,604 | |
| eMemory Technology, Inc. | 18,757 | 1,483 | |
| Marvell Technology, Inc. | 137,662 | 9,623 | |
| Micron Technology, Inc. | 285,936 | 37,609 | |
| NVIDIA Corp. | 2,246,430 | 277,524 | |
| NXP Semiconductors NV | 150,582 | 40,520 | |
| Qualcomm, Inc. | 194,400 | 38,721 | |
| SiTime Corp. (a)(b) | 223,270 | 27,770 | |
| Taiwan Semiconductor Manufacturing Co. Ltd. sponsored ADR | 775,424 | 134,776 | |
| Universal Display Corp. | 155,528 | 32,700 | |
| 750,689 | |||
| Software - 15.5% | |||
| ASAPP, Inc. warrants 8/28/28 (a)(c)(d) | 1,014,955 | 1,441 | |
| Autodesk, Inc. (a) | 24,800 | 6,137 | |
| HubSpot, Inc. (a) | 90,312 | 53,265 | |
| Manhattan Associates, Inc. (a) | 147,106 | 36,288 | |
| Microsoft Corp. | 1,705,480 | 762,267 | |
| NICE Ltd. sponsored ADR (a) | 122,362 | 21,043 | |
| ServiceNow, Inc. (a) | 41,612 | 32,735 | |
| Volue A/S (a) | 724,170 | 2,031 | |
| 915,207 | |||
| Technology Hardware, Storage & Peripherals - 12.3% | |||
| Apple, Inc. | 3,425,618 | 721,504 | |
TOTAL INFORMATION TECHNOLOGY | 2,550,478 | ||
| MATERIALS - 0.2% | |||
| Chemicals - 0.1% | |||
| Aspen Aerogels, Inc. (a) | 277,429 | 6,617 | |
| Containers & Packaging - 0.1% | |||
| International Paper Co. | 126,700 | 5,467 | |
TOTAL MATERIALS | 12,084 | ||
| TOTAL COMMON STOCKS (Cost $3,709,329) | 5,843,877 | ||
| Convertible Preferred Stocks - 0.1% | |||
| Shares | Value ($) (000s) | ||
| CONSUMER DISCRETIONARY - 0.0% | |||
| Textiles, Apparel & Luxury Goods - 0.0% | |||
| Canva, Inc.: | |||
| Series A (c)(d) | 423 | 451 | |
| Series A2 (c)(d) | 77 | 82 | |
| 533 | |||
| FINANCIALS - 0.0% | |||
| Financial Services - 0.0% | |||
| Akeana Series C (c)(d) | 30,000 | 394 | |
| HEALTH CARE - 0.0% | |||
| Biotechnology - 0.0% | |||
| ElevateBio LLC Series C (a)(c)(d) | 75,700 | 232 | |
| INFORMATION TECHNOLOGY - 0.1% | |||
| Software - 0.1% | |||
| ASAPP, Inc.: | |||
| Series C (a)(c)(d) | 250,763 | 514 | |
| Series D (c)(d) | 1,768,998 | 3,149 | |
| 3,663 | |||
| MATERIALS - 0.0% | |||
| Metals & Mining - 0.0% | |||
| Illuminated Holdings, Inc.: | |||
| Series C2 (a)(c)(d) | 50,974 | 819 | |
| Series C3 (a)(c)(d) | 63,718 | 1,023 | |
| Series C4 (a)(c)(d) | 18,303 | 294 | |
| Series C5 (a)(c)(d) | 36,887 | 592 | |
| 2,728 | |||
| TOTAL CONVERTIBLE PREFERRED STOCKS (Cost $15,158) | 7,550 | ||
| Convertible Bonds - 0.0% | |||
Principal Amount (e) (000s) | Value ($) (000s) | ||
| MATERIALS - 0.0% | |||
| Metals & Mining - 0.0% | |||
Illuminated Holdings, Inc. 15% (c)(d)(f) (Cost $810) | 810 | 803 | |
| Preferred Securities - 0.0% | |||
Principal Amount (e) (000s) | Value ($) (000s) | ||
| MATERIALS - 0.0% | |||
| Metals & Mining - 0.0% | |||
Illuminated Holdings, Inc. 15% 6/14/28 (c)(d) (Cost $1,099) | 1,099 | 1,159 | |
| Money Market Funds - 1.6% | |||
| Shares | Value ($) (000s) | ||
| Fidelity Cash Central Fund 5.38% (g) | 40,411,455 | 40,420 | |
| Fidelity Securities Lending Cash Central Fund 5.38% (g)(h) | 54,945,586 | 54,951 | |
| TOTAL MONEY MARKET FUNDS (Cost $95,371) | 95,371 | ||
| TOTAL INVESTMENT IN SECURITIES - 101.0% (Cost $3,821,767) | 5,948,760 |
NET OTHER ASSETS (LIABILITIES) - (1.0)% | (59,700) |
| NET ASSETS - 100.0% | 5,889,060 |
| (a) | Non-income producing |
| (b) | Security or a portion of the security is on loan at period end. |
| (c) | Restricted securities (including private placements) - Investment in securities not registered under the Securities Act of 1933 (excluding 144A issues). At the end of the period, the value of restricted securities (excluding 144A issues) amounted to $12,300,000 or 0.2% of net assets. |
| (d) | Level 3 security |
| (e) | Amount is stated in United States dollars unless otherwise noted. |
| (f) | Security is perpetual in nature with no stated maturity date. |
| (g) | Affiliated fund that is generally available only to investment companies and other accounts managed by Fidelity Investments. The rate quoted is the annualized seven-day yield of the fund at period end. A complete unaudited listing of the fund's holdings as of its most recent quarter end is available upon request. In addition, each Fidelity Central Fund's financial statements, which are not covered by the Fund's Report of Independent Registered Public Accounting Firm, are available on the SEC's website or upon request. |
| (h) | Investment made with cash collateral received from securities on loan. |
| Additional information on each restricted holding is as follows: | ||
| Security | Acquisition Date | Acquisition Cost ($) (000s) |
| Akeana Series C | 1/23/24 | 383 |
| ASAPP, Inc. warrants 8/28/28 | 8/29/23 | 0 |
| ASAPP, Inc. Series C | 4/30/21 | 1,654 |
| ASAPP, Inc. Series D | 8/29/23 | 6,831 |
| Blu Investments LLC | 5/21/20 | 6 |
| Canva, Inc. Series A | 9/22/23 | 451 |
| Canva, Inc. Series A2 | 9/22/23 | 82 |
| ElevateBio LLC Series C | 3/09/21 | 318 |
| Epic Games, Inc. | 3/29/21 | 1,986 |
| Illuminated Holdings, Inc. Series C2 | 7/07/20 | 1,274 |
| Illuminated Holdings, Inc. Series C3 | 7/07/20 | 1,912 |
| Illuminated Holdings, Inc. Series C4 | 1/08/21 | 659 |
| Illuminated Holdings, Inc. Series C5 | 6/16/21 | 1,594 |
| Illuminated Holdings, Inc. 15% | 6/14/23 | 810 |
| Illuminated Holdings, Inc. 15% 6/14/28 | 9/27/23 | 1,099 |
| Affiliate (Amounts in thousands) | Value, beginning of period ($) | Purchases ($) | Sales Proceeds ($) | Dividend Income ($) | Realized Gain (loss) ($) | Change in Unrealized appreciation (depreciation) ($) | Value, end of period ($) | % ownership, end of period |
| Fidelity Cash Central Fund 5.38% | 44,138 | 1,252,423 | 1,256,141 | 3,148 | - | - | 40,420 | 0.1% |
| Fidelity Securities Lending Cash Central Fund 5.38% | 22,191 | 529,499 | 496,739 | 179 | - | - | 54,951 | 0.2% |
| Total | 66,329 | 1,781,922 | 1,752,880 | 3,327 | - | - | 95,371 | |
| Valuation Inputs at Reporting Date: | ||||
Description (Amounts in thousands) | Total ($) | Level 1 ($) | Level 2 ($) | Level 3 ($) |
Investments in Securities: | ||||
| Equities: | ||||
Communication Services | 643,342 | 546,259 | 95,737 | 1,346 |
Consumer Discretionary | 536,395 | 497,928 | 37,933 | 534 |
Consumer Staples | 37,866 | 37,866 | - | - |
Energy | 144,046 | 144,046 | - | - |
Financials | 329,929 | 329,535 | - | 394 |
Health Care | 871,240 | 859,178 | 11,667 | 395 |
Industrials | 719,656 | 719,656 | - | - |
Information Technology | 2,554,141 | 2,549,037 | - | 5,104 |
Materials | 14,812 | 12,084 | - | 2,728 |
| Corporate Bonds | 803 | - | - | 803 |
| Preferred Securities | 1,159 | - | - | 1,159 |
| Money Market Funds | 95,371 | 95,371 | - | - |
| Total Investments in Securities: | 5,948,760 | 5,790,960 | 145,337 | 12,463 |
| Statement of Assets and Liabilities | ||||
| Amounts in thousands (except per-share amounts) | June 30, 2024 | |||
| Assets | ||||
| Investment in securities, at value (including securities loaned of $52,329) - See accompanying schedule: | ||||
Unaffiliated issuers (cost $3,726,396) | $ | 5,853,389 | ||
Fidelity Central Funds (cost $95,371) | 95,371 | |||
| Total Investment in Securities (cost $3,821,767) | $ | 5,948,760 | ||
| Foreign currency held at value (cost $62) | 62 | |||
| Receivable for investments sold | 6,819 | |||
| Receivable for fund shares sold | 4,558 | |||
| Dividends receivable | 1,253 | |||
| Interest receivable | 52 | |||
| Distributions receivable from Fidelity Central Funds | 389 | |||
| Other receivables | 60 | |||
Total assets | 5,961,953 | |||
| Liabilities | ||||
| Payable for investments purchased | $ | 8,388 | ||
| Payable for fund shares redeemed | 3,281 | |||
| Accrued management fee | 3,142 | |||
| Other payables and accrued expenses | 3,137 | |||
| Collateral on securities loaned | 54,945 | |||
| Total liabilities | 72,893 | |||
| Net Assets | $ | 5,889,060 | ||
| Net Assets consist of: | ||||
| Paid in capital | $ | 3,260,330 | ||
| Total accumulated earnings (loss) | 2,628,730 | |||
| Net Assets | $ | 5,889,060 | ||
| Net Asset Value and Maximum Offering Price | ||||
| Growth Discovery : | ||||
Net Asset Value, offering price and redemption price per share ($5,286,394 ÷ 79,701 shares) | $ | 66.33 | ||
| Class K : | ||||
Net Asset Value, offering price and redemption price per share ($602,666 ÷ 9,066 shares)(a) | $ | 66.47 | ||
(a)Corresponding Net Asset Value does not calculate due to rounding of fractional net assets and/or shares. | ||||
| Statement of Operations | ||||
| Amounts in thousands | Year ended June 30, 2024 | |||
| Investment Income | ||||
| Dividends | $ | 23,248 | ||
| Interest | 53 | |||
| Income from Fidelity Central Funds (including $179 from security lending) | 3,327 | |||
| Total income | 26,628 | |||
| Expenses | ||||
| Management fee | ||||
| Basic fee | $ | 24,874 | ||
| Performance adjustment | 582 | |||
| Transfer agent fees | 3,423 | |||
| Accounting fees | 659 | |||
| Custodian fees and expenses | 84 | |||
| Independent trustees' fees and expenses | 20 | |||
| Registration fees | 213 | |||
| Audit | 73 | |||
| Legal | 10 | |||
| Miscellaneous | 66 | |||
| Total expenses before reductions | 30,004 | |||
| Expense reductions | (329) | |||
| Total expenses after reductions | 29,675 | |||
| Net Investment income (loss) | (3,047) | |||
| Realized and Unrealized Gain (Loss) | ||||
| Net realized gain (loss) on: | ||||
| Investment Securities: | ||||
| Unaffiliated issuers (net of foreign taxes of $868) | 529,185 | |||
| Redemptions in-kind | 7,417 | |||
| Foreign currency transactions | 83 | |||
| Total net realized gain (loss) | 536,685 | |||
| Change in net unrealized appreciation (depreciation) on: | ||||
| Investment Securities: | ||||
| Unaffiliated issuers (net of increase in deferred foreign taxes of $686) | 898,810 | |||
| Assets and liabilities in foreign currencies | 4 | |||
| Total change in net unrealized appreciation (depreciation) | 898,814 | |||
| Net gain (loss) | 1,435,499 | |||
| Net increase (decrease) in net assets resulting from operations | $ | 1,432,452 | ||
| Statement of Changes in Net Assets | ||||
| Amount in thousands | Year ended June 30, 2024 | Year ended June 30, 2023 | ||
| Increase (Decrease) in Net Assets | ||||
| Operations | ||||
| Net investment income (loss) | $ | (3,047) | $ | 12,023 |
| Net realized gain (loss) | 536,685 | 92,946 | ||
| Change in net unrealized appreciation (depreciation) | 898,814 | 498,363 | ||
| Net increase (decrease) in net assets resulting from operations | 1,432,452 | 603,332 | ||
| Distributions to shareholders | (95,883) | (98,036) | ||
| Share transactions - net increase (decrease) | 1,099,133 | 179,647 | ||
| Total increase (decrease) in net assets | 2,435,702 | 684,943 | ||
| Net Assets | ||||
| Beginning of period | 3,453,358 | 2,768,415 | ||
| End of period | $ | 5,889,060 | $ | 3,453,358 |
Fidelity® Growth Discovery Fund |
| Years ended June 30, | 2024 | 2023 | 2022 | 2021 | 2020 | |||||
Selected Per-Share Data | ||||||||||
| Net asset value, beginning of period | $ | 50.18 | $ | 42.65 | $ | 58.70 | $ | 45.22 | $ | 37.74 |
| Income from Investment Operations | ||||||||||
Net investment income (loss) A,B | (.04) | .18 | (.07) | (.07) | .03 | |||||
| Net realized and unrealized gain (loss) | 17.56 | 8.84 | (8.48) | 18.53 | 9.15 | |||||
| Total from investment operations | 17.52 | 9.02 | (8.55) | 18.46 | 9.18 | |||||
| Distributions from net investment income | (.03) | (.01) | (.13) | (.01) | (.02) | |||||
| Distributions from net realized gain | (1.35) | (1.48) | (7.37) | (4.98) | (1.68) | |||||
| Total distributions | (1.37) C | (1.49) | (7.50) | (4.98) C | (1.70) | |||||
| Net asset value, end of period | $ | 66.33 | $ | 50.18 | $ | 42.65 | $ | 58.70 | $ | 45.22 |
Total Return D | 35.89 % | 21.46% | (17.10)% | 43.10% | 25.33% | |||||
Ratios to Average Net Assets B,E,F | ||||||||||
| Expenses before reductions | .69% | .83% | .77% | .79% | .79% | |||||
| Expenses net of fee waivers, if any | .69 % | .83% | .77% | .79% | .79% | |||||
| Expenses net of all reductions | .69% | .83% | .77% | .78% | .78% | |||||
| Net investment income (loss) | (.08)% | .40% | (.14)% | (.12)% | .06% | |||||
| Supplemental Data | ||||||||||
| Net assets, end of period (in millions) | $ | 5,286 | $ | 3,073 | $ | 2,339 | $ | 2,944 | $ | 2,094 |
Portfolio turnover rate G | 41 % H | 53% | 45% | 51% | 54% |
Fidelity® Growth Discovery Fund Class K |
| Years ended June 30, | 2024 | 2023 | 2022 | 2021 | 2020 | |||||
Selected Per-Share Data | ||||||||||
| Net asset value, beginning of period | $ | 50.29 | $ | 42.71 | $ | 58.78 | $ | 45.27 | $ | 37.78 |
| Income from Investment Operations | ||||||||||
Net investment income (loss) A,B | .01 | .22 | (.02) | (.02) | .06 | |||||
| Net realized and unrealized gain (loss) | 17.59 | 8.87 | (8.50) | 18.56 | 9.17 | |||||
| Total from investment operations | 17.60 | 9.09 | (8.52) | 18.54 | 9.23 | |||||
| Distributions from net investment income | (.08) | (.03) | (.16) | (.03) | (.06) | |||||
| Distributions from net realized gain | (1.35) | (1.48) | (7.40) | (5.00) | (1.68) | |||||
| Total distributions | (1.42) C | (1.51) | (7.55) C | (5.03) | (1.74) | |||||
| Net asset value, end of period | $ | 66.47 | $ | 50.29 | $ | 42.71 | $ | 58.78 | $ | 45.27 |
Total Return D | 36.00 % | 21.61% | (17.04)% | 43.25% | 25.46% | |||||
Ratios to Average Net Assets B,E,F | ||||||||||
| Expenses before reductions | .59% | .73% | .68% | .69% | .69% | |||||
| Expenses net of fee waivers, if any | .59 % | .72% | .68% | .69% | .69% | |||||
| Expenses net of all reductions | .59% | .72% | .68% | .69% | .68% | |||||
| Net investment income (loss) | .02% | .50% | (.05)% | (.03)% | .17% | |||||
| Supplemental Data | ||||||||||
| Net assets, end of period (in millions) | $ | 603 | $ | 380 | $ | 430 | $ | 430 | $ | 316 |
Portfolio turnover rate G | 41 % H | 53% | 45% | 51% | 54% |
| Fidelity Central Fund | Investment Manager | Investment Objective | Investment Practices | Expense RatioA |
| Fidelity Money Market Central Funds | Fidelity Management & Research Company LLC (FMR) | Each fund seeks to obtain a high level of current income consistent with the preservation of capital and liquidity. | Short-term Investments | Less than .005% |
| Gross unrealized appreciation | $2,254,235 |
| Gross unrealized depreciation | (130,420) |
| Net unrealized appreciation (depreciation) | $2,123,815 |
| Tax Cost | $3,824,945 |
| Undistributed ordinary income | $5,049 |
| Undistributed long-term capital gain | $505,666 |
| Net unrealized appreciation (depreciation) on securities and other investments | $2,123,797 |
| June 30, 2024 | June 30, 2023 | |
| Ordinary Income | $2,458 | $ 797 |
| Long-term Capital Gains | 93,425 | 97,239 |
| Total | $95,883 | $ 98,036 |
| Purchases ($) | Sales ($) | |
| Fidelity Growth Discovery Fund | 2,826,656 | 1,781,212 |
| Shares | Total net realized gain or loss ($) | Total Proceeds ($) | |
| Fidelity Growth Discovery Fund | 204 | 7,417 | 12,238 |
| Maximum Management Fee Rate % | |
| Growth Discovery | .66 |
| Class K | .56 |
| Total Management Fee Rate % | |
| Growth Discovery | .63 |
| Class K | .55 |
| Performance Adjustment Index | |
| Fidelity Growth Discovery Fund | Russell 3000 Growth Index |
| % of Class-Level Average Net Assets | |||
| Growth Discovery | .1411 | ||
| Class K | .0420 | ||
| Amount ($) | % of Class-Level Average Net Assets | |
| Growth Discovery | 3,307 | .14 |
| Class K | 116 | .04 |
3,423 |
| % of Average Net Assets | |
| Fidelity Growth Discovery Fund | .0255 |
| % of Average Net Assets | |
| Fidelity Growth Discovery Fund | .03 |
| Amount ($) | |
| Fidelity Growth Discovery Fund | 15 |
| Purchases ($) | Sales ($) | Realized Gain (Loss)($) | |
| Fidelity Growth Discovery Fund | 173,702 | 50,223 | (1,059) |
| Amount ($) | |
| Fidelity Growth Discovery Fund | 7 |
| Total Security Lending Fees Paid to NFS ($) | Security Lending Income From Securities Loaned to NFS ($) | Value of Securities Loaned to NFS at Period End ($) | |
| Fidelity Growth Discovery Fund | 19 | 2 | 6,422 |
Year ended June 30, 2024 | Year ended June 30, 2023 | |
| Fidelity Growth Discovery Fund | ||
| Distributions to shareholders | ||
| Growth Discovery | $85,127 | $82,690 |
| Class K | 10,756 | 15,346 |
Total | $95,883 | $98,036 |
| Shares | Shares | Dollars | Dollars | |
Year ended June 30, 2024 | Year ended June 30, 2023 | Year ended June 30, 2024 | Year ended June 30, 2023 | |
| Fidelity Growth Discovery Fund | ||||
| Growth Discovery | ||||
| Shares sold | 28,394 | 14,335 | $1,581,709 | $631,744 |
| Reinvestment of distributions | 1,573 | 1,665 | 77,139 | 76,651 |
| Shares redeemed | (11,501) | (9,599) | (644,722) | (418,829) |
| Net increase (decrease) | 18,466 | 6,401 | $1,014,126 | $289,566 |
| Class K | ||||
| Shares sold | 2,808 | 4,349 | $158,825 | $188,046 |
| Reinvestment of distributions | 219 | 333 | 10,756 | 15,346 |
| Shares redeemed | (1,524) | (7,182) | (84,574) | (313,311) |
| Net increase (decrease) | 1,503 | (2,500) | $85,007 | $(109,919) |
| A special meeting of shareholders was held on April 19, 2023. The results of votes taken among shareholders on the proposal before them are reported below. Each vote reported represents one dollar of net asset value held on the record date for the meeting. | ||
| Proposal 1 | ||
| To reclassify the diversification status of the fund from diversified to non-diversified by eliminating the following fundamental policy: The fund may not with respect to 75% of fund's total assets, purchase the securities of any issuer (other than securities issued or guaranteed by the U.S. Government or any of its agencies or instrumentalities, or securities of other investment companies) if, as a result, (a) more than 5% of fund's total assets would be invested in the securities of that issuer, or (b) the fund would hold more than 10% of outstanding voting securities of that issuer. | ||
# of Votes | % of Votes | |
| Affirmative | 1,305,869,193.16 | 86.14 |
| Against | 155,973,443.79 | 10.29 |
| Abstain | 54,199,503.65 | 3.58 |
| TOTAL | 1,516,042,140.60 | 100.00 |
 |
Item 8.
Changes in and Disagreements with Accountants for Open-End Management Investment Companies
See Item 7.
Item 9.
Proxy Disclosures for Open-End Management Investment Companies
See Item 7.
Item 10.
Remuneration Paid to Directors, Officers, and Others of Open-End Management Investment Companies
See Item 7.
Item 11.
Statement Regarding Basis for Approval of Investment Advisory Contract
See Item 7.
Item 12.
Disclosure of Proxy Voting Policies and Procedures for Closed-End Management Investment Companies
Not applicable.
Item 13.
Portfolio Managers of Closed-End Management Investment Companies
Not applicable.
Item 14.
Purchase of Equity Securities by Closed-End Management Investment Company and Affiliated Purchasers
Not applicable.
Item 15.
Submission of Matters to a Vote of Security Holders
There were no material changes to the procedures by which shareholders may recommend nominees to the trust’s Board of Trustees.
Item 16.
Controls and Procedures
(a)(i) The President and Treasurer and the Chief Financial Officer have concluded that the trust’s disclosure controls and procedures (as defined in Rule 30a-3(c) under the Investment Company Act) provide reasonable assurances that material information relating to the trust is made known to them by the appropriate persons, based on their evaluation of these controls and procedures as of a date within 90 days of the filing date of this report.
(a)(ii) There was no change in the trust’s internal control over financial reporting (as defined in Rule 30a-3(d) under the Investment Company Act) that occurred during the period covered by this report that has materially affected, or is reasonably likely to materially affect, the trust’s internal control over financial reporting.
Item 17.
Disclosure of Securities Lending Activities for Closed-End Management Investment Companies
Not applicable.
Item 18.
Recovery of Erroneously Awarded Compensation
(a)
Not applicable.
(b)
Not applicable.
Item 19.
Exhibits
(a) | (1) | Code of Ethics pursuant to Item 2 of Form N-CSR is filed and attached hereto as EX-99.CODE ETH. |
(a) | (2) | |
(a) | (3) | Not applicable. |
(b) |
SIGNATURES
Pursuant to the requirements of the Securities Exchange Act of 1934 and the Investment Company Act of 1940, the registrant has duly caused this report to be signed on its behalf by the undersigned, thereunto duly authorized.
Fidelity Hastings Street Trust
By: | /s/Stacie M. Smith |
Stacie M. Smith | |
President and Treasurer (Principal Executive Officer) | |
Date: | August 22, 2024 |
Pursuant to the requirements of the Securities Exchange Act of 1934 and the Investment Company Act of 1940, this report has been signed below by the following persons on behalf of the registrant and in the capacities and on the dates indicated.
By: | /s/Stacie M. Smith |
Stacie M. Smith | |
President and Treasurer (Principal Executive Officer) | |
Date: | August 22, 2024 |
By: | /s/John J. Burke III |
John J. Burke III | |
Chief Financial Officer (Principal Financial Officer) | |
Date: | August 22, 2024 |