UNITED STATES
SECURITIES AND EXCHANGE COMMISSION
Washington, D.C. 20549
FORM N-CSR
CERTIFIED SHAREHOLDER REPORT OF REGISTERED
MANAGEMENT INVESTMENT COMPANIES
Investment Company Act file number 811-00215
Fidelity Hastings Street Trust
(Exact name of registrant as specified in charter)
245 Summer St., Boston, Massachusetts 02210
(Address of principal executive offices) (Zip code)
Margaret Carey, Secretary
245 Summer St.
Boston, Massachusetts 02210
(Name and address of agent for service)
Registrant's telephone number, including area code:
617-563-7000
| |
Date of fiscal year end: | December 31 |
|
|
Date of reporting period: | December 31, 2023 |
Item 1.
Reports to Stockholders
Fidelity® Series Emerging Markets Debt Fund
Fidelity® Series Emerging Markets Debt Local Currency Fund
Annual Report
December 31, 2023
Contents
To view a fund's proxy voting guidelines and proxy voting record for the 12-month period ended June 30, visit http://www.fidelity.com/proxyvotingresults or visit the Securities and Exchange Commission's (SEC) web site at http://www.sec.gov.
You may also call 1-800-544-8544 to request a free copy of the proxy voting guidelines.
Standard & Poor's, S&P and S&P 500 are registered service marks of The McGraw-Hill Companies, Inc. and have been licensed for use by Fidelity Distributors Corporation.
Other third-party marks appearing herein are the property of their respective owners.
All other marks appearing herein are registered or unregistered trademarks or service marks of FMR LLC or an affiliated company. © 2024 FMR LLC. All rights reserved.
This report and the financial statements contained herein are submitted for the general information of the shareholders of the Funds. This report is not authorized for distribution to prospective investors in the Funds unless preceded or accompanied by an effective prospectus.
A fund files its complete schedule of portfolio holdings with the SEC for the first and third quarters of each fiscal year on Form N-PORT. Forms N-PORT are available on the SEC's web site at http://www.sec.gov. A fund's Forms N-PORT may be reviewed and copied at the SEC's Public Reference Room in Washington, DC. Information regarding the operation of the SEC's Public Reference Room may be obtained by calling 1-800-SEC-0330.
For a complete list of a fund's portfolio holdings, view the most recent holdings listing, semiannual report, or annual report on Fidelity's web site at http://www.fidelity.com, http://www.institutional.fidelity.com, or http://www.401k.com, as applicable.
NOT FDIC INSURED •MAY LOSE VALUE •NO BANK GUARANTEE
Neither the Funds nor Fidelity Distributors Corporation is a bank.
Average annual total return reflects the change in the value of an investment, assuming reinvestment of distributions from dividend income and capital gains (the profits earned upon the sale of securities that have grown in value, if any) and assuming a constant rate of performance each year. The hypothetical investment and the average annual total returns do not reflect the deduction of taxes that a shareholder would pay on fund distributions or the redemption of fund shares. During periods of reimbursement by Fidelity, a fund's total return will be greater than it would be had the reimbursement not occurred. How a fund did yesterday is no guarantee of how it will do tomorrow.
| Average Annual Total Returns |
| | | | |
Periods ended December 31, 2023 | Past 1 year | Past 5 years | Past 10 years |
| Fidelity® Series Emerging Markets Debt Fund | 12.47% | 2.05% | 3.40% |
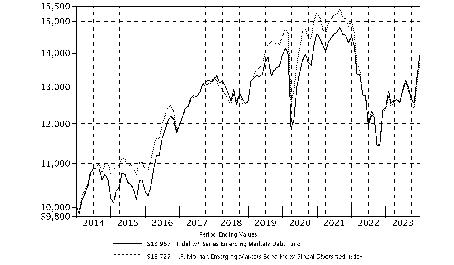
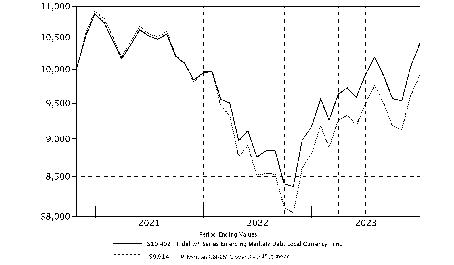
| $10,000 Over 10 Years |
| |
Let's say hypothetically that $10,000 was invested in Fidelity® Series Emerging Markets Debt Fund on December 31, 2013. The chart shows how the value of your investment would have changed, and also shows how the J.P. Morgan Emerging Markets Bond Index Global Diversified Index performed over the same period. |
|
|
Fidelity® Series Emerging Markets Debt Fund
Market Recap:
Emerging-markets debt gained 11.09% in 2023, according to the J.P. Morgan Emerging Markets Bond Index Global Diversified Index. After returning -17.78% in 2022, the index's sharp reversal was driven by global disinflationary trends and expectations that the U.S. Federal Reserve and other central banks around the world would slow or reverse their hiking of interest rates. Notably, the J.P. Morgan index rose 10.66% in the final two months of 2023, capping the year with a powerful rally amid falling U.S. Treasury yields. In December, the Fed projected a shift to monetary easing in 2024. This news, along with resilient late-cycle expansion of the U.S. economy, provided a favorable backdrop for higher-risk assets and spurred global stock and bond markets. A drop in commodity prices in 2023, including a decline in oil and energy prices, led to reduced inflationary pressure in emerging markets. As inflation fell below or closer to target rates, some emerging-markets' central banks began to cut interest rates. Against this backdrop, the higher-yield component of the index outpaced the investment-grade portion for the year. Among the index's country constituents, El Salvador (+117%), Pakistan (+100%) and Sri Lanka (+71%) stood out. Each is a small, distressed index component that was driven by idiosyncratic catalysts. In sharp contrast, Bolivia (-34%) faced the negative impact of dwindling gold reserves, while Ecuador (-18%) was rattled by political risk.
Comments from Co-Managers Timothy Gill and Nader Nazmi:
In 2023, the fund advanced 12.47%, outperforming the J.P. Morgan index. Security selection this year contributed most to fund's performance relative to the benchmark, with market selection also proving helpful. Specifically, leading the way was the fund's exposure to Venezuela , a country that has not been part of the J.P. Morgan index since its removal in late 2019. In October, the U.S. lifted its trading ban on the secondary market for some of the country's bonds. Investors await a decision from J.P. Morgan's index committee on whether Venezuela bonds will be readmitted as a constituent. The fund's holdings in Venezuela securities were up 126% the past 12 months. Security selection and an overweight in Ukraine also helped our relative result, given its outperformance of the benchmark in 2023. A position in bonds issued by Naftogaz, a large, state-owned oil and gas company in Ukraine, was particularly beneficial, as bondholders approved restructuring proposals in July, ending several months of default. On the negative side, a non-benchmark stake in U.S. Treasuries detracted from performance versus the benchmark. The fund's position returned 3% in 2023, underperforming the benchmark. An underweight in El Salvador also weighed on relative performance, given the robust performance of this market in 2023.
The views expressed above reflect those of the portfolio manager(s) only through the end of the period as stated on the cover of this report and do not necessarily represent the views of Fidelity or any other person in the Fidelity organization. Any such views are subject to change at any time based upon market or other conditions and Fidelity disclaims any responsibility to update such views. These views may not be relied on as investment advice and, because investment decisions for a Fidelity fund are based on numerous factors, may not be relied on as an indication of trading intent on behalf of any Fidelity fund.
Fidelity® Series Emerging Markets Debt Fund
| Top Bond Issuers (% of Fund's net assets) |
(with maturities greater than one year) |
| U.S. Treasury Obligations | 5.3 | |
| Petroleos Mexicanos | 3.8 | |
| Dominican Republic | 3.4 | |
| Turkish Republic | 3.1 | |
| Colombian Republic | 2.8 | |
| Indonesian Republic | 2.6 | |
| Sultanate of Oman | 2.5 | |
| State of Qatar | 2.3 | |
| Arab Republic of Egypt | 2.1 | |
| Republic of Nigeria | 2.1 | |
| | 30.0 | |
| |
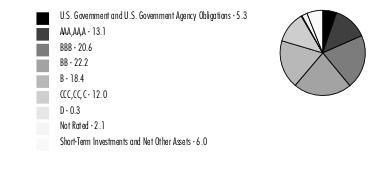
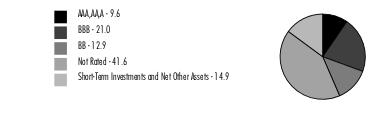
Quality Diversification (% of Fund's net assets) |
|
| |
| We have used ratings from Moody's Investors Service, Inc. Where Moody's® ratings are not available, we have used S&P® ratings. All ratings are as of the date indicated and do not reflect subsequent changes. |
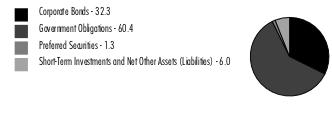
Asset Allocation (% of Fund's net assets) |
|
Futures - 0.3% |
|
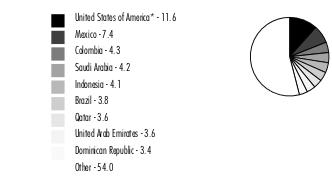
Geographic Diversification (% of Fund's net assets) |
|
* Includes Short-Term investments and Net Other Assets (Liabilities). Percentages are adjusted for the effect of derivatives, if applicable. |
| |
Forward foreign currency contracts and other assets and liabilities are included within United States of America, as applicable.
Fidelity® Series Emerging Markets Debt Fund
Showing Percentage of Net Assets
| Nonconvertible Bonds - 32.3% |
| | | Principal Amount (a) | Value ($) |
| Azerbaijan - 0.9% | | | |
| Southern Gas Corridor CJSC 6.875% 3/24/26 (b) | | 9,951,000 | 10,090,936 |
| State Oil Co. of Azerbaijan Republic 6.95% 3/18/30 (Reg. S) | | 2,010,000 | 2,111,128 |
TOTAL AZERBAIJAN | | | 12,202,064 |
| Bahrain - 0.7% | | | |
| The Oil and Gas Holding Co.: | | | |
| 7.5% 10/25/27 (b) | | 6,889,000 | 7,250,673 |
| 8.375% 11/7/28 (b) | | 1,065,000 | 1,165,509 |
TOTAL BAHRAIN | | | 8,416,182 |
| Brazil - 2.2% | | | |
| Adecoagro SA 6% 9/21/27 (b) | | 3,125,000 | 3,009,625 |
| Aegea Finance SARL 9% 1/20/31 (b) | | 1,045,000 | 1,111,462 |
| Azul Secured Finance LLP: | | | |
| 11.5% 5/28/29 (b) | | 3,722,238 | 3,166,806 |
| 11.93% 8/28/28 (b) | | 1,710,000 | 1,765,575 |
| Braskem Netherlands BV: | | | |
| 5.875% 1/31/50 (b) | | 920,000 | 637,445 |
| 7.25% 2/13/33 (b) | | 1,470,000 | 1,223,775 |
| CSN Islands XI Corp. 6.75% 1/28/28 (b) | | 1,250,000 | 1,210,950 |
| CSN Resources SA: | | | |
| 5.875% 4/8/32 (b) | | 2,115,000 | 1,824,843 |
| 8.875% 12/5/30 (b) | | 955,000 | 991,195 |
| Embraer Netherlands Finance BV: | | | |
| 5.4% 2/1/27 | | 660,000 | 651,961 |
| 6.95% 1/17/28 (b) | | 1,620,000 | 1,663,643 |
| 7% 7/28/30 (b) | | 2,190,000 | 2,288,309 |
| MARB BondCo PLC 3.95% 1/29/31 (b) | | 1,295,000 | 1,045,842 |
| MC Brazil Downstream Trading SARL 7.25% 6/30/31 (b) | | 3,635,426 | 2,817,455 |
| NBM U.S. Holdings, Inc. 6.625% 8/6/29 (b) | | 2,270,000 | 2,194,886 |
| Nexa Resources SA 6.5% 1/18/28 (b) | | 1,580,000 | 1,580,316 |
| Samarco Mineracao SA 9.0494% 6/30/31 pay-in-kind (b)(c) | | 710,000 | 592,673 |
TOTAL BRAZIL | | | 27,776,761 |
| Burkina Faso - 0.2% | | | |
| Endeavour Mining PLC 5% 10/14/26 (b) | | 3,310,000 | 3,044,166 |
| Cambodia - 0.2% | | | |
| NagaCorp Ltd. 7.95% 7/6/24 (Reg. S) | | 3,200,000 | 3,093,888 |
| Chile - 1.7% | | | |
| Antofagasta PLC: | | | |
| 2.375% 10/14/30 (b) | | 3,865,000 | 3,158,430 |
| 5.625% 5/13/32 (b) | | 1,390,000 | 1,380,444 |
| Chile Electricity LUX MPC SARL 6.01% 1/20/33 (b) | | 1,040,000 | 1,069,250 |
| Corporacion Nacional del Cobre de Chile (Codelco): | | | |
| 3% 9/30/29 (b) | | 2,000,000 | 1,778,750 |
| 3.15% 1/14/30 (b) | | 1,645,000 | 1,465,078 |
| 3.15% 1/15/51 (b) | | 1,865,000 | 1,215,747 |
| 3.7% 1/30/50 (b) | | 3,765,000 | 2,707,270 |
| 4.5% 8/1/47 (b) | | 1,970,000 | 1,611,460 |
| 5.125% 2/2/33 (b) | | 1,575,000 | 1,520,348 |
| 5.95% 1/8/34 (b) | | 955,000 | 965,983 |
| Empresa Nacional de Petroleo 6.15% 5/10/33 (b) | | 585,000 | 585,357 |
| Sable International Finance Ltd. 5.75% 9/7/27 (b) | | 2,287,000 | 2,164,760 |
| VTR Comunicaciones SpA: | | | |
| 4.375% 4/15/29 (b) | | 933,000 | 442,009 |
| 5.125% 1/15/28 (b) | | 3,749,000 | 1,781,947 |
TOTAL CHILE | | | 21,846,833 |
| China - 1.6% | | | |
| ENN Clean Energy International Investment Ltd. 3.375% 5/12/26 (b) | | 3,775,000 | 3,528,757 |
| ENN Energy Holdings Ltd. 4.625% 5/17/27 (b) | | 3,430,000 | 3,379,408 |
| Lenovo Group Ltd. 3.421% 11/2/30 (b) | | 2,915,000 | 2,568,873 |
| Meituan: | | | |
| 2.125% 10/28/25 (b) | | 4,740,000 | 4,464,369 |
| 3.05% 10/28/30 (b) | | 1,995,000 | 1,681,346 |
| Prosus NV: | | | |
| 3.061% 7/13/31 (b) | | 815,000 | 655,056 |
| 3.832% 2/8/51 (b) | | 1,590,000 | 999,713 |
| 4.027% 8/3/50 (b) | | 650,000 | 423,719 |
| 4.193% 1/19/32 (b) | | 3,505,000 | 3,009,919 |
TOTAL CHINA | | | 20,711,160 |
| Colombia - 1.5% | | | |
| Ecopetrol SA 8.875% 1/13/33 | | 2,900,000 | 3,143,781 |
| Empresas Publicas de Medellin 4.375% 2/15/31 (b) | | 1,910,000 | 1,557,432 |
| EnfraGen Energia Sur SA 5.375% 12/30/30 (b) | | 5,545,000 | 4,267,987 |
| Gcm Mining Corp. 6.875% 8/9/26 (b) | | 3,895,000 | 3,378,913 |
| GeoPark Ltd. 5.5% 1/17/27 (b) | | 2,685,000 | 2,365,190 |
| Oleoducto Central SA 4% 7/14/27 (b) | | 2,483,000 | 2,296,502 |
| Termocandelaria Power Ltd. 7.875% 1/30/29 (b) | | 3,041,875 | 2,963,927 |
TOTAL COLOMBIA | | | 19,973,732 |
| Costa Rica - 0.2% | | | |
| Liberty Costa Rica SR SF 10.875% 1/15/31 (b) | | 2,280,000 | 2,338,072 |
| Czech Republic - 0.1% | | | |
| Energo-Pro A/S 11% 11/2/28 (b) | | 1,700,000 | 1,751,000 |
| Georgia - 0.3% | | | |
| JSC Georgian Railway 4% 6/17/28 (b) | | 3,580,000 | 3,279,056 |
| Ghana - 1.1% | | | |
| Kosmos Energy Ltd. 7.125% 4/4/26 (b) | | 9,060,000 | 8,623,988 |
| Tullow Oil PLC: | | | |
| 7% 3/1/25 (b) | | 1,060,000 | 979,838 |
| 10.25% 5/15/26 (b) | | 5,670,000 | 5,035,669 |
TOTAL GHANA | | | 14,639,495 |
| Guatemala - 0.6% | | | |
| CT Trust 5.125% 2/3/32 (b) | | 3,975,000 | 3,452,009 |
| Investment Energy Resources Ltd. 6.25% 4/26/29 (b) | | 2,970,000 | 2,783,840 |
| Millicom International Cellular SA 4.5% 4/27/31 (b) | | 2,050,000 | 1,701,357 |
TOTAL GUATEMALA | | | 7,937,206 |
| Hungary - 0.1% | | | |
| Magyar Export-Import Bank 6.125% 12/4/27 (b) | | 1,070,000 | 1,088,565 |
| India - 0.3% | | | |
| CA Magnum Holdings 5.375% 10/31/26 (b) | | 3,545,000 | 3,296,850 |
| Indonesia - 1.5% | | | |
| Medco Bell Pte Ltd. 6.375% 1/30/27 (b) | | 3,120,000 | 2,991,300 |
| Medco Laurel Tree PTE Ltd. 6.95% 11/12/28 (b) | | 3,730,000 | 3,533,653 |
| PT Adaro Indonesia 4.25% 10/31/24 (b) | | 3,515,000 | 3,418,338 |
| PT Freeport Indonesia: | | | |
| 4.763% 4/14/27 (b) | | 1,225,000 | 1,206,760 |
| 5.315% 4/14/32 (b) | | 2,085,000 | 2,039,391 |
| 6.2% 4/14/52 (b) | | 1,420,000 | 1,407,131 |
| PT Indonesia Asahan Aluminium 5.45% 5/15/30 (b) | | 2,955,000 | 2,968,852 |
| PT Pertamina Geothermal Energy 5.15% 4/27/28 (b) | | 1,140,000 | 1,142,138 |
TOTAL INDONESIA | | | 18,707,563 |
| Israel - 0.7% | | | |
| Energean Israel Finance Ltd.: | | | |
| 4.875% 3/30/26 (Reg. S) (b) | | 3,470,000 | 3,192,400 |
| 8.5% 9/30/33 (Reg. S) (b) | | 1,300,000 | 1,239,875 |
| Leviathan Bond Ltd.: | | | |
| 6.125% 6/30/25 (Reg. S) (b) | | 3,640,000 | 3,521,700 |
| 6.5% 6/30/27 (Reg. S) (b) | | 645,000 | 605,245 |
TOTAL ISRAEL | | | 8,559,220 |
| Kazakhstan - 0.6% | | | |
| KazMunaiGaz National Co.: | | | |
| 3.5% 4/14/33 (b) | | 2,010,000 | 1,668,928 |
| 5.75% 4/19/47 (b) | | 1,010,000 | 884,697 |
| Nostrum Oil & Gas Finance BV: | | | |
| 5% 6/30/26 (b) | | 3,543,000 | 1,596,299 |
| 14% 6/30/26 pay-in-kind (b)(c) | | 1,109,603 | 233,017 |
| Tengizchevroil Finance Co. International Ltd. 3.25% 8/15/30 (b) | | 3,800,000 | 3,116,000 |
TOTAL KAZAKHSTAN | | | 7,498,941 |
| Kuwait - 0.3% | | | |
| Meglobal BV 4.25% 11/3/26 (b) | | 1,930,000 | 1,862,450 |
| MEGlobal Canada, Inc. 5% 5/18/25 (b) | | 1,635,000 | 1,615,380 |
TOTAL KUWAIT | | | 3,477,830 |
| Luxembourg - 0.1% | | | |
| TMS Issuer SARL 5.78% 8/23/32 (b) | | 1,670,000 | 1,740,975 |
| Malaysia - 1.0% | | | |
| GENM Capital Labuan Ltd. 3.882% 4/19/31 (b) | | 3,610,000 | 3,074,141 |
| MISC Capital Two (Labuan) Ltd.: | | | |
| 3.625% 4/6/25 (b) | | 945,000 | 923,756 |
| 3.75% 4/6/27 (b) | | 3,090,000 | 2,971,869 |
| Petronas Capital Ltd.: | | | |
| 3.404% 4/28/61 (b) | | 5,315,000 | 3,777,902 |
| 3.5% 4/21/30 (b) | | 1,730,000 | 1,617,758 |
TOTAL MALAYSIA | | | 12,365,426 |
| Mauritius - 0.2% | | | |
| AXIAN Telecom 7.375% 2/16/27 (b) | | 2,870,000 | 2,668,203 |
| Mexico - 4.7% | | | |
| Bimbo Bakeries U.S.A., Inc. 6.4% 1/15/34 (b) | | 2,285,000 | 2,529,198 |
| Braskem Idesa SAPI: | | | |
| 6.99% 2/20/32 (b) | | 450,000 | 254,304 |
| 7.45% 11/15/29 (b) | | 2,825,000 | 1,736,528 |
| Comision Federal de Electricidad: | | | |
| 3.348% 2/9/31 (b) | | 735,000 | 608,213 |
| 4.688% 5/15/29 (b) | | 3,085,000 | 2,900,864 |
| Petroleos Mexicanos: | | | |
| 6.5% 3/13/27 | | 1,725,000 | 1,603,172 |
| 6.5% 6/2/41 | | 2,587,000 | 1,752,693 |
| 6.625% 6/15/35 | | 15,841,000 | 12,049,061 |
| 6.7% 2/16/32 | | 4,827,000 | 3,994,343 |
| 6.75% 9/21/47 | | 10,407,000 | 6,808,780 |
| 6.875% 10/16/25 | | 2,295,000 | 2,256,834 |
| 6.875% 8/4/26 | | 2,485,000 | 2,401,504 |
| 6.95% 1/28/60 | | 9,575,000 | 6,295,563 |
| 7.69% 1/23/50 | | 16,573,000 | 11,787,546 |
| TV Azteca SA de CV 8.25% (Reg. S) (d) | | 10,535,000 | 4,079,784 |
TOTAL MEXICO | | | 61,058,387 |
| Morocco - 0.4% | | | |
| OCP SA: | | | |
| 3.75% 6/23/31 (b) | | 3,150,000 | 2,705,063 |
| 6.875% 4/25/44 (b) | | 2,320,000 | 2,199,650 |
TOTAL MOROCCO | | | 4,904,713 |
| Nigeria - 0.6% | | | |
| Access Bank PLC 6.125% 9/21/26 (b) | | 3,295,000 | 2,954,173 |
| IHS Holding Ltd. 5.625% 11/29/26 (b) | | 2,420,000 | 2,090,275 |
| IHS Netherlands Holdco BV 8% 9/18/27 (b) | | 3,490,000 | 3,094,103 |
TOTAL NIGERIA | | | 8,138,551 |
| Oman - 0.1% | | | |
| Lamar Funding Ltd. 3.958% 5/7/25 (b) | | 1,015,000 | 986,773 |
| Panama - 0.5% | | | |
| Aeropuerto Internacional de Tocumen SA 5.125% 8/11/61 (b) | | 1,230,000 | 922,586 |
| C&W Senior Financing Designated Activity Co. 6.875% 9/15/27 (b) | | 2,060,000 | 1,915,924 |
| Cable Onda SA 4.5% 1/30/30 (b) | | 4,955,000 | 4,286,075 |
TOTAL PANAMA | | | 7,124,585 |
| Paraguay - 0.3% | | | |
| Telefonica Celular del Paraguay SA 5.875% 4/15/27 (b) | | 3,800,000 | 3,706,596 |
| Peru - 0.3% | | | |
| Camposol SA 6% 2/3/27 (b) | | 1,235,000 | 820,299 |
| Compania de Minas Buenaventura SAA 5.5% 7/23/26 (b) | | 2,100,000 | 2,003,337 |
| Volcan Compania Minera SAA 4.375% 2/11/26 (b) | | 1,345,000 | 813,725 |
TOTAL PERU | | | 3,637,361 |
| Qatar - 1.3% | | | |
| Qatar Petroleum: | | | |
| 2.25% 7/12/31 (b) | | 7,425,000 | 6,310,879 |
| 3.125% 7/12/41 (b) | | 4,005,000 | 3,074,238 |
| 3.3% 7/12/51 (b) | | 9,800,000 | 7,140,280 |
TOTAL QATAR | | | 16,525,397 |
| Saudi Arabia - 2.8% | | | |
| EIG Pearl Holdings SARL 3.545% 8/31/36 (b) | | 6,860,000 | 5,961,769 |
| Greensaif Pipelines Bidco SARL: | | | |
| 6.129% 2/23/38 (b) | | 2,260,000 | 2,358,169 |
| 6.51% 2/23/42 (b) | | 1,685,000 | 1,772,936 |
| SA Global Sukuk Ltd. 1.602% 6/17/26 (b) | | 2,530,000 | 2,343,413 |
| Saudi Arabian Oil Co.: | | | |
| 2.25% 11/24/30 (b) | | 4,120,000 | 3,523,888 |
| 3.25% 11/24/50 (b) | | 4,170,000 | 2,939,433 |
| 3.5% 4/16/29 (b) | | 11,299,000 | 10,674,024 |
| 4.25% 4/16/39 (b) | | 3,505,000 | 3,104,116 |
| 4.375% 4/16/49 (b) | | 3,671,000 | 3,129,528 |
TOTAL SAUDI ARABIA | | | 35,807,276 |
| South Africa - 1.9% | | | |
| Eskom Holdings SOC Ltd.: | | | |
| 6.35% 8/10/28 (b) | | 3,515,000 | 3,412,845 |
| 7.125% 2/11/25 (b) | | 8,380,000 | 8,372,144 |
| 8.45% 8/10/28 (b) | | 1,310,000 | 1,323,919 |
| Liquid Telecommunications Financing PLC 5.5% 9/4/26 (b) | | 4,940,000 | 2,840,500 |
| Sasol Financing U.S.A. LLC: | | | |
| 4.375% 9/18/26 | | 5,555,000 | 5,166,150 |
| 8.75% 5/3/29 (b) | | 820,000 | 836,094 |
| Stillwater Mining Co. 4% 11/16/26 (b) | | 2,210,000 | 1,955,850 |
TOTAL SOUTH AFRICA | | | 23,907,502 |
| Tanzania - 0.1% | | | |
| HTA Group Ltd. 7% 12/18/25 (b) | | 1,915,000 | 1,880,913 |
| Ukraine - 0.3% | | | |
| Biz Finance PLC 9.75% 1/22/25 (b) | | 880,500 | 810,060 |
| NAK Naftogaz Ukraine: | | | |
| 7.625% 11/8/28 (b) | | 1,235,000 | 568,100 |
| 7.65% (Reg. S) (d) | | 3,502,650 | 2,399,315 |
TOTAL UKRAINE | | | 3,777,475 |
| United Arab Emirates - 1.9% | | | |
| Abu Dhabi National Energy Co. PJSC: | | | |
| 4% 10/3/49 (b) | | 2,460,000 | 2,067,015 |
| 4.696% 4/24/33 (b) | | 1,945,000 | 1,963,808 |
| 4.875% 4/23/30 (b) | | 545,000 | 558,391 |
| DP World Crescent Ltd.: | | | |
| 3.7495% 1/30/30 (b) | | 1,075,000 | 1,009,103 |
| 3.875% 7/18/29 (Reg. S) | | 3,260,000 | 3,084,351 |
| Galaxy Pipeline Assets BidCo Ltd. 2.625% 3/31/36 (b) | | 5,915,000 | 4,872,481 |
| GEMS MENASA Cayman Ltd. 7.125% 7/31/26 (b) | | 2,095,000 | 2,053,100 |
| MDGH GMTN RSC Ltd.: | | | |
| 2.875% 11/7/29 (b) | | 1,515,000 | 1,378,256 |
| 3.375% 3/28/32 (Reg. S) | | 570,000 | 520,741 |
| 4.375% 11/22/33 (b) | | 1,715,000 | 1,668,455 |
| 5.084% 5/22/53 (b) | | 3,040,000 | 2,976,312 |
| 5.5% 4/28/33 (b) | | 1,620,000 | 1,714,316 |
TOTAL UNITED ARAB EMIRATES | | | 23,866,329 |
| United States of America - 0.3% | | | |
| LCPR Senior Secured Financing DAC 5.125% 7/15/29 (b) | | 3,810,000 | 3,319,026 |
| Uzbekistan - 0.1% | | | |
| National Bank of Uzbekistan 4.85% 10/21/25 (Reg. S) | | 1,725,000 | 1,597,781 |
| Venezuela - 0.4% | | | |
| Petroleos de Venezuela SA: | | | |
| 5.375% (d) | | 6,115,000 | 651,248 |
| 5.5% (d) | | 3,475,000 | 373,563 |
| 6% (b)(d) | | 15,840,000 | 1,782,000 |
| 6% (b)(d) | | 8,980,000 | 987,601 |
| 9.75% (b)(d) | | 12,585,000 | 1,573,125 |
| 12.75% (b)(d) | | 3,065,000 | 398,450 |
TOTAL VENEZUELA | | | 5,765,987 |
| Vietnam - 0.2% | | | |
| Mong Duong Finance Holdings BV 5.125% 5/7/29 (b) | | 2,596,247 | 2,408,019 |
| TOTAL NONCONVERTIBLE BONDS (Cost $477,894,367) | | | 414,825,859 |
| | | | |
| Government Obligations - 60.4% |
| | | Principal Amount (a) | Value ($) |
| Angola - 1.6% | | | |
| Angola Republic: | | | |
| 8% 11/26/29 (b) | | 2,290,000 | 2,032,375 |
| 8.25% 5/9/28 (b) | | 5,065,000 | 4,659,800 |
| 8.75% 4/14/32 (b) | | 2,575,000 | 2,269,219 |
| 9.125% 11/26/49 (b) | | 3,555,000 | 2,901,769 |
| 9.375% 5/8/48 (b) | | 3,125,000 | 2,601,563 |
| 9.5% 11/12/25 (b) | | 5,565,000 | 5,474,569 |
TOTAL ANGOLA | | | 19,939,295 |
| Argentina - 1.7% | | | |
| Argentine Republic: | | | |
| 0.75% 7/9/30 (e) | | 19,209,632 | 7,670,406 |
| 1% 7/9/29 | | 4,963,783 | 1,966,055 |
| 3.625% 7/9/35 (e) | | 17,033,027 | 5,765,339 |
| 4.25% 1/9/38 (e) | | 10,211,997 | 4,029,858 |
| Buenos Aires Province 6.375% 9/1/37 (b)(e) | | 2,255,000 | 867,048 |
| Provincia de Cordoba 6.875% 12/10/25 (b) | | 1,223,630 | 1,119,621 |
TOTAL ARGENTINA | | | 21,418,327 |
| Armenia - 0.2% | | | |
| Republic of Armenia 3.6% 2/2/31 (b) | | 3,805,000 | 3,101,075 |
| Bahrain - 0.2% | | | |
| Bahrain Kingdom 5.625% 5/18/34 (b) | | 3,055,000 | 2,760,956 |
| Barbados - 0.2% | | | |
| Barbados Government 6.5% 10/1/29 (b) | | 3,170,000 | 2,978,437 |
| Benin - 0.1% | | | |
| Republic of Benin 4.875% 1/19/32 (b) | EUR | 1,920,000 | 1,725,474 |
| Bermuda - 0.4% | | | |
| Bermuda Government: | | | |
| 2.375% 8/20/30 (b) | | 525,000 | 449,138 |
| 3.375% 8/20/50 (b) | | 965,000 | 672,663 |
| 3.717% 1/25/27 (b) | | 620,000 | 598,881 |
| 4.75% 2/15/29 (b) | | 2,270,000 | 2,243,713 |
| 5% 7/15/32 (b) | | 1,005,000 | 989,925 |
TOTAL BERMUDA | | | 4,954,320 |
| Brazil - 1.6% | | | |
| Brazilian Federative Republic: | | | |
| 3.875% 6/12/30 | | 5,500,000 | 5,025,625 |
| 4.75% 1/14/50 | | 4,150,000 | 3,185,125 |
| 5.625% 2/21/47 | | 2,183,000 | 1,912,308 |
| 6% 10/20/33 | | 1,880,000 | 1,876,898 |
| 7.125% 1/20/37 | | 2,080,000 | 2,268,947 |
| 8.25% 1/20/34 | | 5,204,000 | 6,109,964 |
TOTAL BRAZIL | | | 20,378,867 |
| Chile - 1.4% | | | |
| Chilean Republic: | | | |
| 2.45% 1/31/31 | | 7,745,000 | 6,728,469 |
| 3.1% 1/22/61 | | 7,500,000 | 5,001,563 |
| 3.5% 1/31/34 | | 1,775,000 | 1,580,305 |
| 4% 1/31/52 | | 985,000 | 808,623 |
| 4.34% 3/7/42 | | 1,410,000 | 1,256,222 |
| 5.33% 1/5/54 | | 2,835,000 | 2,818,167 |
TOTAL CHILE | | | 18,193,349 |
| Colombia - 2.8% | | | |
| Colombian Republic: | | | |
| 3% 1/30/30 | | 10,600,000 | 8,913,938 |
| 3.125% 4/15/31 | | 4,300,000 | 3,495,094 |
| 3.875% 2/15/61 | | 1,490,000 | 925,197 |
| 4.125% 5/15/51 | | 3,120,000 | 2,067,975 |
| 5% 6/15/45 | | 8,500,000 | 6,560,938 |
| 5.2% 5/15/49 | | 5,390,000 | 4,204,200 |
| 6.125% 1/18/41 | | 1,475,000 | 1,338,102 |
| 7.375% 9/18/37 | | 845,000 | 875,367 |
| 7.5% 2/2/34 | | 1,110,000 | 1,169,316 |
| 8% 4/20/33 | | 1,720,000 | 1,877,488 |
| 8% 11/14/35 | | 1,785,000 | 1,950,670 |
| 8.75% 11/14/53 | | 1,690,000 | 1,940,859 |
TOTAL COLOMBIA | | | 35,319,144 |
| Costa Rica - 1.2% | | | |
| Costa Rican Republic: | | | |
| 5.625% 4/30/43 (b) | | 3,955,000 | 3,604,983 |
| 6.125% 2/19/31 (b) | | 3,720,000 | 3,802,538 |
| 6.55% 4/3/34 (b) | | 2,750,000 | 2,847,625 |
| 7% 4/4/44 (b) | | 1,965,000 | 2,048,513 |
| 7.3% 11/13/54 (b) | | 3,295,000 | 3,571,451 |
TOTAL COSTA RICA | | | 15,875,110 |
| Dominican Republic - 3.4% | | | |
| Dominican Republic: | | | |
| 4.5% 1/30/30 (b) | | 7,180,000 | 6,596,625 |
| 4.875% 9/23/32 (b) | | 6,360,000 | 5,782,130 |
| 5.3% 1/21/41 (b) | | 2,450,000 | 2,119,250 |
| 5.875% 1/30/60 (b) | | 6,775,000 | 5,853,600 |
| 5.95% 1/25/27 (b) | | 4,186,000 | 4,194,707 |
| 6% 7/19/28 (b) | | 2,999,000 | 2,999,000 |
| 6.4% 6/5/49 (b) | | 1,662,000 | 1,562,280 |
| 6.5% 2/15/48 (b) | | 3,345,000 | 3,184,440 |
| 6.85% 1/27/45 (b) | | 4,046,000 | 4,023,747 |
| 7.05% 2/3/31 (b) | | 1,215,000 | 1,274,474 |
| 7.45% 4/30/44 (b) | | 6,031,000 | 6,383,814 |
TOTAL DOMINICAN REPUBLIC | | | 43,974,067 |
| Ecuador - 0.9% | | | |
| Ecuador Republic: | | | |
| 2.5% 7/31/40 (b)(e) | | 2,800,000 | 882,000 |
| 3.5% 7/31/35 (b)(e) | | 14,640,000 | 5,189,880 |
| 6% 7/31/30 (b)(e) | | 11,715,000 | 5,424,045 |
TOTAL ECUADOR | | | 11,495,925 |
| Egypt - 2.1% | | | |
| Arab Republic of Egypt: | | | |
| 5.875% 2/16/31 (b) | | 2,625,000 | 1,712,813 |
| 7.0529% 1/15/32 (b) | | 830,000 | 566,734 |
| 7.5% 1/31/27 (b) | | 5,596,000 | 4,700,640 |
| 7.5% 2/16/61 (b) | | 6,070,000 | 3,530,084 |
| 7.6003% 3/1/29 (b) | | 8,726,000 | 6,637,214 |
| 7.903% 2/21/48 (b) | | 3,265,000 | 1,960,020 |
| 8.5% 1/31/47 (b) | | 7,939,000 | 4,927,142 |
| 8.7002% 3/1/49 (b) | | 3,665,000 | 2,284,898 |
| 8.875% 5/29/50 (b) | | 1,945,000 | 1,234,467 |
TOTAL EGYPT | | | 27,554,012 |
| El Salvador - 0.3% | | | |
| El Salvador Republic: | | | |
| 6.375% 1/18/27 (b) | | 435,000 | 381,984 |
| 7.1246% 1/20/50 (b) | | 3,292,000 | 2,323,946 |
| 7.625% 2/1/41 (b) | | 1,035,000 | 772,369 |
| 7.65% 6/15/35 (b) | | 1,185,000 | 919,486 |
TOTAL EL SALVADOR | | | 4,397,785 |
| Gabon - 0.4% | | | |
| Gabonese Republic: | | | |
| 6.95% 6/16/25 (b) | | 2,410,000 | 2,287,241 |
| 7% 11/24/31 (b) | | 3,620,000 | 3,002,338 |
TOTAL GABON | | | 5,289,579 |
| Georgia - 0.2% | | | |
| Georgia Republic 2.75% 4/22/26 (b) | | 2,915,000 | 2,725,525 |
| Ghana - 0.7% | | | |
| Ghana Republic: | | | |
| 7.75% (b)(d) | | 3,695,000 | 1,588,850 |
| 8.125% (b)(d) | | 1,603,076 | 731,904 |
| 8.125% (b)(d) | | 5,475,000 | 2,381,625 |
| 8.627% (b)(d) | | 2,845,000 | 1,202,013 |
| 10.75% 10/14/30 (b) | | 4,845,000 | 3,040,238 |
TOTAL GHANA | | | 8,944,630 |
| Guatemala - 0.7% | | | |
| Guatemalan Republic: | | | |
| 4.9% 6/1/30 (b) | | 485,000 | 466,328 |
| 5.25% 8/10/29 (b) | | 1,200,000 | 1,174,800 |
| 5.375% 4/24/32 (b) | | 2,015,000 | 1,951,528 |
| 6.125% 6/1/50 (b) | | 1,355,000 | 1,281,830 |
| 6.6% 6/13/36 (b) | | 4,410,000 | 4,531,275 |
TOTAL GUATEMALA | | | 9,405,761 |
| Honduras - 0.1% | | | |
| Republic of Honduras 6.25% 1/19/27 (b) | | 615,000 | 588,863 |
| Hungary - 1.4% | | | |
| Hungarian Republic: | | | |
| 2.125% 9/22/31 (b) | | 2,950,000 | 2,377,907 |
| 3.125% 9/21/51 (b) | | 5,810,000 | 3,925,410 |
| 5.25% 6/16/29 (b) | | 1,585,000 | 1,593,765 |
| 5.5% 6/16/34 (b) | | 2,890,000 | 2,927,859 |
| 6.25% 9/22/32 (b) | | 1,125,000 | 1,200,510 |
| 6.75% 9/25/52 (b) | | 3,800,000 | 4,253,074 |
| 7.625% 3/29/41 | | 1,655,000 | 1,978,801 |
TOTAL HUNGARY | | | 18,257,326 |
| Indonesia - 2.6% | | | |
| Indonesian Republic: | | | |
| 3.85% 10/15/30 | | 2,650,000 | 2,522,469 |
| 5.125% 1/15/45 (b) | | 3,353,000 | 3,465,116 |
| 5.25% 1/17/42 (b) | | 3,000,000 | 3,121,125 |
| 5.45% 9/20/52 | | 2,955,000 | 3,158,156 |
| 5.95% 1/8/46 (b) | | 2,100,000 | 2,357,250 |
| 6.625% 2/17/37 (b) | | 3,549,000 | 4,150,112 |
| 6.75% 1/15/44 (b) | | 3,035,000 | 3,716,927 |
| 7.75% 1/17/38 (b) | | 4,298,000 | 5,508,156 |
| 8.5% 10/12/35 (b) | | 4,169,000 | 5,534,348 |
TOTAL INDONESIA | | | 33,533,659 |
| Ivory Coast - 0.8% | | | |
| Ivory Coast: | | | |
| 5.875% 10/17/31 (b) | EUR | 5,335,000 | 5,267,487 |
| 6.375% 3/3/28 (b) | | 5,580,000 | 5,470,144 |
TOTAL IVORY COAST | | | 10,737,631 |
| Jamaica - 0.2% | | | |
| Jamaican Government 7.875% 7/28/45 | | 1,685,000 | 2,058,228 |
| Jordan - 0.6% | | | |
| Jordanian Kingdom: | | | |
| 5.85% 7/7/30 (b) | | 2,325,000 | 2,155,711 |
| 6.125% 1/29/26 (b) | | 985,000 | 980,383 |
| 7.375% 10/10/47 (b) | | 2,005,000 | 1,776,430 |
| 7.5% 1/13/29 (b) | | 1,410,000 | 1,425,863 |
| 7.75% 1/15/28 (b) | | 1,725,000 | 1,778,906 |
TOTAL JORDAN | | | 8,117,293 |
| Kenya - 0.9% | | | |
| Republic of Kenya: | | | |
| 6.3% 1/23/34 (b) | | 4,105,000 | 3,294,263 |
| 6.875% 6/24/24 (b) | | 3,235,000 | 3,135,928 |
| 7% 5/22/27 (b) | | 3,745,000 | 3,510,938 |
| 7.25% 2/28/28 (b) | | 570,000 | 521,550 |
| 8% 5/22/32 (b) | | 685,000 | 618,213 |
TOTAL KENYA | | | 11,080,892 |
| Lebanon - 0.1% | | | |
| Lebanese Republic: | | | |
| 5.8% (d) | | 5,875,000 | 339,035 |
| 6% (d) | | 1,587,000 | 92,740 |
| 6.1% (d) | | 685,000 | 39,530 |
| 6.375% (d) | | 7,072,000 | 416,894 |
TOTAL LEBANON | | | 888,199 |
| Mexico - 1.9% | | | |
| United Mexican States: | | | |
| 3.25% 4/16/30 | | 3,700,000 | 3,343,875 |
| 4.5% 4/22/29 | | 2,040,000 | 2,006,850 |
| 4.75% 4/27/32 | | 970,000 | 932,413 |
| 5.75% 10/12/2110 | | 3,295,000 | 2,939,758 |
| 6.05% 1/11/40 | | 10,222,000 | 10,308,248 |
| 6.338% 5/4/53 | | 1,695,000 | 1,725,722 |
| 6.35% 2/9/35 | | 2,485,000 | 2,599,155 |
TOTAL MEXICO | | | 23,856,021 |
| Mongolia - 0.1% | | | |
| Mongolia Government: | | | |
| 5.125% 4/7/26 (b) | | 1,240,000 | 1,203,963 |
| 7.875% 6/5/29 (b) | | 490,000 | 501,079 |
TOTAL MONGOLIA | | | 1,705,042 |
| Morocco - 0.2% | | | |
| Moroccan Kingdom 6.5% 9/8/33 (b) | | 2,740,000 | 2,888,131 |
| Nigeria - 2.1% | | | |
| Republic of Nigeria: | | | |
| 6.125% 9/28/28 (b) | | 4,880,000 | 4,318,800 |
| 6.5% 11/28/27 (b) | | 5,087,000 | 4,638,708 |
| 7.143% 2/23/30 (b) | | 4,110,000 | 3,695,147 |
| 7.625% 11/21/25 (b) | | 5,383,000 | 5,307,638 |
| 7.625% 11/28/47 (b) | | 5,315,000 | 4,203,155 |
| 7.696% 2/23/38 (b) | | 980,000 | 802,375 |
| 7.875% 2/16/32 (b) | | 1,635,000 | 1,465,880 |
| 8.375% 3/24/29 (b) | | 3,095,000 | 2,964,430 |
TOTAL NIGERIA | | | 27,396,133 |
| Oman - 2.5% | | | |
| Sultanate of Oman: | | | |
| 5.625% 1/17/28 (b) | | 6,505,000 | 6,618,838 |
| 6% 8/1/29 (b) | | 3,625,000 | 3,751,875 |
| 6.25% 1/25/31 (b) | | 4,805,000 | 5,046,752 |
| 6.5% 3/8/47 (b) | | 8,100,000 | 8,251,875 |
| 6.75% 1/17/48 (b) | | 7,720,000 | 8,060,163 |
| 7% 1/25/51 (b) | | 490,000 | 527,669 |
TOTAL OMAN | | | 32,257,172 |
| Pakistan - 0.8% | | | |
| Islamic Republic of Pakistan: | | | |
| 6% 4/8/26 (b) | | 6,130,000 | 4,312,072 |
| 6.875% 12/5/27 (b) | | 5,905,000 | 4,004,328 |
| 7.875% 3/31/36 (b) | | 2,025,000 | 1,268,379 |
TOTAL PAKISTAN | | | 9,584,779 |
| Panama - 1.7% | | | |
| Panamanian Republic: | | | |
| 2.252% 9/29/32 | | 5,065,000 | 3,695,867 |
| 3.16% 1/23/30 | | 3,670,000 | 3,122,941 |
| 3.298% 1/19/33 | | 5,355,000 | 4,233,797 |
| 3.87% 7/23/60 | | 3,880,000 | 2,317,088 |
| 4.3% 4/29/53 | | 1,795,000 | 1,198,723 |
| 4.5% 5/15/47 | | 2,005,000 | 1,420,417 |
| 4.5% 4/16/50 | | 2,680,000 | 1,855,900 |
| 6.4% 2/14/35 | | 2,700,000 | 2,632,500 |
| 6.853% 3/28/54 | | 1,030,000 | 961,763 |
TOTAL PANAMA | | | 21,438,996 |
| Paraguay - 0.8% | | | |
| Republic of Paraguay: | | | |
| 2.739% 1/29/33 (b) | | 1,305,000 | 1,070,100 |
| 4.95% 4/28/31 (b) | | 3,865,000 | 3,772,240 |
| 5.4% 3/30/50 (b) | | 3,925,000 | 3,499,138 |
| 5.6% 3/13/48 (b) | | 1,925,000 | 1,759,450 |
TOTAL PARAGUAY | | | 10,100,928 |
| Peru - 1.0% | | | |
| Peruvian Republic: | | | |
| 2.783% 1/23/31 | | 3,585,000 | 3,115,589 |
| 3% 1/15/34 | | 5,225,000 | 4,398,797 |
| 3.3% 3/11/41 | | 7,075,000 | 5,487,547 |
TOTAL PERU | | | 13,001,933 |
| Philippines - 0.7% | | | |
| Philippine Republic: | | | |
| 2.65% 12/10/45 | | 2,130,000 | 1,505,644 |
| 2.95% 5/5/45 | | 865,000 | 646,588 |
| 5% 7/17/33 | | 1,135,000 | 1,164,794 |
| 5.5% 1/17/48 | | 1,005,000 | 1,055,878 |
| 5.609% 4/13/33 | | 1,670,000 | 1,781,159 |
| 5.95% 10/13/47 | | 2,670,000 | 2,967,872 |
TOTAL PHILIPPINES | | | 9,121,935 |
| Poland - 0.4% | | | |
| Bank Gospodarstwa Krajowego: | | | |
| 5.375% 5/22/33 (b) | | 2,000,000 | 2,025,300 |
| 6.25% 10/31/28 (b) | | 985,000 | 1,038,978 |
| Polish Government 5.5% 4/4/53 | | 1,945,000 | 2,023,597 |
TOTAL POLAND | | | 5,087,875 |
| Qatar - 2.3% | | | |
| State of Qatar: | | | |
| 3.75% 4/16/30 (b) | | 10,275,000 | 10,025,420 |
| 4.4% 4/16/50 (b) | | 9,660,000 | 8,912,026 |
| 4.817% 3/14/49 (b) | | 8,149,000 | 7,917,487 |
| 5.103% 4/23/48 (b) | | 2,960,000 | 2,991,672 |
TOTAL QATAR | | | 29,846,605 |
| Romania - 1.4% | | | |
| Romanian Republic: | | | |
| 2% 4/14/33 (Reg. S) | EUR | 2,030,000 | 1,666,309 |
| 3% 2/14/31 (b) | | 5,296,000 | 4,502,500 |
| 3.375% 1/28/50 (Reg. S) | EUR | 3,875,000 | 2,904,802 |
| 3.624% 5/26/30 (b) | EUR | 1,665,000 | 1,687,685 |
| 3.625% 3/27/32 (b) | | 2,618,000 | 2,260,067 |
| 4% 2/14/51 (b) | | 3,100,000 | 2,233,364 |
| 7.125% 1/17/33 (b) | | 1,615,000 | 1,742,424 |
| 7.625% 1/17/53 (b) | | 1,138,000 | 1,271,510 |
TOTAL ROMANIA | | | 18,268,661 |
| Rwanda - 0.2% | | | |
| Rwanda Republic 5.5% 8/9/31 (b) | | 3,195,000 | 2,549,011 |
| Saudi Arabia - 1.4% | | | |
| Kingdom of Saudi Arabia: | | | |
| 2.25% 2/2/33 (b) | | 4,030,000 | 3,331,047 |
| 3.45% 2/2/61 (b) | | 2,775,000 | 1,946,836 |
| 3.625% 3/4/28 (b) | | 1,770,000 | 1,709,709 |
| 3.75% 1/21/55 (b) | | 3,755,000 | 2,849,106 |
| 4.5% 10/26/46 (b) | | 3,471,000 | 3,063,158 |
| 4.5% 4/22/60 (b) | | 2,055,000 | 1,774,364 |
| 4.625% 10/4/47 (b) | | 3,040,000 | 2,717,699 |
TOTAL SAUDI ARABIA | | | 17,391,919 |
| Senegal - 0.3% | | | |
| Republic of Senegal: | | | |
| 6.25% 5/23/33 (b) | | 2,700,000 | 2,404,688 |
| 6.75% 3/13/48 (b) | | 1,385,000 | 1,086,792 |
TOTAL SENEGAL | | | 3,491,480 |
| Serbia - 0.6% | | | |
| Republic of Serbia: | | | |
| 2.125% 12/1/30 (b) | | 5,110,000 | 4,085,854 |
| 6.25% 5/26/28 (b) | | 865,000 | 884,212 |
| 6.5% 9/26/33 (b) | | 2,300,000 | 2,352,647 |
TOTAL SERBIA | | | 7,322,713 |
| South Africa - 1.1% | | | |
| South African Republic: | | | |
| 5% 10/12/46 | | 880,000 | 647,900 |
| 5.65% 9/27/47 | | 6,075,000 | 4,844,813 |
| 5.75% 9/30/49 | | 7,030,000 | 5,606,284 |
| 7.3% 4/20/52 | | 3,545,000 | 3,350,025 |
TOTAL SOUTH AFRICA | | | 14,449,022 |
| Sri Lanka - 0.9% | | | |
| Democratic Socialist Republic of Sri Lanka: | | | |
| 6.2% (b)(d) | | 4,350,000 | 2,180,438 |
| 6.825% (b)(d) | | 3,085,000 | 1,567,631 |
| 6.85% (b)(d) | | 5,000,000 | 2,548,438 |
| 7.55% (b)(d) | | 3,405,000 | 1,703,564 |
| 7.85% (b)(d) | | 6,363,000 | 3,181,500 |
TOTAL SRI LANKA | | | 11,181,571 |
| Turkey - 3.2% | | | |
| Export Credit Bank of Turkey 9% 1/28/27 (b) | | 1,735,000 | 1,804,942 |
| Turkish Republic: | | | |
| 4.75% 1/26/26 | | 2,030,000 | 1,969,100 |
| 4.875% 4/16/43 | | 5,290,000 | 3,862,229 |
| 5.125% 2/17/28 | | 3,070,000 | 2,920,338 |
| 5.75% 5/11/47 | | 4,040,000 | 3,151,200 |
| 5.95% 1/15/31 | | 2,685,000 | 2,524,437 |
| 6% 1/14/41 | | 4,622,000 | 3,912,754 |
| 6.125% 10/24/28 | | 2,140,000 | 2,099,875 |
| 6.375% 10/14/25 | | 4,480,000 | 4,485,600 |
| 6.625% 2/17/45 | | 150,000 | 131,438 |
| 6.75% 5/30/40 | | 2,112,000 | 1,932,480 |
| 9.125% 7/13/30 | | 3,825,000 | 4,212,281 |
| 9.375% 3/14/29 | | 5,270,000 | 5,816,763 |
| 9.375% 1/19/33 | | 515,000 | 580,663 |
| 26.2% 10/5/33 | TRY | 33,410,000 | 1,172,291 |
TOTAL TURKEY | | | 40,576,391 |
| Ukraine - 0.9% | | | |
| Ukraine Government: | | | |
| 6.876% 5/21/31 (b) | | 3,585,000 | 812,227 |
| 7.253% 3/15/35 (b) | | 3,445,000 | 799,240 |
| 7.375% 9/25/34 (b) | | 2,130,000 | 495,225 |
| 7.75% 9/1/24 (b) | | 9,099,000 | 2,747,898 |
| 7.75% 9/1/25 (b) | | 9,100,000 | 2,675,400 |
| 7.75% 9/1/26 (b) | | 5,364,000 | 1,469,736 |
| 7.75% 9/1/27 (b) | | 1,750,000 | 467,250 |
| 7.75% 9/1/28 (b) | | 1,895,000 | 520,178 |
| 7.75% 9/1/29 (b) | | 2,594,000 | 703,623 |
| 7.75% 8/1/41 (b)(c) | | 2,230,000 | 991,904 |
| 9.75% 11/1/30 (b) | | 425,000 | 120,594 |
TOTAL UKRAINE | | | 11,803,275 |
| United Arab Emirates - 1.3% | | | |
| Abu Dhabi National Energy Co. PJSC 4.375% 1/24/29 (b) | | 1,740,000 | 1,728,760 |
| Emirate of Abu Dhabi: | | | |
| 3.125% 9/30/49 (b) | | 13,102,000 | 9,601,932 |
| 3.875% 4/16/50 (b) | | 2,990,000 | 2,501,584 |
| Emirate of Dubai 3.9% 9/9/50 (Reg. S) | | 4,165,000 | 3,117,242 |
TOTAL UNITED ARAB EMIRATES | | | 16,949,518 |
| United States of America - 5.3% | | | |
| U.S. Treasury Bonds: | | | |
| 2.875% 5/15/52 | | 40,530,000 | 32,268,807 |
| 3.25% 5/15/42 (f) | | 9,912,000 | 8,696,231 |
| 3.625% 2/15/53 | | 8,841,000 | 8,164,111 |
| U.S. Treasury Notes: | | | |
| 3.625% 3/31/30 | | 4,389,000 | 4,320,936 |
| 3.75% 5/31/30 | | 3,633,000 | 3,600,786 |
| 4% 2/28/30 | | 2,772,000 | 2,785,102 |
| 4.625% 9/30/28 | | 4,578,000 | 4,725,354 |
| 4.625% 9/30/30 | | 2,898,000 | 3,020,939 |
TOTAL UNITED STATES OF AMERICA | | | 67,582,266 |
| Uruguay - 0.6% | | | |
| Uruguay Republic: | | | |
| 5.1% 6/18/50 | | 6,360,000 | 6,373,913 |
| 5.75% 10/28/34 | | 1,745,000 | 1,888,963 |
TOTAL URUGUAY | | | 8,262,876 |
| Uzbekistan - 0.4% | | | |
| Republic of Uzbekistan: | | | |
| 3.7% 11/25/30 (b) | | 1,595,000 | 1,338,803 |
| 3.9% 10/19/31 (b) | | 2,880,000 | 2,412,000 |
| 5.375% 2/20/29 (b) | | 1,145,000 | 1,084,888 |
TOTAL UZBEKISTAN | | | 4,835,691 |
| Venezuela - 0.7% | | | |
| Venezuelan Republic: | | | |
| 9.25% (d) | | 27,915,000 | 5,202,239 |
| 11.95% (Reg. S) (d) | | 17,015,000 | 3,186,067 |
| 12.75% (d) | | 3,625,000 | 582,666 |
TOTAL VENEZUELA | | | 8,970,972 |
| Vietnam - 0.6% | | | |
| Vietnamese Socialist Republic 5.5% 3/12/28 | | 7,812,167 | 7,469,603 |
| Zambia - 0.2% | | | |
| Republic of Zambia: | | | |
| 8.5% (b)(d) | | 585,000 | 362,700 |
| 8.97% (b)(d) | | 4,490,000 | 2,766,963 |
TOTAL ZAMBIA | | | 3,129,663 |
| TOTAL GOVERNMENT OBLIGATIONS (Cost $870,904,254) | | | 776,213,911 |
| | | | |
| Common Stocks - 0.0% |
| | | Shares | Value ($) |
| Kazakhstan - 0.0% | | | |
Nostrum Oil & Gas LP warrants (g)(h) (Cost $0) | | 266,460 | 3 |
| | | | |
| Preferred Securities - 1.3% |
| | | Principal Amount (a) | Value ($) |
| Kuwait - 0.1% | | | |
| NBK Tier 1 Financing 2 Ltd. 4.5% (b)(c)(i) | | 1,890,000 | 1,816,081 |
| Mexico - 0.8% | | | |
| Banco Mercantil del Norte SA: | | | |
| 6.75% (b)(c)(i) | | 1,970,000 | 1,943,222 |
| 7.625% (b)(c)(i) | | 3,300,000 | 3,232,466 |
| CEMEX S.A.B. de CV: | | | |
| 5.125% (b)(c)(i) | | 3,625,000 | 3,484,030 |
| 9.125% (b)(c)(i) | | 1,175,000 | 1,251,948 |
TOTAL MEXICO | | | 9,911,666 |
| Russia - 0.0% | | | |
| Tinkoff Credit Systems 6% (b)(c)(d)(h)(i) | | 1,625,000 | 81,250 |
| United Arab Emirates - 0.4% | | | |
| DP World Salaam 6% (Reg. S) (c)(i) | | 4,625,000 | 4,742,153 |
| TOTAL PREFERRED SECURITIES (Cost $18,842,280) | | | 16,551,150 |
| | | | |
| Money Market Funds - 4.2% |
| | | Shares | Value ($) |
Fidelity Cash Central Fund 5.40% (j) (Cost $54,493,561) | | 54,482,664 | 54,493,561 |
| | | | |
| TOTAL INVESTMENT IN SECURITIES - 98.2% (Cost $1,422,134,462) | 1,262,084,484 |
NET OTHER ASSETS (LIABILITIES) - 1.8% | 23,566,352 |
| NET ASSETS - 100.0% | 1,285,650,836 |
| | |
| Futures Contracts |
| | Number of contracts | Expiration Date | Notional Amount ($) | Value ($) | Unrealized Appreciation/ (Depreciation) ($) |
| Purchased | | | | | |
| | | | | | |
| Treasury Contracts | | | | | |
| CBOT 10-Year U.S. Treasury Note Contracts (United States) | 29 | Mar 2024 | 3,273,828 | 73,808 | 73,808 |
| | | | | | |
| The notional amount of futures purchased as a percentage of Net Assets is 0.3% |
Currency Abbreviations
| EUR | - | European Monetary Unit |
| TRY | - | Turkish Lira |
Legend
| (a) | Amount is stated in United States dollars unless otherwise noted. |
| (b) | Security exempt from registration under Rule 144A of the Securities Act of 1933. These securities may be resold in transactions exempt from registration, normally to qualified institutional buyers. At the end of the period, the value of these securities amounted to $800,459,686 or 62.3% of net assets. |
| (c) | Coupon rates for floating and adjustable rate securities reflect the rates in effect at period end. |
| (d) | Non-income producing - Security is in default. |
| (e) | Security initially issued at one coupon which converts to a higher coupon at a specified date. The rate shown is the rate at period end. |
| (f) | Security or a portion of the security was pledged to cover margin requirements for futures contracts. At period end, the value of securities pledged amounted to $74,908. |
| (i) | Security is perpetual in nature with no stated maturity date. |
| (j) | Affiliated fund that is generally available only to investment companies and other accounts managed by Fidelity Investments. The rate quoted is the annualized seven-day yield of the fund at period end. A complete unaudited listing of the fund's holdings as of its most recent quarter end is available upon request. In addition, each Fidelity Central Fund's financial statements, which are not covered by the Fund's Report of Independent Registered Public Accounting Firm, are available on the SEC's website or upon request. |
Affiliated Central Funds
Fiscal year to date information regarding the Fund's investments in Fidelity Central Funds, including the ownership percentage, is presented below.
| Affiliate | Value, beginning of period ($) | Purchases ($) | Sales Proceeds ($) | Dividend Income ($) | Realized Gain (loss) ($) | Change in Unrealized appreciation (depreciation) ($) | Value, end of period ($) | % ownership, end of period |
| Fidelity Cash Central Fund 5.40% | 14,215,744 | 366,272,604 | 325,994,787 | 1,410,730 | - | - | 54,493,561 | 0.1% |
| Total | 14,215,744 | 366,272,604 | 325,994,787 | 1,410,730 | - | - | 54,493,561 | |
| | | | | | | | | |
Amounts in the dividend income column in the above table include any capital gain distributions from underlying funds, which are presented in the corresponding line item in the Statement of Operations, if applicable.
Amounts included in the purchases and sales proceeds columns may include in-kind transactions, if applicable.
Investment Valuation
The following is a summary of the inputs used, as of December 31, 2023, involving the Fund's assets and liabilities carried at fair value. The inputs or methodology used for valuing securities may not be an indication of the risk associated with investing in those securities. For more information on valuation inputs, and their aggregation into the levels used below, please refer to the Investment Valuation section in the accompanying Notes to Financial Statements.
| Valuation Inputs at Reporting Date: |
| Description | Total ($) | Level 1 ($) | Level 2 ($) | Level 3 ($) |
Investments in Securities: | | | | |
|
| Equities: | | | | |
Energy | 3 | - | - | 3 |
|
| Corporate Bonds | 414,825,859 | - | 414,825,859 | - |
|
| Government Obligations | 776,213,911 | - | 776,213,911 | - |
|
| Preferred Securities | 16,551,150 | - | 16,469,900 | 81,250 |
|
| Money Market Funds | 54,493,561 | 54,493,561 | - | - |
| Total Investments in Securities: | 1,262,084,484 | 54,493,561 | 1,207,509,670 | 81,253 |
Derivative Instruments: Assets | | | | |
Futures Contracts | 73,808 | 73,808 | - | - |
| Total Assets | 73,808 | 73,808 | - | - |
| Total Derivative Instruments: | 73,808 | 73,808 | - | - |
Value of Derivative Instruments
The following table is a summary of the Fund's value of derivative instruments by primary risk exposure as of December 31, 2023. For additional information on derivative instruments, please refer to the Derivative Instruments section in the accompanying Notes to Financial Statements.
Primary Risk Exposure / Derivative Type | Value |
| Asset ($) | Liability ($) |
| Interest Rate Risk | | |
Futures Contracts (a) | 73,808 | 0 |
| Total Interest Rate Risk | 73,808 | 0 |
| Total Value of Derivatives | 73,808 | 0 |
(a)Reflects gross cumulative appreciation (depreciation) on futures contracts as presented in the Schedule of Investments. In the Statement of Assets and Liabilities, the period end daily variation margin is included in receivable or payable for daily variation margin on futures contracts, and the net cumulative appreciation (depreciation) is included in Total accumulated earnings (loss).
Fidelity® Series Emerging Markets Debt Fund
| Statement of Assets and Liabilities |
| | | | December 31, 2023 |
| | | | | |
| Assets | | | | |
| Investment in securities, at value - See accompanying schedule: | | | | |
Unaffiliated issuers (cost $1,367,640,901) | $ | 1,207,590,923 | | |
Fidelity Central Funds (cost $54,493,561) | | 54,493,561 | | |
| | | | | |
| | | | | |
| Total Investment in Securities (cost $1,422,134,462) | | | $ | 1,262,084,484 |
| Foreign currency held at value (cost $21) | | | | 21 |
| Receivable for investments sold | | | | 31,498 |
| Receivable for fund shares sold | | | | 306,462 |
| Interest receivable | | | | 26,578,438 |
| Distributions receivable from Fidelity Central Funds | | | | 229,184 |
| Receivable from investment adviser for expense reductions | | | | 188,692 |
| Other receivables | | | | 83 |
Total assets | | | | 1,289,418,862 |
| Liabilities | | | | |
| Payable for fund shares redeemed | $ | 3,766,380 | | |
| Other payables and accrued expenses | | 1,646 | | |
| Total Liabilities | | | | 3,768,026 |
| Net Assets | | | $ | 1,285,650,836 |
| Net Assets consist of: | | | | |
| Paid in capital | | | $ | 1,642,116,115 |
| Total accumulated earnings (loss) | | | | (356,465,279) |
| Net Assets | | | $ | 1,285,650,836 |
Net Asset Value, offering price and redemption price per share ($1,285,650,836 ÷ 165,945,135 shares) | | | $ | 7.75 |
| Statement of Operations |
| | | | Year ended December 31, 2023 |
| Investment Income | | | | |
| Dividends | | | $ | 1,071,902 |
| Interest | | | | 81,858,383 |
| Income from Fidelity Central Funds | | | | 1,410,730 |
| Income before foreign taxes withheld | | | $ | 84,341,015 |
| Less foreign taxes withheld | | | | (4,688) |
| Total Income | | | | 84,336,327 |
| Expenses | | | | |
| Custodian fees and expenses | $ | 4,541 | | |
| Independent trustees' fees and expenses | | 7,281 | | |
| Legal | | 271,460 | | |
| Total expenses before reductions | | 283,282 | | |
| Expense reductions | | (245,118) | | |
| Total expenses after reductions | | | | 38,164 |
| Net Investment income (loss) | | | | 84,298,163 |
| Realized and Unrealized Gain (Loss) | | | | |
| Net realized gain (loss) on: | | | | |
| Investment Securities: | | | | |
| Unaffiliated issuers | | (44,889,013) | | |
| Foreign currency transactions | | 8,078 | | |
| Total net realized gain (loss) | | | | (44,880,935) |
| Change in net unrealized appreciation (depreciation) on: | | | | |
| Investment Securities: | | | | |
| Unaffiliated issuers | | 103,605,522 | | |
| Assets and liabilities in foreign currencies | | (3,243) | | |
| Futures contracts | | 73,808 | | |
| Total change in net unrealized appreciation (depreciation) | | | | 103,676,087 |
| Net gain (loss) | | | | 58,795,152 |
| Net increase (decrease) in net assets resulting from operations | | | $ | 143,093,315 |
| Statement of Changes in Net Assets |
| |
| | Year ended December 31, 2023 | | Year ended December 31, 2022 |
| Increase (Decrease) in Net Assets | | | | |
| Operations | | | | |
| Net investment income (loss) | $ | 84,298,163 | $ | 74,504,061 |
| Net realized gain (loss) | | (44,880,935) | | (93,556,949) |
| Change in net unrealized appreciation (depreciation) | | 103,676,087 | | (187,642,052) |
| Net increase (decrease) in net assets resulting from operations | | 143,093,315 | | (206,694,940) |
| Distributions to shareholders | | (75,296,697) | | (66,732,572) |
| | | | | |
| Share transactions | | | | |
| Proceeds from sales of shares | | 124,923,949 | | 118,610,757 |
| Reinvestment of distributions | | 75,296,578 | | 66,626,169 |
| Cost of shares redeemed | | (143,233,600) | | (193,506,975) |
| | | | | |
Net increase (decrease) in net assets resulting from share transactions | | 56,986,927 | | (8,270,049) |
| Total increase (decrease) in net assets | | 124,783,545 | | (281,697,561) |
| | | | | |
| Net Assets | | | | |
| Beginning of period | | 1,160,867,291 | | 1,442,564,852 |
| End of period | $ | 1,285,650,836 | $ | 1,160,867,291 |
| | | | | |
| Other Information | | | | |
| Shares | | | | |
| Sold | | 16,964,106 | | 15,614,535 |
| Issued in reinvestment of distributions | | 10,202,779 | | 8,801,859 |
| Redeemed | | (19,447,972) | | (25,220,427) |
| Net increase (decrease) | | 7,718,913 | | (804,033) |
| | | | | |
Financial Highlights
| Fidelity® Series Emerging Markets Debt Fund |
| |
| Years ended December 31, | | 2023 | | 2022 | | 2021 | | 2020 | | 2019 |
Selected Per-Share Data | | | | | | | | | | |
| Net asset value, beginning of period | $ | 7.34 | $ | 9.07 | $ | 9.54 | $ | 9.60 | $ | 9.22 |
| Income from Investment Operations | | | | | | | | | | |
Net investment income (loss) A,B | | .524 | | .470 | | .456 | | .519 | | .604 |
| Net realized and unrealized gain (loss) | | .353 C | | (1.779) | | (.515) | | (.103) | | .341 |
| Total from investment operations | | .877 | | (1.309) | | (.059) | | .416 | | .945 |
| Distributions from net investment income | | (.467) | | (.421) | | (.411) | | (.476) | | (.565) |
| Total distributions | | (.467) | | (.421) | | (.411) | | (.476) | | (.565) |
| Net asset value, end of period | $ | 7.75 | $ | 7.34 | $ | 9.07 | $ | 9.54 | $ | 9.60 |
Total Return D | | 12.47% | | (14.45)% | | (.60)% | | 4.75% | | 10.46% |
Ratios to Average Net Assets B,E,F | | | | | | | | | | |
| Expenses before reductions | | .02% | | -% G | | -% G | | -% G | | -% G |
Expenses net of fee waivers, if any G | | -% | | -% | | -% | | -% | | -% |
Expenses net of all reductions G | | -% | | -% | | -% | | -% | | -% |
| Net investment income (loss) | | 7.12% | | 6.12% | | 4.93% | | 5.73% | | 6.35% |
| Supplemental Data | | | | | | | | | | |
| Net assets, end of period (000 omitted) | $ | 1,285,651 | $ | 1,160,867 | $ | 1,442,565 | $ | 1,456,242 | $ | 1,463,941 |
Portfolio turnover rate H | | 22% | | 27% | | 29% | | 84% | | 61% I |
ACalculated based on average shares outstanding during the period.
BNet investment income (loss) is affected by the timing of the declaration of dividends by any underlying mutual funds or exchange-traded funds (ETFs). Net investment income (loss) of any mutual funds or ETFs is not included in the Fund's net investment income (loss) ratio.
CThe amount shown for a share outstanding does not correspond with the aggregate net gain (loss) on investments for the period due to the timing of sales and repurchases of shares in relation to fluctuating market values of the investments of the Fund.
DTotal returns would have been lower if certain expenses had not been reduced during the applicable periods shown.
EFees and expenses of any underlying mutual funds or exchange-traded funds (ETFs) are not included in the Fund's expense ratio. The Fund indirectly bears its proportionate share of these expenses. For additional expense information related to investments in Fidelity Central Funds, please refer to the "Investments in Fidelity Central Funds" note found in the Notes to Financial Statements section of the most recent Annual or Semi-Annual report.
FExpense ratios reflect operating expenses of the class. Expenses before reductions do not reflect amounts reimbursed, waived, or reduced through arrangements with the investment adviser, brokerage services, or other offset arrangements, if applicable, and do not represent the amount paid by the class during periods when reimbursements, waivers or reductions occur.
GAmount represents less than .005%.
HAmount does not include the portfolio activity of any underlying mutual funds or exchange-traded funds (ETFs).
IPortfolio turnover rate excludes securities received or delivered in-kind.
Average annual total return reflects the change in the value of an investment, assuming reinvestment of distributions from dividend income and capital gains (the profits earned upon the sale of securities that have grown in value, if any) and assuming a constant rate of performance each year. The hypothetical investment and the average annual total returns do not reflect the deduction of taxes that a shareholder would pay on fund distributions or the redemption of fund shares. During periods of reimbursement by Fidelity, a fund's total return will be greater than it would be had the reimbursement not occurred. How a fund did yesterday is no guarantee of how it will do tomorrow.
| Average Annual Total Returns |
| | | | |
Periods ended December 31, 2023 | Past 1 year | Life of Fund A |
| Fidelity® Series Emerging Markets Debt Local Currency Fund | 13.53% | 1.25% |
A From October 30, 2020
| $10,000 Over Life of Fund |
| |
Let's say hypothetically that $10,000 was invested in Fidelity® Series Emerging Markets Debt Local Currency Fund, on October 30, 2020, when the fund started. The chart shows how the value of your investment would have changed, and also shows how the J.P. Morgan GBI-EM Global Diversified Index performed over the same period. |
|
|
Fidelity® Series Emerging Markets Debt Local Currency Fund
Market Recap:
Emerging-markets debt gained 11.09% in 2023, according to the J.P. Morgan Emerging Markets Bond Index Global Diversified Index. After returning -17.78% in 2022, the index's sharp reversal was driven by global disinflationary trends and expectations that the U.S. Federal Reserve and other central banks around the world would slow or reverse their hiking of interest rates. Notably, the J.P. Morgan index rose 10.66% in the final two months of 2023, capping the year with a powerful rally amid falling U.S. Treasury yields. In December, the Fed projected a shift to monetary easing in 2024. This news, along with resilient late-cycle expansion of the U.S. economy, provided a favorable backdrop for higher-risk assets and spurred global stock and bond markets. A drop in commodity prices in 2023, including a decline in oil and energy prices, led to reduced inflationary pressure in emerging markets. As inflation fell below or closer to target rates, some emerging-markets' central banks began to cut interest rates. Against this backdrop, the higher-yield component of the index outpaced the investment-grade portion for the year. Among the index's country constituents, El Salvador (+117%), Pakistan (+100%) and Sri Lanka (+71%) stood out. Each is a small, distressed index component that was driven by idiosyncratic catalysts. In sharp contrast, Bolivia (-34%) faced the negative impact of dwindling gold reserves, while Ecuador (-18%) was rattled by political risk.
Comments from Lead Manager Constantin Petrov:
In 2023, the fund gained 13.53%, outperforming the 12.70% gain of the benchmark, the J.P. Morgan GBI-EM Global Diversified Index. The EM debt local-currency market was supported this year by receding inflation, monetary easing in some EM countries and U.S.-dollar depreciation. Against this backdrop, the fund's local-currency debt holdings provided outsized returns, while an underweighting in U.S.-dollar-denominated sovereign bonds also contributed from an asset-class perspective. This relative advantage was somewhat offset by our exposure to currency forwards. At the country level, market selection was strongly additive. Market selection was another significant contributor to the fund's relative result, with security selection also helping for the year. Specifically, it helped most to underweight Thailand, where local bonds were partly held back by the central bank's interest rate hiking cycle. Egypt and Turkey were the worst-performing markets in the EM debt local-currency index in 2023, so it helped to be underexposed to these markets versus the benchmark. Egypt faced ongoing liquidity and political concerns, while Turkey was hampered by soaring inflation. An underweight in Malaysia was another plus. Conversely, the negative of our underweight in strong-performing Poland more than offset the positive of security selection in this market. Positioning in Mexico also weighed on the fund's relative return in 2023.
The views expressed above reflect those of the portfolio manager(s) only through the end of the period as stated on the cover of this report and do not necessarily represent the views of Fidelity or any other person in the Fidelity organization. Any such views are subject to change at any time based upon market or other conditions and Fidelity disclaims any responsibility to update such views. These views may not be relied on as investment advice and, because investment decisions for a Fidelity fund are based on numerous factors, may not be relied on as an indication of trading intent on behalf of any Fidelity fund.
Fidelity® Series Emerging Markets Debt Local Currency Fund
| Top Bond Issuers (% of Fund's net assets) |
(with maturities greater than one year) |
| United Mexican States | 10.3 | |
| Malaysian Government | 8.8 | |
| South African Republic | 8.2 | |
| Indonesian Republic | 8.1 | |
| Brazilian Federative Republic | 5.8 | |
| Kingdom of Thailand | 4.9 | |
| Czech Republic | 4.9 | |
| Romanian Republic | 4.8 | |
| Colombian Republic | 4.7 | |
| Polish Government | 4.7 | |
| | 65.2 | |
| |
Quality Diversification (% of Fund's net assets) |
|
| |
| We have used ratings from Moody's Investors Service, Inc. Where Moody's® ratings are not available, we have used S&P® ratings. All ratings are as of the date indicated and do not reflect subsequent changes. |
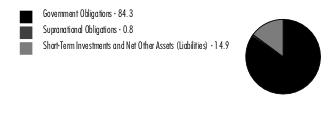
Asset Allocation (% of Fund's net assets) |
|
Forward foreign currency contracts - (28.1)% |
|
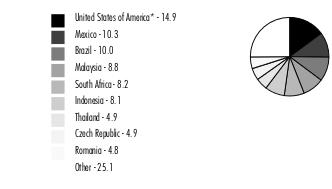
Geographic Diversification (% of Fund's net assets) |
|
* Includes Short-Term investments and Net Other Assets (Liabilities). Percentages are adjusted for the effect of derivatives, if applicable. |
| |
Forward foreign currency contracts and other assets and liabilities are included within United States of America, as applicable.
Fidelity® Series Emerging Markets Debt Local Currency Fund
Showing Percentage of Net Assets
| U.S. Government and Government Agency Obligations - 0.5% |
| | | Principal Amount (a) | Value ($) |
| U.S. Treasury Obligations - 0.5% | | | |
U.S. Treasury Bills, yield at date of purchase 5.32% 5/16/24 (Cost $1,960,862) | | 2,000,000 | 1,961,653 |
| | | | |
| Foreign Government and Government Agency Obligations - 84.3% |
| | | Principal Amount (a) | Value ($) |
| Brazil - 10.0% | | | |
| Brazil Letras Do Tesouro Nacio, yield at date of purchase 9.9654% to 13.1648% 7/1/24 to 7/1/26 | BRL | 102,270,000 | 17,750,309 |
| Brazilian Federative Republic: | | | |
| 10% 1/1/25 | BRL | 28,750,000 | 5,921,913 |
| 10% 1/1/27 | BRL | 38,000,000 | 7,856,169 |
| 10% 1/1/29 | BRL | 22,250,000 | 4,564,239 |
| 10% 1/1/31 | BRL | 12,000,000 | 2,439,673 |
| 10% 1/1/33 | BRL | 18,050,000 | 3,643,842 |
TOTAL BRAZIL | | | 42,176,145 |
| Chile - 2.1% | | | |
| Chilean Republic: | | | |
| 4.5% 3/1/26 | CLP | 1,025,000,000 | 1,141,714 |
| 4.7% 9/1/30 (Reg. S) (b) | CLP | 1,950,000,000 | 2,128,468 |
| 5% 3/1/35 | CLP | 1,800,000,000 | 2,001,318 |
| 6% 4/1/33(Reg. S) (b) | CLP | 1,500,000,000 | 1,779,548 |
| 6% 1/1/43 | CLP | 1,275,000,000 | 1,566,977 |
TOTAL CHILE | | | 8,618,025 |
| China - 4.5% | | | |
| Peoples Republic of China: | | | |
| 2.68% 5/21/30 | CNY | 48,750,000 | 6,914,758 |
| 2.88% 2/25/33 | CNY | 28,000,000 | 4,035,384 |
| 2.91% 10/14/28 | CNY | 13,000,000 | 1,872,386 |
| 3.12% 10/25/52 | CNY | 15,000,000 | 2,195,641 |
| 3.81% 9/14/50 | CNY | 23,250,000 | 3,813,017 |
TOTAL CHINA | | | 18,831,186 |
| Colombia - 4.7% | | | |
| Colombian Republic: | | | |
| 5.75% 11/3/27 | COP | 31,100,000,000 | 7,100,330 |
| 6% 4/28/28 | COP | 1,850,000,000 | 420,315 |
| 7% 6/30/32 | COP | 26,300,000,000 | 5,676,569 |
| 7.25% 10/18/34 | COP | 11,500,000,000 | 2,438,024 |
| 7.25% 10/26/50 | COP | 8,500,000,000 | 1,592,157 |
| 7.5% 8/26/26 | COP | 5,075,000,000 | 1,251,038 |
| 9.25% 5/28/42 | COP | 5,400,000,000 | 1,269,328 |
TOTAL COLOMBIA | | | 19,747,761 |
| Czech Republic - 4.9% | | | |
| Czech Republic: | | | |
| 0.95% 5/15/30 (Reg. S) | CZK | 175,750,000 | 6,630,228 |
| 1.2% 3/13/31 | CZK | 89,370,000 | 3,358,246 |
| 1.5% 4/24/40 | CZK | 40,000,000 | 1,274,312 |
| 1.95% 7/30/37 | CZK | 38,500,000 | 1,377,263 |
| 2% 10/13/33 | CZK | 181,000,000 | 6,925,003 |
| 5.7% 5/25/24 | CZK | 17,750,000 | 796,148 |
TOTAL CZECH REPUBLIC | | | 20,361,200 |
| Dominican Republic - 0.3% | | | |
| Dominican Republic: | | | |
| 9.75% 6/5/26 (Reg. S) | DOP | 26,500,000 | 454,580 |
| 13.625% 2/3/33 (b) | DOP | 38,500,000 | 799,775 |
TOTAL DOMINICAN REPUBLIC | | | 1,254,355 |
| Egypt - 0.3% | | | |
| Arab Republic of Egypt: | | | |
| 14.556% 10/13/27 | EGP | 36,000,000 | 899,144 |
| 16.1% 5/7/29 | EGP | 12,000,000 | 293,244 |
TOTAL EGYPT | | | 1,192,388 |
| Hungary - 3.5% | | | |
| Hungarian Republic: | | | |
| 2.25% 4/20/33 | HUF | 505,000,000 | 1,100,301 |
| 2.25% 6/22/34 | HUF | 470,000,000 | 984,984 |
| 2.75% 12/22/26 | HUF | 1,144,000,000 | 2,998,094 |
| 3% 6/26/24 | HUF | 750,000,000 | 2,121,970 |
| 3.25% 10/22/31 | HUF | 617,000,000 | 1,509,448 |
| 5.5% 6/24/25 | HUF | 400,000,000 | 1,138,924 |
| 6.75% 10/22/28 | HUF | 1,653,000,000 | 4,941,559 |
TOTAL HUNGARY | | | 14,795,280 |
| Indonesia - 8.1% | | | |
| Indonesian Republic: | | | |
| 5.125% 4/15/27 | IDR | 15,000,000,000 | 940,605 |
| 6.375% 4/15/32 | IDR | 66,000,000,000 | 4,241,541 |
| 6.5% 2/15/31 | IDR | 48,500,000,000 | 3,143,349 |
| 7.125% 6/15/38 | IDR | 18,000,000,000 | 1,222,836 |
| 7.125% 6/15/42 | IDR | 31,500,000,000 | 2,127,306 |
| 7.125% 6/15/43 | IDR | 20,000,000,000 | 1,348,964 |
| 7.5% 4/15/40 | IDR | 41,750,000,000 | 2,898,789 |
| 8.25% 5/15/29 | IDR | 123,500,000,000 | 8,662,727 |
| 8.25% 5/15/36 | IDR | 44,750,000,000 | 3,291,510 |
| 8.375% 9/15/26 | IDR | 66,750,000,000 | 4,547,688 |
| 8.375% 3/15/34 | IDR | 19,788,000,000 | 1,451,617 |
TOTAL INDONESIA | | | 33,876,932 |
| Kazakhstan - 0.2% | | | |
| Kazakhstan Republic 10.5% 8/4/26 | KZT | 440,000,000 | 896,043 |
| Malaysia - 8.8% | | | |
| Malaysian Government: | | | |
| 3.519% 4/20/28 | MYR | 40,750,000 | 8,835,877 |
| 3.582% 7/15/32 | MYR | 15,750,000 | 3,372,351 |
| 3.757% 5/22/40 | MYR | 5,000,000 | 1,041,763 |
| 3.828% 7/5/34 | MYR | 14,300,000 | 3,097,358 |
| 3.882% 3/14/25 | MYR | 19,000,000 | 4,157,961 |
| 3.885% 8/15/29 | MYR | 13,000,000 | 2,858,727 |
| 3.906% 7/15/26 | MYR | 23,500,000 | 5,170,358 |
| 4.065% 6/15/50 | MYR | 9,750,000 | 2,033,665 |
| 4.457% 3/31/53 | MYR | 4,500,000 | 1,014,072 |
| 4.642% 11/7/33 | MYR | 4,250,000 | 990,643 |
| 4.696% 10/15/42 | MYR | 6,450,000 | 1,512,009 |
| 4.762% 4/7/37 | MYR | 13,000,000 | 3,047,687 |
TOTAL MALAYSIA | | | 37,132,471 |
| Mexico - 10.3% | | | |
| United Mexican States: | | | |
| 5.75% 3/5/26 | MXN | 275,000,000 | 14,932,081 |
| 7.75% 11/23/34 | MXN | 91,000,000 | 4,902,350 |
| 7.75% 11/13/42 | MXN | 111,000,000 | 5,764,110 |
| 8% 9/5/24 | MXN | 49,500,000 | 2,860,658 |
| 8% 7/31/53 | MXN | 55,250,000 | 2,896,192 |
| 8.5% 5/31/29 | MXN | 205,250,000 | 11,843,847 |
TOTAL MEXICO | | | 43,199,238 |
| Peru - 2.3% | | | |
| Peruvian Republic: | | | |
| 5.35% 8/12/40 | PEN | 2,250,000 | 518,990 |
| 5.4% 8/12/34(Reg. S) | PEN | 4,850,000 | 1,181,416 |
| 5.94% 2/12/29 | PEN | 5,250,000 | 1,416,411 |
| 6.35% 8/12/28 | PEN | 9,900,000 | 2,734,001 |
| 6.9% 8/12/37 | PEN | 2,500,000 | 678,074 |
| 6.95% 8/12/31 | PEN | 11,500,000 | 3,206,953 |
TOTAL PERU | | | 9,735,845 |
| Philippines - 0.1% | | | |
| Philippine Republic 6.25% 1/14/36 | PHP | 30,000,000 | 506,964 |
| Poland - 4.7% | | | |
| Polish Government: | | | |
| 1.25% 10/25/30 | PLN | 10,700,000 | 2,152,971 |
| 1.75% 4/25/32 | PLN | 20,750,000 | 4,102,116 |
| 2.5% 7/25/26 | PLN | 4,250,000 | 1,017,365 |
| 2.5% 7/25/27 | PLN | 17,500,000 | 4,107,002 |
| 2.75% 4/25/28 | PLN | 14,000,000 | 3,261,834 |
| 2.75% 10/25/29 | PLN | 7,000,000 | 1,589,092 |
| 6% 10/25/33 | PLN | 12,500,000 | 3,366,764 |
TOTAL POLAND | | | 19,597,144 |
| Romania - 4.8% | | | |
| Romanian Republic: | | | |
| 3.65% 9/24/31 | RON | 24,250,000 | 4,526,659 |
| 4.25% 4/28/36 | RON | 2,500,000 | 459,836 |
| 4.75% 2/24/25 | RON | 21,050,000 | 4,607,090 |
| 4.75% 10/11/34 | RON | 7,750,000 | 1,516,753 |
| 5% 2/12/29 | RON | 30,950,000 | 6,506,238 |
| 5.8% 7/26/27 | RON | 7,500,000 | 1,644,877 |
| 6.7% 2/25/32 | RON | 3,750,000 | 852,482 |
TOTAL ROMANIA | | | 20,113,935 |
| South Africa - 8.2% | | | |
| South African Republic: | | | |
| 6.25% 3/31/36 | ZAR | 93,000,000 | 3,337,940 |
| 7% 2/28/31 | ZAR | 94,750,000 | 4,337,712 |
| 8% 1/31/30 | ZAR | 259,000,000 | 13,025,795 |
| 8.25% 3/31/32 | ZAR | 17,750,000 | 847,302 |
| 8.75% 2/28/48 | ZAR | 145,250,000 | 5,845,013 |
| 8.875% 2/28/35 | ZAR | 155,500,000 | 7,172,149 |
TOTAL SOUTH AFRICA | | | 34,565,911 |
| Thailand - 4.9% | | | |
| Kingdom of Thailand: | | | |
| 1.585% 12/17/35 | THB | 122,750,000 | 3,170,129 |
| 1.6% 6/17/35 | THB | 180,750,000 | 4,698,442 |
| 2% 12/17/31 | THB | 31,250,000 | 870,922 |
| 2% 6/17/42 | THB | 85,000,000 | 2,093,201 |
| 2.875% 6/17/46 | THB | 44,400,000 | 1,185,178 |
| 3.3% 6/17/38 | THB | 217,750,000 | 6,568,882 |
| 3.775% 6/25/32 | THB | 64,000,000 | 2,031,838 |
TOTAL THAILAND | | | 20,618,592 |
| Turkey - 0.9% | | | |
| Turkish Republic: | | | |
| 10.5% 8/11/27 | TRY | 27,000,000 | 617,994 |
| 10.6% 2/11/26 | TRY | 26,000,000 | 606,575 |
| 12.6% 10/1/25 | TRY | 19,500,000 | 468,496 |
| 17.3% 7/19/28 | TRY | 35,500,000 | 970,358 |
| 17.8% 7/13/33 | TRY | 25,000,000 | 661,718 |
| 26.2% 10/5/33 | TRY | 17,500,000 | 614,040 |
TOTAL TURKEY | | | 3,939,181 |
| Uruguay - 0.7% | | | |
| Uruguay Republic: | | | |
| 8.25% 5/21/31 | UYU | 31,500,000 | 750,458 |
| 8.5% 3/15/28 (Reg. S) | UYU | 49,025,000 | 1,206,757 |
| 9.75% 7/20/33 | UYU | 34,298,120 | 889,309 |
TOTAL URUGUAY | | | 2,846,524 |
| TOTAL FOREIGN GOVERNMENT AND GOVERNMENT AGENCY OBLIGATIONS (Cost $350,064,591) | | | 354,005,120 |
| | | | |
| Supranational Obligations - 0.8% |
| | | Principal Amount (a) | Value ($) |
| Asian Infrastructure Investment Bank 2.375% 2/10/25 (Reg. S) | PHP | 57,900,000 | 1,006,326 |
| Inter-American Development Bank: | | | |
| 5.1% 11/17/26 | IDR | 15,000,000,000 | 958,074 |
| 5.7% 11/12/24 | INR | 105,000,000 | 1,245,842 |
| TOTAL SUPRANATIONAL OBLIGATIONS (Cost $3,654,451) | | | 3,210,242 |
| | | | |
| Money Market Funds - 12.2% |
| | | Shares | Value ($) |
Fidelity Cash Central Fund 5.40% (c) (Cost $51,362,343) | | 51,352,073 | 51,362,343 |
| | | | |
| TOTAL INVESTMENT IN SECURITIES - 97.8% (Cost $407,042,247) | 410,539,358 |
NET OTHER ASSETS (LIABILITIES) - 2.2% | 9,318,758 |
| NET ASSETS - 100.0% | 419,858,116 |
| | |
| Forward Foreign Currency Contracts |
Currency Purchased
| Currency Sold | Counterparty | Settlement Date | Unrealized Appreciation/ (Depreciation) ($) |
| | | | | | | |
| USD | 91,179 | HUF | 31,460,000 | State Street Bank and Trust Co | 1/02/24 | 493 |
| BRL | 5,832,000 | USD | 1,171,527 | BNP Paribas S.A. | 2/29/24 | 22,346 |
| BRL | 3,597,000 | USD | 738,604 | State Street Bank and Trust Co | 2/29/24 | (2,259) |
| BRL | 5,391,000 | USD | 1,102,003 | State Street Bank and Trust Co | 2/29/24 | 1,592 |
| CLP | 1,244,886,000 | USD | 1,425,905 | State Street Bank and Trust Co | 2/29/24 | (17,646) |
| CNY | 5,419,000 | USD | 766,424 | Bank of America, N.A. | 2/29/24 | 1,192 |
| CNY | 136,425,000 | USD | 19,305,880 | Goldman Sachs Bank USA | 2/29/24 | 19,086 |
| CZK | 9,171,000 | USD | 405,443 | Bank of America, N.A. | 2/29/24 | 3,962 |
| CZK | 19,652,000 | USD | 870,764 | Goldman Sachs Bank USA | 2/29/24 | 6,527 |
| EGP | 25,000,000 | USD | 647,668 | Citibank, N. A. | 2/29/24 | (58,900) |
| EUR | 960,000 | USD | 1,035,194 | Canadian Imperial Bk. of Comm. | 2/29/24 | 27,030 |
| EUR | 955,000 | USD | 1,053,623 | Canadian Imperial Bk. of Comm. | 2/29/24 | 3,069 |
| EUR | 3,792,000 | USD | 4,106,016 | Goldman Sachs Bank USA | 2/29/24 | 89,770 |
| HUF | 806,169,000 | USD | 2,272,850 | BNP Paribas S.A. | 2/29/24 | 34,792 |
| HUF | 272,797,000 | USD | 774,088 | JPMorgan Chase Bank, N.A. | 2/29/24 | 6,787 |
| IDR | 18,213,800,000 | USD | 1,179,650 | Bank of America, N.A. | 2/29/24 | 2,516 |
| IDR | 81,709,200,000 | USD | 5,266,804 | State Street Bank and Trust Co | 2/29/24 | 36,531 |
| INR | 414,774,000 | USD | 4,963,787 | BNP Paribas S.A. | 2/29/24 | 10,642 |
| KRW | 1,334,300,000 | USD | 1,018,705 | BNP Paribas S.A. | 2/29/24 | 15,248 |
| KRW | 2,676,900,000 | USD | 2,046,247 | Bank of America, N.A. | 2/29/24 | 28,091 |
| KRW | 1,355,700,000 | USD | 1,035,123 | Goldman Sachs Bank USA | 2/29/24 | 15,413 |
| MXN | 17,515,000 | USD | 998,241 | Canadian Imperial Bk. of Comm. | 2/29/24 | 23,557 |
| MXN | 14,716,000 | USD | 840,207 | JPMorgan Chase Bank, N.A. | 2/29/24 | 18,302 |
| MYR | 9,184,000 | USD | 1,983,328 | Goldman Sachs Bank USA | 2/29/24 | 23,080 |
| PEN | 3,183,000 | USD | 848,415 | State Street Bank and Trust Co | 2/29/24 | 10,463 |
| PHP | 72,086,000 | USD | 1,304,252 | Bank of America, N.A. | 2/29/24 | (2,720) |
| PLN | 30,896,000 | USD | 7,684,978 | Goldman Sachs Bank USA | 2/29/24 | 161,291 |
| PLN | 2,418,000 | USD | 615,667 | Goldman Sachs Bank USA | 2/29/24 | (1,598) |
| PLN | 4,905,000 | USD | 1,223,961 | HSBC Bank | 2/29/24 | 21,700 |
| RON | 9,202,000 | USD | 2,002,500 | BNP Paribas S.A. | 2/29/24 | 37,962 |
| RON | 2,857,000 | USD | 620,109 | JPMorgan Chase Bank, N.A. | 2/29/24 | 13,405 |
| THB | 536,884,000 | USD | 15,330,782 | JPMorgan Chase Bank, N.A. | 2/29/24 | 461,213 |
| THB | 42,811,000 | USD | 1,224,921 | JPMorgan Chase Bank, N.A. | 2/29/24 | 34,329 |
| TRY | 33,303,000 | USD | 1,077,854 | Bank of America, N.A. | 2/29/24 | (7,029) |
| TRY | 152,749,000 | USD | 4,936,945 | JPMorgan Chase Bank, N.A. | 2/29/24 | (25,451) |
| USD | 2,260,560 | BRL | 11,223,000 | State Street Bank and Trust Co | 2/29/24 | (36,909) |
| USD | 1,089,746 | CLP | 942,194,000 | State Street Bank and Trust Co | 2/29/24 | 23,903 |
| USD | 1,000,299 | COP | 4,008,200,000 | Citibank, N. A. | 2/29/24 | (22,140) |
| USD | 1,261,480 | COP | 4,945,000,000 | State Street Bank and Trust Co | 2/29/24 | 74 |
| USD | 330,982 | COP | 1,346,800,000 | State Street Bank and Trust Co | 2/29/24 | (12,569) |
| USD | 1,058,175 | CZK | 24,102,000 | Citibank, N. A. | 2/29/24 | (17,770) |
| USD | 6,199,297 | EUR | 5,707,000 | State Street Bank and Trust Co | 2/29/24 | (115,404) |
| USD | 1,982,272 | HUF | 707,255,000 | Goldman Sachs Bank USA | 2/29/24 | (42,230) |
| USD | 1,034,231 | HUF | 371,711,000 | Goldman Sachs Bank USA | 2/29/24 | (29,784) |
| USD | 2,053,782 | KRW | 2,676,900,000 | State Street Bank and Trust Co | 2/29/24 | (20,555) |
| USD | 2,074,977 | KRW | 2,690,000,000 | State Street Bank and Trust Co | 2/29/24 | (9,512) |
| USD | 1,157,197 | MXN | 20,249,000 | JPMorgan Chase Bank, N.A. | 2/29/24 | (24,098) |
| USD | 835,191 | MXN | 14,716,000 | Royal Bank of Canada | 2/29/24 | (23,318) |
| USD | 840,507 | PEN | 3,183,000 | Bank of America, N.A. | 2/29/24 | (18,372) |
| USD | 1,302,320 | PHP | 72,086,000 | BNP Paribas S.A. | 2/29/24 | 788 |
| USD | 1,190,962 | THB | 40,850,000 | JPMorgan Chase Bank, N.A. | 2/29/24 | (10,607) |
| USD | 1,125,950 | TRY | 35,101,000 | Goldman Sachs Bank USA | 2/29/24 | (2,688) |
| USD | 1,379,108 | ZAR | 25,403,000 | State Street Bank and Trust Co | 2/29/24 | (2,701) |
| ZAR | 25,403,000 | USD | 1,338,615 | Goldman Sachs Bank USA | 2/29/24 | 43,194 |
| | | | | | | |
| TOTAL FORWARD FOREIGN CURRENCY CONTRACTS | | 694,088 |
| Unrealized Appreciation | | | 1,198,348 |
| Unrealized Depreciation | | | (504,260) |
For the period, the average contract value for forward foreign currency contracts was $200,818,966. Contract value represents contract amount in United States dollars plus or minus unrealized appreciation or depreciation, respectively.
Currency Abbreviations
| BRL | - | Brazilian real |
| CLP | - | Chilean peso |
| CNY | - | Chinese yuan |
| COP | - | Colombian peso |
| CZK | - | Czech koruna |
| DOP | - | Dominican Republic peso |
| EGP | - | Egyptian pound |
| EUR | - | European Monetary Unit |
| HUF | - | Hungarian forint |
| IDR | - | Indonesian rupiah |
| INR | - | Indian rupee |
| KRW | - | Korean won |
| KZT | - | Kazakhstan tenge |
| MXN | - | Mexican peso |
| MYR | - | Malaysian ringgit |
| PEN | - | Peruvian new sol |
| PHP | - | Philippine peso |
| PLN | - | Polish zloty |
| RON | - | Romanian leu (new) |
| THB | - | Thai baht |
| TRY | - | Turkish Lira |
| USD | - | U.S. dollar |
| UYU | - | Uruguay peso |
| ZAR | - | South African rand |
Legend
| (a) | Amount is stated in United States dollars unless otherwise noted. |
| (b) | Security exempt from registration under Rule 144A of the Securities Act of 1933. These securities may be resold in transactions exempt from registration, normally to qualified institutional buyers. At the end of the period, the value of these securities amounted to $4,707,791 or 1.1% of net assets. |
| (c) | Affiliated fund that is generally available only to investment companies and other accounts managed by Fidelity Investments. The rate quoted is the annualized seven-day yield of the fund at period end. A complete unaudited listing of the fund's holdings as of its most recent quarter end is available upon request. In addition, each Fidelity Central Fund's financial statements, which are not covered by the Fund's Report of Independent Registered Public Accounting Firm, are available on the SEC's website or upon request. |
Affiliated Central Funds
Fiscal year to date information regarding the Fund's investments in Fidelity Central Funds, including the ownership percentage, is presented below.
| Affiliate | Value, beginning of period ($) | Purchases ($) | Sales Proceeds ($) | Dividend Income ($) | Realized Gain (loss) ($) | Change in Unrealized appreciation (depreciation) ($) | Value, end of period ($) | % ownership, end of period |
| Fidelity Cash Central Fund 5.40% | 52,392,505 | 223,193,175 | 224,223,337 | 2,349,680 | - | - | 51,362,343 | 0.1% |
| Total | 52,392,505 | 223,193,175 | 224,223,337 | 2,349,680 | - | - | 51,362,343 | |
| | | | | | | | | |
Amounts in the dividend income column in the above table include any capital gain distributions from underlying funds, which are presented in the corresponding line item in the Statement of Operations, if applicable.
Amounts included in the purchases and sales proceeds columns may include in-kind transactions, if applicable.
Investment Valuation
The following is a summary of the inputs used, as of December 31, 2023, involving the Fund's assets and liabilities carried at fair value. The inputs or methodology used for valuing securities may not be an indication of the risk associated with investing in those securities. For more information on valuation inputs, and their aggregation into the levels used below, please refer to the Investment Valuation section in the accompanying Notes to Financial Statements.
| Valuation Inputs at Reporting Date: |
| Description | Total ($) | Level 1 ($) | Level 2 ($) | Level 3 ($) |
Investments in Securities: | | | | |
|
| U.S. Government and Government Agency Obligations | 1,961,653 | - | 1,961,653 | - |
|
| Foreign Government and Government Agency Obligations | 354,005,120 | - | 354,005,120 | - |
|
| Supranational Obligations | 3,210,242 | - | 3,210,242 | - |
|
| Money Market Funds | 51,362,343 | 51,362,343 | - | - |
| Total Investments in Securities: | 410,539,358 | 51,362,343 | 359,177,015 | - |
Derivative Instruments: Assets | | | | |
Forward Foreign Currency Contracts | 1,198,348 | - | 1,198,348 | - |
| Total Assets | 1,198,348 | - | 1,198,348 | - |
| Liabilities | | | | |
Forward Foreign Currency Contracts | (504,260) | - | (504,260) | - |
| Total Liabilities | (504,260) | - | (504,260) | - |
| Total Derivative Instruments: | 694,088 | - | 694,088 | - |
Value of Derivative Instruments
The following table is a summary of the Fund's value of derivative instruments by primary risk exposure as of December 31, 2023. For additional information on derivative instruments, please refer to the Derivative Instruments section in the accompanying Notes to Financial Statements.
Primary Risk Exposure / Derivative Type | Value |
| Asset ($) | Liability ($) |
| Foreign Exchange Risk | | |
Forward Foreign Currency Contracts (a) | 1,198,348 | (504,260) |
| Total Foreign Exchange Risk | 1,198,348 | (504,260) |
| Total Value of Derivatives | 1,198,348 | (504,260) |
(a)Gross value is presented in the Statement of Assets and Liabilities in the unrealized appreciation/depreciation on forward foreign currency contracts line-items.
Fidelity® Series Emerging Markets Debt Local Currency Fund
| Statement of Assets and Liabilities |
| | | | December 31, 2023 |
| | | | | |
| Assets | | | | |
| Investment in securities, at value - See accompanying schedule: | | | | |
Unaffiliated issuers (cost $355,679,904) | $ | 359,177,015 | | |
Fidelity Central Funds (cost $51,362,343) | | 51,362,343 | | |
| | | | | |
| | | | | |
| Total Investment in Securities (cost $407,042,247) | | | $ | 410,539,358 |
| Foreign currency held at value (cost $1,845,984) | | | | 1,787,362 |
| Unrealized appreciation on forward foreign currency contracts | | | | 1,198,348 |
| Receivable for fund shares sold | | | | 331,916 |
| Dividends receivable | | | | 752 |
| Reclaims receivable | | | | 355,372 |
| Interest receivable | | | | 6,722,170 |
| Distributions receivable from Fidelity Central Funds | | | | 226,371 |
| Receivable from investment adviser for expense reductions | | | | 3,943 |
Total assets | | | | 421,165,592 |
| Liabilities | | | | |
| Unrealized depreciation on forward foreign currency contracts | $ | 504,260 | | |
| Payable for fund shares redeemed | | 775,163 | �� | |
| Other payables and accrued expenses | | 28,053 | | |
| Total Liabilities | | | | 1,307,476 |
| Net Assets | | | $ | 419,858,116 |
| Net Assets consist of: | | | | |
| Paid in capital | | | $ | 459,018,910 |
| Total accumulated earnings (loss) | | | | (39,160,794) |
| Net Assets | | | $ | 419,858,116 |
Net Asset Value, offering price and redemption price per share ($419,858,116 ÷ 44,812,897 shares) | | | $ | 9.37 |
| Statement of Operations |
| | | | Year ended December 31, 2023 |
| Investment Income | | | | |
| Foreign Tax Reclaims | | | $ | 328,186 |
| Interest | | | | 23,482,942 |
| Income from Fidelity Central Funds | | | | 2,349,680 |
| Income before foreign taxes withheld | | | $ | 26,160,808 |
| Less foreign taxes withheld | | | | (248,435) |
| Total Income | | | | 25,912,373 |
| Expenses | | | | |
| Custodian fees and expenses | $ | 69,029 | | |
| Independent trustees' fees and expenses | | 2,447 | | |
| Total expenses before reductions | | 71,476 | | |
| Expense reductions | | (65,358) | | |
| Total expenses after reductions | | | | 6,118 |
| Net Investment income (loss) | | | | 25,906,255 |
| Realized and Unrealized Gain (Loss) | | | | |
| Net realized gain (loss) on: | | | | |
| Investment Securities: | | | | |
| Unaffiliated issuers (net of foreign taxes of $42,080) | | (13,873,910) | | |
| Forward foreign currency contracts | | 2,405,711 | | |
| Foreign currency transactions | | 208,696 | | |
| Total net realized gain (loss) | | | | (11,259,503) |
| Change in net unrealized appreciation (depreciation) on: | | | | |
| Investment Securities: | | | | |
| Unaffiliated issuers | | 38,899,576 | | |
| Forward foreign currency contracts | | (2,623,163) | | |
| Assets and liabilities in foreign currencies | | 71,955 | | |
| Total change in net unrealized appreciation (depreciation) | | | | 36,348,368 |
| Net gain (loss) | | | | 25,088,865 |
| Net increase (decrease) in net assets resulting from operations | | | $ | 50,995,120 |
| Statement of Changes in Net Assets |
| |
| | Year ended December 31, 2023 | | Year ended December 31, 2022 |
| Increase (Decrease) in Net Assets | | | | |
| Operations | | | | |
| Net investment income (loss) | $ | 25,906,255 | $ | 20,925,997 |
| Net realized gain (loss) | | (11,259,503) | | (52,168,810) |
| Change in net unrealized appreciation (depreciation) | | 36,348,368 | | (6,006,477) |
| Net increase (decrease) in net assets resulting from operations | | 50,995,120 | | (37,249,290) |
| Distributions to shareholders | | (20,583,115) | | - |
| | | | | |
| Share transactions | | | | |
| Proceeds from sales of shares | | 37,776,245 | | 38,013,375 |
| Reinvestment of distributions | | 20,583,115 | | - |
| Cost of shares redeemed | | (52,206,073) | | (100,779,866) |
| | | | | |
Net increase (decrease) in net assets resulting from share transactions | | 6,153,287 | | (62,766,491) |
| Total increase (decrease) in net assets | | 36,565,292 | | (100,015,781) |
| | | | | |
| Net Assets | | | | |
| Beginning of period | | 383,292,824 | | 483,308,605 |
| End of period | $ | 419,858,116 | $ | 383,292,824 |
| | | | | |
| Other Information | | | | |
| Shares | | | | |
| Sold | | 4,107,915 | | 4,444,382 |
| Issued in reinvestment of distributions | | 2,259,402 | | - |
| Redeemed | | (5,684,286) | | (11,553,598) |
| Net increase (decrease) | | 683,031 | | (7,109,216) |
| | | | | |
Financial Highlights
| Fidelity® Series Emerging Markets Debt Local Currency Fund |
| |
| Years ended December 31, | | 2023 | | 2022 | | 2021 | | 2020 A |
Selected Per-Share Data | | | | | | | | |
| Net asset value, beginning of period | $ | 8.69 | $ | 9.43 | $ | 10.81 | $ | 10.00 |
| Income from Investment Operations | | | | | | | | |
Net investment income (loss) B,C | | .598 | | .445 | | .439 | | .067 |
| Net realized and unrealized gain (loss) | | .564 | | (1.185) | | (1.358) | | .806 |
| Total from investment operations | | 1.162 | | (.740) | | (.919) | | .873 |
| Distributions from net investment income | | (.482) | | - | | (.456) | | (.063) |
| Distributions from net realized gain | | - | | - | | (.005) | | - |
| Total distributions | | (.482) | | - | | (.461) | | (.063) |
| Net asset value, end of period | $ | 9.37 | $ | 8.69 | $ | 9.43 | $ | 10.81 |
Total Return D,E | | 13.53% | | (7.85)% | | (8.56)% | | 8.74% |
Ratios to Average Net Assets C,F,G | | | | | | | | |
| Expenses before reductions | | .02% | | .02% | | .03% | | .04% H |
Expenses net of fee waivers, if any I | | -% | | -% | | -% | | -% H |
Expenses net of all reductions I | | -% | | -% | | -% | | -% H |
| Net investment income (loss) | | 6.51% | | 5.17% | | 4.31% | | 3.69% H |
| Supplemental Data | | | | | | | | |
| Net assets, end of period (000 omitted) | $ | 419,858 | $ | 383,293 | $ | 483,309 | $ | 492,748 |
Portfolio turnover rate J | | 71% | | 53% | | 65% | | 17% K |
AFor the period October 30, 2020 (commencement of operations) through December 31, 2020.
BCalculated based on average shares outstanding during the period.
CNet investment income (loss) is affected by the timing of the declaration of dividends by any underlying mutual funds or exchange-traded funds (ETFs). Net investment income (loss) of any mutual funds or ETFs is not included in the Fund's net investment income (loss) ratio.
DTotal returns for periods of less than one year are not annualized.
ETotal returns would have been lower if certain expenses had not been reduced during the applicable periods shown.
FFees and expenses of any underlying mutual funds or exchange-traded funds (ETFs) are not included in the Fund's expense ratio. The Fund indirectly bears its proportionate share of these expenses. For additional expense information related to investments in Fidelity Central Funds, please refer to the "Investments in Fidelity Central Funds" note found in the Notes to Financial Statements section of the most recent Annual or Semi-Annual report.
GExpense ratios reflect operating expenses of the class. Expenses before reductions do not reflect amounts reimbursed, waived, or reduced through arrangements with the investment adviser, brokerage services, or other offset arrangements, if applicable, and do not represent the amount paid by the class during periods when reimbursements, waivers or reductions occur.
HAnnualized.
IAmount represents less than .005%.
JAmount does not include the portfolio activity of any underlying mutual funds or exchange-traded funds (ETFs).
KAmount not annualized.
For the period ended December 31, 2023
1. Organization.
Fidelity Series Emerging Markets Debt Fund and Fidelity Series Emerging Markets Debt Local Currency Fund (the Funds) are funds of Fidelity Hastings Street Trust (the Trust). Fidelity Series Emerging Markets Debt Local Currency Fund is a non-diversified fund. Each Fund is authorized to issue an unlimited number of shares. Shares of the Funds are only available for purchase by mutual funds for which Fidelity Management & Research Company LLC (FMR) or an affiliate serves as an investment manager. The Trust is registered under the Investment Company Act of 1940, as amended (the 1940 Act), as an open-end management investment company organized as a Massachusetts business trust. Investments in emerging markets, if applicable, can be subject to social, economic, regulatory, and political uncertainties and can be extremely volatile.
2. Investments in Fidelity Central Funds.
Funds may invest in Fidelity Central Funds, which are open-end investment companies generally available only to other investment companies and accounts managed by the investment adviser and its affiliates. The Schedule of Investments lists any Fidelity Central Funds held as an investment as of period end, but does not include the underlying holdings of each Fidelity Central Fund. An investing fund indirectly bears its proportionate share of the expenses of the underlying Fidelity Central Funds.
Based on its investment objective, each Fidelity Central Fund may invest or participate in various investment vehicles or strategies that are similar to those of the investing fund. These strategies are consistent with the investment objectives of the investing fund and may involve certain economic risks which may cause a decline in value of each of the Fidelity Central Funds and thus a decline in the value of the investing fund.
| Fidelity Central Fund | Investment Manager | Investment Objective | Investment Practices | Expense RatioA |
| Fidelity Money Market Central Funds | Fidelity Management & Research Company LLC (FMR) | Each fund seeks to obtain a high level of current income consistent with the preservation of capital and liquidity. | Short-term Investments | Less than .005% |
A Expenses expressed as a percentage of average net assets and are as of each underlying Central Fund's most recent annual or semi-annual shareholder report.
A complete unaudited list of holdings for each Fidelity Central Fund is available upon request or at the Securities and Exchange Commission website at www.sec.gov. In addition, the financial statements of the Fidelity Central Funds which contain the significant accounting policies (including investment valuation policies) of those funds, and are not covered by the Report of Independent Registered Public Accounting Firm, are available on the Securities and Exchange Commission website or upon request.
3. Significant Accounting Policies.
Each Fund is an investment company and applies the accounting and reporting guidance of the Financial Accounting Standards Board (FASB) Accounting Standards Codification Topic 946 Financial Services - Investment Companies. The financial statements have been prepared in conformity with accounting principles generally accepted in the United States of America (GAAP), which require management to make certain estimates and assumptions at the date of the financial statements. Actual results could differ from those estimates. Subsequent events, if any, through the date that the financial statements were issued have been evaluated in the preparation of the financial statements. Each Fund's Schedule of Investments lists any underlying mutual funds or exchange-traded funds (ETFs) but does not include the underlying holdings of these funds. The following summarizes the significant accounting policies of each Fund:
Investment Valuation. Investments are valued as of 4:00 p.m. Eastern time on the last calendar day of the period. The Board of Trustees (the Board) has designated each Fund's investment adviser as the valuation designee responsible for the fair valuation function and performing fair value determinations as needed. The investment adviser has established a Fair Value Committee (the Committee) to carry out the day-to-day fair valuation responsibilities and has adopted policies and procedures to govern the fair valuation process and the activities of the Committee. In accordance with these fair valuation policies and procedures, which have been approved by the Board, each Fund attempts to obtain prices from one or more third party pricing services or brokers to value its investments. When current market prices, quotations or currency exchange rates are not readily available or reliable, investments will be fair valued in good faith by the Committee, in accordance with the policies and procedures. Factors used in determining fair value vary by investment type and may include market or investment specific events, transaction data, estimated cash flows, and market observations of comparable investments. The frequency that the fair valuation procedures are used cannot be predicted and they may be utilized to a significant extent. The Committee manages each Fund's fair valuation practices and maintains the fair valuation policies and procedures. Each Fund's investment adviser reports to the Board information regarding the fair valuation process and related material matters.
Each Fund categorizes the inputs to valuation techniques used to value its investments into a disclosure hierarchy consisting of three levels as shown below:
Level 1 - unadjusted quoted prices in active markets for identical investments
Level 2 - other significant observable inputs (including quoted prices for similar investments, interest rates, prepayment speeds, etc.)
Level 3 - unobservable inputs (including the Fund's own assumptions based on the best information available)
Valuation techniques used to value each Fund's investments by major category are as follows:
Debt securities, including restricted securities, are valued based on evaluated prices received from third party pricing services or from brokers who make markets in such securities. Corporate bonds, foreign government and government agency obligations, preferred securities, supranational obligations and U.S. government and government agency obligations are valued by pricing services who utilize matrix pricing which considers yield or price of bonds of comparable quality, coupon, maturity and type or by broker-supplied prices. When independent prices are unavailable or unreliable, debt securities may be valued utilizing pricing methodologies which consider similar factors that would be used by third party pricing services. For foreign debt securities, when significant market or security specific events arise, valuations may be determined in good faith in accordance with procedures adopted by the Board. Debt securities are generally categorized as Level 2 in the hierarchy but may be Level 3 depending on the circumstances. The Fidelity Series Emerging Markets Debt Fund invests a significant portion of its assets in below investment grade securities. The value of these securities can be more volatile due to changes in the credit quality of the issuer and is sensitive to changes in economic, market and regulatory conditions.
Equity securities, including restricted securities, for which market quotations are readily available, are valued at the last reported sale price or official closing price as reported by a third party pricing service on the primary market or exchange on which they are traded and are categorized as Level 1 in the hierarchy. In the event there were no sales during the day or closing prices are not available, securities are valued at the last quoted bid price or may be valued using the last available price and are generally categorized as Level 2 in the hierarchy. For foreign equity securities, when market or security specific events arise, comparisons to the valuation of American Depositary Receipts (ADRs), futures contracts, Exchange-Traded Funds (ETFs) and certain indexes as well as quoted prices for similar securities may be used and would be categorized as Level 2 in the hierarchy. For equity securities, including restricted securities, where observable inputs are limited, assumptions about market activity and risk are used and these securities may be categorized as Level 3 in the hierarchy.
The U.S. dollar value of forward foreign currency contracts is determined using currency exchange rates supplied by a pricing service and are categorized as Level 2 in the hierarchy. Futures contracts are valued at the settlement price or official closing price established each day by the board of trade or exchange on which they are traded and are categorized as Level 1 in the hierarchy. Investments in open-end mutual funds, including the Fidelity Central Funds, are valued at their closing net asset value (NAV) each business day and are categorized as Level 1 in the hierarchy.
Changes in valuation techniques may result in transfers in or out of an assigned level within the disclosure hierarchy. The aggregate value of investments by input level as of December 31, 2023 is included at the end of each Fund's Schedule of Investments.
Foreign Currency. Foreign-denominated assets, including investment securities, and liabilities are translated into U.S. dollars at the exchange rates at period end. Purchases and sales of investment securities, income and dividends received, and expenses denominated in foreign currencies are translated into U.S. dollars at the exchange rate in effect on the transaction date.
The effects of exchange rate fluctuations on investments are included with the net realized and unrealized gain (loss) on investment securities. Other foreign currency transactions resulting in realized and unrealized gain (loss) are disclosed separately.
Realized gains and losses on foreign currency transactions arise from the disposition of foreign currency, realized changes in the value of foreign currency between the trade and settlement dates on security transactions, and the difference between the amounts of dividends, interest and foreign withholding taxes recorded on transaction date and the U.S. dollar equivalent of the amounts actually received or paid. Unrealized gains and losses on assets and liabilities in foreign currencies arise from changes in the value of foreign currency, and from assets and liabilities denominated in foreign currencies, other than investments, which are held at period end.
Investment Transactions and Income. For financial reporting purposes, the Funds' investment holdings and NAV include trades executed through the end of the last business day of the period. The NAV per share for processing shareholder transactions is calculated as of the close of business of the New York Stock Exchange (NYSE), normally 4:00 p.m. Eastern time and includes trades executed through the end of the prior business day. Gains and losses on securities sold are determined on the basis of identified cost. Commissions paid to certain brokers with whom the investment adviser, or its affiliates, places trades on behalf of a fund include an amount in addition to trade execution, which may be rebated back to a fund. Any such rebates are included in net realized gain (loss) on investments in the Statement of Operations. Dividend income is recorded on the ex-dividend date. Income and capital gain distributions from Fidelity Central Funds, if any, are recorded on the ex-dividend date. Interest income is accrued as earned and includes coupon interest and amortization of premium and accretion of discount on debt securities as applicable. Paid in Kind (PIK) income is recorded at the fair market value of the securities received. Investment income is recorded net of foreign taxes withheld where recovery of such taxes is uncertain. Debt obligations may be placed on non-accrual status and related interest income may be reduced by ceasing current accruals and writing off interest receivables when the collection of all or a portion of interest has become doubtful based on consistently applied procedures. A debt obligation is removed from non-accrual status when the issuer resumes interest payments or when collectability of interest is reasonably assured. Funds may file withholding tax reclaims in certain jurisdictions to recover a portion of amounts previously withheld. Any withholding tax reclaims income is included in the Statement of Operations in foreign taxes withheld. Any receivables for withholding tax reclaims are included in the Statement of Assets and Liabilities in reclaims receivable.
Expenses. Expenses directly attributable to a fund are charged to that fund. Expenses attributable to more than one fund are allocated among the respective funds on the basis of relative net assets or other appropriate methods. Expenses included in the accompanying financial statements reflect the expenses of that fund and do not include any expenses associated with any underlying mutual funds or exchange-traded funds. Although not included in a fund's expenses, a fund indirectly bears its proportionate share of these expenses through the net asset value of each underlying mutual fund or exchange-traded fund. Expense estimates are accrued in the period to which they relate and adjustments are made when actual amounts are known.
Income Tax Information and Distributions to Shareholders. Each year, each Fund intends to qualify as a regulated investment company under Subchapter M of the Internal Revenue Code, including distributing substantially all of its taxable income and realized gains. As a result, no provision for U.S. Federal income taxes is required. As of December 31, 2023, each Fund did not have any unrecognized tax benefits in the financial statements; nor is each Fund aware of any tax positions for which it is reasonably possible that the total amounts of unrecognized tax benefits will significantly change in the next twelve months. Each Fund files a U.S. federal tax return, in addition to state and local tax returns as required. Each Fund's federal income tax returns are subject to examination by the Internal Revenue Service (IRS) for a period of three fiscal years after they are filed. State and local tax returns may be subject to examination for an additional fiscal year depending on the jurisdiction. Foreign taxes are provided for based on each Fund's understanding of the tax rules and rates that exist in the foreign markets in which it invests. Fidelity Series Emerging Markets Debt Local Currency Fund is subject to a tax imposed on capital gains by certain countries in which it invest.
Distributions are declared and recorded daily and paid monthly from net investment income. Distributions from realized gains, if any, are declared and recorded on the ex-dividend date. Income and capital gain distributions are determined in accordance with income tax regulations, which may differ from GAAP.
Capital accounts within the financial statements are adjusted for permanent book-tax differences. These adjustments have no impact on net assets or the results of operations. Capital accounts are not adjusted for temporary book-tax differences which will reverse in a subsequent period.
Book-tax differences are primarily due to futures contracts, foreign currency transactions, certain foreign taxes, market discount, contingent interest, capital loss carryforwards, losses deferred due to wash sales, futures contracts and excise tax regulations.
As of period end, the cost and unrealized appreciation (depreciation) in securities, and derivatives if applicable, for federal income tax purposes were as follows for each Fund:
| | Tax cost | Gross unrealized appreciation | Gross unrealized depreciation | Net unrealized appreciation (depreciation) |
Fidelity Series Emerging Markets Debt Fund | $1,399,994,161 | $40,971,692 | $(178,881,369) | $(137,909,677) |
Fidelity Series Emerging Markets Debt Local Currency Fund | 408,574,302 | 12,179,973 | (22,751,199) | (10,571,226) |
The tax-based components of distributable earnings as of period end were as follows for each Fund:
| | Undistributed ordinary income | Capital loss carryforward | Net unrealized appreciation (depreciation) on securities and other investments |
Fidelity Series Emerging Markets Debt Fund | $- | $(218,272,965) | $(137,902,915) |
Fidelity Series Emerging Markets Debt Local Currency Fund | 8,418,546 | (37,087,243) | (10,492,096) |
Capital loss carryforwards are only available to offset future capital gains of the Funds to the extent provided by regulations and may be limited. The capital loss carryforward information presented below, including any applicable limitation, is estimated as of fiscal period end and is subject to adjustment.
| | Short-term | Long-term | Total capital loss carryforward | |
Fidelity Series Emerging Markets Debt Fund | $(27,514,418) | $(190,758,547) | $(218,272,965) | |
Fidelity Series Emerging Markets Debt Local Currency Fund | (12,250,181) | (24,837,062) | (37,087,243) | |
| | | | | |
The tax character of distributions paid was as follows:
| December 31, 2023 | |
| | Ordinary Income |
Fidelity Series Emerging Markets Debt Fund | $75,296,697 |
Fidelity Series Emerging Markets Debt Local Currency Fund | 20,583,115 |
| December 31, 2022 | |
| | Ordinary Income |
Fidelity Series Emerging Markets Debt Fund | $66,732,572 |
Restricted Securities (including Private Placements). Funds may invest in securities that are subject to legal or contractual restrictions on resale. These securities generally may be resold in transactions exempt from registration or to the public if the securities are registered. Disposal of these securities may involve time-consuming negotiations and expense, and prompt sale at an acceptable price may be difficult. Information regarding restricted securities held at period end is included at the end of the Schedule of Investments, if applicable.
4. Derivative Instruments.
Risk Exposures and the Use of Derivative Instruments. Each Fund's investment objectives allow for various types of derivative instruments, including futures contracts and forward foreign currency contracts. Derivatives are investments whose value is primarily derived from underlying assets, indices or reference rates and may be transacted on an exchange or over-the-counter (OTC). Derivatives may involve a future commitment to buy or sell a specified asset based on specified terms, to exchange future cash flows at periodic intervals based on a notional principal amount, or for one party to make one or more payments upon the occurrence of specified events in exchange for periodic payments from the other party.
Derivatives were used to increase returns, to facilitate transactions in foreign-denominated securities and to manage exposure to certain risks as defined below. The success of any strategy involving derivatives depends on analysis of numerous economic factors, and if the strategies for investment do not work as intended, the objectives may not be achieved.
Derivatives were used to increase or decrease exposure to the following risk(s):
| | |
| Foreign Exchange Risk | Foreign exchange rate risk relates to fluctuations in the value of an asset or liability due to changes in currency exchange rates. |
| Interest Rate Risk | Interest rate risk relates to the fluctuations in the value of interest-bearing securities due to changes in the prevailing levels of market interest rates. |
Funds are also exposed to additional risks from investing in derivatives, such as liquidity risk and counterparty credit risk. Liquidity risk is the risk that a fund will be unable to close out the derivative in the open market in a timely manner. Counterparty credit risk is the risk that the counterparty will not be able to fulfill its obligation to a fund. Derivative counterparty credit risk is managed through formal evaluation of the creditworthiness of all potential counterparties. On certain OTC derivatives such as forward foreign currency contracts, a fund attempts to reduce its exposure to counterparty credit risk by entering into an International Swaps and Derivatives Association, Inc. (ISDA) Master Agreement with each of its counterparties. The ISDA Master Agreement gives a fund the right to terminate all transactions traded under such agreement upon the deterioration in the credit quality of the counterparty beyond specified levels. The ISDA Master Agreement gives each party the right, upon an event of default by the other party or a termination of the agreement, to close out all transactions traded under such agreement and to net amounts owed under each transaction to one net payable by one party to the other. To mitigate counterparty credit risk on bi-lateral OTC derivatives, a fund receives collateral in the form of cash or securities once net unrealized appreciation on outstanding derivative contracts under an ISDA Master Agreement exceeds certain applicable thresholds, subject to certain minimum transfer provisions. The collateral received is held in segregated accounts with the custodian bank in accordance with the collateral agreements entered into between a fund, the counterparty and the custodian bank. A fund could experience delays and costs in gaining access to the collateral even though it is held by the custodian bank. The maximum risk of loss to a fund from counterparty credit risk related to bi-lateral OTC derivatives is generally the aggregate unrealized appreciation and unpaid counterparty payments in excess of any collateral pledged by the counterparty to a fund. A fund may be required to pledge collateral for the benefit of the counterparties on bi-lateral OTC derivatives in an amount not less than each counterparty's unrealized appreciation on outstanding derivative contracts, subject to certain minimum transfer provisions, and any such pledged collateral is identified in the Schedule of Investments. Counterparty credit risk related to exchange-traded contracts may be mitigated by the protection provided by the exchange on which they trade.
Investing in derivatives may involve greater risks than investing in the underlying assets directly and, to varying degrees, may involve risk of loss in excess of any initial investment and collateral received and amounts recognized in the Statement of Assets and Liabilities. In addition, there may be the risk that the change in value of the derivative contract does not correspond to the change in value of the underlying instrument.
Forward Foreign Currency Contracts. Forward foreign currency contracts represent obligations to purchase or sell foreign currency on a specified future date at a price fixed at the time the contracts are entered into. Forward foreign currency contracts were used to facilitate transactions in foreign-denominated securities and to manage exposure to certain foreign currencies.
Forward foreign currency contracts are valued daily and fluctuations in exchange rates on open contracts are recorded as unrealized appreciation or (depreciation) and reflected in total accumulated earnings (loss) in the Statement of Assets and Liabilities. When the contract is closed, a gain or loss is realized equal to the difference between the closing value and the value at the time it was opened. Non-deliverable forward foreign currency exchange contracts are settled with the counterparty in cash without the delivery of foreign currency. The net realized gain (loss) and change in net unrealized appreciation (depreciation) on forward foreign currency contracts during the period is presented in the Statement of Operations.
Any open forward foreign currency contracts at period end are presented in the Schedule of Investments under the caption "Forward Foreign Currency Contracts." The contract amount and unrealized appreciation (depreciation) reflects each contract's exposure to the underlying currency at period end, and is representative of volume of activity during the period unless an average contract value is presented.
Futures Contracts. A futures contract is an agreement between two parties to buy or sell a specified underlying instrument for a fixed price at a specified future date. Futures contracts were used to manage exposure to the bond market and fluctuations in interest rates.
Upon entering into a futures contract, a fund is required to deposit either cash or securities (initial margin) with a clearing broker in an amount equal to a certain percentage of the face value of the contract. Futures contracts are marked-to-market daily and subsequent daily payments are made or received by a fund depending on the daily fluctuations in the value of the futures contracts and are recorded as unrealized appreciation or (depreciation). This receivable and/or payable, if any, is included in daily variation margin on futures contracts in the Statement of Assets and Liabilities. Realized gain or (loss) is recorded upon the expiration or closing of a futures contract. The net realized gain (loss) and change in net unrealized appreciation (depreciation) on futures contracts during the period is presented in the Statement of Operations.
Any open futures contracts at period end are presented in the Schedule of Investments under the caption "Futures Contracts". The notional amount at value reflects each contract's exposure to the underlying instrument or index at period end, and is representative of volume of activity during the period unless an average notional amount is presented. Any securities deposited to meet initial margin requirements are identified in the Schedule of Investments. Any cash deposited to meet initial margin requirements is presented as segregated cash with brokers for derivative instruments in the Statement of Assets and Liabilities.
5. Purchases and Sales of Investments.
Purchases and sales of securities, other than short-term securities, U.S. government securities and in-kind transactions, as applicable, are noted in the table below.
| | Purchases ($) | Sales ($) |
| Fidelity Series Emerging Markets Debt Fund | 234,997,215 | 249,379,937 |
| Fidelity Series Emerging Markets Debt Local Currency Fund | 241,329,669 | 243,783,202 |
6. Fees and Other Transactions with Affiliates.
Management Fee. Fidelity Management & Research Company LLC (the investment adviser) and its affiliates provide the Funds with investment management related services for which the Funds do not pay a management fee. Under the management contract, the investment adviser or an affiliate pays all ordinary operating expenses of the Funds, except custody fees, fees and expenses of the independent Trustees, and certain miscellaneous expenses such as proxy and shareholder meeting expenses.
Interfund Trades. Funds may purchase from or sell securities to other Fidelity Funds under procedures adopted by the Board. The procedures have been designed to ensure these interfund trades are executed in accordance with Rule 17a-7 of the 1940 Act. Any interfund trades are included within the respective purchases and sales amounts shown in the Purchases and Sales of Investments note. During the period, there were no interfund trades.
Other. During the period, the investment adviser reimbursed the Funds for certain losses as follows:
| | Amount ($) |
| Fidelity Series Emerging Markets Debt Local Currency Fund | 3,255 |
Subsequent Event - Sub-Advisory Arrangements. Effective March 1, 2024, the Fund's sub-advisory agreements with FMR Investment Management (UK) Limited, Fidelity Management & Research (Hong Kong) Limited, and Fidelity Management & Research (Japan) Limited will be amended to provide that the investment adviser will pay each sub-adviser monthly fees equal to 110% of the sub-adviser's costs for providing sub-advisory services.
7. Committed Line of Credit.
Certain Funds participate with other funds managed by the investment adviser or an affiliate in a $4.25 billion credit facility (the "line of credit") to be utilized for temporary or emergency purposes to fund shareholder redemptions or for other short-term liquidity purposes. The commitment fees on the pro-rata portion of the line of credit are borne by the investment adviser. During the period, there were no borrowings on this line of credit.
8. Expense Reductions.
The investment adviser contractually agreed to reimburse each Fund to the extent annual operating expenses exceeded certain levels of average net assets as noted in the table below. This reimbursement will remain in place through April 30, 2027. Some expenses, for example the compensation of the independent Trustees, and certain other expenses such as interest expense, are excluded from this reimbursement.
The following Funds were in reimbursement during the period:
| | Expense Limitations | Reimbursement |
| Fidelity Series Emerging Markets Debt Fund | .003% | $ 240,490 |
| Fidelity Series Emerging Markets Debt Local Currency Fund | .003% | $ 57,094 |
Through arrangements with each applicable Fund's custodian, credits realized as a result of certain uninvested cash balances were used to reduce each applicable Fund's expenses. All of the applicable expense reductions are noted in the table below.
| | Custodian credits |
Fidelity Series Emerging Markets Debt Fund | $ 4,628 |
Fidelity Series Emerging Markets Debt Local Currency Fund | 8,264 |
9. Other.
A fund's organizational documents provide former and current trustees and officers with a limited indemnification against liabilities arising in connection with the performance of their duties to the fund. In the normal course of business, a fund may also enter into contracts that provide general indemnifications. A fund's maximum exposure under these arrangements is unknown as this would be dependent on future claims that may be made against a fund. The risk of material loss from such claims is considered remote.
At the end of the period, mutual funds and accounts managed by the investment adviser or its affiliates were the owners of record of all of the outstanding shares of the Funds.
10. Credit Risk.
The Fund's relatively large investment in countries with limited or developing capital markets may involve greater risks than investments in more developed markets and the prices of such investments may be volatile. The yields of emerging market debt obligations reflect, among other things, perceived credit risk. The consequences of political, social or economic changes in these markets may have disruptive effects on the market prices of the Fund's investments and the income they generate, as well as the Fund's ability to repatriate such amounts.
11. Risk and Uncertainties.
Many factors affect a fund's performance. Developments that disrupt global economies and financial markets, such as pandemics, epidemics, outbreaks of infectious diseases, war, terrorism, and environmental disasters, may significantly affect a fund's investment performance. The effects of these developments to a fund will be impacted by the types of securities in which a fund invests, the financial condition, industry, economic sector, and geographic location of an issuer, and a fund's level of investment in the securities of that issuer. Significant concentrations in security types, issuers, industries, sectors, and geographic locations may magnify the factors that affect a fund's performance.
To the Board of Trustees of Fidelity Hastings Street Trust and Shareholders of Fidelity Series Emerging Markets Debt Fund and Fidelity Series Emerging Markets Debt Local Currency Fund
Opinions on the Financial Statements
We have audited the accompanying statements of assets and liabilities, including the schedules of investments, of Fidelity Series Emerging Markets Debt Fund and Fidelity Series Emerging Markets Debt Local Currency Fund (two of the funds constituting Fidelity Hastings Street Trust, hereafter collectively referred to as the "Funds") as of December 31, 2023, the related statements of operations for the year ended December 31, 2023, the statements of changes in net assets for each of the two years in the period ended December 31, 2023, including the related notes, and the financial highlights for each of the periods indicated therein (collectively referred to as the "financial statements"). In our opinion, the financial statements present fairly, in all material respects, the financial position of each of the Funds as of December 31, 2023, the results of each of their operations for the year then ended, the changes in each of their net assets for each of the two years in the period ended December 31, 2023 and each of the financial highlights for each of the periods indicated therein in conformity with accounting principles generally accepted in the United States of America.
Basis for Opinions
These financial statements are the responsibility of the Funds' management. Our responsibility is to express an opinion on the Funds' financial statements based on our audits. We are a public accounting firm registered with the Public Company Accounting Oversight Board (United States) (PCAOB) and are required to be independent with respect to the Funds in accordance with the U.S. federal securities laws and the applicable rules and regulations of the Securities and Exchange Commission and the PCAOB.
We conducted our audits of these financial statements in accordance with the standards of the PCAOB. Those standards require that we plan and perform the audit to obtain reasonable assurance about whether the financial statements are free of material misstatement, whether due to error or fraud.
Our audits included performing procedures to assess the risks of material misstatement of the financial statements, whether due to error or fraud, and performing procedures that respond to those risks. Such procedures included examining, on a test basis, evidence regarding the amounts and disclosures in the financial statements. Our audits also included evaluating the accounting principles used and significant estimates made by management, as well as evaluating the overall presentation of the financial statements. Our procedures included confirmation of securities owned as of December 31, 2023 by correspondence with the custodian and brokers; when replies were not received from brokers, we performed other auditing procedures. We believe that our audits provide a reasonable basis for our opinions.
/s/ PricewaterhouseCoopers LLP
Boston, Massachusetts
February 14, 2024
We have served as the auditor of one or more investment companies in the Fidelity group of funds since 1932.
The Trustees, Members of the Advisory Board (if any), and officers of the trust and funds, as applicable, are listed below. The Board of Trustees governs each fund and is responsible for protecting the interests of shareholders. The Trustees are experienced executives who meet periodically throughout the year to oversee each fund's activities, review contractual arrangements with companies that provide services to each fund, oversee management of the risks associated with such activities and contractual arrangements, and review each fund's performance. Except for Vijay Advani, each of the Trustees oversees 322 funds. Mr. Advani oversees 215 funds.
The Trustees hold office without limit in time except that (a) any Trustee may resign; (b) any Trustee may be removed by written instrument, signed by at least two-thirds of the number of Trustees prior to such removal; (c) any Trustee who requests to be retired or who has become incapacitated by illness or injury may be retired by written instrument signed by a majority of the other Trustees; and (d) any Trustee may be removed at any special meeting of shareholders by a two-thirds vote of the outstanding voting securities of the trust. Each Trustee who is not an interested person (as defined in the 1940 Act) of the trust and the funds is referred to herein as an Independent Trustee. Each Independent Trustee shall retire not later than the last day of the calendar year in which his or her 75th birthday occurs. The Independent Trustees may waive this mandatory retirement age policy with respect to individual Trustees. Officers and Advisory Board Members hold office without limit in time, except that any officer or Advisory Board Member may resign or may be removed by a vote of a majority of the Trustees at any regular meeting or any special meeting of the Trustees. Except as indicated, each individual has held the office shown or other offices in the same company for the past five years.
The funds' Statement of Additional Information (SAI) includes more information about the Trustees. To request a free copy, call Fidelity at 1-800-544-8544.
Experience, Skills, Attributes, and Qualifications of the Trustees. The Governance and Nominating Committee has adopted a statement of policy that describes the experience, qualifications, attributes, and skills that are necessary and desirable for potential Independent Trustee candidates (Statement of Policy). The Board believes that each Trustee satisfied at the time he or she was initially elected or appointed a Trustee, and continues to satisfy, the standards contemplated by the Statement of Policy. The Governance and Nominating Committee also engages professional search firms to help identify potential Independent Trustee candidates who have the experience, qualifications, attributes, and skills consistent with the Statement of Policy. From time to time, additional criteria based on the composition and skills of the current Independent Trustees, as well as experience or skills that may be appropriate in light of future changes to board composition, business conditions, and regulatory or other developments, have also been considered by the professional search firms and the Governance and Nominating Committee. In addition, the Board takes into account the Trustees' commitment and participation in Board and committee meetings, as well as their leadership of standing and ad hoc committees throughout their tenure.
In determining that a particular Trustee was and continues to be qualified to serve as a Trustee, the Board has considered a variety of criteria, none of which, in isolation, was controlling. The Board believes that, collectively, the Trustees have balanced and diverse experience, qualifications, attributes, and skills, which allow the Board to operate effectively in governing each fund and protecting the interests of shareholders. Information about the specific experience, skills, attributes, and qualifications of each Trustee, which in each case led to the Board's conclusion that the Trustee should serve (or continue to serve) as a trustee of the funds, is provided below.
Board Structure and Oversight Function. Robert A. Lawrence is an interested person and currently serves as Chair. The Trustees have determined that an interested Chair is appropriate and benefits shareholders because an interested Chair has a personal and professional stake in the quality and continuity of services provided to the funds. Independent Trustees exercise their informed business judgment to appoint an individual of their choosing to serve as Chair, regardless of whether the Trustee happens to be independent or a member of management. The Independent Trustees have determined that they can act independently and effectively without having an Independent Trustee serve as Chair and that a key structural component for assuring that they are in a position to do so is for the Independent Trustees to constitute a substantial majority for the Board. The Independent Trustees also regularly meet in executive session. David M. Thomas serves as Lead Independent Trustee and as such (i) acts as a liaison between the Independent Trustees and management with respect to matters important to the Independent Trustees and (ii) with management prepares agendas for Board meetings.
Fidelity® funds are overseen by different Boards of Trustees. The funds' Board oversees Fidelity's high income and certain equity funds, and other Boards oversee Fidelity's alternative investment, investment-grade bond, money market, asset allocation, and other equity funds. The asset allocation funds may invest in Fidelity® funds overseen by the funds' Board. The use of separate Boards, each with its own committee structure, allows the Trustees of each group of Fidelity® funds to focus on the unique issues of the funds they oversee, including common research, investment, and operational issues. On occasion, the separate Boards establish joint committees to address issues of overlapping consequences for the Fidelity® funds overseen by each Board.
The Trustees operate using a system of committees to facilitate the timely and efficient consideration of all matters of importance to the Trustees, each fund, and fund shareholders and to facilitate compliance with legal and regulatory requirements and oversight of the funds' activities and associated risks. The Board, acting through its committees, has charged FMR and its affiliates with (i) identifying events or circumstances the occurrence of which could have demonstrably adverse effects on the funds' business and/or reputation; (ii) implementing processes and controls to lessen the possibility that such events or circumstances occur or to mitigate the effects of such events or circumstances if they do occur; and (iii) creating and maintaining a system designed to evaluate continuously business and market conditions in order to facilitate the identification and implementation processes described in (i) and (ii) above. Because the day-to-day operations and activities of the funds are carried out by or through FMR, its affiliates, and other service providers, the funds' exposure to risks is mitigated but not eliminated by the processes overseen by the Trustees. While each of the Board's committees has responsibility for overseeing different aspects of the funds' activities, oversight is exercised primarily through the Operations, Audit, and Compliance Committees. Appropriate personnel, including but not limited to the funds' Chief Compliance Officer (CCO), FMR's internal auditor, the independent accountants, the funds' Treasurer and portfolio management personnel, make periodic reports to the Board's committees, as appropriate, including an annual review of Fidelity's risk management program for the Fidelity® funds. The responsibilities of each standing committee, including their oversight responsibilities, are described further under "Standing Committees of the Trustees."
Interested Trustees*:
Correspondence intended for a Trustee who is an interested person may be sent to Fidelity Investments, 245 Summer Street, Boston, Massachusetts 02210.
Name, Year of Birth; Principal Occupations and Other Relevant Experience+
Bettina Doulton (1964)
Year of Election or Appointment: 2020
Trustee
Ms. Doulton also serves as Trustee of other Fidelity® funds. Prior to her retirement, Ms. Doulton served in a variety of positions at Fidelity Investments, including as a managing director of research (2006-2007), portfolio manager to certain Fidelity® funds (1993-2005), equity analyst and portfolio assistant (1990-1993), and research assistant (1987-1990). Ms. Doulton currently owns and operates Phi Builders + Architects and Cellardoor Winery. Previously, Ms. Doulton served as a member of the Board of Brown Capital Management, LLC (2014-2018).
Robert A. Lawrence (1952)
Year of Election or Appointment: 2020
Trustee
Chair of the Board of Trustees
Mr. Lawrence also serves as Trustee of other funds. Previously, Mr. Lawrence served as a Trustee and Member of the Advisory Board of certain funds. Prior to his retirement in 2008, Mr. Lawrence served as Vice President of certain Fidelity® funds (2006-2008), Senior Vice President, Head of High Income Division of Fidelity Management & Research Company (investment adviser firm, 2006-2008), and President of Fidelity Strategic Investments (investment adviser firm, 2002-2005).
* Determined to be an "Interested Trustee" by virtue of, among other things, his or her affiliation with the trust or various entities under common control with FMR.
+ The information includes the Trustee's principal occupation during the last five years and other information relating to the experience, attributes, and skills relevant to the Trustee's qualifications to serve as a Trustee, which led to the conclusion that the Trustee should serve as a Trustee for each fund.
Independent Trustees:
Correspondence intended for an Independent Trustee may be sent to Fidelity Investments, P.O. Box 55235, Boston, Massachusetts 02205-5235.
Name, Year of Birth; Principal Occupations and Other Relevant Experience+
Vijay C. Advani (1960)
Year of Election or Appointment: 2023
Trustee
Mr. Advani also serves as Trustee or Member of the Advisory Board of other funds. Previously, Mr. Advani served as Executive Chairman (2020-2022), Chief Executive Officer (2017-2020) and Chief Operating Officer (2016-2017) of Nuveen (global investment manager). He also served in various capacities at Franklin Resources (global investment manager), including Co-President (2015-2016), Executive Vice President, Global Advisory Services (2008-2015), Head of Global Retail Distribution (2005-2008), Executive Managing Director, International Retail Development (2002-2005), Managing Director, Product Developments, Sales & Marketing, Asia, Eastern Europe and Africa (2000-2002) and President, Templeton Asset Management India (1995-2000). Mr. Advani also served as Senior Investment Officer of International Finance Corporation (private equity and venture capital arm of The World Bank, 1984-1995). Mr. Advani is Chairman Emeritus of the U.S. India Business Council (2018-present), a Director of The Global Impact Investing Network (2019-present), a Director of LOK Capital (Mauritius) (2022-present), a member of the Advisory Council of LOK Capital (2022-present), a Senior Advisor of Neuberger Berman (2021-present), a Senior Advisor of Seviora Holdings Pte. Ltd (Temasek-Singapore) (2021-present), a Director of Seviora Capital (Singapore) (2021-present) and an Advisor of EQUIAM (2021-present). Mr. Advani formerly served as a member of the Board of BowX Acquisition Corp. (special purpose acquisition company, 2020-2021), a member of the Board of Intellecap (advisory arm of The Aavishkaar Group, 2018-2020), a member of the Board of Nuveen Investments, Inc. (2017-2020) and a member of the Board of Docusign (software, 2016-2019).
Thomas P. Bostick (1956)
Year of Election or Appointment: 2021
Trustee
Lieutenant General Bostick also serves as Trustee of other Fidelity® funds. Prior to his retirement, General Bostick (United States Army, Retired) held a variety of positions within the U.S. Army, including Commanding General and Chief of Engineers, U.S. Army Corps of Engineers (2012-2016) and Deputy Chief of Staff and Director of Human Resources, U.S. Army (2009-2012). General Bostick currently serves as a member of the Board and Finance and Governance & Sustainability Committees of CSX Corporation (transportation, 2020-present) and a member of the Board and Corporate Governance and Nominating Committee of Perma-Fix Environmental Services, Inc. (nuclear waste management, 2020-present). General Bostick serves as Chief Executive Officer of Bostick Global Strategies, LLC (consulting, 2016-present), as a member of the Board of HireVue, Inc. (video interview and assessment, 2020-present), as a member of the Board of Allonnia (biotechnology and engineering solutions, 2022-present) and on the Advisory Board of Solugen, Inc. (specialty bio-based chemicals manufacturer, 2022-present). Previously, General Bostick served as a Member of the Advisory Board of certain Fidelity® funds (2021), President, Intrexon Bioengineering (2018-2020) and Chief Operating Officer (2017-2020) and Senior Vice President of the Environment Sector (2016-2017) of Intrexon Corporation (biopharmaceutical company).
Donald F. Donahue (1950)
Year of Election or Appointment: 2018
Trustee
Mr. Donahue also serves as Trustee of other Fidelity® funds. Mr. Donahue serves as President and Chief Executive Officer of Miranda Partners, LLC (risk consulting for the financial services industry, 2012-present). Previously, Mr. Donahue served as Chief Executive Officer (2006-2012), Chief Operating Officer (2003-2006) and Managing Director, Customer Marketing and Development (1999-2003) of The Depository Trust & Clearing Corporation (financial markets infrastructure). Mr. Donahue currently serves as a member (2007-present) and Co-Chairman (2016-present) of the Board of United Way of New York. Mr. Donahue previously served as a member of the Advisory Board of certain Fidelity® funds (2015-2018) and as a member of the Board of The Leadership Academy (previously NYC Leadership Academy) (2012-2022).
Vicki L. Fuller (1957)
Year of Election or Appointment: 2020
Trustee
Ms. Fuller also serves as Trustee of other Fidelity® funds. Previously, Ms. Fuller served as a member of the Advisory Board of certain Fidelity® funds (2018-2020), Chief Investment Officer of the New York State Common Retirement Fund (2012-2018) and held a variety of positions at AllianceBernstein L.P. (global asset management, 1985-2012), including Managing Director (2006-2012) and Senior Vice President and Senior Portfolio Manager (2001-2006). Ms. Fuller currently serves as a member of the Board, Audit Committee and Nominating and Governance Committee of two Blackstone business development companies (2020-present), as a member of the Board of Treliant, LLC (consulting, 2019-present), as a member of the Board of Ariel Alternatives, LLC (private equity, 2022-present) and as a member of the Board and Chair of the Audit Committee of Gusto, Inc. (software, 2021-present). In addition, Ms. Fuller currently serves as a member of the Board of Roosevelt University (2019-present) and as a member of the Executive Board of New York University's Stern School of Business. Ms. Fuller previously served as a member of the Board, Audit Committee and Nominating and Governance Committee of The Williams Companies, Inc. (natural gas infrastructure, 2018-2021).
Patricia L. Kampling (1959)
Year of Election or Appointment: 2020
Trustee
Ms. Kampling also serves as Trustee of other Fidelity® funds. Prior to her retirement, Ms. Kampling served as Chairman of the Board and Chief Executive Officer (2012-2019), President and Chief Operating Officer (2011-2012) and Executive Vice President and Chief Financial Officer (2010-2011) of Alliant Energy Corporation. Ms. Kampling currently serves as a member of the Board, Finance Committee and Governance, Compensation and Nominating Committee of Xcel Energy Inc. (utilities company, 2020-present) and as a member of the Board, Audit, Finance and Risk Committee and Safety, Environmental, Technology and Operations Committee and Chair of the Executive Development and Compensation Committee of American Water Works Company, Inc. (utilities company, 2019-present). In addition, Ms. Kampling currently serves as a member of the Board of the Nature Conservancy, Wisconsin Chapter (2019-present). Previously, Ms. Kampling served as a Member of the Advisory Board of certain Fidelity® funds (2020), a member of the Board, Compensation Committee and Executive Committee and Chair of the Audit Committee of Briggs & Stratton Corporation (manufacturing, 2011-2021), a member of the Board of Interstate Power and Light Company (2012-2019) and Wisconsin Power and Light Company (2012-2019) (each a subsidiary of Alliant Energy Corporation) and as a member of the Board and Workforce Development Committee of the Business Roundtable (2018-2019).
Thomas A. Kennedy (1955)
Year of Election or Appointment: 2021
Trustee
Mr. Kennedy also serves as Trustee of other Fidelity® funds. Previously, Mr. Kennedy served as a Member of the Advisory Board of certain Fidelity® funds (2020) and held a variety of positions at Raytheon Company (aerospace and defense, 1983-2020), including Chairman and Chief Executive Officer (2014-2020) and Executive Vice President and Chief Operating Officer (2013-2014). Mr. Kennedy served as Executive Chairman of the Board of Directors of Raytheon Technologies Corporation (aerospace and defense, 2020-2021). Mr. Kennedy serves as a Director of the Board of Directors of Textron Inc. (aerospace and defense, 2023-present).
Oscar Munoz (1959)
Year of Election or Appointment: 2021
Trustee
Mr. Munoz also serves as Trustee of other Fidelity® funds. Prior to his retirement, Mr. Munoz served as Executive Chairman (2020-2021), Chief Executive Officer (2015-2020), President (2015-2016) and a member of the Board (2010-2021) of United Airlines Holdings, Inc. Mr. Munoz currently serves as a member of the Board of CBRE Group, Inc. (commercial real estate, 2020-present), a member of the Board of Univision Communications, Inc. (Hispanic media, 2020-present), a member of the Board of Archer Aviation Inc. (2021-present), a member of the Defense Business Board of the United States Department of Defense (2021-present) and a member of the Board of Salesforce.com, Inc. (cloud-based software, 2022-present). Previously, Mr. Munoz served as a Member of the Advisory Board of certain Fidelity® funds (2021).
David M. Thomas (1949)
Year of Election or Appointment: 2008
Trustee
Lead Independent Trustee
Mr. Thomas also serves as Trustee of other Fidelity® funds. Previously, Mr. Thomas served as Executive Chairman (2005-2006) and Chairman and Chief Executive Officer (2000-2005) of IMS Health, Inc. (pharmaceutical and healthcare information solutions). Mr. Thomas currently serves as a member of the Board of Fortune Brands Home and Security (home and security products, 2004-present) and as Director (2013-present) and Non-Executive Chairman of the Board (2022-present) of Interpublic Group of Companies, Inc. (marketing communication).
Susan Tomasky (1953)
Year of Election or Appointment: 2020
Trustee
Ms. Tomasky also serves as Trustee of other Fidelity® funds. Prior to her retirement, Ms. Tomasky served in various executive officer positions at American Electric Power Company, Inc. (1998-2011), including most recently as President of AEP Transmission (2007-2011). Ms. Tomasky currently serves as a member of the Board and Sustainability Committee and as Chair of the Audit Committee of Marathon Petroleum Corporation (2018-present) and as a member of the Board, Executive Committee, Corporate Governance Committee and Organization and Compensation Committee and as Lead Director of the Board of Public Service Enterprise Group, Inc. (utilities company, 2012-present) and as a member of the Board of its subsidiary company, Public Service Electric and Gas Co. (2021-present). In addition, Ms. Tomasky currently serves as a member (2009-present) and President (2020-present) of the Board of the Royal Shakespeare Company - America (2009-present), as a member of the Board of the Columbus Association for the Performing Arts (2011-present) and as a member of the Board and Kenyon in the World Committee of Kenyon College (2016-present). Previously, Ms. Tomasky served as a Member of the Advisory Board of certain Fidelity® funds (2020), as a member of the Board of the Columbus Regional Airport Authority (2007-2020), as a member of the Board (2011-2018) and Lead Independent Director (2015-2018) of Andeavor Corporation (previously Tesoro Corporation) (independent oil refiner and marketer) and as a member of the Board of Summit Midstream Partners LP (energy, 2012-2018).
Michael E. Wiley (1950)
Year of Election or Appointment: 2018
Trustee
Mr. Wiley also serves as Trustee of other Fidelity® funds. Previously, Mr. Wiley served as a member of the Advisory Board of certain Fidelity® funds (2018-2020), Chairman, President and CEO of Baker Hughes, Inc. (oilfield services, 2000-2004). Mr. Wiley also previously served as a member of the Board of Andeavor Corporation (independent oil refiner and marketer, 2005-2018), a member of the Board of Andeavor Logistics LP (natural resources logistics, 2015-2018) and a member of the Board of High Point Resources (exploration and production, 2005-2020).
+ The information includes the Trustee's principal occupation during the last five years and other information relating to the experience, attributes, and skills relevant to the Trustee's qualifications to serve as a Trustee, which led to the conclusion that the Trustee should serve as a Trustee for each fund.
Advisory Board Members and Officers:
Correspondence intended for a Member of the Advisory Board (if any) may be sent to Fidelity Investments, P.O. Box 55235, Boston, Massachusetts 02205-5235. Correspondence intended for an officer or Peter S. Lynch may be sent to Fidelity Investments, 245 Summer Street, Boston, Massachusetts 02210.
Name, Year of Birth; Principal Occupation
Peter S. Lynch (1944)
Year of Election or Appointment: 2003
Member of the Advisory Board
Mr. Lynch also serves as a Member of the Advisory Board of other Fidelity® funds. Mr. Lynch is Vice Chairman and a Director of Fidelity Management & Research Company LLC (investment adviser firm). In addition, Mr. Lynch serves as a Trustee of Boston College and as the Chairman of the Inner-City Scholarship Fund. Previously, Mr. Lynch served as Vice Chairman and a Director of FMR Co., Inc. (investment adviser firm) and on the Special Olympics International Board of Directors (1997-2006).
Karen B. Peetz (1955)
Year of Election or Appointment: 2023
Member of the Advisory Board
Ms. Peetz also serves as a Member of the Advisory Board of other funds. Previously, Ms. Peetz served as Chief Administration Officer (2020-2023) of Citigroup Inc. (a diversified financial service company). She also served in various capacities at Bank of New York Mellon Corporation, including President (2013-2016), Vice Chairman, Senior Executive Vice President and Chief Executive Officer of Financial Markets & Treasury Services (2010-2013), Senior Executive Vice President and Chief Executive Officer of Global Corporate Trust (2003-2008), Senior Vice President and Division Manager of Global Payments & Trade Services (2002-2003) and Senior Vice President and Division Manager of Domestic Corporate Trust (1998-2002). Ms. Peetz also served in various capacities at Chase Manhattan Corporation (1982-1998), including Senior Vice President and Manager of Corporate Trust International Business (1996-1998), Managing Director and Manager of Corporate Trust Services (1994-1996) and Managing Director and Group Manager of Financial Institution Sales (1990-1993). Ms. Peetz currently serves as Chair of Amherst Holdings Advisory Council (2018-present), Trustee of Johns Hopkins University (2016-present), Chair of the Carey Business School Advisory Council, Member of the Johns Hopkins Medicine Board and Finance Committee and Chair of the Lyme and Tick Related Disease Institute Advisory Council. Ms. Peetz previously served as a member of the Board of Guardian Life Insurance Company of America (2019-2023), a member of the Board of Trane Technologies (2018-2022), a member of the Board of Wells Fargo Corp. (2017-2019), a member of the Board of SunCoke Energy Inc. (2012-2016), a member of the Board of Private Export Funding Corporation (2010-2016) and as a Trustee of Penn State University (2010-2014) and the United Way of New York City (2008-2010).
Heather Bonner (1977)
Year of Election or Appointment: 2023
Assistant Treasurer
Ms. Bonner also serves as an officer of other funds. Ms. Bonner is a Senior Vice President (2022-present) and is an employee of Fidelity Investments (2022-present). Ms. Bonner serves as Vice President, Treasurer, or Assistant Treasurer of certain Fidelity entities. Prior to joining Fidelity, Ms. Bonner served as Managing Director at AQR Capital Management (2013-2022) and was the Treasurer and Principal Financial Officer of the AQR Funds (2013-2022).
Craig S. Brown (1977)
Year of Election or Appointment: 2022
Deputy Treasurer
Mr. Brown also serves as an officer of other funds. Mr. Brown is a Vice President (2015-present) and is an employee of Fidelity Investments. Mr. Brown serves as Assistant Treasurer of FIMM, LLC (2021-present). Previously, Mr. Brown served as Assistant Treasurer of certain Fidelity® funds (2019-2022).
John J. Burke III (1964)
Year of Election or Appointment: 2018
Chief Financial Officer
Mr. Burke also serves as Chief Financial Officer of other funds. Mr. Burke is Head of Fidelity Fund and Investment Operations (2018-present) and is an employee of Fidelity Investments. Mr. Burke serves as President, Executive Vice President, or Director of certain Fidelity entities. Previously Mr. Burke served as head of Asset Management Investment Operations (2012-2018).
Margaret Carey (1973)
Year of Election or Appointment: 2023
Secretary and Chief Legal Officer (CLO)
Ms. Carey also serves as an officer of other funds and as CLO of certain Fidelity entities. Ms. Carey is a Senior Vice President, Deputy General Counsel (2019-present) and is an employee of Fidelity Investments.
William C. Coffey (1969)
Year of Election or Appointment: 2019
Assistant Secretary
Mr. Coffey also serves as Assistant Secretary of other funds. Mr. Coffey is a Senior Vice President, Deputy General Counsel (2010-present) and is an employee of Fidelity Investments. Previously, Mr. Coffey served as Secretary and CLO of certain funds (2018-2019); CLO, Secretary, or Senior Vice President of certain Fidelity entities and Assistant Secretary of certain funds (2009-2018).
Timothy M. Cohen (1969)
Year of Election or Appointment: 2018
Vice President
Mr. Cohen also serves as Vice President of other funds. Mr. Cohen is Co-Head of Equity (2018-present) and is an employee of Fidelity Investments. Mr. Cohen serves as Director of Fidelity Management & Research (Japan) Limited (investment adviser firm, 2016-present). Previously, Mr. Cohen served as Executive Vice President of Fidelity SelectCo, LLC (2019) and Head of Global Equity Research (2016-2018).
Jonathan Davis (1968)
Year of Election or Appointment: 2010
Assistant Treasurer
Mr. Davis also serves as an officer of other funds. Mr. Davis is a Vice President (2006-present) and is an employee of Fidelity Investments. Mr. Davis serves as Assistant Treasurer of certain Fidelity entities.
Laura M. Del Prato (1964)
Year of Election or Appointment: 2018
Assistant Treasurer
Ms. Del Prato also serves as an officer of other funds. Ms. Del Prato is a Senior Vice President (2017-present) and is an employee of Fidelity Investments. Ms. Del Prato serves as Vice President or Assistant Treasurer of certain Fidelity entities. Previously, Ms. Del Prato served as President and Treasurer of The North Carolina Capital Management Trust: Cash Portfolio and Term Portfolio (2018-2020).
Colm A. Hogan (1973)
Year of Election or Appointment: 2020
Assistant Treasurer
Mr. Hogan also serves as an officer of other funds. Mr. Hogan is a Vice President (2016-present) and is an employee of Fidelity Investments. Mr. Hogan serves as Assistant Treasurer of certain Fidelity entities. Previously, Mr. Hogan served as Deputy Treasurer of certain Fidelity® funds (2016-2020) and Assistant Treasurer of certain Fidelity® funds (2016-2018).
Pamela R. Holding (1964)
Year of Election or Appointment: 2018
Vice President
Ms. Holding also serves as Vice President of other funds. Ms. Holding is Co-Head of Equity (2018-present) and is an employee of Fidelity Investments. Previously, Ms. Holding served as Executive Vice President of Fidelity SelectCo, LLC (2019) and as Chief Investment Officer of Fidelity Institutional Asset Management (2013-2018).
Chris Maher (1972)
Year of Election or Appointment: 2020
Deputy Treasurer
Mr. Maher also serves as an officer of other funds. Mr. Maher is a Vice President (2008-present) and is an employee of Fidelity Investments. Mr. Maher serves as Assistant Treasurer of certain Fidelity entities. Previously, Mr. Maher served as Assistant Treasurer of certain funds (2013-2020).
Jason P. Pogorelec (1975)
Year of Election or Appointment: 2020
Chief Compliance Officer
Mr. Pogorelec also serves as Chief Compliance Officer of other funds. Mr. Pogorelec is a Senior Vice President of Asset Management Compliance (2020-present) and is an employee of Fidelity Investments. Mr. Pogorelec serves as Compliance Officer of Fidelity Management & Research Company LLC (investment adviser firm, 2023-present) and Ballyrock Investment Advisors LLC (2023-present). Previously, Mr. Pogorelec served as a Vice President, Associate General Counsel for Fidelity Investments (2010-2020) and Assistant Secretary of certain Fidelity® funds (2015-2020).
Brett Segaloff (1972)
Year of Election or Appointment: 2021
Anti-Money Laundering (AML) Officer
Mr. Segaloff also serves as AML Officer of other funds. Mr. Segaloff is a Vice President (2022-present) and is an employee of Fidelity Investments. Mr. Segaloff serves as Anti Money Laundering Compliance Officer or Anti Money Laundering/Bank Secrecy Act Compliance Officer of certain Fidelity entities.
Stacie M. Smith (1974)
Year of Election or Appointment: 2016
President and Treasurer
Ms. Smith also serves as an officer of other funds. Ms. Smith is a Senior Vice President (2016-present) and is an employee of Fidelity Investments. Ms. Smith serves as Assistant Treasurer of certain Fidelity entities and has served in other fund officer roles.
Jim Wegmann (1979)
Year of Election or Appointment: 2019
Assistant Treasurer
Mr. Wegmann also serves as an officer of other funds. Mr. Wegmann is a Vice President (2016-present) and is an employee of Fidelity Investments. Mr. Wegmann serves as Assistant Treasurer of FIMM, LLC (2021-present). Previously, Mr. Wegmann served as Assistant Treasurer of certain Fidelity® funds (2019-2021).
As a shareholder, you incur two types of costs: (1) transaction costs, which may include sales charges (loads) on purchase payments or redemption proceeds, as applicable and (2) ongoing costs, which generally include management fees, distribution and/or service (12b-1) fees and other Fund expenses. This Example is intended to help you understand your ongoing costs (in dollars) of investing in a fund and to compare these costs with the ongoing costs of investing in other mutual funds.
| The Example is based on an investment of $1,000 invested at the beginning of the period and held for the entire period (July 1, 2023 to December 31, 2023). |
Actual Expenses
The first line of the accompanying table provides information about actual account values and actual expenses. You may use the information in this line, together with the amount you invested, to estimate the expenses that you paid over the period. Simply divide your account value by $1,000.00 (for example, an $8,600 account value divided by $1,000.00 = 8.6), then multiply the result by the number in the first line for a class/Fund under the heading entitled "Expenses Paid During Period" to estimate the expenses you paid on your account during this period. If any fund is a shareholder of any underlying mutual funds or exchange-traded funds (ETFs) (the Underlying Funds), such fund indirectly bears its proportional share of the expenses of the Underlying Funds in addition to the direct expenses incurred presented in the table. These fees and expenses are not included in the annualized expense ratio used to calculate the expense estimate in the table below.
Hypothetical Example for Comparison Purposes
The second line of the accompanying table provides information about hypothetical account values and hypothetical expenses based on the actual expense ratio and an assumed rate of return of 5% per year before expenses, which is not the actual return. The hypothetical account values and expenses may not be used to estimate the actual ending account balance or expenses you paid for the period. You may use this information to compare the ongoing costs of investing in the Fund and other funds. To do so, compare this 5% hypothetical example with the 5% hypothetical examples that appear in the shareholder reports of the other funds. If any fund is a shareholder of any Underlying Funds, such fund indirectly bears its proportional share of the expenses of the Underlying Funds in addition to the direct expenses as presented in the table. These fees and expenses are not included in the annualized expense ratio used to calculate the expense estimate in the table below.
Please note that the expenses shown in the table are meant to highlight your ongoing costs only and do not reflect any transaction costs. Therefore, the second line of the table is useful in comparing ongoing costs only, and will not help you determine the relative total costs of owning different funds. In addition, if these transactional costs were included, your costs would have been higher.
| | | | | Annualized Expense Ratio- A | | Beginning Account Value July 1, 2023 | | Ending Account Value December 31, 2023 | | Expenses Paid During Period- C July 1, 2023 to December 31, 2023 |
| | | | | | | | | | |
| Fidelity® Series Emerging Markets Debt Fund | | | | .01% | | | | | | |
| Actual | | | | | | $ 1,000 | | $ 1,083.00 | | $ .05 |
Hypothetical-B | | | | | | $ 1,000 | | $ 1,025.16 | | $ .05 |
| | | | | | | | | | |
| Fidelity® Series Emerging Markets Debt Local Currency Fund | | | | -%-D | | | | | | |
| Actual | | | | | | $ 1,000 | | $ 1,049.50 | | $-E |
Hypothetical-B | | | | | | $ 1,000 | | $ 1,025.21 | | $-E |
| |
A Annualized expense ratio reflects expenses net of applicable fee waivers.
B 5% return per year before expenses
C Expenses are equal to the annualized expense ratio, multiplied by the average account value over the period, multiplied by 184/ 365 (to reflect the one-half year period). The fees and expenses of any Underlying Funds are not included in each annualized expense ratio.
D Amount represents less than .005%.
E Amount represents less than $.005.
The dividend and capital gains distributions for the fund(s) are available on Fidelity.com or Institutional.Fidelity.com.
A percentage of the dividends distributed during the fiscal year for the following funds were derived from interest on U.S. Government securities which is generally exempt from state income tax:
| Fidelity Series Emerging Markets Debt Fund | 2.55% |
| Fidelity Series Emerging Markets Debt Local Currency Fund | 0.61% |
The funds hereby designate the amounts noted below as distributions paid during the fiscal year ended 2023 as qualifying to be taxed as section 163(j) interest dividends:
| Fidelity Series Emerging Markets Debt Fund | $75,052,906 |
| Fidelity Series Emerging Markets Debt Local Currency Fund | $20,583,150 |
The funds will notify shareholders in January 2024 of amounts for use in preparing 2023 income tax returns.
Board Approval of Investment Advisory Contracts and Management Fees
Fidelity Series Emerging Markets Debt FundFidelity Series Emerging Markets Debt Local Currency Fund
Each year, the Board of Trustees, including the Independent Trustees (together, the Board), considers the renewal of each fund's management contract with Fidelity Management & Research Company LLC (FMR) and the sub-advisory agreements (together, the Advisory Contracts) for each fund. FMR and the sub-advisers are referred to herein as the Investment Advisers. The Board, assisted by the advice of fund counsel and Independent Trustees' counsel, requests and considers a broad range of information relevant to the renewal of the Advisory Contracts throughout the year.
The Board meets regularly and, at each of its meetings, covers an extensive agenda of topics and materials and considers factors that are relevant to its annual consideration of the renewal of each fund's Advisory Contracts, including the services and support provided to each fund and its shareholders. The Board, acting directly and through its Committees (each of which is composed of and chaired by Independent Trustees), requests and receives information concerning the annual consideration of the renewal of each fund's Advisory Contracts. The Board also meets as needed to review matters specifically related to the Board's annual consideration of the renewal of the Advisory Contracts. Members of the Board may also meet with trustees of other Fidelity funds through joint ad hoc committees to discuss certain matters relevant to all of the Fidelity funds.
At its July 2023 meeting, the Board unanimously determined to renew each fund's Advisory Contracts. In considering whether to renew the Advisory Contracts for each fund, the Board considered all factors it believed relevant and reached a determination, with the assistance of fund counsel and Independent Trustees' counsel and through the exercise of its business judgment, that the renewal of the Advisory Contracts was in the best interests of each fund and its shareholders and the fact that no fee is payable under the management contracts was fair and reasonable in light of all of the surrounding circumstances.
Nature, Extent, and Quality of Services Provided. The Board considered staffing as it relates to the funds, including the backgrounds and experience of investment personnel of the Investment Advisers, and also considered the Investment Advisers' implementation of each fund's investment program. The Independent Trustees also had discussions with senior management of Fidelity's investment operations and investment groups. The Board considered the structure of the investment personnel compensation program and whether this structure provides appropriate incentives to act in the best interests of each fund.
Resources Dedicated to Investment Management and Support Services. The Board and the Fund Oversight and Research Committees reviewed the general qualifications and capabilities of Fidelity's investment staff, including its size, education, experience, and resources, as well as Fidelity's approach to recruiting, training, managing, and compensating investment personnel. The Board noted the resources devoted to expansion of Fidelity's global investment organization, and that Fidelity's analysts have extensive resources, tools and capabilities that allow them to conduct sophisticated quantitative and fundamental analysis, as well as credit analysis of issuers, counterparties and guarantors. Further, the Board considered that Fidelity's investment professionals have sufficient access to global information and data so as to provide competitive investment results over time, and that those professionals also have access to sophisticated tools that permit them to assess portfolio construction and risk and performance attribution characteristics continuously, as well as to transmit new information and research conclusions rapidly around the world. Additionally, in its deliberations, the Board considered Fidelity's trading, risk management, compliance, and technology and operations capabilities and resources, which are integral parts of the investment management process.
Administrative Services. The Board considered (i) the nature, extent, quality, and cost of advisory and administrative services performed by the Investment Advisers and their affiliates under the Advisory Contracts and under separate agreements covering transfer agency, pricing and bookkeeping, and securities lending services for each fund; (ii) the nature and extent of Fidelity's supervision of third party service providers, principally custodians, subcustodians, and pricing vendors; and (iii) the resources devoted by Fidelity to, and the record of compliance with, each fund's compliance policies and procedures. The Board also reviewed the allocation of fund brokerage, including allocations to brokers affiliated with the Investment Advisers, the use of brokerage commissions to pay fund expenses, and the use of "soft" commission dollars to pay for research services. The Board also considered each fund's securities lending activities and any payments made to Fidelity relating to securities lending.
Investment Performance. The Board reviewed each fund's absolute investment performance, as well as each fund's relative investment performance. The Board did not consider performance to be a material factor in its decision to renew each fund's Advisory Contracts, as the funds are not publicly offered as a stand-alone investment product. In this regard, the Board noted that each fund is designed to offer an investment option for other investment companies, 529 plans, and collective investment trusts managed by Fidelity and ultimately to enhance the performance of those investment companies, 529 plans, and collective investment trusts.
Based on its review, the Board concluded that the nature, extent, and quality of services provided to each fund under the Advisory Contracts should continue to benefit the shareholders of each fund.
Competitiveness of Management Fee and Total Expense Ratio. The Board considered that each fund does not pay FMR a management fee for investment advisory services, but that FMR receives fees for providing services to funds that invest in each fund. The Board noted that FMR or an affiliate undertakes to pay all operating expenses of the fund, except transfer agent fees, 12b-1 fees, Independent Trustee fees and expenses, custodian fees and expenses, proxy and shareholder meeting expenses, interest, taxes, and extraordinary expenses (such as litigation expenses). The Board further noted that each fund pays its non-operating expenses, including brokerage commissions and fees and expenses associated with the fund's securities lending program, if applicable.
The Board further considered that FMR has contractually agreed to reimburse each fund to the extent that total operating expenses, with certain exceptions, as a percentage of its average net assets, exceed 0.003% through April 30, 2026.
Based on its review, the Board considered that each fund does not pay a management fee and concluded that the total expense ratio of each fund was reasonable in light of the services that each fund and its shareholders receive and the other factors considered.
Costs of the Services and Profitability. The Board considered the level of Fidelity's profits in respect of all the Fidelity funds.
A public accounting firm has been engaged annually by the Board as part of the Board's assessment of Fidelity's profitability analysis. The engagement includes the review and assessment of the methodologies used by Fidelity in determining the revenues and expenses attributable to Fidelity's fund business, and completion of agreed-upon procedures in respect of the mathematical accuracy of certain fund profitability information and its conformity to established allocation methodologies. After considering the reports issued under the engagement and information provided by Fidelity, the Board concluded that while other allocation methods may also be reasonable, Fidelity's profitability methodologies are reasonable in all material respects.
The Board also reviewed Fidelity's non-fund businesses and potential indirect benefits such businesses may have received as a result of their association with Fidelity's fund business (i.e., fall-out benefits) as well as cases where Fidelity's affiliates may benefit from the funds' business. The Board considered areas where potential indirect benefits to the Fidelity funds from their relationships with Fidelity may exist. The Board's consideration of these matters was informed by the findings of a joint ad hoc committee created by it and the boards of other Fidelity funds to evaluate potential fall-out benefits.
The Board concluded that the costs of the services provided by and the profits realized by Fidelity in connection with the operation of each fund were not relevant to the renewal of the Advisory Contracts because each fund pays no advisory fees and FMR bears all expenses of each fund with certain exceptions.
Economies of Scale. The Board concluded that because each fund pays no advisory fees and FMR bears all expenses of each fund with certain exceptions, the realization of economies of scale was not a material factor in the Board's decision to renew each fund's Advisory Contract.
Additional Information Requested by the Board. In order to develop fully the factual basis for consideration of the Fidelity funds' advisory contracts, the Board requested and received additional information on certain topics, including: (i) fund flow and performance trends, in particular the underperformance of certain funds and strategies, and Fidelity's long-term strategies for certain funds, including any consideration of fund liquidations or mergers; (ii) the operation of performance fees and competitor use of performance fees; (iii) Fidelity's pricing philosophy compared to competitors; (iv) fund profitability methodology and data; (v) evaluation of competitive fund data and peer group classifications and fee and expense comparisons; (vi) the management fee and expense structures for different funds and classes and information about the differences between various fee and expense structures; (vii) group fee breakpoints and related voluntary fee waivers; and (viii) information regarding other accounts managed by Fidelity and the funds' sub-advisory arrangements.
Conclusion. Based on its evaluation of all of the conclusions noted above, and after considering all factors it believed relevant, the Board, including the Independent Trustees, concluded that the advisory and sub-advisory fee arrangements are fair and reasonable in light of all of the surrounding circumstances and that each fund's Advisory Contracts should be renewed through July 31, 2024.
1.924250.112
SED-ANN-0224
Item 2.
Code of Ethics
As of the end of the period, December 31, 2023, Fidelity Hastings Street Trust (the trust) has adopted a code of ethics, as defined in Item 2 of Form N-CSR, that applies to its President and Treasurer and its Chief Financial Officer. A copy of the code of ethics is filed as an exhibit to this Form N-CSR.
Item 3.
Audit Committee Financial Expert
The Board of Trustees of the trust has determined that Donald F. Donahue is an audit committee financial expert, as defined in Item 3 of Form N-CSR. Mr. Donahue is independent for purposes of Item 3 of Form N-CSR.
Item 4.
Principal Accountant Fees and Services
Fees and Services
The following table presents fees billed by PricewaterhouseCoopers LLP (“PwC”) in each of the last two fiscal years for services rendered to Fidelity Series Emerging Markets Debt Fund and Fidelity Series Emerging Markets Debt Local Currency Fund (the “Funds”):
Services Billed by PwC
December 31, 2023 FeesA
| | | | |
| Audit Fees | Audit-Related Fees | Tax Fees | All Other Fees |
Fidelity Series Emerging Markets Debt Fund | $53,400 | $4,400 | $10,300 | $1,500 |
Fidelity Series Emerging Markets Debt Local Currency Fund | $52,500 | $4,400 | $9,800 | $1,500 |
| | | | |
| Audit Fees | Audit-Related Fees | Tax Fees | All Other Fees |
Fidelity Series Emerging Markets Debt Fund | $50,300 | $4,400 | $9,300 | $1,500 |
Fidelity Series Emerging Markets Debt Local Currency Fund | $49,900 | $4,400 | $9,300 | $1,500 |
A Amounts may reflect rounding.
The following table(s) present(s) fees billed by PwC that were required to be approved by the Audit Committee for services that relate directly to the operations and financial reporting of the Fund(s) and that are rendered on behalf of Fidelity Management & Research Company LLC ("FMR") and entities controlling, controlled by, or under common control with FMR (not including any sub-adviser whose role is primarily portfolio management and is subcontracted with or overseen by another investment adviser) that provide ongoing services to the Fund(s) (“Fund Service Providers”):
Services Billed by PwC
| | |
| December 31, 2023A | December 31, 2022A |
Audit-Related Fees | $8,284,200 | $7,914,600 |
Tax Fees | $1,000 | $1,000 |
All Other Fees | $- | $- |
A Amounts may reflect rounding.
“Audit-Related Fees” represent fees billed for assurance and related services that are reasonably related to the performance of the fund audit or the review of the fund's financial statements and that are not reported under Audit Fees.
“Tax Fees” represent fees billed for tax compliance, tax advice or tax planning that relate directly to the operations and financial reporting of the fund.
“All Other Fees” represent fees billed for services provided to the fund or Fund Service Provider, a significant portion of which are assurance related, that relate directly to the operations and financial reporting of the fund, excluding those services that are reported under Audit Fees, Audit-Related Fees or Tax Fees.
Assurance services must be performed by an independent public accountant.
* * *
The aggregate non-audit fees billed by PwC for services rendered to the Fund(s), FMR (not including any sub-adviser whose role is primarily portfolio management and is subcontracted with or overseen by another investment adviser), and any Fund Service Provider for each of the last two fiscal years of the Fund(s) are as follows:
| | |
Billed By | December 31, 2023A | December 31, 2022A |
PwC | $13,619,700 | $12,913,400 |
A Amounts may reflect rounding.
The trust's Audit Committee has considered non-audit services that were not pre-approved that were provided by PwC to Fund Service Providers to be compatible with maintaining the independence of PwC in its(their) audit of the Fund(s), taking into account representations from PwC, in accordance with Public Company Accounting Oversight Board rules, regarding its independence from the Fund(s) and its(their) related entities and FMR’s review of the appropriateness and permissibility under applicable law of such non-audit services prior to their provision to the Fund(s) Service Providers.
Audit Committee Pre-Approval Policies and Procedures
The trust’s Audit Committee must pre-approve all audit and non-audit services provided by a fund’s independent registered public accounting firm relating to the operations or financial reporting of the fund. Prior to the commencement of any audit or non-audit services to a fund, the Audit Committee reviews the services to determine whether they are appropriate and permissible under applicable law.
The Audit Committee has adopted policies and procedures to, among other purposes, provide a framework for the Committee’s consideration of non-audit services by the audit firms that audit the Fidelity funds. The policies and procedures require that any non-audit service provided by a fund audit firm to a Fidelity fund and any non-audit service provided by a fund auditor to a Fund Service Provider that relates directly to the operations and financial reporting of a Fidelity fund (“Covered Service”) are subject to approval by the Audit Committee before such service is provided.
All Covered Services must be approved in advance of provision of the service either: (i) by formal resolution of the Audit Committee, or (ii) by oral or written approval of the service by the Chair of the Audit Committee (or if the Chair is unavailable, such other member of the Audit Committee as may be designated by the Chair to act in the Chair’s absence). The approval contemplated by (ii) above is permitted where the Treasurer determines that action on such an engagement is necessary before the next meeting of the Audit Committee.
Non-audit services provided by a fund audit firm to a Fund Service Provider that do not relate directly to the operations and financial reporting of a Fidelity fund are reported to the Audit Committee periodically.
Non-Audit Services Approved Pursuant to Rule 2-01(c)(7)(i)(C) and (ii) of Regulation S-X (“De Minimis Exception”)
There were no non-audit services approved or required to be approved by the Audit Committee pursuant to the De Minimis Exception during the Fund’s(s’) last two fiscal
years relating to services provided to (i) the Fund(s) or (ii) any Fund Service Provider that relate directly to the operations and financial reporting of the Fund(s).
The Registrant has not retained, for the preparation of the audit report on the financial statements included in the Form N-CSR, a registered public accounting firm that has a branch or office that is located in a foreign jurisdiction and that the Public Company Accounting Oversight Board (the “PCAOB”) has determined that the PCAOB is unable to inspect or investigate completely because of a position taken by an authority in the foreign jurisdiction.
The Registrant is not a “foreign issuer,” as defined in 17 CFR 240.3b-4.
Item 5.
Audit Committee of Listed Registrants
Not applicable.
Item 6.
Investments
(a)
Not applicable.
(b)
Not applicable.
Item 7.
Disclosure of Proxy Voting Policies and Procedures for Closed-End Management Investment Companies
Not applicable.
Item 8.
Portfolio Managers of Closed-End Management Investment Companies
Not applicable.
Item 9.
Purchase of Equity Securities by Closed-End Management Investment Company and Affiliated Purchasers
Not applicable.
Item 10.
Submission of Matters to a Vote of Security Holders
There were no material changes to the procedures by which shareholders may recommend nominees to the trust’s Board of Trustees.
Item 11.
Controls and Procedures
(a)(i) The President and Treasurer and the Chief Financial Officer have concluded that the trust’s disclosure controls and procedures (as defined in Rule 30a-3(c) under the Investment Company Act) provide reasonable assurances that material information
relating to the trust is made known to them by the appropriate persons, based on their evaluation of these controls and procedures as of a date within 90 days of the filing date of this report.
(a)(ii) There was no change in the trust’s internal control over financial reporting (as defined in Rule 30a-3(d) under the Investment Company Act) that occurred during the period covered by this report that has materially affected, or is reasonably likely to materially affect, the trust’s internal control over financial reporting.
Item 12.
Disclosure of Securities Lending Activities for Closed-End Management
Investment Companies
Not applicable.
Item 18.
Recovery of Erroneously Awarded Compensation
(a)
Not applicable.
(b)
Not applicable.
Item 19.
Exhibits
SIGNATURES
Pursuant to the requirements of the Securities Exchange Act of 1934 and the Investment Company Act of 1940, the registrant has duly caused this report to be signed on its behalf by the undersigned, thereunto duly authorized.
Fidelity Hastings Street Trust
| |
By: | /s/Stacie M. Smith |
| Stacie M. Smith |
| President and Treasurer |
|
|
Date: | February 22, 2024 |
Pursuant to the requirements of the Securities Exchange Act of 1934 and the Investment Company Act of 1940, this report has been signed below by the following persons on behalf of the registrant and in the capacities and on the dates indicated.
| |
By: | /s/Stacie M. Smith |
| Stacie M. Smith |
| President and Treasurer |
|
|
Date: | February 22, 2024 |
| |
By: | /s/John J. Burke III |
| John J. Burke III |
| Chief Financial Officer |
|
|
Date: | February 22, 2024 |