UNITED STATES
SECURITIES AND EXCHANGE COMMISSION
Washington, D.C. 20549
FORM N-CSR
CERTIFIED SHAREHOLDER REPORT OF REGISTERED
MANAGEMENT INVESTMENT COMPANIES
Investment Company Act file number 811-00215
Fidelity Hastings Street Trust
(Exact name of registrant as specified in charter)
245 Summer St., Boston, Massachusetts 02210
(Address of principal executive offices) (Zip code)
Cynthia Lo Bessette, Secretary
245 Summer St.
Boston, Massachusetts 02210
(Name and address of agent for service)
Registrant's telephone number, including area code:
617-563-7000
Date of fiscal year end: | June 30 |
Date of reporting period: | June 30, 2022 |
Item 1.
Reports to Stockholders
Fidelity® Series Large Cap Stock Fund
June 30, 2022

Contents
Board Approval of Investment Advisory Contracts and Management Fees | |
To view a fund's proxy voting guidelines and proxy voting record for the 12-month period ended June 30, visit http://www.fidelity.com/proxyvotingresults or visit the Securities and Exchange Commission's (SEC) web site at http://www.sec.gov.
You may also call 1-800-544-8544 to request a free copy of the proxy voting guidelines.
Standard & Poor's, S&P and S&P 500 are registered service marks of The McGraw-Hill Companies, Inc. and have been licensed for use by Fidelity Distributors Corporation.
Other third-party marks appearing herein are the property of their respective owners.
All other marks appearing herein are registered or unregistered trademarks or service marks of FMR LLC or an affiliated company. © 2022 FMR LLC. All rights reserved.
This report and the financial statements contained herein are submitted for the general information of the shareholders of the Fund. This report is not authorized for distribution to prospective investors in the Fund unless preceded or accompanied by an effective prospectus.
A fund files its complete schedule of portfolio holdings with the SEC for the first and third quarters of each fiscal year on Form N-PORT. Forms N-PORT are available on the SEC’s web site at http://www.sec.gov. A fund's Forms N-PORT may be reviewed and copied at the SEC’s Public Reference Room in Washington, DC. Information regarding the operation of the SEC's Public Reference Room may be obtained by calling 1-800-SEC-0330.
For a complete list of a fund's portfolio holdings, view the most recent holdings listing, semiannual report, or annual report on Fidelity's web site at http://www.fidelity.com, http://www.institutional.fidelity.com, or http://www.401k.com, as applicable.
NOT FDIC INSURED •MAY LOSE VALUE •NO BANK GUARANTEE
Neither the Fund nor Fidelity Distributors Corporation is a bank.
Note to Shareholders:
Early in 2020, the outbreak and spread of COVID-19 emerged as a public health emergency that had a major influence on financial markets, primarily based on its impact on the global economy and corporate earnings. On March 11, 2020, the World Health Organization declared the COVID-19 outbreak a pandemic, citing sustained risk of further global spread. The pandemic prompted a number of measures to limit the spread of COVID-19, including travel and border restrictions, quarantines, and restrictions on large gatherings. In turn, these resulted in lower consumer activity, diminished demand for a wide range of products and services, disruption in manufacturing and supply chains, and – given the wide variability in outcomes regarding the outbreak – significant market uncertainty and volatility. To help stem the turmoil, the U.S. government took unprecedented action – in concert with the U.S. Federal Reserve and central banks around the world – to help support consumers, businesses, and the broader economy, and to limit disruption to the financial system.
In general, the overall impact of the pandemic lessened in 2021, amid a resilient economy and widespread distribution of three COVID-19 vaccines granted emergency use authorization from the U.S. Food and Drug Administration (FDA) early in the year. Still, the situation remains dynamic, and the extent and duration of its influence on financial markets and the economy is highly uncertain, due in part to a recent spike in cases based on highly contagious variants of the coronavirus.
Extreme events such as the COVID-19 crisis are exogenous shocks that can have significant adverse effects on mutual funds and their investments. Although multiple asset classes may be affected by market disruption, the duration and impact may not be the same for all types of assets. Fidelity is committed to helping you stay informed amid news about COVID-19 and during increased market volatility, and we continue to take extra steps to be responsive to customer needs. We encourage you to visit us online, where we offer ongoing updates, commentary, and analysis on the markets and our funds.
Performance: The Bottom Line
Average annual total return reflects the change in the value of an investment, assuming reinvestment of distributions from dividend income and capital gains (the profits earned upon the sale of securities that have grown in value, if any) and assuming a constant rate of performance each year. The hypothetical investment and the average annual total returns do not reflect the deduction of taxes that a shareholder would pay on fund distributions or the redemption of fund shares. During periods of reimbursement by Fidelity, a fund’s total return will be greater than it would be had the reimbursement not occurred. How a fund did yesterday is no guarantee of how it will do tomorrow.
Average Annual Total Returns
| For the periods ended June 30, 2022 | Past 1 year | Past 5 years | Life of fundA |
| Fidelity® Series Large Cap Stock Fund | (9.44)% | 9.76% | 11.34% |
A From December 6, 2012
Prior to August 1, 2013, the fund was named Fidelity® Series Mega Cap Fund, and the fund operated under certain different investment policies and compared its performance to a different additional index. The fund's historical performance may not represent its current investment policies.
$10,000 Over Life of Fund
Let's say hypothetically that $10,000 was invested in Fidelity® Series Large Cap Stock Fund on December 6, 2012, when the fund started.
The chart shows how the value of your investment would have changed, and also shows how the S&P 500® Index performed over the same period.

| Period Ending Values | ||
| $27,953 | Fidelity® Series Large Cap Stock Fund | |
| $32,239 | S&P 500® Index | |
Management's Discussion of Fund Performance
Market Recap: The S&P 500® index returned -10.62% for the 12 months ending June 30, 2022, as a multitude of crosscurrents challenged the global economy and financial markets. Persistently high inflation, exacerbated by energy price shocks from the Russia–Ukraine conflict, spurred the U.S. Federal Reserve to hike interest rates more aggressively than anticipated, and concerns about the outlook for economic growth sent stocks into bear market territory. Against this backdrop, the index returned -8.72% in April amid clearer signals of the Fed’s intention to tighten monetary policy. In early May, the Fed approved a rare half-percentage-point interest rate increase and announced plans to shrink its $9 trillion asset portfolio. The S&P 500® gained 0.18% for the month. June began with the Fed allowing up to billions in Treasuries and mortgage bonds to mature every month without investing the proceeds. Two weeks later, the central bank raised rates by 0.75 percentage points, its largest increase since 1994, and said it was becoming more difficult to achieve a soft landing, in which the economy slows enough to bring down inflation while avoiding a recession. Partly in reaction, the S&P 500 returned -8.25% in June and -19.96% since the end of 2021 – its worst first-half result to begin a year since 1970. For the full 12 months, the growth-oriented communication services (-29%) and consumer discretionary (-24%) sectors lagged most. In contrast, energy (+40%) rode a surge in commodity prices and led by a wide margin, followed by defensive sectors, such as utilities (+14%).Comments from Portfolio Manager Matt Fruhan: For the fiscal year ending June 30, 2022, the fund returned -9.44%, outperforming the -10.62% result of the benchmark, the S&P 500® index. Versus the benchmark, market selection was the primary contributor, especially an overweight in the energy sector. An underweight in consumer discretionary also boosted the fund's relative result. Also helping were stock picks in the health care sector, primarily driven by the health care equipment & services industry. The fund's biggest individual relative contributor was an overweight in Exxon Mobil, which gained about 43% the past 12 months. The company was among our largest holdings. Also lifting relative performance was an underweight in Amazon.com, which returned about -38%. This was a stake we established the past year. Another top relative contributor was an out-of-benchmark stake in Cenovus Energy (+101%). I'll note that the fund's foreign holdings contributed overall, despite continued U.S. dollar strength. Conversely, the largest detractor from performance versus the benchmark was stock selection in the industrials sector, primarily within the capital goods industry. An underweight in utilities and security selection in information technology also hurt the fund's relative result. The fund's biggest individual relative detractor was an outsized stake in General Electric, which returned roughly -41% the past 12 months. The company was among the fund's largest holdings. Also hindering performance was our overweight in Comcast, which returned -30%. Comcast was one of the fund's biggest holdings. Another notable relative detractor was an out-of-benchmark stake in Vertiv Holdings (-70%). Notable changes in positioning include increased exposure to the energy sector and a lower allocation to consumer discretionary.The views expressed above reflect those of the portfolio manager(s) only through the end of the period as stated on the cover of this report and do not necessarily represent the views of Fidelity or any other person in the Fidelity organization. Any such views are subject to change at any time based upon market or other conditions and Fidelity disclaims any responsibility to update such views. These views may not be relied on as investment advice and, because investment decisions for a Fidelity fund are based on numerous factors, may not be relied on as an indication of trading intent on behalf of any Fidelity fund.
Investment Summary (Unaudited)
Top Ten Stocks as of June 30, 2022
| % of fund's net assets | |
| Exxon Mobil Corp. | 6.8 |
| Microsoft Corp. | 6.2 |
| Wells Fargo & Co. | 5.1 |
| General Electric Co. | 4.9 |
| Apple, Inc. | 3.0 |
| Bank of America Corp. | 2.7 |
| Comcast Corp. Class A | 2.3 |
| Bristol-Myers Squibb Co. | 2.2 |
| Hess Corp. | 2.0 |
| UnitedHealth Group, Inc. | 1.6 |
| 36.8 |
Market Sectors as of June 30, 2022
| % of fund's net assets | |
| Information Technology | 17.4 |
| Financials | 15.6 |
| Health Care | 14.4 |
| Industrials | 12.5 |
| Energy | 12.5 |
| Communication Services | 8.3 |
| Consumer Staples | 5.1 |
| Consumer Discretionary | 3.5 |
| Materials | 2.5 |
| Real Estate | 0.7 |
| Utilities | 0.5 |
Asset Allocation (% of fund's net assets)
| As of June 30, 2022 | ||
| Stocks | 93.0% | |
| Other Investments | 0.1% | |
| Short-Term Investments and Net Other Assets (Liabilities) | 6.9% | |

Geographic Diversification (% of fund's net assets)
| As of June 30, 2022 | ||
| United States of America* | 89.7% | |
| Canada | 3.3% | |
| United Kingdom | 1.7% | |
| Germany | 1.4% | |
| Netherlands | 1.2% | |
| France | 0.6% | |
| Bailiwick of Jersey | 0.4% | |
| Sweden | 0.3% | |
| Japan | 0.3% | |
| Other | 1.1% | |

* Includes Short-Term investments and Net Other Assets (Liabilities).
Percentages are based on country or territory of incorporation and are adjusted for the effect of futures contracts, if applicable.
Schedule of Investments June 30, 2022
Showing Percentage of Net Assets
| Common Stocks - 92.9% | |||
| Shares | Value | ||
| COMMUNICATION SERVICES - 8.3% | |||
| Diversified Telecommunication Services - 0.4% | |||
| Cellnex Telecom SA (a) | 387,000 | $15,017,763 | |
| Verizon Communications, Inc. | 700,933 | 35,572,350 | |
| 50,590,113 | |||
| Entertainment - 1.4% | |||
| Activision Blizzard, Inc. | 284,322 | 22,137,311 | |
| Nintendo Co. Ltd. ADR | 441,900 | 23,783,058 | |
| The Walt Disney Co. (b) | 804,893 | 75,981,899 | |
| Universal Music Group NV | 2,802,981 | 56,160,610 | |
| 178,062,878 | |||
| Interactive Media & Services - 3.8% | |||
| Alphabet, Inc.: | |||
| Class A (b) | 87,511 | 190,709,222 | |
| Class C (b) | 79,373 | 173,624,469 | |
| Match Group, Inc. (b) | 65,600 | 4,571,664 | |
| Meta Platforms, Inc. Class A (b) | 704,200 | 113,552,250 | |
| Snap, Inc. Class A (b) | 788,600 | 10,354,318 | |
| 492,811,923 | |||
| Media - 2.7% | |||
| Comcast Corp. Class A | 7,492,642 | 294,011,272 | |
| Interpublic Group of Companies, Inc. | 1,897,370 | 52,234,596 | |
| 346,245,868 | |||
| TOTAL COMMUNICATION SERVICES | 1,067,710,782 | ||
| CONSUMER DISCRETIONARY - 3.5% | |||
| Auto Components - 0.3% | |||
| BorgWarner, Inc. | 1,324,862 | 44,210,645 | |
| Automobiles - 0.1% | |||
| General Motors Co. (b) | 297,400 | 9,445,424 | |
| Hotels, Restaurants & Leisure - 1.3% | |||
| Booking Holdings, Inc. (b) | 54,337 | 95,034,870 | |
| Expedia, Inc. (b) | 218,600 | 20,729,838 | |
| Marriott International, Inc. Class A | 258,900 | 35,212,989 | |
| Starbucks Corp. | 166,000 | 12,680,740 | |
| 163,658,437 | |||
| Household Durables - 0.5% | |||
| Mohawk Industries, Inc. (b) | 303,589 | 37,672,359 | |
| Sony Group Corp. sponsored ADR | 194,500 | 15,904,265 | |
| Whirlpool Corp. | 49,463 | 7,660,335 | |
| 61,236,959 | |||
| Internet & Direct Marketing Retail - 0.2% | |||
| Amazon.com, Inc. (b) | 263,600 | 27,996,956 | |
| Multiline Retail - 0.0% | |||
| Target Corp. | 30,100 | 4,251,023 | |
| Specialty Retail - 1.1% | |||
| Lowe's Companies, Inc. | 782,807 | 136,732,899 | |
| Textiles, Apparel & Luxury Goods - 0.0% | |||
| NIKE, Inc. Class B | 12,400 | 1,267,280 | |
| TOTAL CONSUMER DISCRETIONARY | 448,799,623 | ||
| CONSUMER STAPLES - 5.1% | |||
| Beverages - 1.9% | |||
| Diageo PLC sponsored ADR | 341,100 | 59,392,332 | |
| Keurig Dr. Pepper, Inc. | 1,236,800 | 43,770,352 | |
| The Coca-Cola Co. | 2,125,195 | 133,696,017 | |
| 236,858,701 | |||
| Food & Staples Retailing - 1.4% | |||
| Costco Wholesale Corp. | 17,500 | 8,387,400 | |
| Performance Food Group Co. (b) | 501,900 | 23,077,362 | |
| Sysco Corp. | 1,164,500 | 98,644,795 | |
| U.S. Foods Holding Corp. (b) | 595,600 | 18,273,008 | |
| Walmart, Inc. | 269,400 | 32,753,652 | |
| 181,136,217 | |||
| Food Products - 0.1% | |||
| Lamb Weston Holdings, Inc. | 252,800 | 18,065,088 | |
| Household Products - 0.2% | |||
| Colgate-Palmolive Co. | 17,300 | 1,386,422 | |
| Spectrum Brands Holdings, Inc. | 326,182 | 26,753,448 | |
| 28,139,870 | |||
| Tobacco - 1.5% | |||
| Altria Group, Inc. | 3,687,059 | 154,008,454 | |
| Swedish Match Co. AB | 3,756,000 | 38,320,739 | |
| 192,329,193 | |||
| TOTAL CONSUMER STAPLES | 656,529,069 | ||
| ENERGY - 12.5% | |||
| Oil, Gas & Consumable Fuels - 12.5% | |||
| Canadian Natural Resources Ltd. | 415,400 | 22,322,264 | |
| Cenovus Energy, Inc. (Canada) | 10,066,381 | 191,520,875 | |
| EQT Corp. | 330,900 | 11,382,960 | |
| Exxon Mobil Corp. | 10,138,643 | 868,273,385 | |
| Hess Corp. | 2,429,472 | 257,378,264 | |
| Imperial Oil Ltd. | 1,116,900 | 52,651,874 | |
| Kosmos Energy Ltd. (b) | 12,873,135 | 79,684,706 | |
| Phillips 66 Co. | 325,000 | 26,646,750 | |
| Tourmaline Oil Corp. | 1,612,500 | 83,844,488 | |
| 1,593,705,566 | |||
| FINANCIALS - 15.6% | |||
| Banks - 11.4% | |||
| Bank of America Corp. | 11,253,894 | 350,333,720 | |
| JPMorgan Chase & Co. | 1,038,671 | 116,964,741 | |
| M&T Bank Corp. | 162,520 | 25,904,063 | |
| PNC Financial Services Group, Inc. | 863,021 | 136,158,823 | |
| Truist Financial Corp. | 2,074,123 | 98,375,654 | |
| U.S. Bancorp | 1,746,119 | 80,356,396 | |
| Wells Fargo & Co. | 16,559,237 | 648,625,313 | |
| 1,456,718,710 | |||
| Capital Markets - 2.8% | |||
| KKR & Co. LP | 1,282,351 | 59,360,028 | |
| Morgan Stanley | 834,724 | 63,489,107 | |
| Northern Trust Corp. | 1,324,046 | 127,743,958 | |
| Raymond James Financial, Inc. | 358,703 | 32,071,635 | |
| State Street Corp. | 1,094,641 | 67,484,618 | |
| 350,149,346 | |||
| Consumer Finance - 0.2% | |||
| Discover Financial Services | 314,600 | 29,754,868 | |
| Insurance - 0.2% | |||
| Chubb Ltd. | 150,397 | 29,565,042 | |
| Thrifts & Mortgage Finance - 1.0% | |||
| MGIC Investment Corp. | 5,648,377 | 71,169,550 | |
| Radian Group, Inc. | 2,864,008 | 56,277,757 | |
| 127,447,307 | |||
| TOTAL FINANCIALS | 1,993,635,273 | ||
| HEALTH CARE - 14.4% | |||
| Biotechnology - 0.5% | |||
| ADC Therapeutics SA (b) | 243,209 | 1,933,512 | |
| Alnylam Pharmaceuticals, Inc. (b) | 161,150 | 23,503,728 | |
| Argenx SE ADR (b) | 14,700 | 5,569,536 | |
| Crinetics Pharmaceuticals, Inc. (b) | 389,800 | 7,269,770 | |
| Insmed, Inc. (b) | 691,829 | 13,642,868 | |
| Intercept Pharmaceuticals, Inc. (b)(c) | 793,099 | 10,952,697 | |
| Vaxcyte, Inc. (b) | 173,900 | 3,784,064 | |
| Verve Therapeutics, Inc. | 134,300 | 2,052,104 | |
| 68,708,279 | |||
| Health Care Equipment & Supplies - 1.5% | |||
| Abbott Laboratories | 54,500 | 5,921,425 | |
| Becton, Dickinson & Co. | 139,206 | 34,318,455 | |
| Boston Scientific Corp. (b) | 3,691,019 | 137,564,278 | |
| iRhythm Technologies, Inc. (b) | 1,100 | 118,833 | |
| Koninklijke Philips Electronics NV (depositary receipt) (NY Reg.) | 670,376 | 14,433,195 | |
| 192,356,186 | |||
| Health Care Providers & Services - 6.2% | |||
| Cardinal Health, Inc. | 1,196,558 | 62,544,087 | |
| Centene Corp. (b) | 111,200 | 9,408,632 | |
| Cigna Corp. | 658,711 | 173,583,523 | |
| CVS Health Corp. | 1,466,252 | 135,862,910 | |
| Guardant Health, Inc. (b) | 286,300 | 11,549,342 | |
| Humana, Inc. | 45,600 | 21,343,992 | |
| McKesson Corp. | 520,321 | 169,733,913 | |
| Oak Street Health, Inc. (b) | 188,700 | 3,102,228 | |
| UnitedHealth Group, Inc. | 409,181 | 210,167,637 | |
| 797,296,264 | |||
| Life Sciences Tools & Services - 0.2% | |||
| Danaher Corp. | 101,200 | 25,656,224 | |
| Pharmaceuticals - 6.0% | |||
| Bayer AG | 1,466,772 | 87,590,341 | |
| Bristol-Myers Squibb Co. | 3,725,460 | 286,860,420 | |
| Eli Lilly & Co. | 143,300 | 46,462,159 | |
| GSK PLC sponsored ADR | 3,480,936 | 151,525,144 | |
| Johnson & Johnson | 906,571 | 160,925,418 | |
| Pliant Therapeutics, Inc. (b) | 234,300 | 1,876,743 | |
| Sanofi SA sponsored ADR | 478,500 | 23,939,355 | |
| Viatris, Inc. | 185,500 | 1,942,185 | |
| 761,121,765 | |||
| TOTAL HEALTH CARE | 1,845,138,718 | ||
| INDUSTRIALS - 12.4% | |||
| Aerospace & Defense - 2.8% | |||
| Airbus Group NV | 656,600 | 64,221,978 | |
| General Dynamics Corp. | 172,160 | 38,090,400 | |
| Huntington Ingalls Industries, Inc. | 111,550 | 24,297,821 | |
| MTU Aero Engines AG | 51,600 | 9,392,692 | |
| Raytheon Technologies Corp. | 212,969 | 20,468,451 | |
| Safran SA | 110,900 | 11,041,815 | |
| The Boeing Co. (b) | 1,411,591 | 192,992,722 | |
| 360,505,879 | |||
| Air Freight & Logistics - 2.1% | |||
| FedEx Corp. | 298,447 | 67,660,919 | |
| United Parcel Service, Inc. Class B | 1,093,056 | 199,526,442 | |
| 267,187,361 | |||
| Airlines - 0.1% | |||
| Copa Holdings SA Class A (b) | 48,500 | 3,073,445 | |
| Ryanair Holdings PLC sponsored ADR (b) | 113,400 | 7,626,150 | |
| 10,699,595 | |||
| Building Products - 0.1% | |||
| Johnson Controls International PLC | 327,700 | 15,690,276 | |
| Commercial Services & Supplies - 0.1% | |||
| ACV Auctions, Inc. Class A (b) | 1,219,100 | 7,972,914 | |
| Electrical Equipment - 0.8% | |||
| Acuity Brands, Inc. | 234,669 | 36,148,413 | |
| Hubbell, Inc. Class B | 152,814 | 27,289,524 | |
| Regal Rexnord Corp. | 20,100 | 2,281,752 | |
| Vertiv Holdings Co. | 4,162,300 | 34,214,106 | |
| 99,933,795 | |||
| Industrial Conglomerates - 5.0% | |||
| 3M Co. | 147,273 | 19,058,599 | |
| General Electric Co. | 9,811,364 | 624,689,546 | |
| 643,748,145 | |||
| Machinery - 0.9% | |||
| Cummins, Inc. | 79,200 | 15,327,576 | |
| Epiroc AB (A Shares) | 60,100 | 931,854 | |
| Flowserve Corp. | 844,685 | 24,183,332 | |
| Fortive Corp. | 386,500 | 21,017,870 | |
| Otis Worldwide Corp. | 238,884 | 16,881,932 | |
| Stanley Black & Decker, Inc. | 111,500 | 11,691,890 | |
| Westinghouse Air Brake Tech Co. | 291,985 | 23,966,129 | |
| 114,000,583 | |||
| Professional Services - 0.0% | |||
| Equifax, Inc. | 38,400 | 7,018,752 | |
| Road & Rail - 0.5% | |||
| Knight-Swift Transportation Holdings, Inc. Class A | 1,298,715 | 60,117,517 | |
| Trading Companies & Distributors - 0.0% | |||
| Beijer Ref AB (B Shares) | 228,600 | 3,126,288 | |
| TOTAL INDUSTRIALS | 1,590,001,105 | ||
| INFORMATION TECHNOLOGY - 17.4% | |||
| Electronic Equipment & Components - 0.1% | |||
| Mirion Technologies, Inc. (d) | 3,311,098 | 19,071,924 | |
| IT Services - 3.9% | |||
| Amadeus IT Holding SA Class A (b) | 371,500 | 20,801,832 | |
| Edenred SA | 868,100 | 40,910,351 | |
| Fidelity National Information Services, Inc. | 567,500 | 52,022,725 | |
| Genpact Ltd. | 466,000 | 19,739,760 | |
| Global Payments, Inc. | 75,200 | 8,320,128 | |
| IBM Corp. | 140,100 | 19,780,719 | |
| MasterCard, Inc. Class A | 109,989 | 34,699,330 | |
| PayPal Holdings, Inc. (b) | 355,300 | 24,814,152 | |
| Sabre Corp. (b)(c) | 2,134,300 | 12,442,969 | |
| Snowflake, Inc. (b) | 7,500 | 1,042,950 | |
| Twilio, Inc. Class A (b) | 303,600 | 25,444,716 | |
| Unisys Corp. (b) | 1,905,099 | 22,918,341 | |
| Visa, Inc. Class A | 1,065,193 | 209,725,850 | |
| 492,663,823 | |||
| Semiconductors & Semiconductor Equipment - 2.5% | |||
| Analog Devices, Inc. | 145,938 | 21,320,082 | |
| Applied Materials, Inc. | 295,102 | 26,848,380 | |
| Intel Corp. | 1,229,300 | 45,988,113 | |
| Lam Research Corp. | 45,100 | 19,219,365 | |
| Marvell Technology, Inc. | 603,591 | 26,274,316 | |
| NVIDIA Corp. | 11,100 | 1,682,649 | |
| Qualcomm, Inc. | 1,364,631 | 174,317,964 | |
| 315,650,869 | |||
| Software - 7.8% | |||
| Adobe, Inc. (b) | 60,000 | 21,963,600 | |
| Autodesk, Inc. (b) | 122,528 | 21,069,915 | |
| Coupa Software, Inc. (b) | 33,800 | 1,929,980 | |
| DoubleVerify Holdings, Inc. (b) | 224,600 | 5,091,682 | |
| Dynatrace, Inc. (b) | 451,594 | 17,810,867 | |
| Elastic NV (b) | 449,700 | 30,431,199 | |
| Microsoft Corp. | 3,075,205 | 789,804,900 | |
| PTC, Inc. (b) | 132,800 | 14,121,952 | |
| Salesforce.com, Inc. (b) | 49,400 | 8,152,976 | |
| SAP SE sponsored ADR | 901,846 | 81,815,469 | |
| Workday, Inc. Class A (b) | 42,900 | 5,987,982 | |
| 998,180,522 | |||
| Technology Hardware, Storage & Peripherals - 3.1% | |||
| Apple, Inc. | 2,835,104 | 387,615,419 | |
| Samsung Electronics Co. Ltd. | 271,740 | 12,016,897 | |
| 399,632,316 | |||
| TOTAL INFORMATION TECHNOLOGY | 2,225,199,454 | ||
| MATERIALS - 2.5% | |||
| Chemicals - 0.6% | |||
| Axalta Coating Systems Ltd. (b) | 283,400 | 6,265,974 | |
| DuPont de Nemours, Inc. | 1,199,100 | 66,645,978 | |
| 72,911,952 | |||
| Metals & Mining - 1.9% | |||
| First Quantum Minerals Ltd. | 3,078,300 | 58,399,694 | |
| Freeport-McMoRan, Inc. | 4,594,542 | 134,436,299 | |
| Glencore Xstrata PLC | 9,400,900 | 50,919,378 | |
| 243,755,371 | |||
| TOTAL MATERIALS | 316,667,323 | ||
| REAL ESTATE - 0.7% | |||
| Equity Real Estate Investment Trusts (REITs) - 0.7% | |||
| American Tower Corp. | 136,381 | 34,857,620 | |
| Equinix, Inc. | 4,422 | 2,905,342 | |
| Simon Property Group, Inc. | 565,500 | 53,677,260 | |
| 91,440,222 | |||
| UTILITIES - 0.5% | |||
| Electric Utilities - 0.4% | |||
| Entergy Corp. | 110,700 | 12,469,248 | |
| PG&E Corp. (b) | 969,300 | 9,673,614 | |
| Southern Co. | 431,600 | 30,777,396 | |
| 52,920,258 | |||
| Multi-Utilities - 0.1% | |||
| Sempra Energy | 34,380 | 5,166,283 | |
| TOTAL UTILITIES | 58,086,541 | ||
| TOTAL COMMON STOCKS | |||
| (Cost $8,581,245,009) | 11,886,913,676 | ||
| Preferred Stocks - 0.1% | |||
| Convertible Preferred Stocks - 0.0% | |||
| COMMUNICATION SERVICES - 0.0% | |||
| Interactive Media & Services - 0.0% | |||
| Reddit, Inc. Series E (b)(d)(e) | 17,600 | 691,680 | |
| Nonconvertible Preferred Stocks - 0.1% | |||
| INDUSTRIALS - 0.1% | |||
| Aerospace & Defense - 0.1% | |||
| Embraer SA sponsored ADR (b) | 1,588,900 | 13,950,542 | |
| TOTAL PREFERRED STOCKS | |||
| (Cost $19,028,455) | 14,642,222 | ||
| Other - 0.1% | |||
| ENERGY - 0.1% | |||
| Oil, Gas & Consumable Fuels - 0.1% | |||
| Utica Shale Drilling Program (non-operating revenue interest) (d)(e)(f) | |||
| (Cost $28,952,535) | 28,952,535 | 9,001,343 | |
| Money Market Funds - 6.1% | |||
| Fidelity Cash Central Fund 1.58% (g) | 761,327,957 | 761,480,223 | |
| Fidelity Securities Lending Cash Central Fund 1.58% (g)(h) | 21,384,897 | 21,387,036 | |
| TOTAL MONEY MARKET FUNDS | |||
| (Cost $782,867,259) | 782,867,259 | ||
| TOTAL INVESTMENT IN SECURITIES - 99.2% | |||
| (Cost $9,412,093,258) | 12,693,424,500 | ||
| NET OTHER ASSETS (LIABILITIES) - 0.8% | 105,062,951 | ||
| NET ASSETS - 100% | $12,798,487,451 |
Legend
(a) Security exempt from registration under Rule 144A of the Securities Act of 1933. These securities may be resold in transactions exempt from registration, normally to qualified institutional buyers. At the end of the period, the value of these securities amounted to $15,017,763 or 0.1% of net assets.
(b) Non-income producing
(c) Security or a portion of the security is on loan at period end.
(d) Restricted securities (including private placements) - Investment in securities not registered under the Securities Act of 1933 (excluding 144A issues). At the end of the period, the value of restricted securities (excluding 144A issues) amounted to $28,764,947 or 0.2% of net assets.
(e) Level 3 security
(f) Investment is owned by a wholly-owned subsidiary (Subsidiary) that is treated as a corporation for U.S. tax purposes.
(g) Affiliated fund that is generally available only to investment companies and other accounts managed by Fidelity Investments. The rate quoted is the annualized seven-day yield of the fund at period end. A complete unaudited listing of the fund's holdings as of its most recent quarter end is available upon request. In addition, each Fidelity Central Fund's financial statements, which are not covered by the Fund's Report of Independent Registered Public Accounting Firm, are available on the SEC's website or upon request.
(h) Investment made with cash collateral received from securities on loan.
Additional information on each restricted holding is as follows:
| Security | Acquisition Date | Acquisition Cost |
| Mirion Technologies, Inc. | 6/16/21 | $33,110,980 |
| Reddit, Inc. Series E | 5/18/21 | $747,546 |
| Utica Shale Drilling Program (non-operating revenue interest) | 10/5/16 - 10/30/18 | $28,952,535 |
Affiliated Central Funds
Fiscal year to date information regarding the Fund's investments in Fidelity Central Funds, including the ownership percentage, is presented below.
| Fund | Value, beginning of period | Purchases | Sales Proceeds | Dividend Income | Realized Gain/Loss | Change in Unrealized appreciation (depreciation) | Value, end of period | % ownership, end of period |
| Fidelity Cash Central Fund 1.58% | $112,941,949 | $2,426,788,071 | $1,778,249,797 | $879,512 | $-- | $-- | $761,480,223 | 1.4% |
| Fidelity Securities Lending Cash Central Fund 1.58% | 191,405,919 | 858,102,285 | 1,028,121,168 | 8,790,723 | -- | -- | 21,387,036 | 0.1% |
| Total | $304,347,868 | $3,284,890,356 | $2,806,370,965 | $9,670,235 | $-- | $-- | $782,867,259 |
Amounts in the income column in the above table include any capital gain distributions from underlying funds, which are presented in the corresponding line-item in the Statement of Operations, if applicable. Amount for Fidelity Securities Lending Cash Central Fund represents the income earned on investing cash collateral, less rebates paid to borrowers and any lending agent fees associated with the loan, plus any premium payments received for lending certain types of securities.
Investment Valuation
The following is a summary of the inputs used, as of June 30, 2022, involving the Fund's assets and liabilities carried at fair value. The inputs or methodology used for valuing securities may not be an indication of the risk associated with investing in those securities. For more information on valuation inputs, and their aggregation into the levels used below, please refer to the Investment Valuation section in the accompanying Notes to Financial Statements.
| Valuation Inputs at Reporting Date: | ||||
| Description | Total | Level 1 | Level 2 | Level 3 |
| Investments in Securities: | ||||
| Equities: | ||||
| Communication Services | $1,068,402,462 | $1,011,550,172 | $56,160,610 | $691,680 |
| Consumer Discretionary | 448,799,623 | 448,799,623 | -- | -- |
| Consumer Staples | 656,529,069 | 618,208,330 | 38,320,739 | -- |
| Energy | 1,593,705,566 | 1,593,705,566 | -- | -- |
| Financials | 1,993,635,273 | 1,993,635,273 | -- | -- |
| Health Care | 1,845,138,718 | 1,757,548,377 | 87,590,341 | -- |
| Industrials | 1,603,951,647 | 1,527,756,000 | 76,195,647 | -- |
| Information Technology | 2,225,199,454 | 2,204,397,622 | 20,801,832 | -- |
| Materials | 316,667,323 | 265,747,945 | 50,919,378 | -- |
| Real Estate | 91,440,222 | 91,440,222 | -- | -- |
| Utilities | 58,086,541 | 58,086,541 | -- | -- |
| Other | 9,001,343 | -- | -- | 9,001,343 |
| Money Market Funds | 782,867,259 | 782,867,259 | -- | -- |
| Total Investments in Securities: | $12,693,424,500 | $12,353,742,930 | $329,988,547 | $9,693,023 |
See accompanying notes which are an integral part of the financial statements.
Financial Statements
Statement of Assets and Liabilities
| June 30, 2022 | ||
| Assets | ||
| Investment in securities, at value (including securities loaned of $20,408,201) — See accompanying schedule: Unaffiliated issuers (cost $8,629,225,999) | $11,910,557,241 | |
| Fidelity Central Funds (cost $782,867,259) | 782,867,259 | |
| Total Investment in Securities (cost $9,412,093,258) | $12,693,424,500 | |
| Restricted cash | 496,832 | |
| Foreign currency held at value (cost $2,834,308) | 2,834,308 | |
| Receivable for investments sold | 17,486,468 | |
| Receivable for fund shares sold | 184,572,144 | |
| Dividends receivable | 19,358,066 | |
| Distributions receivable from Fidelity Central Funds | 611,454 | |
| Other receivables | 450 | |
| Total assets | 12,918,784,222 | |
| Liabilities | ||
| Payable to custodian bank | $961,350 | |
| Payable for investments purchased | 97,542,411 | |
| Payable for fund shares redeemed | 387,902 | |
| Other payables and accrued expenses | 34,883 | |
| Collateral on securities loaned | 21,370,225 | |
| Total liabilities | 120,296,771 | |
| Net Assets | $12,798,487,451 | |
| Net Assets consist of: | ||
| Paid in capital | $8,857,171,072 | |
| Total accumulated earnings (loss) | 3,941,316,379 | |
| Net Assets | $12,798,487,451 | |
| Net Asset Value, offering price and redemption price per share ($12,798,487,451 ÷ 781,800,742 shares) | $16.37 |
See accompanying notes which are an integral part of the financial statements.
Statement of Operations
| Year ended June 30, 2022 | ||
| Investment Income | ||
| Dividends | $267,526,567 | |
| Income from Fidelity Central Funds (including $8,790,723 from security lending) | 9,670,235 | |
| Income before foreign taxes withheld | 277,196,802 | |
| Less foreign taxes withheld | (16,233,627) | |
| Total income | 260,963,175 | |
| Expenses | ||
| Custodian fees and expenses | $205,799 | |
| Independent trustees' fees and expenses | 50,320 | |
| Interest | 14,307 | |
| Total expenses | 270,426 | |
| Net investment income (loss) | 260,692,749 | |
| Realized and Unrealized Gain (Loss) | ||
| Net realized gain (loss) on: | ||
| Investment securities: | ||
| Unaffiliated issuers | 899,493,478 | |
| Foreign currency transactions | 7,264 | |
| Total net realized gain (loss) | 899,500,742 | |
| Change in net unrealized appreciation (depreciation) on: | ||
| Investment securities: | ||
| Unaffiliated issuers | (2,399,965,684) | |
| Unfunded commitments | 2,119,103 | |
| Assets and liabilities in foreign currencies | (338,614) | |
| Total change in net unrealized appreciation (depreciation) | (2,398,185,195) | |
| Net gain (loss) | (1,498,684,453) | |
| Net increase (decrease) in net assets resulting from operations | $(1,237,991,704) |
See accompanying notes which are an integral part of the financial statements.
Statement of Changes in Net Assets
| Year ended June 30, 2022 | Year ended June 30, 2021 | |
| Increase (Decrease) in Net Assets | ||
| Operations | ||
| Net investment income (loss) | $260,692,749 | $280,217,507 |
| Net realized gain (loss) | 899,500,742 | 906,194,831 |
| Change in net unrealized appreciation (depreciation) | (2,398,185,195) | 4,295,653,330 |
| Net increase (decrease) in net assets resulting from operations | (1,237,991,704) | 5,482,065,668 |
| Distributions to shareholders | (1,309,838,257) | (734,672,078) |
| Share transactions | ||
| Proceeds from sales of shares | 2,398,883,246 | 1,366,684,903 |
| Reinvestment of distributions | 1,309,838,257 | 734,672,078 |
| Cost of shares redeemed | (3,155,193,754) | (3,993,351,799) |
| Net increase (decrease) in net assets resulting from share transactions | 553,527,749 | (1,891,994,818) |
| Total increase (decrease) in net assets | (1,994,302,212) | 2,855,398,772 |
| Net Assets | ||
| Beginning of period | 14,792,789,663 | 11,937,390,891 |
| End of period | $12,798,487,451 | $14,792,789,663 |
| Other Information | ||
| Shares | ||
| Sold | 131,892,724 | 83,478,006 |
| Issued in reinvestment of distributions | 69,841,877 | 48,706,129 |
| Redeemed | (166,893,726) | (233,848,618) |
| Net increase (decrease) | 34,840,875 | (101,664,483) |
See accompanying notes which are an integral part of the financial statements.
Financial Highlights
Fidelity Series Large Cap Stock Fund
| Years ended June 30, | 2022 | 2021 | 2020 | 2019 | 2018 |
| Selected Per–Share Data | |||||
| Net asset value, beginning of period | $19.80 | $14.07 | $14.98 | $15.76 | $15.00 |
| Income from Investment Operations | |||||
| Net investment income (loss)A,B | .34 | .34 | .37 | .42 | .38 |
| Net realized and unrealized gain (loss) | (2.02) | 6.27 | (.32) | .42 | 1.26 |
| Total from investment operations | (1.68) | 6.61 | .05 | .84 | 1.64 |
| Distributions from net investment income | (.47) | (.37) | (.28) | (.39) | (.34) |
| Distributions from net realized gain | (1.28) | (.52) | (.68) | (1.22) | (.54) |
| Total distributions | (1.75) | (.88)C | (.96) | (1.62)C | (.88) |
| Net asset value, end of period | $16.37 | $19.80 | $14.07 | $14.98 | $15.76 |
| Total ReturnD | (9.44)% | 49.05% | .17% | 5.83% | 11.35% |
| Ratios to Average Net AssetsB,E,F | |||||
| Expenses before reductionsG | -% | -% | -% | -% | -% |
| Expenses net of fee waivers, if anyG | -% | -% | -% | -% | -% |
| Expenses net of all reductionsG | -% | -% | -% | -% | -% |
| Net investment income (loss) | 1.84% | 2.04% | 2.58% | 2.80% | 2.47% |
| Supplemental Data | |||||
| Net assets, end of period (000 omitted) | $12,798,487 | $14,792,790 | $11,937,391 | $14,114,096 | $13,059,805 |
| Portfolio turnover rateH | 17% | 15% | 28%I | 41%J | 44% |
A Calculated based on average shares outstanding during the period.
B Net investment income (loss) is affected by the timing of the declaration of dividends by any underlying mutual funds or exchange-traded funds (ETFs). Net investment income (loss) of any such underlying funds is not included in the Fund's net investment income (loss) ratio.
C Total distributions per share do not sum due to rounding.
D Total returns would have been lower if certain expenses had not been reduced during the applicable periods shown.
E Fees and expenses of any underlying mutual funds or exchange-traded funds (ETFs) are not included in the Fund's expense ratio. The Fund indirectly bears its proportionate share of these expenses. For additional expense information related to investments in Fidelity Central Funds, please refer to the "Investments in Fidelity Central Funds" note found in the Notes to Financial Statements section of the most recent Annual or Semi-Annual report.
F Expense ratios reflect operating expenses of the class. Expenses before reductions do not reflect amounts reimbursed, waived, or reduced through arrangements with the investment adviser, brokerage services, or other offset arrangements, if applicable, and do not represent the amount paid by the class during periods when reimbursements, waivers or reductions occur.
G Amount represents less than .005%.
H Amount does not include the portfolio activity of any underlying mutual funds or exchange-traded funds (ETFs).
I Portfolio turnover rate excludes securities received or delivered in-kind.
J The portfolio turnover rate does not include the assets acquired in the merger.
See accompanying notes which are an integral part of the financial statements.
Notes to Financial Statements
For the period ended June 30, 2022
1. Organization.
Fidelity Series Large Cap Stock Fund (the Fund) is a fund of Fidelity Hastings Street Trust (the Trust) and is authorized to issue an unlimited number of shares. Shares are offered only to certain other Fidelity funds, Fidelity managed 529 plans, and Fidelity managed collective investment trusts. The Trust is registered under the Investment Company Act of 1940, as amended (the 1940 Act), as an open-end management investment company organized as a Massachusetts business trust.
2. Investments in Fidelity Central Funds.
Funds may invest in Fidelity Central Funds, which are open-end investment companies generally available only to other investment companies and accounts managed by the investment adviser and its affiliates. The Schedule of Investments lists any Fidelity Central Funds held as an investment as of period end, but does not include the underlying holdings of each Fidelity Central Fund. An investing fund indirectly bears its proportionate share of the expenses of the underlying Fidelity Central Funds.
Based on its investment objective, each Fidelity Central Fund may invest or participate in various investment vehicles or strategies that are similar to those of the investing fund. These strategies are consistent with the investment objectives of the investing fund and may involve certain economic risks which may cause a decline in value of each of the Fidelity Central Funds and thus a decline in the value of the investing fund.
| Fidelity Central Fund | Investment Manager | Investment Objective | Investment Practices | Expense Ratio(a) |
| Fidelity Money Market Central Funds | Fidelity Management & Research Company LLC (FMR) | Each fund seeks to obtain a high level of current income consistent with the preservation of capital and liquidity. | Short-term Investments | Less than .005% |
(a) Expenses expressed as a percentage of average net assets and are as of each underlying Central Fund's most recent annual or semi-annual shareholder report.
A complete unaudited list of holdings for each Fidelity Central Fund is available upon request or at the Securities and Exchange Commission website at www.sec.gov. In addition, the financial statements of the Fidelity Central Funds which contain the significant accounting policies (including investment valuation policies) of those funds, and are not covered by the Report of Independent Registered Public Accounting Firm, are available on the Securities and Exchange Commission website or upon request.
3. Significant Accounting Policies.
The Fund is an investment company and applies the accounting and reporting guidance of the Financial Accounting Standards Board (FASB) Accounting Standards Codification Topic 946 Financial Services - Investment Companies. The financial statements have been prepared in conformity with accounting principles generally accepted in the United States of America (GAAP), which require management to make certain estimates and assumptions at the date of the financial statements. Actual results could differ from those estimates. Subsequent events, if any, through the date that the financial statements were issued have been evaluated in the preparation of the financial statements. The Fund's Schedule of Investments lists any underlying mutual funds or exchange-traded funds (ETFs) but does not include the underlying holdings of these funds. The following summarizes the significant accounting policies of the Fund:
Investment Valuation. Investments are valued as of 4:00 p.m. Eastern time on the last calendar day of the period. The Board of Trustees (the Board) has delegated the day to day responsibility for the valuation of the Fund's investments to the Fair Value Committee (the Committee) established by the Fund's investment adviser. In accordance with valuation policies and procedures approved by the Board, the Fund attempts to obtain prices from one or more third party pricing vendors or brokers to value its investments. When current market prices, quotations or currency exchange rates are not readily available or reliable, investments will be fair valued in good faith by the Committee, in accordance with procedures adopted by the Board. Factors used in determining fair value vary by investment type and may include market or investment specific events. The frequency with which these procedures are used cannot be predicted and they may be utilized to a significant extent. The Committee oversees the Fund's valuation policies and procedures and reports to the Board on the Committee's activities and fair value determinations. The Board monitors the appropriateness of the procedures used in valuing the Fund's investments and ratifies the fair value determinations of the Committee.
The Fund categorizes the inputs to valuation techniques used to value its investments into a disclosure hierarchy consisting of three levels as shown below:
- Level 1 – unadjusted quoted prices in active markets for identical investments
- Level 2 – other significant observable inputs (including quoted prices for similar investments, interest rates, prepayment speeds, etc.)
- Level 3 – unobservable inputs (including the Fund's own assumptions based on the best information available)
Valuation techniques used to value the Fund's investments by major category are as follows:
Equity securities, including restricted securities, for which market quotations are readily available, are valued at the last reported sale price or official closing price as reported by a third party pricing vendor on the primary market or exchange on which they are traded and are categorized as Level 1 in the hierarchy. In the event there were no sales during the day or closing prices are not available, securities are valued at the last quoted bid price or may be valued using the last available price and are generally categorized as Level 2 in the hierarchy. For foreign equity securities, when market or security specific events arise, comparisons to the valuation of American Depositary Receipts (ADRs), futures contracts, ETFs and certain indexes as well as quoted prices for similar securities may be used and would be categorized as Level 2 in the hierarchy. For equity securities, including restricted securities, where observable inputs are limited, assumptions about market activity and risk are used and these securities may be categorized as Level 3 in the hierarchy.
Investments in open-end mutual funds, including the Fidelity Central Funds, are valued at their closing net asset value (NAV) each business day and are categorized as Level 1 in the hierarchy.
Changes in valuation techniques may result in transfers in or out of an assigned level within the disclosure hierarchy. The aggregate value of investments by input level as of June 30, 2022 is included at the end of the Fund's Schedule of Investments.
Foreign Currency. Certain Funds may use foreign currency contracts to facilitate transactions in foreign-denominated securities. Gains and losses from these transactions may arise from changes in the value of the foreign currency or if the counterparties do not perform under the contracts' terms.
Foreign-denominated assets, including investment securities, and liabilities are translated into U.S. dollars at the exchange rates at period end. Purchases and sales of investment securities, income and dividends received, and expenses denominated in foreign currencies are translated into U.S. dollars at the exchange rate in effect on the transaction date.
The effects of exchange rate fluctuations on investments are included with the net realized and unrealized gain (loss) on investment securities. Other foreign currency transactions resulting in realized and unrealized gain (loss) are disclosed separately.
Investment Transactions and Income. For financial reporting purposes, the Fund's investment holdings and NAV include trades executed through the end of the last business day of the period. The NAV per share for processing shareholder transactions is calculated as of the close of business of the New York Stock Exchange (NYSE), normally 4:00 p.m. Eastern time and includes trades executed through the end of the prior business day. Gains and losses on securities sold are determined on the basis of identified cost and include proceeds received from litigation. Commissions paid to certain brokers with whom the investment adviser, or its affiliates, places trades on behalf of a fund include an amount in addition to trade execution, which may be rebated back to a fund. Any such rebates are included in net realized gain (loss) on investments in the Statement of Operations. Dividend income is recorded on the ex-dividend date, except for certain dividends from foreign securities where the ex-dividend date may have passed, which are recorded as soon as the Fund is informed of the ex-dividend date. Non-cash dividends included in dividend income, if any, are recorded at the fair market value of the securities received. Income and capital gain distributions from Fidelity Central Funds, if any, are recorded on the ex-dividend date. Certain distributions received by the Fund represent a return of capital or capital gain. The Fund determines the components of these distributions subsequent to the ex-dividend date, based upon receipt of tax filings or other correspondence relating to the underlying investment. These distributions are recorded as a reduction of cost of investments and/or as a realized gain. Investment income is recorded net of foreign taxes withheld where recovery of such taxes is uncertain. Funds may file withholding tax reclaims in certain jurisdictions to recover a portion of amounts previously withheld. Any withholding tax reclaims income is included in the Statement of Operations in foreign taxes withheld. Any receivables for withholding tax reclaims are included in the Statement of Assets and Liabilities in dividends receivable.
Expenses. Expenses directly attributable to a fund are charged to that fund. Expenses attributable to more than one fund are allocated among the respective funds on the basis of relative net assets or other appropriate methods. Expenses included in the accompanying financial statements reflect the expenses of that fund and do not include any expenses associated with any underlying mutual funds or exchange-traded funds. Although not included in a fund's expenses, a fund indirectly bears its proportionate share of these expenses through the net asset value of each underlying mutual fund or exchange-traded fund. Expense estimates are accrued in the period to which they relate and adjustments are made when actual amounts are known.
Income Tax Information and Distributions to Shareholders. Each year, the Fund intends to qualify as a regulated investment company under Subchapter M of the Internal Revenue Code, including distributing substantially all of its taxable income and realized gains. As a result, no provision for U.S. Federal income taxes is required. As of June 30, 2022, the Fund did not have any unrecognized tax benefits in the financial statements; nor is the Fund aware of any tax positions for which it is reasonably possible that the total amounts of unrecognized tax benefits will significantly change in the next twelve months. The Fund files a U.S. federal tax return, in addition to state and local tax returns as required. The Fund's federal income tax returns are subject to examination by the Internal Revenue Service (IRS) for a period of three fiscal years after they are filed. State and local tax returns may be subject to examination for an additional fiscal year depending on the jurisdiction. Foreign taxes are provided for based on the Fund's understanding of the tax rules and rates that exist in the foreign markets in which it invests.
Distributions are declared and recorded on the ex-dividend date. Income and capital gain distributions are determined in accordance with income tax regulations, which may differ from GAAP.
Capital accounts within the financial statements are adjusted for permanent book-tax differences. These adjustments have no impact on net assets or the results of operations. Capital accounts are not adjusted for temporary book-tax differences which will reverse in a subsequent period.
Book-tax differences are primarily due to foreign currency transactions, certain corporate actions and losses deferred due to wash sales.
As of period end, the cost and unrealized appreciation (depreciation) in securities, and derivatives if applicable, for federal income tax purposes were as follows:
| Gross unrealized appreciation | $4,051,699,206 |
| Gross unrealized depreciation | (838,109,323) |
| Net unrealized appreciation (depreciation) | $3,213,589,883 |
| Tax Cost | $9,479,834,617 |
The tax-based components of distributable earnings as of period end were as follows:
| Undistributed ordinary income | $132,174,041 |
| Undistributed long-term capital gain | $595,758,164 |
| Net unrealized appreciation (depreciation) on securities and other investments | $3,213,384,175 |
The tax character of distributions paid was as follows:
| June 30, 2022 | June 30, 2021 | |
| Ordinary Income | $491,091,246 | $ 344,964,131 |
| Long-term Capital Gains | 818,747,011 | 389,707,947 |
| Total | $1,309,838,257 | $ 734,672,078 |
Restricted Securities (including Private Placements). Funds may invest in securities that are subject to legal or contractual restrictions on resale. These securities generally may be resold in transactions exempt from registration or to the public if the securities are registered. Disposal of these securities may involve time-consuming negotiations and expense, and prompt sale at an acceptable price may be difficult. Information regarding restricted securities held at period end is included at the end of the Schedule of Investments, if applicable.
Special Purpose Acquisition Companies. Funds may invest in stock, warrants, and other securities of special purpose acquisition companies (SPACs) or similar special purpose entities. A SPAC is a publicly traded company that raises investment capital via an initial public offering (IPO) for the purpose of acquiring the equity securities of one or more existing companies via merger, business combination, acquisition or other similar transactions within a designated time frame.
Private Investment in Public Equity. Funds may acquire equity securities of an issuer through a private investment in a public equity (PIPE) transaction, including through commitments to purchase securities on a when-issued basis. A PIPE typically involves the purchase of securities directly from a publicly traded company in a private placement transaction. Securities purchased through PIPE transactions will be restricted from trading and considered illiquid until a resale registration statement for the shares is filed and declared effective.
At the current and/or prior period end, the Fund had commitments to purchase when-issued securities through PIPE transactions with SPACs. The commitments are contingent upon the SPACs acquiring the securities of target companies. Unrealized appreciation (depreciation) on any commitments outstanding at period end is separately presented in the Statements of Assets and Liabilities as Unrealized appreciation (depreciation) on unfunded commitments, and any change in unrealized appreciation (depreciation) on unfunded commitments during the period is separately presented in the Statement of Operations, as applicable.
Consolidated Subsidiary. The Funds included in the table below hold certain investments through a wholly-owned subsidiary ("Subsidiary"), which may be subject to federal and state taxes upon disposition.
As of period end, investments in Subsidiaries were as follows:
| $ Amount | % of Net Assets | |
| Fidelity Series Large Cap Stock Fund | 9,498,175 | .07 |
The financial statements have been consolidated to include the Subsidiary accounts where applicable. Accordingly, all inter-company transactions and balances have been eliminated.
At period end, any estimated tax liability for these investments is presented as "Deferred taxes" in the Statement of Assets and Liabilities and included in "Change in net unrealized appreciation (depreciation) on investment securities" in the Statement of Operations. The tax liability incurred may differ materially depending on conditions when these investments are disposed. Any cash held by a Subsidiary is restricted as to its use and is presented as "Restricted cash" in the Statement of Assets and Liabilities, if applicable.
4. Purchases and Sales of Investments.
Purchases and sales of securities, other than short-term securities and in-kind transactions, as applicable, are noted in the table below.
| Purchases ($) | Sales ($) | |
| Fidelity Series Large Cap Stock Fund | 2,308,085,240 | 3,418,835,208 |
5. Fees and Other Transactions with Affiliates.
Management Fee. Fidelity Management & Research Company LLC (the investment adviser) and its affiliates provide the Fund with investment management related services for which the Fund does not pay a management fee. Under the management contract, the investment adviser or an affiliate pays all ordinary operating expenses of the Fund, except custody fees, fees and expenses of the independent Trustees, and certain miscellaneous expenses such as proxy and shareholder meeting expenses.
Brokerage Commissions. A portion of portfolio transactions were placed with brokerage firms which are affiliates of the investment adviser. Brokerage commissions are included in net realized gain (loss) and change in net unrealized appreciation (depreciation) in the Statement of Operations. The commissions paid to these affiliated firms were as follows:
| Amount | |
| Fidelity Series Large Cap Stock Fund | $49,560 |
Interfund Lending Program. Pursuant to an Exemptive Order issued by the Securities and Exchange Commission (the SEC), the Fund, along with other registered investment companies having management contracts with Fidelity Management & Research Company LLC (FMR), or other affiliated entities of FMR, may participate in an interfund lending program. This program provides an alternative credit facility allowing the Fund to borrow from, or lend money to, other participating affiliated funds. At period end, there were no interfund loans outstanding. Activity in this program during the period for which loans were outstanding was as follows:
| Borrower or Lender | Average Loan Balance | Weighted Average Interest Rate | Interest Expense | |
| Fidelity Series Large Cap Stock Fund | Borrower | $63,197,577 | .31% | $14,307 |
Interfund Trades. Funds may purchase from or sell securities to other Fidelity Funds under procedures adopted by the Board. The procedures have been designed to ensure these interfund trades are executed in accordance with Rule 17a-7 of the 1940 Act. Any interfund trades are included within the respective purchases and sales amounts shown in the Purchases and Sales of Investments note. Interfund trades during the period are noted in the table below.
| Purchases ($) | Sales ($) | Realized Gain (Loss) ($) | |
| Fidelity Series Large Cap Stock Fund | 248,048,873 | 242,442,753 | 75,881,381 |
6. Committed Line of Credit.
Certain Funds participate with other funds managed by the investment adviser or an affiliate in a $4.25 billion credit facility (the "line of credit") to be utilized for temporary or emergency purposes to fund shareholder redemptions or for other short-term liquidity purposes. The commitment fees on the pro-rata portion of the line of credit are borne by the investment adviser. During the period, there were no borrowings on this line of credit.
7. Security Lending.
Funds lend portfolio securities from time to time in order to earn additional income. Lending agents are used, including National Financial Services (NFS), an affiliate of the investment adviser. Pursuant to a securities lending agreement, NFS will receive a fee, which is capped at 9.9% of a fund's daily lending revenue, for its services as lending agent. A fund may lend securities to certain qualified borrowers, including NFS. On the settlement date of the loan, a fund receives collateral (in the form of U.S. Treasury obligations, letters of credit and/or cash) against the loaned securities and maintains collateral in an amount not less than 100% of the market value of the loaned securities during the period of the loan. The market value of the loaned securities is determined at the close of business of a fund and any additional required collateral is delivered to a fund on the next business day. A fund or borrower may terminate the loan at any time, and if the borrower defaults on its obligation to return the securities loaned because of insolvency or other reasons, a fund may apply collateral received from the borrower against the obligation. A fund may experience delays and costs in recovering the securities loaned. Any cash collateral received is invested in the Fidelity Securities Lending Cash Central Fund. Any loaned securities are identified as such in the Schedule of Investments, and the value of loaned securities and cash collateral at period end, as applicable, are presented in the Statement of Assets and Liabilities. Security lending income represents the income earned on investing cash collateral, less rebates paid to borrowers and any lending agent fees associated with the loan, plus any premium payments received for lending certain types of securities. Security lending income is presented in the Statement of Operations as a component of income from Fidelity Central Funds. Affiliated security lending activity, if any, was as follows:
| Total Security Lending Fees Paid to NFS | Security Lending Income From Securities Loaned to NFS | Value of Securities Loaned to NFS at Period End | |
| Fidelity Series Large Cap Stock Fund | $457,931 | $1,139 | $– |
8. Other.
A fund's organizational documents provide former and current trustees and officers with a limited indemnification against liabilities arising in connection with the performance of their duties to the fund. In the normal course of business, a fund may also enter into contracts that provide general indemnifications. A fund's maximum exposure under these arrangements is unknown as this would be dependent on future claims that may be made against a fund. The risk of material loss from such claims is considered remote.
At the end of the period, mutual funds and accounts managed by the investment adviser or its affiliates were the owners of record of all of the outstanding shares of the Fund.
9. Coronavirus (COVID-19) Pandemic.
An outbreak of COVID-19 first detected in China during December 2019 has since spread globally and was declared a pandemic by the World Health Organization during March 2020. Developments that disrupt global economies and financial markets, such as the COVID-19 pandemic, may magnify factors that affect the Fund's performance.
Report of Independent Registered Public Accounting Firm
To the Board of Trustees of Fidelity Hastings Street Trust and Shareholders of Fidelity Series Large Cap Stock Fund
Opinion on the Financial Statements
We have audited the accompanying statement of assets and liabilities, including the schedule of investments, of Fidelity Series Large Cap Stock Fund (one of the funds constituting Fidelity Hastings Street Trust, referred to hereafter as the “Fund”) as of June 30, 2022, the related statement of operations for the year ended June 30, 2022, the statement of changes in net assets for each of the two years in the period ended June 30, 2022, including the related notes, and the financial highlights for each of the five years in the period ended June 30, 2022 (collectively referred to as the “financial statements”). In our opinion, the financial statements present fairly, in all material respects, the financial position of the Fund as of June 30, 2022, the results of its operations for the year then ended, the changes in its net assets for each of the two years in the period ended June 30, 2022 and the financial highlights for each of the five years in the period ended June 30, 2022 in conformity with accounting principles generally accepted in the United States of America.
Basis for Opinion
These financial statements are the responsibility of the Fund’s management. Our responsibility is to express an opinion on the Fund’s financial statements based on our audits. We are a public accounting firm registered with the Public Company Accounting Oversight Board (United States) (PCAOB) and are required to be independent with respect to the Fund in accordance with the U.S. federal securities laws and the applicable rules and regulations of the Securities and Exchange Commission and the PCAOB.
We conducted our audits of these financial statements in accordance with the standards of the PCAOB. Those standards require that we plan and perform the audit to obtain reasonable assurance about whether the financial statements are free of material misstatement, whether due to error or fraud.
Our audits included performing procedures to assess the risks of material misstatement of the financial statements, whether due to error or fraud, and performing procedures that respond to those risks. Such procedures included examining, on a test basis, evidence regarding the amounts and disclosures in the financial statements. Our audits also included evaluating the accounting principles used and significant estimates made by management, as well as evaluating the overall presentation of the financial statements. Our procedures included confirmation of securities owned as of June 30, 2022 by correspondence with the custodian, issuers of privately offered securities and brokers; when replies were not received from brokers, we performed other auditing procedures. We believe that our audits provide a reasonable basis for our opinion.
/s/ PricewaterhouseCoopers LLP
Boston, Massachusetts
August 17, 2022
We have served as the auditor of one or more investment companies in the Fidelity group of funds since 1932.
Trustees and Officers
The Trustees, Members of the Advisory Board (if any), and officers of the trust and fund, as applicable, are listed below. The Board of Trustees governs the fund and is responsible for protecting the interests of shareholders. The Trustees are experienced executives who meet periodically throughout the year to oversee the fund's activities, review contractual arrangements with companies that provide services to the fund, oversee management of the risks associated with such activities and contractual arrangements, and review the fund's performance. Each of the Trustees oversees 316 funds.
The Trustees hold office without limit in time except that (a) any Trustee may resign; (b) any Trustee may be removed by written instrument, signed by at least two-thirds of the number of Trustees prior to such removal; (c) any Trustee who requests to be retired or who has become incapacitated by illness or injury may be retired by written instrument signed by a majority of the other Trustees; and (d) any Trustee may be removed at any special meeting of shareholders by a two-thirds vote of the outstanding voting securities of the trust. Each Trustee who is not an interested person (as defined in the 1940 Act) of the trust and the fund is referred to herein as an Independent Trustee. Each Independent Trustee shall retire not later than the last day of the calendar year in which his or her 75th birthday occurs. The Independent Trustees may waive this mandatory retirement age policy with respect to individual Trustees. Officers and Advisory Board Members hold office without limit in time, except that any officer or Advisory Board Member may resign or may be removed by a vote of a majority of the Trustees at any regular meeting or any special meeting of the Trustees. Except as indicated, each individual has held the office shown or other offices in the same company for the past five years.
The fund’s Statement of Additional Information (SAI) includes more information about the Trustees. To request a free copy, call Fidelity at 1-800-544-8544.
Experience, Skills, Attributes, and Qualifications of the Trustees. The Governance and Nominating Committee has adopted a statement of policy that describes the experience, qualifications, attributes, and skills that are necessary and desirable for potential Independent Trustee candidates (Statement of Policy). The Board believes that each Trustee satisfied at the time he or she was initially elected or appointed a Trustee, and continues to satisfy, the standards contemplated by the Statement of Policy. The Governance and Nominating Committee also engages professional search firms to help identify potential Independent Trustee candidates who have the experience, qualifications, attributes, and skills consistent with the Statement of Policy. From time to time, additional criteria based on the composition and skills of the current Independent Trustees, as well as experience or skills that may be appropriate in light of future changes to board composition, business conditions, and regulatory or other developments, have also been considered by the professional search firms and the Governance and Nominating Committee. In addition, the Board takes into account the Trustees' commitment and participation in Board and committee meetings, as well as their leadership of standing and ad hoc committees throughout their tenure.
In determining that a particular Trustee was and continues to be qualified to serve as a Trustee, the Board has considered a variety of criteria, none of which, in isolation, was controlling. The Board believes that, collectively, the Trustees have balanced and diverse experience, qualifications, attributes, and skills, which allow the Board to operate effectively in governing the fund and protecting the interests of shareholders. Information about the specific experience, skills, attributes, and qualifications of each Trustee, which in each case led to the Board's conclusion that the Trustee should serve (or continue to serve) as a trustee of the fund, is provided below.
Board Structure and Oversight Function. Robert A. Lawrence is an interested person and currently serves as Chair. The Trustees have determined that an interested Chair is appropriate and benefits shareholders because an interested Chair has a personal and professional stake in the quality and continuity of services provided to the fund. Independent Trustees exercise their informed business judgment to appoint an individual of their choosing to serve as Chair, regardless of whether the Trustee happens to be independent or a member of management. The Independent Trustees have determined that they can act independently and effectively without having an Independent Trustee serve as Chair and that a key structural component for assuring that they are in a position to do so is for the Independent Trustees to constitute a substantial majority for the Board. The Independent Trustees also regularly meet in executive session. David M. Thomas serves as Lead Independent Trustee and as such (i) acts as a liaison between the Independent Trustees and management with respect to matters important to the Independent Trustees and (ii) with management prepares agendas for Board meetings.
Fidelity® funds are overseen by different Boards of Trustees. The fund's Board oversees Fidelity's high income and certain equity funds, and other Boards oversee Fidelity's investment-grade bond, money market, asset allocation, and other equity funds. The asset allocation funds may invest in Fidelity® funds overseen by the fund's Board. The use of separate Boards, each with its own committee structure, allows the Trustees of each group of Fidelity® funds to focus on the unique issues of the funds they oversee, including common research, investment, and operational issues. On occasion, the separate Boards establish joint committees to address issues of overlapping consequences for the Fidelity® funds overseen by each Board.
The Trustees operate using a system of committees to facilitate the timely and efficient consideration of all matters of importance to the Trustees, the fund, and fund shareholders and to facilitate compliance with legal and regulatory requirements and oversight of the fund's activities and associated risks. The Board, acting through its committees, has charged FMR and its affiliates with (i) identifying events or circumstances the occurrence of which could have demonstrably adverse effects on the fund's business and/or reputation; (ii) implementing processes and controls to lessen the possibility that such events or circumstances occur or to mitigate the effects of such events or circumstances if they do occur; and (iii) creating and maintaining a system designed to evaluate continuously business and market conditions in order to facilitate the identification and implementation processes described in (i) and (ii) above. Because the day-to-day operations and activities of the fund are carried out by or through FMR, its affiliates, and other service providers, the fund's exposure to risks is mitigated but not eliminated by the processes overseen by the Trustees. While each of the Board's committees has responsibility for overseeing different aspects of the fund's activities, oversight is exercised primarily through the Operations, Audit, and Compliance Committees. Appropriate personnel, including but not limited to the fund's Chief Compliance Officer (CCO), FMR's internal auditor, the independent accountants, the fund's Treasurer and portfolio management personnel, make periodic reports to the Board's committees, as appropriate, including an annual review of Fidelity's risk management program for the Fidelity® funds. The responsibilities of each standing committee, including their oversight responsibilities, are described further under "Standing Committees of the Trustees."
Interested Trustees*:
Correspondence intended for a Trustee who is an interested person may be sent to Fidelity Investments, 245 Summer Street, Boston, Massachusetts 02210.
Name, Year of Birth; Principal Occupations and Other Relevant Experience+
Bettina Doulton (1964)
Year of Election or Appointment: 2020
Trustee
Ms. Doulton also serves as Trustee of other Fidelity® funds. Prior to her retirement, Ms. Doulton served in a variety of positions at Fidelity Investments, including as a managing director of research (2006-2007), portfolio manager to certain Fidelity® funds (1993-2005), equity analyst and portfolio assistant (1990-1993), and research assistant (1987-1990). Ms. Doulton currently owns and operates Phi Builders + Architects and Cellardoor Winery. Previously, Ms. Doulton served as a member of the Board of Brown Capital Management, LLC (2014-2018).
Robert A. Lawrence (1952)
Year of Election or Appointment: 2020
Trustee
Chair of the Board of Trustees
Mr. Lawrence also serves as Trustee of other funds. Previously, Mr. Lawrence served as a Trustee and Member of the Advisory Board of certain funds. Prior to his retirement in 2008, Mr. Lawrence served as Vice President of certain Fidelity® funds (2006-2008), Senior Vice President, Head of High Income Division of Fidelity Management & Research Company (investment adviser firm, 2006-2008), and President of Fidelity Strategic Investments (investment adviser firm, 2002-2005).
* Determined to be an “Interested Trustee” by virtue of, among other things, his or her affiliation with the trust or various entities under common control with FMR.
+ The information includes the Trustee's principal occupation during the last five years and other information relating to the experience, attributes, and skills relevant to the Trustee's qualifications to serve as a Trustee, which led to the conclusion that the Trustee should serve as a Trustee for the fund.
Independent Trustees:
Correspondence intended for an Independent Trustee may be sent to Fidelity Investments, P.O. Box 55235, Boston, Massachusetts 02205-5235.
Name, Year of Birth; Principal Occupations and Other Relevant Experience+
Thomas P. Bostick (1956)
Year of Election or Appointment: 2021
Trustee
Lieutenant General Bostick also serves as Trustee of other Fidelity® funds. Prior to his retirement, General Bostick (United States Army, Retired) held a variety of positions within the U.S. Army, including Commanding General and Chief of Engineers, U.S. Army Corps of Engineers (2012-2016) and Deputy Chief of Staff and Director of Human Resources, U.S. Army (2009-2012). General Bostick currently serves as a member of the Board and Finance and Governance Committees of CSX Corporation (transportation, 2020-present) and a member of the Board and Corporate Governance and Nominating Committee of Perma-Fix Environmental Services, Inc. (nuclear waste management, 2020-present). General Bostick serves as Chief Executive Officer of Bostick Global Strategies, LLC (consulting, 2016-present) and as a member of the Board of HireVue, Inc. (video interview and assessment, 2020-present). Previously, General Bostick served as a Member of the Advisory Board of certain Fidelity® funds (2021), President, Intrexon Bioengineering (2018-2020) and Chief Operating Officer (2017-2020) and Senior Vice President of the Environment Sector (2016-2017) of Intrexon Corporation (biopharmaceutical company).
Dennis J. Dirks (1948)
Year of Election or Appointment: 2005
Trustee
Mr. Dirks also serves as Trustee of other Fidelity® funds. Prior to his retirement in May 2003, Mr. Dirks served as Chief Operating Officer and as a member of the Board of The Depository Trust & Clearing Corporation (financial markets infrastructure), President, Chief Operating Officer and a member of the Board of The Depository Trust Company (DTC), President and a member of the Board of the National Securities Clearing Corporation (NSCC), Chief Executive Officer and a member of the Board of the Government Securities Clearing Corporation and Chief Executive Officer and a member of the Board of the Mortgage-Backed Securities Clearing Corporation. Mr. Dirks currently serves as a member of the Finance Committee (2016-present) and Board (2017-present) and is Treasurer (2018-present) of the Asolo Repertory Theatre.
Donald F. Donahue (1950)
Year of Election or Appointment: 2018
Trustee
Mr. Donahue also serves as Trustee of other Fidelity® funds. Mr. Donahue serves as President and Chief Executive Officer of Miranda Partners, LLC (risk consulting for the financial services industry, 2012-present). Previously, Mr. Donahue served as Chief Executive Officer (2006-2012), Chief Operating Officer (2003-2006) and Managing Director, Customer Marketing and Development (1999-2003) of The Depository Trust & Clearing Corporation (financial markets infrastructure). Mr. Donahue currently serves as a member (2007-present) and Co-Chairman (2016-present) of the Board of United Way of New York and a member of the Board of The Leadership Academy (previously NYC Leadership Academy) (2012-present). Mr. Donahue previously served as a member of the Advisory Board of certain Fidelity® funds (2015-2018).
Vicki L. Fuller (1957)
Year of Election or Appointment: 2020
Trustee
Ms. Fuller also serves as Trustee of other Fidelity® funds. Previously, Ms. Fuller served as a member of the Advisory Board of certain Fidelity® funds (2018-2020), Chief Investment Officer of the New York State Common Retirement Fund (2012-2018) and held a variety of positions at AllianceBernstein L.P. (global asset management, 1985-2012), including Managing Director (2006-2012) and Senior Vice President and Senior Portfolio Manager (2001-2006). Ms. Fuller currently serves as a member of the Board, Audit Committee and Nominating and Governance Committee of two Blackstone business development companies (2020-present), as a member of the Board of Treliant, LLC (consulting, 2019-present), as a member of the Advisory Board of Ariel Alternatives, LLC (private equity, 2021-present) and as a member of the Board and Chair of the Audit Committee of Gusto, Inc. (software, 2021-present). In addition, Ms. Fuller currently serves as a member of the Board of Roosevelt University (2019-present) and as a member of the Executive Board of New York University’s Stern School of Business. Ms. Fuller previously served as a member of the Board, Audit Committee and Nominating and Governance Committee of The Williams Companies, Inc. (natural gas infrastructure, 2018-2021).
Patricia L. Kampling (1959)
Year of Election or Appointment: 2020
Trustee
Ms. Kampling also serves as Trustee of other Fidelity® funds. Prior to her retirement, Ms. Kampling served as Chairman of the Board and Chief Executive Officer (2012-2019), President and Chief Operating Officer (2011-2012) and Executive Vice President and Chief Financial Officer (2010-2011) of Alliant Energy Corporation. Ms. Kampling currently serves as a member of the Board, Finance Committee and Governance, Compensation and Nominating Committee of Xcel Energy Inc. (utilities company, 2020-present) and as a member of the Board, Audit, Finance and Risk Committee and Safety, Environmental, Technology and Operations Committee and Chair of the Executive Development and Compensation Committee of American Water Works Company, Inc. (utilities company, 2019-present). In addition, Ms. Kampling currently serves as a member of the Board of the Nature Conservancy, Wisconsin Chapter (2019-present). Previously, Ms. Kampling served as a Member of the Advisory Board of certain Fidelity® funds (2020), a member of the Board, Compensation Committee and Executive Committee and Chair of the Audit Committee of Briggs & Stratton Corporation (manufacturing, 2011-2021), a member of the Board of Interstate Power and Light Company (2012-2019) and Wisconsin Power and Light Company (2012-2019) (each a subsidiary of Alliant Energy Corporation) and as a member of the Board and Workforce Development Committee of the Business Roundtable (2018-2019).
Thomas A. Kennedy (1955)
Year of Election or Appointment: 2021
Trustee
Mr. Kennedy also serves as Trustee of other Fidelity® funds. Previously, Mr. Kennedy served as a Member of the Advisory Board of certain Fidelity® funds (2020) and held a variety of positions at Raytheon Company (aerospace and defense, 1983-2020), including Chairman and Chief Executive Officer (2014-2020) and Executive Vice President and Chief Operating Officer (2013-2014). Mr. Kennedy currently serves as Executive Chairman of the Board of Directors of Raytheon Technologies Corporation (aerospace and defense, 2020-present). He is also a member of the Rutgers School of Engineering Industry Advisory Board (2011-present) and a member of the UCLA Engineering Dean’s Executive Board (2016-present).
Oscar Munoz (1959)
Year of Election or Appointment: 2021
Trustee
Mr. Munoz also serves as Trustee of other Fidelity® funds. Prior to his retirement, Mr. Munoz served as Executive Chairman (2020-2021), Chief Executive Officer (2015-2020), President (2015-2016) and a member of the Board (2010-2021) of United Airlines Holdings, Inc. Mr. Munoz currently serves as a member of the Board of CBRE Group, Inc. (commercial real estate, 2020-present), a member of the Board of Univision Communications, Inc. (Hispanic media, 2020-present) and a member of the Advisory Board of Salesforce.com, Inc. (cloud-based software, 2020-present). Previously, Mr. Munoz served as a Member of the Advisory Board of certain Fidelity® funds (2021).
Garnett A. Smith (1947)
Year of Election or Appointment: 2018
Trustee
Mr. Smith also serves as Trustee of other Fidelity® funds. Prior to his retirement, Mr. Smith served as Chairman and Chief Executive Officer (1990-1997) and President (1986-1990) of Inbrand Corp. (manufacturer of personal absorbent products). Prior to his employment with Inbrand Corp., he was employed by a retail fabric chain and North Carolina National Bank (now Bank of America). Mr. Smith previously served as a member of the Advisory Board of certain Fidelity® funds (2012-2013).
David M. Thomas (1949)
Year of Election or Appointment: 2008
Trustee
Lead Independent Trustee
Mr. Thomas also serves as Trustee of other Fidelity® funds. Previously, Mr. Thomas served as Executive Chairman (2005-2006) and Chairman and Chief Executive Officer (2000-2005) of IMS Health, Inc. (pharmaceutical and healthcare information solutions). Mr. Thomas currently serves as a member of the Board of Fortune Brands Home and Security (home and security products, 2004-present) and as Director (2013-present) and Non-Executive Chairman of the Board (2022-present) of Interpublic Group of Companies, Inc. (marketing communication).
Susan Tomasky (1953)
Year of Election or Appointment: 2020
Trustee
Ms. Tomasky also serves as Trustee of other Fidelity® funds. Prior to her retirement, Ms. Tomasky served in various executive officer positions at American Electric Power Company, Inc. (1998-2011), including most recently as President of AEP Transmission (2007-2011). Ms. Tomasky currently serves as a member of the Board and Sustainability Committee and as Chair of the Audit Committee of Marathon Petroleum Corporation (2018-present) and as a member of the Board, Executive Committee, Corporate Governance Committee and Organization and Compensation Committee and as Chair of the Audit Committee of Public Service Enterprise Group, Inc. (utilities company, 2012-present) and as a member of the Board of its subsidiary company, Public Service Electric and Gas Co. (2021-present). In addition, Ms. Tomasky currently serves as a member (2009-present) and President (2020-present) of the Board of the Royal Shakespeare Company – America (2009-present), as a member of the Board of the Columbus Association for the Performing Arts (2011-present) and as a member of the Board and Kenyon in the World Committee of Kenyon College (2016-present). Previously, Ms. Tomasky served as a Member of the Advisory Board of certain Fidelity® funds (2020), as a member of the Board of the Columbus Regional Airport Authority (2007-2020), as a member of the Board (2011-2018) and Lead Independent Director (2015-2018) of Andeavor Corporation (previously Tesoro Corporation) (independent oil refiner and marketer) and as a member of the Board of Summit Midstream Partners LP (energy, 2012-2018).
Michael E. Wiley (1950)
Year of Election or Appointment: 2018
Trustee
Mr. Wiley also serves as Trustee of other Fidelity® funds. Previously, Mr. Wiley served as a member of the Advisory Board of certain Fidelity® funds (2018-2020), Chairman, President and CEO of Baker Hughes, Inc. (oilfield services, 2000-2004). Mr. Wiley also previously served as a member of the Board of Andeavor Corporation (independent oil refiner and marketer, 2005-2018), a member of the Board of Andeavor Logistics LP (natural resources logistics, 2015-2018) and a member of the Board of High Point Resources (exploration and production, 2005-2020).
+ The information includes the Trustee's principal occupation during the last five years and other information relating to the experience, attributes, and skills relevant to the Trustee's qualifications to serve as a Trustee, which led to the conclusion that the Trustee should serve as a Trustee for the fund.
Advisory Board Members and Officers:
Correspondence intended for a Member of the Advisory Board (if any) may be sent to Fidelity Investments, P.O. Box 55235, Boston, Massachusetts 02205-5235. Correspondence intended for an officer or Peter S. Lynch may be sent to Fidelity Investments, 245 Summer Street, Boston, Massachusetts 02210. Officers appear below in alphabetical order.
Name, Year of Birth; Principal Occupation
Peter S. Lynch (1944)
Year of Election or Appointment: 2003
Member of the Advisory Board
Mr. Lynch also serves as a Member of the Advisory Board of other Fidelity® funds. Mr. Lynch is Vice Chairman and a Director of Fidelity Management & Research Company LLC (investment adviser firm). In addition, Mr. Lynch serves as a Trustee of Boston College and as the Chairman of the Inner-City Scholarship Fund. Previously, Mr. Lynch served as Vice Chairman and a Director of FMR Co., Inc. (investment adviser firm) and on the Special Olympics International Board of Directors (1997-2006).
Craig S. Brown (1977)
Year of Election or Appointment: 2019
Assistant Treasurer
Mr. Brown also serves as an officer of other funds. Mr. Brown serves as Assistant Treasurer of FIMM, LLC (2021-present) and is an employee of Fidelity Investments (2013-present).
John J. Burke III (1964)
Year of Election or Appointment: 2018
Chief Financial Officer
Mr. Burke also serves as Chief Financial Officer of other funds. Mr. Burke serves as Head of Investment Operations for Fidelity Fund and Investment Operations (2018-present) and is an employee of Fidelity Investments (1998-present). Previously Mr. Burke served as head of Asset Management Investment Operations (2012-2018).
William C. Coffey (1969)
Year of Election or Appointment: 2019
Assistant Secretary
Mr. Coffey also serves as Assistant Secretary of other funds. He is Senior Vice President and Deputy General Counsel of FMR LLC (diversified financial services company, 2010-present), and is an employee of Fidelity Investments. Previously, Mr. Coffey served as Secretary and CLO of certain funds (2018-2019); CLO, Secretary, and Senior Vice President of Fidelity Management & Research Company and FMR Co., Inc. (investment adviser firms, 2018-2019); Secretary of Fidelity SelectCo, LLC and Fidelity Investments Money Management, Inc. (investment adviser firms, 2018-2019); CLO of Fidelity Management & Research (Hong Kong) Limited, FMR Investment Management (UK) Limited, and Fidelity Management & Research (Japan) Limited (investment adviser firms, 2018-2019); and Assistant Secretary of certain funds (2009-2018).
Timothy M. Cohen (1969)
Year of Election or Appointment: 2018
Vice President
Mr. Cohen also serves as Vice President of other funds. Mr. Cohen serves as Co-Head of Equity (2018-present), a Director of Fidelity Management & Research (Japan) Limited (investment adviser firm, 2016-present), and is an employee of Fidelity Investments. Previously, Mr. Cohen served as Executive Vice President of Fidelity SelectCo, LLC (2019), Head of Global Equity Research (2016-2018), Chief Investment Officer - Equity and a Director of Fidelity Management & Research (U.K.) Inc. (investment adviser firm, 2013-2015) and as a Director of Fidelity Management & Research (Hong Kong) Limited (investment adviser firm, 2017).
Jonathan Davis (1968)
Year of Election or Appointment: 2010
Assistant Treasurer
Mr. Davis also serves as an officer of other funds. Mr. Davis serves as Assistant Treasurer of FIMM, LLC (2021-present), FMR Capital, Inc. (2017-present), FD Funds GP LLC (2021-present), FD Funds Holding LLC (2021-present), and FD Funds Management LLC (2021-present); and is an employee of Fidelity Investments. Previously, Mr. Davis served as Vice President and Associate General Counsel of FMR LLC (diversified financial services company, 2003-2010).
Laura M. Del Prato (1964)
Year of Election or Appointment: 2018
Assistant Treasurer
Ms. Del Prato also serves as an officer of other funds. Ms. Del Prato serves as Assistant Treasurer of FIMM, LLC (2021-present) and is an employee of Fidelity Investments (2017-present). Previously, Ms. Del Prato served as President and Treasurer of The North Carolina Capital Management Trust: Cash Portfolio and Term Portfolio (2018-2020). Prior to joining Fidelity Investments, Ms. Del Prato served as a Managing Director and Treasurer of the JPMorgan Mutual Funds (2014-2017). Prior to JPMorgan, Ms. Del Prato served as a partner at Cohen Fund Audit Services (accounting firm, 2012-2013) and KPMG LLP (accounting firm, 2004-2012).
Colm A. Hogan (1973)
Year of Election or Appointment: 2020
Assistant Treasurer
Mr. Hogan also serves as an officer of other funds. Mr. Hogan serves as Assistant Treasurer of FIMM, LLC (2021-present) and FMR Capital, Inc. (2017-present) and is an employee of Fidelity Investments (2005-present). Previously, Mr. Hogan served as Deputy Treasurer of certain Fidelity® funds (2016-2020) and Assistant Treasurer of certain Fidelity® funds (2016-2018).
Pamela R. Holding (1964)
Year of Election or Appointment: 2018
Vice President
Ms. Holding also serves as Vice President of other funds. Ms. Holding serves as Co-Head of Equity (2018-present) and is an employee of Fidelity Investments (2013-present). Previously, Ms. Holding served as Executive Vice President of Fidelity SelectCo, LLC (2019) and as Chief Investment Officer of Fidelity Institutional Asset Management (2013-2018).
Cynthia Lo Bessette (1969)
Year of Election or Appointment: 2019
Secretary and Chief Legal Officer (CLO)
Ms. Lo Bessette also serves as an officer of other funds. Ms. Lo Bessette serves as CLO, Secretary, and Senior Vice President of Fidelity Management & Research Company LLC (investment adviser firm, 2019-present); CLO of Fidelity Management & Research (Hong Kong) Limited, FMR Investment Management (UK) Limited, and Fidelity Management & Research (Japan) Limited (investment adviser firms, 2019-present); Secretary of FD Funds GP LLC (2021-present), FD Funds Holding LLC (2021-present), and FD Funds Management LLC (2021-present); and Assistant Secretary of FIMM, LLC (2019-present). She is a Senior Vice President and Deputy General Counsel of FMR LLC (diversified financial services company, 2019-present), and is an employee of Fidelity Investments. Previously, Ms. Lo Bessette served as CLO, Secretary, and Senior Vice President of FMR Co., Inc. (investment adviser firm, 2019); Secretary of Fidelity SelectCo, LLC and Fidelity Investments Money Management, Inc. (investment adviser firms, 2019). Prior to joining Fidelity Investments, Ms. Lo Bessette was Executive Vice President, General Counsel (2016-2019) and Senior Vice President, Deputy General Counsel (2015-2016) of OppenheimerFunds (investment management company) and Deputy Chief Legal Officer (2013-2015) of Jennison Associates LLC (investment adviser firm).
Chris Maher (1972)
Year of Election or Appointment: 2020
Deputy Treasurer
Mr. Maher also serves as an officer of other funds. Mr. Maher serves as Assistant Treasurer of FIMM, LLC (2021-present) and FMR Capital, Inc. (2017-present), and is an employee of Fidelity Investments (2008-present). Previously, Mr. Maher served as Assistant Treasurer of certain funds (2013-2020); Vice President of Asset Management Compliance (2013), Vice President of the Program Management Group of FMR (investment adviser firm, 2010-2013), and Vice President of Valuation Oversight (2008-2010).
Jason P. Pogorelec (1975)
Year of Election or Appointment: 2020
Chief Compliance Officer
Mr. Pogorelec also serves as Chief Compliance Officer of other funds. Mr. Pogorelec is a senior Vice President of Asset Management Compliance for Fidelity Investments and is an employee of Fidelity Investments (2006-present). Previously, Mr. Pogorelec served as Vice President, Associate General Counsel for Fidelity Investments (2010-2020) and Assistant Secretary of certain Fidelity funds (2015-2020).
Brett Segaloff (1972)
Year of Election or Appointment: 2021
Anti-Money Laundering (AML) Officer
Mr. Segaloff also serves as an AML Officer of other funds and other related entities. He is Director, Anti-Money Laundering (2007-present) of FMR LLC (diversified financial services company) and is an employee of Fidelity Investments (1996-present).
Stacie M. Smith (1974)
Year of Election or Appointment: 2016
President and Treasurer
Ms. Smith also serves as an officer of other funds. Ms. Smith serves as Assistant Treasurer of FIMM, LLC (2021-present) and FMR Capital, Inc. (2017-present), is an employee of Fidelity Investments (2009-present), and has served in other fund officer roles. Prior to joining Fidelity Investments, Ms. Smith served as Senior Audit Manager of Ernst & Young LLP (accounting firm, 1996-2009). Previously, Ms. Smith served as Assistant Treasurer (2013-2019) and Deputy Treasurer (2013-2016) of certain Fidelity® funds.
Jim Wegmann (1979)
Year of Election or Appointment: 2019
Assistant Treasurer
Mr. Wegmann also serves as an officer of other funds. Mr. Wegmann serves as Assistant Treasurer of FIMM, LLC (2021-present) and is an employee of Fidelity Investments (2011-present). Previously, Mr. Wegmann served as Assistant Treasurer of certain Fidelity® funds (2019-2021).
Shareholder Expense Example
As a shareholder, you incur two types of costs: (1) transaction costs, which may include sales charges (loads) on purchase payments or redemption proceeds, as applicable and (2) ongoing costs, which generally include management fees, distribution and/or service (12b-1) fees and other Fund expenses. This Example is intended to help you understand your ongoing costs (in dollars) of investing in a fund and to compare these costs with the ongoing costs of investing in other mutual funds.
The Example is based on an investment of $1,000 invested at the beginning of the period and held for the entire period (January 1, 2022 to June 30, 2022).
Actual Expenses
The first line of the accompanying table provides information about actual account values and actual expenses. You may use the information in this line, together with the amount you invested, to estimate the expenses that you paid over the period. Simply divide your account value by $1,000.00 (for example, an $8,600 account value divided by $1,000.00 = 8.6), then multiply the result by the number in the first line for a class/Fund under the heading entitled "Expenses Paid During Period" to estimate the expenses you paid on your account during this period. If any fund is a shareholder of any underlying mutual funds or exchange-traded funds (ETFs) (the Underlying Funds), such fund indirectly bears its proportional share of the expenses of the Underlying Funds in addition to the direct expenses incurred presented in the table. These fees and expenses are not included in the annualized expense ratio used to calculate the expense estimate in the table below.
Hypothetical Example for Comparison Purposes
The second line of the accompanying table provides information about hypothetical account values and hypothetical expenses based on the actual expense ratio and an assumed rate of return of 5% per year before expenses, which is not the actual return. The hypothetical account values and expenses may not be used to estimate the actual ending account balance or expenses you paid for the period. You may use this information to compare the ongoing costs of investing in the Fund and other funds. To do so, compare this 5% hypothetical example with the 5% hypothetical examples that appear in the shareholder reports of the other funds. If any fund is a shareholder of any Underlying Funds, such fund indirectly bears its proportional share of the expenses of the Underlying Funds in addition to the direct expenses as presented in the table. These fees and expenses are not included in the annualized expense ratio used to calculate the expense estimate in the table below.
Please note that the expenses shown in the table are meant to highlight your ongoing costs only and do not reflect any transaction costs. Therefore, the second line of the table is useful in comparing ongoing costs only, and will not help you determine the relative total costs of owning different funds. In addition, if these transactional costs were included, your costs would have been higher.
| Annualized Expense Ratio-A | Beginning Account Value January 1, 2022 | Ending Account Value June 30, 2022 | Expenses Paid During Period-B January 1, 2022 to June 30, 2022 | |
| Fidelity Series Large Cap Stock Fund | -- %C | |||
| Actual | $1,000.00 | $862.00 | $--D | |
| Hypothetical-E | $1,000.00 | $1,024.79 | $--D |
A Annualized expense ratio reflects expenses net of applicable fee waivers.
B Expenses are equal to the annualized expense ratio, multiplied by the average account value over the period, multiplied by 181/ 365 (to reflect the one-half year period). The fees and expenses of any Underlying Funds are not included in each annualized expense ratio.
C Amount represents less than .005%.
D Amount represents less than $.005.
E 5% return per year before expenses
Distributions (Unaudited)
The dividend and capital gains distributions for the fund(s) are available on Fidelity.com or Institutional.Fidelity.com.
The fund hereby designates as a capital gain dividend with respect to the taxable year ended June 30, 2022, $834,020,840, or, if subsequently determined to be different, the net capital gain of such year.
The fund designates 41% and 54% of the dividends distributed in August and December, respectively during the fiscal year as qualifying for the dividends–received deduction for corporate shareholders.
The fund designates 48% and 59% of the dividends distributed in August and December, respectively during the fiscal year as amounts which may be taken into account as a dividend for the purposes of the maximum rate under section 1(h)(11) of the Internal Revenue Code.
The fund designates 1% and 2% of the dividends distributed in August and December, respectively during the fiscal year as a section 199A dividend.
The fund will notify shareholders in January 2023 of amounts for use in preparing 2022 income tax returns.
Board Approval of Investment Advisory Contracts and Management Fees
Fidelity Series Large Cap Stock Fund
Each year, the Board of Trustees, including the Independent Trustees (together, the Board), votes on the renewal of the management contract with Fidelity Management & Research Company LLC (FMR) and the sub-advisory agreements (together, the Advisory Contracts) for the fund. FMR and the sub-advisers are referred to herein as the Investment Advisers. The Board, assisted by the advice of fund counsel and Independent Trustees' counsel, requests and considers a broad range of information relevant to the renewal of the Advisory Contracts throughout the year.The Board meets regularly and, at each of its meetings, covers an extensive agenda of topics and materials and considers factors that are relevant to its annual consideration of the renewal of the fund's Advisory Contracts, including the services and support provided to the fund and its shareholders. The Board has established various standing committees (Committees), each composed of and chaired by Independent Trustees with varying backgrounds, to which the Board has assigned specific subject matter responsibilities in order to enhance effective decision-making by the Board. The Board, acting directly and through its Committees, requests and receives information concerning the annual consideration of the renewal of the fund's Advisory Contracts. The Board also meets as needed to review matters specifically related to the Board's annual consideration of the renewal of the Advisory Contracts. Members of the Board may also meet with trustees of other Fidelity funds through joint ad hoc committees to discuss certain matters relevant to all of the Fidelity funds.At its May 2022 meeting, the Board unanimously determined to renew the fund's Advisory Contracts. In considering whether to renew the Advisory Contracts for the fund, the Board considered all factors it believed relevant and reached a determination, with the assistance of fund counsel and Independent Trustees' counsel and through the exercise of its business judgment, that the renewal of the Advisory Contracts was in the best interests of the fund and its shareholders and the fact that no fee is payable under the management contract was fair and reasonable.Nature, Extent, and Quality of Services Provided. The Board considered Fidelity's staffing as it relates to the fund, including the backgrounds of investment personnel of Fidelity, and also considered the fund's investment objective, strategies, and related investment philosophy. The Independent Trustees also had discussions with senior management of Fidelity's investment operations and investment groups. The Board considered the structure of the investment personnel compensation program and whether this structure provides appropriate incentives to act in the best interests of the fund. The Board also considered the steps Fidelity had taken to ensure the continued provision of high quality services to the Fidelity funds during the COVID-19 pandemic, including the expansion of staff in client facing positions to maintain service levels in periods of high volumes and volatility.Resources Dedicated to Investment Management and Support Services. The Board and the Fund Oversight and Research Committees reviewed the general qualifications and capabilities of Fidelity's investment staff, including its size, education, experience, and resources, as well as Fidelity's approach to recruiting, training, managing, and compensating investment personnel. The Board noted the resources devoted to expansion of Fidelity's global investment organization, and that Fidelity's analysts have extensive resources, tools, and capabilities that allow them to conduct sophisticated quantitative and fundamental analysis, as well as credit analysis of issuers, counterparties, and guarantors. Further, the Board considered that Fidelity's investment professionals have sufficient access to global information and data so as to provide competitive investment results over time, and that those professionals also have access to sophisticated tools that permit them to assess portfolio construction and risk and performance attribution characteristics continuously, as well as to transmit new information and research conclusions rapidly around the world. Additionally, in its deliberations, the Board considered Fidelity's trading, risk management, compliance, and technology and operations capabilities and resources, which are integral parts of the investment management process.Administrative Services. The Board considered (i) the nature, extent, quality, and cost of advisory and administrative services performed by the Investment Advisers and their affiliates under the Advisory Contracts and under separate agreements covering transfer agency, pricing and bookkeeping, and securities lending services for the fund; (ii) the nature and extent of the supervision of third party service providers, principally custodians, subcustodians, and pricing vendors; and (iii) the resources devoted to, and the record of compliance with, the fund's compliance policies and procedures. The Board also reviewed the allocation of fund brokerage, including allocations to brokers affiliated with the Investment Advisers, the use of brokerage commissions to pay fund expenses, and the use of "soft" commission dollars to pay for research services.Investment Performance. The Board considered whether the fund has operated in accordance with its investment objective, as well as its record of compliance with its investment restrictions. The Board reviewed the fund's absolute investment performance, as well as the fund's relative investment performance, and considered the fund's underperformance for different time periods ended December 31, 2021. The Board did not consider performance to be a material factor in its decision to renew the fund's Advisory Contracts, as the fund is not publicly offered as a stand-alone investment product. In this regard, the Board noted that the fund is designed to offer an investment option for other investment companies, 529 plans, and collective investment trusts managed by Fidelity and ultimately to enhance the performance of those investment companies, 529 plans, and collective investment trusts.Based on its review, the Board concluded that the nature, extent, and quality of services provided to the fund under the Advisory Contracts should continue to benefit the shareholders of the fund.Competitiveness of Management Fee and Total Expense Ratio. The Board considered that the fund does not pay FMR a management fee for investment advisory services, but that FMR receives fees for providing services to funds that invest in the fund. The Board noted that FMR or an affiliate undertakes to pay all operating expenses of the fund, except transfer agent fees, 12b-1 fees (if any), Independent Trustee fees and expenses, custodian fees and expenses, proxy and shareholder meeting expenses, interest, taxes, and extraordinary expenses (such as litigation expenses). The Board further noted that the fund pays its non-operating expenses, including brokerage commissions and fees and expenses associated with the fund's securities lending program, if applicable.The Board further considered that FMR has contractually agreed to reimburse the fund to the extent that total operating expenses, with certain exceptions, as a percentage of its average net assets, exceed 0.003% through October 31, 2024.Based on its review, the Board considered that the fund does not pay a management fee and concluded that the total expense ratio of the fund was reasonable in light of the services that the fund and its shareholders receive and the other factors considered.Costs of the Services and Profitability. The Board considered the level of Fidelity's profits in respect of all the Fidelity funds.A public accounting firm has been engaged annually by the Board as part of the Board's assessment of Fidelity's profitability analysis. The engagement includes the review and assessment of the methodologies used by Fidelity in determining the revenues and expenses attributable to Fidelity's mutual fund business, and completion of agreed-upon procedures in respect of the mathematical accuracy of certain fund profitability information and its conformity to established allocation methodologies. After considering the reports issued under the engagement and information provided by Fidelity, the Board concluded that while other allocation methods may also be reasonable, Fidelity's profitability methodologies are reasonable in all material respects.The Board also reviewed Fidelity's non-fund businesses and potential indirect benefits such businesses may have received as a result of their association with Fidelity's mutual fund business (i.e., fall-out benefits) as well as cases where Fidelity's affiliates may benefit from the funds' business. The Board considered areas where potential indirect benefits to the Fidelity funds from their relationships with Fidelity may exist. The Board's consideration of these matters was informed by the findings of a joint ad hoc committee created by it and the boards of other Fidelity funds to evaluate potential fall-out benefits.The Board concluded that the costs of the services provided by and the profits realized by Fidelity in connection with the operation of the fund were not relevant to the renewal of the Advisory Contracts because the fund pays no advisory fees and FMR bears all expenses of the fund with certain exceptions.Economies of Scale. The Board concluded that because the fund pays no advisory fees and FMR bears all expenses of the fund with certain exceptions, the realization of economies of scale was not a material factor in the Board's decision to renew the fund's Advisory Contracts.Additional Information Requested by the Board. In order to develop fully the factual basis for consideration of the Fidelity funds' advisory contracts, the Board requested and received additional information on certain topics, including: (i) fund flow and performance trends, in particular the underperformance of certain funds and strategies, and Fidelity's long-term strategies for certain funds, including any consideration of fund liquidations or mergers; (ii) the operation of performance fees, competitor use of performance fees, and consideration of the expansion of performance fees to additional funds; (iii) Fidelity's pricing philosophy compared to competitors; (iv) fund profitability methodology and data; (v) evaluation of competitive fund data and peer group classifications and fee and expense comparisons; (vi) the management fee and expense structures for different funds and classes and information about the differences between various fee and expense structures; (vii) group fee breakpoints and related voluntary fee waivers; and (viii) information regarding other accounts managed by Fidelity and the funds' sub-advisory arrangements.Based on its evaluation of all of the conclusions noted above, and after considering all factors it believed relevant, the Board concluded that the advisory fee arrangements are fair and reasonable and that the fund's Advisory Contracts should be renewed.Liquidity Risk Management Program
The Securities and Exchange Commission adopted Rule 22e-4 under the Investment Company Act of 1940 (the Liquidity Rule) to promote effective liquidity risk management throughout the open-end investment company industry, thereby reducing the risk that funds will be unable to meet their redemption obligations and mitigating dilution of the interests of fund shareholders.
The Fund has adopted and implemented a liquidity risk management program pursuant to the Liquidity Rule (the Program) effective December 1, 2018. The Program is reasonably designed to assess and manage the Fund’s liquidity risk and to comply with the requirements of the Liquidity Rule. The Fund’s Board of Trustees (the Board) has designated the Fund’s investment adviser as administrator of the Program. The Fidelity advisers have established a Liquidity Risk Management Committee (the LRM Committee) to manage the Program for each of the Fidelity Funds. The LRM Committee monitors the adequacy and effectiveness of implementation of the Program and on a periodic basis assesses each Fund’s liquidity risk based on a variety of factors including (1) the Fund’s investment strategy, (2) portfolio liquidity and cash flow projections during normal and reasonably foreseeable stressed conditions, (3) shareholder redemptions, (4) borrowings and other funding sources and (5) in the case of exchange-traded funds, certain additional factors including the effect of the Fund’s prices and spreads, market participants, and basket compositions on the overall liquidity of the Fund’s portfolio, as applicable.
In accordance with the Program, each of the Fund’s portfolio investments is classified into one of four liquidity categories described below based on a determination of a reasonable expectation for how long it would take to convert the investment to cash (or sell or dispose of the investment) without significantly changing its market value.
- Highly liquid investments – cash or convertible to cash within three business days or less
- Moderately liquid investments – convertible to cash in three to seven calendar days
- Less liquid investments – can be sold or disposed of, but not settled, within seven calendar days
- Illiquid investments – cannot be sold or disposed of within seven calendar days
Liquidity classification determinations take into account a variety of factors including various market, trading and investment-specific considerations, as well as market depth, and generally utilize analysis from a third-party liquidity metrics service.
The Liquidity Rule places a 15% limit on a fund’s illiquid investments and requires funds that do not primarily hold assets that are highly liquid investments to determine and maintain a minimum percentage of the fund’s net assets to be invested in highly liquid investments (highly liquid investment minimum or HLIM). The Program includes provisions reasonably designed to comply with the 15% limit on illiquid investments and for determining, periodically reviewing and complying with the HLIM requirement as applicable.
At a recent meeting of the Fund’s Board of Trustees, the LRM Committee provided a written report to the Board pertaining to the operation, adequacy, and effectiveness of implementation of the Program for the annual period from December 1, 2020 through November 30, 2021. The report concluded that the Program has been implemented and is operating effectively and is reasonably designed to assess and manage the Fund’s liquidity risk.
![]()
MHT-ANN-0822
1.951035.109
Fidelity® Fund
June 30, 2022
Contents
Board Approval of Investment Advisory Contracts and Management Fees | |
To view a fund's proxy voting guidelines and proxy voting record for the 12-month period ended June 30, visit http://www.fidelity.com/proxyvotingresults or visit the Securities and Exchange Commission's (SEC) web site at http://www.sec.gov.
You may also call 1-800-544-8544 if you’re an individual investing directly with Fidelity, call 1-800-835-5092 if you’re a plan sponsor or participant with Fidelity as your recordkeeper or call 1-877-208-0098 on institutional accounts or if you’re an advisor or invest through one to request a free copy of the proxy voting guidelines.
Standard & Poor's, S&P and S&P 500 are registered service marks of The McGraw-Hill Companies, Inc. and have been licensed for use by Fidelity Distributors Corporation.
Other third-party marks appearing herein are the property of their respective owners.
All other marks appearing herein are registered or unregistered trademarks or service marks of FMR LLC or an affiliated company. © 2022 FMR LLC. All rights reserved.
This report and the financial statements contained herein are submitted for the general information of the shareholders of the Fund. This report is not authorized for distribution to prospective investors in the Fund unless preceded or accompanied by an effective prospectus.
A fund files its complete schedule of portfolio holdings with the SEC for the first and third quarters of each fiscal year on Form N-PORT. Forms N-PORT are available on the SEC’s web site at http://www.sec.gov. A fund's Forms N-PORT may be reviewed and copied at the SEC’s Public Reference Room in Washington, DC. Information regarding the operation of the SEC's Public Reference Room may be obtained by calling 1-800-SEC-0330.
For a complete list of a fund's portfolio holdings, view the most recent holdings listing, semiannual report, or annual report on Fidelity's web site at http://www.fidelity.com, http://www.institutional.fidelity.com, or http://www.401k.com, as applicable.
NOT FDIC INSURED •MAY LOSE VALUE •NO BANK GUARANTEE
Neither the Fund nor Fidelity Distributors Corporation is a bank.
Note to Shareholders:
Early in 2020, the outbreak and spread of COVID-19 emerged as a public health emergency that had a major influence on financial markets, primarily based on its impact on the global economy and corporate earnings. On March 11, 2020, the World Health Organization declared the COVID-19 outbreak a pandemic, citing sustained risk of further global spread. The pandemic prompted a number of measures to limit the spread of COVID-19, including travel and border restrictions, quarantines, and restrictions on large gatherings. In turn, these resulted in lower consumer activity, diminished demand for a wide range of products and services, disruption in manufacturing and supply chains, and – given the wide variability in outcomes regarding the outbreak – significant market uncertainty and volatility. To help stem the turmoil, the U.S. government took unprecedented action – in concert with the U.S. Federal Reserve and central banks around the world – to help support consumers, businesses, and the broader economy, and to limit disruption to the financial system.
In general, the overall impact of the pandemic lessened in 2021, amid a resilient economy and widespread distribution of three COVID-19 vaccines granted emergency use authorization from the U.S. Food and Drug Administration (FDA) early in the year. Still, the situation remains dynamic, and the extent and duration of its influence on financial markets and the economy is highly uncertain, due in part to a recent spike in cases based on highly contagious variants of the coronavirus.
Extreme events such as the COVID-19 crisis are exogenous shocks that can have significant adverse effects on mutual funds and their investments. Although multiple asset classes may be affected by market disruption, the duration and impact may not be the same for all types of assets. Fidelity is committed to helping you stay informed amid news about COVID-19 and during increased market volatility, and we continue to take extra steps to be responsive to customer needs. We encourage you to visit us online, where we offer ongoing updates, commentary, and analysis on the markets and our funds.
Performance: The Bottom Line
Average annual total return reflects the change in the value of an investment, assuming reinvestment of distributions from dividend income and capital gains (the profits earned upon the sale of securities that have grown in value, if any) and assuming a constant rate of performance each year. The hypothetical investment and the average annual total returns do not reflect the deduction of taxes that a shareholder would pay on fund distributions or the redemption of fund shares. During periods of reimbursement by Fidelity, a fund’s total return will be greater than it would be had the reimbursement not occurred. How a fund did yesterday is no guarantee of how it will do tomorrow.
Average Annual Total Returns
| For the periods ended June 30, 2022 | Past 1 year | Past 5 years | Past 10 years |
| Fidelity® Fund | (15.60)% | 12.13% | 12.37% |
| Class K | (15.54)% | 12.22% | 12.49% |
$10,000 Over 10 Years
Let's say hypothetically that $10,000 was invested in Fidelity® Fund, a class of the fund, on June 30, 2012.
The chart shows how the value of your investment would have changed, and also shows how the S&P 500® Index performed over the same period.
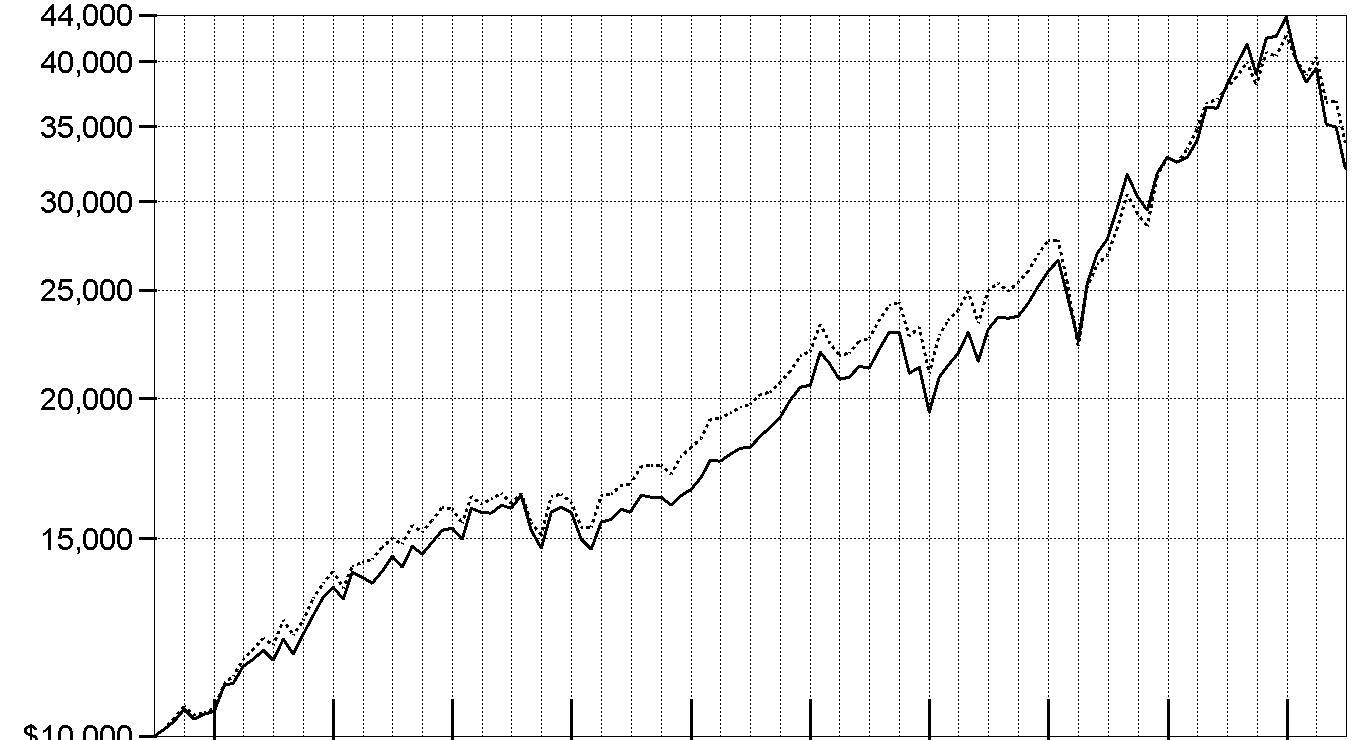
| Period Ending Values | ||
| $32,102 | Fidelity® Fund | |
| $33,816 | S&P 500® Index | |
Management's Discussion of Fund Performance
Market Recap: The S&P 500® index returned -10.62% for the 12 months ending June 30, 2022, as a multitude of crosscurrents challenged the global economy and financial markets. Persistently high inflation, exacerbated by energy price shocks from the Russia–Ukraine conflict, spurred the U.S. Federal Reserve to hike interest rates more aggressively than anticipated, and concerns about the outlook for economic growth sent stocks into bear market territory. Against this backdrop, the index returned -8.72% in April amid clearer signals of the Fed’s intention to tighten monetary policy. In early May, the Fed approved a rare half-percentage-point interest rate increase and announced plans to shrink its $9 trillion asset portfolio. The S&P 500® gained 0.18% for the month. June began with the Fed allowing up to billions in Treasuries and mortgage bonds to mature every month without investing the proceeds. Two weeks later, the central bank raised rates by 0.75 percentage points, its largest increase since 1994, and said it was becoming more difficult to achieve a soft landing, in which the economy slows enough to bring down inflation while avoiding a recession. Partly in reaction, the S&P 500 returned -8.25% in June and -19.96% since the end of 2021 – its worst first-half result to begin a year since 1970. For the full 12 months, the growth-oriented communication services (-29%) and consumer discretionary (-24%) sectors lagged most. In contrast, energy (+40%) rode a surge in commodity prices and led by a wide margin, followed by defensive sectors, such as utilities (+14%).Comments from Portfolio Manager Jean Park: For the fiscal year ending June 30, 2022, the fund's share classes returned about -16%, underperforming the -10.62% result of the benchmark S&P 500® index. The primary detractor from performance versus the benchmark was an underweighting in energy. Weak picks in the financials sector, especially within the diversified financials industry, also hurt. Also hurting our result was security selection in the health care sector, primarily within the pharmaceuticals, biotechnology & life sciences industry. The biggest individual relative detractor was an overweight position in Meta Platforms (-53%). Meta Platforms was among our largest holdings this period. Also hampering performance was our lighter-than-benchmark stake in Exxon Mobil, which gained about 43%. This was a position we established the past year. Avoiding Chevron, a benchmark component that gained approximately 44%, also hurt relative performance. In contrast, the largest contributor to performance versus the benchmark was our security selection in information technology. An underweighting in consumer discretionary and stock selection in communication services also helped the fund's relative performance. The biggest individual relative contributor was an overweight position in UnitedHealth Group (+30%). UnitedHealth Group was among our biggest holdings. Also helping performance was our outsized stake in Costco Wholesale, which gained 22%. Costco Wholesale was among the fund's largest holdings. Avoiding Disney, a benchmark component that returned about -46%, also aided relative performance. Notable changes in positioning include increased exposure to the health care sector and a lower allocation to communication services.The views expressed above reflect those of the portfolio manager(s) only through the end of the period as stated on the cover of this report and do not necessarily represent the views of Fidelity or any other person in the Fidelity organization. Any such views are subject to change at any time based upon market or other conditions and Fidelity disclaims any responsibility to update such views. These views may not be relied on as investment advice and, because investment decisions for a Fidelity fund are based on numerous factors, may not be relied on as an indication of trading intent on behalf of any Fidelity fund.
Investment Summary (Unaudited)
Top Ten Stocks as of June 30, 2022
| % of fund's net assets | |
| Apple, Inc. | 10.4 |
| Microsoft Corp. | 10.2 |
| Alphabet, Inc. Class A | 7.8 |
| UnitedHealth Group, Inc. | 2.9 |
| Amazon.com, Inc. | 2.6 |
| Costco Wholesale Corp. | 2.2 |
| Danaher Corp. | 2.1 |
| The Home Depot, Inc. | 1.8 |
| Exxon Mobil Corp. | 1.8 |
| Eli Lilly & Co. | 1.6 |
| 43.4 |
Market Sectors as of June 30, 2022
| % of fund's net assets | |
| Information Technology | 36.8 |
| Health Care | 15.4 |
| Communication Services | 11.6 |
| Consumer Discretionary | 9.4 |
| Financials | 8.5 |
| Consumer Staples | 5.1 |
| Energy | 4.2 |
| Materials | 3.2 |
| Industrials | 2.4 |
| Utilities | 1.2 |
| Real Estate | 0.5 |
Asset Allocation (% of fund's net assets)
| As of June 30, 2022* | ||
| Stocks | 98.3% | |
| Short-Term Investments and Net Other Assets (Liabilities) | 1.7% | |

* Foreign investments – 3.6%
Schedule of Investments June 30, 2022
Showing Percentage of Net Assets
| Common Stocks - 98.3% | |||
| Shares | Value (000s) | ||
| COMMUNICATION SERVICES - 11.6% | |||
| Entertainment - 0.8% | |||
| Activision Blizzard, Inc. | 659,192 | $51,325 | |
| Interactive Media & Services - 10.8% | |||
| Alphabet, Inc.: | |||
| Class A (a) | 219,100 | 477,476 | |
| Class C (a) | 38,000 | 83,123 | |
| Meta Platforms, Inc. Class A (a) | 614,000 | 99,008 | |
| 659,607 | |||
| TOTAL COMMUNICATION SERVICES | 710,932 | ||
| CONSUMER DISCRETIONARY - 9.4% | |||
| Distributors - 0.2% | |||
| Pool Corp. | 40,600 | 14,260 | |
| Hotels, Restaurants & Leisure - 0.7% | |||
| Airbnb, Inc. Class A (a) | 20,400 | 1,817 | |
| Marriott International, Inc. Class A | 312,000 | 42,435 | |
| 44,252 | |||
| Household Durables - 0.2% | |||
| NVR, Inc. (a) | 2,520 | 10,090 | |
| Internet & Direct Marketing Retail - 2.8% | |||
| Amazon.com, Inc. (a) | 1,524,600 | 161,928 | |
| eBay, Inc. | 233,477 | 9,729 | |
| 171,657 | |||
| Multiline Retail - 1.2% | |||
| Dollar General Corp. | 309,400 | 75,939 | |
| Specialty Retail - 3.9% | |||
| AutoZone, Inc. (a) | 16,300 | 35,031 | |
| Lowe's Companies, Inc. | 248,236 | 43,359 | |
| O'Reilly Automotive, Inc. (a) | 64,500 | 40,749 | |
| The Home Depot, Inc. | 401,900 | 110,229 | |
| Tractor Supply Co. | 39,900 | 7,735 | |
| 237,103 | |||
| Textiles, Apparel & Luxury Goods - 0.4% | |||
| NIKE, Inc. Class B | 252,000 | 25,754 | |
| TOTAL CONSUMER DISCRETIONARY | 579,055 | ||
| CONSUMER STAPLES - 5.1% | |||
| Food & Staples Retailing - 2.5% | |||
| Costco Wholesale Corp. | 285,600 | 136,882 | |
| Walmart, Inc. | 162,900 | 19,805 | |
| 156,687 | |||
| Household Products - 1.6% | |||
| Procter & Gamble Co. | 681,700 | 98,022 | |
| Personal Products - 1.0% | |||
| Estee Lauder Companies, Inc. Class A | 232,600 | 59,236 | |
| TOTAL CONSUMER STAPLES | 313,945 | ||
| ENERGY - 4.2% | |||
| Energy Equipment & Services - 0.4% | |||
| Halliburton Co. | 890,000 | 27,910 | |
| Oil, Gas & Consumable Fuels - 3.8% | |||
| Coterra Energy, Inc. | 434,100 | 11,195 | |
| Exxon Mobil Corp. | 1,279,901 | 109,611 | |
| Occidental Petroleum Corp. | 1,306,500 | 76,927 | |
| PDC Energy, Inc. | 577,100 | 35,555 | |
| 233,288 | |||
| TOTAL ENERGY | 261,198 | ||
| FINANCIALS - 8.5% | |||
| Banks - 1.4% | |||
| JPMorgan Chase & Co. | 753,000 | 84,795 | |
| Capital Markets - 4.8% | |||
| Ameriprise Financial, Inc. | 83,000 | 19,727 | |
| BlackRock, Inc. Class A | 26,000 | 15,835 | |
| Moody's Corp. | 65,000 | 17,678 | |
| Morgan Stanley | 830,000 | 63,130 | |
| MSCI, Inc. | 206,700 | 85,191 | |
| Nordnet AB | 203,200 | 2,656 | |
| Raymond James Financial, Inc. | 405,200 | 36,229 | |
| S&P Global, Inc. | 168,000 | 56,626 | |
| 297,072 | |||
| Consumer Finance - 1.4% | |||
| American Express Co. | 180,000 | 24,952 | |
| Capital One Financial Corp. | 345,940 | 36,043 | |
| Discover Financial Services | 238,489 | 22,556 | |
| 83,551 | |||
| Insurance - 0.9% | |||
| Arthur J. Gallagher & Co. | 312,092 | 50,883 | |
| Progressive Corp. | 57,200 | 6,651 | |
| 57,534 | |||
| TOTAL FINANCIALS | 522,952 | ||
| HEALTH CARE - 15.4% | |||
| Biotechnology - 1.6% | |||
| Regeneron Pharmaceuticals, Inc. (a) | 86,768 | 51,291 | |
| Vertex Pharmaceuticals, Inc. (a) | 160,000 | 45,086 | |
| 96,377 | |||
| Health Care Equipment & Supplies - 1.4% | |||
| Edwards Lifesciences Corp. (a) | 439,000 | 41,745 | |
| Intuitive Surgical, Inc. (a) | 91,267 | 18,318 | |
| ResMed, Inc. | 122,000 | 25,575 | |
| 85,638 | |||
| Health Care Providers & Services - 4.7% | |||
| Laboratory Corp. of America Holdings | 163,800 | 38,388 | |
| McKesson Corp. | 135,200 | 44,104 | |
| Tenet Healthcare Corp. (a) | 564,325 | 29,661 | |
| UnitedHealth Group, Inc. | 342,030 | 175,677 | |
| 287,830 | |||
| Life Sciences Tools & Services - 3.9% | |||
| Danaher Corp. | 514,200 | 130,360 | |
| Mettler-Toledo International, Inc. (a) | 7,200 | 8,271 | |
| Thermo Fisher Scientific, Inc. | 166,600 | 90,510 | |
| West Pharmaceutical Services, Inc. | 39,000 | 11,792 | |
| 240,933 | |||
| Pharmaceuticals - 3.8% | |||
| AstraZeneca PLC sponsored ADR | 694,519 | 45,887 | |
| Eli Lilly & Co. | 315,000 | 102,132 | |
| Merck & Co., Inc. | 522,000 | 47,591 | |
| Zoetis, Inc. Class A | 237,100 | 40,755 | |
| 236,365 | |||
| TOTAL HEALTH CARE | 947,143 | ||
| INDUSTRIALS - 2.4% | |||
| Airlines - 0.4% | |||
| Southwest Airlines Co. (a) | 640,500 | 23,135 | |
| Building Products - 0.8% | |||
| Builders FirstSource, Inc. (a) | 472,800 | 25,389 | |
| Carrier Global Corp. | 669,000 | 23,857 | |
| 49,246 | |||
| Commercial Services & Supplies - 0.2% | |||
| Copart, Inc. (a) | 77,000 | 8,367 | |
| Construction & Engineering - 0.1% | |||
| Quanta Services, Inc. | 50,400 | 6,317 | |
| Electrical Equipment - 0.1% | |||
| AMETEK, Inc. | 72,000 | 7,912 | |
| Machinery - 0.4% | |||
| Otis Worldwide Corp. | 339,700 | 24,007 | |
| Road & Rail - 0.4% | |||
| Old Dominion Freight Lines, Inc. | 103,000 | 26,397 | |
| TOTAL INDUSTRIALS | 145,381 | ||
| INFORMATION TECHNOLOGY - 36.8% | |||
| Electronic Equipment & Components - 0.9% | |||
| Amphenol Corp. Class A | 654,000 | 42,105 | |
| Keysight Technologies, Inc. (a) | 75,000 | 10,339 | |
| 52,444 | |||
| IT Services - 3.9% | |||
| Accenture PLC Class A | 183,800 | 51,032 | |
| Adyen BV (a)(b) | 2,400 | 3,464 | |
| MasterCard, Inc. Class A | 250,000 | 78,870 | |
| Snowflake, Inc. (a) | 91,500 | 12,724 | |
| Visa, Inc. Class A | 487,500 | 95,984 | |
| 242,074 | |||
| Semiconductors & Semiconductor Equipment - 7.6% | |||
| ASML Holding NV | 69,000 | 32,836 | |
| Broadcom, Inc. | 194,800 | 94,636 | |
| KLA Corp. | 203,300 | 64,869 | |
| Lam Research Corp. | 161,900 | 68,994 | |
| Marvell Technology, Inc. | 720,000 | 31,342 | |
| Monolithic Power Systems, Inc. | 100 | 38 | |
| NVIDIA Corp. | 349,700 | 53,011 | |
| NXP Semiconductors NV | 382,200 | 56,577 | |
| onsemi (a) | 963,600 | 48,479 | |
| Texas Instruments, Inc. | 80,900 | 12,430 | |
| 463,212 | |||
| Software - 14.0% | |||
| Adobe, Inc. (a) | 165,000 | 60,400 | |
| Cadence Design Systems, Inc. (a) | 258,700 | 38,813 | |
| Fortinet, Inc. (a) | 1,360,000 | 76,949 | |
| Microsoft Corp. | 2,440,000 | 626,665 | |
| Roper Technologies, Inc. | 102,000 | 40,254 | |
| Synopsys, Inc. (a) | 53,743 | 16,322 | |
| 859,403 | |||
| Technology Hardware, Storage & Peripherals - 10.4% | |||
| Apple, Inc. | 4,685,000 | 640,532 | |
| TOTAL INFORMATION TECHNOLOGY | 2,257,665 | ||
| MATERIALS - 3.2% | |||
| Chemicals - 2.4% | |||
| Dow, Inc. | 1,170,700 | 60,420 | |
| Linde PLC | 60,100 | 17,281 | |
| LyondellBasell Industries NV Class A | 320,000 | 27,987 | |
| Sherwin-Williams Co. | 195,471 | 43,768 | |
| 149,456 | |||
| Metals & Mining - 0.8% | |||
| Freeport-McMoRan, Inc. | 1,049,004 | 30,694 | |
| Steel Dynamics, Inc. | 279,100 | 18,462 | |
| 49,156 | |||
| TOTAL MATERIALS | 198,612 | ||
| REAL ESTATE - 0.5% | |||
| Equity Real Estate Investment Trusts (REITs) - 0.5% | |||
| Prologis (REIT), Inc. | 250,760 | 29,502 | |
| UTILITIES - 1.2% | |||
| Electric Utilities - 1.2% | |||
| NextEra Energy, Inc. | 945,000 | 73,200 | |
| TOTAL COMMON STOCKS | |||
| (Cost $3,299,491) | 6,039,585 | ||
| Money Market Funds - 1.7% | |||
| Fidelity Cash Central Fund 1.58% (c) | |||
| (Cost $102,344) | 102,325,632 | 102,346 | |
| TOTAL INVESTMENT IN SECURITIES - 100.0% | |||
| (Cost $3,401,835) | 6,141,931 | ||
| NET OTHER ASSETS (LIABILITIES) - 0.0% | (262) | ||
| NET ASSETS - 100% | $6,141,669 |
Legend
(a) Non-income producing
(b) Security exempt from registration under Rule 144A of the Securities Act of 1933. These securities may be resold in transactions exempt from registration, normally to qualified institutional buyers. At the end of the period, the value of these securities amounted to $3,464,000 or 0.1% of net assets.
(c) Affiliated fund that is generally available only to investment companies and other accounts managed by Fidelity Investments. The rate quoted is the annualized seven-day yield of the fund at period end. A complete unaudited listing of the fund's holdings as of its most recent quarter end is available upon request. In addition, each Fidelity Central Fund's financial statements, which are not covered by the Fund's Report of Independent Registered Public Accounting Firm, are available on the SEC's website or upon request.
Affiliated Central Funds
Fiscal year to date information regarding the Fund's investments in Fidelity Central Funds, including the ownership percentage, is presented below.
| Fund (Amounts in thousands) | Value, beginning of period | Purchases | Sales Proceeds | Dividend Income | Realized Gain/Loss | Change in Unrealized appreciation (depreciation) | Value, end of period | % ownership, end of period |
| Fidelity Cash Central Fund 1.58% | $122,356 | $2,391,221 | $2,411,231 | $287 | $-- | $-- | $102,346 | 0.2% |
| Fidelity Securities Lending Cash Central Fund 1.58% | 7,351 | 161,130 | 168,481 | 65 | -- | -- | -- | 0.0% |
| Total | $129,707 | $2,552,351 | $2,579,712 | $352 | $-- | $-- | $102,346 |
Amounts in the income column in the above table include any capital gain distributions from underlying funds, which are presented in the corresponding line-item in the Statement of Operations, if applicable. Amount for Fidelity Securities Lending Cash Central Fund represents the income earned on investing cash collateral, less rebates paid to borrowers and any lending agent fees associated with the loan, plus any premium payments received for lending certain types of securities.
Investment Valuation
The following is a summary of the inputs used, as of June 30, 2022, involving the Fund's assets and liabilities carried at fair value. The inputs or methodology used for valuing securities may not be an indication of the risk associated with investing in those securities. For more information on valuation inputs, and their aggregation into the levels used below, please refer to the Investment Valuation section in the accompanying Notes to Financial Statements.
| Valuation Inputs at Reporting Date: | ||||
| Description | Total | Level 1 | Level 2 | Level 3 |
| (Amounts in thousands) | ||||
| Investments in Securities: | ||||
| Equities: | ||||
| Communication Services | $710,932 | $710,932 | $-- | $-- |
| Consumer Discretionary | 579,055 | 579,055 | -- | -- |
| Consumer Staples | 313,945 | 313,945 | -- | -- |
| Energy | 261,198 | 261,198 | -- | -- |
| Financials | 522,952 | 522,952 | -- | -- |
| Health Care | 947,143 | 947,143 | -- | -- |
| Industrials | 145,381 | 145,381 | -- | -- |
| Information Technology | 2,257,665 | 2,254,201 | 3,464 | -- |
| Materials | 198,612 | 198,612 | -- | -- |
| Real Estate | 29,502 | 29,502 | -- | -- |
| Utilities | 73,200 | 73,200 | -- | -- |
| Money Market Funds | 102,346 | 102,346 | -- | -- |
| Total Investments in Securities: | $6,141,931 | $6,138,467 | $3,464 | $-- |
See accompanying notes which are an integral part of the financial statements.
Financial Statements
Statement of Assets and Liabilities
| Amounts in thousands (except per-share amounts) | June 30, 2022 | |
| Assets | ||
| Investment in securities, at value — See accompanying schedule: Unaffiliated issuers (cost $3,299,491) | $6,039,585 | |
| Fidelity Central Funds (cost $102,344) | 102,346 | |
| Total Investment in Securities (cost $3,401,835) | $6,141,931 | |
| Cash | 3 | |
| Receivable for investments sold | 1,043 | |
| Receivable for fund shares sold | 834 | |
| Dividends receivable | 2,182 | |
| Distributions receivable from Fidelity Central Funds | 106 | |
| Other receivables | 32 | |
| Total assets | 6,146,131 | |
| Liabilities | ||
| Payable for fund shares redeemed | $1,949 | |
| Accrued management fee | 1,677 | |
| Transfer agent fee payable | 654 | |
| Other affiliated payables | 84 | |
| Other payables and accrued expenses | 98 | |
| Total liabilities | 4,462 | |
| Net Assets | $6,141,669 | |
| Net Assets consist of: | ||
| Paid in capital | $3,571,870 | |
| Total accumulated earnings (loss) | 2,569,799 | |
| Net Assets | $6,141,669 | |
| Net Asset Value and Maximum Offering Price | ||
| Fidelity Fund: | ||
| Net Asset Value, offering price and redemption price per share ($5,467,793 ÷ 94,180 shares) | $58.06 | |
| Class K: | ||
| Net Asset Value, offering price and redemption price per share ($673,876 ÷ 11,605 shares) | $58.07 |
See accompanying notes which are an integral part of the financial statements.
Statement of Operations
| Amounts in thousands | Year ended June 30, 2022 | |
| Investment Income | ||
| Dividends | $60,287 | |
| Income from Fidelity Central Funds (including $65 from security lending) | 352 | |
| Total income | 60,639 | |
| Expenses | ||
| Management fee | $23,761 | |
| Transfer agent fees | 8,408 | |
| Accounting fees | 1,175 | |
| Custodian fees and expenses | 72 | |
| Independent trustees' fees and expenses | 26 | |
| Registration fees | 156 | |
| Audit | 70 | |
| Legal | 34 | |
| Miscellaneous | 41 | |
| Total expenses before reductions | 33,743 | |
| Expense reductions | (221) | |
| Total expenses after reductions | 33,522 | |
| Net investment income (loss) | 27,117 | |
| Realized and Unrealized Gain (Loss) | ||
| Net realized gain (loss) on: | ||
| Investment securities: | ||
| Unaffiliated issuers | (83,108) | |
| Foreign currency transactions | 35 | |
| Total net realized gain (loss) | (83,073) | |
| Change in net unrealized appreciation (depreciation) on: | ||
| Investment securities: | ||
| Unaffiliated issuers | (1,118,756) | |
| Assets and liabilities in foreign currencies | (10) | |
| Total change in net unrealized appreciation (depreciation) | (1,118,766) | |
| Net gain (loss) | (1,201,839) | |
| Net increase (decrease) in net assets resulting from operations | $(1,174,722) |
See accompanying notes which are an integral part of the financial statements.
Statement of Changes in Net Assets
| Amounts in thousands | Year ended June 30, 2022 | Year ended June 30, 2021 |
| Increase (Decrease) in Net Assets | ||
| Operations | ||
| Net investment income (loss) | $27,117 | $25,228 |
| Net realized gain (loss) | (83,073) | 457,233 |
| Change in net unrealized appreciation (depreciation) | (1,118,766) | 1,258,934 |
| Net increase (decrease) in net assets resulting from operations | (1,174,722) | 1,741,395 |
| Distributions to shareholders | (363,444) | (143,823) |
| Share transactions - net increase (decrease) | 510,634 | 647,842 |
| Total increase (decrease) in net assets | (1,027,532) | 2,245,414 |
| Net Assets | ||
| Beginning of period | 7,169,201 | 4,923,787 |
| End of period | $6,141,669 | $7,169,201 |
See accompanying notes which are an integral part of the financial statements.
Financial Highlights
Fidelity Fund
| Years ended June 30, | 2022 | 2021 | 2020 | 2019 | 2018 |
| Selected Per–Share Data | |||||
| Net asset value, beginning of period | $72.20 | $54.21 | $47.60 | $46.86 | $44.92 |
| Income from Investment Operations | |||||
| Net investment income (loss)A,B | .25 | .28 | .39 | .46 | .45 |
| Net realized and unrealized gain (loss) | (10.75) | 19.40 | 8.96 | 3.26 | 6.74 |
| Total from investment operations | (10.50) | 19.68 | 9.35 | 3.72 | 7.19 |
| Distributions from net investment income | (.21) | (.32) | (.42) | (.44) | (.45) |
| Distributions from net realized gain | (3.44) | (1.38) | (2.32) | (2.54) | (4.80) |
| Total distributions | (3.64)C | (1.69)C | (2.74) | (2.98) | (5.25) |
| Net asset value, end of period | $58.06 | $72.20 | $54.21 | $47.60 | $46.86 |
| Total ReturnD | (15.60)% | 36.94% | 20.51% | 8.27% | 17.51% |
| Ratios to Average Net AssetsB,E,F | |||||
| Expenses before reductions | .45% | .47% | .48% | .50% | .50% |
| Expenses net of fee waivers, if any | .45% | .47% | .48% | .49% | .50% |
| Expenses net of all reductions | .45% | .46% | .48% | .49% | .50% |
| Net investment income (loss) | .35% | .44% | .79% | 1.01% | .99% |
| Supplemental Data | |||||
| Net assets, end of period (in millions) | $5,468 | $6,758 | $4,402 | $4,019 | $4,129 |
| Portfolio turnover rateG | 39% | 34%H | 51% | 45% | 38% |
A Calculated based on average shares outstanding during the period.
B Net investment income (loss) is affected by the timing of the declaration of dividends by any underlying mutual funds or exchange-traded funds (ETFs). Net investment income (loss) of any such underlying funds is not included in the Fund's net investment income (loss) ratio.
C Total distributions per share do not sum due to rounding.
D Total returns would have been lower if certain expenses had not been reduced during the applicable periods shown.
E Fees and expenses of any underlying mutual funds or exchange-traded funds (ETFs) are not included in the Fund's expense ratio. The Fund indirectly bears its proportionate share of these expenses. For additional expense information related to investments in Fidelity Central Funds, please refer to the "Investments in Fidelity Central Funds" note found in the Notes to Financial Statements section of the most recent Annual or Semi-Annual report.
F Expense ratios reflect operating expenses of the class. Expenses before reductions do not reflect amounts reimbursed, waived, or reduced through arrangements with the investment adviser, brokerage services, or other offset arrangements, if applicable, and do not represent the amount paid by the class during periods when reimbursements, waivers or reductions occur.
G Amount does not include the portfolio activity of any underlying mutual funds or exchange-traded funds (ETFs).
H The portfolio turnover rate does not include the assets acquired in the merger.
See accompanying notes which are an integral part of the financial statements.
Fidelity Fund Class K
| Years ended June 30, | 2022 | 2021 | 2020 | 2019 | 2018 |
| Selected Per–Share Data | |||||
| Net asset value, beginning of period | $72.21 | $54.20 | $47.60 | $46.86 | $44.92 |
| Income from Investment Operations | |||||
| Net investment income (loss)A,B | .30 | .33 | .43 | .50 | .49 |
| Net realized and unrealized gain (loss) | (10.74) | 19.41 | 8.96 | 3.26 | 6.74 |
| Total from investment operations | (10.44) | 19.74 | 9.39 | 3.76 | 7.23 |
| Distributions from net investment income | (.26) | (.35) | (.46) | (.48) | (.49) |
| Distributions from net realized gain | (3.44) | (1.38) | (2.32) | (2.54) | (4.80) |
| Total distributions | (3.70) | (1.73) | (2.79)C | (3.02) | (5.29) |
| Net asset value, end of period | $58.07 | $72.21 | $54.20 | $47.60 | $46.86 |
| Total ReturnD | (15.54)% | 37.07% | 20.60% | 8.37% | 17.63% |
| Ratios to Average Net AssetsB,E,F | |||||
| Expenses before reductions | .38% | .39% | .40% | .40% | .41% |
| Expenses net of fee waivers, if any | .37% | .39% | .40% | .40% | .41% |
| Expenses net of all reductions | .37% | .38% | .39% | .40% | .40% |
| Net investment income (loss) | .43% | .52% | .87% | 1.10% | 1.08% |
| Supplemental Data | |||||
| Net assets, end of period (in millions) | $674 | $411 | $522 | $326 | $450 |
| Portfolio turnover rateG | 39% | 34%H | 51% | 45% | 38% |
A Calculated based on average shares outstanding during the period.
B Net investment income (loss) is affected by the timing of the declaration of dividends by any underlying mutual funds or exchange-traded funds (ETFs). Net investment income (loss) of any such underlying funds is not included in the Fund's net investment income (loss) ratio.
C Total distributions per share do not sum due to rounding.
D Total returns would have been lower if certain expenses had not been reduced during the applicable periods shown.
E Fees and expenses of any underlying mutual funds or exchange-traded funds (ETFs) are not included in the Fund's expense ratio. The Fund indirectly bears its proportionate share of these expenses. For additional expense information related to investments in Fidelity Central Funds, please refer to the "Investments in Fidelity Central Funds" note found in the Notes to Financial Statements section of the most recent Annual or Semi-Annual report.
F Expense ratios reflect operating expenses of the class. Expenses before reductions do not reflect amounts reimbursed, waived, or reduced through arrangements with the investment adviser, brokerage services, or other offset arrangements, if applicable, and do not represent the amount paid by the class during periods when reimbursements, waivers or reductions occur.
G Amount does not include the portfolio activity of any underlying mutual funds or exchange-traded funds (ETFs).
H The portfolio turnover rate does not include the assets acquired in the merger.
See accompanying notes which are an integral part of the financial statements.
Notes to Financial Statements
For the period ended June 30, 2022
(Amounts in thousands except percentages)
1. Organization.
Fidelity Fund (the Fund) is a fund of Fidelity Hastings Street Trust (the Trust) and is authorized to issue an unlimited number of shares. The Trust is registered under the Investment Company Act of 1940, as amended (the 1940 Act), as an open-end management investment company organized as a Massachusetts business trust. The Fund offers Fidelity Fund and Class K shares, each of which has equal rights as to assets and voting privileges. Each class has exclusive voting rights with respect to matters that affect that class.
2. Investments in Fidelity Central Funds.
Funds may invest in Fidelity Central Funds, which are open-end investment companies generally available only to other investment companies and accounts managed by the investment adviser and its affiliates. The Schedule of Investments lists any Fidelity Central Funds held as an investment as of period end, but does not include the underlying holdings of each Fidelity Central Fund. An investing fund indirectly bears its proportionate share of the expenses of the underlying Fidelity Central Funds.
Based on its investment objective, each Fidelity Central Fund may invest or participate in various investment vehicles or strategies that are similar to those of the investing fund. These strategies are consistent with the investment objectives of the investing fund and may involve certain economic risks which may cause a decline in value of each of the Fidelity Central Funds and thus a decline in the value of the investing fund.
| Fidelity Central Fund | Investment Manager | Investment Objective | Investment Practices | Expense Ratio(a) |
| Fidelity Money Market Central Funds | Fidelity Management & Research Company LLC (FMR) | Each fund seeks to obtain a high level of current income consistent with the preservation of capital and liquidity. | Short-term Investments | Less than .005% |
(a) Expenses expressed as a percentage of average net assets and are as of each underlying Central Fund's most recent annual or semi-annual shareholder report.
A complete unaudited list of holdings for each Fidelity Central Fund is available upon request or at the Securities and Exchange Commission website at www.sec.gov. In addition, the financial statements of the Fidelity Central Funds which contain the significant accounting policies (including investment valuation policies) of those funds, and are not covered by the Report of Independent Registered Public Accounting Firm, are available on the Securities and Exchange Commission website or upon request.
3. Significant Accounting Policies.
The Fund is an investment company and applies the accounting and reporting guidance of the Financial Accounting Standards Board (FASB) Accounting Standards Codification Topic 946 Financial Services - Investment Companies. The financial statements have been prepared in conformity with accounting principles generally accepted in the United States of America (GAAP), which require management to make certain estimates and assumptions at the date of the financial statements. Actual results could differ from those estimates. Subsequent events, if any, through the date that the financial statements were issued have been evaluated in the preparation of the financial statements. The Fund's Schedule of Investments lists any underlying mutual funds or exchange-traded funds (ETFs) but does not include the underlying holdings of these funds. The following summarizes the significant accounting policies of the Fund:
Investment Valuation. Investments are valued as of 4:00 p.m. Eastern time on the last calendar day of the period. The Board of Trustees (the Board) has delegated the day to day responsibility for the valuation of the Fund's investments to the Fair Value Committee (the Committee) established by the Fund's investment adviser. In accordance with valuation policies and procedures approved by the Board, the Fund attempts to obtain prices from one or more third party pricing vendors or brokers to value its investments. When current market prices, quotations or currency exchange rates are not readily available or reliable, investments will be fair valued in good faith by the Committee, in accordance with procedures adopted by the Board. Factors used in determining fair value vary by investment type and may include market or investment specific events. The frequency with which these procedures are used cannot be predicted and they may be utilized to a significant extent. The Committee oversees the Fund's valuation policies and procedures and reports to the Board on the Committee's activities and fair value determinations. The Board monitors the appropriateness of the procedures used in valuing the Fund's investments and ratifies the fair value determinations of the Committee.
The Fund categorizes the inputs to valuation techniques used to value its investments into a disclosure hierarchy consisting of three levels as shown below:
- Level 1 – unadjusted quoted prices in active markets for identical investments
- Level 2 – other significant observable inputs (including quoted prices for similar investments, interest rates, prepayment speeds, etc.)
- Level 3 – unobservable inputs (including the Fund's own assumptions based on the best information available)
Valuation techniques used to value the Fund's investments by major category are as follows:
Equity securities, including restricted securities, for which market quotations are readily available, are valued at the last reported sale price or official closing price as reported by a third party pricing vendor on the primary market or exchange on which they are traded and are categorized as Level 1 in the hierarchy. In the event there were no sales during the day or closing prices are not available, securities are valued at the last quoted bid price or may be valued using the last available price and are generally categorized as Level 2 in the hierarchy. For foreign equity securities, when market or security specific events arise, comparisons to the valuation of American Depositary Receipts (ADRs), futures contracts, ETFs and certain indexes as well as quoted prices for similar securities may be used and would be categorized as Level 2 in the hierarchy. For equity securities, including restricted securities, where observable inputs are limited, assumptions about market activity and risk are used and these securities may be categorized as Level 3 in the hierarchy.
Investments in open-end mutual funds, including the Fidelity Central Funds, are valued at their closing net asset value (NAV) each business day and are categorized as Level 1 in the hierarchy.
Changes in valuation techniques may result in transfers in or out of an assigned level within the disclosure hierarchy. The aggregate value of investments by input level as of June 30, 2022 is included at the end of the Fund's Schedule of Investments.
Foreign Currency. Certain Funds may use foreign currency contracts to facilitate transactions in foreign-denominated securities. Gains and losses from these transactions may arise from changes in the value of the foreign currency or if the counterparties do not perform under the contracts' terms.
Foreign-denominated assets, including investment securities, and liabilities are translated into U.S. dollars at the exchange rates at period end. Purchases and sales of investment securities, income and dividends received, and expenses denominated in foreign currencies are translated into U.S. dollars at the exchange rate in effect on the transaction date.
The effects of exchange rate fluctuations on investments are included with the net realized and unrealized gain (loss) on investment securities. Other foreign currency transactions resulting in realized and unrealized gain (loss) are disclosed separately.
Investment Transactions and Income. For financial reporting purposes, the Fund's investment holdings and NAV include trades executed through the end of the last business day of the period. The NAV per share for processing shareholder transactions is calculated as of the close of business of the New York Stock Exchange (NYSE), normally 4:00 p.m. Eastern time and includes trades executed through the end of the prior business day. Gains and losses on securities sold are determined on the basis of identified cost and include proceeds received from litigation. Commissions paid to certain brokers with whom the investment adviser, or its affiliates, places trades on behalf of a fund include an amount in addition to trade execution, which may be rebated back to a fund. Any such rebates are included in net realized gain (loss) on investments in the Statement of Operations. Dividend income is recorded on the ex-dividend date, except for certain dividends from foreign securities where the ex-dividend date may have passed, which are recorded as soon as the Fund is informed of the ex-dividend date. Non-cash dividends included in dividend income, if any, are recorded at the fair market value of the securities received. Income and capital gain distributions from Fidelity Central Funds, if any, are recorded on the ex-dividend date. Certain distributions received by the Fund represent a return of capital or capital gain. The Fund determines the components of these distributions subsequent to the ex-dividend date, based upon receipt of tax filings or other correspondence relating to the underlying investment. These distributions are recorded as a reduction of cost of investments and/or as a realized gain. Investment income is recorded net of foreign taxes withheld where recovery of such taxes is uncertain. Funds may file withholding tax reclaims in certain jurisdictions to recover a portion of amounts previously withheld. Any withholding tax reclaims income is included in the Statement of Operations in dividends. Any receivables for withholding tax reclaims are included in the Statement of Assets and Liabilities in dividends receivable.
Class Allocations and Expenses. Investment income, realized and unrealized capital gains and losses, common expenses of a fund, and certain fund-level expense reductions, if any, are allocated daily on a pro-rata basis to each class based on the relative net assets of each class to the total net assets of a fund. Each class differs with respect to transfer agent and distribution and service plan fees incurred, as applicable. Certain expense reductions may also differ by class, if applicable. For the reporting period, the allocated portion of income and expenses to each class as a percent of its average net assets may vary due to the timing of recording these transactions in relation to fluctuating net assets of the classes. Expenses directly attributable to a fund are charged to that fund. Expenses attributable to more than one fund are allocated among the respective funds on the basis of relative net assets or other appropriate methods. Expenses included in the accompanying financial statements reflect the expenses of that fund and do not include any expenses associated with any underlying mutual funds or exchange-traded funds. Although not included in a fund's expenses, a fund indirectly bears its proportionate share of these expenses through the net asset value of each underlying mutual fund or exchange-traded fund. Expense estimates are accrued in the period to which they relate and adjustments are made when actual amounts are known.
Deferred Trustee Compensation. Under a Deferred Compensation Plan (the Plan) for certain Funds, certain independent Trustees have elected to defer receipt of a portion of their annual compensation. Deferred amounts are invested in affiliated mutual funds, are marked-to-market and remain in a fund until distributed in accordance with the Plan. The investment of deferred amounts and the offsetting payable to the Trustees presented below are included in the accompanying Statement of Assets and Liabilities in other receivables and other payables and accrued expenses, as applicable.
| Fidelity Fund | $32 |
Income Tax Information and Distributions to Shareholders. Each year, the Fund intends to qualify as a regulated investment company under Subchapter M of the Internal Revenue Code, including distributing substantially all of its taxable income and realized gains. As a result, no provision for U.S. Federal income taxes is required. As of June 30, 2022, the Fund did not have any unrecognized tax benefits in the financial statements; nor is the Fund aware of any tax positions for which it is reasonably possible that the total amounts of unrecognized tax benefits will significantly change in the next twelve months. The Fund files a U.S. federal tax return, in addition to state and local tax returns as required. The Fund's federal income tax returns are subject to examination by the Internal Revenue Service (IRS) for a period of three fiscal years after they are filed. State and local tax returns may be subject to examination for an additional fiscal year depending on the jurisdiction. Foreign taxes are provided for based on the Fund's understanding of the tax rules and rates that exist in the foreign markets in which it invests.
Distributions are declared and recorded on the ex-dividend date. Income and capital gain distributions are declared separately for each class. Income and capital gain distributions are determined in accordance with income tax regulations, which may differ from GAAP. In addition, the Fund claimed a portion of the payment made to redeeming shareholders as a distribution for income tax purposes.
Capital accounts within the financial statements are adjusted for permanent book-tax differences. These adjustments have no impact on net assets or the results of operations. Capital accounts are not adjusted for temporary book-tax differences which will reverse in a subsequent period.
Book-tax differences are primarily due to foreign currency transactions, passive foreign investment companies (PFIC), capital loss carryforwards and losses deferred due to wash sales and excise tax regulations.
As of period end, the cost and unrealized appreciation (depreciation) in securities, and derivatives if applicable, for federal income tax purposes were as follows:
| Gross unrealized appreciation | $2,870,573 |
| Gross unrealized depreciation | (132,606) |
| Net unrealized appreciation (depreciation) | $2,737,967 |
| Tax Cost | $3,403,964 |
The tax-based components of distributable earnings as of period end were as follows:
| Undistributed ordinary income | $12,647 |
| Net unrealized appreciation (depreciation) on securities and other investments | $2,737,981 |
The Fund intends to elect to defer to its next fiscal year $180,829 of capital losses recognized during the period November 1, 2021 to June 30, 2022.
The tax character of distributions paid was as follows:
| June 30, 2022 | June 30, 2021 | |
| Ordinary Income | $21,231 | $ 27,771 |
| Long-term Capital Gains | 342,213 | 116,052 |
| Total | $363,444 | $ 143,823 |
Restricted Securities (including Private Placements). Funds may invest in securities that are subject to legal or contractual restrictions on resale. These securities generally may be resold in transactions exempt from registration or to the public if the securities are registered. Disposal of these securities may involve time-consuming negotiations and expense, and prompt sale at an acceptable price may be difficult. Information regarding restricted securities held at period end is included at the end of the Schedule of Investments, if applicable.
4. Purchases and Sales of Investments.
Purchases and sales of securities, other than short-term securities and in-kind transactions, as applicable, are noted in the table below.
| Purchases ($) | Sales ($) | |
| Fidelity Fund | 3,141,096 | 2,898,534 |
5. Fees and Other Transactions with Affiliates.
Management Fee. Fidelity Management & Research Company LLC (the investment adviser) and its affiliates provide the Fund with investment management related services for which the Fund pays a monthly management fee. The management fee is the sum of an individual fund fee rate that is based on an annual rate of .09% of the Fund's average net assets and an annualized group fee rate that averaged .22% during the period. The group fee rate is based upon the monthly average net assets of a group of registered investment companies with which the investment adviser has management contracts. The group fee rate decreases as assets under management increase and increases as assets under management decrease. For the reporting period, the total annual management fee rate was .31% of the Fund's average net assets.
Transfer Agent Fees. Fidelity Investments Institutional Operations Company LLC (FIIOC), an affiliate of the investment adviser, is the transfer, dividend disbursing and shareholder servicing agent for each class of the Fund. FIIOC receives account fees and asset-based fees that vary according to the account size and type of account of the shareholders of the respective classes of the Fund, except for Class K. FIIOC receives an asset-based fee of Class K's average net assets. FIIOC pays for typesetting, printing and mailing of shareholder reports, except proxy statements.
For the period, transfer agent fees for each class were as follows:
| Amount | % of Class-Level Average Net Assets | |
| Fidelity Fund | $8,112 | .12 |
| Class K | 296 | .04 |
| $8,408 |
Accounting Fees. Fidelity Service Company, Inc. (FSC), an affiliate of the investment adviser, maintains the Fund's accounting records. The accounting fee is based on the level of average net assets for each month. For the period, the fees were equivalent to the following annual rates:
| % of Average Net Assets | |
| Fidelity Fund | .02 |
Brokerage Commissions. A portion of portfolio transactions were placed with brokerage firms which are affiliates of the investment adviser. Brokerage commissions are included in net realized gain (loss) and change in net unrealized appreciation (depreciation) in the Statement of Operations. The commissions paid to these affiliated firms were as follows:
| Amount | |
| Fidelity Fund | $25 |
Interfund Trades. Funds may purchase from or sell securities to other Fidelity Funds under procedures adopted by the Board. The procedures have been designed to ensure these interfund trades are executed in accordance with Rule 17a-7 of the 1940 Act. Any interfund trades are included within the respective purchases and sales amounts shown in the Purchases and Sales of Investments note. Interfund trades during the period are noted in the table below.
| Purchases ($) | Sales ($) | Realized Gain (Loss) ($) | |
| Fidelity Fund | 164,562 | 114,268 | (8,369) |
6. Committed Line of Credit.
Certain Funds participate with other funds managed by the investment adviser or an affiliate in a $4.25 billion credit facility (the "line of credit") to be utilized for temporary or emergency purposes to fund shareholder redemptions or for other short-term liquidity purposes. The participating funds have agreed to pay commitment fees on their pro-rata portion of the line of credit, which are reflected in Miscellaneous expenses on the Statement of Operations, and are listed below. During the period, there were no borrowings on this line of credit.
| Amount | |
| Fidelity Fund | $12 |
7. Security Lending.
Funds lend portfolio securities from time to time in order to earn additional income. Lending agents are used, including National Financial Services (NFS), an affiliate of the investment adviser. Pursuant to a securities lending agreement, NFS will receive a fee, which is capped at 9.9% of a fund's daily lending revenue, for its services as lending agent. A fund may lend securities to certain qualified borrowers, including NFS. On the settlement date of the loan, a fund receives collateral (in the form of U.S. Treasury obligations, letters of credit and/or cash) against the loaned securities and maintains collateral in an amount not less than 100% of the market value of the loaned securities during the period of the loan. The market value of the loaned securities is determined at the close of business of a fund and any additional required collateral is delivered to a fund on the next business day. A fund or borrower may terminate the loan at any time, and if the borrower defaults on its obligation to return the securities loaned because of insolvency or other reasons, a fund may apply collateral received from the borrower against the obligation. A fund may experience delays and costs in recovering the securities loaned. Any cash collateral received is invested in the Fidelity Securities Lending Cash Central Fund. Any loaned securities are identified as such in the Schedule of Investments, and the value of loaned securities and cash collateral at period end, as applicable, are presented in the Statement of Assets and Liabilities. Security lending income represents the income earned on investing cash collateral, less rebates paid to borrowers and any lending agent fees associated with the loan, plus any premium payments received for lending certain types of securities. Security lending income is presented in the Statement of Operations as a component of income from Fidelity Central Funds. Affiliated security lending activity, if any, was as follows:
| Total Security Lending Fees Paid to NFS | Security Lending Income From Securities Loaned to NFS | Value of Securities Loaned to NFS at Period End | |
| Fidelity Fund | $7 | $– | $– |
8. Expense Reductions.
During the period the investment adviser or an affiliate reimbursed and/or waived a portion of fund-level operating expenses in the amount of $221.
9. Distributions to Shareholders.
Distributions to shareholders of each class were as follows:
| Year ended June 30, 2022 | Year ended June 30, 2021 | |
| Fidelity Fund | ||
| Distributions to shareholders | ||
| Fidelity Fund | $341,399 | $133,806 |
| Class K | 22,045 | 10,017 |
| Total | $363,444 | $143,823 |
10. Share Transactions.
Share transactions for each class were as follows and may contain in-kind transactions, automatic conversions between classes or exchanges between affiliated funds:
| Shares | Shares | Dollars | Dollars | |
| Year ended June 30, 2022 | Year ended June 30, 2021 | Year ended June 30, 2022 | Year ended June 30, 2021 | |
| Fidelity Fund | ||||
| Fidelity Fund | ||||
| Shares sold | 6,458 | 2,551 | $468,923 | $158,805 |
| Issued in exchange for the shares of the Target Fund(s) | – | 16,383 | – | 1,135,518 |
| Reinvestment of distributions | 4,251 | 2,042 | 314,473 | 122,813 |
| Shares redeemed | (10,130) | (8,576) | (715,852) | (539,151) |
| Net increase (decrease) | 579 | 12,400 | $67,544 | $877,985 |
| Class K | ||||
| Shares sold | 11,006 | 1,030 | $775,725 | $63,738 |
| Issued in exchange for the shares of the Target Fund(s) | – | 1,136 | – | 78,757 |
| Reinvestment of distributions | 296 | 167 | 22,045 | 10,017 |
| Shares redeemed | (5,394) | (6,272) | (354,680) | (382,655) |
| Net increase (decrease) | 5,908 | (3,939) | $443,090 | $(230,143) |
11. Other.
A fund's organizational documents provide former and current trustees and officers with a limited indemnification against liabilities arising in connection with the performance of their duties to the fund. In the normal course of business, a fund may also enter into contracts that provide general indemnifications. A fund's maximum exposure under these arrangements is unknown as this would be dependent on future claims that may be made against a fund. The risk of material loss from such claims is considered remote.
12. Coronavirus (COVID-19) Pandemic.
An outbreak of COVID-19 first detected in China during December 2019 has since spread globally and was declared a pandemic by the World Health Organization during March 2020. Developments that disrupt global economies and financial markets, such as the COVID-19 pandemic, may magnify factors that affect the Fund's performance.
13. Prior Fiscal Year Merger Information.
On April 16, 2021, the Fund acquired all of the assets and assumed all of the liabilities of Fidelity Export and Multinational Fund ("Target Fund") pursuant to an Agreement and Plan of Reorganization approved by the Board of Trustees ("The Board"). The securities held by the Target Fund were the primary assets acquired by the Fund. The acquisition was accomplished by an exchange of each class of the Fund for corresponding shares then outstanding of the Target Fund at its respective net asset value on the acquisition date. The reorganization provides shareholders of the Target Fund access to a larger portfolio with a similar investment objective and lower projected expenses. For financial reporting purposes, the assets and liabilities of the Target Fund and shares issued by the Fund were recorded at fair value; however, the cost basis of the investments received from the Target Fund were carried forward and will be utilized for purposes of the Fund's ongoing reporting of realized and unrealized gains and losses to more closely align subsequent reporting of realized gain with amounts distributable to shareholders for tax purposes. The reorganization qualified as a tax-free reorganization for federal income tax purposes with no gain or loss recognized to the funds or their shareholders. The Target Fund's net assets of $1,214,275, including securities of $1,214,278 and unrealized appreciation of $274,674, were combined with the Fund's net assets.
| Target Fund Share Class | Net Assets $ | Shares Exchanged | Shares Exchanged Ratio |
| Export and Multinational | 1,135,518 | 16,383 | .3164262011 |
| Class K | 78,757 | 1,136 | .3155316693 |
| Surviving Fund | Net assets $ | Total net assets after the acquisition $ |
| Fidelity Fund | 5,762,386 | 6,976,661 |
Pro forma results of operations of the combined entity for the entire period ended June 30, 2021, as though the acquisition had occurred as of the beginning of the year (rather than on the actual acquisition date), are as follows:
| Net investment income (loss) | $30,502 |
| Total net realized gain (loss) | 369,522 |
| Total change in net unrealized appreciation (depreciation) | 1,641,136 |
| Net increase (decrease) in net assets resulting from operations | $2,041,160 |
Because the combined investment portfolios have been managed as a single portfolio since the acquisition was completed, it is not practicable to separate the amounts of revenue and earnings of the acquired fund that have been included in the Fund's Statement of Operations since April 16, 2021.
Report of Independent Registered Public Accounting Firm
To the Board of Trustees of Fidelity Hastings Street Trust and Shareholders of Fidelity Fund
Opinion on the Financial Statements
We have audited the accompanying statement of assets and liabilities, including the schedule of investments, of Fidelity Fund (one of the funds constituting Fidelity Hastings Street Trust, referred to hereafter as the “Fund”) as of June 30, 2022, the related statement of operations for the year ended June 30, 2022, the statement of changes in net assets for each of the two years in the period ended June 30, 2022, including the related notes, and the financial highlights for each of the five years in the period ended June 30, 2022 (collectively referred to as the “financial statements”). In our opinion, the financial statements present fairly, in all material respects, the financial position of the Fund as of June 30, 2022, the results of its operations for the year then ended, the changes in its net assets for each of the two years in the period ended June 30, 2022 and the financial highlights for each of the five years in the period ended June 30, 2022 in conformity with accounting principles generally accepted in the United States of America.
Basis for Opinion
These financial statements are the responsibility of the Fund’s management. Our responsibility is to express an opinion on the Fund’s financial statements based on our audits. We are a public accounting firm registered with the Public Company Accounting Oversight Board (United States) (PCAOB) and are required to be independent with respect to the Fund in accordance with the U.S. federal securities laws and the applicable rules and regulations of the Securities and Exchange Commission and the PCAOB.
We conducted our audits of these financial statements in accordance with the standards of the PCAOB. Those standards require that we plan and perform the audit to obtain reasonable assurance about whether the financial statements are free of material misstatement, whether due to error or fraud.
Our audits included performing procedures to assess the risks of material misstatement of the financial statements, whether due to error or fraud, and performing procedures that respond to those risks. Such procedures included examining, on a test basis, evidence regarding the amounts and disclosures in the financial statements. Our audits also included evaluating the accounting principles used and significant estimates made by management, as well as evaluating the overall presentation of the financial statements. Our procedures included confirmation of securities owned as of June 30, 2022 by correspondence with the custodian. We believe that our audits provide a reasonable basis for our opinion.
/s/ PricewaterhouseCoopers LLP
Boston, Massachusetts
August 12, 2022
We have served as the auditor of one or more investment companies in the Fidelity group of funds since 1932.
Trustees and Officers
The Trustees, Members of the Advisory Board (if any), and officers of the trust and fund, as applicable, are listed below. The Board of Trustees governs the fund and is responsible for protecting the interests of shareholders. The Trustees are experienced executives who meet periodically throughout the year to oversee the fund's activities, review contractual arrangements with companies that provide services to the fund, oversee management of the risks associated with such activities and contractual arrangements, and review the fund's performance. Each of the Trustees oversees 316 funds.
The Trustees hold office without limit in time except that (a) any Trustee may resign; (b) any Trustee may be removed by written instrument, signed by at least two-thirds of the number of Trustees prior to such removal; (c) any Trustee who requests to be retired or who has become incapacitated by illness or injury may be retired by written instrument signed by a majority of the other Trustees; and (d) any Trustee may be removed at any special meeting of shareholders by a two-thirds vote of the outstanding voting securities of the trust. Each Trustee who is not an interested person (as defined in the 1940 Act) of the trust and the fund is referred to herein as an Independent Trustee. Each Independent Trustee shall retire not later than the last day of the calendar year in which his or her 75th birthday occurs. The Independent Trustees may waive this mandatory retirement age policy with respect to individual Trustees. Officers and Advisory Board Members hold office without limit in time, except that any officer or Advisory Board Member may resign or may be removed by a vote of a majority of the Trustees at any regular meeting or any special meeting of the Trustees. Except as indicated, each individual has held the office shown or other offices in the same company for the past five years.
The fund's Statement of Additional Information (SAI) includes more information about the Trustees. To request a free copy, call Fidelity at 1-800-544-8544 if you’re an individual investing directly with Fidelity, call 1-800-835-5092 if you’re a plan sponsor or participant with Fidelity as your recordkeeper or call 1-877-208-0098 on institutional accounts or if you’re an advisor or invest through one.
Experience, Skills, Attributes, and Qualifications of the Trustees. The Governance and Nominating Committee has adopted a statement of policy that describes the experience, qualifications, attributes, and skills that are necessary and desirable for potential Independent Trustee candidates (Statement of Policy). The Board believes that each Trustee satisfied at the time he or she was initially elected or appointed a Trustee, and continues to satisfy, the standards contemplated by the Statement of Policy. The Governance and Nominating Committee also engages professional search firms to help identify potential Independent Trustee candidates who have the experience, qualifications, attributes, and skills consistent with the Statement of Policy. From time to time, additional criteria based on the composition and skills of the current Independent Trustees, as well as experience or skills that may be appropriate in light of future changes to board composition, business conditions, and regulatory or other developments, have also been considered by the professional search firms and the Governance and Nominating Committee. In addition, the Board takes into account the Trustees' commitment and participation in Board and committee meetings, as well as their leadership of standing and ad hoc committees throughout their tenure.
In determining that a particular Trustee was and continues to be qualified to serve as a Trustee, the Board has considered a variety of criteria, none of which, in isolation, was controlling. The Board believes that, collectively, the Trustees have balanced and diverse experience, qualifications, attributes, and skills, which allow the Board to operate effectively in governing the fund and protecting the interests of shareholders. Information about the specific experience, skills, attributes, and qualifications of each Trustee, which in each case led to the Board's conclusion that the Trustee should serve (or continue to serve) as a trustee of the fund, is provided below.
Board Structure and Oversight Function. Robert A. Lawrence is an interested person and currently serves as Chair. The Trustees have determined that an interested Chair is appropriate and benefits shareholders because an interested Chair has a personal and professional stake in the quality and continuity of services provided to the fund. Independent Trustees exercise their informed business judgment to appoint an individual of their choosing to serve as Chair, regardless of whether the Trustee happens to be independent or a member of management. The Independent Trustees have determined that they can act independently and effectively without having an Independent Trustee serve as Chair and that a key structural component for assuring that they are in a position to do so is for the Independent Trustees to constitute a substantial majority for the Board. The Independent Trustees also regularly meet in executive session. David M. Thomas serves as Lead Independent Trustee and as such (i) acts as a liaison between the Independent Trustees and management with respect to matters important to the Independent Trustees and (ii) with management prepares agendas for Board meetings.
Fidelity® funds are overseen by different Boards of Trustees. The fund's Board oversees Fidelity's high income and certain equity funds, and other Boards oversee Fidelity's investment-grade bond, money market, asset allocation, and other equity funds. The asset allocation funds may invest in Fidelity® funds overseen by the fund's Board. The use of separate Boards, each with its own committee structure, allows the Trustees of each group of Fidelity® funds to focus on the unique issues of the funds they oversee, including common research, investment, and operational issues. On occasion, the separate Boards establish joint committees to address issues of overlapping consequences for the Fidelity® funds overseen by each Board.
The Trustees operate using a system of committees to facilitate the timely and efficient consideration of all matters of importance to the Trustees, the fund, and fund shareholders and to facilitate compliance with legal and regulatory requirements and oversight of the fund's activities and associated risks. The Board, acting through its committees, has charged FMR and its affiliates with (i) identifying events or circumstances the occurrence of which could have demonstrably adverse effects on the fund's business and/or reputation; (ii) implementing processes and controls to lessen the possibility that such events or circumstances occur or to mitigate the effects of such events or circumstances if they do occur; and (iii) creating and maintaining a system designed to evaluate continuously business and market conditions in order to facilitate the identification and implementation processes described in (i) and (ii) above. Because the day-to-day operations and activities of the fund are carried out by or through FMR, its affiliates, and other service providers, the fund's exposure to risks is mitigated but not eliminated by the processes overseen by the Trustees. While each of the Board's committees has responsibility for overseeing different aspects of the fund's activities, oversight is exercised primarily through the Operations, Audit, and Compliance Committees. Appropriate personnel, including but not limited to the fund's Chief Compliance Officer (CCO), FMR's internal auditor, the independent accountants, the fund's Treasurer and portfolio management personnel, make periodic reports to the Board's committees, as appropriate, including an annual review of Fidelity's risk management program for the Fidelity® funds. The responsibilities of each standing committee, including their oversight responsibilities, are described further under "Standing Committees of the Trustees."
Interested Trustees*:
Correspondence intended for a Trustee who is an interested person may be sent to Fidelity Investments, 245 Summer Street, Boston, Massachusetts 02210.
Name, Year of Birth; Principal Occupations and Other Relevant Experience+
Bettina Doulton (1964)
Year of Election or Appointment: 2020
Trustee
Ms. Doulton also serves as Trustee of other Fidelity® funds. Prior to her retirement, Ms. Doulton served in a variety of positions at Fidelity Investments, including as a managing director of research (2006-2007), portfolio manager to certain Fidelity® funds (1993-2005), equity analyst and portfolio assistant (1990-1993), and research assistant (1987-1990). Ms. Doulton currently owns and operates Phi Builders + Architects and Cellardoor Winery. Previously, Ms. Doulton served as a member of the Board of Brown Capital Management, LLC (2014-2018).
Robert A. Lawrence (1952)
Year of Election or Appointment: 2020
Trustee
Chair of the Board of Trustees
Mr. Lawrence also serves as Trustee of other funds. Previously, Mr. Lawrence served as a Trustee and Member of the Advisory Board of certain funds. Prior to his retirement in 2008, Mr. Lawrence served as Vice President of certain Fidelity® funds (2006-2008), Senior Vice President, Head of High Income Division of Fidelity Management & Research Company (investment adviser firm, 2006-2008), and President of Fidelity Strategic Investments (investment adviser firm, 2002-2005).
* Determined to be an “Interested Trustee” by virtue of, among other things, his or her affiliation with the trust or various entities under common control with FMR.
+ The information includes the Trustee's principal occupation during the last five years and other information relating to the experience, attributes, and skills relevant to the Trustee's qualifications to serve as a Trustee, which led to the conclusion that the Trustee should serve as a Trustee for the fund.
Independent Trustees:
Correspondence intended for an Independent Trustee may be sent to Fidelity Investments, P.O. Box 55235, Boston, Massachusetts 02205-5235.
Name, Year of Birth; Principal Occupations and Other Relevant Experience+
Thomas P. Bostick (1956)
Year of Election or Appointment: 2021
Trustee
Lieutenant General Bostick also serves as Trustee of other Fidelity® funds. Prior to his retirement, General Bostick (United States Army, Retired) held a variety of positions within the U.S. Army, including Commanding General and Chief of Engineers, U.S. Army Corps of Engineers (2012-2016) and Deputy Chief of Staff and Director of Human Resources, U.S. Army (2009-2012). General Bostick currently serves as a member of the Board and Finance and Governance Committees of CSX Corporation (transportation, 2020-present) and a member of the Board and Corporate Governance and Nominating Committee of Perma-Fix Environmental Services, Inc. (nuclear waste management, 2020-present). General Bostick serves as Chief Executive Officer of Bostick Global Strategies, LLC (consulting, 2016-present) and as a member of the Board of HireVue, Inc. (video interview and assessment, 2020-present). Previously, General Bostick served as a Member of the Advisory Board of certain Fidelity® funds (2021), President, Intrexon Bioengineering (2018-2020) and Chief Operating Officer (2017-2020) and Senior Vice President of the Environment Sector (2016-2017) of Intrexon Corporation (biopharmaceutical company).
Dennis J. Dirks (1948)
Year of Election or Appointment: 2005
Trustee
Mr. Dirks also serves as Trustee of other Fidelity® funds. Prior to his retirement in May 2003, Mr. Dirks served as Chief Operating Officer and as a member of the Board of The Depository Trust & Clearing Corporation (financial markets infrastructure), President, Chief Operating Officer and a member of the Board of The Depository Trust Company (DTC), President and a member of the Board of the National Securities Clearing Corporation (NSCC), Chief Executive Officer and a member of the Board of the Government Securities Clearing Corporation and Chief Executive Officer and a member of the Board of the Mortgage-Backed Securities Clearing Corporation. Mr. Dirks currently serves as a member of the Finance Committee (2016-present) and Board (2017-present) and is Treasurer (2018-present) of the Asolo Repertory Theatre.
Donald F. Donahue (1950)
Year of Election or Appointment: 2018
Trustee
Mr. Donahue also serves as Trustee of other Fidelity® funds. Mr. Donahue serves as President and Chief Executive Officer of Miranda Partners, LLC (risk consulting for the financial services industry, 2012-present). Previously, Mr. Donahue served as Chief Executive Officer (2006-2012), Chief Operating Officer (2003-2006) and Managing Director, Customer Marketing and Development (1999-2003) of The Depository Trust & Clearing Corporation (financial markets infrastructure). Mr. Donahue currently serves as a member (2007-present) and Co-Chairman (2016-present) of the Board of United Way of New York and a member of the Board of The Leadership Academy (previously NYC Leadership Academy) (2012-present). Mr. Donahue previously served as a member of the Advisory Board of certain Fidelity® funds (2015-2018).
Vicki L. Fuller (1957)
Year of Election or Appointment: 2020
Trustee
Ms. Fuller also serves as Trustee of other Fidelity® funds. Previously, Ms. Fuller served as a member of the Advisory Board of certain Fidelity® funds (2018-2020), Chief Investment Officer of the New York State Common Retirement Fund (2012-2018) and held a variety of positions at AllianceBernstein L.P. (global asset management, 1985-2012), including Managing Director (2006-2012) and Senior Vice President and Senior Portfolio Manager (2001-2006). Ms. Fuller currently serves as a member of the Board, Audit Committee and Nominating and Governance Committee of two Blackstone business development companies (2020-present), as a member of the Board of Treliant, LLC (consulting, 2019-present), as a member of the Advisory Board of Ariel Alternatives, LLC (private equity, 2021-present) and as a member of the Board and Chair of the Audit Committee of Gusto, Inc. (software, 2021-present). In addition, Ms. Fuller currently serves as a member of the Board of Roosevelt University (2019-present) and as a member of the Executive Board of New York University’s Stern School of Business. Ms. Fuller previously served as a member of the Board, Audit Committee and Nominating and Governance Committee of The Williams Companies, Inc. (natural gas infrastructure, 2018-2021).
Patricia L. Kampling (1959)
Year of Election or Appointment: 2020
Trustee
Ms. Kampling also serves as Trustee of other Fidelity® funds. Prior to her retirement, Ms. Kampling served as Chairman of the Board and Chief Executive Officer (2012-2019), President and Chief Operating Officer (2011-2012) and Executive Vice President and Chief Financial Officer (2010-2011) of Alliant Energy Corporation. Ms. Kampling currently serves as a member of the Board, Finance Committee and Governance, Compensation and Nominating Committee of Xcel Energy Inc. (utilities company, 2020-present) and as a member of the Board, Audit, Finance and Risk Committee and Safety, Environmental, Technology and Operations Committee and Chair of the Executive Development and Compensation Committee of American Water Works Company, Inc. (utilities company, 2019-present). In addition, Ms. Kampling currently serves as a member of the Board of the Nature Conservancy, Wisconsin Chapter (2019-present). Previously, Ms. Kampling served as a Member of the Advisory Board of certain Fidelity® funds (2020), a member of the Board, Compensation Committee and Executive Committee and Chair of the Audit Committee of Briggs & Stratton Corporation (manufacturing, 2011-2021), a member of the Board of Interstate Power and Light Company (2012-2019) and Wisconsin Power and Light Company (2012-2019) (each a subsidiary of Alliant Energy Corporation) and as a member of the Board and Workforce Development Committee of the Business Roundtable (2018-2019).
Thomas A. Kennedy (1955)
Year of Election or Appointment: 2021
Trustee
Mr. Kennedy also serves as Trustee of other Fidelity® funds. Previously, Mr. Kennedy served as a Member of the Advisory Board of certain Fidelity® funds (2020) and held a variety of positions at Raytheon Company (aerospace and defense, 1983-2020), including Chairman and Chief Executive Officer (2014-2020) and Executive Vice President and Chief Operating Officer (2013-2014). Mr. Kennedy currently serves as Executive Chairman of the Board of Directors of Raytheon Technologies Corporation (aerospace and defense, 2020-present). He is also a member of the Rutgers School of Engineering Industry Advisory Board (2011-present) and a member of the UCLA Engineering Dean’s Executive Board (2016-present).
Oscar Munoz (1959)
Year of Election or Appointment: 2021
Trustee
Mr. Munoz also serves as Trustee of other Fidelity® funds. Prior to his retirement, Mr. Munoz served as Executive Chairman (2020-2021), Chief Executive Officer (2015-2020), President (2015-2016) and a member of the Board (2010-2021) of United Airlines Holdings, Inc. Mr. Munoz currently serves as a member of the Board of CBRE Group, Inc. (commercial real estate, 2020-present), a member of the Board of Univision Communications, Inc. (Hispanic media, 2020-present) and a member of the Advisory Board of Salesforce.com, Inc. (cloud-based software, 2020-present). Previously, Mr. Munoz served as a Member of the Advisory Board of certain Fidelity® funds (2021).
Garnett A. Smith (1947)
Year of Election or Appointment: 2018
Trustee
Mr. Smith also serves as Trustee of other Fidelity® funds. Prior to his retirement, Mr. Smith served as Chairman and Chief Executive Officer (1990-1997) and President (1986-1990) of Inbrand Corp. (manufacturer of personal absorbent products). Prior to his employment with Inbrand Corp., he was employed by a retail fabric chain and North Carolina National Bank (now Bank of America). Mr. Smith previously served as a member of the Advisory Board of certain Fidelity® funds (2012-2013).
David M. Thomas (1949)
Year of Election or Appointment: 2008
Trustee
Lead Independent Trustee
Mr. Thomas also serves as Trustee of other Fidelity® funds. Previously, Mr. Thomas served as Executive Chairman (2005-2006) and Chairman and Chief Executive Officer (2000-2005) of IMS Health, Inc. (pharmaceutical and healthcare information solutions). Mr. Thomas currently serves as a member of the Board of Fortune Brands Home and Security (home and security products, 2004-present) and as Director (2013-present) and Non-Executive Chairman of the Board (2022-present) of Interpublic Group of Companies, Inc. (marketing communication).
Susan Tomasky (1953)
Year of Election or Appointment: 2020
Trustee
Ms. Tomasky also serves as Trustee of other Fidelity® funds. Prior to her retirement, Ms. Tomasky served in various executive officer positions at American Electric Power Company, Inc. (1998-2011), including most recently as President of AEP Transmission (2007-2011). Ms. Tomasky currently serves as a member of the Board and Sustainability Committee and as Chair of the Audit Committee of Marathon Petroleum Corporation (2018-present) and as a member of the Board, Executive Committee, Corporate Governance Committee and Organization and Compensation Committee and as Chair of the Audit Committee of Public Service Enterprise Group, Inc. (utilities company, 2012-present) and as a member of the Board of its subsidiary company, Public Service Electric and Gas Co. (2021-present). In addition, Ms. Tomasky currently serves as a member (2009-present) and President (2020-present) of the Board of the Royal Shakespeare Company – America (2009-present), as a member of the Board of the Columbus Association for the Performing Arts (2011-present) and as a member of the Board and Kenyon in the World Committee of Kenyon College (2016-present). Previously, Ms. Tomasky served as a Member of the Advisory Board of certain Fidelity® funds (2020), as a member of the Board of the Columbus Regional Airport Authority (2007-2020), as a member of the Board (2011-2018) and Lead Independent Director (2015-2018) of Andeavor Corporation (previously Tesoro Corporation) (independent oil refiner and marketer) and as a member of the Board of Summit Midstream Partners LP (energy, 2012-2018).
Michael E. Wiley (1950)
Year of Election or Appointment: 2018
Trustee
Mr. Wiley also serves as Trustee of other Fidelity® funds. Previously, Mr. Wiley served as a member of the Advisory Board of certain Fidelity® funds (2018-2020), Chairman, President and CEO of Baker Hughes, Inc. (oilfield services, 2000-2004). Mr. Wiley also previously served as a member of the Board of Andeavor Corporation (independent oil refiner and marketer, 2005-2018), a member of the Board of Andeavor Logistics LP (natural resources logistics, 2015-2018) and a member of the Board of High Point Resources (exploration and production, 2005-2020).
+ The information includes the Trustee's principal occupation during the last five years and other information relating to the experience, attributes, and skills relevant to the Trustee's qualifications to serve as a Trustee, which led to the conclusion that the Trustee should serve as a Trustee for the fund.
Advisory Board Members and Officers:
Correspondence intended for a Member of the Advisory Board (if any) may be sent to Fidelity Investments, P.O. Box 55235, Boston, Massachusetts 02205-5235. Correspondence intended for an officer or Peter S. Lynch may be sent to Fidelity Investments, 245 Summer Street, Boston, Massachusetts 02210. Officers appear below in alphabetical order.
Name, Year of Birth; Principal Occupation
Peter S. Lynch (1944)
Year of Election or Appointment: 2003
Member of the Advisory Board
Mr. Lynch also serves as a Member of the Advisory Board of other Fidelity® funds. Mr. Lynch is Vice Chairman and a Director of Fidelity Management & Research Company LLC (investment adviser firm). In addition, Mr. Lynch serves as a Trustee of Boston College and as the Chairman of the Inner-City Scholarship Fund. Previously, Mr. Lynch served as Vice Chairman and a Director of FMR Co., Inc. (investment adviser firm) and on the Special Olympics International Board of Directors (1997-2006).
Craig S. Brown (1977)
Year of Election or Appointment: 2019
Assistant Treasurer
Mr. Brown also serves as an officer of other funds. Mr. Brown serves as Assistant Treasurer of FIMM, LLC (2021-present) and is an employee of Fidelity Investments (2013-present).
John J. Burke III (1964)
Year of Election or Appointment: 2018
Chief Financial Officer
Mr. Burke also serves as Chief Financial Officer of other funds. Mr. Burke serves as Head of Investment Operations for Fidelity Fund and Investment Operations (2018-present) and is an employee of Fidelity Investments (1998-present). Previously Mr. Burke served as head of Asset Management Investment Operations (2012-2018).
William C. Coffey (1969)
Year of Election or Appointment: 2019
Assistant Secretary
Mr. Coffey also serves as Assistant Secretary of other funds. He is Senior Vice President and Deputy General Counsel of FMR LLC (diversified financial services company, 2010-present), and is an employee of Fidelity Investments. Previously, Mr. Coffey served as Secretary and CLO of certain funds (2018-2019); CLO, Secretary, and Senior Vice President of Fidelity Management & Research Company and FMR Co., Inc. (investment adviser firms, 2018-2019); Secretary of Fidelity SelectCo, LLC and Fidelity Investments Money Management, Inc. (investment adviser firms, 2018-2019); CLO of Fidelity Management & Research (Hong Kong) Limited, FMR Investment Management (UK) Limited, and Fidelity Management & Research (Japan) Limited (investment adviser firms, 2018-2019); and Assistant Secretary of certain funds (2009-2018).
Timothy M. Cohen (1969)
Year of Election or Appointment: 2018
Vice President
Mr. Cohen also serves as Vice President of other funds. Mr. Cohen serves as Co-Head of Equity (2018-present), a Director of Fidelity Management & Research (Japan) Limited (investment adviser firm, 2016-present), and is an employee of Fidelity Investments. Previously, Mr. Cohen served as Executive Vice President of Fidelity SelectCo, LLC (2019), Head of Global Equity Research (2016-2018), Chief Investment Officer - Equity and a Director of Fidelity Management & Research (U.K.) Inc. (investment adviser firm, 2013-2015) and as a Director of Fidelity Management & Research (Hong Kong) Limited (investment adviser firm, 2017).
Jonathan Davis (1968)
Year of Election or Appointment: 2010
Assistant Treasurer
Mr. Davis also serves as an officer of other funds. Mr. Davis serves as Assistant Treasurer of FIMM, LLC (2021-present), FMR Capital, Inc. (2017-present), FD Funds GP LLC (2021-present), FD Funds Holding LLC (2021-present), and FD Funds Management LLC (2021-present); and is an employee of Fidelity Investments. Previously, Mr. Davis served as Vice President and Associate General Counsel of FMR LLC (diversified financial services company, 2003-2010).
Laura M. Del Prato (1964)
Year of Election or Appointment: 2018
Assistant Treasurer
Ms. Del Prato also serves as an officer of other funds. Ms. Del Prato serves as Assistant Treasurer of FIMM, LLC (2021-present) and is an employee of Fidelity Investments (2017-present). Previously, Ms. Del Prato served as President and Treasurer of The North Carolina Capital Management Trust: Cash Portfolio and Term Portfolio (2018-2020). Prior to joining Fidelity Investments, Ms. Del Prato served as a Managing Director and Treasurer of the JPMorgan Mutual Funds (2014-2017). Prior to JPMorgan, Ms. Del Prato served as a partner at Cohen Fund Audit Services (accounting firm, 2012-2013) and KPMG LLP (accounting firm, 2004-2012).
Colm A. Hogan (1973)
Year of Election or Appointment: 2020
Assistant Treasurer
Mr. Hogan also serves as an officer of other funds. Mr. Hogan serves as Assistant Treasurer of FIMM, LLC (2021-present) and FMR Capital, Inc. (2017-present) and is an employee of Fidelity Investments (2005-present). Previously, Mr. Hogan served as Deputy Treasurer of certain Fidelity® funds (2016-2020) and Assistant Treasurer of certain Fidelity® funds (2016-2018).
Pamela R. Holding (1964)
Year of Election or Appointment: 2018
Vice President
Ms. Holding also serves as Vice President of other funds. Ms. Holding serves as Co-Head of Equity (2018-present) and is an employee of Fidelity Investments (2013-present). Previously, Ms. Holding served as Executive Vice President of Fidelity SelectCo, LLC (2019) and as Chief Investment Officer of Fidelity Institutional Asset Management (2013-2018).
Cynthia Lo Bessette (1969)
Year of Election or Appointment: 2019
Secretary and Chief Legal Officer (CLO)
Ms. Lo Bessette also serves as an officer of other funds. Ms. Lo Bessette serves as CLO, Secretary, and Senior Vice President of Fidelity Management & Research Company LLC (investment adviser firm, 2019-present); CLO of Fidelity Management & Research (Hong Kong) Limited, FMR Investment Management (UK) Limited, and Fidelity Management & Research (Japan) Limited (investment adviser firms, 2019-present); Secretary of FD Funds GP LLC (2021-present), FD Funds Holding LLC (2021-present), and FD Funds Management LLC (2021-present); and Assistant Secretary of FIMM, LLC (2019-present). She is a Senior Vice President and Deputy General Counsel of FMR LLC (diversified financial services company, 2019-present), and is an employee of Fidelity Investments. Previously, Ms. Lo Bessette served as CLO, Secretary, and Senior Vice President of FMR Co., Inc. (investment adviser firm, 2019); Secretary of Fidelity SelectCo, LLC and Fidelity Investments Money Management, Inc. (investment adviser firms, 2019). Prior to joining Fidelity Investments, Ms. Lo Bessette was Executive Vice President, General Counsel (2016-2019) and Senior Vice President, Deputy General Counsel (2015-2016) of OppenheimerFunds (investment management company) and Deputy Chief Legal Officer (2013-2015) of Jennison Associates LLC (investment adviser firm).
Chris Maher (1972)
Year of Election or Appointment: 2020
Deputy Treasurer
Mr. Maher also serves as an officer of other funds. Mr. Maher serves as Assistant Treasurer of FIMM, LLC (2021-present) and FMR Capital, Inc. (2017-present), and is an employee of Fidelity Investments (2008-present). Previously, Mr. Maher served as Assistant Treasurer of certain funds (2013-2020); Vice President of Asset Management Compliance (2013), Vice President of the Program Management Group of FMR (investment adviser firm, 2010-2013), and Vice President of Valuation Oversight (2008-2010).
Jason P. Pogorelec (1975)
Year of Election or Appointment: 2020
Chief Compliance Officer
Mr. Pogorelec also serves as Chief Compliance Officer of other funds. Mr. Pogorelec is a senior Vice President of Asset Management Compliance for Fidelity Investments and is an employee of Fidelity Investments (2006-present). Previously, Mr. Pogorelec served as Vice President, Associate General Counsel for Fidelity Investments (2010-2020) and Assistant Secretary of certain Fidelity funds (2015-2020).
Brett Segaloff (1972)
Year of Election or Appointment: 2021
Anti-Money Laundering (AML) Officer
Mr. Segaloff also serves as an AML Officer of other funds and other related entities. He is Director, Anti-Money Laundering (2007-present) of FMR LLC (diversified financial services company) and is an employee of Fidelity Investments (1996-present).
Stacie M. Smith (1974)
Year of Election or Appointment: 2016
President and Treasurer
Ms. Smith also serves as an officer of other funds. Ms. Smith serves as Assistant Treasurer of FIMM, LLC (2021-present) and FMR Capital, Inc. (2017-present), is an employee of Fidelity Investments (2009-present), and has served in other fund officer roles. Prior to joining Fidelity Investments, Ms. Smith served as Senior Audit Manager of Ernst & Young LLP (accounting firm, 1996-2009). Previously, Ms. Smith served as Assistant Treasurer (2013-2019) and Deputy Treasurer (2013-2016) of certain Fidelity® funds.
Jim Wegmann (1979)
Year of Election or Appointment: 2019
Assistant Treasurer
Mr. Wegmann also serves as an officer of other funds. Mr. Wegmann serves as Assistant Treasurer of FIMM, LLC (2021-present) and is an employee of Fidelity Investments (2011-present). Previously, Mr. Wegmann served as Assistant Treasurer of certain Fidelity® funds (2019-2021).
Shareholder Expense Example
As a shareholder, you incur two types of costs: (1) transaction costs, which may include sales charges (loads) on purchase payments or redemption proceeds, as applicable and (2) ongoing costs, which generally include management fees, distribution and/or service (12b-1) fees and other Fund expenses. This Example is intended to help you understand your ongoing costs (in dollars) of investing in a fund and to compare these costs with the ongoing costs of investing in other mutual funds.
The Example is based on an investment of $1,000 invested at the beginning of the period and held for the entire period (January 1, 2022 to June 30, 2022).
Actual Expenses
The first line of the accompanying table provides information about actual account values and actual expenses. You may use the information in this line, together with the amount you invested, to estimate the expenses that you paid over the period. Simply divide your account value by $1,000.00 (for example, an $8,600 account value divided by $1,000.00 = 8.6), then multiply the result by the number in the first line for a class/Fund under the heading entitled "Expenses Paid During Period" to estimate the expenses you paid on your account during this period. If any fund is a shareholder of any underlying mutual funds or exchange-traded funds (ETFs) (the Underlying Funds), such fund indirectly bears its proportional share of the expenses of the Underlying Funds in addition to the direct expenses incurred presented in the table. These fees and expenses are not included in the annualized expense ratio used to calculate the expense estimate in the table below.
Hypothetical Example for Comparison Purposes
The second line of the accompanying table provides information about hypothetical account values and hypothetical expenses based on the actual expense ratio and an assumed rate of return of 5% per year before expenses, which is not the actual return. The hypothetical account values and expenses may not be used to estimate the actual ending account balance or expenses you paid for the period. You may use this information to compare the ongoing costs of investing in the Fund and other funds. To do so, compare this 5% hypothetical example with the 5% hypothetical examples that appear in the shareholder reports of the other funds. If any fund is a shareholder of any Underlying Funds, such fund indirectly bears its proportional share of the expenses of the Underlying Funds in addition to the direct expenses as presented in the table. These fees and expenses are not included in the annualized expense ratio used to calculate the expense estimate in the table below.
Please note that the expenses shown in the table are meant to highlight your ongoing costs only and do not reflect any transaction costs. Therefore, the second line of the table is useful in comparing ongoing costs only, and will not help you determine the relative total costs of owning different funds. In addition, if these transactional costs were included, your costs would have been higher.
| Annualized Expense Ratio-A | Beginning Account Value January 1, 2022 | Ending Account Value June 30, 2022 | Expenses Paid During Period-B January 1, 2022 to June 30, 2022 | |
| Fidelity Fund | ||||
| Fidelity Fund | .46% | |||
| Actual | $1,000.00 | $733.50 | $1.98 | |
| Hypothetical-C | $1,000.00 | $1,022.51 | $2.31 | |
| Class K | .37% | |||
| Actual | $1,000.00 | $733.80 | $1.59 | |
| Hypothetical-C | $1,000.00 | $1,022.96 | $1.86 |
A Annualized expense ratio reflects expenses net of applicable fee waivers.
B Expenses are equal to the annualized expense ratio, multiplied by the average account value over the period, multiplied by 181/ 365 (to reflect the one-half year period). The fees and expenses of any Underlying Funds are not included in each annualized expense ratio.
C 5% return per year before expenses
Distributions (Unaudited)
The dividend and capital gains distributions for the fund(s) are available on Fidelity.com or Institutional.Fidelity.com.
The fund hereby designates as a capital gain dividend with respect to the taxable year ended June 30, 2022, $49,018,917, or, if subsequently determined to be different, the net capital gain of such year.
Fidelity Fund and Class K designate 100% of the dividends distributed during the fiscal year as qualifying for the dividends–received deduction for corporate shareholders.
Fidelity Fund and Class K designate 100% of the dividends distributed during the fiscal year as amounts which may be taken into account as a dividend for purposes of the maximum rate under section 1(h)(11) of the Internal Revenue Code.
The fund will notify shareholders in January 2023 of amounts for use in preparing 2022 income tax returns.
Board Approval of Investment Advisory Contracts and Management Fees
Fidelity Fund
Each year, the Board of Trustees, including the Independent Trustees (together, the Board), votes on the renewal of the management contract with Fidelity Management & Research Company LLC (FMR) and the sub-advisory agreements (together, the Advisory Contracts) for the fund. FMR and the sub-advisers are referred to herein as the Investment Advisers. The Board, assisted by the advice of fund counsel and Independent Trustees' counsel, requests and considers a broad range of information relevant to the renewal of the Advisory Contracts throughout the year.The Board meets regularly and, at each of its meetings, covers an extensive agenda of topics and materials and considers factors that are relevant to its annual consideration of the renewal of the fund's Advisory Contracts, including the services and support provided to the fund and its shareholders. The Board has established various standing committees (Committees), each composed of and chaired by Independent Trustees with varying backgrounds, to which the Board has assigned specific subject matter responsibilities in order to enhance effective decision-making by the Board. The Board, acting directly and through its Committees, requests and receives information concerning the annual consideration of the renewal of the fund's Advisory Contracts. The Board also meets as needed to review matters specifically related to the Board's annual consideration of the renewal of the Advisory Contracts. Members of the Board may also meet with trustees of other Fidelity funds through joint ad hoc committees to discuss certain matters relevant to all of the Fidelity funds.At its May 2022 meeting, the Board unanimously determined to renew the fund's Advisory Contracts. In reaching its determination, the Board considered all factors it believed relevant, including (i) the nature, extent, and quality of the services provided to the fund and its shareholders (including the investment performance of the fund); (ii) the competitiveness relative to peer funds of the fund's management fee and the total expense ratio of a representative class (retail class); (iii) the total costs of the services provided by and the profits realized by Fidelity from its relationships with the fund; and (iv) the extent to which, if any, economies of scale exist and are realized as the fund grows, and whether any economies of scale are appropriately shared with fund shareholders.In considering whether to renew the Advisory Contracts for the fund, the Board reached a determination, with the assistance of fund counsel and Independent Trustees' counsel and through the exercise of its business judgment, that the renewal of the Advisory Contracts was in the best interests of the fund and its shareholders and that the compensation payable under the Advisory Contracts was fair and reasonable. The Board's decision to renew the Advisory Contracts was not based on any single factor, but rather was based on a comprehensive consideration of all the information provided to the Board at its meetings throughout the year. The Board, in reaching its determination to renew the Advisory Contracts, was aware that shareholders of the fund have a broad range of investment choices available to them, including a wide choice among funds offered by Fidelity's competitors, and that the fund's shareholders, who have the opportunity to review and weigh the disclosure provided by the fund in its prospectus and other public disclosures, have chosen to invest in this fund, which is part of the Fidelity family of funds.Nature, Extent, and Quality of Services Provided. The Board considered Fidelity's staffing as it relates to the fund, including the backgrounds of investment personnel of Fidelity, and also considered the fund's investment objective, strategies, and related investment philosophy. The Independent Trustees also had discussions with senior management of Fidelity's investment operations and investment groups. The Board considered the structure of the investment personnel compensation program and whether this structure provides appropriate incentives to act in the best interests of the fund. Additionally, the Board considered the portfolio managers' investments, if any, in the funds that they manage. The Board also considered the steps Fidelity had taken to ensure the continued provision of high quality services to the Fidelity funds during the COVID-19 pandemic, including the expansion of staff in client facing positions to maintain service levels in periods of high volumes and volatility.Resources Dedicated to Investment Management and Support Services. The Board and the Fund Oversight and Research Committees reviewed the general qualifications and capabilities of Fidelity's investment staff, including its size, education, experience, and resources, as well as Fidelity's approach to recruiting, training, managing, and compensating investment personnel. The Board noted the resources devoted to expansion of Fidelity's global investment organization, and that Fidelity's analysts have extensive resources, tools, and capabilities that allow them to conduct sophisticated quantitative and fundamental analysis, as well as credit analysis of issuers, counterparties, and guarantors. Further, the Board considered that Fidelity's investment professionals have sufficient access to global information and data so as to provide competitive investment results over time, and that those professionals also have access to sophisticated tools that permit them to assess portfolio construction and risk and performance attribution characteristics continuously, as well as to transmit new information and research conclusions rapidly around the world. Additionally, in its deliberations, the Board considered Fidelity's trading, risk management, compliance, and technology and operations capabilities and resources, which are integral parts of the investment management process.Shareholder and Administrative Services. The Board considered (i) the nature, extent, quality, and cost of advisory, administrative, and shareholder services performed by the Investment Advisers and their affiliates under the Advisory Contracts and under separate agreements covering transfer agency, pricing and bookkeeping, and securities lending services for the fund; (ii) the nature and extent of the supervision of third party service providers, principally custodians, subcustodians, and pricing vendors; and (iii) the resources devoted to, and the record of compliance with, the fund's compliance policies and procedures. The Board also reviewed the allocation of fund brokerage, including allocations to brokers affiliated with the Investment Advisers, the use of brokerage commissions to pay fund expenses, and the use of "soft" commission dollars to pay for research services.The Board noted that the growth of fund assets over time across the complex allows Fidelity to reinvest in the development of services designed to enhance the value and convenience of the Fidelity funds as investment vehicles. These services include 24-hour access to account information and market information over the Internet and through telephone representatives, investor education materials, and asset allocation tools. The Board also considered that it reviews customer service metrics such as telephone response times, continuity of services on the website and metrics addressing services at Fidelity Investor Centers.Investment in a Large Fund Family. The Board considered the benefits to shareholders of investing in a Fidelity fund, including the benefits of investing in a fund that is part of a large family of funds offering a variety of investment disciplines and providing a large variety of mutual fund investor services. The Board noted that Fidelity had taken, or had made recommendations that resulted in the Fidelity funds taking, a number of actions over the previous year that benefited particular funds, including: (i) continuing to dedicate additional resources to Fidelity's investment research process, which includes meetings with management of issuers of securities in which the funds invest; (ii) continuing efforts to enhance Fidelity's global research capabilities; (iii) launching new funds and ETFs with innovative structures, strategies and pricing and making other enhancements to meet client needs; (iv) launching new share classes of existing funds; (v) eliminating purchase minimums and broadening eligibility requirements for certain funds and share classes; (vi) reducing management fees and total expenses for certain target date funds and classes and index funds; (vii) lowering expenses for certain existing funds and classes by implementing or lowering expense caps; (viii) rationalizing product lines and gaining increased efficiencies from fund mergers and liquidations; (ix) continuing to develop, acquire and implement systems and technology to improve services to the funds and shareholders, strengthen information security, and increase efficiency; and (x) continuing to implement enhancements to further strengthen Fidelity's product line to increase investors' probability of success in achieving their investment goals, including retirement income goals.Investment Performance. The Board considered whether the fund has operated in accordance with its investment objective, as well as its record of compliance with its investment restrictions and its performance history.The Board took into account discussions that occur at Board meetings throughout the year with representatives of the Investment Advisers about fund investment performance. In this regard the Board noted that as part of regularly scheduled fund reviews and other reports to the Board on fund performance, the Board considers annualized return information for the fund for different time periods, measured against an appropriate securities market index (benchmark index) and an appropriate peer group of funds with similar objectives (peer group). The Board also reviews and considers information about performance attribution. In its evaluation of fund investment performance, the Board gave particular attention to information indicating changes in performance of certain Fidelity funds for specific time periods and discussed with the Investment Advisers the reasons for any overperformance or underperformance.In addition to reviewing absolute and relative fund performance, the Independent Trustees periodically consider the appropriateness of fund performance metrics in evaluating the results achieved. In general, the Independent Trustees believe that fund performance should be evaluated based on net performance (after fees and expenses) of the representative class, compared to appropriate benchmark indices, over appropriate time periods that may include full market cycles, and compared to peer groups, as applicable, over the same periods, taking into account relevant factors including the following: general market conditions; issuer-specific information; and fund cash flows and other factors.The Independent Trustees recognize that shareholders evaluate performance on a net basis over their own holding periods, for which one-, three-, and five-year periods are often used as a proxy. For this reason, the performance information reviewed by the Board also included net cumulative total return information for the fund and an appropriate benchmark index and peer group for the most recent one-, three-, and five-year periods ended September 30, 2021, as shown below. Returns are shown compared to the 25th percentile (top of box, 75% beaten) and 75th percentile (bottom of box, 25% beaten) of the peer universe.Fidelity Fund

Fidelity Fund
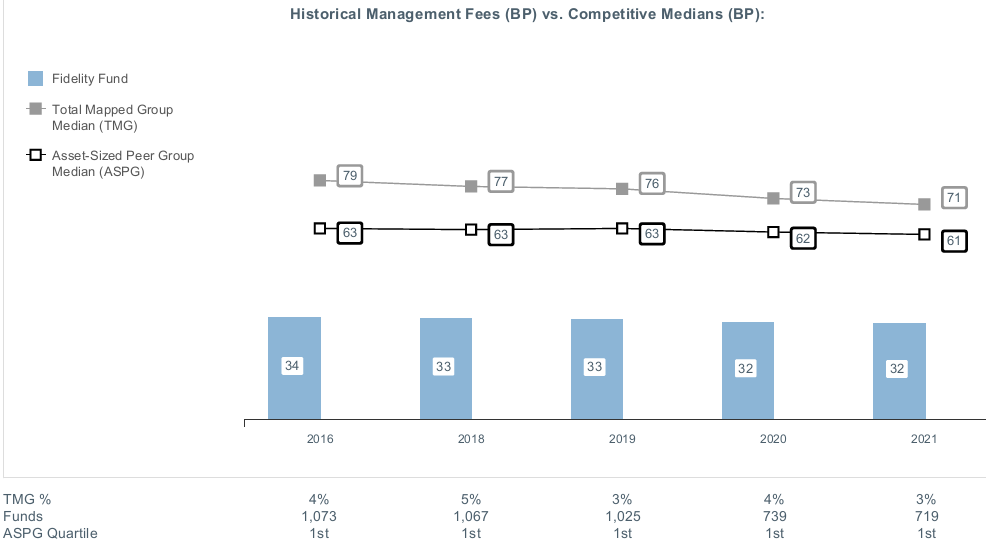
Liquidity Risk Management Program
The Securities and Exchange Commission adopted Rule 22e-4 under the Investment Company Act of 1940 (the Liquidity Rule) to promote effective liquidity risk management throughout the open-end investment company industry, thereby reducing the risk that funds will be unable to meet their redemption obligations and mitigating dilution of the interests of fund shareholders.
The Fund has adopted and implemented a liquidity risk management program pursuant to the Liquidity Rule (the Program) effective December 1, 2018. The Program is reasonably designed to assess and manage the Fund’s liquidity risk and to comply with the requirements of the Liquidity Rule. The Fund’s Board of Trustees (the Board) has designated the Fund’s investment adviser as administrator of the Program. The Fidelity advisers have established a Liquidity Risk Management Committee (the LRM Committee) to manage the Program for each of the Fidelity Funds. The LRM Committee monitors the adequacy and effectiveness of implementation of the Program and on a periodic basis assesses each Fund’s liquidity risk based on a variety of factors including (1) the Fund’s investment strategy, (2) portfolio liquidity and cash flow projections during normal and reasonably foreseeable stressed conditions, (3) shareholder redemptions, (4) borrowings and other funding sources and (5) in the case of exchange-traded funds, certain additional factors including the effect of the Fund’s prices and spreads, market participants, and basket compositions on the overall liquidity of the Fund’s portfolio, as applicable.
In accordance with the Program, each of the Fund’s portfolio investments is classified into one of four liquidity categories described below based on a determination of a reasonable expectation for how long it would take to convert the investment to cash (or sell or dispose of the investment) without significantly changing its market value.
- Highly liquid investments – cash or convertible to cash within three business days or less
- Moderately liquid investments – convertible to cash in three to seven calendar days
- Less liquid investments – can be sold or disposed of, but not settled, within seven calendar days
- Illiquid investments – cannot be sold or disposed of within seven calendar days
Liquidity classification determinations take into account a variety of factors including various market, trading and investment-specific considerations, as well as market depth, and generally utilize analysis from a third-party liquidity metrics service.
The Liquidity Rule places a 15% limit on a fund’s illiquid investments and requires funds that do not primarily hold assets that are highly liquid investments to determine and maintain a minimum percentage of the fund’s net assets to be invested in highly liquid investments (highly liquid investment minimum or HLIM). The Program includes provisions reasonably designed to comply with the 15% limit on illiquid investments and for determining, periodically reviewing and complying with the HLIM requirement as applicable.
At a recent meeting of the Fund’s Board of Trustees, the LRM Committee provided a written report to the Board pertaining to the operation, adequacy, and effectiveness of implementation of the Program for the annual period from December 1, 2020 through November 30, 2021. The report concluded that the Program has been implemented and is operating effectively and is reasonably designed to assess and manage the Fund’s liquidity risk.
![]()
FID-ANN-0822
1.705632.125
Fidelity® Growth Discovery Fund
June 30, 2022
Contents
Board Approval of Investment Advisory Contracts and Management Fees | |
To view a fund's proxy voting guidelines and proxy voting record for the 12-month period ended June 30, visit http://www.fidelity.com/proxyvotingresults or visit the Securities and Exchange Commission's (SEC) web site at http://www.sec.gov.
You may also call 1-800-544-8544 if you’re an individual investing directly with Fidelity, call 1-800-835-5092 if you’re a plan sponsor or participant with Fidelity as your recordkeeper or call 1-877-208-0098 on institutional accounts or if you’re an advisor or invest through one to request a free copy of the proxy voting guidelines.
Standard & Poor's, S&P and S&P 500 are registered service marks of The McGraw-Hill Companies, Inc. and have been licensed for use by Fidelity Distributors Corporation.
Other third-party marks appearing herein are the property of their respective owners.
All other marks appearing herein are registered or unregistered trademarks or service marks of FMR LLC or an affiliated company. © 2022 FMR LLC. All rights reserved.
This report and the financial statements contained herein are submitted for the general information of the shareholders of the Fund. This report is not authorized for distribution to prospective investors in the Fund unless preceded or accompanied by an effective prospectus.
A fund files its complete schedule of portfolio holdings with the SEC for the first and third quarters of each fiscal year on Form N-PORT. Forms N-PORT are available on the SEC’s web site at http://www.sec.gov. A fund's Forms N-PORT may be reviewed and copied at the SEC’s Public Reference Room in Washington, DC. Information regarding the operation of the SEC's Public Reference Room may be obtained by calling 1-800-SEC-0330.
For a complete list of a fund's portfolio holdings, view the most recent holdings listing, semiannual report, or annual report on Fidelity's web site at http://www.fidelity.com, http://www.institutional.fidelity.com, or http://www.401k.com, as applicable.
NOT FDIC INSURED •MAY LOSE VALUE •NO BANK GUARANTEE
Neither the Fund nor Fidelity Distributors Corporation is a bank.
Note to Shareholders:
Early in 2020, the outbreak and spread of COVID-19 emerged as a public health emergency that had a major influence on financial markets, primarily based on its impact on the global economy and corporate earnings. On March 11, 2020, the World Health Organization declared the COVID-19 outbreak a pandemic, citing sustained risk of further global spread. The pandemic prompted a number of measures to limit the spread of COVID-19, including travel and border restrictions, quarantines, and restrictions on large gatherings. In turn, these resulted in lower consumer activity, diminished demand for a wide range of products and services, disruption in manufacturing and supply chains, and – given the wide variability in outcomes regarding the outbreak – significant market uncertainty and volatility. To help stem the turmoil, the U.S. government took unprecedented action – in concert with the U.S. Federal Reserve and central banks around the world – to help support consumers, businesses, and the broader economy, and to limit disruption to the financial system.
In general, the overall impact of the pandemic lessened in 2021, amid a resilient economy and widespread distribution of three COVID-19 vaccines granted emergency use authorization from the U.S. Food and Drug Administration (FDA) early in the year. Still, the situation remains dynamic, and the extent and duration of its influence on financial markets and the economy is highly uncertain, due in part to a recent spike in cases based on highly contagious variants of the coronavirus.
Extreme events such as the COVID-19 crisis are exogenous shocks that can have significant adverse effects on mutual funds and their investments. Although multiple asset classes may be affected by market disruption, the duration and impact may not be the same for all types of assets. Fidelity is committed to helping you stay informed amid news about COVID-19 and during increased market volatility, and we continue to take extra steps to be responsive to customer needs. We encourage you to visit us online, where we offer ongoing updates, commentary, and analysis on the markets and our funds.
Performance: The Bottom Line
Average annual total return reflects the change in the value of an investment, assuming reinvestment of distributions from dividend income and capital gains (the profits earned upon the sale of securities that have grown in value, if any) and assuming a constant rate of performance each year. The hypothetical investment and the average annual total returns do not reflect the deduction of taxes that a shareholder would pay on fund distributions or the redemption of fund shares. During periods of reimbursement by Fidelity, a fund’s total return will be greater than it would be had the reimbursement not occurred. How a fund did yesterday is no guarantee of how it will do tomorrow.
Average Annual Total Returns
| For the periods ended June 30, 2022 | Past 1 year | Past 5 years | Past 10 years |
| Fidelity® Growth Discovery Fund | (17.10)% | 15.06% | 15.22% |
| Class K | (17.04)% | 15.17% | 15.36% |
$10,000 Over 10 Years
Let's say hypothetically that $10,000 was invested in Fidelity® Growth Discovery Fund, a class of the fund, on June 30, 2012.
The chart shows how the value of your investment would have changed, and also shows how the Russell 3000® Growth Index performed over the same period.
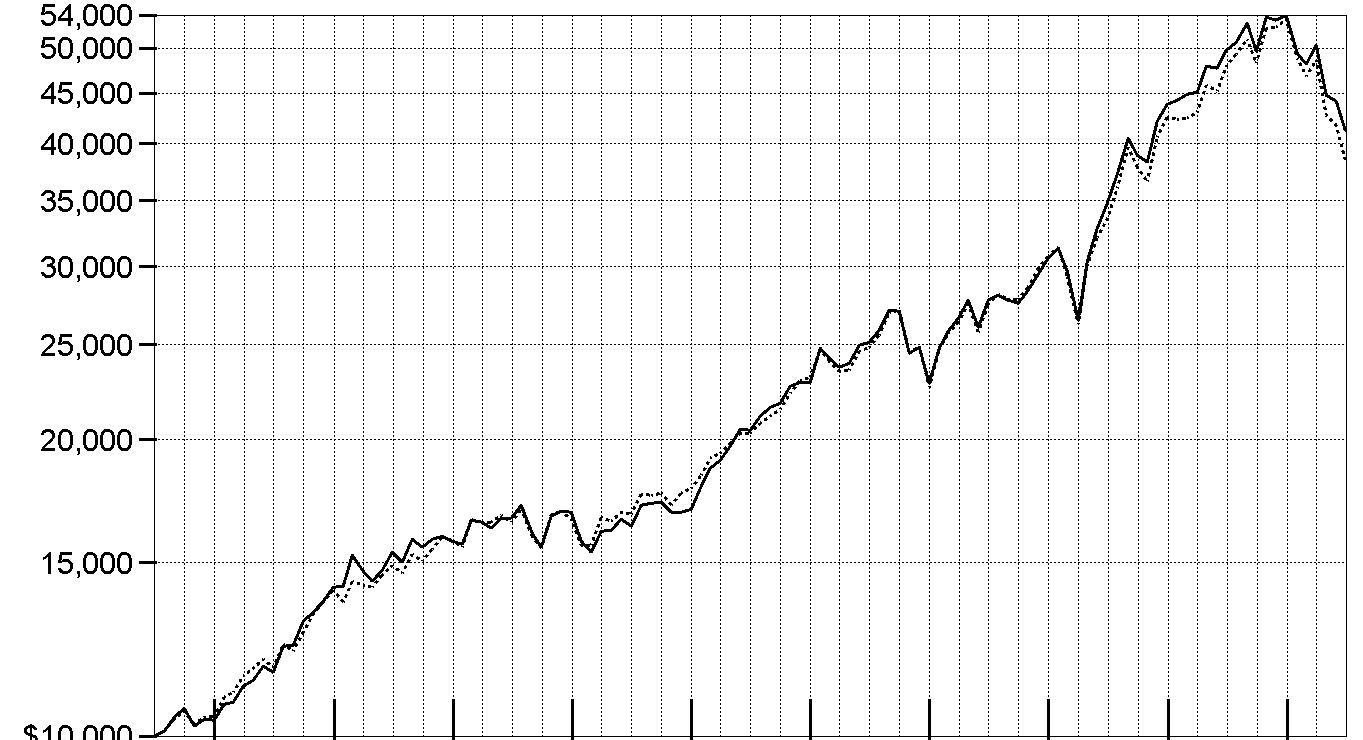
| Period Ending Values | ||
| $41,237 | Fidelity® Growth Discovery Fund | |
| $38,438 | Russell 3000® Growth Index | |
Management's Discussion of Fund Performance
Market Recap: The S&P 500® index returned -10.62% for the 12 months ending June 30, 2022, as a multitude of crosscurrents challenged the global economy and financial markets. Persistently high inflation, exacerbated by energy price shocks from the Russia–Ukraine conflict, spurred the U.S. Federal Reserve to hike interest rates more aggressively than anticipated, and concerns about the outlook for economic growth sent stocks into bear market territory. Against this backdrop, the index returned -8.72% in April amid clearer signals of the Fed’s intention to tighten monetary policy. In early May, the Fed approved a rare half-percentage-point interest rate increase and announced plans to shrink its $9 trillion asset portfolio. The S&P 500® gained 0.18% for the month. June began with the Fed allowing up to billions in Treasuries and mortgage bonds to mature every month without investing the proceeds. Two weeks later, the central bank raised rates by 0.75 percentage points, its largest increase since 1994, and said it was becoming more difficult to achieve a soft landing, in which the economy slows enough to bring down inflation while avoiding a recession. Partly in reaction, the S&P 500 returned -8.25% in June and -19.96% since the end of 2021 – its worst first-half result to begin a year since 1970. For the full 12 months, the growth-oriented communication services (-29%) and consumer discretionary (-24%) sectors lagged most. In contrast, energy (+40%) rode a surge in commodity prices and led by a wide margin, followed by defensive sectors, such as utilities (+14%).Comments from Co-Managers Asher Anolic and Jason Weiner: For the fiscal year ending June 30, 2022, the fund's share classes returned roughly -17%, outperforming the -19.78% result of the Russell 3000 Growth Index®. Versus the benchmark, security selection was the primary contributor. Strong picks in the communication services sector, especially in the media & entertainment industry, also helped. Further bolstering performance was stock selection in materials. The fund's biggest individual relative contributor was an outsized stake in UnitedHealth Group, which gained 30% the past 12 months and was among our largest holdings. Also adding value on a relative basis was our overweighting in Vertex Pharmaceuticals, which gained 40%. We added to our stake the past year. Another notable relative contributor was our outsized exposure to Palo Alto Networks (+34%), one of our biggest holdings the past 12 months. In contrast, the largest detractor from performance versus the benchmark was an overweighting in the communication services sector, primarily among media & entertainment firms. Weak picks in industrials also hindered relative performance, as did investment choices in consumer discretionary, especially within the retailing industry. The fund’s foreign holdings detracted overall, hampered in part by continued U.S. dollar strength. The fund's largest individual relative detractor was our notably smaller-than-benchmark stake in Apple, which was essentially flat the past 12 months. The company was among the fund's biggest holdings, however. Avoiding AbbVie proved to be our second-largest relative detractor this period, as this benchmark component gained 42%. Not owning Tesla, a benchmark component that returned -1%, also hurt relative performance. Meaningful changes in positioning include increased exposure to the financials sector and a lower allocation to industrials.The views expressed above reflect those of the portfolio manager(s) only through the end of the period as stated on the cover of this report and do not necessarily represent the views of Fidelity or any other person in the Fidelity organization. Any such views are subject to change at any time based upon market or other conditions and Fidelity disclaims any responsibility to update such views. These views may not be relied on as investment advice and, because investment decisions for a Fidelity fund are based on numerous factors, may not be relied on as an indication of trading intent on behalf of any Fidelity fund.
Investment Summary (Unaudited)
Top Ten Stocks as of June 30, 2022
| % of fund's net assets | |
| Microsoft Corp. | 11.4 |
| Alphabet, Inc. Class A | 7.9 |
| UnitedHealth Group, Inc. | 5.7 |
| Amazon.com, Inc. | 4.6 |
| Apple, Inc. | 4.5 |
| Vertex Pharmaceuticals, Inc. | 2.9 |
| Adobe, Inc. | 2.0 |
| Reliance Industries Ltd. | 1.9 |
| The Coca-Cola Co. | 1.8 |
| Qualcomm, Inc. | 1.7 |
| 44.4 |
Market Sectors as of June 30, 2022
| % of fund's net assets | |
| Information Technology | 29.7 |
| Health Care | 19.3 |
| Communication Services | 15.2 |
| Consumer Discretionary | 9.3 |
| Industrials | 6.5 |
| Financials | 5.6 |
| Energy | 5.0 |
| Consumer Staples | 4.4 |
| Materials | 4.0 |
| Real Estate | 0.8 |
| Utilities | 0.2 |
Asset Allocation (% of fund's net assets)
| As of June 30, 2022* | ||
| Stocks | 99.6% | |
| Convertible Securities | 0.4% | |

* Foreign investments - 10.6%
Geographic Diversification (% of fund's net assets)
| As of June 30, 2022 | ||
| United States of America* | 89.4% | |
| Netherlands | 2.9% | |
| India | 2.0% | |
| United Kingdom | 1.3% | |
| Bailiwick of Jersey | 1.0% | |
| France | 0.6% | |
| Canada | 0.5% | |
| Luxembourg | 0.4% | |
| Belgium | 0.4% | |
| Other | 1.5% | |

* Includes Short-Term investments and Net Other Assets (Liabilities).
Percentages are based on country or territory of incorporation and include the effect of futures, if applicable.
Schedule of Investments June 30, 2022
Showing Percentage of Net Assets
| Common Stocks - 99.6% | |||
| Shares | Value (000s) | ||
| COMMUNICATION SERVICES - 15.2% | |||
| Entertainment - 3.1% | |||
| Universal Music Group NV | 2,381,709 | $47,720 | |
| Warner Music Group Corp. Class A | 1,571,885 | 38,291 | |
| 86,011 | |||
| Interactive Media & Services - 10.1% | |||
| Alphabet, Inc. Class A (a) | 100,530 | 219,081 | |
| Bumble, Inc. (a)(b) | 241,989 | 6,812 | |
| Meta Platforms, Inc. Class A (a) | 295,434 | 47,639 | |
| Zoominfo Technologies, Inc. (a) | 153,936 | 5,117 | |
| 278,649 | |||
| Media - 2.0% | |||
| Charter Communications, Inc. Class A (a) | 60,164 | 28,189 | |
| Innovid Corp. (c) | 166,306 | 276 | |
| Liberty Media Corp. Liberty Formula One Group Series C (a) | 416,361 | 26,426 | |
| 54,891 | |||
| TOTAL COMMUNICATION SERVICES | 419,551 | ||
| CONSUMER DISCRETIONARY - 9.3% | |||
| Automobiles - 0.6% | |||
| Ferrari NV | 81,932 | 15,033 | |
| XPeng, Inc. ADR (a) | 13,400 | 425 | |
| 15,458 | |||
| Diversified Consumer Services - 0.7% | |||
| Laureate Education, Inc. Class A | 1,110,165 | 12,845 | |
| Mister Car Wash, Inc. (b) | 498,844 | 5,427 | |
| 18,272 | |||
| Hotels, Restaurants & Leisure - 0.8% | |||
| Airbnb, Inc. Class A (a) | 169,046 | 15,059 | |
| Flutter Entertainment PLC (a) | 60,977 | 6,119 | |
| Wingstop, Inc. (b) | 29,400 | 2,198 | |
| 23,376 | |||
| Household Durables - 0.0% | |||
| Blu Investments LLC (a)(c)(d) | 3,320,224 | 1 | |
| Internet & Direct Marketing Retail - 5.1% | |||
| Amazon.com, Inc. (a) | 1,190,320 | 126,424 | |
| Uber Technologies, Inc. (a) | 761,716 | 15,585 | |
| 142,009 | |||
| Multiline Retail - 0.0% | |||
| Dollarama, Inc. | 22,700 | 1,307 | |
| Specialty Retail - 1.2% | |||
| Aritzia, Inc. (a) | 59,900 | 1,622 | |
| Five Below, Inc. (a) | 111,900 | 12,693 | |
| Floor & Decor Holdings, Inc. Class A (a) | 34,300 | 2,160 | |
| TJX Companies, Inc. | 98,200 | 5,484 | |
| Victoria's Secret & Co. (a) | 362,437 | 10,137 | |
| 32,096 | |||
| Textiles, Apparel & Luxury Goods - 0.9% | |||
| LVMH Moet Hennessy Louis Vuitton SE | 20,813 | 12,756 | |
| On Holding AG | 7,900 | 140 | |
| Samsonite International SA (a)(e) | 5,521,463 | 10,991 | |
| 23,887 | |||
| TOTAL CONSUMER DISCRETIONARY | 256,406 | ||
| CONSUMER STAPLES - 4.4% | |||
| Beverages - 3.9% | |||
| Boston Beer Co., Inc. Class A (a) | 27,400 | 8,301 | |
| Constellation Brands, Inc. Class A (sub. vtg.) | 43,458 | 10,128 | |
| Keurig Dr. Pepper, Inc. | 433,671 | 15,348 | |
| Monster Beverage Corp. (a) | 245,313 | 22,741 | |
| The Coca-Cola Co. | 801,729 | 50,437 | |
| 106,955 | |||
| Household Products - 0.5% | |||
| Reckitt Benckiser Group PLC | 207,086 | 15,575 | |
| TOTAL CONSUMER STAPLES | 122,530 | ||
| ENERGY - 5.0% | |||
| Energy Equipment & Services - 0.9% | |||
| Baker Hughes Co. Class A | 485,458 | 14,015 | |
| Cactus, Inc. | 71,000 | 2,859 | |
| Championx Corp. | 149,500 | 2,968 | |
| Helmerich & Payne, Inc. | 71,800 | 3,092 | |
| ProPetro Holding Corp. (a) | 216,200 | 2,162 | |
| TechnipFMC PLC (a) | 46,419 | 312 | |
| 25,408 | |||
| Oil, Gas & Consumable Fuels - 4.1% | |||
| Canadian Natural Resources Ltd. (b) | 189,767 | 10,187 | |
| Cheniere Energy, Inc. | 241,100 | 32,074 | |
| Denbury, Inc. (a) | 66,309 | 3,978 | |
| New Fortress Energy, Inc. | 170,271 | 6,738 | |
| Range Resources Corp. (a) | 352,400 | 8,722 | |
| Reliance Industries Ltd. | 1,580,142 | 51,941 | |
| 113,640 | |||
| TOTAL ENERGY | 139,048 | ||
| FINANCIALS - 5.6% | |||
| Banks - 0.1% | |||
| HDFC Bank Ltd. | 93,676 | 1,605 | |
| M&T Bank Corp. | 8,000 | 1,275 | |
| 2,880 | |||
| Capital Markets - 3.1% | |||
| CME Group, Inc. | 232,137 | 47,518 | |
| MarketAxess Holdings, Inc. | 34,121 | 8,735 | |
| Moody's Corp. | 16,198 | 4,405 | |
| Morningstar, Inc. | 21,110 | 5,105 | |
| MSCI, Inc. | 27,291 | 11,248 | |
| S&P Global, Inc. | 28,306 | 9,541 | |
| 86,552 | |||
| Insurance - 2.4% | |||
| American Financial Group, Inc. | 111,132 | 15,426 | |
| Arthur J. Gallagher & Co. | 164,644 | 26,844 | |
| BRP Group, Inc. (a) | 199,283 | 4,813 | |
| Marsh & McLennan Companies, Inc. | 117,251 | 18,203 | |
| 65,286 | |||
| TOTAL FINANCIALS | 154,718 | ||
| HEALTH CARE - 19.3% | |||
| Biotechnology - 6.0% | |||
| Adamas Pharmaceuticals, Inc.: | |||
| rights (a)(d) | 678,800 | 41 | |
| rights (a)(d) | 678,800 | 41 | |
| Affimed NV (a)(b) | 251,902 | 698 | |
| Alnylam Pharmaceuticals, Inc. (a) | 57,071 | 8,324 | |
| Applied Therapeutics, Inc. (a) | 56,523 | 54 | |
| Atara Biotherapeutics, Inc. (a) | 175,200 | 1,365 | |
| Cytokinetics, Inc. (a) | 80,300 | 3,155 | |
| EQRx, Inc. (a) | 168,650 | 791 | |
| Erasca, Inc. | 65,800 | 367 | |
| Evelo Biosciences, Inc. (a) | 187,600 | 396 | |
| Galapagos NV sponsored ADR (a) | 151,259 | 8,440 | |
| Gamida Cell Ltd. (a)(b) | 617,986 | 1,094 | |
| Hookipa Pharma, Inc. (a) | 454,700 | 741 | |
| Innovent Biologics, Inc. (a)(e) | 409,342 | 1,821 | |
| Insmed, Inc. (a) | 316,697 | 6,245 | |
| Prelude Therapeutics, Inc. (a) | 11,400 | 60 | |
| Regeneron Pharmaceuticals, Inc. (a) | 45,796 | 27,071 | |
| Rubius Therapeutics, Inc. (a) | 54,080 | 46 | |
| Seagen, Inc. (a) | 108,347 | 19,171 | |
| Seres Therapeutics, Inc. (a) | 161,000 | 552 | |
| Synlogic, Inc. (a) | 458,200 | 527 | |
| Vertex Pharmaceuticals, Inc. (a) | 282,910 | 79,721 | |
| Vor Biopharma, Inc. (a) | 168,922 | 840 | |
| XOMA Corp. (a)(b) | 143,400 | 3,195 | |
| 164,756 | |||
| Health Care Equipment & Supplies - 0.9% | |||
| Edwards Lifesciences Corp. (a) | 203,016 | 19,305 | |
| Insulet Corp. (a) | 3,900 | 850 | |
| Nevro Corp. (a) | 26,500 | 1,161 | |
| Penumbra, Inc. (a) | 22,800 | 2,839 | |
| 24,155 | |||
| Health Care Providers & Services - 7.1% | |||
| Guardant Health, Inc. (a) | 187,713 | 7,572 | |
| HealthEquity, Inc. (a) | 466,377 | 28,631 | |
| Option Care Health, Inc. (a) | 23,400 | 650 | |
| Tenet Healthcare Corp. (a) | 34,200 | 1,798 | |
| UnitedHealth Group, Inc. | 309,165 | 158,796 | |
| 197,447 | |||
| Health Care Technology - 0.4% | |||
| Certara, Inc. (a)(b) | 278,958 | 5,986 | |
| Doximity, Inc. (b) | 48,700 | 1,696 | |
| Simulations Plus, Inc. (b) | 45,000 | 2,220 | |
| 9,902 | |||
| Life Sciences Tools & Services - 2.4% | |||
| 10X Genomics, Inc. (a) | 28,000 | 1,267 | |
| Bio-Techne Corp. | 22,510 | 7,803 | |
| Bruker Corp. | 206,415 | 12,955 | |
| Codexis, Inc. (a) | 254,202 | 2,659 | |
| Danaher Corp. | 114,754 | 29,092 | |
| Nanostring Technologies, Inc. (a) | 45,596 | 579 | |
| Thermo Fisher Scientific, Inc. | 22,800 | 12,387 | |
| 66,742 | |||
| Pharmaceuticals - 2.5% | |||
| Aclaris Therapeutics, Inc. (a) | 105,700 | 1,476 | |
| AstraZeneca PLC sponsored ADR | 260,146 | 17,188 | |
| Eli Lilly & Co. | 140,464 | 45,543 | |
| Euroapi SASU (a) | 1,221 | 19 | |
| Nuvation Bio, Inc. (a) | 119,094 | 386 | |
| Revance Therapeutics, Inc. (a) | 189,081 | 2,613 | |
| Sanofi SA | 30,744 | 3,100 | |
| 70,325 | |||
| TOTAL HEALTH CARE | 533,327 | ||
| INDUSTRIALS - 6.5% | |||
| Aerospace & Defense - 1.6% | |||
| Axon Enterprise, Inc. (a) | 42,562 | 3,966 | |
| Northrop Grumman Corp. | 46,943 | 22,466 | |
| The Boeing Co. (a) | 131,800 | 18,020 | |
| 44,452 | |||
| Electrical Equipment - 0.8% | |||
| Ballard Power Systems, Inc. (a)(b) | 11,700 | 74 | |
| Bloom Energy Corp. Class A (a)(b) | 58,800 | 970 | |
| Ceres Power Holdings PLC (a)(b) | 754,365 | 5,032 | |
| Eaton Corp. PLC | 24,097 | 3,036 | |
| Generac Holdings, Inc. (a) | 46,695 | 9,833 | |
| Vestas Wind Systems A/S | 147,300 | 3,132 | |
| 22,077 | |||
| Machinery - 1.4% | |||
| Caterpillar, Inc. | 62,200 | 11,119 | |
| Chart Industries, Inc. (a)(b) | 30,932 | 5,177 | |
| Ingersoll Rand, Inc. (b) | 470,310 | 19,791 | |
| Parker Hannifin Corp. | 8,175 | 2,011 | |
| 38,098 | |||
| Professional Services - 1.9% | |||
| ASGN, Inc. (a) | 66,620 | 6,012 | |
| Clarivate Analytics PLC (a)(b) | 649,192 | 8,998 | |
| CoStar Group, Inc. (a) | 17,400 | 1,051 | |
| KBR, Inc. | 593,549 | 28,722 | |
| Kforce, Inc. | 29,000 | 1,779 | |
| Upwork, Inc. (a) | 333,572 | 6,898 | |
| 53,460 | |||
| Trading Companies & Distributors - 0.8% | |||
| Azelis Group NV | 54,700 | 1,197 | |
| Ferguson PLC | 179,082 | 20,030 | |
| 21,227 | |||
| TOTAL INDUSTRIALS | 179,314 | ||
| INFORMATION TECHNOLOGY - 29.6% | |||
| Electronic Equipment & Components - 0.2% | |||
| Teledyne Technologies, Inc. (a) | 17,666 | 6,627 | |
| IT Services - 1.2% | |||
| Cloudflare, Inc. (a) | 140,276 | 6,137 | |
| MasterCard, Inc. Class A | 28,941 | 9,130 | |
| MongoDB, Inc. Class A (a)(b) | 70,239 | 18,227 | |
| Snowflake, Inc. (a) | 5,100 | 709 | |
| 34,203 | |||
| Semiconductors & Semiconductor Equipment - 6.0% | |||
| Aixtron AG | 309,653 | 7,846 | |
| Allegro MicroSystems LLC (a) | 81,000 | 1,676 | |
| ASML Holding NV | 24,256 | 11,543 | |
| eMemory Technology, Inc. | 24,000 | 836 | |
| Enphase Energy, Inc. (a) | 107,848 | 21,056 | |
| NVIDIA Corp. | 215,564 | 32,677 | |
| NXP Semiconductors NV | 34,339 | 5,083 | |
| Qualcomm, Inc. | 375,396 | 47,953 | |
| Silicon Laboratories, Inc. (a) | 5,600 | 785 | |
| SiTime Corp. (a) | 33,480 | 5,458 | |
| SolarEdge Technologies, Inc. (a) | 69,809 | 19,105 | |
| Taiwan Semiconductor Manufacturing Co. Ltd. sponsored ADR | 3,100 | 253 | |
| Universal Display Corp. | 106,139 | 10,735 | |
| 165,006 | |||
| Software - 17.7% | |||
| Adobe, Inc. (a) | 152,007 | 55,644 | |
| Confluent, Inc. (b) | 147,500 | 3,428 | |
| Elastic NV (a) | 1,800 | 122 | |
| Epic Games, Inc. (a)(c)(d) | 2,244 | 2,087 | |
| GitLab, Inc. (b) | 7,700 | 409 | |
| HashiCorp, Inc. (b) | 120,110 | 3,536 | |
| HubSpot, Inc. (a) | 13,161 | 3,957 | |
| Intuit, Inc. | 59,097 | 22,778 | |
| Manhattan Associates, Inc. (a) | 110,076 | 12,615 | |
| Microsoft Corp. | 1,232,844 | 316,627 | |
| Oracle Corp. | 330,734 | 23,108 | |
| Palo Alto Networks, Inc. (a)(b) | 90,779 | 44,839 | |
| Volue A/S (a) | 782,417 | 1,891 | |
| 491,041 | |||
| Technology Hardware, Storage & Peripherals - 4.5% | |||
| Apple, Inc. | 906,177 | 123,893 | |
| TOTAL INFORMATION TECHNOLOGY | 820,770 | ||
| MATERIALS - 3.7% | |||
| Chemicals - 3.3% | |||
| Albemarle Corp. | 139,455 | 29,143 | |
| CF Industries Holdings, Inc. | 295,136 | 25,302 | |
| Sherwin-Williams Co. | 129,855 | 29,076 | |
| The Chemours Co. LLC | 265,244 | 8,493 | |
| 92,014 | |||
| Metals & Mining - 0.4% | |||
| Lynas Rare Earths Ltd. (a) | 1,265,896 | 7,652 | |
| MP Materials Corp. (a)(b) | 126,580 | 4,061 | |
| 11,713 | |||
| TOTAL MATERIALS | 103,727 | ||
| REAL ESTATE - 0.8% | |||
| Equity Real Estate Investment Trusts (REITs) - 0.5% | |||
| Prologis (REIT), Inc. | 106,851 | 12,571 | |
| Welltower, Inc. | 19,500 | 1,606 | |
| 14,177 | |||
| Real Estate Management & Development - 0.3% | |||
| Doma Holdings, Inc. (a)(c) | 331,286 | 341 | |
| WeWork, Inc. (a)(b) | 1,291,800 | 6,485 | |
| 6,826 | |||
| TOTAL REAL ESTATE | 21,003 | ||
| UTILITIES - 0.2% | |||
| Electric Utilities - 0.2% | |||
| ORSTED A/S (e) | 48,300 | 5,087 | |
| Independent Power and Renewable Electricity Producers - 0.0% | |||
| Brookfield Renewable Partners LP | 56,300 | 1,959 | |
| TOTAL UTILITIES | 7,046 | ||
| TOTAL COMMON STOCKS | |||
| (Cost $2,030,101) | 2,757,440 | ||
| Convertible Preferred Stocks - 0.4% | |||
| HEALTH CARE - 0.0% | |||
| Biotechnology - 0.0% | |||
| ElevateBio LLC Series C (a)(c)(d) | 75,700 | 346 | |
| INFORMATION TECHNOLOGY - 0.1% | |||
| IT Services - 0.0% | |||
| AppNexus, Inc. Series E (Escrow) (a)(c)(d) | 48,212 | 2 | |
| Software - 0.1% | |||
| ASAPP, Inc. Series C (a)(c)(d) | 250,763 | 873 | |
| TOTAL INFORMATION TECHNOLOGY | 875 | ||
| MATERIALS - 0.3% | |||
| Metals & Mining - 0.3% | |||
| Illuminated Holdings, Inc.: | |||
| Series C2 (a)(c)(d) | 50,974 | 2,550 | |
| Series C3 (a)(c)(d) | 63,718 | 3,187 | |
| Series C4 (a)(c)(d) | 18,303 | 916 | |
| Series C5 (c)(d) | 36,887 | 1,845 | |
| 8,498 | |||
| TOTAL CONVERTIBLE PREFERRED STOCKS | |||
| (Cost $7,411) | 9,719 | ||
| Money Market Funds - 4.2% | |||
| Fidelity Cash Central Fund 1.58% (f) | 6,258,105 | 6,259 | |
| Fidelity Securities Lending Cash Central Fund 1.58% (f)(g) | 109,933,662 | 109,945 | |
| TOTAL MONEY MARKET FUNDS | |||
| (Cost $116,204) | 116,204 | ||
| TOTAL INVESTMENT IN SECURITIES - 104.2% | |||
| (Cost $2,153,716) | 2,883,363 | ||
| NET OTHER ASSETS (LIABILITIES) - (4.2)% | (114,948) | ||
| NET ASSETS - 100% | $2,768,415 |
Values shown as $0 in the Schedule of Investments may reflect amounts less than $500.
Legend
(a) Non-income producing
(b) Security or a portion of the security is on loan at period end.
(c) Restricted securities (including private placements) - Investment in securities not registered under the Securities Act of 1933 (excluding 144A issues). At the end of the period, the value of restricted securities (excluding 144A issues) amounted to $12,424,000 or 0.4% of net assets.
(d) Level 3 security
(e) Security exempt from registration under Rule 144A of the Securities Act of 1933. These securities may be resold in transactions exempt from registration, normally to qualified institutional buyers. At the end of the period, the value of these securities amounted to $17,899,000 or 0.6% of net assets.
(f) Affiliated fund that is generally available only to investment companies and other accounts managed by Fidelity Investments. The rate quoted is the annualized seven-day yield of the fund at period end. A complete unaudited listing of the fund's holdings as of its most recent quarter end is available upon request. In addition, each Fidelity Central Fund's financial statements , which are not covered by the Fund's Report of Independent Registered Public Accounting Firm, are available on the SEC's website or upon request.
(g) Investment made with cash collateral received from securities on loan.
Additional information on each restricted holding is as follows:
| Security | Acquisition Date | Acquisition Cost (000s) |
| AppNexus, Inc. Series E (Escrow) | 8/1/14 | $0 |
| ASAPP, Inc. Series C | 4/30/21 | $1,654 |
| Blu Investments LLC | 5/21/20 | $6 |
| Doma Holdings, Inc. | 3/2/21 | $3,313 |
| ElevateBio LLC Series C | 3/9/21 | $318 |
| Epic Games, Inc. | 3/29/21 | $1,986 |
| Illuminated Holdings, Inc. Series C2 | 7/7/20 | $1,274 |
| Illuminated Holdings, Inc. Series C3 | 7/7/20 | $1,912 |
| Illuminated Holdings, Inc. Series C4 | 1/8/21 | $659 |
| Illuminated Holdings, Inc. Series C5 | 6/16/21 | $1,594 |
| Innovid Corp. | 6/24/21 | $1,663 |
Affiliated Central Funds
Fiscal year to date information regarding the Fund's investments in Fidelity Central Funds, including the ownership percentage, is presented below.
| Fund (Amounts in thousands) | Value, beginning of period | Purchases | Sales Proceeds | Dividend Income | Realized Gain/Loss | Change in Unrealized appreciation (depreciation) | Value, end of period | % ownership, end of period |
| Fidelity Cash Central Fund 1.58% | $33,274 | $724,834 | $751,849 | $48 | $-- | $-- | $6,259 | 0.0% |
| Fidelity Securities Lending Cash Central Fund 1.58% | 11,929 | 501,049 | 403,033 | 205 | -- | -- | 109,945 | 0.3% |
| Total | $45,203 | $1,225,883 | $1,154,882 | $253 | $-- | $-- | $116,204 |
Amounts in the income column in the above table include any capital gain distributions from underlying funds, which are presented in the corresponding line-item in the Statement of Operations, if applicable. Amount for Fidelity Securities Lending Cash Central Fund represents the income earned on investing cash collateral, less rebates paid to borrowers and any lending agent fees associated with the loan, plus any premium payments received for lending certain types of securities.
Investment Valuation
The following is a summary of the inputs used, as of June 30, 2022, involving the Fund's assets and liabilities carried at fair value. The inputs or methodology used for valuing securities may not be an indication of the risk associated with investing in those securities. For more information on valuation inputs, and their aggregation into the levels used below, please refer to the Investment Valuation section in the accompanying Notes to Financial Statements.
| Valuation Inputs at Reporting Date: | ||||
| Description | Total | Level 1 | Level 2 | Level 3 |
| (Amounts in thousands) | ||||
| Investments in Securities: | ||||
| Equities: | ||||
| Communication Services | $419,551 | $371,831 | $47,720 | $-- |
| Consumer Discretionary | 256,406 | 243,649 | 12,756 | 1 |
| Consumer Staples | 122,530 | 106,955 | 15,575 | -- |
| Energy | 139,048 | 139,048 | -- | -- |
| Financials | 154,718 | 153,113 | 1,605 | -- |
| Health Care | 533,673 | 530,145 | 3,100 | 428 |
| Industrials | 179,314 | 176,182 | 3,132 | -- |
| Information Technology | 821,645 | 818,683 | -- | 2,962 |
| Materials | 112,225 | 96,075 | 7,652 | 8,498 |
| Real Estate | 21,003 | 21,003 | -- | -- |
| Utilities | 7,046 | 1,959 | 5,087 | -- |
| Money Market Funds | 116,204 | 116,204 | -- | -- |
| Total Investments in Securities: | $2,883,363 | $2,774,847 | $96,627 | $11,889 |
See accompanying notes which are an integral part of the financial statements.
Financial Statements
Statement of Assets and Liabilities
| Amounts in thousands (except per-share amounts) | June 30, 2022 | |
| Assets | ||
| Investment in securities, at value (including securities loaned of $106,028) — See accompanying schedule: Unaffiliated issuers (cost $2,037,512) | $2,767,159 | |
| Fidelity Central Funds (cost $116,204) | 116,204 | |
| Total Investment in Securities (cost $2,153,716) | $2,883,363 | |
| Foreign currency held at value (cost $62) | 62 | |
| Receivable for investments sold | 39 | |
| Receivable for fund shares sold | 4,022 | |
| Dividends receivable | 857 | |
| Distributions receivable from Fidelity Central Funds | 110 | |
| Other receivables | 16 | |
| Total assets | 2,888,469 | |
| Liabilities | ||
| Payable for investments purchased | $4,100 | |
| Payable for fund shares redeemed | 1,115 | |
| Accrued management fee | 1,655 | |
| Other affiliated payables | 373 | |
| Other payables and accrued expenses | 2,872 | |
| Collateral on securities loaned | 109,939 | |
| Total liabilities | 120,054 | |
| Net Assets | $2,768,415 | |
| Net Assets consist of: | ||
| Paid in capital | $1,957,726 | |
| Total accumulated earnings (loss) | 810,689 | |
| Net Assets | $2,768,415 | |
| Net Asset Value and Maximum Offering Price | ||
| Growth Discovery: | ||
| Net Asset Value, offering price and redemption price per share ($2,338,597 ÷ 54,834 shares) | $42.65 | |
| Class K: | ||
| Net Asset Value, offering price and redemption price per share ($429,818 ÷ 10,063 shares) | $42.71 |
See accompanying notes which are an integral part of the financial statements.
Statement of Operations
| Amounts in thousands | Year ended June 30, 2022 | |
| Investment Income | ||
| Dividends | $20,429 | |
| Income from Fidelity Central Funds (including $205 from security lending) | 253 | |
| Total income | 20,682 | |
| Expenses | ||
| Management fee | ||
| Basic fee | $17,206 | |
| Performance adjustment | 2,516 | |
| Transfer agent fees | 3,928 | |
| Accounting fees | 947 | |
| Custodian fees and expenses | 72 | |
| Independent trustees' fees and expenses | 12 | |
| Registration fees | 116 | |
| Audit | 62 | |
| Legal | 6 | |
| Interest | 2 | |
| Miscellaneous | 11 | |
| Total expenses before reductions | 24,878 | |
| Expense reductions | (98) | |
| Total expenses after reductions | 24,780 | |
| Net investment income (loss) | (4,098) | |
| Realized and Unrealized Gain (Loss) | ||
| Net realized gain (loss) on: | ||
| Investment securities: | ||
| Unaffiliated issuers | 226,863 | |
| Foreign currency transactions | (73) | |
| Total net realized gain (loss) | 226,790 | |
| Change in net unrealized appreciation (depreciation) on: | ||
| Investment securities: | ||
| Unaffiliated issuers (net of increase in deferred foreign taxes of $976) | (775,045) | |
| Unfunded commitments | 705 | |
| Assets and liabilities in foreign currencies | (10) | |
| Total change in net unrealized appreciation (depreciation) | (774,350) | |
| Net gain (loss) | (547,560) | |
| Net increase (decrease) in net assets resulting from operations | $(551,658) |
See accompanying notes which are an integral part of the financial statements.
Statement of Changes in Net Assets
| Amounts in thousands | Year ended June 30, 2022 | Year ended June 30, 2021 |
| Increase (Decrease) in Net Assets | ||
| Operations | ||
| Net investment income (loss) | $(4,098) | $(3,316) |
| Net realized gain (loss) | 226,790 | 516,606 |
| Change in net unrealized appreciation (depreciation) | (774,350) | 512,843 |
| Net increase (decrease) in net assets resulting from operations | (551,658) | 1,026,133 |
| Distributions to shareholders | (443,712) | (271,476) |
| Share transactions - net increase (decrease) | 389,486 | 209,053 |
| Total increase (decrease) in net assets | (605,884) | 963,710 |
| Net Assets | ||
| Beginning of period | 3,374,299 | 2,410,589 |
| End of period | $2,768,415 | $3,374,299 |
See accompanying notes which are an integral part of the financial statements.
Financial Highlights
Fidelity Growth Discovery Fund
| Years ended June 30, | 2022 | 2021 | 2020 | 2019 | 2018 |
| Selected Per–Share Data | |||||
| Net asset value, beginning of period | $58.70 | $45.22 | $37.74 | $35.75 | $30.58 |
| Income from Investment Operations | |||||
| Net investment income (loss)A,B | (.07) | (.07) | .03 | .04 | .07 |
| Net realized and unrealized gain (loss) | (8.48) | 18.53 | 9.15 | 3.51 | 6.71 |
| Total from investment operations | (8.55) | 18.46 | 9.18 | 3.55 | 6.78 |
| Distributions from net investment income | (.13) | (.01) | (.02) | (.06) | (.05) |
| Distributions from net realized gain | (7.37) | (4.98) | (1.68) | (1.50) | (1.56) |
| Total distributions | (7.50) | (4.98)C | (1.70) | (1.56) | (1.61) |
| Net asset value, end of period | $42.65 | $58.70 | $45.22 | $37.74 | $35.75 |
| Total ReturnD | (17.10)% | 43.10% | 25.33% | 10.33% | 22.94% |
| Ratios to Average Net AssetsB,E,F | |||||
| Expenses before reductions | .77% | .79% | .79% | .77% | .74% |
| Expenses net of fee waivers, if any | .77% | .79% | .79% | .77% | .74% |
| Expenses net of all reductions | .77% | .78% | .78% | .76% | .73% |
| Net investment income (loss) | (.14)% | (.12)% | .06% | .11% | .22% |
| Supplemental Data | |||||
| Net assets, end of period (in millions) | $2,339 | $2,944 | $2,094 | $1,707 | $1,546 |
| Portfolio turnover rateG | 45% | 51% | 54% | 49% | 45% |
A Calculated based on average shares outstanding during the period.
B Net investment income (loss) is affected by the timing of the declaration of dividends by any underlying mutual funds or exchange-traded funds (ETFs). Net investment income (loss) of any such underlying funds is not included in the Fund's net investment income (loss) ratio.
C Total distributions per share do not sum due to rounding.
D Total returns would have been lower if certain expenses had not been reduced during the applicable periods shown.
E Fees and expenses of any underlying mutual funds or exchange-traded funds (ETFs) are not included in the Fund's expense ratio. The Fund indirectly bears its proportionate share of these expenses. For additional expense information related to investments in Fidelity Central Funds, please refer to the "Investments in Fidelity Central Funds" note found in the Notes to Financial Statements section of the most recent Annual or Semi-Annual report.
F Expense ratios reflect operating expenses of the class. Expenses before reductions do not reflect amounts reimbursed, waived, or reduced through arrangements with the investment adviser, brokerage services, or other offset arrangements, if applicable, and do not represent the amount paid by the class during periods when reimbursements, waivers or reductions occur.
G Amount does not include the portfolio activity of any underlying mutual funds or exchange-traded funds (ETFs).
See accompanying notes which are an integral part of the financial statements.
Fidelity Growth Discovery Fund Class K
| Years ended June 30, | 2022 | 2021 | 2020 | 2019 | 2018 |
| Selected Per–Share Data | |||||
| Net asset value, beginning of period | $58.78 | $45.27 | $37.78 | $35.78 | $30.61 |
| Income from Investment Operations | |||||
| Net investment income (loss)A,B | (.02) | (.02) | .06 | .08 | .11 |
| Net realized and unrealized gain (loss) | (8.50) | 18.56 | 9.17 | 3.52 | 6.71 |
| Total from investment operations | (8.52) | 18.54 | 9.23 | 3.60 | 6.82 |
| Distributions from net investment income | (.16) | (.03) | (.06) | (.10) | (.09) |
| Distributions from net realized gain | (7.40) | (5.00) | (1.68) | (1.50) | (1.56) |
| Total distributions | (7.55)C | (5.03) | (1.74) | (1.60) | (1.65) |
| Net asset value, end of period | $42.71 | $58.78 | $45.27 | $37.78 | $35.78 |
| Total ReturnD | (17.04)% | 43.25% | 25.46% | 10.47% | 23.05% |
| Ratios to Average Net AssetsB,E,F | |||||
| Expenses before reductions | .68% | .69% | .69% | .66% | .63% |
| Expenses net of fee waivers, if any | .68% | .69% | .69% | .66% | .63% |
| Expenses net of all reductions | .68% | .69% | .68% | .66% | .63% |
| Net investment income (loss) | (.05)% | (.03)% | .17% | .22% | .32% |
| Supplemental Data | |||||
| Net assets, end of period (in millions) | $430 | $430 | $316 | $366 | $361 |
| Portfolio turnover rateG | 45% | 51% | 54% | 49% | 45% |
A Calculated based on average shares outstanding during the period.
B Net investment income (loss) is affected by the timing of the declaration of dividends by any underlying mutual funds or exchange-traded funds (ETFs). Net investment income (loss) of any such underlying funds is not included in the Fund's net investment income (loss) ratio.
C Total distributions per share do not sum due to rounding.
D Total returns would have been lower if certain expenses had not been reduced during the applicable periods shown.
E Fees and expenses of any underlying mutual funds or exchange-traded funds (ETFs) are not included in the Fund's expense ratio. The Fund indirectly bears its proportionate share of these expenses. For additional expense information related to investments in Fidelity Central Funds, please refer to the "Investments in Fidelity Central Funds" note found in the Notes to Financial Statements section of the most recent Annual or Semi-Annual report.
F Expense ratios reflect operating expenses of the class. Expenses before reductions do not reflect amounts reimbursed, waived, or reduced through arrangements with the investment adviser, brokerage services, or other offset arrangements, if applicable, and do not represent the amount paid by the class during periods when reimbursements, waivers or reductions occur.
G Amount does not include the portfolio activity of any underlying mutual funds or exchange-traded funds (ETFs).
See accompanying notes which are an integral part of the financial statements.
Notes to Financial Statements
For the period ended June 30, 2022
(Amounts in thousands except percentages)
1. Organization.
Fidelity Growth Discovery Fund (the Fund) is a fund of Fidelity Hastings Street Trust (the Trust) and is authorized to issue an unlimited number of shares. The Trust is registered under the Investment Company Act of 1940, as amended (the 1940 Act), as an open-end management investment company organized as a Massachusetts business trust. The Fund offers Growth Discovery and Class K shares, each of which has equal rights as to assets and voting privileges. Each class has exclusive voting rights with respect to matters that affect that class.
2. Investments in Fidelity Central Funds.
Funds may invest in Fidelity Central Funds, which are open-end investment companies generally available only to other investment companies and accounts managed by the investment adviser and its affiliates. The Schedule of Investments lists any Fidelity Central Funds held as an investment as of period end, but does not include the underlying holdings of each Fidelity Central Fund. An investing fund indirectly bears its proportionate share of the expenses of the underlying Fidelity Central Funds.
Based on its investment objective, each Fidelity Central Fund may invest or participate in various investment vehicles or strategies that are similar to those of the investing fund. These strategies are consistent with the investment objectives of the investing fund and may involve certain economic risks which may cause a decline in value of each of the Fidelity Central Funds and thus a decline in the value of the investing fund.
| Fidelity Central Fund | Investment Manager | Investment Objective | Investment Practices | Expense Ratio(a) |
| Fidelity Money Market Central Funds | Fidelity Management & Research Company LLC (FMR) | Each fund seeks to obtain a high level of current income consistent with the preservation of capital and liquidity. | Short-term Investments | Less than .005% |
(a) Expenses expressed as a percentage of average net assets and are as of each underlying Central Fund's most recent annual or semi-annual shareholder report.
A complete unaudited list of holdings for each Fidelity Central Fund is available upon request or at the Securities and Exchange Commission website at www.sec.gov. In addition, the financial statements of the Fidelity Central Funds which contain the significant accounting policies (including investment valuation policies) of those funds, and are not covered by the Report of Independent Registered Public Accounting Firm, are available on the Securities and Exchange Commission website or upon request.
3. Significant Accounting Policies.
The Fund is an investment company and applies the accounting and reporting guidance of the Financial Accounting Standards Board (FASB) Accounting Standards Codification Topic 946 Financial Services - Investment Companies. The financial statements have been prepared in conformity with accounting principles generally accepted in the United States of America (GAAP), which require management to make certain estimates and assumptions at the date of the financial statements. Actual results could differ from those estimates. Subsequent events, if any, through the date that the financial statements were issued have been evaluated in the preparation of the financial statements. The Fund's Schedule of Investments lists any underlying mutual funds or exchange-traded funds (ETFs) but does not include the underlying holdings of these funds. The following summarizes the significant accounting policies of the Fund:
Investment Valuation. Investments are valued as of 4:00 p.m. Eastern time on the last calendar day of the period. The Board of Trustees (the Board) has delegated the day to day responsibility for the valuation of the Fund's investments to the Fair Value Committee (the Committee) established by the Fund's investment adviser. In accordance with valuation policies and procedures approved by the Board, the Fund attempts to obtain prices from one or more third party pricing vendors or brokers to value its investments. When current market prices, quotations or currency exchange rates are not readily available or reliable, investments will be fair valued in good faith by the Committee, in accordance with procedures adopted by the Board. Factors used in determining fair value vary by investment type and may include market or investment specific events. The frequency with which these procedures are used cannot be predicted and they may be utilized to a significant extent. The Committee oversees the Fund's valuation policies and procedures and reports to the Board on the Committee's activities and fair value determinations. The Board monitors the appropriateness of the procedures used in valuing the Fund's investments and ratifies the fair value determinations of the Committee.
The Fund categorizes the inputs to valuation techniques used to value its investments into a disclosure hierarchy consisting of three levels as shown below:
- Level 1 – unadjusted quoted prices in active markets for identical investments
- Level 2 – other significant observable inputs (including quoted prices for similar investments, interest rates, prepayment speeds, etc.)
- Level 3 – unobservable inputs (including the Fund's own assumptions based on the best information available)
Valuation techniques used to value the Fund's investments by major category are as follows:
Equity securities, including restricted securities, for which market quotations are readily available, are valued at the last reported sale price or official closing price as reported by a third party pricing vendor on the primary market or exchange on which they are traded and are categorized as Level 1 in the hierarchy. In the event there were no sales during the day or closing prices are not available, securities are valued at the last quoted bid price or may be valued using the last available price and are generally categorized as Level 2 in the hierarchy. For foreign equity securities, when market or security specific events arise, comparisons to the valuation of American Depositary Receipts (ADRs), futures contracts, ETFs and certain indexes as well as quoted prices for similar securities may be used and would be categorized as Level 2 in the hierarchy. For equity securities, including restricted securities, where observable inputs are limited, assumptions about market activity and risk are used and these securities may be categorized as Level 3 in the hierarchy.
Investments in open-end mutual funds, including the Fidelity Central Funds, are valued at their closing net asset value (NAV) each business day and are categorized as Level 1 in the hierarchy.
Changes in valuation techniques may result in transfers in or out of an assigned level within the disclosure hierarchy. The aggregate value of investments by input level as of June 30, 2022 is included at the end of the Fund's Schedule of Investments.
Foreign Currency. Certain Funds may use foreign currency contracts to facilitate transactions in foreign-denominated securities. Gains and losses from these transactions may arise from changes in the value of the foreign currency or if the counterparties do not perform under the contracts' terms.
Foreign-denominated assets, including investment securities, and liabilities are translated into U.S. dollars at the exchange rates at period end. Purchases and sales of investment securities, income and dividends received, and expenses denominated in foreign currencies are translated into U.S. dollars at the exchange rate in effect on the transaction date.
The effects of exchange rate fluctuations on investments are included with the net realized and unrealized gain (loss) on investment securities. Other foreign currency transactions resulting in realized and unrealized gain (loss) are disclosed separately.
Investment Transactions and Income. For financial reporting purposes, the Fund's investment holdings and NAV include trades executed through the end of the last business day of the period. The NAV per share for processing shareholder transactions is calculated as of the close of business of the New York Stock Exchange (NYSE), normally 4:00 p.m. Eastern time and includes trades executed through the end of the prior business day. Gains and losses on securities sold are determined on the basis of identified cost and include proceeds received from litigation. Commissions paid to certain brokers with whom the investment adviser, or its affiliates, places trades on behalf of a fund include an amount in addition to trade execution, which may be rebated back to a fund. Any such rebates are included in net realized gain (loss) on investments in the Statement of Operations. Dividend income is recorded on the ex-dividend date, except for certain dividends from foreign securities where the ex-dividend date may have passed, which are recorded as soon as the Fund is informed of the ex-dividend date. Non-cash dividends included in dividend income, if any, are recorded at the fair market value of the securities received. Income and capital gain distributions from Fidelity Central Funds, if any, are recorded on the ex-dividend date. Certain distributions received by the Fund represent a return of capital or capital gain. The Fund determines the components of these distributions subsequent to the ex-dividend date, based upon receipt of tax filings or other correspondence relating to the underlying investment. These distributions are recorded as a reduction of cost of investments and/or as a realized gain. Investment income is recorded net of foreign taxes withheld where recovery of such taxes is uncertain. Funds may file withholding tax reclaims in certain jurisdictions to recover a portion of amounts previously withheld. Any withholding tax reclaims income is included in the Statement of Operations in dividends. Any receivables for withholding tax reclaims are included in the Statement of Assets and Liabilities in dividends receivable.
Class Allocations and Expenses. Investment income, realized and unrealized capital gains and losses, common expenses of a fund, and certain fund-level expense reductions, if any, are allocated daily on a pro-rata basis to each class based on the relative net assets of each class to the total net assets of a fund. Each class differs with respect to transfer agent and distribution and service plan fees incurred, as applicable. Certain expense reductions may also differ by class, if applicable. For the reporting period, the allocated portion of income and expenses to each class as a percent of its average net assets may vary due to the timing of recording these transactions in relation to fluctuating net assets of the classes. Expenses directly attributable to a fund are charged to that fund. Expenses attributable to more than one fund are allocated among the respective funds on the basis of relative net assets or other appropriate methods. Expenses included in the accompanying financial statements reflect the expenses of that fund and do not include any expenses associated with any underlying mutual funds or exchange-traded funds. Although not included in a fund's expenses, a fund indirectly bears its proportionate share of these expenses through the net asset value of each underlying mutual fund or exchange-traded fund. Expense estimates are accrued in the period to which they relate and adjustments are made when actual amounts are known.
Income Tax Information and Distributions to Shareholders. Each year, the Fund intends to qualify as a regulated investment company under Subchapter M of the Internal Revenue Code, including distributing substantially all of its taxable income and realized gains. As a result, no provision for U.S. Federal income taxes is required. As of June 30, 2022, the Fund did not have any unrecognized tax benefits in the financial statements; nor is the Fund aware of any tax positions for which it is reasonably possible that the total amounts of unrecognized tax benefits will significantly change in the next twelve months. The Fund files a U.S. federal tax return, in addition to state and local tax returns as required. The Fund's federal income tax returns are subject to examination by the Internal Revenue Service (IRS) for a period of three fiscal years after they are filed. State and local tax returns may be subject to examination for an additional fiscal year depending on the jurisdiction. Foreign taxes are provided for based on the Fund's understanding of the tax rules and rates that exist in the foreign markets in which it invests. The Fund is subject to a tax imposed on capital gains by certain countries in which it invests. An estimated deferred tax liability for net unrealized appreciation on the applicable securities is included in Other payables and accrued expenses on the Statement of Assets & Liabilities.
Distributions are declared and recorded on the ex-dividend date. Income and capital gain distributions are declared separately for each class. Income and capital gain distributions are determined in accordance with income tax regulations, which may differ from GAAP. In addition, the Fund claimed a portion of the payment made to redeeming shareholders as a distribution for income tax purposes.
Capital accounts within the financial statements are adjusted for permanent book-tax differences. These adjustments have no impact on net assets or the results of operations. Capital accounts are not adjusted for temporary book-tax differences which will reverse in a subsequent period.
Book-tax differences are primarily due to foreign currency transactions, passive foreign investment companies (PFIC), partnerships and losses deferred due to wash sales and excise tax regulations.
As of period end, the cost and unrealized appreciation (depreciation) in securities, and derivatives if applicable, for federal income tax purposes were as follows:
| Gross unrealized appreciation | $953,600 |
| Gross unrealized depreciation | (225,754) |
| Net unrealized appreciation (depreciation) | $727,846 |
| Tax Cost | $2,155,517 |
The tax-based components of distributable earnings as of period end were as follows:
| Undistributed long-term capital gain | $97,158 |
| Net unrealized appreciation (depreciation) on securities and other investments | $727,820 |
The Fund intends to elect to defer to its next fiscal year $1,699 of ordinary losses recognized during the period January 1, 2022 to June 30, 2022.
The tax character of distributions paid was as follows:
| June 30, 2022 | June 30, 2021 | |
| Ordinary Income | $87,507 | $ 38,100 |
| Long-term Capital Gains | 356,205 | 233,376 |
| Total | $443,712 | $ 271,476 |
Restricted Securities (including Private Placements). Funds may invest in securities that are subject to legal or contractual restrictions on resale. These securities generally may be resold in transactions exempt from registration or to the public if the securities are registered. Disposal of these securities may involve time-consuming negotiations and expense, and prompt sale at an acceptable price may be difficult. Information regarding restricted securities held at period end is included at the end of the Schedule of Investments, if applicable.
Special Purpose Acquisition Companies. Funds may invest in stock, warrants, and other securities of special purpose acquisition companies (SPACs) or similar special purpose entities. A SPAC is a publicly traded company that raises investment capital via an initial public offering (IPO) for the purpose of acquiring the equity securities of one or more existing companies via merger, business combination, acquisition or other similar transactions within a designated time frame.
Private Investment in Public Equity. Funds may acquire equity securities of an issuer through a private investment in a public equity (PIPE) transaction, including through commitments to purchase securities on a when-issued basis. A PIPE typically involves the purchase of securities directly from a publicly traded company in a private placement transaction. Securities purchased through PIPE transactions will be restricted from trading and considered illiquid until a resale registration statement for the shares is filed and declared effective.
At the current and/or prior period end, the Fund had commitments to purchase when-issued securities through PIPE transactions with SPACs. The commitments are contingent upon the SPACs acquiring the securities of target companies. Unrealized appreciation (depreciation) on any commitments outstanding at period end is separately presented in the Statements of Assets and Liabilities as Unrealized appreciation (depreciation) on unfunded commitments, and any change in unrealized appreciation (depreciation) on unfunded commitments during the period is separately presented in the Statement of Operations, as applicable.
4. Purchases and Sales of Investments.
Purchases and sales of securities, other than short-term securities and in-kind transactions, as applicable, are noted in the table below.
| Purchases ($) | Sales ($) | |
| Fidelity Growth Discovery Fund | 1,480,417 | 1,504,502 |
5. Fees and Other Transactions with Affiliates.
Management Fee. Fidelity Management & Research Company LLC (the investment adviser) and its affiliates provide the Fund with investment management related services for which the Fund pays a monthly management fee. The management fee is the sum of an individual fund fee rate that is based on an annual rate of .30% of the Fund's average net assets and an annualized group fee rate that averaged .22% during the period. The group fee rate is based upon the monthly average net assets of a group of registered investment companies with which the investment adviser has management contracts. The group fee rate decreases as assets under management increase and increases as assets under management decrease. In addition, the management fee is subject to a performance adjustment (up to a maximum of +/- .20% of the Fund's average net assets over a 36 month performance period). The upward or downward adjustment to the management fee is based on the relative investment performance of Growth Discovery as compared to its benchmark index, the Russell 3000 Growth Index, over the same 36 month performance period. For the reporting period, the total annual management fee rate, including the performance adjustment, was .60% of the Fund's average net assets. The performance adjustment included in the management fee rate may be higher or lower than the maximum performance adjustment rate due to the difference between the average net assets for the reporting and performance periods.
Transfer Agent Fees. Fidelity Investments Institutional Operations Company LLC (FIIOC), an affiliate of the investment adviser, is the transfer, dividend disbursing and shareholder servicing agent for each class of the Fund. FIIOC receives account fees and asset-based fees that vary according to the account size and type of account of the shareholders of Growth Discovery, except for Class K. FIIOC receives an asset-based fee of Class K's average net assets. FIIOC pays for typesetting, printing and mailing of shareholder reports, except proxy statements.
For the period, transfer agent fees for each class were as follows:
| Amount | % of Class-Level Average Net Assets | |
| Growth Discovery | $3,760 | .13 |
| Class K | 168 | .04 |
| $3,928 |
Accounting Fees. Fidelity Service Company, Inc. (FSC), an affiliate of the investment adviser, maintains the Fund's accounting records. The accounting fee is based on the level of average net assets for each month. For the period, the fees were equivalent to the following annual rates:
| % of Average Net Assets | |
| Fidelity Growth Discovery Fund | .03 |
Brokerage Commissions. A portion of portfolio transactions were placed with brokerage firms which are affiliates of the investment adviser. Brokerage commissions are included in net realized gain (loss) and change in net unrealized appreciation (depreciation) in the Statement of Operations. The commissions paid to these affiliated firms were as follows:
| Amount | |
| Fidelity Growth Discovery Fund | $21 |
Interfund Lending Program. Pursuant to an Exemptive Order issued by the Securities and Exchange Commission (the SEC), the Fund, along with other registered investment companies having management contracts with Fidelity Management & Research Company LLC (FMR), or other affiliated entities of FMR, may participate in an interfund lending program. This program provides an alternative credit facility allowing the Fund to borrow from, or lend money to, other participating affiliated funds. At period end, there were no interfund loans outstanding. Activity in this program during the period for which loans were outstanding was as follows:
| Borrower or Lender | Average Loan Balance | Weighted Average Interest Rate | Interest Expense | |
| Fidelity Growth Discovery Fund | Borrower | $6,872 | .32% | $2 |
Interfund Trades. Funds may purchase from or sell securities to other Fidelity Funds under procedures adopted by the Board. The procedures have been designed to ensure these interfund trades are executed in accordance with Rule 17a-7 of the 1940 Act. Any interfund trades are included within the respective purchases and sales amounts shown in the Purchases and Sales of Investments note. Interfund trades during the period are noted in the table below.
| Purchases ($) | Sales ($) | Realized Gain (Loss) ($) | |
| Fidelity Growth Discovery Fund | 59,101 | 70,864 | 8,241 |
6. Committed Line of Credit.
Certain Funds participate with other funds managed by the investment adviser or an affiliate in a $4.25 billion credit facility (the "line of credit") to be utilized for temporary or emergency purposes to fund shareholder redemptions or for other short-term liquidity purposes. The participating funds have agreed to pay commitment fees on their pro-rata portion of the line of credit, which are reflected in Miscellaneous expenses on the Statement of Operations, and are listed below. During the period, there were no borrowings on this line of credit.
| Amount | |
| Fidelity Growth Discovery Fund | $5 |
7. Security Lending.
Funds lend portfolio securities from time to time in order to earn additional income. Lending agents are used, including National Financial Services (NFS), an affiliate of the investment adviser. Pursuant to a securities lending agreement, NFS will receive a fee, which is capped at 9.9% of a fund's daily lending revenue, for its services as lending agent. A fund may lend securities to certain qualified borrowers, including NFS. On the settlement date of the loan, a fund receives collateral (in the form of U.S. Treasury obligations, letters of credit and/or cash) against the loaned securities and maintains collateral in an amount not less than 100% of the market value of the loaned securities during the period of the loan. The market value of the loaned securities is determined at the close of business of a fund and any additional required collateral is delivered to a fund on the next business day. A fund or borrower may terminate the loan at any time, and if the borrower defaults on its obligation to return the securities loaned because of insolvency or other reasons, a fund may apply collateral received from the borrower against the obligation. A fund may experience delays and costs in recovering the securities loaned. Any cash collateral received is invested in the Fidelity Securities Lending Cash Central Fund. Any loaned securities are identified as such in the Schedule of Investments, and the value of loaned securities and cash collateral at period end, as applicable, are presented in the Statement of Assets and Liabilities. Security lending income represents the income earned on investing cash collateral, less rebates paid to borrowers and any lending agent fees associated with the loan, plus any premium payments received for lending certain types of securities. Security lending income is presented in the Statement of Operations as a component of income from Fidelity Central Funds. Affiliated security lending activity, if any, was as follows:
| Total Security Lending Fees Paid to NFS | Security Lending Income From Securities Loaned to NFS | Value of Securities Loaned to NFS at Period End | |
| Fidelity Growth Discovery Fund | $22 | $2 | $153 |
8. Bank Borrowings.
The Fund is permitted to have bank borrowings for temporary or emergency purposes to fund shareholder redemptions or for other short-term liquidity requirements. The Fund has established borrowing arrangements with certain banks. The interest rate on the borrowings is the bank's base rate, as revised from time to time. Any open loans, including accrued interest, at period end are presented under the caption "Notes payable" in the Statement of Assets and Liabilities, if applicable. Activity in this program during the period for which loans were outstanding was as follows:
| Average Loan Balance | Weighted Average Interest Rate | Interest Expense | |
| Fidelity Growth Discovery Fund | $9,466 | 1.33% | $–(a) |
(a) Amount represents less than five hundred dollars.
9. Expense Reductions.
During the period the investment adviser or an affiliate reimbursed and/or waived a portion of fund-level operating expenses in the amount of $98.
10. Distributions to Shareholders.
Distributions to shareholders of each class were as follows:
| Year ended June 30, 2022 | Year ended June 30, 2021 | |
| Fidelity Growth Discovery Fund | ||
| Distributions to shareholders | ||
| Growth Discovery | $386,457 | $236,484 |
| Class K | 57,255 | 34,992 |
| Total | $443,712 | $271,476 |
11. Share Transactions.
Share transactions for each class were as follows and may contain in-kind transactions, automatic conversions between classes or exchanges between affiliated funds:
| Shares | Shares | Dollars | Dollars | |
| Year ended June 30, 2022 | Year ended June 30, 2021 | Year ended June 30, 2022 | Year ended June 30, 2021 | |
| Fidelity Growth Discovery Fund | ||||
| Growth Discovery | ||||
| Shares sold | 7,475 | 8,523 | $391,110 | $442,899 |
| Reinvestment of distributions | 6,660 | 4,468 | 364,307 | 222,760 |
| Shares redeemed | (9,455) | (9,150) | (488,310) | (474,576) |
| Net increase (decrease) | 4,680 | 3,841 | $267,107 | $191,083 |
| Class K | ||||
| Shares sold | 4,366 | 2,578 | $204,465 | $134,895 |
| Reinvestment of distributions | 1,046 | 702 | 57,255 | 34,992 |
| Shares redeemed | (2,667) | (2,947) | (139,341) | (151,917) |
| Net increase (decrease) | 2,745 | 333 | $122,379 | $17,970 |
12. Other.
A fund's organizational documents provide former and current trustees and officers with a limited indemnification against liabilities arising in connection with the performance of their duties to the fund. In the normal course of business, a fund may also enter into contracts that provide general indemnifications. A fund's maximum exposure under these arrangements is unknown as this would be dependent on future claims that may be made against a fund. The risk of material loss from such claims is considered remote.
13. Coronavirus (COVID-19) Pandemic.
An outbreak of COVID-19 first detected in China during December 2019 has since spread globally and was declared a pandemic by the World Health Organization during March 2020. Developments that disrupt global economies and financial markets, such as the COVID-19 pandemic, may magnify factors that affect the Fund's performance.
Report of Independent Registered Public Accounting Firm
To the Board of Trustees of Fidelity Hastings Street Trust and Shareholders of Fidelity Growth Discovery Fund
Opinion on the Financial Statements
We have audited the accompanying statement of assets and liabilities, including the schedule of investments, of Fidelity Growth Discovery Fund (one of the funds constituting Fidelity Hastings Street Trust, referred to hereafter as the “Fund”) as of June 30, 2022, the related statement of operations for the year ended June 30, 2022, the statement of changes in net assets for each of the two years in the period ended June 30, 2022, including the related notes, and the financial highlights for each of the five years in the period ended June 30, 2022 (collectively referred to as the “financial statements”). In our opinion, the financial statements present fairly, in all material respects, the financial position of the Fund as of June 30, 2022, the results of its operations for the year then ended, the changes in its net assets for each of the two years in the period ended June 30, 2022 and the financial highlights for each of the five years in the period ended June 30, 2022 in conformity with accounting principles generally accepted in the United States of America.
Basis for Opinion
These financial statements are the responsibility of the Fund’s management. Our responsibility is to express an opinion on the Fund’s financial statements based on our audits. We are a public accounting firm registered with the Public Company Accounting Oversight Board (United States) (PCAOB) and are required to be independent with respect to the Fund in accordance with the U.S. federal securities laws and the applicable rules and regulations of the Securities and Exchange Commission and the PCAOB.
We conducted our audits of these financial statements in accordance with the standards of the PCAOB. Those standards require that we plan and perform the audit to obtain reasonable assurance about whether the financial statements are free of material misstatement, whether due to error or fraud.
Our audits included performing procedures to assess the risks of material misstatement of the financial statements, whether due to error or fraud, and performing procedures that respond to those risks. Such procedures included examining, on a test basis, evidence regarding the amounts and disclosures in the financial statements. Our audits also included evaluating the accounting principles used and significant estimates made by management, as well as evaluating the overall presentation of the financial statements. Our procedures included confirmation of securities owned as of June 30, 2022 by correspondence with the custodian, issuers of privately offered securities and brokers; when replies were not received from brokers, we performed other auditing procedures. We believe that our audits provide a reasonable basis for our opinion.
/s/ PricewaterhouseCoopers LLP
Boston, Massachusetts
August 12, 2022
We have served as the auditor of one or more investment companies in the Fidelity group of funds since 1932.
Trustees and Officers
The Trustees, Members of the Advisory Board (if any), and officers of the trust and fund, as applicable, are listed below. The Board of Trustees governs the fund and is responsible for protecting the interests of shareholders. The Trustees are experienced executives who meet periodically throughout the year to oversee the fund's activities, review contractual arrangements with companies that provide services to the fund, oversee management of the risks associated with such activities and contractual arrangements, and review the fund's performance. Each of the Trustees oversees 316 funds.
The Trustees hold office without limit in time except that (a) any Trustee may resign; (b) any Trustee may be removed by written instrument, signed by at least two-thirds of the number of Trustees prior to such removal; (c) any Trustee who requests to be retired or who has become incapacitated by illness or injury may be retired by written instrument signed by a majority of the other Trustees; and (d) any Trustee may be removed at any special meeting of shareholders by a two-thirds vote of the outstanding voting securities of the trust. Each Trustee who is not an interested person (as defined in the 1940 Act) of the trust and the fund is referred to herein as an Independent Trustee. Each Independent Trustee shall retire not later than the last day of the calendar year in which his or her 75th birthday occurs. The Independent Trustees may waive this mandatory retirement age policy with respect to individual Trustees. Officers and Advisory Board Members hold office without limit in time, except that any officer or Advisory Board Member may resign or may be removed by a vote of a majority of the Trustees at any regular meeting or any special meeting of the Trustees. Except as indicated, each individual has held the office shown or other offices in the same company for the past five years.
The fund's Statement of Additional Information (SAI) includes more information about the Trustees. To request a free copy, call Fidelity at 1-800-544-8544 if you’re an individual investing directly with Fidelity, call 1-800-835-5092 if you’re a plan sponsor or participant with Fidelity as your recordkeeper or call 1-877-208-0098 on institutional accounts or if you’re an advisor or invest through one.
Experience, Skills, Attributes, and Qualifications of the Trustees. The Governance and Nominating Committee has adopted a statement of policy that describes the experience, qualifications, attributes, and skills that are necessary and desirable for potential Independent Trustee candidates (Statement of Policy). The Board believes that each Trustee satisfied at the time he or she was initially elected or appointed a Trustee, and continues to satisfy, the standards contemplated by the Statement of Policy. The Governance and Nominating Committee also engages professional search firms to help identify potential Independent Trustee candidates who have the experience, qualifications, attributes, and skills consistent with the Statement of Policy. From time to time, additional criteria based on the composition and skills of the current Independent Trustees, as well as experience or skills that may be appropriate in light of future changes to board composition, business conditions, and regulatory or other developments, have also been considered by the professional search firms and the Governance and Nominating Committee. In addition, the Board takes into account the Trustees' commitment and participation in Board and committee meetings, as well as their leadership of standing and ad hoc committees throughout their tenure.
In determining that a particular Trustee was and continues to be qualified to serve as a Trustee, the Board has considered a variety of criteria, none of which, in isolation, was controlling. The Board believes that, collectively, the Trustees have balanced and diverse experience, qualifications, attributes, and skills, which allow the Board to operate effectively in governing the fund and protecting the interests of shareholders. Information about the specific experience, skills, attributes, and qualifications of each Trustee, which in each case led to the Board's conclusion that the Trustee should serve (or continue to serve) as a trustee of the fund, is provided below.
Board Structure and Oversight Function. Robert A. Lawrence is an interested person and currently serves as Chair. The Trustees have determined that an interested Chair is appropriate and benefits shareholders because an interested Chair has a personal and professional stake in the quality and continuity of services provided to the fund. Independent Trustees exercise their informed business judgment to appoint an individual of their choosing to serve as Chair, regardless of whether the Trustee happens to be independent or a member of management. The Independent Trustees have determined that they can act independently and effectively without having an Independent Trustee serve as Chair and that a key structural component for assuring that they are in a position to do so is for the Independent Trustees to constitute a substantial majority for the Board. The Independent Trustees also regularly meet in executive session. David M. Thomas serves as Lead Independent Trustee and as such (i) acts as a liaison between the Independent Trustees and management with respect to matters important to the Independent Trustees and (ii) with management prepares agendas for Board meetings.
Fidelity® funds are overseen by different Boards of Trustees. The fund's Board oversees Fidelity's high income and certain equity funds, and other Boards oversee Fidelity's investment-grade bond, money market, asset allocation, and other equity funds. The asset allocation funds may invest in Fidelity® funds overseen by the fund's Board. The use of separate Boards, each with its own committee structure, allows the Trustees of each group of Fidelity® funds to focus on the unique issues of the funds they oversee, including common research, investment, and operational issues. On occasion, the separate Boards establish joint committees to address issues of overlapping consequences for the Fidelity® funds overseen by each Board.
The Trustees operate using a system of committees to facilitate the timely and efficient consideration of all matters of importance to the Trustees, the fund, and fund shareholders and to facilitate compliance with legal and regulatory requirements and oversight of the fund's activities and associated risks. The Board, acting through its committees, has charged FMR and its affiliates with (i) identifying events or circumstances the occurrence of which could have demonstrably adverse effects on the fund's business and/or reputation; (ii) implementing processes and controls to lessen the possibility that such events or circumstances occur or to mitigate the effects of such events or circumstances if they do occur; and (iii) creating and maintaining a system designed to evaluate continuously business and market conditions in order to facilitate the identification and implementation processes described in (i) and (ii) above. Because the day-to-day operations and activities of the fund are carried out by or through FMR, its affiliates, and other service providers, the fund's exposure to risks is mitigated but not eliminated by the processes overseen by the Trustees. While each of the Board's committees has responsibility for overseeing different aspects of the fund's activities, oversight is exercised primarily through the Operations, Audit, and Compliance Committees. Appropriate personnel, including but not limited to the fund's Chief Compliance Officer (CCO), FMR's internal auditor, the independent accountants, the fund's Treasurer and portfolio management personnel, make periodic reports to the Board's committees, as appropriate, including an annual review of Fidelity's risk management program for the Fidelity® funds. The responsibilities of each standing committee, including their oversight responsibilities, are described further under "Standing Committees of the Trustees."
Interested Trustees*:
Correspondence intended for a Trustee who is an interested person may be sent to Fidelity Investments, 245 Summer Street, Boston, Massachusetts 02210.
Name, Year of Birth; Principal Occupations and Other Relevant Experience+
Bettina Doulton (1964)
Year of Election or Appointment: 2020
Trustee
Ms. Doulton also serves as Trustee of other Fidelity® funds. Prior to her retirement, Ms. Doulton served in a variety of positions at Fidelity Investments, including as a managing director of research (2006-2007), portfolio manager to certain Fidelity® funds (1993-2005), equity analyst and portfolio assistant (1990-1993), and research assistant (1987-1990). Ms. Doulton currently owns and operates Phi Builders + Architects and Cellardoor Winery. Previously, Ms. Doulton served as a member of the Board of Brown Capital Management, LLC (2014-2018).
Robert A. Lawrence (1952)
Year of Election or Appointment: 2020
Trustee
Chair of the Board of Trustees
Mr. Lawrence also serves as Trustee of other funds. Previously, Mr. Lawrence served as a Trustee and Member of the Advisory Board of certain funds. Prior to his retirement in 2008, Mr. Lawrence served as Vice President of certain Fidelity® funds (2006-2008), Senior Vice President, Head of High Income Division of Fidelity Management & Research Company (investment adviser firm, 2006-2008), and President of Fidelity Strategic Investments (investment adviser firm, 2002-2005).
* Determined to be an “Interested Trustee” by virtue of, among other things, his or her affiliation with the trust or various entities under common control with FMR.
+ The information includes the Trustee's principal occupation during the last five years and other information relating to the experience, attributes, and skills relevant to the Trustee's qualifications to serve as a Trustee, which led to the conclusion that the Trustee should serve as a Trustee for the fund.
Independent Trustees:
Correspondence intended for an Independent Trustee may be sent to Fidelity Investments, P.O. Box 55235, Boston, Massachusetts 02205-5235.
Name, Year of Birth; Principal Occupations and Other Relevant Experience+
Thomas P. Bostick (1956)
Year of Election or Appointment: 2021
Trustee
Lieutenant General Bostick also serves as Trustee of other Fidelity® funds. Prior to his retirement, General Bostick (United States Army, Retired) held a variety of positions within the U.S. Army, including Commanding General and Chief of Engineers, U.S. Army Corps of Engineers (2012-2016) and Deputy Chief of Staff and Director of Human Resources, U.S. Army (2009-2012). General Bostick currently serves as a member of the Board and Finance and Governance Committees of CSX Corporation (transportation, 2020-present) and a member of the Board and Corporate Governance and Nominating Committee of Perma-Fix Environmental Services, Inc. (nuclear waste management, 2020-present). General Bostick serves as Chief Executive Officer of Bostick Global Strategies, LLC (consulting, 2016-present) and as a member of the Board of HireVue, Inc. (video interview and assessment, 2020-present). Previously, General Bostick served as a Member of the Advisory Board of certain Fidelity® funds (2021), President, Intrexon Bioengineering (2018-2020) and Chief Operating Officer (2017-2020) and Senior Vice President of the Environment Sector (2016-2017) of Intrexon Corporation (biopharmaceutical company).
Dennis J. Dirks (1948)
Year of Election or Appointment: 2005
Trustee
Mr. Dirks also serves as Trustee of other Fidelity® funds. Prior to his retirement in May 2003, Mr. Dirks served as Chief Operating Officer and as a member of the Board of The Depository Trust & Clearing Corporation (financial markets infrastructure), President, Chief Operating Officer and a member of the Board of The Depository Trust Company (DTC), President and a member of the Board of the National Securities Clearing Corporation (NSCC), Chief Executive Officer and a member of the Board of the Government Securities Clearing Corporation and Chief Executive Officer and a member of the Board of the Mortgage-Backed Securities Clearing Corporation. Mr. Dirks currently serves as a member of the Finance Committee (2016-present) and Board (2017-present) and is Treasurer (2018-present) of the Asolo Repertory Theatre.
Donald F. Donahue (1950)
Year of Election or Appointment: 2018
Trustee
Mr. Donahue also serves as Trustee of other Fidelity® funds. Mr. Donahue serves as President and Chief Executive Officer of Miranda Partners, LLC (risk consulting for the financial services industry, 2012-present). Previously, Mr. Donahue served as Chief Executive Officer (2006-2012), Chief Operating Officer (2003-2006) and Managing Director, Customer Marketing and Development (1999-2003) of The Depository Trust & Clearing Corporation (financial markets infrastructure). Mr. Donahue currently serves as a member (2007-present) and Co-Chairman (2016-present) of the Board of United Way of New York and a member of the Board of The Leadership Academy (previously NYC Leadership Academy) (2012-present). Mr. Donahue previously served as a member of the Advisory Board of certain Fidelity® funds (2015-2018).
Vicki L. Fuller (1957)
Year of Election or Appointment: 2020
Trustee
Ms. Fuller also serves as Trustee of other Fidelity® funds. Previously, Ms. Fuller served as a member of the Advisory Board of certain Fidelity® funds (2018-2020), Chief Investment Officer of the New York State Common Retirement Fund (2012-2018) and held a variety of positions at AllianceBernstein L.P. (global asset management, 1985-2012), including Managing Director (2006-2012) and Senior Vice President and Senior Portfolio Manager (2001-2006). Ms. Fuller currently serves as a member of the Board, Audit Committee and Nominating and Governance Committee of two Blackstone business development companies (2020-present), as a member of the Board of Treliant, LLC (consulting, 2019-present), as a member of the Advisory Board of Ariel Alternatives, LLC (private equity, 2021-present) and as a member of the Board and Chair of the Audit Committee of Gusto, Inc. (software, 2021-present). In addition, Ms. Fuller currently serves as a member of the Board of Roosevelt University (2019-present) and as a member of the Executive Board of New York University’s Stern School of Business. Ms. Fuller previously served as a member of the Board, Audit Committee and Nominating and Governance Committee of The Williams Companies, Inc. (natural gas infrastructure, 2018-2021).
Patricia L. Kampling (1959)
Year of Election or Appointment: 2020
Trustee
Ms. Kampling also serves as Trustee of other Fidelity® funds. Prior to her retirement, Ms. Kampling served as Chairman of the Board and Chief Executive Officer (2012-2019), President and Chief Operating Officer (2011-2012) and Executive Vice President and Chief Financial Officer (2010-2011) of Alliant Energy Corporation. Ms. Kampling currently serves as a member of the Board, Finance Committee and Governance, Compensation and Nominating Committee of Xcel Energy Inc. (utilities company, 2020-present) and as a member of the Board, Audit, Finance and Risk Committee and Safety, Environmental, Technology and Operations Committee and Chair of the Executive Development and Compensation Committee of American Water Works Company, Inc. (utilities company, 2019-present). In addition, Ms. Kampling currently serves as a member of the Board of the Nature Conservancy, Wisconsin Chapter (2019-present). Previously, Ms. Kampling served as a Member of the Advisory Board of certain Fidelity® funds (2020), a member of the Board, Compensation Committee and Executive Committee and Chair of the Audit Committee of Briggs & Stratton Corporation (manufacturing, 2011-2021), a member of the Board of Interstate Power and Light Company (2012-2019) and Wisconsin Power and Light Company (2012-2019) (each a subsidiary of Alliant Energy Corporation) and as a member of the Board and Workforce Development Committee of the Business Roundtable (2018-2019).
Thomas A. Kennedy (1955)
Year of Election or Appointment: 2021
Trustee
Mr. Kennedy also serves as Trustee of other Fidelity® funds. Previously, Mr. Kennedy served as a Member of the Advisory Board of certain Fidelity® funds (2020) and held a variety of positions at Raytheon Company (aerospace and defense, 1983-2020), including Chairman and Chief Executive Officer (2014-2020) and Executive Vice President and Chief Operating Officer (2013-2014). Mr. Kennedy currently serves as Executive Chairman of the Board of Directors of Raytheon Technologies Corporation (aerospace and defense, 2020-present). He is also a member of the Rutgers School of Engineering Industry Advisory Board (2011-present) and a member of the UCLA Engineering Dean’s Executive Board (2016-present).
Oscar Munoz (1959)
Year of Election or Appointment: 2021
Trustee
Mr. Munoz also serves as Trustee of other Fidelity® funds. Prior to his retirement, Mr. Munoz served as Executive Chairman (2020-2021), Chief Executive Officer (2015-2020), President (2015-2016) and a member of the Board (2010-2021) of United Airlines Holdings, Inc. Mr. Munoz currently serves as a member of the Board of CBRE Group, Inc. (commercial real estate, 2020-present), a member of the Board of Univision Communications, Inc. (Hispanic media, 2020-present) and a member of the Advisory Board of Salesforce.com, Inc. (cloud-based software, 2020-present). Previously, Mr. Munoz served as a Member of the Advisory Board of certain Fidelity® funds (2021).
Garnett A. Smith (1947)
Year of Election or Appointment: 2018
Trustee
Mr. Smith also serves as Trustee of other Fidelity® funds. Prior to his retirement, Mr. Smith served as Chairman and Chief Executive Officer (1990-1997) and President (1986-1990) of Inbrand Corp. (manufacturer of personal absorbent products). Prior to his employment with Inbrand Corp., he was employed by a retail fabric chain and North Carolina National Bank (now Bank of America). Mr. Smith previously served as a member of the Advisory Board of certain Fidelity® funds (2012-2013).
David M. Thomas (1949)
Year of Election or Appointment: 2008
Trustee
Lead Independent Trustee
Mr. Thomas also serves as Trustee of other Fidelity® funds. Previously, Mr. Thomas served as Executive Chairman (2005-2006) and Chairman and Chief Executive Officer (2000-2005) of IMS Health, Inc. (pharmaceutical and healthcare information solutions). Mr. Thomas currently serves as a member of the Board of Fortune Brands Home and Security (home and security products, 2004-present) and as Director (2013-present) and Non-Executive Chairman of the Board (2022-present) of Interpublic Group of Companies, Inc. (marketing communication).
Susan Tomasky (1953)
Year of Election or Appointment: 2020
Trustee
Ms. Tomasky also serves as Trustee of other Fidelity® funds. Prior to her retirement, Ms. Tomasky served in various executive officer positions at American Electric Power Company, Inc. (1998-2011), including most recently as President of AEP Transmission (2007-2011). Ms. Tomasky currently serves as a member of the Board and Sustainability Committee and as Chair of the Audit Committee of Marathon Petroleum Corporation (2018-present) and as a member of the Board, Executive Committee, Corporate Governance Committee and Organization and Compensation Committee and as Chair of the Audit Committee of Public Service Enterprise Group, Inc. (utilities company, 2012-present) and as a member of the Board of its subsidiary company, Public Service Electric and Gas Co. (2021-present). In addition, Ms. Tomasky currently serves as a member (2009-present) and President (2020-present) of the Board of the Royal Shakespeare Company – America (2009-present), as a member of the Board of the Columbus Association for the Performing Arts (2011-present) and as a member of the Board and Kenyon in the World Committee of Kenyon College (2016-present). Previously, Ms. Tomasky served as a Member of the Advisory Board of certain Fidelity® funds (2020), as a member of the Board of the Columbus Regional Airport Authority (2007-2020), as a member of the Board (2011-2018) and Lead Independent Director (2015-2018) of Andeavor Corporation (previously Tesoro Corporation) (independent oil refiner and marketer) and as a member of the Board of Summit Midstream Partners LP (energy, 2012-2018).
Michael E. Wiley (1950)
Year of Election or Appointment: 2018
Trustee
Mr. Wiley also serves as Trustee of other Fidelity® funds. Previously, Mr. Wiley served as a member of the Advisory Board of certain Fidelity® funds (2018-2020), Chairman, President and CEO of Baker Hughes, Inc. (oilfield services, 2000-2004). Mr. Wiley also previously served as a member of the Board of Andeavor Corporation (independent oil refiner and marketer, 2005-2018), a member of the Board of Andeavor Logistics LP (natural resources logistics, 2015-2018) and a member of the Board of High Point Resources (exploration and production, 2005-2020).
+ The information includes the Trustee's principal occupation during the last five years and other information relating to the experience, attributes, and skills relevant to the Trustee's qualifications to serve as a Trustee, which led to the conclusion that the Trustee should serve as a Trustee for the fund.
Advisory Board Members and Officers:
Correspondence intended for a Member of the Advisory Board (if any) may be sent to Fidelity Investments, P.O. Box 55235, Boston, Massachusetts 02205-5235. Correspondence intended for an officer or Peter S. Lynch may be sent to Fidelity Investments, 245 Summer Street, Boston, Massachusetts 02210. Officers appear below in alphabetical order.
Name, Year of Birth; Principal Occupation
Peter S. Lynch (1944)
Year of Election or Appointment: 2003
Member of the Advisory Board
Mr. Lynch also serves as a Member of the Advisory Board of other Fidelity® funds. Mr. Lynch is Vice Chairman and a Director of Fidelity Management & Research Company LLC (investment adviser firm). In addition, Mr. Lynch serves as a Trustee of Boston College and as the Chairman of the Inner-City Scholarship Fund. Previously, Mr. Lynch served as Vice Chairman and a Director of FMR Co., Inc. (investment adviser firm) and on the Special Olympics International Board of Directors (1997-2006).
Craig S. Brown (1977)
Year of Election or Appointment: 2019
Assistant Treasurer
Mr. Brown also serves as an officer of other funds. Mr. Brown serves as Assistant Treasurer of FIMM, LLC (2021-present) and is an employee of Fidelity Investments (2013-present).
John J. Burke III (1964)
Year of Election or Appointment: 2018
Chief Financial Officer
Mr. Burke also serves as Chief Financial Officer of other funds. Mr. Burke serves as Head of Investment Operations for Fidelity Fund and Investment Operations (2018-present) and is an employee of Fidelity Investments (1998-present). Previously Mr. Burke served as head of Asset Management Investment Operations (2012-2018).
William C. Coffey (1969)
Year of Election or Appointment: 2019
Assistant Secretary
Mr. Coffey also serves as Assistant Secretary of other funds. He is Senior Vice President and Deputy General Counsel of FMR LLC (diversified financial services company, 2010-present), and is an employee of Fidelity Investments. Previously, Mr. Coffey served as Secretary and CLO of certain funds (2018-2019); CLO, Secretary, and Senior Vice President of Fidelity Management & Research Company and FMR Co., Inc. (investment adviser firms, 2018-2019); Secretary of Fidelity SelectCo, LLC and Fidelity Investments Money Management, Inc. (investment adviser firms, 2018-2019); CLO of Fidelity Management & Research (Hong Kong) Limited, FMR Investment Management (UK) Limited, and Fidelity Management & Research (Japan) Limited (investment adviser firms, 2018-2019); and Assistant Secretary of certain funds (2009-2018).
Timothy M. Cohen (1969)
Year of Election or Appointment: 2018
Vice President
Mr. Cohen also serves as Vice President of other funds. Mr. Cohen serves as Co-Head of Equity (2018-present), a Director of Fidelity Management & Research (Japan) Limited (investment adviser firm, 2016-present), and is an employee of Fidelity Investments. Previously, Mr. Cohen served as Executive Vice President of Fidelity SelectCo, LLC (2019), Head of Global Equity Research (2016-2018), Chief Investment Officer - Equity and a Director of Fidelity Management & Research (U.K.) Inc. (investment adviser firm, 2013-2015) and as a Director of Fidelity Management & Research (Hong Kong) Limited (investment adviser firm, 2017).
Jonathan Davis (1968)
Year of Election or Appointment: 2010
Assistant Treasurer
Mr. Davis also serves as an officer of other funds. Mr. Davis serves as Assistant Treasurer of FIMM, LLC (2021-present), FMR Capital, Inc. (2017-present), FD Funds GP LLC (2021-present), FD Funds Holding LLC (2021-present), and FD Funds Management LLC (2021-present); and is an employee of Fidelity Investments. Previously, Mr. Davis served as Vice President and Associate General Counsel of FMR LLC (diversified financial services company, 2003-2010).
Laura M. Del Prato (1964)
Year of Election or Appointment: 2018
Assistant Treasurer
Ms. Del Prato also serves as an officer of other funds. Ms. Del Prato serves as Assistant Treasurer of FIMM, LLC (2021-present) and is an employee of Fidelity Investments (2017-present). Previously, Ms. Del Prato served as President and Treasurer of The North Carolina Capital Management Trust: Cash Portfolio and Term Portfolio (2018-2020). Prior to joining Fidelity Investments, Ms. Del Prato served as a Managing Director and Treasurer of the JPMorgan Mutual Funds (2014-2017). Prior to JPMorgan, Ms. Del Prato served as a partner at Cohen Fund Audit Services (accounting firm, 2012-2013) and KPMG LLP (accounting firm, 2004-2012).
Colm A. Hogan (1973)
Year of Election or Appointment: 2020
Assistant Treasurer
Mr. Hogan also serves as an officer of other funds. Mr. Hogan serves as Assistant Treasurer of FIMM, LLC (2021-present) and FMR Capital, Inc. (2017-present) and is an employee of Fidelity Investments (2005-present). Previously, Mr. Hogan served as Deputy Treasurer of certain Fidelity® funds (2016-2020) and Assistant Treasurer of certain Fidelity® funds (2016-2018).
Pamela R. Holding (1964)
Year of Election or Appointment: 2018
Vice President
Ms. Holding also serves as Vice President of other funds. Ms. Holding serves as Co-Head of Equity (2018-present) and is an employee of Fidelity Investments (2013-present). Previously, Ms. Holding served as Executive Vice President of Fidelity SelectCo, LLC (2019) and as Chief Investment Officer of Fidelity Institutional Asset Management (2013-2018).
Cynthia Lo Bessette (1969)
Year of Election or Appointment: 2019
Secretary and Chief Legal Officer (CLO)
Ms. Lo Bessette also serves as an officer of other funds. Ms. Lo Bessette serves as CLO, Secretary, and Senior Vice President of Fidelity Management & Research Company LLC (investment adviser firm, 2019-present); CLO of Fidelity Management & Research (Hong Kong) Limited, FMR Investment Management (UK) Limited, and Fidelity Management & Research (Japan) Limited (investment adviser firms, 2019-present); Secretary of FD Funds GP LLC (2021-present), FD Funds Holding LLC (2021-present), and FD Funds Management LLC (2021-present); and Assistant Secretary of FIMM, LLC (2019-present). She is a Senior Vice President and Deputy General Counsel of FMR LLC (diversified financial services company, 2019-present), and is an employee of Fidelity Investments. Previously, Ms. Lo Bessette served as CLO, Secretary, and Senior Vice President of FMR Co., Inc. (investment adviser firm, 2019); Secretary of Fidelity SelectCo, LLC and Fidelity Investments Money Management, Inc. (investment adviser firms, 2019). Prior to joining Fidelity Investments, Ms. Lo Bessette was Executive Vice President, General Counsel (2016-2019) and Senior Vice President, Deputy General Counsel (2015-2016) of OppenheimerFunds (investment management company) and Deputy Chief Legal Officer (2013-2015) of Jennison Associates LLC (investment adviser firm).
Chris Maher (1972)
Year of Election or Appointment: 2020
Deputy Treasurer
Mr. Maher also serves as an officer of other funds. Mr. Maher serves as Assistant Treasurer of FIMM, LLC (2021-present) and FMR Capital, Inc. (2017-present), and is an employee of Fidelity Investments (2008-present). Previously, Mr. Maher served as Assistant Treasurer of certain funds (2013-2020); Vice President of Asset Management Compliance (2013), Vice President of the Program Management Group of FMR (investment adviser firm, 2010-2013), and Vice President of Valuation Oversight (2008-2010).
Jason P. Pogorelec (1975)
Year of Election or Appointment: 2020
Chief Compliance Officer
Mr. Pogorelec also serves as Chief Compliance Officer of other funds. Mr. Pogorelec is a senior Vice President of Asset Management Compliance for Fidelity Investments and is an employee of Fidelity Investments (2006-present). Previously, Mr. Pogorelec served as Vice President, Associate General Counsel for Fidelity Investments (2010-2020) and Assistant Secretary of certain Fidelity funds (2015-2020).
Brett Segaloff (1972)
Year of Election or Appointment: 2021
Anti-Money Laundering (AML) Officer
Mr. Segaloff also serves as an AML Officer of other funds and other related entities. He is Director, Anti-Money Laundering (2007-present) of FMR LLC (diversified financial services company) and is an employee of Fidelity Investments (1996-present).
Stacie M. Smith (1974)
Year of Election or Appointment: 2016
President and Treasurer
Ms. Smith also serves as an officer of other funds. Ms. Smith serves as Assistant Treasurer of FIMM, LLC (2021-present) and FMR Capital, Inc. (2017-present), is an employee of Fidelity Investments (2009-present), and has served in other fund officer roles. Prior to joining Fidelity Investments, Ms. Smith served as Senior Audit Manager of Ernst & Young LLP (accounting firm, 1996-2009). Previously, Ms. Smith served as Assistant Treasurer (2013-2019) and Deputy Treasurer (2013-2016) of certain Fidelity® funds.
Jim Wegmann (1979)
Year of Election or Appointment: 2019
Assistant Treasurer
Mr. Wegmann also serves as an officer of other funds. Mr. Wegmann serves as Assistant Treasurer of FIMM, LLC (2021-present) and is an employee of Fidelity Investments (2011-present). Previously, Mr. Wegmann served as Assistant Treasurer of certain Fidelity® funds (2019-2021).
Shareholder Expense Example
As a shareholder, you incur two types of costs: (1) transaction costs, which may include sales charges (loads) on purchase payments or redemption proceeds, as applicable and (2) ongoing costs, which generally include management fees, distribution and/or service (12b-1) fees and other Fund expenses. This Example is intended to help you understand your ongoing costs (in dollars) of investing in a fund and to compare these costs with the ongoing costs of investing in other mutual funds.
The Example is based on an investment of $1,000 invested at the beginning of the period and held for the entire period (January 1, 2022 to June 30, 2022).
Actual Expenses
The first line of the accompanying table provides information about actual account values and actual expenses. You may use the information in this line, together with the amount you invested, to estimate the expenses that you paid over the period. Simply divide your account value by $1,000.00 (for example, an $8,600 account value divided by $1,000.00 = 8.6), then multiply the result by the number in the first line for a class/Fund under the heading entitled "Expenses Paid During Period" to estimate the expenses you paid on your account during this period. If any fund is a shareholder of any underlying mutual funds or exchange-traded funds (ETFs) (the Underlying Funds), such fund indirectly bears its proportional share of the expenses of the Underlying Funds in addition to the direct expenses incurred presented in the table. These fees and expenses are not included in the annualized expense ratio used to calculate the expense estimate in the table below.
Hypothetical Example for Comparison Purposes
The second line of the accompanying table provides information about hypothetical account values and hypothetical expenses based on the actual expense ratio and an assumed rate of return of 5% per year before expenses, which is not the actual return. The hypothetical account values and expenses may not be used to estimate the actual ending account balance or expenses you paid for the period. You may use this information to compare the ongoing costs of investing in the Fund and other funds. To do so, compare this 5% hypothetical example with the 5% hypothetical examples that appear in the shareholder reports of the other funds. If any fund is a shareholder of any Underlying Funds, such fund indirectly bears its proportional share of the expenses of the Underlying Funds in addition to the direct expenses as presented in the table. These fees and expenses are not included in the annualized expense ratio used to calculate the expense estimate in the table below.
Please note that the expenses shown in the table are meant to highlight your ongoing costs only and do not reflect any transaction costs. Therefore, the second line of the table is useful in comparing ongoing costs only, and will not help you determine the relative total costs of owning different funds. In addition, if these transactional costs were included, your costs would have been higher.
| Annualized Expense Ratio-A | Beginning Account Value January 1, 2022 | Ending Account Value June 30, 2022 | Expenses Paid During Period-B January 1, 2022 to June 30, 2022 | |
| Fidelity Growth Discovery Fund | ||||
| Growth Discovery | .80% | |||
| Actual | $1,000.00 | $764.70 | $3.50 | |
| Hypothetical-C | $1,000.00 | $1,020.83 | $4.01 | |
| Class K | .70% | |||
| Actual | $1,000.00 | $765.10 | $3.06 | |
| Hypothetical-C | $1,000.00 | $1,021.32 | $3.51 |
A Annualized expense ratio reflects expenses net of applicable fee waivers.
B Expenses are equal to the annualized expense ratio, multiplied by the average account value over the period, multiplied by 181/ 365 (to reflect the one-half year period). The fees and expenses of any Underlying Funds are not included in each annualized expense ratio.
C 5% return per year before expenses
Distributions (Unaudited)
The dividend and capital gains distributions for the fund(s) are available on Fidelity.com or Institutional.Fidelity.com.
The fund hereby designates as a capital gain dividend with respect to the taxable year ended June 30, 2022, $226,708,880, or, if subsequently determined to be different, the net capital gain of such year.
The fund designates 100% of the short-term capital gain dividends distributed during the fiscal year as qualifying to be taxed as short-term capital gain dividends for nonresident alien shareholders.
Growth Discovery designates 11% and 100%; and Class K designates 11% and 100% of the dividends distributed in August and December, respectively during the fiscal year as qualifying for the dividends–received deduction for corporate shareholders.
Growth Discovery designates 15% and 100%; and Class K designates 15% and 100% of the dividends distributed in August and December, respectively during the fiscal year as amounts which may be taken into account as a dividend for the purposes of the maximum rate under section 1(h)(11) of the Internal Revenue Code.
Growth Discovery and Class K designate 1% of the dividends distributed during the fiscal year as a section 199A dividend.
The fund will notify shareholders in January 2023 of amounts for use in preparing 2022 income tax returns.
Board Approval of Investment Advisory Contracts and Management Fees
Fidelity Growth Discovery Fund
Each year, the Board of Trustees, including the Independent Trustees (together, the Board), votes on the renewal of the management contract with Fidelity Management & Research Company LLC (FMR) and the sub-advisory agreements (together, the Advisory Contracts) for the fund. FMR and the sub-advisers are referred to herein as the Investment Advisers. The Board, assisted by the advice of fund counsel and Independent Trustees' counsel, requests and considers a broad range of information relevant to the renewal of the Advisory Contracts throughout the year.The Board meets regularly and, at each of its meetings, covers an extensive agenda of topics and materials and considers factors that are relevant to its annual consideration of the renewal of the fund's Advisory Contracts, including the services and support provided to the fund and its shareholders. The Board has established various standing committees (Committees), each composed of and chaired by Independent Trustees with varying backgrounds, to which the Board has assigned specific subject matter responsibilities in order to enhance effective decision-making by the Board. The Board, acting directly and through its Committees, requests and receives information concerning the annual consideration of the renewal of the fund's Advisory Contracts. The Board also meets as needed to review matters specifically related to the Board's annual consideration of the renewal of the Advisory Contracts. Members of the Board may also meet with trustees of other Fidelity funds through joint ad hoc committees to discuss certain matters relevant to all of the Fidelity funds.At its May 2022 meeting, the Board unanimously determined to renew the fund's Advisory Contracts. In reaching its determination, the Board considered all factors it believed relevant, including (i) the nature, extent, and quality of the services provided to the fund and its shareholders (including the investment performance of the fund); (ii) the competitiveness relative to peer funds of the fund's management fee and the total expense ratio of a representative class (retail class); (iii) the total costs of the services provided by and the profits realized by Fidelity from its relationships with the fund; and (iv) the extent to which, if any, economies of scale exist and are realized as the fund grows, and whether any economies of scale are appropriately shared with fund shareholders.In considering whether to renew the Advisory Contracts for the fund, the Board reached a determination, with the assistance of fund counsel and Independent Trustees' counsel and through the exercise of its business judgment, that the renewal of the Advisory Contracts was in the best interests of the fund and its shareholders and that the compensation payable under the Advisory Contracts was fair and reasonable. The Board's decision to renew the Advisory Contracts was not based on any single factor, but rather was based on a comprehensive consideration of all the information provided to the Board at its meetings throughout the year. The Board, in reaching its determination to renew the Advisory Contracts, was aware that shareholders of the fund have a broad range of investment choices available to them, including a wide choice among funds offered by Fidelity's competitors, and that the fund's shareholders, who have the opportunity to review and weigh the disclosure provided by the fund in its prospectus and other public disclosures, have chosen to invest in this fund, which is part of the Fidelity family of funds.Nature, Extent, and Quality of Services Provided. The Board considered Fidelity's staffing as it relates to the fund, including the backgrounds of investment personnel of Fidelity, and also considered the fund's investment objective, strategies, and related investment philosophy. The Independent Trustees also had discussions with senior management of Fidelity's investment operations and investment groups. The Board considered the structure of the investment personnel compensation program and whether this structure provides appropriate incentives to act in the best interests of the fund. Additionally, the Board considered the portfolio managers' investments, if any, in the funds that they manage. The Board also considered the steps Fidelity had taken to ensure the continued provision of high quality services to the Fidelity funds during the COVID-19 pandemic, including the expansion of staff in client facing positions to maintain service levels in periods of high volumes and volatility.Resources Dedicated to Investment Management and Support Services. The Board and the Fund Oversight and Research Committees reviewed the general qualifications and capabilities of Fidelity's investment staff, including its size, education, experience, and resources, as well as Fidelity's approach to recruiting, training, managing, and compensating investment personnel. The Board noted the resources devoted to expansion of Fidelity's global investment organization, and that Fidelity's analysts have extensive resources, tools, and capabilities that allow them to conduct sophisticated quantitative and fundamental analysis, as well as credit analysis of issuers, counterparties, and guarantors. Further, the Board considered that Fidelity's investment professionals have sufficient access to global information and data so as to provide competitive investment results over time, and that those professionals also have access to sophisticated tools that permit them to assess portfolio construction and risk and performance attribution characteristics continuously, as well as to transmit new information and research conclusions rapidly around the world. Additionally, in its deliberations, the Board considered Fidelity's trading, risk management, compliance, and technology and operations capabilities and resources, which are integral parts of the investment management process.Shareholder and Administrative Services. The Board considered (i) the nature, extent, quality, and cost of advisory, administrative, and shareholder services performed by the Investment Advisers and their affiliates under the Advisory Contracts and under separate agreements covering transfer agency, pricing and bookkeeping, and securities lending services for the fund; (ii) the nature and extent of the supervision of third party service providers, principally custodians, subcustodians, and pricing vendors; and (iii) the resources devoted to, and the record of compliance with, the fund's compliance policies and procedures. The Board also reviewed the allocation of fund brokerage, including allocations to brokers affiliated with the Investment Advisers, the use of brokerage commissions to pay fund expenses, and the use of "soft" commission dollars to pay for research services.The Board noted that the growth of fund assets over time across the complex allows Fidelity to reinvest in the development of services designed to enhance the value and convenience of the Fidelity funds as investment vehicles. These services include 24-hour access to account information and market information over the Internet and through telephone representatives, investor education materials, and asset allocation tools. The Board also considered that it reviews customer service metrics such as telephone response times, continuity of services on the website and metrics addressing services at Fidelity Investor Centers.Investment in a Large Fund Family. The Board considered the benefits to shareholders of investing in a Fidelity fund, including the benefits of investing in a fund that is part of a large family of funds offering a variety of investment disciplines and providing a large variety of mutual fund investor services. The Board noted that Fidelity had taken, or had made recommendations that resulted in the Fidelity funds taking, a number of actions over the previous year that benefited particular funds, including: (i) continuing to dedicate additional resources to Fidelity's investment research process, which includes meetings with management of issuers of securities in which the funds invest; (ii) continuing efforts to enhance Fidelity's global research capabilities; (iii) launching new funds and ETFs with innovative structures, strategies and pricing and making other enhancements to meet client needs; (iv) launching new share classes of existing funds; (v) eliminating purchase minimums and broadening eligibility requirements for certain funds and share classes; (vi) reducing management fees and total expenses for certain target date funds and classes and index funds; (vii) lowering expenses for certain existing funds and classes by implementing or lowering expense caps; (viii) rationalizing product lines and gaining increased efficiencies from fund mergers and liquidations; (ix) continuing to develop, acquire and implement systems and technology to improve services to the funds and shareholders, strengthen information security, and increase efficiency; and (x) continuing to implement enhancements to further strengthen Fidelity's product line to increase investors' probability of success in achieving their investment goals, including retirement income goals.Investment Performance. The Board considered whether the fund has operated in accordance with its investment objective, as well as its record of compliance with its investment restrictions and its performance history.The Board took into account discussions that occur at Board meetings throughout the year with representatives of the Investment Advisers about fund investment performance. In this regard the Board noted that as part of regularly scheduled fund reviews and other reports to the Board on fund performance, the Board considers annualized return information for the fund for different time periods, measured against an appropriate securities market index (benchmark index) and an appropriate peer group of funds with similar objectives (peer group). The Board also reviews and considers information about performance attribution. In its evaluation of fund investment performance, the Board gave particular attention to information indicating changes in performance of certain Fidelity funds for specific time periods and discussed with the Investment Advisers the reasons for any overperformance or underperformance.In addition to reviewing absolute and relative fund performance, the Independent Trustees periodically consider the appropriateness of fund performance metrics in evaluating the results achieved. In general, the Independent Trustees believe that fund performance should be evaluated based on net performance (after fees and expenses) of the representative class compared to appropriate benchmark indices, over appropriate time periods that may include full market cycles, and compared to peer groups, as applicable, over the same periods, taking into account relevant factors including the following: general market conditions; issuer-specific information; and fund cash flows and other factors.The Independent Trustees recognize that shareholders evaluate performance on a net basis over their own holding periods, for which one-, three-, and five-year periods are often used as a proxy. For this reason, the performance information reviewed by the Board also included net cumulative total return information for the fund and an appropriate benchmark index and peer group for the most recent one-, three-, and five-year periods ended September 30, 2021, as shown below. Returns are shown compared to the 25th percentile (top of box, 75% beaten) and 75th percentile (bottom of box, 25% beaten) of the peer universe.Fidelity Growth Discovery Fund
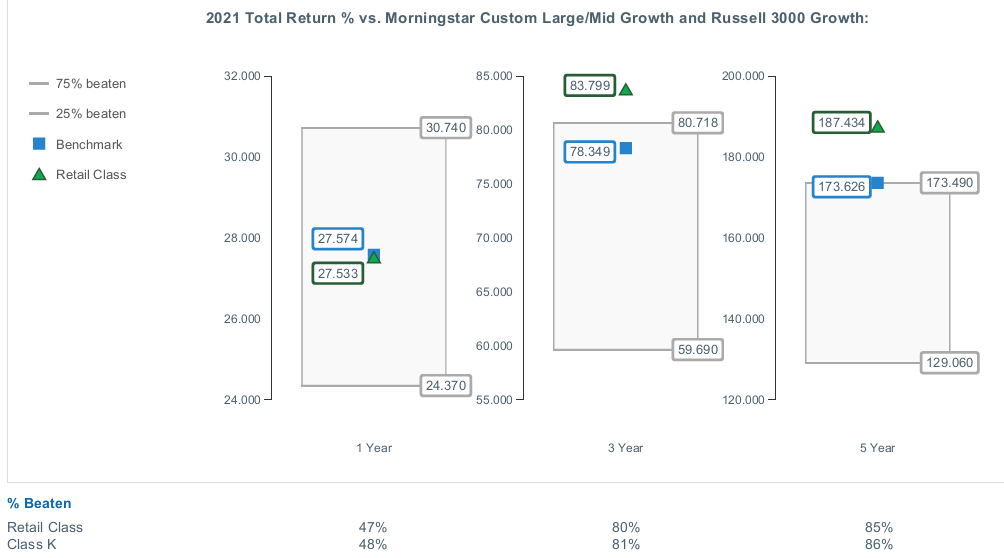
Fidelity Growth Discovery Fund

Liquidity Risk Management Program
The Securities and Exchange Commission adopted Rule 22e-4 under the Investment Company Act of 1940 (the Liquidity Rule) to promote effective liquidity risk management throughout the open-end investment company industry, thereby reducing the risk that funds will be unable to meet their redemption obligations and mitigating dilution of the interests of fund shareholders.
The Fund has adopted and implemented a liquidity risk management program pursuant to the Liquidity Rule (the Program) effective December 1, 2018. The Program is reasonably designed to assess and manage the Fund’s liquidity risk and to comply with the requirements of the Liquidity Rule. The Fund’s Board of Trustees (the Board) has designated the Fund’s investment adviser as administrator of the Program. The Fidelity advisers have established a Liquidity Risk Management Committee (the LRM Committee) to manage the Program for each of the Fidelity Funds. The LRM Committee monitors the adequacy and effectiveness of implementation of the Program and on a periodic basis assesses each Fund’s liquidity risk based on a variety of factors including (1) the Fund’s investment strategy, (2) portfolio liquidity and cash flow projections during normal and reasonably foreseeable stressed conditions, (3) shareholder redemptions, (4) borrowings and other funding sources and (5) in the case of exchange-traded funds, certain additional factors including the effect of the Fund’s prices and spreads, market participants, and basket compositions on the overall liquidity of the Fund’s portfolio, as applicable.
In accordance with the Program, each of the Fund’s portfolio investments is classified into one of four liquidity categories described below based on a determination of a reasonable expectation for how long it would take to convert the investment to cash (or sell or dispose of the investment) without significantly changing its market value.
- Highly liquid investments – cash or convertible to cash within three business days or less
- Moderately liquid investments – convertible to cash in three to seven calendar days
- Less liquid investments – can be sold or disposed of, but not settled, within seven calendar days
- Illiquid investments – cannot be sold or disposed of within seven calendar days
Liquidity classification determinations take into account a variety of factors including various market, trading and investment-specific considerations, as well as market depth, and generally utilize analysis from a third-party liquidity metrics service.
The Liquidity Rule places a 15% limit on a fund’s illiquid investments and requires funds that do not primarily hold assets that are highly liquid investments to determine and maintain a minimum percentage of the fund’s net assets to be invested in highly liquid investments (highly liquid investment minimum or HLIM). The Program includes provisions reasonably designed to comply with the 15% limit on illiquid investments and for determining, periodically reviewing and complying with the HLIM requirement as applicable.
At a recent meeting of the Fund’s Board of Trustees, the LRM Committee provided a written report to the Board pertaining to the operation, adequacy, and effectiveness of implementation of the Program for the annual period from December 1, 2020 through November 30, 2021. The report concluded that the Program has been implemented and is operating effectively and is reasonably designed to assess and manage the Fund’s liquidity risk.
![]()
CII-ANN-0822
1.705796.124
Fidelity® Mega Cap Stock Fund
June 30, 2022
Includes Fidelity and Fidelity Advisor share classes
Contents
Board Approval of Investment Advisory Contracts and Management Fees | |
To view a fund's proxy voting guidelines and proxy voting record for the 12-month period ended June 30, visit http://www.fidelity.com/proxyvotingresults or visit the Securities and Exchange Commission's (SEC) web site at http://www.sec.gov.
You may also call 1-800-544-8544 if you’re an individual investing directly with Fidelity, call 1-800-835-5092 if you’re a plan sponsor or participant with Fidelity as your recordkeeper or call 1-877-208-0098 on institutional accounts or if you’re an advisor or invest through one to request a free copy of the proxy voting guidelines.
Standard & Poor's, S&P and S&P 500 are registered service marks of The McGraw-Hill Companies, Inc. and have been licensed for use by Fidelity Distributors Corporation.
Other third-party marks appearing herein are the property of their respective owners.
All other marks appearing herein are registered or unregistered trademarks or service marks of FMR LLC or an affiliated company. © 2022 FMR LLC. All rights reserved.
This report and the financial statements contained herein are submitted for the general information of the shareholders of the Fund. This report is not authorized for distribution to prospective investors in the Fund unless preceded or accompanied by an effective prospectus.
A fund files its complete schedule of portfolio holdings with the SEC for the first and third quarters of each fiscal year on Form N-PORT. Forms N-PORT are available on the SEC’s web site at http://www.sec.gov. A fund's Forms N-PORT may be reviewed and copied at the SEC’s Public Reference Room in Washington, DC. Information regarding the operation of the SEC's Public Reference Room may be obtained by calling 1-800-SEC-0330.
For a complete list of a fund's portfolio holdings, view the most recent holdings listing, semiannual report, or annual report on Fidelity's web site at http://www.fidelity.com, http://www.institutional.fidelity.com, or http://www.401k.com, as applicable.
NOT FDIC INSURED •MAY LOSE VALUE •NO BANK GUARANTEE
Neither the Fund nor Fidelity Distributors Corporation is a bank.
Note to Shareholders:
Early in 2020, the outbreak and spread of COVID-19 emerged as a public health emergency that had a major influence on financial markets, primarily based on its impact on the global economy and corporate earnings. On March 11, 2020, the World Health Organization declared the COVID-19 outbreak a pandemic, citing sustained risk of further global spread. The pandemic prompted a number of measures to limit the spread of COVID-19, including travel and border restrictions, quarantines, and restrictions on large gatherings. In turn, these resulted in lower consumer activity, diminished demand for a wide range of products and services, disruption in manufacturing and supply chains, and – given the wide variability in outcomes regarding the outbreak – significant market uncertainty and volatility. To help stem the turmoil, the U.S. government took unprecedented action – in concert with the U.S. Federal Reserve and central banks around the world – to help support consumers, businesses, and the broader economy, and to limit disruption to the financial system.
In general, the overall impact of the pandemic lessened in 2021, amid a resilient economy and widespread distribution of three COVID-19 vaccines granted emergency use authorization from the U.S. Food and Drug Administration (FDA) early in the year. Still, the situation remains dynamic, and the extent and duration of its influence on financial markets and the economy is highly uncertain, due in part to a recent spike in cases based on highly contagious variants of the coronavirus.
Extreme events such as the COVID-19 crisis are exogenous shocks that can have significant adverse effects on mutual funds and their investments. Although multiple asset classes may be affected by market disruption, the duration and impact may not be the same for all types of assets. Fidelity is committed to helping you stay informed amid news about COVID-19 and during increased market volatility, and we continue to take extra steps to be responsive to customer needs. We encourage you to visit us online, where we offer ongoing updates, commentary, and analysis on the markets and our funds.
Performance: The Bottom Line
Average annual total return reflects the change in the value of an investment, assuming reinvestment of distributions from dividend income and capital gains (the profits earned upon the sale of securities that have grown in value, if any) and assuming a constant rate of performance each year. The hypothetical investment and the average annual total returns do not reflect the deduction of taxes that a shareholder would pay on fund distributions or the redemption of fund shares. During periods of reimbursement by Fidelity, a fund’s total return will be greater than it would be had the reimbursement not occurred. How a fund did yesterday is no guarantee of how it will do tomorrow.
Average Annual Total Returns
| For the periods ended June 30, 2022 | Past 1 year | Past 5 years | Past 10 years |
| Class A (incl. 5.75% sales charge) | (16.35)% | 8.55% | 11.11% |
| Class M (incl. 3.50% sales charge) | (14.54)% | 8.80% | 11.10% |
| Class C (incl. contingent deferred sales charge) | (12.75)% | 9.02% | 11.12% |
| Fidelity® Mega Cap Stock Fund | (10.99)% | 10.15% | 12.09% |
| Class I | (11.00)% | 10.14% | 12.08% |
| Class Z | (10.92)% | 10.28% | 12.22% |
Class C shares' contingent deferred sales charges included in the past one year, past five years and past ten years total return figures are 1%, 0% and 0%, respectively.
The initial offering of Class Z shares took place on August 13, 2013. Returns prior to August 13, 2013 are those of Class I.
$10,000 Over 10 Years
Let's say hypothetically that $10,000 was invested in Fidelity® Mega Cap Stock Fund, a class of the fund, on June 30, 2012.
The chart shows how the value of your investment would have changed, and also shows how the S&P 500® Index performed over the same period.

| Period Ending Values | ||
| $31,316 | Fidelity® Mega Cap Stock Fund | |
| $33,816 | S&P 500® Index | |
Management's Discussion of Fund Performance
Market Recap: The S&P 500® index returned -10.62% for the 12 months ending June 30, 2022, as a multitude of crosscurrents challenged the global economy and financial markets. Persistently high inflation, exacerbated by energy price shocks from the Russia–Ukraine conflict, spurred the U.S. Federal Reserve to hike interest rates more aggressively than anticipated, and concerns about the outlook for economic growth sent stocks into bear market territory. Against this backdrop, the index returned -8.72% in April amid clearer signals of the Fed’s intention to tighten monetary policy. In early May, the Fed approved a rare half-percentage-point interest rate increase and announced plans to shrink its $9 trillion asset portfolio. The S&P 500® gained 0.18% for the month. June began with the Fed allowing up to billions in Treasuries and mortgage bonds to mature every month without investing the proceeds. Two weeks later, the central bank raised rates by 0.75 percentage points, its largest increase since 1994, and said it was becoming more difficult to achieve a soft landing, in which the economy slows enough to bring down inflation while avoiding a recession. Partly in reaction, the S&P 500 returned -8.25% in June and -19.96% since the end of 2021 – its worst first-half result to begin a year since 1970. For the full 12 months, the growth-oriented communication services (-29%) and consumer discretionary (-24%) sectors lagged most. In contrast, energy (+40%) rode a surge in commodity prices and led by a wide margin, followed by defensive sectors, such as utilities (+14%).Comments from Portfolio Manager Matt Fruhan: For the fiscal year ending June 30, 2022, the fund's share classes (excluding sales charges, if applicable) returned roughly -12% to -11%, roughly in line with the -11.46% return of the Russell Top 200® Index, but underperforming the broad-based S&P 500® index. Versus the benchmark, market selection was the primary contributor, especially an overweight in the energy sector. An underweight and stock picking in the consumer discretionary sector, especially within the retailing industry, also helped. Also boosting performance was security selection in the communication services sector, primarily driven by the media & entertainment industry. The biggest individual relative contributor was an overweight position in Exxon Mobil (+43%). Exxon Mobil was among the fund's biggest holdings. Also boosting the fund was our lighter-than-benchmark stake in Amazon.com, which returned approximately -38%. This was a position we established the past year. Another notable relative contributor was our lighter-than-benchmark stake in Meta Platforms (-54%). This period we increased our stake. I'll note that the fund's foreign holdings contributed overall, despite continued U.S. dollar strength. In contrast, the largest detractor from performance versus the benchmark was security selection in the industrials sector, especially within the capital goods industry. An underweight in utilities and stock selection in financials also hurt relative performance. The biggest individual relative detractor was an overweight position in General Electric (-41%). General Electric was among our largest holdings. Another notable relative detractor was an outsized stake in Boeing (-43%). Avoiding Chevron, a benchmark component that gained roughly 44%, also hurt relative performance. Notable changes in positioning include increased exposure to the energy sector.The views expressed above reflect those of the portfolio manager(s) only through the end of the period as stated on the cover of this report and do not necessarily represent the views of Fidelity or any other person in the Fidelity organization. Any such views are subject to change at any time based upon market or other conditions and Fidelity disclaims any responsibility to update such views. These views may not be relied on as investment advice and, because investment decisions for a Fidelity fund are based on numerous factors, may not be relied on as an indication of trading intent on behalf of any Fidelity fund.
Note to shareholders: On August 28, 2021, Ashley Fernandes came off of the fund, leaving Matt Fruhan as sole manager. This move has allowed Ashley to more fully focus on his responsibilities as leader of Fidelity's natural resources research team.Investment Summary (Unaudited)
Top Ten Stocks as of June 30, 2022
| % of fund's net assets | |
| Exxon Mobil Corp. | 7.6 |
| Microsoft Corp. | 6.3 |
| General Electric Co. | 5.4 |
| Wells Fargo & Co. | 5.3 |
| Apple, Inc. | 4.7 |
| Bank of America Corp. | 3.9 |
| Alphabet, Inc. Class A | 3.0 |
| Alphabet, Inc. Class C | 3.0 |
| UnitedHealth Group, Inc. | 2.3 |
| JPMorgan Chase & Co. | 2.3 |
| 43.8 |
Market Sectors as of June 30, 2022
| % of fund's net assets | |
| Information Technology | 19.3 |
| Financials | 14.4 |
| Health Care | 14.0 |
| Energy | 12.8 |
| Industrials | 12.7 |
| Communication Services | 12.1 |
| Consumer Staples | 5.0 |
| Consumer Discretionary | 4.2 |
| Materials | 3.0 |
| Real Estate | 0.6 |
| Utilities | 0.1 |
Asset Allocation (% of fund's net assets)
| As of June 30, 2022* | ||
| Stocks | 98.0% | |
| Other Investments | 0.2% | |
| Short-Term Investments and Net Other Assets (Liabilities) | 1.8% | |

* Foreign investments - 12.1%
Geographic Diversification (% of fund's net assets)
| As of June 30, 2022 | ||
| United States of America* | 87.9% | |
| United Kingdom | 2.7% | |
| Canada | 2.3% | |
| Netherlands | 2.0% | |
| Japan | 1.4% | |
| Germany | 1.3% | |
| France | 0.7% | |
| Ireland | 0.7% | |
| Bailiwick of Jersey | 0.6% | |
| Other | 0.4% | |

* Short-Term Investments and Net Other Assets (Liabilities) are not included in the pie chart
Percentages are based on country or territory of incorporation and are adjusted for the effect of futures contracts, if applicable.
Schedule of Investments June 30, 2022
Showing Percentage of Net Assets
| Common Stocks - 98.0% | |||
| Shares | Value | ||
| COMMUNICATION SERVICES - 12.1% | |||
| Diversified Telecommunication Services - 0.9% | |||
| Verizon Communications, Inc. | 242,876 | $12,325,957 | |
| Entertainment - 2.6% | |||
| Activision Blizzard, Inc. | 55,941 | 4,355,566 | |
| Nintendo Co. Ltd. ADR | 120,900 | 6,506,838 | |
| The Walt Disney Co. (a) | 151,699 | 14,320,386 | |
| Universal Music Group NV | 448,499 | 8,986,139 | |
| 34,168,929 | |||
| Interactive Media & Services - 7.1% | |||
| Alphabet, Inc.: | |||
| Class A (a) | 18,400 | 40,098,384 | |
| Class C (a) | 18,140 | 39,680,343 | |
| Meta Platforms, Inc. Class A (a) | 89,400 | 14,415,750 | |
| 94,194,477 | |||
| Media - 1.5% | |||
| Comcast Corp. Class A | 526,297 | 20,651,894 | |
| TOTAL COMMUNICATION SERVICES | 161,341,257 | ||
| CONSUMER DISCRETIONARY - 4.2% | |||
| Automobiles - 0.1% | |||
| General Motors Co. (a) | 34,400 | 1,092,544 | |
| Hotels, Restaurants & Leisure - 1.5% | |||
| Booking Holdings, Inc. (a) | 9,398 | 16,437,008 | |
| Marriott International, Inc. Class A | 24,500 | 3,332,245 | |
| Starbucks Corp. | 6,100 | 465,979 | |
| 20,235,232 | |||
| Household Durables - 0.9% | |||
| Sony Group Corp. sponsored ADR | 148,800 | 12,167,376 | |
| Internet & Direct Marketing Retail - 0.5% | |||
| Amazon.com, Inc. (a) | 62,100 | 6,595,641 | |
| Specialty Retail - 1.2% | |||
| Lowe's Companies, Inc. | 90,311 | 15,774,622 | |
| Textiles, Apparel & Luxury Goods - 0.0% | |||
| NIKE, Inc. Class B | 8,500 | 868,700 | |
| TOTAL CONSUMER DISCRETIONARY | 56,734,115 | ||
| CONSUMER STAPLES - 5.0% | |||
| Beverages - 3.0% | |||
| Diageo PLC | 472,600 | 20,412,878 | |
| Keurig Dr. Pepper, Inc. | 239,500 | 8,475,905 | |
| The Coca-Cola Co. | 182,000 | 11,449,620 | |
| 40,338,403 | |||
| Food & Staples Retailing - 1.6% | |||
| Costco Wholesale Corp. | 1,300 | 623,064 | |
| Sysco Corp. | 185,299 | 15,696,678 | |
| Walmart, Inc. | 45,400 | 5,519,732 | |
| 21,839,474 | |||
| Food Products - 0.1% | |||
| Mondelez International, Inc. | 22,100 | 1,372,189 | |
| Tobacco - 0.3% | |||
| Altria Group, Inc. | 91,200 | 3,809,424 | |
| TOTAL CONSUMER STAPLES | 67,359,490 | ||
| ENERGY - 12.6% | |||
| Oil, Gas & Consumable Fuels - 12.6% | |||
| Canadian Natural Resources Ltd. | 367,100 | 19,705,928 | |
| Exxon Mobil Corp. | 1,194,187 | 102,270,176 | |
| Hess Corp. (b) | 280,316 | 29,696,677 | |
| Imperial Oil Ltd. | 218,000 | 10,276,756 | |
| Phillips 66 Co. | 81,200 | 6,657,588 | |
| 168,607,125 | |||
| FINANCIALS - 14.4% | |||
| Banks - 13.1% | |||
| Bank of America Corp. | 1,672,061 | 52,051,259 | |
| JPMorgan Chase & Co. | 270,130 | 30,419,339 | |
| PNC Financial Services Group, Inc. | 81,631 | 12,878,923 | |
| Truist Financial Corp. | 2,700 | 128,061 | |
| U.S. Bancorp | 193,512 | 8,905,422 | |
| Wells Fargo & Co. | 1,803,621 | 70,647,835 | |
| 175,030,839 | |||
| Capital Markets - 0.3% | |||
| Charles Schwab Corp. | 62,100 | 3,923,478 | |
| Consumer Finance - 0.1% | |||
| American Express Co. | 8,600 | 1,192,132 | |
| Diversified Financial Services - 0.9% | |||
| Berkshire Hathaway, Inc. Class B (a) | 46,800 | 12,777,336 | |
| TOTAL FINANCIALS | 192,923,785 | ||
| HEALTH CARE - 14.0% | |||
| Health Care Equipment & Supplies - 2.5% | |||
| Abbott Laboratories | 24,900 | 2,705,385 | |
| Boston Scientific Corp. (a) | 547,424 | 20,402,492 | |
| Koninklijke Philips Electronics NV (depositary receipt) (NY Reg.) | 119,912 | 2,581,705 | |
| Medtronic PLC | 84,696 | 7,601,466 | |
| 33,291,048 | |||
| Health Care Providers & Services - 3.3% | |||
| Cigna Corp. | 43,162 | 11,374,050 | |
| Humana, Inc. | 5,000 | 2,340,350 | |
| UnitedHealth Group, Inc. | 60,298 | 30,970,862 | |
| 44,685,262 | |||
| Life Sciences Tools & Services - 0.8% | |||
| Danaher Corp. | 39,310 | 9,965,871 | |
| Pharmaceuticals - 7.4% | |||
| Bayer AG | 151,418 | 9,042,138 | |
| Bristol-Myers Squibb Co. | 324,699 | 25,001,823 | |
| Eli Lilly & Co. | 27,500 | 8,916,325 | |
| GSK PLC sponsored ADR | 367,833 | 16,011,770 | |
| Johnson & Johnson | 142,513 | 25,297,483 | |
| Roche Holding AG (participation certificate) | 13,298 | 4,445,519 | |
| Sanofi SA sponsored ADR | 196,973 | 9,854,559 | |
| 98,569,617 | |||
| TOTAL HEALTH CARE | 186,511,798 | ||
| INDUSTRIALS - 12.7% | |||
| Aerospace & Defense - 3.5% | |||
| Airbus Group NV | 121,900 | 11,923,026 | |
| Raytheon Technologies Corp. | 125,530 | 12,064,688 | |
| The Boeing Co. (a) | 170,100 | 23,256,072 | |
| 47,243,786 | |||
| Air Freight & Logistics - 1.9% | |||
| FedEx Corp. | 4,200 | 952,182 | |
| United Parcel Service, Inc. Class B | 132,679 | 24,219,225 | |
| 25,171,407 | |||
| Building Products - 0.0% | |||
| Johnson Controls International PLC | 8,500 | 406,980 | |
| Electrical Equipment - 0.4% | |||
| Rockwell Automation, Inc. | 24,200 | 4,823,302 | |
| Industrial Conglomerates - 5.4% | |||
| General Electric Co. | 1,124,904 | 71,622,638 | |
| Machinery - 1.5% | |||
| Caterpillar, Inc. | 59,200 | 10,582,592 | |
| Deere & Co. | 25,500 | 7,636,485 | |
| Epiroc AB (B Shares) | 117,200 | 1,583,327 | |
| 19,802,404 | |||
| TOTAL INDUSTRIALS | 169,070,517 | ||
| INFORMATION TECHNOLOGY - 19.3% | |||
| IT Services - 3.7% | |||
| Fidelity National Information Services, Inc. | 52,900 | 4,849,343 | |
| Fiserv, Inc. (a) | 23,000 | 2,046,310 | |
| IBM Corp. | 1,100 | 155,309 | |
| Kyndryl Holdings, Inc. (a) | 220 | 2,152 | |
| MasterCard, Inc. Class A | 24,252 | 7,651,021 | |
| PayPal Holdings, Inc. (a) | 50,600 | 3,533,904 | |
| Twilio, Inc. Class A (a) | 32,200 | 2,698,682 | |
| Visa, Inc. Class A | 143,688 | 28,290,730 | |
| 49,227,451 | |||
| Semiconductors & Semiconductor Equipment - 3.5% | |||
| Applied Materials, Inc. | 133,574 | 12,152,563 | |
| ASML Holding NV | 5,136 | 2,444,120 | |
| Intel Corp. | 175,000 | 6,546,750 | |
| Lam Research Corp. | 20,100 | 8,565,615 | |
| NVIDIA Corp. | 3,200 | 485,088 | |
| Qualcomm, Inc. | 130,716 | 16,697,662 | |
| 46,891,798 | |||
| Software - 7.4% | |||
| Adobe, Inc. (a) | 9,700 | 3,550,782 | |
| Microsoft Corp. | 327,466 | 84,103,093 | |
| Salesforce.com, Inc. (a) | 15,100 | 2,492,104 | |
| SAP SE sponsored ADR | 87,800 | 7,965,216 | |
| 98,111,195 | |||
| Technology Hardware, Storage & Peripherals - 4.7% | |||
| Apple, Inc. | 463,042 | 63,307,102 | |
| TOTAL INFORMATION TECHNOLOGY | 257,537,546 | ||
| MATERIALS - 3.0% | |||
| Chemicals - 0.7% | |||
| DuPont de Nemours, Inc. | 146,528 | 8,144,026 | |
| Linde PLC | 4,500 | 1,293,885 | |
| 9,437,911 | |||
| Metals & Mining - 2.3% | |||
| Freeport-McMoRan, Inc. | 768,000 | 22,471,680 | |
| Glencore Xstrata PLC | 1,388,500 | 7,520,722 | |
| 29,992,402 | |||
| TOTAL MATERIALS | 39,430,313 | ||
| REAL ESTATE - 0.6% | |||
| Equity Real Estate Investment Trusts (REITs) - 0.6% | |||
| American Tower Corp. | 8,500 | 2,172,515 | |
| Simon Property Group, Inc. | 67,900 | 6,445,068 | |
| 8,617,583 | |||
| UTILITIES - 0.1% | |||
| Electric Utilities - 0.1% | |||
| NextEra Energy, Inc. | 4,000 | 309,840 | |
| Southern Co. | 17,800 | 1,269,318 | |
| 1,579,158 | |||
| TOTAL COMMON STOCKS | |||
| (Cost $944,398,873) | 1,309,712,687 | ||
| Other - 0.2% | |||
| Energy - 0.2% | |||
| Oil, Gas & Consumable Fuels - 0.2% | |||
| Utica Shale Drilling Program (non-operating revenue interest) (c)(d)(e) | |||
| (Cost $9,242,241) | 9,242,241 | 2,873,413 | |
| Money Market Funds - 1.8% | |||
| Fidelity Cash Central Fund 1.58% (f) | |||
| (Cost $23,229,078) | 23,224,433 | 23,229,078 | |
| TOTAL INVESTMENT IN SECURITIES - 100.0% | |||
| (Cost $976,870,192) | 1,335,815,178 | ||
| NET OTHER ASSETS (LIABILITIES) - 0.0% | 366,355 | ||
| NET ASSETS - 100% | $1,336,181,533 |
| Written Options | ||||||
| Counterparty | Number of Contracts | Notional Amount | Exercise Price | Expiration Date | Value | |
| Call Options | ||||||
| Hess Corp. | Chicago Board Options Exchange | 200 | $2,118,800 | $125.00 | 8/19/22 | $(45,500) |
Legend
(a) Non-income producing
(b) Security or a portion of the security is pledged as collateral for call options written. At period end, the value of securities pledged amounted to $2,118,800.
(c) Investment is owned by a wholly-owned subsidiary (Subsidiary) that is treated as a corporation for U.S. tax purposes.
(d) Restricted securities (including private placements) - Investment in securities not registered under the Securities Act of 1933 (excluding 144A issues). At the end of the period, the value of restricted securities (excluding 144A issues) amounted to $2,873,413 or 0.2% of net assets.
(e) Level 3 security
(f) Affiliated fund that is generally available only to investment companies and other accounts managed by Fidelity Investments. The rate quoted is the annualized seven-day yield of the fund at period end. A complete unaudited listing of the fund's holdings as of its most recent quarter end is available upon request. In addition, each Fidelity Central Fund's financial statements, which are not covered by the Fund's Report of Independent Registered Public Accounting Firm, are available on the SEC's website or upon request.
Additional information on each restricted holding is as follows:
| Security | Acquisition Date | Acquisition Cost |
| Utica Shale Drilling Program (non-operating revenue interest) | 10/5/16 - 9/1/17 | $9,242,241 |
Affiliated Central Funds
Fiscal year to date information regarding the Fund's investments in Fidelity Central Funds, including the ownership percentage, is presented below.
| Fund | Value, beginning of period | Purchases | Sales Proceeds | Dividend Income | Realized Gain/Loss | Change in Unrealized appreciation (depreciation) | Value, end of period | % ownership, end of period |
| Fidelity Cash Central Fund 1.58% | $72,643,657 | $214,033,380 | $263,447,959 | $99,619 | $-- | $-- | $23,229,078 | 0.0% |
| Fidelity Securities Lending Cash Central Fund 1.58% | 23,456,173 | 251,010,570 | 274,466,743 | 1,333,585 | -- | -- | -- | 0.0% |
| Total | $96,099,830 | $465,043,950 | $537,914,702 | $1,433,204 | $-- | $-- | $23,229,078 |
Amounts in the income column in the above table include any capital gain distributions from underlying funds, which are presented in the corresponding line-item in the Statement of Operations, if applicable. Amount for Fidelity Securities Lending Cash Central Fund represents the income earned on investing cash collateral, less rebates paid to borrowers and any lending agent fees associated with the loan, plus any premium payments received for lending certain types of securities.
Investment Valuation
The following is a summary of the inputs used, as of June 30, 2022, involving the Fund's assets and liabilities carried at fair value. The inputs or methodology used for valuing securities may not be an indication of the risk associated with investing in those securities. For more information on valuation inputs, and their aggregation into the levels used below, please refer to the Investment Valuation section in the accompanying Notes to Financial Statements.
| Valuation Inputs at Reporting Date: | ||||
| Description | Total | Level 1 | Level 2 | Level 3 |
| Investments in Securities: | ||||
| Equities: | ||||
| Communication Services | $161,341,257 | $152,355,118 | $8,986,139 | $-- |
| Consumer Discretionary | 56,734,115 | 56,734,115 | -- | -- |
| Consumer Staples | 67,359,490 | 46,946,612 | 20,412,878 | -- |
| Energy | 168,607,125 | 168,607,125 | -- | -- |
| Financials | 192,923,785 | 192,923,785 | -- | -- |
| Health Care | 186,511,798 | 173,024,141 | 13,487,657 | -- |
| Industrials | 169,070,517 | 157,147,491 | 11,923,026 | -- |
| Information Technology | 257,537,546 | 257,537,546 | -- | -- |
| Materials | 39,430,313 | 31,909,591 | 7,520,722 | -- |
| Real Estate | 8,617,583 | 8,617,583 | -- | -- |
| Utilities | 1,579,158 | 1,579,158 | -- | -- |
| Other | 2,873,413 | -- | -- | 2,873,413 |
| Money Market Funds | 23,229,078 | 23,229,078 | -- | -- |
| Total Investments in Securities: | $1,335,815,178 | $1,270,611,343 | $62,330,422 | $2,873,413 |
| Derivative Instruments: | ||||
| Liabilities | ||||
| Written Options | $(45,500) | $(45,500) | $-- | $-- |
| Total Liabilities | $(45,500) | $(45,500) | $-- | $-- |
| Total Derivative Instruments: | $(45,500) | $(45,500) | $-- | $-- |
Value of Derivative Instruments
The following table is a summary of the Fund's value of derivative instruments by primary risk exposure as of June 30, 2022. For additional information on derivative instruments, please refer to the Derivative Instruments section in the accompanying Notes to Financial Statements.
| Primary Risk Exposure / Derivative Type | Value | |
| Asset | Liability | |
| Equity Risk | ||
| Written Options(a) | $0 | $(45,500) |
| Total Equity Risk | 0 | (45,500) |
| Total Value of Derivatives | $0 | $(45,500) |
(a) Gross value is presented in the Statement of Assets and Liabilities in the written options, at value line-item.
See accompanying notes which are an integral part of the financial statements.
Financial Statements
Statement of Assets and Liabilities
| June 30, 2022 | ||
| Assets | ||
| Investment in securities, at value — See accompanying schedule: Unaffiliated issuers (cost $953,641,114) | $1,312,586,100 | |
| Fidelity Central Funds (cost $23,229,078) | 23,229,078 | |
| Total Investment in Securities (cost $976,870,192) | $1,335,815,178 | |
| Cash | 38,785 | |
| Restricted cash | 158,602 | |
| Receivable for investments sold | 141,670 | |
| Receivable for fund shares sold | 1,243,868 | |
| Dividends receivable | 1,989,863 | |
| Distributions receivable from Fidelity Central Funds | 27,114 | |
| Other receivables | 4,899 | |
| Total assets | 1,339,419,979 | |
| Liabilities | ||
| Payable for investments purchased | $392,870 | |
| Payable for fund shares redeemed | 2,004,718 | |
| Accrued management fee | 500,417 | |
| Transfer agent fee payable | 162,560 | |
| Distribution and service plan fees payable | 48,204 | |
| Written options, at value (premium received $132,304) | 45,500 | |
| Other affiliated payables | 32,883 | |
| Other payables and accrued expenses | 51,294 | |
| Total liabilities | 3,238,446 | |
| Net Assets | $1,336,181,533 | |
| Net Assets consist of: | ||
| Paid in capital | $942,908,855 | |
| Total accumulated earnings (loss) | 393,272,678 | |
| Net Assets | $1,336,181,533 | |
| Net Asset Value and Maximum Offering Price | ||
| Class A: | ||
| Net Asset Value and redemption price per share ($88,063,539 ÷ 5,456,858 shares)(a) | $16.14 | |
| Maximum offering price per share (100/94.25 of $16.14) | $17.12 | |
| Class M: | ||
| Net Asset Value and redemption price per share ($25,616,757 ÷ 1,588,606 shares)(a) | $16.13 | |
| Maximum offering price per share (100/96.50 of $16.13) | $16.72 | |
| Class C: | ||
| Net Asset Value and offering price per share ($20,254,610 ÷ 1,287,066 shares)(a) | $15.74 | |
| Mega Cap Stock: | ||
| Net Asset Value, offering price and redemption price per share ($927,216,526 ÷ 56,473,238 shares) | $16.42 | |
| Class I: | ||
| Net Asset Value, offering price and redemption price per share ($52,884,064 ÷ 3,215,291 shares) | $16.45 | |
| Class Z: | ||
| Net Asset Value, offering price and redemption price per share ($222,146,037 ÷ 13,609,103 shares) | $16.32 |
(a) Redemption price per share is equal to net asset value less any applicable contingent deferred sales charge.
See accompanying notes which are an integral part of the financial statements.
Statement of Operations
| Year ended June 30, 2022 | ||
| Investment Income | ||
| Dividends | $28,469,754 | |
| Income from Fidelity Central Funds (including $1,333,585 from security lending) | 1,433,204 | |
| Income before foreign taxes withheld | 29,902,958 | |
| Less foreign taxes withheld | (2,825,301) | |
| Total income | 27,077,657 | |
| Expenses | ||
| Management fee | $6,877,818 | |
| Transfer agent fees | 2,042,498 | |
| Distribution and service plan fees | 632,434 | |
| Accounting fees | 498,199 | |
| Custodian fees and expenses | 32,833 | |
| Independent trustees' fees and expenses | 5,693 | |
| Registration fees | 151,261 | |
| Audit | 62,085 | |
| Legal | 3,662 | |
| Interest | 1,803 | |
| Miscellaneous | 6,086 | |
| Total expenses before reductions | 10,314,372 | |
| Expense reductions | (47,476) | |
| Total expenses after reductions | 10,266,896 | |
| Net investment income (loss) | 16,810,761 | |
| Realized and Unrealized Gain (Loss) | ||
| Net realized gain (loss) on: | ||
| Investment securities: | ||
| Unaffiliated issuers | 58,996,736 | |
| Foreign currency transactions | 53,207 | |
| Written options | 916,379 | |
| Total net realized gain (loss) | 59,966,322 | |
| Change in net unrealized appreciation (depreciation) on: | ||
| Investment securities: | ||
| Unaffiliated issuers | (243,471,087) | |
| Assets and liabilities in foreign currencies | (42,864) | |
| Written options | 44,582 | |
| Total change in net unrealized appreciation (depreciation) | (243,469,369) | |
| Net gain (loss) | (183,503,047) | |
| Net increase (decrease) in net assets resulting from operations | $(166,692,286) |
See accompanying notes which are an integral part of the financial statements.
Statement of Changes in Net Assets
| Year ended June 30, 2022 | Year ended June 30, 2021 | |
| Increase (Decrease) in Net Assets | ||
| Operations | ||
| Net investment income (loss) | $16,810,761 | $16,088,163 |
| Net realized gain (loss) | 59,966,322 | 103,234,688 |
| Change in net unrealized appreciation (depreciation) | (243,469,369) | 407,842,130 |
| Net increase (decrease) in net assets resulting from operations | (166,692,286) | 527,164,981 |
| Distributions to shareholders | (82,065,696) | (99,856,135) |
| Share transactions - net increase (decrease) | (79,071,772) | 128,626,186 |
| Total increase (decrease) in net assets | (327,829,754) | 555,935,032 |
| Net Assets | ||
| Beginning of period | 1,664,011,287 | 1,108,076,255 |
| End of period | $1,336,181,533 | $1,664,011,287 |
See accompanying notes which are an integral part of the financial statements.
Financial Highlights
Fidelity Mega Cap Stock Fund Class A
| Years ended June 30, | 2022 | 2021 | 2020 | 2019 | 2018 |
| Selected Per–Share Data | |||||
| Net asset value, beginning of period | $19.05 | $13.83 | $15.51 | $17.34 | $18.42 |
| Income from Investment Operations | |||||
| Net investment income (loss)A,B | .14 | .15 | .22 | .29 | .23 |
| Net realized and unrealized gain (loss) | (2.17) | 6.31 | .08 | .77 | 1.49 |
| Total from investment operations | (2.03) | 6.46 | .30 | 1.06 | 1.72 |
| Distributions from net investment income | (.29) | (.24) | (.27) | (.26) | (.24) |
| Distributions from net realized gain | (.59) | (1.00) | (1.70) | (2.63) | (2.56) |
| Total distributions | (.88) | (1.24) | (1.98)C | (2.89) | (2.80) |
| Net asset value, end of period | $16.14 | $19.05 | $13.83 | $15.51 | $17.34 |
| Total ReturnD,E | (11.25)%F | 49.60% | 1.78% | 6.99% | 10.60% |
| Ratios to Average Net AssetsB,G,H | |||||
| Expenses before reductions | .90% | .91% | .93% | .93% | .93% |
| Expenses net of fee waivers, if any | .89% | .91% | .93% | .93% | .93% |
| Expenses net of all reductions | .89% | .91% | .92% | .93% | .93% |
| Net investment income (loss) | .78% | .95% | 1.56% | 1.88% | 1.33% |
| Supplemental Data | |||||
| Net assets, end of period (000 omitted) | $88,064 | $87,302 | $54,948 | $64,311 | $62,333 |
| Portfolio turnover rateI | 13% | 43% | 49%J | 36% | 39% |
A Calculated based on average shares outstanding during the period.
B Net investment income (loss) is affected by the timing of the declaration of dividends by any underlying mutual funds or exchange-traded funds (ETFs). Net investment income (loss) of any such underlying funds is not included in the Fund's net investment income (loss) ratio.
C Total distributions per share do not sum due to rounding.
D Total returns would have been lower if certain expenses had not been reduced during the applicable periods shown.
E Total returns do not include the effect of the sales charges.
F Amount includes a reimbursement from the investment adviser for an operational error which amounted to less than $.01 per share. Excluding this reimbursement, the total return would have been (11.29) %.
G Fees and expenses of any underlying mutual funds or exchange-traded funds (ETFs) are not included in the Fund's expense ratio. The Fund indirectly bears its proportionate share of these expenses. For additional expense information related to investments in Fidelity Central Funds, please refer to the "Investments in Fidelity Central Funds" note found in the Notes to Financial Statements section of the most recent Annual or Semi-Annual report.
H Expense ratios reflect operating expenses of the class. Expenses before reductions do not reflect amounts reimbursed, waived, or reduced through arrangements with the investment adviser, brokerage services, or other offset arrangements, if applicable, and do not represent the amount paid by the class during periods when reimbursements, waivers or reductions occur.
I Amount does not include the portfolio activity of any underlying mutual funds or exchange-traded funds (ETFs).
J Portfolio turnover rate excludes securities received or delivered in-kind.
See accompanying notes which are an integral part of the financial statements.
Fidelity Mega Cap Stock Fund Class M
| Years ended June 30, | 2022 | 2021 | 2020 | 2019 | 2018 |
| Selected Per–Share Data | |||||
| Net asset value, beginning of period | $19.03 | $13.82 | $15.50 | $17.31 | $18.39 |
| Income from Investment Operations | |||||
| Net investment income (loss)A,B | .10 | .11 | .19 | .25 | .19 |
| Net realized and unrealized gain (loss) | (2.17) | 6.31 | .06 | .78 | 1.48 |
| Total from investment operations | (2.07) | 6.42 | .25 | 1.03 | 1.67 |
| Distributions from net investment income | (.24) | (.20) | (.23) | (.21) | (.19) |
| Distributions from net realized gain | (.59) | (1.00) | (1.70) | (2.63) | (2.56) |
| Total distributions | (.83) | (1.21)C | (1.93) | (2.84) | (2.75) |
| Net asset value, end of period | $16.13 | $19.03 | $13.82 | $15.50 | $17.31 |
| Total ReturnD,E | (11.45)%F | 49.19% | 1.50% | 6.79% | 10.33% |
| Ratios to Average Net AssetsB,G,H | |||||
| Expenses before reductions | 1.15% | 1.17% | 1.18% | 1.19% | 1.19% |
| Expenses net of fee waivers, if any | 1.15% | 1.17% | 1.18% | 1.19% | 1.19% |
| Expenses net of all reductions | 1.15% | 1.16% | 1.18% | 1.18% | 1.18% |
| Net investment income (loss) | .52% | .69% | 1.31% | 1.63% | 1.07% |
| Supplemental Data | |||||
| Net assets, end of period (000 omitted) | $25,617 | $28,266 | $21,208 | $25,031 | $26,446 |
| Portfolio turnover rateI | 13% | 43% | 49%J | 36% | 39% |
A Calculated based on average shares outstanding during the period.
B Net investment income (loss) is affected by the timing of the declaration of dividends by any underlying mutual funds or exchange-traded funds (ETFs). Net investment income (loss) of any such underlying funds is not included in the Fund's net investment income (loss) ratio.
C Total distributions per share do not sum due to rounding.
D Total returns would have been lower if certain expenses had not been reduced during the applicable periods shown.
E Total returns do not include the effect of the sales charges.
F Amount includes a reimbursement from the investment adviser for an operational error which amounted to less than $.01 per share. Excluding this reimbursement, the total return would have been (11.49) %.
G Fees and expenses of any underlying mutual funds or exchange-traded funds (ETFs) are not included in the Fund's expense ratio. The Fund indirectly bears its proportionate share of these expenses. For additional expense information related to investments in Fidelity Central Funds, please refer to the "Investments in Fidelity Central Funds" note found in the Notes to Financial Statements section of the most recent Annual or Semi-Annual report.
H Expense ratios reflect operating expenses of the class. Expenses before reductions do not reflect amounts reimbursed, waived, or reduced through arrangements with the investment adviser, brokerage services, or other offset arrangements, if applicable, and do not represent the amount paid by the class during periods when reimbursements, waivers or reductions occur.
I Amount does not include the portfolio activity of any underlying mutual funds or exchange-traded funds (ETFs).
J Portfolio turnover rate excludes securities received or delivered in-kind.
See accompanying notes which are an integral part of the financial statements.
Fidelity Mega Cap Stock Fund Class C
| Years ended June 30, | 2022 | 2021 | 2020 | 2019 | 2018 |
| Selected Per–Share Data | |||||
| Net asset value, beginning of period | $18.58 | $13.53 | $15.20 | $17.03 | $18.13 |
| Income from Investment Operations | |||||
| Net investment income (loss)A,B | –C | .03 | .11 | .17 | .10 |
| Net realized and unrealized gain (loss) | (2.12) | 6.15 | .08 | .77 | 1.47 |
| Total from investment operations | (2.12) | 6.18 | .19 | .94 | 1.57 |
| Distributions from net investment income | (.15) | (.13) | (.15) | (.13) | (.11) |
| Distributions from net realized gain | (.58) | (1.00) | (1.70) | (2.63) | (2.56) |
| Total distributions | (.72)D | (1.13) | (1.86)D | (2.77)D | (2.67) |
| Net asset value, end of period | $15.74 | $18.58 | $13.53 | $15.20 | $17.03 |
| Total ReturnE,F | (11.90)%G | 48.31% | 1.05% | 6.23% | 9.81% |
| Ratios to Average Net AssetsB,H,I | |||||
| Expenses before reductions | 1.67% | 1.69% | 1.69% | 1.68% | 1.68% |
| Expenses net of fee waivers, if any | 1.67% | 1.69% | 1.69% | 1.67% | 1.68% |
| Expenses net of all reductions | 1.67% | 1.69% | 1.69% | 1.67% | 1.68% |
| Net investment income (loss) | - %J | .17% | .80% | 1.14% | .58% |
| Supplemental Data | |||||
| Net assets, end of period (000 omitted) | $20,255 | $27,727 | $24,283 | $28,459 | $33,640 |
| Portfolio turnover rateK | 13% | 43% | 49%L | 36% | 39% |
A Calculated based on average shares outstanding during the period.
B Net investment income (loss) is affected by the timing of the declaration of dividends by any underlying mutual funds or exchange-traded funds (ETFs). Net investment income (loss) of any such underlying funds is not included in the Fund's net investment income (loss) ratio.
C Amount represents less than $.005 per share.
D Total distributions per share do not sum due to rounding.
E Total returns would have been lower if certain expenses had not been reduced during the applicable periods shown.
F Total returns do not include the effect of the contingent deferred sales charge.
G Amount includes a reimbursement from the investment adviser for an operational error which amounted to less than $.01 per share. Excluding this reimbursement, the total return would have been (11.94) %.
H Fees and expenses of any underlying mutual funds or exchange-traded funds (ETFs) are not included in the Fund's expense ratio. The Fund indirectly bears its proportionate share of these expenses. For additional expense information related to investments in Fidelity Central Funds, please refer to the "Investments in Fidelity Central Funds" note found in the Notes to Financial Statements section of the most recent Annual or Semi-Annual report.
I Expense ratios reflect operating expenses of the class. Expenses before reductions do not reflect amounts reimbursed, waived, or reduced through arrangements with the investment adviser, brokerage services, or other offset arrangements, if applicable, and do not represent the amount paid by the class during periods when reimbursements, waivers or reductions occur.
J Amount represents less than .005% per share.
K Amount does not include the portfolio activity of any underlying mutual funds or exchange-traded funds (ETFs).
L Portfolio turnover rate excludes securities received or delivered in-kind.
See accompanying notes which are an integral part of the financial statements.
Fidelity Mega Cap Stock Fund
| Years ended June 30, | 2022 | 2021 | 2020 | 2019 | 2018 |
| Selected Per–Share Data | |||||
| Net asset value, beginning of period | $19.36 | $14.04 | $15.71 | $17.52 | $18.58 |
| Income from Investment Operations | |||||
| Net investment income (loss)A,B | .20 | .20 | .27 | .34 | .28 |
| Net realized and unrealized gain (loss) | (2.21) | 6.40 | .07 | .78 | 1.50 |
| Total from investment operations | (2.01) | 6.60 | .34 | 1.12 | 1.78 |
| Distributions from net investment income | (.34) | (.28) | (.31) | (.30) | (.27) |
| Distributions from net realized gain | (.59) | (1.00) | (1.70) | (2.63) | (2.56) |
| Total distributions | (.93) | (1.28) | (2.01) | (2.93) | (2.84)C |
| Net asset value, end of period | $16.42 | $19.36 | $14.04 | $15.71 | $17.52 |
| Total ReturnD | (10.99)%E | 49.96% | 2.09% | 7.33% | 10.86% |
| Ratios to Average Net AssetsB,F,G | |||||
| Expenses before reductions | .61% | .63% | .65% | .65% | .68% |
| Expenses net of fee waivers, if any | .61% | .63% | .64% | .65% | .68% |
| Expenses net of all reductions | .61% | .63% | .64% | .65% | .68% |
| Net investment income (loss) | 1.06% | 1.23% | 1.84% | 2.16% | 1.58% |
| Supplemental Data | |||||
| Net assets, end of period (000 omitted) | $927,217 | $1,166,988 | $773,080 | $1,488,549 | $1,715,822 |
| Portfolio turnover rateH | 13% | 43% | 49%I | 36% | 39% |
A Calculated based on average shares outstanding during the period.
B Net investment income (loss) is affected by the timing of the declaration of dividends by any underlying mutual funds or exchange-traded funds (ETFs). Net investment income (loss) of any such underlying funds is not included in the Fund's net investment income (loss) ratio.
C Total distributions per share do not sum due to rounding.
D Total returns would have been lower if certain expenses had not been reduced during the applicable periods shown.
E Amount includes a reimbursement from the investment adviser for an operational error which amounted to less than $.01 per share. Excluding this reimbursement, the total return would have been (11.03) %.
F Fees and expenses of any underlying mutual funds or exchange-traded funds (ETFs) are not included in the Fund's expense ratio. The Fund indirectly bears its proportionate share of these expenses. For additional expense information related to investments in Fidelity Central Funds, please refer to the "Investments in Fidelity Central Funds" note found in the Notes to Financial Statements section of the most recent Annual or Semi-Annual report.
G Expense ratios reflect operating expenses of the class. Expenses before reductions do not reflect amounts reimbursed, waived, or reduced through arrangements with the investment adviser, brokerage services, or other offset arrangements, if applicable, and do not represent the amount paid by the class during periods when reimbursements, waivers or reductions occur.
H Amount does not include the portfolio activity of any underlying mutual funds or exchange-traded funds (ETFs).
I Portfolio turnover rate excludes securities received or delivered in-kind.
See accompanying notes which are an integral part of the financial statements.
Fidelity Mega Cap Stock Fund Class I
| Years ended June 30, | 2022 | 2021 | 2020 | 2019 | 2018 |
| Selected Per–Share Data | |||||
| Net asset value, beginning of period | $19.39 | $14.07 | $15.72 | $17.53 | $18.60 |
| Income from Investment Operations | |||||
| Net investment income (loss)A,B | .19 | .20 | .27 | .34 | .28 |
| Net realized and unrealized gain (loss) | (2.21) | 6.42 | .06 | .79 | 1.50 |
| Total from investment operations | (2.02) | 6.62 | .33 | 1.13 | 1.78 |
| Distributions from net investment income | (.34) | (.29) | (.28) | (.30) | (.29) |
| Distributions from net realized gain | (.59) | (1.00) | (1.70) | (2.63) | (2.56) |
| Total distributions | (.92)C | (1.30)C | (1.98) | (2.94)C | (2.85) |
| Net asset value, end of period | $16.45 | $19.39 | $14.07 | $15.72 | $17.53 |
| Total ReturnD | (11.00)%E | 49.97% | 2.04% | 7.33% | 10.87% |
| Ratios to Average Net AssetsB,F,G | |||||
| Expenses before reductions | .65% | .65% | .66% | .66% | .67% |
| Expenses net of fee waivers, if any | .64% | .65% | .66% | .66% | .67% |
| Expenses net of all reductions | .64% | .64% | .65% | .66% | .66% |
| Net investment income (loss) | 1.03% | 1.21% | 1.83% | 2.15% | 1.60% |
| Supplemental Data | |||||
| Net assets, end of period (000 omitted) | $52,884 | $39,876 | $20,725 | $147,465 | $143,472 |
| Portfolio turnover rateH | 13% | 43% | 49%I | 36% | 39% |
A Calculated based on average shares outstanding during the period.
B Net investment income (loss) is affected by the timing of the declaration of dividends by any underlying mutual funds or exchange-traded funds (ETFs). Net investment income (loss) of any such underlying funds is not included in the Fund's net investment income (loss) ratio.
C Total distributions per share do not sum due to rounding.
D Total returns would have been lower if certain expenses had not been reduced during the applicable periods shown.
E Amount includes a reimbursement from the investment adviser for an operational error which amounted to less than $.01 per share. Excluding this reimbursement, the total return would have been (11.04) %.
F Fees and expenses of any underlying mutual funds or exchange-traded funds (ETFs) are not included in the Fund's expense ratio. The Fund indirectly bears its proportionate share of these expenses. For additional expense information related to investments in Fidelity Central Funds, please refer to the "Investments in Fidelity Central Funds" note found in the Notes to Financial Statements section of the most recent Annual or Semi-Annual report.
G Expense ratios reflect operating expenses of the class. Expenses before reductions do not reflect amounts reimbursed, waived, or reduced through arrangements with the investment adviser, brokerage services, or other offset arrangements, if applicable, and do not represent the amount paid by the class during periods when reimbursements, waivers or reductions occur.
H Amount does not include the portfolio activity of any underlying mutual funds or exchange-traded funds (ETFs).
I Portfolio turnover rate excludes securities received or delivered in-kind.
See accompanying notes which are an integral part of the financial statements.
Fidelity Mega Cap Stock Fund Class Z
| Years ended June 30, | 2022 | 2021 | 2020 | 2019 | 2018 |
| Selected Per–Share Data | |||||
| Net asset value, beginning of period | $19.25 | $13.97 | $15.65 | $17.46 | $18.53 |
| Income from Investment Operations | |||||
| Net investment income (loss)A,B | .22 | .22 | .28 | .35 | .30 |
| Net realized and unrealized gain (loss) | (2.20) | 6.36 | .08 | .79 | 1.51 |
| Total from investment operations | (1.98) | 6.58 | .36 | 1.14 | 1.81 |
| Distributions from net investment income | (.36) | (.30) | (.33) | (.32) | (.31) |
| Distributions from net realized gain | (.59) | (1.00) | (1.70) | (2.63) | (2.56) |
| Total distributions | (.95) | (1.30) | (2.04)C | (2.95) | (2.88)C |
| Net asset value, end of period | $16.32 | $19.25 | $13.97 | $15.65 | $17.46 |
| Total ReturnD | (10.92)%E | 50.14% | 2.18% | 7.47% | 11.09% |
| Ratios to Average Net AssetsB,F,G | |||||
| Expenses before reductions | .51% | .52% | .53% | .53% | .53% |
| Expenses net of fee waivers, if any | .51% | .52% | .52% | .53% | .53% |
| Expenses net of all reductions | .51% | .52% | .52% | .53% | .53% |
| Net investment income (loss) | 1.16% | 1.34% | 1.96% | 2.29% | 1.73% |
| Supplemental Data | |||||
| Net assets, end of period (000 omitted) | $222,146 | $313,854 | $213,832 | $193,889 | $81,817 |
| Portfolio turnover rateH | 13% | 43% | 49%I | 36% | 39% |
A Calculated based on average shares outstanding during the period.
B Net investment income (loss) is affected by the timing of the declaration of dividends by any underlying mutual funds or exchange-traded funds (ETFs). Net investment income (loss) of any such underlying funds is not included in the Fund's net investment income (loss) ratio.
C Total distributions per share do not sum due to rounding.
D Total returns would have been lower if certain expenses had not been reduced during the applicable periods shown.
E Amount includes a reimbursement from the investment adviser for an operational error which amounted to less than $.01 per share. Excluding this reimbursement, the total return would have been (10.96) %.
F Fees and expenses of any underlying mutual funds or exchange-traded funds (ETFs) are not included in the Fund's expense ratio. The Fund indirectly bears its proportionate share of these expenses. For additional expense information related to investments in Fidelity Central Funds, please refer to the "Investments in Fidelity Central Funds" note found in the Notes to Financial Statements section of the most recent Annual or Semi-Annual report.
G Expense ratios reflect operating expenses of the class. Expenses before reductions do not reflect amounts reimbursed, waived, or reduced through arrangements with the investment adviser, brokerage services, or other offset arrangements, if applicable, and do not represent the amount paid by the class during periods when reimbursements, waivers or reductions occur.
H Amount does not include the portfolio activity of any underlying mutual funds or exchange-traded funds (ETFs).
I Portfolio turnover rate excludes securities received or delivered in-kind.
See accompanying notes which are an integral part of the financial statements.
Notes to Financial Statements
For the period ended June 30, 2022
1. Organization.
Fidelity Mega Cap Stock Fund (the Fund) is a fund of Fidelity Hastings Street Trust (the Trust) and is authorized to issue an unlimited number of shares. The Trust is registered under the Investment Company Act of 1940, as amended (the 1940 Act), as an open-end management investment company organized as a Massachusetts business trust. The Fund offers Class A, Class M, Class C, Mega Cap Stock, Class I and Class Z shares, each of which has equal rights as to assets and voting privileges. Each class has exclusive voting rights with respect to matters that affect that class. Class C shares will automatically convert to Class A shares after a holding period of eight years from the initial date of purchase, with certain exceptions.
2. Investments in Fidelity Central Funds.
Funds may invest in Fidelity Central Funds, which are open-end investment companies generally available only to other investment companies and accounts managed by the investment adviser and its affiliates. The Schedule of Investments lists any Fidelity Central Funds held as an investment as of period end, but does not include the underlying holdings of each Fidelity Central Fund. An investing fund indirectly bears its proportionate share of the expenses of the underlying Fidelity Central Funds.
Based on its investment objective, each Fidelity Central Fund may invest or participate in various investment vehicles or strategies that are similar to those of the investing fund. These strategies are consistent with the investment objectives of the investing fund and may involve certain economic risks which may cause a decline in value of each of the Fidelity Central Funds and thus a decline in the value of the investing fund.
| Fidelity Central Fund | Investment Manager | Investment Objective | Investment Practices | Expense Ratio(a) |
| Fidelity Money Market Central Funds | Fidelity Management & Research Company LLC (FMR) | Each fund seeks to obtain a high level of current income consistent with the preservation of capital and liquidity. | Short-term Investments | Less than .005% |
(a) Expenses expressed as a percentage of average net assets and are as of each underlying Central Fund's most recent annual or semi-annual shareholder report.
A complete unaudited list of holdings for each Fidelity Central Fund is available upon request or at the Securities and Exchange Commission website at www.sec.gov. In addition, the financial statements of the Fidelity Central Funds which contain the significant accounting policies (including investment valuation policies) of those funds, and are not covered by the Report of Independent Registered Public Accounting Firm, are available on the Securities and Exchange Commission website or upon request.
3. Significant Accounting Policies.
The Fund is an investment company and applies the accounting and reporting guidance of the Financial Accounting Standards Board (FASB) Accounting Standards Codification Topic 946 Financial Services - Investment Companies. The financial statements have been prepared in conformity with accounting principles generally accepted in the United States of America (GAAP), which require management to make certain estimates and assumptions at the date of the financial statements. Actual results could differ from those estimates. Subsequent events, if any, through the date that the financial statements were issued have been evaluated in the preparation of the financial statements. The Fund's Schedule of Investments lists any underlying mutual funds or exchange-traded funds (ETFs) but does not include the underlying holdings of these funds. The following summarizes the significant accounting policies of the Fund:
Investment Valuation. Investments are valued as of 4:00 p.m. Eastern time on the last calendar day of the period. The Board of Trustees (the Board) has delegated the day to day responsibility for the valuation of the Fund's investments to the Fair Value Committee (the Committee) established by the Fund's investment adviser. In accordance with valuation policies and procedures approved by the Board, the Fund attempts to obtain prices from one or more third party pricing vendors or brokers to value its investments. When current market prices, quotations or currency exchange rates are not readily available or reliable, investments will be fair valued in good faith by the Committee, in accordance with procedures adopted by the Board. Factors used in determining fair value vary by investment type and may include market or investment specific events. The frequency with which these procedures are used cannot be predicted and they may be utilized to a significant extent. The Committee oversees the Fund's valuation policies and procedures and reports to the Board on the Committee's activities and fair value determinations. The Board monitors the appropriateness of the procedures used in valuing the Fund's investments and ratifies the fair value determinations of the Committee.
The Fund categorizes the inputs to valuation techniques used to value its investments into a disclosure hierarchy consisting of three levels as shown below:
- Level 1 – unadjusted quoted prices in active markets for identical investments
- Level 2 – other significant observable inputs (including quoted prices for similar investments, interest rates, prepayment speeds, etc.)
- Level 3 – unobservable inputs (including the Fund's own assumptions based on the best information available)
Valuation techniques used to value the Fund's investments by major category are as follows:
Equity securities, including restricted securities, for which market quotations are readily available, are valued at the last reported sale price or official closing price as reported by a third party pricing vendor on the primary market or exchange on which they are traded and are categorized as Level 1 in the hierarchy. In the event there were no sales during the day or closing prices are not available, securities are valued at the last quoted bid price or may be valued using the last available price and are generally categorized as Level 2 in the hierarchy. For foreign equity securities, when market or security specific events arise, comparisons to the valuation of American Depositary Receipts (ADRs), futures contracts, ETFs and certain indexes as well as quoted prices for similar securities may be used and would be categorized as Level 2 in the hierarchy. For equity securities, including restricted securities, where observable inputs are limited, assumptions about market activity and risk are used and these securities may be categorized as Level 3 in the hierarchy.
Exchange-traded options are valued using the last sale price or, in the absence of a sale, the last offering price and are categorized as Level 1 in the hierarchy. Investments in open-end mutual funds, including the Fidelity Central Funds, are valued at their closing net asset value (NAV) each business day and are categorized as Level 1 in the hierarchy.
Changes in valuation techniques may result in transfers in or out of an assigned level within the disclosure hierarchy. The aggregate value of investments by input level as of June 30, 2022 is included at the end of the Fund's Schedule of Investments.
Foreign Currency. Certain Funds may use foreign currency contracts to facilitate transactions in foreign-denominated securities. Gains and losses from these transactions may arise from changes in the value of the foreign currency or if the counterparties do not perform under the contracts' terms.
Foreign-denominated assets, including investment securities, and liabilities are translated into U.S. dollars at the exchange rates at period end. Purchases and sales of investment securities, income and dividends received, and expenses denominated in foreign currencies are translated into U.S. dollars at the exchange rate in effect on the transaction date.
The effects of exchange rate fluctuations on investments are included with the net realized and unrealized gain (loss) on investment securities. Other foreign currency transactions resulting in realized and unrealized gain (loss) are disclosed separately.
Investment Transactions and Income. For financial reporting purposes, the Fund's investment holdings and NAV include trades executed through the end of the last business day of the period. The NAV per share for processing shareholder transactions is calculated as of the close of business of the New York Stock Exchange (NYSE), normally 4:00 p.m. Eastern time and includes trades executed through the end of the prior business day. Gains and losses on securities sold are determined on the basis of identified cost and include proceeds received from litigation. Commissions paid to certain brokers with whom the investment adviser, or its affiliates, places trades on behalf of a fund include an amount in addition to trade execution, which may be rebated back to a fund. Any such rebates are included in net realized gain (loss) on investments in the Statement of Operations. Dividend income is recorded on the ex-dividend date, except for certain dividends from foreign securities where the ex-dividend date may have passed, which are recorded as soon as the Fund is informed of the ex-dividend date. Non-cash dividends included in dividend income, if any, are recorded at the fair market value of the securities received. Income and capital gain distributions from Fidelity Central Funds, if any, are recorded on the ex-dividend date. Certain distributions received by the Fund represent a return of capital or capital gain. The Fund determines the components of these distributions subsequent to the ex-dividend date, based upon receipt of tax filings or other correspondence relating to the underlying investment. These distributions are recorded as a reduction of cost of investments and/or as a realized gain. Investment income is recorded net of foreign taxes withheld where recovery of such taxes is uncertain. Funds may file withholding tax reclaims in certain jurisdictions to recover a portion of amounts previously withheld. Any withholding tax reclaims income is included in the Statement of Operations in foreign taxes withheld. Any receivables for withholding tax reclaims are included in the Statement of Assets and Liabilities in dividends receivable.
Class Allocations and Expenses. Investment income, realized and unrealized capital gains and losses, common expenses of a fund, and certain fund-level expense reductions, if any, are allocated daily on a pro-rata basis to each class based on the relative net assets of each class to the total net assets of a fund. Each class differs with respect to transfer agent and distribution and service plan fees incurred, as applicable. Certain expense reductions may also differ by class, if applicable. For the reporting period, the allocated portion of income and expenses to each class as a percent of its average net assets may vary due to the timing of recording these transactions in relation to fluctuating net assets of the classes. Expenses directly attributable to a fund are charged to that fund. Expenses attributable to more than one fund are allocated among the respective funds on the basis of relative net assets or other appropriate methods. Expenses included in the accompanying financial statements reflect the expenses of that fund and do not include any expenses associated with any underlying mutual funds or exchange-traded funds. Although not included in a fund's expenses, a fund indirectly bears its proportionate share of these expenses through the net asset value of each underlying mutual fund or exchange-traded fund. Expense estimates are accrued in the period to which they relate and adjustments are made when actual amounts are known.
Income Tax Information and Distributions to Shareholders. Each year, the Fund intends to qualify as a regulated investment company under Subchapter M of the Internal Revenue Code, including distributing substantially all of its taxable income and realized gains. As a result, no provision for U.S. Federal income taxes is required. As of June 30, 2022, the Fund did not have any unrecognized tax benefits in the financial statements; nor is the Fund aware of any tax positions for which it is reasonably possible that the total amounts of unrecognized tax benefits will significantly change in the next twelve months. The Fund files a U.S. federal tax return, in addition to state and local tax returns as required. The Fund's federal income tax returns are subject to examination by the Internal Revenue Service (IRS) for a period of three fiscal years after they are filed. State and local tax returns may be subject to examination for an additional fiscal year depending on the jurisdiction. Foreign taxes are provided for based on the Fund's understanding of the tax rules and rates that exist in the foreign markets in which it invests.
Distributions are declared and recorded on the ex-dividend date. Income and capital gain distributions are declared separately for each class. Income and capital gain distributions are determined in accordance with income tax regulations, which may differ from GAAP. In addition, the Fund claimed a portion of the payment made to redeeming shareholders as a distribution for income tax purposes.
Capital accounts within the financial statements are adjusted for permanent book-tax differences. These adjustments have no impact on net assets or the results of operations. Capital accounts are not adjusted for temporary book-tax differences which will reverse in a subsequent period.
Book-tax differences are primarily due to foreign currency transactions, certain corporate actions and losses deferred due to wash sales.
As of period end, the cost and unrealized appreciation (depreciation) in securities, and derivatives if applicable, for federal income tax purposes were as follows:
| Gross unrealized appreciation | $459,485,356 |
| Gross unrealized depreciation | (112,613,134) |
| Net unrealized appreciation (depreciation) | $346,872,222 |
| Tax Cost | $988,897,456 |
The tax-based components of distributable earnings as of period end were as follows:
| Undistributed ordinary income | $9,563,706 |
| Undistributed long-term capital gain | $36,861,603 |
| Net unrealized appreciation (depreciation) on securities and other investments | $346,847,369 |
The tax character of distributions paid was as follows:
| June 30, 2022 | June 30, 2021 | |
| Ordinary Income | $48,982,782 | $ 49,602,599 |
| Long-term Capital Gains | 33,082,914 | 50,253,536 |
| Total | $82,065,696 | $ 99,856,135 |
Restricted Securities (including Private Placements). Funds may invest in securities that are subject to legal or contractual restrictions on resale. These securities generally may be resold in transactions exempt from registration or to the public if the securities are registered. Disposal of these securities may involve time-consuming negotiations and expense, and prompt sale at an acceptable price may be difficult. Information regarding restricted securities held at period end is included at the end of the Schedule of Investments, if applicable.
Consolidated Subsidiary. The Funds included in the table below hold certain investments through a wholly-owned subsidiary ("Subsidiary"), which may be subject to federal and state taxes upon disposition.
As of period end, investments in Subsidiaries were as follows:
| $ Amount | % of Net Assets | |
| Fidelity Mega Cap Stock Fund | 3,032,015 | .23 |
The financial statements have been consolidated to include the Subsidiary accounts where applicable. Accordingly, all inter-company transactions and balances have been eliminated.
At period end, any estimated tax liability for these investments is presented as "Deferred taxes" in the Statement of Assets and Liabilities and included in "Change in net unrealized appreciation (depreciation) on investment securities" in the Statement of Operations. The tax liability incurred may differ materially depending on conditions when these investments are disposed. Any cash held by a Subsidiary is restricted as to its use and is presented as "Restricted cash" in the Statement of Assets and Liabilities, if applicable.
4. Derivative Instruments.
Risk Exposures and the Use of Derivative Instruments. Investment objectives allow a fund to enter into various types of derivative contracts, including options. Derivatives are investments whose value is primarily derived from underlying assets, indices or reference rates and may be transacted on an exchange or over-the-counter (OTC). Derivatives may involve a future commitment to buy or sell a specified asset based on specified terms, to exchange future cash flows at periodic intervals based on a notional principal amount, or for one party to make one or more payments upon the occurrence of specified events in exchange for periodic payments from the other party.
Derivatives were used to increase returns and to manage exposure to certain risks as defined below. The success of any strategy involving derivatives depends on analysis of numerous economic factors, and if the strategies for investment do not work as intended, the objectives may not be achieved.
Derivatives were used to increase or decrease exposure to the following risk:
| Equity Risk | Equity risk relates to the fluctuations in the value of financial instruments as a result of changes in market prices (other than those arising from interest rate risk or foreign exchange risk), whether caused by factors specific to an individual investment, its issuer, or all factors affecting all instruments traded in a market or market segment. |
Funds are also exposed to additional risks from investing in derivatives, such as liquidity risk and counterparty credit risk. Liquidity risk is the risk that a fund will be unable to close out the derivative in the open market in a timely manner. Counterparty credit risk is the risk that the counterparty will not be able to fulfill its obligation to a fund. Exchange-traded contracts are not covered by the ISDA Master Agreement; however counterparty credit risk related to these contracts may be mitigated by the protection provided by the exchange on which they trade.
Investing in derivatives may involve greater risks than investing in the underlying assets directly and, to varying degrees, may involve risk of loss in excess of any initial investment and collateral received and amounts recognized in the Statement of Assets and Liabilities. In addition, there may be the risk that the change in value of the derivative contract does not correspond to the change in value of the underlying instrument.
Options. Options give the purchaser the right, but not the obligation, to buy (call) or sell (put) an underlying security or financial instrument at an agreed exercise or strike price between or on certain dates. Options obligate the seller (writer) to buy (put) or sell (call) an underlying instrument at the exercise or strike price or cash settle an underlying derivative instrument if the holder exercises the option on or before the expiration date.
Exchange-traded written covered call options were used to manage exposure to the market. When a fund writes a covered call option, a fund holds the underlying instrument which must be delivered to the holder upon the exercise of the option.
Upon entering into a written options contract, a fund will receive a premium. Premiums received are reflected as a liability on the Statement of Assets and Liabilities. Options are valued daily and any unrealized appreciation (depreciation) is reflected on the Statement of Assets and Liabilities. When a written option is exercised, the premium is added to the proceeds from the sale of the underlying instrument in determining the gain or loss realized on that investment. When an option is closed, a gain or loss is realized depending on whether the proceeds or amount paid for the closing sale transaction are greater or less than the premium received. When an option expires, gains and losses are realized to the extent of premiums received. The net realized gain (loss) on closed and expired written options and the change in net unrealized appreciation (depreciation) on written options are presented in the Statement of Operations.
Writing call options tends to decrease exposure to the underlying instrument and risk of loss is the change in value in excess of the premium received.
Any open options at period end are presented in the Schedule of Investments under the caption "Written Options", and are representative of volume of activity during the period unless an average notional amount is presented.
5. Purchases and Sales of Investments.
Purchases and sales of securities, other than short-term securities and in-kind transactions, as applicable, are noted in the table below.
| Purchases ($) | Sales ($) | |
| Fidelity Mega Cap Stock Fund | 202,952,752 | 282,858,953 |
6. Fees and Other Transactions with Affiliates.
Management Fee. Fidelity Management & Research Company LLC (the investment adviser) and its affiliates provide the Fund with investment management related services for which the Fund pays a monthly management fee. The management fee is the sum of an individual fund fee rate that is based on an annual rate of .20% of the Fund's average net assets and an annualized group fee rate that averaged .22% during the period. The group fee rate is based upon the monthly average net assets of a group of registered investment companies with which the investment adviser has management contracts. The group fee rate decreases as assets under management increase and increases as assets under management decrease. For the reporting period, the total annual management fee rate was .42% of the Fund's average net assets.
Distribution and Service Plan Fees. In accordance with Rule 12b-1 of the 1940 Act, the Fund has adopted separate Distribution and Service Plans for each class of shares. Certain classes pay Fidelity Distributors Company LLC (FDC), an affiliate of the investment adviser, separate Distribution and Service Fees, each of which is based on an annual percentage of each class' average net assets. In addition, FDC may pay financial intermediaries for selling shares of the Fund and providing shareholder support services. For the period, the Distribution and Service Fee rates, total fees and amounts retained by FDC were as follows:
| Distribution Fee | Service Fee | Total Fees | Retained by FDC | |
| Class A | -% | .25% | $236,153 | $8,686 |
| Class M | .25% | .25% | 145,474 | – |
| Class C | .75% | .25% | 250,807 | 32,479 |
| $632,434 | $41,165 |
Sales Load. FDC may receive a front-end sales charge of up to 5.75% for selling Class A shares and 3.50% for selling Class M shares, some of which is paid to financial intermediaries for selling shares of the Fund. Depending on the holding period, FDC may receive contingent deferred sales charges levied on Class A, Class M and Class C redemptions. The deferred sales charges are 1.00% for Class C shares, 1.00% for certain purchases of Class A shares and .25% for certain purchases of Class M shares.
For the period, sales charge amounts retained by FDC were as follows:
| Retained by FDC | |
| Class A | $36,328 |
| Class M | 3,955 |
| Class C(a) | 237 |
| $40,520 |
(a) When Class C shares are initially sold, FDC pays commissions from its own resources to financial intermediaries through which the sales are made.
Transfer Agent Fees. Fidelity Investments Institutional Operations Company LLC (FIIOC), an affiliate of the investment adviser, is the transfer, dividend disbursing and shareholder servicing agent for each class of the Fund. FIIOC receives account fees and asset-based fees that vary according to the account size and type of account of the shareholders of the respective classes of the Fund, except for Class Z. FIIOC receives an asset-based fee of Class Z's average net assets. FIIOC pays for typesetting, printing and mailing of shareholder reports, except proxy statements.
For the period, transfer agent fees for each class were as follows:
| Amount | % of Class-Level Average Net Assets | |
| Class A | $165,349 | .18 |
| Class M | 52,669 | .18 |
| Class C | 50,264 | .20 |
| Mega Cap Stock | 1,572,777 | .14 |
| Class I | 80,604 | .17 |
| Class Z | 120,835 | .04 |
| $2,042,498 |
Accounting Fees. Fidelity Service Company, Inc. (FSC), an affiliate of the investment adviser, maintains the Fund's accounting records. The accounting fee is based on the level of average net assets for each month. For the period, the fees were equivalent to the following annual rates:
| % of Average Net Assets | |
| Fidelity Mega Cap Stock Fund | .03 |
Brokerage Commissions. A portion of portfolio transactions were placed with brokerage firms which are affiliates of the investment adviser. Brokerage commissions are included in net realized gain (loss) and change in net unrealized appreciation (depreciation) in the Statement of Operations. The commissions paid to these affiliated firms were as follows:
| Amount | |
| Fidelity Mega Cap Stock Fund | $3,404 |
Interfund Lending Program. Pursuant to an Exemptive Order issued by the Securities and Exchange Commission (the SEC), the Fund, along with other registered investment companies having management contracts with Fidelity Management & Research Company LLC (FMR), or other affiliated entities of FMR, may participate in an interfund lending program. This program provides an alternative credit facility allowing the Fund to borrow from, or lend money to, other participating affiliated funds. At period end, there were no interfund loans outstanding. Activity in this program during the period for which loans were outstanding was as follows:
| Borrower or Lender | Average Loan Balance | Weighted Average Interest Rate | Interest Expense | |
| Fidelity Mega Cap Stock Fund | Borrower | $11,475,722 | .31% | $1,803 |
Interfund Trades. Funds may purchase from or sell securities to other Fidelity Funds under procedures adopted by the Board. The procedures have been designed to ensure these interfund trades are executed in accordance with Rule 17a-7 of the 1940 Act. Any interfund trades are included within the respective purchases and sales amounts shown in the Purchases and Sales of Investments note. Interfund trades during the period are noted in the table below.
| Purchases ($) | Sales ($) | Realized Gain (Loss) ($) | |
| Fidelity Mega Cap Stock Fund | 17,097,286 | 25,620,380 | 5,001,999 |
Other. During the period, FMR reimbursed the Fund $584,479 for an operating error which is included in Share Transactions in the accompanying Statement of Changes in Net Assets.
7. Committed Line of Credit.
Certain Funds participate with other funds managed by the investment adviser or an affiliate in a $4.25 billion credit facility (the "line of credit") to be utilized for temporary or emergency purposes to fund shareholder redemptions or for other short-term liquidity purposes. The participating funds have agreed to pay commitment fees on their pro-rata portion of the line of credit, which are reflected in Miscellaneous expenses on the Statement of Operations, and are listed below. During the period, there were no borrowings on this line of credit.
| Amount | |
| Fidelity Mega Cap Stock Fund | $2,705 |
8. Security Lending.
Funds lend portfolio securities from time to time in order to earn additional income. Lending agents are used, including National Financial Services (NFS), an affiliate of the investment adviser. Pursuant to a securities lending agreement, NFS will receive a fee, which is capped at 9.9% of a fund's daily lending revenue, for its services as lending agent. A fund may lend securities to certain qualified borrowers, including NFS. On the settlement date of the loan, a fund receives collateral (in the form of U.S. Treasury obligations, letters of credit and/or cash) against the loaned securities and maintains collateral in an amount not less than 100% of the market value of the loaned securities during the period of the loan. The market value of the loaned securities is determined at the close of business of a fund and any additional required collateral is delivered to a fund on the next business day. A fund or borrower may terminate the loan at any time, and if the borrower defaults on its obligation to return the securities loaned because of insolvency or other reasons, a fund may apply collateral received from the borrower against the obligation. A fund may experience delays and costs in recovering the securities loaned. Any cash collateral received is invested in the Fidelity Securities Lending Cash Central Fund. Any loaned securities are identified as such in the Schedule of Investments, and the value of loaned securities and cash collateral at period end, as applicable, are presented in the Statement of Assets and Liabilities. Security lending income represents the income earned on investing cash collateral, less rebates paid to borrowers and any lending agent fees associated with the loan, plus any premium payments received for lending certain types of securities. Security lending income is presented in the Statement of Operations as a component of income from Fidelity Central Funds. Affiliated security lending activity, if any, was as follows:
| Total Security Lending Fees Paid to NFS | Security Lending Income From Securities Loaned to NFS | Value of Securities Loaned to NFS at Period End | |
| Fidelity Mega Cap Stock Fund | $69,540 | $– | $– |
9. Expense Reductions.
During the period the investment adviser or an affiliate reimbursed and/or waived a portion of fund-level operating expenses in the amount of $47,476.
10. Distributions to Shareholders.
Distributions to shareholders of each class were as follows:
| Year ended June 30, 2022 | Year ended June 30, 2021 | |
| Fidelity Mega Cap Stock Fund | ||
| Distributions to shareholders | ||
| Class A | $4,168,848 | $4,929,440 |
| Class M | 1,236,079 | 1,781,202 |
| Class C | 1,054,574 | 1,970,202 |
| Mega Cap Stock | 56,066,052 | 68,467,281 |
| Class I | 1,998,583 | 1,732,149 |
| Class Z | 17,541,560 | 20,975,861 |
| Total | $82,065,696 | $99,856,135 |
11. Share Transactions.
Share transactions for each class were as follows and may contain in-kind transactions, automatic conversions between classes or exchanges between affiliated funds:
| Shares | Shares | Dollars | Dollars | |
| Year ended June 30, 2022 | Year ended June 30, 2021 | Year ended June 30, 2022 | Year ended June 30, 2021 | |
| Fidelity Mega Cap Stock Fund | ||||
| Class A | ||||
| Shares sold | 1,492,302 | 1,189,789 | $27,642,806 | $20,607,021 |
| Reinvestment of distributions | 221,711 | 330,881 | 4,140,030 | 4,880,925 |
| Shares redeemed | (840,067) | (909,536) | (15,338,731) | (14,543,322) |
| Net increase (decrease) | 873,946 | 611,134 | $16,444,105 | $10,944,624 |
| Class M | ||||
| Shares sold | 292,638 | 159,911 | $5,511,563 | $2,674,568 |
| Reinvestment of distributions | 66,120 | 120,261 | 1,234,490 | 1,773,468 |
| Shares redeemed | (255,295) | (329,299) | (4,693,563) | (5,153,984) |
| Net increase (decrease) | 103,463 | (49,127) | $2,052,490 | $(705,948) |
| Class C | ||||
| Shares sold | 260,842 | 230,217 | $4,755,232 | $3,988,072 |
| Reinvestment of distributions | 57,728 | 136,418 | 1,053,354 | 1,967,822 |
| Shares redeemed | (523,457) | (669,993) | (9,487,326) | (10,992,252) |
| Net increase (decrease) | (204,887) | (303,358) | $(3,678,740) | $(5,036,358) |
| Mega Cap Stock | ||||
| Shares sold | 7,598,334 | 14,433,123 | $146,062,944 | $259,290,529 |
| Reinvestment of distributions | 2,797,662 | 4,347,425 | 53,068,612 | 65,033,627 |
| Shares redeemed | (14,201,219) | (13,566,635) | (268,561,849) | (219,513,415) |
| Net increase (decrease) | (3,805,223) | 5,213,913 | $(69,430,293) | $104,810,741 |
| Class I | ||||
| Shares sold | 2,965,041 | 1,260,443 | $57,337,133 | $21,783,162 |
| Reinvestment of distributions | 103,482 | 113,556 | 1,967,233 | 1,695,026 |
| Shares redeemed | (1,909,760) | (790,590) | (36,447,458) | (12,720,170) |
| Net increase (decrease) | 1,158,763 | 583,409 | $22,856,908 | $10,758,018 |
| Class Z | ||||
| Shares sold | 17,477,193 | 6,462,220 | $318,523,898 | $101,872,846 |
| Reinvestment of distributions | 547,391 | 766,455 | 10,313,549 | 11,457,036 |
| Shares redeemed | (20,717,755) | (6,231,350) | (376,153,689) | (105,474,773) |
| Net increase (decrease) | (2,693,171) | 997,325 | $(47,316,242) | $7,855,109 |
12. Other.
A fund's organizational documents provide former and current trustees and officers with a limited indemnification against liabilities arising in connection with the performance of their duties to the fund. In the normal course of business, a fund may also enter into contracts that provide general indemnifications. A fund's maximum exposure under these arrangements is unknown as this would be dependent on future claims that may be made against a fund. The risk of material loss from such claims is considered remote.
13. Coronavirus (COVID-19) Pandemic.
An outbreak of COVID-19 first detected in China during December 2019 has since spread globally and was declared a pandemic by the World Health Organization during March 2020. Developments that disrupt global economies and financial markets, such as the COVID-19 pandemic, may magnify factors that affect the Fund's performance.
Report of Independent Registered Public Accounting Firm
To the Board of Trustees of Fidelity Hastings Street Trust and Shareholders of Fidelity Mega Cap Stock Fund
Opinion on the Financial Statements
We have audited the accompanying statement of assets and liabilities, including the schedule of investments, of Fidelity Mega Cap Stock Fund (one of the funds constituting Fidelity Hastings Street Trust, referred to hereafter as the “Fund”) as of June 30, 2022, the related statement of operations for the year ended June 30, 2022, the statement of changes in net assets for each of the two years in the period ended June 30, 2022, including the related notes, and the financial highlights for each of the five years in the period ended June 30, 2022 (collectively referred to as the “financial statements”). In our opinion, the financial statements present fairly, in all material respects, the financial position of the Fund as of June 30, 2022, the results of its operations for the year then ended, the changes in its net assets for each of the two years in the period ended June 30, 2022 and the financial highlights for each of the five years in the period ended June 30, 2022 in conformity with accounting principles generally accepted in the United States of America.
Basis for Opinion
These financial statements are the responsibility of the Fund’s management. Our responsibility is to express an opinion on the Fund’s financial statements based on our audits. We are a public accounting firm registered with the Public Company Accounting Oversight Board (United States) (PCAOB) and are required to be independent with respect to the Fund in accordance with the U.S. federal securities laws and the applicable rules and regulations of the Securities and Exchange Commission and the PCAOB.
We conducted our audits of these financial statements in accordance with the standards of the PCAOB. Those standards require that we plan and perform the audit to obtain reasonable assurance about whether the financial statements are free of material misstatement, whether due to error or fraud.
Our audits included performing procedures to assess the risks of material misstatement of the financial statements, whether due to error or fraud, and performing procedures that respond to those risks. Such procedures included examining, on a test basis, evidence regarding the amounts and disclosures in the financial statements. Our audits also included evaluating the accounting principles used and significant estimates made by management, as well as evaluating the overall presentation of the financial statements. Our procedures included confirmation of securities owned as of June 30, 2022 by correspondence with the custodian, issuers of privately offered securities and brokers; when replies were not received from brokers, we performed other auditing procedures. We believe that our audits provide a reasonable basis for our opinion.
/s/ PricewaterhouseCoopers LLP
Boston, Massachusetts
August 17, 2022
We have served as the auditor of one or more investment companies in the Fidelity group of funds since 1932.
Trustees and Officers
The Trustees, Members of the Advisory Board (if any), and officers of the trust and fund, as applicable, are listed below. The Board of Trustees governs the fund and is responsible for protecting the interests of shareholders. The Trustees are experienced executives who meet periodically throughout the year to oversee the fund's activities, review contractual arrangements with companies that provide services to the fund, oversee management of the risks associated with such activities and contractual arrangements, and review the fund's performance. Each of the Trustees oversees 316 funds.
The Trustees hold office without limit in time except that (a) any Trustee may resign; (b) any Trustee may be removed by written instrument, signed by at least two-thirds of the number of Trustees prior to such removal; (c) any Trustee who requests to be retired or who has become incapacitated by illness or injury may be retired by written instrument signed by a majority of the other Trustees; and (d) any Trustee may be removed at any special meeting of shareholders by a two-thirds vote of the outstanding voting securities of the trust. Each Trustee who is not an interested person (as defined in the 1940 Act) of the trust and the fund is referred to herein as an Independent Trustee. Each Independent Trustee shall retire not later than the last day of the calendar year in which his or her 75th birthday occurs. The Independent Trustees may waive this mandatory retirement age policy with respect to individual Trustees. Officers and Advisory Board Members hold office without limit in time, except that any officer or Advisory Board Member may resign or may be removed by a vote of a majority of the Trustees at any regular meeting or any special meeting of the Trustees. Except as indicated, each individual has held the office shown or other offices in the same company for the past five years.
The fund's Statement of Additional Information (SAI) includes more information about the Trustees. To request a free copy, call Fidelity at 1-800-544-8544 if you’re an individual investing directly with Fidelity, call 1-800-835-5092 if you’re a plan sponsor or participant with Fidelity as your recordkeeper or call 1-877-208-0098 on institutional accounts or if you’re an advisor or invest through one.
Experience, Skills, Attributes, and Qualifications of the Trustees. The Governance and Nominating Committee has adopted a statement of policy that describes the experience, qualifications, attributes, and skills that are necessary and desirable for potential Independent Trustee candidates (Statement of Policy). The Board believes that each Trustee satisfied at the time he or she was initially elected or appointed a Trustee, and continues to satisfy, the standards contemplated by the Statement of Policy. The Governance and Nominating Committee also engages professional search firms to help identify potential Independent Trustee candidates who have the experience, qualifications, attributes, and skills consistent with the Statement of Policy. From time to time, additional criteria based on the composition and skills of the current Independent Trustees, as well as experience or skills that may be appropriate in light of future changes to board composition, business conditions, and regulatory or other developments, have also been considered by the professional search firms and the Governance and Nominating Committee. In addition, the Board takes into account the Trustees' commitment and participation in Board and committee meetings, as well as their leadership of standing and ad hoc committees throughout their tenure.
In determining that a particular Trustee was and continues to be qualified to serve as a Trustee, the Board has considered a variety of criteria, none of which, in isolation, was controlling. The Board believes that, collectively, the Trustees have balanced and diverse experience, qualifications, attributes, and skills, which allow the Board to operate effectively in governing the fund and protecting the interests of shareholders. Information about the specific experience, skills, attributes, and qualifications of each Trustee, which in each case led to the Board's conclusion that the Trustee should serve (or continue to serve) as a trustee of the fund, is provided below.
Board Structure and Oversight Function. Robert A. Lawrence is an interested person and currently serves as Chair. The Trustees have determined that an interested Chair is appropriate and benefits shareholders because an interested Chair has a personal and professional stake in the quality and continuity of services provided to the fund. Independent Trustees exercise their informed business judgment to appoint an individual of their choosing to serve as Chair, regardless of whether the Trustee happens to be independent or a member of management. The Independent Trustees have determined that they can act independently and effectively without having an Independent Trustee serve as Chair and that a key structural component for assuring that they are in a position to do so is for the Independent Trustees to constitute a substantial majority for the Board. The Independent Trustees also regularly meet in executive session. David M. Thomas serves as Lead Independent Trustee and as such (i) acts as a liaison between the Independent Trustees and management with respect to matters important to the Independent Trustees and (ii) with management prepares agendas for Board meetings.
Fidelity® funds are overseen by different Boards of Trustees. The fund's Board oversees Fidelity's high income and certain equity funds, and other Boards oversee Fidelity's investment-grade bond, money market, asset allocation, and other equity funds. The asset allocation funds may invest in Fidelity® funds overseen by the fund's Board. The use of separate Boards, each with its own committee structure, allows the Trustees of each group of Fidelity® funds to focus on the unique issues of the funds they oversee, including common research, investment, and operational issues. On occasion, the separate Boards establish joint committees to address issues of overlapping consequences for the Fidelity® funds overseen by each Board.
The Trustees operate using a system of committees to facilitate the timely and efficient consideration of all matters of importance to the Trustees, the fund, and fund shareholders and to facilitate compliance with legal and regulatory requirements and oversight of the fund's activities and associated risks. The Board, acting through its committees, has charged FMR and its affiliates with (i) identifying events or circumstances the occurrence of which could have demonstrably adverse effects on the fund's business and/or reputation; (ii) implementing processes and controls to lessen the possibility that such events or circumstances occur or to mitigate the effects of such events or circumstances if they do occur; and (iii) creating and maintaining a system designed to evaluate continuously business and market conditions in order to facilitate the identification and implementation processes described in (i) and (ii) above. Because the day-to-day operations and activities of the fund are carried out by or through FMR, its affiliates, and other service providers, the fund's exposure to risks is mitigated but not eliminated by the processes overseen by the Trustees. While each of the Board's committees has responsibility for overseeing different aspects of the fund's activities, oversight is exercised primarily through the Operations, Audit, and Compliance Committees. Appropriate personnel, including but not limited to the fund's Chief Compliance Officer (CCO), FMR's internal auditor, the independent accountants, the fund's Treasurer and portfolio management personnel, make periodic reports to the Board's committees, as appropriate, including an annual review of Fidelity's risk management program for the Fidelity® funds. The responsibilities of each standing committee, including their oversight responsibilities, are described further under "Standing Committees of the Trustees."
Interested Trustees*:
Correspondence intended for a Trustee who is an interested person may be sent to Fidelity Investments, 245 Summer Street, Boston, Massachusetts 02210.
Name, Year of Birth; Principal Occupations and Other Relevant Experience+
Bettina Doulton (1964)
Year of Election or Appointment: 2020
Trustee
Ms. Doulton also serves as Trustee of other Fidelity® funds. Prior to her retirement, Ms. Doulton served in a variety of positions at Fidelity Investments, including as a managing director of research (2006-2007), portfolio manager to certain Fidelity® funds (1993-2005), equity analyst and portfolio assistant (1990-1993), and research assistant (1987-1990). Ms. Doulton currently owns and operates Phi Builders + Architects and Cellardoor Winery. Previously, Ms. Doulton served as a member of the Board of Brown Capital Management, LLC (2014-2018).
Robert A. Lawrence (1952)
Year of Election or Appointment: 2020
Trustee
Chair of the Board of Trustees
Mr. Lawrence also serves as Trustee of other funds. Previously, Mr. Lawrence served as a Trustee and Member of the Advisory Board of certain funds. Prior to his retirement in 2008, Mr. Lawrence served as Vice President of certain Fidelity® funds (2006-2008), Senior Vice President, Head of High Income Division of Fidelity Management & Research Company (investment adviser firm, 2006-2008), and President of Fidelity Strategic Investments (investment adviser firm, 2002-2005).
* Determined to be an “Interested Trustee” by virtue of, among other things, his or her affiliation with the trust or various entities under common control with FMR.
+ The information includes the Trustee's principal occupation during the last five years and other information relating to the experience, attributes, and skills relevant to the Trustee's qualifications to serve as a Trustee, which led to the conclusion that the Trustee should serve as a Trustee for the fund.
Independent Trustees:
Correspondence intended for an Independent Trustee may be sent to Fidelity Investments, P.O. Box 55235, Boston, Massachusetts 02205-5235.
Name, Year of Birth; Principal Occupations and Other Relevant Experience+
Thomas P. Bostick (1956)
Year of Election or Appointment: 2021
Trustee
Lieutenant General Bostick also serves as Trustee of other Fidelity® funds. Prior to his retirement, General Bostick (United States Army, Retired) held a variety of positions within the U.S. Army, including Commanding General and Chief of Engineers, U.S. Army Corps of Engineers (2012-2016) and Deputy Chief of Staff and Director of Human Resources, U.S. Army (2009-2012). General Bostick currently serves as a member of the Board and Finance and Governance Committees of CSX Corporation (transportation, 2020-present) and a member of the Board and Corporate Governance and Nominating Committee of Perma-Fix Environmental Services, Inc. (nuclear waste management, 2020-present). General Bostick serves as Chief Executive Officer of Bostick Global Strategies, LLC (consulting, 2016-present) and as a member of the Board of HireVue, Inc. (video interview and assessment, 2020-present). Previously, General Bostick served as a Member of the Advisory Board of certain Fidelity® funds (2021), President, Intrexon Bioengineering (2018-2020) and Chief Operating Officer (2017-2020) and Senior Vice President of the Environment Sector (2016-2017) of Intrexon Corporation (biopharmaceutical company).
Dennis J. Dirks (1948)
Year of Election or Appointment: 2005
Trustee
Mr. Dirks also serves as Trustee of other Fidelity® funds. Prior to his retirement in May 2003, Mr. Dirks served as Chief Operating Officer and as a member of the Board of The Depository Trust & Clearing Corporation (financial markets infrastructure), President, Chief Operating Officer and a member of the Board of The Depository Trust Company (DTC), President and a member of the Board of the National Securities Clearing Corporation (NSCC), Chief Executive Officer and a member of the Board of the Government Securities Clearing Corporation and Chief Executive Officer and a member of the Board of the Mortgage-Backed Securities Clearing Corporation. Mr. Dirks currently serves as a member of the Finance Committee (2016-present) and Board (2017-present) and is Treasurer (2018-present) of the Asolo Repertory Theatre.
Donald F. Donahue (1950)
Year of Election or Appointment: 2018
Trustee
Mr. Donahue also serves as Trustee of other Fidelity® funds. Mr. Donahue serves as President and Chief Executive Officer of Miranda Partners, LLC (risk consulting for the financial services industry, 2012-present). Previously, Mr. Donahue served as Chief Executive Officer (2006-2012), Chief Operating Officer (2003-2006) and Managing Director, Customer Marketing and Development (1999-2003) of The Depository Trust & Clearing Corporation (financial markets infrastructure). Mr. Donahue currently serves as a member (2007-present) and Co-Chairman (2016-present) of the Board of United Way of New York and a member of the Board of The Leadership Academy (previously NYC Leadership Academy) (2012-present). Mr. Donahue previously served as a member of the Advisory Board of certain Fidelity® funds (2015-2018).
Vicki L. Fuller (1957)
Year of Election or Appointment: 2020
Trustee
Ms. Fuller also serves as Trustee of other Fidelity® funds. Previously, Ms. Fuller served as a member of the Advisory Board of certain Fidelity® funds (2018-2020), Chief Investment Officer of the New York State Common Retirement Fund (2012-2018) and held a variety of positions at AllianceBernstein L.P. (global asset management, 1985-2012), including Managing Director (2006-2012) and Senior Vice President and Senior Portfolio Manager (2001-2006). Ms. Fuller currently serves as a member of the Board, Audit Committee and Nominating and Governance Committee of two Blackstone business development companies (2020-present), as a member of the Board of Treliant, LLC (consulting, 2019-present), as a member of the Advisory Board of Ariel Alternatives, LLC (private equity, 2021-present) and as a member of the Board and Chair of the Audit Committee of Gusto, Inc. (software, 2021-present). In addition, Ms. Fuller currently serves as a member of the Board of Roosevelt University (2019-present) and as a member of the Executive Board of New York University’s Stern School of Business. Ms. Fuller previously served as a member of the Board, Audit Committee and Nominating and Governance Committee of The Williams Companies, Inc. (natural gas infrastructure, 2018-2021).
Patricia L. Kampling (1959)
Year of Election or Appointment: 2020
Trustee
Ms. Kampling also serves as Trustee of other Fidelity® funds. Prior to her retirement, Ms. Kampling served as Chairman of the Board and Chief Executive Officer (2012-2019), President and Chief Operating Officer (2011-2012) and Executive Vice President and Chief Financial Officer (2010-2011) of Alliant Energy Corporation. Ms. Kampling currently serves as a member of the Board, Finance Committee and Governance, Compensation and Nominating Committee of Xcel Energy Inc. (utilities company, 2020-present) and as a member of the Board, Audit, Finance and Risk Committee and Safety, Environmental, Technology and Operations Committee and Chair of the Executive Development and Compensation Committee of American Water Works Company, Inc. (utilities company, 2019-present). In addition, Ms. Kampling currently serves as a member of the Board of the Nature Conservancy, Wisconsin Chapter (2019-present). Previously, Ms. Kampling served as a Member of the Advisory Board of certain Fidelity® funds (2020), a member of the Board, Compensation Committee and Executive Committee and Chair of the Audit Committee of Briggs & Stratton Corporation (manufacturing, 2011-2021), a member of the Board of Interstate Power and Light Company (2012-2019) and Wisconsin Power and Light Company (2012-2019) (each a subsidiary of Alliant Energy Corporation) and as a member of the Board and Workforce Development Committee of the Business Roundtable (2018-2019).
Thomas A. Kennedy (1955)
Year of Election or Appointment: 2021
Trustee
Mr. Kennedy also serves as Trustee of other Fidelity® funds. Previously, Mr. Kennedy served as a Member of the Advisory Board of certain Fidelity® funds (2020) and held a variety of positions at Raytheon Company (aerospace and defense, 1983-2020), including Chairman and Chief Executive Officer (2014-2020) and Executive Vice President and Chief Operating Officer (2013-2014). Mr. Kennedy currently serves as Executive Chairman of the Board of Directors of Raytheon Technologies Corporation (aerospace and defense, 2020-present). He is also a member of the Rutgers School of Engineering Industry Advisory Board (2011-present) and a member of the UCLA Engineering Dean’s Executive Board (2016-present).
Oscar Munoz (1959)
Year of Election or Appointment: 2021
Trustee
Mr. Munoz also serves as Trustee of other Fidelity® funds. Prior to his retirement, Mr. Munoz served as Executive Chairman (2020-2021), Chief Executive Officer (2015-2020), President (2015-2016) and a member of the Board (2010-2021) of United Airlines Holdings, Inc. Mr. Munoz currently serves as a member of the Board of CBRE Group, Inc. (commercial real estate, 2020-present), a member of the Board of Univision Communications, Inc. (Hispanic media, 2020-present) and a member of the Advisory Board of Salesforce.com, Inc. (cloud-based software, 2020-present). Previously, Mr. Munoz served as a Member of the Advisory Board of certain Fidelity® funds (2021).
Garnett A. Smith (1947)
Year of Election or Appointment: 2018
Trustee
Mr. Smith also serves as Trustee of other Fidelity® funds. Prior to his retirement, Mr. Smith served as Chairman and Chief Executive Officer (1990-1997) and President (1986-1990) of Inbrand Corp. (manufacturer of personal absorbent products). Prior to his employment with Inbrand Corp., he was employed by a retail fabric chain and North Carolina National Bank (now Bank of America). Mr. Smith previously served as a member of the Advisory Board of certain Fidelity® funds (2012-2013).
David M. Thomas (1949)
Year of Election or Appointment: 2008
Trustee
Lead Independent Trustee
Mr. Thomas also serves as Trustee of other Fidelity® funds. Previously, Mr. Thomas served as Executive Chairman (2005-2006) and Chairman and Chief Executive Officer (2000-2005) of IMS Health, Inc. (pharmaceutical and healthcare information solutions). Mr. Thomas currently serves as a member of the Board of Fortune Brands Home and Security (home and security products, 2004-present) and as Director (2013-present) and Non-Executive Chairman of the Board (2022-present) of Interpublic Group of Companies, Inc. (marketing communication).
Susan Tomasky (1953)
Year of Election or Appointment: 2020
Trustee
Ms. Tomasky also serves as Trustee of other Fidelity® funds. Prior to her retirement, Ms. Tomasky served in various executive officer positions at American Electric Power Company, Inc. (1998-2011), including most recently as President of AEP Transmission (2007-2011). Ms. Tomasky currently serves as a member of the Board and Sustainability Committee and as Chair of the Audit Committee of Marathon Petroleum Corporation (2018-present) and as a member of the Board, Executive Committee, Corporate Governance Committee and Organization and Compensation Committee and as Chair of the Audit Committee of Public Service Enterprise Group, Inc. (utilities company, 2012-present) and as a member of the Board of its subsidiary company, Public Service Electric and Gas Co. (2021-present). In addition, Ms. Tomasky currently serves as a member (2009-present) and President (2020-present) of the Board of the Royal Shakespeare Company – America (2009-present), as a member of the Board of the Columbus Association for the Performing Arts (2011-present) and as a member of the Board and Kenyon in the World Committee of Kenyon College (2016-present). Previously, Ms. Tomasky served as a Member of the Advisory Board of certain Fidelity® funds (2020), as a member of the Board of the Columbus Regional Airport Authority (2007-2020), as a member of the Board (2011-2018) and Lead Independent Director (2015-2018) of Andeavor Corporation (previously Tesoro Corporation) (independent oil refiner and marketer) and as a member of the Board of Summit Midstream Partners LP (energy, 2012-2018).
Michael E. Wiley (1950)
Year of Election or Appointment: 2018
Trustee
Mr. Wiley also serves as Trustee of other Fidelity® funds. Previously, Mr. Wiley served as a member of the Advisory Board of certain Fidelity® funds (2018-2020), Chairman, President and CEO of Baker Hughes, Inc. (oilfield services, 2000-2004). Mr. Wiley also previously served as a member of the Board of Andeavor Corporation (independent oil refiner and marketer, 2005-2018), a member of the Board of Andeavor Logistics LP (natural resources logistics, 2015-2018) and a member of the Board of High Point Resources (exploration and production, 2005-2020).
+ The information includes the Trustee's principal occupation during the last five years and other information relating to the experience, attributes, and skills relevant to the Trustee's qualifications to serve as a Trustee, which led to the conclusion that the Trustee should serve as a Trustee for the fund.
Advisory Board Members and Officers:
Correspondence intended for a Member of the Advisory Board (if any) may be sent to Fidelity Investments, P.O. Box 55235, Boston, Massachusetts 02205-5235. Correspondence intended for an officer or Peter S. Lynch may be sent to Fidelity Investments, 245 Summer Street, Boston, Massachusetts 02210. Officers appear below in alphabetical order.
Name, Year of Birth; Principal Occupation
Peter S. Lynch (1944)
Year of Election or Appointment: 2003
Member of the Advisory Board
Mr. Lynch also serves as a Member of the Advisory Board of other Fidelity® funds. Mr. Lynch is Vice Chairman and a Director of Fidelity Management & Research Company LLC (investment adviser firm). In addition, Mr. Lynch serves as a Trustee of Boston College and as the Chairman of the Inner-City Scholarship Fund. Previously, Mr. Lynch served as Vice Chairman and a Director of FMR Co., Inc. (investment adviser firm) and on the Special Olympics International Board of Directors (1997-2006).
Craig S. Brown (1977)
Year of Election or Appointment: 2019
Assistant Treasurer
Mr. Brown also serves as an officer of other funds. Mr. Brown serves as Assistant Treasurer of FIMM, LLC (2021-present) and is an employee of Fidelity Investments (2013-present).
John J. Burke III (1964)
Year of Election or Appointment: 2018
Chief Financial Officer
Mr. Burke also serves as Chief Financial Officer of other funds. Mr. Burke serves as Head of Investment Operations for Fidelity Fund and Investment Operations (2018-present) and is an employee of Fidelity Investments (1998-present). Previously Mr. Burke served as head of Asset Management Investment Operations (2012-2018).
William C. Coffey (1969)
Year of Election or Appointment: 2019
Assistant Secretary
Mr. Coffey also serves as Assistant Secretary of other funds. He is Senior Vice President and Deputy General Counsel of FMR LLC (diversified financial services company, 2010-present), and is an employee of Fidelity Investments. Previously, Mr. Coffey served as Secretary and CLO of certain funds (2018-2019); CLO, Secretary, and Senior Vice President of Fidelity Management & Research Company and FMR Co., Inc. (investment adviser firms, 2018-2019); Secretary of Fidelity SelectCo, LLC and Fidelity Investments Money Management, Inc. (investment adviser firms, 2018-2019); CLO of Fidelity Management & Research (Hong Kong) Limited, FMR Investment Management (UK) Limited, and Fidelity Management & Research (Japan) Limited (investment adviser firms, 2018-2019); and Assistant Secretary of certain funds (2009-2018).
Timothy M. Cohen (1969)
Year of Election or Appointment: 2018
Vice President
Mr. Cohen also serves as Vice President of other funds. Mr. Cohen serves as Co-Head of Equity (2018-present), a Director of Fidelity Management & Research (Japan) Limited (investment adviser firm, 2016-present), and is an employee of Fidelity Investments. Previously, Mr. Cohen served as Executive Vice President of Fidelity SelectCo, LLC (2019), Head of Global Equity Research (2016-2018), Chief Investment Officer - Equity and a Director of Fidelity Management & Research (U.K.) Inc. (investment adviser firm, 2013-2015) and as a Director of Fidelity Management & Research (Hong Kong) Limited (investment adviser firm, 2017).
Jonathan Davis (1968)
Year of Election or Appointment: 2010
Assistant Treasurer
Mr. Davis also serves as an officer of other funds. Mr. Davis serves as Assistant Treasurer of FIMM, LLC (2021-present), FMR Capital, Inc. (2017-present), FD Funds GP LLC (2021-present), FD Funds Holding LLC (2021-present), and FD Funds Management LLC (2021-present); and is an employee of Fidelity Investments. Previously, Mr. Davis served as Vice President and Associate General Counsel of FMR LLC (diversified financial services company, 2003-2010).
Laura M. Del Prato (1964)
Year of Election or Appointment: 2018
Assistant Treasurer
Ms. Del Prato also serves as an officer of other funds. Ms. Del Prato serves as Assistant Treasurer of FIMM, LLC (2021-present) and is an employee of Fidelity Investments (2017-present). Previously, Ms. Del Prato served as President and Treasurer of The North Carolina Capital Management Trust: Cash Portfolio and Term Portfolio (2018-2020). Prior to joining Fidelity Investments, Ms. Del Prato served as a Managing Director and Treasurer of the JPMorgan Mutual Funds (2014-2017). Prior to JPMorgan, Ms. Del Prato served as a partner at Cohen Fund Audit Services (accounting firm, 2012-2013) and KPMG LLP (accounting firm, 2004-2012).
Colm A. Hogan (1973)
Year of Election or Appointment: 2020
Assistant Treasurer
Mr. Hogan also serves as an officer of other funds. Mr. Hogan serves as Assistant Treasurer of FIMM, LLC (2021-present) and FMR Capital, Inc. (2017-present) and is an employee of Fidelity Investments (2005-present). Previously, Mr. Hogan served as Deputy Treasurer of certain Fidelity® funds (2016-2020) and Assistant Treasurer of certain Fidelity® funds (2016-2018).
Pamela R. Holding (1964)
Year of Election or Appointment: 2018
Vice President
Ms. Holding also serves as Vice President of other funds. Ms. Holding serves as Co-Head of Equity (2018-present) and is an employee of Fidelity Investments (2013-present). Previously, Ms. Holding served as Executive Vice President of Fidelity SelectCo, LLC (2019) and as Chief Investment Officer of Fidelity Institutional Asset Management (2013-2018).
Cynthia Lo Bessette (1969)
Year of Election or Appointment: 2019
Secretary and Chief Legal Officer (CLO)
Ms. Lo Bessette also serves as an officer of other funds. Ms. Lo Bessette serves as CLO, Secretary, and Senior Vice President of Fidelity Management & Research Company LLC (investment adviser firm, 2019-present); CLO of Fidelity Management & Research (Hong Kong) Limited, FMR Investment Management (UK) Limited, and Fidelity Management & Research (Japan) Limited (investment adviser firms, 2019-present); Secretary of FD Funds GP LLC (2021-present), FD Funds Holding LLC (2021-present), and FD Funds Management LLC (2021-present); and Assistant Secretary of FIMM, LLC (2019-present). She is a Senior Vice President and Deputy General Counsel of FMR LLC (diversified financial services company, 2019-present), and is an employee of Fidelity Investments. Previously, Ms. Lo Bessette served as CLO, Secretary, and Senior Vice President of FMR Co., Inc. (investment adviser firm, 2019); Secretary of Fidelity SelectCo, LLC and Fidelity Investments Money Management, Inc. (investment adviser firms, 2019). Prior to joining Fidelity Investments, Ms. Lo Bessette was Executive Vice President, General Counsel (2016-2019) and Senior Vice President, Deputy General Counsel (2015-2016) of OppenheimerFunds (investment management company) and Deputy Chief Legal Officer (2013-2015) of Jennison Associates LLC (investment adviser firm).
Chris Maher (1972)
Year of Election or Appointment: 2020
Deputy Treasurer
Mr. Maher also serves as an officer of other funds. Mr. Maher serves as Assistant Treasurer of FIMM, LLC (2021-present) and FMR Capital, Inc. (2017-present), and is an employee of Fidelity Investments (2008-present). Previously, Mr. Maher served as Assistant Treasurer of certain funds (2013-2020); Vice President of Asset Management Compliance (2013), Vice President of the Program Management Group of FMR (investment adviser firm, 2010-2013), and Vice President of Valuation Oversight (2008-2010).
Jason P. Pogorelec (1975)
Year of Election or Appointment: 2020
Chief Compliance Officer
Mr. Pogorelec also serves as Chief Compliance Officer of other funds. Mr. Pogorelec is a senior Vice President of Asset Management Compliance for Fidelity Investments and is an employee of Fidelity Investments (2006-present). Previously, Mr. Pogorelec served as Vice President, Associate General Counsel for Fidelity Investments (2010-2020) and Assistant Secretary of certain Fidelity funds (2015-2020).
Brett Segaloff (1972)
Year of Election or Appointment: 2021
Anti-Money Laundering (AML) Officer
Mr. Segaloff also serves as an AML Officer of other funds and other related entities. He is Director, Anti-Money Laundering (2007-present) of FMR LLC (diversified financial services company) and is an employee of Fidelity Investments (1996-present).
Stacie M. Smith (1974)
Year of Election or Appointment: 2016
President and Treasurer
Ms. Smith also serves as an officer of other funds. Ms. Smith serves as Assistant Treasurer of FIMM, LLC (2021-present) and FMR Capital, Inc. (2017-present), is an employee of Fidelity Investments (2009-present), and has served in other fund officer roles. Prior to joining Fidelity Investments, Ms. Smith served as Senior Audit Manager of Ernst & Young LLP (accounting firm, 1996-2009). Previously, Ms. Smith served as Assistant Treasurer (2013-2019) and Deputy Treasurer (2013-2016) of certain Fidelity® funds.
Jim Wegmann (1979)
Year of Election or Appointment: 2019
Assistant Treasurer
Mr. Wegmann also serves as an officer of other funds. Mr. Wegmann serves as Assistant Treasurer of FIMM, LLC (2021-present) and is an employee of Fidelity Investments (2011-present). Previously, Mr. Wegmann served as Assistant Treasurer of certain Fidelity® funds (2019-2021).
Shareholder Expense Example
As a shareholder, you incur two types of costs: (1) transaction costs, which may include sales charges (loads) on purchase payments or redemption proceeds, as applicable and (2) ongoing costs, which generally include management fees, distribution and/or service (12b-1) fees and other Fund expenses. This Example is intended to help you understand your ongoing costs (in dollars) of investing in a fund and to compare these costs with the ongoing costs of investing in other mutual funds.
The Example is based on an investment of $1,000 invested at the beginning of the period and held for the entire period (January 1, 2022 to June 30, 2022).
Actual Expenses
The first line of the accompanying table provides information about actual account values and actual expenses. You may use the information in this line, together with the amount you invested, to estimate the expenses that you paid over the period. Simply divide your account value by $1,000.00 (for example, an $8,600 account value divided by $1,000.00 = 8.6), then multiply the result by the number in the first line for a class/Fund under the heading entitled "Expenses Paid During Period" to estimate the expenses you paid on your account during this period. If any fund is a shareholder of any underlying mutual funds or exchange-traded funds (ETFs) (the Underlying Funds), such fund indirectly bears its proportional share of the expenses of the Underlying Funds in addition to the direct expenses incurred presented in the table. These fees and expenses are not included in the annualized expense ratio used to calculate the expense estimate in the table below.
Hypothetical Example for Comparison Purposes
The second line of the accompanying table provides information about hypothetical account values and hypothetical expenses based on the actual expense ratio and an assumed rate of return of 5% per year before expenses, which is not the actual return. The hypothetical account values and expenses may not be used to estimate the actual ending account balance or expenses you paid for the period. You may use this information to compare the ongoing costs of investing in the Fund and other funds. To do so, compare this 5% hypothetical example with the 5% hypothetical examples that appear in the shareholder reports of the other funds. If any fund is a shareholder of any Underlying Funds, such fund indirectly bears its proportional share of the expenses of the Underlying Funds in addition to the direct expenses as presented in the table. These fees and expenses are not included in the annualized expense ratio used to calculate the expense estimate in the table below.
Please note that the expenses shown in the table are meant to highlight your ongoing costs only and do not reflect any transaction costs. Therefore, the second line of the table is useful in comparing ongoing costs only, and will not help you determine the relative total costs of owning different funds. In addition, if these transactional costs were included, your costs would have been higher.
| Annualized Expense Ratio-A | Beginning Account Value January 1, 2022 | Ending Account Value June 30, 2022 | Expenses Paid During Period-B January 1, 2022 to June 30, 2022 | |
| Fidelity Mega Cap Stock Fund | ||||
| Class A | .90% | |||
| Actual | $1,000.00 | $845.90 | $4.12 | |
| Hypothetical-C | $1,000.00 | $1,020.33 | $4.51 | |
| Class M | 1.16% | |||
| Actual | $1,000.00 | $844.90 | $5.31 | |
| Hypothetical-C | $1,000.00 | $1,019.04 | $5.81 | |
| Class C | 1.68% | |||
| Actual | $1,000.00 | $842.60 | $7.68 | |
| Hypothetical-C | $1,000.00 | $1,016.46 | $8.40 | |
| Mega Cap Stock | .61% | |||
| Actual | $1,000.00 | $847.30 | $2.79 | |
| Hypothetical-C | $1,000.00 | $1,021.77 | $3.06 | |
| Class I | .63% | |||
| Actual | $1,000.00 | $847.10 | $2.89 | |
| Hypothetical-C | $1,000.00 | $1,021.67 | $3.16 | |
| Class Z | .52% | |||
| Actual | $1,000.00 | $847.40 | $2.38 | |
| Hypothetical-C | $1,000.00 | $1,022.22 | $2.61 |
A Annualized expense ratio reflects expenses net of applicable fee waivers.
B Expenses are equal to the annualized expense ratio, multiplied by the average account value over the period, multiplied by 181/ 365 (to reflect the one-half year period). The fees and expenses of any Underlying Funds are not included in each annualized expense ratio.
C 5% return per year before expenses
Distributions (Unaudited)
The dividend and capital gains distributions for the fund(s) are available on Fidelity.com or Institutional.Fidelity.com.
The fund hereby designates as a capital gain dividend with respect to the taxable year ended June 30, 2022, $41,280,426, or, if subsequently determined to be different, the net capital gain of such year.
The fund designates 100% of the short-term capital gain dividends distributed during the fiscal year as qualifying to be taxed as short-term capital gain dividends for nonresident alien shareholders.
Class A designates 33% and 54%; Class M designates 37% and 60%; Class C designates 47% and 81%; Mega Cap Stock designates 31% and 48%; Class I designates 31% and 49%; and Class Z designates 30% and 46% of the dividends distributed in August and December, respectively during the fiscal year as qualifying for the dividends–received deduction for corporate shareholders.
Class A designates 46% and 75%; Class M designates 51% and 85%; Class C designates 64% and 100%; Mega Cap Stock designates 43% and 67%; Class I designates 43% and 69%; and Class Z designates 42% and 65% of the dividends distributed in August and December, respectively during the fiscal year as amounts which may be taken into account as a dividend for purposes of the maximum rate under section 1(h)(11) of the Internal Revenue Code.
Class A designates 1% and 2%; Class M designates 1% and 2%; Class C designates 1% and 0%; Mega Cap Stock designates 1% and 2%; Class I designates 1% and 2%; and Class Z designates 1% and 2% of the dividends distributed in August and December, respectively during the fiscal year as a section 199A dividend.
The fund will notify shareholders in January 2023 of amounts for use in preparing 2022 income tax returns.
Board Approval of Investment Advisory Contracts and Management Fees
Fidelity Mega Cap Stock Fund
Each year, the Board of Trustees, including the Independent Trustees (together, the Board), votes on the renewal of the management contract with Fidelity Management & Research Company LLC (FMR) and the sub-advisory agreements (together, the Advisory Contracts) for the fund. FMR and the sub-advisers are referred to herein as the Investment Advisers. The Board, assisted by the advice of fund counsel and Independent Trustees' counsel, requests and considers a broad range of information relevant to the renewal of the Advisory Contracts throughout the year.The Board meets regularly and, at each of its meetings, covers an extensive agenda of topics and materials and considers factors that are relevant to its annual consideration of the renewal of the fund's Advisory Contracts, including the services and support provided to the fund and its shareholders. The Board has established various standing committees (Committees), each composed of and chaired by Independent Trustees with varying backgrounds, to which the Board has assigned specific subject matter responsibilities in order to enhance effective decision-making by the Board. The Board, acting directly and through its Committees, requests and receives information concerning the annual consideration of the renewal of the fund's Advisory Contracts. The Board also meets as needed to review matters specifically related to the Board's annual consideration of the renewal of the Advisory Contracts. Members of the Board may also meet with trustees of other Fidelity funds through joint ad hoc committees to discuss certain matters relevant to all of the Fidelity funds.At its May 2022 meeting, the Board unanimously determined to renew the fund's Advisory Contracts. In reaching its determination, the Board considered all factors it believed relevant, including (i) the nature, extent, and quality of the services provided to the fund and its shareholders (including the investment performance of the fund); (ii) the competitiveness relative to peer funds of the fund's management fee and the total expense ratio of a representative class (retail class); (iii) the total costs of the services provided by and the profits realized by Fidelity from its relationships with the fund; and (iv) the extent to which, if any, economies of scale exist and are realized as the fund grows, and whether any economies of scale are appropriately shared with fund shareholders.In considering whether to renew the Advisory Contracts for the fund, the Board reached a determination, with the assistance of fund counsel and Independent Trustees' counsel and through the exercise of its business judgment, that the renewal of the Advisory Contracts was in the best interests of the fund and its shareholders and that the compensation payable under the Advisory Contracts was fair and reasonable. The Board's decision to renew the Advisory Contracts was not based on any single factor, but rather was based on a comprehensive consideration of all the information provided to the Board at its meetings throughout the year. The Board, in reaching its determination to renew the Advisory Contracts, was aware that shareholders of the fund have a broad range of investment choices available to them, including a wide choice among funds offered by Fidelity's competitors, and that the fund's shareholders, who have the opportunity to review and weigh the disclosure provided by the fund in its prospectus and other public disclosures, have chosen to invest in this fund, which is part of the Fidelity family of funds.Nature, Extent, and Quality of Services Provided. The Board considered Fidelity's staffing as it relates to the fund, including the backgrounds of investment personnel of Fidelity, and also considered the fund's investment objective, strategies, and related investment philosophy. The Independent Trustees also had discussions with senior management of Fidelity's investment operations and investment groups. The Board considered the structure of the investment personnel compensation program and whether this structure provides appropriate incentives to act in the best interests of the fund. Additionally, the Board considered the portfolio managers' investments, if any, in the funds that they manage. The Board also considered the steps Fidelity had taken to ensure the continued provision of high quality services to the Fidelity funds during the COVID-19 pandemic, including the expansion of staff in client facing positions to maintain service levels in periods of high volumes and volatility.Resources Dedicated to Investment Management and Support Services. The Board and the Fund Oversight and Research Committees reviewed the general qualifications and capabilities of Fidelity's investment staff, including its size, education, experience, and resources, as well as Fidelity's approach to recruiting, training, managing, and compensating investment personnel. The Board noted the resources devoted to expansion of Fidelity's global investment organization, and that Fidelity's analysts have extensive resources, tools, and capabilities that allow them to conduct sophisticated quantitative and fundamental analysis, as well as credit analysis of issuers, counterparties, and guarantors. Further, the Board considered that Fidelity's investment professionals have sufficient access to global information and data so as to provide competitive investment results over time, and that those professionals also have access to sophisticated tools that permit them to assess portfolio construction and risk and performance attribution characteristics continuously, as well as to transmit new information and research conclusions rapidly around the world. Additionally, in its deliberations, the Board considered Fidelity's trading, risk management, compliance, and technology and operations capabilities and resources, which are integral parts of the investment management process.Shareholder and Administrative Services. The Board considered (i) the nature, extent, quality, and cost of advisory, administrative, and shareholder services performed by the Investment Advisers and their affiliates under the Advisory Contracts and under separate agreements covering transfer agency, pricing and bookkeeping, and securities lending services for the fund; (ii) the nature and extent of the supervision of third party service providers, principally custodians, subcustodians, and pricing vendors; and (iii) the resources devoted to, and the record of compliance with, the fund's compliance policies and procedures. The Board also reviewed the allocation of fund brokerage, including allocations to brokers affiliated with the Investment Advisers, the use of brokerage commissions to pay fund expenses, and the use of "soft" commission dollars to pay for research services.The Board noted that the growth of fund assets over time across the complex allows Fidelity to reinvest in the development of services designed to enhance the value and convenience of the Fidelity funds as investment vehicles. These services include 24-hour access to account information and market information over the Internet and through telephone representatives, investor education materials, and asset allocation tools. The Board also considered that it reviews customer service metrics such as telephone response times, continuity of services on the website and metrics addressing services at Fidelity Investor Centers.Investment in a Large Fund Family. The Board considered the benefits to shareholders of investing in a Fidelity fund, including the benefits of investing in a fund that is part of a large family of funds offering a variety of investment disciplines and providing a large variety of mutual fund investor services. The Board noted that Fidelity had taken, or had made recommendations that resulted in the Fidelity funds taking, a number of actions over the previous year that benefited particular funds, including: (i) continuing to dedicate additional resources to Fidelity's investment research process, which includes meetings with management of issuers of securities in which the funds invest; (ii) continuing efforts to enhance Fidelity's global research capabilities; (iii) launching new funds and ETFs with innovative structures, strategies and pricing and making other enhancements to meet client needs; (iv) launching new share classes of existing funds; (v) eliminating purchase minimums and broadening eligibility requirements for certain funds and share classes; (vi) reducing management fees and total expenses for certain target date funds and classes and index funds; (vii) lowering expenses for certain existing funds and classes by implementing or lowering expense caps; (viii) rationalizing product lines and gaining increased efficiencies from fund mergers and liquidations; (ix) continuing to develop, acquire and implement systems and technology to improve services to the funds and shareholders, strengthen information security, and increase efficiency; and (x) continuing to implement enhancements to further strengthen Fidelity's product line to increase investors' probability of success in achieving their investment goals, including retirement income goals.Investment Performance. The Board considered whether the fund has operated in accordance with its investment objective, as well as its record of compliance with its investment restrictions and its performance history. The Board noted that the fund had a portfolio manager change in August 2021. The Board will continue to monitor the fund's performance, taking into account the portfolio manager change.The Board took into account discussions that occur at Board meetings throughout the year with representatives of the Investment Advisers about fund investment performance. In this regard the Board noted that as part of regularly scheduled fund reviews and other reports to the Board on fund performance, the Board considers annualized return information for the fund for different time periods, measured against an appropriate securities market index (benchmark index). The Board also reviews and considers information about performance attribution. In its evaluation of fund investment performance, the Board gave particular attention to information indicating changes in performance of certain Fidelity funds for specific time periods and discussed with the Investment Advisers the reasons for any overperformance or underperformance.In addition to reviewing absolute and relative fund performance, the Independent Trustees periodically consider the appropriateness of fund performance metrics in evaluating the results achieved. In general, the Independent Trustees believe that fund performance should be evaluated based on net performance (after fees and expenses) of the representative class, compared to appropriate benchmark indices, over appropriate time periods that may include full market cycles, and compared to peer groups, as applicable, over the same periods, taking into account relevant factors including the following: general market conditions; issuer-specific information; and fund cash flows and other factors.The Independent Trustees recognize that shareholders evaluate performance on a net basis over their own holding periods, for which one-, three-, and five-year periods are often used as a proxy. For this reason, the performance information reviewed by the Board also included net cumulative total return information for the fund and an appropriate benchmark index for the most recent one-, three-, and five-year periods ended September 30, 2021, as shown below. A peer group is not shown below because the fund does not generally utilize a peer group for performance comparison purposes.Fidelity Mega Cap Stock Fund
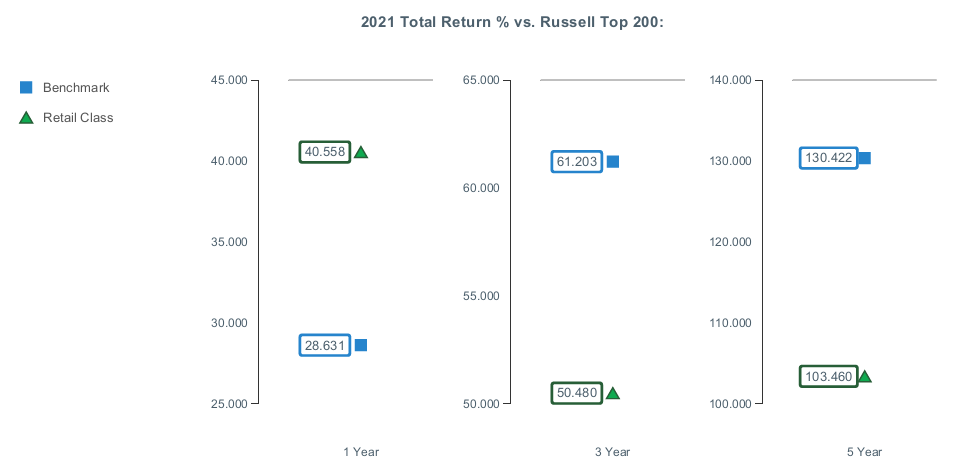
Fidelity Mega Cap Stock Fund
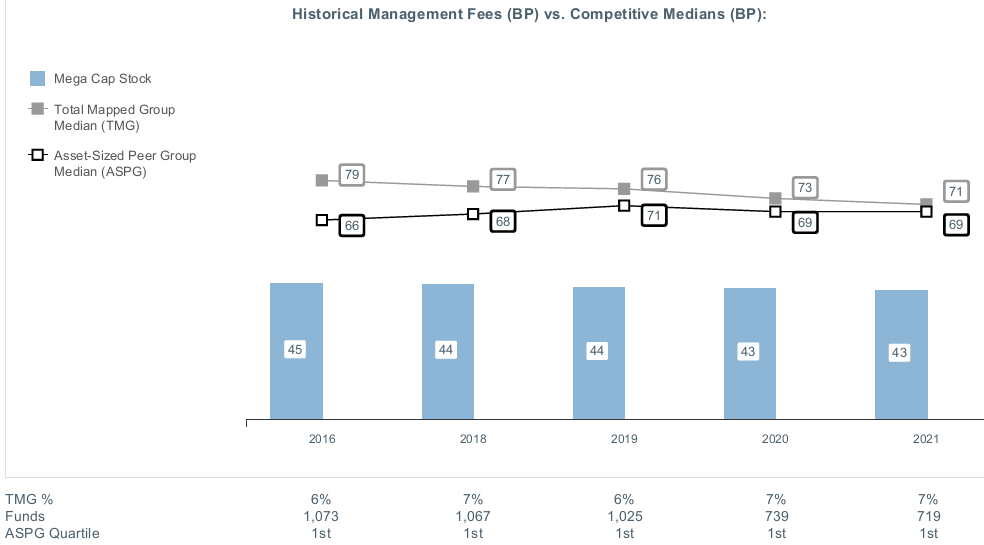
Liquidity Risk Management Program
The Securities and Exchange Commission adopted Rule 22e-4 under the Investment Company Act of 1940 (the Liquidity Rule) to promote effective liquidity risk management throughout the open-end investment company industry, thereby reducing the risk that funds will be unable to meet their redemption obligations and mitigating dilution of the interests of fund shareholders.
The Fund has adopted and implemented a liquidity risk management program pursuant to the Liquidity Rule (the Program) effective December 1, 2018. The Program is reasonably designed to assess and manage the Fund’s liquidity risk and to comply with the requirements of the Liquidity Rule. The Fund’s Board of Trustees (the Board) has designated the Fund’s investment adviser as administrator of the Program. The Fidelity advisers have established a Liquidity Risk Management Committee (the LRM Committee) to manage the Program for each of the Fidelity Funds. The LRM Committee monitors the adequacy and effectiveness of implementation of the Program and on a periodic basis assesses each Fund’s liquidity risk based on a variety of factors including (1) the Fund’s investment strategy, (2) portfolio liquidity and cash flow projections during normal and reasonably foreseeable stressed conditions, (3) shareholder redemptions, (4) borrowings and other funding sources and (5) in the case of exchange-traded funds, certain additional factors including the effect of the Fund’s prices and spreads, market participants, and basket compositions on the overall liquidity of the Fund’s portfolio, as applicable.
In accordance with the Program, each of the Fund’s portfolio investments is classified into one of four liquidity categories described below based on a determination of a reasonable expectation for how long it would take to convert the investment to cash (or sell or dispose of the investment) without significantly changing its market value.
- Highly liquid investments – cash or convertible to cash within three business days or less
- Moderately liquid investments – convertible to cash in three to seven calendar days
- Less liquid investments – can be sold or disposed of, but not settled, within seven calendar days
- Illiquid investments – cannot be sold or disposed of within seven calendar days
Liquidity classification determinations take into account a variety of factors including various market, trading and investment-specific considerations, as well as market depth, and generally utilize analysis from a third-party liquidity metrics service.
The Liquidity Rule places a 15% limit on a fund’s illiquid investments and requires funds that do not primarily hold assets that are highly liquid investments to determine and maintain a minimum percentage of the fund’s net assets to be invested in highly liquid investments (highly liquid investment minimum or HLIM). The Program includes provisions reasonably designed to comply with the 15% limit on illiquid investments and for determining, periodically reviewing and complying with the HLIM requirement as applicable.
At a recent meeting of the Fund’s Board of Trustees, the LRM Committee provided a written report to the Board pertaining to the operation, adequacy, and effectiveness of implementation of the Program for the annual period from December 1, 2020 through November 30, 2021. The report concluded that the Program has been implemented and is operating effectively and is reasonably designed to assess and manage the Fund’s liquidity risk.
![]()
GII-ANN-0822
1.723705.123
Item 2.
Code of Ethics
As of the end of the period, June 30, 2022, Fidelity Hastings Street Trust (the trust) has adopted a code of ethics, as defined in Item 2 of Form N-CSR, that applies to its President and Treasurer and its Chief Financial Officer. A copy of the code of ethics is filed as an exhibit to this Form N-CSR.
Item 3.
Audit Committee Financial Expert
The Board of Trustees of the trust has determined that Donald F. Donahue is an audit committee financial expert, as defined in Item 3 of Form N-CSR. Mr. Donahue is independent for purposes of Item 3 of Form N-CSR.
Item 4.
Principal Accountant Fees and Services
Fees and Services
The following table presents fees billed by PricewaterhouseCoopers LLP (“PwC”) in each of the last two fiscal years for services rendered to Fidelity Fund, Fidelity Growth Discovery Fund, Fidelity Mega Cap Stock Fund and Fidelity Series Large Cap Stock Fund (the “Funds”):
Services Billed by PwC
June 30, 2022 FeesA
Audit Fees | Audit-Related Fees | Tax Fees | All Other Fees | |
Fidelity Fund | $49,600 | $4,500 | $10,400 | $1,500 |
Fidelity Growth Discovery Fund | $35,100 | $3,400 | $9,100 | $1,100 |
Fidelity Mega Cap Stock Fund | $42,200 | $3,900 | $8,500 | $1,300 |
Fidelity Series Large Cap Stock Fund | $38,700 | $3,600 | $8,300 | $1,200 |
June 30, 2021 FeesA
Audit Fees | Audit-Related Fees | Tax Fees | All Other Fees | |
Fidelity Fund | $60,400 | $4,800 | $8,100 | $1,700 |
Fidelity Growth Discovery Fund | $34,100 | $3,400 | $8,300 | $1,200 |
Fidelity Mega Cap Stock Fund | $46,000 | $4,000 | $10,800 | $1,500 |
Fidelity Series Large Cap Stock Fund | $38,600 | $3,700 | $10,600 | $1,300 |
A Amounts may reflect rounding.
The following table(s) present(s) fees billed by PwC that were required to be approved by the Audit Committee for services that relate directly to the operations and financial reporting of the Fund(s) and that are rendered on behalf of Fidelity Management & Research Company LLC ("FMR") and entities controlling, controlled by, or under common control with FMR (not including any sub-adviser whose role is primarily portfolio management and is subcontracted with or overseen by another investment adviser) that provide ongoing services to the Fund(s) (“Fund Service Providers”):
Services Billed by PwC
June 30, 2022A | June 30, 2021A | |
Audit-Related Fees | $7,914,600 | $9,015,700 |
Tax Fees | $353,200 | $14,300 |
All Other Fees | $- | $- |
A Amounts may reflect rounding.
“Audit-Related Fees” represent fees billed for assurance and related services that are reasonably related to the performance of the fund audit or the review of the fund's financial statements and that are not reported under Audit Fees.
“Tax Fees” represent fees billed for tax compliance, tax advice or tax planning that relate directly to the operations and financial reporting of the fund.
“All Other Fees” represent fees billed for services provided to the fund or Fund Service Provider, a significant portion of which are assurance related, that relate directly to the operations and financial reporting of the fund, excluding those services that are reported under Audit Fees, Audit-Related Fees or Tax Fees.
Assurance services must be performed by an independent public accountant.
* * *
The aggregate non-audit fees billed by PwC for services rendered to the Fund(s), FMR (not including any sub-adviser whose role is primarily portfolio management and is subcontracted with or overseen by another investment adviser), and any Fund Service Provider for each of the last two fiscal years of the Fund(s) are as follows:
Billed By | June 30, 2022A | June 30, 2021A |
PwC | $13,342,000 | $14,342,100 |
A Amounts may reflect rounding.
The trust's Audit Committee has considered non-audit services that were not pre-approved that were provided by PwC to Fund Service Providers to be compatible with maintaining the independence of PwC in its(their) audit of the Fund(s), taking into account representations from PwC, in accordance with Public Company Accounting Oversight Board rules, regarding its independence from the Fund(s) and its(their) related entities and FMR’s review of the appropriateness and permissibility under applicable law of such non-audit services prior to their provision to the Fund(s) Service Providers.
Audit Committee Pre-Approval Policies and Procedures
The trust’s Audit Committee must pre-approve all audit and non-audit services provided by a fund’s independent registered public accounting firm relating to the operations or financial reporting of the fund. Prior to the commencement of any audit or non-audit services to a fund, the Audit Committee reviews the services to determine whether they are appropriate and permissible under applicable law.
The Audit Committee has adopted policies and procedures to, among other purposes, provide a framework for the Committee’s consideration of non-audit services by the audit firms that audit the Fidelity funds. The policies and procedures require that any non-audit service provided by a fund audit firm to a Fidelity fund and any non-audit service provided by a fund auditor to a Fund Service Provider that relates directly to the operations and financial reporting of a Fidelity fund (“Covered Service”) are subject to approval by the Audit Committee before such service is provided.
All Covered Services must be approved in advance of provision of the service either: (i) by formal resolution of the Audit Committee, or (ii) by oral or written approval of the service by the Chair of the Audit Committee (or if the Chair is unavailable, such other member of the Audit Committee as may be designated by the Chair to act in the Chair’s absence). The approval contemplated by (ii) above is permitted where the Treasurer determines that action on such an engagement is necessary before the next meeting of the Audit Committee.
Non-audit services provided by a fund audit firm to a Fund Service Provider that do not relate directly to the operations and financial reporting of a Fidelity fund are reported to the Audit Committee periodically.
Non-Audit Services Approved Pursuant to Rule 2-01(c)(7)(i)(C) and (ii) of Regulation S-X (“De Minimis Exception”)
There were no non-audit services approved or required to be approved by the Audit Committee pursuant to the De Minimis Exception during the Fund’s(s’) last two fiscal years relating to services provided to (i) the Fund(s) or (ii) any Fund Service Provider that relate directly to the operations and financial reporting of the Fund(s).
Item 5.
Audit Committee of Listed Registrants
Not applicable.
Item 6.
Investments
(a)
Not applicable.
(b)
Not applicable.
Item 7.
Disclosure of Proxy Voting Policies and Procedures for Closed-End Management Investment Companies
Not applicable.
Item 8.
Portfolio Managers of Closed-End Management Investment Companies
Not applicable.
Item 9.
Purchase of Equity Securities by Closed-End Management Investment Company and Affiliated Purchasers
Not applicable.
Item 10.
Submission of Matters to a Vote of Security Holders
There were no material changes to the procedures by which shareholders may recommend nominees to the trust’s Board of Trustees.
Item 11.
Controls and Procedures
(a)(i) The President and Treasurer and the Chief Financial Officer have concluded that the trust’s disclosure controls and procedures (as defined in Rule 30a-3(c) under the Investment Company Act) provide reasonable assurances that material information relating to the trust is made known to them by the appropriate persons, based on their evaluation of these controls and procedures as of a date within 90 days of the filing date of this report.
(a)(ii) There was no change in the trust’s internal control over financial reporting (as defined in Rule 30a-3(d) under the Investment Company Act) that occurred during the period covered by this report that has materially affected, or is reasonably likely to materially affect, the trust’s internal control over financial reporting.
Item 12.
Disclosure of Securities Lending Activities for Closed-End Management
Investment Companies
Not applicable.
Item 13.
Exhibits
(a) | (1) | Code of Ethics pursuant to Item 2 of Form N-CSR is filed and attached hereto as EX-99.CODE ETH. |
(a) | (2) | |
(a) | (3) | Not applicable. |
(b) |
SIGNATURES
Pursuant to the requirements of the Securities Exchange Act of 1934 and the Investment Company Act of 1940, the registrant has duly caused this report to be signed on its behalf by the undersigned, thereunto duly authorized.
Fidelity Hastings Street Trust
By: | /s/Stacie M. Smith |
Stacie M. Smith | |
President and Treasurer | |
Date: | August 19, 2022 |
Pursuant to the requirements of the Securities Exchange Act of 1934 and the Investment Company Act of 1940, this report has been signed below by the following persons on behalf of the registrant and in the capacities and on the dates indicated.
By: | /s/Stacie M. Smith |
Stacie M. Smith | |
President and Treasurer | |
Date: | August 19, 2022 |
By: | /s/John J. Burke III |
John J. Burke III | |
Chief Financial Officer | |
Date: | August 19, 2022 |