In recent months several issues in the mutual fund industry have come under the scrutiny of federal and state regulators.The fund’s Adviser and some of its affiliates have received requests for information from various government regulators regarding market timing, late trading, fees, and other mutual fund issues in connection with various investigations.The regulators appear to be examining, among other things, the fund’s response to market timing and shareholder exchange activity, including compliance with prospectus disclosure related to these subjects.The fund has been informed that the Adviser and its affiliates are responding to those information requests, but are not in a position to predict the outcome of these requests and investigations.
In November 2003, Citigroup Asset Management (“CAM”) disclosed an investigation by the Securities and Exchange Commission (“SEC”) and the U.S. Attorney relating to CAM’s entry into the transfer agency business during 1997-1999. Citigroup has disclosed that the Staff of the SEC is considering recommending a civil injunctive action and/or an administrative proceeding against certain advisory and transfer agent entities affiliated with Citigroup, the former CEO of CAM, a former employee and a current employee of CAM relating to the creation, operation and fees of its internal transfer agent unit that serves various CAM-managed funds. Citigroup is cooperating with the SEC and will seek to resolve this matter in discussion with the SEC Staff. Although there can be no assurance, Citigroup does not believe that this matter will have a material adverse effect on the fund.
As always, thank you for your confidence in our stewardship of your assets.We look forward to helping you continue to meet your financial goals.
M A N A G E R O V E R V I E W
Special Shareholder Notice
Effective November 1, 2004, the Smith Barney Small Cap Value Fund will consider small capitalization companies to be companies with market capitalization values not exceeding (i) $3 billion or (ii) the highest month-end market capitalization value of any stock in the Russell 2000 Index for the previous 12 months, whichever is greater. Securities of companies whose market capitalizations no longer meet this definition after purchase by the fund still will be considered to be securities of small capitalization companies for purposes of the fund’s 80% investment policy.
Effective May 7, 2004, Peter Hable, investment officer of Smith Barney Fund Management LLC (the “manager”), a managing director of Citigroup Global Markets, Inc, and president of Davis Skaggs Investment Management, a division of the manager, is the sole portfolio manager for the fund. Mr. Hable has been responsible for the day-to-day management of the fund’s portfolio since inception. Thomas B. Driscoll III, no longer assists in managing the portfolio.
On February 2, 2004, initial sales charges on Class L shares were eliminated. Effective April 29, 2004, Class L shares were renamed Class C shares.
Market Overview
Last year, the market for small capitalization stocks was characterized generally by dramatic outperformance by companies with the lowest share prices, smallest market capitalizations and little or no earnings.This year small-cap performance has been driven typically by companies with high returns on invested capital, healthy balance sheets, strong free cash flow profiles and larger market capitalizations. Given our focus on these higher-quality, small-cap companies, the fund’s performance for calendar 2004 is approximately in line with its Russell 2000 Value benchmark.With the dominance of micro-cap stocks in the fourth quarter of 2003, however, the fund’s performance for its fiscal year has slightly lagged its benchmark.
PERFORMANCE SNAPSHOT
AS OF SEPTEMBER 30, 2004
(excluding sales charges)
|
|
|
| | 6 Months | 12 Months |
|
| Class A Shares- Small Cap Value Fund | 2.37 | % | 22.35 | % |
|
| Russell 2000 Value Index | 1.00 | % | 25.66 | % |
|
| Lipper Small Cap Value Funds Category | | | | |
| Average | 0.88 | % | 23.87 | % |
|
The performance shown represents past performance. Past performance is no guarantee of future results and current performance may be higher or lower than the performance shown above. Principal value and investment returns will fluctuate and investors’ shares, when redeemed, may be worth more or less than their original cost. To obtain performance data current to the most recent month-end, please visit our website at www.smithbarneymutualfunds.com.
Class A share returns assume the reinvestment of income dividends and capital gains distributions at net asset value and the deduction of all fund expenses. Returns have not been adjusted to include sales charges that may apply when shares are purchased or the deduction of taxes that a shareholder would pay on fund distributions. Excluding sales charges, Class B shares returned 1.97%, Class C shares returned 1.92% and Class Y shares returned 2.50% over the six months ended September 30, 2004. Excluding sales charges, Class B shares returned 21.35%, Class C shares returned 21.36% and Class Y shares returned 22.71% over the 12 months ended September 30, 2004.
Performance figures may reflect reimbursements or fee waivers, without which the performance would have been lower.
Lipper, Inc. is a major independent mutual-fund tracking organization. Returns are based on the period ended September 30, 2004, calculated among the 251 funds for the six-month period and among the 237 funds for the 12-month period in the fund’s Lipper category including the reinvestment of dividends and capital gains, if any, and excluding sales charges.
Performance Review
For the 12 months ended September 30, 2004, Class A shares of the Smith Barney Small Cap Value Fund, excluding sales charges, returned 22.35% .These shares underperformed the fund’s unmanaged benchmark, the Russell 2000 Value Index,xi which returned 25.66% for the
| 1 | Lipper, Inc. is a major independent mutual-fund tracking organization. Average annual returns are based on the 12-month period ended September 30, 2004, calculated among the 237 funds in the fund’s Lipper category, including the reinvestment of dividends and capital gains, if any, and excluding sales charges. |
3 Smith Barney Small Cap Value Fund | 2004 Annual Report
same period.They also underperformed the Lipper small-cap value funds category average1, which was 23.87% .
Portfolio Update
Small capitalization stocks generally have outperformed large-cap stocks for over five years.This period of relative outperformance by small-cap stocks has narrowed the extreme valuation gap that we believe has existed between small- and large-cap companies since 1998. While this outperformance may have eliminated the potential for dramatic gains for small-caps relative to large companies, we believe many small-cap valuations imply that there still may be room to generate superior returns.
Last year, we argued that an economic recovery was unfolding and that corporate capital expenditures were accelerating. Consequently, the fund held overweighted positions in the industrials, technology and basic materials sectors, which served it well moving into early 2004. By this summer, however, higher oil prices, negative earnings surprises and downward earnings revisions had taken a toll on the small-cap market.While corporate profit growth slowed, it does not appear to us that profits are disappearing.We have begun to shift the fund’s exposure in the industrials sector towards companies that we believe will benefit from the later stages of an economic recovery.We also lowered the fund’s exposure to the basic materials and energy sectors, believing that commodity prices will show some signs of receding. As to technology, we expect the sector will show its seasonal strength in the fourth quarter after a summer dominated by negative earnings surprises.
With an increase in economic activity, we also anticipated an increase in interest rates. As a result, we underweighted those sectors that historically are often negatively impacted by rising interest rates, in particular, the financial and utility sectors.This call worked well for the fund into April as rates rose, but turned against the fund as longer rates declined during this summer’s economic doldrums. We continue to underweight these sectors, believing that rates will rise as the economy regains momentum and valuations are extended.We are especially concerned by what we believe to be the speculative fervor in small-cap banks and real estate investment trusts.
In terms of specific holdings, among the biggest positive contributors to the fund’s performance for the period were shares of Pentair Inc., a focused diversified industrial manufacturer that has operated in the water, enclosures and tools segments, XTO Energy Inc., a company engaged in the acquisition, development, exploitation and exploration of producing oil and gas properties, IKON Office Solutions Inc., a firm that integrates imaging systems and services that help businesses manage document workflow, Mueller Industries Inc., a manufacturer of copper, brass, plastic and aluminum products and Gibraltar Industries, Inc. (formerly Gibraltar Steel Corporation), a processor, manufacturer and distributor of an array of high value-added and high margin products and services.While the fund’s performance overall for the period was positive, some holdings detracted from performance. Stocks that detracted most from the fund’s performance were Bentley Pharmaceuticals Inc., a specialty pharmaceutical company focused on research, development and licensing of advanced drug delivery technologies and pharmaceutical products, Performance Food Group Co., a food service distributor that markets and distributes brand food and non-food products, Cabot Microelectronics Corp., a supplier of high-performance polishing slurries used in the manufacture of integrated circuit (IC) devices, MedQuist Inc., a comprehensive provider of health information solutions and services and Micromuse Inc., a provider of a suite of software products that enable business and service assurance for enterprises and service providers. At the close of the period, the fund still held shares of all of the companies listed as positive contributors and still holds shares in Bentley Pharmaceuticals Inc., Performance Food Group Co. and MedQuist Inc.
Thank you for your investment in the Smith Barney Small Cap Value Fund. As ever, we appreciate that you have chosen us to manage your assets and we remain focused on achieving the fund’s investment goals.
Sincerely,

Peter J. Hable
Vice President and
Investment Officer
November 10, 2004
4 Smith Barney Small Cap Value Fund | 2004 Annual Report
The information provided is not intended to be a forecast of future events, a guarantee of future results or investment advice. Views expressed may differ from those of the firm as a whole.
Portfolio holdings and breakdowns are as of September 30, 2004 and are subject to change and may not be representative of the portfolio manager’s current or future investments. The fund’s top ten holdings (as a % of net assets) as of this date were: Steiner Leisure Ltd. (1.53%), Pentair, Inc. (1.44%), IDEX Corp. (1.40%), Roper Industries, Inc. (1.40%), The Neiman Marcus Group, Inc., Class A Shares (1.39%), Gibraltar Steel Corp. (1.36%), AGCO Corp. (1.33%), Cummins Inc. (1.31%), RehabCare Group, Inc. (1.31%), Albany International Corp., Class A Shares (1.26%) . Please refer to pages 11 through 15 for a list and percentage breakdown of the fund’s holdings.
The mention of sector breakdowns is for informational purposes only and should not be construed as a recommendation to purchase or sell any securities. The information provided regarding such sectors is not a sufficient basis upon which to make an investment decision. Investors seeking financial advice regarding the appropriateness of investing in any securities or investment strategies discussed should consult their financial professional. Portfolio holdings are subject to change at any time and may not be representative of the portfolio manager’s current or future investments. The fund’s top five sector holdings (as a % of net assets) as of September 30, 2004 were: Industrial (27.9%); Financials (19.5%); Consumer Discretionary (12.6%); Information Technology (10.5%); Materials (6.6%) . The fund’s portfolio composition is subject to change at any time.
RISKS: Keep in mind, stocks of small-cap companies often experience sharper price fluctuations than stocks of large-cap companies. The fund may use derivatives, such as options and futures, which can be illiquid, may disproportionately increase losses, and have a potentially large impact on fund performance.
All index performance reflects no deduction for fees, expenses or taxes. Please note an investor cannot invest directly in an index.
| i | Gross domestic product is a market value of goods and services produced by labor and property in a given country. |
| | |
| ii | Source: Bureau of Economic Analysis, U.S. Department of Commerce, September 29, 2004. |
| | |
| iii | Source: Bureau of Labor Statistics, U.S. Department of Labor, October 8, 2004. |
| | |
| iv | Source: Consumer Confidence Index, The Conference Board, September 28, 2004. |
| | |
| v | The federal funds rate is the interest rate that banks with excess reserves at a Federal Reserve district bank charge other banks that need overnight loans. |
| | |
| vi | The Russell 2000 Index measures the performance of the 2000 smallest companies in the Russell 3000 Index, which represents approximately 8% of the total market capitalization of the Russell 3000 Index. |
| | |
| vii | The S&P 500 Index is a market capitalization-weighted index of 500 widely held common stocks. |
| | |
| viii | The Dow Jones Industrial Average is a widely followed measurement of the stock market. The average is comprised of 30 stocks that represent leading companies in major industries. These stocks, widely held by both individual and institutional investors, are considered to be all blue-chip companies. |
| | |
| ix | The MSCI World Index is a market capitalization weighted equity index of over 1,500 stocks traded in 22 world markets. |
| | |
| x | The Wilshire 5000 Index is the broadest stock market indicator covering the performance of the entire U.S. equity market, which consists of over 7,000 U.S. headquartered equity securities individually weighted by market capitalization. |
| | |
| xi | The Russell 2000 Value Index measures the performance of those Russell 2000 Index companies with lower price-to-book ratios and lower forecasted growth values. |
5 Smith Barney Small Cap Value Fund | 2004 Annual Report
Fund at a Glance (unaudited)
Investment Breakdown†
| |
|
| March 31, 2004 | | September 30, 2004 |
| |
|
 | |  |
† As a percentage of total investments. Please note that Fund holdings are subject to change.
6 Smith Barney Small Cap Value Fund | 2004 Annual Report
Fund Expenses (unaudited)
Example
As a shareholder of the Fund, you may incur two types of costs: (1) transaction costs, including front-end and back-end sales charges (loads) on purchase payments, reinvested dividends, or other distributions; and (2) ongoing costs, including management fees; distribution and/or service (12b-1) fees; and other Fund expenses.This example is intended to help you understand your ongoing costs (in dollars) of investing in the Fund and to compare these costs with the ongoing costs of investing in other mutual funds.
This Example is based on an investment of $1,000 invested on April 1, 2004 and held for the six months ended September 30, 2004.
Actual Expenses
The table below titled “Based on Actual Total Return” provides information about actual account values and actual expenses. You may use the information provided in this table, together with the amount you invested, to estimate the expenses that you paid over the period.To estimate the expenses you paid on your account, divide your ending account value by $1,000 (for example, an $8,600 ending account value divided by $1,000 = 8.6), then multiply the result by the number under the heading entitled “Expenses Paid During the Period”.
Based on Actual Total Return(1)
| | Actual | | | | | | | | | | | | | |
| | Total Return | | Beginning | | Ending | | Annualized | | Expenses |
| | Without | | Account | | Account | | Expense | | Paid During |
| | Sales Charges(2) | | Value | | Value | | Ratios | | the Period(3) |
|
| Class A | 2.37 | % | | $ | 1,000.00 | | | $ | 1,023.70 | | | 1.13 | % | | $5.72 |
|
| Class B | 1.97 | | | | 1,000.00 | | | | 1,019.70 | | | 1.92 | | | 9.69 |
|
| Class C(4) | 1.92 | | | | 1,000.00 | | | | 1,019.20 | | | 1.97 | | | 9.94 |
|
| Class Y | 2.50 | | | | 1,000.00 | | | | 1,025.00 | | | 0.85 | | | 4.30 |
|
| (1) | For the six months ended September 30, 2004. |
| |
| (2) | Assumes reinvestment of all dividends and capital gain distributions, if any, at net asset value and does not reflect the deduction of the applicable sales charges with respect to Class A shares or the applicable contingent deferred sales charge (“CDSC”) with respect to Class B and C shares. Total return is not annualized, as it may not be representative of the total return for the year. Performance figures may reflect fee waivers and/or expense reimbursements. Past performance is no guarantee of future results. In the absence of fee waivers and/or expense reimbursements, the total return would have been lower. |
| |
| (3) | Expenses (net of voluntary waiver) are equal to each class’ respective annualized expense ratio multiplied by the average account value over the period, multiplied by the number of days in the most recent fiscal half-year, then divided by 366. |
| |
| (4) | On April 29, 2004, Class L shares were renamed as Class C shares. |
| |
7 Smith Barney Small Cap Value Fund | 2004 Annual Report
Fund Expenses (unaudited) (continued)
Hypothetical Example for Comparison Purposes
The table below titled “Based on Hypothetical Total Return” provides information about hypothetical account values and hypothetical expenses based on the actual expense ratio and an assumed rate of return of 5.00% per year before expenses, which is not the Fund’s actual return.The hypothetical account values and expenses may not be used to estimate the actual ending account balance or expenses you paid for the period.You may use the information provided in this table to compare the ongoing costs of investing in the Fund and other funds. To do so, compare the 5.00% hypothetical example relating to the Fund with the 5.00% hypothetical examples that appear in the shareholder reports of the other funds.
Please note that the expenses shown in the table below are meant to highlight your ongoing costs only and do not reflect any transactional costs, such as front-end or back-end sales charges (loads). Therefore, the table is useful in comparing ongoing costs only, and will not help you determine the relative total costs of owning different funds. In addition, if these transaction costs were included, your costs would have been higher.
Based on Hypothetical Total Return(1)
| | Hypothetical | | Beginning | | Ending | | Annualized | | Expenses |
| | Annualized | | Account | | Account | | Expense | | Paid During |
| | Total Return | | Value | | Value | | Ratios | | the Period(2) |
|
| Class A | 5.00 | % | | $ | 1,000.00 | | | $ | 1,019.35 | | | 1.13 | % | | $5.70 |
|
| Class B | 5.00 | | | | 1,000.00 | | | | 1,015.40 | | | 1.92 | | | 9.67 |
|
| Class C(3) | 5.00 | | | | 1,000.00 | | | | 1,015.15 | | | 1.97 | | | 9.92 |
|
| Class Y | 5.00 | | | | 1,000.00 | | | | 1,020.75 | | | 0.85 | | | 4.29 |
|
| (1) | For the six months ended September 30, 2004. |
| |
| (2) | Expenses (net of voluntary waiver) are equal to each class’ respective annualized expense ratio multiplied by the average account value over the period, multiplied by the number of days in the most recent fiscal half-year, then divided by 366. |
| |
| (3) | On April 29, 2004, Class L shares were renamed as Class C shares. |
| |
8 Smith Barney Small Cap Value Fund | 2004 Annual Report
Average Annual Total Returns† (unaudited)
| | | Without Sales Charges(1) |
| |
|
| | | Class A | | Class B | | Class C(2) | | Class Y |
|
| Twelve Months Ended 9/30/04 | | 22.35 | % | | 21.35 | % | | 21.36 | % | | 22.71 | % |
|
| Inception* through 9/30/04 | | 15.56 | | | 14.68 | | | 14.67 | | | 34.25 | ‡ |
|
| | | With Sales Charges(3) |
| |
|
| | | Class A | | Class B | | Class C(2) | | Class Y |
|
| Twelve Months Ended 9/30/04 | | 16.23 | % | | 16.35 | % | | 20.36 | % | | 22.71 | % |
|
| Inception* through 9/30/04 | | 14.50 | | | 14.68 | | | 14.67 | | | 34.25 | ‡ |
|
Cumulative Total Returns† (unaudited)
| | | Without Sales Charges(1) |
|
| Class A (Inception* through 9/30/04) | | 124.45 | % |
|
| Class B (Inception* through 9/30/04) | | 115.10 | |
|
| Class C(2) (Inception* through 9/30/04) | | 115.03 | |
|
| Class Y (Inception* through 9/30/04) | | 53.87 | |
|
| (1 | ) | | Assumes reinvestment of all dividends and capital gain distributions, if any, at net asset value and does not reflect the deduction of the applicable sales charges with respect to Class A shares or the applicable contingent deferred sales charges (“CDSC”) with respect to Class B and C shares. |
| | | | |
| (2 | ) | | On April 29, 2004, Class L shares were renamed as Class C shares. |
| | | | |
| (3 | ) | | Assumes reinvestment of all dividends and capital gain distributions, if any, at net asset value. In addition, Class A shares reflect the deduction of the maximum sales charge of 5.00%; Class B shares reflect the deduction of a 5.00% CDSC, which applies if shares are redeemed within one year from purchase payment. Thereafter, this CDSC declines by 1.00% per year until no CDSC is incurred. Class C shares reflect the deduction of a 1.00% CDSC, which applies if shares are redeemed within one year from purchase payment. The 1.00% initial sales charge on Class C shares is no longer imposed effective February 2, 2004. |
| | | | |
| † | | | All figures represent past performance and are not a guarantee of future results. Investment return and principal value of an investment will fluctuate so that an investor’s shares, when redeemed, may be worth more or less than their original cost. The returns shown do not reflect the deduction of taxes that a shareholder would pay on fund distributions or the redemption of fund shares. Performance figures may reflect fee waivers and/or expense reimbursements. In the absence of fee waivers and/or expense reimbursements, the total return would have been lower. |
| | | | |
| * | | | Inception date for Class A, B and C shares is February 26, 1999. Inception date for Class Y shares is April 14, 2003. |
| | | | |
| ‡ | | | Total return is not annualized, as it may not be representative of the total return for the year. |
9 Smith Barney Small Cap Value Fund | 2004 Annual Report
Historical Performance (unaudited)
Value of $10,000 Invested in Class A, B and C Shares of the Smith Barney Small Cap Value Fund
vs. the Russell 2000 Value Index†
February 1999 — September 2004
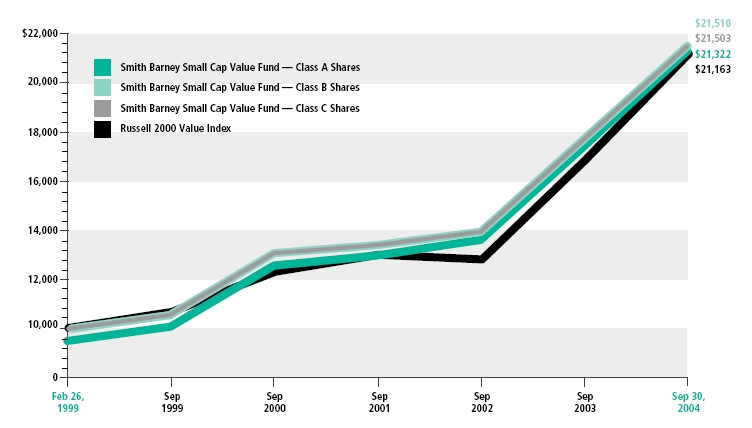
| † | Hypothetical illustration of $10,000 invested in Class A, B and C shares at inception on February 26, 1999, assuming deduction of the maximum 5.00% sales charge at the time of investment for Class A shares; and the deduction of the maximum 5.00% and 1.00% CDSC for Class B and C shares, respectively. It also assumes reinvestment of dividends and capital gains, if any, at net asset value through September 30, 2004. The Russell 2000 Value Index is a capitalization weighted total return index which is comprised of 2,000 of the smallest capitalized U.S. domiciled companies with less-than-average growth orientation whose common stock is traded in the United States on the New York Stock Exchange, American Stock Exchange and NASDAQ. The Index is unmanaged and is not subject to the same management and trading expenses as a mutual fund. Please note that an investor cannot invest directly in an index.
All figures represent past performance and are not a guarantee of future results. Investment return and principal value of an investment will fluctuate so that an investor’s shares, when redeemed, may be worth more or less than their original cost. The returns shown do not reflect the deduction of taxes that a shareholder would pay on fund distributions or the redemption of fund shares. Performance figures may reflect fee waivers and/or expense reimbursements. In the absence of fee waivers and/or expense reimbursements, the total return would have been lower. |
10 Smith Barney Small Cap Value Fund | 2004 Annual Report
|
| Schedule of Investments | September 30, 2004 |
|
| |
| |
| SHARES | | SECURITY | | VALUE |
|
| COMMON STOCK — 94.0% | | | |
| CONSUMER DISCRETIONARY — 12.6% | | | |
| Auto Components — 2.1% | | | |
| 404,200 | | Sauer-Danfoss, Inc. | | $ | 6,903,736 |
| 244,100 | | Wabtec Corp. | | | 4,562,229 |
|
| | | | | | 11,465,965 |
|
| Hotels, Restaurants & Leisure — 1.6% | | | |
| 264,300 | | Benihana Inc., Class A Shares* | | | 3,536,334 |
| 305,100 | | O’Charley’s Inc.* | | | 4,973,130 |
|
| | | | | | 8,509,464 |
|
| Household Durables — 1.6% | | | |
| 224,600 | | Furniture Brands International, Inc. | | | 5,632,968 |
| 117,200 | | Snap-on Inc. | | | 3,230,032 |
|
| | | | | | 8,863,000 |
|
| Multiline Retail — 2.4% | | | |
| 293,075 | | Dillard’s, Inc., Class A Shares | | | 5,785,300 |
| 133,300 | | The Neiman Marcus Group, Inc., Class A Shares | | | 7,664,750 |
|
| | | | | | 13,450,050 |
|
| Specialty Retail — 3.8% | | | |
| 164,000 | | The Buckle, Inc. | | | 4,505,080 |
| 278,200 | | The Cato Corp., Class A Shares | | | 6,189,950 |
| 117,700 | | DEB Shops, Inc. | | | 2,871,880 |
| 177,400 | | Linens ‘n Things, Inc.* | | | 4,110,358 |
| 275,600 | | Pomeroy IT Solutions, Inc.* | | | 3,489,096 |
|
| | | | | | 21,166,364 |
|
| Textiles & Apparel — 1.1% | | | |
| 106,900 | | The Timberland Co., Class A Shares* | | | 6,071,920 |
|
| | | TOTAL CONSUMER DISCRETIONARY | | | 69,526,763 |
|
| CONSUMER STAPLES — 4.6% | | | |
| Food & Drug Retailing — 0.9% | | | |
| 194,400 | | Performance Food Group Co.* | | | 4,607,280 |
|
| Food Products — 2.2% | | | |
| 346,400 | | Hain Celestial Group, Inc.* | | | 6,124,352 |
| 282,200 | | Sensient Technologies Corp. | | | 6,106,808 |
|
| | | | | | 12,231,160 |
|
| Personal Products — 1.5% | | | |
| 381,150 | | Steiner Leisure Ltd.* | | | 8,423,415 |
|
| | | TOTAL CONSUMER STAPLES | | | 25,261,855 |
|
| ENERGY — 5.1% | | | |
| Energy Equipment & Services — 1.5% | | | |
| 80,800 | | RPC, Inc. | | | 1,444,704 |
| 259,000 | | Varco International, Inc.* | | | 6,946,380 |
|
| | | | | | 8,391,084 |
|
See Notes to Financial Statements.
11 Smith Barney Small Cap Value Fund | 2004 Annual Report
|
Schedule of Investments (continued) | September 30, 2004 |
|
| |
| |
| SHARES | | SECURITY | | VALUE |
|
| Oil & Gas — 3.6% | | | |
| 265,300 | | Denbury Resources Inc.* | | $ | 6,738,620 |
| 60,628 | | Newfield Exploration Co.* | | | 3,712,859 |
| 175,000 | | Todco, Class A Shares* | | | 3,036,250 |
| 198,791 | | XTO Energy, Inc. | | | 6,456,732 |
|
| | | | | | 19,944,461 |
|
| | | TOTAL ENERGY | | | 28,335,545 |
|
| FINANCIALS — 19.5% | | | |
Banks — 8.6% | | | |
| 88,700 | | AMCORE Financial, Inc. | | | 2,517,306 |
| 67,700 | | BancTrust Financial Group, Inc. | | | 1,272,760 |
| 22,600 | | CityBank | | | 790,548 |
| 119,900 | | Corus Bankshares, Inc. | | | 5,171,287 |
| 121,300 | | Cullen/Frost Bankers, Inc. | | | 5,636,811 |
| 87,400 | | Downey Financial Corp. | | | 4,803,504 |
| 242,200 | | First Charter Corp. | | | 5,853,974 |
| 125,600 | | First State Bancorp. | | | 3,960,168 |
| 37,900 | | IBERIABANK Corp. | | | 2,187,588 |
| 168,733 | | Pacific Capital Bancorp | | | 4,991,122 |
| 108,275 | | Sterling Bancorp | | | 2,928,839 |
| 119,400 | | Umpqua Holdings Corp. | | | 2,693,664 |
| 93,700 | | Webster Financial Corp. | | | 4,627,843 |
|
| | | | | | 47,435,414 |
|
| Diversified Financials — 1.9% | | | |
| 113,500 | | Financial Federal Corp.* | | | 4,253,980 |
| 271,000 | | First Albany Cos. Inc. | | | 2,476,940 |
| 124,300 | | Portfolio Recovery Associates, Inc.* | | | 3,653,177 |
|
| | | | | | 10,384,097 |
|
| Insurance — 3.7% | | | |
| 291,000 | | CNA Surety Corp.* | | | 3,084,600 |
| 201,100 | | The Midland Co. | | | 5,500,085 |
| 109,300 | | RLI Corp. | | | 4,104,215 |
| 233,900 | | Scottish Re Group Ltd. | | | 4,951,663 |
| 54,200 | | Triad Guaranty Inc.* | | | 3,007,016 |
|
| | | | | | 20,647,579 |
|
Real Estate — 5.3% | | | |
| 118,700 | | American Land Lease, Inc. | | | 2,302,780 |
| 106,200 | | Cousins Properties, Inc. | | | 3,643,722 |
| 83,200 | | Duke Realty Corp. | | | 2,762,240 |
| 181,900 | | Equity One, Inc. | | | 3,568,878 |
| 265,400 | | Host Marriott Corp.* | | | 3,723,562 |
| 162,300 | | LaSalle Hotel Properties | | | 4,479,480 |
| 74,000 | | Liberty Property Trust | | | 2,948,160 |
| 102,600 | | Pan Pacific Retail Properties, Inc. | | | 5,550,660 |
|
| | | | | | 28,979,482 |
|
| | | TOTAL FINANCIALS | | | 107,446,572 |
|
See Notes to Financial Statements.
12 Smith Barney Small Cap Value Fund | 2004 Annual Report
|
| Schedule of Investments (continued) | September 30, 2004 |
|
| |
| |
| SHARES | | SECURITY | | VALUE |
|
| HEALTHCARE — 5.8% | | | |
| Healthcare Providers & Services — 5.3% | | | |
| 88,200 | | AMERIGROUP Corp.* | | $ | 4,961,250 |
| 217,600 | | Apria Healthcare Group, Inc.* | | | 5,929,600 |
| 382,100 | | Cross Country Healthcare, Inc.* | | | 5,922,550 |
| 192,200 | | National Dentex Corp.* | | | 5,416,196 |
| 312,900 | | RehabCare Group, Inc.* | | | 7,206,087 |
|
| | | | | | 29,435,683 |
|
| Pharmaceuticals — 0.5% | | | |
| 256,500 | | Bentley Pharmaceuticals, Inc.* | | | 2,716,335 |
|
| | | TOTAL HEALTHCARE | | | 32,152,018 |
|
| INDUSTRIALS — 27.9% | | | |
| Aerospace & Defense — 1.5% | | | |
| 128,000 | | DRS Technologies, Inc.* | | | 4,792,320 |
| 96,200 | | The Fairchild Corp., Class A Shares* | | | 382,876 |
| 235,200 | | HEICO Corp., Class A Shares | | | 3,170,496 |
|
| | | | | | 8,345,692 |
|
Airlines — 1.0% | | | |
| 355,100 | | SkyWest, Inc. | | | 5,344,255 |
|
| Building Products — 1.8% | | | |
| 209,300 | | Crane Co. | | | 6,052,956 |
| 337,800 | | Patrick Industries, Inc.* | | | 4,036,710 |
|
| | | | | | 10,089,666 |
|
| Commercial Services & Supplies — 5.9% | | | |
| 123,000 | | John H. Harland Co. | | | 3,856,050 |
| 430,700 | | Labor Ready, Inc.* | | | 6,038,414 |
| 388,500 | | MedQuist Inc.* | | | 5,069,925 |
| 240,900 | | Pegasus Solutions, Inc.* | | | 2,871,528 |
| 701,200 | | Stonepath Group, Inc.* | | | 638,092 |
| 158,785 | | United Stationers Inc.* | | | 6,891,269 |
| 260,100 | | Watson Wyatt & Co. Holdings | | | 6,840,630 |
|
| | | | | | 32,205,908 |
|
| Construction & Engineering — 0.7% | | | |
| 102,100 | | EMCOR Group, Inc.* | | | 3,841,002 |
|
| Electrical Equipment — 0.3% | | | |
| 109,500 | | Powell Industries, Inc.* | | | 1,845,075 |
|
| Machinery — 14.7% | | | |
| 324,700 | | AGCO Corp.* | | | 7,344,714 |
| 233,800 | | Albany International Corp., Class A Shares | | | 6,969,578 |
| 98,000 | | Cummins Inc. | | | 7,241,220 |
| 110,100 | | Harsco Corp. | | | 4,943,490 |
| 227,800 | | IDEX Corp. | | | 7,736,088 |
| 238,400 | | Kaydon Corp. | | | 6,858,768 |
| 125,500 | | Kennametal Inc. | | | 5,666,325 |
| 154,200 | | Lindsay Manufacturing Co. | | | 4,137,186 |
| 159,200 | | Mueller Industries, Inc. | | | 6,837,640 |
See Notes to Financial Statements.
13 Smith Barney Small Cap Value Fund | 2004 Annual Report
|
| Schedule of Investments (continued) | September 30, 2004 |
|
| |
| |
| SHARES | | SECURITY | | VALUE |
|
| Machinery — 14.7% (continued) | | | |
| 160,900 | | Navistar International Corp.* | | $ | 5,983,871 |
| 227,500 | | Pentair, Inc. | | | 7,942,025 |
| 74,400 | | Thomas Industries Inc. | | | 2,336,160 |
| 270,100 | | The Timken Co. | | | 6,649,862 |
|
| | | | | | 80,646,927 |
|
Marine — 0.8% | | | |
| 114,200 | | Kirby Corp.* | | | 4,585,130 |
|
| Road & Rail — 1.2% | | | |
| 184,500 | | Arkansas Best Corp. | | | 6,756,390 |
|
| | | TOTAL INDUSTRIALS | | | 153,660,045 |
|
| INFORMATION TECHNOLOGY — 10.5% | | | |
| Communications Equipment — 0.7% | | | |
| 62,300 | | Bel Fuse Inc., Class B Shares | | | 2,060,884 |
| 44,100 | | Black Box Corp. | | | 1,629,495 |
|
| | | | | | 3,690,379 |
|
| Computers & Peripherals — 1.7% | | | |
| 154,600 | | Electronics for Imaging, Inc.* | | | 2,510,704 |
| 148,100 | | Mercury Computer Systems, Inc.* | | | 3,986,852 |
| 199,500 | | Rimage Corp.* | | | 2,793,000 |
|
| | | | | | 9,290,556 |
|
| Electronic Equipment & Instruments — 3.4% | | | |
| 211,900 | | Exar Corp.* | | | 3,000,504 |
| 134,400 | | Roper Industries, Inc. | | | 7,722,624 |
| 92,300 | | Tech Data Corp.* | | | 3,558,165 |
| 337,200 | | Woodhead Industries, Inc. | | | 4,653,360 |
|
| | | | | | 18,934,653 |
|
| Internet Software & Services — 0.6% | | | |
| 156,600 | | McAfee Inc.* | | | 3,147,660 |
|
| IT Consulting & Services — 0.4% | | | |
| 134,100 | | Perot Systems Corp., Class A Shares* | | | 2,153,646 |
|
| Office Electronics — 1.0% | | | |
| 469,600 | | IKON Office Solutions, Inc. | | | 5,644,592 |
|
| Software — 2.7% | | | |
| 255,400 | | Dendrite International, Inc.* | | | 4,117,048 |
| 270,600 | | EPIQ Systems, Inc.* | | | 4,215,948 |
| 310,100 | | Inet Technologies, Inc.* | | | 3,901,058 |
| 231,400 | | NetIQ Corp.* | | | 2,475,980 |
|
| | | | | | 14,710,034 |
|
| | | TOTAL INFORMATION TECHNOLOGY | | | 57,571,520 |
|
See Notes to Financial Statements.
14 Smith Barney Small Cap Value Fund | 2004 Annual Report
|
| Schedule of Investments (continued) | September 30, 2004 |
|
| |
| |
| SHARES | | SECURITY | | VALUE |
|
| MATERIALS — 6.6% | | | |
| Chemicals — 2.3% | | | |
| 197,500 | | A. Schulman, Inc. | | $ | 4,352,900 |
| 78,900 | | Cabot Corp. | | | 3,043,173 |
| 259,300 | | Millennium Chemicals Inc.* | | | 5,499,753 |
|
| | | | | | 12,895,826 |
|
| Containers & Packaging — 2.1% | | | |
| 128,100 | | AptarGroup, Inc. | | | 5,632,557 |
| 295,700 | | Smurfit-Stone Container Corp.* | | | 5,727,709 |
|
| | | | | | 11,360,266 |
|
| Metals & Mining — 1.4% | | | |
| 207,200 | | Gibraltar Steel Corp. | | | 7,492,352 |
|
| Paper & Forest Products — 0.8% | | | |
| 255,400 | | Pope & Talbot, Inc. | | | 4,495,040 |
|
| | | TOTAL MATERIALS | | | 36,243,484 |
|
| |
| UTILITIES — 1.4% | | | |
| Electric Utilities — 0.3% | | | |
| 46,000 | | MGE Energy, Inc. | | | 1,463,720 |
|
| Gas Utilities — 1.1% | | | |
| 79,000 | | New Jersey Resources Corp. | | | 3,270,600 |
| 98,300 | | Northwest Natural Gas Co. | | | 3,119,059 |
|
| | | | | | 6,389,659 |
|
| | | TOTAL UTILITIES | | | 7,853,379 |
|
| | | TOTAL COMMON STOCK | | | |
| | | (Cost — $400,285,862) | | | 518,051,181 |
|
| |
| FACE | | | | | |
| AMOUNT | | | | | |
|
| REPURCHASE AGREEMENT — 5.1% | | | |
| $ | 28,230,000 | | Bank of America dated 9/30/04, 1.830% due 10/1/04; Proceeds at maturity — $28,231,435; | |
| | | (Fully collateralized by various U.S. Government Agency Obligations 0.000% to 6.625%, | |
| | | due 2/14/05 to 10/15/14; Market value — $28,794,617) | | | |
| | | (Cost — $28,230,000) | | | 28,230,000 |
|
| | | TOTAL INVESTMENTS — 99.1% (Cost — $428,515,862**) | | | 546,281,181 |
| | | Other Assets in Excess of Liabilities — 0.9% | | | 4,927,452 |
|
| | | TOTAL NET ASSETS — 100.0% | | $ | 551,208,633 |
|
| * | Non-income producing security. | | | |
| ** | Aggregate cost for Federal income tax purposes is $428,259,895. | | | |
See Notes to Financial Statements.
15 Smith Barney Small Cap Value Fund | 2004 Annual Report
|
| Statement of Assets and Liabilities | September 30, 2004 |
|
| ASSETS: | | | |
| Investments, at value (Cost — $428,515,862) | | $ | 546,281,181 |
| Cash | | | 643 |
| Receivable for securities sold | | | 4,755,896 |
| Receivable for Fund shares sold | | | 1,119,001 |
| Dividends and interest receivable | | | 379,442 |
| Prepaid expenses | | | 24,528 |
|
| Total Assets | | | 552,560,691 |
|
| LIABILITIES: | | | |
| Payable for Fund shares reacquired | | | 646,990 |
| Management fee payable | | | 332,884 |
| Distribution plan fees payable | | | 127,209 |
| Payable for securities purchased | | | 63,591 |
| Accrued expenses | | | 181,384 |
|
| Total Liabilities | | | 1,352,058 |
|
| Total Net Assets | | $ | 551,208,633 |
|
| NET ASSETS: | | | |
| Par value of capital shares ($0.001 par value, 10,000,000,000 shares authorized) | | $ | 26,312 |
| Capital paid in excess of par value | | | 412,987,571 |
| Accumulated net realized gain from investment transactions and futures contracts | | | 20,429,431 |
| Net unrealized appreciation of investments | | | 117,765,319 |
|
| Total Net Assets | | $ | 551,208,633 |
|
| Shares Outstanding: | | | |
| Class A | | | 9,690,912 |
|
| Class B | | | 6,899,287 |
|
| Class C | | | 6,872,158 |
|
| Class Y | | | 2,849,804 |
|
| Net Asset Value: | | | |
| Class A (and redemption price) | | | $21.19 |
|
| Class B * | | | $20.71 |
|
| Class C * | | | $20.70 |
|
| Class Y (and redemption price) | | | $21.29 |
|
| Maximum Public Offering Price Per Share: | | | |
| Class A (based on maximum sales charge of 5.00%) | | | $22.30 |
|
| |
* Redemption price is NAV of Class B and C shares reduced by a 5.00% and 1.00% contingent deferred sales charge, respectively, if shares are redeemed within one year from purchase (See Note 2). |
See Notes to Financial Statements.
16 Smith Barney Small Cap Value Fund | 2004 Annual Report
|
| Statement of Operations | For the Year Ended September 30, 2004 |
|
| INVESTMENT INCOME: |
| Dividends | | $ | 5,123,344 | |
| Interest | | | 233,777 | |
|
| Total Investment Income | | | 5,357,121 | |
|
| EXPENSES: |
| Management fee (Note 2) | | | 3,498,018 | |
| Distribution plan fees (Notes 2 and 4) | | | 3,129,365 | |
| Transfer agency services (Notes 2 and 4) | | | 560,064 | |
| Shareholder communications (Note 4) | | | 79,894 | |
| Custody | | | 46,314 | |
| Audit and legal | | | 40,335 | |
| Registration fees | | | 37,884 | |
| Directors’ fees | | | 29,463 | |
| Other | | | 9,384 | |
|
| Total Expenses | | | 7,430,721 | |
| Less: Management fee waiver (Notes 2 and 8) | | | (79,674 | ) |
|
| Net Expenses | | | 7,351,047 | |
|
| Net Investment Loss | | | (1,993,926 | ) |
|
| REALIZED AND UNREALIZED GAIN ON INVESTMENTS AND FUTURES CONTRACTS (NOTES 1 AND 3) |
| Net Realized Gain From: | | | | |
| Investment transactions | | | 27,331,127 | |
| Futures contracts | | | 707,200 | |
|
| Net Realized Gain | | | 28,038,327 | |
|
| Net Increase in Unrealized Appreciation on Investments | | 58,847,882 | |
|
| Net Gain on Investments and Futures Contracts | | | 86,886,209 | |
|
| Increase in Net Assets From Operations | $ | 84,892,283 | |
|
See Notes to Financial Statements.
17 Smith Barney Small Cap Value Fund | 2004 Annual Report
|
| Statements of Changes in Net Assets | For the Years Ended September 30, |
|
| | | | |
| | 2004 | | 2003 |
|
| OPERATIONS: | | | | | | | |
| Net investment loss | $ | (1,993,926 | ) | | $ | (568,869 | ) |
| Net realized gain | | 28,038,327 | | | | 21,116,524 | |
| Net increase in unrealized appreciation | | 58,847,882 | | | | 52,222,041 | |
|
| Increase in Net Assets From Operations | | 84,892,283 | | | | 72,769,696 | |
|
| DISTRIBUTIONS TO SHAREHOLDERS FROM (NOTE 5): | | | | | | | |
| Net realized gains | | (22,270,541 | ) | | | (3,960,523 | ) |
|
| Decrease in Net Assets From Distributions to Shareholders | | (22,270,541 | ) | | | (3,960,523 | ) |
|
| FUND SHARE TRANSACTIONS (NOTE 6): | | | | | | | |
| Net proceeds from sale of shares | | 194,505,372 | | | | 88,969,059 | |
| Net asset value of shares issued for reinvestment of distributions | | 21,127,525 | | | | 3,750,624 | |
| Cost of shares reacquired | | (96,095,589 | ) | | | (68,896,536 | ) |
|
| Increase in Net Assets From Fund Share Transactions | | 119,537,308 | | | | 23,823,147 | |
|
| Increase in Net Assets | | 182,159,050 | | | | 92,632,320 | |
| | | | | | | | |
| NET ASSETS: | | | | | | | |
| Beginning of year | | 369,049,583 | | | | 276,417,263 | |
|
| End of year* | $ | 551,208,633 | | | $ | 369,049,583 | |
|
| * Includes undistributed net investment income of: | | — | | | $ | 64,621 | |
|
See Notes to Financial Statements.
18 Smith Barney Small Cap Value Fund | 2004 Annual Report
Financial Highlights
For a share of capital stock outstanding throughout each year ended September 30, unless otherwise noted:
| Class A Shares(1) | | 2004 | | 2003 | | 2002 | | 2001 | | 2000 |
|
| Net Asset Value, Beginning of Year | | | $18.24 | | | | $14.45 | | | | $14.19 | | | | $14.85 | | | | $12.10 | |
|
| Income From Operations: | | | | | | | | | | | | | | | | | | | | |
| Net investment income | | | 0.00 | * | | | 0.06 | | | | 0.09 | | | | 0.20 | | | | 0.16 | |
| Net realized and unrealized gain | | | 4.01 | | | | 3.94 | | | | 0.64 | | | | 0.27 | | | | 2.78 | |
|
| Total Income From Operations | | | 4.01 | | | | 4.00 | | | | 0.73 | | | | 0.47 | | | | 2.94 | |
|
| Less Distributions From: | | | | | | | | | | | | | | | | | | | | |
| Net investment income | | | — | | | | — | | | | (0.14 | ) | | | (0.18 | ) | | | (0.19 | ) |
| Net realized gains | | | (1.06 | ) | | | (0.21 | ) | | | (0.33 | ) | | | (0.95 | ) | | | — | |
|
| Total Distributions | | | (1.06 | ) | | | (0.21 | ) | | | (0.47 | ) | | | (1.13 | ) | | | (0.19 | ) |
|
| Net Asset Value, End of Year | | | $21.19 | | | | $18.24 | | | | $14.45 | | | | $14.19 | | | | $14.85 | |
|
| Total Return(2) | | | 22.35 | % | | | 27.98 | % | | | 4.88 | % | | | 3.26 | % | | | 24.71 | % |
|
| Net Assets, End of Year (000s) | | $ | 205,357 | | | $ | 101,798 | | | $ | 72,196 | | | $ | 52,670 | | | $ | 40,693 | |
|
| Ratios to Average Net Assets: | | | | | | | | | | | | | | | | | | | | |
| Expenses | | | 1.14 | %(3) | | 1.19 | % | | | 1.18 | % | | | 1.20 | % | | | 1.28 | % |
| Net investment income | | | 0.02 | | | | 0.36 | | | | 0.58 | | | | 1.33 | | | | 1.28 | |
|
| Portfolio Turnover Rate | | | 31 | % | | | 68 | % | | | 49 | % | | | 47 | % | | | 48 | % |
|
| (1 | ) | | Per share amounts have been calculated using the monthly average shares method. |
| | | | |
| (2 | ) | | Performance figures may reflect fee waivers and/or expense reimbursements. Past performance is no guarantee of future results. In the absence of fee waivers and/or expense reimbursements, the total return would have been lower. |
| | | |
| (3 | ) | | The investment manager waived a portion of its management fee for the year ended September 30, 2004. If such fees were not waived, the actual expense ratio for Class A shares would have been 1.16%. |
| | | |
| * | | | Amount represents less than $0.01 per share. |
See Notes to Financial Statements.
19 Smith Barney Small Cap Value Fund | 2004 Annual Report
Financial Highlights (continued)
For a share of capital stock outstanding throughout each year ended September 30, unless otherwise noted:
| Class B Shares(1) | | 2004 | | 2003 | | 2002 | | 2001 | | 2000 |
|
| Net Asset Value, Beginning of Year | | | $17.99 | | | | $14.35 | | | | $14.10 | | | | $14.76 | | | | $12.05 | |
|
| Income (Loss) From Operations: | | | | | | | | | | | | | | | | | | | | |
| Net investment income (loss) | | | (0.15 | ) | | | (0.06 | ) | | | (0.03 | ) | | | 0.08 | | | | 0.07 | |
| Net realized and unrealized gain | | | 3.93 | | | | 3.91 | | | | 0.63 | | | | 0.28 | | | | 2.76 | |
|
| Total Income From Operations | | | 3.78 | | | | 3.85 | | | | 0.60 | | | | 0.36 | | | | 2.83 | |
|
| Less Distributions From: | | | | | | | | | | | | | | | | | | | | |
| Net investment income | | | — | | | | — | | | | (0.02 | ) | | | (0.07 | ) | | | (0.12 | ) |
| Net realized gains | | | (1.06 | ) | | | (0.21 | ) | | | (0.33 | ) | | | (0.95 | ) | | | — | |
|
| Total Distributions | | | (1.06 | ) | | | (0.21 | ) | | | (0.35 | ) | | | (1.02 | ) | | | (0.12 | ) |
|
| Net Asset Value, End of Year | | | $20.71 | | | | $17.99 | | | | $14.35 | | | | $14.10 | | | | $14.76 | |
|
| Total Return(2) | | | 21.35 | % | | | 27.12 | % | | | 4.03 | % | | | 2.52 | % | | | 23.70 | % |
|
| Net Assets, End of Year (000s) | | $ | 142,896 | | | $ | 131,657 | | | $ | 112,946 | | | $ | 83,426 | | | $ | 65,125 | |
|
| Ratios to Average Net Assets: | | | | | | | | | | | | | | | | | | | | |
| Expenses | | | 1.91 | %(3) | | 1.95 | % | | | 1.94 | % | | | 1.97 | % | | | 2.04 | % |
| Net investment income (loss) | | | (0.77 | ) | | | (0.41 | ) | | | (0.19 | ) | | | 0.56 | | | | 0.52 | |
|
| Portfolio Turnover Rate | | | 31 | % | | | 68 | % | | | 49 | % | | | 47 | % | | | 48 | % |
|
| (1) | Per share amounts have been calculated using the monthly average shares method. |
| |
| (2) | Performance figures may reflect fee waivers and/or expense reimbursements. Past performance is no guarantee of future results. In the absence of fee waivers and/or expense reimbursements, the total return would have been lower. |
| |
| (3) | The investment manager waived a portion of its management fee for the year ended September 30, 2004. If such fees were not waived, the actual expense ratio for Class B shares would have been 1.93%. |
See Notes to Financial Statements.
20 Smith Barney Small Cap Value Fund | 2004 Annual Report
Financial Highlights (continued)
For a share of capital stock outstanding throughout each year ended September 30, unless otherwise noted:
| Class C Shares(1) | | 2004 | | 2003 | | 2002 | | 2001 | | 2000 |
|
| Net Asset Value, Beginning of Year | | | $17.98 | | | | $14.35 | | | | $14.10 | | | | $14.76 | | | | $12.05 | |
|
| Income (Loss) From Operations: | | | | | | | | | | | | | | | | | | | | |
| Net investment income (loss) | | | (0.16 | ) | | | (0.06 | ) | | | (0.03 | ) | | | 0.08 | | | | 0.07 | |
| Net realized and unrealized gain | | | 3.94 | | | | 3.90 | | | | 0.63 | | | | 0.28 | | | | 2.76 | |
|
| Total Income From Operations | | | 3.78 | | | | 3.84 | | | | 0.60 | | | | 0.36 | | | | 2.83 | |
|
| Less Distributions From: | | | | | | | | | | | | | | | | | | | | |
| Net investment income | | | — | | | | — | | | | (0.02 | ) | | | (0.07 | ) | | | (0.12 | ) |
| Net realized gains | | | (1.06 | ) | | | (0.21 | ) | | | (0.33 | ) | | | (0.95 | ) | | | — | |
|
| Total Distributions | | | (1.06 | ) | | | (0.21 | ) | | | (0.35 | ) | | | (1.02 | ) | | | (0.12 | ) |
|
| Net Asset Value, End of Year | | | $20.70 | | | | $17.98 | | | | $14.35 | | | | $14.10 | | | | $14.76 | |
|
| Total Return(2) | | | 21.36 | % | | | 27.05 | % | | | 4.04 | % | | | 2.52 | % | | | 23.70 | % |
|
| Net Assets, End of Year (000s) | | $ | 142,272 | | | $ | 111,838 | | | $ | 91,275 | | | $ | 69,712 | | | $ | 46,299 | |
|
| Ratios to Average Net Assets: | | | | | | | | | | | | | | | | | | | | |
| Expenses | | | 1.94 | %(3) | | 1.96 | % | | | 1.94 | % | | | 1.96 | % | | | 2.04 | % |
| Net investment income (loss) | | | (0.80 | ) | | | (0.41 | ) | | | (0.19 | ) | | | 0.55 | | | | 0.52 | |
|
| Portfolio Turnover Rate | | | 31 | % | | | 68 | % | | | 49 | % | | | 47 | % | | | 48 | % |
|
| (1) | Per share amounts have been calculated using the monthly average shares method. |
| |
| (2) | Performance figures may reflect fee waivers and/or expense reimbursements. Past performance is no guarantee of future results. In the absence of fee waivers and/or expense reimbursements, the total return would have been lower. |
| |
| (3) | The investment manager waived a portion of its management fee for the year ended September 30, 2004. If such fees were not waived, the actual expense ratio for Class C shares would have been 1.96%. |
See Notes to Financial Statements.
21 Smith Barney Small Cap Value Fund | 2004 Annual Report
Financial Highlights (continued)
For a share of capital stock outstanding throughout the year ended September 30, unless otherwise noted:
| Class Y Shares(1) | | 2004 | | 2003 (2) |
|
| Net Asset Value, Beginning of Year | | | $18.27 | | | | $14.57 | |
|
| Income From Operations: | | | | | | | | |
| Net investment income | | | 0.07 | | | | 0.06 | |
| Net realized and unrealized gain | | | 4.01 | | | | 3.64 | |
|
| Total Income From Operations | | | 4.08 | | | | 3.70 | |
|
| Less Distributions From: | | | | | | | | |
| Net realized gains | | | (1.06 | ) | | | — | |
|
| Total Distributions | | | (1.06 | ) | | | — | |
|
| Net Asset Value, End of Year | | | $21.29 | | | | $18.27 | |
|
| Total Return(3) | | | 22.71 | % | | | 25.39 | %‡ |
|
| Net Assets, End of Year (000s) | | $ | 60,684 | | | $ | 23,757 | |
|
| Ratios to Average Net Assets: | | | | | | | | |
| Expenses | | | 0.84 | %(4) | | 0.80 | %† |
| Net investment income | | | 0.32 | | | | 0.75 | † |
|
| Portfolio Turnover Rate | | | 31 | % | | | 68 | % |
|
| (1 | ) | | Per share amounts have been calculated using the monthly average shares method. |
| | | | |
| (2 | ) | | For the period April 14, 2003 (inception date) to September 30, 2003. |
| | | | |
| (3 | ) | | Performance figures may reflect fee waivers and/or expense reimbursements. Past performance is no guarantee of future results. In the absence of fee waivers and/or expense reimbursements, the total return would have been lower. |
| | | |
| (4 | ) | | The investment manager waived a portion of its management fee for the year ended September 30, 2004. If such fees were not waived, the actual expense ratio for Class Y shares would have been 0.86%. |
| | | |
| ‡ | | | Total return is not annualized, as it may not be representative of the total return for the year. |
| | | | |
| † | | | Annualized. |
See Notes to Financial Statements.
22 Smith Barney Small Cap Value Fund | 2004 Annual Report
Notes to Financial Statements
1. Organization and Significant Accounting Policies
The Smith Barney Small Cap Value Fund (“Fund”), a separate investment fund of the Smith Barney Investment Funds Inc. (“Company”), a Maryland corporation, is registered under the Investment Company Act of 1940, as amended, as a diversified, open-end management investment company.
The following are significant accounting policies consistently followed by the Fund and are in conformity with U.S. generally accepted accounting principles (“GAAP”). The preparation of financial statements in accordance with GAAP requires management to make estimates and assumptions regarding assets, liabilities and changes in net assets resulting from operations when financial statements are prepared. Changes in the economic environment, financial markets and any other parameters used in determining these estimates could cause actual results to differ.
(a) Investment Valuation. Securities traded on national securities markets are valued at the closing price on such markets. Securities traded in the over-the-counter market and listed securities for which no sales prices were reported are valued at the mean between the bid and asked prices. Securities listed on the NASDAQ National Market System for which market quotations are available are valued at the official closing price or, if there is no official closing price on that day, at the last sale price. When market quotations or official closing prices are not readily available, or are determined not to reflect accurately fair value, such as when the value of a security has been significantly affected by events after the close of the exchange or market on which the security is principally traded (for example, a foreign exchange or market), but before the Fund calculates its net asset value, the Fund may value these investments at fair value as determined in accordance with the procedures approved by the Fund’s Board of Directors. Fair valuing of securities may be determined with the assistance of a pricing service using calculations based on indices of domestic securities and other appropriate indicators, such as prices of relevant ADRs and futures contracts. Securities that have a maturity of more than 60 days are valued at prices based on market quotations for securities of similar type, yield and maturity. Securities maturing within 60 days are valued at cost plus accreted discount, or minus amortized premium, which approximates value.
(b) Repurchase Agreements. When entering into repurchase agreements, it is the Fund’s policy that a custodian takes possession of the underlying collateral securities, the value of which at least equals the principal amount of the repurchase transaction, including accrued interest.To the extent that any repurchase transaction exceeds one business day, the value of the collateral is marked-to-market to ensure the adequacy of the collateral. If the seller defaults and the value of the collateral declines or if bankruptcy proceedings are commenced with respect to the seller of the security, realization of the collateral by the Fund may be delayed or limited.
(c) Futures Contracts. The Fund may enter into futures contracts to the extent permitted by its investment policies and objectives. Upon entering into a futures contract, the Fund is required to deposit cash or securities as initial margin.Additional securities are also segregated up to the current market value of the futures contracts. Subsequent payments, which are dependent on the daily fluctuations in the value of the underlying instrument, are made or received by the Fund each day (daily variation margin) and are recorded as unrealized gains or losses until the contracts are closed.When the contracts are closed, the Fund records a realized gain or loss equal to the difference between the proceeds from (or cost of) the closing transactions and the Fund’s basis in the contracts.The Fund enters into such contracts typically to hedge a portion of the portfolio. Risks of entering into futures contracts for hedging purposes include the possibility that a change in the value of the contract may not correlate with the changes in the value of the investments hedged. In addition, the purchase of a futures contract involves the risk that the Fund could lose more than the original margin deposit and subsequent payments required for a futures transaction.
(d) Option Contracts. When a Fund writes or purchases a call or a put option, an amount equal to the premium received or paid by the Fund is recorded as a liability or asset, the value of which is marked-to-market daily to reflect the current market value of the option.When the option expires, the Fund realizes a gain or loss equal to the amount of the premium received or paid.When the Fund enters into a closing transaction by purchasing or selling an offsetting option, it realizes a gain or loss
23 Smith Barney Small Cap Value Fund | 2004 Annual Report
Notes to Financial Statements (continued)
without regard to any unrealized gain or loss on the underlying security.When a written call option is exercised, the Fund realizes a gain or loss from the sale of the underlying security and the proceeds from such sale are increased by the premium originally received.When a written put option is exercised, the amount of the premium received reduces the cost of the security that the Fund purchased upon exercise of the option.
(e) Investment Transactions and Investment Income. Security transactions are accounted for on trade date. Dividend income is recorded on ex-dividend date and interest income is recorded on an accrual basis. Gains or losses on the sale of securities are calculated by using the specific identification method.
(f ) Foreign Currency Translation. The books and records of the Fund are maintained in U.S. dollars. Transactions denominated in foreign currencies are recorded at the current prevailing exchange rates.All assets and liabilities denominated in foreign currencies are translated into U.S. dollar amounts at the current exchange rate at the end of the period.Translation gains or losses resulting from changes in the exchange rate during the reporting period and realized gains and losses on the settlement of foreign currency transactions are reported in the results of operations for the current period. The Fund does not isolate that portion of realized gains and losses on investments in securities, which are due to changes in the foreign exchange rate from that which is due to changes in market prices of equity securities.
(g) Dividends and Distributions to Shareholders. Dividends and distributions to shareholders are recorded on the ex-dividend date; the Fund distributes dividends and capital gains, if any, at least annually.The character of income and gains to be distributed is determined in accordance with income tax regulations which may differ from GAAP.
(h) Class Accounting. Class specific expenses are charged to each class; management fees, general fund expenses, income, gains and/or losses are allocated on the basis of relative net assets of each class or on another reasonable basis.
(i) Federal Income Taxes. It is the Fund’s policy to comply with the federal income and excise tax requirements of the Internal Revenue Code of 1986, as amended, applicable to regulated investment companies. Accordingly, the Fund intends to distribute substantially all of its taxable income and net realized gains on investments, if any, to shareholders each year. Therefore, no federal income tax provision is required.
(j) Year End Tax Reclassifications. U.S. generally accepted accounting principles require that certain components of net assets be adjusted to reflect permanent differences between financial and tax reporting. Accordingly, during the current year, $1,929,301 has been reclassified between undistributed net investment income and accumulated net realized gain from investment transactions and futures contracts as a result of permanent differences primarily attributable to the utilization of tax net operating loss against realized short-term capital gains.This reclassification has no effect on net assets or net asset values per share.
2. Management Agreement and Other Transactions
Smith Barney Fund Management LLC (“SBFM”), an indirect wholly-owned subsidiary of Citigroup Inc. (“Citigroup”), acts as investment manager to the Fund.The Fund pays SBFM a management fee calculated at an annual rate of 0.75% of the Fund’s average daily net assets.This fee is calculated daily and paid monthly.
During the year ended September 30, 2004 SBFM waived a portion of its management fee in the amount of $79,674.
Citicorp Trust Bank, fsb. (“CTB”), another subsidiary of Citigroup, acts as the Fund’s transfer agent. PFPC Inc. (“PFPC”) acts as the Fund’s sub-transfer agent. CTB receives account fees and asset-based fees that vary according to the size and type of account. PFPC is responsible for shareholder recordkeeping and financial processing for all shareholder accounts and is paid by CTB. For the year ended September 30, 2004, the Fund paid transfer agent fees of $402,890 to CTB.
Citigroup Global Markets Inc. (“CGM”), another indirect wholly-owned subsidiary of Citigroup, acts as the Fund’s distributor. For the year ended September 30, 2004, CGM and its affiliates did not receive any brokerage commissions.
24 Smith Barney Small Cap Value Fund | 2004 Annual Report
Notes to Financial Statements (continued)
On February 2, 2004, initial sales charges on Class L shares were eliminated. Effective April 29, 2004, Class L shares were renamed as Class C shares.
There is a maximum sales charge of 5.00% for Class A shares.There is a contingent deferred sales charge (“CDSC”) of 5.00% on Class B shares, which applies if redemption occurs within one year from purchase payment and declines thereafter by 1.00% per year until no CDSC is incurred. Class C shares have a 1.00% CDSC, which applies if redemption occurs within one year from purchase payment. In certain cases, Class A shares have a 1.00% CDSC, which applies if redemption occurs within one year from purchase payment.This CDSC only applies to those purchases of Class A shares, which when combined with current holdings of Class A shares, equal or exceed $1,000,000 in the aggregate.These purchases do not incur an initial sales charge.
For the year ended September 30, 2004, CGM received sales charges of approximately $326,000 and $72,000 on sales of the Fund’s Class A and C shares, respectively. In addition, for the year ended September 30, 2004, CDSCs paid to CGM were approximately:
| | | | | Class B | Class C |
|
| CDSCs | | | | $222,000 | $13,000 |
|
All officers and one Director of the Company are employees of Citigroup or its affiliates and do not receive compensation from the Fund.
3. Investments
During the year ended September 30, 2004, the aggregate cost of purchases and proceeds from sales of investments (excluding short-term investments) were as follows:
| Purchases | | | | $234,153,020 |
|
| Sales | | | | 138,590,107 |
|
At September 30, 2004, the aggregate gross unrealized appreciation and depreciation of investments for Federal income tax purposes were as follows:
| Gross unrealized appreciation | | $ | 126,262,678 | |
| Gross unrealized depreciation | | | (8,241,392 | ) |
|
| Net unrealized appreciation | | $ | 118,021,286 | |
|
25 Smith Barney Small Cap Value Fund | 2004 Annual Report
Notes to Financial Statements (continued)
4. Class Specific Expenses
Pursuant to a Rule 12b-1 Distribution Plan, the Fund pays a service fee with respect to its Class A, B and C shares calculated at the annual rate of 0.25% of the average daily net assets of each respective class.The Fund also pays a distribution fee with respect to its Class B and C shares calculated at the annual rate of 0.75% of the average daily net assets of each class, respectively. For the year ended September 30, 2004, total Rule 12b-1 Distribution Plan fees, which are accrued daily and paid monthly, were as follows:
| | Class A | Class B | Class C |
|
| Rule 12b-1 Distribution Plan Fees | $375,055 | $1,437,314 | $1,316,996 |
|
For the year ended September 30, 2004, total Transfer Agency Service expenses were as follows:
| | Class A | Class B | Class C | Class Y |
|
| Transfer Agency Service Expenses | $161,363 | $173,300 | $196,664 | $28,737 |
|
For the year ended September 30, 2004, total Shareholder Communication expenses were as follows:
| | Class A | Class B | Class C | Class Y |
|
| Shareholder Communication Expenses | $16,564 | $30,913 | $31,979 | $438 |
|
5. Distributions Paid to Shareholders by Class
| | | Year Ended | Year Ended |
| | | September 30, 2004 | September 30, 2003* |
|
| Class A | | | | | | | |
| Net realized gains | | $ | 6,325,351 | | $ | 1,027,798 | |
|
| Total | | $ | 6,325,351 | | $ | 1,027,798 | |
|
| Class B | | | | | | | |
| Net realized gains | | $ | 7,643,465 | | $ | 1,614,903 | |
|
| Total | | $ | 7,643,465 | | $ | 1,614,903 | |
|
| Class C | | | | | | | |
| Net realized gains | | $ | 6,657,543 | | $ | 1,317,822 | |
|
| Total | | $ | 6,657,543 | | $ | 1,317,822 | |
|
| Class Y | | | | | | | |
| Net realized gains | | $ | 1,644,182 | | | — | |
|
| Total | | $ | 1,644,182 | | | — | |
|
* For the period April 14, 2003 (inception date) to September 30, 2003 for Class Y shares.
6. Capital Shares
At September 30, 2004, the Company had ten billion shares of capital stock authorized with a par value of $0.001 per share.The Fund has the ability to issue multiple classes of shares. Each share of a class represents an identical interest and has the same rights, except that each class bears certain direct expenses, including those specifically related to the distribution of its shares. Effective April 29, 2004, the Fund renamed Class L shares as Class C shares.
26 Smith Barney Small Cap Value Fund | 2004 Annual Report
Notes to Financial Statements (continued)
Transactions in shares of each class were as follows:
| | | Year Ended | | Year Ended |
| | | September 30, 2004 | | September 30, 2003* |
| |
| |
|
| | | Shares | | Amount | | Shares | | Amount |
|
| Class A | | | | | | | | | | | | | | |
| Shares sold | | 5,382,763 | | | $ | 109,237,622 | | | 1,817,521 | | | $ | 29,822,064 | |
| Shares issued on reinvestment | | 303,138 | | | | 6,026,382 | | | 64,745 | | | | 972,468 | |
| Shares reacquired | | (1,575,075 | ) | | | (31,758,736 | ) | | (1,299,565 | ) | | | (20,722,453 | ) |
|
| Net Increase | | 4,110,826 | | | $ | 83,505,268 | | | 582,701 | | | $ | 10,072,079 | |
|
| Class B | | | | | | | | | | | | | | |
| Shares sold | | 705,999 | | | $ | 14,031,653 | | | 972,080 | | | $ | 15,151,999 | |
| Shares issued on reinvestment | | 365,804 | | | | 7,151,471 | | | 101,740 | | | | 1,514,905 | |
| Shares reacquired | | (1,492,717 | ) | | | (29,720,849 | ) | | (1,621,938 | ) | | | (24,866,650 | ) |
|
| Net Decrease | | (420,914 | ) | | $ | (8,537,725 | ) | | (548,118 | ) | | $ | (8,199,746 | ) |
|
| Class C† | | | | | | | | | | | | | | |
| Shares sold | | 1,523,277 | | | $ | 30,251,909 | | | 1,012,174 | | | $ | 16,069,286 | |
| Shares issued on reinvestment | | 326,455 | | | | 6,378,942 | | | 84,839 | | | | 1,263,251 | |
| Shares reacquired | | (1,196,595 | ) | | | (23,759,457 | ) | | (1,236,977 | ) | | | (18,766,788 | ) |
|
| Net Increase (Decrease) | | 653,137 | | | $ | 12,871,394 | | | (139,964 | ) | | $ | (1,434,251 | ) |
|
| Class Y | | | | | | | | | | | | | | |
| Shares sold | | 2,004,154 | | | $ | 40,984,188 | | | 1,558,872 | | | $ | 27,925,710 | |
| Shares issued on reinvestment | | 78,773 | | | | 1,570,730 | | | — | | | | — | |
| Shares reacquired | | (533,115 | ) | | | (10,856,547 | ) | | (258,880 | ) | | | (4,540,645 | ) |
|
| Net Increase | | 1,549,812 | | | $ | 31,698,371 | | | 1,299,992 | | | $ | 23,385,065 | |
|
| * | | For the period April 14, 2003 (inception date) to September 30, 2003 for Class Y shares. |
| | | |
| † | | On April 29, 2004, Class L shares were renamed as Class C shares. |
7. Income Tax Information and Distributions to Shareholders
The tax character of distributions paid during the fiscal years ended September 30, were as follows:
| | | 2004 | 2003 |
|
| Ordinary income | | $ | 4,002,083 | | $ | 768,925 | |
| Long-term capital gains | | | 18,268,458 | | | 3,191,598 | |
|
| Total distributions paid | | $ | 22,270,541 | | $ | 3,960,523 | |
|
| |
| As of September 30, 2004, the components of accumulated earnings on a tax basis were as follows: |
| |
|
| Undistributed ordinary income—net | | | | | $ | 3,851,020 | |
| Undistributed long-term capital gains—net | | | | | | 16,322,444 | |
|
| Total undistributed earnings | | | | | | 20,173,464 | |
| |
| Unrealized appreciation | | | | | | 118,021,286 | * |
|
| Total accumulated earnings—net | | | | | $ | 138,194,750 | |
|
| * | The difference between book-basis and tax-basis unrealized appreciation is attributable primarily to the tax deferral of losses on wash sales and the differences between book & tax cost on real estate investment trusts. |
| |
27 Smith Barney Small Cap Value Fund | 2004 Annual Report
Notes to Financial Statements (continued)
8. Additional Information
In connection with an investigation previously disclosed by Citigroup, the Staff of the Securities and Exchange Commission (“SEC”) has notified Citigroup Asset Management (“CAM”), the Citigroup business unit that includes the funds’ investment manager and other investment advisory companies; Citicorp Trust Bank (“CTB”), an affiliate of CAM;Thomas W. Jones, the former CEO of CAM; and two other individuals, one of whom is an employee and the other of whom is a former employee of CAM, that the SEC Staff is considering recommending a civil injunctive action and/or an administrative proceeding against each of them relating to the creation and operation of an internal transfer agent unit to serve various CAM-managed funds.
In 1999, CTB entered the transfer agent business. CTB hired an unaffiliated subcontractor to perform some of the transfer agent services.The subcontractor, in exchange, had signed a separate agreement with CAM in 1998 that guaranteed investment management revenue to CAM and investment banking revenue to a CAM affiliate.The subcontractor’s business was later taken over by PFPC Inc., and at that time the revenue guarantee was eliminated and a one-time payment was made by the subcontractor to a CAM affiliate.
CAM did not disclose the revenue guarantee when the boards of various CAM-managed funds hired CTB as transfer agent. Nor did CAM disclose to the boards of the various CAM-managed funds the one-time payment received by the CAM affiliate when it was made.
In addition, the SEC Staff has indicated that it is considering recommending action based on the adequacy of the disclosures made to the fund boards that approved the transfer agency arrangement, CAM’s initiation and operation of, and compensation for, the transfer agent business and CAM’s retention of, and agreements with, the subcontractor.
Citigroup is cooperating fully in the investigation and will seek to resolve the matter in discussions with the SEC Staff. Although there can be no assurance, Citigroup does not believe that this matter will have a material adverse effect on the Fund. As previously disclosed, CAM has already agreed to pay the applicable funds, primarily through fee waivers, a total of approximately $17 million (plus interest) that is the amount of the revenue received by Citigroup relating to the revenue guarantee.
9. Legal Matters
Class action lawsuits have been filed against Citigroup Global Markets Inc. (the “Distributor”) and a number of its affiliates, including Smith Barney Fund Management LLC and Salomon Brothers Asset Management Inc (the “Advisers”), substantially all of the mutual funds managed by the Advisers (the “Funds”), and directors or trustees of the Funds.The complaints allege, among other things, that the Distributor created various undisclosed incentives for its brokers to sell Smith Barney and Salomon Brothers funds. In addition, according to the complaints, the Advisers caused the Funds to pay excessive brokerage commissions to the Distributor for steering clients towards proprietary funds.The complaints also allege that the defendants breached their fiduciary duty to the Funds by improperly charging Rule 12b-1 fees and by drawing on Fund assets to make undisclosed payments of soft dollars and excessive brokerage commissions. The complaints seek injunctive relief and compensatory and punitive damages, rescission of the Funds’ contracts with the Advisers, recovery of all fees paid to the Advisers pursuant to such contracts and an award of attorneys’ fees and litigation expenses. Citigroup Asset Management believes that the suits are without merit and intends to defend the cases vigorously.
Additional lawsuits arising out of these circumstances and presenting similar allegations and requests for relief may be filed against the defendants in the future. Neither Citigroup Asset Management nor the Funds believe that any of the pending actions will have a material adverse effect on the Funds or the ability of the Distributor or the Advisers to perform under their respective contracts with the Funds.
28 Smith Barney Small Cap Value Fund | 2004 Annual Report
Report of Independent Registered Public Accounting Firm
The Shareholders and Board of Directors of
Smith Barney Investment Funds Inc.:
We have audited the accompanying statement of assets and liabilities, including the schedule of investments, of Smith Barney Small Cap Value Fund of Smith Barney Investment Funds Inc. (“Fund”) as of September 30, 2004, and the related statement of operations for the year then ended, the statements of changes in net assets for each of the years in the two-year period then ended and the financial highlights for each of the years in the five-year period then ended.These financial statements and financial highlights are the responsibility of the Fund’s management. Our responsibility is to express an opinion on these financial statements and financial highlights based on our audits.
We conducted our audits in accordance with the standards of the Public Company Accounting Oversight Board (United States).Those standards require that we plan and perform the audit to obtain reasonable assurance about whether the financial statements and financial highlights are free of material misstatement.An audit includes examining, on a test basis, evidence supporting the amounts and disclosures in the financial statements. Our procedures included confirmation of securities owned as of September 30, 2004, by correspondence with the custodian and broker. As to securities purchased or sold but not received or delivered, we performed other appropriate auditing procedures. An audit also includes assessing the accounting principles used and significant estimates made by management, as well as evaluating the overall financial statement presentation.We believe that our audits provide a reasonable basis for our opinion.
In our opinion, the financial statements and financial highlights referred to above present fairly, in all material respects, the financial position of the Fund as of September 30, 2004, and the results of its operations for the year then ended, the changes in its net assets for each of the years in the two-year period then ended and the financial highlights for each of the years in the five-year period then ended, in conformity with U.S. generally accepted accounting principles.
/s/ KPMG LLP
New York, New York
November 19, 2004
29 Smith Barney Small Cap Value Fund | 2004 Annual Report
Additional Information (unaudited)
Information about Directors and Officers
The business and affairs of the Smith Barney Small Cap Value Fund (“Fund”) are managed under the direction of the Smith Barney Investment Funds Inc.’s (“Company”) Board of Directors. Information pertaining to the Directors and certain officers of the Company is set forth below.The Statement of Additional Information includes additional information about the Company’s Directors and is available, without charge, upon request by calling the Fund’s transfer agent (Citicorp Trust Bank, fsb. at 1-800-451-2010).
| | | | | | | | | | | Number of | | |
| | | | | | | | | | | Portfolios in the | | |
| | | | | | Term of Office* | | | | | Fund Complex | | Other |
| | | Position(s) Held | | and Length of | | Principal Occupation(s) | | | Overseen by | | Board Memberships |
| Name, Address and Age | | with Fund | | Time Served | | During Past Five Years | | | Director | | Held by Director |
|
| Non-Interested Directors: | | | | | | | | | | | | |
| | | | | | | | | | | | | |
| Paul R. Ades | | | Director | | Since | | Law Firm of Paul R. Ades, PLLC | | | 15 | | None |
| Paul R. Ades, PLLC | | | | | 1994 | | (from April 2000 to Present); | | | | | |
| 181 West Main Street | | | | | | | Partner in Law Firm of Murov & | | | | | |
| Suite C | | | | | | | Ades, Esqs. (from November 1970 | | | | | |
| Babylon, NY 11702 | | | | | | | to March 2000) | | | | | |
| Age 63 | | | | | | | | | | | | |
| | | | | | | | | | | | | |
| Dwight B. Crane | | | Director | | Since | | Professor, Harvard Business School | | | 49 | | None |
| Harvard Business School | | | | | 1981 | | | | | | | |
| Soldiers Field | | | | | | | | | | | | |
| Morgan Hall #375 | | | | | | | | | | | | |
| Boston, MA 02163 | | | | | | | | | | | | |
| Age 66 | | | | | | | | | | | | |
| | | | | | | | | | | | | |
| Frank G. Hubbard | | | Director | | Since | | President of Avatar International, | | | 15 | | None |
| Avatar International, Inc. | | | | | 1993 | | Inc. (Business Development) (since | | | | | |
| 87 Whittredge Road | | | | | | | 1998) | | | | | |
| Summit, NJ 07901 | | | | | | | | | | | | |
| Age 66 | | | | | | | | | | | | |
| | | | | | | | | | | | | |
| Jerome H. Miller | | | Director | | Since | | Retired | | | 15 | | None |
| c/o R. Jay Gerken | | | | | 1998 | | | | | | | |
| Citigroup Asset Management (“CAM”) | | | | | | | | | |
| 399 Park Avenue, 4th Floor | | | | | | | | | | | | |
| New York, NY 10022 | | | | | | | | | | | | |
| Age 65 | | | | | | | | | | | | |
| | | | | | | | | | | | | |
| Ken Miller | | | Director | | Since | | President of Young Stuff Apparel | | | 15 | | None |
| Young Stuff Apparel Group, Inc. | | | | | 1994 | | Group, Inc. (since 1963) | | | | | |
| 930 Fifth Avenue | | | | | | | | | | | | |
| Suite 610 | | | | | | | | | | | | |
| New York, NY 10021 | | | | | | | | | | | | |
| Age 62 | | | | | | | | | | | | |
| |
| Interested Director: | | | | | | | | | | | | |
| R. Jay Gerken, CFA** | | | Chairman, | | Since | | Managing Director of Citigroup | | | 221 | | None |
| CAM | | | President | | 2002 | | Global Markets Inc. (“CGM”); | | | | | |
| 399 Park Avenue, 4th Floor | | | and Chief | | | | Chairman, President and Chief | | | | | |
| New York, NY 10022 | | | Executive Officer | | | | Executive Officer of Smith Barney | | | | | |
| Age 53 | | | | | | | Fund Management LLC (“SBFM”), | | | | | |
| | | | | | | | Travelers Investment Adviser, Inc. | | | | | |
| | | | | | | | (“TIA”) and Citi Fund Management | | |
| | | | | | | | Inc. (“CFM”); President and Chief | | | | | |
| | | | | | | | Executive Officer of certain mutual | | | | | |
| | | | | | | | funds associated with Citigroup | | | | | |
| | | | | | | | Inc. (“Citigroup”); Formerly, | | | | | |
| | | | | | | | Portfolio Manager of Smith Barney | | | | | |
| | | | | | | | Allocation Series Inc. (from 1996 to | | |
| | | | | | | | 2001) and Smith Barney Growth | | | | | |
| | | | | | | | and Income Fund (from 1996 | | | | | |
| | | | | | | | to 2000) | | | | | |
30 Smith Barney Small Cap Value Fund | 2004 Annual Report
Additional Information (unaudited) (continued)
| | | | | | | | | | | Number of | | |
| | | | | | | | | | | Portfolios in the | | |
| | | | | | | Term of Office* | | | | Fund Complex | | Other |
| | | Position(s) Held | | | | and Length of | | Principal Occupation(s) | | Overseen by | | Board Memberships |
| Name, Address and Age | | with Fund | | | | Time Served | | During Past Five Years | | Director | | Held by Director |
|
| Officers: | | | | | | | | | | | | |
| | | | | | | | | | | | | |
| Andrew B. Shoup | | Senior Vice | | | | Since | | Director of CAM; Senior Vice | | N/A | | N/A |
| CAM | | President | | | | 2003 | | President and Chief Administrative | | | | |
| 125 Broad Street, 11th Floor | | and Chief | | | | | | Officer of mutual funds associated | | | | |
| New York, NY 10004 | | Administrative | | | | with Citigroup; Head of International | | | | |
| Age 47 | | Officer | | | | | | Funds Administration of CAM (from | | | | |
| | | | | | | | | 2001 to 2003); Director of Global | | | | |
| | | | | | | | | Funds Administration of CAM (from | | | | |
| | | | | | | | | 2000 to 2001); Head of U.S. | | | | |
| | | | | | | | | Citibank Funds Administration of | | | | |
| | | | | | | | | CAM (from 1998 to 2000) | | | | |
| | | | | | | | | | | |
| Kaprel Ozsolak | | Chief Financial | | Since | | Vice President of CGM; Chief Financial | | N/A | | N/A |
| CAM | | Officer and | | | | 2004 | | Officer and Treasurer of certain mutual | | | | |
| 125 Broad Street, 11th Floor | | Treasurer | | | | | | funds associated with Citigroup; Controller | | |
| New York, NY 10004 | | | | | | | | of certain mutual funds associated | | | | |
| Age 39 | | | | | | | | with Citigroup (since 2002) | | | | |
| | | | | | | | | | | |
| John G. Goode | | Vice President | | Since | | Managing Director of CGM and | | N/A | | N/A |
| CAM | | and Investment | | 1999 | | Investment Officer of SBFM | | | | |
| One Sansome Street | | Officer | | | | | | | | | | |
| San Francisco, CA 94104 | | | | | | | | | | | | |
| Age 60 | | | | | | | | | | | | |
| | | | | | | | | | | |
| Peter J. Hable | | Vice President | | Since | | Managing Director of CGM and | | N/A | | N/A |
| CAM | | and Investment | | 1999 | | Investment Officer of SBFM | | | | |
| One Sansome Street | | Officer | | | | | | | | | | |
| San Francisco, CA 94104 | | | | | | | | | | | | |
| Age 46 | | | | | | | | | | | | |
| | | | | | | | | | | |
| Andrew Beagley | | Chief Anti-Money | | Since | | Director of CGM (since 2000); | | N/A | | N/A |
| CAM | | Laundering | | | | 2002 | | Director of Compliance, North | | | | |
| 399 Park Avenue, 4th Floor | | Compliance | | | | | | America, CAM (since 2000); Chief | | | | |
| New York, NY 10022 | | Officer | | | | | | Anti-Money Laundering | | | | |
| Age 41 | | | | | | | | Compliance Officer, Chief Compliance | | | | |
| | | Chief Compliance | | Since | | Officer and Vice President of certain | | | | |
| | | Officer | | | | 2004 | | mutual funds associated with Citigroup; | | |
| | | | | | | | | Director of Compliance, Europe, | | | | |
| | | | | | | | | the Middle East and Africa, CAM | | | | |
| | | | | | | | | (from 1999 to 2000); Compliance | | | | |
| | | | | | | | | Officer, Salomon Brothers Asset | | | | |
| | | | | | | | | Management Limited, Smith Barney | | | | |
| | | | | | | | | Global Capital Management Inc., | | | | |
| | | | | | | | | Salomon Brothers Asset | | | | |
| | | | | | | | | Management Asia Pacific Limited | | | | |
| | | | | | | | | (from 1997 to 1999) | | | | |
| | | | | | | | | | | |
| Robert I. Frenkel | | Secretary and | | Since | | Managing Director and General | | N/A | | N/A |
| CAM | | Chief Legal Officer | | 2003 | | Counsel of Global Mutual Funds | | | | |
| 300 First Stamford Place | | | | | | | | for CAM and its predecessor (since | | | | |
| 4th Floor | | | | | | | | 1994); Secretary of CFM (from | | | | |
| Stamford, CT 06902 | | | | | | | | 2001 to 2004); Secretary and Chief | | | | |
| Age 48 | | | | | | | | Legal Officer of certain mutual | | | | |
| | | | | | | | | funds associated with Citigroup | | | | |
|
| * | Each Director and officer serves until his or her successor has been duly elected and qualified. |
| |
| ** | Mr. Gerken is an “interested person” of the Company as defined in the Investment Company Act of 1940, as amended, because Mr. Gerken is an officer of SBFM and certain of its affiliates. |
31 Smith Barney Small Cap Value Fund | 2004 Annual Report
Important Tax Information (unaudited)
The following information is provided with respect to the ordinary income distributions paid by Smith Barney Investment Funds, Inc.: Smith Barney Small Cap Value Fund during the taxable year ended September 30, 2004.
|
| Record Date | | | | 12/26/2003 | |
| Payable Date | | | | 12/30/2003 | |
|
| | | | | Per Share |
|
| Long-term Capital Gain Distributions Paid | | | | $0.867300 | |
|
| Qualified Dividend Income for Individuals | | | | 0.133000 | |
|
| Dividends Qualifying for the Dividends Received Deduction for Corporations | | | | 0.105794 | |
|
Please retain this information for your records.
32 Smith Barney Small Cap Value Fund | 2004 Annual Report
SMITH BARNEY
SMALL CAP VALUE FUND
| | | | |
| | DIRECTORS | | Robert I. Frenkel |
| | Paul R. Ades | | Secretary and |
| | Dwight B. Crane | | Chief Legal Officer |
| | R. Jay Gerken, CFA | | |
| | Chairman | | INVESTMENT MANAGER |
| | Frank G. Hubbard | | Smith Barney Fund |
| | Jerome H. Miller | | Management LLC |
| | Ken Miller | | |
| | | | DISTRIBUTOR |
| | OFFICERS | | Citigroup Global Markets Inc. |
| | R. Jay Gerken, CFA | | |
| | President and | | CUSTODIAN |
| | Chief Executive Officer | | State Street Bank and |
| | | | Trust Company |
| | Andrew B. Shoup | | |
| | Senior Vice President and | | TRANSFER AGENT |
| | Chief Administrative Officer | | Citicorp Trust Bank, fsb. |
| | | | 125 Broad Street, 11th Floor |
| | Kaprel Ozsolak | | New York, New York 10004 |
| | Chief Financial Officer | | |
| | and Treasurer | | SUB-TRANSFER AGENT |
| | | | PFPC Inc. |
| | John G. Goode | | P.O. Box 9699 |
| | Vice President and | | Providence, Rhode Island |
| | Investment Officer | | 02940-9699 |
| |
| | Peter J. Hable | | |
| | Vice President and | | |
| | Investment Officer | | |
| |
| | Andrew Beagley | | |
| | Chief Anti-Money Laundering | | |
| | Compliance Officer and | | |
| | Chief Compliance Officer | | |
Smith Barney Investment Funds Inc.
Smith Barney Small Cap Value Fund The Fund is a separate investment fund of the Smith Barney Investment
Funds Inc., a Maryland corporation. | This report is submitted for the general information of the shareholders of Smith Barney Investment Funds Inc. — Smith Barney Small Cap Value Fund, but it also may be used as sales literature when preceded or accompanied by the current Prospectus, which gives details about charges, expenses, investment objectives and operating policies of the Fund. SMITH BARNEY SMALL CAP VALUE FUND
Smith Barney Mutual Funds
125 Broad Street
10th Floor, MF-2
New York, New York 10004
This document must be preceded or accompanied by a free prospectus. Investors should consider the fund’s investment objectives, risks, charges and expenses carefully before investing. The prospectus contains this and other important information about the fund. Please read the prospectus carefully before you invest or send money. www.smithbarneymutualfunds.com |
| | | |
The Fund files its complete schedule of portfolio holdings with Securities and Exchange Commission for the first and third quarters of each fiscal year on Form N-Q. The Fund’s Forms N-Q are available on the Commission’s website at www.sec.gov. The Fund’s Forms N-Q may be reviewed and copied at the Commission’s Public Reference Room in Washington, D.C., and information on the operation of the Public Reference Room may be obtained by calling 1-800-SEC-0330. To obtain information on Form N-Q from the Fund, shareholders can call 1-800-451-2010. Information on how the fund voted proxies relating to portfolio securities during the 12 month period ended June 30, 2004 and a description of the policies and procedures that the fund uses to determine how to vote proxies relating to portfolio securities is available (1) without charge, upon request, by calling 1-800-451-2010, (2) on the fund’s website at www.citigroupAM.com and (3) on the SEC’s website at www.sec.gov. | | ©2004 Citigroup Global Markets Inc.
Member NASD, SIPC FD01745 11/04 04-7461 |
ITEM 2.  CODE OF ETHICS.

         The registrant has adopted a code of ethics that applies to the
         registrant's principal executive officfer, principal financial officer,
         principal accounting officer or controller.

ITEM 3.  AUDIT COMMITTEE FINANCIAL EXPERT.

         The Board of Directors of the registrant has determined that Dwight B.
         Crane, a Member of the Board's Audit Committee, possesses the technical
         attributes identified in Instruction 2(b) of Item 3 to Form N-CSR to
         qualify as an "audit committee financial expert," and has designated
         Mr. Crane as the Audit Committee's financial expert. Mr. Crane is an
         "independent" Director pursuant to paragraph (a)(2) of Item 3 to Form
         N-CSR.

ITEM 4.  PRINCIPAL ACCOUNTANT FEES AND SERVICES.

         (a)      Audit Fees for the Smith Barney Investment Funds Inc. were
                  $70,350 and $70,500 for the years ended 9/30/04 and 9/30/03.

         (b)      Audit-Related Fees for the Smith Barney Investment Funds Inc.
                  were $0 and $0 for the years ended 9/30/04 and 9/30/03.

         (c)      Tax Fees for Smith Barney Investment Funds Inc. were $7,500
                  and $7,300 for the years ended 9/30/04 and 9/30/03. These
                  amounts represent aggregate fees paid for tax compliance, tax
                  advice and tax planning services, which include (the filing
                  and amendment of federal, state and local income tax returns,
                  timely RIC qualification review and tax distribution and
                  analysis planning) rendered by the Accountant to Smith Barney
                  Investment Funds Inc.

         (d)      All Other Fees for Smith Barney Investment Funds Inc. were $0
                  and $0 for the years ended 9/30/04 and 9/30/03.

         (e)      (1) Audit Committee's pre-approval policies and procedures
                  described in paragraph (c) (7) of Rule 2-01 of Regulation S-X.

                  The Charter for the Audit Committee (the "Committee") of the
                  Board of each registered investment company (the "Fund")
                  advised by Smith Barney Fund Management LLC or Salomon
                  Brothers Asset Management Inc or one of their affiliates
                  (each, an "Adviser") requires that the Committee shall approve
                  (a) all audit and permissible non-audit services to be
                  provided to the Fund and (b) all permissible non-audit
                  services to be provided by the Fund's independent auditors to
                  the Adviser and any Covered Service Providers if the
                  engagement relates directly to the operations and financial
                  reporting of the Fund. The Committee may implement policies
                  and procedures by which such services are approved other than
                  by the full Committee.

                  The Committee shall not approve non-audit services that the
                  Committee believes may impair the independence of the
                  auditors. As of the date of the approval of this Audit
                  Committee Charter, permissible non-audit services include any


                  professional services (including tax services), that are not
                  prohibited services as described below, provided to the Fund
                  by the independent auditors, other than those provided to the
                  Fund in connection with an audit or a review of the financial
                  statements of the Fund. Permissible non-audit services may not
                  include: (i) bookkeeping or other services related to the
                  accounting records or financial statements of the Fund; (ii)
                  financial information systems design and implementation; (iii)
                  appraisal or valuation services, fairness opinions or
                  contribution-in-kind reports; (iv) actuarial services; (v)
                  internal audit outsourcing services; (vi) management functions
                  or human resources; (vii) broker or dealer, investment adviser
                  or investment banking services; (viii) legal services and
                  expert services unrelated to the audit; and (ix) any other
                  service the Public Company Accounting Oversight Board
                  determines, by regulation, is impermissible.

                  Pre-approval by the Committee of any permissible non-audit
                  services is not required so long as: (i) the aggregate amount
                  of all such permissible non-audit services provided to the
                  Fund, the Adviser and any service providers controlling,
                  controlled by or under common control with the Adviser that
                  provide ongoing services to the Fund ("Covered Service
                  Providers") constitutes not more than 5% of the total amount
                  of revenues paid to the independent auditors during the fiscal
                  year in which the permissible non-audit services are provided
                  to (a) the Fund, (b) the Adviser and (c) any entity
                  controlling, controlled by or under common control with the
                  Adviser that provides ongoing services to the Fund during the
                  fiscal year in which the services are provided that would have
                  to be approved by the Committee; (ii) the permissible
                  non-audit services were not recognized by the Fund at the time
                  of the engagement to be non-audit services; and (iii) such
                  services are promptly brought to the attention of the
                  Committee and approved by the Committee (or its delegate(s))
                  prior to the completion of the audit.

                  (2) For the Smith Barney Investment Funds Inc., the percentage
                  of fees that were approved by the audit committee, with
                  respect to: Audit-Related Fees were 100% and 100% for the
                  years ended 9/30/04 and 9/30/03; Tax Fees were 100% and 100%
                  for the years ended 9/30/04 and 9/30/03; and Other Fees were
                  100% and 100% for the years ended 9/30/04 and 9/30/03.

         (f)      N/A

         (g)      Non-audit fees billed by the Accountant for services rendered
                  to Smith Barney Investment Funds Inc. and CAM and any entity
                  controlling, controlled by, or under common control with CAM
                  that provides ongoing services to Smith Barney Investment
                  Funds Inc. were $0 and $0 for the years ended 9/30/04 and
                  9/30/03.

         (h)      Yes. The Smith Barney Investment Funds Inc.' Audit Committee
                  has considered whether the provision of non-audit services
                  that were rendered to Service Affiliates which were not
                  pre-approved (not requiring pre-approval) is compatible with
                  maintaining the Accountant's independence. All services
                  provided by the Accountant to the Smith Barney Investment
                  Funds Inc. or to Service Affiliates which were required to be
                  pre-approved were pre-approved as required.


ITEM 5.  AUDIT COMMITTEE OF LISTED REGISTRANTS.

         Not applicable.

ITEM 6.  [RESERVED]

ITEM 7.  DISCLOSURE OF PROXY VOTING POLICIES AND PROCEDURES FOR CLOSED-END
         MANAGEMENT INVESTMENT COMPANIES.

         Not applicable.

ITEM 8.  [RESERVED]

ITEM 9.  SUBMISSION OF MATTERS TO A VOTE OF SECURITY HOLDERS.

         Not applicable.

ITEM 10. CONTROLS AND PROCEDURES.

         (a)      The registrant's principal executive officer and principal
                  financial officer have concluded that the registrant's
                  disclosure controls and procedures (as defined in Rule 30a-
                  3(c) under the Investment Company Act of 1940, as amended (the
                  "1940 Act")) are effective as of a date within 90 days of the
                  filing date of this report that includes the disclosure
                  required by this paragraph, based on their evaluation of the
                  disclosure controls and procedures required by Rule 30a-3(b)
                  under the 1940 Act and 15d-15(b) under the Securities Exchange
                  Act of 1934.

         (b)      There were no changes in the registrant's internal control
                  over financial reporting (as defined in Rule 30a-3(d) under
                  the 1940 Act) that occurred during the registrant's last
                  fiscal half-year (the registrant's second fiscal half-year in
                  the case of an annual report) that have materially affected,
                  or are likely to materially affect the registrant's internal
                  control over financial reporting.

ITEM 11. EXHIBITS.

         (a)      Code of Ethics attached hereto.

         Exhibit 99.CODE ETH

         (b)      Attached hereto.

         Exhibit 99.CERT           Certifications pursuant to section 302 of the
                                   Sarbanes-Oxley Act of 2002

         Exhibit 99.906CERT        Certifications pursuant to Section 906 of the
                                   Sarbanes-Oxley Act of 2002


SIGNATURES

     Pursuant to the requirements of the Securities Exchange Act of 1934 and the
Investment Company Act of 1940, the registrant has duly caused this Report to be
signed on its behalf by the undersigned, there unto duly authorized.

SMITH BARNEY INVESTMENT FUNDS INC.

By:   /s/ R. JAY GERKEN
      R. JAY GERKEN
      Chief Executive Officer of
      SMITH BARNEY INVESTMENT FUNDS INC.

Date: December 8, 2004

     Pursuant to the requirements of the Securities Exchange Act of 1934 and the
Investment Company Act of 1940, this report has been signed below by the
following persons on behalf of the registrant and in the capacities and on the
dates indicated.


By:   /s/ R. JAY GERKEN
      R. JAY GERKEN
      Chief Executive Officer of
      SMITH BARNEY INVESTMENT FUNDS INC.

Date: December 8, 2004


By:   /s/ KAPREL OZSOLAK
      KAPREL OZSOLAK
      Chief Financial Officer of
      SMITH BARNEY INVESTMENT FUNDS INC.

Date: December 8, 2004