UNITED STATES
SECURITIES AND EXCHANGE COMMISSION
Washington, D.C. 20549
FORM N-CSR
CERTIFIED SHAREHOLDER REPORT OF REGISTERED
MANAGEMENT INVESTMENT COMPANIES
Investment Company Act file number 811-3275
Smith Barney Investment Funds Inc.
(Exact name of registrant as specified in charter)
| | |
| 125 Broad Street, New York, NY | | 10004 |
|
| (Address of principal executive offices) | | (Zip code) |
Robert I. Frenkel, Esq.
Smith Barney Fund Management LLC
300 First Stamford Place
Stamford, CT 06902
(Name and address of agent for service)
Registrant’s telephone number, including area code: (800) 451-2010
Date of fiscal year end: April 30
Date of reporting period: April 30, 2005
ITEM 1. REPORT TO STOCKHOLDERS.
The Annual Report to Stockholders is filed herewith.
SMITH BARNEY
HANSBERGER
GLOBAL VALUE FUND
CLASSIC SERIES | ANNUAL REPORT | APRIL 30, 2005

| | |

| | HANSBERGER GLOBAL INVESTORS, INC. |
|
 |
NOT FDIC INSURED • NOT BANK GUARANTEED • MAY LOSE VALUE
WHAT’S INSIDE
LETTER FROM THE CHAIRMAN

R. JAY GERKEN
Chairman, President and
Chief Executive Officer
Dear Shareholder,
Despite generally lackluster economic news, the international equity markets generated solid results for the 12-month reporting period covered by this report. A recent International Monetary Fund’s World Economic Outlook projected a modest 1.6% growth rate for the Eurozone in 2005 and Japanese growth is expected to be 0.8% in 2005, compared to 2.6% in 2004. Yet, international equities, as measured by the MSCI EAFE Index,i returned 14.95% over the reporting period. In contrast, U.S. stocks, as measured by the S&P 500 Index,ii rose 6.33% over the same period.
During the first half of the period, stocks traded in a fairly narrow range, as economic uncertainty, terrorism threats, and inflationary pressures caused many investors to remain on the sidelines. However, from late October 2004 through the end of the year, equities in both the U.S. and abroad rallied sharply. Investors were drawn to stocks as oil prices retreated from their record highs and the uncertainty of the U.S. Presidential election lifted. Thus far in 2005, the equity markets have been volatile. International equities were weak in January and then rallied strongly in February. However, they again fell in March and April. The market’s recent troubles have been attributed to mixed economic data and continued high oil prices.
Please read on for a more detailed look at prevailing economic and market conditions during the Fund’s fiscal year and to learn how those conditions have affected Fund performance.
Information About Your Fund
As you may be aware, several issues in the mutual fund industry have recently come under the scrutiny of federal and state regulators. The Fund’s Adviser and some of its affiliates have received requests for information from various government regulators regarding market timing, late trading, fees, and other mutual fund issues in connection with various investigations. The regulators appear to be examining, among other things, the Fund’s response to market timing and shareholder exchange activity, including compliance with prospectus disclosure related to these subjects. The Fund has been informed that the Adviser and its affiliates are responding to those information requests, but are not in a position to predict the outcome of these requests and investigations.
Important information concerning the Fund and its Adviser with regard to recent regulatory developments is contained in the “Additional Information” note in the Notes to the Financial Statements included in this report.
As always, thank you for your confidence in our stewardship of your assets. We look forward to helping you continue to meet your financial goals.
Sincerely,

R. Jay Gerken, CFA
Chairman, President and Chief Executive Officer
May 13, 2005
1 Smith Barney Hansberger Global Value Fund | 2005 Annual Report
MANAGER OVERVIEW

THOMAS L. HANSBERGER, CFA, CIC
Chairman and Chief Executive Officer, Hansberger Global Investors, Inc.
PERFORMANCE SNAPSHOT
AS OF APRIL 30, 2005
(excluding sales charges)
(unaudited)
| | | | | | |
| | | 6 Months | | | 12 Months | |
| | | | | | | |
Hansberger Global Value Fund — Class A Shares | | 4.58 | % | | 6.63 | % |
| | | | | | | |
MSCI ACWI Free Index | | 6.08 | % | | 11.03 | % |
| | | | | | | |
Lipper Global Large-Cap Value Funds Category Average | | 6.14 | % | | 8.79 | % |
The performance shown represents past performance. Past performance is no guarantee of future results and current performance may be higher or lower than the performance shown above. Principal value and investment returns will fluctuate and investors’ shares, when redeemed, may be worth more or less than their original cost. To obtain performance data current to the most recent month-end, please visit our website at www.citigroupam.com.
Performance figures reflect reimbursements and/or fee waivers, without which the performance would have been lower.
Class A share returns assume the reinvestment of income dividends and capital gains distributions, if any, at net asset value and the deduction of all fund expenses. Returns have not been adjusted to include sales charges that may apply when shares are purchased or the deduction of taxes that a shareholder would pay on fund distributions. Excluding sales charges, Class B shares returned 4.21%, Class C shares returned 4.13% and Class Y shares returned 4.93% over the six months ended April 30, 2005. Excluding sales charges, Class B shares returned 5.84%, Class C shares returned 5.67% and Class Y shares returned 7.25% over the 12 months ended April 30, 2005.
Lipper, Inc. is a major independent mutual-fund tracking organization. Returns are based on the period ended April 30, 2005, including the reinvestment of dividends and capital gains distributions, if any, calculated among the 22 funds for the six-month period and among the 22 funds for the 12-month period in the fund’s Lipper category and excluding sales charges.
Performance Review
For the 12 months ended April 30, 2005, Class A shares of the Smith Barney Hansberger Global Value Fund, excluding sales charges, returned 6.63%. These shares underperformed the Lipper Global Large-Cap Value Funds Category Average,1 which was 8.79%. The Fund’s unmanaged benchmark, the MSCI ACWI (All Country World Index) Free Indexiii returned 11.03% for the same period.
Market Overview
In the face of seemingly insurmountable headwinds, the global equity markets managed to turn in positive performance results for the fiscal year ended April 30, 2005. For much of the past year, the markets dealt with a significant rise in the price of oil and other commodities, several hikes in U.S. interest rates and presidential elections in the U.S. and elsewhere. These issues created a high level of investor uncertainty and stoked fears of potentially higher inflation, slower economic growth, and even “stagflation,” the combination of higher inflation and sluggish economic growth.
Against this backdrop of uncertainty, investors rotated into companies in the energy and utilities sectors, which performed well. Companies in the energy sector benefited from the sharp rise in oil prices, which topped $50 per barrel in late 2004 and continued to remain at these high levels through the end of the Fund’s fiscal year. Utilities benefited from the earnings stability and high dividend yields that have traditionally been associated with companies in this sector.
From a geographic standpoint, the economies and stock markets of South Africa, Australia, New Zealand, Canada, and Brazil, generally benefited from the sharp rise in
| 1 | | Lipper, Inc. is a major independent mutual-fund tracking organization. Returns are based on the 12-month period ended April 30, 2005, including the reinvestment of dividends and capital gains, if any, calculated among the 22 Funds in the Fund’s Lipper category, and excluding sales charges. |
2 Smith Barney Hansberger Global Value Fund | 2005 Annual Report
commodity prices. Investments in these countries, as well as in other international markets, also benefited from the continued decline in the U.S. dollar. During the past year, the decline in the U.S. dollar provided a significant source of additional return for U.S. investors invested in international assets.
What Affected Fund Performance
For most of the past year, the relatively low level of interest rates and a benign global economic environment seemed to lead to an increase in the willingness of investors to invest in risky assets. In our opinion, the decline in risk aversion was puzzling considering the high probability of rising interest rates and the elevated level of uncertainty surrounding economic growth and inflation. That said, investors sought higher returns in emerging market equities and bonds, as well as in smaller capitalization and more speculative stocks globally. Considering the Fund’s bias towards established, large capitalization companies, the increased propensity for risk by the global investment community played a role in the Fund’s underperformance versus the benchmark over the reporting period. In addition, an underweight allocation to the energy and utilities sectors relative to the benchmark detracted from performance. While the Fund’s holdings in the energy sector, such as Brazil-based Petroleo Brasileiro S.A. and Europe-based Total Fina Elf S.A. and ENI S.p.A. performed well, the Fund’s average weight in the energy sector was well below that of the Index during the period. Considering the strong performance of the sector, this underweight allocation hurt the Fund’s relative performance. Similarly, while the Fund’s two investments in the utilities sector performed relatively well, German-based E.ON AG and France-based SUEZ S.A., an underweight allocation to the sector detracted from relative performance.
In addition to these allocation decisions, company-specific issues with respect to investments in the U.S. also hurt relative performance. In the information technology sector, the value of the Fund’s investment in Unisys Corp. declined sharply following the company’s announcement that it would need to increase its provisions for pension liabilities and lowered its 2005 earnings guidance. In the financials sector, the Fund’s investment in American International Group, Inc. (“AIG”) was negatively impacted by accusations of alleged accounting irregularities. The shares of AIG ended the Fund’s fiscal year sharply lower, hurting the Fund’s overall return.
Conversely, the Fund’s investments in the defensive healthcare and consumer staples sectors were the most significant positive contributors to performance. Despite a number of concerns related to specific pharmaceutical products and a more onerous regulatory environment in the U.S., the Fund’s investments in pharmaceutical companies GlaxoSmithKline PLC and Wyeth, as well as hospital operator HCA Inc. performed relatively well. In the consumer staples sector, holdings in France-based food producer Groupe Danone and U.S.-based supermarket chain Albertson’s, Inc. contributed positively to the Fund’s relative performance. We sold the Fund’s investments in HCA, Inc. and Albertson’s prior to the end of the reporting period to preserve what we believed to be significant profits in those stocks.
Thank you for your investment in the Smith Barney Hansberger Global Value Fund. As ever, we appreciate that you have chosen us to manage your assets and we remain focused on achieving the Fund’s investment goals.
Sincerely,

Thomas L. Hansberger, CFA, CIC
Chairman and Chief Executive Officer, Hansberger Global Investors, Inc.
May 13, 2005
3 Smith Barney Hansberger Global Value Fund | 2005 Annual Report
The information provided is not intended to be a forecast of future events, a guarantee of future results or investment advice. Views expressed may differ from those of Citigroup Inc. as a whole.
Portfolio holdings and breakdowns are as of April 30, 2005 and are subject to change and may not be representative of the portfolio manager’s current or future investments. The Fund’s top ten holdings (as a percentage of net assets) as of this date were: GlaxoSmithKline plc (2.11%), Telefonica Moviles (2.05%), HSBC Holdings (1.85%), DBS Group Holdings (1.80%), Alliance Capital Management (1.79%), General Electric Co. (1.77%), Johnson Electric Holdings (1.75%), MetLife Inc. (1.74%), Total Fina Elf S.A. (1.72%) and Nestle SA (1.72%). Please refer to pages 10 through 12 for a list and percentage breakdown of the Fund’s holdings.
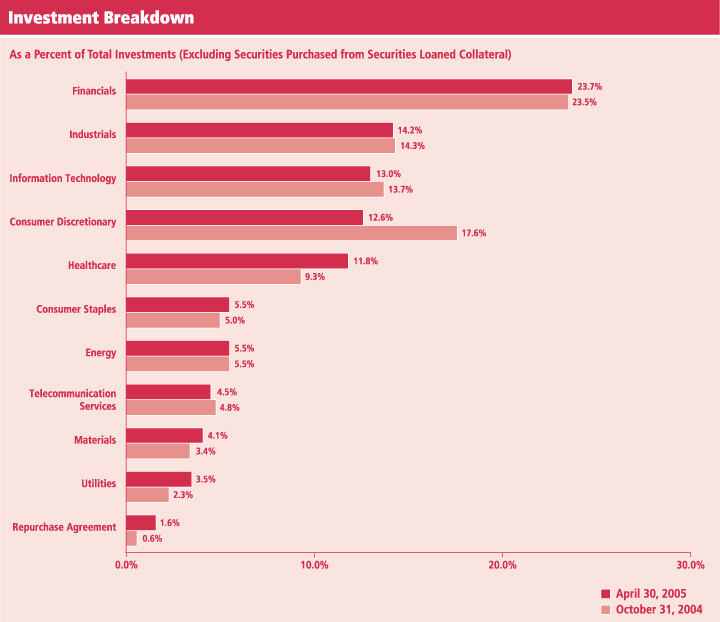
The mention of sector breakdowns is for informational purposes only and should not be construed as a recommendation to purchase or sell any securities. The information provided regarding such sectors is not a sufficient basis upon which to make an investment decision. Investors seeking financial advice regarding the appropriateness of investing in any securities or investment strategies discussed should consult their financial professional. Portfolio holdings are subject to change at any time and may not be representative of the portfolio manager’s current or future investments. The Fund’s top five sector holdings (as a percentage of net assets) as of April 30, 2005 were: Financials (23.61%), Industrials (14.13%), Information Technology (13.00%), Consumer Discretionary (12.60%) and Healthcare (11.78%). The Fund’s portfolio composition is subject to change at any time.
RISKS: Keep in mind, the Fund is subject to certain risks of overseas investing, not associated with domestic investing, including currency fluctuations, changes in political and economic conditions, differing securities regulations and periods of illiquidity, which could result in significant market fluctuations. These risks are magnified in emerging or developing markets. The Fund may use derivatives, such as options and futures, which can be illiquid, may disproportionately increase losses, and have a potentially large impact on Fund performance.
All index performance reflects no deduction for fees, expenses or taxes. Please note an investor cannot invest directly in an index.
| i | | The MSCI EAFE Index is an unmanaged index of common stocks of companies located in Europe, Australasia and the Far East. |
| ii | | The S&P 500 Index is a market capitalization-weighted index of 500 widely held common stocks. |
| iii | | The MSCI ACWI (All Country World Index) Free Index represents the performance of 47 markets in both the developed and emerging markets in Africa, Europe, North America and South America. |
4 Smith Barney Hansberger Global Value Fund | 2005 Annual Report
Fund at a Glance (unaudited)
5 Smith Barney Hansberger Global Value Fund | 2005 Annual Report
| | |
| Fund Expenses (unaudited) | | |
Example
As a shareholder of the Fund, you may incur two types of costs: (1) transaction costs, including front-end and back-end sales charges (loads) on purchase payments, reinvested dividends, or other distributions; and (2) ongoing costs, including management fees; distribution and/or service (12b-1) fees; and other Fund expenses. This example is intended to help you understand your ongoing costs (in dollars) of investing in the Fund and to compare these costs with the ongoing costs of investing in other mutual funds.
This example is based on an investment of $1,000 invested on November 1, 2004 and held for the six months ended April 30, 2005.
Actual Expenses
The table below titled “Based on Actual Total Return” provides information about actual account values and actual expenses. You may use the information provided in this table, together with the amount you invested, to estimate the expenses that you paid over the period. To estimate the expenses you paid on your account, divide your ending account value by $1,000 (for example, an $8,600 ending account value divided by $1,000 = 8.6), then multiply the result by the number under the heading entitled “Expenses Paid During the Period”.
Based on Actual Total Return(1)
| | | | | | | | | | | | | | | |
| | | Actual Total
Return Without
Sales Charges(2) | | | Beginning
Account
Value | | Ending
Account
Value | | Annualized
Expense
Ratio | | | Expenses
Paid During
the Period(3) |
Class A | | 4.58 | % | | $ | 1,000.00 | | $ | 1,045.80 | | 1.66 | % | | $ | 8.42 |
|
Class B | | 4.21 | | | | 1,000.00 | | | 1,042.10 | | 2.44 | | | | 12.35 |
|
Class C | | 4.13 | | | | 1,000.00 | | | 1,041.30 | | 2.49 | | | | 12.60 |
|
Class Y | | 4.93 | | | | 1,000.00 | | | 1,049.30 | | 1.09 | | | | 5.54 |
|
| (1) | | For the six months ended April 30, 2005. |
| (2) | | Assumes reinvestment of all dividends and capital gain distributions, if any, at net asset value and does not reflect the deduction of the applicable sales charges with respect to Class A shares or the applicable contingent deferred sales charges (“CDSC”) with respect to Class B and C shares. Total return is not annualized, as it may not be representative of the total return for the year. Performance figures may reflect voluntary fee waivers and/or expense reimbursements. Past performance is no guarantee of future results. In the absence of voluntary fee waivers and/or expense reimbursements, the total return would have been lower. |
| (3) | | Expenses (net of voluntary fee waiver) are equal to each class’ respective annualized expense ratio multiplied by the average account value over the period, multiplied by the number of days in the most recent fiscal half-year, then divided by 365. |
6 Smith Barney Hansberger Global Value Fund | 2005 Annual Report
| | |
| Fund Expenses (unaudited) (continued) | | |
Hypothetical Example for Comparison Purposes
The table below titled “Based on Hypothetical Total Return” provides information about hypothetical account values and hypothetical expenses based on the actual expense ratio and an assumed rate of return of 5.00% per year before expenses, which is not the Fund’s actual return. The hypothetical account values and expenses may not be used to estimate the actual ending account balance or expenses you paid for the period. You may use the information provided in this table to compare the ongoing costs of investing in the Fund and other funds. To do so, compare the 5.00% hypothetical example relating to the Fund with the 5.00% hypothetical examples that appear in the shareholder reports of the other funds.
Please note that the expenses shown in the table below are meant to highlight your ongoing costs only and do not reflect any transactional costs, such as front-end or back-end sales charges (loads). Therefore, the table is useful in comparing ongoing costs only, and will not help you determine the relative total costs of owning different funds. In addition, if these transaction costs were included, your costs would have been higher.
Based on Hypothetical Total Return(1)
| | | | | | | | | | | | | | | |
| | | Hypothetical
Annualized
Total Return | | | Beginning
Account
Value | | Ending
Account
Value | | Annualized
Expense
Ratio | | | Expenses
Paid During
the Period(2) |
Class A | | 5.00 | % | | $ | 1,000.00 | | $ | 1,016.56 | | 1.66 | % | | $ | 8.30 |
|
Class B | | 5.00 | | | | 1,000.00 | | | 1,012.69 | | 2.44 | | | | 12.18 |
|
Class C | | 5.00 | | | | 1,000.00 | | | 1,012.45 | | 2.49 | | | | 12.42 |
|
Class Y | | 5.00 | | | | 1,000.00 | | | 1,019.39 | | 1.09 | | | | 5.46 |
|
| (1) | | For the six months ended April 30, 2005. |
| (2) | | Expenses (net of voluntary fee waiver) are equal to each class’ respective annualized expense ratio multiplied by the average account value over the period, multiplied by the number of days in the most recent fiscal half-year, then divided by 365. |
7 Smith Barney Hansberger Global Value Fund | 2005 Annual Report
Average Annual Total Returns(1) (unaudited)
| | | | | | | | | | | | |
| | | Without Sales Charges(2)
| |
| | | Class A | | | Class B | | | Class C(3) | | | Class Y | |
Twelve Months Ended 4/30/05 | | 6.63 | % | | 5.84 | % | | 5.67 | % | | 7.25 | % |
|
|
Five Years Ended 4/30/05 | | (0.65 | ) | | (1.41 | ) | | (1.44 | ) | | (0.13 | ) |
|
|
Inception* through 4/30/05 | | 1.71 | | | 0.94 | | | 0.90 | | | 0.88 | |
|
|
| |
| | | With Sales Charges(4)
| |
| | | Class A | | | Class B | | | Class C(3) | | | Class Y | |
Twelve Months Ended 4/30/05 | | 1.28 | % | | 0.84 | % | | 4.67 | % | | 7.25 | % |
|
|
Five Years Ended 4/30/05 | | (1.66 | ) | | (1.60 | ) | | (1.44 | ) | | (0.13 | ) |
|
|
Inception* through 4/30/05 | | 1.00 | | | 0.94 | | | 0.90 | | | 0.88 | |
|
|
Cumulative Total Returns(1) (unaudited)
| | | |
| |
| | | Without Sales Charges(2) | |
Class A (Inception* through 4/30/05) | | 13.28 | % |
|
|
Class B (Inception* through 4/30/05) | | 7.09 | |
|
|
Class C (Inception* through 4/30/05)(3) | | 6.83 | |
|
|
Class Y (Inception* through 4/30/05) | | 6.48 | |
|
|
| (1) | | All figures represent past performance and are not a guarantee of future results. Investment return and principal value of an investment will fluctuate so that an investor’s shares, when redeemed, may be worth more or less than their original cost. The returns shown do not reflect the deduction of taxes that a shareholder would pay on fund distributions or the redemption of fund shares. Performance figures may reflect voluntary fee waivers and/or expense reimbursements. In the absence of voluntary fee waivers and/or expense reimbursements, the total return would have been lower. |
| (2) | | Assumes reinvestment of all dividends and capital gain distributions, if any, at net asset value and does not reflect the deduction of the applicable sales charge with respect to Class A shares or the applicable contingent deferred sales charges (“CDSC”) with respect to Class B and C shares. |
| (3) | | On April 29, 2004, Class L shares were renamed as Class C shares. |
| (4) | | Assumes reinvestment of all dividends and capital gain distributions, if any, at net asset value. In addition, Class A shares reflect the deduction of the maximum initial sales charge of 5.00%; Class B shares reflect the deduction of a 5.00% CDSC, which applies if shares are redeemed within one year from purchase payment. Thereafter, this CDSC declines by 1.00% per year until no CDSC is incurred. Class C shares also reflect the deduction of a 1.00% CDSC, which applies if shares are redeemed within one year from purchase payment. |
| * | | The inception date for Class A, B and C shares is December 19, 1997 and the inception date for Class Y shares is March 10, 1998. |
8 Smith Barney Hansberger Global Value Fund | 2005 Annual Report
| | |
| Historical Performance (unaudited) | | |
Value of $10,000 Invested in Class A, B and C Shares of the
Smith Barney Hansberger Global Value Fund vs. MSCI ACWI (All Country World Index) Free Index†
December 1997 — April 2005
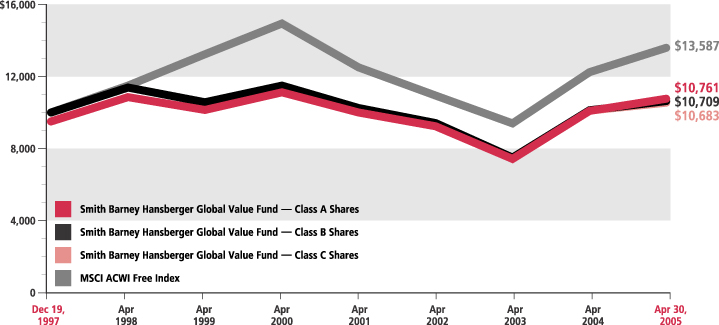
| † | Hypothetical illustration of $10,000 invested in Class A, B and C shares at inception on December 19, 1997, assuming deduction of the maximum sales charge of 5.00% for Class A shares at the time of investment and reinvestment of dividends and capital gains, if any, at net asset value through April 30, 2005. The MSCI ACWI (All Country World Index) Free Index represents the performance of 47 markets in both the developed and the emerging markets in Africa, Asia, Australia, Europe, North America and South America. Emerging markets represent approximately 9.5% and the Index excludes shares which are not readily purchased by non-local investors. The Index is unmanaged and is not subject to the same management and trading expenses as a mutual fund. The performance of the Fund’s other class may be greater or less than the shares’ performance indicated on this chart, depending on whether greater or lesser sales charges and fees were incurred by shareholders investing in the other class. |
All figures represent past performance and are not a guarantee of future results. Investment return and principal value of an investment will fluctuate so that an investor’s shares, when redeemed, may be worth more or less than their original cost. The returns shown do not reflect the deduction of taxes that a shareholder would pay on fund distributions or the redemption of fund shares. Performance figures may reflect voluntary fee waivers and/or expense reimbursements. In the absence of voluntary fee waivers and/or expense reimbursements, the total return would have been lower.
9 Smith Barney Hansberger Global Value Fund | 2005 Annual Report
| | |
| Schedule of Investments | | April 30, 2005 |
| | | | | |
| SHARES | | SECURITY | | VALUE |
| | | | | | |
| STOCK — 98.1% | | | |
| Brazil — 2.9% | | | |
| 65,000 | | CEMIG S.A., ADR (a) | | $ | 1,799,200 |
| 52,000 | | Petroleo Brasileiro S.A., ADR (a) | | | 2,180,360 |
|
| | | | | | 3,979,560 |
|
| Canada — 1.0% | | | |
| 115,000 | | Celestica Inc. — Subordinate Voting Shares (b) | | | 1,322,500 |
|
| Finland (c) — 2.3% | | | |
| 105,000 | | Nokia OYJ (a) | | | 1,684,490 |
| 74,000 | | UPM-Kymmene OYJ | | | 1,485,428 |
|
| | | | | | 3,169,918 |
|
| France (c) — 8.4% | | | |
| 53,000 | | AXA (a) | | | 1,311,633 |
| 21,000 | | BNP Paribas S.A. (a) | | | 1,389,136 |
| 46,000 | | Carrefour S.A. (a) | | | 2,244,231 |
| 15,400 | | Groupe Danone (a) | | | 1,448,824 |
| 18,000 | | Schneider Electric S.A. (a) | | | 1,301,002 |
| 58,200 | | Suez S.A. (a) | | | 1,596,067 |
| 10,700 | | Total Fina Elf S.A. (a) | | | 2,383,785 |
|
| | | | | | 11,674,678 |
|
| Germany (c) — 3.2% | | | |
| 19,000 | | Deutsche Bank AG — Registered Shares | | | 1,558,473 |
| 17,500 | | E.On AG (a) | | | 1,480,775 |
| 21,300 | | Linde AG | | | 1,415,911 |
|
| | | | | | 4,455,159 |
|
| Hong Kong (c) — 4.9% | | | |
| 159,200 | | HSBC Holdings PLC | | | 2,560,458 |
| 202,000 | | Hutchison Whampoa Ltd. (a) | | | 1,811,793 |
| 2,705,000 | | Johnson Electric Holdings Ltd. (a) | | | 2,424,163 |
|
| | | | | | 6,796,414 |
|
| Indonesia (c) — 0.9% | | | |
| 2,722,000 | | PT Indosat Tbk | | | 1,231,189 |
|
| Italy (c) — 1.7% | | | |
| 93,000 | | ENI S.p.A (a) | | | 2,344,765 |
|
| Japan (c) — 11.1% | | | |
| 145,000 | | Asahi Glass Co., Ltd. (a) | | | 1,611,391 |
| 43,000 | | Canon Inc. | | | 2,247,104 |
| 110,000 | | JS Group Corp. | | | 1,983,149 |
| 1,087,000 | | Kawasaki Heavy Industries, Ltd. (a) | | | 2,110,518 |
| 200,000 | | Marubeni Corp. | | | 654,458 |
| 77,000 | | Pioneer Corp. (a) | | | 1,318,195 |
| 11,000 | | Rohm Co. Ltd. | | | 1,040,425 |
| 62,000 | | Sony Corp. | | | 2,291,962 |
| 336,000 | | The Sumitomo Trust & Banking Co., Ltd. | | | 2,108,133 |
|
| | | | | | 15,365,335 |
|
| The Netherlands (c) — 1.0% | | | |
| 48,987 | | ING Groep N.V. (a)(b) | | | 1,348,368 |
|
See Notes to Financial Statements.
10 Smith Barney Hansberger Global Value Fund | 2005 Annual Report
| | |
| Schedule of Investments (continued) | | April 30, 2005 |
| | | | | |
| SHARES | | SECURITY | | VALUE |
| | | | | | |
| Russia — 0.5% | | | |
| 5,000 | | LUKOIL ADR | | $ | 677,500 |
|
| Singapore (c) — 2.8% | | | |
| 284,000 | | DBS Group Holdings Ltd. | | | 2,489,181 |
| 213,000 | | Singapore Airlines Ltd. | | | 1,461,756 |
|
| | | | | | 3,950,937 |
|
| South Korea — 4.2% | | | |
| 45,000 | | Kookmin Bank ADR (a) | | | 1,923,750 |
| 49,000 | | LG Chem Ltd. (c) | | | 1,867,590 |
| 9,000 | | Samsung Electronics Co., Ltd. GDR (d) | | | 2,029,500 |
|
| | | | | | 5,820,840 |
|
| Spain (c) — 3.1% | | | |
| 122,000 | | Banco Santander Central Hispano S.A. (a) | | | 1,430,032 |
| 244,000 | | Telefónica Móviles, S.A. (a) | | | 2,829,834 |
|
| | | | | | 4,259,866 |
|
| Switzerland (c) — 4.4% | | | |
| 37,000 | | Lonza Group AG (a) | | | 2,237,418 |
| 9,000 | | Nestle S.A., Registered B Shares | | | 2,373,836 |
| 32,000 | | Novartis AG | | | 1,564,097 |
|
| | | | | | 6,175,351 |
|
| United Kingdom (c) — 11.8% | | | |
| 53,000 | | AstraZeneca PLC | | | 2,329,841 |
| 466,000 | | Compass Group PLC | | | 2,090,116 |
| 115,872 | | GlaxoSmithKline PLC | | | 2,923,963 |
| 127,500 | | HBOS PLC | | | 1,889,101 |
| 264,821 | | Kingfisher PLC | | | 1,251,332 |
| 242,557 | | Lloyds TSB Group PLC | | | 2,088,333 |
| 165,000 | | Unilever PLC | | | 1,574,471 |
| 812,176 | | Vodafone Group PLC | | | 2,125,304 |
|
| | | | | | 16,272,461 |
|
| United States — 33.9% | | | |
| 55,000 | | Alliance Capital Management Holding L.P. (a) | | | 2,471,700 |
| 38,500 | | American International Group, Inc. | | | 1,957,725 |
| 33,500 | | Bank of America Corp. | | | 1,508,840 |
| 59,000 | | Baxter International Inc. | | | 2,188,900 |
| 48,000 | | Boston Scientific Corp. (b) | | | 1,419,840 |
| 54,000 | | Eastman Kodak Co. | | | 1,350,000 |
| 91,000 | | Electronic Data Systems Corp. | | | 1,760,850 |
| 92,000 | | The Gap, Inc. | | | 1,964,200 |
| 67,562 | | General Electric Co. | | | 2,445,744 |
| 50,500 | | The Home Depot, Inc. | | | 1,786,185 |
| 24,000 | | International Business Machines Corp. | | | 1,833,120 |
| 170,000 | | The Interpublic Group of Companies, Inc. (b) | | | 2,186,200 |
| 60,000 | | Jones Apparel Group, Inc. | | | 1,827,000 |
| 60,700 | | JPMorgan Chase & Co. | | | 2,154,243 |
| 56,000 | | Merck & Co., Inc. | | | 1,898,400 |
| 38,000 | | Merrill Lynch & Co., Inc. | | | 2,049,340 |
| 62,000 | | MetLife, Inc. | | | 2,411,800 |
| 62,000 | | Microsoft Corp. | | | 1,568,600 |
See Notes to Financial Statements.
11 Smith Barney Hansberger Global Value Fund | 2005 Annual Report
| | |
| Schedule of Investments (continued) | | April 30, 2005 |
| | | | | | |
| SHARES | | SECURITY | | VALUE | |
| | | | | | | |
| United States — 33.9% (continued) | | | | |
| 63,000 | | Pfizer Inc. | | $ | 1,711,710 | |
| 272,000 | | Tellabs, Inc. (b) | | | 2,110,720 | |
| 98,000 | | Teradyne, Inc. (b) | | | 1,079,960 | |
| 3,301 | | TIMCO Aviation Services, Inc. | | | 462 | |
| 74,000 | | Tyco International Ltd. | | | 2,316,940 | |
| 200,000 | | Unisys Corp. (b) | | | 1,298,000 | |
| 51,300 | | The Walt Disney Co. | | | 1,354,320 | |
| 50,000 | | Wyeth | | | 2,247,000 | |
|
|
| | | | | | 46,901,799 | |
|
|
| | | TOTAL STOCK
(Cost — $119,645,646) | | | 135,746,640 | |
|
|
| | |
| WARRANTS | | | | | |
| WARRANTS — 0.0% | | | | |
| United States — 0.0% | | | | |
| 1,307 | | TIMCO Aviation Services, Inc. Expire 2/27/07 (b)(c) (Cost — $1) | | | 0 | |
|
|
| | |
| SHARES | | | | | |
| SHORT-TERM INVESTMENTS — 25.8% | |
| SECURITIES PURCHASED FROM SECURITIES LOANED COLLATERAL — 24.2% | |
| 33,440,838 | | State Street Navigator Securities Lending Trust Prime Portfolio | | | 33,440,838 | |
|
|
FACE
AMOUNT | | | | | |
| REPURCHASE AGREEMENT — 1.6% | |
| $ 2,178,000 | | State Street Bank & Trust Co. dated 4/29/05, 2.600% due 5/2/05; Proceeds at maturity — $2,178,472; (Fully collateralized by U.S. Treasury Bonds, 7.250% due 8/15/22; Market value — $2,222,663) | | | 2,178,000 | |
|
|
| | | TOTAL SHORT-TERM INVESTMENTS (Cost — $35,618,838) | | | 35,618,838 | |
|
|
| | | TOTAL INVESTMENTS — 123.9% (Cost — $155,264,485*) | | | 171,365,478 | |
| | | Liabilities in Excess of Other Assets — (23.9)% | | | (33,080,787 | ) |
|
|
| | | TOTAL NET ASSETS — 100.0% | | $ | 138,284,691 | |
|
|
| (a) | | All or a portion of this security is on loan (See Notes 1 and 3). |
| (b) | | Non-income producing security. |
| (c) | | Securities are fair valued at April 30, 2005 in accordance with the policies adopted by the Board of Directors (See Note 1). |
| (d) | | Security is exempt from registration under 144A of the Securities Act of 1933. This security may be sold in transactions that are exempt from registration, normally to qualified institutional buyers. This security has been deemed liquid pursuant to guidelines established by the Board of Directors. |
| * | | Aggregate cost for federal income tax purposes is substantially the same. |
Abbreviations used in this schedule:
ADR — American Depositary Receipt
GDR — Global Depositary Receipt
See Notes to Financial Statements.
12 Smith Barney Hansberger Global Value Fund | 2005 Annual Report
| | |
| Schedule of Investments (continued) | | April 30, 2005 |
| | | |
| Summary of Investments by Sector*** | | | |
Financials | | 23.7 | % |
Industrials | | 14.2 | |
Information Technology | | 13.0 | |
Consumer Discretionary | | 12.6 | |
Healthcare | | 11.8 | |
Consumer Staples | | 5.5 | |
Energy | | 5.5 | |
Telecommunication Services | | 4.5 | |
Materials | | 4.1 | |
Utilities | | 3.5 | |
Repurchase Agreement | | 1.6 | |
|
|
| | | 100.0 | % |
|
|
| *** | | As a percentage of total investments. Please note that Fund holdings are as of April 30, 2005 and are subject to change. |
See Notes to Financial Statements.
13 Smith Barney Hansberger Global Value Fund | 2005 Annual Report
| | |
| Statement of Assets and Liabilities | | April 30, 2005 |
| | | | |
| ASSETS: | | | | |
Investments, at value (Cost — $155,264,485) | | $ | 171,365,478 | |
Foreign currency, at value (Cost — $82,981) | | | 83,009 | |
Cash | | | 170 | |
Dividends and interest receivable | | | 606,574 | |
Receivable for Fund shares sold | | | 4,212 | |
Prepaid expenses | | | 29,313 | |
|
|
Total Assets | | | 172,088,756 | |
|
|
| LIABILITIES: | | | | |
Payable for loaned securities collateral (Notes 1 and 3) | | | 33,440,838 | |
Payable for securities purchased | | | 178,469 | |
Management fee payable | | | 110,683 | |
Transfer agency services payable | | | 6,418 | |
Payable for Fund shares reacquired | | | 5,112 | |
Distribution plan fees payable | | | 3,798 | |
Directors’ fees payable | | | 912 | |
Accrued expenses | | | 57,835 | |
|
|
Total Liabilities | | | 33,804,065 | |
|
|
Total Net Assets | | $ | 138,284,691 | |
|
|
| NET ASSETS: | | | | |
Par value of capital shares (Note 6) | | $ | 11,117 | |
Capital paid in excess of par value | | | 143,710,698 | |
Undistributed net investment income | | | 485,439 | |
Accumulated net realized loss from investment transactions and foreign currencies | | | (22,038,614 | ) |
Net unrealized appreciation of investments and foreign currencies | | | 16,116,051 | |
|
|
Total Net Assets | | $ | 138,284,691 | |
|
|
Shares Outstanding: | | | | |
Class A | | | 606,336 | |
| |
Class B | | | 790,530 | |
| |
Class C | | | 313,653 | |
| |
Class Y | | | 9,405,991 | |
| |
Net Asset Value: | | | | |
Class A (and redemption price) | | | $12.44 | |
| |
Class B * | | | $12.14 | |
| |
Class C * | | | $12.11 | |
| |
Class Y (and redemption price) | | | $12.48 | |
| |
Maximum Public Offering Price Per Share: | | | | |
Class A (based on maximum sales charge of 5.00%) | | | $13.09 | |
|
|
| * | | Redemption price is NAV of Class B and C shares reduced by a 5.00% and 1.00% CDSC, respectively, if shares are redeemed within one year from purchase payment (See Note 2). |
See Notes to Financial Statements.
14 Smith Barney Hansberger Global Value Fund | 2005 Annual Report
| | |
| Statement of Operations | | For the Year Ended April 30, 2005 |
| | | | |
| INVESTMENT INCOME: | | | | |
Dividends | | $ | 4,142,883 | |
Securities lending | | | 172,152 | |
Interest | | | 32,604 | |
Less: Foreign withholding tax | | | (233,713 | ) |
|
|
Total Investment Income | | | 4,113,926 | |
|
|
| EXPENSES: | | | | |
Management fee (Note 2) | | | 1,551,099 | |
Distribution plan fees (Notes 2 and 4) | | | 164,406 | |
Custody | | | 81,496 | |
Audit and legal | | | 49,154 | |
Registration fees | | | 44,489 | |
Transfer agency services (Notes 2 and 4) | | | 43,517 | |
Shareholder communications (Note 4) | | | 35,422 | |
Directors’ fees | | | 23,255 | |
Pricing fees | | | 10,987 | |
Other | | | 5,243 | |
|
|
Total Expenses | | | 2,009,068 | |
Less: Management fee waiver (Notes 2 and 8) | | | (13,068 | ) |
|
|
Net Expenses | | | 1,996,000 | |
|
|
Net Investment Income | | | 2,117,926 | |
|
|
REALIZED AND UNREALIZED GAIN (LOSS) ON INVESTMENTS
AND FOREIGN CURRENCIES (NOTES 1 AND 3): | | | | |
Realized Gain (Loss) From: | | | | |
Investment transactions | | | 20,768,153 | |
Foreign currency transactions | | | (76,698 | ) |
|
|
Net Realized Gain | | | 20,691,455 | |
|
|
Net Change in Unrealized Appreciation/Depreciation From: | | | | |
Investments | | | (10,998,202 | ) |
Foreign currencies | | | 11,981 | |
|
|
Net Change in Unrealized Appreciation/Depreciation | | | (10,986,221 | ) |
|
|
Net Gain on Investments and Foreign Currencies | | | 9,705,234 | |
|
|
Increase in Net Assets From Operations | | $ | 11,823,160 | |
|
|
See Notes to Financial Statements.
15 Smith Barney Hansberger Global Value Fund | 2005 Annual Report
| | |
| Statements of Changes in Net Assets | | For the Years Ended April 30, |
| | | | | | | | |
| | | 2005 | | | 2004 | |
| OPERATIONS: | | | | | | | | |
Net investment income | | $ | 2,117,926 | | | $ | 1,167,344 | |
Net realized gain | | | 20,691,455 | | | | 11,826,159 | |
Net change in unrealized appreciation/depreciation | | | (10,986,221 | ) | | | 36,070,767 | |
|
|
Increase in Net Assets From Operations | | | 11,823,160 | | | | 49,064,270 | |
|
|
| DISTRIBUTIONS TO SHAREHOLDERS FROM (NOTE 5): | | | | | | | | |
Net investment income | | | (1,650,586 | ) | | | (1,650,500 | ) |
|
|
Decrease in Net Assets From Distributions to Shareholders | | | (1,650,586 | ) | | | (1,650,500 | ) |
|
|
| FUND SHARE TRANSACTIONS (NOTE 6): | | | | | | | | |
Net proceeds from sale of shares | | | 2,616,809 | | | | 5,322,459 | |
Net asset value of shares issued for reinvestment of distributions | | | 39,244 | | | | 37,616 | |
Cost of shares reacquired | | | (49,968,724 | ) | | | (13,594,998 | ) |
|
|
Decrease in Net Assets From Fund Share Transactions | | | (47,312,671 | ) | | | (8,234,923 | ) |
|
|
Increase (Decrease) in Net Assets | | | (37,140,097 | ) | | | 39,178,847 | |
| NET ASSETS: | | | | | | | | |
Beginning of year | | | 175,424,788 | | | | 136,245,941 | |
|
|
End of year* | | | $138,284,691 | | | | $175,424,788 | |
|
|
* Includes undistributed net investment income of: | | | $485,439 | | | | $94,797 | |
|
|
See Notes to Financial Statements.
16 Smith Barney Hansberger Global Value Fund | 2005 Annual Report
For a share of each class of capital stock outstanding throughout each year ended April 30:
| | | | | | | | | | | | | | | |
| Class A Shares(1) | | 2005 | | | 2004 | | | 2003 | | | 2002 | | | 2001 | |
Net Asset Value, Beginning of Year | | $11.73 | | | $ 8.67 | | | $10.86 | | | $11.79 | | | $13.14 | |
|
|
Income (Loss) From Operations: | | | | | | | | | | | | | | | |
Net investment income | | 0.11 | | | 0.04 | | | 0.06 | | | 0.04 | | | 0.05 | |
Net realized and unrealized gain (loss) | | 0.67 | | | 3.09 | | | (2.20 | ) | | (0.94 | ) | | (1.38 | ) |
|
|
Total Income (Loss) From Operations | | 0.78 | | | 3.13 | | | (2.14 | ) | | (0.90 | ) | | (1.33 | ) |
|
|
Less Distributions From: | | | | | | | | | | | | | | | |
Net investment income | | (0.07 | ) | | (0.07 | ) | | (0.05 | ) | | (0.03 | ) | | (0.02 | ) |
|
|
Total Distributions | | (0.07 | ) | | (0.07 | ) | | (0.05 | ) | | (0.03 | ) | | (0.02 | ) |
|
|
Net Asset Value, End of Year | | $12.44 | | | $11.73 | | | $ 8.67 | | | $10.86 | | | $11.79 | |
|
|
Total Return(2) | | 6.63 | % | | 36.11 | % | | (19.71 | )% | | (7.61 | )% | | (10.10 | )% |
|
|
Net Assets, End of Year (000s) | | $7,544 | | | $7,679 | | | $5,280 | | | $7,704 | | | $10,367 | |
|
|
Ratio to Average Net Assets: | | | | | | | | | | | | | | | |
Expenses | | 1.66 | %(3) | | 1.55 | % | | 1.54 | % | | 1.56 | % | | 1.49 | % |
Net investment income | | 0.89 | | | 0.33 | | | 0.65 | | | 0.35 | | | 0.39 | |
|
|
Portfolio Turnover Rate | | 26 | % | | 27 | % | | 36 | % | | 43 | % | | 74 | % |
|
|
| | | | | |
| Class B Shares(1) | | 2005 | | | 2004 | | | 2003 | | | 2002 | | | 2001 | |
Net Asset Value, Beginning of Year | | $11.47 | | | $ 8.49 | | | $10.66 | | | $11.62 | | | $13.03 | |
|
|
Income (Loss) From Operations: | | | | | | | | | | | | | | | |
Net investment income (loss) | | 0.02 | | | (0.05 | ) | | (0.01 | ) | | (0.04 | ) | | (0.05 | ) |
Net realized and unrealized gain (loss) | | 0.65 | | | 3.03 | | | (2.16 | ) | | (0.92 | ) | | (1.36 | ) |
|
|
Total Income (Loss) From Operations | | 0.67 | | | 2.98 | | | (2.17 | ) | | (0.96 | ) | | (1.41 | ) |
|
|
Net Asset Value, End of Year | | $12.14 | | | $11.47 | | | $ 8.49 | | | $10.66 | | | $11.62 | |
|
|
Total Return(2) | | 5.84 | % | | 35.10 | % | | (20.36 | )% | | (8.26 | )% | | (10.82 | )% |
|
|
Net Assets, End of Year (000s) | | $9,594 | | | $10,937 | | | $8,831 | | | $13,993 | | | $20,476 | |
|
|
Ratio to Average Net Assets: | | | | | | | | | | | | | | | |
Expenses | | 2.41 | %(3) | | 2.34 | % | | 2.31 | % | | 2.31 | % | | 2.29 | % |
Net investment income (loss) | | 0.13 | | | (0.45 | ) | | (0.13 | ) | | (0.33 | ) | | (0.39 | ) |
|
|
Portfolio Turnover Rate | | 26 | % | | 27 | % | | 36 | % | | 43 | % | | 74 | % |
|
|
| (1) | | Per share amounts have been calculated using the monthly average shares method. |
| (2) | | Performance figures may reflect voluntary fee waivers and/or expense reimbursements. Past performance is no guarantee of future results. In the absence of voluntary fee waivers and/or expense reimbursements, the total return would have been lower. |
| (3) | | The investment manager voluntarily waived a portion of its management fee for the year ended April 30, 2005. If such fee were not voluntarily waived, the actual expense ratios would have been 1.67% and 2.42% for Class A and B shares, respectively. |
See Notes to Financial Statements.
17 Smith Barney Hansberger Global Value Fund | 2005 Annual Report
| | |
| Financial Highlights (continued) | | |
For a share of each class of capital stock outstanding throughout each year ended April 30:
| | | | | | | | | | | | | | | |
| Class C Shares(1)(2) | | 2005 | | | 2004 | | | 2003 | | | 2002 | | | 2001 | |
Net Asset Value, Beginning of Year | | $11.46 | | | $ 8.49 | | | $10.65 | | | $11.62 | | | $13.02 | |
|
|
Income (Loss) From Operations: | | | | | | | | | | | | | | | |
Net investment loss | | 0.00 | * | | (0.05 | ) | | (0.01 | ) | | (0.04 | ) | | (0.05 | ) |
Net realized and unrealized gain (loss) | | 0.65 | | | 3.02 | | | (2.15 | ) | | (0.93 | ) | | (1.35 | ) |
|
|
Total Income (Loss) From Operations | | 0.65 | | | 2.97 | | | (2.16 | ) | | (0.97 | ) | | (1.40 | ) |
|
|
Net Asset Value, End of Year | | $12.11 | | | $11.46 | | | $ 8.49 | | | $10.65 | | | $11.62 | |
|
|
Total Return(3) | | 5.67 | % | | 34.98 | % | | (20.28 | )% | | (8.35 | )% | | (10.75 | )% |
|
|
Net Assets, End of Year (000s) | | $3,799 | | | $4,389 | | | $3,189 | | | $4,680 | | | $6,094 | |
|
|
Ratio to Average Net Assets: | | | | | | | | | | | | | | | |
Expenses | | 2.49 | %(4) | | 2.37 | % | | 2.34 | % | | 2.35 | % | | 2.29 | % |
Net investment income (loss) | | 0.03 | | | (0.49 | ) | | (0.14 | ) | | (0.37 | ) | | (0.44 | ) |
|
|
Portfolio Turnover Rate | | 26 | % | | 27 | % | | 36 | % | | 43 | % | | 74 | % |
|
|
| | | | | |
| Class Y Shares(2) | | 2005 | | | 2004 | | | 2003 | | | 2002 | | | 2001 | |
Net Asset Value, Beginning of Year | | $11.77 | | | $ 8.69 | | | $10.87 | | | $11.81 | | | $13.16 | |
|
|
Income (Loss) From Operations: | | | | | | | | | | | | | | | |
Net investment income | | 0.18 | | | 0.09 | | | 0.11 | | | 0.10 | | | 0.10 | |
Net realized and unrealized gain (loss) | | 0.67 | | | 3.11 | | | (2.21 | ) | | (0.95 | ) | | (1.37 | ) |
|
|
Total Income (Loss) From Operations | | 0.85 | | | 3.20 | | | (2.10 | ) | | (0.85 | ) | | (1.27 | ) |
|
|
Less Distributions From: | | | | | | | | | | | | | | | |
Net investment income | | (0.14 | ) | | (0.12 | ) | | (0.08 | ) | | (0.09 | ) | | (0.08 | ) |
|
|
Total Distributions | | (0.14 | ) | | (0.12 | ) | | (0.08 | ) | | (0.09 | ) | | (0.08 | ) |
|
|
Net Asset Value, End of Year | | $12.48 | | | $11.77 | | | $ 8.69 | | | $10.87 | | | $11.81 | |
|
|
Total Return(3) | | 7.25 | % | | 36.86 | % | | (19.30 | )% | | (7.16 | )% | | (9.64 | )% |
|
|
Net Assets, End of Year (000s) | | $117,348 | | | $152,420 | | | $118,946 | | | $159,333 | | | $180,709 | |
|
|
Ratio to Average Net Assets: | | | | | | | | | | | | | | | |
Expenses | | 1.07 | %(4) | | 1.05 | % | | 1.05 | % | | 1.04 | % | | 1.06 | % |
Net investment income | | 1.44 | | | 0.83 | | | 1.18 | | | 0.92 | | | 0.81 | |
|
|
Portfolio Turnover Rate | | 26 | % | | 27 | % | | 36 | % | | 43 | % | | 74 | % |
|
|
| (1) | | On April 29, 2004, Class L shares were renamed as Class C shares. |
| (2) | | Per share amounts have been calculated using the monthly average shares method. |
| (3) | | Performance figures may reflect voluntary fee waivers and/or expense reimbursements. Past performance is no guarantee of future results. In the absence of voluntary fee waivers and/or expense reimbursements, the total return would have been lower. |
| (4) | | The investment manager voluntarily waived a portion of its management fee for the year ended April 30, 2005. If such fee were not voluntarily waived, the actual expense ratios would have been 2.50% and 1.08% for Class C and Y shares, respectively. |
| * | | Amount represents less than $0.01. |
See Notes to Financial Statements.
18 Smith Barney Hansberger Global Value Fund | 2005 Annual Report
Notes to Financial Statements
| 1. | Significant Accounting Policies |
The Smith Barney Hansberger Global Value Fund (“Fund”), a separate diversified investment fund of the Smith Barney Investment Funds Inc. (“Company”), a Maryland corporation, is registered under the Investment Company Act of 1940, as amended, as an open-end management investment company.
The following are significant accounting policies consistently followed by the Fund and are in conformity with U.S. generally accepted accounting principles (“GAAP”). Estimates and assumptions are required to be made regarding assets, liabilities and changes in net assets resulting from operations when financial statements are prepared. Changes in the economic environment, financial markets and any other parameters used in determining these estimates could cause actual results to differ.
(a) Investment Valuation. Equity securities for which market quotations are available are valued at the last sale price or official closing price on the primary market or exchange on which they trade. Debt securities are valued at the mean between the bid and asked price provided by an independent pricing service that are based on transactions in debt obligations, quotations from bond dealers, market transactions in comparable securities and various relationships between securities. When prices are not readily available, or are determined not to reflect fair value, such as when the value of a security has been significantly affected by events after the close of the exchange or market on which the security is principally traded, but before the Fund calculates its net asset value, the Fund may value these investments at fair value as determined in accordance with the procedures approved by the Fund’s Board of Directors. Fair valuing of securities may be determined with the assistance of a pricing service using calculations based on indices of domestic securities and other appropriate indicators, such as prices of relevant ADRs and futures contracts. Short-term obligations maturing within 60 days are valued at amortized cost, which approximates market value.
(b) Repurchase Agreements. When entering into repurchase agreements, it is the Fund’s policy that its custodian or a third party custodian take possession of the underlying collateral securities, the market value of which at least equals the principal amount of the repurchase transaction, including accrued interest. To the extent that any repurchase transaction exceeds one business day, the value of the collateral is marked-to-market to ensure the adequacy of the collateral. If the seller defaults, and the market value of the collateral declines or if bankruptcy proceedings are commenced with respect to the seller of the security, realization of the collateral by the Fund may be delayed or limited.
(c) Lending of Portfolio Securities. The Fund has an agreement with its custodian whereby the custodian may lend securities owned by the Fund to brokers, dealers and other financial organizations. In exchange for lending securities under the terms of the agreement with its custodian, the Fund receives a lender’s fee. Fees earned by the Fund on securities lending are recorded as securities lending income. Loans of securities by the Fund are collateralized by cash, U.S. government securities or high quality money market instruments that are maintained at all times in an amount at least equal to the current market value of the loaned securities, plus a margin which varies depending on the type of securities loaned. The custodian establishes and maintains the collateral in a segregated account. The Fund has the right under the lending agreement to recover the securities from the borrower on demand.
The Fund maintains the risk of any loss on the securities on loan as well as the potential loss on investments purchased with cash collateral received from securities lending.
(d) Forward Foreign Currency Contracts. The Fund may enter into forward foreign currency contracts to hedge against foreign currency exchange rate risk on its non-US dollar denominated securities or to facilitate settlement of foreign currency denominated portfolio transactions. A forward foreign currency contract is an agreement between two parties to buy and sell a currency at a set price on a future date. The contract is marked-to-market daily and the change in value is recorded by the Fund as an unrealized gain or loss. When a forward foreign currency contract is extinguished, through
19 Smith Barney Hansberger Global Value Fund | 2005 Annual Report
Notes to Financial Statements (continued)
either delivery or offset by entering into another forward foreign currency contract, the Fund records a realized gain or loss equal to the difference between the value of the contract at the time it was opened and the value of the contract at the time it was extinguished or offset.
Forward foreign currency contracts involve elements of market risk in excess of the amounts reflected in the Statement of Assets and Liabilities. The Fund bears the risk of an unfavorable change in the foreign exchange rate underlying the forward foreign currency contract. Risks may also arise upon entering into these contracts from the potential inability of the counterparties to meet the terms of their contracts.
(e) Concentration Risk. The Fund’s investments in foreign securities may involve risks not present in domestic investments. Since securities may be denominated in a foreign currency and may require settlement in foreign currencies and pay interest or dividends in foreign currencies, changes in the relationship of these foreign currencies to the U.S. dollar can significantly affect the value of the investments and earnings of the Fund. Foreign investments may also subject the Fund to foreign government exchange restrictions, expropriation, taxation or other political, social or economic developments, all of which affect the market and/or credit risk of the investments.
(f) Security Transactions and Investment Income. Security transactions are accounted for on a trade date basis. Interest income, adjusted for amortization of premium and accretion of discount, is recorded on the accrual basis. Dividend income is recorded on the ex-dividend date. Foreign dividend income is recorded on the ex-dividend date or as soon as practical after the Fund determines the existence of a dividend declaration after exercising reasonable due diligence. The cost of investments sold is determined by use of the specific identification method.
(g) Foreign Currency Translation. Investment securities and other assets and liabilities denominated in foreign currencies are translated into U.S. dollar amounts based upon prevailing exchange rates on the date of valuation. Purchases and sales of investment securities and income and expense items denominated in foreign currencies are translated into U.S. dollar amounts based upon prevailing exchange rates on the respective dates of such transactions.
The Fund does not isolate that portion of the results of operations resulting from changes in foreign exchange rates on investments from the fluctuations arising from changes in market prices of securities held. Such fluctuations are included with the net realized and unrealized gain or loss on investments.
Net realized foreign exchange gains or losses arise from sales of foreign currencies, including gains and losses on forward foreign currency contracts, currency gains or losses realized between the trade and settlement dates on securities transactions and the difference between the amounts of dividends, interest and foreign withholding taxes recorded on the Fund’s books and the U.S. dollar equivalent of the amounts actually received or paid. Net unrealized foreign exchange gains and losses arise from changes in the fair values of assets and liabilities, other than investments in securities, at the date of valuation, resulting from changes in exchange rates.
Foreign security and currency transactions may involve certain considerations and risks not typically associated with those of U.S. dollar denominated transactions as a result of, among other factors, the possibility of lower levels of governmental supervision and regulation of foreign securities markets and the possibility of political or economic instability.
(h) Distributions to Shareholders. Distributions from net investment income and distributions of net realized gains, if any, are declared at least annually. Distributions to shareholders of the Fund are recorded on the ex-dividend date and are determined in accordance with income tax regulations, which may differ from GAAP.
20 Smith Barney Hansberger Global Value Fund | 2005 Annual Report
Notes to Financial Statements (continued)
(i) Class Accounting. Investment income, common expenses and realized/unrealized gain (loss) on investments are allocated to the various classes of the Fund on the basis of daily net assets of each class. Fees relating to a specific class are charged directly to that class.
(j) Federal and Other Taxes. It is the Fund’s policy to comply with the federal income and excise tax requirements of the Internal Revenue Code of 1986, as amended, applicable to regulated investment companies. Accordingly, the Fund intends to distribute substantially all of its taxable income and net realized gains on investments, if any, to shareholders each year. Therefore, no federal income tax provision is required in the Fund’s financial statements. Under the applicable foreign tax laws, a withholding tax may be imposed on interest, dividends and capital gains at various rates.
(k) Reclassifications. GAAP requires that certain components of net assets be adjusted to reflect permanent differences between financial and tax reporting. These reclassifications have no effect on net assets or net asset values per share. During the year ended April 30, 2005, the following reclassifications have been made:
| | | | |
Undistributed Net
Investment Income | | | | Accumulated Net
Realized Loss |
| (76,698) | | | | 76,698 |
|
Reclassifications are primarily due to foreign currency transactions treated as ordinary income for tax purposes.
| 2. | Management Agreement and Other Transactions with Affiliates |
Smith Barney Fund Management LLC (“SBFM”), an indirect wholly-owned subsidiary of Citigroup Inc. (“Citigroup”), acts as investment manager of the Fund. The Fund pays SBFM a management fee calculated at an annual rate of 0.95% of the Fund’s average daily net assets. This fee is calculated daily and paid monthly.
During the year ended April 30, 2005, SBFM waived a portion of its management fee amounting to $13,068.
On April 30, 2005, Smith Barney Allocation Series Inc. (“Allocation Series”), also managed by SBFM or one of its affiliates, owned substantially all of the Fund’s outstanding Class Y shares, which represented 85% of the total net assets of the Fund. On May 27, 2005, all Class Y shares were redeemed. In connection with this redemption, SBFM instituted voluntary expense limitations of 1.66%, 2.41% and 2.49% on the Fund’s Class A, B and C shares, respectively. These expense limitations became effective on May 27, 2005 and can be terminated at any time by SBFM.
SBFM has entered into a sub-advisory agreement with Hansberger Global Investors, Inc. (“Hansberger”). Pursuant to the sub-advisory agreement, Hansberger is responsible for the day-to-day portfolio operations and investment decisions of the Fund. SBFM pays Hansberger a fee of 0.50% of the Fund’s average daily net assets for the services Hansberger provides as sub-adviser.
Citicorp Trust Bank, fsb. (“CTB”), another subsidiary of Citigroup, acts as the Fund’s transfer agent. PFPC Inc. (“PFPC”) acts as the Fund’s sub-transfer agent. CTB receives account fees and asset-based fees that vary according to the size and type of account. PFPC is responsible for shareholder recordkeeping and financial processing for all shareholder accounts and is paid by CTB. For the year ended April 30, 2005, the Fund paid transfer agent fees of $20,263 to CTB.
Citigroup Global Markets Inc. (“CGM”), another indirect wholly-owned subsidiary of Citigroup, acts as the Fund’s distributor.
There is a maximum initial sales charge of 5.00% for Class A shares. There is a contingent deferred sales charge (“CDSC”) of 5.00% on Class B shares, which applies if redemption occurs within one year from purchase payment and declines by
21 Smith Barney Hansberger Global Value Fund | 2005 Annual Report
Notes to Financial Statements (continued)
1.00% per year until no CDSC is incurred. Class C shares have a 1.00% CDSC, which applies if redemption occurs within one year from purchase payment. In certain cases, Class A shares have a 1.00% CDSC, which applies if redemption occurs within one year from purchase payment. This CDSC only applies to those purchases of Class A shares, which when combined with current holdings of Class A shares, equal or exceed $1,000,000 in the aggregate. These purchases do not incur an initial sales charge.
For the year ended April 30, 2005, CGM received sales charges of approximately $20,000 on sales of the Fund’s Class A shares. In addition, for the year ended April 30, 2005, CDSCs paid to CGM were approximately $4,000 and $1,000 for Class B and C shares, respectively.
All officers and one Director of the Company are employees of Citigroup or its affiliates and do not receive compensation from the Company.
During the year ended April 30, 2005, the aggregate cost of purchases and proceeds from sales of investments (excluding short-term investments) were as follows:
| | | |
|
Purchases | | $ | 42,156,866 |
|
Sales | | | 86,969,124 |
|
At April 30, 2005, the aggregate gross unrealized appreciation and depreciation of investments for federal income tax purposes were substantially as follows:
| | | | |
|
|
Gross unrealized appreciation | | $ | 22,629,162 | |
Gross unrealized depreciation | | | (6,528,169 | ) |
|
|
Net unrealized appreciation | | $ | 16,100,993 | |
|
|
At April 30, 2005, the Fund loaned securities having a market value of $32,000,523. The Fund received cash collateral amounting to $33,440,838, which was invested into the State Street Navigator Securities Lending Trust Prime Portfolio, a Rule 2a-7 money market fund, under the 1940 Act.
| 4. | Class Specific Expenses |
Pursuant to a Rule 12b-1 Distribution Plan, the Fund pays a service fee with respect to its Class A, B and C shares calculated at the annual rate of 0.25% of the average daily net assets of each respective class. The Fund also pays a distribution fee with respect to its Class B and C shares calculated at the annual rate of 0.75% of the average daily net assets of each class, respectively. For the year ended April 30, 2005, total Rule 12b-1 Distribution Plan fees, which are accrued daily and paid monthly, were as follows:
| | | | | | | | | |
| | | Class A | | Class B | | Class C |
Rule 12b-1 Distribution Plan Fees | | $ | 18,690 | | $ | 102,871 | | $ | 42,845 |
|
For the year ended April 30, 2005, total Transfer Agency Services expenses were as follows:
| | | | | | | | | | | | |
| | | Class A | | Class B | | Class C | | Class Y |
Transfer Agency Services Expenses | | $ | 14,189 | | $ | 19,537 | | $ | 9,512 | | $ | 279 |
|
22 Smith Barney Hansberger Global Value Fund | 2005 Annual Report
Notes to Financial Statements (continued)
For the year ended April 30, 2005, total Shareholder Communication expenses were as follows:
| | | | | | | | | | | | |
| | | Class A | | Class B | | Class C | | Class Y |
Shareholder Communication Expenses | | $ | 10,733 | | $ | 14,793 | | $ | 8,410 | | $ | 1,486 |
|
| 5. | Distributions Paid to Shareholders by Class |
| | | | | | |
| | | Year Ended
April 30, 2005 | | Year Ended
April 30, 2004 |
Net Investment Income | | | | | | |
Class A | | $ | 41,116 | | $ | 39,598 |
Class B | | | — | | | — |
Class C* | | | — | | | — |
Class Y | | | 1,609,470 | | | 1,610,902 |
|
Total | | $ | 1,650,586 | | $ | 1,650,500 |
|
| * | On April 29, 2004, Class L shares were renamed as Class C shares. |
At April 30, 2005, the Company had ten billion shares of capital stock authorized with a par value of $0.001 per share. The Fund has the ability to issue multiple classes of shares. Each share of a class represents an identical legal interest in the Fund and has the same rights, except that each class bears certain expenses, including those specifically related to the distribution of its shares.
Transactions in shares of each class were as follows:
| | | | | | | | | | | | | | |
| | | Year Ended April 30, 2005
| | | Year Ended April 30, 2004
| |
| | | Shares | | | Amount | | | Shares | | | Amount | |
Class A | | | | | | | | | | | | | | |
Shares sold | | 109,233 | | | $ | 1,344,603 | | | 174,767 | | | $ | 2,008,998 | |
Shares issued on reinvestment | | 3,160 | | | | 39,244 | | | 3,237 | | | | 37,616 | |
Shares reacquired | | (160,521 | ) | | | (1,935,142 | ) | | (132,263 | ) | | | (1,421,677 | ) |
|
|
Net Increase (Decrease) | | (48,128 | ) | | $ | (551,295 | ) | | 45,741 | | | $ | 624,937 | |
|
|
Class B | | | | | | | | | | | | | | |
Shares sold | | 66,365 | | | $ | 800,476 | | | 182,241 | | | $ | 2,086,870 | |
Shares reacquired | | (229,440 | ) | | | (2,741,380 | ) | | (268,287 | ) | | | (2,891,818 | ) |
|
|
Net Decrease | | (163,075 | ) | | $ | (1,940,904 | ) | | (86,046 | ) | | $ | (804,948 | ) |
|
|
Class C* | | | | | | | | | | | | | | |
Shares sold | | 39,654 | | | $ | 471,730 | | | 86,719 | | | $ | 958,925 | |
Shares reacquired | | (109,123 | ) | | | (1,312,091 | ) | | (79,316 | ) | | | (837,326 | ) |
|
|
Net Increase (Decrease) | | (69,469 | ) | | $ | (840,361 | ) | | 7,403 | | | $ | 121,599 | |
|
|
Class Y | | | | | | | | | | | | | | |
Shares sold | | — | | | | — | | | 21,788 | | | $ | 267,666 | |
Shares reacquired | | (3,546,995 | ) | | $ | (43,980,111 | ) | | (749,509 | ) | | | (8,444,177 | ) |
|
|
Net Decrease | | (3,546,995 | ) | | $ | (43,980,111 | ) | | (727,721 | ) | | $ | (8,176,511 | ) |
|
|
| * | On April 29, 2004, Class L shares were renamed as Class C shares. |
23 Smith Barney Hansberger Global Value Fund | 2005 Annual Report
Notes to Financial Statements (continued)
| 7. | Income Tax Information and Distributions to Shareholders |
The tax character of distributions paid during the years ended April 30, was as follows:
| | | | | | |
| | | 2005 | | 2004 |
Distributions paid from: | | | | | | |
Ordinary income | | $ | 1,650,586 | | $ | 1,650,500 |
|
As of April 30, 2005, the components of accumulated earnings on a tax basis were as follows:
| | | | |
|
|
Undistributed ordinary income | | $ | 485,439 | |
|
|
Total undistributed earnings | | | 485,439 | |
Capital loss carryforward * | | | (22,038,614 | ) |
Unrealized appreciation | | | 16,116,051 | |
|
|
Total Accumulated Losses | | $ | (5,437,124 | ) |
|
|
| * | During the taxable year ended April 30, 2005, Smith Barney Hansberger Global Value Fund utilized $20,768,153 of its capital loss carryover available from prior years. As of April 30, 2005, the Fund had the following net capital loss carryforwards remaining: |
| | | | |
| Year of Expiration | | Amount | |
4/30/2008 | | $ | (1,273,822 | ) |
4/30/2010 | | | (4,231,110 | ) |
4/30/2011 | | | (16,533,682 | ) |
|
|
| | | $ | (22,038,614 | ) |
|
|
| | These amounts will be available to offset any future taxable capital gains. |
On May 31, 2005, the U.S. Securities and Exchange Commission (“SEC”) issued an order in connection with the settlement of an administrative proceeding against Smith Barney Fund Management LLC (“SBFM”) and Citigroup Global Markets Inc. (“CGMI”) relating to the appointment of an affiliated transfer agent for the Smith Barney family of mutual funds (the “Funds”).
The SEC order finds that SBFM and CGMI willfully violated Section 206(1) of the Investment Advisers Act of 1940 (“Advisers Act”). Specifically, the order finds that SBFM and CGMI knowingly or recklessly failed to disclose to the boards of the Funds in 1999 when proposing a new transfer agent arrangement with an affiliated transfer agent that: First Data Investors Services Group (“First Data”), the Funds’ then-existing transfer agent, had offered to continue as transfer agent and do the same work for substantially less money than before; and that Citigroup Asset Management (“CAM”), the Citigroup business unit that includes the fund’s investment manager and other investment advisory companies, had entered into a side letter with First Data under which CAM agreed to recommend the appointment of First Data as sub-transfer agent to the affiliated transfer agent in exchange, among other things, for a guarantee by First Data of specified amounts of asset management and investment banking fees to CAM and CGMI. The order also finds that SBFM and CGMI willfully violated Section 206(2) of the Advisers Act by virtue of the omissions discussed above and other misrepresentations and omissions in the materials provided to the Funds’ boards, including the failure to make clear that the affiliated transfer agent would earn a high profit for performing limited functions while First Data continued to perform almost all of the transfer agent functions, and the suggestion that the proposed arrangement was in the Funds’ best interests and that no viable alternatives existed. SBFM and CGMI do not admit or deny any wrongdoing or liability. The settlement does not establish wrongdoing or liability for purposes of any other proceeding.
The SEC censured SBFM and CGMI and ordered them to cease and desist from violations of Sections 206(1) and 206(2) of the Advisers Act. The order requires Citigroup to pay $208.1 million, including $109 million in disgorgement of profits,
24 Smith Barney Hansberger Global Value Fund | 2005 Annual Report
Notes to Financial Statements (continued)
$19.1 million in interest, and a civil money penalty of $80 million. Approximately $24.4 million has already been paid to the Funds, primarily through fee waivers. The remaining $183.7 million, including the penalty, has been paid to the U.S. Treasury and will be distributed pursuant to a plan to be prepared by Citigroup and submitted within 90 days of the entry of the order for approval by the SEC. The order also requires that transfer agency fees received from the Funds since December 1, 2004 less certain expenses be placed in escrow and provides that a portion of such fees may be subsequently distributed in accordance with the terms of the order.
The order requires SBFM to recommend a new transfer agent contract to the Fund boards within 180 days of the entry of the order; if a Citigroup affiliate submits a proposal to serve as transfer agent or sub-transfer agent, an independent monitor must be engaged at the expense of SBFM and CGMI to oversee a competitive bidding process. Under the order, Citigroup also must comply with an amended version of a vendor policy that Citigroup instituted in August 2004. That policy, as amended, among other things, requires that when requested by a Fund board, CAM will retain at its own expense an independent consulting expert to advise and assist the board on the selection of certain service providers affiliated with Citigroup.
At this time, there is no certainty as to how the proceeds of the settlement will be distributed, to whom such distributions will be made, the methodology by which such distributions will be allocated, and when such distributions will be made. Although there can be no assurance, Citigroup does not believe that this matter will have a material adverse effect on the Funds.
Beginning in June 2004, class action lawsuits alleging violations of the federal securities laws were filed against Citigroup Global Markets Inc. (the “Distributor”) and a number of its affiliates, including Smith Barney Fund Management LLC and Salomon Brothers Asset Management Inc (the “Advisers”), substantially all of the mutual funds managed by the Advisers, including the Fund (the “Funds”), and directors or trustees of the Funds (collectively, the “Defendants”). The complaints alleged, among other things, that the Distributor created various undisclosed incentives for its brokers to sell Smith Barney and Salomon Brothers funds. In addition, according to the complaints, the Advisers caused the Funds to pay excessive brokerage commissions to the Distributor for steering clients towards proprietary funds. The complaints also alleged that the defendants breached their fiduciary duty to the Funds by improperly charging Rule 12b-1 fees and by drawing on fund assets to make undisclosed payments of soft dollars and excessive brokerage commissions. The complaints also alleged that the Funds failed to adequately disclose certain of the allegedly wrongful conduct. The complaints sought injunctive relief and compensatory and punitive damages, rescission of the Funds’ contracts with the Advisers, recovery of all fees paid to the Advisers pursuant to such contracts and an award of attorneys’ fees and litigation expenses.
On December 15, 2004, a consolidated amended complaint (the “Complaint”) was filed alleging substantially similar causes of action. While the lawsuit is in its earliest stages, to the extent that the Complaint purports to state causes of action against the Funds, Citigroup Asset Management believes the Funds have significant defenses to such allegations, which the Funds intend to vigorously assert in responding to the Complaint.
Additional lawsuits arising out of these circumstances and presenting similar allegations and requests for relief may be filed against the Defendants in the future.
As of the date of this report, Citigroup Asset Management and the Funds believe that the resolution of the pending lawsuit will not have a material effect on the financial position or results of operations of the Funds or the ability of the Advisers and their affiliates to continue to render services to the Funds under their respective contracts.
25 Smith Barney Hansberger Global Value Fund | 2005 Annual Report
Notes to Financial Statements (continued)
10. Subsequent Event
On June 24, 2005, Citigroup announced that it has signed a definitive agreement under which Citigroup will sell substantially all of its worldwide asset management business to Legg Mason, Inc. (“Legg Mason”).
As part of this transaction, SBFM (the “Manager”), currently an indirect wholly owned subsidiary of Citigroup, would become an indirect wholly owned subsidiary of Legg Mason. The Manager is the investment manager to the Fund.
The transaction is subject to certain regulatory approvals, as well as other customary conditions to closing. Subject to such approvals and the satisfaction of the other conditions, Citigroup expects the transaction to be completed later this year.
Under the Investment Company Act of 1940, consummation of the transaction will result in the automatic termination of the investment management contract between the Fund and the Manager. Therefore, the Fund’s Board of Directors will be asked to approve a new investment management contract between the Fund and the Manager. If approved by the Board, the new investment management contract will be presented to the shareholders of the Fund for their approval.
26 Smith Barney Hansberger Global Value Fund | 2005 Annual Report
Report of Independent Registered Public Accounting Firm
The Shareholders and Board of Directors of Smith Barney Investment Funds Inc.:
We have audited the accompanying statement of assets and liabilities, including the schedule of investments, of Smith Barney Hansberger Global Value Fund (“Fund”) of Smith Barney Investment Funds Inc. as of April 30, 2005, and the related statement of operations for the year then ended, the statements of changes in net assets for each of the years in the two-year period then ended, and the financial highlights for each of the years in the five-year period then ended. These financial statements and financial highlights are the responsibility of the Fund’s management. Our responsibility is to express an opinion on these financial statements and financial highlights based on our audits.
We conducted our audits in accordance with the standards of the Public Company Accounting Oversight Board (United States). Those standards require that we plan and perform the audit to obtain reasonable assurance about whether the financial statements and financial highlights are free of material misstatement. An audit includes examining, on a test basis, evidence supporting the amounts and disclosures in the financial statements. Our procedures included confirmation of securities owned as of April 30, 2005, by correspondence with the custodian or broker. An audit also includes assessing the accounting principles used and significant estimates made by management, as well as evaluating the overall financial statement presentation. We believe that our audits provide a reasonable basis for our opinion.
In our opinion, the financial statements and financial highlights referred to above present fairly, in all material respects, the financial position of the Smith Barney Hansberger Global Value Fund of Smith Barney Investment Funds Inc. as of April 30, 2005, and the results of its operations for the year then ended, the changes in its net assets for each of the years in the two-year period then ended, and the financial highlights for each of the years in the five-year period then ended, in conformity with U.S. generally accepted accounting principles.

New York, New York
June 24, 2005
27 Smith Barney Hansberger Global Value Fund | 2005 Annual Report
| | |
| Additional Information (unaudited) | | |
Information about Directors and Officers
The business and affairs of the Smith Barney Hansberger Global Value Fund (“Fund”) are managed under the direction of the Smith Barney Investment Funds Inc.’s (“Company”) Board of Directors. Information pertaining to the Directors and certain officers of the Company is set forth below. The Statement of Additional Information includes additional information about the Company’s Directors and is available, without charge, upon request by calling the Fund’s transfer agent (Citicorp Trust Bank, fsb. at 1-800-451-2010).
| | | | | | | | | | |
| Name, Address and Birth Year | | Position(s) Held with Fund | | Term of Office*
and Length of Time Served | | Principal Occupation(s) During Past Five Years | | Number of
Portfolios in the
Fund Complex
Overseen by Director | | Other Board Memberships
Held by Director |
Non-Interested Directors: | | | | | | |
| | | | | |
Paul R. Ades Paul R. Ades, PLLC 181 West Main Street Suite C Babylon, NY 11702 Birth Year: 1940 | | Director | | Since
1994 | | Law Firm of Paul R. Ades, PLLC (from April 2000 to Present); Partner in Law Firm of Murov & Ades, Esqs. (from 1970 to 2000) | | 16 | | None |
| | | | | |
Dwight B. Crane Harvard Business School Soldiers Field Morgan Hall #375 Boston, MA 02163 Birth Year: 1937 | | Director | | Since
1981 | | Professor, Harvard Business School | | 51 | | None |
| | | | | |
Frank G. Hubbard Avatar International, Inc. 87 Whittredge Road Summit, NJ 07901 Birth Year: 1937 | | Director | | Since
1993 | | President of Avatar International, Inc. (Business Development) (since 1998); Vice President of S&S Industries (Chemical Distribution) (from 1995 to 1998) | | 16 | | None |
| | | | | |
Jerome H. Miller c/o Smith Barney Mutual Funds New York, NY 10004 Birth Year: 1938 | | Director | | Since
1998 | | Retired | | 16 | | None |
| | | | | |
Ken Miller Young Stuff Apparel Group, Inc. 930 Fifth Avenue Suite 610 New York, NY 10021 Birth Year: 1942 | | Director | | Since
1994 | | President of Young Stuff Apparel Group, Inc. (since 1963) | | 16 | | None |
| | | |
Interested Director: | | | | | | |
| | | | | |
R. Jay Gerken, CFA** CAM 399 Park Avenue, 4th Floor New York, NY 10022 Birth Year: 1951 | | Chairman, President and Chief
Executive Officer | | Since
2002 | | Managing Director of Citigroup Global Markets Inc. (“CGM”); Chairman, President and Chief Executive Officer of Smith Barney Fund Management LLC (“SBFM”), Travelers Investment Adviser, Inc. (“TIA”) and Citi Fund Management Inc. (“CFM”); President and Chief Executive Officer of certain mutual funds associated with Citigroup Inc. (“Citigroup”); Formerly, Portfolio Manager of Smith Barney Allocation Series Inc. (from 1996 to 2001) and Smith Barney Growth and Income Fund (from 1996 to 2000) | | 220 | | None |
28 Smith Barney Hansberger Global Value Fund | 2005 Annual Report
Additional Information (unaudited) (continued)
| | | | | | | | | | |
| Name, Address and Birth Year | | Position(s) Held with Fund | | Term of Office*
and Length of Time Served | | Principal Occupation(s) During Past Five Years | | Number of
Portfolios in the
Fund Complex
Overseen by Director | | Other Board Memberships
Held by Director |
Officers: | | | | | | |
| | | | | |
Andrew B. Shoup CAM 125 Broad Street, 11th Floor New York, NY 10004 Birth Year: 1956 | | Senior Vice President and Chief Administrative Officer | | Since
2003 | | Director of CAM; Senior Vice President and Chief Administrative Officer of mutual funds associated with Citigroup; Head of International Funds Administration of CAM (from 2001 to 2003); Director of Global Funds Administration of CAM (from 2000 to 2001); Head of U.S. Citibank Funds Administration of CAM (from 1998 to 2000) | | N/A | | N/A |
| | | | | |
Kaprel Ozsolak CAM 125 Broad Street, 11th Floor New York, NY 10004 Birth Year: 1965 | | Chief Financial Officer and Treasurer | | Since
2004 | | Vice President of CGM; Chief Financial Officer and Treasurer of certain mutual funds associated with Citigroup; Controller of certain mutual Funds associated with Citigroup (from 2002 to 2004) | | N/A | | N/A |
| | | | | |
Andrew Beagley CAM 399 Park Avenue, 4th Floor New York, NY 10022 Birth Year: 1962 | | Chief Anti-Money Laundering Compliance Officer Chief Compliance Officer | | Since 2002 Since 2004 | | Director of CGM (since 2000); Director of Compliance, North America, CAM (since 2000); Chief Anti-Money Laundering Compliance Officer and Chief Compliance Officer of certain mutual funds associated with Citigroup; Director of Compliance, Europe, the Middle East and Africa, CAM (from 1999 to 2000); Chief Compliance Officer, SBFM, CFM and TIA | | N/A | | N/A |
| | | | | |
Robert I. Frenkel CAM 300 First Stamford Place 4th Floor Stamford, CT 06902 Birth Year: 1954 | | Secretary and Chief Legal Officer | | Since
2003 | | Managing Director and General Counsel of Global Mutual Funds for CAM and its predecessor (since 1994); Secretary and Chief Legal Officer of mutual funds associated with Citigroup | | N/A | | N/A |
| * | | Each Director and officer serves until his or her successor has been duly elected and qualified. |
| ** | | Mr. Gerken is an “interested person” of the Company as defined in the Investment Company Act of 1940, as amended, because Mr. Gerken is an officer of SBFM and certain of its affiliates. |
29 Smith Barney Hansberger Global Value Fund | 2005 Annual Report
| | |
| Important Tax Information (unaudited) | | |
The following information is provided with respect to the distributions paid during the taxable year ended April 30, 2005:
| | | |
|
|
Record Date: | | 12/8/2004 | |
Payable Date: | | 12/10/2004 | |
|
|
Qualified Dividend Income for Individuals | | 100.00 | % |
|
|
Dividends Qualifying for the Dividends Received Deduction for Corporations | | 72.09 | % |
|
|
Please retain this information for your records.
30 Smith Barney Hansberger Global Value Fund | 2005 Annual Report
SMITH BARNEY
HANSBERGER
GLOBAL VALUE FUND
| | |
DIRECTORS Paul R. Ades Dwight B. Crane R. Jay Gerken, CFA
Chairman Frank G. Hubbard Jerome H. Miller Ken Miller OFFICERS R. Jay Gerken, CFA President and Chief Executive Officer Andrew B. Shoup Senior Vice President and Chief Administrative Officer Kaprel Ozsolak Chief Financial Officer
and Treasurer Andrew Beagley Chief Anti-Money Laundering
Compliance Officer and
Chief Compliance Officer Robert I. Frenkel Secretary and Chief Legal Officer | | INVESTMENT MANAGER Smith Barney Fund Management LLC SUB-INVESTMENT ADVISER Hansberger Global Investors, Inc. DISTRIBUTOR Citigroup Global Markets Inc. CUSTODIAN State Street Bank and
Trust Company TRANSFER AGENT Citicorp Trust Bank, fsb. 125 Broad Street, 11th Floor New York, New York 10004 SUB-TRANSFER AGENT PFPC Inc. P.O. Box 9699 Providence, Rhode Island
02940-9699 |
Smith Barney Investment Funds Inc.
Smith Barney Hansberger Global Value Fund
The Fund is a separate investment fund of the Smith Barney Investment Funds Inc., a Maryland corporation.
The Fund files its complete schedule of portfolio holdings with the Securities and Exchange Commission for the first and third quarters of each fiscal year on Form N-Q. The Fund’s Forms N-Q are available on the Commission’s website at www.sec.gov. The Fund’ Forms N-Q may be reviewed and copied at the Commission’s Public Reference Room in Washington D.C., and information on the operation of the Public Reference Room may be obtained by calling 1-800-SEC-0330. To obtain information on Form N-Q from the Fund, shareholders can call 1-800-451-2010.
Information on how the Fund voted proxies relating to portfolio securities during the 12-month period ended June 30, 2004 and a description of the policies and procedures that the Fund uses to determine how to vote proxies relating to portfolio securities is available (1) without charge, upon request, by calling 1-800-451-2010, (2) on the Fund’s website at www.citigroupam.com and (3) on the SEC’s website at www.sec.gov.
This report is submitted for the general information of the shareholders of Smith Barney Investment Funds Inc. — Smith Barney Hansberger Global Value Fund, but it may also be used as sales literature when preceded or accompanied by the current Prospectus.
SMITH BARNEY HANSBERGER GLOBAL VALUE FUND
Smith Barney Mutual Funds
125 Broad Street
10th Floor, MF-2
New York, New York 10004
This report must be preceded or accompanied by a free prospectus. Investors should consider the Fund’s investment objectives, risks, charges and expenses carefully before investing. The prospectus contains this and other important information about the Fund. Please read the prospectus carefully before investing.
www.citigroupam.com
©2005 Citigroup Global Markets Inc.
Member NASD, SIPC
FD01490 6/05 05-8621
The registrant has adopted a code of ethics that applies to the registrant’s principal executive officer, principal financial officer, principal accounting officer or controller.
| ITEM 3. | AUDIT COMMITTEE FINANCIAL EXPERT. |
The Board of Directors of the registrant has determined that Dwight B. Crane, a member of the Board’s Audit Committee, possesses the technical attributes identified in Instruction 2(b) of Item 3 to Form N-CSR to qualify as an “audit committee financial expert,” and has designated Mr. Crane as the Audit Committee’s financial expert. Mr. Crane is an “independent” Director pursuant to paragraph (a)(2) of Item 3 to Form N-CSR.
| ITEM 4. | PRINCIPAL ACCOUNTANT FEES AND SERVICES. |
(a) Audit Fees. The aggregate fees billed in the last two fiscal years ending April 30, 2004 and April 30, 2005 (the “Reporting Periods”) for professional services rendered by the Registrant’s principal accountant (the “Auditor”) for the audit of the Registrant’s annual financial statements, or services that are normally provided by the Auditor in connection with the statutory and regulatory filings or engagements for the Reporting Periods, were $100,250 in 2004 and $183,250 in 2005.
(b) Audit-Related Fees. The aggregate fees billed in the Reporting Periods for assurance and related services by the Auditor that are reasonably related to the performance of the audit of the Registrant’s financial statements and are not reported under paragraph (a) of this Item 4 in connection with the review of the registration statement on Form N-1A and issuance of consent, were $0.00 in 2004 and $7,500 in 2005.
In addition, there were no Audit-Related Fees billed in the Reporting Period for assurance and related services by the Auditor to the Registrant’s investment adviser (not including any sub-adviser whose role is primarily portfolio management and is subcontracted with or overseen by another investment adviser), and any entity controlling, controlled by or under common control with the investment adviser that provides ongoing services to the Smith Barney Investment Funds (“service affiliates”), that were reasonably related to the performance of the annual audit of the service affiliates. Accordingly, there were no such fees that required pre-approval by the Audit Committee for the Reporting Periods (prior to May 6, 2003 services provided by the Auditor were not required to be pre-approved).
(c) Tax Fees. The aggregate fees billed in the Reporting Periods for professional services rendered by the Auditor for tax compliance, tax advice and tax planning (“Tax Services”) were $9,900 in 2004 and $29,700 in 2005. These services consisted of (i) review or preparation of U.S. federal, state, local and excise tax returns; (ii) U.S. federal, state and local tax planning, advice and assistance regarding statutory, regulatory or administrative developments, and (iii) tax advice regarding tax qualification matters and/or treatment of various financial instruments held or proposed to be acquired or held.
There were no fees billed for tax services by the Auditors to service affiliates during the Reporting Periods that required pre-approval by the Audit Committee.
(d) All Other Fees. There were no other fees billed in the Reporting Periods for products and services provided by the Auditor, other than the services reported in paragraphs (a) through (c) of this Item for the Smith Barney Investment Funds.
All Other Fees. There were no other non-audit services rendered by the Auditor to Smith Barney Fund Management LLC (“SBFM”), and any entity controlling, controlled by or under common control with SBFM that provided ongoing services to Smith Barney Investment Funds requiring pre-approval by the Audit Committee in the Reporting Period.
| | (e) | (1) Audit Committee’s pre–approval policies and procedures described in paragraph (c) (7) of Rule 2-01 of Regulation S-X. |
The Charter for the Audit Committee (the “Committee”) of the Board of each registered investment company (the “Fund”) advised by Smith Barney Fund Management LLC or Salomon Brothers Asset Management Inc. or one of their affiliates (each, an “Adviser”) requires that the Committee shall approve (a) all audit and permissible non-audit services to be provided to the Fund and (b) all permissible non-audit services to be provided by the Fund’s independent auditors to the Adviser and any Covered Service Providers if the engagement relates directly to the operations and financial reporting of the Fund. The Committee may implement policies and procedures by which such services are approved other than by the full Committee.
The Committee shall not approve non-audit services that the Committee believes may impair the independence of the auditors. As of the date of the approval of this Audit Committee Charter, permissible non-audit services include any professional services (including tax services), that are not prohibited services as described below, provided to the Fund by the independent auditors, other than those provided to the Fund in connection with an audit or a review of the financial statements of the Fund. Permissible non-audit services may not include: (i) bookkeeping or other services related to the accounting records or financial statements of the Fund; (ii) financial information systems design and implementation; (iii) appraisal or valuation services, fairness opinions or contribution-in-kind reports; (iv) actuarial services; (v) internal audit outsourcing services; (vi) management functions or human resources; (vii) broker or dealer, investment adviser or investment banking services; (viii) legal services and expert services unrelated to the audit; and (ix) any other service the Public Company Accounting Oversight Board determines, by regulation, is impermissible.
Pre-approval by the Committee of any permissible non-audit services is not required so long as: (i) the aggregate amount of all such permissible non-audit services provided to the Fund, the Adviser and any service providers controlling, controlled by or under common control with the Adviser that provide ongoing services to the Fund (“Covered Service Providers”) constitutes not more than 5% of the total amount of revenues paid to the independent auditors during the fiscal year in which the permissible non-audit services are provided to (a) the Fund, (b) the Adviser and (c) any entity controlling, controlled by or under common control with the Adviser that provides ongoing services to the Fund during the fiscal year in which the services are provided that would have to be approved by the Committee; (ii) the permissible non-audit services were not recognized by the Fund at the time of the engagement to be non-audit services; and (iii) such services are promptly brought to the attention of the Committee and approved by the Committee (or its delegate(s)) prior to the completion of the audit.
(2) For the Smith Barney Investment Funds Inc., the percentage of fees that were approved by the audit committee, with respect to: Audit-Related Fees were 100% and 100% for the years ended 4/30/05 and 4/30/04; Tax Fees were 100% and 100% for the years ended 4/30/05 and 4/30/04; and Other Fees were 100% and 100% for the years ended 4/30/05 and 4/30/04.
(f) N/A
(g) Non-audit fees billed by the Auditor for services rendered to Smith Barney Investment Funds and CAM and any entity controlling, controlled by, or under common control with CAM that provides ongoing services to Smith Barney Investment Funds during the reporting period were $75,000 in 2005 for fees related to the transfer agent matter as fully described in the notes the financial statements titled “additional information” and none for 2004.
(h) Yes. The Smith Barney Investment Funds Audit Committee has considered whether the provision of non-audit services that were rendered to Service Affiliates which were not pre-approved (not requiring pre-approval) is compatible with maintaining the Accountant’s independence. All services provided by the Auditor to the Smith Barney Investment Funds or to Service Affiliates, which were required to be pre-approved, were pre-approved as required.
| ITEM 5. | AUDIT COMMITTEE OF LISTED REGISTRANTS. |
Not applicable.
| ITEM 6. | SCHEDULE OF INVESTMENTS. |
Not applicable.
| ITEM 7. | DISCLOSURE OF PROXY VOTING POLICIES AND PROCEDURES FOR CLOSED-END MANAGEMENT INVESTMENT COMPANIES. |
Not applicable.
| ITEM 9. | PURCHASES OF EQUITY SECURITIES BY CLOSED-END MANAGEMENT INVESTMENT COMPANY AND AFFILIATED PURCHASERS. |
Not applicable.
| ITEM 10. | CONTROLS AND PROCEDURES. |
| | |
| (a) | | The registrant’s principal executive officer and principal financial officer have concluded that the registrant’s disclosure controls and procedures (as defined in Rule 30a- 3(c) under the Investment Company Act of 1940, as amended (the “1940 Act”)) are effective as of a date within 90 days of the filing date of this report that includes the disclosure required by this paragraph, based on their evaluation of the disclosure controls and procedures required by Rule 30a-3(b) under the 1940 Act and 15d-15(b) under the Securities Exchange Act of 1934. |
| |
| (b) | | There were no changes in the registrant’s internal control over financial reporting (as defined in Rule 30a-3(d) under the 1940 Act) that occurred during the registrant’s last fiscal half-year (the registrant’s second fiscal half-year in the case of an annual report) that have materially affected, or are likely to materially affect the registrant’s internal control over financial reporting. |
| | (a) | Code of Ethics attached hereto. |
Exhibit 99.CODE ETH
| | |
| Exhibit 99.CERT | | Certifications pursuant to section 302 of the Sarbanes-Oxley Act of 2002 |
| |
| Exhibit 99.906CERT | | Certifications pursuant to Section 906 of the Sarbanes-Oxley Act of 2002 |
SIGNATURES
Pursuant to the requirements of the Securities Exchange Act of 1934 and the Investment Company Act of 1940, the registrant has duly caused this Report to be signed on its behalf by the undersigned, there unto duly authorized.
| | |
| Smith Barney Investment Funds Inc. |
| |
| By: | | /s/ R. Jay Gerken
|
| | | (R. Jay Gerken) Chief Executive Officer of Smith Barney Investment Funds Inc. |
Date: July 7, 2005
Pursuant to the requirements of the Securities Exchange Act of 1934 and the Investment Company Act of 1940, this report has been signed below by the following persons on behalf of the registrant and in the capacities and on the dates indicated.
| | |
| By: | | /s/ R. Jay Gerken
|
| | | (R. Jay Gerken) |
| | | Chief Executive Officer of |
| | | Smith Barney Investment Funds Inc. |
|
| Date: July 7, 2005 |
| |
| By: | | /s/ Kaprel Ozsolak
|
| | | (Kaprel Ozsolak) |
| | | Chief Financial Officer of |
| | | Smith Barney Investment Funds Inc. |
|
| Date: July 7, 2005 |