UNITED STATES
SECURITIES AND EXCHANGE COMMISSION
Washington, D.C. 20549
FORM N-CSR
CERTIFIED SHAREHOLDER REPORT OF REGISTERED MANAGEMENT
INVESTMENT COMPANIES
Investment Company Act file number 811-03287
New Alternatives Fund, Inc.
(Exact name of registrant as specified in charter)
150 Broadhollow Road, Suite PH2
Melville, New York 11747
(Address of principal executive offices) (Zip code)
David J. Schoenwald, President
New Alternatives Fund, Inc.
150 Broadhollow Road, Suite PH2
Melville, New York 11747
(Name and address of agent for service)
Registrant’s telephone number, including area code: 631-423-7373
Date of fiscal year end: December 31
Date of reporting period: December 31, 2011
Form N-CSR is to be used by management investment companies to file reports with the Commission not later than 10 days after the transmission to stockholders of any report that is required to be transmitted to stockholders under Rule 30e-1 under the Investment Company Act of 1940 (17 CFR 270.30e-1). The Commission may use the information provided on Form N-CSR in its regulatory, disclosure review, inspection, and policymaking roles.
A registrant is required to disclose the information specified by Form N-CSR, and the Commission will make this information public. A registrant is not required to respond to the collection of information contained in Form N-CSR unless the Form displays a currently valid Office of Management and Budget (“OMB”) control number. Please direct comments concerning the accuracy of the information collection burden estimate and any suggestions for reducing the burden to Secretary, Securities and Exchange Commission, 100 F Street, NE, Washington, DC 20549. The OMB has reviewed this collection of information under the clearance requirements of 44 U.S.C. § 3507.
Item 1. Reports to Stockholders.
The Report to Shareholders is attached herewith.
| | | |
|
| | New Alternatives Fund, Inc. A SOCIALLY RESPONSIBLE MUTUAL FUND EMPHASIZING ALTERNATIVE ENERGY AND THE ENVIRONMENT |
ANNUAL
FINANCIAL REPORT
DECEMBER 31, 2011
This report is submitted for the general information of the shareholders of the Fund. It is not authorized for distribution unless preceded or accompanied by a prospectus for the Fund.
| | | | | | | | | |
| THE FUND | | 150 Broadhollow Road | | Melville, New York 11747 | | (800) 423-8383 | | (631) 423-7373 |
| BNY Mellon Investment Servicing (US) Inc. | | PO Box 9794 | | Providence, RI 02940 | | (800) 441-6580 | | (610) 382-7819 |
| Overnight Address | | 4400 Computer Drive | | Westborough, MA 01581 | | | | |
| BNY Mellon Distributors LLC | | 760 Moore Road | | King of Prussia, PA 19406 | | | | |
Recycled Paper
NEW ALTERNATIVES FUND, INC.
MANAGEMENT’S DISCUSSION OF FINANCIAL PERFORMANCE
FOR THE YEAR 2011
Fund Performance: The Fund declined 7.28% for the year ended December 31, 2011. The Net Asset Value per share (“NAV”) started at $39.09 on January 1, 2011 and decreased to $35.82 by year end. Shares outstanding decreased 14% from 6,055,618 to 5,208,518. The Fund’s net assets declined from $236.7 million at the beginning of the year to approximately $186.6 million by year end.
Factors Affecting the Fund: The renewable energy sector continued to be the poorest performing sector in the Fund in 2011. Our energy conservation companies also experienced significant drops in their share prices. The hardest hit firms were the manufacturers of wind turbines, solar photovoltaic (PV) and solar thermal (CSP) equipment, geothermal systems, batteries, energy efficiency systems and scrap metal recycling.
The nuclear disaster at the Fukushima reactors following the March tsunami in Japan created an immediate rise in shares of renewable energy companies worldwide. The “bounce” proved to be short-lived. The sluggish economic recovery in the U.S. and the continuing recession in Europe have led to the adoption of widespread austerity policies both in this country and abroad. These measures have greatly diminished support for the renewable energy sector.
Natural gas prices in the U.S. declined, as production of shale gas increased, reducing the cost of producing electricity with gas turbines in the U.S., and thus the competiveness of renewable energy producers in the U.S. Mirroring the gas market, electricity prices have dropped more than 50% on average since 2008, according to a January 2012 report from Bloomberg New Energy Finance.
While a surplus of natural gas reduced the price of natural gas in the U.S., there was strong demand and a stronger pricing environment for natural gas overseas, particularly in Japan. There was criticism of increasing U.S. shale gas production on environmental grounds by some, but celebration by others of increased jobs in states where the gas is produced. It is not clear whether production of natural gas in the U.S. is sustainable, as the commodity price is less than the cost of production according to some analysts.
As the year progressed, the Euro weakened versus the U.S. dollar. A significant portion of the Fund’s portfolio (approximately 34%) is denominated in the Euro. As the Fund prefers to maintain its European holdings (which most closely represent the Fund’s interest in renewable energy, the environment and social responsibility), the relative valuation of the Euro and the U.S. dollar influences our performance.
European companies have been leaders in the renewable energy sector, but the profitability of the manufacturing companies (wind, solar) is pressured by competition, both by larger conglomerates such as General Electric and Siemens, Chinese companies which appear to have sufficiently competitive offerings and prices, while the markets in the U.S. and Europe have been less than robust.
1
The share prices of our European holdings companies have suffered, despite the fact that many (but not all) of them have reported increased earnings and a substantial portion of their new projects, assets and workforce are located outside of Europe.
In the U.S. and Europe, the growth of the alternative energy project development is hampered by diminished government policy support, continuing tight credit for new projects, and in the U.S., low natural gas prices.
There is concern that a failure of the U.S. to renew the production tax credit for wind developers in the U.S. which expires at the end of 2012 will reduce U.S. demand. This is most threatening to dedicated (pure play) European wind turbine manufacturers which have invested in building infrastructure geared for growth of the wind power in the U.S.
Over the course of the last two years, we have given more consideration to companies that pay dividends. Many of the Fund’s holdings have seen their share prices decline precipitously since the recession hit in 2008. We are not likely to realize a net capital gain again until the alternative energy sector fully recovers. With this in mind, we have tried to improve the Fund’s returns by adding a greater percentage of dividend-paying companies to our portfolio.
Portfolio Holdings and Changes: Consolidation in renewable energy producers led to the most significant changes in the Fund’s portfolio. Two of our larger holdings, Iberdrola Renovables SA (Spain) and EDF Energies Nouvelles SA (France), were taken over by their respective parent companies. Because the larger firms, Iberdrola SA and Electricitie de France have extensive coal, nuclear and oil facilities, we chose to completely sell our positions.
One of our other core holdings, Abengoa SA (Spain), a bio-fuel, solar and recycling developer, bought out Befesa Medio Ambiente SA (Spain), a smaller recycling, waste and water treatment company. Telvent GIT SA (Spain), an energy efficiency and smart grid company was taken over by Schneider Electric SA (France).
We sold our shares of Solar Millennium AG (Germany) when a filing indicated the company’s financial health was worse than we expected. The company went bankrupt shortly afterwards. Its failure was particularly disappointing as it had been awarded federal funding for a huge solar thermal facility in California.
Early in the year, we sold our shares of thin film solar cell producer and project developer First Solar, Inc., after they lost over 50% of their value. We recently bought back a small amount of shares when the price reached a new low and the company showed signs of renewed activity after trimming its costs.
We also sold our holdings of solar cell manufacturers and project developers SolarWorld AG (Germany), and SunPower Corp., “smart” meter producer Itron, Inc., Power-One, Inc., a producer of power management systems and equipment; and electronics firm Panasonic Corp. (Japan) which manufactures PV systems and batteries.
New Investments During 2011 Included:
Xylem, Inc. is a manufacturer of water systems and waste water equipment which was spun out of ITT Corp. during 2011.
2
WGL Holdings, Inc. is a natural gas and electric distribution company in the Washington, D.C. metro area. It also has a division that promotes energy efficient buildings and community based solar and wind power systems.
FuelCell Energy, Inc. is a manufacturer of stationery molten carbonate fuel cells for commercial and industrial use. FuelCell was a prior holding and we bought it again as it appears to be increasing sales and getting closer to profitability.
Veolia Environnement SA (France) is a large water utility with smaller divisions in the areas of recycling, waste water treatment, combined heat and power systems, energy efficiency and transportation. The company plans to divest its transportation division as well as some of its waste business. The combined heat and power business has its origin in a former fund holding called Trigen Energy.
At year end, approximately 48% of the Fund’s net assets were invested in foreign companies and approximately 4.6% of net assets were held in cash and cash equivalents
Alternate Energy:
Renewable Power Producers: The Fund’s remaining larger holdings in this sector are EDP Renovaveis SA (Spain/Portugal), Acciona SA (Spain), Abengoa SA (Spain), Ormat Technologies, Inc., Elecnor SA (Spain), and Hafslund ASA (Norway), a developer and operator of hydro electric and distributed generation systems. Other than Hafslund, each of these companies has expanded its geographic areas of operation during the last few years. Each company has its own area of expertise: Acciona in wind, solar thermal and clean water projects; Abengoa in biofuels, solar thermal and clean water projects; Elecnor in electric distribution and solar thermal systems.
Our smaller investments in this sector continue to include wind and hydro power generation companies TrustPower Ltd. (New Zealand) and Algonquin Power & Utilities Corp. (Canada). Each provides a generous dividend.
We reduced our holdings in Abengoa and Acciona. We bought a small number of additional shares of Hafslund and held steady on the rest of our investments in this sector.
Wind: The share performance of our wind turbine manufacturers, Vestas Wind Systems (Denmark) and Gamesa Corporacion Tecnologica (Spain), has been dismal. Both companies have a large presence in the U.S., Europe, Asia and South America. They have both made substantial investments in technology and manufacturing capacity in the U.S, India and China, along with their existing facilities in Europe, in response to the robust growth of alternative energy development before 2008. The economic turmoil of the past three years has brought demand growth to a near standstill, leaving these manufacturers with idle factories and falling prices for their turbines and components. They now also face fierce competition from state-subsidized Chinese companies and large conglomerates such as General Electric and Siemens.
Despite these challenges, we feel both companies remain among the best in their area and we took advantage of their “bargain basement” prices to add shares of each.
3
Solar: The price of solar cells and the raw material used, solar grade silicon, continued to decline, along with demand for new developments. Many people believe that a number of firms, particularly those in China, were selling solar cells and silicon at below the cost of production. Austerity measures in Europe lead to declining subsidies and excess production capacity. A number of manufacturers went out of business or were bought up by larger companies.
Among our holdings, Kyocera Corp. (Japan), a large diversified electronics company that also produces solar cells, held up better than the less diversified solar companies.
SMA Solar Technology AG (Germany), the largest manufacturer of inverters used in solar installations, suffered from a major decline in its profit margins and a rapid reduction in demand.
Development of solar thermal (CSP) projects slowed due to the competition from the extraordinary decline in the cost of solar PV modules. Before its bankruptcy, Solar Millennium was attempting to switch its major CSP project, the 500 megawatt (MW) Blythe, California installation to a PV system. However, CSP facilities have the advantage of being able to incorporate energy storage in their operations. Because of this critical factor, several large solar thermal projects, including Abengoa’s 250 MW Solana project in Arizona, are continuing to be developed.
The Fund made small additional purchases of Kyocera and First Solar and maintain our existing shares of SMA Solar.
Geothermal: Our companies in this sector continue to be Ormat Technologies, Inc. and WFI Industries Ltd. (Canada; also known as WaterFurnace Renewable Energy).
Ormat is the world’s major geothermal developer and operator. They are building new plants in Nevada, California, New Zealand and Asia. The company’s share price slumped in 2011 when they reported reduced earnings in the electric power division. This was mostly due to operational difficulties at their North Brawley plant in California which resulted in a lower than anticipated power output. The problem is now resolved and they expect to meet generation goals going forward. Ormat is also expanding into PV solar with the construction and operation of a 10 MW plant, also in California, expected to be on line by the end of 2013. Unfortunately, the contracted rate that Ormat receives for its power production in California is tied to the price of natural gas. If natural gas prices remain low, Ormat’s earnings may be significantly reduced in 2012.
WFI Industries Ltd. (“WFI”) continues to build its core business of residential and small commercial building heat pump/heat exchange systems.
We added to our holdings of both Ormat and WFI.
Bio-Fuel: We continue to be cautious and skeptical about the potential of ethanol and other bio-fuels to significantly replace oil and gas for transportation. Among our current holdings, Abengoa, in addition to its other power projects, is also engaged in developing bio-fuel production facilities in Europe, the U.S. and Brazil. They recently announced a joint venture with another Fund company, FuelCell Energy, to develop fuel cell power plants using liquid bio-fuels in Europe and Latin America. The first pilot plant will be built at Abengoa’s headquarters in Spain.
4
Energy Conservation/Efficiency/Power Transmission: The Fund now holds four companies, comprising approximately 18.7% of our net assets, which manufacture energy conservation materials or develop energy efficiency systems. These holdings include Schneider Electric SA, a large, diversified engineering and manufacturing firm; Johnson Controls, Inc., a developer of building energy management systems and batteries for hybrid cars; Owens Corning, Inc., producer of insulation materials; Koninklijke Philips Electronics NV (Netherlands), a major manufacturer of energy efficient light bulbs and lighting systems. We added to our holdings of Schneider Electric, Koninklijke Philips Electronics and Johnson Controls and maintained our shares of Owens Corning.
Analysts continued to predict that the energy conservation/efficiency sector would lead the recovery in alternative energy businesses because it represented the quickest way to reduce overall energy use and costs, and provide immediate reductions in greenhouse gas emissions. Indeed, some of these companies saw our greatest increases in share prices in 2010. But in 2011 the economic recovery stalled in the U.S. Funding for new construction and energy saving measures for existing buildings disappeared. Legislation to provide new efficiency standards and regulations was held hostage by politics. European governments responded to the sovereign debt crisis by instituting austerity measures, including cuts to the feed-in tariffs and subsidies that had created a robust renewable energy industry during the past fifteen years. Consequently, these companies posted lower earnings and their share prices fell drastically.
There were a few bright spots in our portfolio including ITC Holdings Corp., an independent electric transmission system installer and power grid manager. ITC’s share price rose approximately 22% and it also pays a dividend. The company expanded its operating territory through acquisitions during 2011. Unfortunately we sold a small portion of our holdings to meet Fund redemptions.
A.O. Smith Corp., a leading manufacturer of electric motors, water pumps and water heaters, including a line of new, high efficiency solar thermal hot water systems, also rose modestly during the past year. The company, which pays a small dividend, experienced solid growth in China and India. We were able to slightly increase our holdings.
Natural Gas Distribution: We continued to hold natural gas distribution companies. These firms operate mostly as regulated utilities and provide the Fund with regular income and stability. They not only pay a current dividend in excess of any U.S. Treasury security, but we believe their high level of liquidity makes them a secure haven for potential cash reserves. During the course of 2011, we trimmed our shares of our three longer term holdings: Atmos Energy Corp., Northwest Natural Gas Co., and South Jersey Industries, Inc. As we noted above, we also added shares of WGL Holdings, Inc., for diversification.
5
Water/Recycling: Our water utilities held up well in 2011. Toward the end of the year, we added Veolia Environnement SA to our long standing positions in American Water Works Co., Inc., Aqua America, Inc. and CIA SaneamentoBasico (Brazil). These companies also pay better than average dividends and generally maintain a stable share price. In addition to the income and stability they bring to the Fund, we believe they also provide a secure location for the cash. Aside from the addition of Veolia, we sold shares of American Water Works, Aqua America and CIA SaneamentoBasico for portfolio balance.
Xylem, Inc. joined our waste and water treatment companies after it was spun off of corporate conglomerate ITT in November 2011. Our other holdings include Hyflux, Ltd. (Singapore), Abengoa and A.O. Smith Corp. Hyflux experienced lower earnings this past year due to the loss of contracts in the North African countries of Tunisia, Algeria and Libya during their political turmoil in the spring. It has been moving aggressively to build and open new facilities in China and Southeast Asia which should bring its income back up in 2012. In addition to our new holdings in Xylem, we also increased our shares of Hyflux.
Our investment in recycling company Sims Metal Management Ltd. (Australia) remained unchanged.
Natural Food: We have still not identified a natural foods related company we want to add to the portfolio since we sold our shares of Whole Foods Markets back in 2009.
Cash and Treasury Holdings: We ended the year with approximately 4.6% of net assets in cash and cash equivalents.
We owned no short-term U.S. Treasury Bills, as explained above, because the interest rates were nominal.
Income from Dividends and Interest: The Fund’s net income from dividends actually decreased by approximately 13% in 2011. However, our dividend payment to shareholders increased from $0.36 per share in 2010 to $0.42 this year.
Expenses: The Fund’s cost of operations declined during 2011 as the number of shareholder accounts and net assets decreased gradually during the year. The amounts paid to the investment advisor, Accrued Equities, Inc. (the “Advisor”), BNY Mellon Investment Servicing (U.S.) Inc. (the Fund’s accounting agent, and administrator), and The Bank of New York Mellon (the Fund’s custodian) are largely based on net assets. BNY Mellon, in its role also as transfer agent, bases its fee on the number of shareholder accounts maintained during the year. This figure decreased slightly and was allocated across fewer outstanding shares which lowered the Fund’s expense ratio from 1.04% in 2010 to 1.03% in 2011. Total Fund Expense decreased by $297,543 or 11.44%.
Realized and Unrealized Capital Gain/Loss: The Fund did not have or distribute any net realized capital gains during 2011. The Fund has a capital loss carryforward available which can be used to offset future capital gains. The Fund ended the year with accumulated net unrealized losses of approximately $28 million.
6
Corporate Governance and Regulatory: All eight of the Fund’s directors (five of whom are considered “Independent”) were re-elected by shareholders at the annual meeting held on September 23, 2011. David Schoenwald will continue as President, Treasurer and Chairperson of the Board, Sharon Reier as Vice-Chairperson, Maurice Schoenwald as Vice-President and Secretary, and Murray Rosenblith as Assistant Secretary. Joseph Don Angelo continues to serve as the Fund’s Chief Compliance Officer. Preston Pumphrey continues to serve as Chairperson of the Audit Committee.
The Fund’s directors re-approved the investment advisory agreement (the “Advisory Agreement”) with the Advisor, Accrued Equities, Inc., at the directors meeting on June 24, 2011.
The Board of Directors decided to approve the renewal of the Advisory Agreement for a one-year period commencing July 1, 2011 based upon their evaluation of: (i) the long-term relationship between the Advisor and the Fund; (ii) the Advisor’s commitment to the Fund’s socially responsible investment objectives and its ability to manage the Fund’s portfolio in a manner consistent with those objectives; (iii) the depth of experience and expertise of the Advisor with regard to the alternative energy market; (iv) the nature, extent and quality of the services provided; (v) the performance of the Fund; and (vi) the costs of the services provided and the profitability of the Advisor from its relationship with the Fund. Information regarding the material factors the Board considered in approving the Advisory Agreement is included in the Semi-Annual Report to Shareholders dated June 30, 2011.
Beginning in 2012, all mutual funds are required to provide shareholders with cost basis information on their accounts. Shareholders have received a notice giving them the option to choose among several cost basis reporting options. This new rule applies to Fund shares purchased in or after 2012. Shareholders will receive information about the cost basis of their shares starting with the 1099 forms for 2012.
The Fund launched an on-line account access portal on our web site in the first half of 2011. Initially shareholders could register their accounts and access share balance and transaction information only. Beginning in September 2011, shareholders could choose an “e-delivery” option for their account statements and Fund documents. If you haven’t already done so, you can go to the Fund’s web site at www.newalternativesfund.com and click on the “Account Login” link to create your on-line access and select your document delivery options.
Strategy: The Fund’s investment objective remains unchanged. We continue to seek long-term capital appreciation.The Fund seeks to achieve its investment objective by investing in equity securities, such as common stocks. The Fund makes investments in a wide range of industries and in companies of all sizes. The Fund invests in equity securities of both U.S. and foreign companies, and has no limitation on the percentage of assets invested in the U.S. or abroad. The Fund concentrates at least 25% of its total assets in equity securities of companies which have an interest in alternative energy.
“Alternative Energy” means the production and conservation of energy in a manner that reduces pollution and harm to the environment, particularly when compared to conventional coal, oil or nuclear energy.
7
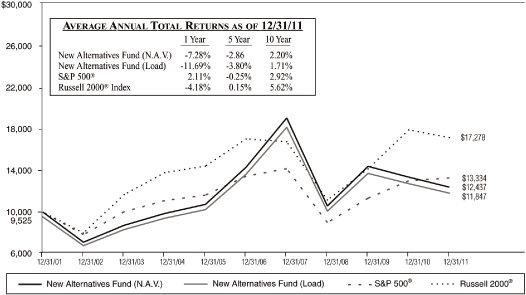
New Alternatives Fund Growth of $10,000 vs. The S&P 500® Index and The Russell 2000® Index
(Unaudited)
Performance quoted represents past performance and does not guarantee future results. Investment return and principal value will fluctuate so that shares, when redeemed, may be worth more or less than their original cost. Current performance may be lower or higher than that shown here. The performance quoted reflects a deduction for the maximum front-end sales charge of 4.75%. Returns include the reinvestment of distributions. Performance data current to the most recent month-end may be obtained by calling 800-423-8383. The graph and table do not reflect the deduction of taxes that a Shareholder would pay on fund distributions or the redemption of fund shares.
The Fund’s total annual operating expenses, as stated in the current prospectus are 1.04%*. The S&P 500® and the Russell 2000® indices are unmanaged stock market indices and do not reflect any asset-based charges for investment management or transaction expenses. You cannot invest directly in these indices. Current and future portfolio holdings are subject to change and risk.
| | |
| * | | Per prospectus. The expense ratio presented above may vary from the expense ratio presented in other sections of this report which is based on expenses incurred during the period covered by this report. |
8
NEW ALTERNATIVES FUND, INC.
FUND EXPENSE EXAMPLE
(Unaudited)
As a shareholder of the Fund, you incur two types of costs: (1) transaction costs such as the sales charge; and (2) ongoing costs, including management fees and other Fund expenses. This example is intended to help you understand your ongoing costs (in dollars) of investing in the Fund and to compare these costs with the ongoing costs of investing in other mutual funds.
The example is based on an investment of $1,000 invested at the beginning of the period shown (July 1, 2011) and held for the entire six months ended December 31, 2011.
Actual Expenses
The first line of the table below provides information about actual account values and actual expenses. You may use the information in this line, together with the amount you invested, to estimate the expense that you paid over the period. Simply divide your account value by $1,000 (for example, an $8,600 account value divided by $1,000 = 8.6), then multiply the result by the number in the first line under the heading entitled “Expenses Paid During Six Months Ended December 31, 2011” to estimate the expenses you paid on your account during this period.
Note: The Fund’s Transfer Agent, BNY Mellon Investment Servicing (US) Inc., charges an annual IRA maintenance fee of $15 for IRA accounts. That fee is not reflected in the accompanying table.
Hypothetical Example for Comparison Purposes
The second line of the table below provides information about hypothetical account values and hypothetical expenses based on the Fund’s actual expense ratio and an assumed rate of return of 5% per year before expenses, which is not the Fund’s actual return. The hypothetical account values and expenses may not be used to estimate the actual ending account balance or expenses you paid for the period. You may use this information to compare the ongoing costs of investing in the Fund and other funds. To do so, compare this 5% hypothetical example with the 5% hypothetical examples that appear in the shareholder reports of other funds.
Please note that the expenses shown in the table are meant to highlight your ongoing costs only and do not reflect any transactional costs such as the sales charge, redemption fees or exchange fees. The Fund does not charge any redemption fees or exchange fees, but these may be present in other funds to which you compare the Fund. Therefore, the second line of the table is useful in comparing ongoing costs only, and will not help you determine the relative total costs of owning different funds. In addition, if transactional costs were included, your costs would have been higher.
NEW ALTERNATIVES FUND, INC.
| | | | | | | | | | | | | |
| | | Beginning | | | Ending | | | Expenses Paid During | |
| | | Account Value | | | Account Value | | | Six Months Ended | |
| | | July 1, 2011 | | | December 31, 2011 | | | December 31, 2011* | |
| Actual | | $ | 1,000.00 | | | $ | 843.67 | | | $ | 4.88 | |
| Hypothetical | | | | | | | | | | | | |
| (assumes 5% return before expenses) | | $ | 1,000.00 | | | $ | 1,019.91 | | | $ | 5.35 | |
| | |
| * | | Expenses are equal to the Fund’s annualized expense ratio for the six-month period of 1.05%, multiplied by the average account value over the period, multiplied by the number of days (184) in the most recent fiscal half year, then divided by the days in the year (365) to reflect the half year period. The Fund’s ending account value on the first line in the table is based on its actual total return of (15.63)% for the six-month period of July 1, 2011 to December 31, 2011. |
9
NEW ALTERNATIVES FUND, INC.
PORTFOLIO HOLDINGS SUMMARY
December 31, 2011
(Unaudited)
| | | | | | | | | |
| | | % of Net | | | | |
| Sector Diversification | | Assets | | | Value | |
| Alternate Energy: | | | | | | | | |
| Renewable Energy Power Producers & Developers | | | 21.9 | % | | $ | 40,775,187 | |
| Wind Turbines | | | 6.2 | | | | 11,629,394 | |
| Geothermal | | | 5.5 | | | | 10,237,250 | |
| Solar Photovoltaic | | | 2.1 | | | | 3,959,754 | |
| Fuel Cells | | | 0.0 | | | | 87,200 | |
| Natural Gas Distribution | | | 19.1 | | | | 35,665,500 | |
| Energy Conservation | | | 18.7 | | | | 34,810,745 | |
| Water: | | | | | | | | |
| Water Utilities | | | 15.9 | | | | 29,699,750 | |
| Water Related | | | 2.3 | | | | 4,219,531 | |
| Electric Transmission | | | 3.0 | | | | 5,691,000 | |
| Recycling | | | 0.7 | | | | 1,285,000 | |
| Certificates of Deposit | | | 0.3 | | | | 500,000 | |
| Other Assets in Excess of Liabilities | | | 4.3 | | | | 7,993,723 | |
| | | | | | | |
| | | | 100.0 | % | | $ | 186,554,034 | |
| | | | | | | |
Top Ten Common Stock Portfolio Holdings
December 31, 2011
(Unaudited)
| | | | | |
| | | % of Net | |
| Name | | Assets | |
| EDP Renovaveis SA (Spain/Portugal) | | | 6.6 | % |
| American Water Works Co., Inc. | | | 6.0 | |
| Acciona SA (Spain) | | | 5.8 | |
| Koninklijke Philips Electronics NV (Netherlands) | | | 5.6 | |
| Atmos Energy Corp. | | | 5.4 | |
| WGL Holdings, Inc | | | 5.3 | |
| Abengoa SA (Spain) | | | 5.1 | |
| Johnson Controls, Inc. | | | 5.0 | |
| Schneider Electric SA (France) | | | 4.9 | |
| Ormat Technologies, Inc. | | | 4.8 | |
| | | | |
| Total Top Ten | | | 54.5 | % |
| | | | |
10
NEW ALTERNATIVES FUND, INC.
SCHEDULE OF INVESTMENTS
December 31, 2011
| | | | | | | | | |
| | | Shares | | | Value | |
COMMON STOCKS — 95.4% | | | | | | | | |
Alternate Energy — 35.7% | | | | | | | | |
Renewable Energy Power Producers & Developers — 21.9% | | | | | | | | |
| Abengoa SA (Spain) | | | 450,000 | | | $ | 9,551,543 | |
| Acciona SA (Spain) | | | 125,000 | | | | 10,795,638 | |
| Algonquin Power & Utilities Corp. (Canada) | | | 100,000 | | | | 630,184 | |
| EDP Renovaveis SA (Spain/Portugal)* | | | 2,000,000 | | | | 12,238,400 | |
| Elecnor SA (Spain) | | | 125,000 | | | | 1,614,573 | |
| Hafslund ASA, Class A (Norway) | | | 328,074 | | | | 3,181,536 | |
| TrustPower Ltd. (New Zealand) | | | 500,000 | | | | 2,763,313 | |
| | | | | | | | |
| | | | | | | | 40,775,187 | |
| | | | | | | | |
| | | | | | | | | |
Wind Turbines — 6.2% | | | | | | | | |
| Gamesa Corporacion Tecnologica SA (Spain) | | | 1,500,000 | | | | 6,231,800 | |
| Vestas Wind Systems AS (Denmark)* | | | 500,000 | | | | 5,397,594 | |
| | | | | | | | |
| | | | | | | | 11,629,394 | |
| | | | | | | | |
| | | | | | | | | |
Geothermal — 5.5% | | | | | | | | |
| Ormat Technologies, Inc. | | | 500,000 | | | | 9,015,000 | |
| WFI Industries Ltd. (Canada) | | | 80,000 | | | | 1,222,250 | |
| | | | | | | | |
| | | | | | | | 10,237,250 | |
| | | | | | | | |
| | | | | | | | | |
Solar Photovoltaic — 2.1% | | | | | | | | |
| First Solar, Inc.* | | | 5,000 | | | | 168,800 | |
| Kyocera Corp. (Japan) SP ADR | | | 30,000 | | | | 2,394,300 | |
| SMA Solar Technology AG (Germany) | | | 25,000 | | | | 1,396,654 | |
| | | | | | | | |
| | | | | | | | 3,959,754 | |
| | | | | | | | |
| | | | | | | | | |
Fuel Cells — 0.0% | | | | | | | | |
| FuelCell Energy, Inc.* | | | 100,000 | | | | 87,200 | |
| | | | | | | | |
Total Alternate Energy | | | | | | | 66,688,785 | |
| | | | | | | | |
The accompanying notes are an integral part of these financial statements.
11
NEW ALTERNATIVES FUND, INC.
SCHEDULE OF INVESTMENTS (Continued)
December 31, 2011
| | | | | | | | | |
| | | Shares | | | Value | |
Natural Gas Distribution — 19.1% | | | | | | | | |
| Atmos Energy Corp. | | | 300,000 | | | $ | 10,005,000 | |
| Northwest Natural Gas Co. | | | 150,000 | | | | 7,189,500 | |
| South Jersey Industries, Inc. | | | 150,000 | | | | 8,521,500 | |
| WGL Holdings, Inc. | | | 225,000 | | | | 9,949,500 | |
| | | | | | | | |
| | | | | | | | 35,665,500 | |
| | | | | | | | |
| | | | | | | | | |
Energy Conservation — 18.7% | | | | | | | | |
| Johnson Controls, Inc. | | | 300,000 | | | | 9,378,000 | |
| Koninklijke Philips Electronics NV (Netherlands) | | | 500,000 | | | | 10,475,000 | |
| Owens Corning, Inc.* | | | 200,000 | | | | 5,744,000 | |
| Schneider Electric SA (France) | | | 175,000 | | | | 9,213,745 | |
| | | | | | | | |
| | | | | | | | 34,810,745 | |
| | | | | | | | |
| | | | | | | | | |
Water — 18.2% | | | | | | | | |
Water Utilities — 15.9% | | | | | | | | |
| American Water Works Co., Inc. | | | 350,000 | | | | 11,151,000 | |
| Aqua America, Inc. | | | 400,000 | | | | 8,820,000 | |
| CIA SaneamentoBasico (Brazil) ADR | | | 150,000 | | | | 8,347,500 | |
| Veolia Environnement SA (France) ADR | | | 125,000 | | | | 1,381,250 | |
| | | | | | | | |
| | | | | | | | 29,699,750 | |
| | | | | | | | |
| | | | | | | | | |
Water Related — 2.3% | | | | | | | | |
| A. O. Smith Corp. | | | 50,000 | | | | 2,006,000 | |
| Hyflux Ltd. (Singapore) | | | 1,000,000 | | | | 929,031 | |
| Xylem, Inc. | | | 50,000 | | | | 1,284,500 | |
| | | | | | | | |
| | | | | | | | 4,219,531 | |
| | | | | | | | |
Total Water | | | | | | | 33,919,281 | |
| | | | | | | | |
| | | | | | | | | |
Electric Transmission — 3.0% | | | | | | | | |
| ITC Holdings Corp. | | | 75,000 | | | | 5,691,000 | |
| | | | | | | | |
| | | | | | | | | |
Recycling — 0.7% | | | | | | | | |
| Sims Metal Management Ltd. (Australia) SP ADR | | | 100,000 | | | | 1,285,000 | |
| | | | | | | | |
Total Common Stocks (Cost $206,472,565) | | | | | | | 178,060,311 | |
| | | | | | | | |
The accompanying notes are an integral part of these financial statements.
12
NEW ALTERNATIVES FUND, INC.
SCHEDULE OF INVESTMENTS (Concluded)
December 31, 2011
| | | | | | | | | |
| | | Par | | | Value | |
CERTIFICATES OF DEPOSIT — 0.3% | | | | | | | | |
Socially Concerned Banks — 0.3% | | | | | | | | |
| Alternatives Federal Credit Union 0.15% due 01/31/12 | | $ | 100,000 | | | $ | 100,000 | |
| Carver Federal Savings Bank 0.60% due 12/22/12 | | | 100,000 | | | | 100,000 | |
| Urban Partnership Bank 0.10% due 01/11/12 | | | 100,000 | | | | 100,000 | |
| People’s United Bank 0.75% due 12/02/12 | | | 100,000 | | | | 100,000 | |
| Self-Help Credit Union 0.75% due 3/30/12 | | | 100,000 | | | | 100,000 | |
| | | | | | | | |
| | | | | | | | | |
Total Certificates of Deposit (Cost $500,000) | | | | | | | 500,000 | |
| | | | | | | | |
TOTAL INVESTMENTS (Cost $206,972,565) — 95.7% | | | | | | | 178,560,311 | |
| Other Assets in Excess of Liabilities — 4.3% | | | | | | | 7,993,723 | |
| | | | | | | | |
| | | | | | | | | |
Net Assets — 100.0% | | | | | | $ | 186,554,034 | |
| | | | | | | | |
| | |
| * | | Non-income producing security |
ADR -American Depositary Receipts
SP ADR -Sponsored American Depositary Receipts
The accompanying notes are an integral part of these financial statements.
13
NEW ALTERNATIVES FUND, INC.
STATEMENT OF ASSETS AND LIABILITIES
December 31, 2011
| | | | | |
|
ASSETS |
| Investment securities at fair value (cost: $206,972,565) (Notes 2A and 7) | | $ | 178,560,311 | |
| Cash | | | 8,249,452 | |
| | | | | | | | | |
| Receivables: | | | | |
| Investments sold | | | 837,264 | |
| Capital stock subscribed | | | 280,996 | |
| Tax reclaims | | | 70,519 | |
| Dividends | | | 59,315 | |
| Interest | | | 1,106 | |
| Prepaid insurance and registration | | | 30,345 | |
| | | | |
| Total Assets | | | 188,089,308 | |
| | | | |
| | | | | | | | | |
LIABILITIES |
| Payables: | | | | |
| Capital stock reacquired | | | 685,215 | |
| Distributions | | | 498,811 | |
| Postage and printing fees | | | 77,027 | |
| Management fees | | | 84,516 | |
| Accrued expenses and other liabilities | | | 189,705 | |
| | | | |
| Total Liabilities | | | 1,535,274 | |
| | | | |
Net Assets | | $ | 186,554,034 | |
| | | | |
| | | | | | | | | |
ANALYSIS OF NET ASSETS |
| Net capital paid in shares of capital stock | | $ | 241,091,007 | |
| Par Value (Note 3) | | | 52,085 | |
| Undistributed net investment income | | | 1,355 | |
| Accumulated net realized loss on investments and foreign currency transactions | | | (26,175,027 | ) |
| Net unrealized depreciation on investments | | | (28,412,254 | ) |
| Net unrealized depreciation of translation of other assets and liabilities in foreign currency | | | (3,132 | ) |
| | | | |
Net Assets | | $ | 186,554,034 | |
| | | | |
Net asset value and redemption price per share ($186,554,034/5,208,518 shares of outstanding capital stock, 40 million shares authorized with a par value of $0.01 per share) | | $ | 35.82 | |
| | | | |
Maximum offering price per share (100/95.25 of $35.82) | | $ | 37.61 | |
| | | | |
The accompanying notes are an integral part of these financial statements.
14
NEW ALTERNATIVES FUND, INC.
STATEMENT OF OPERATIONS
For the Year Ended December 31, 2011
| | | | | |
|
Investment Income: | | | | |
| Dividends (net of $366,635 foreign taxes withheld) | | $ | 4,498,065 | |
| Interest | | | 3,360 | |
| | | | |
| Total Investment Income | | | 4,501,425 | |
| | | | |
| | | | | |
Expenses: | | | | |
| Management fee (Note 4) | | | 1,159,003 | |
| Transfer agent fees | | | 435,278 | |
| Administration and accounting fees | | | 233,277 | |
| Custodian fees | | | 128,851 | |
| Postage and printing fees | | | 120,563 | |
| Legal fees | | | 96,521 | |
| Compliance service fees | | | 42,000 | |
| Audit fees | | | 23,361 | |
| Directors’ fees (Note 5) | | | 18,431 | |
| Insurance fees | | | 16,471 | |
| Registration fees | | | 16,234 | |
| Other expenses | | | 14,401 | |
| | | | |
| Total Expenses | | | 2,304,391 | |
| | | | |
Net Investment Income | | | 2,197,034 | |
| | | | |
| | | | | |
Net Realized and Unrealized Gain/(Loss) from Investments and Foreign Currency Related Transactions: | | | | |
| | | | | |
Realized Loss from Investments and Foreign Currency Related Transactions (Notes 2B & 6): | | | | |
| Net realized loss from investments | | | (1,150,625 | ) |
| Net realized loss from foreign currency transactions | | | (13,216 | ) |
| | | | |
| Net Realized Loss | | | (1,163,841 | ) |
| | | | |
| | | | | |
Net Change in Unrealized Appreciation/(Depreciation) of Investments and Foreign Currency Related Transactions: | | | | |
| Net change in unrealized appreciation/(depreciation) on investments | | | (15,838,229 | ) |
| Net change in unrealized appreciation/(depreciation) on foreign currency translations | | | (3,585 | ) |
| | | | |
| Net change in unrealized appreciation/(depreciation) | | | (15,841,814 | ) |
| | | | |
| Net Realized and Unrealized Loss on Investments and Foreign Currency Related Transactions | | | (17,005,655 | ) |
| | | | |
Net Decrease in Net Assets Resulting from Operations | | $ | (14,808,621 | ) |
| | | | |
The accompanying notes are an integral part of these financial statements.
15
NEW ALTERNATIVES FUND, INC.
STATEMENTS OF CHANGES IN NET ASSETS
| | | | | | | | | |
| | | For the | | | For the | |
| | | Year Ended | | | Year Ended | |
| | | December 31, 2011 | | | December 31, 2010 | |
Investment Activities: | | | | | | | | |
| Net investment income | | $ | 2,197,034 | | | $ | 2,142,691 | |
| Net realized gain/(loss) from investments, foreign currency transactions and payment by affiliates | | | (1,163,841 | ) | | | 4,562,300 | |
| Net change in unrealized appreciation/(depreciation) on investments and foreign currency translations | | | (15,841,814 | ) | | | (28,948,308 | ) |
| | | | | | | |
| Net decrease in net assets derived from operations | | | (14,808,621 | ) | | | (22,243,317 | ) |
| | | | | | | |
| | | | | | | | | |
Dividends to Shareholders: | | | | | | | | |
| Dividends from net investment income | | | (2,187,989 | ) | | | (2,175,010 | ) |
| | | | | | | |
| Total dividends to shareholders | | | (2,187,989 | ) | | | (2,175,010 | ) |
| | | | | | | |
| | | | | | | | | |
Capital Share Transactions: | | | | | | | | |
| Net decrease in net assets from capital share transactions (Note 3) | | | (33,145,677 | ) | | | (21,690,414 | ) |
| | | | | | | |
Total Decrease in Net Assets | | | (50,142,287 | ) | | | (46,108,741 | ) |
| | | | | | | | | |
Net Assets: | | | | | | | | |
| Beginning of the year | | | 236,696,321 | | | | 282,805,062 | |
| | | | | | | |
| End of the year* | | $ | 186,554,034 | | | $ | 236,696,321 | |
| | | | | | | |
| | |
| * | | Includes undistributed net investment income of $1,355 and $5,526 for the years ended 12/31/11 and 12/31/10 |
The accompanying notes are an integral part of these financial statements.
16
NEW ALTERNATIVES FUND, INC.
FINANCIAL HIGHLIGHTS
STATEMENT OF PER SHARE INCOME AND CAPITAL CHANGES
For a share of capital stock outstanding throughout each year
| | | | | | | | | | | | | | | | | | | | | |
| | | For the Years Ended December 31, | |
| | | 2011 | | | 2010 | | | 2009 | | | 2008 | | | 2007 | |
| Net asset value at beginning of year | | $ | 39.09 | | | $ | 42.54 | | | $ | 31.41 | | | $ | 57.28 | | | $ | 43.91 | |
| | | | | | | | | | | | | | | | |
Investment Operations | | | | | | | | | | | | | | | | | | | | |
| Net investment income | | | 0.42 | | | | 0.35 | | | | 0.36 | | | | 0.24 | | | | 0.34 | |
| Net realized & unrealized gain/(loss) on investments and foreign currency related transactions | | | (3.27 | ) | | | (3.45 | ) | | | 11.14 | | | | (25.93 | ) | | | 14.39 | |
| Payments by affiliates | | | — | | | | 0.01 | | | | — | | | | — | | | | — | |
| | | | | | | | | | | | | | | | |
| | | | | | | | | | | | | | | | | | | | | |
| Total from investment operations | | | (2.85 | ) | | | (3.09 | ) | | | 11.50 | | | | (25.69 | ) | | | 14.73 | |
| | | | | | | | | | | | | | | | |
| | | | | | | | | | | | | | | | | | | | | |
Distributions | | | | | | | | | | | | | | | | | | | | |
| From net investment income | | | (0.42 | ) | | | (0.36 | ) | | | (0.37 | ) | | | (0.18 | ) | | | (0.34 | ) |
| From net realized gain on investments | | | — | | | | — | | | | — | | | | — | | | | (1.02 | ) |
| | | | | | | | | | | | | | | | |
| | | | | | | | | |
| Total distributions | | | (0.42 | ) | | | (0.36 | ) | | | (0.37 | ) | | | (0.18 | ) | | | (1.36 | ) |
| | | | | | | | | | | | | | | | |
| | | | | | | | | |
| Net asset value at end of year | | $ | 35.82 | | | $ | 39.09 | | | $ | 42.54 | | | $ | 31.41 | | | $ | 57.28 | |
| | | | | | | | | | | | | | | | |
| | | | | | | | | | | | | | | | | | | | | |
Total return
(Sales load not reflected) | | | (7.28 | )% | | | (7.26 | )%* | | | 36.61 | % | | | (44.85 | )% | | | 33.53 | % |
| | | | | | | | | | | | | | | | | | | | | |
Net assets, end of the year
(in thousands) | | $ | 186,554 | | | $ | 236,696 | | | $ | 282,805 | | | $ | 184,257 | | | $ | 301,650 | |
| | | | | | | | | | | | | | | | | | | | | |
| Ratio of operating expenses to average net assets | | | 1.03 | % | | | 1.04 | % | | | 1.02 | % | | | 1.09 | % | | | 0.95 | % |
| | | | | | | | | | | | | | | | | | | | | |
| Ratio of net investment income to average net assets | | | 0.98 | % | | | 0.86 | % | | | 1.06 | % | | | 0.56 | % | | | 0.82 | % |
| | | | | | | | | | | | | | | | | | | | | |
| Portfolio turnover | | | 21.44 | % | | | 16.16 | % | | | 33.94 | % | | | 25.67 | % | | | 14.24 | % |
| | | | | | | | | | | | | | | | | | | | | |
| Number of shares outstanding at end of the year | | | 5,208,518 | | | | 6,055,618 | | | | 6,647,611 | | | | 5,866,871 | | | | 5,266,358 | |
| | |
| * | | In 2010, 0.02% of the Fund’s total return consisted of a voluntary reimbursement by the investment advisor for a realized investment loss. Excluding this voluntary reimbursement, total return for the year would have been (7.28)%. |
The accompanying notes are an integral part of these financial statements.
17
NEW ALTERNATIVES FUND, INC.
NOTES TO FINANCIAL STATEMENTS
For the Year Ended December 31, 2011
1) ORGANIZATION — New Alternatives Fund, Inc. (the “Fund”) was incorporated under the laws of the State of New York on January 17, 1978 and is registered under the Investment Company Act of 1940, as amended (the “1940 Act”), as an open-end management investment company. The Fund commenced operations on September 3, 1982. The investment objective of the Fund is to seek long-term capital appreciation. The Fund seeks to achieve its investment objective by investing in equity securities, such as common stocks. The Fund makes investments in a wide range of industries and in companies of all sizes. The Fund invests in equity securities of both U.S. and foreign companies, and has no limitation on the percentage of assets invested in the U.S. or abroad. The Fund concentrates at least 25% of its total assets in equity securities of companies which have an interest in alternative energy. “Alternative Energy” means the production and conservation of energy in a manner that reduces pollution and harm to the environment, particularly when compared to conventional coal, oil or nuclear energy.
2) ACCOUNTING POLICIES — The following is a summary of significant accounting policies followed by the Fund.
| | | | A. PORTFOLIO VALUATION — The Fund’s net asset value (“NAV”) is calculated once daily at the close of regular trading hours on the New York Stock Exchange (“NYSE”) (generally 4:00 p.m. Eastern time) on each day the NYSE is open. Securities held by the Fund are valued based on the official closing price or the last reported sale price on a national securities exchange or on the National Association of Securities Dealers Automatic Quotation System (“NASDAQ”) market system where they are primarily traded, as of the close of business on the day the securities are being valued. That is normally 4:00 p.m. Eastern time. If there were no sales on that day or the securities are traded on other over-the-counter markets, the mean of the last bid and asked prices prior to the market close is used. Short-term debt securities having a remaining maturity of 60 days or less are amortized based on their cost. |
| |
| | | | Non-U.S. equity securities are valued based on their most recent closing market prices on their primary market and are translated from the local currency into U.S. dollars using current exchange rates on the day of valuation. |
| |
| | | | If the market price of a security held by the Fund is unavailable at the time the Fund prices its shares at 4:00 p.m. Eastern time, the Fund will use the “fair value” of such security as determined in good faith by Accrued Equities, Inc. the Fund’s investment advisor under methods established by and under the general supervision of the Fund’s Board of Directors. The Fund may use fair value pricing if the value of a security it holds has been materially affected by events occurring before the Fund’s pricing time but after the close of the primary markets or exchange on which the security is traded. This most commonly |
18
| | | | occurs with foreign securities, but may occur in other cases as well. Certain foreign securities are fair valued by utilizing an external pricing service in the event of any significant market movements between the time the fund valued such foreign securities and the earlier closing of foreign markets. The Fund does not invest in unlisted securities. |
| |
| | | | The inputs and valuations techniques used to measure fair value of the Fund’s net assets are summarized into three levels as described in the hierarchy below: |
| | | | | |
|
• | | Level 1 — | | Unadjusted quoted prices in active markets for identical assets or liabilities that the Fund has the ability to access. |
| |
• | | Level 2 — | | Observable inputs other than quoted prices included in Level 1 that are observable for the asset or liability, either directly or indirectly. These inputs may include quoted prices for the identical instrument on an inactive market, prices for similar instruments, interest rates, prepayment speeds, credit risk, yield curves, default rates and similar data. |
| |
• | | Level 3 — | | Unobservable inputs for the asset or liability, to the extent relevant observable inputs are not available, representing the Fund’s own assumptions about the assumptions a market participant would use in valuing the asset or liability, and would be based on the best information available. |
| | | | The inputs or methodology used for valuing securities are not necessarily an indication of the risk associated with investing in those securities. |
| |
| | | | The following is a summary of the inputs used, as of December 31, 2011, in valuing the Fund’s assets carried at fair value: |
| | | | | | | | | | | | | | | | | |
| | | | | | | | | | | Level 2 – | | | | |
| | | Total | | | | | | | Other | | | Level 3 – | |
| | | Value at | | | Level 1 – | | | Significant | | | Significant | |
| | | December 31, | | | Quoted | | | Observable | | | Unobservable | |
| | | 2011 | | | Prices | | | Inputs | | | Inputs | |
Investments in Securities: | | | | | | | | | | | | | | | | |
| Common Stocks* | | $ | 178,060,311 | | | $ | 178,060,311 | | | $ | — | | | $ | — | |
| Certificates of Deposit | | | 500,000 | | | | — | | | | 500,000 | | | | — | |
| | | | | | | | | | | | | |
| Total | | $ | 178,560,311 | | | $ | 178,060,311 | | | $ | 500,000 | | | $ | — | |
| | | | | | | | | | | | | |
| | |
| * | | See Schedule of Investments for sector diversification. |
| | | | At the end of each calendar quarter, management evaluates the classification of Levels 1, 2 and 3 assets and liabilities. Various factors are considered, such as changes in liquidity from the prior reporting period; whether or not a broker is willing to execute at the quoted price; the depth and consistency of prices from third party pricing services; and the existence of contemporaneous, observable trades in the market. Additionally, management |
19
| | | | evaluates the classification of Level 1 and Level 2 assets and liabilities on a quarterly basis for changes in listings or delistings on national exchanges. |
| |
| | | | Due to the inherent uncertainty of determining the fair value of investments that do not have a readily available market value, the fair value of the Fund’s investments may fluctuate from period to period. Additionally, the fair value of investments may differ significantly from the values that would have been used had a readily available market existed for such investments and may differ materially from the values the Fund may ultimately realize. Further, such investments may be subject to legal and other restrictions on resale or otherwise less liquid than publicly traded securities. |
| |
| | | | For the year ended December 31, 2011, there were no transfers between Levels 1, 2 and 3 for the Fund. |
| |
| | | | B. FOREIGN CURRENCY TRANSLATION — Investment securities and other assets and liabilities denominated in foreign currencies are translated into U.S. dollar amounts at the date of valuation. Purchases and sales of investment securities and income and expense items denominated in foreign currencies are translated into U.S. dollar amounts on the respective dates of such transactions. If foreign currency translations are not available, the foreign exchange rate(s) will be valued at fair market value using procedures approved by the Fund’s Board of Directors. |
| |
| | | | The Fund does not isolate that portion of the results of operations resulting from changes in foreign exchange rates on investments from the fluctuations arising from changes in market prices of securities held. Such fluctuations are included with the net realized and unrealized gain or loss from investments. |
| |
| | | | Reported net realized foreign exchange gains or losses arise from sales of foreign currencies, currency gains or losses realized between the trade and settlement dates on securities transactions, and the difference between the amounts of dividends, interest, and foreign withholding taxes recorded on the Fund’s books and the U.S. dollar equivalent of the amounts actually received or paid. |
| |
| | | | Foreign Securities — Investing in foreign securities (including depositary receipts traded on U.S. exchanges but representing shares of foreign companies) involves more risks than investing in U.S. securities. Risks of investing in foreign companies include currency exchange rates between foreign currencies and the U.S. dollar. The political, economic and social structures of some foreign countries may be less stable and more volatile than those in the U.S. Brokerage commissions and other fees may be higher for foreign securities. Foreign companies may not be subject to the same disclosure, accounting, auditing and financial reporting standards as U.S. companies. These risks can increase the potential for losses in the Fund and affect its share price. |
20
| | | | C. SECURITY TRANSACTIONS AND RELATED INVESTMENT INCOME — Security transactions are accounted for on the trade date (date order to buy or sell is executed). The cost of investments sold is determined by use of a first in, first out basis for both financial reporting and income tax purposes in determining realized gains and losses on investments. |
| |
| | | | D. INVESTMENT INCOME AND EXPENSE RECOGNITION — Dividend income is recorded as of the ex-dividend date. Foreign dividend income is recorded on the ex-dividend date or as soon as possible after the Fund determines the existence of a dividend declaration after exercising reasonable diligence. Interest income, including amortization/accretion of premium and discount, is accrued daily. Expenses are accrued on a daily basis. |
| |
| | | | E. DIVIDENDS AND DISTRIBUTIONS TO SHAREHOLDERS — Dividends from net investment income and distributions from net realized capital gains, if any, will be declared and paid at least annually to shareholders and recorded on ex-date. Income dividends and capital gain distributions are determined in accordance with U.S. federal income tax regulations which may differ from accounting principles generally accepted in the United States of America. |
| |
| | | | F. U.S. TAX STATUS — No provision is made for U.S. income taxes as it is the Fund’s intention to qualify for and elect the tax treatment applicable to regulated investment companies under Subchapter M of the Internal Revenue Code of 1986, as amended, and make the requisite distributions to its shareholders which will be sufficient to relieve it from U.S. income and excise taxes. |
| |
| | | | G. USE OF ESTIMATES IN THE PREPARATION OF FINANCIAL STATEMENTS —The preparation of financial statements in conformity with accounting principles generally accepted in the United States of America requires management to make estimates and assumptions that affect the reported amounts of assets and liabilities and disclosure of contingent assets and liabilities at the date of the financial statements and the reported amounts of revenue and expenses during the reporting period. Actual results could differ from those estimates. |
| |
| | | | H. OTHER — In the normal course of business, the Fund may enter into contracts that provide general indemnifications. The Fund’s maximum exposure under these arrangements is dependent on claims that may be made against the Fund in the future, and therefore, cannot be estimated; however, based on experience, the risk of material loss for such claims is considered remote. |
| |
| | | | I. NEW ACCOUNTING PRONOUNCEMENT — In May 2011, the Financial Accounting Standards Board issued Accounting Standards Update (“ASU”) No. 2011-04 “Amendments to Achieve Common Fair Value Measurement and Disclosure Requirements in U.S. GAAP and IFRSs”. ASU 2011-04 includes common requirements for |
21
| | | | measurement of and disclosure about fair value between U.S. GAAP and IFRS. ASU 2011-04 will require reporting entities to disclose the following information for fair value measurements categorized within Level 3 of the fair value hierarchy: quantitative information about the unobservable inputs used in the fair value measurement, the valuation processes used by the reporting entity and a narrative description of the sensitivity of the fair value measurement to changes in unobservable inputs and the interrelationships between those unobservable inputs. In addition, ASU 2011-04 will require reporting entities to make disclosures about amounts and reasons for all transfers in and out of Level 1 and Level 2 fair value measurements. The new and revised disclosures are effective for interim and annual reporting periods beginning after December 15, 2011. Management is currently evaluating the implications of ASU No. 2011-04 and its impact on the financial statements. |
3) CAPITAL STOCK — There are 40,000,000 shares of $0.01 par value capital stock authorized. On December 31, 2011 there were 5,208,518 shares outstanding. Aggregate paid-in capital including reinvestment of dividends was $241,143,092. Transactions in capital stock were as follows:
| | | | | | | | | | | | | | | | | |
| | | For the Year Ended | | | For the Year Ended | |
| | | December 31, 2011 | | | December 31, 2010 | |
| | | Shares | | | Amount | | | Shares | | | Amount | |
| Capital stock sold | | | 442,464 | | | $ | 18,128,567 | | | | 826,721 | | | $ | 32,362,329 | |
| Reinvestment of distributions | | | 47,195 | | | | 1,690,663 | | | | 43,051 | | | | 1,683,069 | |
| Redemptions | | | (1,336,759 | ) | | | (52,964,907 | ) | | | (1,461,765 | ) | | | (55,735,812 | ) |
| | | | | | | | | | | | | |
| Net Decrease | | | (847,100 | ) | | $ | (33,145,677 | ) | | | (591,993 | ) | | $ | (21,690,414 | ) |
| | | | | | | | | | | | | |
4) MANAGEMENT FEE AND OTHER TRANSACTIONS WITH AFFILIATES — Accrued Equities, Inc. (“Accrued Equities” or the “Advisor”), an SEC registered investment advisor and broker-dealer, serves as investment advisor to the Fund pursuant to an Investment Advisory Agreement, as amended, and as an underwriter (but not a principal underwriter) of the Fund’s shares pursuant to a Sub-Distribution Agreement. For it’s investment advisory services, the Fund pays Accrued Equities an annual management fee of 1.00% of the first $10 million of average net assets; 0.75% of the next $20 million of average net assets; 0.50% of average net assets more than $30 million and less than $100 million; and 0.45% of average net assets more than $100 million.
The Fund pays no remuneration to its directors, David J. Schoenwald, Maurice L. Schoenwald and Murray D. Rosenblith, who are also officers or employees of Accrued Equities. BNY Mellon Distributors LLC, formerly known as “BNY Mellon Distributors, Inc.” (“BNY Mellon Distributors”), serves as the principal underwriter of the Fund pursuant to an Underwriting Agreement for the limited purpose of acting as statutory underwriter to facilitate the distribution of shares of the Funds. The Underwriter has entered into a Sub-Distribution Agreement with Accrued Equities. The Underwriter receives as compensation for its services: (i) a base underwriting fee of
22
$25,000 per year; (ii) a compliance systems fee of $2,500; and (iii) commissions on the sale of Fund shares. The Fund charges a maximum front-end sales charge of 4.75% on most new sales. Of this amount, the Underwriter and Accrued Equities retain the net underwriter commission and pay out the remaining sales commission to other brokers who actually sell new shares. Their share of the sales commission may vary. The aggregate underwriter concession on all sales of Fund shares during the year ended December 31, 2011 was $40,023, and the amounts retained by the Underwriter and Accrued Equities were $13,341, and $26,682, respectively. The Underwriter and Accrued Equities are also entitled to receive sales commissions for the sale of Fund shares. For the year ended December 31, 2011, the Underwriter and Accrued Equities received $8,829 and $37,914 in sales commissions, respectively, for the sale of Fund shares. The Underwriter is a registered broker-dealer affiliated with BNY Mellon Investment Servicing (US) Inc., the Fund’s administrator, transfer agent and fund accounting agent.
5) DIRECTORS’ FEES — For the year ended December 31, 2011, the Fund paid directors’ fees and out of pocket expenses of $20,000 to its Directors who are not “interested persons” of the Fund, as that term is defined in the 1940 Act (the “Independent Directors”).
Each Independent Director receives an annual fee of $3,500 for their services as Independent Directors of the Fund. As Vice Chairperson of the Fund’s Board of Directors, Sharon Reier receives an additional annual fee of $1,000. Each member of the Audit Committee receives an additional $500 annual fee and Preston V. Pumphrey, Chairperson of the Audit Committee, receives an additional annual fee of $500. The Independent Directors also receive reimbursement of “coach” travel expenses to attend Board Meetings. The Directors and Officers of the Fund who are officers and employees of the Advisor do not receive compensation from the Fund for their services and are paid for their services by the Advisor. The Fund’s Chief Compliance Officer is not an officer or employee of the Advisor and is compensated directly by the Fund for his services.
6) PURCHASES AND SALES OF SECURITIES — For the year ended December 31, 2011, the aggregate cost of securities purchased totaled $45,621,961. Net realized gains (losses) were computed on a first in, first out basis. The proceeds received on sales of securities for the year ended December 31, 2011 was $81,046,238.
7) FEDERAL INCOME TAX INFORMATION — At December 31, 2011, the federal tax basis cost and aggregate gross unrealized appreciation and depreciation of securities held by the Fund were as follows:
| | | | | |
|
| Cost of investments for tax purposes | | $ | 207,819,793 | |
| | | | |
| Unrealized appreciation for tax purposes | | $ | 26,144,576 | |
| Unrealized depreciation for tax purposes | | | (55,404,058 | ) |
| | | | |
| Net unrealized depreciation on investments | | $ | (29,259,482 | ) |
| | | | |
23
The tax character of distributions paid during 2011 and 2010 was as follows:
| | | | | | | | | |
| | | 2011 | | | 2010 | |
| Distribution paid from: | | | | | | | |
| Ordinary Income | | $ | 2,187,989 | | | $ | 2,175,010 | |
| Long-term Capital Gains | | | — | | | | — | |
| | | | | | | |
| | | $ | 2,187,989 | | | $ | 2,175,010 | |
| | | | | | | |
For federal income tax purposes, distributions from net investment income and short-term capital gains are treated as ordinary income dividends.
The following permanent differences as of December 31, 2011, attributable to transactions involving foreign securities and currencies were reclassified to the following accounts:
| | | | | |
| Accumulated Net Realized Loss | | $ | 13,216 | |
| Undistributed Net Investment Income | | | (13,216 | ) |
As of December 31, 2011, the components of distributable earnings on a tax basis were as follows:
| | | | | |
|
| Undistributed Ordinary Income | | $ | 1,355 | |
| Capital Loss Carryforward | | | (25,327,799 | ) |
| ** Net Unrealized Depreciation on Investments and Foreign Currency Translations | | | (29,262,614 | ) |
| | | | |
| | | $ | (54,589,058 | ) |
| | | | |
| | |
| ** | | The primary difference between distributable earnings on a book and tax basis is due to wash sales losses. |
The Fund has a capital loss carryforward of $25,327,799 which can be used to offset future capital gains. If not utilized against future capital gains, $15,782,057 of this capital loss carryforward will expire on December 31, 2016 and $8,395,118 will expire on December 31, 2017. $1,150,624 of this capital loss carryforward will not be subject to expiration, as under the recently enacted Regulated Investment Company Modification Act of 2010, capital losses incurred by the Fund after December 31, 2010 will not be subject to expiration. Such losses must be used to offset future capital gains realized prior to losses incurred in the years preceding enactment. Additionally, post-enactment capital losses that are carried forward will retain their character as either short-term or long-term capital losses rather than being considered all short-term as under previous law.
Management has analyzed the Fund’s tax positions taken on federal income tax returns for all open tax years (current and prior three tax years), and has concluded that no provision for federal income tax is required in the Fund’s financial statements. The Fund’s federal and state income and federal excise tax returns for tax years for which the applicable statutes of limitations have not expired are subject to examination by the Internal Revenue Service and state departments of revenue.
24
8) SUBSEQUENT EVENTS — On November 28, 2011, The Bank of New York Mellon Corporation announced the sale of BNY Mellon Distributors to the Foreside Financial Group (“Foreside”) (the “Transaction”). The Transaction, which will involve The Bank of New York Mellon Corporation selling the stock of BNY Mellon Distributors and its four broker dealer subsidiaries to Foreside, is anticipated to close, subject to any necessary governmental and regulatory approvals, during the first half of 2012.
In connection with the Transaction, on January 30, 2012, “BNY Mellon Distributors, Inc.” converted from a corporation to a limited liability company named “BNY Mellon Distributors LLC.” In addition, at the time of the Transaction, it is anticipated that BNY Mellon Distributors will change its name to “Foreside Funds Distributors LLC.”
At a meeting of the Board of Directors of the Fund held on January 27, 2012, the Board approved an underwriting agreement between the Fund and Foreside Funds Distributors LLC to commence at the effective time of the Transaction. This underwriting agreement will be on the same terms and conditions as the Fund’s current underwriting agreement, including the provisions for fees.
25
REPORT OF INDEPENDENT REGISTERED PUBLIC ACCOUNTING FIRM
To the Shareholders and Board of Directors of
New Alternatives Fund, Inc.
We have audited the accompanying statement of assets and liabilities of New Alternatives Fund, Inc., including the schedule of investments, as of December 31, 2011, and the related statement of operations for the year then ended, the statements of changes in net assets for each of the two years in the period then ended, and the financial highlights for each of the five years in the period then ended. These financial statements and financial highlights are the responsibility of the Fund’s management. Our responsibility is to express an opinion on these financial statements and financial highlights based on our audits.
We conducted our audits in accordance with the standards of the Public Company Accounting Oversight Board (United States). Those standards require that we plan and perform the audits to obtain reasonable assurance about whether the financial statements and financial highlights are free of material misstatement. An audit includes examining, on a test basis, evidence supporting the amounts and disclosures in the financial statements. Our procedures included confirmation of securities owned as of December 31, 2011 by correspondence with the custodian and brokers. An audit also includes assessing the accounting principles used and significant estimates made by management, as well as evaluating the overall financial statement presentation. We believe that our audits provide a reasonable basis for our opinion.
In our opinion, the financial statements and financial highlights referred to above present fairly, in all material respects, the financial position of New Alternatives Fund, Inc. as of December 31, 2011, the results of its operations for the year then ended, the changes in its net assets for each of the two years in the period then ended, and the financial highlights for each of the five years in the period then ended, in conformity with accounting principles generally accepted in the United States of America.
BBD, LLP
Philadelphia, Pennsylvania
February 22, 2012
26
OTHER INFORMATION
(Unaudited)
1) PROXY VOTING — The Fund has proxy voting policies which are available: (1) without charge, upon request by calling the Fund at 800-423-8383 and (2) on the SEC’s website at http://www.sec.gov. Information regarding how the Fund voted proxies during the most recent twelve-month period ended June 30 is available on form N-PX: (1) without charge, upon request, by calling the Fund at 800-423-8383 and (2) on the SEC’s website at http://www.sec.gov.
2) QUARTERLY PORTFOLIO SCHEDULES — The Fund files a complete schedule of portfolio holdings with the SEC for the first and third quarters of each fiscal year (quarters ended March 31 and September 30) on Form N-Q. The Fund’s Form N-Q’s are available on the SEC website at http://www.sec.gov and may be reviewed and copied at the SEC Public Reference Room in Washington, D.C. Information on the operation of the SEC Public Reference Room may be obtained by calling 1-800-SEC-0330.
3) SHAREHOLDER MEETING INFORMATION — The Annual Meeting of Shareholders of the Fund (the “Meeting”) was held on September 23, 2011 pursuant to notice given to all shareholders of record at the close of business on August 5, 2011. At the Meeting, the shareholders were asked to approve the election of eight directors and to the Board of Directors’ appointment of BBD, LLP as the Fund’s independent registered public accounting firm for its fiscal year ending December 31, 2011
Information regarding shares voted for and against the matters before the Meeting follows:
Matter 1: To elect eight Directors to serve for the ensuing year.
| | | | | | | | | |
| | | For | | Withhold |
| Jonathan D. Beard | | | 3,821,525.195 | | | | 68,412.208 | |
| Susan Hickey | | | 3,821,753.713 | | | | 68,183.690 | |
| Jeffrey E. Perlman | | | 3,823,123.891 | | | | 66,813.512 | |
| Preston V. Pumphrey | | | 3,808,473.925 | | | | 81,463.478 | |
| Sharon Reier | | | 3,822,372.702 | | | | 67,564.701 | |
| Murray D. Rosenblith | | | 3,809,877.320 | | | | 80,060.083 | |
| David J. Schoenwald | | | 3,800,767.169 | | | | 89,170.234 | |
| Maurice L. Schoenwald | | | 3,661,119.972 | | | | 228,817.431 | |
Matter 2: To ratify the selection of BBD, LLP as the Fund’s independent registered public accounting firm for its fiscal year ending December 31, 2011.
| | | | | | | | | |
| For | | Against | | Abstain |
| 3,777,396,969 | | | 27,082.183 | | | | 85,458.251 | |
27
NEW ALTERNATIVES FUND, INC.
SHAREHOLDER TAX INFORMATION (Unaudited)
During the fiscal year ended December 31, 2011, the following dividends were paid by the Fund:
| | | | | |
|
| Ordinary Income | | $ | 2,187,989 | |
| Long-Term Capital Gains | | | — | |
For the year ended December 31, 2011, certain dividends may be subject to a maximum tax rate of 15%, as provided for by the Jobs and Growth Tax Relief Reconciliation Act of 2003. For individual shareholders, 100% of their ordinary income dividends for the Fund qualify for the maximum tax rate of 15%. Complete information will be computed and reported in conjunction with your Form 1099-DIV.
For corporate shareholders, 99.99% of the ordinary income dividends qualify for the dividends received deduction.
Shareholders are advised to consult their own tax advisors with respect to the tax consequences of their investments in the Fund.
28
MANAGEMENT OF THE FUND
(Unaudited)
Information pertaining to the Directors and Officers of the Fund is set forth below. The Statement of Additional Information includes additional information about the Directors and is available without charge, upon request, by calling the Fund at 800-423-8383 or by visiting our website at www.newalternativesfund.com. The mailing address for the Directors and Officers of the Fund is c/o New Alternatives Fund, Inc., 150 Broadhollow Road, Suite PH2, Melville, New York 11747.
DIRECTORS
| | | | | | | | | | | | | | | |
| | | | | | | | | | | Number of | | All |
| | | | | | | | | | | Portfolios in | | Directorships |
| | | | | Term of | | Principal | | Fund Complex | | Held by |
| | | Position(s) | | Office and | | Occupation(s) | | To Be | | Director |
| | | Held with | | Length of Time | | During the Past | | Overseen by | | During the |
| Name, Address and Age | | the Fund | | Served1 | | Five Years | | Director2 | | Past Five Years3 |
Interested Directors: | | | | | | | | | | | | | | |
| Maurice L. Schoenwald* | | Founder, Director | | Founder and | | Semi-Retired (since | | | 1 | | | None |
| Longboat Key, FL | | | | Director, 1982 to | | 2012); Founder and | | | | | | |
| Age: 91 | | | | present; Vice | | Director, Accrued | | | | | | |
| | | | | President and | | Equities, Inc.**; | | | | | | |
| | | | | Secretary, 1982 to
2012 | | Formerly, Chairperson | | | | | | |
| | | | | | | | | of the Board of the | | | | | | |
| | | | | | | | | Fund (1982-2008). | | | | | | |
| | | | | | | | | | | | | | | |
| David J. Schoenwald* | | Founder, | | Founder, Director, | | President and | | | 1 | | | None |
| Huntington Bay, NY | | Director, | | President and | | Treasurer, Accrued | | | | | | |
| Age: 62 | | President, | | Treasurer, 1982 to | | Equities, Inc.** | | | | | | |
| | | Treasurer and | | present; | | | | | | | | |
| | | Chairperson of | | Chairperson of the | | | | | | | | |
| | | the Board | | Board, 2008 to | | | | | | | | |
| | | | | present | | | | | | | | |
| | | | | | | | | | | | | | | |
| Murray D. Rosenblith* | | Director and | | Director, 2003 to | | Portfolio Manager and | | | 1 | | | None |
| Brooklyn, NY | | Assistant | | present; Assistant | | Assistant Compliance | | | | | | |
| Age: 60 | | Secretary | | Secretary, 2009 to | | Officer (since 2010), | | | | | | |
| | | | | present | | and employee, | | | | | | |
| | | | | | | | | Accrued Equities, | | | | | | |
| | | | | | | | | Inc.** (2008 to | | | | | | |
| | | | | | | | | present); Formerly, | | | | | | |
| | | | | | | | | Executive Director, | | | | | | |
| | | | | | | | | A.J. Muste Memorial | | | | | | |
| | | | | | | | | Institute, an | | | | | | |
| | | | | | | | | organization | | | | | | |
| | | | | | | | | concerned with | | | | | | |
| | | | | | | | | exploration of the link | | | | | | |
| | | | | | | | | between non-violence | | | | | | |
| | | | | | | | | and social change | | | | | | |
| | | | | | | | | (1985 to 2008). | | | | | | |
29
| | | | | | | | | | | | | |
| | | | | | | | | Number of | | All |
| | | | | | | | | Portfolios in | | Directorships |
| | | | | Term of | | Principal | | Fund Complex | | Held by |
| | | Position(s) | | Office and | | Occupation(s) | | To Be | | Director |
| | | Held with | | Length of Time | | During the Past | | Overseen by | | During the |
| Name, Address and Age | | Fund | | Served1 | | Five Years | | Director2 | | Past Five Years3 |
Independent Directors: | | | | | | | | | | | | |
| | | | | | | | | |
| Sharon Reier | | Director and | | Director, 1982 to | | Freelance financial | | | 1 | | | None |
| Coconut Creek, FL and | | Vice-Chairperson | | present; Vice- | | journalist; contributor to | | | | | | |
| Paris, France | | of the Board | | Chairperson, 2008 | | the International Herald | | | | | | |
| Age: 65 | | | | to present | | Tribune, (1995 to 2011); | | | | | | |
| | | | | | | former contributor to | | | | | | |
| | | | | | | Business Week | | | | | | |
| | | | | | | International; former | | | | | | |
| | | | | | | regional editor, Financial | | | | | | |
| | | | | | | World; former editor, | | | | | | |
| | | | | | | Boardroom Reports; | | | | | | |
| | | | | | | former contributing editor, | | | | | | |
| | | | | | | Institutional Investor; | | | | | | |
| | | | | | | former staff, Forbes and | | | | | | |
| | | | | | | American Banker. | | | | | | |
| | | | | | | | | | | | | |
| Preston V. Pumphrey | | Director and | | 2003 to present | | Registered Principal, C.E. | | | 1 | | | None |
| Syosset, NY | | Audit Committee | | | | Gaye & Sons Securities, | | | | | | |
| Age: 77 | | Chairperson | | | | Ltd. (July 2008 to | | | | | | |
| | | | | | | present); FINRA Dispute | | | | | | |
| | | | | | | Resolution Board of | | | | | | |
| | | | | | | Arbitrators (June 2002 to | | | | | | |
| | | | | | | present); Formerly, | | | | | | |
| | | | | | | Adjunct Professor of | | | | | | |
| | | | | | | Finance, C.W. Post | | | | | | |
| | | | | | | College. | | | | | | |
| | | | | | | | | | | | | |
| Susan Hickey | | Director and | | 2005 to present | | Accounting Software | | | 1 | | | None |
| East Northport, NY | | Audit Committee | | | | Developer, | | | | | | |
| Age: 59 | | Member | | | | AccountantsWorld, LLC.; | | | | | | |
| | | | | | | Member of National | | | | | | |
| | | | | | | Association of Enrolled | | | | | | |
| | | | | | | Agents and New York | | | | | | |
| | | | | | | Society of Independent | | | | | | |
| | | | | | | Accountants; Former IRS | | | | | | |
| | | | | | | Tax Return Auditor; BA | | | | | | |
| | | | | | | International Affairs, | | | | | | |
| | | | | | | Stonehill College, North | | | | | | |
| | | | | | | Easton, MA. | | | | | | |
| | | | | | | | | | | | | |
| Jonathan D. Beard | | Director | | 2005 to present | | Self-employed Freelance | | | 1 | | | None |
| New York, NY | | | | | | Journalist for various | | | | | | |
| Age: 64 | | | | | | American and European | | | | | | |
| | | | | | | Science Magazines; | | | | | | |
| | | | | | | Lifetime Member, Sierra | | | | | | |
| | | | | | | Club and New York-New | | | | | | |
| | | | | | | Jersey Trails Conference; | | | | | | |
| | | | | | | Graduate of Columbia | | | | | | |
| | | | | | | University 1970. | | | | | | |
30
| | | | | | | | | | | |
| | | | | | | | | Number of | | All |
| | | | | | | | | Portfolios in | | Directorships |
| | | | | Term of | | Principal | | Fund Complex | | Held by |
| | | Position(s) | | Office and | | Occupation(s) | | To Be | | Director |
| | | Held with | | Length of Time | | During the Past | | Overseen by | | During the |
| Name, Address and Age | | Fund | | Served1 | | Five Years | | Director2 | | Past Five Years3 |
| Jeffrey E. Perlman | | Director | | 2009 to present | | President and Founder, | | 1 | | None |
| New York, NY | | | | | | Bright Power, a | | | | |
| Age: 32 | | | | | | company advancing | | | | |
| | | | | | | clean, cost-effective | | | | |
| | | | | | | energy solutions (2004 | | | | |
| | | | | | | to present); Clarinetist/ | | | | |
| | | | | | | Saxophonist, | | | | |
| | | | | | | Romashka and various | | | | |
| | | | | | | Klezmer music | | | | |
| | | | | | | ensembles (1996 to | | | | |
| | | | | | | present); Formerly, | | | | |
| | | | | | | Consultant, Capital E, | | | | |
| | | | | | | a renewable energy | | | | |
| | | | | | | consulting and | | | | |
| | | | | | | investment services | | | | |
| | | | | | | company (2002 to 2005). | | | | |
Officers of the Fund who are not Directors:
| | | | | | | |
| | | | | Term of | | |
| | | Position(s) | | Office and | | |
| | | Held with the | | Length of Time | | Principal Occupation(s) |
| Name, Address and Age | | Fund | | Served1 | | During the Past Five Years |
| Joseph A. Don Angelo | | Chief | | 2007 to present | | Accountant and Owner, Don Angelo and |
| Syosset, NY | | Compliance | | | | Associates, CPAs P.C. (1984 to present). |
| Age: 63 | | Officer | | | | |
| | |
| 1 | | Each Director and Officer holds office until the next annual meeting of shareholders at which Directors or Officers are elected following his or her election or appointment and until his or her successor has been elected and qualified. |
| |
| 2 | | Currently, there is only one portfolio and no fund complex. |
| |
| 3 | | Includes directorships of companies required to report to the SEC under the Securities Exchange Act of 1934, as amended (i.e., “public companies”), or other investment companies registered under the 1940 Act. |
| |
| * | | “Interested person”, as defined in section 2(a)(19) of the 1940 Act. Maurice L. Schoenwald is Director and minority shareholder of the Advisor. David J. Schoenwald is majority shareholder and President of the Advisor. Maurice L. Schoenwald and David J. Schoenwald are father and son. Murray D. Rosenblith is considered an “interested person” as a result of his employment with Advisor. |
| |
| ** | | Maurice L. Schoenwald, David J. Schoenwald and Murry D. Rosenblith have no present enterprise, employment, position or commercial investment activity except for their positions with Accrued Equities, Inc., the Fund’s investment advisor and Sub-Distributor. At the present time, Accrued Equities, Inc. provides services only to the Fund. David J. Schoenwald is licensed to practice law in New York and is President and sole shareholder of Schoenwald and Schoenwald, P.C. |
31
[This Page Intentionally Left Blank]
[This Page Intentionally Left Blank]
Item 2. Code of Ethics.
| | (a) | | The registrant, as of the end of the period covered by this report, has adopted a code of ethics that applies to the registrant’s principal executive officer, principal financial officer, principal accounting officer or controller, or persons performing similar functions, regardless of whether these individuals are employed by the registrant or a third party. |
| |
| | (c) | | There have been no amendments, during the period covered by this report, to a provision of the code of ethics that applies to the registrant’s principal executive officer, principal financial officer, principal accounting officer or controller, or persons performing similar functions, regardless of whether these individuals are employed by the registrant or a third party, and that relates to any element of the code of ethics description. |
| |
| | (d) | | The registrant has not granted any waivers, including an implicit waiver, from a provision of the code of ethics that applies to the registrant’s principal executive officer, principal financial officer, principal accounting officer or controller, or persons performing similar functions, regardless of whether these individuals are employed by the registrant or a third party, that relates to one or more of the items set forth in paragraph (b) of this item’s instructions. |
Item 3. Audit Committee Financial Expert.
As of the end of the period covered by the report, the Registrant’s Board of Directors has determined that Preston V. Pumphrey is qualified to serve as an audit committee financial expert serving on its audit committee and that he is “independent,” as defined by Item 3 of Form N-CSR.
Item 4. Principal Accountant Fees and Services.
Audit Fees
| | (a) | | The aggregate fees billed for each of the last two fiscal years for professional services rendered by the principal accountant for the audit of the registrant’s annual financial statements or services that are normally provided by the accountant in connection with statutory and regulatory filings or engagements for those fiscal years are $19,250 for 2010 and $19,250 for 2011. |
Audit-Related Fees
| | (b) | | The aggregate fees billed in each of the last two fiscal years for assurance and related services by the principal accountant that are reasonably related to the performance of the audit of the registrant’s financial statements and are not reported under paragraph (a) of this Item are $0 for 2010 and $0 for 2011. |
Tax Fees
| | (c) | | The aggregate fees billed in each of the last two fiscal years for professional services rendered by the principal accountant for tax compliance, tax advice, and tax planning are $2,000 for 2010 and $2,000 for 2011. The fees billed were for review by the principal accountant of the registrant’s Federal tax returns. |
All Other Fees
| | (d) | | The aggregate fees billed in each of the last two fiscal years for products and services provided by the principal accountant, other than the services reported in paragraphs (a) through (c) of this Item are $0 for 2010 and $0 for 2011. |
| |
| | (e)(1) | | Disclose the audit committee’s pre-approval policies and procedures described in paragraph (c)(7) of Rule 2-01 of Regulation S-X. |
| |
| | | | The Audit Committee will be responsible for evaluating the provision of non-audit services to the Company as required by Section 201 of the Sarbanes-Oxley Act of 2002 and the rules and regulations promulgated thereunder (collectively, the “2002 Act”) and any pre-approval requests submitted by the independent accountants as required by Section 202 of the 2002 Act. |
| |
| | (e)(2) | | The percentage of services described in each of paragraphs (b) through (d) of this Item that were approved by the audit committee pursuant to paragraph (c)(7)(i)(C) of Rule 2-01 of Regulation S-X are as follows: |
| | (f) | | The percentage of hours expended on the principal accountant’s engagement to audit the registrant’s financial statements for the most recent fiscal year that were attributed to work performed by persons other than the principal accountant’s full-time, permanent employees was less than fifty percent. |
| |
| | (g) | | The aggregate non-audit fees billed by the registrant’s accountant for services rendered to the registrant, and rendered to the registrant’s investment adviser (not including any sub-adviser whose role is primarily portfolio management and is subcontracted with or overseen by another investment adviser), and any entity controlling, controlled by, or under common control with the adviser that provides ongoing services to the registrant for each of the last two fiscal years of the registrant was $0 for 2010 and $0 for 2011. |
| |
| | (h) | | Not applicable. |
Item 5. Audit Committee of Listed registrants.
Not applicable to Registrant, which is an open-end management investment company.
Item 6. Investments.
| (a) | | Not applicable. The full Schedule of Investments in securities of unaffiliated issuers as of the close of the reporting period is included as part of the annual report to shareholders filed under Item 1 of this form. |
| |
| (b) | | Not applicable. |
Item 7. Disclosure of Proxy Voting Policies and Procedures for Closed-End Management Investment Companies.
Not applicable to Registrant, which is an open-end management investment company.
Item 8. Portfolio Managers of Closed-End Management Investment Companies.
Not applicable to Registrant, which is an open-end management investment company.
Item 9. Purchases of Equity Securities by Closed-End Management Investment Company and Affiliated Purchasers.
Not applicable to Registrant, which is an open-end management investment company.
Item 10. Submission of Matters to a Vote of Security Holders.
There have been no material changes to the procedures by which the shareholders may recommend nominees to the Registrant’s Board of Directors, where those changes were implemented after the Registrant last provided disclosure in response to the requirements of Item 407(c)(2)(iv) of Regulation S-K (17 CFR 229.407) (as required by Item 22(b)(15) of Schedule 14A (17 CFR 240.14a-101)), or this Item.
Item 11. Controls and Procedures.
| | (a) | | Based on his evaluation of the Registrant’s disclosure controls and procedures (as defined in Rule 30a-3(c) under the Investment Company Act of 1940, as amended (the “1940 Act”)) as of a date within 90 days of the filing date of this report, the Registrant’s principal executive officer and principal financial officer has concluded that such disclosure controls and procedures are reasonably designed and are operating effectively to ensure that material information relating to the Registrant, including its consolidated subsidiaries, is made known to him by others within those entities, particularly during the period in which this report is being prepared, and that the |
| | | | information required in filings on Form N-CSR is recorded, processed, summarized, and reported on a timely basis. |
| |
| | (b) | | There were no changes in the registrant’s internal control over financial reporting (as defined in Rule 30a-3(d) under the 1940 Act (17 CFR 270.30a-3(d)) that occurred during the registrant’s second fiscal quarter of the period covered by this report that has materially affected, or is reasonably likely to materially affect, the registrant’s internal control over financial reporting. |
Item 12. Exhibits.
| | (a)(1) | | Code of ethics, or any amendment thereto, that is the subject of disclosure required by Item 2 is incorporated by reference to Exhibit (a)(1) of the Registrant’s Form N-CSR filed on March 8, 2007 (Accession No. 0001116502-07-000455). |
| |
| | (a)(2) | | Certifications pursuant to Rule 30a-2(a) under the 1940 Act and Section 302 of the Sarbanes-Oxley Act of 2002 are attached hereto. |
| |
| | (a)(3) | | Not applicable. |
| |
| | (b) | | Certifications pursuant to Rule 30a-2(b) under the 1940 Act and Section 906 of the Sarbanes-Oxley Act of 2002 are attached hereto. |
SIGNATURES
Pursuant to the requirements of the Securities Exchange Act of 1934 and the Investment Company Act of 1940, the registrant has duly caused this report to be signed on its behalf by the undersigned, thereunto duly authorized.
| | | | | |
| (registrant) | | New Alternatives Fund, Inc. | | |
| | | | | |
|
| By (Signature and Title)* | | /s/ David J. Schoenwald David J. Schoenwald, President and Treasurer
| | |
| | | (Principal Executive Officer and Principal Financial Officer) | | |
Pursuant to the requirements of the Securities Exchange Act of 1934 and the Investment Company Act of 1940, this report has been signed below by the following persons on behalf of the registrant and in the capacities and on the dates indicated.
| | | | | |
|
| By (Signature and Title)* | | /s/ David J. Schoenwald | | |
| | | | | |
| | | David J. Schoenwald, President and Treasurer
| | |
| | | (Principal Executive Officer and Principal Financial Officer) | | |
| | |
| * | | Print the name and title of each signing officer under his or her signature. |