UNITED STATES
SECURITIES AND EXCHANGE COMMISSION
Washington, D.C. 20549
FORM N-CSR
CERTIFIED SHAREHOLDER REPORT OF REGISTERED MANAGEMENT
INVESTMENT COMPANIES
Investment Company Act file number 811-03287
New Alternatives Fund, Inc.
(Exact name of registrant as specified in charter)
150 Broadhollow Road, Suite PH2
Melville, New York 11747
(Address of principal executive offices) (Zip code)
David J. Schoenwald, President
New Alternatives Fund, Inc.
150 Broadhollow Road, Suite PH2
Melville, New York 11747
(Name and address of agent for service)
Registrant’s telephone number, including area code: 631-423-7373
Date of fiscal year end: December 31
Date of reporting period: December 31, 2012
Form N-CSR is to be used by management investment companies to file reports with the Commission not later than 10 days after the transmission to stockholders of any report that is required to be transmitted to stockholders under Rule 30e-1 under the Investment Company Act of 1940 (17 CFR 270.30e-1). The Commission may use the information provided on Form N-CSR in its regulatory, disclosure review, inspection, and policymaking roles.
A registrant is required to disclose the information specified by Form N-CSR, and the Commission will make this information public. A registrant is not required to respond to the collection of information contained in Form N-CSR unless the Form displays a currently valid Office of Management and Budget (“OMB”) control number. Please direct comments concerning the accuracy of the information collection burden estimate and any suggestions for reducing the burden to Secretary, Securities and Exchange Commission, 100 F Street, NE, Washington, DC 20549. The OMB has reviewed this collection of information under the clearance requirements of 44 U.S.C. § 3507.
Item 1. Reports to Stockholders.
The Report to Shareholders is attached herewith.
New Alternatives Fund, Inc.
A SOCIALLY RESPONSIBLE MUTUAL FUND EMPHASIZING
ALTERNATIVE ENERGY AND THE ENVIRONMENT
ANNUAL
FINANCIAL REPORT
DECEMBER 31, 2012
This report is submitted for the general information of the shareholders of the Fund. It is not authorized for distribution unless preceded or accompanied by a prospectus for the Fund.
| | | | | | | | | | | | |
| THE FUND | | 150 Broadhollow Road | | Melville, New York 11747 | | | (800) 423-8383 | | | | (631) 423-7373 | |
| BNY Mellon Investment Servicing (US) Inc. | | PO Box 9794 | | Providence, RI 02940 | | | (800) 441-6580 | | | | (610) 382-7819 | |
| Overnight Address | | 4400 Computer Drive | | Westborough, MA 01581 | | | | | | | | |
| Foreside Funds Distributors LLC | | 400 Berwyn Park, 899 Cassat Road | | Berwyn, PA 19312 | | | | | | | | |
Recycled Paper
NEW ALTERNATIVES FUND, INC.
MANAGEMENT’S DISCUSSION OF FINANCIAL PERFORMANCE
FOR THE YEAR 2012
Fund Performance: The Fund’s share price increased 3.49% for the year ending December 31, 2012. The Net Asset Value (“NAV”) began at $35.82 on January 1 and closed on December 31 at $36.40 after payment of a $0.67 dividend per share. However, the Fund’s net assets declined during the year from $186.5 million at the beginning to approximately $149.8 million at the end due primarily to shareholder redemptions.
Factors Affecting the Fund: After several years of steady decline, the share prices of alternative energy and energy conservation companies have regained some value. Many of these companies are still priced far below earlier levels. The impact of climate change recently reflected by extraordinary heat waves, drought, and storms such as Hurricanes Irene and Sandy has still not translated into legislative action favorable to or investor enthusiasm for renewable energy and clean tech shares.
Fiscal austerity in Europe, the value of the Euro versus the U.S. dollar, and political headwinds in the U.S. seemed to keep the share prices of these companies depressed rather than the financial performance of the companies themselves. Most operating renewable power producers were profitable – reflecting the economic value of the equipment produced by the manufacturers whose share prices declined so sharply. The hardest hit firms were manufacturers of wind turbines and solar photovoltaic (PV) systems where there was excess capacity in world markets and serious competition from low cost countries such as China, India and Indonesia. The continuing strength of Chinese manufacturers, supported by the Chinese government, means competitors must achieve better technology, quality and creativity to challenge their growing market share.
Natural gas prices in the U.S. remained low by historical standards due mostly to a large supply of new shale gas. Prices did experience a modest increase toward the second half of the year. Cheap natural gas has made it the top alternative to coal, oil and even nuclear power, in a national economy slowly climbing out of recession. The current low gas price also makes it a more competitive power source than new wind or solar development. Its relatively lower carbon emission as an energy source has helped manufacturers, along with a lower level of general economic growth and activity, to slow the rate of increase in greenhouse gas emissions in the U.S.
There has been heated criticism of shale gas production and its potential negative environmental impact, particularly on water supply. It is not clear how sustainable low gas prices will continue to be in the U.S. According to some analysts the production of natural gas is not profitable at current prices and the development of new sources by hydraulic fracturing (“fracking”) may become more expensive as environmental regulations are developed. Already, public pressure has led most major companies to provide greater disclosure of their extraction practices, including the chemicals involved in their fracking compounds. Legislatures and regulatory authorities around the country are monitoring drilling practices more closely to assess adverse environmental effects and are considering stricter, and potentially more expensive, oversight.
1
We have kept most of our natural gas distribution utilities which provide price stability and reliable dividends. They also use their strong balance sheets to finance and participate in alternative energy and energy efficiency projects both in and outside of their service areas.
The economic crisis in the European market began stabilizing toward the end of the year. The value of the Euro gained strength against the U.S. dollar, which helps boost the share prices of our European companies. As of December 31, 2012, 40.1% of our portfolio was invested in European companies (with 25.9% priced in Euros and the remainder in other currencies). The rest of our holdings include 42.8% in U.S. based firms; 5.2% in Asia and 3.8% in Canada, and the remaining 8.1% in cash in U.S. banks and credit unions and other assets in excess of liabilities.
It remains to be seen whether President Obama’s re-election will yield more support for green energy development. Clearly this administration will be more favorable than the alternative would have been. One positive development at the very end of the year was the renewal of the production tax credit (PTC) for wind power projects. This policy, which helps subsidize wind farm construction, was due to expire on December 31. This situation discouraged developers from starting new projects. Unfortunately, it was only renewed for one additional year. Short term policies and supports are a continuing obstacle to alternative energy development. The major infrastructure changes needed for a clean energy future require extended commitments from government and private industry.
The conditions described above are real examples of some of the abstract “risk factors” that New Alternatives Fund and every other mutual fund lists in our required literature (see below). This discussion brings to life the actual events and their impact on the Fund’s performance.
Despite these recent improvements, the share price value of most renewable energy companies remains low. The capital losses that we’ve sustained over the last four years will prevent us from declaring capital gains distributions anytime soon. We’ve continued to build up the percentage of our portfolio that pays dividends. We are not trying to become an “income fund,” but realize the need to add to our returns as much as possible until the alternative energy sector makes a fuller recovery. This approach has allowed us to raise the ordinary dividend from $0.36 in 2010 to $0.42 in 2011 to just under $0.67 in 2012.
Portfolio Holdings and Changes:
New Investments in 2012: The last two years have not been kind to solar cell and module manufacturers. We trimmed our solar holdings early in 2011. Toward the end of that year, we thought the sector was showing some renewed strength. Our optimism turned out to be short-lived. First Solar struggled early on, still burdened by competition from cheaper silicon solar cells, issues of efficiency degradation of their panels and uncertain funding for several projects. We sold these shares early in 2012. Later we added shares of SunPower Corporation, a U.S. based PV solar system manufacturer and developer with more projects in progress. We are also hopeful that SunPower will do well in Japan, where it is involved in a joint venture with Toshiba as that country struggles to replace its major dependence on nuclear power with solar, wind, geothermal and other energy sources.
We added two Canadian independent power producers: Innergenix Renewable Energy, Inc. and Northland Power, Inc. Both companies own and operate wind, solar PV and hydro power facilities in Canada and, in keeping with our current focus, both companies pay regular dividends.
2
Other changes and adjustments in the Fund’s holdings that took place in 2012 are described below:
Alternate Energy:
Renewable Power Producers: The companies in this sector have been our steadiest group of holdings. Northland Power and Innergex Renewable Energy are the first new additions to this group in recent years. Our core group of Spanish firms: Abengoa SA (biomass, solar thermal, recycling and desalinization), Acciona SA (wind, small hydro, solar thermal generation; water treatment systems), EDP Renovaveis SA (wind and ocean power projects), and Elecnor SA (wind and solar projects; transmission facilities) were among the companies whose share prices have retreated the most during the last three years. This trend continued through the first six months of 2012. Austerity policies in Spain and other European countries reduced government support for alternative energy and contributed to low or no growth in electric power demand overall. Despite this, all of these companies started a recovery from earlier undervalued share prices. Starting from July 1, these companies made significant recoveries which contributed to the Fund’s improved performance for the year. In the last six months, Abengoa gained 17.36%; Acciona was up 24.9%; EDP Renovaveis rose 54.52% and Elecnor grew 3.99%.
Hafslund ASA (Norway-hydro power and district heating systems) and TrustPower Ltd. (New Zealand-wind and hydro power) are the two smaller long term holdings in this group. Hafslund also saw a downturn in its share price, although not as great as the Euro-denominated companies and ended up down 15.46% for the year. TrustPower was one of our stronger performers for 2012, finishing up just over 26%. Despite the depressed values most of these companies have experienced, they have all continued to pay dividends. EDP Renovaveis is the exception, having never paid a dividend.
In 2012 we trimmed our holdings of Acciona and EDP Renovaveis for diversification. We increased our shares of Abengoa, Algonquin Power, Innergex Renewable Energy and Northland Power. We maintained our holdings of Elecnor, Hafslund and TrustPower.
Wind: Wind turbine manufacturers, Vestas Wind Systems A/S (Denmark) and Gamesa Corporacion Tecnologica SA (Spain) have been particularly hard hit by austerity in Europe and an absence of financing for project developers. When the recession took hold both companies were in the midst of ambitious plans to expand their operations in the U.S. and China. Those opportunities quickly disappeared. Delays in proposed offshore transmission infrastructure in Europe, inadequate transmission lines in China and the unsure future of tax benefits in the U.S. cut deeply into these companies’ options for growth.
Gamesa and Vestas, along with project developers like Acciona and EDP Renovaveis, have adjusted to the present realities by shifting their focus for new development to Latin America, Africa, and other areas of Asia and, to a lesser extent, Eastern Europe. In a recent report, Gamesa noted that 47% of new revenue in 2012 came from Latin America versus 17% in 2011. Both Gamesa and Vestas have put new emphasis on seeking operation and maintenance contracts for existing wind facilities instead of relying solely on manufacturing and construction contracts. Vestas recently announced that it would be reopening part of a previously shut factory in Colorado to build wind turbine towers for other companies rather than only seeking orders for complete turbines.
3
While Gamesa and Vestas shares also joined the price rebound in the second half of 2012, they remained down 46.5% and 47.7% respectively for the year. We increased our Gamesa holdings slightly by taking a dividend in new shares and held our position in Vestas.
Solar: We remain enthusiastic about the development of utility scale concentrating solar power (CSP) plants. The advantage of CSP, also called solar thermal power, involves the capacity to store some of the energy generated and continue to provide power for more hours of the day. PV solar facilities do not have this ability as yet. The dramatic decline in the price of PV solar systems seems to have made CSP uncompetitive and there are fewer new CSP projects being started. Abengoa, Acciona and Elecnor all continue to operate existing CSP generating stations among their other clean tech operations.
PV solar manufacturers have seen their profit margins shrink from low module prices, along with continued pressure from inexpensive Chinese products. The price differentials are slowly closing as international pressure and internal dissent is forcing Chinese manufacturers to pay better wages, clean up their production processes, and improve working conditions and safety in their factories. Trade regulators in both the U.S. and Europe have responded to complaints from their domestic industries and human rights groups by initiating punitive tariffs on imported Chinese components. While lower prices have been bad news for PV solar manufacturers, it has been a positive development for solar installers. In fact, companies that focused primarily on manufacturing, like First Solar and SunPower, have increased the installation part of their businesses to expand their opportunities in a depressed economy.
In addition to adding SunPower back into the Fund, we added a small amount of shares to our holdings of Kyocera Corp. (Japan), a large diversified electronics company that also produces solar cells. It has held up better than the less diversified solar companies and is up 14.46% in 2012. We also hope that Kyocera, along with SunPower’s joint venture with Toshiba mentioned earlier, will pick up new business in Japan as that country seeks to restructure its energy system away from a heavy dependence on nuclear power. Added to the nuclear problems, Japan has also been forced to rely more heavily on natural gas, which is much more expensive than in the U.S., for electricity.
SMA Solar Technology AG (Germany), the largest manufacturer of inverters used in solar installations, is still suffering from cutbacks in solar development and funding in Germany and Western Europe. It was the worst performing stock in our portfolio, down 54.66% for the year. We held our small position in SMA in the belief that the company’s advantages of scale and technology will allow it to survive the “Euro zone” crisis and emerge in a strong position when PV solar development picks up again.
Geothermal: This continues to be a small sector (4.9% in 2012) of our portfolio. We have held the same two companies, Ormat Technologies and WFI Industries Ltd. (an American company listed on a Canadian exchange) for many years. Ormat is one of the largest geothermal development companies in the world, building and operating utility scale energy facilities in the U.S., Africa, Central America, Asia (including Australia and New Zealand), and Europe. WFI is a small company concentrating on a core business of residential and small commercial building heat pump/heat exchange systems.
4
Although geologists estimate that there is potential to develop geothermal energy in many places around the world, construction of new facilities has lagged in the last three years. Once again, inexpensive natural gas has made it a more competitive alternative to geothermal. While recent technology improvements have made it possible to generate electricity and provide heating and cooling systems from lower levels of geothermal sources, the peak areas for this energy have often been located where transmission facilities were inadequate or nonexistent. It remains a potential resource that is being overlooked in major alternative energy considerations.
We have found it necessary to sell off a good deal of Ormat stock to meet share redemptions. Ormat share prices, while well below historic highs, did recover over the course of the year, finishing up 6.9% in 2012. However the company has been plagued with operating difficulties at one of its main projects, the North Brawley plant in California. It has been forced to write off projected future earnings when it determined that the plant would only produce about 2/3rds of the contracted power output.
WFI continues to build its core business of residential and small commercial building heat pump/heat exchange systems. In July 2012, WFI signed a joint venture agreement with a Chinese manufacturer to expand its production of small commercial building systems in that country and enlarge its presence in the Asian market. We held our shares of WFI; its price was down 4.97% for the year.
Bio-Fuel: There has been increased activity in bio-fuel companies. A number of companies are developing new fuels based on proprietary blends, often referred to as “secret sauces.” We remain on the sidelines. We continue to be skeptical about the potential for organic matter and plant based fuels to economically replace oil and gas for transportation and power production. Abengoa has a division devoted to cellulosic ethanol development. The company has a production plant in Kansas and several pilot projects in Spain and Brazil. The continuing drought has severely reduced corn production in the U.S., which will lead to higher costs for ethanol production and exacerbate shortages already plaguing feed stocks for farm animals.
Energy Conservation: Our four companies in this area continue to be among our best performers in 2012. This group now comprises 21.3% of the Fund’s portfolio. These holdings include Schneider Electric SA, a large, diversified engineering and manufacturing firm; Johnson Controls, Inc., a developer of building energy management systems and batteries for hybrid cars; Owens Corning, Inc., producer of insulation materials; and Koninklijke Philips Electronics NV (Netherlands), a major manufacturer of energy efficient light bulbs and lighting systems. Schneider’s share value rose 39.1%; Owens Corning, 28.8%; and Philips Electronics 26.68%. Johnson Controls reversed direction in the last six months (up 10.79%), but ended the year down 1.79% overall.
5
Earlier predictions that the energy conservation sector would lead the clean energy “universe” seem to be only partly right at this time. The world’s sluggish progress out of the recession, continuation of austerity measures in Europe, along with the uncertainties of future U.S. policy during the election year kept money from flowing into badly needed upgrades of transmission systems and delayed introduction of new technologies that would help integrate renewable power sources into energy grids. The housing market in the U.S. improved slightly, but new commercial construction and upgrades of existing buildings stayed flat which served to depress Johnston Controls’ earnings. The slow adoption of electric vehicles (including hybrids) on a broader scale, competition from more efficient Asian manufacturers, and reliability issues all held back the results of car battery makers like Johnson Controls. Johnson Controls’ earnings were also impaired when the Chinese government claimed its battery factory in China was responsible for leaking lead and forced it to shut down.
Falling prices and improving energy efficiency is leading to a rapid growth in the market for LED light bulbs and lighting systems. Philips Electronics has maintained its position as one of the world’s largest and most innovative LED manufacturers. Most analysts are positive on Philips Electronics’ future earnings, along with a growing market for its healthcare technology.
However, we once again found it necessary to reduce our shares of Schneider Electric, Johnson Controls and Philips Electronics to balance our overall holdings and make cash available to meet shareholder redemptions.
Natural Gas Distribution: Four natural gas distribution and electric utility companies continued to make up 17.8% of the Fund’s holdings at the end of 2012. Earlier in the year, we divested Northwest Natural Gas Co. and bought shares of New Jersey Resources Corp. We continue to hold Atmos Energy Corp., South Jersey Industries, Inc. and WGL Holdings, Inc. These companies function as regulated utilities, which provides them with tax benefits and makes it possible for them to pay steady dividends far in excess of current U.S. Treasury bills and notes. Their high liquidity as stocks makes them a very reasonable alternative to holding excess cash in Treasury notes. Plus these companies are all involved in developing and financing renewable energy projects and helping to subsidize energy efficiency measures in their various service areas.
WGL Holdings, headquartered in the District of Columbia, maintains a Clean Steps division which develops solar projects on schools and other public buildings in the greater Washington area. It is also a part owner of a number of solar PV projects in California. Atmos Energy, which is based in Texas, serves over 3 million customers in six regions around the country. Their Power Systems division develops distributed generation (recycling excess heat for power) plants for municipal and industrial buildings.
6
New Jersey Resources and South Jersey Industries both serve areas of New Jersey which were devastated by Superstorm Sandy in 2012. While this catastrophic event served to depress these companies’ share price, both increased earnings and met dividend goals. Both companies were also cited for their admirable performance in the clean-up efforts and restoration of service to customers in the affected areas. South Jersey continued its program of providing low cost installation and maintenance of fuel efficient heating and cooling systems to residential and small commercial customers in its service areas. Its Energenic division develops landfill-gas powered on-site electric generators, distributed energy systems and small solar projects. New Jersey Resources sponsors a similar efficiency program, called the SAVEGREEN project, which provides rebates and subsidies to allow customers to purchase and install more efficient equipment and save money on energy costs. Through their NJR Clean Energy Ventures, New Jersey Resources operates 27.6 megawatts (MW) of wind power in the southern part of the state and also provides leases for residential customers to install solar electric systems on their homes without requiring upfront investment.
Water/Recycling: We sold our holdings of Aqua America to meet redemptions because its share price had reached what we felt was an unsustainable level. We also sold our shares of the Brazilian water company CIA Saneamento Basico early in the year due to our concerns about slowing economic growth in that country and a report that their system was plagued by unusually high rates of water leaks.
Our remaining water companies were among the best performing stocks. In addition to paying dividends, Veolia Environnement (France-water utility, waste water treatment) rose 10.77%; American Water Works Co., Inc. (water utility) was up 16.54%; Xylem, Inc. (water filtration and treatment equipment and services) up 5.49%; Hyflux Ltd. (Singapore-desalinization and water treatment) gained 13.98%; and A.O. Smith Corp. (energy efficient and solar water heaters; water pumps) was up 57.2% for the year.
Hyflux recovered well this year after experiencing a price drop in 2011 due to concerns about its exposure in several of the North African countries experiencing the “Arab Spring” events. Veolia’s performance has been somewhat uneven, although it has maintained a generous dividend. The company is reorganizing and divesting non-core businesses. The company has been the focus of criticism for a contract its transport division holds in the Palestinian territories on the West Bank area occupied by Israel. In 2012 it sold off its U.S. based waste water treatment division and it’s currently in the process of divesting its controversial transport division.
A.O. Smith’s dramatic share price increase followed its record earnings and growth reports for the year. The company has established a division in China which has allowed it to expand its market in both China and India while at the same time generating increased sales in its home market in the U.S. Its future prospects are strong, but we decided that its price was too high for now, so we sold off some shares. We also sold shares of American Water Works. We were able to increase our holdings of Veolia and Xylem during the year.
7
Natural Foods/Recycling: We sold Sims Metal Management (Australia-metal recycling) early in the year due to falling prices for metal. Abengoa maintains an industrial waste division that is heavily involved in aluminum and zinc recycling, along with other metals. Veolia has a major operation devoted to municipal waste separation and recycling. As part of its waste water treatment division, it is involved with dismantling decommissioned nuclear power plants. We have not replaced a natural/organic food related company since divesting our shares of Whole Foods in 2009. We are keeping five or six potential companies in sight.
Cash and Treasury Holdings: We ended the year with approximately 8.8% of net assets in cash. We owned no short-term U.S. Treasury Bills as interest rates were too low.
Income from Dividends and Interest: The Fund’s net income from dividends and interest decreased by a very small amount (0.2%), but due to the drop in our number of shares outstanding, the per share dividend increased from $0.42 in 2011 to $0.67 in 2012.
Expenses: The Fund’s cost of operations declined during 2012 as the number of shareholder accounts and the net assets decreased during the year. The amounts paid to the investment advisor, Accrued Equities Inc. (the “Advisor”), and Bank of New York Mellon (the Fund’s custodian), and its affiliate BNY Mellon Investment Servicing (U.S.), Inc. (the Fund’s accounting agent, transfer agent and administrator) are largely based on net assets. The Fund’s net assets declined gradually during the year. BNY Mellon, in its role as transfer agent, bases its fees on the number of shareholder accounts established during the year. While this figure decreased slightly, it was allocated across fewer outstanding shares which raised the Fund’s expense ratio from 1.03% in 2011 to 1.10% in 2012. Total Fund Expenses decreased during the year by $528,195 or 22.9%.
Risks: Investments in New Alternatives Fund continue to be subject to inherent risks. You may lose money by investing in the Fund. Other risks include, but are not limited to:
Market Risk. The value of the Fund’s investments will fluctuate as markets fluctuate and could decline over short- or long-term periods.
Concentration Risk. Under normal market conditions, at least 25% of the Fund’s total assets will be invested in equity securities of companies in the alternative energy industry. A downturn in this group of industries would have a larger impact on the Fund than on a fund that does not concentrate its investments.
New Technology Risk. The Fund may consider investments in new technologies intended to produce a clean and sustainable environment. New technologies may not be cost effective, and the investment adviser may select a new technology that is not successful. It is also possible that interest in achieving a clean and sustainable environment may diminish. The potential advantages of new technologies may be slow in both development and recognition.
Political Risk. Investments in Alternative Energy and companies with environmental products are subject to political priorities and changing government regulations and subsidies that may impact the value of their securities. There are also risks associated with a failure to enforce environmental law. For example, if the government reduces environmental regulation or its enforcement, companies that produce products designed to provide a clean environment, and in which the Fund invests, are less likely to prosper.
8
Foreign Company Risk. Investing in foreign securities (including depositary receipts traded on U.S. exchanges but representing shares of foreign companies) involves more risks than investing in U.S. securities. Risks of investing in foreign companies include currency exchange rates between foreign currencies and the U.S. dollar. The political, economic and social structures of some foreign countries may be less stable and more volatile than those in the U.S. Brokerage commissions and other fees may be higher for foreign securities. Foreign companies may not be subject to the same disclosure, accounting, auditing and financial reporting standards as U.S. companies. These risks can increase the potential for losses in the Fund and affect its share price.
Net Realized Capital Gains: The Fund did not have or distribute any net realized capital gains during 2012.
Corporate Governance and Regulatory: All seven of the Fund’s Directors (five of whom are considered “Independent”) were re-elected by shareholders at the annual meeting held on September 21, 2012. David Schoenwald will continue as President, Treasurer and Chairperson of the Board, and Sharon Reier as Vice-Chairperson. Murray Rosenblith, a director and an employee of the Advisor, was appointed as Secretary to replace Maurice Schoenwald who passed away in April 2012. Joseph Don Angelo continues to serve as the Fund’s Chief Compliance Officer. Preston Pumphrey continues to serve as Chairperson of the Audit Committee.
The Fund’s Directors approved the investment advisory agreement (the “Advisory Agreement”) with the Advisor, Accrued Equities Inc., at the Directors meeting on June 15, 2012. The Board of Directors decided to approve the renewal of the Advisory Agreement for a one-year period commencing July 1, 2012 based upon their evaluation of: (i) the long-term relationship between the Advisor and the Fund; (ii) the Advisor’s commitment to the Fund’s socially responsible investment objectives and its ability to manage the Fund’s portfolio in a manner consistent with those objectives; (iii) the depth of experience and expertise of the Advisor with regard to the alternative energy market; (iv) the nature, extent and quality of the services provided; (v) the performance of the Fund; and (vi) the costs of the services provided and the profitability of the Advisor from its relationship with the Fund. Information regarding the material factors the Board considered in approving the Advisory Agreement is included in the Semi-Annual Report to Shareholders dated June 30, 2012.
Beginning in 2012, all mutual funds are required to provide shareholders with cost basis information on their accounts. Shareholders have received a notice giving them the option to choose among several cost basis reporting options. The Fund’s default cost basis reporting option is FIFO (first-in, first-out) which means that the first Fund shares you purchase are the first Fund shares redeemed. There are other options for you to choose. This new rule applies only to Fund shares purchased in or after 2012. Shareholders will receive information about the cost basis of their shares starting with the 1099 forms for 2012.
9
New Alternatives Fund launched an on-line account access portal on our web site in the first half of 2011. Shareholders can now register their accounts and access share balance and transaction information, enter address changes and choose an “e-delivery” option for their statements and Fund documents. If you haven’t already done so, you can go to the Fund’s web site at www.newalternativesfund.com and click on the “Account Login” link to create your on-line access and select your document delivery options.
Strategy: The Fund’s investment objective remains unchanged. We continue to seek long-term capital appreciation. The Fund seeks to achieve its investment objective by investing in equity securities, such as common stocks. The Fund makes investments in a wide range of industries and in companies of all sizes. The Fund invests in equity securities of both U.S. and foreign companies, and has no limitation on the percentage of assets invested in the U.S. or abroad.
Under normal market conditions at least 25% of the Funds’ total assets will be invested in equity securities of companies in the alternative energy industry.
“Alternative Energy” means the production and conservation of energy in a manner that reduces pollution and harm to the environment, particularly when compared to conventional coal, oil or nuclear energy.
10
New Alternatives Fund Growth of $10,000 vs. The S&P 500® Index and The Russell 2000® Index
(Unaudited)
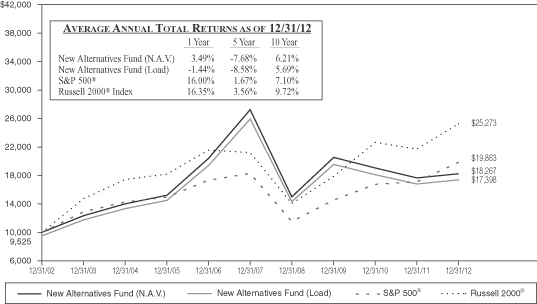
Performance quoted represents past performance and does not guarantee future results. Investment return and principal value will fluctuate so that shares, when redeemed, may be worth more or less than their original cost. Current performance may be lower or higher than that shown here. The performance quoted reflects a deduction for the maximum front-end sales charge of 4.75%. Returns include the reinvestment of distributions. Performance data current to the most recent month-end may be obtained by calling 800-423-8383. The graph and table do not reflect the deduction of taxes that a Shareholder would pay on fund distributions or the redemption of fund shares.
The Fund’s total annual operating expenses, as stated in the current prospectus are 1.03%*.
The S&P 500® and the Russell 2000® indices are unmanaged stock market indices and do not reflect any asset-based charges for investment management or transaction expenses. You cannot invest directly in these indices. Current and future portfolio holdings are subject to change and risk.
| * | Per prospectus. The expense ratio presented above may vary from the expense ratio presented in other sections of this report which is based on expenses incurred during the period covered by this report. |
11
NEW ALTERNATIVES FUND, INC.
FUND EXPENSE EXAMPLE
(Unaudited)
As a shareholder of the Fund, you incur two types of costs: (1) transaction costs such as the sales charge; and (2) ongoing costs, including management fees and other Fund expenses. This example is intended to help you understand your ongoing costs (in dollars) of investing in the Fund and to compare these costs with the ongoing costs of investing in other mutual funds.
The example is based on an investment of $1,000 invested at the beginning of the period shown (July 1, 2012) and held for the entire six months ended December 31, 2012.
Actual Expenses
The first line of the table below provides information about actual account values and actual expenses. You may use the information in this line, together with the amount you invested, to estimate the expense that you paid over the period. Simply divide your account value by $1,000 (for example, an $8,600 account value divided by $1,000 = 8.6), then multiply the result by the number in the first line under the heading entitled “Expenses Paid During Six Months Ended December 31, 2012” to estimate the expenses you paid on your account during this period.
Note: The Fund’s Transfer Agent, BNY Mellon Investment Servicing (US) Inc., charges an annual IRA maintenance fee of $15 for IRA accounts. That fee is not reflected in the accompanying table.
Hypothetical Example for Comparison Purposes
The second line of the table below provides information about hypothetical account values and hypothetical expenses based on the Fund’s actual expense ratio and an assumed rate of return of 5% per year before expenses, which is not the Fund’s actual return. The hypothetical account values and expenses may not be used to estimate the actual ending account balance or expenses you paid for the period. You may use this information to compare the ongoing costs of investing in the Fund and other funds. To do so, compare this 5% hypothetical example with the 5% hypothetical examples that appear in the shareholder reports of other funds.
Please note that the expenses shown in the table are meant to highlight your ongoing costs only and do not reflect any transactional costs such as the sales charge, redemption fees or exchange fees. The Fund does not charge any redemption fees or exchange fees, but these may be present in other funds to which you compare the Fund. Therefore, the second line of the table is useful in comparing ongoing costs only, and will not help you determine the relative total costs of owning different funds. In addition, if transactional costs were included, your costs would have been higher.
NEW ALTERNATIVES FUND, INC.
| | | | | | | | | | | | |
| | | Beginning
Account Value
July 1, 2012 | | | Ending Account Value
December 31, 2012 | | | Expenses Paid During
Six Months Ended
December 31, 2012* | |
| | | |
| Actual | | | $1,000.00 | | | | $1,124.70 | | | | $6.20 | |
Hypothetical (assumes 5% return before expenses) | | | $1,000.00 | | | | $1,019.30 | | | | $5.89 | |
* Expenses are equal to the Fund’s annualized expense ratio for the six-month period of 1.16%, multiplied by the average account value over the period, multiplied by the number of days (184) in the most recent fiscal half year, then divided by the days in the year (366) to reflect the half year period. The Fund’s ending account value on the first line in the table is based on its actual total return of 12.47% for the six-month period of July 1, 2012 to December 31, 2012.
12
NEW ALTERNATIVES FUND, INC.
SCHEDULE OF INVESTMENTS
December 31, 2012
(Unaudited)
| | | | | | | | |
Sector Diversification | | % of Net
Assets | | | Value | |
Alternate Energy: | | | | | | | | |
Renewable Energy Power Producers & Developers | | | 24.8 | % | | $ | 37,137,800 | |
Geothermal | | | 4.9 | | | | 7,427,425 | |
Wind Turbines | | | 4.2 | | | | 6,247,074 | |
Solar Photovoltaic | | | 2.9 | | | | 4,392,559 | |
Fuel Cells | | | 0.4 | | | | 550,200 | |
Energy Conservation | | | 21.3 | | | | 31,855,832 | |
Natural Gas Distribution Utilities | | | 17.8 | | | | 26,749,500 | |
Water: | | | | | | | | |
Water Utilities | | | 9.9 | | | | 14,770,000 | |
Water Related | | | 3.1 | | | | 4,714,336 | |
Electric Transmission | | | 2.6 | | | | 3,845,500 | |
Certificates of Deposit | | | 0.3 | | | | 500,000 | |
Other Assets in Excess of Liabilities | | | 7.8 | | | | 11,644,338 | |
| | | | | | | | |
| | | 100.0 | % | | $ | 149,834,564 | |
| | | | | | | | |
Top Ten Common Stock Portfolio Issuers
December 31, 2012
(Unaudited)
| | | | |
Name | | % of Net
Assets | |
Abengoa SA (Spain) | | | 5.8 | % |
Schneider Electric SA (France) | | | 5.6 | |
Koninklijke Philips Electronics NV (Netherlands) | | | 5.6 | |
Acciona SA (Spain) | | | 5.5 | |
EDP Renovaveis SA (Spain/Portugal) | | | 5.3 | |
Johnson Controls, Inc. | | | 5.1 | |
American Water Works Co., Inc. | | | 5.0 | |
Owens Corning, Inc. | | | 4.9 | |
Veolia Environnement SA (France) ADR | | | 4.9 | |
South Jersey Industries, Inc. | | | 4.9 | |
| | | | |
Total Top Ten | | | 52.6 | % |
| | | | |
Portfolio holdings are subject to change, risk and may not represent current compositions of the portfolio.
13
NEW ALTERNATIVES FUND, INC.
SCHEDULE OF INVESTMENTS
December 31, 2012
| | | | | | | | |
| | | Shares | | | Value | |
| COMMON STOCKS — 91.9% | | | | | | | | |
| Alternate Energy — 37.2% | | | | | | | | |
Renewable Energy Power Producers & Developers — 24.8% | | | | | | | | |
Abengoa SA (Spain) | | | 500,000 | | | $ | 1,596,792 | |
Abengoa SA — B Shares (Spain)* | | | 2,300,000 | | | | 7,104,013 | |
Acciona SA (Spain) | | | 110,000 | | | | 8,214,693 | |
Algonquin Power & Utilities Corp (Canada) | | | 200,000 | | | | 1,373,044 | |
EDP Renovaveis SA (Spain/Portugal)* | | | 1,500,000 | | | | 7,955,199 | |
Elecnor, SA (Spain) | | | 125,000 | | | | 1,562,500 | |
Hafslund ASA, Class A (Norway) | | | 328,074 | | | | 2,691,768 | |
Innergex Renewable Energy, Inc. (Canada) | | | 150,000 | | | | 1,556,985 | |
Northland Power, Inc. (Canada) | | | 85,000 | | | | 1,595,406 | |
TrustPower Ltd. (New Zealand) | | | 500,000 | | | | 3,487,400 | |
| | | | | | | | |
| | |
| | | | | | | 37,137,800 | |
| | | | | | | | |
Geothermal — 4.9% | | | | | | | | |
Ormat Technologies, Inc. | | | 325,000 | | | | 6,266,000 | |
WFI Industries Ltd. (Canada) | | | 80,000 | | | | 1,161,425 | |
| | | | | | | | |
| | |
| | | | | | | 7,427,425 | |
| | | | | | | | |
Wind Turbines — 4.2% | | | | | | | | |
Gamesa Corporacion Tecnologica SA (Spain) | | | 1,545,454 | | | | 3,428,752 | |
Vestas Wind Systems AS (Denmark)* | | | 500,000 | | | | 2,818,322 | |
| | | | | | | | |
| | |
| | | | | | | 6,247,074 | |
| | | | | | | | |
Solar Photovoltaic — 2.9% | | | | | | | | |
Kyocera Corp. (Japan) SP ADR | | | 35,000 | | | | 3,197,250 | |
SMA Solar Technology AG (Germany) | | | 25,000 | | | | 633,309 | |
SunPower Corp* | | | 100,000 | | | | 562,000 | |
| | | | | | | | |
| | |
| | | | | | | 4,392,559 | |
| | | | | | | | |
Fuel Cells — 0.4% | | | | | | | | |
FuelCell Energy, Inc.* | | | 600,000 | | | | 550,200 | |
| | | | | | | | |
| | | | | | | 550,200 | |
| | | | | | | | |
| Total Alternate Energy | | | | | | | 55,755,058 | |
| | | | | | | | |
The accompanying notes are an integral part of these financial statements.
14
NEW ALTERNATIVES FUND, INC.
SCHEDULE OF INVESTMENTS (Continued)
December 31, 2012
| | | | | | | | |
| | | Shares | | | Value | |
| Energy Conservation — 21.3% | | | | | | | | |
Johnson Controls, Inc. | | | 250,000 | | | $ | 7,675,000 | |
Koninklijke Philips Electronics NV (Netherlands) | | | 315,000 | | | | 8,360,100 | |
Owens Corning, Inc.* | | | 200,000 | | | | 7,398,000 | |
Schneider Electric SA (France) | | | 115,000 | | | | 8,422,732 | |
| | | | | | | | |
| | |
| | | | | | | 31,855,832 | |
| | | | | | | | |
| Natural Gas Distribution Utilities — 17.8% | | | | | | | | |
Atmos Energy Corp. | | | 150,000 | | | | 5,268,000 | |
New Jersey Resources Corp. | | | 175,000 | | | | 6,933,500 | |
South Jersey Industries, Inc. | | | 145,000 | | | | 7,297,850 | |
WGL Holdings, Inc. | | | 185,000 | | | | 7,250,150 | |
| | | | | | | | |
| | |
| | | | | | | 26,749,500 | |
| | | | | | | | |
| Water — 13.0% | | | | | | | | |
Water Utilities — 9.9% | | | | | | | | |
American Water Works Co., Inc. | | | 200,000 | | | | 7,426,000 | |
Veolia Environnement SA (France)ADR | | | 600,000 | | | | 7,344,000 | |
| | | | | | | | |
| | |
| | | | | | | 14,770,000 | |
| | | | | | | | |
Water Related — 3.1% | | | | | | | | |
A. O. Smith Corp. | | | 15,000 | | | | 946,050 | |
Hyflux Ltd. (Singapore) | | | 1,000,000 | | | | 1,058,286 | |
Xylem, Inc. | | | 100,000 | | | | 2,710,000 | |
| | | | | | | | |
| | |
| | | | | | | 4,714,336 | |
| | | | | | | | |
| Total Water | | | | | | | 19,484,336 | |
| | | | | | | | |
| Electric Transmission — 2.6% | | | | | | | | |
ITC Holdings Corp. | | | 50,000 | | | | 3,845,500 | |
| | | | | | | | |
| | |
| | | | | | | 3,845,500 | |
| | | | | | | | |
| Total Common Stocks (Cost $166,237,862) | | | | | | | 137,690,226 | |
| | | | | | | | |
The accompanying notes are an integral part of these financial statements.
15
NEW ALTERNATIVES FUND, INC.
SCHEDULE OF INVESTMENTS (Concluded)
December 31, 2012
| | | | | | | | |
| | | Par | | | Value | |
| CERTIFICATES OF DEPOSIT — 0.3% | | | | | | | | |
| Socially Concerned Banks — 0.3% | | | | | | | | |
Alternatives Federal Credit Union savings account 0.15% due 01/14/13 | | $ | 100,000 | | | $ | 100,000 | |
Carver Federal Savings Bank 0.24% due 12/22/13 | | | 100,000 | | | | 100,000 | |
People’s United Bank 0.35% due 12/02/13 | | | 100,000 | | | | 100,000 | |
Self-Help Credit Union 0.50% due 03/30/13 | | | 100,000 | | | | 100,000 | |
Urban Partnership Bank 0.50% due 12/28/13 | | | 100,000 | | | | 100,000 | |
| | | | | | | | |
| Total Certificates of Deposit (Cost $500,000) | | | | | | | 500,000 | |
| | | | | | | | |
| TOTAL INVESTMENTS (Cost $166,737,862) — 92.2% | | | | | | | 138,190,226 | |
Other Assets in Excess of Liabilities — 7.8% | | | | | | | 11,644,338 | |
| | | | | | | | |
| Net Assets — 100.0% | | | | | | $ | 149,834,564 | |
| | | | | | | | |
| * | Non-income producing security |
| ADR | -American Depositary Receipts |
| SP ADR | -Sponsored American Depositary Receipts |
The accompanying notes are an integral part of these financial statements.
16
NEW ALTERNATIVES FUND, INC.
STATEMENT OF ASSETS AND LIABILITIES
December 31, 2012
| | | | |
ASSETS | |
Investment securities at fair value (cost: $166,737,862) (Notes 2A and 7) | | $ | 138,190,226 | |
Cash | | | 12,731,017 | |
| |
Receivables: | | | | |
Investments sold | | | 473,614 | |
Capital stock subscribed | | | 248,870 | |
Dividends | | | 44,958 | |
Tax reclaims | | | 31,680 | |
Interest | | | 553 | |
Prepaid insurance and registration | | | 27,810 | |
| | | | |
Total Assets | | | 151,748,728 | |
| | | | |
LIABILITIES | |
| |
Payables: | | | | |
Capital stock reacquired | | | 509,264 | |
Distributions | | | 538,758 | |
Investments purchased | | | 607,881 | |
Management fees | | | 69,509 | |
Transfer agent fees | | | 56,628 | |
Postage and printing fees | | | 26,873 | |
Accrued expenses and other liabilities | | | 105,251 | |
| | | | |
Total Liabilities | | | 1,914,164 | |
| | | | |
| Net Assets | | $ | 149,834,564 | |
| | | | |
ANALYSIS OF NET ASSETS | |
Net capital paid in shares of capital stock | | $ | 203,235,978 | |
Par Value (Note 3) | | | 41,166 | |
Undistributed net investment income | | | 1,314 | |
Accumulated net realized loss on investments and foreign currency transactions | | | (24,895,271 | ) |
Net unrealized depreciation on investments | | | (28,547,636 | ) |
Net unrealized depreciation of translation of other assets and liabilities in foreign currency | | | (987 | ) |
| | | | |
| Net Assets | | $ | 149,834,564 | |
| | | | |
| Net asset value and redemption price per share ($149,834,564/4,116,641) shares of outstanding capital stock, 40 million shares authorized with a par value of $0.01 per share) | | $ | 36.40 | |
| | | | |
| Maximum offering price per share (100/95.25 of $36.40) | | $ | 38.22 | |
| | | | |
The accompanying notes are an integral part of these financial statements.
17
NEW ALTERNATIVES FUND, INC.
STATEMENT OF OPERATIONS
For the Year Ended December 31, 2012
| | | | |
| Investment Income: | | | | |
Dividends (net of $517,271 foreign taxes withheld) | | $ | 4,489,960 | |
Interest | | | 2,210 | |
| | | | |
Total Investment Income | | | 4,492,170 | |
| | | | |
| |
| Expenses: | | | | |
Management fee (Note 4) | | | 873,703 | |
Transfer agent fees | | | 385,070 | |
Administration and accounting fees | | | 207,258 | |
Legal fees | | | 58,350 | |
Custodian fees | | | 55,610 | |
Postage and printing fees | | | 49,164 | |
Registration fees | | | 42,939 | |
Compliance service fees | | | 42,000 | |
Directors’ fees (Note 5) | | | 20,000 | |
Audit fees | | | 18,500 | |
Insurance fees | | | 11,874 | |
Other expenses | | | 11,728 | |
| | | | |
Total Expenses | | | 1,776,196 | |
| | | | |
| Net Investment Income | | | 2,715,974 | |
| | | | |
| |
| Net Realized and Unrealized Gain/(Loss) from Investments and Foreign Currency Related Transactions: | | | | |
| |
| Realized Gain/(Loss) from Investments and Foreign Currency Related Transactions (Notes 2B & 6): | | | | |
Net realized gain from investments | | | 1,279,756 | |
Net realized loss from foreign currency transactions | | | (3,128 | ) |
| | | | |
Net Realized Gain | | | 1,276,628 | |
| | | | |
| |
| Net Change in Unrealized Appreciation/(Depreciation) of Investments and Foreign Currency Related Transactions: | | | | |
Net change in unrealized appreciation/(depreciation) on investments | | | (135,382 | ) |
Net change in unrealized appreciation/(depreciation) on foreign currency translations | | | 2,145 | |
| | | | |
Net change in unrealized appreciation/(depreciation) | | | (133,237 | ) |
| | | | |
Net Realized and Unrealized Gain on Investments and Foreign Currency Related Transactions | | | 1,143,391 | |
| | | | |
| Net Increase in Net Assets Resulting from Operations | | $ | 3,859,365 | |
| | | | |
The accompanying notes are an integral part of these financial statements.
18
NEW ALTERNATIVES FUND, INC.
STATEMENTS OF CHANGES IN NET ASSETS
| | | | | | | | |
| | | For the
Year Ended
December 31, 2012 | | | For the
Year Ended
December 31, 2011 | |
| Investment Activities: | | | | | | | | |
| | |
Net investment income | | $ | 2,715,974 | | | $ | 2,197,034 | |
Net realized gain/(loss) from investments and foreign currency transactions | | | 1,276,628 | | | | (1,163,841 | ) |
Net change in unrealized appreciation/(depreciation) on investments and foreign currency translations | | | (133,237 | ) | | | (15,841,814 | ) |
| | | | | | | | |
Net increase (decrease) in net assets derived from operations | | | 3,859,365 | | | | (14,808,621 | ) |
| | | | | | | | |
| | |
| Dividends to Shareholders: | | | | | | | | |
Dividends from net investment income | | | (2,712,887 | ) | | | (2,187,989 | ) |
| | | | | | | | |
Total dividends to shareholders | | | (2,712,887 | ) | | | (2,187,989 | ) |
| | | | | | | | |
| | |
| Capital Share Transactions: | | | | | | | | |
Net decrease in net assets from capital share transactions (Note 3) | | | (37,865,948 | ) | | | (33,145,677 | ) |
| | | | | | | | |
| Total Decrease in Net Assets | | | (36,719,470 | ) | | | (50,142,287 | ) |
| | |
| Net Assets: | | | | | | | | |
Beginning of the year | | | 186,554,034 | | | | 236,696,321 | |
| | | | | | | | |
End of the year* | | $ | 149,834,564 | | | $ | 186,554,034 | |
| | | | | | | | |
| * | Includes undistributed net investment income of $1,314 and $1,355 for the years ended 12/31/12 and 12/31/11, respectively. |
The accompanying notes are an integral part of these financial statements.
19
NEW ALTERNATIVES FUND, INC.
FINANCIAL HIGHLIGHTS
STATEMENT OF PER SHARE INCOME AND CAPITAL CHANGES
For a share of capital stock outstanding throughout each year
| | | | | | | | | | | | | | | | | | | | |
| | | For the Years Ended December 31, | |
| | | 2012 | | | 2011 | | | 2010 | | | 2009 | | | 2008 | |
Net asset value at beginning of year | | $ | 35.82 | | | $ | 39.09 | | | $ | 42.54 | | | $ | 31.41 | | | $ | 57.28 | |
| | | | | | | | | | | | | | | | | | | | |
Investment Operations | | | | | | | | | | | | | | | | | | | | |
Net investment income | | | 0.67 | | | | 0.42 | | | | 0.35 | | | | 0.36 | | | | 0.24 | |
| Net realized and unrealized gain/(loss) on investments and foreign currency related transactions | | | 0.58 | | | | (3.27 | ) | | | (3.45 | ) | | | 11.14 | | | | (25.93 | ) |
Payments by affiliates | | | — | | | | — | | | | 0.01 | | | | — | | | | — | |
| | | | | | | | | | | | | | | | | | | | |
Total from investment operations | | | 1.25 | | | | (2.85 | ) | | | (3.09 | ) | | | 11.50 | | | | (25.69 | ) |
| | | | | | | | | | | | | | | | | | | | |
Distributions | | | | | | | | | | | | | | | | | | | | |
From net investment income | | | (0.67 | ) | | | (0.42 | ) | | | (0.36 | ) | | | (0.37 | ) | | | (0.18 | ) |
| | | | | | | | | | | | | | | | | | | | |
Total distributions | | | (0.67 | ) | | | (0.42 | ) | | | (0.36 | ) | | | (0.37 | ) | | | (0.18 | ) |
| | | | | | | | | | | | | | | | | | | | |
Net asset value at end of year | | $ | 36.40 | | | $ | 35.82 | | | $ | 39.09 | | | $ | 42.54 | | | $ | 31.41 | |
| | | | | | | | | | | | | | | | | | | | |
Total return
(Sales load not reflected) | | | 3.49% | | | | (7.28)% | | | | (7.26)%* | | | | 36.61% | | | | (44.85)% | |
Net assets, end of the year
(in thousands) | | $ | 149,835 | | | | $186,554 | | | | $236,696 | | | | $282,805 | | | | $184,257 | |
| Ratio of operating expenses to average net assets | | | 1.10% | | | | 1.03% | | | | 1.04% | | | | 1.02% | | | | 1.09% | |
| Ratio of net investment income to average net assets | | | 1.69% | | | | 0.98% | | | | 0.86% | | | | 1.06% | | | | 0.56% | |
Portfolio turnover | | | 22.05% | | | | 21.44% | | | | 16.16% | | | | 33.94% | | | | 25.67% | |
Number of shares outstanding at end
of the year | | | 4,116,641 | | | | 5,208,518 | | | | 6,055,618 | | | | 6,647,611 | | | | 5,866,871 | |
| | * | In 2010, 0.02% of the Fund’s total return consisted of a voluntary reimbursement by the investment advisor for a realized investment loss. Excluding this voluntary reimbursement, total return for the year would have been (7.28)%. |
The accompanying notes are an integral part of these financial statements.
20
NEW ALTERNATIVES FUND, INC.
NOTES TO FINANCIAL STATEMENTS
December 31, 2012
1) ORGANIZATION – New Alternatives Fund, Inc. (the “Fund”) was incorporated under the laws of the State of New York on January 17, 1978 and is registered under the Investment Company Act of 1940, as amended (the “1940 Act”), as an open-end management investment company. The Fund commenced operations on September 3, 1982. The investment objective of the Fund is long-term capital appreciation. The Fund seeks to achieve its investment objective by investing in equity securities, such as common stocks. The Fund makes investments in a wide range of industries and in companies of all sizes. The Fund invests in equity securities of both U.S. and foreign companies, and has no limitation on the percentage of assets invested in the U.S. or abroad. Under normal market conditions, at least 25% of the Fund’s of its total assets will be invested in equity securities of companies in the alternative energy industry which have an interest in alternative energy. “Alternative Energy” means the production and conservation of energy in a manner that reduces pollution and harm to the environment, particularly when compared to conventional coal, oil or nuclear energy.
2) ACCOUNTING POLICIES – The following is a summary of significant accounting policies followed by the Fund.
A. PORTFOLIO VALUATION – The Fund’s net asset value (“NAV”) is calculated once daily at the close of regular trading hours on the New York Stock Exchange (“NYSE”) (generally 4:00 p.m. Eastern time) on each day the NYSE is open. Securities held by the Fund are valued based on the official closing price or the last reported sale price on a national securities exchange or on the National Association of Securities Dealers Automatic Quotation System (“NASDAQ”) market system where they are primarily traded, as of the close of business on the day the securities are being valued. That is normally 4:00 p.m. Eastern time. If there were no sales on that day or the securities are traded on other over-the-counter markets, the mean of the last bid and asked prices prior to the market close is used. Short-term debt securities having a remaining maturity of 60 days or less are amortized based on their cost.
Non-U.S. equity securities are valued based on their most recent closing market prices on their primary market and are translated from the local currency into U.S. dollars using current exchange rates on the day of valuation.
If the market price of a security held by the Fund is unavailable at the time the Fund prices its shares at 4:00 p.m. Eastern time, the Fund will use the “fair value” of such security as determined in good faith by Accrued Equities, Inc. the Fund’s investment advisor under methods established by and under the general supervision of the Fund’s Board of Directors. The Fund may use fair value pricing if the value of a security it holds has been materially affected by events occurring before the Fund’s pricing time but after
21
the close of the primary markets or exchange on which the security is traded. This most commonly occurs with foreign securities, but may occur in other cases as well. Certain foreign securities are fair valued by utilizing an external pricing service in the event of any significant market movements between the time the Fund valued such foreign securities and the earlier closing of foreign markets. The Fund does not invest in unlisted securities.
The inputs and valuations techniques used to measure fair value of the Fund’s net assets are summarized into three levels as described in the hierarchy below:
| | • Level 1 – | Unadjusted quoted prices in active markets for identical assets or liabilities that the Fund has the ability to access. |
| | • Level 2 – | Observable inputs other than quoted prices included in Level 1 that are observable for the asset or liability, either directly or indirectly. These inputs may include quoted prices for the identical instrument on an inactive market, prices for similar instruments, interest rates, prepayment speeds, credit risk, yield curves, default rates and similar data. |
| | • Level 3 – | Unobservable inputs for the asset or liability, to the extent relevant observable inputs are not available, representing the Fund’s own assumptions about the assumptions a market participant would use in valuing the asset or liability, and would be based on the best information available. |
The inputs or methodology used for valuing securities are not necessarily an indication of the risk associated with investing in those securities.
The following is a summary of the inputs used, as of December 31, 2012, in valuing the Fund’s assets carried at fair value:
| | | | | | | | | | | | | | | | |
| | | Total
Value at
12/31/2012 | | | Level 1 –
Quoted
Price | | | Level 2 –
Significant
Observable
Inputs | | | Level 3 –
Significant
Unobservable
Inputs | |
| Common Stocks | | | | | | | | | | | | | | | | |
Alternate Energy | | | | | | | | | | | | | | | | |
Renewable Energy Power Producers & Developers | | $ | 37,137,800 | | | $ | 16,679,348 | | | $ | 20,458,452 | | | $ | — | |
Geothermal | | | 7,427,425 | | | | 7,427,425 | �� | | | — | | | | — | |
Wind Turbines | | | 6,247,074 | | | | — | | | | 6,247,074 | | | | — | |
Solar Photovoltaic | | | 4,392,559 | | | | 3,759,250 | | | | 633,309 | | | | — | |
Fuel Cells | | | 550,200 | | | | 550,200 | | | | — | | | | — | |
Energy Conservation | | | 31,855,832 | | | | 23,433,100 | | | | 8,422,732 | | | | — | |
Natural Gas Distribution Utilities | | | 26,749,500 | | | | 26,749,500 | | | | — | | | | — | |
22
| | | | | | | | | | | | | | | | |
| | | Total
Value at
12/31/2012 | | | Level 1 –
Quoted
Price | | | Level 2 –
Significant
Observable
Inputs | | | Level 3 –
Significant
Unobservable
Inputs | |
Water | | | | | | | | | | | | | | | | |
Water Utilities | | $ | 14,770,000 | | | $ | 14,770,000 | | | $ | — | | | $ | — | |
Water Related | | | 4,714,336 | | | | 3,656,050 | | | | 1,058,286 | | | | — | |
Electric Transmission | | | 3,845,500 | | | | 3,845,500 | | | | — | | | | — | |
| | | | | | | | | | | | | | | | |
Total Common Stocks | | | 137,690,226 | | | | 100,870,373 | | | | 36,819,853 | | | | — | |
Certificates of Deposit | | | 500,000 | | | | — | | | | 500,000 | | | | — | |
| | | | | | | | | | | | | | | | |
Total | | $ | 138,190,226 | | | $ | 100,870,373 | | | $ | 37,319,853 | | | $ | — | |
| | | | | | | | | | | | | | | | |
At the end of each calendar quarter, management evaluates the classification of Levels 1, 2 and 3 assets and liabilities. Various factors are considered, such as changes in liquidity from the prior reporting period; whether or not a broker is willing to execute at the quoted price; the depth and consistency of prices from third party pricing services; and the existence of contemporaneous, observable trades in the market. Additionally, management evaluates the classification of Level 1 and Level 2 assets and liabilities on a quarterly basis for changes in listings or delistings on national exchanges.
Due to the inherent uncertainty of determining the fair value of investments that do not have a readily available market value, the fair value of the Fund’s investments may fluctuate from period to period. Additionally, the fair value of investments may differ significantly from the values that would have been used had a readily available market existed for such investments and may differ materially from the values the Fund may ultimately realize. Further, such investments may be subject to legal and other restrictions on resale or otherwise less liquid than publicly traded securities.
For the period January 1, 2012 through December 31, 2012, the Fund had transferred securities from Level 1 into Level 2. The Fund utilizes an external pricing service to fair value certain foreign securities in the event of any significant market movements between the time the Fund valued certain foreign securities and the earlier closing of foreign markets. Such fair valuations are categorized as Level 2 in the hierarchy. Significant market movements were deemed to have occurred at December 31, 2012, and therefore, the Fund utilized the external pricing service model adjustments. As a result, for the period January 1, 2012 through December 31, 2012, there were transfers between Level 1 and Level 2 in the amount of $36,819,853.
23
B. FOREIGN CURRENCY TRANSLATION – Investment securities and other assets and liabilities denominated in foreign currencies are translated into U.S. dollar amounts at the date of valuation. Purchases and sales of investment securities and income and expense items denominated in foreign currencies are translated into U.S. dollar amounts on the respective dates of such transactions. If foreign currency translations are not available, the foreign exchange rate(s) will be valued at fair market value using procedures approved by the Fund’s Board of Directors.
The Fund does not isolate that portion of the results of operations resulting from changes in foreign exchange rates on investments from the fluctuations arising from changes in market prices of securities held. Such fluctuations are included with the net realized and unrealized gain or loss from investments.
Reported net realized foreign exchange gains or losses arise from sales of foreign currencies, currency gains or losses realized between the trade and settlement dates on securities transactions, and the difference between the amounts of dividends, interest, and foreign withholding taxes recorded on the Fund’s books and the U.S. dollar equivalent of the amounts actually received or paid.
Foreign Securities – Investing in foreign securities (including depositary receipts traded on U.S. exchanges but representing shares of foreign companies) involves more risks than investing in U.S. securities. Risks of investing in foreign companies include currency exchange rates between foreign currencies and the U.S. dollar. The political, economic and social structures of some foreign countries may be less stable and more volatile than those in the U.S. Brokerage commissions and other fees may be higher for foreign securities. Foreign companies may not be subject to the same disclosure, accounting, auditing and financial reporting standards as U.S. companies. These risks can increase the potential for losses in the Fund and affect its share price.
C. SECURITY TRANSACTIONS AND RELATED INVESTMENT INCOME – Security transactions are accounted for on the trade date (date order to buy or sell is executed). The cost of investments sold is determined by use of a first in, first out basis for both financial reporting and income tax purposes in determining realized gains and losses on investments.
D. INVESTMENT INCOME AND EXPENSE RECOGNITION – Dividend income is recorded as of the ex-dividend date. Foreign dividend income is recorded on the ex-dividend date or as soon as possible after the Fund determines the existence of a dividend declaration after exercising reasonable diligence. Interest income, including amortization/accretion of premium and discount, is accrued daily. Expenses are accrued on a daily basis.
24
E. DIVIDENDS AND DISTRIBUTIONS TO SHAREHOLDERS – Dividends from net investment income and distributions from net realized capital gains, if any, will be declared and paid at least annually to shareholders and recorded on ex-date. Income dividends and capital gain distributions are determined in accordance with U.S. federal income tax regulations which may differ from accounting principles generally accepted in the United States of America.
F. U.S. TAX STATUS – No provision is made for U.S. income taxes as it is the Fund’s intention to qualify for and elect the tax treatment applicable to regulated investment companies under Subchapter M of the Internal Revenue Code of 1986, as amended, and make the requisite distributions to its shareholders which will be sufficient to relieve it from U.S. income and excise taxes.
G. USE OF ESTIMATES IN THE PREPARATION OF FINANCIAL STATEMENTS –The preparation of financial statements in conformity with accounting principles generally accepted in the United States of America requires management to make estimates and assumptions that affect the reported amounts of assets and liabilities and disclosure of contingent assets and liabilities at the date of the financial statements and the reported amounts of revenue and expenses during the reporting period. Actual results could differ from those estimates.
H. OTHER – In the normal course of business, the Fund may enter into contracts that provide general indemnifications. The Fund’s maximum exposure under these arrangements is dependent on claims that may be made against the Fund in the future, and therefore, cannot be estimated; however, based on experience, the risk of material loss for such claims is considered remote.
3) CAPITAL STOCK – There are 40,000,000 shares of $0.01 par value capital stock authorized. On December 31, 2012 there were 4,116,641 shares outstanding. Aggregate paid-in capital including reinvestment of dividends was $203,277,144. Transactions in capital stock were as follows:
��
| | | | | | | | | | | | | | | | |
| | | For the Year Ended December 31, 2012 | | | For the Year Ended
December 31, 2011 | |
| | | Shares | | | Amount | | | Shares | | | Amount | |
Capital stock sold | | | 159,927 | | | $ | 5,626,920 | | | | 442,464 | | | $ | 18,128,567 | |
Reinvestment of distributions | | | 59,732 | | | | 2,174,247 | | | | 47,195 | | | | 1,690,663 | |
Redemptions | | | (1,311,536 | ) | | | (45,667,115 | ) | | | (1,336,759 | ) | | | (52,964,907 | ) |
| | | | | | | | | | | | | | | | |
Net Decrease | | | (1,091,877 | ) | | $ | (37,865,948 | ) | | | (847,100 | ) | | $ | (33,145,677 | ) |
| | | | | | | | | | | | | | | | |
4) MANAGEMENT FEE AND OTHER TRANSACTIONS WITH AFFILIATES – Accrued Equities, Inc. (“Accrued Equities” or the “Advisor”), an SEC registered investment advisor and broker-dealer, serves as investment advisor to the Fund pursuant to an Investment Advisory
25
Agreement, as amended, and as an underwriter (but not a principal underwriter) of the Fund’s shares pursuant to a Sub-Distribution Agreement. For it’s investment advisory services, the Fund pays Accrued Equities an annual management fee of 1.00% of the first $10 million of average net assets; 0.75% of the next $20 million of average net assets; 0.50% of average net assets more than $30 million and less than $100 million; and 0.45% of average net assets more than $100 million.
The Fund pays no remuneration to its directors, David J. Schoenwald and Murray D. Rosenblith, who are also officers or employees of Accrued Equities. On March 31, 2012, BNY Mellon Distributors LLC, the Fund’s principal underwriter, was sold to Foreside Distributors, LLC. Upon the closing of the transaction, BNY Mellon Distributors LLC became an indirect, wholly owned subsidiary of Foreside Financial Group, LLC and was renamed Foreside Funds Distributors LLC (“Foreside” or the “Underwriter”) effective April 1, 2012. Foreside serves as the principal underwriter of the Fund pursuant to an Underwriting Agreement for the limited purpose of acting as statutory underwriter to facilitate the distribution of shares of the Fund. The Underwriter has entered into a Sub-Distribution Agreement with Accrued Equities. The Underwriter receives as compensation for its services: (i) a base underwriting fee of $25,000 per year; (ii) a compliance systems fee of $2,500; and (iii) commissions on the sale of Fund shares. The Fund charges a maximum front-end sales charge of 4.75% on most new sales. Of this amount, the Underwriter and Accrued Equities retain the net underwriter commission and pay out the remaining sales commission to other brokers who actually sell new shares. Their share of the sales commission may vary. The aggregate underwriter concession on all sales of Fund shares during the year ended December 31, 2012 was $12,938, and the amounts retained by Accrued Equities and the Underwriter were $8,625, and $4,313, respectively. The Underwriter and Accrued Equities are also entitled to receive sales commissions for the sale of Fund shares. For the year ended December 31, 2012, Accrued Equities and the Underwriter received $24,247 and $3,097 in sales commissions, respectively, for the sale of Fund shares. Prior to April 1, 2012, the Underwriter was affiliated with BNY Mellon Investment Servicing (US) Inc., the Fund’s administrator, transfer agent and fund accounting agent.
5) DIRECTORS’ FEES – For the year ended December 31, 2012, the Fund paid directors’ fees of $20,000 to its Directors who are not “interested persons” of the Fund, as that term is defined in the 1940 Act (the “Independent Directors”).
Each Independent Director receives an annual fee of $3,500 for their services as Independent Directors of the Fund. As Vice-Chairperson of the Fund’s Board of Directors, Sharon Reier receives an additional annual fee of $1,000. Each member of the Audit Committee receives an additional $500 annual fee and Preston V. Pumphrey, Chairperson of the Audit Committee, receives an additional annual fee of $500. The Independent Directors also receive reimbursement of “coach” travel expenses to attend Board Meetings. The Directors and Officers of the Fund who are officers and employees of the Advisor do not receive compensation from the Fund for their services and are paid for their services by the Advisor. The Fund’s Chief Compliance Officer is not an officer or employee of the Advisor and is compensated directly by the Fund for his services.
26
6) PURCHASES AND SALES OF SECURITIES – For the year ended December 31, 2012, the aggregate cost of securities purchased totaled $33,318,326. Net realized gains (losses) were computed on a first in, first out basis. The proceeds received on sales of securities for the year ended December 31, 2012 was $74,802,050.
7) FEDERAL INCOME TAX INFORMATION – At December 31, 2012, the federal tax basis cost and aggregate gross unrealized appreciation and depreciation of securities held by the Fund were as follows:
| | | | |
Cost of investments for tax purposes | | $ | 166,944,156 | |
| | | | |
Unrealized appreciation for tax purposes | | $ | 19,620,960 | |
Unrealized depreciation for tax purposes | | | (48,374,890 | ) |
| | | | |
Net unrealized depreciation on investments | | $ | (28,753,930 | ) |
| | | | |
The tax character of distributions paid during 2012 and 2011 was as follows:
| | | | | | | | |
| Distribution paid from: | | 2012 | | | 2011 | |
Ordinary Income | | $ | 2,712,887 | | | $ | 2,187,989 | |
| | | | | | | | |
| | $ | 2,712,887 | | | $ | 2,187,989 | |
| | | | | | | | |
For federal income tax purposes, distributions from net investment income and short-term capital gains are treated as ordinary income dividends.
The following permanent differences as of December 31, 2012, attributable to transactions involving foreign securities and currencies were reclassified to the following accounts:
| | | | |
Accumulated Net Realized Loss | | $ | 3,128 | |
Undistributed Net Investment Income | | | (3,128 | ) |
As of December 31, 2012, the components of distributable earnings on a tax basis were as follows:
| | | | |
Undistributed Ordinary Income | | $ | 1,314 | |
Capital Loss Carryforward | | | (24,688,977 | ) |
**Net Unrealized Depreciation on
Investments and Foreign Currency Translations | | | (28,754,917 | ) |
| | | | |
| | $ | (53,442,580 | ) |
| | | | |
| ** | The primary difference between distributable earnings on a book and tax basis is due to wash sales losses. |
The Fund has a capital loss carryforward of $24,688,977 which can be used to offset future capital gains. If not utilized against future capital gains, $15,782,057 of this capital loss carryforward will
27
expire on December 31, 2016 and $8,395,118 will expire on December 31, 2017. $511,802 of this capital loss carryforward is a long-term loss and will not be subject to expiration, as under the recently enacted Regulated Investment Company Modification Act of 2010, capital losses incurred by the Fund after December 31, 2010 will not be subject to expiration. Such losses must be used to offset future capital gains realized prior to losses incurred in the years preceding enactment. Additionally, post-enactment capital losses that are carried forward will retain their character as either short-term or long-term capital losses rather than being considered all short-term as under previous law.
Management has analyzed the Fund’s tax positions taken on federal income tax returns for all open tax years (current and prior three tax years), and has concluded that no provision for federal income tax is required in the Fund’s financial statements. The Fund’s federal and state income and federal excise tax returns for tax years for which the applicable statutes of limitations have not expired are subject to examination by the Internal Revenue Service and state departments of revenue.
8) SUBSEQUENT EVENTS – Management has evaluated the impact of all subsequent events on the Fund through the date the financial statements were available to be issued, and has determined that there were no subsequent events.
28

REPORT OF INDEPENDENT REGISTERED PUBLIC ACCOUNTING FIRM
To the Shareholders and Board of Directors of
New Alternatives Fund, Inc.
We have audited the accompanying statement of assets and liabilities of New Alternatives Fund, Inc., including the schedule of investments, as of December 31, 2012, and the related statement of operations for the year then ended, the statements of changes in net assets for each of the two years in the period then ended, and the financial highlights for each of the five years in the period then ended. These financial statements and financial highlights are the responsibility of the Fund’s management. Our responsibility is to express an opinion on these financial statements and financial highlights based on our audits.
We conducted our audits in accordance with the standards of the Public Company Accounting Oversight Board (United States). Those standards require that we plan and perform the audits to obtain reasonable assurance about whether the financial statements and financial highlights are free of material misstatement. An audit includes examining, on a test basis, evidence supporting the amounts and disclosures in the financial statements. Our procedures included confirmation of securities owned as of December 31, 2012 by correspondence with the custodian and brokers. An audit also includes assessing the accounting principles used and significant estimates made by management, as well as evaluating the overall financial statement presentation. We believe that our audits provide a reasonable basis for our opinion.
In our opinion, the financial statements and financial highlights referred to above present fairly, in all material respects, the financial position of New Alternatives Fund, Inc. as of December 31, 2012, the results of its operations for the year then ended, the changes in its net assets for each of the two years in the period then ended, and the financial highlights for each of the five years in the period then ended, in conformity with accounting principles generally accepted in the United States of America.

BBD, LLP
Philadelphia, Pennsylvania
February 22, 2013
29
OTHER INFORMATION
(Unaudited)
1) PROXY VOTING – The Fund has proxy voting policies which are available: (1) without charge, upon request by calling the Fund at 800-423-8383 and (2) on the SEC’s website at http://www.sec.gov. Information regarding how the Fund voted proxies during the most recent twelve-month period ended June 30 is available on form N-PX: (1) without charge, upon request, by calling the Fund at 800-423-8383 and (2) on the SEC’s website at http://www.sec.gov.
2) QUARTERLY PORTFOLIO SCHEDULES – The Fund files a complete schedule of portfolio holdings with the SEC for the first and third quarters of each fiscal year (quarters ended March 31 and September 30) on Form N-Q. The Fund’s Form N-Q’s are available on the SEC website at http://www.sec.gov and may be reviewed and copied at the SEC Public Reference Room in Washington, D.C. Information on the operation of the SEC Public Reference Room may be obtained by calling 1-800-SEC-0330.
3) SHAREHOLDER MEETING INFORMATION – The Annual Meeting of Shareholders of the Fund was held on Friday, September 21, 2012, at 3:00 p.m. Eastern time at the offices of the Fund, 150 Broadhollow Road, Suite PH2, Melville, New York, pursuant to notice duly given to all shareholders of record as of the close of business on August 3, 2012 (the “Record Date”). At the Meeting, the shareholders were asked to approve the election of seven Directors and to ratify the Board of Directors’ appointment of BBD, LLP as the Fund’s independent registered public accounting firm for its fiscal year ending December 31, 2012.
Information regarding shares voted for and against the matters before the Meeting follows:
Matter 1: To elect seven Directors to serve for the ensuing year:
| | | | | | | | |
Nominee | | For | | | Withheld | |
Jonathan D. Beard | | | 3,010,536.766 | | | | 71,256.006 | |
Susan Hickey | | | 3,018,655.865 | | | | 63,136.907 | |
Jeffrey E. Perlman | | | 3,006,857.339 | | | | 74,935.433 | |
Preston V. Pumphrey | | | 2,998,727.398 | | | | 83,065.374 | |
Sharon Reier | | | 3,010,873.427 | | | | 70,919.345 | |
Murray D. Rosenblith | | | 3,009,141.356 | | | | 72,651.416 | |
David J. Schoenwald | | | 2,811,980.697 | | | | 269,812.075 | |
Matter 2: To ratify the selection of BBD, LLP as the Fund’s independent registered public accounting firm for its fiscal year ending December 31, 2012.
| | | | | | | | |
For | | Against | | | Abstain | |
3,002,741.557 | | | 22,686.037 | | | | 56,365.178 | |
30
NEW ALTERNATIVES FUND, INC.
SHAREHOLDER TAX INFORMATION (Unaudited)
During the fiscal year ended December 31, 2012, the following dividends were paid by the Fund:
| | | | |
Ordinary Income | | $ | 2,712,887 | |
Long-Term Capital Gains | | | — | |
For the year ended December 31, 2012, certain dividends may be subject to a maximum tax rate of 15%, as provided for by the Jobs and Growth Tax Relief Reconciliation Act of 2003. For individual shareholders, 100% of their ordinary income dividends for the Fund qualify for the maximum tax rate of 15%. Complete information will be computed and reported in conjunction with your Form 1099-DIV.
For corporate shareholders, 71.11% of the ordinary income dividends qualify for the dividends received deduction.
Shareholders are advised to consult their own tax advisors with respect to the tax consequences of their investments in the Fund.
31
MANAGEMENT OF THE FUND
(Unaudited)
Information pertaining to the Directors and Officers of the Fund is set forth below. The Statement of Additional Information includes additional information about the Directors and is available without charge, upon request, by calling the Fund at 800-423-8383 or by visiting our website at www.newalternativesfund.com. The mailing address for the Directors and Officers of the Fund is c/o New Alternatives Fund, Inc., 150 Broadhollow Road, Suite PH2, Melville, New York 11747.
DIRECTORS
| | | | | | | | | | |
Name, Address and Age | | Position(s) Held with
the Fund | | Term of Office and
Length of
Time Served1 | | Principal Occupation(s)
During the Past
Five Years | | Number of
Portfolios in
Fund Complex
To Be
Overseen by
Director2 | | All
Directorships
Held by
Director
During the
Past Five Years3 |
Interested Directors: |
| | | | | |
David J. Schoenwald* Huntington Bay, NY Age: 63 | | Founder, Director, President, Treasurer and Chairperson of the Board | | Founder, Director, President and Treasurer, 1982 to present; Chairperson of the Board, 2008 to present | | President and Treasurer, Accrued Equities, Inc.** | | 1 | | None |
| | | | | |
Murray D. Rosenblith* Brooklyn, NY Age: 61 | | Director and Secretary | | Director, 2003 to present; Secretary, 2012 to present; Assistant Secretary, 2009 to 2012 | | Portfolio Manager and Assistant Compliance Officer (since 2010), and employee, Accrued Equities, Inc.** (2008 to present); Formerly, Executive Director, A.J. Muste Memorial Institute, an organization concerned with exploration of the link between non-violence and social change (1985 to 2008). | | 1 | | None |
32
| | | | | | | | | | |
Name, Address and Age | | Position(s) Held with
the Fund | | Term of Office and
Length of
Time Served1 | | Principal Occupation(s)
During the Past
Five Years | | Number of
Portfolios in
Fund Complex
To Be
Overseen by
Director2 | | All
Directorships
Held by
Director
During the
Past Five Years3 |
Independent Directors: | | |
| | | | | |
Sharon Reier Coconut Creek, FL and Paris, France Age: 66 | | Director and Vice-Chairperson of the Board | | Director, 1982 to present; Vice- Chairperson, 2008 to present | | Retired; prior these to, freelance financial journalist; Contributor to the International Herald Tribune, (1995 to 2011); former contributor to Business Week International; former regional editor, Financial World; former editor, Boardroom Reports; former contributing editor, Institutional Investor; former staff, Forbes and American Banker. | | 1 | | None |
| | | | | |
Preston V. Pumphrey Syosset, NY Age: 78 | | Director and Audit Committee Chairperson | | 2003 to present | | Registered Principal, C.E. Gaye & Sons Securities, Ltd. (July 2008 to present); FINRA Dispute Resolution Board of Arbitrators (June 2002 to December 2012); Formerly, Adjunct Professor of Finance, C.W. Post College. | | 1 | | None |
| | | | | |
Susan Hickey East Northport, NY Age: 60 | | Director and Audit Committee Member | | 2005 to present | | Accounting Software Developer, AccountantsWorld, LLC.; Member of National Association of Enrolled Agents and New York Society of Independent Accountants. Former IRS Tax Return Auditor; BA International Affairs, Stonehill College, North Easton, MA. | | 1 | | None |
33
| | | | | | | | | | |
Name, Address and Age | | Position(s) Held with
the Fund | | Term of Office and
Length of
Time Served1 | | Principal Occupation(s)
During the Past
Five Years | | Number of
Portfolios in
Fund Complex
To Be
Overseen by
Director2 | | All
Directorships
Held by
Director
During the
Past Five Years3 |
| | | | | |
Jonathan D. Beard New York, NY Age: 65 | | Director | | 2005 to present | | Self-employed Freelance Journalist for various American and European Science Magazines; Lifetime Member, Sierra Club and New York-New Jersey Trails Conference; Graduate of Columbia University 1970. | | 1 | | None |
| | | | | |
Jeffrey E. Perlman New York, NY Age: 33 | | Director | | 2009 to present | | President and Founder, Bright Power, a company advancing clean, cost-effective energy solutions (2004 to present); Clarinetist/ Saxophonist, Romashka and various Klezmer music ensembles (1996 to present); Formerly, Consultant, Capital E, a renewable energy consulting and investment services company (2002 to 2005). | | 1 | | None |
34
Officers of the Fund who are not Directors:
| | | | | | | | |
Name, Address and Age | | Position(s) Held with the Fund | | Term of Office and Length of Time Served1 | | Principal Occupation(s) During the Past Five Years | | |
| | | |
Joseph A. Don Angelo Syosset, NY Age: 64 | | Chief Compliance Officer | | 2007 to present | | Accountant and Owner, Don Angelo and Associates, CPAs P.C. (1984 to present). |
| 1 | Each Director and Officer holds office until the next annual meeting of shareholders at which Directors or Officers are elected following his or her election or appointment and until his or her successor has been elected and qualified. |
| 2 | Currently, there is only one portfolio and no fund complex. |
| 3 | Includes directorships of companies required to report to the SEC under the Securities Exchange Act of 1934, as amended (i.e., “public companies”), or other investment companies registered under the 1940 Act. |
| * | “Interested person”, as defined in section 2(a)(19) of the 1940 Act. David J. Schoenwald is majority shareholder and President of the Advisor. Murray D. Rosenblith is considered an “interested person” as a result of his employment with Advisor. |
| ** | David J. Schoenwald and Murray D. Rosenblith have no present enterprise, employment, position or commercial investment activity except for their positions with Accrued Equities, Inc., the Fund’s investment advisor and Sub-Distributor. At the present time, Accrued Equities, Inc. provides services only to the Fund. David J. Schoenwald is licensed to practice law in New York and is President and sole shareholder of Schoenwald and Schoenwald, P.C. |
35
Item 2. Code of Ethics.
| | (a) | The registrant, as of the end of the period covered by this report, has adopted a code of ethics that applies to the registrant’s principal executive officer, principal financial officer, principal accounting officer or controller, or persons performing similar functions, regardless of whether these individuals are employed by the registrant or a third party. |
| | (c) | There have been no amendments, during the period covered by this report, to a provision of the code of ethics that applies to the registrant’s principal executive officer, principal financial officer, principal accounting officer or controller, or persons performing similar functions, regardless of whether these individuals are employed by the registrant or a third party, and that relates to any element of the code of ethics description. |
| | (d) | The registrant has not granted any waivers, including an implicit waiver, from a provision of the code of ethics that applies to the registrant’s principal executive officer, principal financial officer, principal accounting officer or controller, or persons performing similar functions, regardless of whether these individuals are employed by the registrant or a third party, that relates to one or more of the items set forth in paragraph (b) of this item’s instructions. |
Item 3. Audit Committee Financial Expert.
As of the end of the period covered by the report, the Registrant’s Board of Directors has determined that Preston V. Pumphrey is qualified to serve as an audit committee financial expert serving on its audit committee and that he is “independent,” as defined by Item 3 of Form N-CSR.
Item 4. Principal Accountant Fees and Services.
Audit Fees
| | (a) | The aggregate fees billed for each of the last two fiscal years for professional services rendered by the principal accountant for the audit of the registrant’s annual financial statements or services that are normally provided by the accountant in connection with statutory and regulatory filings or engagements for those fiscal years are $19,250 for 2011 and $19,250 for 2012. |
Audit-Related Fees
| | (b) | The aggregate fees billed in each of the last two fiscal years for assurance and related services by the principal accountant that are reasonably related to the performance of the audit of the registrant’s financial statements and are not reported under paragraph (a) of this Item are $0 for 2011 and $0 for 2012. |
Tax Fees
| | (c) | The aggregate fees billed in each of the last two fiscal years for professional services rendered by the principal accountant for tax compliance, tax advice, and tax planning are $2,000 for 2011 and $2,000 for 2012. The fees billed were for review by the principal accountant of the registrant’s Federal tax returns. |
All Other Fees
| | (d) | The aggregate fees billed in each of the last two fiscal years for products and services provided by the principal accountant, other than the services reported in paragraphs (a) through (c) of this Item are $0 for 2011 and $0 for 2012. |
| | (e)(1) | Disclose the audit committee’s pre-approval policies and procedures described in paragraph (c)(7) of Rule 2-01 of Regulation S-X. |
The Audit Committee will be responsible for evaluating the provision of non-audit services to the Company as required by Section 201 of the Sarbanes-Oxley Act of 2002 and the rules and regulations promulgated thereunder (collectively, the “2002 Act”) and any pre-approval requests submitted by the independent accountants as required by Section 202 of the 2002 Act.
| | (e)(2) | The percentage of services described in each of paragraphs (b) through (d) of this Item that were approved by the audit committee pursuant to paragraph (c)(7)(i)(C) of Rule 2-01 of Regulation S-X are as follows: |
(b) N/A
(c) 100%
(d) N/A
| | (f) | The percentage of hours expended on the principal accountant’s engagement to audit the registrant’s financial statements for the most recent fiscal year that were attributed to work performed by persons other than the principal accountant’s full-time, permanent employees was less than fifty percent. |
| | (g) | The aggregate non-audit fees billed by the registrant’s accountant for services rendered to the registrant, and rendered to the registrant’s investment adviser (not including any sub-adviser whose role is primarily portfolio management and is subcontracted with or overseen by another investment adviser), and any entity controlling, controlled by, or under common control with the adviser that provides ongoing services to the registrant for each of the last two fiscal years of the registrant was $0 for 2011 and $0 for 2012. |
Item 5. Audit Committee of Listed registrants.
Not applicable to Registrant, which is an open-end management investment company.
Item 6. Investments.
| | (a) | Not applicable. The full Schedule of Investments in securities of unaffiliated issuers as of the close of the reporting period is included as part of the annual report to shareholders filed under Item 1 of this form. |
Item 7. Disclosure of Proxy Voting Policies and Procedures for Closed-End Management Investment
Companies.
Not applicable to Registrant, which is an open-end management investment company.
Item 8. Portfolio Managers of Closed-End Management Investment Companies.
Not applicable to Registrant, which is an open-end management investment company.
Item 9. Purchases of Equity Securities by Closed-End Management Investment Company and Affiliated
Purchasers.
Not applicable to Registrant, which is an open-end management investment company.
Item 10. Submission of Matters to a Vote of Security Holders.
There have been no material changes to the procedures by which the shareholders may recommend nominees to the Registrant’s Board of Directors, where those changes were implemented after the Registrant last provided disclosure in response to the requirements of Item 407(c)(2)(iv) of Regulation S-K (17 CFR 229.407) (as required by Item 22(b)(15) of Schedule 14A (17 CFR 240.14a-101)), or this Item.
Item 11. Controls and Procedures.
| | (a) | Based on his evaluation of the Registrant’s disclosure controls and procedures (as defined in Rule 30a-3(c) under the Investment Company Act of 1940, as amended (the “1940 Act”)) as of a date within 90 days of the filing date of this report, the Registrant’s principal executive officer and principal financial officer has concluded that such disclosure controls and procedures are reasonably designed and are operating effectively to ensure that material information relating to the Registrant, including its consolidated subsidiaries, is made known to him by others within those entities, particularly during the period in which this report is being prepared, and that the information required in filings on Form N-CSR is recorded, processed, summarized, and reported on a timely basis. |
| | (b) | There were no changes in the registrant’s internal control over financial reporting (as defined in Rule 30a-3(d) under the 1940 Act (17 CFR 270.30a-3(d)) that occurred during the registrant’s second fiscal quarter of the period covered by this report that has materially affected, or is reasonably likely to materially affect, the registrant’s internal control over financial reporting. |
Item 12. Exhibits.
| | (a)(1) | Code of ethics, or any amendments thereto, that is the subject of disclosure required by Item 2 is attached hereto. |
| | (a)(2) | Certifications pursuant to Rule 30a-2(a) under the 1940 Act and Section 302 of the Sarbanes-Oxley Act of 2002 are attached hereto. |
| | (b) | Certifications pursuant to Rule 30a-2(b) under the 1940 Act and Section 906 of the Sarbanes-Oxley Act of 2002 are attached hereto. |
SIGNATURES
Pursuant to the requirements of the Securities Exchange Act of 1934 and the Investment Company Act of 1940, the registrant has duly caused this report to be signed on its behalf by the undersigned, thereunto duly authorized.
| | |
| (Registrant) | | New Alternatives Fund, Inc. |
| | |
| By (Signature and Title)* | | /s/ David J. Schoenwald |
| | David J. Schoenwald, President and Treasurer (Principal Executive Officer and Principal Financial Officer) |
Pursuant to the requirements of the Securities Exchange Act of 1934 and the Investment Company Act of 1940, this report has been signed below by the following persons on behalf of the registrant and in the capacities and on the dates indicated.
| | |
| By (Signature and Title)* | | /s/ David J. Schoenwald |
| | David J. Schoenwald, President and Treasurer (Principal Executive Officer and Principal Financial Officer) |
* Print the name and title of each signing officer under his or her signature.
