UNITED STATES
SECURITIES AND EXCHANGE COMMISSION
Washington, D.C. 20549
FORM N-CSR
CERTIFIED SHAREHOLDER REPORT OF REGISTERED MANAGEMENT
INVESTMENT COMPANIES
Investment Company Act file number 811-03287
New Alternatives Fund
(Exact name of registrant as specified in charter)
150 Broadhollow Road, Suite PH2
Melville, New York 11747
(Address of principal executive offices) (Zip code)
David J. Schoenwald, President
New Alternatives Fund
150 Broadhollow Road, Suite PH2
Melville, New York 11747
(Name and address of agent for service)
Registrant’s telephone number, including area code: 631-423-7373
Date of fiscal year end: December 31
Date of reporting period: December 31, 2014
Form N-CSR is to be used by management investment companies to file reports with the Commission not later than 10 days after the transmission to stockholders of any report that is required to be transmitted to stockholders under Rule 30e-1 under the Investment Company Act of 1940 (17 CFR 270.30e-1). The Commission may use the information provided on Form N-CSR in its regulatory, disclosure review, inspection, and policymaking roles.
A registrant is required to disclose the information specified by Form N-CSR, and the Commission will make this information public. A registrant is not required to respond to the collection of information contained in Form N-CSR unless the Form displays a currently valid Office of Management and Budget (“OMB”) control number. Please direct comments concerning the accuracy of the information collection burden estimate and any suggestions for reducing the burden to Secretary, Securities and Exchange Commission, 100 F Street, NE, Washington, DC 20549. The OMB has reviewed this collection of information under the clearance requirements of 44 U.S.C. § 3507.
Item 1. Reports to Stockholders.
The Report to Shareholders is attached herewith.
| | |
 | | New Alternatives Fund A SOCIALLY RESPONSIBLE MUTUAL FUND EMPHASIZING ALTERNATIVE ENERGY AND THE ENVIRONMENT |
| | |
| | |
| | |
ANNUAL
FINANCIAL REPORT
CLASS A SHARES: NALFX
INVESTOR SHARES: NAEFX
DECEMBER 31, 2014
This report is submitted for the general information of the shareholders of the Fund. It is not authorized for distribution unless preceded or accompanied by a prospectus for the Fund.
| | | | | | | | |
THE FUND | | 150 Broadhollow Road | | Melville, NewYork 11747 | | (800) 423-8383 | | (631) 423-7373 |
BNY Mellon Investment Servicing (US) Inc. | | PO Box 9794 | | Providence, RI 02940 | | (800) 441-6580 | | (610) 382-7819 |
Overnight Address | | 4400 Computer Drive | | Westborough, MA 01581 | | | | |
Foreside Funds Distributors LLC | | 400 Berwyn Park, | | Berwyn, PA 19312 | | | | |
| | 899 Cassat Road | | | | | | |
Recycled Paper
NEW ALTERNATIVES FUND
MANAGEMENT’S DISCUSSION OF FINANCIAL PERFORMANCE
FOR THE YEAR 2014
Fund Performance: The Fund’s share price increased 2.91% for the year ending December 31, 2014. The Net Asset Value (“NAV”) began at $46.93 on January 1, 2014 and closed at $46.87 after payment of an ordinary dividend of $0.628 and a long term capital gain of $0.796 (totaling $1.42) per share. The Fund’s net assets increased during the year from $175.1 million to approximately $175.9 million at the end due primarily to appreciation of the Fund’s holdings.
The Fund grew robustly through the first six months of 2014. On June 30, 2014, the NAV reached $56.04, a gain of 19.41% for the year to date. From that point on, we saw a steady decline through the 3rd quarter and much of the 4th quarter. We reached a low point of $46.45 on October 15, 2014 before rebounding to a small gain by the year’s end.
At December 31, 2014, 39.5% of the Fund’s portfolio was invested in U.S. based companies, up slightly from 36.5% in 2013. European companies comprised 35% of our holdings (with 20.8% priced in Euros and the remainder in other currencies, including those of Denmark and Norway). The rest of our companies included: 16.8% in Canada, 7.5% in Asia (Japan, Singapore and New Zealand) and also 1.2% in cash in U.S. banks and credit unions.
Factors Affecting the Fund: Significant factors influencing performance included a 50% decline in the price of oil during the 2nd half of the year, and considerable weakness of foreign currencies compared to the U.S. Dollar.The value of the Euro declined from approximately $1.39 per Euro, to approximately $1.20 per Euro. The value of other foreign currencies declined against the U.S. Dollar, as well.
The majority of the Fund’s investments are geared to renewable energy and energy conservation, and, while the price of oil is only tangentially related to the price of electricity, the impact of low oil prices on investor sentiment to the sector, proved significant. The security with the greatest connection to petroleum prices is probably Abengoa SA (Spain), which has some conventional and second generation ethanol business among its clean water, renewable energy and electric transmission assets. Consensus sentiment at year-end was for continued low oil prices, a likelihood of worldwide deflation, continued strength of the U.S. Dollar versus foreign currencies, and continued backtracking on clean energy and the environmental policies, outside of the U.S., where supportive policies continue to be advanced by the Obama administration.
A note about “stranded assets”: There has been a great deal of discussion about the notion of stranded fossil fuel assets, the notion that fossil fuels — coal, oil and natural gas will remain in the ground — their value marginalized on account of the concern about climate change. This view is supported of late not by the politics of climate change, but by the decline in the value of oil attributable to excess supply and reduced demand.
There has been very little discussion about stranded renewable assets, caused by the abandoning of support for climate change regulation in Europe and Australia, political actions ranging from retroactive
1
legislation, reducing the amount paid for renewable electricity, and, in the case of Spain, new taxes levied specifically on production of solar power, but not on electricity generated by burning fossil fuels.
The value of a megawatt of electricity produced by wind and solar farms in parts of Europe and Australia are worth considerably less of the value of the same assets in North America. While development of renewable power assets occurred earlier in Europe, the asset owners have been penalized and new development has slowed. We feel this causes the earnings of renewable equipment producers and the value of renewable energy producing assets in those countries to be discounted.
Portfolio Holdings and Changes:
The most significant change in New Alternatives Fund’s portfolio was the sale of our remaining investments in natural gas distribution utilities, and further investment in so-called “Yield Companies”, a relatively new investment vehicle (which we described in our Semi-Annual Report of June 30, 2104). These Yield Co’s consist primarily of operating renewable energy generating companies. The Yield Co’s should provide growth and replace the income which had been provided by the distribution utilities.
New Investments in 2014: This year saw the creation of a number of Yield Co’s as renewable energy producers and developers sought to free up cash for new operations and, at the same time, create a revenue stream for the parent company, along with outside investors. We added shares of new Yield Co’s Abengoa Yield PLC (a subsidiary of Spanish developer Abengoa SA, Abengoa Yield is headquartered in the United Kingdom but is also listed on the NASDAQ exchange in the U.S.); NextEra Energy Partners LP (owns and operates wind and solar projects; a subsidiary of NextEra Energy, Inc.); TerraForm Power, Inc. (owns and operates solar projects in the U.S., Canada, the U.K. and Chile; a subsidiary of SunEdison, Inc.); and TransAlta Renewables, Inc. (Canada-owns and operates wind and hydro power projects; a subsidiary of TransAlta Corp.).
Our purchase of solar photovoltaic (PV) manufacturer Canadian Solar, Inc. (Canada) at the beginning of 2014 marked our cautious return to greater investment in solar PV producers and developers. We have been holding small amounts of two other solar companies (Kyocera Corp.-Japan and SunPower Corp.) for several years, but we have mostly sat on the sidelines waiting for this sector to recover from the serious plunge of the past few years due to falling material prices, oversupply against slowing demand and the cost undercutting practiced by several Chinese companies in their campaign to capture a greater market share from producers in other countries. Solar developments, both PV and concentrated solar thermal (CST), appear to be picking up again.
The addition of Cree, Inc. (energy efficient LED lighting materials) to our energy conservation companies early in the past year has not worked out as well as we had hoped. Cree’s products are considered to be high quality and technologically advanced, but the company faces severe competition from Chinese manufacturers and has struggled with management and distribution issues. Its shares have declined 43.6% during 2014 making it the weakest performer in the Fund for the year.
We added shares of Whole Foods Market, Inc. (organic food retailer) to the Fund in 2014. It was the first time in the past five years we held a company related to organic food. In this instance, it has worked out better for New Alternatives Fund as Whole Foods share price rose over 30% for the year.
2
Holdings Sold:We sold our remaining shares of New Jersey Resources Corp., South Jersey Industries, Inc. and WGL Holdings, Inc. These were natural gas distribution utilities, each with a demonstrated commitment to social responsibility and sound environmental practices. For years, they provided a stable share price and regular dividends to help anchor the Fund’s performance. These companies were all heavily investing in replacing and upgrading old distribution lines to mitigate methane leaks, which will increase their earnings as these expenses are added to their regulatory rate basis. Despite this, we sold our shares, with some trepidation and with the hope that the dividends from the Yield Co’s would be able to replace the dividends from these companies. We also took note of the issues raised during recent years as to whether natural gas was actually helping or hindering the transition to greater renewable energy usage. Along with a recent study from the U.S. Department of Energy that the export of cheap U.S. natural gas overseas was contributing to greater methane and CO2 emissions, led us to conclude that even though these companies were not engaged in extraction or export activities, it was more consistent with the Fund’s principles to divest all natural gas related holdings at this time.
We sold three companies — Ormat Technologies, Inc. (geothermal energy developer) and WFI Industries, Ltd. (Canada-residential and small commercial heat pump system manufacturer) and Schneider Electric SA (France-energy efficient electric components and building systems) — when they announced corporate reorganizations. Ormat was absorbing its parent company in Israel and WFI was being bought by a larger manufacturing firm. Schneider bought out another company which makes software and control systems for chemical makers, oil refineries and mining companies. These sales also represented capital gains for the Fund.
During 2014, we also sold our shares of ITC Holdings Corp. (electric utility and transmission line developer, EnerNOC, Inc. (energy management and demand response systems), Veolia Environnement SA (France-water utility, cogeneration facilities, waste water treatment developer, recycling solutions and waste management systems) and Xylem, Inc. (water treatment and conservation systems).
Other Changes in the Fund:
Gainers and Losers: While no company in our portfolio experienced triple digit share price increases like 2013, our strongest performers again included Vestas Wind Systems AS (Denmark-wind turbine manufacturer), which was up 41.4% for 2014. Joining Vestas as top performers were: EDP Renovaveis SA (Spain/Portugal-wind and ocean power projects), gaining 40.6%; Algonquin Power & Utilities Corp. (Canada-local utility, small hydro and wind power developer, water service and waste water treatment), up 37.1%;Acciona SA (Spain-international hydro, wind and solar developer and producer, wind turbine manufacturer, water and transportation infrastructure builder/developer), up 34.6%; and Whole Foods Market was up 30.1% from our initial purchase in August to the year end.
Other companies with significant increases in their share price include: American Water Works, Inc. (water utility) rose 29.4%; Brookfield Renewable Energy Partners LP (Canada/Bermuda-small hydro and wind power facilities in the U.S. and Canada), up 24%; TrustPower Ltd. (New Zealand-wind and hydro power utility), up 21.7%; NRG Yield, Inc. (renewable power project operator, yield co. subsidiary of NRG Energy, Inc.), up 21.5%; and Hafslund ASA (Norway-hydropower producer and district heating systems operator), up 13.5%.
Solar and energy conservation companies were already having a hard year when the share price downturn hit during the second half of the year. The value of many energy related companies retreated. Among
3
the Fund’s holdings, in addition to Cree which was mentioned above, the greatest decrease in value occurred to: Canadian Solar, down 40.4%; Abengoa Yield, down 26.1%; Hyflux Ltd. (Singapore-water purification and desalinization systems in China, India, North Africa and Southeast Asia), down 25.4%; Elecnor SA (Spain-wind, solar and electric transmission projects in Spain, Latin America and Africa), down 22.7%; Koninklijke Philips Electronics NV (Netherlands-energy efficient lighting systems, electronics and healthcare products), down 18.8%; Abengoa SA, down 16%; and Pattern Energy Group, Inc. (a Yield Co. owning and operating wind power projects in the U.S., Canada and Chile), down 14.8%.
Cash and Treasury Holdings: We ended the year with approximately 1.2% of net assets in cash. We owned no short-term U.S. Treasury Bills as interest rates continued to be too low. Given these low rates, in recent years we have preferred to invest in stocks paying higher dividend rates and maintain enough of a cash position to take advantage of investment opportunities and meet redemption demands.
Income from Dividends and Interest: The Fund’s net income from dividends and interest increased by 8.6% in 2014. The per share dividend increased from $0.58 in 2013 to $0.63 in 2014.
Realized and Unrealized Capital Gain/Loss: During 2014, the Fund distributed a per share capital gain of $0.81 for 2014. The Fund’s portfolio turnover was higher in 2014 (67.04%) than usual. During the last three years, the Fund had recognized substantial capital gains which would have been taxable for shareholders. We had carryover losses to offset the gains. These offsets were due to expire, so we managed our trades during 2014 to utilize the loss carryover and reduce capital gain for tax purposes.
Expenses: The Fund’s cost of operations increased slightly in 2014. The number of shareholder accounts and the net assets also increased slightly during the year. The amounts paid to the investment advisor, Accrued Equities, Inc. (the “Advisor”), the Bank of New York Mellon (the Fund’s custodian) and BNY Mellon Investment Servicing (U.S.), Inc. (the Fund’s accounting agent, transfer agent and administrator) are largely based on net assets. The Fund’s net assets increased substantially during the first half of the year and then retreated to end the year at a small increase. BNY Mellon, in its role as transfer agent, bases its fees on the number of shareholder accounts established during the year. This figure increased slightly, but it was also allocated across slightly more shares which lower the Fund’s expense ratio from 1.12% in 2013 to 1.08% in 2014. Total Fund Expenses increased by $258,180 or 14.4%. Some of the Fund’s expense increase in 2014 was from costs related to our conversion from a New York State Corporation to a Delaware Statutory Trust and is not expected to be repeated.
Corporate Governance and Regulatory: The Fund reorganized as a Delaware Statutory Trust from a New York State Corporation during 2014. Following a vote by a majority of shares outstanding to approve this reorganization, the Trust commenced operations on November 17, 2014. This change was made to streamline the Fund’s operations and did not change any of the underlying investment principles or practices of the Fund. The Fund also introduced a new, no-load share class (“Investor Share”) in addition to the existing front-end sales load share class (“Class A Share” ) which continue to be offered. The Investor Shares became active on December 31, 2014.
The six existing Directors of the Fund (four of whom are considered “Independent”) became the Trustees of the Delaware Statutory Trust and will continue their oversight of New Alternatives Fund’s operations.
4
Susan Hickey was appointed as Chairperson of the Audit Committee following the resignation of Preston Pumphrey (due to his retirement and relocation) from the Fund’s Board of Directors in January, 2014.
We continue to encourage all shareholders to create an on-line account log-on which is available through a link on our web site at: www.newalternativesfund.com, At present, you can use this access to check the current balance of your account, sign up for e-mail delivery of reports and documents and perform account maintenance such as address changes. Before the end of 2015, we expect to offer the ability to open and close accounts and buy and sell shares on-line as well. If you have already enrolled in this service, the new features will be available to you as soon as they are active.
Strategy:The Fund’s investment objective remains unchanged. We continue to seek long-term capital appreciation. The Fund seeks to achieve its investment objective by investing in equity securities. The equity securities in which the Fund invests consist primarily of common stocks. Other equity securities in which the Fund may invest include depository receipts, real estate investment trusts (“REITs”) and publicly-traded master limited partnerships (“MLPs”). The Fund makes investments in a wide range of industries and in companies of all sizes. The Fund invests in equity securities of both U.S. and foreign companies, and has no limitation on the percentage of assets invested in the U.S. or abroad. Under normal market conditions, at least 25% of the Fund’s total assets will be invested in equity securities of companies in the alternative energy industry.
“Alternative Energy” means the production and conservation of energy in a manner that reduces pollution and harm to the environment, particularly when compared to conventional coal, oil or nuclear energy.
5
New Alternatives Fund Growth of $10,000 vs. The S&P 500® Index and Russell 2000 Index
(Unaudited)
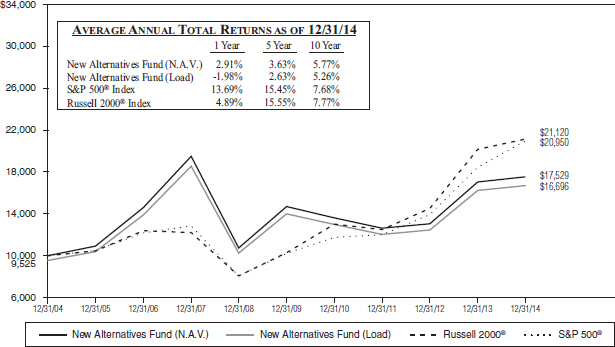
Performance quoted represents past performance and does not guarantee future results. Investment return and principal and principal value will fluctuate so that shares, when redeemed, may be worth more or less than their original cost. Current performance may be lower or higher than that shown here. The“Load“performance quoted reflects a deduction for Class A Shares’ maximum front-end sales charge of 4.75%. Returns include the reinvestment of distributions. Performance data current to the most recent month-end may be obtained by calling 800-423-8383. The graph and table do not reflect the deduction of taxes that a Shareholder would pay on fund distributions or the redemption of fund shares.
The Fund’s total annual operating expenses, as stated in the current prospectus dated November 17, 2014 are 1.16%* for the Class A Shares.
The S&P 500® and Russell 2000 indices are an unmanaged stock market indices and do not reflect any asset-based charges for investment management or transaction expenses. You cannot invest directly in these indices. Current and future portfolio holdings are subject to change and risk.
* Per prospectus. The expense ratio presented above may vary from the expense ratio presented in other sections of this report which is based on expenses incurred during the period covered by this report.
The performance quoted is for the Fund’s Class A Shares.
Investor Shares inception date was December 31, 2014.
6
NEW ALTERNATIVES FUND
FUND EXPENSE EXAMPLE
(Unaudited)
As a shareholder of the Fund, you incur two types of costs: (1) transaction costs such as the sales charge and redemption fees; and (2) ongoing costs, including management fees, distribution (i.e., Rule 12b-1) fees and other Fund expenses. This example is intended to help you understand your ongoing costs (in dollars) of investing in the Fund and to compare these costs with the ongoing costs of investing in other mutual funds.
The example is based on an investment in Class A Shares of the Fund of $1,000 invested at the beginning of the period shown (July 1, 2014) and held for the entire six months ended December 31, 2014.
Actual Expenses
The first line of the table below provides information about actual account values and actual expenses. You may use the information in this line, together with the amount you invested, to estimate the expense that you paid over the period. Simply divide your account value by $1,000 (for example, an $8,600 account value divided by $1,000 = 8.6), then multiply the result by the number in the first line under the heading entitled “Expenses Paid During Six Months Ended December 31, 2014” to estimate the expenses you paid on your account during this period.
Note: The Fund’s Transfer Agent, BNY Mellon Investment Servicing (US) Inc., charges an annual IRA maintenance fee of $15 for IRA accounts. That fee is not reflected in the accompanying table.
Hypothetical Example for Comparison Purposes
The second line of the table below provides information about hypothetical account values and hypothetical expenses based on the Fund’s actual expense ratio and an assumed rate of return of 5% per year before expenses, which is not the Fund’s actual return. The hypothetical account values and expenses may not be used to estimate the actual ending account balance or expenses you paid for the period. You may use this information to compare the ongoing costs of investing in the Fund and other funds. To do so, compare this 5% hypothetical example with the 5% hypothetical examples that appear in the shareholder reports of other funds.
Please note that the expenses shown in the table are meant to highlight your ongoing costs only and do not reflect any transactional costs such as the sales charge, redemption fees or exchange fees. The Fund does not charge any redemption fees or exchange fees on Class A Shares of the Fund, but these may be present in other funds to which you compare the Fund. Therefore, the second line of the table is useful in comparing ongoing costs only, and will not help you determine the relative total costs of owning different funds. In addition, if transactional costs were included, your costs would have been higher.
7
NEW ALTERNATIVES FUND - CLASS A SHARES
| | | | | | | | | | | | |
| |
| | | Beginning
Account Value
July 1, 2014 | | | Ending
Account Value
December 31, 2014 | | | Expenses Paid During
Six Months Ended
December 31, 2014* | |
| |
Actual | | | $1,000.00 | | | | $ 861.70 | | | | $5.49 | |
Hypothetical (assumes 5% return before expenses) | | | $1,000.00 | | | | $1,019.31 | | | | $5.96 | |
* Expenses are equal to the Fund’s annualized expense ratio for the six-month period of 1.17%, multiplied by the average account value over the period, multiplied by the number of days (184) in the most recent fiscal half year, then divided by the days in the year (365) to reflect the half year period. The Fund’s ending account value on the first line in the table is based on its actual total return of -13.83% for the six-month period of July 1, 2014 to December 31, 2014.
8
NEW ALTERNATIVES FUND
SCHEDULE OF INVESTMENTS
December 31, 2014
(Unaudited)
| | | | | | | | |
| | | % of Net | | | | |
Sector Diversification | | Assets | | | Value | |
Alternate Energy: | | | | | | | | |
Renewable Energy Power Producers & Developers | | | 58.7 | % | | $ | 103,228,062 | |
Wind Turbines | | | 8.1 | | | | 14,259,188 | |
Solar Photovoltaic | | | 4.4 | | | | 7,751,750 | |
Fuel Cells | | | 0.3 | | | | 616,000 | |
Energy Conservation | | | 17.4 | | | | 30,546,500 | |
Water: | | | | | | | | |
Water Utilities | | | 4.5 | | | | 7,995,000 | |
Water Related | | | 0.4 | | | | 635,312 | |
Sustainable Energy Financial Services | | | 4.9 | | | | 8,538,000 | |
Natural Food | | | 0.1 | | | | 252,100 | |
Certificates of Deposit | | | 0.3 | | | | 500,000 | |
Other Assets in Excess of Liabilities | | | 0.9 | | | | 1,620,441 | |
| | | | | | | | |
Net Assets | | | 100.0 | % | | $ | 175,942,353 | |
| | | | | | | | |
Top Ten Common Stock Portfolio Issuers
December 31, 2014
(Unaudited)
| | | | |
| | | % of Net | |
Name | | Assets | |
Brookfield Renewable Energy Partners LP (Canada/Bermuda) | | | 5.3 | % |
Owens Corning, Inc. | | | 5.1 | |
Hannon Armstrong Sustainable Infrastructure Capital, Inc., REIT | | | 4.9 | |
TerraForm Power, Inc. Class A | | | 4.8 | |
NextEra Energy Partners LP | | | 4.8 | |
Pattern Energy Group, Inc. | | | 4.7 | |
NRG Yield, Inc., Class A | | | 4.7 | |
Abengoa Yield PLC (Great Britain) | | | 4.7 | |
EDP Renovaveis SA (Spain/Portugal) | | | 4.6 | |
American Water Works Co., Inc. | | | 4.5 | |
| | | | |
Total Top Ten | | | 48.1 | % |
| | | | |
Portfolio holdings are subject to change, risk and may not represent current compositions of the portfolio.
9
NEW ALTERNATIVES FUND
SCHEDULE OF INVESTMENTS
December 31, 2014
| | | | | | | | |
| | | Shares | | | Value | |
| COMMON STOCKS – 98.8% | | | | | | |
Alternate Energy — 71.5% | | | | | | | | |
Fuel Cells — 0.3% | | | | | | | | |
Fuel Cell Energy, Inc.* | | | 400,000 | | | $ | 616,000 | |
| | | | | | | | |
| | | | | | | 616,000 | |
| | | | | | | | |
Renewable Energy Power Producers & Developers — 58.7% | | | | | | | | |
Abengoa SA (Spain) Class B | | | 3,000,001 | | | | 6,592,574 | |
Abengoa Yield PLC (Great Britain) | | | 300,000 | | | | 8,196,000 | |
Acciona SA (Spain)* | | | 110,000 | | | | 7,422,754 | |
Algonquin Power & Utilities Corp. (Canada) | | | 500,000 | | | | 4,140,200 | |
Brookfield Renewable Energy Partners LP (Canada/Bermuda) | | | 300,000 | | | | 9,279,000 | |
EDP Renovaveis SA (Spain/Portugal) | | | 1,250,000 | | | | 8,134,594 | |
Elecnor SA (Spain) | | | 125,000 | | | | 1,285,682 | |
Enel Green Power SPA (Italy) | | | 3,000,000 | | | | 6,285,501 | |
Hafslund ASA, (Norway) Class A | | | 328,074 | | | | 2,222,962 | |
Innergex Renewable Energy, Inc. (Canada) | | | 500,000 | | | | 4,890,000 | |
NextEra Energy Partners LP | | | 250,000 | | | | 8,437,500 | |
Northland Power, Inc. (Canada) | | | 250,000 | | | | 3,317,500 | |
NRG Yield, Inc., Class A | | | 175,000 | | | | 8,249,500 | |
Pattern Energy Group, Inc. | | | 335,000 | | | | 8,261,100 | |
TerraForm Power, Inc., Class A | | | 275,000 | | | | 8,492,000 | |
TransAlta Renewables, Inc. (Canada) | | | 500,000 | | | | 4,940,000 | |
TrustPower Ltd. (New Zealand) | | | 500,000 | | | | 3,081,195 | |
| | | | | | | | |
| | | | | | | 103,228,062 | |
| | | | | | | | |
Solar Photovoltaic — 4.4% | | | | | | | | |
Canadian Solar, Inc. (Canada)* | | | 125,000 | | | | 3,023,750 | |
Kyocera Corp. (Japan) SP ADR | | | 75,000 | | | | 3,436,500 | |
SunPower Corp.* | | | 50,000 | | | | 1,291,500 | |
| | | | | | | | |
| | | | | | | 7,751,750 | |
| | | | | | | | |
Wind Turbines — 8.1% | | | | | | | | |
Gamesa Corporaction Tecnologica SA (Spain)* | | | 775,000 | | | | 6,995,842 | |
Vestas Wind Systems AS (Denmark)* | | | 200,000 | | | | 7,263,346 | |
| | | | | | | | |
| | | | | | | 14,259,188 | |
| | | | | | | | |
Total Alternate Energy | | | | | | | 125,855,000 | |
| | | | | | | | |
Energy Conservation — 17.4% | | | | | | | | |
Cree, Inc.* | | | 75,000 | | | | 2,416,500 | |
Johnson Controls, Inc. | | | 125,000 | | | | 6,042,500 | |
Koninklijke Philips Electronics NV (Netherlands) | | | 250,000 | | | | 7,250,000 | |
Owens Corning, Inc | | | 250,000 | | | | 8,952,500 | |
Panasonic Corp. (Japan) SP ADR | | | 500,000 | | | | 5,885,000 | |
| | | | | | | | |
| | | | | | | 30,546,500 | |
| | | | | | | | |
The accompanying notes are an integral part of these financial statements.
10
NEW ALTERNATIVES FUND
SCHEDULE OF INVESTMENTS (Continued)
December 31, 2014
| | | | | | | | |
| | | Shares | | | Value | |
Water — 4.9% | | | | | | | | |
Water Related — 0.4% | | | | | | | | |
Hyflux Ltd. (Singapore) | | | 1,000,000 | | | $ | 635,312 | |
| | | | | | | | |
| | | | | | | 635,312 | |
| | | | | | | | |
Water Utilities — 4.5% | | | | | | | | |
American Water Works Co., Inc. | | | 150,000 | | | | 7,995,000 | |
| | | | | | | | |
| | | | | | | 7,995,000 | |
| | | | | | | | |
Total Water | | | | | | | 8,630,312 | |
| | | | | | | | |
Sustainable Energy Financial Services — 4.9% | | | | | | | | |
Hannon Armstrong Sustainable Infrastructure Capital, Inc., REIT | | | 600,000 | | | | 8,538,000 | |
| | | | | | | | |
| | | | | | | 8,538,000 | |
| | | | | | | | |
Natural Food — 0.1% | | | | | | | | |
Whole Foods Market, Inc. | | | 5,000 | | | | 252,100 | |
| | | | | | | | |
| | | | | | | 252,100 | |
| | | | | | | | |
Total Common Stocks (Cost $186,275,836) | | | | | | | 173,821,912 | |
| | | | | | | | |
| | | Par | | | | |
CERTIFICATES OF DEPOSIT—0.3% | | | | | | | | |
Socially Concerned Banks — 0.3% | | | | | | | | |
Alternatives Federal Credit Union savings account 0.30% due 01/14/15 | | $ | 100,000 | | | | 100,000 | |
Carver Federal Savings Bank 0.25% due 12/22/15 | | | 100,000 | | | | 100,000 | |
People’s United Bank 0.30% due 12/02/15 | | | 100,000 | | | | 100,000 | |
Self Help Credit Union 0.25% due 03/30/15 | | | 100,000 | | | | 100,000 | |
Urban Partnership Bank 0.35% due 01/28/15 | | | 100,000 | | | | 100,000 | |
| | | | | | | | |
Total Certificates of Deposit (Cost $500,000) | | | | | | | 500,000 | |
| | | | | | | | |
| | |
TOTAL INVESTMENTS (Cost $186,775,836) — 99.1% | | | | | | | 174,321,912 | |
Other Assets in Excess of Liabilities — 0.9% | | | | | | | 1,620,441 | |
| | | | | | | | |
Net Assets — 100.0% | | | | | | $ | 175,942,353 | |
| | | | | | | | |
| | |
* Non-income producing security |
ADR | | -American Depositary Receipts |
REIT | | -Real Estate Investment Trust |
SP ADR | | -Sponsored American Depositary Receipts |
The accompanying notes are an integral part of these financial statements.
11
NEW ALTERNATIVES FUND
SCHEDULE OF INVESTMENTS (Concluded)
December 31, 2014
Country Portfolio Issuers
December 31, 2014
(Unaudited)
| | | | |
| | | % of Net | |
Country | | Assets | |
United States | | | 39.5 | % |
Spain | | | 17.3 | |
Canada | | | 16.8 | |
Japan | | | 5.3 | |
Great Britain | | | 4.7 | |
Denmark | | | 4.1 | |
Netherlands | | | 4.1 | |
Italy | | | 3.5 | |
New Zealand | | | 1.8 | |
Norway | | | 1.3 | |
Singapore | | | 0.4 | |
Other Assets/Liabilities | | | 1.2 | |
| | | | |
| | | 100.0 | % |
| | | | |
The accompanying notes are an integral part of these financial statements.
12
NEW ALTERNATIVES FUND
STATEMENT OF ASSETS AND LIABILITIES
December 31, 2014
| | | | |
| ASSETS | | | | |
Investment securities at fair value (cost: $186,775,836) (Notes 2A and 7) | | $ | 174,321,912 | |
Cash | | | 2,632,783 | |
Receivables: | | | | |
Capital shares subscribed | | | 154,344 | |
Dividends | | | 470,953 | |
Tax reclaims | | | 54,997 | |
Prepaid insurance and registration | | | 15,852 | |
| | | | |
Total Assets | | | 177,650,841 | |
| | | | |
| LIABILITIES | | | | |
Payables: | | | | |
Capital shares reacquired | | | 600,714 | |
Distributions | | | 601,414 | |
Investments purchased | | | 244,989 | |
Management fees | | | 86,461 | |
Transfer agent fees | | | 52,518 | |
Postage and printing fees | | | 26,592 | |
Professional fees | | | 26,335 | |
Custodian fees | | | 16,221 | |
Accrued expenses and other liabilities | | | 53,244 | |
| | | | |
Total Liabilities | | | 1,708,488 | |
| | | | |
Net Assets | | $ | 175,942,353 | |
| | | | |
| ANALYSIS OF NET ASSETS | | | | |
Net capital paid in shares of capital shares | | $ | 189,039,745 | |
Overdistributed net investment income | | | (9,729 | ) |
Accumulated net realized loss on investments and foreign currency transactions | | | (626,827 | ) |
Net unrealized depreciation on investments | | | (12,453,924 | ) |
Net unrealized depreciation on translation of other assets and liabilities in foreign currency | | | (6,912 | ) |
| | | | |
Net Assets | | $ | 175,942,353 | |
| | | | |
| |
Class A Shares: | | | | |
Net Assets | | $ | 175,843,459 | |
Net asset value and redemption price per share ($175,843,459/3,751,972) shares of outstanding beneficial interest, unlimited authorization, no par value | | $ | 46.87 | |
| | | | |
Maximum offering price per share (100/95.25 of $46.87) | | $ | 49.21 | |
| | | | |
Investor Shares: | | | | |
Net Assets | | $ | 98,894 | |
Net asset value, offering and redemption* price per share ($98,894/2,110) shares of outstanding beneficial interest, unlimited authorization, no par value | | $ | 46.87 | |
| | | | |
* Redemption fee may apply (Note 1)
The accompanying notes are an integral part of these financial statements.
13
NEW ALTERNATIVES FUND
STATEMENT OF OPERATIONS
For the Year Ended December 31, 2014
| | | | |
Investment Income: | | | | |
Dividends (net of $327,951 foreign taxes withheld) | | $ | 4,083,449 | |
| | | | |
Total Investment Income | | | 4,083,449 | |
| | | | |
Expenses: | | | | |
Management fee (Note 4) | | | 1,009,343 | |
Transfer agent fees | | | 330,899 | |
Administration and accounting fees | | | 218,949 | |
Legal fees | | | 191,395 | |
Postage and printing fees | | | 71,446 | |
Custodian fees | | | 57,731 | |
Compliance service fees | | | 45,501 | |
Registration fees | | | 40,983 | |
Trustees fees (Note 5) | | | 33,532 | |
Audit fees | | | 21,250 | |
Insurance fees | | | 14,876 | |
Other expenses | | | 14,277 | |
| | | | |
Total Expenses | | | 2,050,182 | |
| | | | |
Net Investment Income | | | 2,033,267 | |
| | | | |
| |
Net Realized and Unrealized Gain/(Loss) from Investments and Foreign Currency Related Transactions: | | | | |
| |
Realized Gain/(Loss) from Investments and Foreign Currency Related Transactions (Notes 2B & 6): | | | | |
Net realized gain from investments | | | 42,345,388 | |
Net realized loss from foreign currency transactions | | | (2,119 | ) |
| | | | |
Net Realized Gain | | | 42,343,269 | |
| | | | |
| |
Net Change in Unrealized Appreciation/(Depreciation) of Investments and Foreign Currency Related Transactions: | | | | |
Net change in unrealized appreciation/(depreciation) on investments | | | (39,381,755 | ) |
Net change in unrealized appreciation/(depreciation) on foreign currency translations | | | (8,922 | ) |
| | | | |
Net change in unrealized appreciation/(depreciation) | | | (39,390,677 | ) |
| | | | |
Net Realized and Unrealized Gain on Investments and Foreign Currency Related Transactions | | | 2,952,592 | |
| | | | |
Net Increase in Net Assets Resulting from Operations | | $ | 4,985,859 | |
| | | | |
The accompanying notes are an integral part of these financial statements.
14
NEW ALTERNATIVES FUND
STATEMENTS OF CHANGES IN NET ASSETS
| | | | | | | | |
| | | For the
Year Ended
December 31, 2014 | | | For the
Year Ended
December 31, 2013 | |
Investment Activities: | | | | | | | | |
Net investment income | | | $ 2,033,267 | | | | $ 2,139,223 | |
Net realized gain/(loss) from investments and foreign currency transactions | | | 42,343,269 | | | | (14,910,058 | ) |
Net change in unrealized appreciation/(depreciation) on investments and foreign currency translations | | | (39,390,677 | ) | | | 55,478,464 | |
| | | | | | | | |
Net increase in net assets resulting from operations | | | 4,985,859 | | | | 42,707,629 | |
| | | | | | | | |
| | |
Dividends to Shareholders: | | | | | | | | |
Class A Shares: | | | | | | | | |
Dividends from net investment income | | | (2,300,023 | ) | | | (2,136,017 | ) |
Dividends from realized gain on investments | | | (2,912,260 | ) | | | — | |
| | | | | | | | |
Total dividends to shareholders | | | (5,212,283 | ) | | | (2,136,017 | ) |
| | | | | | | | |
| | |
Capital Share Transactions: | | | | | | | | |
Net increase/decrease in net assets from capital share transactions (Note 3) | | | 1,067,474 | | | | (15,304,873 | ) |
| | | | | | | | |
Total Increase in Net Assets | | | 841,050 | | | | 25,266,739 | |
| | |
Net Assets: | | | | | | | | |
Beginning of the year | | | 175,101,303 | | | | 149,834,564 | |
| | | | | | | | |
End of the year* | | | $175,942,353 | | | | $175,101,303 | |
| | | | | | | | |
* Includes (overdistributed) Underdistribution net investment income of $(9,729) and $1,221 for the years ended 12/31/14 and 12/31/13, respectively.
The accompanying notes are an integral part of these financial statements.
15
NEW ALTERNATIVES FUND*
FINANCIAL HIGHLIGHTS
STATEMENT OF PER SHARE INCOME AND CAPITAL CHANGES
For a share outstanding throughout each year
| | | | | | | | | | | | | | | | | | | | |
| Class A | | For the Years Ended December 31, | |
| |
| | | 2014 | | | 2013 | | | 2012 | | | 2011 | | | 2010 | |
Net asset value at the beginning of year | | $ | 46.93 | | | $ | 36.40 | | | $ | 35.82 | | | $ | 39.09 | | | $ | 42.54 | |
| | | | | | | | | | | | | | | | | | | | |
| | | | | |
Investment Operations | | | | | | | | | | | | | | | | | | | | |
Net investment income | | | 0.56 | | | | 0.58 | | | | 0.67 | | | | 0.42 | | | | 0.35 | |
Net realized and unrealized gain/(loss) on investments and foreign currency related transactions | | | 0.81 | | | | 10.53 | | | | 0.58 | | | | (3.27 | ) | | | (3.45 | ) |
Payments by affiliates | | | — | | | | — | | | | — | | | | — | | | | 0.01 | |
| | | | | | | | | | | | | | | | | | | | |
Total from investment operations | | | 1.37 | | | | 11.11 | | | | 1.25 | | | | (2.85 | ) | | | (3.09 | ) |
| | | | | | | | | | | | | | | | | | | | |
| | | | | |
Distributions | | | | | | | | | | | | | | | | | | | | |
From net investment income | | | (0.63 | ) | | | (0.58 | ) | | | (0.67 | ) | | | (0.42 | ) | | | (0.36 | ) |
From net realized gains | | | (0.80 | ) | | | — | | | | — | | | | — | | | | — | |
| | | | | | | | | | | | | | | | | | | | |
Total distributions | | | (1.43 | ) | | | (0.58 | ) | | | (0.67 | ) | | | (0.42 | ) | | | (0.36 | ) |
| | | | | | | | | | | | | | | | | | | | |
Net asset value at end of year | | $ | 46.87 | | | $ | 46.93 | | | $ | 36.40 | | | $ | 35.82 | | | $ | 39.09 | |
| | | | | | | | | | | | | | | | | | | | |
| | | | | |
Total return (Sales load not reflected) | | | 2.91% | | | | 30.52% | | | | 3.49% | | | | (7.28)% | | | | (7.26)%** | |
Net assets, end of the year (in thousands) | | $ | 175,843 | | | $ | 175,101 | | | $ | 149,835 | | | $ | 186,554 | | | $ | 236,696 | |
Ratio of expenses to average net assets | | | 1.08% | | | | 1.12% | | | | 1.10% | | | | 1.03% | | | | 1.04% | |
Ratio of net investment income to average net assets | | | 1.07% | | | | 1.34% | | | | 1.69% | | | | 0.98% | | | | 0.86% | |
Portfolio turnover | | | 67.04% | | | | 24.01% | | | | 22.05% | | | | 21.44% | | | | 16.16% | |
Number of shares outstanding at end of the year | | | 3,751,972 | | | | 3,731,230 | | | | 4,116,641 | | | | 5,208,518 | | | | 6,055,618 | |
| * | The Fund acquired all of the assets and liabilities of New Alternatives Fund, Inc. (the “Predecessor Company”) in a reorganization on November 14, 2014. The Predecessor Company’s performance and financial history have been adopted by New Alternatives Fund and will be used going forward. As a result the information prior to November 14, 2014 reflects that of the Predecessor Company. |
| ** | In 2010, 0.02% of the Fund’s total return consisted of voluntary reimbursement by the investment advisor for a realized investment loss. Excluding this voluntary reimbursement, total return for the year would have been (7.28)%. |
Investor Shares inception date was December 31, 2014.
The accompanying notes are an integral part of these financial statements.
16
NEW ALTERNATIVES FUND
NOTES TO FINANCIAL STATEMENTS
For the Year Ended December 31, 2014
1) ORGANIZATION – New Alternatives Fund (the “Trust”) was organized as a Delaware statutory trust on June 12, 2014.TheTrust currently offers one series of shares, also known as “New Alternatives Fund” (the“Fund”). The Fund is the successor to New Alternatives Fund, Inc. (the“PredecessorCompany”), a New York corporation that commenced operations in 1982. The Fund is a diversified, open-end management investment company registered under the Investment Company Act of 1940, as amended (the “1940 Act”). On November 14, 2014, the Predecessor Company was reorganized into the Fund. The Fund has recently been organized for the purpose of continuing the investment operations and performance history of the Predecessor Company and prior to the reorganization had no substantial assets or prior history of investment operations. The Fund currently offers two classes of shares: ClassA Shares and Investor Shares. Class A Shares represent a continuance of the original class of shares offered by the Predecessor Company. Class A Shares are sold subject to a front-end sales charge. Class A Shares of the Fund do not have any distribution (i.e., Rule 12b-1) charges, service charges or redemption fees. Investor Shares are not subject to a sales charge but are subject to a 2.00% redemption fee imposed on any Investor Shares redeemed within sixty (60) days of their initial purchase. Investor Shares are also subject to 12b-1 fees. The investment objective of the Fund is long-term capital appreciation. The Fund seeks to achieve its investment objective by investing in equity securities. The equity securities in which the Fund invests consist primarily of common stocks. Other equity securities in which the Fund may invest include depositary receipts, real estate investment trusts (“REITs”) and publicly-traded master limited partnerships (“MLPs”). The Fund makes investments in a wide range of industries and in companies of all sizes. The Fund invests in equity securities of both U.S. and foreign companies, and has no limitation on the percentage of assets invested in the U.S. or abroad. Under normal market conditions, at least 25% of the Fund’s total assets will be invested in equity securities of companies in the alternative energy industry. “Alternative Energy” means the production and conservation of energy in a manner that reduces pollution and harm to the environment, particularly when compared to conventional coal, oil or nuclear energy.
2) ACCOUNTING POLICIES – The Fund is an investment company that follows the accounting and reporting guidance of Accounting Standards Codification Topic 946 applicable to Investment Companies. The following is a summary of significant accounting policies followed by the Fund.
A. PORTFOLIO VALUATION – The Fund’s net asset value (“NAV”) is calculated once daily at the close of regular trading hours on the NewYork Stock Exchange (“NYSE”) (generally 4:00 p.m. Eastern time) on each day the NYSE is open. Securities held by the Fund are valued based on the official closing price or the last reported sale price on a national securities exchange or on the National Association of Securities Dealers Automatic Quotation System (“NASDAQ”) market system where they are primarily traded, as of the close of business on the day the securities are being valued. That is normally 4:00 p.m. Eastern time. If there were no sales on that day or the securities are traded on other over-the-counter markets, the mean of the
17
last bid and asked prices prior to the market close is used. Short-term debt securities having a remaining maturity of 60 days or less are amortized based on their cost.
Non-U.S. equity securities are valued based on their most recent closing market prices on their primary market and are translated from the local currency into U.S. dollars using current exchange rates on the day of valuation.
If the market price of a security held by the Fund is unavailable at the time the Fund prices its shares at 4:00 p.m. Eastern time, the Fund will use the “fair value” of such security as determined in good faith by Accrued Equities, Inc., the Fund’s investment advisor, under methods established by and under the general supervision of the Fund’s Board of Trustees. The Fund may use fair value pricing if the value of a security it holds has been materially affected by events occurring before the Fund’s pricing time but after the close of the primary markets or exchange on which the security is traded.This most commonly occurs with foreign securities, but may occur in other cases as well. Certain foreign securities are fair valued by utilizing an external pricing service in the event of any significant market movements between the time the Fund valued such foreign securities and the earlier closing of foreign markets. The Fund does not invest in unlisted securities.
The inputs and valuations techniques used to measure fair value of the Fund’s net assets are summarized into three levels as described in the hierarchy below:
| | | | | | |
— Level | | 1 | | - | | Unadjusted quoted prices in active markets for identical assets or liabilities that the Fund has the ability to access. |
| | | |
— Level | | 2 | | - | | Observable inputs other than quoted prices included in Level 1 that are observable for the asset or liability, either directly or indirectly. These inputs may include quoted prices for the identical instrument on an inactive market, prices for similar instruments, interest rates, prepayment speeds, credit risk, yield curves, default rates and similar data. |
| | | |
— Level | | 3 | | - | | Unobservable inputs for the asset or liability, to the extent relevant observable inputs are not available, representing the Fund’s own assumptions about the assumptions a market participant would use in valuing the asset or liability, and would be based on the best information available. |
The inputs or methodology used for valuing securities are not necessarily an indication of the risk associated with investing in those securities.
18
The following is a summary of the inputs used, as of December 31, 2014, in valuing the Fund’s assets carried at fair value:
| | | | | | | | | | | | | | | | |
| | | Total
Value at
12/31/2014 | | | Level 1 –
Quoted
Price | | | Level 2 –
Significant
Observable
Inputs | | | Level 3 –
Significant
Unobservable
Inputs | |
Common Stocks | | | | | | | | | | | | | | | | |
Alternate Energy | | $ | 125,855,000 | | | $ | 73,330,389 | | | $ | 52,524,611 | | | $ | — | |
Energy Conservation | | | 30,546,500 | | | | 30,546,500 | | | | — | | | | — | |
Water | | | 8,630,312 | | | | 7,995,000 | | | | 635,312 | | | | — | |
Sustainable Energy Financial Services | | | 8,538,000 | | | | 8,538,000 | | | | — | | | | — | |
Natural Food | | | 252,100 | | | | 252,100 | | | | — | | | | — | |
Certificates of Deposit | | | 500,000 | | | | — | | | | 500,000 | | | | — | |
| | | | | | | | | | | | | | | | |
Total | | $ | 174,321,912 | | | $ | 120,661,989 | | | $ | 53,659,923 | | | $ | — | |
| | | | | | | | | | | | | | | | |
At the end of each calendar quarter, management evaluates the classification of Levels 1, 2 and 3 assets and liabilities. Various factors are considered, such as changes in liquidity from the prior reporting period; whether or not a broker is willing to execute at the quoted price; the depth and consistency of prices from third party pricing services; and the existence of contemporaneous, observable trades in the market. Additionally, management evaluates the classification of Level 1 and Level 2 assets and liabilities on a quarterly basis for changes in listings or delistings on national exchanges.
The Fund utilizes an external pricing service to fair value certain foreign securities in the event of any significant market movements between the time the Fund valued certain foreign securities and the earlier closing of foreign markets. Such fair valuations are categorized as Level 2 in the hierarchy.Significant market movements were deemed to have occurred at December 31, 2014, and therefore, the Fund utilized the external pricing service model adjustments. Transfers in and out between Levels are based on values at the end of the period. As a result, for the year January 1, 2014 through December 31, 2014, there were transfers from Level 1 to Level 2 in the amount of $53,159,923.The Fund did not hold any Level 3 categorized securities during the year ended December 31, 2014.
B. FOREIGN CURRENCY TRANSLATION – Investment securities and other assets and liabilities denominated in foreign currencies are translated into U.S. dollar amounts at the date of valuation. Purchases and sales of investment securities and income and expense items denominated in foreign currencies are translated into U.S. dollar amounts on the respective dates of such transactions. If foreign currency translations are not available, the foreign exchange rate (s) will be valued at fair market value using procedures approved by the Fund’s Board of Trustees.
The Fund does not isolate that portion of the results of operations resulting from changes in foreign exchange rates on investments from the fluctuations arising from changes in market
19
prices of securities held. Such fluctuations are included with the net realized and unrealized gain or loss from investments.
Reported net realized foreign exchange gains or losses arise from sales of foreign currencies, currency gains or losses realized between the trade and settlement dates on securities transactions, and the difference between the amounts of dividends, interest, and foreign withholding taxes recorded on the Fund’s books and the U.S. dollar equivalent of the amounts actually received or paid.
Foreign Securities – Investing in foreign securities (including depositary receipts traded on U.S. exchanges but representing shares of foreign companies) involves more risks than investing in U.S. securities. Risks of investing in foreign companies include currency exchange rates between foreign currencies and the U.S. dollar. The political, economic and social structures of some foreign countries may be less stable and more volatile than those in the U.S. Brokerage commissions and other fees may be higher for foreign securities. Foreign companies may not be subject to the same disclosure, accounting, auditing and financial reporting standards as U.S. companies. These risks can increase the potential for losses in the Fund and affect its share price.
C. SECURITY TRANSACTIONS AND RELATED INVESTMENT INCOME – Security transactions are accounted for on the trade date (date order to buy or sell is executed). The cost of investments sold is determined by use of specific lots for both financial reporting and income tax purposes in determining realized gains and losses on investments.
D. INVESTMENT INCOMEAND EXPENSE RECOGNITION – Dividend income is recorded as of the ex-dividend date. Foreign dividend income is recorded on the ex-dividend date or as soon as possible after the Fund determines the existence of a dividend declaration after exercising reasonable diligence. Interest income, including amortization/accretion of premium and discount, is accrued daily. Expenses are accrued on a daily basis.
E. DIVIDENDS AND DISTRIBUTIONS TO SHAREHOLDERS – Dividends from net investment income and distributions from net realized capital gains, if any, will be declared and paid at least annually to shareholders and recorded on ex-date. Income dividends and capital gain distributions are determined in accordance with U.S. federal income tax regulations which may differ from accounting principles generally accepted in the United States of America.
F. U.S.TAX STATUS – No provision is made for U.S. income taxes as it is the Fund’s intention to qualify for and elect the tax treatment applicable to regulated investment companies under Subchapter M of the Internal Revenue Code of 1986, as amended, and make the requisite distributions to its shareholders which will be sufficient to relieve it from U.S. income and excise taxes.
G. USE OF ESTIMATES IN THE PREPARATION OF FINANCIAL STATEMENTS – The preparation of financial statements in conformity with accounting principles generally accepted
20
in the United States of America requires management to make estimates and assumptions that affect the reported amounts of assets and liabilities and disclosure of contingent assets and liabilities at the date of the financial statements and the reported amounts of revenue and expenses during the reporting period. Actual results could differ from those estimates.
H. OTHER – In the normal course of business, the Fund may enter into contracts that provide general indemnifications. The Fund’s maximum exposure under these arrangements is dependent on claims that may be made against the Fund in the future, and therefore, cannot be estimated; however, based on experience, the risk of material loss for such claims is considered remote.
3) SHARES OF BENEFICIAL INTEREST – There are unlimited no par value shares of beneficial interest authorized. On December 31, 2014, there were 3,754,082 shares outstanding. Aggregate paid-in capital including reinvestment of dividends was $189,039,745. Transactions in shares of beneficial interest were as follows:
| | | | | | | | | | | | | | | | |
| | | For the Year Ended
December 31, 2014 | | | For the Year Ended
December 31, 2013 | |
| | | Shares | | | Amount | | | Shares | | | Amount | |
Class A Shares | | | | | | | | | | | | | | | | |
Shares of beneficial interest sold | | | 314,284 | | | $ | 16,225,345 | | | | 180,683 | | | $ | 7,617,053 | |
Reinvestment of distributions | | | 98,378 | | | | 4,610,980 | | | | 37,086 | | | | 1,740,441 | |
Redemptions | | | (391,920 | ) | | | (19,867,745 | ) | | | (603,180 | ) | | | (24,662,367 | ) |
| | | | | | | | | | | | | | | | |
Net Increase/Decrease | | | 20,742 | | | $ | 968,580 | | | | (385,411 | ) | | $ | (15,304,873 | ) |
| | | | | | | | | | | | | | | | |
| | | | | | | | |
| | | For the Period Ended
December 31, 2014* | |
| | | Shares | | | Amount | |
Investor Shares | | | | | | | | |
Capital stock sold | | | 2,110 | | | $ | 98,894 | |
| | | | | | | | |
Net Increase | | | 2,110 | | | $ | 98,894 | |
| | | | | | | | |
| * | Commencement of operations. |
4) MANAGEMENT FEE AND OTHER TRANSACTIONS WITH AFFILIATES – Accrued Equities, Inc. (“Accrued Equities” or the “Advisor”), an SEC registered investment advisor and broker-dealer, serves as investment advisor to the Fund pursuant to an Investment Advisory Agreement, and as an underwriter (but not a principal underwriter) of the Fund’s shares pursuant to a Sub-Distribution Agreement. Effective December 1, 2014, for it’s investment advisory services, the Fund pays Accrued Equities an annual management fee of 1.00% of the first $25 million of average daily net assets; 0.50% of the next $475 million of average daily net assets; and 0.40% of average daily net assets more than $500 million. Prior to December 1, 2014, the Fund paid Accrued Equities an annual management fee of 1.00% of the first $10 million of average net assets; 0.75% of the next $20 million of average net
21
assets; 0.50% of average net assets more than $30 million and less than $100 million; and 0.45% of average net assets more than $100 million.
The Fund pays no remuneration to its trustees, David J. Schoenwald and Murray D. Rosenblith, who are also officers or employees of Accrued Equities.
Foreside Funds Distributors LLC (the “ Underwriter”) serves as the principal underwriter of the Fund pursuant to a Distribution Agreement for the limited purpose of acting as statutory underwriter to facilitate the distribution of shares of the Fund. The Underwriter has entered into a Sub-Distribution Agreement with Accrued Equities. The Fund charges a maximum front-end sales charge of 4.75% on most new sales of the Fund’s Class A Shares. Of this amount, the Underwriter and Accrued Equities receive the net underwriter commission and pay out the remaining sales commission to other brokers who actually sell new Class A Shares. Their share of the sales commission may vary. The aggregate underwriter commissions on all sales of Class A Shares of the Fund ( including shares of the Predecessor Company ) during the year ended December 31, 2014 was $41,040, and the amounts received by Accrued Equities and the Underwriter were $27,360, and $13,680, respectively. The Underwriter and Accrued Equities are also entitled to receive sales commissions for the sale of Class A Shares. For the year ended December 31, 2014, Accrued Equities and the Underwriter received $51,783 and $5,008 in sales commissions, respectively, for the sale of Class A Shares of the Fund ( including shares of the Predecessor Company ). Underwriter commissions and sales commissions received by the Underwriter are set aside by the Underwriter and used solely for distribution-related expenses.
Investor Shares of the Fund are not subject to a sale charge. The Fund has adopted a distribution plan (the “Rule 12b-1 Plan”) for its Investor Shares in accordance with the requirements of Rule 12b-1 under the 1940 Act. The Rule 12b-1 Plan provides that the Fund will pay a fee to Accrued Equities at an annual rate of 0.25% of the average daily net assets of the Fund’s Investor Shares to finance certain activities primarily intended to sell such Investor Shares.
5) TRUSTEES’ FEES – For the year ended December 31, 2014, the Fund paid trustees’ fees of $33,532 to its Trustees who are not “interested persons” of the Fund, as that term is defined in the 1940 Act (the “Independent Trustees”).
Each Independent Trustee receives an annual fee of $4,500 for their services as Independent Trustees of the Fund. AsVice-Chairperson of the Fund’s Board of Trustees, Sharon Reier receives an additional annual fee of $1,000. Each member of the Audit Committee receives an additional $500 annual fee and Susan Hickey, Chairperson of the Audit Committee, receives an additional annual fee of $500. The Independent Trustees also receive reimbursement of “coach” travel expenses to attend Board Meetings. The Trustees and Officers of the Fund who are officers and employees of the Advisor do not receive compensation from the Fund for their services and are paid for their services by the Advisor. The Fund’s Chief Compliance Officer is not an officer or employee of the Advisor and is compensated directly by the Fund for his services.
6) PURCHASES AND SALES OF SECURITIES – For the year ended December 31, 2014, the aggregate cost of securities purchased totaled $126,658,784. Net realized gains (losses) were computed on a specific lot basis. The proceeds received on sales of securities for the year ended December 31, 2014 was $119,872,260.
22
7) FEDERAL INCOME TAX INFORMATION – At December 31, 2014, the federal tax basis cost and aggregate gross unrealized appreciation and depreciation of securities held by the Fund were as follows:
| | | | |
Cost of investments for tax purposes | | $ | 187,402,663 | |
| | | | |
Unrealized appreciation for tax purposes | | $ | 7,606,370 | |
Unrealized depreciation for tax purposes | | | (20,687,121 | ) |
| | | | |
Net unrealized depreciation on investments | | $ | (13,080,751 | ) |
| | | | |
The tax character of distributions paid during 2014 and 2013 was as follows:
| | | | | | | | |
Distributions paid from: | | | 2014 | | | | 2013 | |
Ordinary Income | | $ | 2,278,731 | | | $ | 2,136,017 | |
Long-Term Capital Gains | | | 2,933,552 | | | | — | |
| | | | | | | | |
| | $ | 5,212,283 | | | $ | 2,136,017 | |
| | | | | | | | |
For federal income tax purposes, distributions from net investment income and short-term capital gains are treated as ordinary income dividends.
The following permanent differences as of December 31, 2014, attributable to (to follow) were reclassified to the following accounts:
| | | | |
Accumulated Net Realized Loss | | $ | (255,806 | ) |
Undistributed Net Investment Income | | | 255,806 | |
As of December 31, 2014, the components of distributable earnings (deficit) on a tax basis were as follows:
| | | | |
Overdistributed Ordinary Income | | $ | (9,729 | ) |
**Net Unrealized Depreciation on | | | | |
Investments and Foreign Currency Translations | | | (13,087,663 | ) |
| | | | |
| | $ | (13,097,392 | ) |
| | | | |
** The primary difference between distributable earnings on a book and tax basis is due to wash sale losses and investments in partnerships.
Management has analyzed the Fund’s tax positions taken on federal income tax returns for all open tax years (current and prior three tax years), and has concluded that no provision for federal income tax is required in the Fund’s financial statements. The Fund’s federal and state income and federal excise tax returns for tax years for which the applicable statutes of limitations have not expired are subject to examination by the Internal Revenue Service and state departments of revenue.
8) SUBSEQUENT EVENTS – Management has evaluated the impact of all subsequent events on the Fund through the date the financial statements were available to be issued, and has determined that there were no subsequent events requiring disclosure.
23

REPORT OF INDEPENDENT REGISTERED PUBLIC ACCOUNTING FIRM
To the Shareholders and Board Trustees of
New Alternatives Fund
We have audited the accompanying statement of assets and liabilities of New Alternatives Fund, a series of shares of beneficial interest of New Alternatives Fund, including the schedule of investments, as of December 31, 2014, and the related statement of operations for the year then ended, the statements of changes in net assets for each of the years in the two-year period then ended and the financial highlights for each of the years in the five-year period then ended. These financial statements and financial highlights are the responsibility of the Fund’s management. Our responsibility is to express an opinion on these financial statements and financial highlights based on our audits.
We conducted our audits in accordance with the standards of the Public Company Accounting Oversight Board (United States). Those standards require that we plan and perform the audits to obtain reasonable assurance about whether the financial statements and financial highlights are free of material misstatement. An audit includes examining, on a test basis, evidence supporting the amounts and disclosures in the financial statements. Our procedures included confirmation of securities owned as of December 31, 2014 by correspondence with the custodian and brokers or by other appropriate auditing procedures where replies were not received. An audit also includes assessing the accounting principles used and significant estimates made by management, as well as evaluating the overall financial statement presentation. We believe that our audits provide a reasonable basis for our opinion.
In our opinion, the financial statements and financial highlights referred to above present fairly, in all material respects, the financial position of New Alternatives Fund as of December 31, 2014, and the results of its operations for the year then ended, the changes in its net assets for each of the years in the two-year period then ended, and its financial highlights for each of the years in the five-year period then ended, in conformity with accounting principles generally accepted in the United States of America.
| | | | |
| | | 
| |
| |
Philadelphia, Pennsylvania | | | BBD,LLP | |
February 25, 2015 | | | | |
24
OTHER INFORMATION
(Unaudited)
1) PROXY VOTING – The Fund has proxy voting policies which are available: (1) without charge, upon request by calling the Fund at 800-423-8383 and (2) on the SEC’s website at http://www.sec.gov. Information regarding how the Fund voted proxies during the most recent twelve-month period ended June 30 is available on form N-PX: (1) without charge, upon request, by calling the Fund at 800-423-8383 and (2) on the SEC’s website at http://www.sec.gov.
2) QUARTERLY PORTFOLIO SCHEDULES – The Fund files a complete schedule of portfolio holdings with the SEC for the first and third quarters of each fiscal year (quarters ended March 31 and September 30) on Form N-Q. The Fund’s Form N-Q’s are available on the SEC website at http://www.sec.gov and may be reviewed and copied at the SEC Public Reference Room in Washington, D.C. Information on the operation of the SEC Public Reference Room may be obtained by calling 1-800-SEC-0330.
3) APPROVAL OF INVESTMENT ADVISORY AGREEMENT– In connection with the organization of New Alternatives Fund, a Delaware statutory trust (the “Trust”), and on behalf of the Trust’s sole series of shares, also named “New Alternatives Fund” (the “Fund”), the Board of Trustees approved an investment advisory agreement (the “Advisory Agreement”) between the Fund and Accrued Equities, Inc. (the “Advisor”) at its organizational meeting held on June 27, 2014. The June 27, 2014 organizational meeting of the Board of Trustees was called, in part, to act upon the approval of such Advisory Agreement. This approval by the Board of Trustees included the approval by a majority of the Trustees who are not “interested persons” of the Trust, as that term is defined in the Investment Company Act of 1940, as amended (the “Independent Trustees”), and by a majority of the entire Board.
The Advisor serves as the investment adviser to the Fund. The Advisor previously served as the investment adviser to New Alternatives Fund, Inc. (the “Predecessor Company”), a New York corporation that commenced operations in 1982. On November 14, 2014, the Predecessor Company was reorganized into the Fund. The Fund was organized to continue the investment operations and performance history of the Predecessor Company.
Prior to the organizational meeting, the Board received and reviewed certain materials concerning the Advisory Agreement. The materials included: (i) a memorandum prepared by independent counsel setting forth the Board’s fiduciary duties, responsibilities and the factors they should consider in their evaluation of the approval of the Advisory Agreement; (ii) a copy of the Advisor’s responses to a request for information necessary to evaluate the terms of the Advisory Agreement (the “Advisor Questionnaire”); (iii) an organizational chart for the Advisor; (iv) certification from the Advisor that it has a compliance program in place; (v) a copy of Form ADV, Part I for the Advisor; (vi) audited financial information for the Advisor for its fiscal year ended December 31, 2013; (vii) a pro-forma (before and after) fee and expense table comparing the fee schedule for the Fund with the fee schedule of the Predecessor Company; and (viii) a copy of the Advisory Agreement.
25
The Board noted that some of the information received in the Board materials referred to the historical relationship between the Advisor and the Predecessor Company.
The Advisor Questionnaire provided to the Board contained detailed information concerning the Advisor and the Advisory Agreement, including: (i) information on the Advisor’s business and services; (ii) information concerning the employees of the Advisor who serviced the Predecessor Company and who would service the Fund after the reorganization; (iii) information on the Advisor’s investment process; (iv) performance information comparing the Predecessor Company to other, similar mutual funds; (v) information on the Advisor’s trading and brokerage practices; (vi) information concerning investment advisory fees paid to the Advisor by the Predecessor Company; (vii) information concerning other fees earned by the Advisor with respect to its relationship with the Predecessor Company, such as net underwriting fees and sales commissions for the sale of Predecessor Company shares; (viii) information concerning investment advisory fees and total operating expenses as a percentage of net assets paid by the Predecessor Company and other, similar mutual funds; and (ix) other information concerning the Advisor such as information concerning its compliance procedures, code of ethics and insurances.
At the organizational meeting, the Board was provided a copy of the Advisor’s compliance manual and the opportunity to speak with the Trust’s Chief Compliance Officer.
The Board of Trustees, including a majority of the Independent Trustees, decided to approve the Advisory Agreement for a period commencing at the time of the reorganization and lasting until June 30, 2015 based upon their evaluation of: (i) the long-term relationship between the Advisor and the Predecessor Company that would continue after the reorganization into the Fund; (ii) the Advisor’s commitment to the Fund’s socially responsible investment objectives and its ability to manage the Fund’s portfolio in a manner consistent with those objectives; (iii) the depth of experience and expertise of the Advisor with regard to the alternative energy market; (iv) the nature, extent and quality of the services provided; (v) the historical performance of the Predecessor Company; and (vi) the costs of the services provided and the profitability of the Advisor from its relationship with the Fund.
The Board noted that the fee schedule under the Advisory Agreement was different than the investment advisory fee schedule with the Predecessor Company. The Board discussed the investment advisory fee schedule and compared it to the fee schedule for the Predecessor Company. The investment advisory fee would be 1.00% of the Fund’s first $25 million of average daily net assets, 0.50% of the Fund’s next $475 million of average daily net assets, and 0.40% of the Fund’s average daily net assets over $500 million. The historical investment advisory fee was 1.00% of the Predecessor Company’s first $10 million of average daily net assets, 0.75% of the next $20 million of average daily net assets, 0.50% of average daily net assets between $30 million and $100 million, and 0.45% of average daily net assets over $100 million. The proposed change to the investment advisory fee schedule would have the effect of raising the Fund’s investment advisory fee. Referring to a pro-forma (before and after) fee and expense table provided in the Board Materials, and based on 2013 net asset levels for the Predecessor Company, the new investment advisory fee schedule would have increased the Predecessor Company’s investment advisory fee (and overall expenses) by approximately 4 basis points (0.04%) for that year.
26
In general, the Independent Trustees considered it to be most significant that the proposed investment advisory arrangements would assure a continuity of relationships to service the Fund. Of particular significance in the Board’s decision to approve the Advisory Agreement was the fact that the Fund’s investment advisory fee structure, including the change in breakpoints, and its total operating expense ratio, were very low in comparison to the Fund’s industry peer group. The Board also noted that the Advisor continued to provide investment advisory services exclusively to the Fund and that the firm has been committed to alternative energy investing since the Predecessor Company’s inception over 30 years ago.
The Trustees considered the nature, quality and scope of the investment advisory services that had been provided to the Predecessor Company by the Advisor in the past and the services that are expected to continue in the future. Further, the Trustees considered the Advisor’s personnel assigned to service the Fund. Based upon information provided by the Advisor, the Board determined that the Advisor’s current staffing was adequate to meet the Fund’s needs. The Board also concluded that the nature, quality and scope of the investment advisory services provided by the Advisor were very satisfactory.
The Trustees considered the performance results of the Predecessor Company over various time periods. They reviewed information comparing the Predecessor Company’s performance with the performance of other, similar mutual funds and with its benchmark index. The Predecessor Company’s industry peer group comprised other socially responsible mutual funds with an international scope and an interest in the environment and clean energy. The Independent Trustees questioned the Predecessor Company’s underperformance over a one year period in comparison to one of its industry peers. David J. Schoenwald explained that this particular mutual fund’s investment performance had benefited greatly from an over weighting in solar energy. He noted that the other fund was significantly smaller in asset size than the Predecessor Company and its expense ratio was much higher than the Predecessor Company’s expense ratio. He also noted that over longer periods of time, the Predecessor Company was outperforming the other fund. The Board reviewed the Predecessor Company’s performance both with the sales load factored in and without the sales load. This was done because the Predecessor Company’s industry peer group and benchmark index did not have sales loads. In general, the Board noted that the Predecessor Company had been performing competitively in comparison with its industry peer group of other, similar mutual funds and with its benchmark index.
The Trustees considered the investment advisory fees and other expenses paid by the Predecessor Company directly and in comparison to information regarding the fees and expenses incurred by other, similar mutual funds specializing in alternative energy investments and which seek to invest in accordance with a socially responsible investment philosophy. The Board noted that the Predecessor Company’s overall expense ratio was significantly lower than the other comparable funds in its industry peer group. This would still be true under the Fund’s proposed new breakpoint schedule. Based on the foregoing, the Board determined that the investment advisory fee was appropriate.
The Independent Trustees reviewed and discussed other aspects of the Advisor, such as the profitability of the Advisor, the benefits each party received from their long-term relationship, the Advisor’s entrepreneurial risks, and the fact that the Advisor received other compensation from the relationship. They discussed the Advisor’s entrepreneurial risks involved with its proposals to reorganize the Predecessor Company into a Delaware statutory trust and create a new share class to increase total assets and lower expenses for the Fund and its shareholders. They noted that the Advisor was also a registered broker-dealer
27
and was eligible to receive underwriting fees and sales commissions on the sale of Fund shares. Going forward, the Advisor would be eligible to receive fees from the Investor Shares’ Rule 12b-1 plan. The Board noted that two of the Trustees, David J. Schoenwald and Murray D. Rosenblith, were directors and/or officers of the Advisor. The Trustees also noted that Mr. Schoenwald was the owner of the Advisor and would benefit by the approval of the investment advisory and distribution agreements, and the Rule 12b-1 plan. The Board reviewed the Advisor’s brokerage policies noting that the Advisor does not engage in any directed brokerage or soft dollar transactions.
In their deliberations, the Board did not rely upon comparisons of the services to be rendered and the amounts to be paid under the contract with those under other investment advisory contracts, such as contracts of the same and other investment advisers with other registered investment companies or other types of clients (e.g., pension funds and other institutional investors). These factors were considered not to be relevant in a situation where the Trustees were determining whether to approve an agreement in connection with the proposed reorganization under similar terms and conditions. Such factors would be relevant to considering and approving new investment advisory agreements with other investment advisory entities. In addition, the Advisor does not service any other investment advisory accounts.
4) SHAREHOLDER MEETING INFORMATION – A Special Meeting of Shareholders in lieu of an annual meeting (the “Special Meeting”) of New Alternatives Fund, Inc. (the “Predecessor Company”) was held on October 24, 2014, as adjourned to November 7, 2014, at 3:00 p.m. (Eastern time), at the offices of the Predecessor Company, 150 Broadhollow Road, Suite PH2, Melville, NewYork, pursuant to notice duly given to all shareholders of record as of the close of business on August 2, 2013.
At the Special Meeting, the shareholders were asked to approve an Agreement and Plan of Reorganization (the “Reorganization Agreement”) and the transactions contemplated thereby, including (a) the transfer of substantially all of the assets and liabilities of the Predecessor Company to a corresponding series of New Alternatives Fund, a Delaware statutory trust (the “Trust”) in exchange for Class A Shares of the Trust; and (b) the distribution of such Class A Shares of the Trust to the shareholders of the Predecessor Company according to their respective interests.
28
The Reorganization Agreement was approved at the Special Meeting by a majority of the outstanding shares of the Predecessor Company. Information regarding shares voted for and against the matter before the Special Meeting follows:
| | | | | | | | | | | | | | | | |
MATTERS: | | FOR: | | | AGAINST: | | | ABSTAIN: | | | PERCENTAGE
OF SHARES
VOTED FOR: | |
| To approve the Reorganization Agreement and the transactions contemplated thereby, including (a) the transfer of substantially all of the assets and liabilities of the Predecessor Company to a corresponding series of the Trust in exchange for Class A Shares of the Trust; and (b) the distribution of such Class A Shares of the Trust to the shareholders of the Predecessor Company according to their respective interests. | | | 1,552,718 | | | | 90,118 | | | | 218,792 | | | | 83.41 | % |
29
NEW ALTERNATIVES FUND
SHAREHOLDER TAX INFORMATION (Unaudited)
During the fiscal year ended December 31, 2014, the following dividends were paid by the Fund:
| | | | | | | | |
| | Ordinary Income | | | | $2,278,731 | | |
| | Long-Term Capital Gains | | | | 2,933,552 | | |
The Fund paid foreign taxes of $327,951 and recognized foreign source income of $1,273,246 pursuant to Section 853 of the Internal Revenue Code. The Fund will elect to pass these foreign taxes through to shareholders as a foreign tax credit and designates such amounts as having been paid in connection with dividends distributed from investment taxable income during the year ended December 31, 2014.
For the year ended December 31, 2014, certain dividends may be subject to a maximum capital gains tax rate, as provided for by the Jobs and Growth Tax Relief Reconciliation Act of 2003. For individual shareholders, 100% of their ordinary income dividends for the Fund qualify for the maximum capital gains tax rate. Complete information will be computed and reported in conjunction with your Form 1099-DIV.
For corporate shareholders, 59.11% of the ordinary income dividends qualify for the dividends received deduction.
Shareholders are advised to consult their own tax advisors with respect to the tax consequences of their investments in the Fund.
30
MANAGEMENT OF THE FUND
(Unaudited)
Information pertaining to the Trustees and Officers of the Trust is set forth below. The Statement of Additional Information includes additional information about the Trustees and is available without charge, upon request, by calling the Fund at 800-423-8383 or by visiting our website at www.newalternativesfund.com. The mailing address for the Trustees and Officers of the Trust is c/o New Alternatives Fund, 150 Broadhollow Road, Suite PH2, Melville, New York 11747.
| | | | | | | | | | |
Name, Address and Age | | Position(s) Held with the Trust | | Term of Office and Length of Time Served1 | | Principal Occupation(s) During the Past Five Years | | Number of
Portfolios in Trust Complex To Be Overseen by
Trustee2 | | All Directorships Held by Trustee During the Past Five Years3 |
| | | | |
Interested Trustee: | | | | | | | | |
| | | | | |
David J. Schoenwald* Huntington Bay, NY Age: 65 | | Founder, Trustee, President, Treasurer and Chairperson of the Board | | Founder, Trustee, President and Treasurer, 1982 to present; Chairperson of the Board, 2008 to present | | President and Treasurer, Accrued Equities, Inc.** | | 1 | | None |
| | | | | |
Murray D. Rosenblith* Brooklyn, NY Age: 63 | | Trustee, Secretary | | Trustee, 2003 to present; Secretary, 2012 to present; Assistant Secretary, 2009 to 2012 | | Portfolio Manager and Assistant Compliance Officer (since 2010), and employee, Accrued Equities, Inc.(2008 to present); Formerly, Executive Director, A.J. Muste Memorial Institute, an organization concerned with exploration of the link between non-violence and social change (1985 to 2008). | | 1 | | None |
31
| | | | | | | | | | |
Name, Address and Age | | Position(s) Held with the Trust | | Term of Office and Length of Time Served1 | | Principal Occupation(s) During the Past Five Years | | Number of
Portfolios in
Trust
Complex To Be
Overseen by
Trustee2 | | All Directorships Held by Trustee During the Past Five Years3 |
| | | | |
Independent Trustees: | | | | | | | | |
| | | | | |
Sharon Reier Coconut Creek, FL and Paris, France Age: 67 | | Trustee and Vice- Chairperson of the Board | | Trustee, 1982 to present; Vice- Chairperson, 2008 to present | | Retired; prior these to, freelance financial journalist; Contributor to the International Herald Tribune, (1995 to 2011); former contributor to Business Week International; former regional editor, Financial World; former editor, Boardroom Reports; former contributing editor, Institutional Investor; former staff, Forbes and American Banker. | | 1 | | None |
| | | | | |
Susan Hickey East Northport, NY Age: 62 | | Trustee, Audit Committee Member and Audit Committee Chairperson | | 2005 to present; 2005 to 2014; 2014 to present | | Accounting Software Developer, AccountantsWorld, LLC.; Member of National Association of Enrolled Agents and New York Society of Independent Accountants; Former IRS Tax Return Auditor; BA International Affairs, Stonehill College, North Easton, MA. | | 1 | | None |
| | | | | |
Jonathan D. Beard New York, NY Age: 66 | | Trustee and Audit Committee Member | | 2005 to present; 2014 to present | | Retired; prior thereto, Self-employed Freelance Journalist for various American and European Science Magazines; Lifetime Member, Sierra Club and New York-New Jersey Trails Conference; Graduate of Columbia University 1970. | | 1 | | None |
32
| | | | | | | | | | |
Name, Address and Age | | Position(s) Held with the Trust | | Term of Office and Length of Time Served1 | | Principal Occupation(s) During the Past Five Years | | Number of
Portfolios in Trust Complex To Be Overseen by
Trustee2 | | All Directorships Held by Trustee During the Past Five Years3 |
| | | | | |
Jeffrey E. Perlman New York, NY Age: 35 | | Trustee and Audit Committee Member | | 2009 to present; 2014 to present | | President and Founder, Bright Power, a company advancing clean, cost-effective energy solutions (2004 to present); Clarinetist/ Saxophonist, Romashka and various Klezmer music ensembles (1996 to present); Formerly, Consultant, Capital E, a renewable energy consulting and investment services company (2002 to 2005). | | 1 | | None |
33
| | | | | | | | |
Name, Address and Age | | Position(s) Held with the Trust | | Term of Office and Length of Time Served1 | | Principal Occupation(s) During the Past Five Years | | |
| |
Officers of the Fund who are not Directors: | | |
| | | |
Joseph A. Don Angelo Syosset, NY Age: 66 | | Chief Compliance Officer | | 2007 to present | | Accountant and Owner, Don Angelo and Associates, CPAs P.C. (1984 to present). |
| 1 | Each Trustee and Officer holds office until the next annual meeting of shareholders at which Trustees or Officers are elected following his or her election or appointment and until his or her successor has been elected and qualified. |
| 2 | Currently, there is only one portfolio and no fund complex. |
| 3 | Includes directorships of companies required to report to the SEC under the Securities Exchange Act of 1934, as amended (i.e., “public companies”), or other investment companies registered under the 1940 Act. |
| * | “Interested person”, as defined in section 2(a)(19) of the 1940 Act. David J. Schoenwald is majority shareholder and President of the Advisor. Murray D. Rosenblith is considered an “interested person” as a result of his employment with Advisor. |
| ** | David J. Schoenwald and Murray D. Rosenblith have no present enterprise, employment, position or commercial investment activity except for their positions with Accrued Equities, Inc., the Fund’s investment advisor and Sub-Distributor. At the present time, Accrued Equities, Inc. provides services only to the Fund. David J. Schoenwald is licensed to practice law in New York and is President and sole shareholder of Schoenwald and Schoenwald, P.C. |
34
Item 2. Code of Ethics.
| | (a) | The registrant, as of the end of the period covered by this report, has adopted a code of ethics that applies to the registrant’s principal executive officer, principal financial officer, principal accounting officer or controller, or persons performing similar functions, regardless of whether these individuals are employed by the registrant or a third party. |
| | (c) | There have been no amendments, during the period covered by this report, to a provision of the code of ethics that applies to the registrant’s principal executive officer, principal financial officer, principal accounting officer or controller, or persons performing similar functions, regardless of whether these individuals are employed by the registrant or a third party, and that relates to any element of the code of ethics description. |
| | (d) | The registrant has not granted any waivers, including an implicit waiver, from a provision of the code of ethics that applies to the registrant’s principal executive officer, principal financial officer, principal accounting officer or controller, or persons performing similar functions, regardless of whether these individuals are employed by the registrant or a third party, that relates to one or more of the items set forth in paragraph (b) of this item’s instructions. |
Item 3. Audit Committee Financial Expert.
As of the end of the period covered by the report, the Registrant’s Board of Directors has determined that Preston V. Pumphrey is qualified to serve as an audit committee financial expert serving on its audit committee and that he is “independent,” as defined by Item 3 of Form N-CSR.
Item 4. Principal Accountant Fees and Services.
Audit Fees
| | (a) | The aggregate fees billed for each of the last two fiscal years for professional services rendered by the principal accountant for the audit of the registrant’s annual financial statements or services that are normally provided by the accountant in connection with statutory and regulatory filings or engagements for those fiscal years are $19,250 for 2013 and $19,250 for 2014. |
Audit-Related Fees
| | (b) | The aggregate fees billed in each of the last two fiscal years for assurance and related services by the principal accountant that are reasonably related to the performance of the audit of the registrant’s financial statements and are not reported under paragraph (a) of this Item are $0 for 2013 and $0 for 2014. |
Tax Fees
| | (c) | The aggregate fees billed in each of the last two fiscal years for professional services rendered by the principal accountant for tax compliance, tax advice, and tax planning are $2,000 for 2013 and $2,000 for 2014. The fees billed were for review by the principal accountant of the registrant’s Federal tax returns. |
All Other Fees
| | (d) | The aggregate fees billed in each of the last two fiscal years for products and services provided by the principal accountant, other than the services reported in paragraphs (a) through (c) of this Item are $0 for 2013 and $0 for 2014. |
| | (e)(1) | Disclose the audit committee’s pre-approval policies and procedures described in paragraph (c)(7) of Rule 2-01 of Regulation S-X. |
| | | The Audit Committee will be responsible for evaluating the provision of non-audit services to the Company as required by Section 201 of the Sarbanes-Oxley Act of 2002 and the rules and regulations promulgated thereunder (collectively, the “2002 Act”) and any pre-approval requests submitted by the independent accountants as required by Section 202 of the 2002 Act. |
| | (e)(2) | The percentage of services described in each of paragraphs (b) through (d) of this Item that were approved by the audit committee pursuant to paragraph (c)(7)(i)(C) of Rule 2-01 of Regulation S-X are as follows: |
(b) N/A
(c) 100%
(d) N/A
| | (f) | The percentage of hours expended on the principal accountant’s engagement to audit the registrant’s financial statements for the most recent fiscal year that were attributed to work performed by persons other than the principal accountant’s full-time, permanent employees was less than fifty percent. |
| | (g) | The aggregate non-audit fees billed by the registrant’s accountant for services rendered to the registrant, and rendered to the registrant’s investment adviser (not including any sub-adviser whose role is primarily portfolio management and is subcontracted with or overseen by another investment adviser), and any entity controlling, controlled by, or under common control with the adviser that provides ongoing services to the registrant for each of the last two fiscal years of the registrant was $0 for 2013 and $0 for 2014. |
| | (h) | The registrant’s audit committee of the board of directors has considered whether the provision of non-audit services that were rendered to the registrant’s investment adviser (not including any sub-adviser whose role is primarily portfolio management and is subcontracted with or overseen by another investment adviser), and any entity controlling, controlled by, or under common control with the investment adviser that provides ongoing services to the registrant that were not pre-approved pursuant to paragraph (c)(7)(ii) of Rule 2-01 of Regulation S-X is compatible with maintaining the principal accountant’s independence. |
Item 5. Audit Committee of Listed Registrants.
Not applicable to Registrant, which is an open-end management investment company.
Item 6. Investments.
| (a) | Not applicable. The full Schedule of Investments in securities of unaffiliated issuers as of the close of the reporting period is included as part of the annual report to shareholders filed under Item 1 of this Form. |
| Item 7. | Disclosure of Proxy Voting Policies and Procedures for Closed-End Management Investment Companies. |
Not applicable to Registrant, which is an open-end management investment company.
Item 8. Portfolio Managers of Closed-End Management Investment Companies.
Not applicable to Registrant, which is an open-end management investment company.
| Item 9. | Purchases of Equity Securities by Closed-End Management Investment Company and Affiliated Purchasers. |
Not applicable to Registrant, which is an open-end management investment company.
Item 10. Submission of Matters to a Vote of Security Holders.
There have been no material changes to the procedures by which the shareholders may recommend nominees to the Registrant’s Board of Directors, where those changes were implemented after the Registrant last provided disclosure in response to the requirements of Item 407(c)(2)(iv) of Regulation S-K (17 CFR 229.407) (as required by Item 22(b)(15) of Schedule 14A (17 CFR 240.14a-101)), or this Item.
Item 11. Controls and Procedures.
| | (a) | Based on his evaluation of the Registrant’s disclosure controls and procedures (as defined in Rule 30a-3(c) under the Investment Company Act of 1940, as amended (the “1940 Act”)) as of a date within 90 days of the filing date of this report, the Registrant’s principal executive officer and principal financial officer has concluded that such disclosure controls and procedures are reasonably designed and are operating effectively to ensure that material information relating to |
| | the Registrant, including its consolidated subsidiaries, is made known to him by others within those entities, particularly during the period in which this report is being prepared, and that the information required in filings on Form N-CSR is recorded, processed, summarized, and reported on a timely basis. |
| | (b) | There were no changes in the Registrant’s internal control over financial reporting (as defined in Rule 30a-3(d) under the 1940 Act (17 CFR 270.30a-3(d)) that occurred during the registrant’s second fiscal quarter of the period covered by this report that has materially affected, or is reasonably likely to materially affect, the registrant’s internal control over financial reporting. |
Item 12. Exhibits.
| | (a)(1) | Code of ethics, or any amendments thereto, that is the subject of disclosure required by Item 2 is attached hereto. |
| | (a)(2) | Certifications pursuant to Rule 30a-2(a) under the 1940 Act and Section 302 of the Sarbanes-Oxley Act of 2002 are attached hereto. |
| | (b) | Certifications pursuant to Rule 30a-2(b) under the 1940 Act and Section 906 of the Sarbanes-Oxley Act of 2002 are attached hereto. |
(12.other) Not applicable.
SIGNATURES
Pursuant to the requirements of the Securities Exchange Act of 1934 and the Investment Company Act of 1940, the registrant has duly caused this report to be signed on its behalf by the undersigned, thereunto duly authorized.
| | |
| (Registrant) | | New Alternatives Fund |
| | |
| By (Signature and Title)* | | /s/ David J. Schoenwald |
| | David J. Schoenwald, President and Treasurer (Principal Executive Officer and Principal Financial Officer) |
Pursuant to the requirements of the Securities Exchange Act of 1934 and the Investment Company Act of 1940, this report has been signed below by the following persons on behalf of the registrant and in the capacities and on the dates indicated.
| | |
| By (Signature and Title)* | | /s/ David J. Schoenwald |
| | David J. Schoenwald, President and Treasurer (Principal Executive Officer and Principal Financial Officer) |
* Print the name and title of each signing officer under his or her signature.