UNITED STATES
SECURITIES AND EXCHANGE COMMISSION
Washington, D.C. 20549
FORM N-CSR
CERTIFIED SHAREHOLDER REPORT OF REGISTERED MANAGEMENT
INVESTMENT COMPANIES
Investment Company Act file number 811-03287
New Alternatives Fund
(Exact name of registrant as specified in charter)
150 Broadhollow Road, Suite PH2
Melville, New York 11747
(Address of principal executive offices) (Zip code)
David J. Schoenwald, President
New Alternatives Fund
150 Broadhollow Road, Suite PH2
Melville, New York 11747
(Name and address of agent for service)
Registrant’s telephone number, including area code: 631-423-7373
Date of fiscal year end: December 31
Date of reporting period: December 31, 2016
Form N-CSR is to be used by management investment companies to file reports with the Commission not later than 10 days after the transmission to stockholders of any report that is required to be transmitted to stockholders under Rule 30e-1 under the Investment Company Act of 1940 (17 CFR 270.30e-1). The Commission may use the information provided on Form N-CSR in its regulatory, disclosure review, inspection, and policymaking roles.
A registrant is required to disclose the information specified by Form N-CSR, and the Commission will make this information public. A registrant is not required to respond to the collection of information contained in Form N-CSR unless the Form displays a currently valid Office of Management and Budget (“OMB”) control number. Please direct comments concerning the accuracy of the information collection burden estimate and any suggestions for reducing the burden to Secretary, Securities and Exchange Commission, 450 Fifth Street, NW, Washington, DC 20549-0609. The OMB has reviewed this collection of information under the clearance requirements of 44 U.S.C. § 3507.
| Item 1. | Reports to Stockholders. |
The Report to Shareholders is attached herewith.
| | | | |

| | New Alternatives Fund A SOCIALLY RESPONSIBLE MUTUAL FUND EMPHASIZING ALTERNATIVE ENERGY AND THE ENVIRONMENT | | |
ANNUAL
FINANCIAL REPORT
CLASS A SHARES: NALFX
INVESTOR SHARES: NAEFX
DECEMBER 31, 2016
This report is submitted for the general information of the shareholders of the Fund. It is not authorized for distribution unless preceded or accompanied by a prospectus for the Fund.
| | | | | | | | |
| THE FUND | | 150 Broadhollow Road | | Melville, New York 11747 | | (800) 423-8383 | | (631) 423-7373 |
| BNY Mellon Investment Servicing (US) Inc. | | PO Box 9794 | | Providence, RI 02940 | | (800) 441-6580 | | (610) 382-7819 |
| Overnight Address | | 4400 Computer Drive | | Westborough, MA 01581 | | | | |
| Foreside Funds Distributors LLC | | 400 Berwyn Park, | | Berwyn, PA 19312 | | | | |
| | 899 Cassatt Road | | | | | | |
Recycled Paper
NEW ALTERNATIVES FUND
MANAGEMENT’S DISCUSSION OF FINANCIAL PERFORMANCE
FOR THE YEAR 2016
Fund Performance: The Net Asset Value (“NAV”) of New Alternatives Fund’s Class A Shares began at $46.46 on January 1, 2016 and closed at $47.78 after payment of a dividend from ordinary income of $0.67 per share and a long-term capital gain distribution of $1.10 per share on December 31, 2016. The Fund’s Investor Shares opened at an NAV of $46.39 on January 1, 2016 and ended the year on December 31, 2016 at $47.71 after payment of a dividend from ordinary income of $0.56 per share and a long-term capital gain distribution of $1.10 per share. The Fund’s net assets increased during the year from approximately $179 million on December 31, 2015 to approximately $182 million on December 31, 2016 due to appreciation of the Fund’s holdings.
During the period from January 1, 2016 to December 31, 2016, the number of the Fund’s Class A Shares outstanding decreased from 3,825,379 to 3,766,734 for a total loss of 58,645 shares. During that same period, we added a net of 10,074 of the Fund’s new Investor Shares, increasing the number of those shares outstanding to 38,727 from 28,653.
The Fund recorded steady growth through the first three quarters of the year. This increase was driven by strong performances in our European holdings and most of the Yieldcos in the Fund’s portfolio. As the U.S. presidential election drew closer and the Federal Reserve indicated that it would likely begin raising interest rates again, these same holdings began a retreat across the board. The Fund experienced a severe drop off in many of our companies’ share values in the 3 days following the election of Donald Trump as president. With a small recovery in late December 2016, the Fund’s Class A Shares closed up 6.66% and the Investor Shares closed up 6.42% at year end.
At December 31, 2016, 39.1% of the Fund’s portfolio was invested in U.S. based companies, down from 43.7% in 2015. European companies comprised 32.7% of the Fund’s holdings (with 20.2% priced in Euros and the remainder in other currencies, including those of Denmark, Great Britain and Norway). The rest of the Fund’s portfolio companies included: 12.9% in Canada, 6.1% in Bermuda, 5.5% in Asia (Japan, South Korea and New Zealand) and also 3.7% in cash in U.S. banks and credit unions.
Factors Affecting the Fund: Let’s get the first item on everyone’s mind out of the way: What does it mean for New Alternatives Fund and renewable energy in general now that Donald Trump is president? This is the person who, during the campaign, said that climate change was a hoax perpetrated by the Chinese to harm the U.S. energy industry. He’s also the same person who signed an open letter in 2009 calling on President Obama and Congress to ratify a global climate treaty and take action on climate change! Trump rarely holds to a consistent ideology (or thought). His administration shows every sign that it will be hostile to renewable energy, but it may not totally reverse course on existing clean energy development.
During his campaign, Trump stated that he would cancel U.S. participation in the Paris climate accords, dismantle the Obama administration’s Clean Power Plan and bring the coal industry back to life. Since his election and inauguration as president, he has filled his cabinet departments and federal agencies, including the Department of Energy (DOE) and the Environmental Protection Agency (EPA), with anti-science, climate change deniers with close ties to the fossil fuel industry across the board.
1
NEW ALTERNATIVES FUND
MANAGEMENT’S DISCUSSION OF FINANCIAL PERFORMANCE
FOR THE YEAR 2016
As president-elect, Trump did hold meetings with Al Gore and Leonardo DiCaprio to supposedly listen to their concerns about climate change and clean energy. He also had a visit with from Bill Gates to discuss “innovation and energy” according to statements Gates made afterwards. But, nothing he has done since these events indicates that his administration will be anything but hostile to renewable energy development and continuing efforts to reduce carbon emissions. The new administration’s default position, as stated by the new Chief of Staff Reince Priebus, is that climate change is “a bunch of bunk.”
Shortly after the election, a group of 365 companies and investors made a public plea to the incoming Trump administration to maintain support for the recent Paris accords and to continue to build a clean energy economy because doing otherwise would, according to the statement released: “put American prosperity at risk.” (www.lowcarbonusa.org).
It will be interesting to see how this administration, which has made job growth a cornerstone policy, will deal with the fact that renewable energy is one of the fastest growing sectors of the U.S. economy. In the most recent “U.S. Energy and Employment Report” issued by the Department of Energy (DOE) for 2016, “clean energy” (the DOE includes nuclear power and natural gas in this category), provided over 3 million jobs. Data published by the U.S. Bureau of Labor Statistics (BLS) put the number of jobs in the coal industry at 56,600 as of April, 2016. The BLS also listed “wind turbine technician” as the fastest growing job description in the U.S.
Looking past the panic and hype, what is likely to happen? We are hesitant to make predictions. Recent events have proven how perilous that can be. In the period before the election, stock markets, both in the U.S. and internationally, were trending down. The uncertainty and general tone of the campaign was unsettling for investors. A number of financial commentators predicted that markets would drop precipitously if Trump was elected. But, when the opening bells rang on Wednesday, November 9, most U.S. markets recorded modest gains and have been on a generally upward trend since then. Renewable energy related stocks and funds, including New Alternatives Fund, did not fare so well at first.
The Fund’s NAVs, both the Class A Shares and the Investor Shares, fell just over 6% from the day after the election (November 9) until the following Monday, November 14. From that point until the year end at December 31, the Fund’s NAVs both regained about 1% to finish the year up over 6% overall. The prevailing sentiment was that the incoming administration would pursue policies that would hinder renewable energy development added to a more general uncertainty about economic policy. After this interim period, share prices, including those in the Fund’s portfolio, have resumed an upward direction while we wait for the new president to establish his policies, if that ever actually happens.
2
NEW ALTERNATIVES FUND
MANAGEMENT’S DISCUSSION OF FINANCIAL PERFORMANCE
FOR THE YEAR 2016
It seems fairly clear that regardless of what the government does, the fortunes of our investments will largely be determined by broader international events and factors such as when and how much the Federal Reserve decides to raise interest rates. The only prediction we’re inclined to make is that it’s likely to be a bumpy ride ahead.
Portfolio Holdings and Changes:
New Investments in 2016: Our Semi-Annual Financial Report as of June 30, 2016 covers investments added to and sold from the Fund’s portfolio during the first six months of the year. You can read the report at:www.newalternativesfund.com/wp-content/uploads/2016/08/New-Alternatives-Fund-60-30-16-Semi-Annual-Report.pdf.
In the second half of 2016, we added six companies to the Fund’s portfolio holdings.
Completely new to the Fund is Dong Energy A/S, the Danish power company that has become the world’s largest developer and operator of offshore wind turbines. Branching out from its utility base in Denmark and the Netherlands, Dong develops and operates offshore wind farms in Denmark, the United Kingdom, and Germany, and is holding leases for offshore developments in the United States.
Hanwha Q Cells Company, Ltd. (South Korea) develops and manufactures solar cells and PV modules for solar power installations. Hanwha also develops and builds solar power projects to sell to third party operators. In addition to South Korea, they currently operate in the U.S., Europe, Japan, China, India and Turkey.
Despite its popularity and previous run ups in its stock price, we have passed on investing in Tesla, Inc. until now. Its electric cars combine great engineering with beautiful form. They have continued to improve their battery technology and to extend the functional range of their cars. However, for the company’s entire history, it’s been a money losing proposition. While Tesla was slowly closing the gap on its negative cash flow, we felt the time line for becoming a profitable enterprise was too long and uncertain. They were facing increasing competition from major auto manufacturers like Ford, General Motors and even Volkswagen, who were starting to produce electric cars that may not have been as “sexy” as Teslas, but were less expensive and featured longer driving range.
What changed our minds and led us to make a small (1,000 shares at present) investment in Tesla? They’ve changed and expanded their business in significant ways during the past year or so. They merged with Solar City, the installer and leaser of solar energy systems to residential, commercial and government customers. They have taken the battery technology they’ve been developing for their cars and created a new business line of power storage packs for both residential and utility scale use.
Another of the companies in the Fund’s portfolio, Panasonic Corporation, has been working with Tesla for years. Panasonic is the major supplier of the lithium-ion batteries that power Tesla’s cars and in their new “Power Wall” battery systems. Panasonic is Tesla’s partner in the construction of two major manufacturing facilities in the U.S. A “gigafactory” in Nevada will produce batteries for
3
NEW ALTERNATIVES FUND
MANAGEMENT’S DISCUSSION OF FINANCIAL PERFORMANCE
FOR THE YEAR 2016
both their cars and energy packs. Once the facility is up and operating at full capacity, it is projected to cut the production costs of batteries by more than half of their current prices. A second joint factory is being built in Buffalo, New York, to produce Panasonic-designed PV solar cells and modules for Tesla’s rooftop solar business line and to also power their battery storage units.
The company expects to earn a growing share of its income from its solar power and battery business. To reflect this, they recently changed their corporate name from “Tesla Motors, Inc.” to “Tesla, Inc.”
In December 2015, Trustpower Ltd., the New Zealand utility that we’ve held in the Fund for many years, announced that it was going to split into two companies. The “de-merger” took place in 2016 and as a result, New Alternatives Fund has ended up holding shares of both companies. The “new” Trustpower continues to operate as a mainly hydro powered utility and telecommunications provider in New Zealand and Australia. The new company, Tilt Renewables Ltd., has taken over Trustpower’s wind farms in New Zealand and Australia and will also develop solar facilities in Australia.
The last new holding in the Fund’s portfolio in 2016 was Whole Foods Market, Inc., the Austin, TX based organic and natural food retailer.
We added Abengoa SA, the Spanish renewable energy giant, back into the Fund. One of our earlier long-term holdings, Abengoa has been a major manufacturer and developer of both concentrated solar thermal (CST) and photovoltaic (PV) solar generation projects, biofuel producer, transmission line developer, and water desalinization and filtration project developer internationally. We sold off our shares in 2015 when the company flirted with bankruptcy after taking on excessive debt during a period of expansion. Abengoa has reorganized its management, worked out an agreement with its creditors and avoided bankruptcy. During this process, the company sold off some of its business units, such as those producing cellulosic ethanol, but its renewable energy assets continued to produce power and most existing construction advanced. The financial uncertainty depressed the stock price significantly, so it appeared as a good opportunity for New Alternatives Fund to buy back into one of our favorite companies. We have, however, kept our investment small at this point.
Holdings Sold in 2016: During the last six months of 2016, the Fund sold its positions in two smaller holdings: FuelCell Energy, Inc. and Xylem, Inc. FuelCell Energy manufactures solid oxide fuel cells for energy storage systems. Xylem manufactures and distributes water filtration and conservation systems. Both companies were sold, along with parts of other holdings, to raise cash for redemptions during the year.
Other Changes in the Fund: Over the course of the year, we usually buy and sell shares of our companies to balance the sectors of the Fund’s portfolio or to raise money to meet Fund share redemptions. Occasionally, we will sell off a particular company’s shares if the Advisor believes the share price has become overvalued. We will also buy additional shares if the Advisor concludes that a company’s share price has become undervalued in relation to its asset base or earnings.
4
NEW ALTERNATIVES FUND
MANAGEMENT’S DISCUSSION OF FINANCIAL PERFORMANCE
FOR THE YEAR 2016
During 2016, the Fund added to its holdings of 8point3 Energy Partners LP, Atlantica Yield PLC (formerly Abengoa Yield PLC), Acciona SA (Spain), Avangrid, Inc., EDP Renovaveis SA (Spain), NextEra Energy Partners LP, NRG Yield Inc., Class A, Panasonic Corporation (Japan), Pattern Energy Group, Inc., SunPower Corporation, TerraForm Power, Inc., Transalta Renewables Inc. (Canada), and Vestas Wind Systems A/S (Denmark).
The dividend yields of many of the YieldCos are extraordinary. The shares of most of the YieldCos in the Fund’s portfolio — 8Point3 Energy Partners, Atlantica Yield PLC, NextEra Energy Partners LP, Pattern Energy Group — have performed poorly, but their dividend payments should remain secure. They represent income received from credit worthy utilities or other direct purchasers of renewable power such as Alphabet, Inc. (Google),Amazon, Facebook and Intel. These increasingly large corporations have become direct purchasers of power from renewable projects for their energy needs. A number of large pension funds seeking reliable returns have also become shareholders of YieldCos.
In 2016, the Fund reduced our shares of: American Water Works Company, Inc., First Solar, Inc., Gamesa Corporacion Tecnologica, SA (Spain), Innergex Renewable Energy, Inc. (Canada), Johnson Controls, Inc., and Owens Corning, Inc.
Gainers and Losers: The companies in New Alternatives Fund that saw their share price rise during 2016 included Hafslund ASA-A shares, a Norwegian hydropower and district heating provider that was up 61.6%. Four of our Canadian-based renewable energy developers and operators saw their share prices rise as of December 31, 2016, including: Brookfield Renewable Energy Partners LP, up 13.4%; Transalta Renewables, Inc., up 38.3%; Northland Power, Inc., up 28.7%; and Innergex Renewable Energy, Inc., up 26.7%.
Other companies with positive results included: American Water Works Co., Inc., a water utility, up 21.1%; and Gamesa Corporacion Tecnologica, SA, the Spanish wind turbine manufacturer, up 17.9%. Tilt Renewables was up 13% from the initial de-merger price. Tesla, Inc., increased 12.2%. Finishing up our top gainers were: NRG Yield-A shares, a renewable power project Yieldco, up 10.4%; and Owens Corning, Inc, a manufacturer of insulation for energy efficiency and fiberglass composites for wind turbine blades, up 9.6%.
A number of the Fund’s companies shares experienced price declines in 2016. The companies with the greatest loses included most of our solar PV manufacturers and project developers, including: SunPower Corporation, down 77.9%; First Solar, Inc., down 49.8%; Canadian Solar, Inc., down 23.4%; and 8Point3 Energy Partners LP, down 19.5%. Other companies with falling share prices were three Spain based international renewable energy project developers: EDP Renovaveis SA, down 19.4%; Acciona SA, down 14.3%; and Abengoa SA-Class B shares, down 13.9%.
Cash and Treasury Holdings: We ended the year with approximately 3.6% of the Fund’s net assets in cash. We owned no short-term U.S. Treasury Bills as interest rates continued to be too low. Given these low rates, in recent years we have preferred to invest in stocks paying higher dividend rates and maintain enough of a cash position to take advantage of investment opportunities and to meet redemption demands if and when necessary.
5
NEW ALTERNATIVES FUND
MANAGEMENT’S DISCUSSION OF FINANCIAL PERFORMANCE
FOR THE YEAR 2016
Income from Dividends and Interest: The per share dividend for Class A Shares went down from $0.79 in 2015 to $0.67 in 2016. The per share dividend for Investor Shares was $0.56 in 2016, down from $0.74 in 2015.
Realized and Unrealized Capital Gain/Loss: The Fund also paid a net realized long-term capital gain of $1.10 per share for both Class A Shares and Investor Shares during 2016. During the year ended December 31, 2016, the Fund had net realized and unrealized gains of $9,698,921.
Another factor affecting our dividend income was payments we received from several of the companies in the portfolio were characterized as “return of capital” rather than dividends. Because these payments do not represent income on an investment, they do not add to the dividend. They do, however, add value back into the Fund, which raises the NAV, so shareholders do benefit in the sense that their investment will go up in value.
Expenses: The Fund’s cost of operations decreased slightly in 2016.The number of shareholder accounts decreased slightly and the net assets increased slightly during the year. The amounts paid to the investment advisor, Accrued Equities, Inc., the Bank of New York Mellon (the Fund’s custodian) and BNY Mellon Investment Servicing (U.S.), Inc. (the Fund’s accounting agent, transfer agent and administrator) are largely based on net assets. The Fund’s net assets increased during the first three quarters of 2016 and then decreased during the fourth quarter, still ending approximately 1.5% higher for the year. BNY Mellon, in its role as transfer agent, bases its fees on the number of shareholder accounts established during the year. This figure decreased slightly. While it was allocated across slightly fewer shares, the share decrease was lower than the decrease in expenses which lowered the expense ratio on Class A Shares from 1.15% in 2015 to 1.12% in 2016. The expense ratio for the Investor Shares includes an additional 12b-1 fee of 0.25% for an expense ratio on these shares of 1.37% for 2016, down from 1.40% in 2015. Total Fund Expenses decreased by $101,421 or 4.7%.
On-Line Capabilities: We continue to encourage all shareholders to create an on-line account log-on which is available through a link on our web site at: www.newalternativesfund.com.You can now use this access to open an account, purchase or redeem shares, check the current balance of your account, sign up for e-mail delivery of reports and documents, and perform account maintenance such as address changes.
Change in Investment Objective: In 2016, after notice to shareholders, the Fund changed the wording of its investment objective. Since the Fund commenced operations on September 3, 1982, its investment objective has been long-term capital appreciation. Effective April 30, 2016, the investment objective of the Fund is long-term capital appreciation, with income as a secondary objective.
6
NEW ALTERNATIVES FUND
MANAGEMENT’S DISCUSSION OF FINANCIAL PERFORMANCE
FOR THE YEAR 2016
This change in the Fund’s investment objective language is not intended to reflect any change in the Fund’s investment policies or strategies. Instead, it is meant to better describe the Fund’s investment portfolio. As discussed here, as well as in prior shareholder letters, many of the Fund’s eligible portfolio securities offer not only an opportunity for long-term capital appreciation but also provide dividend income. Examples include utilities, YieldCos, publicly-traded master limited partnerships (“MLPs”) and real estate investment trusts (“REITs”).
The Fund continues to seek to achieve its investment objective by investing in equity securities. The equity securities in which the Fund invests consist primarily of common stocks. Other equity securities in which the Fund may invest include depository receipts, REITs and MLPs. The Fund makes investments in a wide range of industries and in companies of all sizes. The Fund invests in equity securities of both U.S. and foreign companies, and has no limitation on the percentage of assets invested in the U.S. or abroad. Under normal market conditions, at least 25% of the Fund’s total assets will be invested in equity securities of companies in the alternative energy industry.
“Alternative Energy” means the production and conservation of energy in a manner that reduces pollution and harm to the environment, particularly when compared to conventional coal, oil or nuclear energy.
A Special Note to Shareholders of IRA Accounts: We want to remind you that the annual maintenance fee charged by the Fund’s transfer agent for IRA accounts was raised to $20 from $15 in 2016. For those of you who pay this fee directly, rather than have the funds automatically deducted from your account balance, please make note of the new fee amount.
7
New Alternatives Fund Class A Shares Growth of $10,000 vs. The S&P 500®Index
(Unaudited)
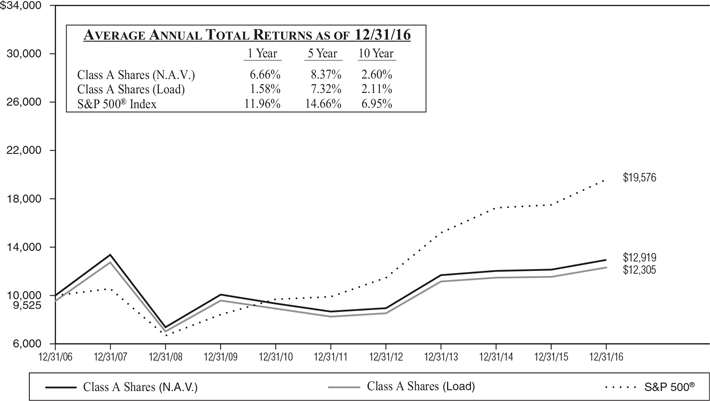
Performance quoted represents past performance and does not guarantee future results. Investment return and principal value will fluctuate so that shares, when redeemed, may be worth more or less than their original cost. Current performance may be lower or higher than that shown here. The “Load” performance quoted reflects a deduction for Class A Shares’ maximum front-end sales charge of 4.75%. Returns include the reinvestment of dividends and distributions. Performance data current to the most recent month-end may be obtained by calling 800-423-8383. The graph and table do not reflect the deduction of taxes that a Shareholder would pay on fund distributions or the redemption of fund shares.
8
New Alternatives Fund Investor Shares Growth of $10,000 vs. The S&P 500® Index
(Unaudited)
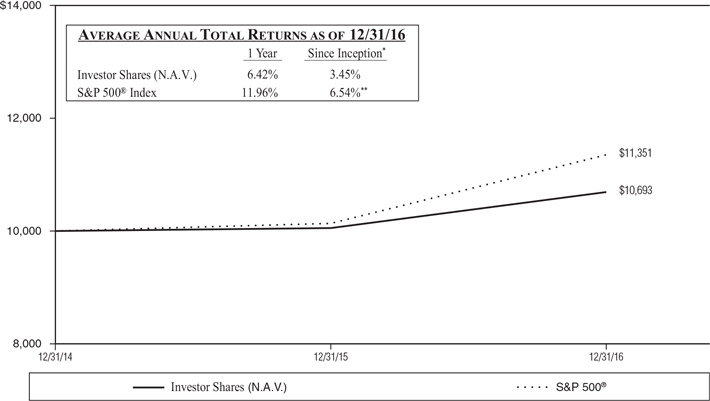
Performance quoted represents past performance and does not guarantee future results. Investment return and principal value will fluctuate so that shares, when redeemed, may be worth more or less than their original cost. Current performance may be lower or higher than that shown here. A 2.00% redemption fee applies to Investor Shares redeemed within 60 days of purchase. This redemption fee is not reflected in the returns shown above. Returns include the reinvestment of dividends and distributions. Performance data current to the most recent month-end may be obtained by calling 800-423-8383. The graph and table do not reflect the deduction of taxes that a Shareholder would pay on fund distributions or the redemption of fund shares.
The Fund’s total annual operating expenses, as stated in its current prospectus dated April 30, 2016 are 1.15% *** and 1.40%*** for the Class A Shares and the Investor Shares, respectively.
The S&P 500® Index is an unmanaged stock market index and does not reflect any asset-based charges for investment management or transaction expenses. You cannot invest directly in this index. Current and future portfolio holdings are subject to change and risk.
* The inception date for Investor Shares of New Alternatives Fund was December 31, 2014.
**The performance presented is from the inception date of the Investor Shares of the Fund only and is not from the inception date of the Fund’s broad-based securities market index.
*** Per prospectus. The expense ratio presented above may vary from the expense ratio presented in other sections of this report which is based on expenses incurred during the period covered by this report.
9
NEW ALTERNATIVES FUND
FUND EXPENSE EXAMPLE
(Unaudited)
As a shareholder of the Fund, you incur two types of costs: (1) transaction costs such as the sales charge and redemption fees; and (2) ongoing costs, including management fees, distribution (i.e., Rule 12b-1) fees and other Fund expenses. This example is intended to help you understand your ongoing costs (in dollars) of investing in the Fund and to compare these costs with the ongoing costs of investing in other mutual funds.
The example is based on an investment of $1,000 invested at the beginning of the period shown (July 1, 2016) and held for the entire six months ended December 31, 2016.
Actual Expenses
The first line of the table below provides information about actual account values and actual expenses. You may use the information in this line, together with the amount you invested, to estimate the expense that you paid over the period. Simply divide your account value by $1,000 (for example, an $8,600 account value divided by $1,000 = 8.6), then multiply the result by the number in the first line under the heading entitled “Expenses Paid During Six Months Ended December 31, 2016” to estimate the expenses you paid on your account during this period.
Note: The Fund’s Transfer Agent, BNY Mellon Investment Servicing (US) Inc., charges an annual IRA maintenance fee of $20 for IRA accounts. That fee is not reflected in the accompanying table.
Hypothetical Example for Comparison Purposes
The second line of the table below provides information about hypothetical account values and hypothetical expenses based on the Fund’s actual expense ratio and an assumed rate of return of 5% per year before expenses, which is not the Fund’s actual return. The hypothetical account values and expenses may not be used to estimate the actual ending account balance or expenses you paid for the period. You may use this information to compare the ongoing costs of investing in the Fund and other funds. To do so, compare this 5% hypothetical example with the 5% hypothetical examples that appear in the shareholder reports of other funds.
Please note that the expenses shown in the table are meant to highlight your ongoing costs only and do not reflect any transactional costs such as the sales charge, redemption fees or exchange fees. Therefore, the second line of the table is useful in comparing ongoing costs only, and will not help you determine the relative total costs of owning different funds. In addition, if transactional costs were included, your costs would have been higher.
10
NEW ALTERNATIVES FUND
(Unaudited)
| | | | | | |
| | | Beginning | | Ending | | Expenses Paid During |
| | | Account Value | | Account Value | | Six Months Ended |
| | | July 1, 2016 | | December 31, 2016 | | December 31, 2016 |
Class A Shares * | | | | | | |
Actual | | $1,000.00 | | $ 981.00 | | $5.58 |
Hypothetical (assumes 5% return before expenses) | | $1,000.00 | | $1,019.50 | | $5.69 |
Investor Shares ** | | | | | | |
Actual | | $1,000.00 | | $ 979.80 | | $6.82 |
Hypothetical (assumes 5% return before expenses) | | $1,000.00 | | $1,018.25 | | $6.95 |
* Expenses are equal to the annualized expense ratio of the Fund’s Class A Shares for the six-month period of 1.12%, multiplied by the average account value over the period, multiplied by the number of days (184) in the most recent fiscal half year, then divided by the days in the year (366) to reflect the half year period. The Class A Shares’ ending account value on the first line in the table is based on its actual total return of -1.90% for the six-month period of July 1, 2016 to December 31, 2016.
** Expenses are equal to the annualized expense ratio of the Fund’s Investor Shares for the six-month period of 1.37%, multiplied by the average account value over the period, multiplied by the number of days (184) in the most recent fiscal half year, then divided by the days in the year (366) to reflect the half year period. The Investor Shares’ ending account value on the third line in the table is based on its actual total return of -2.02% for the six-month period of July 1, 2016 to December 31, 2016.
11
NEW ALTERNATIVES FUND
SCHEDULE OF INVESTMENTS
December 31, 2016
(Unaudited)
| | | | | | | | |
| | | % of Net | | | | |
Sector Diversification | | Assets | | | Value | |
Alternate Energy: | | | | | | | | |
Renewable Energy Power Producers & Developers | | | 64.4% | | | | $117,050,964 | |
Wind Turbines | | | 10.4 | | | | 18,876,760 | |
Solar Photovoltaic | | | 5.6 | | | | 10,212,250 | |
Energy Storage | | | 4.2 | | | | 7,620,000 | |
Sustainable Energy Financial Services | | | 5.7 | | | | 10,444,500 | |
Energy Conservation | | | 4.2 | | | | 7,667,050 | |
Water Utilities | | | 1.0 | | | | 1,809,000 | |
Natural Food | | | 0.4 | | | | 769,000 | |
Transportation | | | 0.1 | | | | 213,690 | |
Certificates of Deposit | | | 0.3 | | | | 500,000 | |
Other Assets in Excess of Liabilities | | | 3.7 | | | | 6,658,337 | |
| | | | | | | | |
Net Assets | | | 100.0% | | | | $181,821,551 | |
| | | | | | | | |
Top Ten Portfolio Issuers
December 31, 2016
(Unaudited)
| | |
| | | % of Net |
Name | | Assets |
Brookfield Renewable Energy Partners LP (Canada/Bermuda) | | 6.1% |
NRG Yield, Inc., Class A & C | | 5.8 |
Hannon Armstrong Sustainable Infrastructure Capital, Inc., REIT | | 5.7 |
Acciona SA (Spain) | | 5.5 |
Vestas Wind Systems AS (Denmark) | | 5.4 |
Pattern Energy Group, Inc. | | 5.3 |
Avangrid, Inc. | | 5.2 |
EDP Renovaveis SA (Spain/Portugal) | | 5.1 |
Gamesa Corporacion Tecnologica SA (Spain) | | 5.0 |
Nextera Energy Partners LP | | 5.0 |
| | |
Total Top Ten | | 54.1% |
| | |
Portfolio holdings are subject to change, risk and may not represent current compositions of the portfolio.
12
NEW ALTERNATIVES FUND
SCHEDULE OF INVESTMENTS
December 31, 2016
| | | | | | | | |
| | | Shares | | | Value | |
COMMON STOCKS – 96.0% | | | | | | | | |
Alternate Energy — 84.6% | | | | | | | | |
Energy Storage — 4.2% | | | | | | | | |
Panasonic Corp. (Japan) SP ADR | | | 750,000 | | | $ | 7,620,000 | |
| | | | | | | | |
| | | | | | | 7,620,000 | |
| | | | | | | | |
Renewable Energy Power Producers & Developers — 64.4% | | | | | | | | |
Abengoa SA, Class B (Spain)** | | | 500,000 | | | | 98,949 | |
Acciona SA (Spain) | | | 135,000 | | | | 9,937,630 | |
Atlantica Yield PLC (Great Britain)* | | | 460,000 | | | | 8,901,000 | |
Avangrid, Inc. | | | 250,000 | | | | 9,470,000 | |
Brookfield Renewable Energy Partners LP (Canada/Bermuda) | | | 375,000 | | | | 11,137,500 | |
DONG Energy A/S (Denmark)** | | | 10,000 | | | | 378,903 | |
EDP Renovaveis SA (Spain/Portugal) | | | 1,450,000 | | | | 9,213,036 | |
Elecnor SA (Spain) | | | 125,000 | | | | 1,181,604 | |
Hafslund ASA, Class A (Norway) | | | 328,074 | | | | 3,580,744 | |
Innergex Renewable Energy, Inc. (Canada) | | | 850,000 | | | | 8,908,850 | |
Nextera Energy Partners LP* | | | 355,000 | | | | 9,066,700 | |
Northland Power, Inc. (Canada) | | | 300,000 | | | | 5,206,500 | |
NRG Yield, Inc., Class A* | | | 360,000 | | | | 5,529,600 | |
NRG Yield, Inc., Class C* | | | 315,000 | | | | 4,977,000 | |
Pattern Energy Group, Inc.* | | | 510,000 | | | | 9,684,900 | |
TerraForm Power, Inc., Class A*** | | | 675,000 | | | | 8,646,750 | |
Tilt Renewables Ltd. (New Zealand) | | | 500,000 | | | | 673,859 | |
TransAlta Renewables, Inc. (Canada) | | | 825,000 | | | | 8,811,000 | |
Trustpower Ltd. (New Zealand) | | | 500,000 | | | | 1,646,439 | |
| | | | | | | | |
| | | | | | | 117,050,964 | |
| | | | | | | | |
Solar Photovoltaic — 5.6% | | | | | | | | |
8Point3 Energy Partners LP* | | | 680,000 | | | | 8,826,400 | |
Canadian Solar, Inc. (Canada)** | | | 35,000 | | | | 426,300 | |
First Solar, Inc.** | | | 15,000 | | | | 481,350 | |
Hanwha Q Cells Co. Ltd. (South Korea) ADR** | | | 10,000 | | | | 81,600 | |
SunPower Corp.** | | | 60,000 | | | | 396,600 | |
| | | | | | | | |
| | | | | | | 10,212,250 | |
| | | | | | | | |
Wind Turbines — 10.4% | | | | | | | | |
Gamesa Corporacion Tecnologica SA (Spain) | | | 450,000 | | | | 9,128,087 | |
Vestas Wind Systems AS (Denmark) | | | 150,000 | | | | 9,748,673 | |
| | | | | | | | |
| | | | | | | 18,876,760 | |
| | | | | | | | |
Total Alternate Energy | | | | | | | 153,759,974 | |
| | | | | | | | |
Sustainable Energy Financial Services — 5.7% | | | | | | | | |
Hannon Armstrong Sustainable Infrastructure Capital, Inc., REIT | | | 550,000 | | | | 10,444,500 | |
| | | | | | | | |
| | | | | | | 10,444,500 | |
| | | | | | | | |
The accompanying notes are an integral part of these Financial Statements.
13
NEW ALTERNATIVES FUND
SCHEDULE OF INVESTMENTS (Continued)
December 31, 2016
| | | | | | | | |
| | | Shares | | | Value | |
| | |
Energy Conservation — 4.2% | | | | | | | | |
Johnson Controls International PLC (Ireland) | | | 50,000 | | | $ | 2,059,500 | |
Koninklijke Philips NV (Netherlands) | | | 175,000 | | | | 5,349,750 | |
Owens Corning, Inc. | | | 5,000 | | | | 257,800 | |
| | | | | | | | |
| | | | | | | 7,667,050 | |
| | | | | | | | |
Water Utilities — 1.0% | | | | | | | | |
American Water Works Co., Inc. | | | 25,000 | | | | 1,809,000 | |
| | | | | | | | |
| | | | | | | 1,809,000 | |
| | | | | | | | |
Natural Food — 0.4% | | | | | | | | |
Whole Foods Market, Inc. | | | 25,000 | | | | 769,000 | |
| | | | | | | | |
| | | | | | | 769,000 | |
| | | | | | | | |
Transportation — 0.1% | | | | | | | | |
Tesla Motors, Inc.** | | | 1,000 | | | | 213,690 | |
| | | | | | | | |
| | | | | | | 213,690 | |
| | | | | | | | |
Total Common Stocks (Cost $183,746,762) | | | | | | | 174,663,214 | |
| | | | | | | | |
| | | Par | | | | |
CERTIFICATES OF DEPOSIT – 0.3% | | | | | | | | |
Socially Concerned Banks — 0.3% | | | | | | | | |
Alternatives Federal Credit Union savings account 0.20% due 01/14/17 | | | $ 100,000 | | | | 100,000 | |
Carver Federal Savings Bank 0.25% due 12/22/17 | | | 100,000 | | | | 100,000 | |
People’s United Bank 0.30% due 12/01/17 | | | 100,000 | | | | 100,000 | |
Self Help Credit Union 1.05% due 12/30/17 | | | 100,000 | | | | 100,000 | |
Urban Partnership Bank 0.30% due 01/28/17 | | | 100,000 | | | | 100,000 | |
| | | | | | | | |
Total Certificates of Deposit (Cost $500,000) | | | | | | | 500,000 | |
| | | | | | | | |
| | |
TOTAL INVESTMENTS (Cost $184,246,762) — 96.3% | | | | | | | 175,163,214 | |
Other Assets in Excess of Liabilities — 3.7% | | | | | | | 6,658,337 | |
| | | | | | | | |
Net Assets — 100.0% | | | | | | $ | 181,821,551 | |
| | | | | | | | |
| * | These entities are commonly known as “Yieldco’s”. |
| ** | Non-income producing security |
| ADR | -American Depositary Receipts |
| PLC | -Public Limited Company |
| REIT | -Real Estate Investment Trust |
| SP ADR | -Sponsored American Depositary Receipts |
The accompanying notes are an integral part of these Financial Statements.
14
NEW ALTERNATIVES FUND
SCHEDULE OF INVESTMENTS (Concluded)
December 31, 2016
Country Portfolio Issuers
December 31, 2016
(Unaudited)
| | | | |
| | | % of Net | |
Country | | Assets | |
United States | | | 39.1% | |
Spain | | | 16.2 | |
Canada | | | 12.9 | |
Bermuda | | | 6.1 | |
Denmark | | | 5.6 | |
Great Britain | | | 4.9 | |
Japan | | | 4.2 | |
Netherlands | | | 2.9 | |
Norway | | | 2.0 | |
New Zealand | | | 1.3 | |
Ireland | | | 1.1 | |
South Korea | | | 0.0 | |
Other Assets/Liabilities | | | 3.7 | |
| | | | |
| | | 100.0% | |
| | | | |
The accompanying notes are an integral part of these Financial Statements.
15
NEW ALTERNATIVES FUND
STATEMENT OF ASSETS AND LIABILITIES
December 31, 2016
| | | | |
| ASSETS | |
Investment securities at fair value (cost: $184,246,762) (Notes 2A and 7) | | $ | 175,163,214 | |
Cash | | | 7,251,879 | |
Foreign currency at value (cost: $41,225) | | | 41,219 | |
Receivables: | | | | |
Investments sold | | | 211,962 | |
Capital shares subscribed | | | 107,161 | |
Dividends | | | 971,291 | |
Tax reclaims | | | 101,699 | |
Prepaid insurance and registration | | | 43,730 | |
| | | | |
Total Assets | | | 183,892,155 | |
| | | | |
| LIABILITIES | |
Payables: | | | | |
Capital shares reacquired | | | 438,848 | |
Distributions | | | 765,274 | |
Investments purchased | | | 617,597 | |
Management fees | | | 86,965 | |
Transfer agent fees | | | 73,789 | |
Professional fees | | | 37,643 | |
Custodian fees | | | 13,942 | |
12B-1 fees | | | 396 | |
Accrued expenses and other liabilities | | | 36,150 | |
| | | | |
Total Liabilities | | | 2,070,604 | |
| | | | |
Net Assets | | $ | 181,821,551 | |
| | | | |
| ANALYSIS OF NET ASSETS | |
Net capital paid in shares of capital shares | | $ | 192,197,698 | |
Distributions in excess of net investment income | | | (11,099 | ) |
Accumulated net realized loss on investments and foreign currency transactions | | | (1,273,624 | ) |
Net unrealized depreciation on investments | | | (9,083,548 | ) |
Net unrealized depreciation on translation of other assets and liabilities in foreign currencies | | | (7,876 | ) |
| | | | |
Net Assets | | $ | 181,821,551 | |
| | | | |
| |
Class A Shares: | | | | |
Net Assets | | $ | 179,974,024 | |
| Net asset value and redemption price per share ($179,974,024/3,766,734) shares of outstanding beneficial interest, unlimited authorization, no par value | | $ | 47.78 | |
| | | | |
Maximum offering price per share (100/95.25 of $47.78) | | $ | 50.16 | |
| | | | |
| |
Investor Shares: | | | | |
Net Assets | | $ | 1,847,527 | |
| Net asset value, offering and redemption* price per share ($1,847,527/38,727) shares of outstanding beneficial interest, unlimited authorization, no par value | | $ | 47.71 | |
| | | | |
| * | Redemption fee may apply (Note 1) |
The accompanying notes are an integral part of these financial statements.
16
NEW ALTERNATIVES FUND
STATEMENT OF OPERATIONS
For the Year Ended December 31, 2016
| | | | |
Investment Income: | | | | |
Dividends (net of $394,899 foreign taxes withheld) | | $ | 4,121,844 | |
| | | | |
Total Investment Income | | | 4,121,844 | |
| | | | |
| |
Expenses: | | | | |
Management fee (Note 4) | | | 1,048,750 | |
Transfer agent fees | | | 461,160 | |
Administration and accounting fees | | | 218,214 | |
Legal fees | | | 118,725 | |
Compliance service fees | | | 48,000 | |
Custodian fees | | | 39,294 | |
Registration fees | | | 29,540 | |
Audit fees | | | 21,250 | |
Trustees fees (Note 5) | | | 21,000 | |
Postage and printing fees | | | 19,833 | |
Insurance fees | | | 15,403 | |
12b-1 fees (Investor Shares) (Note 4) | | | 4,194 | |
Other expenses | | | 20,513 | |
| | | | |
Total Expenses | | | 2,065,876 | |
| | | | |
Net Investment Income | | | 2,055,968 | |
| | | | |
| |
Net Realized and Unrealized Gain/(Loss) from Investments and Foreign Currency Related Transactions: | | | | |
| |
Realized Gain from Investments and Foreign Currency Related Transactions (Notes 2B & 6): | | | | |
Net realized gain from investments | | | 3,906,219 | |
Net realized gain from foreign currency transactions | | | 1,713 | |
| | | | |
Net Realized Gain | | | 3,907,932 | |
| | | | |
| |
Net Change in Unrealized Appreciation/(Depreciation) on Investments and Foreign Currency Related Translations: | | | | |
Net change in unrealized appreciation/(depreciation) on investments | | | 5,789,915 | |
Net change in unrealized appreciation/(depreciation) on foreign currency translations | | | 1,074 | |
| | | | |
Net change in unrealized appreciation/(depreciation) | | | 5,790,989 | |
| | | | |
Net Realized and Unrealized Gain on Investments and Foreign Currency Related Translations | | | 9,698,921 | |
| | | | |
Net Increase in Net Assets Resulting from Operations | | $ | 11,754,889 | |
| | | | |
The accompanying notes are an integral part of these financial statements.
17
NEW ALTERNATIVES FUND
STATEMENTS OF CHANGES IN NET ASSETS
| | | | | | | | | | |
| | | For the | | For the |
| | | Year Ended | | Year Ended |
| | | December 31, 2016 | | December 31, 2015 |
Investment Activities: | | | | | | | | | | |
Net investment income | | | $ | 2,055,968 | | | | $ | 2,932,928 | |
Net realized gain from investments and foreign currency transactions | | | | 3,907,932 | | | | | 5,262 | |
Net change in unrealized appreciation/(depreciation) on investments and foreign currency translations | | | | 5,790,989 | | | | | (2,421,577 | ) |
| | | | | | | | | | |
Net increase in net assets resulting from operations | | | | 11,754,889 | | | | | 516,613 | |
| | | | | | | | | | |
| | |
Distributions to Shareholders: | | | | | | | | | | |
Class A Shares: | | | | | | | | | | |
Distributions from net investment income | | | | (2,444,095 | ) | | | | (2,998,444 | ) |
Distributions from realized gain on investments | | | | (4,024,703 | ) | | | | — | |
Investor Shares: | | | | | | | | | | |
Distributions from net investment income | | | | (20,860 | ) | | | | (20,899 | ) |
Distributions from realized gain on investments | | | | (41,256 | ) | | | | — | |
| | | | | | | | | | |
Total distributions to shareholders | | | | (6,530,914 | ) | | | | (3,019,343 | ) |
| | | | | | | | | | |
| | |
Capital Share Transactions: | | | | | | | | | | |
Net increase (decrease) in net assets from capital share transactions (Note 3) | | | | (2,476,091 | ) | | | | 5,634,044 | |
| | | | | | | | | | |
Total Increase in Net Assets | | | | 2,747,884 | | | | | 3,131,314 | |
| | |
Net Assets: | | | | | | | | | | |
Beginning of the year | | | | 179,073,667 | | | | | 175,942,353 | |
| | | | | | | | | | |
End of the year* | | | $ | 181,821,551 | | | | $ | 179,073,667 | |
| | | | | | | | | | |
| * | Includes distributions in excess of net investment income of $(11,099) and $(40,508) for the years ended 12/31/16 and 12/31/15, respectively. |
The accompanying notes are an integral part of these financial statements.
18
NEW ALTERNATIVES FUND*
FINANCIAL HIGHLIGHTS
STATEMENT OF PER SHARE INCOME AND CAPITAL CHANGES
For a share outstanding throughout each year
| | | | | | | | | | | | | | | | | | | | | | |
| Class A Shares | | For the Years Ended December 31, | | | |
| | | 2016 | | | 2015 | | | 2014 | | | 2013 | | | 2012 | | | |
Net asset value at the beginning of year | | $ | 46.46 | | | $ | 46.87 | | | $ | 46.93 | | | $ | 36.40 | | | $ | 35.82 | | |
| | | | | | | | | | | | | | | | | | | | | |
Investment Operations | | | | | | | | | | | | | | | | | | | | | |
Net investment income | | | 0.54 | ** | | | 0.77 | ** | | | 0.56 | | | | 0.58 | | | | 0.67 | | |
| Net realized and unrealized gain/(loss) on investments and foreign currency related transactions | | | 2.55 | | | | (0.39) | | | | 0.81 | | | | 10.53 | | | | 0.58 | | |
| | | | | | | | | | | | | | | | | | | | | |
Total from investment operations | | | 3.09 | | | | 0.38 | | | | 1.37 | | | | 11.11 | | | | 1.25 | | |
| | | | | | | | | | | | | | | | | | | | | |
Distributions | | | | | | | | | | | | | | | | | | | | | |
From net investment income | | | (0.67) | | | | (0.79) | | | | (0.63) | | | | (0.58) | | | | (0.67) | | |
From net realized gains | | | (1.10) | | | | — | | | | (0.80) | | | | — | | | | — | | |
| | | | | | | | | | | | | | | | | | | | | |
Total distributions | | | (1.77) | | | | (0.79) | | | | (1.43) | | | | (0.58) | | | | (0.67) | | |
| | | | | | | | | | | | | | | | | | | | | |
Net asset value at end of year | | $ | 47.78 | | | $ | 46.46 | | | $ | 46.87 | | | $ | 46.93 | | | $ | 36.40 | | |
| | | | | | | | | | | | | | | | | | | | | |
| | | | | | | | | | | | | | | | | | | | | |
Total return | | | | | | | | | | | | | | | | | | | | | |
(Sales load not reflected) | | | 6.66% | | | | 0.82% | | | | 2.91% | | | | 30.52% | | | | 3.49% | | |
Net assets, end of the year | | | | | | | | | | | | | | | | | | | | | |
(in thousands) | | $ | 179,974 | | | $ | 177,745 | | | $ | 175,843 | | | $ | 175,101 | | | $ | 149,835 | | |
Ratio of expenses to average net assets | | | 1.12% | | | | 1.15% | | | | 1.08% | | | | 1.12% | | | | 1.10% | | |
Ratio of net investment income to average net assets | | | 1.12% | | | | 1.55% | | | | 1.07% | | | | 1.34% | | | | 1.69% | | |
Portfolio turnover | | | 30.44% | | | | 37.14% | | | | 67.04% | | | | 24.01% | | | | 22.05% | | |
Number of shares outstanding at end of the year | | | 3,766,734 | | | | 3,825,379 | | | | 3,751,972 | | | | 3,731,230 | | | | 4,116,641 | | |
| * | The Fund acquired all of the assets and liabilities of New Alternatives Fund, Inc. (the “Predecessor Company”) in a reorganization on November 14, 2014. The Predecessor Company’s performance and financial history have been adopted by the Fund and will be used going forward. As a result, the information prior to November 14, 2014 reflects that of the Predecessor Company. |
| ** | The selected per share data was calculated using the average shares outstanding method for the period. |
The accompanying notes are an integral part of these financial statements.
19
NEW ALTERNATIVES FUND
FINANCIAL HIGHLIGHTS
STATEMENT OF PER SHARE INCOME AND CAPITAL CHANGES
For a share outstanding throughout each year
| | | | | | | | |
| Investor Shares | | Year Ended
December 31,
2016 | | | Year Ended
December 31,
2015* | |
| |
Net asset value at the beginning of year | | $ | 46.39 | | | $ | 46.87 | |
| | | | | | | | |
| | |
Investment Operations | | | | | | | | |
Net investment income | | | 0.42 | ** | | | 0.62 | ** |
Net realized and unrealized gain/(loss) on investments and foreign currency related transactions | | | 2.56 | | | | (0.36) | |
| | | | | | | | |
Total from investment operations | | | 2.98 | | | | 0.26 | |
| | | | | | | | |
| | |
Distributions | | | | | | | | |
From net investment income | | | (0.56) | | | | (0.74) | |
From net realized gains | | | (1.10) | | | | — | |
| | | | | | | | |
Total distributions | | | (1.66) | | | | (0.74) | |
| | | | | | | | |
Net asset value at end of year | | $ | 47.71 | | | $ | 46.39 | |
| | | | | | | | |
| | |
Total return | | | 6.42% | | | | 0.56% | |
Net assets, end of the year | | | | | | | | |
(in thousands) | | $ | 1,848 | | | $ | 1,329 | |
Ratio of expenses to average net assets | | | 1.37% | | | | 1.40% | |
Ratio of net investment income to average net assets | | | 0.87% | | | | 1.31% | |
Portfolio turnover | | | 30.44% | | | | 37.14% | |
Number of shares outstanding at end of the year | | | 38,727 | | | | 28,653 | |
| * | Investor Shares inception date was December 31, 2014. |
| ** | The selected per share data was calculated using the average shares outstanding method for the period. |
The accompanying notes are an integral part of these financial statements.
20
NEW ALTERNATIVES FUND
NOTES TO FINANCIAL STATEMENTS
For the Year Ended December 31, 2016
1) ORGANIZATION – New Alternatives Fund (the “Trust”) was organized as a Delaware statutory trust on June 12, 2014. The Trust currently offers one series of shares, also known as “New Alternatives Fund” (the “Fund”). The Fund is the successor to New Alternatives Fund, Inc. (the “Predecessor Company”), a New York corporation that commenced operations in 1982. The Fund is a diversified, open-end management investment company registered under the Investment Company Act of 1940, as amended (the “1940 Act”). On November 14, 2014, the Predecessor Company was reorganized into the Fund. The Fund was organized for the purpose of continuing the investment operations and performance history of the Predecessor Company and prior to the reorganization had no substantial assets or prior history of investment operations. The Fund currently offers two classes of shares: Class A Shares and Investor Shares. Class A Shares represent a continuance of the original class of shares offered by the Predecessor Company. Class A Shares are sold subject to a front-end sales charge. Class A Shares of the Fund do not have any distribution (i.e., Rule 12b-1) charges, service charges or redemption fees. Investor Shares are not subject to a sales charge but are subject to a 2.00% redemption fee imposed on any Investor Shares redeemed within sixty (60) days of their initial purchase. Any redemption fee imposed is retained by the Fund and is meant to deter short-term trading in Investor Shares and to offset any transaction and other costs associated with short-term trading. For the year ended December 31, 2016, no redemption fees were imposed on the redemption of Investor Shares. Investor Shares are also subject to 12b-1 fees. The investment objective of the Fund is long-term capital appreciation, with income as a secondary objective. The Fund seeks to achieve its investment objective by investing in equity securities. The equity securities in which the Fund invests consist primarily of common stocks. Other equity securities in which the Fund may invest include American Depositary Receipts, real estate investment trusts and publicly-traded master limited partnerships. The Fund makes investments in a wide range of industries and in companies of all sizes. The Fund invests in equity securities of both U.S. and foreign companies, and has no limitation on the percentage of assets invested in the U.S. or abroad. Under normal market conditions, at least 25% of the Fund’s total assets will be invested in equity securities of companies in the alternative energy industry. “Alternative Energy” means the production and conservation of energy to reduce pollution and harm to the environment, particularly when compared to conventional coal, oil or nuclear energy.
2) ACCOUNTING POLICIES – The Fund is an investment company that follows the accounting and reporting guidance of Accounting Standards Codification Topic 946 applicable to Investment Companies. The following is a summary of significant accounting policies followed by the Fund.
A. PORTFOLIO VALUATION – The Fund’s net asset value (“NAV”) is calculated once daily at the close of regular trading hours on the New York Stock Exchange (“NYSE”) (generally 4:00 p.m. Eastern time) on each day the NYSE is open. Securities held by the Fund are valued based on the official closing price or the last reported sale price on a national securities exchange or on the National Association of Securities Dealers Automatic Quotation System (“NASDAQ”) market system where they are primarily traded, as of the close of business on the day the
21
NEW ALTERNATIVES FUND
NOTES TO FINANCIAL STATEMENTS
For the Year Ended December 31, 2016
securities are being valued. That is normally 4:00 p.m. Eastern time. If there were no sales on that day or the securities are traded on other over-the-counter markets, the mean of the last bid and asked prices prior to the market close is used. Short-term debt securities having a remaining maturity of 60 days or less are valued based upon their amortized cost, provided that such amounts are representative of fair value.
Non-U.S. equity securities are valued based on their most recent closing market prices on their primary market and are translated from the local currency into U.S. dollars using current exchange rates on the day of valuation.
If the market price of a security held by the Fund is unavailable at the time the Fund prices its shares at 4:00 p.m. Eastern time, the Fund will use the “fair value” of such security as determined in good faith by Accrued Equities, Inc., the Fund’s investment advisor, under methods established by and under the general supervision of the Trust’s Board of Trustees. The Fund may use fair value pricing if the value of a security it holds has been materially affected by events occurring before the Fund’s pricing time but after the close of the primary markets or exchange on which the security is traded. This most commonly occurs with foreign securities, but may occur in other cases as well. Certain foreign securities are fair valued by utilizing an external pricing service in the event of any significant market movements between the time the Fund valued such foreign securities and the earlier closing of foreign markets. The Fund does not invest in unlisted securities.
The inputs and valuations techniques used to measure fair value of the Fund’s net assets are summarized into three levels as described in the hierarchy below:
| | | | | | |
| | ● | | Level 1 - | | Unadjusted quoted prices in active markets for identical assets or liabilities that the Fund has the ability to access. |
| | | |
| | ● | | Level 2 - | | Observable inputs other than quoted prices included in Level 1 that are observable for the asset or liability, either directly or indirectly. These inputs may include quoted prices for the identical instrument on an inactive market, prices for similar instruments, interest rates, prepayment speeds, credit risk, yield curves, default rates and similar data. |
| | | |
| | ● | | Level 3 - | | Unobservable inputs for the asset or liability, to the extent relevant observable inputs are not available, representing the Fund’s own assumptions about the assumptions a market participant would use in valuing the asset or liability, and would be based on the best information available. |
22
NEW ALTERNATIVES FUND
NOTES TO FINANCIAL STATEMENTS
For the Year Ended December 31, 2016
The inputs or methodology used for valuing securities are not necessarily an indication of the risk associated with investing in those securities.
The following is a summary of the inputs used, as of December 31, 2016, in valuing the Fund’s assets carried at fair value:
| | | | | | | | | | | | | | | | |
| | | Total
Value at
12/31/2016 | | | Level 1 –
Quoted
Price | | | Level 2 –
Significant
Observable
Inputs | | | Level 3 –
Significant
Unobservable
Inputs | |
Common Stocks | | | | | | | | | | | | | | | | |
Alternate Energy | | $ | 153,759,974 | | | $ | 153,759,974 | | | $ | — | | | $ | — | |
Sustainable Energy Financial | | | | | | | | | | | | | | | | |
Services | | | 10,444,500 | | | | 10,444,500 | | | | — | | | | — | |
Energy Conservation | | | 7,667,050 | | | | 7,667,050 | | | | — | | | | — | |
Water Utilities | | | 1,809,000 | | | | 1,809,000 | | | | — | | | | — | |
Natural Food | | | 769,000 | | | | 769,000 | | | | — | | | | — | |
Transportation | | | 213,690 | | | | 213,690 | | | | — | | | | — | |
Certificates of Deposit | | | 500,000 | | | | — | | | | 500,000 | | | | — | |
| | | | | | | | | | | | | | | | |
Total | | $ | 175,163,214 | | | $ | 174,663,214 | | | $ | 500,000 | | | $ | — | |
| | | | | | | | | | | | | | | | |
At the end of each calendar quarter, management evaluates the classification of Level 1, 2 and 3 assets and liabilities. Various factors are considered, such as changes in liquidity from the prior reporting period; whether or not a broker is willing to execute at the quoted price; the depth and consistency of prices from third party pricing services; and the existence of contemporaneous, observable trades in the market. Additionally, management evaluates the classification of Level 1 and Level 2 assets and liabilities on a quarterly basis for changes in listings or delistings on national exchanges.
The Fund utilizes an external pricing service to fair value certain foreign securities in the event of any significant market movements between the time the Fund valued certain foreign securities and the earlier closing of foreign markets. Such fair valuations are categorized as Level 2 in the hierarchy. Significant market movements were not deemed to have occurred at December 31, 2016, and therefore, the Fund did not utilize the external pricing service model adjustments. Transfers in and out between Levels are based on values at the end of the period. The Fund did not hold any Level 3 categorized securities during the year ended December 31, 2016.
B. FOREIGN CURRENCY TRANSLATION – Investment securities and other assets and liabilities denominated in foreign currencies are translated into U.S. dollar amounts at the date of valuation. Purchases and sales of investment securities and income and expense items
23
NEW ALTERNATIVES FUND
NOTES TO FINANCIAL STATEMENTS
For the Year Ended December 31, 2016
denominated in foreign currencies are translated into U.S. dollar amounts on the respective dates of such transactions. If foreign currency translations are not available, the foreign exchange rate(s) will be valued at fair market value using procedures approved by the Trust’s Board of Trustees.
The Fund does not isolate that portion of the results of operations resulting from changes in foreign exchange rates on investments from the fluctuations arising from changes in market prices of securities held. Such fluctuations are included with the net realized and unrealized gain or loss from investments.
Reported net realized foreign exchange gains or losses arise from sales of foreign currencies, currency gains or losses realized between the trade and settlement dates on securities transactions, and the difference between the amounts of dividends, interest, and foreign withholding taxes recorded on the Fund’s books and the U.S. dollar equivalent of the amounts actually received or paid.
Foreign Securities – Investing in foreign securities (including depositary receipts traded on U.S. exchanges but representing shares of foreign companies) involves more risks than investing in U.S. securities. Risks of investing in foreign companies include currency exchange rates between foreign currencies and the U.S. dollar. The political, economic and social structures of some foreign countries may be less stable and more volatile than those in the U.S. Brokerage commissions and other fees may be higher for foreign securities. Foreign companies may not be subject to the same disclosure, accounting, auditing and financial reporting standards as U.S. companies. These risks can increase the potential for losses in the Fund and affect its share price.
C. SECURITY TRANSACTIONS AND RELATED INVESTMENT INCOME – Security transactions are accounted for on the trade date (date order to buy or sell is executed). The cost of investments sold is determined by use of specific lots for both financial reporting and income tax purposes in determining realized gains and losses on investments.
D. INVESTMENT INCOME AND EXPENSE RECOGNITION – Dividend income is recorded as of the ex-dividend date. Foreign dividend income is recorded on the ex-dividend date or as soon as possible after the Fund determines the existence of a dividend declaration after exercising reasonable diligence. Interest income, including amortization/accretion of premium and discount, is accrued daily. Expenses are accrued on a daily basis.
E. DIVIDENDS AND DISTRIBUTIONS TO SHAREHOLDERS – Dividends from net investment income and distributions from net realized capital gains, if any, will be declared and paid at least annually to shareholders and recorded on ex-date. Income dividends and
24
NEW ALTERNATIVES FUND
NOTES TO FINANCIAL STATEMENTS
For the Year Ended December 31, 2016
capital gain distributions are determined in accordance with U.S. federal income tax regulations which may differ from accounting principles generally accepted in the United States of America.
F. U.S. TAX STATUS – No provision is made for U.S. income taxes as it is the Fund’s intention to qualify for and elect the tax treatment applicable to regulated investment companies under Subchapter M of the Internal Revenue Code of 1986, as amended, and make the requisite distributions to its shareholders which will be sufficient to relieve it from U.S. income and excise taxes.
G. USE OF ESTIMATES IN THE PREPARATION OF FINANCIAL STATEMENTS – The preparation of financial statements in conformity with accounting principles generally accepted in the United States of America requires management to make estimates and assumptions that affect the reported amounts of assets and liabilities and disclosure of contingent assets and liabilities at the date of the financial statements and the reported amounts of revenue and expenses during the reporting period. Actual results could differ from those estimates.
H. OTHER – In the normal course of business, the Fund may enter into contracts that provide general indemnifications. The Fund’s maximum exposure under these arrangements is dependent on claims that may be made against the Fund in the future, and therefore, cannot be estimated; however, based on experience, the risk of material loss for such claims is considered remote.
I. ALLOCATION – Investment income earned, realized capital gains and losses, and unrealized appreciation and depreciation for the Fund are allocated daily to each class of shares based upon its proportionate share of total net assets of the Fund. Class-specific expenses are charged directly to the class incurring the expense. Common expenses, which are not attributable to a specific class, are allocated daily to each class of shares based upon their proportionate share of total net assets of the Fund.
J. CASH – Cash represents amounts held on deposit with the Fund’s custodian bank. Balances at times may exceed federally insured limits.
25
NEW ALTERNATIVES FUND
NOTES TO FINANCIAL STATEMENTS
For the Year Ended December 31, 2016
3) SHARES OF BENEFICIAL INTEREST – There are unlimited, no par value shares of beneficial interest authorized. On December 31, 2016, the Fund’s total shares outstanding were 3,805,461. Aggregate paid-in capital including reinvestment of dividends was $192,197,698. Transactions in shares of beneficial interest were as follows:
| | | | | | | | | | | | | | | | |
| | | For the Year Ended | | | For the Year Ended | |
| | | December 31, 2016 | | | December 31, 2015 | |
| | | Shares | | | Amount | | | Shares | | | Amount | |
Class A Shares | | | | | | | | | | | | | | | | |
Shares of beneficial interest sold | | | 255,002 | | | | $ 12,335,424 | | | | 440,493 | | | | $ 22,549,849 | |
Reinvestment of distributions | | | 119,496 | | | | 5,704,759 | | | | 55,885 | | | | 2,597,838 | |
Redemptions | | | (433,143 | ) | | | (21,015,228 | ) | | | (422,971 | ) | | | (20,794,493 | ) |
| | | | | | | | | | | | | | | | |
Net Increase (Decrease) | | | (58,645 | ) | | | $ (2,975,045 | ) | | | 73,407 | | | | $ 4,353,194 | |
| | | | | | | | | | | | | | | | |
| | |
| | | For the Year Ended | | | For the Year Ended | |
| | | December 31, 2016 | | | December 31, 2015 | |
| | | Shares | | | Amount | | | Shares | | | Amount | |
Investor Shares | | | | | | | | | | | | | | | | |
Shares of beneficial interest sold | | | 12,370 | | | | $ 610,800 | | | | 27,036 | | | | $1,303,085 | |
Reinvestment of distributions | | | 1,278 | | | | 60,879 | | | | 440 | | | | 20,422 | |
Redemptions | | | (3,574 | ) | | | (172,725 | ) | | | (933 | ) | | | (42,657 | ) |
| | | | | | | | | | | | | | | | |
Net Increase | | | 10,074 | | | | $ 498,954 | | | | 26,543 | | | | $1,280,850 | |
| | | | | | | | | | | | | | | | |
4) MANAGEMENT FEE AND OTHER TRANSACTIONS WITH AFFILIATES–Accrued Equities, Inc. (“Accrued Equities” or the “Advisor”), an SEC registered investment advisor and broker-dealer, serves as investment advisor to the Fund pursuant to an Investment Advisory Agreement, and as an underwriter (but not a principal underwriter) of the Fund’s shares pursuant to a Sub-Distribution Agreement. For it’s investment advisory services, the Fund pays Accrued Equities an annual management fee of 1.00% of the first $25 million of average daily net assets; 0.50% of the next $475 million of average daily net assets; and 0.40% of average daily net assets more than $500 million. The Fund incurred management fees of $1,048,750 for the year ended December 31, 2016.
The Fund pays no remuneration to two of its trustees, David J. Schoenwald and Murray D. Rosenblith, who are also officers or employees of Accrued Equities.
26
NEW ALTERNATIVES FUND
NOTES TO FINANCIAL STATEMENTS
For the Year Ended December 31, 2016
Foreside Funds Distributors LLC (the “Distributor”) serves as the principal underwriter of the Fund pursuant to a Distribution Agreement for the limited purpose of acting as statutory underwriter to facilitate the distribution of shares of the Fund. The Distributor has entered into a Sub-Distribution Agreement with Accrued Equities. The Fund charges a maximum front-end sales charge of 4.75% on most new sales of the Fund’s Class A Shares. Of this amount, the Distributor and Accrued Equities receive the net underwriter commission and pay out the remaining sales commission to other brokers who actually sell new Class A Shares. Their share of the sales commission may vary. The aggregate underwriter commissions on all sales of Class A Shares of the Fund during the year ended December 31, 2016 was $36,225, and the amounts received by the Distributor and Accrued Equities were $12,075 and $24,150, respectively. The Distributor and Accrued Equities are also entitled to receive sales commissions for the sale of Class A Shares. For the year ended December 31, 2016, the Distributor and Accrued Equities received $6,708 and $23,219 in sales commissions, respectively, for the sale of Class A Shares of the Fund. Underwriter commissions and sales commissions received by the Distributor are set aside by the Distributor and used solely for distribution-related expenses.
Investor Shares of the Fund are not subject to a sales charge. The Fund has adopted a distribution plan (the “Rule 12b-1 Plan”) for its Investor Shares in accordance with the requirements of Rule 12b-1 under the 1940 Act. The Rule 12b-1 Plan provides that the Fund may pay a fee to Accrued Equities, the Distributor, or certain broker-dealers, investment advisers, banks or other financial institutions at an annual rate of up to 0.25% of the average daily net assets of the Fund’s Investor Shares to finance certain activities primarily intended to sell such Investor Shares. For the year ended December 31, 2016, 12b-1 Fees of $4,194 were accrued by the Investor Shares of the Fund.
5) TRUSTEES’ FEES – For the year ended December 31, 2016, the Fund paid trustees’ fees of $21,000 to its Trustees who are not “interested persons” of the Trust, as that term is defined in the 1940 Act (the “Independent Trustees”).
Each Independent Trustee receives an annual fee of $4,500 for their services as an Independent Trustee of the Trust. As Vice-Chairperson of the Trust’s Board of Trustees, Sharon Reier receives an additional annual fee of $1,000. Each member of the Audit Committee receives an additional $500 annual fee and Susan Hickey, Chairperson of the Audit Committee, receives an additional annual fee of $500. The Independent Trustees also receive reimbursement of “coach” travel expenses to attend Board Meetings. The Trustees and Officers of the Trust who are officers and employees of the Advisor do not receive compensation from the Fund for their services and are paid for their services by the Advisor. The Fund’s Chief Compliance Officer is not an officer or employee of the Advisor and is compensated directly by the Fund for his services.
6) PURCHASES AND SALES OF SECURITIES – For the year ended December 31, 2016, the aggregate cost of securities purchased totaled $54,098,440. Net realized gains (losses) were computed on a specific lot basis. The proceeds received on sales of securities for the year ended December 31, 2016 was $57,127,016.
27
NEW ALTERNATIVES FUND
NOTES TO FINANCIAL STATEMENTS
For the Year Ended December 31, 2016
7) FEDERAL INCOME TAX INFORMATION – At December 31, 2016, the federal tax basis cost and aggregate gross unrealized appreciation and depreciation of securities held by the Fund were as follows:
| | | | |
Cost of investments for tax purposes | | $ | 185,582,631 | |
| | | | |
Unrealized appreciation for tax purposes | | $ | 15,498,890 | |
Unrealized depreciation for tax purposes | | | (25,918,307 | ) |
| | | | |
Net unrealized depreciation on investments | | $ | (10,419,417 | ) |
| | | | |
The tax character of distributions paid during 2016 and 2015 was as follows:
| | | | | | | | |
Distributions paid from: | | | 2016 | | | | 2015 | |
Ordinary Income | | $ | 2,464,955 | | | $ | 3,019,343 | |
Long-Term Capital Gains | | | 4,065,959 | | | | — | |
| | | | | | | | |
| | $ | 6,530,914 | | | $ | 3,019,343 | |
| | | | | | | | |
For federal income tax purposes, distributions from net investment income and short-term capital gains are treated as ordinary income dividends.
The following permanent differences as of December 31, 2016, attributable to transactions involving foreign securities and currencies and investments in partnerships were reclassified to the following accounts:
| | | | |
Accumulated Net Realized Loss | | $ | (438,396 | ) |
Distributions in Excess of Net Investment Income | | | 438,396 | |
As of December 31, 2016, the components of distributable earnings (deficit) on a tax basis were as follows:
| | | | |
Overdistributed Ordinary Income | | $ | (11,099 | ) |
Undistributed Capital Gains | | | 62,245 | |
Net Unrealized Depreciation on | | | | |
Investments and Foreign Currency Translations* | | | (10,427,293 | ) |
| | | | |
| | $ | (10,376,147 | ) |
| | | | |
* The primary difference between distributable earnings on a book and tax basis is due to wash sale losses and investments in partnerships.
Management has analyzed the Fund’s tax positions taken on federal income tax returns for all open tax years (current and prior three tax years), and has concluded that no provision for federal income
28
NEW ALTERNATIVES FUND
NOTES TO FINANCIAL STATEMENTS
For the Year Ended December 31, 2016
tax is required in the Fund’s financial statements. The Fund’s federal and state income and federal excise tax returns for tax years for which the applicable statutes of limitations have not expired are subject to examination by the Internal Revenue Service and state departments of revenue.
8) SUBSEQUENT EVENTS – Management has evaluated the impact of all subsequent events on the Fund through the date the financial statements were available to be issued, and has determined that there were no subsequent events requiring disclosure.
9) REGULATORY UPDATES –On October 13, 2016, the SEC amended existing rules intended to modernize reporting and disclosure of information. These amendments relate to Regulation S-X which sets forth the form and content of financial statements. At this time, management is evaluating the implications of adopting these amendments and their impact on the financial statements and accompanying notes.
29

REPORT OF INDEPENDENT REGISTERED PUBLICACCOUNTING FIRM
To the Shareholders and Board of Trustees of
New Alternatives Fund
We have audited the accompanying statement of assets and liabilities of New Alternatives Fund, (the “Fund”) including the schedule of investments, as of December 31, 2016, and the related statement of operations for the year then ended, the statements of changes in net assets for each of the years in the two-year period then ended and the financial highlights for each of the years in the five-year period then ended. These financial statements and financial highlights are the responsibility of the Fund’s management. Our responsibility is to express an opinion on these financial statements and financial highlights based on our audits.
We conducted our audits in accordance with the standards of the Public Company Accounting Oversight Board (United States). Those standards require that we plan and perform the audits to obtain reasonable assurance about whether the financial statements and financial highlights are free of material misstatement. An audit includes examining, on a test basis, evidence supporting the amounts and disclosures in the financial statements. Our procedures included confirmation of securities owned as of December 31, 2016 by correspondence with the custodian and brokers. An audit also includes assessing the accounting principles used and significant estimates made by management, as well as evaluating the overall financial statement presentation. We believe that our audits provide a reasonable basis for our opinion.
In our opinion, the financial statements and financial highlights referred to above present fairly, in all material respects, the financial position of New Alternatives Fund as of December 31, 2016, and the results of its operations for the year then ended, the changes in its net assets for each of the years in the two-year period then ended and its financial highlights for each of the years in the five-year period then ended, in conformity with accounting principles generally accepted in the United States of America.
| | |
| Philadelphia, Pennsylvania | | 
BBD, LLP |
| February 28, 2017 | | |
30
OTHER INFORMATION
(Unaudited)
1) PROXY VOTING – The Fund has proxy voting policies which are available: (1) without charge, upon request by calling the Fund at 800-423-8383 and (2) on the SEC’s website at http://www.sec.gov. Information regarding how the Fund voted proxies during the most recent twelve-month period ended June 30 is available on form N-PX: (1) without charge, upon request, by calling the Fund at 800-423-8383 and (2) on the SEC’s website at http://www.sec.gov.
2) QUARTERLY PORTFOLIO SCHEDULES – The Fund files a complete schedule of portfolio holdings with the SEC for the first and third quarters of each fiscal year (quarters ended March 31 and September 30) on Form N-Q. The Fund’s Form N-Q’s are available on the SEC website at http://www.sec.gov and may be reviewed and copied at the SEC Public Reference Room in Washington, D.C. Information on the operation of the SEC Public Reference Room may be obtained by calling 1-800-SEC-0330.
31
NEW ALTERNATIVES FUND
SHAREHOLDER TAX INFORMATION (Unaudited)
During the fiscal year ended December 31, 2016, the following dividends were paid by the Fund:
| | | | |
Ordinary Income | | $ | 2,464,955 | |
Long-term Capital Gains | | $ | 4,065,959 | |
The Fund paid foreign taxes of $394,899 and recognized foreign source income of $2,148,371 pursuant to Section 853 of the Internal Revenue Code. The Fund will elect to pass these foreign taxes through to shareholders as a foreign tax credit and designates such amounts as having been paid in connection with dividends distributed from investment taxable income during the year ended December 31, 2016.
For the year ended December 31, 2016, certain dividends may be subject to a maximum capital gains tax rate, as provided for by the Jobs and Growth Tax Relief Reconciliation Act of 2003. For individual shareholders, 100% of their ordinary income dividends for the Fund qualify for the maximum capital gains tax rate. Complete information will be computed and reported in conjunction with your Form 1099-DIV.
For corporate shareholders, 64.61% of the ordinary income dividends qualify for the dividends received deduction.
Shareholders are advised to consult their own tax advisors with respect to the tax consequences of their investments in the Fund.
32
BOARD OF TRUSTEES AND OFFICERS
(Unaudited)
The Predecessor Company was a New York corporation governed by a Board of Directors. The Board of Directors of the Predecessor Company was identical to the Trust’s current Board of Trustees. Information pertaining to the Trustees and Officers of the Trust is provided in the table below. Certain information on the Trustees includes information on such Trustee’s service on the Board of Directors of the Predecessor Company. The Statement of Additional Information includes additional information about the Trustees and is available without charge, upon request, by calling the Fund at 800-423-8383 or by visiting the Fund’s website at www.newalternatviesfund.com. The mailing address for the Trustees and Officers of the Trust is c/o New Alternatives Fund, 150 Broadhollow Road, Suite PH2, Melville, New York 11747.
| | | | | | | | | | |
| | | | | | | | | Number of | | All |
| | | | | | | | | Portfolios in | | Directorships |
| | | | | | | | | Trust | | Held by |
| | | | | Term of | | Principal | | Complex | | Trustee |
| | | Position(s) | | Office and | | Occupation(s) | | To Be | | During the |
| | | Held with | | Length of | | During the Past | | Overseen by | | Past Five |
Name and Year of Birth | | the Trust | | Time Served1 | | Five Years | | Trustee2 | | Years3 |
| | | | | |
Interested Trustee: | | | | | | | | | | |
| | | | | |
David J. Schoenwald* 1949 | | Founder, Trustee, President, Treasurer and Chairperson of the Board | | Founder, Trustee, President and Treasurer, 1982 to present; Chairperson of the Board, 2008 to present. | | President, Treasurer and Portfolio Manager, Accrued Equities, Inc.** | | 1 | | None |
| | | | | |
Murray D. Rosenblith* 1951 | | Trustee and Secretary | | Trustee, 2003 to present; Secretary, 2012 to present; Assistant Secretary, 2009 to 2012. | | Portfolio Manager and Assistant Compliance Officer (2010 to present), and employee, Accrued Equities, Inc.** (2008 to present); formerly, Executive Director, A.J. Muste Memorial Institute, an organization concerned with exploration of the link between non- violence and social change (1985 to 2008). | | 1 | | None |
33
BOARD OF TRUSTEES AND OFFICERS
(Unaudited)
| | | | | | | | | | |
| | | | | | | | | Number of | | All |
| | | | | | | | | Portfolios in | | Directorships |
| | | | | | | | | Trust | | Held by |
| | | | | Term of | | Principal | | Complex | | Trustee |
| | | Position(s) | | Office and | | Occupation(s) | | To Be | | During the |
| | | Held with | | Length of | | During the Past | | Overseen by | | Past Five |
Name and Year of Birth | | the Trust | | Time Served1 | | Five Years | | Trustee2 | | Years3 |
| | | | | |
Independent Trustees: | | | | | | | | | | |
| | | | | |
Sharon Reier 1946 | | Trustee and Vice- Chairperson of the Board | | Trustee, 1982 to present; Vice- Chairperson, 2008 to present. | | Retired; prior thereto, freelance financial journalist; Contributor to the International Herald Tribune, (1995 to 2011); former contributor to Business Week International; former regional editor, Financial World; former editor, Boardroom Reports; former contributing editor, Institutional Investor; former staff, Forbes and American Banker. | | 1 | | None |
| | | | | |
Susan Hickey 1952 | | Trustee, Audit Committee Member and Audit Committee Chairperson | | Trustee and Audit Committee Member, 2005 to present; Audit Committee Chairperson, 2014 to present. | | Self-Employed Tax Preparer (1983 to present); prior thereto, Accounting Software Developer, AccountantsWorld, LLC. (until 2016); Member of National Association of Enrolled Agents and New York Society of Independent Accountants; Former IRS Tax Return Auditor; BA International Affairs, Stonehill College, North Easton, MA. | | 1 | | None |
34
BOARD OF TRUSTEES AND OFFICERS
(Unaudited)
| | | | | | | | | | |
| | | | | | | | | Number of | | All |
| | | | | | | | | Portfolios in | | Directorships |
| | | | | | | | | Trust | | Held by |
| | | | | Term of | | Principal | | Complex | | Trustee |
| | | Position(s) | | Office and | | Occupation(s) | | To Be | | During the |
| | | Held with | | Length of | | During the Past | | Overseen by | | Past Five |
Name and Year of Birth | | the Trust | | Time Served1 | | Five Years | | Trustee2 | | Years3 |
| | | | | |
Jonathan D. Beard 1948 | | Trustee and Audit Committee Member | | Trustee, 2005 to present; Audit Committee Member, 2014 to present. | | Retired; prior thereto, Self-employed Freelance Journalist for various American and European Science Magazines; Lifetime Member, Sierra Club and New York-New Jersey Trails Conference; Graduate of Columbia University 1970. | | 1 | | None |
| | | | | |
Jeffrey E. Perlman 1979 | | Trustee and Audit Committee Member | | Trustee, 2009 to present; Audit Committee Member, 2014 to present. | | President and Founder, Bright Power, a company advancing clean, cost-effective energy solutions (2004 to present); Clarinetist/ Saxophonist, Romashka and various Klezmer music ensembles (1996 to present); Formerly, Consultant, Capital E, a renewable energy consulting and investment services company (2002 to 2005). | | 1 | | None |
| | |
Officers of the Trust who are not Trustees: | | | | |
| | | | | |
Joseph A. Don Angelo 1948 | | Chief Compliance Officer | | 2007 to present. | | Certified Public Accountant and Owner, Don Angelo and Associates, CPAs P.C. (1984 to present). | | N/A | | N/A |
35
BOARD OF TRUSTEES AND OFFICERS
(Unaudited)
| 1 | Each Trustee holds office until the next annual meeting of shareholders at which Trustees are elected following his or her election or appointment and until his or her successor has been elected and qualified. Officers are appointed on an annual basis and serve at the pleasure of the Trustees. |
| 2 | Currently, there is only one portfolio and no fund complex. |
| 3 | Includes directorships of companies required to report to the SEC under the Securities Exchange Act of 1934, as amended (i.e., “public companies”), or other investment companies registered under the 1940 Act. |
| * | “Interested person”, as defined in section 2(a)(19) of the 1940 Act. David J. Schoenwald is majority shareholder and President of the Advisor. Murray D. Rosenblith is considered an “interested person” as a result of his employment with the Advisor. |
| ** | David J. Schoenwald and Murray D. Rosenblith have no present enterprise, employment, position or commercial investment activity except for their positions with the Advisor, which is also the Fund’s Sub-Distributor. At the present time, the Advisor provides services only to the Fund. |
36
This page intentionally left blank.
37
This page intentionally left blank.
38
This page intentionally left blank.
39
| (a) | The registrant, as of the end of the period covered by this report, has adopted a code of ethics that applies to the registrant’s principal executive officer, principal financial officer, principal accounting officer or controller, or persons performing similar functions, regardless of whether these individuals are employed by the registrant or a third party. |
| (c) | There have been no amendments, during the period covered by this report, to a provision of the code of ethics that applies to the registrant’s principal executive officer, principal financial officer, principal accounting officer or controller, or persons performing similar functions, regardless of whether these individuals are employed by the registrant or a third party, and that relates to any element of the code of ethics description. |
| (d) | The registrant has not granted any waivers, including an implicit waiver, from a provision of the code of ethics that applies to the registrant’s principal executive officer, principal financial officer, principal accounting officer or controller, or persons performing similar functions, regardless of whether these individuals are employed by the registrant or a third party, that relates to one or more of the items set forth in paragraph (b) of this item’s instructions. |
| Item 3. | Audit Committee Financial Expert. |
As of the end of the period covered by the report, the registrant’s Board of Trustees has determined that Susan Hickey is qualified to serve as an audit committee financial expert serving on its audit committee and that she is “independent,” as defined by Item 3 of Form N-CSR.
| Item 4. | Principal Accountant Fees and Services. |
Audit Fees
| (a) | The aggregate fees billed for each of the last two fiscal years for professional services rendered by the principal accountant for the audit of the registrant’s annual financial statements or services that are normally provided by the accountant in connection with statutory and regulatory filings or engagements for those fiscal years are $19,250 for 2015 and $19,250 for 2016. |
Audit-Related Fees
| (b) | The aggregate fees billed in each of the last two fiscal years for assurance and related services by the principal accountant that are reasonably related to the performance of the audit of the registrant’s financial statements and are not reported under paragraph (a) of this Item are $0 for 2015 and $0 for 2016. |
Tax Fees
| (c) | The aggregate fees billed in each of the last two fiscal years for professional services rendered by the principal accountant for tax compliance, tax advice, and tax planning are $2,000 for 2015 and $2,000 for 2016. The fees billed were for review by the principal accountant of the registrant’s Federal tax returns. |
All Other Fees
| (d) | The aggregate fees billed in each of the last two fiscal years for products and services provided by the principal accountant, other than the services reported in paragraphs (a) through (c) of this Item are $0 for 2015 and $0 for 2016. |
| (e)(1) | Disclose the audit committee’s pre-approval policies and procedures described in paragraph (c)(7) of Rule 2-01 of Regulation S-X. |
| | The audit committee will be responsible for evaluating the provision of non-audit services to the registrant as required by Section 201 of the Sarbanes-Oxley Act of 2002 and the rules and regulations promulgated thereunder (collectively, the “2002 Act”) and any pre-approval requests submitted by the independent accountants as required by Section 202 of the 2002 Act. |
| (e)(2) | The percentage of services described in each of paragraphs (b) through (d) of this Item that were approved by the audit committee pursuant to paragraph (c)(7)(i)(C) of Rule 2-01 of Regulation S-X are as follows: |
(b) Not applicable
(c) 100%
(d) Not applicable
| (f) | The percentage of hours expended on the principal accountant’s engagement to audit the registrant’s financial statements for the most recent fiscal year that were attributed to work performed by persons other than the principal accountant’s full-time, permanent employees was less than fifty percent. |
| (g) | The aggregate non-audit fees billed by the registrant’s accountant for services rendered to the registrant, and rendered to the registrant’s investment adviser (not including any sub-adviser whose role is primarily portfolio management and is subcontracted with or overseen by another investment adviser), and any entity controlling, controlled by, or under common control with the adviser that provides ongoing services to the registrant for each of the last two fiscal years of the registrant was $0 for 2015 and $0 for 2016. |
| Item 5. | Audit Committee of Listed Registrants. |
Not applicable to registrant.
| (a) | Not applicable. The full Schedule of Investments in securities of unaffiliated issuers as of the close of the reporting period is included as part of the audited annual report to shareholders filed under Item 1 of this Form. |
| Item 7. | Disclosure of Proxy Voting Policies and Procedures for Closed-End Management Investment Companies. |
Not applicable to registrant, which is an open-end management investment company.
| Item 8. | Portfolio Managers of Closed-End Management Investment Companies. |
Not applicable to registrant, which is an open-end management investment company.
| Item 9. | Purchases of Equity Securities by Closed-End Management Investment Company and Affiliated Purchasers. |
Not applicable to Registrant, which is an open-end management investment company.
| Item 10. | Submission of Matters to a Vote of Security Holders. |
There have been no material changes to the procedures by which the shareholders may recommend nominees to the registrant’s Board of Trustees, where those changes were implemented after the registrant last provided disclosure in response to the requirements of Item 407(c)(2)(iv) of Regulation S-K (17 CFR 229.407) (as required by Item 22(b)(15) of Schedule 14A (17 CFR 240.14a-101)), or this Item.
| Item 11. | Controls and Procedures. |
| (a) | Based on his evaluation of the registrant’s disclosure controls and procedures (as defined in Rule 30a-3(c) under the Investment Company Act of 1940, as amended (the “1940 Act”)) as of a date within 90 days of the filing date of this report, the registrant’s principal executive officer and principal financial officer has concluded that such disclosure controls and procedures are reasonably designed and are operating effectively to ensure that material information relating to |
| | the registrant, including its consolidated subsidiaries, is made known to him by others within those entities, particularly during the period in which this report is being prepared, and that the information required in filings on Form N-CSR is recorded, processed, summarized, and reported on a timely basis. |
| (b) | There were no changes in the registrant’s internal control over financial reporting (as defined in Rule 30a-3(d) under the 1940 Act (17 CFR 270.30a-3(d))) that occurred during the registrant’s second fiscal quarter of the period covered by this report that has materially affected, or is reasonably likely to materially affect, the registrant’s internal control over financial reporting. |
| | (a)(1) | Code of ethics, or any amendments thereto, that is the subject of disclosure required by Item 2 is attached hereto. |
| | (a)(2) | Certifications pursuant to Rule 30a-2(a) under the 1940 Act and Section 302 of the Sarbanes-Oxley Act of 2002 are attached hereto. |
| | (b) | Certifications pursuant to Rule 30a-2(b) under the 1940 Act and Section 906 of the Sarbanes-Oxley Act of 2002 are attached hereto. |
(12.other) Not applicable.
SIGNATURES
Pursuant to the requirements of the Securities Exchange Act of 1934 and the Investment Company Act of 1940, the registrant has duly caused this report to be signed on its behalf by the undersigned, thereunto duly authorized.
(Registrant) New Alternatives Fund
| | | | |
| By (Signature and Title)* | | /s/ David J. Schoenwald | | |
| | David J. Schoenwald, President and Treasurer | | |
| | (principal executive officer) | | |
Date 2/28/2017
Pursuant to the requirements of the Securities Exchange Act of 1934 and the Investment Company Act of 1940, this report has been signed below by the following persons on behalf of the registrant and in the capacities and on the dates indicated.
| | | | |
| By (Signature and Title)* | | /s/ David J. Schoenwald | | |
| | David J. Schoenwald, President and Treasurer | | |
| | (principal executive officer) | | |
Date 2/28/2017
* Print the name and title of each signing officer under his or her signature.