UNITED STATES
SECURITIES AND EXCHANGE COMMISSION
Washington, D.C. 20549
FORM N-CSR
CERTIFIED SHAREHOLDER REPORT OF REGISTERED MANAGEMENT
INVESTMENT COMPANIES
Investment Company Act file number 811-03287
New Alternatives Fund
(Exact name of registrant as specified in charter)
150 Broadhollow Road, Suite PH2
Melville, New York 11747
(Address of principal executive offices) (Zip code)
David J. Schoenwald, President
New Alternatives Fund
150 Broadhollow Road, Suite PH2
Melville, New York 11747
(Name and address of agent for service)
Registrant’s telephone number, including area code: 631-423-7373
Date of fiscal year end: December 31
Date of reporting period: December 31, 2017
Form N-CSR is to be used by management investment companies to file reports with the Commission not later than 10 days after the transmission to stockholders of any report that is required to be transmitted to stockholders under Rule 30e-1 under the Investment Company Act of 1940 (17 CFR 270.30e-1). The Commission may use the information provided on Form N-CSR in its regulatory, disclosure review, inspection, and policymaking roles.
A registrant is required to disclose the information specified by Form N-CSR, and the Commission will make this information public. A registrant is not required to respond to the collection of information contained in Form N-CSR unless the Form displays a currently valid Office of Management and Budget (“OMB”) control number. Please direct comments concerning the accuracy of the information collection burden estimate and any suggestions for reducing the burden to Secretary, Securities and Exchange Commission, 450 Fifth Street, NW, Washington, DC 20549-0609. The OMB has reviewed this collection of information under the clearance requirements of 44 U.S.C. § 3507.
Item 1. Reports to Stockholders.
The Report to Shareholders is attached herewith.
| | | | | | |
 | | New Alternatives Fund A SOCIALLY RESPONSIBLE MUTUAL FUND EMPHASIZING ALTERNATIVE ENERGY AND THE ENVIRONMENT | | |
ANNUAL
FINANCIAL REPORT
INVESTOR SHARES: NAEFX
CLASS A SHARES: NALFX
DECEMBER 31, 2017
This report is submitted for the general information of the shareholders of the Fund. It is not authorized for distribution unless preceded or accompanied by a prospectus for the Fund.
| | | | | | | | |
| THE FUND | | 150 Broadhollow Road | | Melville, New York 11747 | | (800) 423-8383 | | (631) 423-7373 |
| BNY Mellon Investment Servicing (US) Inc. | | PO Box 9794 | | Providence, RI 02940 | | (800) 441-6580 | | (610) 382-7819 |
| Overnight Address | | 4400 Computer Drive | | Westborough, MA 01581 | | | | |
| Foreside Funds Distributors LLC | | 400 Berwyn Park, | | Berwyn, PA 19312 | | | | |
| | | 899 Cassatt Road | | | | | | |
Recycled Paper
NEW ALTERNATIVES FUND
MANAGEMENT’S DISCUSSION OF FINANCIAL PERFORMANCE
FOR THE YEAR 2017
Fund Performance: The Net Asset Value (“NAV”) of New Alternatives Fund’s Class A Shares was $47.78 on January 1, 2017 and closed at $55.54 after payment of a dividend from ordinary income of $1.03 per share and a long-term capital gain distribution of $1.29 per share on December 31, 2017. The Fund’s Investor Shares opened at an NAV of $47.71 on January 1, 2017 and ended at $55.41 after payment of a dividend from ordinary income of $0.92 per share and a long-term capital gain distribution of $1.29 per share on December 31. 2017. The Fund’s net assets increased from approximately $181,821,551 on December 31, 2016 to $213,079,428 on December 31, 2017 primarily due to appreciation of the Fund’s holdings.
The Fund’s Class A Shares delivered a total return of 21.08 percent and the Investor Shares closed up 20.76 percent at year end December 31, 2017. During the period from January 1, 2017 to December 31, 2017, the number of the Fund’s Class A Shares outstanding increased from 3,766,734 to 3,777,599 for a net increase of 10,865. The Fund also added a net total of 20,378 Investor Shares increasing the number of those shares from 38,727 to 59,105.
Just over 44 percent of the Fund’s investments at December 31, 2017 were in U.S. based companies, including 5.4 percent held in cash (and cash equivalents) at U.S. banks and credit unions. This is up very slightly from 42.8 percent on December 31, 2016. European companies comprised just under 30 percent of the Fund’s holdings (with 16.4 percent priced in Euros); followed by Canada, 12.2 percent; Asia, 7.6 percent; and Bermuda, 6.1 percent. Details are contained on the chart on page 14.
The Fund achieved most of its gains in the first half of the year. Both share classes were up just over 19 percent as of June 30, 2017. You can read our analysis of that period in our Semi-Annual Financial Report which is available on our web site at: http://www.newalternativesfund.com/wp-content/uploads/ 2017/08/NAF-Semi-Annual-Report-6-30-17.pdf. In the following six months, from July 1 to December 31, 2017, we saw only incremental gains of just under 2 percent for our Class A Shares and just over 1 percent for our Investor Shares.
Factors Affecting the Fund: There seem to be several factors that contributed to this slowdown in the second half of the year. The Federal Reserve continued to raise interest rates, albeit slowly, from the historically low levels maintained since the financial crisis of 2008. These increases have been gradual and communicated well ahead of time, but stock markets tend to react negatively when they occur all the same. Fortunately, these down turns have been short-lived. There is some fear that as the economy has grown and “heated up”, the Federal Reserve may accelerate its rate raising schedule, although it has given no sign that it is considering this move. This concern has negatively affected companies which rely on debt to fund their growth, like several of the YieldCos and independent renewable power producers in our holdings, including TerraForm Power, Inc., TransAlta Renewables, Inc., Northland Power, Inc., and Innergex Renewable Energy (all Canada). Higher interest rates, both here and abroad, may also cause higher costs and lower margins of profit for major manufacturers,
1
NEW ALTERNATIVES FUND
MANAGEMENT’S DISCUSSION OF FINANCIAL PERFORMANCE
FOR THE YEAR 2017
including wind turbine manufacturers Vestas Wind Systems A/S (Denmark), Siemens Gamesa Corporation and Acciona SA (both Spain).
As the U.S. Congress was considering the tax reform legislation toward the end of the year there was some additional concern that it might include a rolling back of the Production Tax Credit (PTC) which benefits wind power development. It seemed pretty clear to us from early on, that this credit, which is already set to phase out by the mid-2020s, remained popular with a broad section of Republican legislators in the Midwest and Southwest, where wind power development is one of the largest contributors to regional economic development and new employment. There was one proposal in the initial legislation that called for this credit to be phased out earlier, but that was quickly voted out and the new tax package maintained the PTC as it was originally proposed.
There has been some pressure on wind and solar power developers internationally as more countries have been turning to unsubsidized competitive bidding for new project developments. The “winning” bids of these auctions have been coming in at new lows for each megawatt (MW). Solar prices have been falling a bit faster than wind creating a situation where solar projects are being bid in direct competition with wind projects. According to a report in November 2017 by the International Energy Agency (IEA), some European auctions have lowered the cost per unit of new onshore wind projects by 15 percent. Vestas, which became the largest wind turbine manufacturer and developer in the world last year, reported that it received 950,000 Euros per MW in bids in 2016, but that had fallen to 800,000 Euros by 2017. Vestas and other manufacturers have built bigger, more efficient turbines but have seen their profit margins squeezed a bit tighter recently. These companies remain profitable and continue to have good long-term prospects. Despite the need to tighten expenses to maintain income margins, Vestas, for one, reported a 48 percent rise in wind turbine orders in the 3rd quarter of 2017.
Ironically, the Trump administration’s recently announced 30 percent tariff on imported solar cells (and washing machines), undertaken with the supposed intent to boost U.S. solar production, is likely to lead to a cut back in the growth of solar installation jobs. One U.S. based solar manufacturer, SunPower, already announced that it would likely stop expansion of its domestic manufacturing factories that relied on components from the Philippines and Mexico, and which would be subject to the new tariffs. SunPower said it would seek an exemption from the tariff.
We continued to see some consolidation and restructuring in some of our renewable power production companies during 2017. As we reported earlier, Hafslund ASA, a Norwegian hydropower and district heating utility was bought out by the city of Oslo, which already owned a majority of the company. We received a payment for our shares, but the Fund joined a lawsuit brought by other independent shareholders seeking a better price for our holdings. We have been informed that it may take several years for Norwegian courts to settle the case. In another somewhat similar situation, the Fund joined other minority independent shareholders in objecting to the reabsorbing of EDP Renovaveis SA, the
2
NEW ALTERNATIVES FUND
MANAGEMENT’S DISCUSSION OF FINANCIAL PERFORMANCE
FOR THE YEAR 2017
Spanish renewable energy company, by its “parent” EDP SA, the joint Spanish/Portuguese utility. This prevented the deal for the time being, so EDP Renovaveis continues to be included in the Fund’s holdings.
Finally, one of the Fund’s companies, Brookfield Renewable Energy Partners LP (Canada) completed its proposed purchase of the part of the YieldCo, TerraForm Power, owned by its parent company SunEdison, which was in bankruptcy earlier in 2017. The Fund continues to hold our position of independent shares in TerraForm. Brookfield is a much more substantial company than SunEdison and we believe that TerraForm’s share price and general performance should improve now that it is not weighed down by a weak parent company.
Not Quite Politics As Usual:We feel we would be remiss if we did not address shareholders’ continuing concerns about the impact of the Trump government policies on the forward march of renewable energy and issues of climate change.
As promised, the U.S. officially pulled out of the UN climate accords and executive agency appointees have continued to roll back aspects of the Obama administration Clean Power Plan. And while the tax reform bill maintains the existing credits for wind and solar development, it did include provisions that could slow some renewable energy projects by taxing the financing available from multinational investors. There is also the possibility that the lower corporate tax rate will reduce the value of the remaining credits. A compromise was worked out with some key Republican lawmakers who discovered this would negatively impact jobs in their home states that allow additional credits to be applied against the taxes. It remains to be seen if there will be any significant tax imposed on new projects in the end.
A substantial coalition of states and cities in the U.S., along with a number of corporations, have taken up the cause of meeting the agreements to limit greenhouse gas emissions under the Paris accords. The provisions of the agreement were mild enough that the U.S., along with a number of other countries, was already on a path to meet its goals regardless of whether the government officially accepted them or not. The main setback to this international effort will be the withholding of the U.S. government’s contribution to the international climate fund that was established to help undeveloped countries cope with the damage that climate change was already doing and the added costs of meeting their increasing energy needs without adding to the world’s greenhouse gas thresholds. Some of those funds may also be made up by private and corporate donations.
The current Trump administration policies will not substantially slow the progress of renewable energy, which is mostly driven by economic conditions (albeit with a “push” from government policies). The main damage that we presently face appears to be the roll back of environmental protections on clean water and air standards, and protection of public lands and wilderness areas against resource extraction and commercial development.
3
NEW ALTERNATIVES FUND
MANAGEMENT’S DISCUSSION OF FINANCIAL PERFORMANCE
FOR THE YEAR 2017
Portfolio Holdings and Changes:
Investments in 2017: Our Semi-Annual Financial Report as of June 30, 2017 covers investments added to and sold from the Fund’s portfolio during the first six months of the year. You can read this report at: http://www.newalternativesfund.com/wp-content/uploads/2017/08/NAF-Semi-Annual-Report-6-30-17.pdf.
In the six months from July 1 to December 31, 2017, we did not add any new companies or completely sell off our positions of any company in the Fund’s portfolio. We add to shares of our existing holdings to balance the portfolio or if the Advisor believes a company’s share price has become undervalued in relation to its asset base or earnings. Likewise, we sell shares of our existing holdings to balance the Fund’s portfolio sectors, to raise money to meet Fund share redemptions or if the Advisor believes a company’s share price has become overvalued.
We want to make a special note of one of the Fund’s holdings: The Danish company formerly known as DONG Energy A/S changed its corporate name to: Orsted A/S. There is an interesting story behind this and it is the reason we added this company to the Fund in the second half of 2016. Orsted is a diversified energy company and utility primarily owned by the state of Denmark. It is now the world’s largest developer and operator of offshore wind turbines. It is also developing biomass generation facilities and installing smart meters in its primary service areas. They have recently announced that they will also be developing some new solar photovoltaic (PV) projects and have already begun adding energy storage capabilities to some of their existing facilities.
The company’s original name stood for “Danish Oil and Natural Gas.” Starting around 2006, the company committed to moving all its operations from fossil fuels to renewable energy and energy conservation, primarily with wind power. As of last year, they had completely divested themselves of all their oil and natural gas exposure. They are pursuing one of the most interesting and extensive corporate changes that has taken place in recent memory. And where did the name “Orsted” come from? Check out their web site at: https://orsted.com/en to learn about that and their entire transformation.
During the second half of 2017, the Fund added slightly to its existing holdings of Orsted. We also added to our shares of Siemens Gamesa Renewable Energy SA (Spain), TerraForm Power, Inc., Transalta Renewables Inc. (Canada) and Vestas Wind Systems A/S. The wind turbine manufactures suffered sharp declines, but we felt comfortable with large holdings of Vestas and Siemens Gamesa as they are dominant suppliers in a growing industry.
During this same period, the Fund reduced its holdings of Avangrid, Inc., Innergex Renewable Energy Inc. (Canada), and NextEra Energy Partners LP. All other share holdings of companies in the Fund remained unchanged in the six months from July 1 to December 31, 2017.
Top Gainers and Losers: Most of the companies in the Fund’s portfolio saw their share price increase during 2017.The firms with the largest appreciation at December 31, 2017 included: Owens Corning,
4
NEW ALTERNATIVES FUND
MANAGEMENT’S DISCUSSION OF FINANCIAL PERFORMANCE
FOR THE YEAR 2017
up 78.3 percent; NextEra Energy Partners, up 68.8 percent; Elecnor SA (Spain), also up 68.8 percent; Tesla, Inc., up 45.7 percent; Panasonic Corporation (Japan), up 44.8 percent; Orsted A/S, up 44.1%; Avangrid, Inc., up 33.5 percent; EDP Renovaveis SA, up 31.7 percent; Trustpower Ltd., up 28.9 percent; and Hannon Armstrong Sustainable Infrastructure Capital, Inc., up 26.7 percent.
Other companies showing a gain for the year were: American Water Works Company, Inc., up 26.4 percent; Koninklijke Philips NV (Netherlands), up 23.7 percent; NRG Yield, Inc., Class A Shares, up 22.7 percent; and NRG Yield, Inc., Class C Shares, up 19.6 percent.
The only companies in the Fund’s holdings whose share price decreased during 2017 were: Siemens Gamesa Renewable Energy SA, down 32.4 percent; TerraForm Power, down 6.6 percent; Johnson Controls International PLC (Ireland), down 3.1 percent; and TransAlta Renewables, down 0.84 percent.
Cash Holdings: We ended the year with approximately 5.4 percent of the Fund’s net assets in cash. We continue to avoid short-term U.S. Treasury Bills as interest rates still hover at historic lows. A portion of this cash is invested in a series of Certificates of Deposit (CDs) at socially responsible banks and local credit unions.
Income from Dividends and Interest: The per share dividend for Class A Shares went up from $0.67 in 2016 to $1.03 in 2017. The per share dividend for Investor Shares rose from $0.56 in 2016 to $0.92 in 2017. The increase in the ordinary dividends was largely the result of a one-time distribution by Siemens Gamesa when the merger was complete.
Realized and Unrealized Capital Gain/Loss: The Fund also paid a net realized long-term capital gain of $1.29 per share for both Class A Shares and Investor Shares in 2017. During the year ended December 31, 2017, the Fund had net realized and unrealized gains of $34,587,155.
The Fund continued to receive payments from several companies in our portfolio which were characterized as “return of capital” rather than dividends or interest. These payments are not considered to represent income on an investment and do not add to the dividend. They do add value to the Fund by helping to increase the NAV, which also benefits shareholders.
Expenses: The Fund’s cost of operations increased slightly in 2017. The number of shareholder accounts decreased slightly while the net assets increased substantially during the year. The amounts paid to the investment advisor, Accrued Equities, Inc., the Bank of New York Mellon (the Fund’s custodian) and BNY Mellon Investment Servicing (U.S.), Inc. (the Fund’s accounting agent, transfer agent and administrator) are largely based on net assets. The Fund’s net assets increased during 2017, ending approximately 17.2 percent higher for the entire year. BNY Mellon, in its role as transfer agent, bases its fees on the number of shareholder accounts established during the year. This figure decreased slightly. However, the total number of shares rose slightly, so while the overall transfer agent fees also went up, the per share cost decreased. As a result, the expense ratio for the Class A Shares decreased from
5
NEW ALTERNATIVES FUND
MANAGEMENT’S DISCUSSION OF FINANCIAL PERFORMANCE
FOR THE YEAR 2017
1.12 percent in 2016 to 1.07 percent in 2017. The expense ratio for the Investor Shares includes an additional 12b-1 fee of 0.25 percent for an expense ratio of 1.32 percent for 2017, down from 1.37 percent in 2016. Total Fund Expenses increased by $139,054 or 6.7 percent.
The Fund Web Site/On-Line Capabilities: We continue to build the Fund’s on-line functions and web site features. All relevant Fund documents are posted on our web site which can be accessed at: www.newalternativesfund.com.
We encourage all shareholders to create an on-line account log-on which is available through a link on our web site. When you access the web site, go to the “Open An Account” link on the selection bar and follow the instructions to create your account access. You can use this link to open an account, purchase or redeem shares, check the current balance of your account, sign up for e-delivery of reports and documents, and perform account maintenance such as address changes.
Investment Objective: The Fund continues to seek to achieve long-term capital appreciation, with income as a secondary objective. We continue to seek these objectives by investing in equity securities. The equity securities in which the Fund invests consists primarily of common stocks. Other equity securities in which the Fund may invest include depository receipts, real estate investment trusts (“REITs”) and publicly traded master limited partnerships (“MLPs”). The Fund makes investments in a wide range of industries and companies of all sizes. The Fund invests in equity securities of both U.S. and foreign companies, and has no limitation on the percentage of assets invested in the U.S. or abroad. Under normal market conditions, at least 25 percent (usually almost 100 percent) of the Fund’s total assets will be invested in equity securities of companies in the alternative energy industry.
“Alternative Energy” means the production, conservation, storage and transmission of energy to reduce pollution and harm to the environment, particularly when compared to conventional coal, oil or nuclear energy.
Risk Disclosure: All investments are subject to inherent risks. An investment in the Fund is no exception. Accordingly, you may lose money by investing in the Fund. This disclosure of risks is not complete. Go to our web site at: www.newalternativesfund.com., call 800-423-8383 or write to the Fund to obtain a prospectus that contains a more complete description of risks associated with investment in the Fund and other information about the Fund.
6
New Alternatives Fund Class A Shares Growth of $10,000 vs. The S&P 500® Index
(Unaudited)
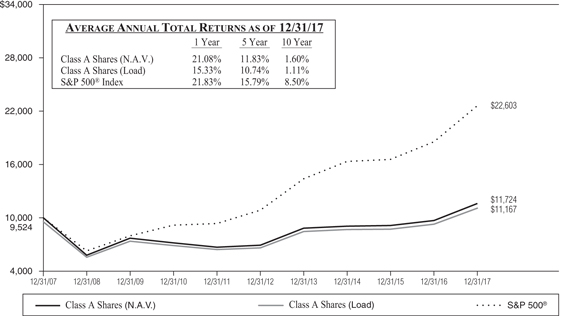
Performance quoted represents past performance and does not guarantee future results. Investment return and principal value will fluctuate so that shares, when redeemed, may be worth more or less than their original cost. Current performance may be lower or higher than that shown here. The“Load”performance quoted reflects a deduction for Class A Shares’ maximum front-end sales charge of 3.50%. Prior to May 1, 2017, the Class A Shares’ maximum front end sales charge was 4.75%. Returns include the reinvestment of dividends and distributions. Performance data current to the most recent month-end may be obtained by calling 800-423-8383. The graph and table do not reflect the deduction of taxes that a Shareholder would pay on Fund distributions or the redemption of Fund shares.
The Fund’s total annual operating expenses, as stated in its current prospectus dated April 30, 2017 are 1.12%*** for the Class A Shares.
*** Per prospectus. The expense ratio presented above may vary from the expense ratio presented in other sections of this report which is based on expenses incurred during the period covered by this report.
7
New Alternatives Fund Investor Shares Growth of $10,000 vs. The S&P 500® Index
(Unaudited)
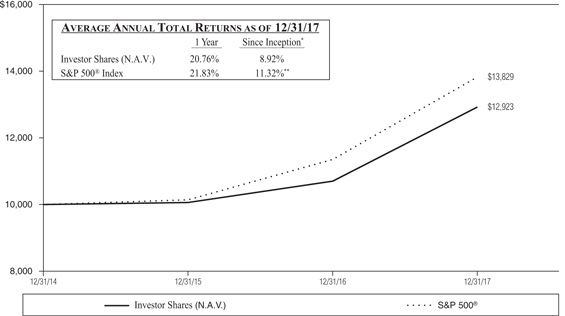
Performance quoted represents past performance and does not guarantee future results. Investment return and principal value will fluctuate so that shares, when redeemed, may be worth more or less than their original cost. Current performance may be lower or higher than that shown here. A 2.00% redemption fee applies to Investor Shares redeemed within 60 days of purchase. This redemption fee is not reflected in the returns shown above. Returns include the reinvestment of dividends and distributions. Performance data current to the most recent month-end may be obtained by calling 800-423-8383. The graph and table do not reflect the deduction of taxes that a Shareholder would pay on Fund distributions or the redemption of Fund shares.
The Fund’s total annual operating expenses, as stated in its current prospectus dated April 30, 2017 are 1.37%*** for the Investor Shares.
The S&P 500® Index is an unmanaged stock market index and does not reflect any asset-based charges for investment management or transaction expenses. You cannot invest directly in this index. Current and future portfolio holdings are subject to change and risk.
* The inception date for Investor Shares of New Alternatives Fund was December 31, 2014.
** The performance presented is from the inception date of the Investor Shares of the Fund only and is not from the inception date of the Fund’s broad-based securities market index.
*** Per prospectus. The expense ratio presented above may vary from the expense ratio presented in other sections of this report which is based on expenses incurred during the period covered by this report.
8
NEW ALTERNATIVES FUND
FUND EXPENSE EXAMPLE
(Unaudited)
As a shareholder of the Fund, you incur two types of costs: (1) transaction costs such as the sales charge and redemption fees; and (2) ongoing costs, including management fees, distribution (i.e., Rule 12b-1) fees and other Fund expenses. This example is intended to help you understand your ongoing costs (in dollars) of investing in the Fund and to compare these costs with the ongoing costs of investing in other mutual funds.
The example is based on an investment of $1,000 invested at the beginning of the period shown (July 1, 2017) and held for the entire six months ended December 31, 2017.
Actual Expenses
The first line of the table below provides information about actual account values and actual expenses. You may use the information in this line, together with the amount you invested, to estimate the expense that you paid over the period. Simply divide your account value by $1,000 (for example, an $8,600 account value divided by $1,000 = 8.6), then multiply the result by the number in the first line under the heading entitled “Expenses Paid During Six Months Ended December 31, 2017” to estimate the expenses you paid on your account during this period.
Note: The Fund’s Transfer Agent, BNY Mellon Investment Servicing (US) Inc., charges an annual IRA maintenance fee of $20 for IRA accounts. That fee is not reflected in the accompanying table.
Hypothetical Example for Comparison Purposes
The second line of the table below provides information about hypothetical account values and hypothetical expenses based on the Fund’s actual expense ratio and an assumed rate of return of 5% per year before expenses, which is not the Fund’s actual return. The hypothetical account values and expenses may not be used to estimate the actual ending account balance or expenses you paid for the period. You may use this information to compare the ongoing costs of investing in the Fund and other funds. To do so, compare this 5% hypothetical example with the 5% hypothetical examples that appear in the shareholder reports of other funds.
Please note that the expenses shown in the table are meant to highlight your ongoing costs only and do not reflect any transactional costs such as the sales charge, redemption fees or exchange fees. Therefore, the second line of the table is useful in comparing ongoing costs only, and will not help you determine the relative total costs of owning different funds. In addition, if transactional costs were included, your costs would have been higher.
9
NEW ALTERNATIVES FUND
FUND EXPENSE EXAMPLE
(Unaudited)
| | | | | | | | | | | | |
| | | Beginning
Account Value
July 1, 2017 | | | Ending
Account Value
December 31, 2017 | | | Expenses Paid During
Six Months Ended
December 31, 2017 | |
Class A Shares * | | | | | | | | | | | | |
Actual | | | $1,000.00 | | | | $1,015.70 | | | | $5.28 | |
Hypothetical | | | | | | | | | | | | |
(assumes 5% return before expenses) | | | $1,000.00 | | | | $1,019.96 | | | | $5.30 | |
Investor Shares ** | | | | | | | | | | | | |
Actual | | | $1,000.00 | | | | $1,014.20 | | | | $6.55 | |
Hypothetical | | | | | | | | | | | | |
(assumes 5% return before expenses) | | | $1,000.00 | | | | $1,018.70 | | | | $6.56 | |
| * | Expenses are equal to the annualized expense ratio of the Fund’s Class A Shares for the six-month period of 1.04%, multiplied by the average account value over the period, multiplied by the number of days (184) in the most recent fiscal half year, then divided by the days in the year (365) to reflect the half year period. The Class A Shares’ ending account value on the first line in the table is based on its actual total return of 1.57% for the six-month period of July 1, 2017 to December 31, 2017. |
| ** | Expenses are equal to the annualized expense ratio of the Fund’s Investor Shares for the six-month period of 1.29%, multiplied by the average account value over the period, multiplied by the number of days (184) in the most recent fiscal half year, then divided by the days in the year (365) to reflect the half year period. The Investor Shares’ ending account value on the third line in the table is based on its actual total return of 1.42% for the six-month period of July 1, 2017 to December 31, 2017. |
10
NEW ALTERNATIVES FUND
SCHEDULE OF INVESTMENTS
December 31, 2017
(Unaudited)
| | | | | | | | |
Sector Diversification | | % of Net
Assets | | | Value | |
Common Stocks | | | | | | | | |
Alternate Energy: | | | | | | | | |
Renewable Energy Power Producers & Developers | | | 63.6% | | | $ | 135,460,063 | |
Wind Turbines | | | 9.4 | | | | 19,960,929 | |
Energy Storage | | | 5.7 | | | | 12,135,750 | |
Solar Photovoltaic | | | 4.6 | | | | 9,886,500 | |
Sustainable Energy Financial Services | | | 5.6 | | | | 12,030,000 | |
Energy Conservation | | | 4.2 | | | | 8,980,200 | |
Water Utilities | | | 1.1 | | | | 2,287,250 | |
Transportation | | | 0.2 | | | | 311,350 | |
Warrants | | | 0.0 | | | | 0 | |
Certificates of Deposit | | | 0.2 | | | | 500,000 | |
Other Assets in Excess of Liabilities | | | 5.4 | | | | 11,527,386 | |
| | | | | | | | |
Net Assets | | | 100.0% | | | $ | 213,079,428 | |
| | | | | | | | |
Top Ten Portfolio Issuers
December 31, 2017
(Unaudited)
| | |
Name | | % of Net
Assets |
NextEra Energy Partners LP | | 6.4% |
Brookfield Renewable Partners LP (Bermuda/Canada) | | 6.1 |
EDP Renovaveis SA (Spain/Portugal) | | 5.9 |
Panasonic Corp. (Japan) SP ADR | | 5.7 |
Hannon Armstrong Sustainable Infrastructure Capital, Inc., REIT | | 5.6 |
Pattern Energy Group, Inc | | 5.0 |
Atlantica Yield PLC (Great Britain) | | 5.0 |
TerraForm Power, Inc. Class A | | 4.9 |
Innergex Renewable Energy, Inc. (Canada) | | 4.9 |
Siemens Gamesa Renewable Energy SA (Spain) | | 4.8 |
| | |
Total Top Ten | | 54.3% |
| | |
Portfolio holdings are subject to change, risk and may not represent current compositions of the portfolio.
11
NEW ALTERNATIVES FUND
SCHEDULE OF INVESTMENTS
December 31, 2017
| | | | | | | | |
| | | Shares | | | Value | |
COMMON STOCKS—94.4% | | | | | | | | |
Alternate Energy — 83.3% | | | | | | | | |
Energy Storage — 5.7% | | | | | | | | |
Panasonic Corp. (Japan) SP ADR | | | 825,000 | | | $ | 12,135,750 | |
| | | | | | | | |
| | | | | | | 12,135,750 | |
| | | | | | | | |
Renewable Energy Power Producers & Developers — 63.6% | | | | | | | | |
Acciona SA (Spain) | | | 100,000 | | | | 8,163,755 | |
Atlantica Yield PLC (Great Britain)* | | | 500,000 | | | | 10,605,000 | |
Avangrid, Inc. | | | 200,000 | | | | 10,116,000 | |
Brookfield Renewable Partners LP (Bermuda/Canada) | | | 375,000 | | | | 13,091,250 | |
EDP Renovaveis SA (Spain/Portugal) | | | 1,500,000 | | | | 12,538,995 | |
Elecnor SA (Spain) | | | 125,000 | | | | 1,993,245 | |
Infratil Ltd. (New Zealand) | | | 500,000 | | | | 1,176,446 | |
Innergex Renewable Energy, Inc. (Canada) | | | 900,000 | | | | 10,388,430 | |
NextEra Energy Partners LP* | | | 315,000 | | | | 13,579,650 | |
Northland Power, Inc. (Canada) | | | 300,000 | | | | 5,584,500 | |
NRG Yield, Inc., Class A* | | | 360,000 | | | | 6,786,000 | |
NRG Yield, Inc., Class C* | | | 315,000 | | | | 5,953,500 | |
Orsted A/S (Denmark) | | | 25,000 | | | | 1,364,691 | |
Pattern Energy Group, Inc., Class A* | | | 500,000 | | | | 10,745,000 | |
TerraForm Power, Inc., Class A* ** | | | 875,302 | | | | 10,468,612 | |
Tilt Renewables Ltd. (New Zealand) | | | 500,000 | | | | 726,420 | |
TransAlta Renewables, Inc. (Canada) | | | 950,000 | | | | 10,059,550 | |
Trustpower Ltd. (New Zealand) | | | 500,000 | | | | 2,119,019 | |
| | | | | | | | |
| | | | | | | 135,460,063 | |
| | | | | | | | |
Solar Photovoltaic — 4.6% | | | | | | | | |
8Point3 Energy Partners LP* | | | 650,000 | | | | 9,886,500 | |
| | | | | | | | |
| | | | | | | 9,886,500 | |
| | | | | | | | |
Wind Turbines — 9.4% | | | | | | | | |
Siemens Gamesa Renewable Energy SA (Spain) | | | 750,000 | | | | 10,285,683 | |
Vestas Wind Systems A/S (Denmark) | | | 140,000 | | | | 9,675,246 | |
| | | | | | | | |
| | | | | | | 19,960,929 | |
| | | | | | | | |
Total Alternate Energy | | | | | | | 177,443,242 | |
| | | | | | | | |
Sustainable Energy Financial Services — 5.6% | | | | | | | | |
Hannon Armstrong Sustainable Infrastructure Capital, Inc., REIT | | | 500,000 | | | | 12,030,000 | |
| | | | | | | | |
| | | | | | | 12,030,000 | |
| | | | | | | | |
Energy Conservation — 4.2% | | | | | | | | |
Johnson Controls International PLC (Ireland) | | | 50,000 | | | | 1,905,500 | |
Koninklijke Philips NV (Netherlands) | | | 175,000 | | | | 6,615,000 | |
Owens Corning, Inc. | | | 5,000 | | | | 459,700 | |
| | | | | | | | |
| | | | | | | 8,980,200 | |
| | | | | | | | |
The accompanying notes are an integral part of these financial statements.
12
NEW ALTERNATIVES FUND
SCHEDULE OF INVESTMENTS (Continued)
December 31, 2017
| | | | | | | | |
| | | Shares | | | Value | |
Water Utilities — 1.1% | | | | | | | | |
American Water Works Co., Inc. | | | 25,000 | | | $ | 2,287,250 | |
| | | | | | | | |
| | | | | | 2,287,250 | |
| | | | | | | | |
Transportation — 0.2% | | | | | | | | |
Tesla, Inc.** | | | 1,000 | | | | 311,350 | |
| | | | | | | | |
| | | | | | 311,350 | |
| | | | | | | | |
Total Common Stocks (Cost $180,573,921) | | | | | | | 201,052,042 | |
| | | | | | | | |
WARRANTS — 0.0% | | | | | | | | |
Alternate Energy — 0.0% | | | | | | | | |
Abengoa SA, Class B Exp. 2025 (Spain)^ ** | | | 500,000 | | | | — | |
| | | | | | | | |
Total Warrants (Cost $4,204) | | | | | | | — | |
| | | | | | | | |
| | | Par | | | | |
CERTIFICATES OF DEPOSIT — 0.2% | | | | | | | | |
Socially Concerned Banks — 0.2% | | | | | | | | |
Alternatives Federal Credit Union savings account 0.20% due 01/14/18 | | $ | 100,000 | | | | 100,000 | |
Carver Federal Savings Bank 0.25% due 12/22/18 | | | 100,000 | | | | 100,000 | |
People’s United Bank 0.30% due 12/01/18 | | | 100,000 | | | | 100,000 | |
Self Help Credit Union 1.30% due 12/30/18 | | | 100,000 | | | | 100,000 | |
Urban Partnership Bank 0.30% due 01/28/18 | | | 100,000 | | | | 100,000 | |
| | | | | | | | |
Total Certificates of Deposit (Cost $500,000) | | | | | | | 500,000 | |
| | | | | | | | |
| | |
TOTAL INVESTMENTS (Cost $181,078,125) — 94.6% | | | | | | | 201,552,042 | |
Other Assets in Excess of Liabilities — 5.4% | | | | | | | 11,527,386 | |
| | | | | | | | |
Net Assets — 100.0% | | | | | | $ | 213,079,428 | |
| | | | | | | | |
| * | These entities are commonly known as “Yieldco’s”. |
| ^ | An investment with a value of $0 or 0.0% of the Fund’s net assets was valued by the Fund’s investment advisor. |
| ** | Non-income producing security |
| | |
LP | | -Limited Partnership |
PLC | | -Public Limited Company |
REIT | | -Real Estate Investment Trust |
SP ADR | | -Sponsored American Depositary Receipts |
The accompanying notes are an integral part of these financial statements.
13
NEW ALTERNATIVES FUND
SCHEDULE OF INVESTMENTS (Concluded)
December 31, 2017
Country Portfolio Issuers
(Unaudited)
| | |
Country | | % of Net
Assets |
| |
United States | | 39.0% |
Spain | | 15.5 |
Canada | | 12.2 |
Bermuda | | 6.1 |
Japan | | 5.7 |
Denmark | | 5.2 |
Great Britain | | 5.0 |
Netherlands. | | 3.1 |
New Zealand | | 1.9 |
Ireland | | 0.9 |
Other Assets/Liabilities | | 5.4 |
| | |
| | | 100.0% |
| | |
The accompanying notes are an integral part of these financial statements.
14
NEW ALTERNATIVES FUND
STATEMENT OF ASSETS AND LIABILITIES
December 31, 2017
| | | | |
| ASSETS | | | | |
Investment securities at fair value (cost: $181,078,125) (Notes 2A and 7) | | $ | 201,552,042 | |
Cash. | | | 13,054,258 | |
Receivables: | | | | |
Investments sold | | | 1,022,751 | |
Capital shares subscribed | | | 98,193 | |
Dividends | | | 833,169 | |
Tax reclaims | | | 213,573 | |
Prepaid insurance and registration | | | 48,223 | |
| | | | |
Total Assets | | | 216,822,209 | |
| | | | |
| |
| LIABILITIES | | | | |
Payables: | | | | |
Investments purchased | | | 1,856,461 | |
Distributions | | | 991,230 | |
Capital shares reacquired | | | 645,550 | |
Management fees | | | 100,048 | |
Transfer agent fees | | | 61,205 | |
Postage and printing fees | | | 23,140 | |
Professional fees. | | | 22,991 | |
Custodian fees | | | 9,401 | |
12B-1 fees. | | | 672 | |
Accrued expenses and other liabilities | | | 32,083 | |
| | | | |
Total Liabilities | | | 3,742,781 | |
| | | | |
Net Assets | | $ | 213,079,428 | |
| | | | |
| |
| ANALYSIS OF NET ASSETS | | | | |
Net capital paid in shares of capital shares | | $ | 194,077,835 | |
Distributions in excess of net investment income. | | | (250,023 | ) |
Accumulated net realized loss on investments and foreign currency transactions | | | (1,233,906 | ) |
Net unrealized appreciation on investments | | | 20,473,917 | |
Net unrealized appreciation on translation of other assets and liabilities in foreign currencies | | | 11,605 | |
| | | | |
Net Assets | | $ | 213,079,428 | |
| | | | |
| |
Class A Shares: | | | | |
Net Assets | | $ | 209,804,338 | |
Net asset value and redemption price per share ($209,804,338/3,777,599) shares of outstanding beneficial interest, unlimited authorization, no par value | | $ | 55.54 | * |
| | | | |
| |
Maximum offering price per share (100/96.50 of $55.54) | | $ | 57.55 | |
| | | | |
| |
Investor Shares: | | | | |
Net Assets | | $ | 3,275,090 | |
Net asset value, offering and redemption** price per share ($3,275,090/59,105) shares of outstanding beneficial interest, unlimited authorization, no par value | | $ | 55.41 | * |
| | | | |
| * | Includes adjustments in accordance with accounting principles generally accepted in the United States of America and as such, the net asset values for financial reporting purposes may differ from the net asset value for shareholder transactions. |
| ** | Redemption fee may apply (Note 1) |
The accompanying notes are an integral part of these financial statements.
15
NEW ALTERNATIVES FUND
STATEMENT OF OPERATIONS
For the Year Ended December 31, 2017
| | | | |
Investment Income: | | | | |
Dividends (net of $652,268 foreign taxes withheld) | | $ | 5,570,180 | |
| | | | |
Total Investment Income | | | 5,570,180 | |
| | | | |
Expenses: | | | | |
Management fee (Note 4) | | | 1,154,085 | |
Transfer agent fees | | | 415,128 | |
Administration and accounting fees | | | 226,542 | |
Legal fees | | | 98,815 | |
Custodian fees | | | 61,589 | |
Postage and printing fees | | | 58,998 | |
Registration fees | | | 57,787 | |
Compliance service fees | | | 49,501 | |
Audit fees | | | 21,800 | |
Trustees fees (Note 5) | | | 21,000 | |
Insurance fees | | | 15,374 | |
12b-1 fees (Investor Shares) (Note 4) | | | 6,155 | |
Other expenses | | | 18,156 | |
| | | | |
Total Expenses | | | 2,204,930 | |
| | | | |
Net Investment Income | | | 3,365,250 | |
| | | | |
| |
Net Realized and Unrealized Gain/(Loss) from Investments and Foreign Currency Related Transactions: | | | | |
| |
Realized Gain/(Loss) from Investments and Foreign Currency Related Transactions (Notes 2B & 6): | | | | |
Net realized gain from investments | | | 5,174,356 | |
Net realized loss from foreign currency transactions | | | (164,147 | ) |
| | | | |
Net Realized Gain | | | 5,010,209 | |
| | | | |
| |
Net Change in Unrealized Appreciation/(Depreciation) on Investments and Foreign Currency | | | | |
Related Translations: | | | | |
Net change in unrealized appreciation/(depreciation) on investments | | | 29,557,465 | |
Net change in unrealized appreciation/(depreciation) on foreign currency translations | | | 19,481 | |
| | | | |
Net change in unrealized appreciation/(depreciation) | | | 29,576,946 | |
| | | | |
Net Realized and Unrealized Gain on Investments and Foreign Currency Related Translations | | | 34,587,155 | |
| | | | |
Net Increase in Net Assets Resulting from Operations | | $ | 37,952,405 | |
| | | | |
The accompanying notes are an integral part of these financial statements.
16
NEW ALTERNATIVES FUND
STATEMENTS OF CHANGES IN NET ASSETS
| | | | | | | | |
| | | For the
Year Ended
December 31, 2017 | | | For the
Year Ended
December 31, 2016 | |
Investment Activities: | | | | | | | | |
Net investment income | | $ | 3,365,250 | | | $ | 2,055,968 | |
Net realized gain from investments and foreign currency transactions | | | 5,010,209 | | | | 3,907,932 | |
Net change in unrealized appreciation/(depreciation) on investments and foreign currency translations | | | 29,576,946 | | | | 5,790,989 | |
| | | | | | | | |
Net increase in net assets resulting from operations | | | 37,952,405 | | | | 11,754,889 | |
| | | | | | | | |
| | |
Distributions to Shareholders: | | | | | | | | |
Class A Shares: | | | | | | | | |
Distributions from net investment income | | | (3,744,662 | ) | | | (2,444,095 | ) |
Distributions from realized gain on investments | | | (4,704,780 | ) | | | (4,024,703 | ) |
Investor Shares: | | | | | | | | |
Distributions from net investment income | | | (52,070 | ) | | | (20,860 | ) |
Distributions from realized gain on investments | | | (73,153 | ) | | | (41,256 | ) |
| | | | | | | | |
Total distributions to shareholders. | | | (8,574,665 | ) | | | (6,530,914 | ) |
| | | | | | | | |
| | |
Capital Share Transactions: | | | | | | | | |
Net increase/(decrease) in net assets from capital share transactions (Note 3) | | | 1,880,137 | | | | (2,476,091 | ) |
| | | | | | | | |
Total Increase in Net Assets | | | 31,257,877 | | | | 2,747,884 | |
| | |
Net Assets: | | | | | | | | |
Beginning of the year | | | 181,821,551 | | | | 179,073,667 | |
| | | | | | | | |
End of the year* | | $ | 213,079,428 | | | $ | 181,821,551 | |
| | | | | | | | |
| * | Includes distributions in excess of net investment income of $(250,023) and $(11,099) for the years ended 12/31/17 and 12/31/16, respectively. |
The accompanying notes are an integral part of these financial statements.
17
NEW ALTERNATIVES FUND*
FINANCIAL HIGHLIGHTS
STATEMENT OF PER SHARE INCOME AND CAPITAL CHANGES
For a share outstanding throughout each year
| | | | | | | | | | | | | | | | | | | | |
| Class A Shares | | For the Years Ended December 31, | |
| | | 2017 | | | 2016 | | | 2015 | | | 2014 | | | 2013 | |
Net asset value at the beginning of year | | $ | 47.78 | | | $ | 46.46 | | | $ | 46.87 | | | $ | 46.93 | | | $ | 36.40 | |
| | | | | | | | | | | | | | | | | | | | |
Investment Operations | | | | | | | | | | | | | | | | | | | | |
Net investment income | | | 0.90 | ** | | | 0.54 | ** | | | 0.77 | ** | | | 0.56 | | | | 0.58 | |
Net realized and unrealized gain/(loss) on investments and foreign currency related transactions | | | 9.18 | | | | 2.55 | | | | (0.39 | ) | | | 0.81 | | | | 10.53 | |
| | | | | | | | | | | | | | | | | | | | |
Total from investment operations | | | 10.08 | | | | 3.09 | | | | 0.38 | | | | 1.37 | | | | 11.11 | |
| | | | | | | | | | | | | | | | | | | | |
| | | | | |
Distributions | | | | | | | | | | | | | | | | | | | | |
From net investment income | | | (1.03 | ) | | | (0.67 | ) | | | (0.79 | ) | | | (0.63 | ) | | | (0.58 | ) |
From net realized gains | | | (1.29 | ) | | | (1.10 | ) | | | — | | | | (0.80 | ) | | | — | |
| | | | | | | | | | | | | | | | | | | | |
Total distributions | | | (2.32 | ) | | | (1.77 | ) | | | (0.79 | ) | | | (1.43 | ) | | | (0.58 | ) |
| | | | | | | | | | | | | | | | | | | | |
Net asset value at end of year | | $ | 55.54 | | | $ | 47.78 | | | $ | 46.46 | | | $ | 46.87 | | | $ | 46.93 | |
| | | | | | | | | | | | | | | | | | | | |
| | | | | |
Total return | | | | | | | | | | | | | | | | | | | | |
(Sales load not reflected) | | | 21.08 | % | | | 6.66 | % | | | 0.82 | % | | | 2.91 | % | | | 30.52 | % |
Net assets, end of the year | | | | | | | | | | | | | | | | | | | | |
(in thousands) | | $ | 209,804 | | | $ | 179,974 | | | $ | 177,745 | | | $ | 175,843 | | | $ | 175,101 | |
Ratio of expenses to average net assets | | | 1.07 | % | | | 1.12 | % | | | 1.15 | % | | | 1.08 | % | | | 1.12 | % |
Ratio of net investment income to average net assets | | | 1.64 | % | | | 1.12 | % | | | 1.55 | % | | | 1.07 | % | | | 1.34 | % |
Portfolio turnover | | | 11.31 | % | | | 30.44 | % | | | 37.14 | % | | | 67.04 | % | | | 24.01 | % |
Number of shares outstanding at end of the year | | | 3,777,599 | | | | 3,766,734 | | | | 3,825,379 | | | | 3,751,972 | | | | 3,731,230 | |
| * | The Fund acquired all of the assets and liabilities of New Alternatives Fund, Inc. (the “Predecessor Company”) in a reorganization on November 14, 2014. The Predecessor Company’s performance and financial history have been adopted by the Fund and will be used going forward. As a result, the information prior to November 14, 2014 reflects that of the Predecessor Company. |
| ** | The selected per share data was calculated using the average shares outstanding method for the period. |
The accompanying notes are an integral part of these financial statements.
18
NEW ALTERNATIVES FUND
FINANCIAL HIGHLIGHTS
STATEMENT OF PER SHARE INCOME AND CAPITAL CHANGES
For a share outstanding throughout each year
| | | | | | | | | | | | |
| Investor Shares | | Year Ended
December 31,
2017 | | | Year Ended
December 31,
2016 | | | Year Ended
December 31,
2015* | |
Net asset value at the beginning of year | | $ | 47.71 | | | $ | 46.39 | | | $ | 46.87 | |
| | | | | | | | | | | | |
| | | |
Investment Operations | | | | | | | | | | | | |
Net investment income | | | 0.76 | ** | | | 0.42 | ** | | | 0.62 | ** |
Net realized and unrealized gain/(loss) on investments and foreign currency related transactions | | | 9.15 | | | | 2.56 | | | | (0.36 | ) |
| | | | | | | | | | | | |
Total from investment operations | | | 9.91 | | | | 2.98 | | | | 0.26 | |
| | | | | | | | | | | | |
| | | |
Distributions | | | | | | | | | | | | |
From net investment income | | | (0.92 | ) | | | (0.56 | ) | | | (0.74 | ) |
From net realized gains | | | (1.29 | ) | | | (1.10 | ) | | | — | |
| | | | | | | | | | | | |
Total distributions | | | (2.21 | ) | | | (1.66 | ) | | | (0.74 | ) |
| | | | | | | | | | | | |
Net asset value at end of year | | $ | 55.41 | | | $ | 47.71 | | | $ | 46.39 | |
| | | | | | | | | | | | |
| | | |
Total return | | | 20.76 | % | | | 6.42 | % | | | 0.56 | % |
Net assets, end of the year | | | | | | | | | | | | |
(in thousands) | | $ | 3,275 | | | $ | 1,848 | | | $ | 1,329 | |
Ratio of expenses to average net assets | | | 1.32 | % | | | 1.37 | % | | | 1.40 | % |
Ratio of net investment income to average net assets | | | 1.39 | % | | | 0.87 | % | | | 1.31 | % |
Portfolio turnover | | | 11.31 | % | | | 30.44 | % | | | 37.14 | % |
Number of shares outstanding at end of the year | | | 59,105 | | | | 38,727 | | | | 28,653 | |
| * | Investor Shares inception date was December 31, 2014. |
| ** | The selected per share data was calculated using the average shares outstanding method for the period. |
The accompanying notes are an integral part of these financial statements.
19
NEW ALTERNATIVES FUND
NOTES TO FINANCIAL STATEMENTS
For the Year Ended December 31, 2017
1) ORGANIZATION – New Alternatives Fund (the “Trust”) was organized as a Delaware statutory trust on June 12, 2014. The Trust currently offers one series of shares, also known as “New Alternatives Fund” (the “Fund”). The Fund is the successor to New Alternatives Fund, Inc. (the “Predecessor Company”), a New York corporation that commenced operations in 1982. The Fund is a diversified, open-end management investment company registered under the Investment Company Act of 1940, as amended (the “1940 Act”). On November 14, 2014, the Predecessor Company was reorganized into the Fund. The Fund was organized for the purpose of continuing the investment operations and performance history of the Predecessor Company and prior to the reorganization had no substantial assets or prior history of investment operations. The Fund currently offers two classes of shares: Class A Shares and Investor Shares. Class A Shares represent a continuance of the original class of shares offered by the Predecessor Company. Class A Shares are sold subject to a front-end sales charge. Class A Shares of the Fund do not have any distribution (i.e., Rule 12b-1) charges, service charges or redemption fees. Investor Shares are not subject to a sales charge but are subject to a 2.00% redemption fee imposed on any Investor Shares redeemed within sixty (60) days of their initial purchase. Any redemption fee imposed is retained by the Fund and is meant to deter short-term trading in Investor Shares and to offset any transaction and other costs associated with short-term trading. For the year ended December 31, 2017, no redemption fees were imposed on the redemption of Investor Shares. Investor Shares are also subject to 12b-1 fees. The investment objective of the Fund is long-term capital appreciation, with income as a secondary objective. The Fund seeks to achieve its investment objective by investing in equity securities. The equity securities in which the Fund invests consist primarily of common stocks. Other equity securities in which the Fund may invest include American Depositary Receipts, real estate investment trusts and publicly-traded master limited partnerships. The Fund makes investments in a wide range of industries and in companies of all sizes. The Fund invests in equity securities of both U.S. and foreign companies, and has no limitation on the percentage of assets invested in the U.S. or abroad. Under normal market conditions, at least 25% of the Fund’s total assets will be invested in equity securities of companies in the alternative energy industry. “Alternative Energy” means the production, conservation, storage and transmission of energy to reduce pollution and harm to the environment, particularly when compared to conventional coal, oil or nuclear energy.
2) ACCOUNTING POLICIES – The Fund is an investment company that follows the accounting and reporting guidance of Accounting Standards Codification Topic 946 applicable to Investment Companies. The following is a summary of significant accounting policies followed by the Fund.
A. PORTFOLIO VALUATION –The Fund’s net asset value (“NAV”) is calculated once daily at the close of regular trading hours on the New York Stock Exchange (“NYSE”) (generally 4:00 p.m. Eastern time) on each day the NYSE is open. Securities held by the Fund are valued based on the official closing price or the last reported sale price on national securities exchanges where they are primarily traded or on the National Association of Securities Dealers Automatic Quotation System (“NASDAQ”) market system as of the close of business on the day the
20
NEW ALTERNATIVES FUND
NOTES TO FINANCIAL STATEMENTS
For the Year Ended December 31, 2017
securities are being valued. That is normally 4:00 p.m. Eastern time. If there were no sales on that day or the securities are traded on other over-the-counter markets, the mean of the last bid and asked prices prior to the market close is used. Short-term debt securities having a remaining maturity of 60 days or less are valued based on amortized cost. Certificates of Deposit securities are valued at amortized cost, provided such amount approximates market value and are categorized in Level 2.
Non-U.S. equity securities are valued based on their most recent closing market prices on their primary market and are translated from the local currency into U.S. dollars using current exchange rates on the day of valuation. The Fund may hold securities that are primarily listed on foreign exchanges that trade on weekends or other days when the Fund does not price its shares. As such, the Fund’s NAV may change on days when shareholders will not be able to purchase or redeem Fund shares.
If the market price of a security held by the Fund is unavailable at the time the Fund prices its shares at 4:00 p.m. Eastern time, the Fund will use the “fair value” of such security as determined in good faith by Accrued Equities, Inc., the Fund’s investment advisor, under methods established by and under the general supervision of the Trust’s Board of Trustees. The Fund may use fair value pricing if the value of a security it holds has been materially affected by events occurring before the Fund’s pricing time but after the close of the primary markets or exchange on which the security is traded. This most commonly occurs with foreign securities, but may occur in other cases as well. Certain foreign securities are fair valued by utilizing an external pricing service in the event of any significant market movements between the time the Fund valued such foreign securities and the earlier closing of foreign markets. The Fund does not invest in unlisted securities.
The inputs and valuations techniques used to measure fair value of the Fund’s net assets are summarized into three levels as described in the hierarchy below:
| | | | |
| • Level 1 | | - | | Unadjusted quoted prices in active markets for identical assets or liabilities that the Fund has the ability to access. |
| | |
| • Level 2 | | - | | Observable inputs other than quoted prices included in Level 1 that are observable for the asset or liability, either directly or indirectly. These inputs may include quoted prices for the identical instrument on an inactive market, prices for similar instruments, interest rates, prepayment speeds, credit risk, yield curves, default rates and similar data. |
| | |
| • Level 3 | | - | | Unobservable inputs for the asset or liability, to the extent relevant observable inputs are not available, representing the Fund’s own assumptions about |
21
NEW ALTERNATIVES FUND
NOTES TO FINANCIAL STATEMENTS
For the Year Ended December 31, 2017
the assumptions a market participant would use in valuing the asset or liability, and would be based on the best information available.
The inputs or methodology used for valuing securities are not necessarily an indication of the risk associated with investing in those securities.
The following is a summary of the inputs used, as of December 31, 2017, in valuing the Fund’s assets carried at fair value:
| | | | | | | | | | | | | | | | |
| | | Total
Value at
12/31/2017 | | | Level 1 –
Quoted
Price | | | Level 2 –
Significant
Observable
Inputs | | | Level 3 –
Significant
Unobservable
Inputs | |
Common Stocks | | | | | | | | | | | | | | | | |
Alternate Energy | | $ | 177,443,242 | | | $ | 177,443,242 | | | $ | — | | | $ | — | |
Sustainable Energy Financial | | | | | | | | | | | | | | | | |
Services | | | 12,030,000 | | | | 12,030,000 | | | | — | | | | — | |
Energy Conservation | | | 8,980,200 | | | | 8,980,200 | | | | — | | | | — | |
Water Utilities | | | 2,287,250 | | | | 2,287,250 | | | | — | | | | — | |
Transportation | | | 311,350 | | | | 311,350 | | | | — | | | | — | |
Warrants | | | — | | | | — | | | | 0 | | | | — | |
Certificates of Deposit | | | 500,000 | | | | — | | | | 500,000 | | | | — | |
| | | | | | | | | | | | | | | | |
Total | | $ | 201,552,042 | | | $ | 201,052,042 | | | $ | 500,000 | | | $ | — | |
| | | | | | | | | | | | | | | | |
At the end of each calendar quarter, management evaluates the classification of Level 1, 2 and 3 assets and liabilities. Various factors are considered, such as changes in liquidity from the prior reporting period; whether or not a broker is willing to execute at the quoted price; the depth and consistency of prices from third party pricing services; and the existence of contemporaneous, observable trades in the market. Additionally, management evaluates the classification of Level 1 and Level 2 assets and liabilities on a quarterly basis for changes in listings or delistings on national exchanges.
The Fund utilizes an external pricing service to fair value certain foreign securities in the event of any significant market movements between the time the Fund valued certain foreign securities and the earlier closing of foreign markets. Such fair valuations are categorized as Level 2 in the hierarchy. Significant market movements were not deemed to have occurred at December 31, 2017, and therefore, the Fund did not utilize the external pricing service model adjustments. Transfers in and out between Levels are based on values at the end of the period. The Fund did not hold any Level 3 categorized securities during the year ended December 31, 2017.
22
NEW ALTERNATIVES FUND
NOTES TO FINANCIAL STATEMENTS
For the Year Ended December 31, 2017
B. FOREIGN CURRENCY TRANSLATION – Investment securities and other assets and liabilities denominated in foreign currencies are translated into U.S. dollar amounts at the date of valuation. Purchases and sales of investment securities and income and expense items denominated in foreign currencies are translated into U.S. dollar amounts on the respective dates of such transactions. If foreign currency translations are not available, the foreign exchange rate(s) will be valued at fair market value using procedures approved by the Trust’s Board of Trustees.
The Fund does not isolate that portion of the results of operations resulting from changes in foreign exchange rates on investments from the fluctuations arising from changes in market prices of securities held. Such fluctuations are included with the net realized and unrealized gain or loss from investments.
Reported net realized foreign exchange gains or losses arise from sales of foreign currencies, currency gains or losses realized between the trade and settlement dates on securities transactions, and the difference between the amounts of dividends, interest, and foreign withholding taxes recorded on the Fund’s books and the U.S. dollar equivalent of the amounts actually received or paid.
Foreign Securities – Investing in foreign securities (including depositary receipts traded on U.S. exchanges but representing shares of foreign companies) involves different risks than investing in U.S. securities. Risks of investing in foreign companies include currency exchange rates between foreign currencies and the U.S. dollar. The political, economic and social structures of some foreign countries may be less stable and more volatile than those in the U.S. Brokerage commissions and other fees may be higher for foreign securities. Foreign companies may not be subject to the same disclosure, accounting, auditing and financial reporting standards as U.S. companies. These risks can increase the potential for losses in the Fund and affect its share price.
C. SECURITY TRANSACTIONS AND RELATED INVESTMENT INCOME – Security transactions are accounted for on the trade date (date order to buy or sell is executed). The cost of investments sold is determined by use of specific lots for both financial reporting and income tax purposes in determining realized gains and losses on investments.
D. INVESTMENT INCOME AND EXPENSE RECOGNITION – Dividend income is recorded as of the ex-dividend date. Foreign dividend income is recorded on the ex-dividend date or as soon as possible after the Fund determines the existence of a dividend declaration after exercising reasonable diligence. Interest income, including amortization/accretion of premium and discount, is accrued daily. Expenses are accrued on a daily basis.
23
NEW ALTERNATIVES FUND
NOTES TO FINANCIAL STATEMENTS
For the Year Ended December 31, 2017
E. DIVIDENDS AND DISTRIBUTIONS TO SHAREHOLDERS – Dividends from net investment income and distributions from net realized capital gains, if any, will be declared and paid at least annually to shareholders and recorded on ex-date. Income dividends and capital gain distributions are determined in accordance with U.S. federal income tax regulations which may differ from accounting principles generally accepted in the United States of America.
F. U.S. TAX STATUS – No provision is made for U.S. income taxes as it is the Fund’s intention to qualify for and elect the tax treatment applicable to regulated investment companies under Subchapter M of the Internal Revenue Code of 1986, as amended, and make the requisite distributions to its shareholders which will be sufficient to relieve it from U.S. income and excise taxes.
G. USE OF ESTIMATES IN THE PREPARATION OF FINANCIAL STATEMENTS – The preparation of financial statements in conformity with accounting principles generally accepted in the United States of America requires management to make estimates and assumptions that affect the reported amounts of assets and liabilities and disclosure of contingent assets and liabilities at the date of the financial statements and the reported amounts of revenue and expenses during the reporting period. Actual results could differ from those estimates.
H. OTHER – In the normal course of business, the Fund may enter into contracts that provide general indemnifications. The Fund’s maximum exposure under these arrangements is dependent on claims that may be made against the Fund in the future, and therefore, cannot be estimated; however, based on experience, the risk of material loss for such claims is considered remote.
I. ALLOCATION – Investment income earned, realized capital gains and losses, and unrealized appreciation and depreciation for the Fund are allocated daily to each class of shares based upon its proportionate share of total net assets of the Fund. Class-specific expenses are charged directly to the class incurring the expense. Common expenses, which are not attributable to a specific class, are allocated daily to each class of shares based upon its proportionate share of total net assets of the Fund.
J. CASH – Cash represents amounts held on deposit with the Fund’s custodian bank. Balances at times may exceed federally insured limits.
24
NEW ALTERNATIVES FUND
NOTES TO FINANCIAL STATEMENTS
For the Year Ended December 31, 2017
3) SHARES OF BENEFICIAL INTEREST –There are unlimited, no par value shares of beneficial interest authorized. On December 31, 2017, the Fund’s total shares outstanding were 3, 836, 704. Aggregate paid-in capital including reinvestment of dividends was $194,077,835. Transactions in shares of beneficial interest were as follows:
| | | | | | | | | | | | | | | | |
| | | For the Year Ended
December 31, 2017 | | | For the Year Ended
December 31, 2016 | |
| | | Shares | | | Amount | | | Shares | | | Amount | |
Class A Shares | | | | | | | | | | | | | | | | |
Shares of beneficial interest sold | | | 240,959 | | | $ | 13,232,296 | | | | 255,002 | | | $ | 12,335,424 | |
Reinvestment of distributions | | | 134,297 | | | | 7,461,068 | | | | 119,496 | | | | 5,704,759 | |
Redemptions | | | (364,391 | ) | | | (19,964,816 | ) | | | (433,143 | ) | | | (21,015,228 | ) |
Capital contribution | | | — | | | | 3,192 | * | | | — | | | | — | |
| | | | | | | | | | | | | | | | |
Net Increase (Decrease) | | | 10,865 | | | $ | 731,740 | | | | (58,645 | ) | | $ | (2,975,045 | ) |
| | | | | | | | | | | | | | | | |
| | | | | | | | | | | | | | | | |
| | | For the Year Ended
December 31, 2017 | | | For the Year Ended
December 31, 2016 | |
| | | Shares | | | Amount | | | Shares | | | Amount | |
Investor Shares | | | | | | | | | | | | | | | | |
Shares of beneficial interest sold | | | 27,897 | | | $ | 1,544,328 | | | | 12,370 | | | $ | 610,800 | |
Reinvestment of distributions | | | 2,208 | | | | 122,367 | | | | 1,278 | | | | 60,879 | |
Redemptions | | | (9,727 | ) | | | (518,333 | ) | | | (3,574 | ) | | | (172,725 | ) |
Capital contribution | | | — | | | | 35 | * | | | — | | | | — | |
| | | | | | | | | | | | | | | | |
Net Increase | | | 20,378 | | | $ | 1,148,397 | | | | 10,074 | | | $ | 498,954 | |
| | | | | | | | | | | | | | | | |
| * | During the fiscal year ended December 31, 2017, the Fund was reimbursed $3,227 by BNY Mellon Investment Servicing (U.S.), Inc. for losses incurred on the cost of correcting the Fund’s net asset value. |
4) MANAGEMENT FEE AND OTHER TRANSACTIONS WITH AFFILIATES–Accrued Equities, Inc. (“Accrued Equities” or the “Advisor”), an SEC registered investment advisor and broker-dealer, serves as investment advisor to the Fund pursuant to an Investment Advisory Agreement, and as an underwriter (but not a principal underwriter) of the Fund’s shares pursuant to a Sub-Distribution Agreement. For it’s investment advisory services, the Fund pays Accrued Equities an annual management fee of 1.00% of the first $25 million of average daily net assets; 0.50% of the next $475 million of average daily net assets; and 0.40% of average daily net assets more than $500 million. The Fund incurred management fees of $1,154,085 for the year ended December 31, 2017.
25
NEW ALTERNATIVES FUND
NOTES TO FINANCIAL STATEMENTS
For the Year Ended December 31, 2017
The Fund pays no remuneration to two of its trustees, David J. Schoenwald and Murray D. Rosenblith, who are also officers or employees of Accrued Equities.
Foreside Funds Distributors LLC (the “Distributor”) serves as the principal underwriter of the Fund pursuant to a Distribution Agreement for the limited purpose of acting as statutory underwriter to facilitate the distribution of shares of the Fund. The Distributor has entered into a Sub-Distribution Agreement with Accrued Equities. Effective May 1, 2017, the Fund charges a maximum front-end sales charge of 3.50% on most new sales of the Fund’s Class A Shares. Prior to May 1, 2017, the Fund charged a maximum front-end sales charge on Class A Shares of 4.75%. Of this amount, the Distributor and Accrued Equities receive the net underwriter commission and pay out the remaining sales commission to other brokers who actually sell new Class A Shares. Their share of the sales commission may vary. The aggregate underwriter commissions on all sales of Class A Shares of the Fund during the year ended December 31, 2017 was $35,269, and the amounts received by the Distributor and Accrued Equities were $11,756 and $23,513, respectively. The Distributor and Accrued Equities are also entitled to receive sales commissions for the sale of Class A Shares. For the year ended December 31, 2017, the Distributor and Accrued Equities received $5,094 and $18,247 in sales commissions, respectively, for the sale of Class A Shares of the Fund. Underwriter commissions and sales commissions received by the Distributor are set aside by the Distributor and used solely for distribution-related expenses.
Investor Shares of the Fund are not subject to a sales charge. The Fund has adopted a distribution plan (the “Rule 12b-1 Plan”) for its Investor Shares in accordance with the requirements of Rule 12b-1 under the 1940 Act. The Rule 12b-1 Plan provides that the Fund may pay a fee to Accrued Equities, the Distributor, or certain broker-dealers, investment advisers, banks or other financial institutions at an annual rate of up to 0.25% of the average daily net assets of the Fund’s Investor Shares to finance certain activities primarily intended to sell such Investor Shares. For the year ended December 31, 2017, 12b-1 Fees of $6,155 were accrued by the Investor Shares of the Fund.
5) TRUSTEES’ FEES – For the year ended December 31, 2017, the Fund paid trustees’ fees of $21,000 to its Trustees who are not “interested persons” of the Trust, as that term is defined in the 1940 Act (the “Independent Trustees”).
Each Independent Trustee receives an annual fee of $4,500 for their services as an Independent Trustee of the Trust. As Vice-Chairperson of the Trust’s Board of Trustees, Sharon Reier receives an additional annual fee of $1,000. Each member of the Audit Committee receives an additional $500 annual fee and Susan Hickey, Chairperson of the Audit Committee, receives an additional annual fee of $500. The Independent Trustees also receive reimbursement of “coach” travel expenses to attend Board Meetings. The Trustees and Officers of the Trust who are officers and employees of the Advisor do not receive compensation from the Fund for their services and are paid for their services by the Advisor. The Fund’s Chief Compliance Officer is not an officer or employee of the Advisor and is compensated directly by the Fund for his services.
26
NEW ALTERNATIVES FUND
NOTES TO FINANCIAL STATEMENTS
For the Year Ended December 31, 2017
6) PURCHASES AND SALES OF SECURITIES – For the year ended December 31, 2017, the aggregate cost of securities purchased totaled $22,049,580. Net realized gains (losses) were computed on a specific lot basis. The proceeds received on sales of securities for the year ended December 31, 2017 was $25,268,070.
7) FEDERAL INCOME TAX INFORMATION – At December 31, 2017, the federal tax basis cost and aggregate gross unrealized appreciation and depreciation of securities held by the Fund were as follows:
| | | | |
Cost of investments for tax purposes | | $ | 182,312,031 | |
| | | | |
Unrealized appreciation for tax purposes | | $ | 30,202,373 | |
Unrealized depreciation for tax purposes | | | (10,950,757 | ) |
| | | | |
Net unrealized appreciation on investments and foreign currency translation | | $ | 19,251,616 | |
| | | | |
The tax character of distributions paid during 2017 and 2016 was as follows:
| | | | | | | | |
Distributions paid from: | | | 2017 | | | | 2016 | |
| | |
Ordinary Income | | $ | 3,796,765 | | | $ | 2,464,955 | |
Long-Term Capital Gains | | | 4,777,900 | | | | 4,065,959 | |
| | | | | | | | |
| | | $8,574,665 | | | $6,530,914 | |
| | | | | | | | |
For federal income tax purposes, distributions from net investment income and short-term capital gains are treated as ordinary income dividends.
The following permanent differences as of December 31, 2017, attributable to transactions involving foreign securities and currencies and investments in partnerships were reclassified to the following accounts:
| | | | |
Accumulated Net Realized Loss | | $ | (192,558 | ) |
Distributions in Excess of Net Investment Income | | | 192,558 | |
As of December 31, 2017, the components of distributable earnings (deficit) on a tax basis were as follows:
| | | | |
Overdistributed Ordinary Income | | $ | (250,023 | ) |
Net Unrealized Appreciation on | | | | |
Investments and Foreign Currency Translations* | | | 19,251,616 | |
| | | | |
| | $ | 19,001,593 | |
| | | | |
* The primary difference between distributable earnings on a book and tax basis is due to wash sale losses, investments in partnerships and other book tax cost differences.
27
NEW ALTERNATIVES FUND
NOTES TO FINANCIAL STATEMENTS
For the Year Ended December 31, 2017
Management has analyzed the Fund’s tax positions taken on federal income tax returns for all open tax years (current and prior three tax years), and has concluded that no provision for federal income tax is required in the Fund’s financial statements. The Fund’s federal and state income and federal excise tax returns for tax years for which the applicable statutes of limitations have not expired are subject to examination by the Internal Revenue Service and state departments of revenue.
8) SUBSEQUENT EVENTS – Management has evaluated the impact of all subsequent events on the Fund through the date the financial statements were issued and has determined that there was the following subsequent event:
Effective January 1, 2018, each Independent Trustee receives a base annual fee of $7,000 for their services as an Independent Trustee of the Trust. All other Trustee fees remain unchanged.
28

REPORT OF INDEPENDENT REGISTERED PUBLIC ACCOUNTING FIRM
To the Shareholders and Board of Trustees of
New Alternatives Fund
Opinion on the Financial Statements
We have audited the accompanying statement of assets and liabilities of New Alternatives Fund (the “Fund”), including the schedule of investments, as of December 31, 2017, and the related statement of operations for the year then ended, the statements of changes in net assets for each of the years in the two-year period then ended and the financial highlights for each of the years and periods in the five-year period then ended, and the related notes and schedules (collectively referred to as the “financial statements”). In our opinion, the financial statements and financial highlights present fairly, in all material respects, the financial position of the Fund as of December 31, 2017, and the results of its operations for the year then ended, the changes in its net assets for each of the years in the two-year period then ended and its financial highlights for each of the years and periods in the five-year period then ended, in conformity with accounting principles generally accepted in the United States of America (“GAAP”).
Basis for Opinion
These financial statements and financial highlights are the responsibility of the Fund’s management. Our responsibility is to express an opinion on the Fund’s financial statements and financial highlights based on our audits. We are a public accounting firm registered with the Public Company Accounting Oversight Board (United States) (“PCAOB”) and are required to be independent with respect to the Fund in accordance with the U.S. federal securities law and the applicable rules and regulations of the Securities and Exchange Commission and the PCAOB.
We conducted our audits in accordance with the standards of the PCAOB. Those standards require that we plan and perform the audits to obtain reasonable assurance about whether the financial statements and financial highlights are free of material misstatement, whether due to error or fraud. The Fund is not required to have, nor were we engaged to perform, an audit of its internal control over financial reporting. As part of our audits we are required to obtain an understanding of internal control over financial reporting but not for the purpose of expressing an opinion on the effectiveness of the Fund’s internal control over financial reporting. Accordingly, we express no such opinion.
Our audits included performing procedures to assess the risk of material misstatement of the financial statements, whether due to error or fraud, and performing procedures that respond to those risks. Such procedures include examining, on a test basis, evidence regarding the amounts and disclosures in the financial statements. Our procedures included confirmation of securities owned as of December 31,
29
2017 by correspondence with the custodian and other appropriate parties. Our audits also included evaluating the accounting principles used and significant estimates made by management, as well as evaluating the overall presentation of the financial statements. We believe that our audits provide a reasonable basis for our opinion.

BBD, LLP
We have served as the auditor of the New Alternatives Fund since 2007.
Philadelphia, Pennsylvania
February 27, 2018
30
NEW ALTERNATIVES FUND
OTHER INFORMATION
(Unaudited)
1) PROXY VOTING – The Fund has proxy voting policies and procedures that the Fund uses to determine how to vote proxies relating to portfolio securities held by the Fund which are available: (1) without charge, upon request by calling the Fund at 800-423-8383 and (2) on the SEC’s website at http://www.sec.gov. Information regarding how the Fund voted proxies relating to portfolio securities held by the Fund during the most recent twelve-month period ended June 30 is available on Form N-PX: (1) without charge, upon request, by calling the Fund at 800-423-8383 and (2) on the SEC’s website at http://www.sec.gov.
2) QUARTERLY PORTFOLIO SCHEDULES – The Fund files a complete schedule of portfolio holdings with the SEC for the first and third quarters of each fiscal year (quarters ended March 31 and September 30) on Form N-Q. The Fund’s Form N-Q’s are available on the SEC website at http://www.sec.gov and may be reviewed and copied at the SEC Public Reference Room in Washington, D.C. Information on the operation of the SEC Public Reference Room may be obtained by calling 1-800-SEC-0330.
31
NEW ALTERNATIVES FUND
SHAREHOLDER TAX INFORMATION
(Unaudited)
During the fiscal year ended December 31, 2017, the following dividends were paid by the Fund:
| | | | |
Ordinary Income | | $ | 3,796,765 | |
Long-term Capital Gains | | $ | 4,777,900 | |
The Fund paid foreign taxes of $652,268 and recognized foreign source income of $3,298,246 pursuant to Section 853 of the Internal Revenue Code. The Fund will elect to pass these foreign taxes through to shareholders as a foreign tax credit and designates such amounts as having been paid in connection with dividends distributed from investment taxable income during the year ended December 31, 2017.
For the year ended December 31, 2017, certain dividends may be subject to a maximum capital gains tax rate, as provided for by the Jobs and Growth Tax Relief Reconciliation Act of 2003. For individual shareholders, 100% of their ordinary income dividends for the Fund qualify for the maximum capital gains tax rate. Complete information will be computed and reported in conjunction with your Form 1099-DIV.
For corporate shareholders, 34.98% of the ordinary income dividends qualify for the dividends received deduction.
Shareholders are advised to consult their own tax advisors with respect to the tax consequences of their investments in the Fund.
32
BOARD OF TRUSTEES AND OFFICERS
(Unaudited)
The Predecessor Company was a New York corporation governed by a Board of Directors. The Board of Directors of the Predecessor Company was identical to the Trust’s current Board of Trustees. Information pertaining to the Trustees and Officers of the Trust is provided in the table below. Certain information on the Trustees includes information on such Trustee’s service on the Board of Directors of the Predecessor Company. The Statement of Additional Information includes additional information about the Trustees and is available without charge, upon request, by calling the Fund at 800-423-8383 or by visiting the Fund’s website at www.newalternativesfund.com. The mailing address for the Trustees and Officers of the Trust is c/o New Alternatives Fund, 150 Broadhollow Road, Suite PH2, Melville, New York 11747.
| | | | | | | | | | |
Name and Year of Birth | | Position(s) Held with the Trust | | Term of Office and Length of Time Served1 | | Principal
Occupation(s)
During the Past Five Years | | Number of
Portfolios in
Trust
Complex
To Be
Overseen by
Trustee2 | | All
Directorships
Held by
Trustee
During the
Past Five
Years3 |
| | | | | |
Interested Trustee: | | | | | | | | | | |
| | | | | |
| David J. Schoenwald* 1949 | | Founder, Trustee, President, Treasurer and Chairperson of the Board | | Founder, Trustee, President and Treasurer, 1982 to present; Chairperson of the Board, 2008 to present. | | President, Treasurer and Portfolio Manager, Accrued Equities, Inc.** | | 1 | | None |
| | | | | |
| Murray D. Rosenblith* 1951 | | Trustee and Secretary | | Trustee, 2003 to present; Secretary, 2012 to present; Assistant Secretary, 2009 to 2012. | | Portfolio Manager and Assistant Compliance Officer (2010 to present), and employee, Accrued Equities, Inc.** (2008 to present); formerly, Executive Director, A.J. Muste Memorial Institute, an organization concerned with exploration of the link between non- violence and social change (1985 to 2008). | | 1 | | None |
33
BOARD OF TRUSTEES AND OFFICERS
(Unaudited)
| | | | | | | | | | |
Name and Year of Birth | | Position(s) Held with the Trust | | Term of Office and Length of Time Served1 | | Principal
Occupation(s) During the Past Five Years | | Number of
Portfolios in
Trust
Complex
To Be
Overseen by
Trustee2 | | All
Directorships
Held by
Trustee
During the
Past Five
Years3 |
| | | | | |
Independent Trustees: | | | | | | | | | | |
| | | | | |
Sharon Reier 1946 | | Trustee and Vice- Chairperson of the Board | | Trustee, 1982 to present; Vice- Chairperson, 2008 to present. | | Retired; prior thereto, freelance financial journalist; Contributor to the International Herald Tribune, (1995 to 2011); former contributor to Business Week International; former regional editor, Financial World; former editor, Boardroom Reports; former contributing editor, Institutional Investor; former staff, Forbes and American Banker. | | 1 | | None |
| | | | | |
Susan Hickey 1952 | | Trustee, Audit Committee Member and Audit Committee Chairperson | | Trustee and Audit Committee Member, 2005 to present; Audit Committee Chairperson, 2014 to present. | | Self-Employed Tax Preparer (1983 to present); prior thereto, Accounting Software Developer, Accountants World, LLC. (until 2016); Member of National Association of Enrolled Agents and New York Society of Independent Accountants; Former IRS Tax Return Auditor; BA International Affairs, Stonehill College, North Easton, MA. | | 1 | | None |
34
BOARD OF TRUSTEES AND OFFICERS
(Unaudited)
| | | | | | | | | | |
Name and Year of Birth | | Position(s) Held with the Trust | | Term of Office and Length of Time Served1 | | Principal
Occupation(s)
During the Past Five Years | | Number of
Portfolios in
Trust
Complex To Be
Overseen by
Trustee2 | | All
Directorships
Held by
Trustee
During the
Past Five
Year3 |
| | | | | |
| Jonathan D. Beard 1948 | | Trustee and Audit Committee Member | | Trustee, 2005 to present; Audit Committee Member, 2014 to present. | | Retired; prior thereto, Self-employed Freelance Journalist for various American and European Science Magazines; Lifetime Member, Sierra Club and New York-New Jersey Trails Conference; Graduate of Columbia University 1970. | | 1 | | None |
| Jeffrey E. Perlman 1979 | | Trustee and Audit Committee Member | | Trustee, 2009 to present; Audit Committee Member, 2014 to present. | | President and Founder, Bright Power, a company advancing clean, cost-effective energy solutions (2004 to present); Clarinetist/ Saxophonist, Romashka and various Klezmer music ensembles (1996 to present); Formerly, Consultant, Capital E, a renewable energy consulting and investment services company (2002 to 2005). | | 1 | | None |
Officers of the Trust who are not Trustees: | | | | | | | | |
| Joseph A. Don Angelo 1948 | | Chief Compliance Officer | | 2007 to present. | | Certified Public Accountant and Owner, Don Angelo and Associates, CPAs P.C. (1984 to present). | | N/A | | N/A |
35
BOARD OF TRUSTEES AND OFFICERS
(Unaudited)
| 1 | Each Trustee holds office until the next meeting of shareholders for the election of Trustees and until his or her successor has been elected and qualified, except in the event of his or her death, resignation or removal. Officers are appointed on an annual basis and serve at the pleasure of the Trustees. |
| 2 | Currently, there is only one portfolio and no fund complex. |
| 3 | Includes directorships of companies required to report to the SEC under the Securities Exchange Act of 1934, as amended (i.e., “public companies”), or other investment companies registered under the 1940 Act. |
| * | “Interested person”, as defined in section 2(a)(19) of the 1940 Act. David J. Schoenwald is majority shareholder and President of the Advisor. Murray D. Rosenblith is considered an “interested person” as a result of his employment with the Advisor. |
| ** | David J. Schoenwald and Murray D. Rosenblith have no present enterprise, employment, position or commercial investment activity except for their positions with the Advisor, which is also the Fund’s Sub-Distributor. At the present time, the Advisor provides services only to the Fund. |
36
Item 2. Code of Ethics.
| | (a) | The registrant, as of the end of the period covered by this report, has adopted a code of ethics that applies to the registrant’s principal executive officer, principal financial officer, principal accounting officer or controller, or persons performing similar functions, regardless of whether these individuals are employed by the registrant or a third party. |
| | (c) | There have been no amendments, during the period covered by this report, to a provision of the code of ethics that applies to the registrant’s principal executive officer, principal financial officer, principal accounting officer or controller, or persons performing similar functions, regardless of whether these individuals are employed by the registrant or a third party, and that relates to any element of the code of ethics description. |
| | (d) | The registrant has not granted any waivers, including an implicit waiver, from a provision of the code of ethics that applies to the registrant’s principal executive officer, principal financial officer, principal accounting officer or controller, or persons performing similar functions, regardless of whether these individuals are employed by the registrant or a third party, that relates to one or more of the items set forth in paragraph (b) of this item’s instructions. |
| | (e) | The registrant shall provide to any person, without charge, upon request, by calling the registrant at 1-800-423-8383, a copy of its code of ethics. |
Item 3. Audit Committee Financial Expert.
As of the end of the period covered by the report, the registrant’s Board of Trustees has determined that Susan Hickey is qualified to serve as an audit committee financial expert serving on its audit committee and that she is “independent,” as defined by Item 3 of Form N-CSR.
Item 4. Principal Accountant Fees and Services.
Audit Fees
| | (a) | The aggregate fees billed for each of the last two fiscal years for professional services rendered by the principal accountant for the audit of the registrant’s annual financial statements or services that are normally provided by the accountant in connection with statutory and regulatory filings or engagements for those fiscal years are $19,250 for 2016 and $19,500 for 2017. |
Audit-Related Fees
| | (b) | The aggregate fees billed in each of the last two fiscal years for assurance and related services by the principal accountant that are reasonably related to the performance of the audit of the |
| | registrant’s financial statements and are not reported under paragraph (a) of this Item are $0 for 2016 and $0 for 2017. |
Tax Fees
| | (c) | The aggregate fees billed in each of the last two fiscal years for professional services rendered by the principal accountant for tax compliance, tax advice, and tax planning are $2,000 for 2016 and $2,200 for 2017. The fees billed were for review by the principal accountant of the registrant’s Federal tax returns. |
All Other Fees
| | (d) | The aggregate fees billed in each of the last two fiscal years for products and services provided by the principal accountant, other than the services reported in paragraphs (a) through (c) of this Item are $0 for 2016 and $0 for 2017. |
| (e)(1) | Disclose the audit committee’s pre-approval policies and procedures described in paragraph (c)(7) of Rule 2-01 of Regulation S-X. |
| (e)(2) | The percentage of services described in each of paragraphs (b) through (d) of this Item that were approved by the audit committee pursuant to paragraph (c)(7)(i)(C) of Rule 2-01 of Regulation S-X are as follows: |
(b) N/A
(c) 100%
(d) N/A
| | (f) | The percentage of hours expended on the principal accountant’s engagement to audit the registrant’s financial statements for the most recent fiscal year that were attributed to work performed by persons other than the principal accountant’s full-time, permanent employees was less than fifty percent. |
| | (g) | The aggregate non-audit fees billed by the registrant’s accountant for services rendered to the registrant, and rendered to the registrant’s investment adviser (not including any sub-adviser whose role is primarily portfolio management and is subcontracted with or overseen by another investment adviser), and any entity controlling, controlled by, or under common control with the adviser that provides ongoing services to the registrant for each of the last two fiscal years of the registrant was $0 for 2016 and $0 for 2017. |
Item 5. Audit Committee of Listed Registrants.
Not applicable to registrant.
Item 6. Investments.
| (a) | Not applicable. The full Schedule of Investments in securities of unaffiliated issuers as of the close of the reporting period is included as part of the audited annual report to shareholders filed under Item 1 of this Form. |
| Item 7. | Disclosure of Proxy Voting Policies and Procedures for Closed-End Management Investment Companies. |
Not applicable to registrant, which is an open-end management investment company.
Item 8. Portfolio Managers of Closed-End Management Investment Companies.
Not applicable to registrant, which is an open-end management investment company.
| Item 9. | Purchases of Equity Securities by Closed-End Management Investment Company and Affiliated Purchasers. |
Not applicable to Registrant, which is an open-end management investment company.
Item 10. Submission of Matters to a Vote of Security Holders.
There have been no material changes to the procedures by which the shareholders may recommend nominees to the registrant’s Board of Trustees, where those changes were implemented after the registrant last provided disclosure in response to the requirements of Item 407(c)(2)(iv) of Regulation S-K (17 CFR 229.407) (as required by Item 22(b)(15) of Schedule 14A (17 CFR 240.14a-101)), or this Item.
Item 11. Controls and Procedures.
| | (a) | Based on his evaluation of the registrant’s disclosure controls and procedures (as defined in Rule 30a-3(c) under the Investment Company Act of 1940, as amended (the “1940 Act”)) as of a date within 90 days of the filing date of this report, the registrant’s principal executive officer and principal financial officer has concluded that such disclosure controls and procedures are reasonably designed and are operating effectively to ensure that material information relating to the registrant, including its consolidated subsidiaries, is made known to him by others within those entities, particularly during the period in which this report is being prepared, and that the information required in filings on Form N-CSR is recorded, processed, summarized, and reported on a timely basis. |
| | (b) | There were no changes in the registrant’s internal control over financial reporting (as defined in Rule 30a-3(d) under the 1940 Act (17 CFR 270.30a-3(d))) that occurred during the registrant’s |
| | last fiscal quarter that has materially affected, or is reasonably likely to materially affect, the registrant’s internal control over financial reporting. |
Item 12. Disclosure of Securities Lending Activities for Closed-End Management Investment Companies.
Not applicable.
Item 13. Exhibits.
| | (a)(1) | Code of ethics, or any amendments thereto, that is the subject of disclosure required by Item 2 is attached hereto. |
| | (a)(2) | Certifications pursuant to Rule 30a-2(a) under the 1940 Act and Section 302 of the Sarbanes-Oxley Act of 2002 are attached hereto. |
(a)(3) Not applicable.
(a)(4) Not applicable.
| | (b) | Certifications pursuant to Rule 30a-2(b) under the 1940 Act and Section 906 of the Sarbanes-Oxley Act of 2002 are attached hereto. |
SIGNATURES
Pursuant to the requirements of the Securities Exchange Act of 1934 and the Investment Company Act of 1940, the registrant has duly caused this report to be signed on its behalf by the undersigned, thereunto duly authorized.
(Registrant) New Alternatives Fund
By (Signature and Title)* /s/ David J. Schoenwald
David J. Schoenwald, President and Treasurer
(principal executive officer)
Date March 1, 2018
Pursuant to the requirements of the Securities Exchange Act of 1934 and the Investment Company Act of 1940, this report has been signed below by the following persons on behalf of the registrant and in the capacities and on the dates indicated.
By (Signature and Title)* /s/ David J. Schoenwald
David J. Schoenwald, President and Treasurer
(principal executive officer)
Date March 1, 2018
* Print the name and title of each signing officer under his or her signature.