UNITED STATES
SECURITIES AND EXCHANGE COMMISSION
Washington, D.C. 20549
FORMN-CSR
CERTIFIED SHAREHOLDER REPORT OF REGISTERED MANAGEMENT
INVESTMENT COMPANIES
Investment Company Act file number 811-03287
New Alternatives Fund
(Exact name of registrant as specified in charter)
150 Broadhollow Road, Suite PH2
Melville, New York 11747
(Address of principal executive offices) (Zip code)
David J. Schoenwald, President
New Alternatives Fund
150 Broadhollow Road, Suite PH2
Melville, New York 11747
(Name and address of agent for service)
Registrant’s telephone number, including area code: 631-423-7373
Date of fiscal year end: December 31
Date of reporting period: December 31, 2019
FormN-CSR is to be used by management investment companies to file reports with the Commission not later than 10 days after the transmission to stockholders of any report that is required to be transmitted to stockholders under Rule30e-1 under the Investment Company Act of 1940 (17 CFR270.30e-1). The Commission may use the information provided on FormN-CSR in its regulatory, disclosure review, inspection, and policymaking roles.
A registrant is required to disclose the information specified by FormN-CSR, and the Commission will make this information public. A registrant is not required to respond to the collection of information contained in FormN-CSR unless the Form displays a currently valid Office of Management and Budget (“OMB”) control number. Please direct comments concerning the accuracy of the information collection burden estimate and any suggestions for reducing the burden to Secretary, Securities and Exchange Commission, 450 Fifth Street, NW, Washington, DC 20549-0609. The OMB has reviewed this collection of information under the clearance requirements of 44 U.S.C. § 3507.
Item 1. Reports to Stockholders.
The Report to Shareholders is attached herewith.
| | | | |

| | New Alternatives Fund A SOCIALLY RESPONSIBLE MUTUAL FUND EMPHASIZING ALTERNATIVE ENERGY AND THE ENVIRONMENT ANNUAL FINANCIAL REPORT INVESTOR SHARES: NAEFX CLASS A SHARES: NALFX DECEMBER 31, 2019 | | |
Beginning on January 1, 2021, as permitted by regulations adopted by the Securities and Exchange Commission, paper copies of the Fund’s shareholder reports like this one will no longer be sent by mail, unless you specifically request paper copies of the reports from the Fund or from your financial intermediary, such as a broker-dealer or bank. Instead, the reports will be made available on the Fund’s website (https://www.newalternativesfund.com), and you will be notified by mail each time a report is posted and provided with a website link to access the report.
If you already elected to receive shareholder reports electronically, you will not be affected by this change and you need not take any action. You may elect to receive shareholder reports and other communications from the Fund electronically at any time by contacting your financial intermediary or, if you invest directly with the Fund, by logging into your account at www.newalternativesfund.com.
You may elect to receive all future reports in paper free of charge. If you invest through a financial intermediary, you can contact your financial intermediary to request that you continue to receive paper copies of your shareholder reports. If you invest directly with the Fund, you can call1-800-441-6580 to inform the Fund that you wish to continue receiving paper copies of your shareholder reports.
This report is submitted for the general information of the shareholders of the Fund. It is not authorized for distribution unless preceded or accompanied by a prospectus for the Fund.
| | | | | | | | |
| THE FUND | | 150 Broadhollow Road | | Melville, New York 11747 | | (800) 423-8383 | | (631) 423-7373 |
| BNY Mellon Investment Servicing (US) Inc. | | PO Box 9794 | | Providence, RI 02940 | | (800) 441-6580 | | (610) 382-7819 |
| Overnight Address | | 4400 Computer Drive | | Westborough, MA 01581 | | | | |
| Foreside Funds Distributors LLC | | 400 Berwyn Park, | | Berwyn, PA 19312 | | | | |
| | | 899 Cassatt Road | | | | | | |
Recycled Paper
NEW ALTERNATIVES FUND
MANAGEMENT’S COMMENTARY
AND DISCUSSION OF FINANCIAL PERFORMANCE
FOR THE YEAR 2019 (UNAUDITED)
Dear Shareholders:
Concern about the long-term effects of climate change exploded on the world scene in 2019. Despite a significant presence of “deniers” among national leaders, including the U.S. President, the growing scientific evidence accompanied by several significant natural disasters, sent the issue to the top tier of international concern. Accompanied by a continuing low interest rate environment, reasonably strong economic growth in the U.S. and other countries, this issue helped drive robust development of renewable energy and related industries around the world.
This energy picture was somewhat divided, given the backlash created by the retrograde policies supported by the Trump administration, combined with those emerging in the similarly nationalist governments in the United Kingdom, Brazil, India, Australia and Russia, among other places.
According to the annual World Energy Outlook, issued in November by the International Energy Agency (IEA), wind and solar power will be the fastest growing energy sources into the future, but overall growing energy demand will continue to outrun the increased capacity of clean energy sources. The gap will continue to be filled by fossil fuels, primarily natural gas. Global greenhouse gas emissions will continue to rise at a rate greater than the targets set by the United Nations’ Intergovernmental Panel on Climate Change (IPCC) to limit emissions to 2 degrees Celsius or less in the next 20 years.
The IEA report also noted that global coal consumption actually increased slightly in 2019. New coal fired power facilities are still being built and integrated into electric systems, mostly in China, Indonesia, India and Russia. While the expansion is slowing and projected to flatten out by 2024, these facilities will continue to operate well into the future unless there is a concerted effort to restrict coal use and retire these plants early. On the optimistic side, the report notes that a major factor driving the slower pace in both new coal and natural gas development is the growing cost advantage of solar and wind power coupled with battery storage. The costs for renewable power are falling rapidly. When coupled with the societal costs added to fossil fuel use, renewable power sources have a clear economic advantage going forward.
While the Trump administration continued to weaken policies that benefit renewable energy and energy conservation, there was still some forward progress in government supports for clean energy resources. At the same time that fuel economy standards for passenger vehicles and efficiency goals for lightbulbs and lighting fixtures were being rolled back, Congress passed (and Trump signed, under pressure from Midwest Republicans) extensions to tax credits and tax breaks for wind, hydropower, geothermal andwaste-to-energy projects. Funding that had previously been gutted for research at the Environmental Protection Agency and the Department of Energy was restored or even increased slightly, also by Congressional action.
Stock markets around the world continued the upward movement that has characterized the global economy for the past 10 years. In this sense, a “rising tide” has lifted most ships. 2019 was different. For the previous five years or so, the renewable energy sector, while growing, lagged behind the broader markets. This past year saw the renewable sector outperforming most of the major world indexes. For
1
NEW ALTERNATIVES FUND
MANAGEMENT’S COMMENTARY
AND DISCUSSION OF FINANCIAL PERFORMANCE
FOR THE YEAR 2019 (UNAUDITED)
example, broader indexes, like the S & P 500 Index, rose by 31.49 percent; the Russell 2000 Index was up 25.52 percent for 2019. More environmentally focused indexes, like the MSCI ACWI was up 26.6 percent; the FTSE Environmental Opportunities Index rose 31.53 percent. Class A Shares of New Alternatives Fund gained 36.98 percent for 2019.
Fund Performance:The Net Asset Value (“NAV”) of New Alternatives Fund’s Class A Shares was $48.48 on January 1, 2019 and closed at $62.92 after payment of a dividend from ordinary income of $0.26 per share and a long-term capital gain distribution of $3.23 per share on December 31, 2019. The Fund’s Investor Shares opened at a NAV of $48.36 on January 1, 2019 and closed at $62.74 after payment of a dividend from ordinary income of $0.13 per share and a long-term capital gain distribution of $3.23 per share on December 31, 2019. The Fund’s net assets increased from $174,369,876 on December 31, 2018 to $234,461,630 on December 31, 2019, primarily due to appreciation of the Fund’s holdings and net subscriptions of capital stock.
The Fund’s Class A Shares delivered a total return of 36.98 percent and the Investor Shares delivered a total return of 36.68 percent at year end on December 31, 2019. During the period from January 1, 2019 to December 31, 2019, the number of the Fund’s Class A Shares outstanding increased from 3,520,688 to 3,629,088 for a net gain of 108,400 shares. During that same time period, the Fund added a net total of 21,552 Investor Shares, increasing the number of those shares outstanding from 75,901 to 97,453.
Just over 34 percent of the Fund’s investments at December 31, 2019 were in U.S. based companies, including 5.9 percent held in cash (and cash equivalents) at U.S. banks and credit unions. This is down from 40 percent on December 31, 2018. European companies comprised 42 percent of the Fund’s holdings (with 26.7 percent priced in Euros); followed by Canada, 12.5 percent; Asia/Oceania, 6.8 percent; and Bermuda, 4.6 percent. Details are contained on page 15.
Portfolio Holdings and Changes:During the period from January 1, 2019 to December 31, 2019, we added 4 companies and sold off our positions in 4 companies to hold the total number of companies in the Fund’s portfolio to 37. For a description of the changes in the Fund’s holdings during the period from January 1 to June 30, 2019, please refer to our Semi-Annual Financial Report, which is available on our web site at:https://www.newalternativesfund.com/wp-content/uploads/2019/09/NAF-Semi-Annual-Report-6-30-2019.pdf.
In addition to the Fund’s holdings as of June 30, 2019, we bought shares of 4 companies:
| | ● | | ENEL SpA: Enel is an Italian electric utility and renewable energy developer that has committed itself to be carbon neutral by 2050. It has developed over 46 gigawatts (GW) of wind, solar, hydro, geothermal and biomass projects across 33 countries in the last 10 years. |
| | ● | | Eversource Energy: Eversource, formerly Northeast Utilities, is a New England based electric and water public utility that has become a major renewable power developer and generator in that region. The company has set a goal to be carbon neutral by 2030. |
2
NEW ALTERNATIVES FUND
MANAGEMENT’S COMMENTARY
AND DISCUSSION OF FINANCIAL PERFORMANCE
FOR THE YEAR 2019 (UNAUDITED)
| | ● | | Iberdrola SA: Iberdrola is a major electric utility based in Spain that has become a large renewable energy project developer in several other European countries, the U.S., Mexico, and Brazil, among other places. |
| | ● | | Veolia Environnement SA: Veolia, based in France, is one of the largest water, waste water processing and energy management systems companies in the world. In addition to its extensive water operations, Veolia is also becoming a major plastic and metal recycling facility developer. |
We sold off our holdings of ABB, Ltd.; First Solar, Inc.; Sprouts Farmers Market, Inc.; and Tesla, Inc. in the period between October 1 and December 31, 2019. The management of ABB, a Swiss engineering company, decided to reorganize its business divisions. That move included selling off its power grid operations and its solar energy inverter manufacturing. We felt these actions no longer made it an appropriate investment for the Fund. Sprouts Farmers Market was performing poorly over an extended period of time and seemed to be experiencing management issues, so we sold off our holding here also. The solar manufacturing sector, which has been in the financial doldrums for several years due to Chinese companies undercutting their prices (with support of the government), and tight margins on the actual prices that the companies could charge for their products, made us reconsider our focus in this sector. Even though First Solar was, arguably, the strongest company in this field, we still felt it was not overcoming the downward price pressure in the overall sector. We instead choose to focus on the Yieldco’s, which are the developers and operators of the solar fields and wind farms, rather than the manufacturers.
Ironically, we sold off our small holding in Tesla right before it made a huge run up in share price near the end of the year. All it took was one quarter’s profitability to light a fire under the shares after they had been languishing for close to 2 years. However, we’ve seen this before. It’s an incredibly volatile stock and the company has been consistently unprofitable from the beginning. The cars themselves are incredible and the technology is cutting edge, although not without its “bugs”. We were most enthusiastic about Tesla’s energy storage system development, but have always been concerned about its management and longstanding difficulties ramping up production of its car lines. It has remained a darling stock for more speculative investors, but that’s not our style.
The Fund also continued to gradually trim some of our larger holdings, including a number of our Yieldco’s and independent power producers, which is the largest concentration of our investments. We did this to keep the portfolio more balanced, but also to maintain cash reserves sufficient to meet continuing redemptions of our shares. Since the 4th quarter of 2019, and so far in 2020, we’re happy to note that the Fund has, apparently, been rediscovered by investors seeking to put their money into a renewable energy future. We began to see a modest increase in shares being purchased that has gotten stronger as the new year has progressed. We will continue to make moves to keep the Fund’s holdings balanced between companies and sectors, but now feel like we have additional capital to expand and diversify our scope in the coming year.
3
NEW ALTERNATIVES FUND
MANAGEMENT’S COMMENTARY
AND DISCUSSION OF FINANCIAL PERFORMANCE
FOR THE YEAR 2019 (UNAUDITED)
In the last half of 2019, we did sell off some of our shares of Atlantica Yield PLC (U.K.); Brookfield Renewable Energy Partners LP (Canada); Clearway Energy Inc.-Class C shares; Hannon Armstrong Sustainable Infrastructure Capital, Inc.; Innergex Renewable Energy, Inc. (Canada); OrstedA/S (Denmark); Pattern Energy Group, Inc.; Terraform Power, Inc.; and Transalta Renewables, Inc. (Canada). These are mostly Yieldco’s and other independent power producers, that have been among our strongest performers during the last few years and they have appreciated in the Fund’s portfolio holdings to a larger extent than other companies. One of the holdings, Pattern Energy Group, is in negotiation to be bought by a Canadian pension fund and taken private. We wanted to keep some shares to collect a couple of remaining dividends, but at the same time, take advantage of the fact that Pattern Energy Group’s shares have been selling above the current offering price of the buyout.
During this same period, we took the opportunity to increase some of our smaller holdings by buying additional shares of Avangrid, Inc.; Clearway EnergyInc.-A Shares; Enel SpA (Italy); Eversource Energy; Panasonic Corporation (Japan); Signify N.V. (Netherlands); Terna Rete Elettrica Nazionale SpA (Italy) and Veolia Environnement SA (France).
You can read descriptions of all these companies on our web site at:
https://www.newalternativesfund.com/the-fund/our-holdings-2/.
The year was such that just about every company in the Fund’s portfolio saw its share price rise. Our 10 biggest gainers for the year included: Brookfield, up 80.1 percent; Hannon Armstrong, up 70.7 percent; Orsted, up 58.14 percent; TransAlta, up 49.7 percent; Owens Corning, Inc., up 48.1 percent; Siemens Gamesa Renewable Energy SA (Spain), up 46.9 percent; Ingersoll-Rand PLC (Ireland), up 45.8 percent; Boralex, Inc. (Canada), up 45.2 percent; Pattern Energy Group, up 43.7 percent; and Infratil Ltd. (New Zealand), up 39.7 percent.
The only companies whose share prices declined were: BYD Company Ltd, a major Chinese manufacturer of electric vehicles and batteries. Their share price declined 21.3 percent. We believe they were partly a victim of the trade “war” between the U.S. and China. They continue to be a profitable company and are expanding manufacturing and operations to Europe, and the U.S. and Canada. Their share price has recovered somewhat since the beginning of 2020, but it remains to be seen whether they will be affected by the recent coronavirus outbreak in China. The only other company in the Fund that saw its share price decline was Iberdrola, which ended 2019 down 2.6 percent. Its share price has also rebounded in the new year.
Cash Holdings:We ended the year with approximately 5.9 percent of the Fund’s net assets in cash. We continue to avoid short-term U.S. Treasury Bills as interest rates remain low. A portion of this cash is invested in a series of Certificates of Deposit (CDs) at socially responsible banks and local credit unions.
4
NEW ALTERNATIVES FUND
MANAGEMENT’S COMMENTARY
AND DISCUSSION OF FINANCIAL PERFORMANCE
FOR THE YEAR 2019 (UNAUDITED)
Income from Dividends and Interest:The per share dividend for Class A Shares went down from $0.33 in 2018 to $0.26 in 2019. The per share dividend for Investor Shares declined from $0.21 in 2018 to $0.13 in 2019. The lower payment of ordinary dividends in 2019 was the result of the Fund’s need to sell off some positions in dividend paying holdings to meet redemptions earlier in the year and the recharacterization of payments from several of the Fund’s investments as returns of capital. While this situation reduced the dividend payment, it increased the capital gain return as noted in the next paragraph.
Realized and Unrealized Capital Gain/Loss:The Fund paid a net realized capital gain of $3.23 per share for both Class A Shares and Investor Shares in 2019. This was an increase from the $2.88 per share net realized capital gain paid in 2018. During the year ended December 31, 2019, the Fund had net realized and unrealized gains of $63,526,398.
This year’s increase in total net assets was due to the overall appreciation of many of the Fund’s holdings, a gain of $11,693,077 from realized gains from investments and foreign currency and a net increase of $8,666,394 for share subscriptions in the year ending December 31, 2019.
Expenses: The Fund’s cost of operations increased slightly in 2019. The number of shareholder accounts actually decreased slightly while the overall net assets of the Fund increased. The amounts paid to the investment advisor, Accrued Equities, Inc., the Bank of New York Mellon (the Fund’s custodian) and BNY Investment Servicing (U.S.), Inc. (the Fund’s accounting agent, transfer agent and administrator) are largely based on net assets. The Fund’s net assets increased during 2019, ending approximately 34.5 percent higher for the entire year. BNY Mellon, in its role as transfer agent, bases its fees on the number of shareholder accounts established during the year. This figure decreased by approximately 1.7 percent. Total Fund Expenses increased by $62,800, or approximately 2.9 percent. However, the total number of shares increased by a greater percentage, approximately 3.6 percent, so the per share cost decreased. As a result, the expense ratio for the Class A Shares decreased from 1.12 percent in 2018 to 1.08 percent in 2019. The expense ratio for the Investor Shares includes an additional12b-1 fee of 0.25 percent for an expense ratio of 1.33 percent for 2019, down from 1.37 percent in 2018.
The Fund WebSite/On-Line Capabilities:We continue to build the Fund’son-line functions and web site features. All relevant Fund documents are posted on our web site which can be accessed at: www.newalternativesfund.com.
We encourage all shareholders to create anon-line accountlog-on which is available through a link on our web site. When you access the web site, go to the “Open An Account” link on the selection bar and follow the instructions to create your account access. You can use this link to open an account, purchase or redeem shares, check the current balance of your account, sign up fore-delivery of reports and documents, and perform account maintenance such as address changes.
5
NEW ALTERNATIVES FUND
MANAGEMENT’S COMMENTARY
AND DISCUSSION OF FINANCIAL PERFORMANCE
FOR THE YEAR 2019 (UNAUDITED)
Shareholder Comments: We continue to receive, use and welcome advice and comments from shareholders. You can contact us bye-mail at: info@newalternativesfund.com, regular “snail mail” or give us a call at800-423-8383 or631-423-7373.
David Schoenwald
Murray Rosenblith
February 24, 2020
The Principal Underwriter is Foreside Funds Distributors LLC and theCo-Distributor is Accrued Equities, Inc.
Investment Objective: The investment objective of the Fund is long-term capital appreciation, with income as a secondary objective. The Fund seeks to achieve its investment objective by investing in equity securities. The equity securities in which the Fund invests consists primarily of common stocks. Other equity securities in which the Fund may invest include Yieldco’s, American Depositary Receipts (“ADRs”), real estate investment trusts (“REITs”) and publicly traded master limited partnerships (“MLPs”). The Fund makes investments in a wide range of industries and companies of all sizes. The Fund invests in equity securities of both U.S. and foreign companies, and has no limitation on the percentage of assets invested in the U.S. or abroad. Under normal market conditions, at least 25 percent of the Fund’s total assets will be invested in equity securities of companies in the alternative energy industry.
“Alternative Energy” or “Renewable Energy” means the production, conservation, storage and transmission of energy to reduce pollution and harm to the environment, particularly when compared to conventional coal, oil or nuclear energy.
Risk Disclosure: All investments are subject to inherent risks. An investment in the Fund is no exception. Accordingly, you may lose money by investing in the Fund. This disclosure of risks is not complete. Go to our web site at: www.newalternativesfund.com, call800-423-8383, or write to the Fund to obtain a prospectus that contains a more complete description of risks associated with investment in the Fund and other information about the Fund.
6
New Alternatives Fund Class A Shares Growth of $10,000 vs. The S&P 500® Index
(Unaudited)
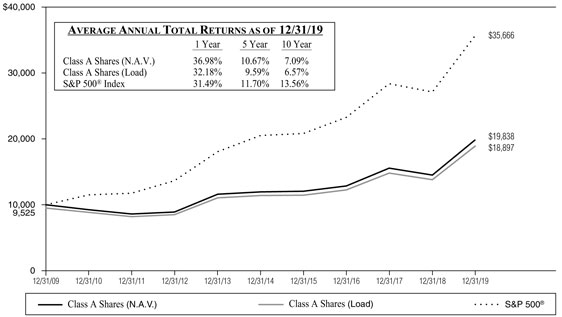
Performance quoted represents past performance and does not guarantee future results. Investment return and principal value will fluctuate so that shares, when redeemed, may be worth more or less than their original cost. Current performance may be lower or higher than that shown here. The “Load” performance quoted reflects a deduction for Class A Shares’ maximumfront-end sales charge of 3.50%. Prior to May 1, 2017, the Class A Shares’ maximum front end sales charge was 4.75%. Returns include the reinvestment of dividends and distributions. Performance data current to the most recentmonth-end may be obtained by calling800-423-8383. The graph and table do not reflect the deduction of taxes that a Shareholder would pay on Fund distributions or the redemption of Fund shares.
The Fund’s total annual operating expenses, as stated in its current prospectus dated April 30, 2019 are 1.12%*** for the Class A Shares.
*** Per prospectus. The expense ratio presented above may vary from the expense ratio presented in other sections of this report which is based on expenses incurred during the year covered by this report.
7
New Alternatives Fund Investor Shares Growth of $10,000 vs. The S&P 500® Index
(Unaudited)
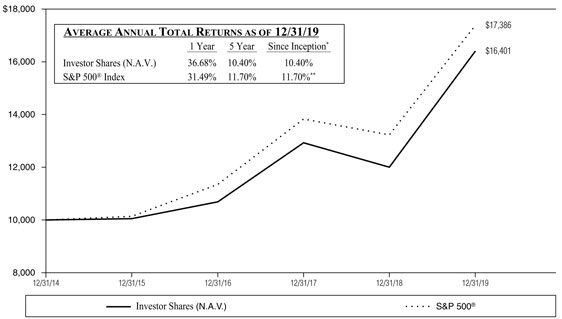
Performance quoted represents past performance and does not guarantee future results. Investment return and principal value will fluctuate so that shares, when redeemed, may be worth more or less than their original cost. Current performance may be lower or higher than that shown here. A 2.00% redemption fee applies to Investor Shares redeemed within 60 days of purchase. This redemption fee is not reflected in the returns shown above. Returns include the reinvestment of dividends and distributions. Performance data current to the most recentmonth-end may be obtained by calling800-423-8383. The graph and table do not reflect the deduction of taxes that a Shareholder would pay on Fund distributions or the redemption of Fund shares.
The Fund’s total annual operating expenses, as stated in its current prospectus dated April 30, 2019 are 1.37%*** for the Investor Shares.
The S&P 500® Index is an unmanaged stock market index and does not reflect any asset-based charges for investment management or transaction expenses. You cannot invest directly in this index. Current and future portfolio holdings are subject to change and risk.
* The inception date for Investor Shares of New Alternatives Fund was December 31, 2014.
**The performance presented is from the inception date of the Investor Shares of the Fund only and is not from the inception date of the Fund’s broad-based securities market index.
*** Per prospectus. The expense ratio presented above may vary from the expense ratio presented in other sections of this report which is based on expenses incurred during the year covered by this report.
8
NEW ALTERNATIVES FUND
FUND EXPENSE EXAMPLE
(Unaudited)
As a shareholder of the Fund, you incur two types of costs: (1) transaction costs such as the sales charge and redemption fees; and (2) ongoing costs, including management fees, distribution (i.e., Rule12b-1) fees and other Fund expenses. This example is intended to help you understand your ongoing costs (in dollars) of investing in the Fund and to compare these costs with the ongoing costs of investing in other mutual funds.
The example is based on an investment of $1,000 invested at the beginning of the period shown (July 1, 2019) and held for the entire six months ended December 31, 2019.
Actual Expenses
The first line of the table below provides information about actual account values and actual expenses. You may use the information in this line, together with the amount you invested, to estimate the expense that you paid over the period. Simply divide your account value by $1,000 (for example, an $8,600 account value divided by $1,000 = 8.6), then multiply the result by the number in the first line under the heading entitled “Expenses Paid During Six Months Ended December 31, 2019” to estimate the expenses you paid on your account during this period.
Note: The Fund’s Transfer Agent, BNY Mellon Investment Servicing (US) Inc., charges an annual IRA maintenance fee of $20 for IRA accounts. That fee is not reflected in the accompanying table.
Hypothetical Example for Comparison Purposes
The second line of the table below provides information about hypothetical account values and hypothetical expenses based on the Fund’s actual expense ratio and an assumed rate of return of 5% per year before expenses, which is not the Fund’s actual return. The hypothetical account values and expenses may not be used to estimate the actual ending account balance or expenses you paid for the period. You may use this information to compare the ongoing costs of investing in the Fund and other funds. To do so, compare this 5% hypothetical example with the 5% hypothetical examples that appear in the shareholder reports of other funds.
Please note that the expenses shown in the table are meant to highlight your ongoing costs only and do not reflect any transactional costs such as the sales charge, redemption fees or exchange fees. Therefore, the second line of the table is useful in comparing ongoing costs only, and will not help you determine the relative total costs of owning different funds. In addition, if transactional costs were included, your costs would have been higher.
9
NEW ALTERNATIVES FUND
FUND EXPENSE EXAMPLE
(Unaudited)
| | | | | | | | | | | | |
| | | Beginning
Account Value
July 1, 2019 | | | Ending
Account Value
December 31, 2019 | | | Expenses Paid During
Six Months Ended
December 31, 2019 | |
Class A Shares * | | | | | | | | | | | | |
Actual | | | $1,000.00 | | | | $1,133.30 | | | | $5.54 | |
Hypothetical | | | | | | | | | | | | |
(assumes 5% return before expenses) | | | $1,000.00 | | | | $1,020.01 | | | | $5.24 | |
Investor Shares ** | | | | | | | | | | | | |
Actual | | | $1,000.00 | | | | $1,132.00 | | | | $6.88 | |
Hypothetical | | | | | | | | | | | | |
(assumes 5% return before expenses) | | | $1,000.00 | | | | $1,018.75 | | | | $6.51 | |
| * | Expenses are equal to the annualized expense ratio of the Fund’s Class A Shares for thesix-month period of 1.03%, multiplied by the average account value over the period, multiplied by the number of days (184) in the most recent fiscal half year, then divided by the days in the year (365) to reflect the half year period. The Class A Shares’ ending account value on the first line in the table is based on its actual total return of 13.33% for thesix-month period of July 1, 2019 to December 31, 2019. |
| ** | Expenses are equal to the annualized expense ratio of the Fund’s Investor Shares for thesix-month period of 1.28%, multiplied by the average account value over the period, multiplied by the number of days (184) in the most recent fiscal half year, then divided by the days in the year (365) to reflect the half year period. The Investor Shares’ ending account value on the third line in the table is based on its actual total return of 13.20% for thesix-month period of July 1, 2019 to December 31, 2019. |
10
NEW ALTERNATIVES FUND
SCHEDULE OF INVESTMENTS
December 31, 2019
(Unaudited)
| | | | | | | | | | |
Sector Diversification | | % of Net
Assets | | Value |
Common Stocks | | | | | | | | | | |
Alternate Energy: | | | | | | | | | | |
Renewable Energy Power Producers & Developers | | | | 63.4% | | | | $ | 148,708,058 | |
Wind Turbines | | | | 8.8 | | | | | 20,628,016 | |
Energy Storage | | | | 3.5 | | | | | 8,233,750 | |
Solar Photovoltaic | | | | 0.3 | | | | | 683,600 | |
Energy Conservation | | | | 6.5 | | | | | 15,278,369 | |
Sustainable Energy Financial Services | | | | 4.5 | | | | | 10,458,500 | |
Water Systems & Utilities | | | | 3.8 | | | | | 8,781,000 | |
Energy Management | | | | 2.7 | | | | | 6,328,384 | |
Transportation | | | | 0.5 | | | | | 1,249,525 | |
Recycling & Waste Management | | | | 0.1 | | | | | 183,500 | |
Warrants | | | | 0.0 | | | | | — | |
Certificates of Deposit | | | | 0.1 | | | | | 300,000 | |
Other Assets in Excess of Liabilities | | | | 5.8 | | | | | 13,628,928 | |
| | | | | | | | | | |
| | |
Net Assets | | | | 100.0% | | | | $ | 234,461,630 | |
| | | | | | | | | | |
Top Ten Portfolio Issuers
December 31, 2019
(Unaudited)
| | | | |
Name | | % of Net
Assets | |
EDP Renovaveis SA (Spain/Portugal) | | | 4.8% | |
Orsted A/S (Denmark) | | | 4.6 | |
TransAlta Renewables, Inc. (Canada) | | | 4.6 | |
Brookfield Renewable Partners LP (Bermuda/Canada) | | | 4.6 | |
Atlantica Yield PLC (Great Britain) | | | 4.5 | |
NextEra Energy Partners LP | | | 4.5 | |
Siemens Gamesa Renewable Energy SA (Spain) | | | 4.5 | |
Hannon Armstrong Sustainable Infrastructure Capital, Inc., REIT | | | 4.5 | |
TerraForm Power, Inc., Class A | | | 4.4 | |
Innergex Renewable Energy, Inc. (Canada) | | | 4.4 | |
| | | | |
Total Top Ten | | | 45.4% | |
| | | | |
Portfolio holdings are subject to change, risk and may not represent current compositions of the portfolio.
11
NEW ALTERNATIVES FUND
SCHEDULE OF INVESTMENTS
December 31, 2019
| | | | | | | | |
| | | Shares | | | Value | |
COMMON STOCKS – 94.1% | | | | | | | | |
Alternate Energy — 76.0% | | | | | | | | |
Energy Storage — 3.5% | | | | | | | | |
Panasonic Corp. (Japan) SP ADR | | | 875,000 | | | $ | 8,233,750 | |
| | | | | | | | |
| | | | | | | 8,233,750 | |
| | | | | | | | |
Renewable Energy Power Producers & Developers — 63.4% | | | | | | | | |
Acciona SA (Spain) | | | 85,000 | | | | 8,943,354 | |
Atlantica Yield PLC (Great Britain)* | | | 400,000 | | | | 10,556,000 | |
Avangrid, Inc. | | | 200,000 | | | | 10,232,000 | |
Boralex, Inc., Class A (Canada) | | | 100,000 | | | | 1,882,800 | |
Brookfield Renewable Partners LP (Bermuda/Canada)** | | | 230,000 | | | | 10,724,900 | |
Clearway Energy, Inc., Class A | | | 400,000 | | | | 7,648,000 | |
Clearway Energy, Inc., Class C | | | 150,000 | | | | 2,992,500 | |
EDP Renovaveis SA (Spain/Portugal) | | | 950,000 | | | | 11,189,007 | |
Enel SpA (Italy) | | | 675,000 | | | | 5,354,571 | |
Eversource Energy | | | 15,000 | | | | 1,276,050 | |
Iberdrola SA (Spain) | | | 525,000 | | | | 5,406,057 | |
Infratil Ltd. (New Zealand) | | | 1,025,000 | | | | 3,477,758 | |
Innergex Renewable Energy, Inc. (Canada) | | | 800,000 | | | | 10,344,000 | |
NextEra Energy Partners LP*,** | | | 200,000 | | | | 10,530,000 | |
Northland Power, Inc. (Canada) | | | 300,000 | | | | 6,285,000 | |
Orsted A/S (Denmark) | | | 105,000 | | | | 10,859,596 | |
Pattern Energy Group, Inc., Class A* | | | 275,000 | | | | 7,357,625 | |
TerraForm Power, Inc., Class A* | | | 675,302 | | | | 10,392,898 | |
TransAlta Renewables, Inc. (Canada) | | | 900,000 | | | | 10,755,000 | |
Trustpower Ltd. (New Zealand) | | | 500,000 | | | | 2,500,942 | |
| | | | | | | | |
| | | | | | | 148,708,058 | |
| | | | | | | | |
Solar Photovoltaic — 0.3% | | | | | | | | |
Kyocera Corp. (Japan) SP ADR | | | 10,000 | | | | 683,600 | |
| | | | | | | | |
| | | | | | | 683,600 | |
| | | | | | | | |
Wind Turbines — 8.8% | | | | | | | | |
Siemens Gamesa Renewable Energy SA (Spain) | | | 600,000 | | | | 10,522,715 | |
Vestas Wind Systems A/S (Denmark) | | | 100,000 | | | | 10,105,301 | |
| | | | | | | | |
| | | | | | | 20,628,016 | |
| | | | | | | | |
Total Alternate Energy | | | | | | | 178,253,424 | |
| | | | | | | | |
| | |
Energy Conservation — 6.5% | | | | | | | | |
Johnson Controls International PLC (Ireland) | | | 25,000 | | | | 1,017,750 | |
Koninklijke Philips NV (Netherlands) | | | 150,000 | | | | 7,320,000 | |
Owens Corning, Inc. | | | 25,000 | | | | 1,628,000 | |
Signify NV (Netherlands) | | | 170,000 | | | | 5,312,619 | |
| | | | | | | | |
| | | | | | | 15,278,369 | |
| | | | | | | | |
The accompanying notes are an integral part of these financial statements.
12
NEW ALTERNATIVES FUND
SCHEDULE OF INVESTMENTS (Continued)
December 31, 2019
| | | | | | | | |
| | | Shares | | | Value | |
Sustainable Energy Financial Services — 4.5% | | | | | | | | |
Hannon Armstrong Sustainable Infrastructure Capital, Inc., REIT | | | 325,000 | | | $ | 10,458,500 | |
| | | | | | | | |
| | | | | | | 10,458,500 | |
| | | | | | | | |
Water Systems & Utilities — 3.8% | | | | | | | | |
American Water Works Co., Inc. | | | 25,000 | | | | 3,071,250 | |
Veolia Environnement SA (France) ADR | | | 200,000 | | | | 5,315,800 | |
Xylem, Inc. | | | 5,000 | | | | 393,950 | |
| | | | | | | | |
| | | | | | | 8,781,000 | |
| | | | | | | | |
Energy Management — 2.7% | | | | | | | | |
Ingersoll-Rand PLC (Ireland) | | | 25,000 | | | | 3,323,000 | |
Terna Rete Elettrica Nazionale SPA (Italy) | | | 450,000 | | | | 3,005,384 | |
| | | | | | | | |
| | | | | | | 6,328,384 | |
| | | | | | | | |
Transportation — 0.5% | | | | | | | | |
BYD Co. Ltd. (China) SP ADR | | | 85,000 | | | | 842,775 | |
Shimano, Inc. (Japan) SP ADR | | | 25,000 | | | | 406,750 | |
| | | | | | | | |
| | | | | | | 1,249,525 | |
| | | | | | | | |
Recycling & Waste Management — 0.1% | | | | | | | | |
Sims Metal Management Ltd. (Australia) SP ADR | | | 25,000 | | | | 183,500 | |
| | | | | | | | |
| | | | | | | 183,500 | |
| | | | | | | | |
| | |
Total Common Stocks (Cost $172,345,987) | | | | | | | 220,532,702 | |
| | | | | | | | |
| | |
WARRANTS – 0.0% | | | | | | | | |
Alternate Energy — 0.0% | | | | | | | | |
Abengoa SA, Class B Exp. 2025 (Spain)^*** | | | 500,000 | | | | — | |
| | | | | | | | |
Total Warrants (Cost $4,204) | | | | | | | — | |
| | | | | | | | |
| | |
| | | Par | | | | |
CERTIFICATES OF DEPOSIT — 0.1% | | | | | | | | |
Socially Concerned Banks — 0.1% | | | | | | | | |
Alternatives Federal Credit Union savings account 2.42% due 01/14/20 | | $ | 100,000 | | | | 100,000 | |
Self Help Credit Union 1.95% due 12/30/20 | | | 100,000 | | | | 100,000 | |
Urban Partnership Bank 0.30% due 01/28/20 | | | 100,000 | | | | 100,000 | |
| | | | | | | | |
Total Certificates of Deposit (Cost $300,000) | | | | | | | 300,000 | |
| | | | | | | | |
| | |
Investments in Securities (Cost $172,650,191) — 94.2% | | | | | | | 220,832,702 | |
Other Assets in Excess of Liabilities — 5.8% | | | | | | | 13,628,928 | |
| | | | | | | | |
| | |
Net Assets — 100.0% | | | | | | $ | 234,461,630 | |
| | | | | | | | |
The accompanying notes are an integral part of these financial statements.
13
NEW ALTERNATIVES FUND
SCHEDULE OF INVESTMENTS (Continued)
December 31, 2019
| * | These entities are commonly known as “Yieldco’s”. Yieldco’s are companies formed to own operating power assets which sell most of their electric production to major utilities under long term power purchase agreements. They are expected to pay most of their earnings in dividends to shareholders. They are similar in structure to Real Estate Investment Trusts (REITs). |
| ^ | An investment with a value of $0 or 0.0% of the Fund’s net assets was valued by the Fund’s investment advisor. |
| ** | Master Limited Partnership |
| ***Non-income | producing security. |
| | |
| ADR | | -American Depositary Receipts |
| LP | | -Limited Partnership |
| PLC | | -Public Limited Company |
| REIT | | -Real Estate Investment Trust |
| SP ADR | | -Sponsored American Depositary Receipts |
The accompanying notes are an integral part of these financial statements.
14
NEW ALTERNATIVES FUND
SCHEDULE OF INVESTMENTS (Concluded)
December 31, 2019
Country Portfolio Issuers
(Unaudited)
| | | | |
Country | | % of Net
Assets | |
United States | | | 28.3% | |
Spain | | | 15.4 | |
Canada | | | 12.5 | |
Denmark | | | 8.9 | |
Netherlands | | | 5.4 | |
Bermuda | | | 4.6 | |
Great Britain | | | 4.5 | |
Japan | | | 4.0 | |
Italy | | | 3.6 | |
New Zealand | | | 2.4 | |
France | | | 2.3 | |
Ireland | | | 1.9 | |
China | | | 0.3 | |
Australia | | | 0.1 | |
Other Assets/Liabilities | | | 5.8 | |
| | | | |
| | | 100.0% | |
| | | | |
The accompanying notes are an integral part of these financial statements.
15
NEW ALTERNATIVES FUND
STATEMENT OF ASSETS AND LIABILITIES
December 31, 2019
| | | | |
| ASSETS | | | | |
Investment securities at fair value (cost: $172,650,191) (Notes 2A and 7) | | $ | 220,832,702 | |
Cash | | | 14,787,584 | |
Receivables: | | | | |
Investments sold | | | 100,000 | |
Capital shares subscribed | | | 278,063 | |
Dividends | | | 434,037 | |
Tax reclaims | | | 388,545 | |
Prepaid insurance and registration | | | 42,263 | |
| | | | |
| |
Total Assets | | | 236,863,194 | |
| | | | |
| LIABILITIES | | | |
Payables: | | | | |
Distributions | | | 1,520,259 | |
Capital shares reacquired | | | 631,842 | |
Management fees | | | 108,961 | |
Transfer agent fees | | | 63,853 | |
Professional fees | | | 23,200 | |
Postage and printing fees | | | 17,493 | |
Custodian fees | | | 4,701 | |
12b-1 fees | | | 1,275 | |
Accrued expenses and other liabilities | | | 29,980 | |
| | | | |
| |
Total Liabilities | | | 2,401,564 | |
| | | | |
| |
Net Assets | | $ | 234,461,630 | |
| | | | |
| ANALYSIS OF NET ASSETS | | | | |
Net capital paid in shares of capital shares | | $ | 188,905,800 | |
Total distributable earnings | | | 45,555,830 | |
| | | | |
Net Assets | | $ | 234,461,630 | |
| | | | |
Class A Shares: | | | | |
Net Assets | | $ | 228,347,843 | |
| Net asset value and redemption price per share ($228,347,843/3,629,088) shares of outstanding beneficial interest, unlimited authorization, no par value | | $ | 62.92 | |
| | | | |
Maximum offering price per share (100/96.50 of $62.92) | | $ | 65.20 | |
| | | | |
| |
Investor Shares: | | | | |
Net Assets | | $ | 6,113,787 | |
| Net asset value, offering and redemption* price per share ($6,113,787/97,453) shares of outstanding beneficial interest, unlimited authorization, no par value | | $ | 62.74 | |
| | | | |
* Redemption fee may apply (Note 1)
The accompanying notes are an integral part of these financial statements.
16
NEW ALTERNATIVES FUND
STATEMENT OF OPERATIONS
For the Year Ended December 31, 2019
| | | | |
Investment Income: | | | | |
Dividends (net of $449,243 foreign taxes withheld) | | $ | 2,541,960 | |
| | | | |
Total Investment Income | | | 2,541,960 | |
| | | | |
| |
Expenses: | | | | |
Management fee (Note 4) | | | 1,156,317 | |
Transfer agent fees | | | 383,809 | |
Administration and accounting fees | | | 228,596 | |
Legal fees | | | 135,781 | |
Custodian fees | | | 65,632 | |
Registration fees | | | 63,486 | |
Compliance service fees | | | 54,300 | |
Postage and printing fees | | | 38,019 | |
Trustees fees (Note 5) | | | 35,000 | |
Audit fees | | | 22,150 | |
Insurance fees | | | 15,386 | |
12b-1 fees (Investor Shares) (Note 4) | | | 12,099 | |
Other expenses | | | 22,480 | |
| | | | |
| |
Total Expenses | | | 2,233,055 | |
| | | | |
| |
Net Investment Income | | | 308,905 | |
| | | | |
| |
Net Realized and Unrealized Gain/(Loss) from Investments and Foreign Currency Related Transactions: | | | | |
| |
Realized Gain from Investments and Foreign Currency Related Transactions (Notes 2B & 6): | | | | |
Net realized gain from investments | | | 11,688,931 | |
Net realized gain from foreign currency transactions | | | 4,146 | |
| | | | |
Net Realized Gain | | | 11,693,077 | |
| | | | |
| |
| Net Change in Unrealized Appreciation/(Depreciation) on Investments and Foreign Currency Related Translations: | | | | |
Net change in unrealized appreciation/(depreciation) on investments | | | 51,836,127 | |
Net change in unrealized appreciation/(depreciation) on foreign currency translations | | | (2,806 | ) |
| | | | |
Net change in unrealized appreciation/(depreciation) | | | 51,833,321 | |
| | | | |
Net Realized and Unrealized Gain on Investments and Foreign Currency Related Translations | | | 63,526,398 | |
| | | | |
| |
Net Increase in Net Assets Resulting from Operations | | $ | 63,835,303 | |
| | | | |
The accompanying notes are an integral part of these financial statements.
17
NEW ALTERNATIVES FUND
STATEMENTS OF CHANGES IN NET ASSETS
| | | | | | | | | | |
| | | For the Year Ended
December 31, 2019 | | For the Year Ended
December 31, 2018 |
Investment Activities: | | | | | | | | | | |
Net investment income | | | $ | 308,905 | | | | $ | 316,798 | |
Net realized gain from investments and foreign currency transactions | | | | 11,693,077 | | | | | 9,883,773 | |
Net change in unrealized appreciation/(depreciation) on investments and foreign currency translations | | | | 51,833,321 | | | | | (24,143,583 | ) |
| | | | | | | | | | |
Net increase/(decrease) in net assets resulting from operations | | | | 63,835,303 | | | | | (13,943,012 | ) |
| | | | | | | | | | |
| | |
Distributions to Shareholders from distributable earnings: | | | | | | | | | | |
Class A Shares | | | | (12,098,715 | ) | | | | (10,706,859 | ) |
Investor Shares | | | | (311,228 | ) | | | | (221,252 | ) |
| | | | | | | | | | |
Total distributions to shareholders from distributable earnings | | | | (12,409,943 | ) | | | | (10,928,111 | ) |
| | | | | | | | | | |
| | |
Capital Share Transactions: | | | | | | | | | | |
Net increase/(decrease) in net assets from capital share transactions (Note 3) | | | | 8,666,394 | | | | | (13,838,429 | ) |
| | | | | | | | | | |
Total Increase/(Decrease) in Net Assets | | | | 60,091,754 | | | | | (38,709,552 | ) |
| | |
Net Assets: | | | | | | | | | | |
Beginning of the year | | | | 174,369,876 | | | | | 213,079,428 | |
| | | | | | | | | | |
End of the year | | | $ | 234,461,630 | | | | $ | 174,369,876 | |
| | | | | | | | | | |
The accompanying notes are an integral part of these financial statements.
18
NEW ALTERNATIVES FUND
FINANCIAL HIGHLIGHTS
STATEMENT OF PER SHARE INCOME AND CAPITAL CHANGES
For a share outstanding throughout each year
| | | | | | | | | | | | | | | | | | | | |
| Class A Shares | | | | | For the Years Ended December 31, | | | | |
| | | | | |
| | | 2019 | | | 2018 | | | 2017 | | | 2016 | | | 2015 | |
Net asset value at the beginning of year | | $ | 48.48 | | | $ | 55.54 | | | $ | 47.78 | | | $ | 46.46 | | | $ | 46.87 | |
| | | | | | | | | | | | | | | | | | | | |
| | | | | |
Investment Operations | | | | | | | | | | | | | | | | | | | | |
Net investment income* | | | 0.09 | | | | 0.09 | | | | 0.90 | | | | 0.54 | | | | 0.77 | |
| Net realized and unrealized gain/(loss) on investments and foreign currency related transactions | | | 17.84 | | | | (3.94) | | | | 9.18 | | | | 2.55 | | | | (0.39) | |
| | | | | | | | | | | | | | | | | | | | |
Total from investment operations | | | 17.93 | | | | (3.85) | | | | 10.08 | | | | 3.09 | | | | 0.38 | |
| | | | | | | | | | | | | | | | | | | | |
| | | | | |
Distributions | | | | | | | | | | | | | | | | | | | | |
From net investment income | | | (0.26) | | | | (0.33) | | | | (1.03) | | | | (0.67) | | | | (0.79) | |
From net realized gains | | | (3.23) | | | | (2.88) | | | | (1.29) | | | | (1.10) | | | | — | |
| | | | | | | | | | | | | | | | | | | | |
Total distributions | | | (3.49) | | | | (3.21) | | | | (2.32) | | | | (1.77) | | | | (0.79) | |
| | | | | | | | | | | | | | | | | | | | |
Net asset value at end of year | | $ | 62.92 | | | $ | 48.48 | | | $ | 55.54 | | | $ | 47.78 | | | $ | 46.46 | |
| | | | | | | | | | | | | | | | | | | | |
| | | | | |
Total return | | | | | | | | | | | | | | | | | | | | |
(Sales load not reflected) | | | 36.98% | | | | (6.93)% | | | | 21.08% | | | | 6.66% | | | | 0.82% | |
Net assets, end of the year | | | | | | | | | | | | | | | | | | | | |
(in thousands) | | $ | 228,348 | | | $ | 170,699 | | | $ | 209,804 | | | $ | 179,974 | | | $ | 177,745 | |
Ratio of expenses to average net assets | | | 1.08% | | | | 1.12% | | | | 1.07% | | | | 1.12% | | | | 1.15% | |
Ratio of net investment income to average net assets | | | 0.16% | | | | 0.17% | | | | 1.64% | | | | 1.12% | | | | 1.55% | |
Portfolio turnover | | | 18.78% | | | | 17.77% | | | | 11.31% | | | | 30.44% | | | | 37.14% | |
Number of shares outstanding at end of the year | | | 3,629,088 | | | | 3,520,688 | | | | 3,777,599 | | | | 3,766,734 | | | | 3,825,379 | |
| * | The selected per share data was calculated using the average shares outstanding method for the year. |
The accompanying notes are an integral part of these financial statements.
19
NEW ALTERNATIVES FUND
FINANCIAL HIGHLIGHTS
STATEMENT OF PER SHARE INCOME AND CAPITAL CHANGES
For a share outstanding throughout each year
| | | | | | | | | | | | | | | | | | | | |
| Investor Shares | | | | | For the Years Ended December 31, | | | | |
| | | | | |
| | | 2019 | | | 2018 | | | 2017 | | | 2016 | | | 2015* | |
Net asset value at the beginning of year | | $ | 48.36 | | | $ | 55.41 | | | $ | 47.71 | | | $ | 46.39 | | | $ | 46.87 | |
| | | | | | | | | | | | | | | | | | | | |
| | | | | |
Investment Operations | | | | | | | | | | | | | | | | | | | | |
Net investment income (loss)** | | | (0.05) | | | | (0.04) | | | | 0.76 | | | | 0.42 | | | | 0.62 | |
| Net realized and unrealized gain/(loss) on investments and foreign currency related transactions | | | 17.79 | | | | (3.92) | | | | 9.15 | | | | 2.56 | | | | (0.36) | |
| | | | | | | | | | | | | | | | | | | | |
Total from investment operations | | | 17.74 | | | | (3.96) | | | | 9.91 | | | | 2.98 | | | | 0.26 | |
| | | | | | | | | | | | | | | | | | | | |
| | | | | |
Distributions | | | | | | | | | | | | | | | | | | | | |
From net investment income | | | (0.13) | | | | (0.21) | | | | (0.92) | | | | (0.56) | | | | (0.74) | |
From net realized gains | | | (3.23) | | | | (2.88) | | | | (1.29) | | | | (1.10) | | | | — | |
| | | | | | | | | | | | | | | | | | | | |
Total distributions | | | (3.36) | | | | (3.09) | | | | (2.21) | | | | (1.66) | | | | (0.74) | |
| | | | | | | | | | | | | | | | | | | | |
Net asset value at end of year | | $ | 62.74 | | | $ | 48.36 | | | $ | 55.41 | | | $ | 47.71 | | | $ | 46.39 | |
| | | | | | | | | | | | | | | | | | | | |
| | | | | |
Total return | | | 36.68% | | | | (7.15)% | | | | 20.76% | | | | 6.42% | | | | 0.56% | |
Net assets, end of the year | | | | | | | | | | | | | | | | | | | | |
(in thousands) | | $ | 6,114 | | | $ | 3,671 | | | $ | 3,275 | | | $ | 1,848 | | | $ | 1,329 | |
Ratio of expenses to average net assets | | | 1.33% | | | | 1.37% | | | | 1.32% | | | | 1.37% | | | | 1.40% | |
Ratio of net investment income (loss) to average net assets | | | (0.09)% | | | | (0.08)% | | | | 1.39% | | | | 0.87% | | | | 1.31% | |
Portfolio turnover | | | 18.78% | | | | 17.77% | | | | 11.31% | | | | 30.44% | | | | 37.14% | |
Number of shares outstanding at end of the year | | | 97,453 | | | | 75,901 | | | | 59,105 | | | | 38,727 | | | | 28,653 | |
| * | Investor Shares inception date was December 31, 2014. |
| ** | The selected per share data was calculated using the average shares outstanding method for the year. |
The accompanying notes are an integral part of these financial statements.
20
NEW ALTERNATIVES FUND
NOTES TO FINANCIAL STATEMENTS
For the Year Ended December 31, 2019
1) ORGANIZATION– New Alternatives Fund (the “Trust”) was organized as a Delaware statutory trust on June 12, 2014. The Trust currently offers one series of shares, also known as “New Alternatives Fund” (the “Fund”). The Fund is the successor to New Alternatives Fund, Inc. (the “Predecessor Company”), a New York corporation that commenced operations in 1982. The Fund is a diversified,open-end management investment company registered under the Investment Company Act of 1940, as amended (the “1940 Act”). On November 14, 2014, the Predecessor Company was reorganized into the Fund. The Fund was organized for the purpose of continuing the investment operations and performance history of the Predecessor Company and prior to the reorganization had no substantial assets or prior history of investment operations. The Fund currently offers two classes of shares: Class A Shares and Investor Shares. Class A Shares represent a continuance of the original class of shares offered by the Predecessor Company. Class A Shares are sold subject to afront-end sales charge. Class A Shares of the Fund do not have any distribution (i.e., Rule12b-1) charges, service charges or redemption fees. Investor Shares are not subject to a sales charge but are subject to a 2.00% redemption fee imposed on any Investor Shares redeemed within sixty (60) days of their initial purchase. Any redemption fee imposed is retained by the Fund and is meant to deter short-term trading in Investor Shares and to offset any transaction and other costs associated with short-term trading. For the years ended December 31, 2019 and 2018, no redemption fees were imposed on the redemption of Investor Shares. Investor Shares are also subject to 12b-1 fees. The investment objective of the Fund is long-term capital appreciation, with income as a secondary objective. The Fund seeks to achieve its investment objective by investing in equity securities. The equity securities in which the Fund invests consist primarily of common stocks. Other equity securities in which the Fund may invest include “Yieldco’s”, American Depositary Receipts (“ADRs”), real estate investment trusts (“REITs”) and publicly-traded master limited partnerships (“MLPs”). The Fund makes investments in a wide range of industries and in companies of all sizes. The Fund invests in equity securities of both U.S. and foreign companies, and has no limitation on the percentage of assets invested in the U.S. or abroad. Under normal market conditions, at least 25% of the Fund’s total assets will be invested in equity securities of companies in the alternative energy industry. “Alternative Energy” or “Renewable Energy” means the production, conservation, storage and transmission of energy to reduce pollution and harm to the environment, particularly when compared to conventional coal, oil or nuclear energy.
2) ACCOUNTING POLICIES– The Fund is an investment company that follows the accounting and reporting guidance of Accounting Standards Codification Topic 946 applicable to Investment Companies. The following is a summary of significant accounting policies followed by the Fund.
A.PORTFOLIO VALUATION – The Fund’s net asset value (“NAV”) is calculated once daily at the close of regular trading hours on the New York Stock Exchange (“NYSE”) (generally 4:00 p.m. Eastern time) on each day the NYSE is open. Securities held by the Fund are valued based on the official closing price or the last reported sale price on national securities exchanges where they are primarily traded or on the National Association of Securities Dealers Automatic
21
NEW ALTERNATIVES FUND
NOTES TO FINANCIAL STATEMENTS
For the Year Ended December 31, 2019
Quotation System (“NASDAQ”) market system as of the close of business on the day the securities are being valued. That is normally 4:00 p.m. Eastern time. If there were no sales on that day or the securities are traded on otherover-the-counter markets, the mean of the last bid and asked prices prior to the market close is used. Short-term debt securities having a remaining maturity of 60 days or less are amortized based on their cost. Certificates of Deposit are valued at amortized cost, provided such amount approximates market value and are categorized in Level 2.
Non-U.S. equity securities are valued based on their most recent closing market prices on their primary market and are translated from the local currency into U.S. dollars using current exchange rates on the day of valuation. The Fund may hold securities that are primarily listed on foreign exchanges that trade on weekends or other days when the Fund does not price its shares. As such, the Fund’s NAV may change on days when shareholders will not be able to purchase or redeem Fund shares.
If the market price of a security held by the Fund is unavailable at the time the Fund prices its shares at 4:00 p.m. Eastern time, the Fund will use the “fair value” of such security as determined in good faith by Accrued Equities, Inc., the Fund’s investment advisor, under methods established by and under the general supervision of the Trust’s Board of Trustees. The Fund may use fair value pricing if the value of a security it holds has been materially affected by events occurring before the Fund’s pricing time but after the close of the primary markets or exchange on which the security is traded. This most commonly occurs with foreign securities, but may occur in other cases as well. Certain foreign securities are fair valued by utilizing an external pricing service in the event of any significant market movements between the time the Fund valued such foreign securities and the earlier closing of foreign markets. The Fund does not invest in unlisted securities.
The inputs and valuations techniques used to measure fair value of the Fund’s net assets are summarized into three levels as described in the hierarchy below:
| | | | |
| ● | | Level 1 - | | Unadjusted quoted prices in active markets for identical assets or liabilities that the Fund has the ability to access. |
| | |
| ● | | Level 2 - | | Observable inputs other than quoted prices included in Level 1 that are observable for the asset or liability, either directly or indirectly. These inputs may include quoted prices for the identical instrument on an inactive market, prices for similar instruments, interest rates, prepayment speeds, credit risk, yield curves, default rates and similar data. |
22
NEW ALTERNATIVES FUND
NOTES TO FINANCIAL STATEMENTS
For the Year Ended December 31, 2019
| | | | |
| ● | | Level 3 - | | Unobservable inputs for the asset or liability, to the extent relevant observable inputs are not available, representing the Fund’s own assumptions about the assumptions a market participant would use in valuing the asset or liability, and would be based on the best information available. |
The inputs or methodology used for valuing securities are not necessarily an indication of the risk associated with investing in those securities.
The following is a summary of the inputs used, as of December 31, 2019, in valuing the Fund’s assets carried at fair value:
| | | | | | | | | | | | | | | | |
| | | Total
Value at
12/31/2019 | | | Level 1 –
Quoted
Price | | | Level 2 –
Significant
Observable
Inputs | | | Level 3 –
Significant
Unobservable
Inputs | |
Common Stocks | | | | | | | | | | | | | | | | |
Alternate Energy | | $ | 178,253,424 | | | $ | 178,253,424 | | | $ | — | | | $ | — | |
Energy Conservation | | | 15,278,369 | | | | 15,278,369 | | | | — | | | | — | |
Sustainable Energy Financial Services | | | 10,458,500 | | | | 10,458,500 | | | | — | | | | — | |
Water Systems & Utilities | | | 8,781,000 | | | | 8,781,000 | | | | — | | | | — | |
Energy Management | | | 6,328,384 | | | | 6,328,384 | | | | — | | | | — | |
Transportation | | | 1,249,525 | | | | 1,249,525 | | | | — | | | | — | |
Recycling & Waste Management | | | 183,500 | | | | 183,500 | | | | — | | | | — | |
Warrants | | | 0 | | | | — | | | | 0 | | | | — | |
Certificates of Deposit | | | 300,000 | | | | — | | | | 300,000 | | | | — | |
| | | | | | | | | | | | | | | | |
Total | | $ | 220,832,702 | | | $ | 220,532,702 | | | $ | 300,000 | | | $ | — | |
| | | | | | | | | | | | | | | | |
At the end of each calendar quarter, management evaluates the classification of Level 1, 2 and 3 assets and liabilities. Various factors are considered, such as changes in liquidity from the prior reporting period; whether or not a broker is willing to execute at the quoted price; the depth and consistency of prices from third party pricing services; and the existence of contemporaneous, observable trades in the market. Additionally, management evaluates the classification of Level 1 and Level 2 assets and liabilities on a quarterly basis for changes in listings or delistings on national exchanges.
The Fund utilizes an external pricing service to fair value certain foreign securities in the event of any significant market movements between the time the Fund valued certain foreign securities and the earlier closing of foreign markets. Such fair valuations are categorized as Level 2 in the hierarchy. Significant market movements were not deemed to have occurred at December 31, 2019, and therefore, the Fund did not utilize the external pricing service
23
NEW ALTERNATIVES FUND
NOTES TO FINANCIAL STATEMENTS
For the Year Ended December 31, 2019
model adjustments. Transfers in and out between Levels are based on values at the end of the period. The Fund did not hold any Level 3 categorized securities during the year ended December 31, 2019.
B.FOREIGN CURRENCY TRANSLATION – Investment securities and other assets and liabilities denominated in foreign currencies are translated into U.S. dollar amounts at the date of valuation. Purchases and sales of investment securities and income and expense items denominated in foreign currencies are translated into U.S. dollar amounts on the respective dates of such transactions. If foreign currency translations are not available, the foreign exchange rate(s) will be valued at fair market value using procedures approved by the Trust’s Board of Trustees.
The Fund does not isolate that portion of the results of operations resulting from changes in foreign exchange rates on investments from the fluctuations arising from changes in market prices of securities held. Such fluctuations are included with the net realized and unrealized gain or loss from investments.
Reported net realized foreign exchange gains or losses arise from sales of foreign currencies, currency gains or losses realized between the trade and settlement dates on securities transactions, and the difference between the amounts of dividends, interest, and foreign withholding taxes recorded on the Fund’s books and the U.S. dollar equivalent of the amounts actually received or paid.
Foreign Securities – Investing in foreign securities (including depositary receipts traded on U.S. exchanges but representing shares of foreign companies) involves more risks than investing in U.S. securities. Risks of investing in foreign companies include currency exchange rates between foreign currencies and the U.S. dollar. The political, economic and social structures of some foreign countries may be less stable and more volatile than those in the U.S. Brokerage commissions and other fees may be higher for foreign securities. Foreign companies may not be subject to the same disclosure, accounting, auditing and financial reporting standards as U.S. companies. These risks can increase the potential for losses in the Fund and affect its share price.
C.SECURITY TRANSACTIONS AND RELATED INVESTMENT INCOME – Security transactions are accounted for on the trade date (date order to buy or sell is executed). The cost of investments sold is determined by use of specific lots for both financial reporting and income tax purposes in determining realized gains and losses on investments.
D. INVESTMENT INCOME AND EXPENSE RECOGNITION – Dividend income is recorded as of theex-dividend date. Foreign dividend income is recorded on theex-dividend date or
24
NEW ALTERNATIVES FUND
NOTES TO FINANCIAL STATEMENTS
For the Year Ended December 31, 2019
as soon as possible after the Fund determines the existence of a dividend declaration after exercising reasonable diligence. Interest income, including amortization/accretion of premium and discount, is accrued daily. Return of capital distributions are recorded as a reduction of cost of the related investments. Expenses are accrued on a daily basis. Fund level expenses common to all classes are allocated to each class based upon relative daily net assets of each class.
E.DIVIDENDS AND DISTRIBUTIONS TO SHAREHOLDERS – Dividends from net investment income and distributions from net realized capital gains, if any, will be declared and paid at least annually to shareholders and recorded onex-date. Income dividends and capital gain distributions are determined in accordance with U.S. federal income tax regulations which may differ from accounting principles generally accepted in the United States of America.
F.U.S. TAX STATUS – No provision is made for U.S. income taxes as it is the Fund’s intention to qualify for and elect the tax treatment applicable to regulated investment companies under Subchapter M of the Internal Revenue Code of 1986, as amended, and make the requisite distributions to its shareholders which will be sufficient to relieve it from U.S. income and excise taxes.
G.USE OF ESTIMATES IN THE PREPARATION OF FINANCIAL STATEMENTS – The preparation of financial statements in conformity with accounting principles generally accepted in the United States of America requires management to make estimates and assumptions that affect the reported amounts of assets and liabilities and disclosure of contingent assets and liabilities at the date of the financial statements and the reported amounts of revenue and expenses during the reporting period. Actual results could differ from those estimates.
H.OTHER – In the normal course of business, the Fund may enter into contracts that provide general indemnifications. The Fund’s maximum exposure under these arrangements is dependent on claims that may be made against the Fund in the future, and therefore, cannot be estimated; however, based on experience, the risk of material loss for such claims is considered remote.
I. ALLOCATION – Investment income earned, realized capital gains and losses, and unrealized appreciation and depreciation for the Fund are allocated daily to each class of shares based upon its proportionate share of total net assets of the Fund. Class-specific expenses are charged directly to the class incurring the expense. Common expenses, which are not attributable to a specific class, are allocated daily to each class of shares based upon its proportionate share of total net assets of the Fund.
25
NEW ALTERNATIVES FUND
NOTES TO FINANCIAL STATEMENTS
For the Year Ended December 31, 2019
J.CASH – Cash represents amounts held on deposit with the Fund’s custodian bank. Balances at times may exceed federally insured limits.
K. RECENT ACCOUNTING PRONOUNCEMENT – In August 2018, the Financial Accounting Standards Board issued Accounting Standards Update2018-13 “Changes to the Disclosure Requirements for Fair Value Measurement” which modifies disclosure requirements for fair value measurements. The guidance is effective for fiscal years beginning after December 15, 2019 and for interim periods within those fiscal years. Management is currently evaluating the impact of this guidance to the Fund.
3) SHARES OF BENEFICIAL INTEREST– There are unlimited, no par value shares of beneficial interest authorized. On December 31, 2019, the Fund’s total shares outstanding were 3,726,541. Aggregatepaid-in capital including reinvestment of dividends was $188,905,800. Transactions in shares of beneficial interest were as follows:
| | | | | | | | | | | | | | | | |
| | | For the Year Ended
December 31, 2019 | | | For the Year Ended
December 31, 2018 | |
| | | Shares | | | Amount | | | Shares | | | Amount | |
Class A Shares | | | | | | | | | | | | | | | | |
Shares of beneficial interest sold | | | 224,511 | | | $ | 13,069,157 | | | | 129,747 | | | $ | 6,962,941 | |
Reinvestment of distributions | | | 168,472 | | | | 10,599,373 | | | | 194,719 | | | | 9,439,978 | |
Redemptions | | | (284,583 | ) | | | (16,281,570 | ) | | | (581,377 | ) | | | (31,122,341 | ) |
| | | | | | | | | | | | | | | | |
Net Increase (Decrease) | | | 108,400 | | | $ | 7,386,960 | | | | (256,911 | ) | | $ | (14,719,422 | ) |
| | | | | | | | | | | | | | | | |
| | | | | | | | | | | | | | | | |
| | |
| | | For the Year Ended
December 31, 2019 | | | For the Year Ended
December 31, 2018 | |
| | | Shares | | | Amount | | | Shares | | | Amount | |
Investor Shares | | | | | | | | | | | | | | | | |
Shares of beneficial interest sold | | | 21,325 | | | $ | 1,249,503 | | | | 18,846 | | | $ | 1,009,638 | |
Reinvestment of distributions | | | 4,654 | | | | 299,740 | | | | 4,136 | | | | 200,038 | |
Redemptions | | | (4,427 | ) | | | (269,809 | ) | | | (6,186 | ) | | | (328,683 | ) |
| | | | | | | | | | | | | | | | |
Net Increase | | | 21,552 | | | $ | 1,279,434 | | | | 16,796 | | | $ | 880,993 | |
| | | | | | | | | | | | | | | | |
4) MANAGEMENT FEE AND OTHER TRANSACTIONS WITH AFFILIATES – Accrued Equities, Inc. (“Accrued Equities” or the “Advisor”), an SEC registered investment advisor and broker-dealer, serves as investment advisor to the Fund pursuant to an Investment Advisory Agreement, and as an underwriter (but not a principal underwriter) of the Fund’s shares pursuant to a Sub-Distribution Agreement.
26
NEW ALTERNATIVES FUND
NOTES TO FINANCIAL STATEMENTS
For the Year Ended December 31, 2019
For it’s investment advisory services, the Fund pays Accrued Equities an annual management fee of 1.00% of the first $25 million of average daily net assets; 0.50% of the next $475 million of average daily net assets; and 0.40% of average daily net assets more than $500 million. The Fund incurred management fees of $1,156,317 for the year ended December 31, 2019.
The Fund pays no remuneration to two of its trustees, David J. Schoenwald and Murray D. Rosenblith, who are also officers or employees of Accrued Equities.
Foreside Funds Distributors LLC (the “Distributor”) serves as the principal underwriter of the Fund pursuant to a Distribution Agreement for the limited purpose of acting as statutory underwriter to facilitate the distribution of shares of the Fund. The Distributor has entered into aSub-Distribution Agreement with Accrued Equities. Effective May 1, 2017, the Fund charges a maximumfront-end sales charge of 3.50% on most new sales of the Fund’s Class A Shares. Of this amount, the Distributor and Accrued Equities receive the net underwriter commission and pay out the remaining sales commission to other brokers who actually sell new Class A Shares. Their share of the sales commission may vary. The aggregate underwriter commissions on all sales of Class A Shares of the Fund during the year ended December 31, 2019 was $18,671 and the amounts received by the Distributor and Accrued Equities were $6,224 and $12,447, respectively. The Distributor and Accrued Equities are also entitled to receive sales commissions for the sale of Class A Shares. For the year ended December 31, 2019, the Distributor and Accrued Equities received $4,295 and $18,004 in sales commissions, respectively, for the sale of Class A Shares of the Fund. Underwriter commissions and sales commissions received by the Distributor are set aside by the Distributor and used solely for distribution-related expenses.
Investor Shares of the Fund are not subject to a sales charge. The Fund has adopted a distribution plan (the “Rule12b-1 Plan”) for its Investor Shares in accordance with the requirements of Rule12b-1 under the 1940 Act. The Rule12b-1 Plan provides that the Fund may pay a fee to Accrued Equities, the Distributor, or certain broker-dealers, investment advisers, banks or other financial institutions at an annual rate of up to 0.25% of the average daily net assets of the Fund’s Investor Shares to finance certain activities primarily intended to sell such Investor Shares. For the year ended December 31, 2019,12b-1 Fees of $12,099 were accrued by the Investor Shares of the Fund.
The Board of Trustees has authorized the Class A Shares of the Fund to paysub-transfer agent fees to financial intermediaries, including securities dealers, that provide shareholder account-related services to their customers who own Class A Shares of the Fund, or to reimburse Accrued Equities for such expenses it reimbursed on behalf of the Class A Shares. Thesub-transfer agent services provided must be necessary and may not duplicate services already provided by a Fund service provider. Thesub-transfer agent services may not be for distribution-related services. The fees paid by the Class A Shares may not exceed the fees that would have been incurred by customers of the financial intermediaries if they maintained their customer account directly with the Fund.
27
NEW ALTERNATIVES FUND
NOTES TO FINANCIAL STATEMENTS
For the Year Ended December 31, 2019
5) TRUSTEES’ FEES– For the year ended December 31, 2019, the Fund paid trustees’ fees of $35,000 to its Trustees who are not “interested persons” of the Trust, as that term is defined in the 1940 Act (the “Independent Trustees”).
For the fiscal year ended December 31, 2019, each Independent Trustee received an annual fee of $8,000 for their services as an Independent Trustee of the Trust. As Vice-Chairperson of the Trust’s Board of Trustees, Sharon Reier received an additional annual fee of $1,000. Each member of the Audit Committee received an additional $500 annual fee and Susan Hickey, Chairperson of the Audit Committee, received an additional annual fee of $500. The Independent Trustees are also entitled to receive reimbursement of “coach” travel expenses to attend Board Meetings. The Trustees and Officers of the Trust who are officers and employees of the Advisor do not receive compensation from the Fund for their services and are paid for their services by the Advisor. The Fund’s Chief Compliance Officer is not an officer or employee of the Advisor and is compensated directly by the Fund for his services.
6) PURCHASES AND SALES OF SECURITIES– For the year ended December 31, 2019, the aggregate cost of securities purchased totaled $35,917,109. Net realized gains (losses) were computed on a specific lot basis. The proceeds received on sales of securities for the year ended December 31, 2019 was $36,406,460.
7) FEDERAL INCOME TAX INFORMATION– At December 31, 2019, the federal tax basis cost and aggregate gross unrealized appreciation and depreciation of securities held by the Fund were as follows:
| | | | |
Cost of investments for tax purposes | | $ | 174,773,752 | |
| | | | |
Unrealized appreciation for tax purposes | | $ | 52,556,116 | |
Unrealized depreciation for tax purposes | | | (6,497,166 | ) |
| | | | |
Net unrealized appreciation on investments and foreign currency translation | | $ | 46,058,950 | |
| | | | |
The tax character of distributions paid during 2019 and 2018 was as follows:
| | | | | | |
| Distributions paid from: | | 2019 | | 2018 | |
Ordinary Income | | $ 1,102,925 | | $ | 1,898,080 | |
Long-Term Capital Gains | | 11,307,018 | | | 9,030,031 | |
| | | | | | |
| | $12,409,943 | | $ | 10,928,111 | |
| | | | | | |
For federal income tax purposes, distributions from net investment income and short-term capital gains are treated as ordinary income dividends.
28
NEW ALTERNATIVES FUND
NOTES TO FINANCIAL STATEMENTS
For the Year Ended December 31, 2019
As of December 31, 2019, the components of distributable earnings (deficit) on a tax basis were as follows:
| | | | |
Distributions in Excess of Net Investment Income | | $ | (503,120 | ) |
Net Unrealized Appreciation on | | | | |
Investments and Foreign Currency Translations* | | | 46,058,950 | |
| | | | |
| | $ | 45,555,830 | |
| | | | |
* The primary difference between distributable earnings on a book and tax basis is due to wash sale losses, investments in partnerships and other book tax cost differences.
Management has analyzed the Fund’s tax positions taken on federal income tax returns for all open tax years (current and prior three tax years), and has concluded that no provision for federal income tax is required in the Fund’s financial statements. The Fund’s federal and state income and federal excise tax returns for tax years for which the applicable statutes of limitations have not expired are subject to examination by the Internal Revenue Service and state departments of revenue.
8) SUBSEQUENT EVENTS– Management has evaluated the impact of all subsequent events on the Fund through the date the financial statements were issued and has determined that there were no subsequent events requiring disclosure.
29

REPORT OF INDEPENDENT REGISTERED PUBLIC ACCOUNTING FIRM
To the Shareholders and Board of Trustees of
New Alternatives Fund
Opinion on the Financial Statements
We have audited the accompanying statement of assets and liabilities of New Alternatives Fund (the“Fund”),including the schedule of investments, as of December 31, 2019, and the related statement of operations for the year then ended, the statements of changes in net assets for each of the years in thetwo-year period then ended and the financial highlights for each of the years in the five-year period then ended, and the related notes (collectively referred to as the“financial statements”). In our opinion, the financial statements present fairly, in all material respects, the financial position of the Fund as of December 31, 2019, and the results of its operations for the year then ended, the changes in its net assets for each of the years in thetwo-year period then ended and its financial highlights for each of the years in the five-year period then ended, in conformity with accounting principles generally accepted in the United States of America.
Basis for Opinion
These financial statements are the responsibility of the Fund’s management. Our responsibility is to express an opinion on the Fund’s financial statements based on our audits. We are a public accounting firm registered with the Public Company Accounting Oversight Board (United States) (“PCAOB”) and are required to be independent with respect to the Fund in accordance with the U.S. federal securities law and the applicable rules and regulations of the Securities and Exchange Commission and the PCAOB.
We conducted our audits in accordance with the standards of the PCAOB. Those standards require that we plan and perform the audit to obtain reasonable assurance about whether the financial statements are free of material misstatement, whether due to error or fraud. The Fund is not required to have, nor were we engaged to perform, an audit of its internal control over financial reporting. As part of our audit we are required to obtain an understanding of internal control over financial reporting but not for the purpose of expressing an opinion on the effectiveness of the Fund’s internal control over financial reporting. Accordingly, we express no such opinion.
30
Our audits included performing procedures to assess the risk of material misstatement of the financial statements, whether due to error or fraud, and performing procedures that respond to those risks. Such procedures included examining, on a test basis, evidence regarding the amounts and disclosures in the financial statements. Our procedures included confirmation of securities owned as of December 31, 2019 by correspondence with the custodian, and other appropriate parties, or by other appropriate auditing procedures where replies from appropriate parties were not received. Our audits also included evaluating the accounting principles used and significant estimates made by management, as well as evaluating the overall presentation of the financial statements. We believe that our audits provide a reasonable basis for our opinion.

BBD, LLP
We have served as the auditor of the New Alternatives Fund since 2007.
Philadelphia, Pennsylvania
February 26, 2020
31
NEW ALTERNATIVES FUND
OTHER INFORMATION
(Unaudited)
1) PROXY VOTING– The Fund has proxy voting policies and procedures that the Fund uses to determine how to vote proxies relating to portfolio securities held by the Fund which are available: (1) without charge, upon request by calling the Fund at800-423-8383 and (2) on the SEC’s website at http://www.sec.gov. Information regarding how the Fund voted proxies relating to portfolio securities held by the Fund during the most recent twelve-month period ended June 30 is available on FormN-PX: (1) without charge, upon request, by calling the Fund at800-423-8383 and (2) on the SEC’s website at http://www.sec.gov.
2) QUARTERLY PORTFOLIO SCHEDULES– The Fund files a complete schedule of portfolio holdings with the SEC for the first and third quarters of each fiscal year (quarters ended March 31 and September 30) on FormN-Q. The Fund’s FormN-Q’s are available on the SEC website at http://www.sec.gov and may be reviewed and copied at the SEC Public Reference Room inWashington, D.C. Information on the operation of the SEC Public Reference Room may be obtained by calling1-800-SEC-0330.
32
NEW ALTERNATIVES FUND
SHAREHOLDER TAX INFORMATION
(Unaudited)
During the fiscal year ended December 31, 2019, the following dividends were paid by the Fund:
| | | | |
Ordinary Income | | $ | 1,102,925 | |
Long-Term Capital Gains | | $ | 11,307,018 | |
The Fund paid foreign taxes of $449,243 and recognized foreign source income of $1,208,659 pursuant to Section 853 of the Internal Revenue Code. The Fund will elect to pass these foreign taxes through to shareholders as a foreign tax credit and designates such amounts as having been paid in connection with dividends distributed from investment taxable income during the year ended December 31, 2019.
For the year ended December 31, 2019, certain dividends may be subject to a maximum capital gains tax rate, as provided for by the Jobs and Growth Tax Relief Reconciliation Act of 2003. For individual shareholders, 100.0% of their ordinary income dividends for the Fund qualify for the maximum capital gains tax rate. Complete information will be computed and reported in conjunction with your Form1099-DIV.
For corporate shareholders, 0.0% of the ordinary income dividends qualify for the dividends received deduction.
Shareholders are advised to consult their own tax advisors with respect to the tax consequences of their investments in the Fund.
33
BOARD OF TRUSTEES AND OFFICERS
(Unaudited)
Information pertaining to the Trustees and Officers of the Trust is provided in the table below. Certain information on the Trustees includes information on such Trustee’s service on the Board of Directors of the Predecessor Company. The Statement of Additional Information includes additional information about the Trustees and is available without charge, upon request, by calling the Fund at800-423-8383 or by visiting the Fund’s website at www.newalternativesfund.com. The mailing address for the Trustees and Officers of the Trust is c/o New Alternatives Fund, 150 Broadhollow Road, Suite PH2, Melville, New York 11747.
| | | | | | | | | | | | | | |
Name and Year of Birth | | Position(s)
Held with
the Trust | | | Term of Office and Length of Time Served1 | | Principal Occupation(s) During the Past Five Years | | Number of
Portfolios in
Trust
Complex
To Be
Overseen by
Trustee2 | | | All
Directorships
Held by
Trustee
During the
Past Five
Years3 |
| | | | | |
Interested Trustee: | | | | | | | | | | | | | | |
| | | | | |
David J. Schoenwald* 1949 | |
| Founder,
Trustee,
President,
Treasurer and
Chairperson of
the Board |
| | Founder, Trustee, President and Treasurer, 1982 to present; Chairperson of the Board, 2008 to present. | | President, Treasurer and Portfolio Manager, Accrued Equities, Inc.** | | | 1 | | | None |
| | | | | |
Murray D. Rosenblith* 1951 | |
| Trustee, Vice
President and
Secretary |
| | Trustee, 2003 to present; Vice President, 2018 to present; Secretary, 2012 to present; Assistant Secretary, 2009 to 2012. | | Portfolio Manager and Assistant Compliance Officer (2010 to present), and employee, Accrued Equities, Inc.** (2008 to present); formerly, Executive Director, A.J. Muste Memorial Institute, an organization concerned with exploration of the link between non-violence and social change (1985 to 2008). | | | 1 | | | None |
34
BOARD OF TRUSTEES AND OFFICERS
(Unaudited)
| | | | | | | | | | | | | | |
Name and Year of Birth | | Position(s)
Held with
the Trust | | | Term of Office
and Length of
Time Served1 | | Principal Occupation(s) During the Past Five Years | | Number of
Portfolios in
Trust
Complex
To Be
Overseen by
Trustee2 | | | All
Directorships
Held by
Trustee
During the
Past Five
Years3 |
| | | | | |
Independent Trustees: | | | | | | | | | | | | | | |
| | | | | |
Sharon Reier 1946 | |
| Trustee and
Vice-
Chairperson
of the
Board |
| | Trustee, 1982 to present; Vice- Chairperson, 2008 to present. | | Retired; prior thereto, freelance financial journalist; Contributor to the International Herald Tribune, (1995 to 2011); former contributor to Business Week International; former regional editor, Financial World; former editor, Boardroom Reports; former contributing editor, Institutional Investor; former staff, Forbes and American Banker. | | | 1 | | | None |
| | | | | |
Susan Hickey 1952 | |
| Trustee,
Audit
Committee
Member
and Audit
Committee
Chairperson |
| | Trustee and Audit Committee Member, 2005 to present; Audit Committee Chairperson, 2014 to present. | | Self-Employed Tax Preparer (1983 to present); prior thereto, Accounting Software Developer, AccountantsWorld, LLC. (until 2016); Member of National Association of Enrolled Agents and New York Society of Independent Accountants; Former IRS Tax Return Auditor; BA International Affairs, Stonehill College, North Easton, MA. | | | 1 | | | None |
35
BOARD OF TRUSTEES AND OFFICERS
(Unaudited)
| | | | | | | | | | |
Name and Year of Birth | | Position(s)
Held with
the Trust | | Term of
Office and
Length of
Time Served1 | | Principal Occupation(s) During the Past Five Years | | Number of
Portfolios in
Trust
Complex
To Be
Overseen by
Trustee2 | | All
Directorships
Held by
Trustee
During the
Past Five
Years3 |
| | | | | |
Jonathan D. Beard 1948 | | Trustee and
Audit
Committee
Member | | Trustee, 2005 to present; Audit Committee Member, 2014 to present. | | Retired; prior thereto, Self-employed Freelance Journalist for various American and European Science Magazines; Lifetime Member, Sierra Club and NewYork-New Jersey Trails Conference; Graduate of Columbia University 1970. | | 1 | | None |
| | | | | |
Jeffrey E. Perlman 1979 | | Trustee and
Audit
Committee
Member | | Trustee, 2009 to present; Audit Committee Member, 2014 to present. | | President and Founder, Bright Power, a company advancing clean, cost-effective energy solutions (2004 to present); Clarinetist/ Saxophonist, Romashka and various Klezmer music ensembles (1996 to present); Formerly, Consultant, Capital E, a renewable energy consulting and investment services company (2002 to 2005). | | 1 | | None |
| | | |
Officers of the Trust who are not Trustees: | | | | | | |
| | | | | |
Joseph A. Don Angelo 1948 | | Chief
Compliance
Officer | | 2007 to present. | | Certified Public Accountant and Owner, Don Angelo and Associates, CPAs P.C. (1984 to present). | | N/A | | N/A |
36
BOARD OF TRUSTEES AND OFFICERS
(Unaudited)
| 1 | Each Trustee holds office until the next meeting of shareholders for the election of Trustees and until his or her successor has been elected and qualified, except in the event of his or her death, resignation or removal. Officers are appointed on an annual basis and serve at the pleasure of the Trustees. |
| 2 | Currently, there is only one portfolio and no fund complex. |
| 3 | Includes directorships of companies required to report to the SEC under the Securities Exchange Act of 1934, as amended (i.e., “public companies”), or other investment companies registered under the 1940 Act. |
| * | An “interested person”, as defined in section 2(a)(19) of the 1940 Act. David J. Schoenwald is majority shareholder and President of the Advisor. Murray D. Rosenblith is considered an “interested person” as a result of his employment with the Advisor. |
| ** | David J. Schoenwald and Murray D. Rosenblith have no present enterprise, employment, position or commercial investment activity except for their positions with the Advisor, which is also the Fund’sSub-Distributor. At the present time, the Advisor provides services only to the Fund. |
37
Item 2. Code of Ethics.
| | (a) | The registrant, as of the end of the period covered by this report, has adopted a code of ethics that applies to the registrant’s principal executive officer, principal financial officer, principal accounting officer or controller, or persons performing similar functions, regardless of whether these individuals are employed by the registrant or a third party. |
| | (c) | There have been no amendments, during the period covered by this report, to a provision of the code of ethics that applies to the registrant’s principal executive officer, principal financial officer, principal accounting officer or controller, or persons performing similar functions, regardless of whether these individuals are employed by the registrant or a third party, and that relates to any element of the code of ethics description. |
| | (d) | The registrant has not granted any waivers, including an implicit waiver, from a provision of the code of ethics that applies to the registrant’s principal executive officer, principal financial officer, principal accounting officer or controller, or persons performing similar functions, regardless of whether these individuals are employed by the registrant or a third party, that relates to one or more of the items set forth in paragraph (b) of this item’s instructions. |
Item 3. Audit Committee Financial Expert.
As of the end of the period covered by the report, the registrant’s Board of Trustees has determined that Susan Hickey is qualified to serve as an audit committee financial expert serving on its audit committee and that she is “independent,” as defined by Item 3 of FormN-CSR.
Item 4. Principal Accountant Fees and Services.
Audit Fees
| | (a) | The aggregate fees billed for each of the last two fiscal years for professional services rendered by the principal accountant for the audit of the registrant’s annual financial statements or services that are normally provided by the accountant in connection with statutory and regulatory filings or engagements for those fiscal years are $19,500 for 2018 and $20,000 for 2019. |
Audit-Related Fees
| | (b) | The aggregate fees billed in each of the last two fiscal years for assurance and related services by the principal accountant that are reasonably related to the performance of the audit of the registrant’s financial statements and are not reported under paragraph (a) of this Item are $0 for 2018 and $0 for 2019. |
Tax Fees
| | (c) | The aggregate fees billed in each of the last two fiscal years for professional services rendered by the principal accountant for tax compliance, tax advice, and tax planning are $2,200 for 2018 and $2,200 for 2019. The fees billed were for review by the principal accountant of the registrant’s Federal tax returns. |
All Other Fees
| | (d) | The aggregate fees billed in each of the last two fiscal years for products and services provided by the principal accountant, other than the services reported in paragraphs (a) through (c) of this Item are $0 for 2018 and $0 for 2019. |
| | (e)(1) | Disclose the audit committee’spre-approval policies and procedures described in paragraph (c)(7) of Rule2-01 of RegulationS-X. |
The audit committee will be responsible for evaluating the provision ofnon-audit services to the registrant as required by Section 201 of the Sarbanes-Oxley Act of 2002 and the rules and regulations promulgated thereunder (collectively, the “2002 Act”) and anypre-approval requests submitted by the independent accountants as required by Section 202 of the 2002 Act.
| | (e)(2) | The percentage of services described in each of paragraphs (b) through (d) of this Item that were approved by the audit committee pursuant to paragraph (c)(7)(i)(C) of Rule2-01 of RegulationS-X are as follows: |
(b) N/A
(c) - 0 -
(d) N/A
| | (f) | The percentage of hours expended on the principal accountant’s engagement to audit the registrant’s financial statements for the most recent fiscal year that were attributed to work performed by persons other than the principal accountant’s full-time, permanent employees was less than fifty percent. |
| | (g) | The aggregatenon-audit fees billed by the registrant’s accountant for services rendered to the registrant, and rendered to the registrant’s investment adviser (not including anysub-adviser whose role is primarily portfolio management and is subcontracted with or overseen by another investment adviser), and any entity controlling, controlled by, or under common control with the adviser that provides ongoing services to the registrant for each of the last two fiscal years of the registrant was $0 for 2018 and $0 for 2019. |
Item 5. Audit Committee of Listed Registrants.
Not applicable to registrant.
Item 6. Investments.
| (a) | Not applicable. The full Schedule of Investments in securities of unaffiliated issuers as of the close of the reporting period is included as part of the audited annual report to shareholders filed under Item 1 of this Form. |
| Item 7. | Disclosure of Proxy Voting Policies and Procedures forClosed-End Management Investment Companies. |
Not applicable to registrant, which is anopen-end management investment company.
Item 8. Portfolio Managers ofClosed-End Management Investment Companies.
Not applicable to registrant, which is anopen-end management investment company.
| Item 9. | Purchases of Equity Securities byClosed-End Management Investment Company and Affiliated Purchasers. |
Not applicable to Registrant, which is anopen-end management investment company.
Item 10. Submission of Matters to a Vote of Security Holders.
There have been no material changes to the procedures by which the shareholders may recommend nominees to the registrant’s Board of Trustees, where those changes were implemented after the registrant last provided disclosure in response to the requirements of Item 407(c)(2)(iv) of RegulationS-K (17 CFR 229.407) (as required by Item 22(b)(15) of Schedule 14A (17 CFR240.14a-101)), or this Item.
Item 11. Controls and Procedures.
| | (a) | Based on his evaluation of the registrant’s disclosure controls and procedures (as defined in Rule30a-3(c) under the Investment Company Act of 1940, as amended (the “1940 Act”)) as of a date within 90 days of the filing date of this report, the registrant’s principal executive officer and principal financial officer has concluded that such disclosure controls and procedures are reasonably designed and are operating effectively to ensure that material information relating to the registrant, including its consolidated subsidiaries, is made known to him by others within those entities, particularly during the period in which this report is being prepared, and that the information required in filings on FormN-CSR is recorded, processed, summarized, and reported on a timely basis. |
| | (b) | There were no changes in the registrant’s internal control over financial reporting (as defined in Rule30a-3(d) under the 1940 Act (17 CFR270.30a-3(d))) that occurred during the registrant’s last fiscal quarter that has materially affected, or is reasonably likely to materially affect, the registrant’s internal control over financial reporting. |
| Item 12. | Disclosure of Securities Lending Activities forClosed-End Management Investment Companies. |
Not applicable.
Item 13. Exhibits.
| | (a)(1) | Code of ethics, or any amendments thereto, that is the subject of disclosure required by Item 2 is attached hereto. |
| | (a)(2) | Certifications pursuant to Rule30a-2(a) under the 1940 Act and Section 302 of the Sarbanes-Oxley Act of 2002 are attached hereto. |
| | (b) | Certifications pursuant to Rule30a-2(b) under the 1940 Act and Section 906 of the Sarbanes-Oxley Act of 2002 are attached hereto. |
SIGNATURES
Pursuant to the requirements of the Securities Exchange Act of 1934 and the Investment Company Act of 1940, the registrant has duly caused this report to be signed on its behalf by the undersigned, thereunto duly authorized.
(Registrant) New Alternatives Fund
By (Signature and Title)* /s/ David J. Schoenwald
David J. Schoenwald, President and Treasurer
(principal executive officer)
Date March 4, 2020
Pursuant to the requirements of the Securities Exchange Act of 1934 and the Investment Company Act of 1940, this report has been signed below by the following persons on behalf of the registrant and in the capacities and on the dates indicated.
By (Signature and Title)* /s/ David J. Schoenwald
David J. Schoenwald, President and Treasurer
(principal executive officer)
Date March 4, 2020
* Print the name and title of each signing officer under his or her signature.