UNITED STATES
SECURITIES AND EXCHANGE COMMISSION
Washington, D.C. 20549
FORM N-CSR
CERTIFIED SHAREHOLDER REPORT OF REGISTERED MANAGEMENT
INVESTMENT COMPANIES
Investment Company Act file number 811-03287
New Alternatives Fund
(Exact name of registrant as specified in charter)
150 Broadhollow Road, Suite PH2
Melville, New York 11747
(Address of principal executive offices) (Zip code)
David J. Schoenwald, President
New Alternatives Fund
150 Broadhollow Road, Suite PH2
Melville, New York 11747
(Name and address of agent for service)
Registrant’s telephone number, including area code: 631-423-7373
Date of fiscal year end: December 31
Date of reporting period: December 31, 2015
Form N-CSR is to be used by management investment companies to file reports with the Commission not later than 10 days after the transmission to stockholders of any report that is required to be transmitted to stockholders under Rule 30e-1 under the Investment Company Act of 1940 (17 CFR 270.30e-1). The Commission may use the information provided on Form N-CSR in its regulatory, disclosure review, inspection, and policymaking roles.
A registrant is required to disclose the information specified by Form N-CSR, and the Commission will make this information public. A registrant is not required to respond to the collection of information contained in Form N-CSR unless the Form displays a currently valid Office of Management and Budget (“OMB”) control number. Please direct comments concerning the accuracy of the information collection burden estimate and any suggestions for reducing the burden to Secretary, Securities and Exchange Commission, 100 F Street, NE, Washington, DC 20549. The OMB has reviewed this collection of information under the clearance requirements of 44 U.S.C. § 3507.
Item 1. Reports to Stockholders.
The Report to Shareholders is attached herewith.
 | New Alternatives Fund
A SOCIALLY RESPONSIBLE MUTUAL FUND EMPHASIZING ALTERNATIVE ENERGY AND THE ENVIRONMENT |
ANNUAL
FINANCIAL REPORT
CLASS A SHARES: NALFX
INVESTOR SHARES: NAEFX
DECEMBER 31, 2015
This report is submitted for the general information of the shareholders of the Fund. It is not authorized for distribution unless preceded or accompanied by a prospectus for the Fund.
| THE FUND | 150 Broadhollow Road | Melville, New York 11747 | (800)423-8383 | (631)423-7373 | ||||
| BNY Mellon Investment Servicing (US) Inc. | PO Box 9794 | Providence, RI 02940 | (800)441-6580 | (610)382-7819 | ||||
| Overnight Address | 4400 Computer Drive | Westborough, MA 01581 | ||||||
| Foreside Funds Distributors LLC | 400 Berwyn Park, | Berwyn, PA 19312 | ||||||
| 899 Cassat Road |
Recycled Paper
NEW ALTERNATIVES FUND
MANAGEMENT’S DISCUSSION OF FINANCIAL PERFORMANCE
FOR THE YEAR 2015
Fund Performance: The Net Asset Value (“NAV”) of New Alternatives Fund’s Class A Shares began at $46.87 on January 1, 2015 and closed at $46.46 after payment of a dividend from ordinary income of $0.79 per share. Our Investor Shares, which were introduced on January 1, 2015 also opened at an NAV of $46.87 and ended the year on December 31, 2015 at $46.39 after payment of a dividend from ordinary income of $0.74 per share. The Fund’s net assets increased during the year from approximately $175.9 million on December 31, 2014 to approximately $179.1 million on December 31, 2015 due to appreciation of the Fund’s holdings and a small increase in shares outstanding.
During the period from January 1, 2015 to December 31, 2015, the number of the Fund’s Class A Shares outstanding increased from 3,751,972 to 3,825,379 for a total growth of 73,407 shares. During the year, we also sold 26,543 of the Fund’s new Investor Shares.
After recording a steady growth during the first six months of 2015, the Fund experienced a large drop in its NAV during the third quarter. The Fund’s NAV recovered in the fourth quarter to finish with a small gain (0.82% for Class A Shares; 0.56% for Investor Shares) for 2015 overall.
At December 31, 2015, 43.4% of the Fund’s portfolio was invested in U.S. based companies, up from 39.5% in 2014. European companies comprised 30.3% of the Fund’s holdings (with 19.6% priced in Euros and the remainder in other currencies, including those of Denmark and Norway). The rest of the Fund’s portfolio companies included: 17.24% in Canada, 4.46% in Asia (Japan and New Zealand) and also 4.6% in cash in U.S. banks and credit unions.
Factors Affecting the Fund: Looking back a year ago, some of the significant factors influencing the Fund’s (and the broader markets) performance in 2015 were the continuation of the same influences in 2014. The value of the Euro continued to decline against the U.S. dollar (US$), going from approximately US$1.21 per Euro on December 31, 2014 to approximately US$1.09 per Euro on December 31, 2015. The Canadian dollar also continued a decline during 2015, reaching approximately US$0.72 on December 31 after trading at approximately US$0.86 U.S. on December 31, 2014. The continuing decline of these currencies against the U.S. dollar depresses the gains we may realize from appreciation of the share prices and dividends paid by the European and Canadian companies in the Fund’s portfolio. On the positive side, it gives the Fund more purchasing power when we chose to add shares of these companies.
The low prices of oil and natural gas also continue to weigh on the Fund’s performance, along with certain sectors of the general economy. After experiencing record low prices during 2014, many experts predicted oil prices would rise considerably and gas prices would rise at a somewhat lower rate. Neither of these situations happened. Oil went from just above $50 a barrel toward the end of 2014 to around $30 a barrel at the close of 2015. It has pretty much continued to decline in price thus far in 2016. Natural gas started 2015 around $3 per Million British Thermal Units (MBTU) and fell to about $1.75 per MBTU as of December 31, 2015.
1
NEW ALTERNATIVES FUND
MANAGEMENT’S DISCUSSION OF FINANCIAL PERFORMANCE
FOR THE YEAR 2015
There is very little direct reason why low oil prices should depress renewable energy company shares or even the broader energy market, except as it relates to transportation. Very little electric power is generated by oil around the world. It seems that this result has more to do with the psychology of the market with these lower commodity prices raising fears of a weakening global recovery from the 2008 recession. It is also true that the major oil companies are some of the largest corporations in existence and their falling profits and share prices have an outsized effect on other stock prices in general. Low natural gas prices have a more direct effect. There is a popular belief that as long as the price of gas stays low, it will tend to undercut new wind and solar energy projects. We’re not sure this is the case, as renewable energy projects continue to be developed at a growing pace regardless of low gas prices. More likely cheap natural gas is suppressing new coal-burning projects and hastening the retirement of existing coal plants. The costs of renewable power production are falling so quickly that the emerging clean energy producers will likely be cost competitive with natural gas, coal and even nuclear power (especially if the total fuel cycle cost is factored in), without subsidies and tax breaks, within a decade. The large oversupply of gas on the market and the attendant low price is also making it increasingly difficult for extraction companies to make money from new developments. This is slowing down the mad rush to “frack” potential well sites with the attendant environmental issues such projects bring.
Starting in 2014, the Fund began buying shares in the growing series of “YieldCos.” These companies were primarily created as independently traded subsidiaries of larger utilities to acquire and operate renewable energy generating projects. They were structured similar to Master Limited Partnerships (MLPs) which are used in the conventional energy industry to hold assets. The YieldCos were imagined as “boring” investments like utilities, with relatively stable share prices and regular, hopefully generous, dividends. They may yet achieve this goal, but the second half of 2015 was anything but boring for most of these companies.
After a dynamic roll out, with corresponding share price increases for most of these companies in 2014 and the beginning of 2015, this sector experienced rapidly falling share prices starting at the end of the second quarter and continuing through the third quarter. There was a bit of a recovery in the fourth quarter, but by and large, these companies ended 2015 significantly down from their high points. For the record, at December 31, 2015, the six YieldCos in the Fund constituted 30.4% of our holdings. There were several broad reasons why these stocks fell so hard and a few situations that were specific to individual companies.
There was a general concern that the YieldCos had paid too high a price for the generating projects they acquired. These debt loads might prevent them from paying out, and growing, the projected dividends that were fundamental to their investment appeal. Related to this was the stated intention of the U.S. Federal Reserve Bank (the “Fed”) to start raising interest rates as the U.S. economy continued to recover from the recession. Despite the Fed making it clear that any rate increases would be incremental, the idea that the era of “cheap money” seemed to be coming to a close, created uncertainty in the stock markets that led to falling share prices across the board. There was also a concern that the YieldCos,
2
NEW ALTERNATIVES FUND
MANAGEMENT’S DISCUSSION OF FINANCIAL PERFORMANCE
FOR THE YEAR 2015
under these changing market conditions, would not be able to acquire the new projects necessary to grow their asset base as planned. With the fanfare that accompanied their initial public offerings, many of these companies saw their share prices run up to what became, in hindsight, unsustainable levels.
Several of these firms also experienced difficulties stemming from problems that arose within their sponsoring companies. One prominent example involved Abengoa Yield PLC (United Kingdom) and its sponsor, Abengoa SA (Spain), both of which were Fund holdings. Abengoa SA, a long term Fund holding, is one of the major renewable energy companies in the world. Its roster of projects includes some of the world’s largest solar thermal generation facilities, biofuel production, power transmission services, water desalinization and filtration. It came to light recently that Abengoa SA was more deeply in debt than previously acknowledged. The parent company is considering bankruptcy protection. It owns approximately 45% of Abengoa Yield and has used its YieldCo shares as collateral for some of its debt. Abengoa Yield owns 20 projects spread out across Spain, the U.S., Latin America, Algeria and South Africa. These projects are generating regular operating income under long term contracts and the company is paying a projected divided of over 12% based on current share price. But the concern over the parent company’s status has led to a share price drop of about 25% for Abengoa Yield during 2015. The recent share price actually represents a discount against the underlying value of the firm’s asset base. In light of its troubles, the Fund sold its position in Abengoa SA in 2015. We kept and increased our shares of Abengoa Yield during the year based on our belief that the YieldCo will continue to generate a healthy return and stand on its own. We feel the share price should stabilize when the parent company’s situation is resolved, regardless of whether it goes bankrupt or not.
Another of the Fund’s YieldCo holdings, TerraForm Power, Inc., saw its share price fall just over 55% during 2015. TerraForm is a subsidiary of SunEdison, a major U.S. photovoltaic (PV) solar manufacturer and project developer. Since its inception in 2014, Terraform has acquired, from SunEdison and others, over 100 solar and wind projects in the U.S., the U.K., Canada and Chile. Terraform’s problems stem from SunEdison’s recent acquisitions of solar rooftop developer Vivint Solar. Analysts fear that SunEdison has tied too much of its capital in buying up these companies and will make TerraForm take them over on unfavorable terms. An activist hedge fund shareholder has recently bought up large blocks of TerraForm and SunEdison and mounted a lawsuit in an attempt to block SunEdison’s acquisition of Vivint and, if necessary, modify the terms under which TerraForm would acquire these assets. Mean while, TerraForm has met and increased its dividend payments regularly and is currently paying the equivalent of almost 18% at its present share price.
Our strategy for these companies and our other YieldCos, is to be patient. Now that the share prices of these firms have come “down to earth,” they have a solid, long term value. We can collect the regular dividend payments while we wait out the sector turbulence.
On the positive side, the Fund’s wind turbine manufacturers experienced a renaissance of sorts during 2015. The December renewal and unanticipated extension of both the U.S. production tax credit (PTC) for wind power development and the investment tax credit (ITC) for solar projects gave both these
3
NEW ALTERNATIVES FUND
MANAGEMENT’S DISCUSSION OF FINANCIAL PERFORMANCE
FOR THE YEAR 2015
sectors a year-end boost. Two of our turbine manufacturers, Gamesa Corporacion Technologica SA (Spain) and Vestas Wind Systems A/S (Denmark) were already showing share price growth from expanding business around the world even without this policy boost in the U.S. Gamesa shares rose just over 110% and Vestas went up by a little more than 116% during the course of 2015. Meanwhile, Acciona SA (Spain; diversified developer of hydro, wind and solar power projects, wind turbine manufacturer and water systems developer) rose almost 45% during the year. It was given a boost by the news that it would sell its wind turbine manufacturing division to Nordex SE, Germany’s largest turbine manufacturer.
One factor that did not seem to have much effect on the Fund or renewable energy development in general were the agreements reached at the United Nations climate summit in Paris, popularly known as “COP21.”Tens of thousands of national leaders and delegates from 187 countries, activists, business leaders and journalists gathered for two weeks and in the end produced what is described as a legally binding agreement. This treaty seeks to reduce greenhouse gas emissions and work to prevent global temperatures from rising more than 2 degrees Centigrade to prevent the most harmful effects of climate change. Along with the commitments by national governments, business leaders pledged to increase efforts to develop renewable energy resources and increase investment in clean energy and energy conservation.
Despite what most observers see as a positive outcome, after a series of earlier conferences failed to produce any meaningful results on this issue, there was certainly no visible boost in renewable energy stocks or markets around the world. While major developed countries like the U.S., France, and Germany, along with emerging economies in India, China, Brazil and South Africa, have promised to ramp up spending on renewable development. They will also provide financial support less developed nations will require to meet their growing power needs through renewable sources rather than increased use of coal and oil as has historically been the case. But investors and analysts do not see significant increases in the amount of capital flowing to the renewable sector for several years. While these agreements may ultimately provide a financial boost for the Fund’s portfolio companies and the broader renewable energy markets, for the time being, the sector continues to move based on many of the same economic forces that have shaped it in past years.
Portfolio Holdings and Changes:
New Investments in 2015: The Fund generally does not have a lot of turnover in its holdings. We prefer to buy and hold shares of a company for the long term. This past year we added two new companies, 8point3 Energy Partners LP and First Solar, Inc. 8point3 is a YieldCo which is jointly sponsored by solar PV manufacturers and developers First Solar and SunPower Corporation. First Solar and SunPower are considered to be two of the strongest solar manufacturing firms based in the U.S. They have successfully weathered the transition from manufacturers of solar PV modules and systems to project developers as well. SunPower, in which the Fund also holds a position, has made significant progress in the area of residential and small commercial solar system leasing. As each of these two companies rolled out
4
NEW ALTERNATIVES FUND
MANAGEMENT’S DISCUSSION OF FINANCIAL PERFORMANCE
FOR THE YEAR 2015
generating projects, they combined forces in early 2015 to create 8point3 as the vehicle to hold and operate both their utility scale projects and SunPower’s residential and small commercial rooftop solar systems. As of November 30, 2015, it owned interests in six utility-scale solar energy projects, two commercial and industrial solar energy projects, and a portfolio of approximately 5,900 residential solar installations with a total capacity of 432 megawatts, all located in the U.S. 8pont3 also paid a dividend of almost 7% based on its share price at year end.
First Solar, a pioneering firm in the development of thin film solar PV technology, has continued to be one of the few solar companies to consistently earn a profit. While its share price experienced some considerable ups and downs in the second and third quarters of 2015, it ended the year up almost 48% and was one of the companies that reaped a bump up in share price with the announcement of the ITC extension on December 12, 2015.
Holdings Sold: In addition to removing Abengoa SA from our holdings, as discussed above, the Fund also sold its shares in solar manufacturers Canadian Solar, Inc. (Canada) and Kyocera Corporation (Japan); Singapore-based Hyflux Ltd., a manufacturer of water desalinization equipment and project developer; Cree, Inc., LED lighting manufacturer; and organic retailer Whole Foods Market, Inc. Midway through 2015, Koninklijke Philips Electronics NV, the diversified electronics manufacturer based in the Netherlands, announced it was either splitting, selling or spinning off the company’s lighting division into a separate corporation. It was unclear how the new company would be structured and if it could maintain profitability when separated from Philips successful medical and home electronics product lines. We decided to sell these shares and wait to see how the new company was faring when the transition is completed.
Other Changes in the Fund:
Gainers and Losers: We mentioned the strong share price appreciation during 2015 of wind turbine manufacturers Gamesa and Vestas, and solar PV builder First Solar above. Among the other firms in the Fund’s holdings that produced significant gains were: Hannon Armstrong Sustainable Infrastructure Capital, Inc. (U.S. based real estate investment trust which finances energy efficiency systems for government and privately owned buildings), up 40.8%; international renewable power developer EDP Renovaveis, SA (Spain) rose by 35%. Owens Corning, Inc. (manufacturer of building insulation materials and composite materials for wind turbine blades) saw its share price rise 33.5%. Canadian-based developer and operator of small hydro, wind, solar and cogeneration facilities, Northland Power, Inc., went up 30%. Rounding out the other top gainers in the Fund were: Hafslund ASA (Norway-hydro power and district heating system developer and operator), up 23.4%; and Algonquin Power & Utilities Corporation (Canada/U.S.-regional utility with small hydro and wind power facilities and waste water treatment plants), up 18.8%.
5
NEW ALTERNATIVES FUND
MANAGEMENT’S DISCUSSION OF FINANCIAL PERFORMANCE
FOR THE YEAR 2015
As we also noted above, many of the YieldCos in the Fund experienced major declines in their share prices during 2015. Although these companies continued to pay out reasonable dividends, their price drops did contribute to the Fund’s somewhat weaker performance this year. We discussed TerraForm’s situation above. Also losing share value during the year: NRG Yield, Inc. (a YieldCo subsidiary of the utility NRG, Inc.), with two share classes that lost 41% (A shares) and 39.75% (C shares) respectively. Johnson Controls, Inc. (energy efficiency control systems for commercial buildings and batteries for hybrid cars and energy storage) fell 16.4%; Pattern Energy Group, Inc. (an independent YieldCo operating mostly wind power facilities), down 15.2%; Panasonic Corporation (Japan-solar cell producer, electric vehicle and energy storage batteries and diversified electronics), down 13.9%; Brookfield Renewable Energy Partners (Canada-small hydro and wind power generation projects), down 10.2%; and NextEra Energy Partners LP (a YieldCo subsidiary of NextEra Energy, Inc.-wind, solar and cogeneration power project developer), down 9%.
Cash and Treasury Holdings: We ended the year with approximately 4.6% of net assets in cash. We owned no short-term U.S. Treasury Bills as interest rates continued to be too low. Given these low rates, in recent years we have preferred to invest in stocks paying higher dividend rates and maintain enough of a cash position to take advantage of investment opportunities and meet redemption demands.
Income from Dividends and Interest: The Fund’s net income from dividends and interest increased by 25.4% in 2015. The per share dividend for Class A Shares increased from $0.63 in 2014 to $0.79 in 2015. The per share dividend for Investor Shares, which the Fund first offered on December 31, 2014, was $0.74 in 2015.
Realized and Unrealized Capital Gain/Loss: The Fund did not have or distribute any net realized capital gains during 2015. The Fund ended the year with accumulated net realized losses of approximately $677,201.
Expenses: The Fund’s cost of operations increased slightly in 2015. The number of shareholder accounts and the net assets also increased slightly during the year. The amounts paid to the investment advisor, Accrued Equities, Inc. (the “Advisor”), the Bank of New York Mellon (the Fund’s custodian) and BNY Mellon Investment Servicing (U.S.), Inc. (the Fund’s accounting agent, transfer agent and administrator) are largely based on net assets. The Fund’s net assets increased substantially during the first half of the year and then retreated to end the year at a small increase. BNY Mellon, in its role as transfer agent, bases its fees on the number of shareholder accounts established during the year. This figure increased slightly. While it was allocated across slightly more shares, the share growth was lower than the increase in expenses which raised the expense ratio on Class A Shares from 1.08% in 2014 to 1.15% in 2015. The expense ratio for the Investor Shares includes an additional 12b-1 fee of 0.25% for an expense ratio on these shares of 1.40% for 2015. Total Fund Expenses increased by $117,115 or 5.7%.
6
NEW ALTERNATIVES FUND
MANAGEMENT’S DISCUSSION OF FINANCIAL PERFORMANCE
FOR THE YEAR 2015
Corporate Governance and Regulatory: The Fund is now organized as a Delaware Statutory Trust, which commenced operations on November 17, 2014. This change was made to streamline the Fund’s operations and did not change any of the underlying investment objectives or strategies of the Fund. The Fund also introduced a new, no-load share class (“Investor Shares”) in addition to the existing front-end sales load share class (“Class A Shares”) which continues to be offered. The Investor Shares were first offered on December 31, 2014.
The six existing Directors of the Fund (four of whom are considered “Independent”) became the Trustees of the Delaware Statutory Trust and will continue their oversight of the Fund’s operations.
We continue to encourage all shareholders to create an on-line account log-on which is available through a link on our web site at: www.newalternativesfund.com. You can now use this access to open an account, purchase or redeem shares, check the current balance of your account, sign up for e-mail delivery of reports and documents, and perform account maintenance such as address changes.
Change in Investment Objective: Since the Fund commenced operations on September 3, 1982, its investment objective has been long-term capital appreciation. This investment objective is not fundamental, which means that it can be changed by the Board of Trustees without the approval of the shareholders. However, the Fund has committed that it will not change its investment objective without providing shareholders with at least 60 days prior written notice of such change.
On September 25, 2015, the Board of Trustees voted unanimously to change the wording of the Fund’s investment objective to read: “The investment objective of the Fund is long-term capital appreciation, with income as a secondary objective.” This management discussion will serve as the Fund’s 60 days prior written notice and this change to the Fund’s investment objective will be effective on April 30, 2016.
This change in the Fund’s investment objective language is not intended to reflect any change in the Fund’s investment policies or strategies. Instead, it is meant to better describe the Fund’s investment portfolio. As discussed here, as well as in prior shareholder letters, many of the Fund’s eligible portfolio securities offer not only an opportunity for long-term capital appreciation but also provide dividend income. Examples include utilities, YieldCos and MLPs.
After this change, the Fund will continue to seek to achieve its investment objective by investing in equity securities. The equity securities in which the Fund invests consist primarily of common stocks. Other equity securities in which the Fund may invest include depository receipts, real estate investment trusts (“REITs”) and publicly-traded master limited partnerships (“MLPs”). The Fund makes investments in a wide range of industries and in companies of all sizes. The Fund invests in equity securities of both U.S. and foreign companies, and has no limitation on the percentage of assets invested in the U.S. or abroad. Under normal market conditions, at least 25% of the Fund’s total assets will be invested in equity securities of companies in the alternative energy industry.
“Alternative Energy” means the production and conservation of energy in a manner that reduces pollution and harm to the environment, particularly when compared to conventional coal, oil or nuclear energy.
7
New Alternatives Fund Class A Shares Growth of $10,000 vs. The S&P 500® Index
(Unaudited)
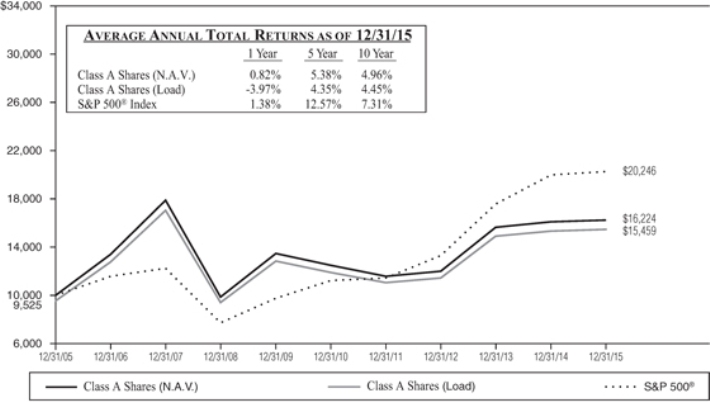
Performance quoted represents past performance and does not guarantee future results. Investment return and principal value will fluctuate so that shares, when redeemed, may be worth more or less than their original cost. Current performance may be lower or higher than that shown here. The “Load” performance quoted reflects a deduction for Class A Shares’ maximum front-end sales charge of 4.75%. Returns include the reinvestment of dividends and distributions. Performance data current to the most recent month-end may be obtained by calling 800-423-8383. The graph and table do not reflect the deduction of taxes that a Shareholder would pay on fund distributions or the redemption of fund shares.
8
New Alternatives Fund Investor Shares Growth of $10,000 vs. The S&P 500® Index
(Unaudited)
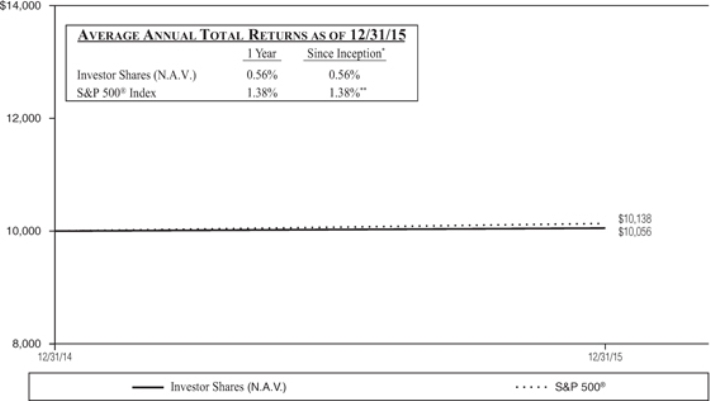
Performance quoted represents past performance and does not guarantee future results. Investment return and principal value will fluctuate so that shares, when redeemed, may be worth more or less than their original cost. Current performance may be lower or higher than that shown here. A 2.00% redemption fee applies to Investor Shares redeemed within 60 days of purchase. This redemption fee is not reflected in the returns shown above. Returns include the reinvestment of dividends and distributions. Performance data current to the most recent month-end may be obtained by calling 800-423-8383. The graph and table do not reflect the deduction of taxes that a Shareholder would pay on fund distributions or the redemption of fund shares.
The Fund’s total annual operating expenses, as stated in its current prospectus dated April 30, 2015 are 1.12% *** and 1.37%*** for the Class A Shares and the Investor Shares, respectively.
The S&P 500® Index is an unmanaged stock market index and does not reflect any asset-based charges for investment management or transaction expenses. You cannot invest directly in this index. Current and future portfolio holdings are subject to change and risk.
* The inception date for Investor Shares of New Alternatives Fund was December 31, 2014.
** The performance presented is from the inception date of the Investor Shares of the Fund only and is not from the inception date of the Fund’s broad-based securities market index.
*** Per prospectus. The expense ratio presented above may vary from the expense ratio presented in other sections of this report which is based on expenses incurred during the period covered by this report.
9
NEW ALTERNATIVES FUND
FUND EXPENSE EXAMPLE
(Unaudited)
As a shareholder of the Fund, you incur two types of costs: (1) transaction costs such as the sales charge and redemption fees; and (2) ongoing costs, including management fees, distribution (i.e., Rule 12b-1) fees and other Fund expenses. This example is intended to help you understand your ongoing costs (in dollars) of investing in the Fund and to compare these costs with the ongoing costs of investing in other mutual funds.
The example is based on an investment of $1,000 invested at the beginning of the period shown (July 1, 2015) and held for the entire six months ended December 31, 2015.
Actual Expenses
The first line of the table below provides information about actual account values and actual expenses. You may use the information in this line, together with the amount you invested, to estimate the expense that you paid over the period. Simply divide your account value by $1,000 (for example, an $8,600 account value divided by $1,000 = 8.6), then multiply the result by the number in the first line under the heading entitled “Expenses Paid During Six Months Ended December 31, 2015” to estimate the expenses you paid on your account during this period.
Note: The Fund’s Transfer Agent, BNY Mellon Investment Servicing (US) Inc., charges an annual IRA maintenance fee of $15 for IRA accounts. That fee is not reflected in the accompanying table.
Hypothetical Example for Comparison Purposes
The second line of the table below provides information about hypothetical account values and hypothetical expenses based on the Fund’s actual expense ratio and an assumed rate of return of 5% per year before expenses, which is not the Fund’s actual return. The hypothetical account values and expenses may not be used to estimate the actual ending account balance or expenses you paid for the period. You may use this information to compare the ongoing costs of investing in the Fund and other funds. To do so, compare this 5% hypothetical example with the 5% hypothetical examples that appear in the shareholder reports of other funds.
Please note that the expenses shown in the table are meant to highlight your ongoing costs only and do not reflect any transactional costs such as the sales charge, redemption fees or exchange fees. Therefore, the second line of the table is useful in comparing ongoing costs only, and will not help you determine the relative total costs of owning different funds. In addition, if transactional costs were included, your costs would have been higher.
10
NEW ALTERNATIVES FUND
(Unaudited)
| Beginning | Ending | Expenses Paid During | ||||
| Account Value | Account Value | Six Months Ended | ||||
| July 1, 2015 | December 31, 2015 | December 31, 2015 | ||||
Class A Shares * | ||||||
Actual | $1,000.00 | $ 890.80 | $5.86 | |||
Hypothetical (assumes 5% return before expenses) | $1,000.00 | $1,019.01 | $6.26 | |||
Investor Shares ** | ||||||
Actual | $1,000.00 | $ 891.90 | $7.14 | |||
Hypothetical (assumes 5% return before expenses) | $1,000.00 | $1,017.65 | $7.62 |
* Expenses are equal to the annualized expense ratio of the Fund’s Class A Shares for the six-month period of 1.23%, multiplied by the average account value over the period, multiplied by the number of days (184) in the most recent fiscal half year, then divided by the days in the year (365) to reflect the half year period. The Class A Shares’ ending account value on the first line in the table is based on its actual total return of -10.81% for the six-month period of July 1, 2015 to December 31, 2015.
** Expenses are equal to the annualized expense ratio of the Fund’s Investor Shares for the six-month period of 1.50%, multiplied by the average account value over the period, multiplied by the number of days (184) in the most recent fiscal half year, then divided by the days in the year (365) to reflect the half year period. The Investor Shares’ ending account value on the first line in the table is based on its actual total return of -10.92% for the six-month period of July 1, 2015 to December 31, 2015.
11
NEW ALTERNATIVES FUND
SCHEDULE OF INVESTMENTS
December 31, 2015
(Unaudited)
| % of Net | ||||||||
Sector Diversification | Assets | Value | ||||||
Alternate Energy: | ||||||||
Renewable Energy Power Producers & Developers | 59.6% | $106,704,069 | ||||||
Wind Turbines | 9.2 | 16,444,400 | ||||||
Solar Photovoltaic | 7.6 | 13,641,250 | ||||||
Energy Storage | 3.0 | 5,318,250 | ||||||
Sustainable Energy Financial Services | 5.8 | 10,406,000 | ||||||
Water Utilities | 5.3 | 9,560,000 | ||||||
Energy Conservation | 4.9 | 8,840,500 | ||||||
Certificates of Deposit | 0.3 | 500,000 | ||||||
Other Assets in Excess of Liabilities | 4.3 | 7,659,198 | ||||||
|
|
|
| |||||
Net Assets | 100.0% | $179,073,667 | ||||||
|
|
|
| |||||
Top Ten Portfolio Issuers
December 31, 2015
(Unaudited)
| % of Net | ||||
Name | Assets | |||
8Point3 Energy Partners LP |
|
5.9% |
| |
Nextera Energy Partners LP | 5.8 | |||
Hannon Armstrong Sustainable Infrastructure Capital, Inc., REIT | 5.8 | |||
Brookfield Renewable Energy Partners LP (Canada/Bermuda) | 5.5 | |||
American Water Works Co., Inc. | 5.3 | |||
EDP Renovaveis SA (Spain/Portugal) | 5.3 | |||
Pattern Energy Group, Inc. | 5.3 | |||
Abengoa Yield PLC (Great Britain) | 4.8 | |||
Acciona SA (Spain) | 4.8 | |||
Vestas Wind Systems AS (Denmark) | 4.6 | |||
|
| |||
Total Top Ten | 53.1% | |||
|
| |||
Portfolio holdings are subject to change, risk and may not represent current compositions of the portfolio.
12
NEW ALTERNATIVES FUND
SCHEDULE OF INVESTMENTS
December 31, 2015
| Shares | Value | |||||||
COMMON STOCKS – 95.4% | ||||||||
Alternate Energy — 79.4% | ||||||||
Energy Storage — 3.0% | ||||||||
Panasonic Corp. (Japan) SP ADR | 525,000 | $ | 5,318,250 | |||||
|
| |||||||
| 5,318,250 | ||||||||
|
| |||||||
Renewable Energy Power Producers & Developers — 59.6% | ||||||||
Abengoa Yield PLC (Great Britain)* | 450,000 | 8,680,500 | ||||||
Acciona SA (Spain) | 100,000 | 8,594,064 | ||||||
Algonquin Power & Utilities Corp. (Canada) | 500,000 | 3,941,250 | ||||||
Brookfield Renewable Energy Partners LP (Canada/Bermuda) | 375,000 | 9,817,500 | ||||||
EDP Renovaveis SA (Spain/Portugal) | 1,200,000 | 9,454,775 | ||||||
Elecnor SA (Spain) | 125,000 | 1,118,000 | ||||||
Enel Green Power SPA (Italy) | 3,800,000 | 7,776,172 | ||||||
Hafslund ASA, Class A (Norway) | 328,074 | 2,214,550 | ||||||
Innergex Renewable Energy, Inc. (Canada) | 925,000 | 7,649,935 | ||||||
Nextera Energy Partners LP* | 350,000 | 10,447,500 | ||||||
Northland Power, Inc. (Canada) | 300,000 | 4,045,500 | ||||||
NRG Yield, Inc., Class A* | 325,000 | 4,520,750 | ||||||
NRG Yield, Inc., Class C* | 315,000 | 4,649,400 | ||||||
Pattern Energy Group, Inc.* | 450,000 | 9,409,500 | ||||||
TerraForm Power, Inc., Class A* | 500,000 | 6,290,000 | ||||||
TransAlta Renewables, Inc. (Canada) | 725,000 | 5,427,277 | ||||||
TrustPower Ltd. (New Zealand) | 500,000 | 2,667,396 | ||||||
|
| |||||||
| 106,704,069 | ||||||||
|
| |||||||
Solar Photovoltaic — 7.6% | ||||||||
8Point3 Energy Partners LP* | 650,000 | 10,491,000 | ||||||
First Solar, Inc.** | 25,000 | 1,649,750 | ||||||
SunPower Corp.** | 50,000 | 1,500,500 | ||||||
|
| |||||||
| 13,641,250 | ||||||||
|
| |||||||
Wind Turbines — 9.2% | ||||||||
Gamesa Corporacion Tecnologica SA (Spain) | 475,000 | 8,166,426 | ||||||
Vestas Wind Systems AS (Denmark) | 117,500 | 8,277,974 | ||||||
|
| |||||||
| 16,444,400 | ||||||||
|
| |||||||
Total Alternate Energy | 142,107,969 | |||||||
|
| |||||||
Sustainable Energy Financial Services — 5.8% | ||||||||
Hannon Armstrong Sustainable Infrastructure Capital, Inc., REIT | 550,000 | 10,406,000 | ||||||
|
| |||||||
| 10,406,000 | ||||||||
|
| |||||||
Water Utilities — 5.3% | ||||||||
American Water Works Co., Inc. | 160,000 | 9,560,000 | ||||||
|
| |||||||
| 9,560,000 | ||||||||
|
| |||||||
Energy Conservation — 4.9% | ||||||||
Johnson Controls, Inc. | 75,000 | 2,961,750 | ||||||
The accompanying notes are an integral part of these financial statements.
13
NEW ALTERNATIVES FUND
SCHEDULE OF INVESTMENTS (Continued)
December 31, 2015
Shares |
Value | |||||||
Energy Conservation (Continued) | ||||||||
Owens Corning, Inc. | 125,000 | $ | 5,878,750 | |||||
|
| |||||||
| 8,840,500 | ||||||||
|
| |||||||
Total Common Stocks (Cost $185,787,932) | 170,914,469 | |||||||
|
| |||||||
| Par | ||||||||
CERTIFICATES OF DEPOSIT – 0.3% | ||||||||
Socially Concerned Banks — 0.3% | ||||||||
Alternatives Federal Credit Union savings account 0.20% due 01/14/16 | $ 100,000 | 100,000 | ||||||
Carver Federal Savings Bank 0.25% due 12/22/16 | 100,000 | 100,000 | ||||||
People’s United Bank 0.30% due 12/01/16 | 100,000 | 100,000 | ||||||
Self Help Credit Union 1.05% due 12/30/16 | 100,000 | 100,000 | ||||||
Urban Partnership Bank 0.30% due 01/28/16 | 100,000 | 100,000 | ||||||
|
| |||||||
Total Certificates of Deposit (Cost $500,000) | 500,000 | |||||||
|
| |||||||
TOTAL INVESTMENTS (Cost $186,287,932) — 95.7% | 171,414,469 | |||||||
Other Assets in Excess of Liabilities — 4.3% | 7,659,198 | |||||||
|
| |||||||
Net Assets — 100.0% | $ | 179,073,667 | ||||||
|
| |||||||
| * | These entities are commonly known as “Yieldco’s”. |
| ** | Non-income producing security |
| REIT | -Real Estate Investment Trust |
| SP ADR | -Sponsored American Depositary Receipts |
The accompanying notes are an integral part of these financial statements.
14
NEW ALTERNATIVES FUND
SCHEDULE OF INVESTMENTS (Concluded)
December 31, 2015
Country Portfolio Issuers
December 31, 2015
(Unaudited)
| % of Net | ||||
Country | Assets | |||
United States |
|
43.7% |
| |
Canada | 17.3 | |||
Spain | 15.3 | |||
Great Britain | 4.8 | |||
Denmark | 4.6 | |||
Italy | 4.3 | |||
Japan | 3.0 | |||
New Zealand | 1.5 | |||
Norway | 1.2 | |||
Other Assets/Liabilities | 4.3 | |||
|
| |||
| 100.0% | ||||
|
| |||
The accompanying notes are an integral part of these financial statements.
15
NEW ALTERNATIVES FUND
STATEMENT OF ASSETS AND LIABILITIES
December 31, 2015
ASSETS
|
| |||
Investment securities at fair value (cost: $186,287,932) (Notes 2A and 7) | $ | 171,414,469 | ||
Cash | 7,704,825 | |||
Receivables: | ||||
Capital shares subscribed | 197,113 | |||
Dividends | 690,048 | |||
Tax reclaims | 73,049 | |||
Prepaid insurance and registration | 14,658 | |||
|
| |||
Total Assets | 180,094,162 | |||
|
| |||
LIABILITIES
|
| |||
Payables: | ||||
Capital shares reacquired | 328,733 | |||
Distributions | 401,399 | |||
Management fees | 83,493 | |||
Transfer agent fees | 68,428 | |||
Professional fees | 39,398 | |||
Custodian fees | 30,437 | |||
12B-1 fees | 256 | |||
Accrued expenses and other liabilities | 68,351 | |||
|
| |||
Total Liabilities | 1,020,495 | |||
|
| |||
Net Assets | $ | 179,073,667 | ||
|
| |||
ANALYSIS OF NET ASSETS
|
| |||
Net capital paid in shares of capital shares | $ | 194,673,789 | ||
Distributions in excess of net investment income | (40,508 | ) | ||
Accumulated net realized loss on investments and foreign currency transactions | (677,201 | ) | ||
Net unrealized depreciation on investments | (14,873,463 | ) | ||
Net unrealized depreciation on translation of other assets and liabilities in foreign currency | (8,950 | ) | ||
|
| |||
Net Assets | $ | 179,073,667 | ||
|
| |||
Class A Shares: | ||||
Net Assets | $ | 177,744,571 | ||
| Net asset value and redemption price per share ($177,744,571/3,825,379) shares of outstanding beneficial interest, unlimited authorization, no par value | $ | 46.46 | ||
|
| |||
Maximum offering price per share (100/95.25 of $46.46) | $ | 48.78 | ||
|
| |||
Investor Shares: | ||||
Net Assets | $ | 1,329,096 | ||
| Net asset value, offering and redemption* price per share ($1,329,096/28,653) shares of outstanding beneficial interest, unlimited authorization, no par value | $ | 46.39 | ||
|
| |||
| * | Redemption fee may apply (Note 1) |
The accompanying notes are an integral part of these financial statements.
16
NEW ALTERNATIVES FUND
STATEMENT OF OPERATIONS
For the Year Ended December 31, 2015
Investment Income: | ||||
Interest | $ | 1,239 | ||
Dividends (net of $499,638 foreign taxes withheld) | 5,098,986 | |||
|
| |||
Total Investment Income | 5,100,225 | |||
|
| |||
Expenses: | ||||
Management fee (Note 4) | 1,071,063 | |||
Transfer agent fees | 397,892 | |||
Administration and accounting fees | 210,569 | |||
Postage and printing fees | 128,425 | |||
Legal fees | 106,915 | |||
Registration fees | 72,322 | |||
Custodian fees | 59,377 | |||
Compliance service fees | 48,000 | |||
Audit fees | 21,250 | |||
Trustees fees (Note 5) | 21,000 | |||
Insurance fees | 15,391 | |||
12b-1 fees (Investor Shares) (Note 4) | 1,521 | |||
Other expenses | 13,572 | |||
|
| |||
Total Expenses | 2,167,297 | |||
|
| |||
Net Investment Income | 2,932,928 | |||
|
| |||
Net Realized and Unrealized Gain/(Loss) from Investments and Foreign Currency Related Transactions: | ||||
Realized Gain/(Loss) from Investments and Foreign Currency Related Transactions (Notes 2B & 6): | ||||
Net realized gain from investments | 18,055 | |||
Net realized loss from foreign currency transactions | (12,793 | ) | ||
|
| |||
Net Realized Gain | 5,262 | |||
|
| |||
Net Change in Unrealized Appreciation/(Depreciation) of Investments and Foreign Currency Related Transactions: | ||||
Net change in unrealized appreciation/(depreciation) on investments | (2,419,539 | ) | ||
Net change in unrealized appreciation/(depreciation) on foreign currency translations | (2,038 | ) | ||
|
| |||
Net change in unrealized appreciation/(depreciation) | (2,421,577 | ) | ||
|
| |||
Net Realized and Unrealized Loss on Investments and Foreign Currency Related Transactions | (2,416,315 | ) | ||
|
| |||
Net Increase in Net Assets Resulting from Operations | $ | 516,613 | ||
|
| |||
The accompanying notes are an integral part of these financial statements.
17
NEW ALTERNATIVES FUND
STATEMENTS OF CHANGES IN NET ASSETS
| For the | For the | |||||||||
| Year Ended | Year Ended | |||||||||
| December 31, 2015 | December 31, 2014 | |||||||||
Investment Activities: | ||||||||||
Net investment income | $ 2,932,928 | $ 2,033,267 | ||||||||
Net realized gain from investments and foreign currency transactions | 5,262 | 42,343,269 | ||||||||
Net change in unrealized appreciation/(depreciation) on investments and foreign currency translations | (2,421,577 | ) | (39,390,677 | ) | ||||||
|
|
|
| |||||||
Net increase in net assets resulting from operations | 516,613 | 4,985,859 | ||||||||
|
|
|
| |||||||
Distributions to Shareholders: | ||||||||||
Class A Shares: | ||||||||||
Distributions from net investment income | (2,998,444 | ) | (2,300,023 | ) | ||||||
Distributions from realized gain on investments | — | (2,912,260 | ) | |||||||
Investor Shares Class: | ||||||||||
Distributions from net investment income | (20,899 | ) | — | |||||||
|
|
|
| |||||||
Total distributions to shareholders | (3,019,343 | ) | (5,212,283 | ) | ||||||
|
|
|
| |||||||
Capital Share Transactions: | ||||||||||
Net increase in net assets from capital share transactions (Note 3) | 5,634,044 | 1,067,474 | ||||||||
|
|
|
| |||||||
Total Increase in Net Assets | 3,131,314 | 841,050 | ||||||||
Net Assets: | ||||||||||
Beginning of the year | 175,942,353 | 175,101,303 | ||||||||
|
|
|
| |||||||
End of the year* | $179,073,667 | $175,942,353 | ||||||||
|
|
|
| |||||||
| * | Includes distributions in excess of net investment income of $(40,508) and $(9,729) for the years ended 12/31/2015 and 12/31/14, respectively. |
The accompanying notes are an integral part of these financial statements.
18
NEW ALTERNATIVES FUND*
FINANCIAL HIGHLIGHTS
STATEMENT OF PER SHARE INCOME AND CAPITAL CHANGES
For a share outstanding throughout each year
| Class A Shares | For the Years Ended December 31, | |||||||||||||||||||
| 2015 | 2014 | 2013 | 2012 | 2011 | ||||||||||||||||
Net asset value at the beginning of year | $ | 46.87 | $ | 46.93 | $ | 36.40 | $ | 35.82 | $ | 39.09 | ||||||||||
|
|
|
|
|
|
|
|
|
| |||||||||||
Investment Operations | ||||||||||||||||||||
Net investment income | 0.77 | ** | 0.56 | 0.58 | 0.67 | 0.42 | ||||||||||||||
| Net realized and unrealized gain/(loss) on investments and foreign currency related transactions | (0.39) | 0.81 | 10.53 | 0.58 | (3.27) | |||||||||||||||
|
|
|
|
|
|
|
|
|
| |||||||||||
Total from investment operations | 0.38 | 1.37 | 11.11 | 1.25 | (2.85) | |||||||||||||||
|
|
|
|
|
|
|
|
|
| |||||||||||
Distributions | ||||||||||||||||||||
From net investment income | (0.79) | (0.63) | (0.58) | (0.67) | (0.42) | |||||||||||||||
From net realized gains | — | (0.80) | — | — | — | |||||||||||||||
|
|
|
|
|
|
|
|
|
| |||||||||||
Total distributions | (0.79) | (1.43) | (0.58) | (0.67) | (0.42) | |||||||||||||||
|
|
|
|
|
|
|
|
|
| |||||||||||
Net asset value at end of year | $ | 46.46 | $ | 46.87 | $ | 46.93 | $ | 36.40 | $ | 35.82 | ||||||||||
|
|
|
|
|
|
|
|
|
| |||||||||||
Total return | ||||||||||||||||||||
(Sales load not reflected) | 0.82% | 2.91% | 30.52% | 3.49% | (7.28)% | |||||||||||||||
Net assets, end of the year | ||||||||||||||||||||
(in thousands) | $ | 177,745 | $ | 175,843 | $ | 175,101 | $ | 149,835 | $ | 186,554 | ||||||||||
Ratio of expenses to average net assets | 1.15% | 1.08% | 1.12% | 1.10% | 1.03% | |||||||||||||||
Ratio of net investment income to average net assets | 1.55% | 1.07% | 1.34% | 1.69% | 0.98% | |||||||||||||||
Portfolio turnover | 37.14% | 67.04% | 24.01% | 22.05% | 21.44% | |||||||||||||||
Number of shares outstanding at end of the year | 3,825,379 | 3,751,972 | 3,731,230 | 4,116,641 | 5,208,518 | |||||||||||||||
| * | The Fund acquired all of the assets and liabilities of New Alternatives Fund, Inc. (the “Predecessor Company”) in a reorganization on November 14, 2014. The Predecessor Company’s performance and financial history have been adopted by New Alternatives Fund and will be used going forward. As a result, the information prior to November 14, 2014 reflects that of the Predecessor Company. |
| ** | The selected per share data was calculated using the average shares outstanding method for the period. |
The accompanying notes are an integral part of these financial statements.
19
NEW ALTERNATIVES FUND
FINANCIAL HIGHLIGHTS
STATEMENT OF PER SHARE INCOME AND CAPITAL CHANGES
For a share outstanding throughout the year
| Investor Shares | Year Ended December 31, 2015* | |||
| ||||
Net asset value at the beginning of year | $ | 46.87 | ||
|
| |||
Investment Operations | ||||
Net investment income | 0.62 | ** | ||
Net realized and unrealized loss on investments and foreign currency related transactions | (0.36) | |||
|
| |||
Total from investment operations | 0.26 | |||
|
| |||
Distributions | ||||
From net investment income | (0.74) | |||
|
| |||
Total distributions | (0.74) | |||
|
| |||
Net asset value at end of year | $ | 46.39 | ||
|
| |||
Total return | 0.56% | |||
Net assets, end of the year | ||||
(in thousands) | $ | 1,329 | ||
Ratio of expenses to average net assets | 1.40% | |||
Ratio of net investment income to average net assets | 1.31% | |||
Portfolio turnover | 37.14% | |||
Number of shares outstanding at end of the year | 28,653 | |||
| * | Investor Shares inception date was December 31, 2014. |
| ** | The selected per share data was calculated using the average shares outstanding method for the period. |
The accompanying notes are an integral part of these financial statements.
20
NEW ALTERNATIVES FUND
NOTES TO FINANCIAL STATEMENTS
For the Year Ended December 31, 2015
1) ORGANIZATION – New Alternatives Fund (the “Trust”) was organized as a Delaware statutory trust on June 12, 2014. The Trust currently offers one series of shares, also known as “New Alternatives Fund” (the “Fund”). The Fund is the successor to New Alternatives Fund, Inc. (the “Predecessor Company”), a New York corporation that commenced operations in 1982. The Fund is a diversified, open-end management investment company registered under the Investment Company Act of 1940, as amended (the “1940 Act”). On November 14, 2014, the Predecessor Company was reorganized into the Fund. The Fund was organized for the purpose of continuing the investment operations and performance history of the Predecessor Company and prior to the reorganization had no substantial assets or prior history of investment operations. The Fund currently offers two classes of shares: Class A Shares and Investor Shares. Class A Shares represent a continuance of the original class of shares offered by the Predecessor Company. Class A Shares are sold subject to a front-end sales charge. Class A Shares of the Fund do not have any distribution (i.e., Rule 12b-1) charges, service charges or redemption fees. Investor Shares are not subject to a sales charge but are subject to a 2.00% redemption fee imposed on any Investor Shares redeemed within sixty (60) days of their initial purchase. Any redemption fee imposed is retained by the Fund and is meant to deter short-term trading in Investor Shares. For the year ended December 31, 2015, no redemption fees were imposed on the redemption of Investor Shares. Investor Shares are also subject to 12b-1 fees. The investment objective of the Fund is long-term capital appreciation. The Fund seeks to achieve its investment objective by investing in equity securities. The equity securities in which the Fund invests consist primarily of common stocks. Other equity securities in which the Fund may invest include depositary receipts, real estate investment trusts (“REITs”) and publicly-traded master limited partnerships (“MLPs”). The Fund makes investments in a wide range of industries and in companies of all sizes. The Fund invests in equity securities of both U.S. and foreign companies, and has no limitation on the percentage of assets invested in the U.S. or abroad. Under normal market conditions, at least 25% of the Fund’s total assets will be invested in equity securities of companies in the alternative energy industry. “Alternative Energy” means the production and conservation of energy to reduce pollution and harm to the environment, particularly when compared to conventional coal, oil or nuclear energy.
2) ACCOUNTING POLICIES – The Fund is an investment company that follows the accounting and reporting guidance of Accounting Standards Codification Topic 946 applicable to Investment Companies. The following is a summary of significant accounting policies followed by the Fund.
A. PORTFOLIO VALUATION –The Fund’s net asset value (“NAV”) is calculated once daily at the close of regular trading hours on the NewYork Stock Exchange (“NYSE”) (generally 4:00 p.m. Eastern time) on each day the NYSE is open. Securities held by the Fund are valued based on the official closing price or the last reported sale price on a national securities exchange or on the National Association of Securities Dealers Automatic Quotation System (“NASDAQ”) market system where they are primarily traded, as of the close of business on the day the securities are being valued. That is normally 4:00 p.m. Eastern time. If there were no sales
21
NEW ALTERNATIVES FUND
NOTES TO FINANCIAL STATEMENTS
For the Year Ended December 31, 2015
on that day or the securities are traded on other over-the-counter markets, the mean of the last bid and asked prices prior to the market close is used. Short-term debt securities having a remaining maturity of 60 days or less are amortized based on their cost.
Non-U.S. equity securities are valued based on their most recent closing market prices on their primary market and are translated from the local currency into U.S. dollars using current exchange rates on the day of valuation.
If the market price of a security held by the Fund is unavailable at the time the Fund prices its shares at 4:00 p.m. Eastern time, the Fund will use the “fair value” of such security as determined in good faith by Accrued Equities, Inc., the Fund’s investment advisor, under methods established by and under the general supervision of the Trust’s Board of Trustees. The Fund may use fair value pricing if the value of a security it holds has been materially affected by events occurring before the Fund’s pricing time but after the close of the primary markets or exchange on which the security is traded. This most commonly occurs with foreign securities, but may occur in other cases as well. Certain foreign securities are fair valued by utilizing an external pricing service in the event of any significant market movements between the time the Fund valued such foreign securities and the earlier closing of foreign markets. The Fund does not invest in unlisted securities.
The inputs and valuations techniques used to measure fair value of the Fund’s net assets are summarized into three levels as described in the hierarchy below:
l | Level 1 - | Unadjusted quoted prices in active markets for identical assets or liabilities that the Fund has the ability to access. | ||||
l | Level 2 - | Observable inputs other than quoted prices included in Level 1 that are observable for the asset or liability, either directly or indirectly. These inputs may include quoted prices for the identical instrument on an inactive market, prices for similar instruments, interest rates, prepayment speeds, credit risk, yield curves, default rates and similar data. | ||||
l | Level 3 - | Unobservable inputs for the asset or liability, to the extent relevant observable inputs are not available, representing the Fund’s own assumptions about the assumptions a market participant would use in valuing the asset or liability, and would be based on the best information available. | ||||
The inputs or methodology used for valuing securities are not necessarily an indication of the risk associated with investing in those securities.
22
NEW ALTERNATIVES FUND
NOTES TO FINANCIAL STATEMENTS
For the Year Ended December 31, 2015
The following is a summary of the inputs used, as of December 31, 2015, in valuing the Fund’s assets carried at fair value:
| Total Value at 12/31/2015 | Level 1 – Quoted Price | Level 2 – Significant Observable Inputs | Level 3 – Significant Unobservable Inputs | |||||||||||||
Common Stocks | ||||||||||||||||
Alternate Energy | $ | 142,107,969 | $ | 142,107,969 | $ | — | $ | — | ||||||||
Sustainable Energy Financial Services | 10,406,000 | 10,406,000 | — | — | ||||||||||||
Water Utilities | 9,560,000 | 9,560,000 | — | — | ||||||||||||
Energy Conservation | 8,840,500 | 8,840,500 | — | — | ||||||||||||
Certificates of Deposit | 500,000 | — | 500,000 | — | ||||||||||||
|
|
|
|
|
|
|
| |||||||||
Total | $ | 171,414,469 | $ | 170,914,469 | $ | 500,000 | $ | — | ||||||||
|
|
|
|
|
|
|
| |||||||||
At the end of each calendar quarter, management evaluates the classification of Level 1, 2 and 3 assets and liabilities. Various factors are considered, such as changes in liquidity from the prior reporting period; whether or not a broker is willing to execute at the quoted price; the depth and consistency of prices from third party pricing services; and the existence of contemporaneous, observable trades in the market. Additionally, management evaluates the classification of Level 1 and Level 2 assets and liabilities on a quarterly basis for changes in listings or delistings on national exchanges.
The Fund utilizes an external pricing service to fair value certain foreign securities in the event of any significant market movements between the time the Fund valued certain foreign securities and the earlier closing of foreign markets. Such fair valuations are categorized as Level 2 in the hierarchy. Significant market movements were not deemed to have occurred at December 31, 2015, and therefore, the Fund did not utilize the external pricing service model adjustments. Transfers in and out between Levels are based on values at the end of the period. As a result, for the year January 1, 2015 through December 31, 2015, there were transfers from Level 2 to Level 1 in the amount of $55,346,623.The Fund did not hold any Level 3 categorized securities during the year ended December 31, 2015.
B. FOREIGN CURRENCY TRANSLATION – Investment securities and other assets and liabilities denominated in foreign currencies are translated into U.S. dollar amounts at the date of valuation. Purchases and sales of investment securities and income and expense items denominated in foreign currencies are translated into U.S. dollar amounts on the respective dates of such transactions. If foreign currency translations are not available, the foreign exchange rate(s) will be valued at fair market value using procedures approved by the Trust’s Board of Trustees.
23
NEW ALTERNATIVES FUND
NOTES TO FINANCIAL STATEMENTS
For the Year Ended December 31, 2015
The Fund does not isolate that portion of the results of operations resulting from changes in foreign exchange rates on investments from the fluctuations arising from changes in market prices of securities held. Such fluctuations are included with the net realized and unrealized gain or loss from investments.
Reported net realized foreign exchange gains or losses arise from sales of foreign currencies, currency gains or losses realized between the trade and settlement dates on securities transactions, and the difference between the amounts of dividends, interest, and foreign withholding taxes recorded on the Fund’s books and the U.S. dollar equivalent of the amounts actually received or paid.
Foreign Securities – Investing in foreign securities (including depositary receipts traded on U.S. exchanges but representing shares of foreign companies) involves more risks than investing in U.S. securities. Risks of investing in foreign companies include currency exchange rates between foreign currencies and the U.S. dollar. The political, economic and social structures of some foreign countries may be less stable and more volatile than those in the U.S. Brokerage commissions and other fees may be higher for foreign securities. Foreign companies may not be subject to the same disclosure, accounting, auditing and financial reporting standards as U.S. companies. These risks can increase the potential for losses in the Fund and affect its share price.
C. SECURITY TRANSACTIONS AND RELATED INVESTMENT INCOME – Security transactions are accounted for on the trade date (date order to buy or sell is executed). The cost of investments sold is determined by use of specific lots for both financial reporting and income tax purposes in determining realized gains and losses on investments.
D.INVESTMENT INCOME AND EXPENSE RECOGNITION – Dividend income is recorded as of the ex-dividend date. Foreign dividend income is recorded on the ex-dividend date or as soon as possible after the Fund determines the existence of a dividend declaration after exercising reasonable diligence. Interest income, including amortization/accretion of premium and discount, is accrued daily. Expenses are accrued on a daily basis.
E. DIVIDENDS AND DISTRIBUTIONS TO SHAREHOLDERS – Dividends from net investment income and distributions from net realized capital gains, if any, will be declared and paid at least annually to shareholders and recorded on ex-date. Income dividends and capital gain distributions are determined in accordance with U.S. federal income tax regulations which may differ from accounting principles generally accepted in the United States of America.
24
NEW ALTERNATIVES FUND
NOTES TO FINANCIAL STATEMENTS
For the Year Ended December 31, 2015
F. U.S.TAX STATUS – No provision is made for U.S. income taxes as it is the Fund’s intention to qualify for and elect the tax treatment applicable to regulated investment companies under Subchapter M of the Internal Revenue Code of 1986, as amended, and make the requisite distributions to its shareholders which will be sufficient to relieve it from U.S. income and excise taxes.
G. USE OF ESTIMATES IN THE PREPARATION OF FINANCIAL STATEMENTS – The preparation of financial statements in conformity with accounting principles generally accepted in the United States of America requires management to make estimates and assumptions that affect the reported amounts of assets and liabilities and disclosure of contingent assets and liabilities at the date of the financial statements and the reported amounts of revenue and expenses during the reporting period. Actual results could differ from those estimates.
H. OTHER – In the normal course of business, the Fund may enter into contracts that provide general indemnifications. The Fund’s maximum exposure under these arrangements is dependent on claims that may be made against the Fund in the future, and therefore, cannot be estimated; however, based on experience, the risk of material loss for such claims is considered remote.
I.ALLOCATION – Investment income earned, realized capital gains and losses, and unrealized appreciation and depreciation for the Fund are allocated daily to each class of shares based upon its proportionate share of total net assets of the Fund. Class-specific expenses are charged directly to the class incurring the expense. Common expenses, which are not attributable to a specific class, are allocated daily to each class of shares based upon their proportionate share of total net assets of the Fund.
3) SHARES OF BENEFICIAL INTEREST –There are unlimited, no par value shares of beneficial interest authorized. On December 31, 2015, the Fund’s total shares outstanding were 3,854,032. Aggregate paid-in capital including reinvestment of dividends was $194,673,789.Transactions in shares of beneficial interest were as follows:
| For the Year Ended | For the Year Ended | |||||||||||||||
| December 31, 2015 | December 31, 2014 | |||||||||||||||
| Shares | Amount | Shares | Amount | |||||||||||||
Class A Shares | ||||||||||||||||
Shares of beneficial interest sold | 440,493 | $ | 22,549,849 | 314,284 | $ | 16,225,345 | ||||||||||
Reinvestment of distributions | 55,885 | 2,597,838 | 98,378 | 4,610,980 | ||||||||||||
Redemptions | (422,971 | ) | (20,794,493 | ) | (391,920 | ) | (19,867,745 | ) | ||||||||
|
|
|
|
|
|
|
| |||||||||
Net Increase | 73,407 | $ | 4,353,194 | 20,742 | $ | 968,580 | ||||||||||
|
|
|
|
|
|
|
| |||||||||
25
NEW ALTERNATIVES FUND
NOTES TO FINANCIAL STATEMENTS
For the Year Ended December 31, 2015
| For the Year Ended | For the Period Ended | |||||||||||||||
| December 31, 2015 | December 31, 2014* | |||||||||||||||
| Shares | Amount | Shares | Amount | |||||||||||||
Investor Shares | ||||||||||||||||
Shares of beneficial interest sold | 27,036 | $ | 1,303,085 | 2,110 | $ | 98,894 | ||||||||||
Reinvestment of distributions | 440 | 20,422 | — | — | ||||||||||||
Redemptions | (933 | ) | (42,657 | ) | — | — | ||||||||||
|
|
|
|
|
|
|
| |||||||||
Net Increase | 26,543 | $ | 1,280,850 | 2,110 | $ | 98,894 | ||||||||||
|
|
|
|
|
|
|
| |||||||||
| * | Commencement of operations. |
4) MANAGEMENT FEE AND OTHER TRANSACTIONS WITH AFFILIATES–Accrued Equities, Inc. (“Accrued Equities” or the “Advisor”), an SEC registered investment advisor and broker-dealer, serves as investment advisor to the Fund pursuant to an Investment Advisory Agreement, and as an underwriter (but not a principal underwriter) of the Fund’s shares pursuant to a Sub-Distribution Agreement. For it’s investment advisory services, the Fund pays Accrued Equities an annual management fee of 1.00% of the first $25 million of average daily net assets; 0.50% of the next $475 million of average daily net assets; and 0.40% of average daily net assets more than $500 million.
The Fund pays no remuneration to two of its trustees, David J. Schoenwald and Murray D. Rosenblith, who are also officers or employees of Accrued Equities.
Foreside Funds Distributors LLC (the “ Distributor”) serves as the principal underwriter of the Fund pursuant to a Distribution Agreement for the limited purpose of acting as statutory underwriter to facilitate the distribution of shares of the Fund. The Distributor has entered into a Sub-Distribution Agreement with Accrued Equities. The Fund charges a maximum front-end sales charge of 4.75% on most new sales of the Fund’s Class A Shares. Of this amount, the Distributor and Accrued Equities receive the net underwriter commission and pay out the remaining sales commission to other brokers who actually sell new Class A Shares. Their share of the sales commission may vary. The aggregate underwriter commissions on all sales of Class A Shares of the Fund during the year ended December 31, 2015 was $41,833, and the amounts received by Accrued Equities and the Distributor were $27,889, and $13,944, respectively. The Distributor and Accrued Equities are also entitled to receive sales commissions for the sale of Class A Shares. For the year ended December 31, 2015, Accrued Equities and the Distributor received $36,269 and $2,373 in sales commissions, respectively, for the sale of Class A Shares of the Fund. Underwriter commissions and sales commissions received by the Distributor are set aside by the Distributor and used solely for distribution-related expenses.
26
NEW ALTERNATIVES FUND
NOTES TO FINANCIAL STATEMENTS
For the Year Ended December 31, 2015
Investor Shares of the Fund are not subject to a sale charge. The Fund has adopted a distribution plan (the “Rule 12b-1 Plan”) for its Investor Shares in accordance with the requirements of Rule 12b-1 under the 1940 Act. The Rule 12b-1 Plan provides that the Fund may pay a fee to Accrued Equities, the Distributor, or certain broker-dealers, investment advisers, banks or other financial institutions at an annual rate of up to 0.25% of the average daily net assets of the Fund’s Investor Shares to finance certain activities primarily intended to sell such Investor Shares. For the year ended December 31, 2015, 12b-1 Fees of $1,521 were accrued by the Investor Shares of the Fund.
5) TRUSTEES’ FEES – For the year ended December 31, 2015, the Fund paid trustees’ fees of $21,000 to its Trustees who are not “interested persons” of the Trust, as that term is defined in the 1940 Act (the “Independent Trustees”).
Each Independent Trustee receives an annual fee of $4,500 for their services as an Independent Trustee of the Trust. As Vice-Chairperson of the Trust’s Board of Trustees, Sharon Reier receives an additional annual fee of $1,000. Each member of the Audit Committee receives an additional $500 annual fee and Susan Hickey, Chairperson of the Audit Committee, receives an additional annual fee of $500. The Independent Trustees also receive reimbursement of “coach” travel expenses to attend Board Meetings. The Trustees and Officers of the Trust who are officers and employees of the Advisor do not receive compensation from the Fund for their services and are paid for their services by the Advisor. The Fund’s Chief Compliance Officer is not an officer or employee of the Advisor and is compensated directly by the Fund for his services.
6) PURCHASES AND SALES OF SECURITIES – For the year ended December 31, 2015, the aggregate cost of securities purchased totaled $68,589,646. Net realized gains (losses) were computed on a specific lot basis. The proceeds received on sales of securities for the year ended December 31, 2015 was $67,692,271.
7) FEDERAL INCOME TAX INFORMATION – At December 31, 2015, the federal tax basis cost and aggregate gross unrealized appreciation and depreciation of securities held by the Fund were as follows:
Cost of investments for tax purposes | $ | 186,879,570 | ||
|
| |||
Unrealized appreciation for tax purposes | $ | 19,130,675 | ||
Unrealized depreciation for tax purposes | (34,595,776 | ) | ||
|
| |||
Net unrealized depreciation on investments | $ | (15,465,101 | ) | |
|
|
The tax character of distributions paid during 2015 and 2014 was as follows:
| Distributions paid from: | 2015 | 2014 | ||||||
Ordinary Income | $ | 3,019,343 | $ | 2,278,731 | ||||
Long-Term Capital Gains | — | 2,933,552 | ||||||
|
|
|
| |||||
| $ | 3,019,343 | $ | 5,212,283 | |||||
|
|
|
| |||||
27
NEW ALTERNATIVES FUND
NOTES TO FINANCIAL STATEMENTS
For the Year Ended December 31, 2015
For federal income tax purposes, distributions from net investment income and short-term capital gains are treated as ordinary income dividends.
The following permanent differences as of December 31, 2015, attributable to transactions involving foreign securities and currencies and investments in partnerships were reclassified to the following accounts:
Accumulated Net Realized Loss | $ | (55,636 | ) | |
Overdistributed Net Investment Income | 55,636 | |||
As of December 31, 2015, the components of distributable earnings (deficit) on a tax basis were as follows: | ||||
Overdistributed Ordinary Income | $ | (40,508 | ) | |
Capital Loss Carry forward* | (85,563 | ) | ||
Net Unrealized Depreciation on | ||||
Investments and Foreign Currency Translations** | (15,474,051 | ) | ||
|
| |||
| $ | (15,600,122 | ) | ||
|
|
* This capital loss carryforward can be used to offset future realized capital gains.
** The primary difference between distributable earnings on a book and tax basis is due to wash sale losses and investments in partnerships.
Management has analyzed the Fund’s tax positions taken on federal income tax returns for all open tax years (current and prior three tax years), and has concluded that no provision for federal income tax is required in the Fund’s financial statements. The Fund’s federal and state income and federal excise tax returns for tax years for which the applicable statutes of limitations have not expired are subject to examination by the Internal Revenue Service and state departments of revenue.
8) SUBSEQUENT EVENTS – Management has evaluated the impact of all subsequent events on the Fund through the date the financial statements were available to be issued, and has determined that there were no subsequent events requiring disclosure.
28

REPORT OF INDEPENDENT REGISTERED PUBLIC ACCOUNTING FIRM
To the Shareholders and Board Trustees of
New Alternatives Fund
We have audited the accompanying statement of assets and liabilities of the New Alternatives Fund, a series of shares of beneficial interest in New Alternatives Fund (the “Fund”), including the schedule of investments, as of December 31, 2015, and the related statement of operations for the year then ended, the statements of changes in net assets for each of the years in the two-year period then ended and the financial highlights for each of the years in the five-year period then ended. These financial statements and financial highlights are the responsibility of the Fund’s management. Our responsibility is to express an opinion on these financial statements and financial highlights based on our audits.
We conducted our audits in accordance with the standards of the Public Company Accounting Oversight Board (United States). Those standards require that we plan and perform the audits to obtain reasonable assurance about whether the financial statements and financial highlights are free of material misstatement. An audit includes examining, on a test basis, evidence supporting the amounts and disclosures in the financial statements. Our procedures included confirmation of securities owned as of December 31, 2015 by correspondence with the custodians. An audit also includes assessing the accounting principles used and significant estimates made by management, as well as evaluating the overall financial statement presentation. We believe that our audits provide a reasonable basis for our opinion.
In our opinion, the financial statements and financial highlights referred to above present fairly, in all material respects, the financial position of the New Alternatives Fund as of December 31, 2015, and the results of its operations for the year then ended, the changes in its net assets for each of the years in the two-year period then ended and its financial highlights for each of the years in the five-year period then ended, in conformity with accounting principles generally accepted in the United States of America.
| Philadelphia, Pennsylvania |
BBD,LLP | |
| February 26, 2016 |

29
OTHER INFORMATION
(Unaudited)
1) PROXY VOTING – The Fund has proxy voting policies which are available: (1) without charge, upon request by calling the Fund at 800-423-8383 and (2) on the SEC’s website at http://www.sec.gov. Information regarding how the Fund voted proxies during the most recent twelve-month period ended June 30 is available on form N-PX: (1) without charge, upon request, by calling the Fund at 800-423-8383 and (2) on the SEC’s website at http://www.sec.gov.
2) QUARTERLY PORTFOLIO SCHEDULES – The Fund files a complete schedule of portfolio holdings with the SEC for the first and third quarters of each fiscal year (quarters ended March 31 and September 30) on Form N-Q. The Fund’s Form N-Q’s are available on the SEC website at http://www.sec.gov and may be reviewed and copied at the SEC Public Reference Room in Washington, D.C. Information on the operation of the SEC Public Reference Room may be obtained by calling 1-800-SEC-0330.
30
NEW ALTERNATIVES FUND
SHAREHOLDER TAX INFORMATION (Unaudited)
During the fiscal year ended December 31, 2015, the following dividends were paid by the Fund:
Ordinary Income | $ | 3,019,343 |
The Fund paid foreign taxes of $467,424 and recognized foreign source income of $2,122,358 pursuant to Section 853 of the Internal Revenue Code. The Fund will elect to pass these foreign taxes through to shareholders as a foreign tax credit and designates such amounts as having been paid in connection with dividends distributed from investment taxable income during the year ended December 31, 2015.
For the year ended December 31, 2015, certain dividends may be subject to a maximum capital gains tax rate, as provided for by the Jobs and Growth Tax Relief Reconciliation Act of 2003. For individual shareholders, 100% of their ordinary income dividends for the Fund qualify for the maximum capital gains tax rate. Complete information will be computed and reported in conjunction with your Form 1099-DIV.
For corporate shareholders, 57.16% of the ordinary income dividends qualify for the dividends received deduction.
Shareholders are advised to consult their own tax advisors with respect to the tax consequences of their investments in the Fund.
31
MANAGEMENT OF THE TRUST
(Unaudited)
Information pertaining to the Trustees and Officers of the Trust is provided in the table below. Certain information on the Trustee’s includes information on such Trustee’s service on the Board of Directors of the Predecessor Company. The mailing address for the Trustees and Officers of the Trust is c/o New Alternatives Fund, 150 Broadhollow Road, Suite PH2, Melville, New York 11747.
| Number of | All | |||||||||
| Portfolios in | Directorships | |||||||||
| Trust | Held by | |||||||||
| Term of | Principal | Complex | Trustee | |||||||
| Position(s) | Office and | Occupation(s) | To Be | During the | ||||||
| Held with | Length of | During the Past | Overseen by | Past Five | ||||||
Name and Year of Birth | the Trust | Time Served1 | Five Years | Trustee2 | Years3 | |||||
Interested Trustee: | ||||||||||
David J. Schoenwald* 1949 | Founder, Trustee, President, Treasurer and Chairperson of the Board | Founder, Trustee, President and Treasurer, 1982 to present; Chairperson of the Board, 2008 to present. | President, Treasurer and Portfolio Manager, Accrued Equities, Inc.** | 1 | None | |||||
Murray D. Rosenblith* 1951 | Trustee and Secretary | Trustee, 2003 to present; Secretary, 2012 to present; Assistant Secretary, 2009 to 2012. | Portfolio Manager and Assistant Compliance Officer (2010 to present), and employee, Accrued Equities, Inc.**(2008 to present); Formerly, Executive Director, A.J. Muste Memorial Institute, an organization concerned with exploration of the link between non-violence and social change (1985 to 2008). | 1 | None | |||||
32
MANAGEMENT OF THE TRUST
(Unaudited)
| Number of | All | |||||||||
| Portfolios in | Directorships | |||||||||
| Trust | Held by | |||||||||
| Term of | Principal | Complex | Trustee | |||||||
| Position(s) | Office and | Occupation(s) | To Be | During the | ||||||
| Held with | Length of | During the Past | Overseen by | Past Five | ||||||
Name and Year of Birth | the Trust | Time Served1 | Five Years | Trustee2 | Years3 | |||||
Independent Trustees: | ||||||||||
Sharon Reier 1946 | Trustee and Vice- Chairperson of the Board | Trustee, 1982 to present; Vice- Chairperson, 2008 to present. | Retired; prior thereto, freelance financial journalist; Contributor to the International Herald Tribune, (1995 to 2011); former contributor to Business Week International; former regional editor, Financial World; former editor, Boardroom Reports; former contributing editor, Institutional Investor; former staff, Forbes and American Banker. | 1 | None | |||||
Susan Hickey 1952 | Trustee, Audit Committee Member and Audit Committee Chairperson | Trustee and Audit Committee Member 2005 to present; Audit Committee Chairperson 2014 to present. | Accounting Software Developer, Accountants World, LLC.; Member of National Association of Enrolled Agents and New York Society of Independent Accountants; Former IRS Tax Return Auditor; BA International Affairs, Stonehill College, North Easton, MA. | 1 | None | |||||
33
MANAGEMENT OF THE TRUST
(Unaudited)
| Number of | All | |||||||||
| Portfolios in | Directorships | |||||||||
| Trust | Held by | |||||||||
| Term of | Principal | Complex | Trustee | |||||||
| Position(s) | Office and | Occupation(s) | To Be | During the | ||||||
| Held with | Length of | During the Past | Overseen by | Past Five | ||||||
Name and Year of Birth | the Trust | Time Served1 | Five Years | Trustee2 | Years3 | |||||
Jonathan D. Beard 1948 | Trustee and Audit Committee Member | Trustee; 2005 to present; Audit Committee Member, 2014 to present. | Retired; prior thereto, Self-employed Freelance Journalist for various American and European Science Magazines; Lifetime Member, Sierra Club and New York-New Jersey Trails Conference; Graduate of Columbia University 1970. | 1 | None | |||||
Jeffrey E. Perlman 1979 | Trustee and Audit Committee Member | Trustee; 2009 to present; Audit Committee Member, 2014 to present. | President and Founder, Bright Power, a company advancing clean, cost-effective energy solutions (2004 to present); Clarinetist/ Saxophonist, Romashka and various Klezmer music ensembles (1996 to present); Formerly, Consultant, Capital E, a renewable energy consulting and investment services company (2002 to 2005). | 1 | None | |||||
Officers of the Trust who are not Trustees: | ||||||||||
Joseph A. Don Angelo 1948 | Chief Compliance Officer | 2007 to present. | Certified Public Accountant and Owner, Don Angelo and Associates, CPAs P.C. (1984 to present). | 1 | None | |||||
34
MANAGEMENT OF THE TRUST
(Unaudited)
| 1 | Each Trustee holds office until the next annual meeting of shareholders at which Trustees are elected following his or her election or appointment and until his or her successor has been elected and qualified. Officers are appointed on an annual basis and serve at the pleasure of the Trustees. |
| 2 | Currently, there is only one portfolio and no fund complex. |
| 3 | Includes directorships of companies required to report to the SEC under the Securities Exchange Act of 1934, as amended (i.e., “public companies”), or other investment companies registered under the 1940 Act. |
| * | “Interested person”, as defined in section 2(a)(19) of the 1940 Act. David J. Schoenwald is majority shareholder and President of the Advisor. Murray D. Rosenblith is considered an “interested person” as a result of his employment with Advisor. |
| ** | David J. Schoenwald and Murray D. Rosenblith have no present enterprise, employment, position or commercial investment activity except for their positions with the Advisor, which is also the Fund’s Sub-Distributor. At the present time, Accrued Equities, Inc. provides services only to the Fund. |
35
Item 2. Code of Ethics.
| (a) | The registrant, as of the end of the period covered by this report, has adopted a code of ethics that applies to the registrant’s principal executive officer, principal financial officer, principal accounting officer or controller, or persons performing similar functions, regardless of whether these individuals are employed by the registrant or a third party. |
| (c) | There have been no amendments, during the period covered by this report, to a provision of the code of ethics that applies to the registrant’s principal executive officer, principal financial officer, principal accounting officer or controller, or persons performing similar functions, regardless of whether these individuals are employed by the registrant or a third party, and that relates to any element of the code of ethics description. |
| (d) | The registrant has not granted any waivers, including an implicit waiver, from a provision of the code of ethics that applies to the registrant’s principal executive officer, principal financial officer, principal accounting officer or controller, or persons performing similar functions, regardless of whether these individuals are employed by the registrant or a third party, that relates to one or more of the items set forth in paragraph (b) of this item’s instructions. |
Item 3. Audit Committee Financial Expert.
As of the end of the period covered by the report, the registrant’s Board of Trustees has determined that Susan Hickey is qualified to serve as an audit committee financial expert serving on its audit committee and that she is “independent,” as defined by Item 3 of Form N-CSR.
Item 4. Principal Accountant Fees and Services.
| • | Registrant may incorporate the following information by reference, if this information has been disclosed in the registrant’s definitive proxy statement or definitive information statement. The proxy statement or information statement must be filed no later than 120 days after the end of the fiscal year covered by the Annual Report. |
Audit Fees
| (a) | The aggregate fees billed for each of the last two fiscal years for professional services rendered by the principal accountant for the audit of the registrant’s annual financial statements or services that are normally provided by the accountant in connection with statutory and regulatory filings or engagements for those fiscal years are $19,250 for 2014 and $19,250 for 2015. |
Audit-Related Fees
| (b) | The aggregate fees billed in each of the last two fiscal years for assurance and related services by the principal accountant that are reasonably related to the performance of the audit of the registrant’s financial statements and are not reported under paragraph (a) of this Item are $0 for 2014 and $0 for 2015. |
Tax Fees
| (c) | The aggregate fees billed in each of the last two fiscal years for professional services rendered by the principal accountant for tax compliance, tax advice, and tax planning are $2,000 for 2014 and $2,000 for 2015. The fees billed were for review by the principal accountant of the registrant’s Federal tax returns. |
All Other Fees
| (d) | The aggregate fees billed in each of the last two fiscal years for products and services provided by the principal accountant, other than the services reported in paragraphs (a) through (c) of this Item are $0 for 2014 and $0 for 2015. |
| (e)(1) | Disclose the audit committee’s pre-approval policies and procedures described in paragraph (c)(7) of Rule 2-01 of Regulation S-X. |
The audit committee will be responsible for evaluating the provision of non-audit services to the registrant as required by Section 201 of the Sarbanes-Oxley Act of 2002 and the rules and regulations promulgated thereunder (collectively, the “2002 Act”) and any pre-approval requests submitted by the independent accountants as required by Section 202 of the 2002 Act. |
| (e)(2) | The percentage of services described in each of paragraphs (b) through (d) of this Item that were approved by the audit committee pursuant to paragraph (c)(7)(i)(C) of Rule 2-01 of Regulation S-X are as follows: |
(b) N/A
(c) 100%
(d) N/A
| (f) | The percentage of hours expended on the principal accountant’s engagement to audit the registrant’s financial statements for the most recent fiscal year that were attributed to work performed by persons other than the principal accountant’s full-time, permanent employees was less than fifty percent. |
| (g) | The aggregate non-audit fees billed by the registrant’s accountant for services rendered to the registrant, and rendered to the registrant’s investment adviser (not including any sub-adviser whose role is primarily portfolio management and is subcontracted with or overseen by another investment adviser), and any entity controlling, controlled by, or under common control with the adviser that provides ongoing services to the registrant for each of the last two fiscal years of the registrant was $0 for 2014 and $0 for 2015. |
| (h) | The registrant’s audit committee of the board of trustees has considered whether the provision of non-audit services that were rendered to the registrant’s investment adviser (not including any sub-adviser whose role is primarily portfolio management and is subcontracted with or overseen by another investment adviser), and any entity controlling, controlled by, or under common control with the investment adviser that provides ongoing services to the registrant that were not pre-approved pursuant to paragraph (c)(7)(ii) of Rule 2-01 of Regulation S-X is compatible with maintaining the principal accountant’s independence. |
Item 5. Audit Committee of Listed Registrants.
Not applicable to registrant.
Item 6. Investments.
| (a) | Not applicable. The full Schedule of Investments in securities of unaffiliated issuers as of the close of the reporting period is included as part of the annual report to shareholders filed under Item 1 of this Form. |
| (b) | Not applicable. |
| Item 7. | Disclosure of Proxy Voting Policies and Procedures for Closed-End Management Investment Companies. |
Not applicable to registrant, which is an open-end management investment company.
Item 8. Portfolio Managers of Closed-End Management Investment Companies.
Not applicable to registrant, which is an open-end management investment company.
| Item 9. | Purchases of Equity Securities by Closed-End Management Investment Company and Affiliated Purchasers. |
Not applicable to Registrant, which is an open-end management investment company.
Item 10. Submission of Matters to a Vote of Security Holders.
There have been no material changes to the procedures by which the shareholders may recommend nominees to the registrant’s Board of Trustees, where those changes were implemented after the registrant last provided disclosure in response to the requirements of Item 407(c)(2)(iv) of Regulation S-K (17 CFR 229.407) (as required by Item 22(b)(15) of Schedule 14A (17 CFR 240.14a-101)), or this Item.
Item 11. Controls and Procedures.
| (a) | Based on his evaluation of the registrant’s disclosure controls and procedures (as defined in Rule 30a-3(c) under the Investment Company Act of 1940, as amended (the “1940 Act”)) as of a date within 90 days of the filing date of this report, the registrant’s principal executive officer and principal financial officer has concluded that such disclosure controls and procedures are reasonably designed and are operating effectively to ensure that material information relating to the registrant, including its consolidated subsidiaries, is made known to him by others within those entities, particularly during the period in which this report is being prepared, and that the information required in filings on Form N-CSR is recorded, processed, summarized, and reported on a timely basis. |
| (b) | There were no changes in the registrant’s internal control over financial reporting (as defined in Rule 30a-3(d) under the 1940 Act (17 CFR 270.30a-3(d)) that occurred during the registrant’s second fiscal quarter of the period covered by this report that has materially affected, or is reasonably likely to materially affect, the registrant’s internal control over financial reporting. |
Item 12. Exhibits.
| (a)(1) | Code of ethics, or any amendments thereto, that is the subject of disclosure required by Item 2 is attached hereto. |
| (a)(2) | Certifications pursuant to Rule 30a-2(a) under the 1940 Act and Section 302 of the Sarbanes-Oxley Act of 2002 are attached hereto. |
| (a)(3) | Not applicable. |
| (b) | Certifications pursuant to Rule 30a-2(b) under the 1940 Act and Section 906 of the Sarbanes-Oxley Act of 2002 are attached hereto. |
(12.other) Not applicable.
SIGNATURES
Pursuant to the requirements of the Securities Exchange Act of 1934 and the Investment Company Act of 1940, the registrant has duly caused this report to be signed on its behalf by the undersigned, thereunto duly authorized.
| (Registrant) | New Alternatives Fund |
| By (Signature and Title)* | /s/ David J. Schoenwald | |
David J. Schoenwald, President and Treasurer (Principal Executive Officer and Principal Financial Officer) |
| Date | 3-1-2016 |
Pursuant to the requirements of the Securities Exchange Act of 1934 and the Investment Company Act of 1940, this report has been signed below by the following persons on behalf of the registrant and in the capacities and on the dates indicated.
| By (Signature and Title)* | David J. Schoenwald | |
David J. Schoenwald, President and Treasurer (Principal Executive Officer and Principal Financial Officer) |
| Date | 3-1-2016 |
* Print the name and title of each signing officer under his or her signature.