Fidelity® Investments Money Market Funds
(formerly Fidelity® Institutional Money Market Funds) Tax-Exempt Portfolio
Government Portfolio
Money Market Portfolio
Treasury Only Portfolio
Prime Money Market Portfolio
Treasury Portfolio
Annual Report March 31, 2016 |
 |
Contents
Fund Goals:
Treasury Only Portfolio seeks as high a level of current income as is consistent with the security of principal and liquidity.
Treasury Portfolio, Government Portfolio, Prime Money Market Portfolio, and Money Market Portfolio seek to obtain as high a level of current income as is consistent with the preservation of principal and liquidity within the limitations prescribed for the fund.
Tax-Exempt Portfolio seeks to obtain as high a level of interest income exempt from federal income tax as is consistent with liquidity and stability of principal.
To view a fund's proxy voting guidelines and proxy voting record for the 12-month period ended June 30, visit http://www.fidelity.com/proxyvotingresults or visit the Securities and Exchange Commission's (SEC) web site at http://www.sec.gov.
You may also call 1-877-297-2952, or for Class F, call 1-800-835-5092, to request a free copy of the proxy voting guidelines.
Standard & Poor's, S&P and S&P 500 are registered service marks of The McGraw-Hill Companies, Inc. and have been licensed for use by Fidelity Distributors Corporation.
Other third-party marks appearing herein are the property of their respective owners.
All other marks appearing herein are registered or unregistered trademarks or service marks of FMR LLC or an affiliated company. © 2016 FMR LLC. All rights reserved.
This report and the financial statements contained herein are submitted for the general information of the shareholders of the Funds. This report is not authorized for distribution to prospective investors in the Funds unless preceded or accompanied by an effective prospectus.
A fund files its complete schedule of portfolio holdings with the SEC for the first and third quarters of each fiscal year on Form N-Q. Forms N-Q are available on the SEC’s web site at http://www.sec.gov. A fund's Forms N-Q may be reviewed and copied at the SEC’s Public Reference Room in Washington, DC. Information regarding the operation of the SEC's Public Reference Room may be obtained by calling 1-800-SEC-0330.
For a complete list of a fund's portfolio holdings, view the most recent holdings listing, semiannual report, or annual report on Fidelity's web site at http://www.fidelity.com, http://www.advisor.fidelity.com, or http://www.401k.com, as applicable.
Investments in the funds are neither insured nor guaranteed by the U.S. Government, and there can be no assurance that the funds will maintain a stable $1.00 share price.
NOT FDIC INSURED •MAY LOSE VALUE •NO BANK GUARANTEE
Neither the Funds nor Fidelity Distributors Corporation is a bank.
Tax-Exempt Portfolio
Investment Summary/Performance (Unaudited)
Effective Maturity Diversification
| Days | % of fund's investments 3/31/16 | % of fund's investments 9/30/15 | % of fund's investments 3/31/15 |
| 1 - 7 | 75.4 | 77.8 | 75.6 |
| 8 - 30 | 1.4 | 2.2 | 1.1 |
| 31 - 60 | 3.6 | 3.4 | 3.8 |
| 61 - 90 | 3.3 | 1.8 | 9.7 |
| 91 - 180 | 9.8 | 2.9 | 7.3 |
| >180 | 6.5 | 11.9 | 2.5 |
Effective maturity is determined in accordance with the requirements of Rule 2a-7 under the Investment Company Act of 1940.
Weighted Average Maturity
| | 3/31/16 | 9/30/15 | 3/31/15 |
| Tax-Exempt Portfolio | 32 Days | 41 Days | 28 Days |
| All Tax-Free Money Market Funds Average(a) | 24 Days | 33 Days | 32 Days |
(a) Source: iMoneyNet, Inc.
This is a weighted average of all the maturities of the securities held in a fund. Weighted Average Maturity (WAM) can be used as a measure of sensitivity to interest rate changes and market changes. Generally, the longer the maturity, the greater the sensitivity to such changes. WAM is based on the dollar-weighted average length of time until principal payments must be paid. Depending on the types of securities held in a fund, certain maturity shortening devices (e.g., demand features, interest rate resets, and call options) may be taken into account when calculating the WAM.
Weighted Average Life
| | 3/31/16 | 9/30/15 | 3/31/15 |
| Tax-Exempt Portfolio | 33 Days | 42 Days | 28 Days |
Weighted Average Life (WAL) is the weighted average of the life of the securities held in a fund or portfolio and can be used as a measure of sensitivity to changes in liquidity and/or credit risk. Generally, the higher the value, the greater the sensitivity. WAL is based on the dollar-weighted average length of time until principal payments must be paid, taking into account any call options exercised by the issuer and any permissible maturity shortening features other than interest rate resets. The difference between WAM and WAL is that WAM takes into account interest rate resets and WAL does not. WAL for money market funds is not the same as WAL of a mortgage- or asset-backed security.
Asset Allocation (% of fund's net assets)
| As of March 31, 2016 |
| | Variable Rate Demand Notes (VRDNs) | 56.2% |
| | Other Municipal Debt | 29.4% |
| | Investment Companies | 12.3% |
| | Net Other Assets (Liabilities) | 2.1% |

| As of September 30, 2015 |
| | Variable Rate Demand Notes (VRDNs) | 63.7% |
| | Other Municipal Debt | 26.6% |
| | Investment Companies | 9.4% |
| | Net Other Assets (Liabilities) | 0.3% |

Current And Historical 7-Day Yields
| | 3/31/16 | 12/31/15 | 9/30/15 | 6/30/15 | 3/31/15 |
| Class I | 0.13% | 0.01% | 0.01% | 0.01% | 0.01% |
| Class II | 0.01% | 0.01% | 0.01% | 0.01% | 0.01% |
| Class III | 0.01% | 0.01% | 0.01% | 0.01% | 0.01% |
| Select Class | 0.08% | 0.01% | 0.01% | 0.01% | 0.01% |
Yield refers to the income paid by the Fund over a given period. Yields for money market funds are usually for seven-day periods, as they are here, though they are expressed as annual percentage rates. Past performance is no guarantee of future results. Yield will vary and it's possible to lose money investing in the Fund. A portion of the Fund's expenses was reimbursed and/or waived. Absent such reimbursements and/or waivers the yield for the period ending March 31, 2016, the most recent period shown in the table, would have been 0.09% for Class I, -0.06% for Class II, -0.16% for Class III and 0.04% for Select Class.
Tax-Exempt Portfolio
Investments March 31, 2016
Showing Percentage of Net Assets
| Variable Rate Demand Note - 56.2% | | | |
| | | Principal Amount (000s) | Value (000s) |
| Alaska - 0.2% | | | |
| Valdez Marine Term. Rev. (Exxon Pipeline Co. Proj.): | | | |
| Series 1985, 0.36% 4/1/16 (Exxon Mobil Corp. Guaranteed), VRDN (a) | | $2,100 | $2,100 |
| Series 1993 C, 0.34% 4/1/16 (Exxon Mobil Corp. Guaranteed), VRDN (a) | | 1,000 | 1,000 |
| | | | 3,100 |
| Arizona - 0.6% | | | |
| Arizona Board of Regents Arizona State Univ. Rev. Series 2008 A, 0.37% 4/7/16, LOC JPMorgan Chase Bank, VRDN (a) | | 3,633 | 3,633 |
| Phoenix Civic Impt. Corp. Wtr. Sys. Rev. Participating VRDN Series Putters 3458, 0.45% 4/7/16 (Liquidity Facility JPMorgan Chase Bank) (a)(b) | | 3,000 | 3,000 |
| Salt River Proj. Agricultural Impt. & Pwr. District Elec. Sys. Rev. Participating VRDN Series Putters 3307, 0.45% 4/7/16 (Liquidity Facility JPMorgan Chase Bank) (a)(b) | | 3,600 | 3,600 |
| | | | 10,233 |
| California - 0.8% | | | |
| California Muni. Fin. Auth. Rev. (La Sierra Univ. Proj.) Series 2008 B, 0.42% 4/7/16, LOC Wells Fargo Bank NA, VRDN (a) | | 3,000 | 3,000 |
| Los Angeles Cmnty. College District Participating VRDN 0.43% 4/7/16 (Liquidity Facility Royal Bank of Canada New York Branch) (a)(b) | | 2,000 | 2,000 |
| Los Angeles Dept. of Wtr. & Pwr. Rev. Series 2001 B6, 0.3% 4/1/16 (Liquidity Facility Bank of Montreal Chicago CD Prog.), VRDN (a) | | 2,800 | 2,800 |
| Rancho Wtr. District Fing. Auth. Rev. Participating VRDN Series 16 ZF0342, 0.45% 4/7/16 (Liquidity Facility Bank of America NA) (a)(b) | | 4,980 | 4,980 |
| | | | 12,780 |
| Colorado - 0.3% | | | |
| Colorado Health Facilities Auth. Rev. (Boulder Cmnty. Hosp. Proj.) Series 2000, 0.51% 4/7/16, LOC JPMorgan Chase Bank, VRDN (a) | | 2,520 | 2,520 |
| Univ. of Colorado Enterprise Sys. Rev. Participating VRDN Series RBC O 70, 0.45% 4/7/16 (Liquidity Facility Royal Bank of Canada) (a)(b) | | 1,800 | 1,800 |
| | | | 4,320 |
| Connecticut - 0.2% | | | |
| Connecticut Health & Edl. Facilities Auth. Rev. Participating VRDN Series 15 XF0091, 0.45% 4/7/16 (Liquidity Facility JPMorgan Chase Bank) (a)(b) | | 390 | 390 |
| Connecticut Hsg. Fin. Auth.: | | | |
| (Hsg. Mtg. Fin. Prog.) Series 2009 C2, 0.35% 4/1/16 (Liquidity Facility JPMorgan Chase Bank), VRDN (a) | | 1,415 | 1,415 |
| Series 2009 A2, 0.35% 4/1/16 (Liquidity Facility JPMorgan Chase Bank), VRDN (a) | | 1,300 | 1,300 |
| | | | 3,105 |
| District Of Columbia - 0.9% | | | |
| District of Columbia Hsg. Fin. Agcy. Multi-family Hsg. Rev. (Pentacle Apts. Proj.) Series 2008, 0.44% 4/7/16, LOC Freddie Mac, VRDN (a) | | 3,200 | 3,200 |
| District of Columbia Income Tax Rev. Participating VRDN Series Putters 3354, 0.45% 4/7/16 (Liquidity Facility JPMorgan Chase Bank) (a)(b) | | 7,155 | 7,155 |
| District of Columbia Rev.: | | | |
| (American Psychological Assoc. Proj.) Series 2003, 0.45% 4/7/16, LOC Bank of America NA, VRDN (a) | | 1,290 | 1,290 |
| (Medlantic/Helix Proj.) Series 1998 A Tranche II, 0.38% 4/7/16, LOC TD Banknorth, NA, VRDN (a) | | 2,970 | 2,970 |
| | | | 14,615 |
| Florida - 1.0% | | | |
| Highlands County Health Facilities Auth. Rev. Participating VRDN Series MS 3251, 0.46% 4/7/16 (Liquidity Facility Morgan Stanley Bank, West Valley City Utah) (a)(b) | | 5,625 | 5,625 |
| North Broward Hosp. District Rev.: | | | |
| Series 2005 A, 0.42% 4/7/16, LOC Wells Fargo Bank NA, VRDN (a) | | 8,865 | 8,865 |
| 0.42% 4/7/16, LOC Northern Trust Co., VRDN (a) | | 1,680 | 1,680 |
| | | | 16,170 |
| Georgia - 1.2% | | | |
| Athens-Clarke County Unified Govt. Dev. Auth. Rev. (Univ. of Georgia Athletic Assoc. Proj.) Series 2003, 0.35% 4/1/16, LOC Wells Fargo Bank NA, VRDN (a) | | 1,685 | 1,685 |
| Georgia Muni. Elec. Auth. Pwr. Rev. (Proj. One) Series 2008 B, 0.38% 4/7/16, LOC Bank of Tokyo-Mitsubishi UFJ Ltd., VRDN (a) | | 6,000 | 6,000 |
| Glynn-Brunswick Memorial Hosp. Auth. Rev. (Southeast Georgia Health Sys. Proj.) Series 2008 B, 0.45% 4/7/16, LOC Branch Banking & Trust Co., VRDN (a) | | 12,370 | 12,370 |
| | | | 20,055 |
| Hawaii - 0.6% | | | |
| Hawaii State Hsg. Fin. & Dev. Corp. Rev. (Lokahi Kau Apts. Proj.) Series 2008, 0.4% 4/7/16, LOC Freddie Mac, VRDN (a) | | 9,830 | 9,830 |
| Illinois - 4.7% | | | |
| Chicago Wtr. Rev.: | | | |
| Series 2000, 0.49% 4/7/16, LOC JPMorgan Chase Bank, VRDN (a) | | 1,500 | 1,500 |
| Series 2000-1, 0.49% 4/7/16, LOC JPMorgan Chase Bank, VRDN (a) | | 1,500 | 1,500 |
| Series 2004 A1, 0.49% 4/7/16, LOC Bank of Tokyo-Mitsubishi UFJ Ltd., VRDN (a) | | 5,135 | 5,135 |
| Series 2004 A2, 0.53% 4/7/16, LOC State Street Bank & Trust Co., Boston, VRDN (a) | | 4,845 | 4,845 |
| Illinois Fin. Auth. Rev.: | | | |
| (The Univ. of Chicago Med. Ctr. Proj.) Series 2009 E1, 0.35% 4/1/16, LOC Wells Fargo Bank NA, VRDN (a) | | 2,200 | 2,200 |
| Participating VRDN: | | | |
| Series Putters 0022, 0.45% 4/7/16 (Liquidity Facility JPMorgan Chase Bank) (a)(b) | | 3,795 | 3,795 |
| Series Putters 3379, 0.45% 4/7/16 (Liquidity Facility JPMorgan Chase Bank) (a)(b) | | 4,995 | 4,995 |
| Series 2009 D1, 0.38% 4/1/16, LOC PNC Bank NA, VRDN (a) | | 600 | 600 |
| Series 2011 A, 0.38% 4/1/16, LOC Bank of America NA, VRDN (a) | | 2,000 | 2,000 |
| Series 2011 B, 0.35% 4/1/16, LOC Wells Fargo Bank NA, VRDN (a) | | 13,950 | 13,950 |
| Illinois Gen. Oblig.: | | | |
| Series 2003 B2, 0.38% 4/7/16, LOC PNC Bank NA, VRDN (a) | | 25,200 | 25,200 |
| Series 2003 B3, 0.38% 4/7/16, LOC Wells Fargo Bank NA, VRDN (a) | | 9,350 | 9,350 |
| Illinois Toll Hwy. Auth. Toll Hwy. Rev. Participating VRDN: | | | |
| Series 15 XF0277, 0.48% 4/7/16 (Liquidity Facility JPMorgan Chase Bank) (a)(b) | | 1,500 | 1,500 |
| Series 15 XF2202, 0.43% 4/7/16 (Liquidity Facility Citibank NA) (a)(b) | | 1,150 | 1,150 |
| | | | 77,720 |
| Indiana - 5.6% | | | |
| Indiana Dev. Fin. Auth. Envir. Rev. (Duke Energy Indiana, Inc. Proj.) Series 2009 A5, 0.35% 4/1/16, LOC Sumitomo Mitsui Banking Corp., VRDN (a) | | 3,950 | 3,950 |
| Indiana Fin. Auth. Health Sys. Rev. (Sisters of Saint Francis Health Svcs., Inc. Obligated Group Proj.): | | | |
| Series 2008 A, 0.42% 4/7/16, LOC JPMorgan Chase Bank, VRDN (a) | | 26,520 | 26,520 |
| Series 2008 F, 0.42% 4/7/16, LOC Bank of New York, New York, VRDN (a) | | 33,850 | 33,850 |
| Series 2008 G, 0.42% 4/7/16, LOC Wells Fargo Bank NA, VRDN (a) | | 4,000 | 4,000 |
| Series 2008 J, 0.42% 4/7/16, LOC Wells Fargo Bank NA, VRDN (a) | | 4,585 | 4,585 |
| Indiana Fin. Auth. Hosp. Rev.: | | | |
| (Cmnty. Health Network Proj.) Series 2009 A, 0.42% 4/7/16, LOC Wells Fargo Bank NA, VRDN (a) | | 12,900 | 12,900 |
| (Indiana Univ. Health Obligated Group Proj.) Series 2011 E, 0.38% 4/7/16, LOC Bank of America NA, VRDN (a) | | 2,795 | 2,795 |
| (Parkview Health Sys. Oblig. Group Proj.) Series 2009 B, 0.38% 4/7/16, LOC Wells Fargo Bank NA, VRDN (a) | | 4,100 | 4,100 |
| | | | 92,700 |
| Kansas - 0.0% | | | |
| Kansas Dev. Fin. Auth. Health Facilities Rev. (KU Health Sys. Proj.) Series 2011 J, 0.4% 4/1/16, LOC U.S. Bank NA, Cincinnati, VRDN (a) | | 600 | 600 |
| Kentucky - 0.5% | | | |
| Louisville & Jefferson County Series 2011 B, 0.35% 4/1/16, LOC JPMorgan Chase Bank, VRDN (a) | | 7,700 | 7,700 |
| Louisiana - 2.0% | | | |
| East Baton Rouge Parish Indl. Dev. Board Rev. (ExxonMobil Proj.) Series 2010 A, 0.36% 4/1/16 (Exxon Mobil Corp. Guaranteed), VRDN (a) | | 18,200 | 18,200 |
| Louisiana Gas & Fuel Tax Rev. Participating VRDN Series EGL 14 0049, 0.45% 4/7/16 (Liquidity Facility Citibank NA) (a)(b) | | 5,400 | 5,400 |
| Louisiana Offshore Term. Auth. Deepwater Port Rev. (LOOP LLC Proj.) Series 2003 A, 0.37% 4/1/16, LOC JPMorgan Chase Bank, VRDN (a) | | 8,300 | 8,300 |
| Louisiana Pub. Facilities Auth. Rev. (C-Port LLC Proj.) Series 2008, 0.46% 4/7/16, LOC Bank of America NA, VRDN (a) | | 1,880 | 1,880 |
| | | | 33,780 |
| Massachusetts - 0.1% | | | |
| Massachusetts School Bldg. Auth. Dedicated Sales Tax Rev. Participating VRDN Series MS 30911, 0.46% 4/7/16 (Liquidity Facility Morgan Stanley Bank, West Valley City Utah) (a)(b) | | 2,630 | 2,630 |
| Michigan - 1.8% | | | |
| Kent Hosp. Fin. Auth. Hosp. Facilities Rev. (Metropolitan Hosp. Proj.) Series 2012, 0.42% 4/7/16, LOC Bank of America NA, VRDN (a) | | 21,370 | 21,370 |
| Michigan Fin. Auth. Rev. Participating VRDN Series 15 XF0126, 0.45% 4/7/16 (Liquidity Facility JPMorgan Chase Bank) (a)(b) | | 2,000 | 2,000 |
| Ottawa County Wtr. Supply Sys. Rev. Participating VRDN Series 15 XF0113, 0.45% 4/7/16 (Liquidity Facility JPMorgan Chase Bank) (a)(b) | | 6,625 | 6,625 |
| | | | 29,995 |
| Minnesota - 0.1% | | | |
| Minneapolis & Saint Paul Hsg. & Redev. Auth. Health Care Sys. Rev. (Allina Health Sys. Proj.) Series 2009 B1, 0.37% 4/1/16, LOC JPMorgan Chase Bank, VRDN (a) | | 1,300 | 1,300 |
| Mississippi - 1.0% | | | |
| Jackson County Port Facilities Rev. (Chevron U.S.A., Inc. Proj.) Series 1993, 0.34% 4/1/16, VRDN (a) | | 1,820 | 1,820 |
| Mississippi Bus. Fin. Corp. (Chevron U.S.A., Inc. Proj.) Series 2007 A, 0.37% 4/1/16 (Chevron Corp. Guaranteed), VRDN (a) | | 1,900 | 1,900 |
| Mississippi Bus. Fin. Corp. Indl. Dev. Rev. (New Process Steel, L.P. Proj.) Series 2010, 0.42% 4/7/16, LOC Wells Fargo Bank NA, VRDN (a) | | 2,400 | 2,400 |
| Mississippi Dev. Bank Spl. Oblig. (Harrison County Proj.) Series 2008 A2, 0.42% 4/7/16, LOC Bank of America NA, VRDN (a) | | 10,150 | 10,150 |
| | | | 16,270 |
| Missouri - 0.6% | | | |
| Missouri Health & Edl. Facilities Auth. Edl. Facilities Rev. (Saint Louis Univ. Proj.): | | | |
| Series 2008 A1, 0.35% 4/1/16, LOC Wells Fargo Bank NA, VRDN (a) | | 1,290 | 1,290 |
| Series 2008 A2, 0.35% 4/1/16, LOC Wells Fargo Bank NA, VRDN (a) | | 8,280 | 8,280 |
| | | | 9,570 |
| Nevada - 0.3% | | | |
| Clark County Fuel Tax Participating VRDN Series ROC II R 11507, 0.43% 4/7/16 (Liquidity Facility Citibank NA) (a)(b) | | 5,345 | 5,345 |
| New York - 16.2% | | | |
| Nassau Health Care Corp. Rev. Series 2009 C1, 0.42% 4/7/16, LOC Wells Fargo Bank NA, VRDN (a) | | 13,255 | 13,255 |
| New York City Gen. Oblig.: | | | |
| Participating VRDN Series 15 ZF0198, 0.45% 4/7/16 (Liquidity Facility JPMorgan Chase Bank) (a)(b) | | 3,690 | 3,690 |
| Series 2004 H1, 0.37% 4/1/16, LOC Bank of New York, New York, VRDN (a) | | 2,300 | 2,300 |
| Series 2004 H4, 0.37% 4/1/16, LOC Bank of New York, New York, VRDN (a) | | 1,300 | 1,300 |
| Series 2006 E2, 0.38% 4/1/16, LOC Bank of America NA, VRDN (a) | | 1,900 | 1,900 |
| Series 2006 H1, 0.36% 4/1/16 (Liquidity Facility JPMorgan Chase Bank), VRDN (a) | | 1,600 | 1,600 |
| Series 2006 I3, 0.38% 4/1/16, LOC Bank of America NA, VRDN (a) | | 5,150 | 5,150 |
| Series 2008 J6, 0.38% 4/1/16, LOC Landesbank Hessen-Thuringen, VRDN (a) | | 17,005 | 17,005 |
| Series 2013 A3, 0.45% 4/1/16 (Liquidity Facility Mizuho Corporate Bank Ltd.), VRDN (a) | | 1,000 | 1,000 |
| Series 2015 F6, 0.36% 4/1/16 (Liquidity Facility JPMorgan Chase Bank), VRDN (a) | | 5,000 | 5,000 |
| Series 2104 1, 0.36% 4/1/16 (Liquidity Facility JPMorgan Chase Bank), VRDN (a) | | 7,100 | 7,100 |
| Series D5, 0.38% 4/1/16, LOC PNC Bank NA, VRDN (a) | | 8,500 | 8,500 |
| New York City Hsg. Dev. Corp. Multi-family Rental Hsg. Rev. (90 Washington Street Proj.) Series 2005 A, 0.39% 4/7/16, LOC Fannie Mae, VRDN (a) | | 13,100 | 13,100 |
| New York City Muni. Wtr. Fin. Auth. Wtr. & Swr. Sys. Rev.: | | | |
| Participating VRDN: | | | |
| Series EGL 14 0043, 0.44% 4/7/16 (Liquidity Facility Citibank NA) (a)(b) | | 14,800 | 14,800 |
| Series ROC II R 11916, 0.43% 4/7/16 (Liquidity Facility Citibank NA) (a)(b) | | 1,235 | 1,235 |
| Series 2006 AA-1B, 0.36% 4/1/16 (Liquidity Facility State Street Bank & Trust Co., Boston), VRDN (a) | | 8,750 | 8,750 |
| Series 2008 B3, 0.38% 4/1/16 (Liquidity Facility Bank of America NA), VRDN (a) | | 2,700 | 2,700 |
| Series 2009 BB2, 0.43% 4/1/16 (Liquidity Facility Landesbank Hessen-Thuringen), VRDN (a) | | 16,500 | 16,500 |
| Series 2012 B, 0.36% 4/1/16 (Liquidity Facility U.S. Bank NA, Cincinnati), VRDN (a) | | 1,700 | 1,700 |
| Series 2012 B3, 0.36% 4/1/16 (Liquidity Facility State Street Bank & Trust Co., Boston), VRDN (a) | | 1,050 | 1,050 |
| Series 2014 AA: | | | |
| 0.35% 4/1/16 (Liquidity Facility TD Banknorth, NA), VRDN (a) | | 4,675 | 4,675 |
| 0.37% 4/1/16 (Liquidity Facility Mizuho Corporate Bank Ltd.), VRDN (a) | | 11,300 | 11,300 |
| 0.45% 4/1/16 (Liquidity Facility Mizuho Corporate Bank Ltd.), VRDN (a) | | 17,700 | 17,700 |
| Series 2014 BB1, 0.38% 4/1/16 (Liquidity Facility Bank of America NA), VRDN (a) | | 2,900 | 2,900 |
| New York City Transitional Fin. Auth. Rev.: | | | |
| Participating VRDN: | | | |
| Series ROC II R 11902, 0.43% 4/7/16 (Liquidity Facility Citibank NA) (a)(b) | | 3,800 | 3,800 |
| Series ROC II R 14022, 0.43% 4/7/16 (Liquidity Facility Citibank NA) (a)(b) | | 2,185 | 2,185 |
| Series 2001 C, 0.38% 4/1/16 (Liquidity Facility PNC Bank NA), VRDN (a) | | 9,815 | 9,815 |
| Series 2003 1D, 0.38% 4/1/16 (Liquidity Facility Landesbank Hessen-Thuringen), VRDN (a) | | 10,530 | 10,530 |
| Series 2003 A2, 0.39% 4/4/16 (Liquidity Facility Bank of Tokyo-Mitsubishi UFJ Ltd.), VRDN (a) | | 3,000 | 3,000 |
| Series 2003 C1, 0.36% 4/1/16 (Liquidity Facility JPMorgan Chase Bank), VRDN (a) | | 3,300 | 3,300 |
| Series 2003 C2, 0.38% 4/1/16 (Liquidity Facility Landesbank Hessen-Thuringen), VRDN (a) | | 5,950 | 5,950 |
| Series 2013 A5, 0.36% 4/1/16 (Liquidity Facility U.S. Bank NA, Cincinnati), VRDN (a) | | 1,000 | 1,000 |
| Series 2013 C4, 0.36% 4/1/16 (Liquidity Facility JPMorgan Chase Bank), VRDN (a) | | 7,985 | 7,985 |
| Series 2015 E4: | | | |
| 0.36% 4/1/16 (Liquidity Facility JPMorgan Chase Bank), VRDN (a) | | 3,000 | 3,000 |
| 0.38% 4/1/16 (Liquidity Facility Bank of America NA), VRDN (a) | | 5,000 | 5,000 |
| New York Dorm. Auth. Revs. Participating VRDN Series Putters 1955, 0.45% 4/7/16 (Liquidity Facility JPMorgan Chase Bank) (a)(b) | | 2,600 | 2,600 |
| New York Envir. Facilities Corp. Clean Wtr. & Drinking Wtr. Participating VRDN Series Putters 3376, 0.45% 4/7/16 (Liquidity Facility JPMorgan Chase Bank) (a)(b) | | 4,425 | 4,425 |
| New York Envir. Facilities Corp. State Personal Income Tax Rev. Participating VRDN Series 15 XF0086, 0.45% 4/7/16 (Liquidity Facility JPMorgan Chase Bank) (a)(b) | | 3,185 | 3,185 |
| New York Hsg. Fin. Agcy. Rev.: | | | |
| (505 West 37th Street Proj.) Series 2009 A, 0.38% 4/1/16, LOC Landesbank Hessen-Thuringen, VRDN (a) | | 1,400 | 1,400 |
| Series 2013 A1, 0.43% 4/7/16, LOC Manufacturers & Traders Trust Co., VRDN (a) | | 17,600 | 17,600 |
| Series 2014 A, 0.36% 4/1/16, LOC PNC Bank NA, VRDN (a) | | 7,000 | 7,000 |
| Series 2015 A1, 0.38% 4/7/16, LOC Bank of New York, New York, VRDN (a) | | 1,000 | 1,000 |
| New York Metropolitan Trans. Auth. Rev. Series 2015 E1, 0.36% 4/1/16, LOC U.S. Bank NA, Cincinnati, VRDN (a) | | 7,500 | 7,500 |
| New York Thruway Auth. Second Gen. Hwy. & Bridge Trust Fund Participating VRDN Series ROC II R 11997, 0.43% 4/7/16 (Liquidity Facility Citibank NA) (a)(b) | | 2,000 | 2,000 |
| | | | 266,485 |
| North Carolina - 2.7% | | | |
| Charlotte Wtr. & Swr. Sys. Rev. Participating VRDN Series ROC II R 11906, 0.43% 4/7/16 (Liquidity Facility Citibank NA) (a)(b) | | 2,705 | 2,705 |
| Charlotte-Mecklenburg Hosp. Auth. Health Care Sys. Rev. Series 2007 H, 0.35% 4/1/16, LOC Wells Fargo Bank NA, VRDN (a) | | 3,360 | 3,360 |
| Greensboro Combined Enterprise Sys. Rev. Series 2014 A, 0.41% 4/7/16 (Liquidity Facility Bank of America NA), VRDN (a) | | 1,030 | 1,030 |
| North Carolina Cap. Facilities Fin. Agcy. Rev. Participating VRDN: | | | |
| Series EGL 14 0051, 0.44% 4/7/16 (Liquidity Facility Citibank NA) (a)(b) | | 8,800 | 8,800 |
| Series MS 15 ZM0105, 0.46% 4/7/16 (Liquidity Facility Morgan Stanley Bank, West Valley City Utah) (a)(b) | | 2,185 | 2,185 |
| North Carolina Ltd. Oblig. Participating VRDN Series ROC 14089, 0.43% 4/7/16 (Liquidity Facility Citibank NA) (a)(b) | | 1,000 | 1,000 |
| North Carolina Med. Care Commission Health Care Facilities Rev. (WakeMed Proj.) Series 2009 C, 0.4% 4/7/16, LOC Wells Fargo Bank NA, VRDN (a) | | 8,050 | 8,050 |
| North Carolina Med. Care Commission Hosp. Rev. (CaroMont Health Proj.) Series 2003 A, 0.4% 4/7/16, LOC Wells Fargo Bank NA, VRDN (a) | | 9,090 | 9,090 |
| Parson County Indl. Facilities and Poll. Cont. Fing. Auth. (CertainTeed Gypsum NC, Inc. Proj.) Series 2010, 0.43% 4/7/16, LOC Cr. Industriel et Commercial, VRDN (a) | | 2,700 | 2,700 |
| Piedmont Triad Arpt. Auth. Series 2008 A, 0.41% 4/7/16, LOC Branch Banking & Trust Co., VRDN (a) | | 2,595 | 2,595 |
| Wake County Gen. Oblig. Series 2003 C, 0.41% 4/7/16 (Liquidity Facility Wells Fargo Bank NA), VRDN (a) | | 3,150 | 3,150 |
| | | | 44,665 |
| Ohio - 0.6% | | | |
| Alliance Hosp. Rev. (Alliance Obligated Group Proj.) Series 2003, 0.37% 4/1/16, LOC JPMorgan Chase Bank, VRDN (a) | | 9,690 | 9,690 |
| Oregon - 1.0% | | | |
| Oregon Facilities Auth. Rev. (PeaceHealth Proj.) Series 2008 B, 0.41% 4/7/16, LOC U.S. Bank NA, Cincinnati, VRDN (a) | | 4,400 | 4,400 |
| Oregon Gen. Oblig. Participating VRDN Series ROC II R 11949, 0.43% 4/7/16 (Liquidity Facility Citibank NA) (a)(b) | | 3,000 | 3,000 |
| Oregon Health and Science Univ. Spl. Rev. Series 2012 B3, 0.37% 4/1/16, LOC U.S. Bank NA, Cincinnati, VRDN (a) | | 8,520 | 8,520 |
| | | | 15,920 |
| Pennsylvania - 1.5% | | | |
| Delaware County Auth. Hosp. Rev. (Crozer-Chester Med. Ctr. Proj.) Series 1996, 0.52% 4/7/16, LOC Wells Fargo Bank NA, VRDN (a) | | 8,375 | 8,375 |
| Indiana County Hosp. Auth. Series 2014 B, 0.43% 4/7/16, LOC PNC Bank NA, VRDN (a) | | 3,400 | 3,400 |
| Lancaster Indl. Dev. Auth. Rev. (Willow Valley Retirement Proj.) Series 2009 B, 0.44% 4/7/16, LOC PNC Bank NA, VRDN (a) | | 455 | 455 |
| Philadelphia Gas Works Rev. (1998 Gen. Ordinance Proj.) Eighth Series B, 0.42% 4/7/16, LOC Wells Fargo Bank NA, VRDN (a) | | 12,200 | 12,200 |
| | | | 24,430 |
| Rhode Island - 0.3% | | | |
| Rhode Island Health and Edl. Bldg. Corp. Higher Ed. Facility Rev. (New England Institute of Technology Proj.) Series 2008, 0.4% 4/7/16, LOC TD Banknorth, NA, VRDN (a) | | 4,830 | 4,830 |
| South Carolina - 0.2% | | | |
| South Carolina Jobs-Econ. Dev. Auth. (AnMed Health Proj.) Series 2009 A, 0.36% 4/7/16, LOC Wells Fargo Bank NA, VRDN (a) | | 1,800 | 1,800 |
| South Carolina Jobs-Econ. Dev. Auth. Econ. Dev. Rev. (Bon Secours Health Sys. Proj.) 0.52% 4/7/16, LOC JPMorgan Chase Bank, VRDN (a) | | 2,500 | 2,500 |
| | | | 4,300 |
| Tennessee - 1.5% | | | |
| Clarksville Pub. Bldg. Auth. Rev. (Tennessee Muni. Bond Fund Proj.): | | | |
| Series 1994, 0.43% 4/7/16, LOC Bank of America NA, VRDN (a) | | 1,895 | 1,895 |
| Series 2005, 0.4% 4/1/16, LOC Bank of America NA, VRDN (a) | | 1,130 | 1,130 |
| Johnson City Health & Edl. Hosp. Rev. (Mountain States Health Alliance Proj.) Series 2011 B, 0.4% 4/7/16, LOC PNC Bank NA, VRDN (a) | | 15,625 | 15,625 |
| Nashville and Davidson County Metropolitan Govt. Health & Edl. Facilities Board Rev. Bonds Series 2001 B1, 0.67%, tender 10/27/16 (a) | | 4,000 | 4,000 |
| Rutherford County Health & Edl. Facilities Board Rev. Participating VRDN Series 2014 ZF0208, 0.5% 4/7/16 (Liquidity Facility JPMorgan Chase Bank) (a)(b) | | 2,500 | 2,500 |
| | | | 25,150 |
| Texas - 7.9% | | | |
| Austin Wtr. & Wastewtr. Sys. Rev. Participating VRDN Series ROC II R 11992, 0.43% 4/7/16 (Liquidity Facility Citibank NA) (a)(b) | | 3,400 | 3,400 |
| Dallas Wtrwks. & Swr. Sys. Rev. Participating VRDN: | | | |
| Series Putters 3227, 0.45% 4/7/16 (Liquidity Facility JPMorgan Chase Bank) (a)(b) | | 2,995 | 2,995 |
| Series Putters 3742, 0.45% 4/7/16 (Liquidity Facility JPMorgan Chase Bank) (a)(b) | | 5,000 | 5,000 |
| Friendswood Independent School District Participating VRDN Series Putters 3221, 0.45% 4/7/16 (Liquidity Facility JPMorgan Chase Bank) (a)(b) | | 1,295 | 1,295 |
| Goose Creek Consolidated Independent School District Participating VRDN Series PZ 219, 0.45% 4/7/16 (Liquidity Facility Wells Fargo & Co.) (a)(b) | | 10,708 | 10,708 |
| Gulf Coast Indl. Dev. Auth. TX Rev. (ExxonMobil Proj.) Series 2012, 0.32% 4/1/16 (Exxon Mobil Corp. Guaranteed), VRDN (a) | | 28,600 | 28,600 |
| Harris County Cultural Ed. Facilities Fin. Corp. Rev.: | | | |
| Participating VRDN Series Putters 15 3, 0.35% 4/1/16 (Liquidity Facility JPMorgan Securities LLC) (a)(b) | | 1,100 | 1,100 |
| Series 2014 D, 0.38% 4/7/16, VRDN (a) | | 2,200 | 2,200 |
| Harris County Cultural Ed. Facilities Fin. Corp. Spl. Facilities Rev. (Texas Med. Ctr. Proj.) Series 2008 B1, 0.35% 4/1/16, LOC JPMorgan Chase Bank, VRDN (a) | | 4,610 | 4,610 |
| Harris County Gen. Oblig. Participating VRDN Series Clipper 07 46, 0.44% 4/7/16 (Liquidity Facility State Street Bank & Trust Co., Boston) (a)(b) | | 40,000 | 40,000 |
| Harris County Health Facilities Dev. Corp. Rev. (Saint Dominic Village Proj.) Series 2000, 0.53% 4/7/16, LOC JPMorgan Chase Bank, VRDN (a) | | 5,900 | 5,900 |
| Lower Neches Valley Auth. Indl. Dev. Corp. Exempt Facilities Rev. (ExxonMobil Proj.) Series 2001 A, 0.34% 4/1/16 (Exxon Mobil Corp. Guaranteed), VRDN (a) | | 8,400 | 8,400 |
| Port Arthur Navigation District Indl. Dev. Corp. Exempt Facilities Rev. (Total Petrochemicals and Refining U.S.A., Inc. Proj.) Series 2012 A, 0.48% 4/7/16 (Total SA Guaranteed), VRDN (a) | | 4,100 | 4,100 |
| Tarrant County Cultural Ed. Facilities Fin. Corp. Hosp. Rev. (Methodist Hospitals of Dallas Proj.) Series 2008, 0.36% 4/1/16, LOC TD Banknorth, NA, VRDN (a) | | 8,140 | 8,140 |
| Univ. of Texas Permanent Univ. Fund Rev. Series 2008 A, 0.39% 4/7/16, VRDN (a) | | 3,200 | 3,200 |
| | | | 129,648 |
| Utah - 0.2% | | | |
| Emery County Poll. Cont. Rev. (PacifiCorp Proj.) Series 1994, 0.38% 4/7/16, LOC Canadian Imperial Bank of Commerce, VRDN (a) | | 2,500 | 2,500 |
| Riverton Hosp. Rev. Participating VRDN Series RBC ZF 0274, 0.47% 4/7/16 (Liquidity Facility Royal Bank of Canada New York Branch) (a)(b) | | 1,400 | 1,400 |
| | | | 3,900 |
| Virginia - 0.3% | | | |
| Albemarle County Indl. Dev. Auth. 0.42% 4/7/16, LOC Wells Fargo Bank NA, VRDN (a) | | 1,260 | 1,260 |
| Albemarle Econ. Dev. Auth. Health Svcs. Rev. (The Univ. of Virginia Health Svcs. Foundation Proj.) Series 2009, 0.4% 4/1/16, LOC Bank of America NA, VRDN (a) | | 1,480 | 1,480 |
| Fauquier County Indl. Dev. Auth. Rev. (Highland School Proj.) Series 2008, 0.4% 4/7/16, LOC Branch Banking & Trust Co., VRDN (a) | | 3,150 | 3,150 |
| | | | 5,890 |
| Washington - 1.2% | | | |
| Central Puget Sound Reg'l. Trans. Auth. Sales & Use Tax Rev. Participating VRDN Series 15 XF2158, 0.43% 4/7/16 (Liquidity Facility Citibank NA) (a)(b) | | 2,885 | 2,885 |
| Washington Gen. Oblig. Participating VRDN: | | | |
| Series 15 ZM0121, 0.45% 4/7/16 (Liquidity Facility Royal Bank of Canada New York Branch) (a)(b) | | 1,250 | 1,250 |
| Series Putters 3539, 0.45% 4/7/16 (Liquidity Facility JPMorgan Chase Bank) (a)(b) | | 4,330 | 4,330 |
| Washington Health Care Facilities Auth. Rev. Participating VRDN Series 15 XF0132, 0.45% 4/7/16 (Liquidity Facility JPMorgan Chase Bank) (a)(b) | | 4,625 | 4,625 |
| Washington Hsg. Fin. Commission Multi-family Hsg. Rev.: | | | |
| (New Haven Apts. Proj.) Series 2009, 0.4% 4/7/16, LOC Fannie Mae, VRDN (a) | | 5,000 | 5,000 |
| (The Cambridge Apts. Proj.) Series 2009, 0.4% 4/7/16, LOC Fannie Mae, VRDN (a) | | 1,200 | 1,200 |
| | | | 19,290 |
| Wyoming - 0.1% | | | |
| Uinta County Poll. Cont. Rev. (Chevron Corp. Proj.) Series 1993, 0.34% 4/1/16 (Chevron Corp. Guaranteed), VRDN (a) | | 1,500 | 1,500 |
| TOTAL VARIABLE RATE DEMAND NOTE | | | |
| (Cost $927,516) | | | 927,516 |
|
| Other Municipal Debt - 29.4% | | | |
| Alaska - 0.8% | | | |
| Alaska Gen. Oblig. Bonds Series 2012 A, 5% 8/1/16 | | 3,250 | 3,301 |
| Anchorage Gen. Oblig. TAN 2% 9/15/16 (c) | | 7,000 | 7,047 |
| North Slope Borough Gen. Oblig. Bonds: | | | |
| Series 2006 A, 5% 6/30/16 | | 1,000 | 1,011 |
| Series 2013 A, 2% 6/30/16 | | 1,010 | 1,014 |
| | | | 12,373 |
| Arizona - 0.1% | | | |
| Salt River Proj. Agricultural Impt. & Pwr. District Elec. Sys. Rev. Series C, 0.05% 4/4/16, CP | | 1,400 | 1,400 |
| California - 3.1% | | | |
| California Dept. of Wtr. Resources Pwr. Supply Rev. Bonds 4% 5/1/16 | | 9,275 | 9,304 |
| California Statewide Cmntys. Dev. Auth. Gas Supply Rev. Bonds: | | | |
| Series 2010 A, 0.46%, tender 7/1/16 (Liquidity Facility Royal Bank of Canada) (a) | | 3,800 | 3,800 |
| Series 2010 B, 0.46%, tender 5/2/16 (Liquidity Facility Royal Bank of Canada) (a) | | 2,600 | 2,600 |
| Los Angeles County Gen. Oblig. TRAN 5% 6/30/16 | | 9,240 | 9,347 |
| Los Angeles Dept. of Wtr. & Pwr. Rev. 0.46% 4/28/16 (Liquidity Facility Wells Fargo Bank NA), CP | | 1,300 | 1,300 |
| Los Angeles Gen. Oblig. TRAN 2% 6/30/16 | | 23,000 | 23,095 |
| Los Angeles Hbr. Dept. Rev. Bonds Series WF 10 40C, 0.55%, tender 6/2/16 (Liquidity Facility Wells Fargo Bank NA) (a)(b)(d) | | 1,400 | 1,400 |
| | | | 50,846 |
| Colorado - 1.3% | | | |
| Colorado Gen. Fdg. Rev. TRAN 1.75% 6/28/16 | | 11,000 | 11,038 |
| Colorado Univ. Co. Hosp. Auth. Rev. Bonds: | | | |
| Series 2015 A, 0.65%, tender 10/27/16 (a) | | 4,500 | 4,500 |
| Series 2015 C, 0.65%, tender 10/27/16 (a) | | 5,200 | 5,200 |
| | | | 20,738 |
| Connecticut - 0.5% | | | |
| Connecticut Gen. Oblig. Bonds: | | | |
| Series 2013 A, 0.52% 7/1/16 (a) | | 1,635 | 1,635 |
| Series 2014 C, 4% 6/15/16 | | 1,970 | 1,985 |
| Series 2015 B, 2% 6/15/16 | | 1,000 | 1,003 |
| Series 2015 D, 0.48% 6/15/16 (a) | | 1,000 | 1,000 |
| Series 2016 A, 3% 3/15/17 | | 2,000 | 2,046 |
| | | | 7,669 |
| District Of Columbia - 0.1% | | | |
| Metropolitan Washington Arpts. Auth. Dulles Toll Road Rev. Series 1, 0.05% 4/5/16, LOC JPMorgan Chase Bank, CP | | 800 | 800 |
| Florida - 2.0% | | | |
| Florida Board of Ed. Pub. Ed. Cap. Outlay Bonds: | | | |
| Series 2007 H, 5% 6/1/16 | | 3,280 | 3,306 |
| Series 2009 D, 5.5% 6/1/16 | | 1,500 | 1,513 |
| Florida Local Govt. Fin. Cmnty. Series 2011 A1, 0.1% 5/2/16, LOC JPMorgan Chase Bank, CP | | 2,400 | 2,400 |
| Orlando Utils. Commission Util. Sys. Rev. Bonds Series 2011 A, 0.65%, tender 10/27/16 (a) | | 10,000 | 10,000 |
| Polk County Indl. Dev. Auth. Health Sys. Rev. Bonds: | | | |
| Series 2014 A, 0.7%, tender 10/27/16 (a) | | 1,000 | 1,000 |
| Series 2014 A1, 0.65%, tender 10/27/16 (a) | | 3,800 | 3,800 |
| RBC Muni. Products, Inc. Trust Bonds Series RBC E 64, 0.53%, tender 7/1/16 (Liquidity Facility Royal Bank of Canada New York Branch) (a)(b)(d) | | 6,700 | 6,700 |
| Tampa Health Sys. Rev. Bonds Series 2012 B, 0.48%, tender 10/27/16 (a) | | 4,800 | 4,800 |
| | | | 33,519 |
| Georgia - 0.9% | | | |
| Georgia Muni. Elec. Auth. Pwr. Rev. Series B, 0.05% 4/1/16, LOC TD Banknorth, NA, CP | | 3,000 | 3,000 |
| Main Street Natural Gas, Inc. Georgia Gas Proj. Rev. Bonds: | | | |
| Series 2010 A1, 0.46%, tender 6/1/16 (Liquidity Facility Royal Bank of Canada) (a) | | 9,135 | 9,135 |
| Series 2010 A2, 0.48%, tender 8/1/16 (Liquidity Facility Royal Bank of Canada) (a) | | 2,900 | 2,900 |
| | | | 15,035 |
| Illinois - 1.2% | | | |
| Illinois Fin. Auth. Ed. Rev.: | | | |
| 0.04% 4/4/16, LOC PNC Bank NA, CP | | 1,500 | 1,500 |
| 0.08% 5/3/16, LOC PNC Bank NA, CP | | 1,500 | 1,500 |
| 0.1% 5/16/16, LOC PNC Bank NA, CP | | 1,500 | 1,500 |
| Illinois Fin. Auth. Rev. Bonds (Hosp. Sister Svcs. Proj.): | | | |
| Series 2012 H: | | | |
| 0.04% tender 4/4/16, CP mode | | 1,600 | 1,600 |
| 0.04% tender 4/4/16, CP mode | | 1,085 | 1,085 |
| 0.1% tender 5/16/16, CP mode | | 1,500 | 1,500 |
| Series 2012 I: | | | |
| 0.04% tender 4/4/16, CP mode | | 1,600 | 1,600 |
| 0.05% tender 4/4/16, CP mode | | 2,400 | 2,400 |
| 0.1% tender 5/16/16, CP mode | | 1,500 | 1,500 |
| Illinois Health Facilities Auth. Rev. Bonds (Advocate Health Care Proj.) Series 2003 A, 0.35%, tender 7/21/16 (a) | | 4,125 | 4,125 |
| Illinois Unemployment Ins. Fund Bldg. Receipts Bonds Series 2012 A, 5% 6/15/16 | | 1,465 | 1,479 |
| | | | 19,789 |
| Indiana - 0.2% | | | |
| Indiana Health & Edl. Facilities Fing. Auth. Rev. Bonds (Ascension Health Sr. Cr. Group Proj.) Series 2006 B1, 4.1%, tender 11/3/16 (a) | | 2,500 | 2,554 |
| Indianapolis Gas Util. Sys. Rev. 0.2% 4/5/16, LOC JPMorgan Chase Bank, CP | | 1,500 | 1,500 |
| | | | 4,054 |
| Maryland - 0.6% | | | |
| Baltimore County Gen. Oblig.: | | | |
| Bonds 5% 8/1/16 | | 3,500 | 3,555 |
| 0.05% 4/4/16 (Liquidity Facility Mizuho Bank Ltd.), CP | | 3,900 | 3,900 |
| 0.08% 5/2/16 (Liquidity Facility Mizuho Bank Ltd.), CP | | 3,000 | 3,000 |
| | | | 10,455 |
| Massachusetts - 0.5% | | | |
| Massachusetts Gen. Oblig. RAN Series 2015 A, 2% 4/27/16 | | 8,500 | 8,511 |
| Michigan - 1.8% | | | |
| Michigan Hosp. Fin. Auth. Rev. Bonds (Ascension Health Sr. Cr. Group Proj.) Series 2010 F: | | | |
| 0.58%, tender 10/27/16 (a) | | 11,700 | 11,700 |
| 0.58%, tender 10/27/16 (a) | | 6,490 | 6,490 |
| 0.58%, tender 10/27/16 (a) | | 7,800 | 7,799 |
| Univ. of Michigan Rev. Bonds Series 2009 B: | | | |
| 0.03% tender 4/1/16, CP mode | | 1,400 | 1,400 |
| 0.07% tender 4/12/16, CP mode | | 1,900 | 1,900 |
| | | | 29,289 |
| Minnesota - 0.9% | | | |
| Minnesota Gen. Oblig. Bonds: | | | |
| Series 2010 E, 5% 8/1/16 | | 1,675 | 1,701 |
| Series 2014 A, 5% 8/1/16 | | 4,645 | 4,718 |
| Univ. of Minnesota Gen. Oblig. Series 2007 C, 0.03% 4/1/16, CP | | 1,600 | 1,600 |
| Univ. of Minnesota Rev. Series 2005 A: | | | |
| 0.04% 4/4/16, CP | | 1,300 | 1,300 |
| 0.1% 5/2/16, CP | | 1,600 | 1,600 |
| Univ. of Minnesota Spl. Purp. Rev. Bonds Series 2015 A, 2% 8/1/16 | | 4,585 | 4,611 |
| | | | 15,530 |
| Missouri - 0.1% | | | |
| Saint Louis Gen. Fund Rev. TRAN 2% 6/1/16 | | 1,100 | 1,103 |
| Nebraska - 0.6% | | | |
| Nebraska Pub. Pwr. District Rev. Series A: | | | |
| 0.05% 4/4/16, CP | | 1,500 | 1,500 |
| 0.06% 4/6/16, CP | | 1,200 | 1,200 |
| 0.13% 4/1/16, CP | | 1,400 | 1,400 |
| 0.17% 4/12/16, CP | | 900 | 900 |
| Omaha Pub. Pwr. District Elec. Rev. Series A: | | | |
| 0.09% 4/6/16, CP | | 900 | 900 |
| 0.15% 4/1/16, CP | | 800 | 800 |
| 0.45% 4/25/16, CP | | 3,500 | 3,500 |
| | | | 10,200 |
| Nevada - 1.1% | | | |
| Clark County School District Bonds: | | | |
| Series 2007 A, 4% 6/15/16 | | 3,600 | 3,627 |
| Series 2012 A, 5% 6/15/16 | | 1,200 | 1,211 |
| Series 2014 B, 5.5% 6/15/16 | | 1,885 | 1,905 |
| Nevada Unemployment Compensation Fund Spl. Rev. Bonds Series 2013, 5% 6/1/16 | | 8,485 | 8,553 |
| Truckee Meadows Wtr. Auth. Wtr. Rev.: | | | |
| Series 2006 A, 0.11% 5/2/16, LOC Bank of Tokyo-Mitsubishi UFJ Ltd., CP | | 1,400 | 1,400 |
| Series 2006 B, 0.06% 4/6/16, LOC Bank of Tokyo-Mitsubishi UFJ Ltd., CP | | 1,000 | 1,000 |
| | | | 17,696 |
| New Jersey - 0.4% | | | |
| Hudson County Gen. Oblig. BAN Series 2015, 2% 12/16/16 | | 3,700 | 3,736 |
| Passaic County Gen. Oblig. BAN Series 2015 A, 2% 12/13/16 | | 2,700 | 2,728 |
| | | | 6,464 |
| New York - 0.8% | | | |
| Erie County Gen. Oblig. RAN Series 2015, 1.5% 6/30/16 | | 1,900 | 1,905 |
| New York City Gen. Oblig. Bonds Series 2015 C, 2% 8/1/16 | | 5,135 | 5,162 |
| New York Envir. Facilities Corp. Clean Wtr. & Drinking Wtr. Bonds (New York City Muni. Wtr. Fin. Auth. Projs.) Series 2012 A, 5% 6/15/16 | | 5,635 | 5,690 |
| | | | 12,757 |
| North Carolina - 0.4% | | | |
| Charlotte Gen. Oblig. Bonds 5% 7/1/16 | | 4,520 | 4,574 |
| Mecklenburg County Gen. Oblig. Bonds Series 2009 D, 0.65%, tender 10/27/16 (a) | | 800 | 800 |
| North Carolina Gen. Oblig. Bonds Series 2010 A, 5% 5/1/16 | | 1,000 | 1,004 |
| | | | 6,378 |
| Ohio - 0.2% | | | |
| Hamilton Ohio Elec. Rev. BAN Series 2015, 0.43% 9/27/16 (Ohio Gen. Oblig. Guaranteed) | | 900 | 900 |
| Ohio Higher Edl. Facility Commission Rev. Bonds (The Cleveland Clinic Foundation Proj.) Series 2008 B5, 0.18% tender 5/4/16, CP mode | | 1,900 | 1,900 |
| | | | 2,800 |
| Oklahoma - 0.3% | | | |
| Oklahoma City Wtr. Utils. Trust Wtr. and Swr. Rev. Series A: | | | |
| 0.04% 4/1/16, LOC State Street Bank & Trust Co., Boston, CP | | 500 | 500 |
| 0.04% 4/1/16, LOC State Street Bank & Trust Co., Boston, CP | | 1,000 | 1,000 |
| 0.11% 5/2/16, LOC State Street Bank & Trust Co., Boston, CP | | 1,000 | 1,000 |
| 0.14% 5/2/16, LOC State Street Bank & Trust Co., Boston, CP | | 500 | 500 |
| Oklahoma Dev. Fin. Auth. Health Sys. Rev. Bonds Series 2015 B, 0.75%, tender 10/27/16 (a) | | 1,800 | 1,800 |
| | | | 4,800 |
| Oregon - 0.2% | | | |
| Oregon Gen. Oblig. Bonds Series 2011 L, 5% 5/1/16 | | 1,000 | 1,004 |
| Portland Swr. Sys. Rev. Bonds Series 2015 A, 5% 6/1/16 | | 2,700 | 2,721 |
| | | | 3,725 |
| Pennsylvania - 2.5% | | | |
| Pennsylvania Econ. Dev. Fin. Auth. Unemployment Compensation Rev. Bonds Series 2012 A, 5% 7/1/16 | | 29,760 | 30,117 |
| Philadelphia Gen. Oblig. TRAN Series 2015 A, 2% 6/30/16 | | 11,600 | 11,651 |
| | | | 41,768 |
| South Carolina - 0.4% | | | |
| Anderson County School District #5 Gen. Oblig. BAN 1.5% 4/15/16 | | 1,600 | 1,601 |
| Greenville County School District Bonds 2% 6/1/16 | | 5,500 | 5,516 |
| | | | 7,117 |
| Tennessee - 0.1% | | | |
| Tennessee Gen. Oblig. Bonds Series 2009 A, 5% 5/1/16 | | 1,255 | 1,260 |
| Texas - 5.0% | | | |
| Austin Elec. Util. Sys. Rev. Series A: | | | |
| 0.05% 4/4/16, LOC Bank of Tokyo-Mitsubishi UFJ Ltd., CP | | 6,680 | 6,680 |
| 0.06% 4/4/16, LOC Bank of Tokyo-Mitsubishi UFJ Ltd., CP | | 6,200 | 6,200 |
| 0.06% 4/6/16, LOC Bank of Tokyo-Mitsubishi UFJ Ltd., CP | | 1,000 | 1,000 |
| Harris County Cultural Ed. Facilities Fin. Corp. Rev. Bonds (Texas Children's Hosp. Proj.): | | | |
| Series 2010, 5% 10/1/16 | | 1,295 | 1,324 |
| Series 2015 2, 0.6%, tender 10/27/16 (a) | | 2,900 | 2,900 |
| Harris County Gen. Oblig. Series D, 0.06% 4/7/16 (Liquidity Facility JPMorgan Chase Bank), CP | | 1,300 | 1,300 |
| Harris County Metropolitan Trans. Auth. Series A1: | | | |
| 0.06% 4/14/16 (Liquidity Facility JPMorgan Chase Bank), CP | | 2,700 | 2,700 |
| 0.17% 4/19/16 (Liquidity Facility JPMorgan Chase Bank), CP | | 2,000 | 2,000 |
| Houston Gen. Oblig. TRAN: | | | |
| Series 2015, 1% 6/30/16 | | 1,600 | 1,602 |
| 2% 6/30/16 | | 1,100 | 1,104 |
| 2.25% 6/30/16 | | 1,100 | 1,105 |
| Houston Util. Sys. Rev. Bonds 4% 5/15/16 | | 10,000 | 10,046 |
| Lewisville Independent School District Bonds Series 2012 A, 4% 8/15/16 (Permanent School Fund of Texas Guaranteed) | | 2,360 | 2,392 |
| Lower Colorado River Auth. Rev.: | | | |
| Series A: | | | |
| 0.04% 4/4/16, LOC JPMorgan Chase Bank, CP | | 2,000 | 2,000 |
| 0.1% 5/17/16, LOC JPMorgan Chase Bank, CP | | 1,300 | 1,300 |
| 0.08% 5/2/16, LOC JPMorgan Chase Bank, LOC State Street Bank & Trust Co., Boston, CP | | 1,100 | 1,100 |
| San Antonio Elec. & Gas Sys. Rev. Bonds Series 2007 B, 5% 2/1/17 | | 1,000 | 1,037 |
| Tarrant County Cultural Ed. Facilities Fin. Corp. Hosp. Rev. Bonds (Baylor Health Care Sys. Proj.): | | | |
| Series 2011 B, 0.6%, tender 10/27/16 (a) | | 8,400 | 8,400 |
| Series 2013 B, 0.6%, tender 10/27/16 (a) | | 1,800 | 1,800 |
| Texas Gen. Oblig. Bonds Series 2009 A, 5% 10/1/16 | | 4,550 | 4,653 |
| Texas Pub. Fin. Auth. Rev. Bonds Series 2014 A, 5% 7/1/16 | | 6,655 | 6,735 |
| Texas Trans. Commission State Hwy. Fund Rev. Bonds Series 2006 A, 4.5% 4/1/16 | | 2,085 | 2,085 |
| Univ. of Texas Board of Regents Sys. Rev. Series A: | | | |
| 0.12% 4/6/16 (Liquidity Facility Univ. of Texas Invt. Mgmt. Co.), CP | | 7,800 | 7,800 |
| 0.29% 5/6/16 (Liquidity Facility Univ. of Texas Invt. Mgmt. Co.), CP | | 1,200 | 1,200 |
| 0.32% 6/8/16 (Liquidity Facility Univ. of Texas Invt. Mgmt. Co.), CP | | 1,100 | 1,100 |
| Univ. of Texas Permanent Univ. Fund Rev. Series A, 0.06% 4/7/16, CP | | 1,500 | 1,500 |
| Upper Trinity Reg'l. Wtr. District 0.1% 5/16/16, LOC Bank of America NA, CP | | 1,700 | 1,700 |
| | | | 82,763 |
| Utah - 0.7% | | | |
| Intermountain Pwr. Agcy. Pwr. Supply Rev. Bonds Series 2007 A, 5% 7/1/16 | | 1,500 | 1,517 |
| Riverton Hosp. Rev. Bonds Series WF 11 35C, 0.55%, tender 5/5/16 (Liquidity Facility Wells Fargo Bank NA) (a)(b)(d) | | 5,530 | 5,530 |
| Utah Gen. Oblig. Bonds Series 2009 C, 5% 7/1/16 | | 5,000 | 5,060 |
| | | | 12,107 |
| Virginia - 0.7% | | | |
| Fairfax County Indl. Dev. Auth. Bonds (Inova Health Sys. Proj.) Series 2012 C, 0.58%, tender 9/26/16 (a) | | 5,090 | 5,090 |
| Norfolk Econ. Dev. Auth. Hosp. Facilities Rev. Bonds (Sentara Healthcare Proj.): | | | |
| Series 2010 B, 0.6%, tender 10/27/16 (a) | | 2,790 | 2,790 |
| Series 2012 A, 0.6%, tender 10/27/16 (a) | | 1,495 | 1,495 |
| Norfolk Econ. Dev. Auth. Rev. Series 1997, 0.06% 4/5/16, CP | | 2,200 | 2,200 |
| | | | 11,575 |
| Washington - 0.8% | | | |
| Energy Northwest Elec. Rev. Bonds: | | | |
| Series 2014 A, 3% 7/1/16 | | 3,240 | 3,262 |
| 5% 7/1/16 | | 4,535 | 4,589 |
| Seattle Muni. Lt. & Pwr. Rev. Bonds Series WF 11-18C, 0.55%, tender 5/12/16 (Liquidity Facility Wells Fargo Bank NA) (a)(b)(d) | | 600 | 600 |
| Washington Gen. Oblig. Bonds: | | | |
| Series 2013 E, 5% 2/1/17 | | 1,000 | 1,037 |
| Series R 2016 A, 5% 7/1/16 | | 1,185 | 1,199 |
| Series WF 11-16C, 0.55%, tender 5/19/16 (Liquidity Facility Wells Fargo Bank NA) (a)(b)(d) | | 2,500 | 2,500 |
| | | | 13,187 |
| Wisconsin - 1.1% | | | |
| Wisconsin Gen. Oblig.: | | | |
| Bonds: | | | |
| Series 2006 A, 5% 5/1/16 | | 1,770 | 1,777 |
| Series 2014 2, 4% 5/1/16 | | 2,500 | 2,508 |
| Series 2006 A, 0.18% 4/6/16 (Liquidity Facility BMO Harris Bank NA), CP | | 2,400 | 2,400 |
| Wisconsin Health & Edl. Facilities Bonds: | | | |
| Series 2013 B, 0.58%, tender 10/27/16 (a) | | 4,190 | 4,190 |
| Series 2014 B1, 0.6%, tender 10/27/16 (a) | | 2,900 | 2,900 |
| Wisconsin Trans. Rev.: | | | |
| Series 1997 A, 0.06% 4/7/16 (Liquidity Facility State Street Bank & Trust Co., Boston) (Liquidity Facility California Teachers Retirement Sys.), CP | | 1,100 | 1,100 |
| Series 2006 A, 0.06% 4/7/16 (Liquidity Facility State Street Bank & Trust Co., Boston) (Liquidity Facility California Teachers Retirement Sys.), CP | | 601 | 601 |
| Series 2013 A: | | | |
| 0.04% 4/1/16 (Liquidity Facility State Street Bank & Trust Co., Boston) (Liquidity Facility California Teachers Retirement Sys.), CP | | 1,765 | 1,765 |
| 0.07% 4/7/16 (Liquidity Facility State Street Bank & Trust Co., Boston) (Liquidity Facility California Teachers Retirement Sys.), CP | | 1,100 | 1,100 |
| | | | 18,341 |
| TOTAL OTHER MUNICIPAL DEBT | | | |
| (Cost $484,049) | | | 484,049 |
| | | Shares (000s) | Value (000s) |
|
| Investment Company - 12.3% | | | |
| Fidelity Tax-Free Cash Central Fund, 0.33% (e)(f) | | | |
| (Cost $203,155) | | 203,155 | 203,155 |
| TOTAL INVESTMENT PORTFOLIO - 97.9% | | | |
| (Cost $1,614,720) | | | 1,614,720 |
| NET OTHER ASSETS (LIABILITIES) - 2.1% | | | 34,125 |
| NET ASSETS - 100% | | | $1,648,845 |
Security Type Abbreviations
BAN – BOND ANTICIPATION NOTE
CP – COMMERCIAL PAPER
RAN – REVENUE ANTICIPATION NOTE
TAN – TAX ANTICIPATION NOTE
TRAN – TAX AND REVENUE ANTICIPATION NOTE
VRDN – VARIABLE RATE DEMAND NOTE (A debt instrument that is payable upon demand, either daily, weekly or monthly)
The date shown for securities represents the date when principal payments must be paid, taking into account any call options exercised by the issuer and any permissible maturity shortening features other than interest rate resets.
Legend
(a) Coupon rates for floating and adjustable rate securities reflect the rates in effect at period end.
(b) Provides evidence of ownership in one or more underlying municipal bonds.
(c) Security or a portion of the security purchased on a delayed delivery or when-issued basis.
(d) Restricted securities - Investment in securities not registered under the Securities Act of 1933 (excluding 144A issues). At the end of the period, the value of restricted securities (excluding 144A issues) amounted to $16,730,000 or 1.0% of net assets.
(e) Information in this report regarding holdings by state and security types does not reflect the holdings of the Fidelity Tax-Free Cash Central Fund.
(f) Affiliated fund that is available only to investment companies and other accounts managed by Fidelity Investments. The rate quoted is the annualized seven-day yield of the fund at period end. A complete unaudited listing of the fund's holdings as of its most recent quarter end is available upon request. In addition, each Fidelity Central Fund's financial statements, which are not covered by the Fund's Report of Independent Registered Public Accounting Firm, are available on the SEC's website or upon request.
Additional information on each restricted holding is as follows:
| Security | Acquisition Date | Cost (000s) |
| Los Angeles Hbr. Dept. Rev. Bonds Series WF 10 40C, 0.55%, tender 6/2/16 (Liquidity Facility Wells Fargo Bank NA) | 3/22/12 | $1,400 |
| RBC Muni. Products, Inc. Trust Bonds Series RBC E 64, 0.53%, tender 7/1/16 (Liquidity Facility Royal Bank of Canada New York Branch) | 3/31/16 | $6,700 |
| Riverton Hosp. Rev. Bonds Series WF 11 35C, 0.55%, tender 5/5/16 (Liquidity Facility Wells Fargo Bank NA) | 3/24/11 | $5,530 |
| Seattle Muni. Lt. & Pwr. Rev. Bonds Series WF 11-18C, 0.55%, tender 5/12/16 (Liquidity Facility Wells Fargo Bank NA) | 2/11/16 | $600 |
| Washington Gen. Oblig. Bonds Series WF 11-16C, 0.55%, tender 5/19/16 (Liquidity Facility Wells Fargo Bank NA) | 5/9/13 - 2/18/16 | $2,500 |
Affiliated Central Funds
Information regarding fiscal year to date income earned by the Fund from investments in Fidelity Central Funds is as follows:
| Fund | Income earned |
| | (Amounts in thousands) |
| Fidelity Tax-Free Cash Central Fund | $57 |
| Total | $57 |
Investment Valuation
All investments are categorized as Level 2 under the Fair Value Hierarchy. The inputs or methodology used for valuing securities may not be an indication of the risk associated with investing in those securities. For more information on valuation inputs please refer to the Investment Valuation section in the accompanying Notes to Financial Statements.
See accompanying notes which are an integral part of the financial statements.
Tax-Exempt Portfolio
Financial Statements
Statement of Assets and Liabilities
| Amounts in thousands (except per-share amounts) | | March 31, 2016 |
| Assets | | |
Investment in securities, at value — See accompanying schedule:
Unaffiliated issuers (cost $1,411,565) | $1,411,565 | |
| Fidelity Central Funds (cost $203,155) | 203,155 | |
| Total Investments (cost $1,614,720) | | $1,614,720 |
| Cash | | 299 |
| Receivable for investments sold | | 54,820 |
| Receivable for fund shares sold | | 22 |
| Interest receivable | | 3,397 |
| Distributions receivable from Fidelity Central Funds | | 23 |
| Prepaid expenses | | 3 |
| Receivable from investment adviser for expense reductions | | 61 |
| Other receivables | | 48 |
| Total assets | | 1,673,393 |
| Liabilities | | |
| Payable for investments purchased | | |
| Regular delivery | $15,015 | |
| Delayed delivery | 7,047 | |
| Payable for fund shares redeemed | 2,121 | |
| Distributions payable | 32 | |
| Accrued management fee | 221 | |
| Other affiliated payables | 21 | |
| Other payables and accrued expenses | 91 | |
| Total liabilities | | 24,548 |
| Net Assets | | $1,648,845 |
| Net Assets consist of: | | |
| Paid in capital | | $1,648,845 |
| Net Assets | | $1,648,845 |
| Class I: | | |
| Net Asset Value, offering price and redemption price per share ($1,428,873 ÷ 1,426,916 shares) | | $1.00 |
| Class II: | | |
| Net Asset Value, offering price and redemption price per share ($761 ÷ 759 shares) | | $1.00 |
| Class III: | | |
| Net Asset Value, offering price and redemption price per share ($215,369 ÷ 215,085 shares) | | $1.00 |
| Select Class: | | |
| Net Asset Value, offering price and redemption price per share ($3,842 ÷ 3,836 shares) | | $1.00 |
See accompanying notes which are an integral part of the financial statements.
Statement of Operations
| Amounts in thousands | | Year ended March 31, 2016 |
| Investment Income | | |
| Interest | | $1,545 |
| Income from Fidelity Central Funds | | 57 |
| Total income | | 1,602 |
| Expenses | | |
| Management fee | $3,405 | |
| Transfer agent fees | 1,460 | |
| Distribution and service plan fees | 762 | |
| Accounting fees and expenses | 229 | |
| Custodian fees and expenses | 22 | |
| Independent trustees' compensation | 11 | |
| Registration fees | 106 | |
| Audit | 45 | |
| Legal | 7 | |
| Miscellaneous | 24 | |
| Total expenses before reductions | 6,071 | |
| Expense reductions | (4,756) | 1,315 |
| Net investment income (loss) | | 287 |
| Realized and Unrealized Gain (Loss) | | |
| Net realized gain (loss) on: | | |
| Investment securities: | | |
| Unaffiliated issuers | 443 | |
| Capital gain distributions from underlying funds | 16 | |
| Total net realized gain (loss) | | 459 |
| Net increase in net assets resulting from operations | | $746 |
See accompanying notes which are an integral part of the financial statements.
Statement of Changes in Net Assets
| Amounts in thousands | Year ended March 31, 2016 | Year ended March 31, 2015 |
| Increase (Decrease) in Net Assets | | |
| Operations | | |
| Net investment income (loss) | $287 | $234 |
| Net realized gain (loss) | 459 | 1,005 |
| Net increase in net assets resulting from operations | 746 | 1,239 |
| Distributions to shareholders from net investment income | (287) | (234) |
| Distributions to shareholders from net realized gain | (1,814) | (452) |
| Total distributions | (2,101) | (686) |
| Share transactions - net increase (decrease) | (817,108) | 117,947 |
| Total increase (decrease) in net assets | (818,463) | 118,500 |
| Net Assets | | |
| Beginning of period | 2,467,308 | 2,348,808 |
| End of period | $1,648,845 | $2,467,308 |
See accompanying notes which are an integral part of the financial statements.
Financial Highlights — Tax-Exempt Portfolio Class I
| Years ended March 31, | 2016 | 2015 | 2014 | 2013 | 2012 |
| Selected Per–Share Data | | | | | |
| Net asset value, beginning of period | $1.00 | $1.00 | $1.00 | $1.00 | $1.00 |
| Income from Investment Operations | | | | | |
| Net investment income (loss)A | – | – | – | – | – |
| Net realized and unrealized gain (loss) | .001 | –A | –A | –A | –A |
| Total from investment operations | .001 | –A | –A | –A | –A |
| Distributions from net investment incomeA | – | – | – | – | – |
| Distributions from net realized gain | (.001) | –A | –A | – | – |
| Total distributions | (.001) | –A | –A | –A | –A |
| Net asset value, end of period | $1.00 | $1.00 | $1.00 | $1.00 | $1.00 |
| Total ReturnB | .08% | .03% | .02% | .01% | .01% |
| Ratios to Average Net AssetsC,D | | | | | |
| Expenses before reductions | .22% | .22% | .22% | .22% | .22% |
| Expenses net of fee waivers, if any | .05% | .06% | .11% | .18% | .16% |
| Expenses net of all reductions | .05% | .06% | .10% | .17% | .15% |
| Net investment income (loss) | .01% | .01% | .01% | .01% | .01% |
| Supplemental Data | | | | | |
| Net assets, end of period (in millions) | $1,429 | $2,166 | $2,055 | $2,342 | $3,160 |
A Amount represents less than $.0005 per share.
B Total returns would have been lower if certain expenses had not been reduced during the applicable periods shown.
C Fees and expenses of any underlying Fidelity Central Funds are not included in the Fund's expense ratio. The Fund indirectly bears its proportionate share of the expenses of any underlying Fidelity Central Funds.
D Expense ratios reflect operating expenses of the class. Expenses before reductions do not reflect amounts reimbursed or waived or reductions from expense offset arrangements and do not represent the amount paid by the class during periods when reimbursements, waivers or reductions occur. Expenses net of fee waivers reflect expenses after reimbursement and waivers but prior to reductions from expense offset arrangements. Expenses net of all reductions represent the net expenses paid by the class.
See accompanying notes which are an integral part of the financial statements.
Financial Highlights — Tax-Exempt Portfolio Class II
| Years ended March 31, | 2016 | 2015 | 2014 | 2013 | 2012 |
| Selected Per–Share Data | | | | | |
| Net asset value, beginning of period | $1.00 | $1.00 | $1.00 | $1.00 | $1.00 |
| Income from Investment Operations | | | | | |
| Net investment income (loss)A | – | – | – | – | – |
| Net realized and unrealized gain (loss) | .001 | –A | –A | –A | –A |
| Total from investment operations | .001 | –A | –A | –A | –A |
| Distributions from net investment incomeA | – | – | – | – | – |
| Distributions from net realized gain | (.001) | –A | –A | – | – |
| Total distributions | (.001) | –A | –A | –A | –A |
| Net asset value, end of period | $1.00 | $1.00 | $1.00 | $1.00 | $1.00 |
| Total ReturnB | .08% | .03% | .02% | .01% | .01% |
| Ratios to Average Net AssetsC,D | | | | | |
| Expenses before reductions | .37% | .37% | .37% | .37% | .37% |
| Expenses net of fee waivers, if any | .06% | .06% | .11% | .17% | .15% |
| Expenses net of all reductions | .05% | .06% | .10% | .17% | .15% |
| Net investment income (loss) | .01% | .01% | .01% | .01% | .01% |
| Supplemental Data | | | | | |
| Net assets, end of period (in millions) | $1 | $12 | $12 | $12 | $15 |
A Amount represents less than $.0005 per share.
B Total returns would have been lower if certain expenses had not been reduced during the applicable periods shown.
C Fees and expenses of any underlying Fidelity Central Funds are not included in the Fund's expense ratio. The Fund indirectly bears its proportionate share of the expenses of any underlying Fidelity Central Funds.
D Expense ratios reflect operating expenses of the class. Expenses before reductions do not reflect amounts reimbursed or waived or reductions from expense offset arrangements and do not represent the amount paid by the class during periods when reimbursements, waivers or reductions occur. Expenses net of fee waivers reflect expenses after reimbursement and waivers but prior to reductions from expense offset arrangements. Expenses net of all reductions represent the net expenses paid by the class.
See accompanying notes which are an integral part of the financial statements.
Financial Highlights — Tax-Exempt Portfolio Class III
| Years ended March 31, | 2016 | 2015 | 2014 | 2013 | 2012 |
| Selected Per–Share Data | | | | | |
| Net asset value, beginning of period | $1.00 | $1.00 | $1.00 | $1.00 | $1.00 |
| Income from Investment Operations | | | | | |
| Net investment income (loss) A | – | – | – | – | – |
| Net realized and unrealized gain (loss) | .001 | –A | –A | –A | –A |
| Total from investment operations | .001 | –A | –A | –A | –A |
| Distributions from net investment income A | – | – | – | – | – |
| Distributions from net realized gain | (.001) | –A | –A | – | – |
| Total distributions | (.001) | –A | –A | –A | –A |
| Net asset value, end of period | $1.00 | $1.00 | $1.00 | $1.00 | $1.00 |
| Total ReturnB | .08% | .03% | .02% | .01% | .01% |
| Ratios to Average Net AssetsC,D | | | | | |
| Expenses before reductions | .47% | .47% | .47% | .47% | .47% |
| Expenses net of fee waivers, if any | .06% | .06% | .11% | .17% | .16% |
| Expenses net of all reductions | .06% | .06% | .10% | .17% | .16% |
| Net investment income (loss) | .01% | .01% | .01% | .01% | .01% |
| Supplemental Data | | | | | |
| Net assets, end of period (in millions) | $215 | $285 | $275 | $323 | $240 |
A Amount represents less than $.0005 per share.
B Total returns would have been lower if certain expenses had not been reduced during the applicable periods shown.
C Fees and expenses of any underlying Fidelity Central Funds are not included in the Fund's expense ratio. The Fund indirectly bears its proportionate share of the expenses of any underlying Fidelity Central Funds.
D Expense ratios reflect operating expenses of the class. Expenses before reductions do not reflect amounts reimbursed or waived or reductions from expense offset arrangements and do not represent the amount paid by the class during periods when reimbursements, waivers or reductions occur. Expenses net of fee waivers reflect expenses after reimbursement and waivers but prior to reductions from expense offset arrangements. Expenses net of all reductions represent the net expenses paid by the class.
See accompanying notes which are an integral part of the financial statements.
Financial Highlights — Tax-Exempt Portfolio Select Class
| Years ended March 31, | 2016 | 2015 | 2014 | 2013 | 2012 |
| Selected Per–Share Data | | | | | |
| Net asset value, beginning of period | $1.00 | $1.00 | $1.00 | $1.00 | $1.00 |
| Income from Investment Operations | | | | | |
| Net investment income (loss)A | – | – | – | – | – |
| Net realized and unrealized gain (loss) | .001 | –A | –A | –A | –A |
| Total from investment operations | .001 | –A | –A | –A | –A |
| Distributions from net investment incomeA | – | – | – | – | – |
| Distributions from net realized gain | (.001) | –A | –A | – | – |
| Total distributions | (.001) | –A | –A | –A | –A |
| Net asset value, end of period | $1.00 | $1.00 | $1.00 | $1.00 | $1.00 |
| Total ReturnB | .08% | .03% | .02% | .01% | .01% |
| Ratios to Average Net AssetsC,D | | | | | |
| Expenses before reductions | .27% | .27% | .27% | .27% | .27% |
| Expenses net of fee waivers, if any | .06% | .06% | .11% | .18% | .17% |
| Expenses net of all reductions | .06% | .06% | .11% | .18% | .17% |
| Net investment income (loss) | .01% | .01% | .01% | .01% | .01% |
| Supplemental Data | | | | | |
| Net assets, end of period (in millions) | $4 | $4 | $7 | $8 | $15 |
A Amount represents less than $.0005 per share.
B Total returns would have been lower if certain expenses had not been reduced during the applicable periods shown.
C Fees and expenses of any underlying Fidelity Central Funds are not included in the Fund's expense ratio. The Fund indirectly bears its proportionate share of the expenses of any underlying Fidelity Central Funds.
D Expense ratios reflect operating expenses of the class. Expenses before reductions do not reflect amounts reimbursed or waived or reductions from expense offset arrangements and do not represent the amount paid by the class during periods when reimbursements, waivers or reductions occur. Expenses net of fee waivers reflect expenses after reimbursement and waivers but prior to reductions from expense offset arrangements. Expenses net of all reductions represent the net expenses paid by the class.
See accompanying notes which are an integral part of the financial statements.
Government Portfolio
Investment Summary/Performance (Unaudited)
Effective Maturity Diversification
| Days | % of fund's investments 3/31/16 | % of fund's investments 9/30/15 | % of fund's investments 3/31/15 |
| 1 - 7 | 36.0 | 52.5 | 45.1 |
| 8 - 30 | 22.3 | 17.9 | 16.8 |
| 31 - 60 | 9.1 | 8.8 | 8.9 |
| 61 - 90 | 16.4 | 5.8 | 6.2 |
| 91 - 180 | 14.2 | 13.7 | 17.6 |
| > 180 | 2.0 | 1.3 | 5.4 |
Effective maturity is determined in accordance with the requirements of Rule 2a-7 under the Investment Company Act of 1940.
Weighted Average Maturity
| | 3/31/16 | 9/30/15 | 3/31/15 |
| Government Portfolio | 45 Days | 34 Days | 49 Days |
| All Taxable Money Market Funds Average(a) | 38 Days | 35 Days | 43 Days |
(a) Source: iMoneyNet, Inc.
This is a weighted average of all the maturities of the securities held in a fund. Weighted Average Maturity (WAM) can be used as a measure of sensitivity to interest rate changes and market changes. Generally, the longer the maturity, the greater the sensitivity to such changes. WAM is based on the dollar-weighted average length of time until principal payments must be paid. Depending on the types of securities held in a fund, certain maturity shortening devices (e.g., demand features, interest rate resets, and call options) may be taken into account when calculating the WAM.
Weighted Average Life
| | 3/31/16 | 9/30/15 | 3/31/15 |
| Government Portfolio | 95 Days | 89 Days | 103 Days |
Weighted Average Life (WAL) is the weighted average of the life of the securities held in a fund or portfolio and can be used as a measure of sensitivity to changes in liquidity and/or credit risk. Generally, the higher the value, the greater the sensitivity. WAL is based on the dollar-weighted average length of time until principal payments must be paid, taking into account any call options exercised by the issuer and any permissible maturity shortening features other than interest rate resets. The difference between WAM and WAL is that WAM takes into account interest rate resets and WAL does not. WAL for money market funds is not the same as WAL of a mortgage- or asset-backed security.
Asset Allocation (% of fund's net assets)
| As of March 31, 2016 |
| | Treasury Debt | 24.7% |
| | Government Agency Debt | 47.9% |
| | Repurchase Agreements | 28.9% |
| | Net Other Assets (Liabilities)* | (1.5)% |

* Net Other Assets (Liabilities) are not included in the pie chart
| As of September 30, 2015 |
| | Treasury Debt | 3.3% |
| | Government Agency Debt | 46.9% |
| | Repurchase Agreements | 50.9% |
| | Net Other Assets (Liabilities)* | (1.1)% |

* Net Other Assets (Liabilities) are not included in the pie chart
Current And Historical 7-Day Yields
| | 3/31/16 | 12/31/15 | 9/30/15 | 6/30/15 | 3/31/15 |
| Class I | 0.23% | 0.12% | 0.01% | 0.01% | 0.01% |
| Class II | 0.08% | 0.01% | 0.01% | 0.01% | 0.01% |
| Class III | 0.01% | 0.01% | 0.01% | 0.01% | 0.01% |
| Select Class | 0.18% | 0.07% | 0.01% | 0.01% | 0.01% |
| Institutional Class | 0.27% | 0.16% | 0.02% | 0.01% | 0.01% |
Yield refers to the income paid by the Fund over a given period. Yields for money market funds are usually for seven-day periods, as they are here, though they are expressed as annual percentage rates. Past performance is no guarantee of future results. Yield will vary and it's possible to lose money investing in the Fund. A portion of the Fund's expenses was reimbursed and/or waived. Absent such reimbursements and/or waivers the yield for the period ending March 31, 2016, the most recent period shown in the table, would have been 0.20% for Class I, 0.05% for Class II, -0.04% for Class III, 0.15% for Select Class and 0.23% for Institutional Class.
Government Portfolio
Investments March 31, 2016
Showing Percentage of Net Assets
| Treasury Debt - 24.7% | | | | |
| | | Yield(a) | Principal Amount (000s) | Value (000s) |
| U.S. Treasury Inflation Protected Obligations - 2.8% | | | | |
| U.S. Treasury Notes | | | | |
| 4/15/16 | | 0.35 to 0.37% | $1,202,547 | $1,203,120 |
| U.S. Treasury Obligations - 21.9% | | | | |
| U.S. Treasury Bills | | | | |
| 5/5/16 to 9/15/16 | | 0.29 to 0.51 | 4,608,000 | 4,602,533 |
| U.S. Treasury Bonds | | | | |
| 5/15/16 | | 0.29 to 0.39 | 207,000 | 208,723 |
| U.S. Treasury Notes | | | | |
| 4/15/16 to 9/30/16 | | 0.25 to 0.56 (b) | 4,836,000 | 4,846,166 |
| | | | | 9,657,422 |
| TOTAL TREASURY DEBT | | | | |
| (Cost $10,860,542) | | | | 10,860,542 |
|
| Government Agency Debt - 47.9% | | | | |
| Federal Agencies - 47.9% | | | | |
| Fannie Mae | | | | |
| 6/1/16 to 9/15/16 | | 0.40 to 0.54 | 325,696 | 327,144 |
| Federal Farm Credit Bank | | | | |
| 4/6/16 to 6/9/17 | | 0.40 to 0.57 (b)(c) | 2,805,900 | 2,805,765 |
| Federal Home Loan Bank | | | | |
| 4/4/16 to 4/5/17 | | 0.26 to 0.60 (b) | 14,771,890 | 14,769,255 |
| Freddie Mac | | | | |
| 4/7/16 to 4/20/17 | | 0.33 to 0.75 (b) | 3,201,454 | 3,199,516 |
| TOTAL GOVERNMENT AGENCY DEBT | | | | |
| (Cost $21,101,680) | | | | 21,101,680 |
| Government Agency Repurchase Agreement - 12.0% | | | |
| | | Maturity Amount (000s) | Value (000s) |
| In a joint trading account: | | | |
| at 0.31% dated 3/31/16 due 4/1/16 (Collateralized by U.S. Government Obligations) # | | $2,454,350 | $2,454,329 |
| at 0.31% dated 3/31/16 due 4/1/16 (Collateralized by U.S. Government Obligations) # | | 467,864 | 467,860 |
| With: | | | |
| Citibank NA at: | | | |
| 0.33%, dated 3/29/16 due 4/5/16 (Collateralized by U.S. Treasury Obligations valued at $46,166,051, 0.13% - 3.13%, 7/31/17 - 5/15/45) | | 45,003 | 45,000 |
| 0.34%, dated 3/29/16 due 4/5/16 (Collateralized by U.S. Treasury Obligations valued at $277,447,904, 0.00% - 8.00%, 3/19/18 - 11/01/45) | | 272,018 | 272,000 |
| ING Financial Markets LLC at: | | | |
| 0.43%, dated: | | | |
| 2/17/16 due 5/5/16 (Collateralized by U.S. Government Obligations valued at $38,781,091, 3.50%, 12/01/42) | | 38,041 | 38,000 |
| 2/23/16 due 4/1/16 (Collateralized by U.S. Government Obligations valued at $23,472,090, 4.00%, 11/01/31) | | 23,010 | 23,000 |
| 2/24/16 due 5/5/16 (Collateralized by U.S. Government Obligations valued at $38,776,832, 3.50%, 12/01/42) | | 38,041 | 38,000 |
| 3/8/16 due 5/5/16 (Collateralized by U.S. Government Obligations valued at $68,361,086, 3.50% - 4.50%, 8/01/40 - 11/01/44) | | 67,072 | 67,000 |
| 0.44%, dated: | | | |
| 3/10/16 due 5/5/16-: | | | |
| (Collateralized by U.S. Government Obligations valued at $69,380,412, 3.50% - 5.50%, 5/01/40 - 6/01/42) | | 68,074 | 68,000 |
| (Collateralized by U.S. Government Obligations valued at $52,034,427, 3.50%, 8/01/42 - 12/01/42) | | 51,056 | 51,000 |
| 3/11/16 due 5/5/16 (Collateralized by U.S. Government Obligations valued at $64,278,306, 3.50%, 6/01/42 - 8/01/45) | | 63,069 | 63,000 |
| 3/14/16 due 5/5/16 (Collateralized by U.S. Government Obligations valued at $88,762,221, 3.00% - 4.00%, 1/01/29 - 4/01/44) | | 87,094 | 87,000 |
| 3/15/16 due 5/5/16 (Collateralized by U.S. Government Obligations valued at $52,032,252, 3.50%, 8/01/42 - 9/01/42) | | 51,056 | 51,000 |
| 3/16/16 due 5/5/16 (Collateralized by U.S. Government Obligations valued at $53,053,577, 3.50% - 4.50%, 11/01/26 - 9/01/42) | | 52,057 | 52,000 |
| Merrill Lynch, Pierce, Fenner & Smith at 0.36%, dated 2/18/16 due 4/7/16 (Collateralized by U.S. Government Obligations valued at $231,639,562, 2.29% - 4.00%, 12/20/26 - 3/20/65) | | 227,136 | 227,000 |
| Mizuho Securities U.S.A., Inc. at 0.4%, dated 2/10/16 due 4/7/16 (Collateralized by U.S. Treasury Obligations valued at $73,481,628, 2.00%, 10/31/21) | | 72,071 | 72,000 |
| RBC Capital Markets Corp. at: | | | |
| 0.36%, dated: | | | |
| 2/9/16 due 4/7/16 (Collateralized by U.S. Government Obligations valued at $73,478,189, 2.02% - 5.50%, 9/01/26 - 3/01/46) | | 72,045 | 72,000 |
| 2/10/16 due 4/7/16 (Collateralized by U.S. Government Obligations valued at $73,477,454, 2.50% - 4.50%, 4/01/27 - 3/01/46) | | 72,047 | 72,000 |
| 2/11/16 due 4/7/16 (Collateralized by U.S. Government Obligations valued at $73,476,720, 2.09% - 5.00%, 5/01/19 - 3/01/46) | | 72,048 | 72,000 |
| 3/11/16 due 4/7/16 (Collateralized by U.S. Government Obligations valued at $70,399,024, 1.50% - 6.08%, 4/01/27 - 3/01/46) | | 69,021 | 69,000 |
| 0.38%, dated: | | | |
| 3/2/16 due 4/7/16 (Collateralized by U.S. Government Obligations valued at $57,168,910, 0.94% - 8.50%, 9/25/20 - 3/01/46) | | 56,036 | 56,000 |
| 3/3/16 due 4/7/16 (Collateralized by U.S. Government Obligations valued at $121,475,074, 0.94% - 6.00%, 12/01/19 - 3/01/46) | | 119,078 | 119,000 |
| 0.39%, dated: | | | |
| 2/16/16 due 4/7/16-: | | | |
| (Collateralized by U.S. Government Obligations valued at $74,496,300, 2.27% - 5.00%, 4/01/27 - 3/01/46) | | 73,071 | 73,000 |
| (Collateralized by U.S. Government Obligations valued at $74,626,977, 1.88% - 5.00%, 11/15/26 - 4/01/46) | | 73,071 | 73,000 |
| 2/17/16 due 4/7/16 (Collateralized by U.S. Government Obligations valued at $77,577,639, 2.00% - 8.50%, 9/25/21 - 3/01/46) | | 76,074 | 76,000 |
| 2/18/16 due 4/7/16 (Collateralized by U.S. Government Obligations valued at $40,819,805, 2.50% - 5.00%, 6/01/28 - 3/01/46) | | 40,041 | 40,000 |
| Wells Fargo Securities, LLC at: | | | |
| 0.34%, dated: | | | |
| 3/29/16 due 4/5/16 (Collateralized by U.S. Government Obligations valued at $280,167,939, 0.74% - 3.00%, 3/15/43 - 3/25/46) | | 272,018 | 272,000 |
| 3/31/16 due 4/7/16 (Collateralized by U.S. Government Obligations valued at $46,350,438, 0.78% - 3.50%, 2/15/33 - 3/25/46) | | 45,003 | 45,000 |
| 0.45%, dated: | | | |
| 1/6/16 due 4/6/16 (Collateralized by U.S. Government Obligations valued at $43,907,150, 4.00%, 10/01/45 - 2/01/46) | | 43,049 | 43,000 |
| 1/7/16 due 4/7/16 (Collateralized by U.S. Government Obligations valued at $95,981,873, 3.50% - 4.50%, 2/01/31 - 4/01/46) | | 94,107 | 94,000 |
| 1/11/16 due 4/11/16 (Collateralized by U.S. Government Obligations valued at $28,588,917, 4.00%, 3/01/46) | | 28,032 | 28,000 |
| TOTAL GOVERNMENT AGENCY REPURCHASE AGREEMENT | | | |
| (Cost $5,280,189) | | | 5,280,189 |
|
| Treasury Repurchase Agreement - 16.9% | | | |
| With: | | | |
| Federal Reserve Bank of New York at 0.25%, dated 3/31/16 due 4/1/16 (Collateralized by U.S. Treasury Obligations valued at $5,471,038,081, 1.38% - 8.13%, 5/31/20 - 8/15/29) | | 5,471,038 | 5,471,000 |
| Mizuho Securities U.S.A., Inc. at: | | | |
| 0.31%, dated 3/30/16 due 4/6/16 (Collateralized by U.S. Treasury Obligations valued at $114,634,459, 2.25%, 11/15/24) | | 113,007 | 113,000 |
| 0.32%, dated 3/31/16 due 4/1/16 (Collateralized by U.S. Treasury Obligations valued at $164,280,830, 0.63% - 1.63%, 10/15/16 - 3/31/19) | | 161,001 | 161,000 |
| Prudential Insurance Co. of America at 0.3%, dated 3/31/16 due 4/1/16 (Collateralized by U.S. Treasury Obligations valued at $431,911,148, 1.00% - 8.13%, 7/31/19 - 5/15/25) | | 423,425 | 423,422 |
| Royal Bank of Canada at 0.32%, dated 3/31/16 due 4/1/16: | | | |
| (Collateralized by U.S. Treasury Obligations valued at $527,476,474, 2.88%, 8/15/45) | | 512,005 | 512,000 |
| (Collateralized by U.S. Treasury Obligations valued at $19,577,256, 3.63%, 8/15/43) | | 19,000 | 19,000 |
| Sumitomo Mitsui Trust Bank Ltd. at: | | | |
| 0.38%, dated: | | | |
| 3/8/16 due 4/7/16 (Collateralized by U.S. Treasury Obligations valued at $142,900,478, 3.00%, 2/28/17) | | 140,438 | 140,387 |
| 3/18/16 due 4/7/16 (Collateralized by U.S. Treasury Obligations valued at $151,493,615, 2.13%, 8/31/20) | | 148,692 | 148,637 |
| 0.39%, dated: | | | |
| 3/22/16 due 4/7/16 (Collateralized by U.S. Treasury Obligations valued at $156,903,459, 2.63% - 3.75%, 11/15/18 - 8/15/20) | | 154,699 | 154,640 |
| 3/28/16 due 4/7/16 (Collateralized by U.S. Treasury Obligations valued at $154,192,377, 0.50% - 3.25%, 6/15/16 - 3/31/17) | | 151,416 | 151,359 |
| 3/29/16 due 4/7/16 (Collateralized by U.S. Treasury Obligations valued at $159,946,550, 3.75%, 11/15/18) | | 158,760 | 158,709 |
| TOTAL TREASURY REPURCHASE AGREEMENT | | | |
| (Cost $7,453,154) | | | 7,453,154 |
| TOTAL INVESTMENT PORTFOLIO - 101.5% | | | |
| (Cost $44,695,565) | | | 44,695,565 |
| NET OTHER ASSETS (LIABILITIES) - (1.5)% | | | (639,823) |
| NET ASSETS - 100% | | | $44,055,742 |
The date shown for securities represents the date when principal payments must be paid, taking into account any call options exercised by the issuer and any permissible maturity shortening features other than interest rate resets.
Legend
(a) Yield represents either the annualized yield at the date of purchase, or the stated coupon rate, or, for floating and adjustable rate securities, the rate at period end.
(b) Coupon rates for floating and adjustable rate securities reflect the rates in effect at period end.
(c) Security or a portion of the security purchased on a delayed delivery or when-issued basis.
Investment Valuation
All investments are categorized as Level 2 under the Fair Value Hierarchy. The inputs or methodology used for valuing securities may not be an indication of the risk associated with investing in those securities. For more information on valuation inputs please refer to the Investment Valuation section in the accompanying Notes to Financial Statements.
Other Information
# Additional information on each counterparty to the repurchase agreement is as follows:
| Repurchase Agreement / Counterparty | Value (000s) |
| $2,454,329,000 due 4/01/16 at 0.31% | |
| BNP Paribas Securities Corp. | $430,011 |
| Bank of America NA | 506,877 |
| Citibank NA | 87,778 |
| Credit Agricole CIB New York Branch | 146,297 |
| HSBC Securities (USA), Inc. | 203,920 |
| ING Financial Markets LLC | 24,670 |
| J.P. Morgan Securities, Inc. | 116,751 |
| Mizuho Securities USA, Inc. | 61,961 |
| Societe Generale | 194,776 |
| Wells Fargo Securities LLC | 681,288 |
| | $2,454,329 |
| $467,860,000 due 4/01/16 at 0.31% | |
| Bank of Nova Scotia | 8,568 |
| Citibank NA | 60,454 |
| HSBC Securities (USA), Inc. | 116,712 |
| J.P. Morgan Securities, Inc. | 80,605 |
| Merrill Lynch, Pierce, Fenner & Smith, Inc. | 56,431 |
| Wells Fargo Securities LLC | 145,090 |
| | $467,860 |
See accompanying notes which are an integral part of the financial statements.
Government Portfolio
Financial Statements
Statement of Assets and Liabilities
| Amounts in thousands (except per-share amounts) | | March 31, 2016 |
| Assets | | |
Investment in securities, at value (including repurchase agreements of $12,733,343) — See accompanying schedule:
Unaffiliated issuers (cost $44,695,565) | | $44,695,565 |
| Receivable for fund shares sold | | 400,829 |
| Interest receivable | | 33,887 |
| Prepaid expenses | | 24 |
| Receivable from investment adviser for expense reductions | | 977 |
| Other receivables | | 393 |
| Total assets | | 45,131,675 |
| Liabilities | | |
| Payable for investments purchased | | |
| Regular delivery | $857,656 | |
| Delayed delivery | 185,990 | |
| Payable for fund shares redeemed | 21,426 | |
| Distributions payable | 3,390 | |
| Accrued management fee | 4,690 | |
| Distribution and service plan fees payable | 411 | |
| Other affiliated payables | 1,789 | |
| Other payables and accrued expenses | 581 | |
| Total liabilities | | 1,075,933 |
| Net Assets | | $44,055,742 |
| Net Assets consist of: | | |
| Paid in capital | | $44,056,943 |
| Distributions in excess of net investment income | | (397) |
| Accumulated undistributed net realized gain (loss) on investments | | (804) |
| Net Assets | | $44,055,742 |
| Class I: | | |
| Net Asset Value, offering price and redemption price per share ($22,046,743 ÷ 22,037,765 shares) | | $1.00 |
| Class II: | | |
| Net Asset Value, offering price and redemption price per share ($484,949 ÷ 485,011 shares) | | $1.00 |
| Class III: | | |
| Net Asset Value, offering price and redemption price per share ($1,957,424 ÷ 1,956,221 shares) | | $1.00 |
| Select Class: | | |
| Net Asset Value, offering price and redemption price per share ($285,911 ÷ 285,794 shares) | | $1.00 |
| Institutional Class: | | |
| Net Asset Value, offering price and redemption price per share ($19,280,715 ÷ 19,280,243 shares) | | $1.00 |
See accompanying notes which are an integral part of the financial statements.
Statement of Operations
| Amounts in thousands | | Year ended March 31, 2016 |
| Investment Income | | |
| Interest | | $65,708 |
| Expenses | | |
| Management fee | $38,650 | |
| Transfer agent fees | 15,346 | |
| Distribution and service plan fees | 5,463 | |
| Accounting fees and expenses | 1,476 | |
| Custodian fees and expenses | 136 | |
| Independent trustees' compensation | 113 | |
| Registration fees | 343 | |
| Audit | 69 | |
| Legal | 56 | |
| Interest | 1 | |
| Miscellaneous | 246 | |
| Total expenses before reductions | 61,899 | |
| Expense reductions | (17,872) | 44,027 |
| Net investment income (loss) | | 21,681 |
| Realized and Unrealized Gain (Loss) | | |
| Net realized gain (loss) on: | | |
| Investment securities: | | |
| Unaffiliated issuers | | 145 |
| Total net realized gain (loss) | | 145 |
| Net increase in net assets resulting from operations | | $21,826 |
See accompanying notes which are an integral part of the financial statements.
Statement of Changes in Net Assets
| Amounts in thousands | Year ended March 31, 2016 | Year ended March 31, 2015 |
| Increase (Decrease) in Net Assets | | |
| Operations | | |
| Net investment income (loss) | $21,681 | $1,659 |
| Net realized gain (loss) | 145 | 241 |
| Net increase in net assets resulting from operations | 21,826 | 1,900 |
| Distributions to shareholders from net investment income | (20,503) | (2,610) |
| Share transactions - net increase (decrease) | 19,868,899 | (1,383,243) |
| Total increase (decrease) in net assets | 19,870,222 | (1,383,953) |
| Net Assets | | |
| Beginning of period | 24,185,520 | 25,569,473 |
| End of period (including distributions in excess of net investment income of $397 and distributions in excess of net investment income of $624, respectively) | $44,055,742 | $24,185,520 |
See accompanying notes which are an integral part of the financial statements.
Financial Highlights — Government Portfolio Class I
| Years ended March 31, | 2016 | 2015 | 2014 | 2013 | 2012 |
| Selected Per–Share Data | | | | | |
| Net asset value, beginning of period | $1.00 | $1.00 | $1.00 | $1.00 | $1.00 |
| Income from Investment Operations | | | | | |
| Net investment income (loss) | .001 | –A | –A | –A | –A |
| Net realized and unrealized gain (loss)A | – | – | – | – | – |
| Total from investment operations | .001 | –A | –A | –A | –A |
| Distributions from net investment income | (.001) | –A | –A | –A | –A |
| Total distributions | (.001) | –A | –A | –A | –A |
| Net asset value, end of period | $1.00 | $1.00 | $1.00 | $1.00 | $1.00 |
| Total ReturnB | .06% | .01% | .01% | .01% | .01% |
| Ratios to Average Net AssetsC | | | | | |
| Expenses before reductions | .21% | .21% | .21% | .21% | .21% |
| Expenses net of fee waivers, if any | .16% | .11% | .11% | .18% | .15% |
| Expenses net of all reductions | .16% | .11% | .11% | .18% | .15% |
| Net investment income (loss) | .08% | .01% | .01% | .01% | .01% |
| Supplemental Data | | | | | |
| Net assets, end of period (in millions) | $22,047 | $19,333 | $22,569 | $21,579 | $24,822 |
A Amount represents less than $.0005 per share.
B Total returns would have been lower if certain expenses had not been reduced during the applicable periods shown.
C Expense ratios reflect operating expenses of the class. Expenses before reductions do not reflect amounts reimbursed or waived or reductions from expense offset arrangements and do not represent the amount paid by the class during periods when reimbursements, waivers or reductions occur. Expenses net of fee waivers reflect expenses after reimbursement and waivers but prior to reductions from expense offset arrangements. Expenses net of all reductions represent the net expenses paid by the class.
See accompanying notes which are an integral part of the financial statements.
Financial Highlights — Government Portfolio Class II
| Years ended March 31, | 2016 | 2015 | 2014 | 2013 | 2012 |
| Selected Per–Share Data | | | | | |
| Net asset value, beginning of period | $1.00 | $1.00 | $1.00 | $1.00 | $1.00 |
| Income from Investment Operations | | | | | |
| Net investment income (loss)A | – | – | – | – | – |
| Net realized and unrealized gain (loss)A | – | – | – | – | – |
| Total from investment operationsA | – | – | – | – | – |
| Distributions from net investment incomeA | – | – | – | – | – |
| Total distributionsA | – | – | – | – | – |
| Net asset value, end of period | $1.00 | $1.00 | $1.00 | $1.00 | $1.00 |
| Total ReturnB | .02% | .01% | .01% | .01% | .01% |
| Ratios to Average Net AssetsC | | | | | |
| Expenses before reductions | .36% | .36% | .36% | .36% | .36% |
| Expenses net of fee waivers, if any | .20% | .11% | .11% | .18% | .15% |
| Expenses net of all reductions | .20% | .11% | .11% | .18% | .15% |
| Net investment income (loss) | .04% | .01% | .01% | .01% | .01% |
| Supplemental Data | | | | | |
| Net assets, end of period (in millions) | $485 | $539 | $356 | $642 | $827 |
A Amount represents less than $.0005 per share.
B Total returns would have been lower if certain expenses had not been reduced during the applicable periods shown.
C Expense ratios reflect operating expenses of the class. Expenses before reductions do not reflect amounts reimbursed or waived or reductions from expense offset arrangements and do not represent the amount paid by the class during periods when reimbursements, waivers or reductions occur. Expenses net of fee waivers reflect expenses after reimbursement and waivers but prior to reductions from expense offset arrangements. Expenses net of all reductions represent the net expenses paid by the class.
See accompanying notes which are an integral part of the financial statements.
Financial Highlights — Government Portfolio Class III
| Years ended March 31, | 2016 | 2015 | 2014 | 2013 | 2012 |
| Selected Per–Share Data | | | | | |
| Net asset value, beginning of period | $1.00 | $1.00 | $1.00 | $1.00 | $1.00 |
| Income from Investment Operations | | | | | |
| Net investment income (loss)A | – | – | – | – | – |
| Net realized and unrealized gain (loss)A | – | – | – | – | – |
| Total from investment operationsA | – | – | – | – | – |
| Distributions from net investment incomeA | – | – | – | – | – |
| Total distributionsA | – | – | – | – | – |
| Net asset value, end of period | $1.00 | $1.00 | $1.00 | $1.00 | $1.00 |
| Total ReturnB | .01% | .01% | .01% | .01% | .01% |
| Ratios to Average Net AssetsC | | | | | |
| Expenses before reductions | .46% | .46% | .46% | .46% | .46% |
| Expenses net of fee waivers, if any | .21% | .11% | .11% | .18% | .15% |
| Expenses net of all reductions | .21% | .11% | .11% | .18% | .15% |
| Net investment income (loss) | .03% | .01% | .01% | .01% | .01% |
| Supplemental Data | | | | | |
| Net assets, end of period (in millions) | $1,957 | $2,120 | $2,266 | $1,709 | $2,027 |
A Amount represents less than $.0005 per share.
B Total returns would have been lower if certain expenses had not been reduced during the applicable periods shown.
C Expense ratios reflect operating expenses of the class. Expenses before reductions do not reflect amounts reimbursed or waived or reductions from expense offset arrangements and do not represent the amount paid by the class during periods when reimbursements, waivers or reductions occur. Expenses net of fee waivers reflect expenses after reimbursement and waivers but prior to reductions from expense offset arrangements. Expenses net of all reductions represent the net expenses paid by the class.
See accompanying notes which are an integral part of the financial statements.
Financial Highlights — Government Portfolio Select Class
| Years ended March 31, | 2016 | 2015 | 2014 | 2013 | 2012 |
| Selected Per–Share Data | | | | | |
| Net asset value, beginning of period | $1.00 | $1.00 | $1.00 | $1.00 | $1.00 |
| Income from Investment Operations | | | | | |
| Net investment income (loss)A | – | – | – | – | – |
| Net realized and unrealized gain (loss)A | – | – | – | – | – |
| Total from investment operationsA | – | – | – | – | – |
| Distributions from net investment incomeA | – | – | – | – | – |
| Total distributionsA | – | – | – | – | – |
| Net asset value, end of period | $1.00 | $1.00 | $1.00 | $1.00 | $1.00 |
| Total ReturnB | .05% | .01% | .01% | .01% | .01% |
| Ratios to Average Net AssetsC | | | | | |
| Expenses before reductions | .26% | .26% | .26% | .26% | .26% |
| Expenses net of fee waivers, if any | .17% | .11% | .11% | .18% | .15% |
| Expenses net of all reductions | .17% | .11% | .11% | .18% | .15% |
| Net investment income (loss) | .07% | - %D | .01% | .01% | .01% |
| Supplemental Data | | | | | |
| Net assets, end of period (in millions) | $286 | $686 | $378 | $669 | $519 |
A Amount represents less than $.0005 per share.
B Total returns would have been lower if certain expenses had not been reduced during the applicable periods shown.
C Expense ratios reflect operating expenses of the class. Expenses before reductions do not reflect amounts reimbursed or waived or reductions from expense offset arrangements and do not represent the amount paid by the class during periods when reimbursements, waivers or reductions occur. Expenses net of fee waivers reflect expenses after reimbursement and waivers but prior to reductions from expense offset arrangements. Expenses net of all reductions represent the net expenses paid by the class.
D Amount represents less than .005%.
See accompanying notes which are an integral part of the financial statements.
Financial Highlights — Government Portfolio Institutional Class
| Years ended March 31, | 2016 | 2015 A |
| Selected Per–Share Data | | |
| Net asset value, beginning of period | $1.00 | $1.00 |
| Income from Investment Operations | | |
| Net investment income (loss) | .001 | –B |
| Net realized and unrealized gain (loss)B | – | – |
| Total from investment operations | .001 | –B |
| Distributions from net investment income | (.001) | –B |
| Total distributions | (.001) | –B |
| Net asset value, end of period | $1.00 | $1.00 |
| Total ReturnC,D | .08% | .01% |
| Ratios to Average Net AssetsE | | |
| Expenses before reductions | .18% | .18%F |
| Expenses net of fee waivers, if any | .14% | .11%F |
| Expenses net of all reductions | .14% | .11%F |
| Net investment income (loss) | .10% | - %F,G |
| Supplemental Data | | |
| Net assets, end of period (in millions) | $19,281 | $1,508 |
A For the period May 14, 2014 (commencement of sale of shares) to March 31, 2015.
B Amount represents less than $.0005 per share.
C Total returns for periods of less than one year are not annualized.
D Total returns would have been lower if certain expenses had not been reduced during the applicable periods shown.
E Expense ratios reflect operating expenses of the class. Expenses before reductions do not reflect amounts reimbursed or waived or reductions from expense offset arrangements and do not represent the amount paid by the class during periods when reimbursements, waivers or reductions occur. Expense ratios before reductions for start-up periods may not be representative of longer-term operating periods. Expenses net of fee waivers reflect expenses after reimbursement and waivers but prior to reductions from expense offset arrangements. Expenses net of all reductions represent the net expenses paid by the class.
F Annualized
G Amount represents less than .005%.
See accompanying notes which are an integral part of the financial statements.
Money Market Portfolio
Investment Summary/Performance (Unaudited)
Effective Maturity Diversification
| Days | % of fund's investments 3/31/16 | % of fund's investments 9/30/15 | % of fund's investments 3/31/15 |
| 1 - 7 | 59.9 | 45.2 | 36.8 |
| 8 - 30 | 16.1 | 21.8 | 16.6 |
| 31 - 60 | 16.0 | 9.8 | 7.4 |
| 61 - 90 | 6.0 | 15.6 | 18.4 |
| 91 - 180 | 2.0 | 7.6 | 18.8 |
| > 180 | 0.0 | 0.0 | 2.0 |
Effective maturity is determined in accordance with the requirements of Rule 2a-7 under the Investment Company Act of 1940.
Weighted Average Maturity
| | 3/31/16 | 9/30/15 | 3/31/15 |
| Money Market Portfolio | 18 Days | 29 Days | 47 Days |
| All Taxable Money Market Funds Average(a) | 38 Days | 35 Days | 43 Days |
(a) Source: iMoneyNet, Inc.
This is a weighted average of all the maturities of the securities held in a fund. Weighted Average Maturity (WAM) can be used as a measure of sensitivity to interest rate changes and market changes. Generally, the longer the maturity, the greater the sensitivity to such changes. WAM is based on the dollar-weighted average length of time until principal payments must be paid. Depending on the types of securities held in a fund, certain maturity shortening devices (e.g., demand features, interest rate resets, and call options) may be taken into account when calculating the WAM.
Weighted Average Life
| | 3/31/16 | 9/30/15 | 3/31/15 |
| Money Market Portfolio | 29 Days | 60 Days | 85 Days |
Weighted Average Life (WAL) is the weighted average of the life of the securities held in a fund or portfolio and can be used as a measure of sensitivity to changes in liquidity and/or credit risk. Generally, the higher the value, the greater the sensitivity. WAL is based on the dollar-weighted average length of time until principal payments must be paid, taking into account any call options exercised by the issuer and any permissible maturity shortening features other than interest rate resets. The difference between WAM and WAL is that WAM takes into account interest rate resets and WAL does not. WAL for money market funds is not the same as WAL of a mortgage- or asset-backed security.
Asset Allocation (% of fund's net assets)
| As of March 31, 2016 |
| | Certificates of Deposit | 34.6% |
| | Commercial Paper | 8.9% |
| | Variable Rate Demand Notes (VRDNs) | 0.1% |
| | Treasury Debt | 4.6% |
| | Government Agency Debt | 1.3% |
| | Other Instruments | 19.0% |
| | Repurchase Agreements | 30.9% |
| | Net Other Assets (Liabilities) | 0.6% |
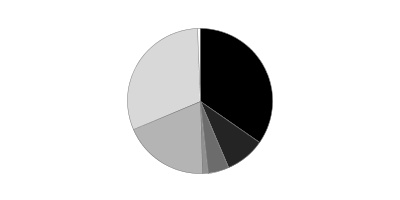
| As of September 30, 2015 |
| | Certificates of Deposit | 47.9% |
| | Commercial Paper | 8.8% |
| | Variable Rate Demand Notes (VRDNs) | 0.1% |
| | Other Notes | 0.7% |
| | Government Agency Debt | 1.2% |
| | Other Instruments | 1.3% |
| | Repurchase Agreements | 40.2% |
| | Net Other Assets (Liabilities)* | (0.2)% |

* Net Other Assets (Liabilities) are not included in the pie chart
Current And Historical 7-Day Yields
| | 3/31/16 | 12/31/15 | 9/30/15 | 6/30/15 | 3/31/15 |
| Class I | 0.35% | 0.28% | 0.13% | 0.10% | 0.10% |
| Class II | 0.20% | 0.13% | 0.01% | 0.01% | 0.01% |
| Class III | 0.10% | 0.04% | 0.01% | 0.01% | 0.01% |
| Select Class | 0.30% | 0.23% | 0.08% | 0.05% | 0.05% |
| Class F | 0.39% | 0.32% | 0.17% | 0.14% | 0.14% |
| Institutional Class | 0.39% | 0.32% | 0.17% | 0.14% | 0.14% |
Yield refers to the income paid by the Fund over a given period. Yields for money market funds are usually for seven-day periods, as they are here, though they are expressed as annual percentage rates. Past performance is no guarantee of future results. Yield will vary and it's possible to lose money investing in the Fund. A portion of the Fund's expenses was reimbursed and/or waived. Absent such reimbursements and/or waivers the yield for the period ending March 31, 2016, the most recent period shown in the table, would have been 0.32% for Class I, 0.18% for Class II, 0.08% for Class III, 0.27% for Select Class, 0.38% for Class F and 0.35% for Institutional Class.
Percentages shown as 0.0% may reflect amounts less than 0.05%.
Money Market Portfolio
Investments March 31, 2016
Showing Percentage of Net Assets
| Certificate of Deposit - 34.6% | | | | |
| | | Yield(a) | Principal Amount (000s) | Value (000s) |
| Domestic Certificates Of Deposit - 1.7% | | | | |
| Wells Fargo Bank NA | | | | |
| 4/6/16 | | 0.65 (b)% | $771,000 | $771,000 |
| London Branch, Eurodollar, Foreign Banks - 3.0% | | | | |
| Mitsubishi UFJ Trust & Banking Corp. | | | | |
| 4/26/16 to 4/28/16 | | 0.70 | 150,000 | 149,924 |
| Mizuho Bank Ltd. Ldn | | | | |
| 6/17/16 to 7/1/16 | | 0.69 to 0.74 | 370,000 | 369,386 |
| Sumitomo Mitsui Trust Bank Ltd. | | | | |
| 5/16/16 to 6/9/16 | | 0.70 to 0.83 | 863,000 | 862,845 |
| | | | | 1,382,155 |
| New York Branch, Yankee Dollar, Foreign Banks - 29.9% | | | | |
| Bank of Montreal Chicago CD Program | | | | |
| 5/13/16 to 6/10/16 | | 0.60 to 0.61 (b) | 777,000 | 777,000 |
| Bank of Nova Scotia | | | | |
| 4/19/16 to 7/25/16 | | 0.60 to 0.83 (b) | 1,037,000 | 1,037,000 |
| Bank of Tokyo-Mitsubishi UFJ Ltd. | | | | |
| 4/4/16 to 6/15/16 | | 0.38 to 0.72 | 940,000 | 940,000 |
| BNP Paribas New York Branch | | | | |
| 4/1/16 | | 0.64 | 355,000 | 355,000 |
| Canadian Imperial Bank of Commerce | | | | |
| 4/20/16 to 7/22/16 | | 0.61 to 0.77 (b) | 1,435,000 | 1,435,000 |
| Credit Agricole CIB | | | | |
| 5/5/16 to 5/9/16 | | 0.63 to 0.71 | 600,000 | 600,000 |
| Credit Suisse | | | | |
| 5/17/16 | | 0.74 (b) | 200,000 | 200,000 |
| Dg Bank New York Brh Institutional Cd Be | | | | |
| 4/18/16 | | 0.53 | 300,000 | 300,000 |
| Mitsubishi UFJ Trust & Banking Corp. | | | | |
| 5/19/16 to 5/26/16 | | 0.50 to 0.52 | 681,000 | 681,035 |
| Mizuho Corporate Bank Ltd. | | | | |
| 4/1/16 to 5/23/16 | | 0.40 to 0.70 | 1,520,000 | 1,520,000 |
| Natexis Banques Populaires New York Branch | | | | |
| 5/2/16 to 5/25/16 | | 0.63 to 0.64 | 782,000 | 782,022 |
| Sumitomo Mitsui Banking Corp. | | | | |
| 4/1/16 to 5/26/16 | | 0.40 to 0.70 | 2,319,500 | 2,319,502 |
| Sumitomo Mitsui Trust Bank Ltd. | | | | |
| 4/5/16 to 5/23/16 | | 0.37 to 0.72 | 1,033,500 | 1,033,567 |
| Toronto-Dominion Bank | | | | |
| 5/19/16 | | 0.50 | 500,000 | 500,000 |
| Toronto-Dominion Bank New York Branch | | | | |
| 4/11/16 to 4/12/16 | | 0.61 to 0.62 (b) | 835,000 | 835,000 |
| UBS AG | | | | |
| 5/31/16 to 9/9/16 | | 0.60 to 0.85 (b) | 290,000 | 290,020 |
| | | | | 13,605,146 |
| TOTAL CERTIFICATE OF DEPOSIT | | | | |
| (Cost $15,758,301) | | | | 15,758,301 |
|
| Financial Company Commercial Paper - 5.9% | | | | |
| BNP Paribas Fortis | | | | |
| 5/20/16 | | 0.50 | 600,000 | 599,592 |
| BNP Paribas New York Branch | | | | |
| 5/18/16 to 6/2/16 | | 0.50 to 0.65 | 550,000 | 549,571 |
| Credit Suisse AG | | | | |
| 6/1/16 to 8/2/16 | | 0.70 to 1.01 | 450,000 | 449,132 |
| JPMorgan Securities LLC | | | | |
| 4/8/16 | | 0.75 | 330,000 | 329,952 |
| Mitsubishi UFJ Trust & Banking Corp. | | | | |
| 4/11/16 | | 0.44 | 500,000 | 499,939 |
| Sumitomo Trust & Banking Co. Ltd. | | | | |
| 6/30/16 | | 0.65 | 75,000 | 74,878 |
| Toronto Dominion Holdings (U.S.A.) | | | | |
| 4/13/16 | | 0.60 | 168,000 | 167,966 |
| TOTAL FINANCIAL COMPANY COMMERCIAL PAPER | | | | |
| (Cost $2,671,030) | | | | 2,671,030 |
|
| Asset Backed Commercial Paper - 1.3% | | | | |
| Gotham Funding Corp. (Liquidity Facility Bank of Tokyo-Mitsubishi UFJ Ltd.) | | | | |
| | | | | |
| 5/4/16 | | 0.48 | 350,000 | 349,846 |
| 5/5/16 | | 0.48 | 121,000 | 120,945 |
| Manhattan Asset Funding Co. LLC (Liquidity Facility Sumitomo Mitsui Banking Corp.) | | | | |
| 4/1/16 | | 0.45 | 100,000 | 100,000 |
| TOTAL ASSET BACKED COMMERCIAL PAPER | | | | |
| (Cost $570,791) | | | | 570,791 |
|
| Other Commercial Paper - 1.7% | | | | |
| Ascension Health | | | | |
| 5/3/16 to 5/5/16 | | 0.55 | 140,407 | 140,336 |
| BPCE SA | | | | |
| 6/6/16 | | 0.67 | 160,000 | 159,803 |
| UnitedHealth Group, Inc. | | | | |
| 4/1/16 to 4/7/16 | | 0.53 to 0.61 | 485,000 | 484,972 |
| TOTAL OTHER COMMERCIAL PAPER | | | | |
| (Cost $785,111) | | | | 785,111 |
|
| Treasury Debt - 4.6% | | | | |
| U.S. Treasury Inflation Protected Obligations - 3.3% | | | | |
| U.S. Treasury Notes | | | | |
| 4/15/16 | | 0.35 to 0.37 | 1,477,975 | 1,478,680 |
| U.S. Treasury Obligations - 1.3% | | | | |
| U.S. Treasury Notes | | | | |
| 6/15/16 to 1/31/18 | | 0.38 to 0.57 (b) | 610,000 | 609,988 |
| TOTAL TREASURY DEBT | | | | |
| (Cost $2,088,668) | | | | 2,088,668 |
|
| Variable Rate Demand Note - 0.1% | | | | |
| Delaware - 0.1% | | | | |
| LP Pinewood SPV LLC Taxable, LOC Wells Fargo Bank NA, VRDN | | | | |
| 4/7/16 | | | | |
| (Cost $67,000) | | 0.43 (b) | 67,000 | 67,000 |
|
| Government Agency Debt - 1.3% | | | | |
| Federal Agencies - 1.3% | | | | |
| Fannie Mae | | | | |
| 1/26/17 | | 0.45 (b) | 210,000 | 209,982 |
| Freddie Mac | | | | |
| 4/20/17 | | 0.44 (b) | 358,000 | 357,942 |
| TOTAL GOVERNMENT AGENCY DEBT | | | | |
| (Cost $567,924) | | | | 567,924 |
|
| Other Instrument - 19.0% | | | | |
| Time Deposits - 19.0% | | | | |
| Bank of New York Mellon (TD) | | | | |
| 4/1/16 | | 0.27 | 1,105,000 | 1,105,000 |
| Credit Agricole CIB | | | | |
| 4/1/16 | | 0.30 | 1,161,553 | 1,161,553 |
| Natixis SA | | | | |
| 4/1/16 | | 0.33 | 1,322,000 | 1,322,000 |
| Nordea Bank AB | | | | |
| 4/1/16 | | 0.35 | 1,323,000 | 1,323,000 |
| Skandinaviska Enskilda Banken AB | | | | |
| 4/1/16 | | 0.34 to 0.35 | 654,000 | 654,000 |
| Svenska Handelsbanken AB | | | | |
| 4/1/16 | | 0.27 to 0.32 | 1,309,000 | 1,309,000 |
| Swedbank AB | | | | |
| 4/1/16 | | 0.35 | 1,763,000 | 1,763,000 |
| TOTAL OTHER INSTRUMENT | | | | |
| (Cost $8,637,553) | | | | 8,637,553 |
| Government Agency Repurchase Agreement - 6.0% | | | |
| | | Maturity Amount (000s) | Value (000s) |
| In a joint trading account: | | | |
| at 0.31% dated 3/31/16 due 4/1/16 (Collateralized by U.S. Government Obligations) # | | $2,643,273 | $2,643,250 |
| at 0.31% dated 3/31/16 due 4/1/16 (Collateralized by U.S. Government Obligations) # | | 92,758 | 92,757 |
| TOTAL GOVERNMENT AGENCY REPURCHASE AGREEMENT | | | |
| (Cost $2,736,007) | | | 2,736,007 |
|
| Treasury Repurchase Agreement - 14.3% | | | |
| With Federal Reserve Bank of New York at 0.25%, dated 3/31/16 due 4/1/16 (Collateralized by U.S. Treasury Obligations valued at $6,495,045,186, 2.00%, 2/15/23) | | | |
| (Cost $6,495,000) | | 6,495,045 | 6,495,000 |
|
| Other Repurchase Agreement - 10.6% | | | |
| Other Repurchase Agreement - 10.6% | | | |
| With: | | | |
| Citibank NA at 1.59%, dated 2/1/16 due 8/3/16: | | | |
| (Collateralized by Corporate Obligations valued at $244,349,590, 0.41% - 14.73%, 3/15/19 - 11/25/54)(b)(c) | | 227,837 | 226,000 |
| (Collateralized by Corporate Obligations valued at $27,029,822, 0.88% - 1.78%, 5/25/37 - 11/20/46)(b)(c) | | 25,203 | 25,000 |
| Citigroup Global Markets, Inc. at 1.59%, dated 2/18/16 due 8/3/16 (Collateralized by Corporate Obligations valued at $57,303,222, 0.66% - 2.82%, 5/25/36 - 12/06/50) (b)(c) | | 53,391 | 53,000 |
| Credit Suisse Securities (U.S.A.) LLC at: | | | |
| 0.62%, dated 3/30/16 due 4/6/16 (Collateralized by U.S. Government Obligations valued at $125,662,315, 0.27% - 3.25%, 4/16/46 - 5/16/55) | | 122,015 | 122,000 |
| 1.2%, dated 3/31/16 due 6/17/16 (Collateralized by Corporate Obligations valued at $529,427,677, 0.00% - 14.75%, 12/01/16 - 4/20/65) | | 501,300 | 500,000 |
| HSBC Securities, Inc. at 0.4%, dated 3/31/16 due 4/1/16 (Collateralized by Corporate Obligations valued at $262,502,224, 2.00% - 8.88%, 5/15/16 - 10/19/75) | | 250,003 | 250,000 |
| ING Financial Markets LLC at 0.4%, dated 3/31/16 due 4/1/16 (Collateralized by Equity Securities valued at $172,802,220) | | 160,002 | 160,000 |
| J.P. Morgan Securities, LLC at: | | | |
| 0.35%, dated 3/31/16 due 4/1/16 (Collateralized by U.S. Government Obligations valued at $252,933,408, 0.00% - 5.85%, 6/24/16 - 3/20/46) | | 247,002 | 247,000 |
| 0.51%, dated 3/31/16 due 4/7/16 (Collateralized by U.S. Government Obligations valued at $207,033,953, 0.73% - 4.50%, 4/20/41 - 11/20/45) | | 201,020 | 201,000 |
| 1.29%, dated 2/17/16 due 6/29/16 (Collateralized by Mortgage Loan Obligations valued at $216,330,822, 0.61% - 6.14%, 8/25/34 - 3/12/51) (b)(c) | | 200,953 | 200,000 |
| Merrill Lynch, Pierce, Fenner & Smith at: | | | |
| 0.4%, dated 3/31/16 due 4/7/16 (Collateralized by U.S. Government Obligations valued at $430,551,763, 2.62% - 11.08%, 10/25/22 - 1/01/46) | | 421,033 | 421,000 |
| 0.72%, dated 3/31/16 due 4/1/16 (Collateralized by Corporate Obligations valued at $526,118,951, 0.00% - 6.14%, 7/19/16 - 9/15/65) | | 503,011 | 503,000 |
| 1.3%, dated 1/11/16 due 5/11/16 (Collateralized by Commercial Paper valued at $65,290,418, 4/01/16 - 5/17/16) | | 62,271 | 62,000 |
| 1.35%, dated: | | | |
| 1/14/16 due 5/13/16 (Collateralized by Equity Securities valued at $178,721,235) | | 165,743 | 165,000 |
| 3/18/16 due 6/16/16: | | | |
| (Collateralized by Equity Securities valued at $242,028,083) | | 224,756 | 224,000 |
| (Collateralized by Equity Securities valued at $259,336,080) | | 240,810 | 240,000 |
| Mitsubishi UFJ Securities (U.S.A.), Inc. at 0.65%, dated 3/30/16 due 4/7/16 (Collateralized by Corporate Obligations valued at $46,374,982, 0.00% - 8.00%, 5/01/16 - 1/01/49) | | 43,011 | 43,000 |
| Mizuho Securities U.S.A., Inc. at: | | | |
| 0.38%, dated 3/31/16 due 4/1/16 (Collateralized by U.S. Government Obligations valued at $250,292,642, 0.00% - 7.27%, 10/25/20 - 12/20/65) | | 243,003 | 243,000 |
| 0.6%, dated: | | | |
| 3/21/16 due 4/4/16 (Collateralized by Equity Securities valued at $43,207,942) | | 40,009 | 40,000 |
| 3/22/16 due 4/5/16 (Collateralized by Equity Securities valued at $43,189,864) | | 40,009 | 40,000 |
| 3/23/16 due 4/6/16 (Collateralized by Equity Securities valued at $53,707,697) | | 50,012 | 50,000 |
| 0.77%, dated 3/24/16 due 4/7/16 (Collateralized by U.S. Government Obligations valued at $20,603,525, 3.50% - 6.17%, 6/15/41 - 3/15/44) | | 20,006 | 20,000 |
| RBC Capital Markets Co. at: | | | |
| 0.56%, dated 3/23/16 due 4/7/16 (Collateralized by U.S. Government Obligations valued at $122,273,756, 0.00% - 10.84%, 9/15/26 - 9/25/55) | | 119,054 | 119,000 |
| 0.65%, dated 1/22/16 due 4/7/16 (Collateralized by U.S. Government Obligations valued at $175,034,038, 0.00% - 24.86%, 10/01/21 - 3/01/46) | | 170,289 | 170,000 |
| 0.78%, dated: | | | |
| 2/29/16 due 4/7/16 (Collateralized by Municipal Bond Obligations valued at $46,552,761, 5.00%, 8/15/31 - 12/01/44) | | 44,088 | 44,000 |
| 3/1/16 due 4/7/16 (Collateralized by Municipal Bond Obligations valued at $92,866,490, 4.00% - 5.00%, 7/01/37 - 2/01/40) | | 88,175 | 88,000 |
| Wells Fargo Securities, LLC at 0.57%, dated 3/28/16 due 4/4/16 (Collateralized by Equity Securities valued at $409,345,959) | | 379,042 | 379,000 |
| TOTAL OTHER REPURCHASE AGREEMENT | | | |
| (Cost $4,835,000) | | | 4,835,000 |
| TOTAL INVESTMENT PORTFOLIO - 99.4% | | | |
| (Cost $45,212,385) | | | 45,212,385 |
| NET OTHER ASSETS (LIABILITIES) - 0.6% | | | 294,834 |
| NET ASSETS - 100% | | | $45,507,219 |
Security Type Abbreviations
VRDN – Variable Rate Demand Note (A debt instrument that is payable upon demand, either daily, weekly or monthly)
The date shown for securities represents the date when principal payments must be paid, taking into account any call options exercised by the issuer and any permissible maturity shortening features other than interest rate resets.
Legend
(a) Yield represents either the annualized yield at the date of purchase, or the stated coupon rate, or, for floating and adjustable rate securities, the rate at period end.
(b) Coupon rates for floating and adjustable rate securities reflect the rates in effect at period end.
(c) The maturity amount is based on the rate at period end.
Investment Valuation
All investments are categorized as Level 2 under the Fair Value Hierarchy. The inputs or methodology used for valuing securities may not be an indication of the risk associated with investing in those securities. For more information on valuation inputs please refer to the Investment Valuation section in the accompanying Notes to Financial Statements.
Other Information
# Additional information on each counterparty to the repurchase agreement is as follows:
| Repurchase Agreement / Counterparty | Value (000s) |
| $2,643,250,000 due 4/01/16 at 0.31% | |
| BNP Paribas Securities Corp. | $463,111 |
| Bank of America NA | 545,893 |
| Citibank NA | 94,535 |
| Credit Agricole CIB New York Branch | 157,559 |
| HSBC Securities (USA), Inc. | 219,617 |
| ING Financial Markets LLC | 26,569 |
| J.P. Morgan Securities, Inc. | 125,738 |
| Mizuho Securities USA, Inc. | 66,731 |
| Societe Generale | 209,769 |
| Wells Fargo Securities LLC | 733,728 |
| | $2,643,250 |
| $92,757,000 due 4/01/16 at 0.31% | |
| Bank of Nova Scotia | 1,699 |
| Citibank NA | 11,985 |
| HSBC Securities (USA), Inc. | 23,139 |
| J.P. Morgan Securities, Inc. | 15,981 |
| Merrill Lynch, Pierce, Fenner & Smith, Inc. | 11,188 |
| Wells Fargo Securities LLC | 28,765 |
| | $92,757 |
See accompanying notes which are an integral part of the financial statements.
Money Market Portfolio
Financial Statements
Statement of Assets and Liabilities
| Amounts in thousands (except per-share amounts) | | March 31, 2016 |
| Assets | | |
Investment in securities, at value (including repurchase agreements of $14,066,007) — See accompanying schedule:
Unaffiliated issuers (cost $45,212,385) | | $45,212,385 |
| Receivable for investments sold | | 12 |
| Receivable for fund shares sold | | 757,949 |
| Interest receivable | | 14,335 |
| Prepaid expenses | | 70 |
| Receivable from investment adviser for expense reductions | | 1,197 |
| Other receivables | | 717 |
| Total assets | | 45,986,665 |
| Liabilities | | |
| Payable for investments purchased | $149,720 | |
| Payable for fund shares redeemed | 316,514 | |
| Distributions payable | 3,760 | |
| Accrued management fee | 5,695 | |
| Distribution and service plan fees payable | 266 | |
| Other affiliated payables | 1,889 | |
| Other payables and accrued expenses | 1,602 | |
| Total liabilities | | 479,446 |
| Net Assets | | $45,507,219 |
| Net Assets consist of: | | |
| Paid in capital | | $45,506,939 |
| Undistributed net investment income | | 280 |
| Net Assets | | $45,507,219 |
| Class I: | | |
| Net Asset Value, offering price and redemption price per share ($19,911,189 ÷ 19,906,343 shares) | | $1.00 |
| Class II: | | |
| Net Asset Value, offering price and redemption price per share ($75,901 ÷ 75,956 shares) | | $1.00 |
| Class III: | | |
| Net Asset Value, offering price and redemption price per share ($1,128,754 ÷ 1,129,161 shares) | | $1.00 |
| Select Class: | | |
| Net Asset Value, offering price and redemption price per share ($223,591 ÷ 223,737 shares) | | $1.00 |
| Class F: | | |
| Net Asset Value, offering price and redemption price per share ($2,304,572 ÷ 2,303,683 shares) | | $1.00 |
| Institutional Class: | | |
| Net Asset Value, offering price and redemption price per share ($21,863,212 ÷ 21,848,440 shares) | | $1.00 |
See accompanying notes which are an integral part of the financial statements.
Statement of Operations
| Amounts in thousands | | Year ended March 31, 2016 |
| Investment Income | | |
| Interest | | $226,120 |
| Expenses | | |
| Management fee | $89,961 | |
| Transfer agent fees | 25,918 | |
| Distribution and service plan fees | 4,571 | |
| Accounting fees and expenses | 2,180 | |
| Custodian fees and expenses | 962 | |
| Independent trustees' compensation | 279 | |
| Registration fees | 371 | |
| Audit | 66 | |
| Legal | 147 | |
| Miscellaneous | 899 | |
| Total expenses before reductions | 125,354 | |
| Expense reductions | (22,876) | 102,478 |
| Net investment income (loss) | | 123,642 |
| Realized and Unrealized Gain (Loss) | | |
| Net realized gain (loss) on: | | |
| Investment securities: | | |
| Unaffiliated issuers | | 655 |
| Total net realized gain (loss) | | 655 |
| Net increase in net assets resulting from operations | | $124,297 |
See accompanying notes which are an integral part of the financial statements.
Statement of Changes in Net Assets
| Amounts in thousands | Year ended March 31, 2016 | Year ended March 31, 2015 |
| Increase (Decrease) in Net Assets | | |
| Operations | | |
| Net investment income (loss) | $123,642 | $50,864 |
| Net realized gain (loss) | 655 | 797 |
| Net increase in net assets resulting from operations | 124,297 | 51,661 |
| Distributions to shareholders from net investment income | (122,767) | (51,480) |
| Share transactions - net increase (decrease) | (17,083,145) | (4,716,104) |
| Total increase (decrease) in net assets | (17,081,615) | (4,715,923) |
| Net Assets | | |
| Beginning of period | 62,588,834 | 67,304,757 |
| End of period (including undistributed net investment income of $280 and $0, respectively) | $45,507,219 | $62,588,834 |
See accompanying notes which are an integral part of the financial statements.
Financial Highlights — Money Market Portfolio Class I
| Years ended March 31, | 2016 | 2015 | 2014 | 2013 | 2012 |
| Selected Per–Share Data | | | | | |
| Net asset value, beginning of period | $1.00 | $1.00 | $1.00 | $1.00 | $1.00 |
| Income from Investment Operations | | | | | |
| Net investment income (loss) | .002 | .001 | .001 | .002 | .002 |
| Net realized and unrealized gain (loss)A | – | – | – | – | – |
| Total from investment operations | .002 | .001 | .001 | .002 | .002 |
| Distributions from net investment income | (.002) | (.001) | (.001) | (.002) | (.002) |
| Total distributions | (.002) | (.001) | (.001) | (.002) | (.002) |
| Net asset value, end of period | $1.00 | $1.00 | $1.00 | $1.00 | $1.00 |
| Total ReturnB | .18% | .06% | .06% | .16% | .17% |
| Ratios to Average Net AssetsC | | | | | |
| Expenses before reductions | .21% | .21% | .21% | .21% | .21% |
| Expenses net of fee waivers, if any | .18% | .18% | .18% | .18% | .18% |
| Expenses net of all reductions | .18% | .18% | .18% | .18% | .18% |
| Net investment income (loss) | .17% | .05% | .06% | .16% | .16% |
| Supplemental Data | | | | | |
| Net assets, end of period (in millions) | $19,911 | $21,651 | $22,712 | $24,416 | $24,209 |
A Amount represents less than $.0005 per share.
B Total returns would have been lower if certain expenses had not been reduced during the applicable periods shown.
C Expense ratios reflect operating expenses of the class. Expenses before reductions do not reflect amounts reimbursed or waived or reductions from expense offset arrangements and do not represent the amount paid by the class during periods when reimbursements, waivers or reductions occur. Expenses net of fee waivers reflect expenses after reimbursement and waivers but prior to reductions from expense offset arrangements. Expenses net of all reductions represent the net expenses paid by the class.
See accompanying notes which are an integral part of the financial statements.
Financial Highlights — Money Market Portfolio Class II
| Years ended March 31, | 2016 | 2015 | 2014 | 2013 | 2012 |
| Selected Per–Share Data | | | | | |
| Net asset value, beginning of period | $1.00 | $1.00 | $1.00 | $1.00 | $1.00 |
| Income from Investment Operations | | | | | |
| Net investment income (loss) | .001 | –A | –A | –A | –A |
| Net realized and unrealized gain (loss)A | – | – | – | – | – |
| Total from investment operations | .001 | –A | –A | –A | –A |
| Distributions from net investment income | (.001) | –A | –A | –A | –A |
| Total distributions | (.001) | –A | –A | –A | –A |
| Net asset value, end of period | $1.00 | $1.00 | $1.00 | $1.00 | $1.00 |
| Total ReturnB | .06% | .01% | .01% | .02% | .03% |
| Ratios to Average Net AssetsC | | | | | |
| Expenses before reductions | .36% | .36% | .36% | .36% | .36% |
| Expenses net of fee waivers, if any | .30% | .22% | .23% | .32% | .32% |
| Expenses net of all reductions | .30% | .22% | .23% | .32% | .32% |
| Net investment income (loss) | .06% | .01% | .01% | .02% | .03% |
| Supplemental Data | | | | | |
| Net assets, end of period (in millions) | $76 | $95 | $150 | $165 | $207 |
A Amount represents less than $.0005 per share.
B Total returns would have been lower if certain expenses had not been reduced during the applicable periods shown.
C Expense ratios reflect operating expenses of the class. Expenses before reductions do not reflect amounts reimbursed or waived or reductions from expense offset arrangements and do not represent the amount paid by the class during periods when reimbursements, waivers or reductions occur. Expenses net of fee waivers reflect expenses after reimbursement and waivers but prior to reductions from expense offset arrangements. Expenses net of all reductions represent the net expenses paid by the class.
See accompanying notes which are an integral part of the financial statements.
Financial Highlights — Money Market Portfolio Class III
| Years ended March 31, | 2016 | 2015 | 2014 | 2013 | 2012 |
| Selected Per–Share Data | | | | | |
| Net asset value, beginning of period | $1.00 | $1.00 | $1.00 | $1.00 | $1.00 |
| Income from Investment Operations | | | | | |
| Net investment income (loss)A | – | – | – | – | – |
| Net realized and unrealized gain (loss)A | – | – | – | – | – |
| Total from investment operationsA | – | – | – | – | – |
| Distributions from net investment incomeA | – | – | – | – | – |
| Total distributionsA | – | – | – | – | – |
| Net asset value, end of period | $1.00 | $1.00 | $1.00 | $1.00 | $1.00 |
| Total ReturnB | .03% | .01% | .01% | .01% | .01% |
| Ratios to Average Net AssetsC | | | | | |
| Expenses before reductions | .46% | .46% | .46% | .46% | .46% |
| Expenses net of fee waivers, if any | .32% | .23% | .23% | .33% | .33% |
| Expenses net of all reductions | .32% | .23% | .23% | .33% | .33% |
| Net investment income (loss) | .03% | .01% | .01% | .01% | .01% |
| Supplemental Data | | | | | |
| Net assets, end of period (in millions) | $1,129 | $1,454 | $1,834 | $2,086 | $2,398 |
A Amount represents less than $.0005 per share.
B Total returns would have been lower if certain expenses had not been reduced during the applicable periods shown.
C Expense ratios reflect operating expenses of the class. Expenses before reductions do not reflect amounts reimbursed or waived or reductions from expense offset arrangements and do not represent the amount paid by the class during periods when reimbursements, waivers or reductions occur. Expenses net of fee waivers reflect expenses after reimbursement and waivers but prior to reductions from expense offset arrangements. Expenses net of all reductions represent the net expenses paid by the class.
See accompanying notes which are an integral part of the financial statements.
Financial Highlights — Money Market Portfolio Select Class
| Years ended March 31, | 2016 | 2015 | 2014 | 2013 | 2012 |
| Selected Per–Share Data | | | | | |
| Net asset value, beginning of period | $1.00 | $1.00 | $1.00 | $1.00 | $1.00 |
| Income from Investment Operations | | | | | |
| Net investment income (loss) | .001 | –A | –A | .001 | .001 |
| Net realized and unrealized gain (loss)A | – | – | – | – | – |
| Total from investment operations | .001 | –A | –A | .001 | .001 |
| Distributions from net investment income | (.001) | –A | –A | (.001) | (.001) |
| Total distributions | (.001) | –A | –A | (.001) | (.001) |
| Net asset value, end of period | $1.00 | $1.00 | $1.00 | $1.00 | $1.00 |
| Total ReturnB | .13% | .02% | .02% | .11% | .11% |
| Ratios to Average Net AssetsC | | | | | |
| Expenses before reductions | .26% | .26% | .26% | .26% | .26% |
| Expenses net of fee waivers, if any | .23% | .22% | .22% | .23% | .23% |
| Expenses net of all reductions | .23% | .22% | .22% | .23% | .23% |
| Net investment income (loss) | .12% | .01% | .02% | .11% | .11% |
| Supplemental Data | | | | | |
| Net assets, end of period (in millions) | $224 | $407 | $331 | $389 | $577 |
A Amount represents less than $.0005 per share.
B Total returns would have been lower if certain expenses had not been reduced during the applicable periods shown.
C Expense ratios reflect operating expenses of the class. Expenses before reductions do not reflect amounts reimbursed or waived or reductions from expense offset arrangements and do not represent the amount paid by the class during periods when reimbursements, waivers or reductions occur. Expenses net of fee waivers reflect expenses after reimbursement and waivers but prior to reductions from expense offset arrangements. Expenses net of all reductions represent the net expenses paid by the class.
See accompanying notes which are an integral part of the financial statements.
Financial Highlights — Money Market Portfolio Class F
| Years ended March 31, | 2016 | 2015 | 2014 | 2013 | 2012 |
| Selected Per–Share Data | | | | | |
| Net asset value, beginning of period | $1.00 | $1.00 | $1.00 | $1.00 | $1.00 |
| Income from Investment Operations | | | | | |
| Net investment income (loss) | .002 | .001 | .001 | .002 | .002 |
| Net realized and unrealized gain (loss)A | – | – | – | – | – |
| Total from investment operations | .002 | .001 | .001 | .002 | .002 |
| Distributions from net investment income | (.002) | (.001) | (.001) | (.002) | (.002) |
| Total distributions | (.002) | (.001) | (.001) | (.002) | (.002) |
| Net asset value, end of period | $1.00 | $1.00 | $1.00 | $1.00 | $1.00 |
| Total ReturnB | .22% | .10% | .10% | .20% | .21% |
| Ratios to Average Net AssetsC | | | | | |
| Expenses before reductions | .15% | .15% | .15% | .15% | .15% |
| Expenses net of fee waivers, if any | .14% | .14% | .14% | .14% | .14% |
| Expenses net of all reductions | .14% | .14% | .14% | .14% | .14% |
| Net investment income (loss) | .21% | .09% | .10% | .20% | .20% |
| Supplemental Data | | | | | |
| Net assets, end of period (in millions) | $2,305 | $2,064 | $2,135 | $2,244 | $1,547 |
A Amount represents less than $.0005 per share.
B Total returns would have been lower if certain expenses had not been reduced during the applicable periods shown.
C Expense ratios reflect operating expenses of the class. Expenses before reductions do not reflect amounts reimbursed or waived or reductions from expense offset arrangements and do not represent the amount paid by the class during periods when reimbursements, waivers or reductions occur. Expenses net of fee waivers reflect expenses after reimbursement and waivers but prior to reductions from expense offset arrangements. Expenses net of all reductions represent the net expenses paid by the class.
See accompanying notes which are an integral part of the financial statements.
Financial Highlights — Money Market Portfolio Institutional Class
| Years ended March 31, | 2016 | 2015 | 2014 | 2013 | 2012 |
| Selected Per–Share Data | | | | | |
| Net asset value, beginning of period | $1.00 | $1.00 | $1.00 | $1.00 | $1.00 |
| Income from Investment Operations | | | | | |
| Net investment income (loss) | .002 | .001 | .001 | .002 | .002 |
| Net realized and unrealized gain (loss)A | – | – | – | – | – |
| Total from investment operations | .002 | .001 | .001 | .002 | .002 |
| Distributions from net investment income | (.002) | (.001) | (.001) | (.002) | (.002) |
| Total distributions | (.002) | (.001) | (.001) | (.002) | (.002) |
| Net asset value, end of period | $1.00 | $1.00 | $1.00 | $1.00 | $1.00 |
| Total ReturnB | .22% | .10% | .10% | .20% | .21% |
| Ratios to Average Net AssetsC | | | | | |
| Expenses before reductions | .18% | .18% | .18% | .18% | .18% |
| Expenses net of fee waivers, if any | .14% | .14% | .14% | .14% | .14% |
| Expenses net of all reductions | .14% | .14% | .14% | .14% | .14% |
| Net investment income (loss) | .21% | .09% | .10% | .20% | .20% |
| Supplemental Data | | | | | |
| Net assets, end of period (in millions) | $21,863 | $36,919 | $40,143 | $37,824 | $32,286 |
A Amount represents less than $.0005 per share.
B Total returns would have been lower if certain expenses had not been reduced during the applicable periods shown.
C Expense ratios reflect operating expenses of the class. Expenses before reductions do not reflect amounts reimbursed or waived or reductions from expense offset arrangements and do not represent the amount paid by the class during periods when reimbursements, waivers or reductions occur. Expenses net of fee waivers reflect expenses after reimbursement and waivers but prior to reductions from expense offset arrangements. Expenses net of all reductions represent the net expenses paid by the class.
See accompanying notes which are an integral part of the financial statements.
Treasury Only Portfolio
Investment Summary/Performance (Unaudited)
Effective Maturity Diversification
| Days | % of fund's investments 3/31/16 | % of fund's investments 9/30/15 | % of fund's investments 3/31/15 |
| 1 - 7 | 20.6 | 22.7 | 15.6 |
| 8 - 30 | 20.3 | 29.9 | 26.9 |
| 31 - 60 | 16.0 | 11.7 | 11.3 |
| 61 - 90 | 20.8 | 1.5 | 17.3 |
| 91 - 180 | 21.0 | 34.2 | 27.7 |
| > 180 | 1.3 | 0.0 | 1.2 |
Effective maturity is determined in accordance with the requirements of Rule 2a-7 under the Investment Company Act of 1940.
Weighted Average Maturity
| | 3/31/16 | 9/30/15 | 3/31/15 |
| Treasury Only Portfolio | 53 Days | 51 Days | 55 Days |
| All Taxable Money Market Funds Average(a) | 38 Days | 35 Days | 43 Days |
(a) Source: iMoneyNet, Inc.
This is a weighted average of all the maturities of the securities held in a fund. Weighted Average Maturity (WAM) can be used as a measure of sensitivity to interest rate changes and market changes. Generally, the longer the maturity, the greater the sensitivity to such changes. WAM is based on the dollar-weighted average length of time until principal payments must be paid. Depending on the types of securities held in a fund, certain maturity shortening devices (e.g., demand features, interest rate resets, and call options) may be taken into account when calculating the WAM.
Weighted Average Life
| | 3/31/16 | 9/30/15 | 3/31/15 |
| Treasury Only Portfolio | 88 Days | 86 Days | 96 Days |
Weighted Average Life (WAL) is the weighted average of the life of the securities held in a fund or portfolio and can be used as a measure of sensitivity to changes in liquidity and/or credit risk. Generally, the higher the value, the greater the sensitivity. WAL is based on the dollar-weighted average length of time until principal payments must be paid, taking into account any call options exercised by the issuer and any permissible maturity shortening features other than interest rate resets. The difference between WAM and WAL is that WAM takes into account interest rate resets and WAL does not. WAL for money market funds is not the same as WAL of a mortgage- or asset-backed security.
Asset Allocation (% of fund's net assets)
| As of March 31, 2016 |
| | Treasury Debt | 99.9% |
| | Net Other Assets (Liabilities) | 0.1% |

| As of September 30, 2015 |
| | Treasury Debt | 103.2% |
| | Net Other Assets (Liabilities)* | (3.2)% |

* Net Other Assets (Liabilities) are not included in the pie chart
Current And Historical 7-Day Yields
| | 3/31/16 | 12/31/15 | 9/30/15 | 6/30/15 | 3/31/15 |
| Class I | 0.17% | 0.04% | 0.01% | 0.01% | 0.01% |
| Class II | 0.02% | 0.01% | 0.01% | 0.01% | 0.01% |
| Class III | 0.01% | 0.01% | 0.01% | 0.01% | 0.01% |
| Class IV | 0.01% | 0.01% | 0.01% | 0.01% | 0.01% |
| Select Class | 0.12% | 0.01% | 0.01% | 0.01% | 0.01% |
| Institutional Class | 0.21% | 0.08% | 0.01% | 0.01% | 0.01% |
Yield refers to the income paid by the Fund over a given period. Yields for money market funds are usually for seven-day periods, as they are here, though they are expressed as annual percentage rates. Past performance is no guarantee of future results. Yield will vary and it's possible to lose money investing in the Fund. A portion of the Fund's expenses was reimbursed and/or waived. Absent such reimbursements and/or waivers the yield for the period ending March 31, 2016, the most recent period shown in the table, would have been 0.15% for Class I, 0.00% for Class II, -0.09% for Class III, -0.34% for Class IV, 0.10% for Select Class and 0.18% for Institutional Class.
Percentages shown as 0.0% may reflect amounts less than 0.05%.
Treasury Only Portfolio
Investments March 31, 2016
Showing Percentage of Net Assets
| Treasury Debt - 99.9% | | | | |
| | | Yield(a) | Principal Amount (000s) | Value (000s) |
| U.S. Treasury Inflation Protected Obligations - 1.9% | | | | |
| U.S. Treasury Notes | | | | |
| 4/15/16 | | 0.37 % | $255,452 | $255,574 |
| U.S. Treasury Obligations - 98.0% | | | | |
| U.S. Treasury Bills | | | | |
| 4/7/16 to 9/29/16 | | 0.20 to 0.52 | 9,357,035 | 9,351,017 |
| U.S. Treasury Bonds | | | | |
| 5/15/16 | | 0.38 to 0.40 | 409,000 | 412,382 |
| U.S. Treasury Notes | | | | |
| 4/15/16 to 10/31/17 | | 0.31 to 0.57 (b) | 3,592,014 | 3,594,775 |
| | | | | 13,358,174 |
| TOTAL TREASURY DEBT | | | | |
| (Cost $13,613,748) | | | | 13,613,748 |
| TOTAL INVESTMENT PORTFOLIO - 99.9% | | | | |
| (Cost $13,613,748) | | | | 13,613,748 |
| NET OTHER ASSETS (LIABILITIES) - 0.1% | | | | 8,991 |
| NET ASSETS - 100% | | | | $13,622,739 |
The date shown for securities represents the date when principal payments must be paid, taking into account any call options exercised by the issuer and any permissible maturity shortening features other than interest rate resets.
Legend
(a) Yield represents either the annualized yield at the date of purchase, or the stated coupon rate, or, for floating and adjustable rate securities, the rate at period end.
(b) Coupon rates for floating and adjustable rate securities reflect the rates in effect at period end.
Investment Valuation
All investments are categorized as Level 2 under the Fair Value Hierarchy. The inputs or methodology used for valuing securities may not be an indication of the risk associated with investing in those securities. For more information on valuation inputs please refer to the Investment Valuation section in the accompanying Notes to Financial Statements.
See accompanying notes which are an integral part of the financial statements.
Treasury Only Portfolio
Financial Statements
Statement of Assets and Liabilities
| Amounts in thousands (except per-share amounts) | | March 31, 2016 |
| Assets | | |
Investment in securities, at value — See accompanying schedule:
Unaffiliated issuers (cost $13,613,748) | | $13,613,748 |
| Receivable for fund shares sold | | 3,944 |
| Interest receivable | | 18,577 |
| Prepaid expenses | | 11 |
| Receivable from investment adviser for expense reductions | | 304 |
| Total assets | | 13,636,584 |
| Liabilities | | |
| Payable to custodian bank | $1 | |
| Payable for fund shares redeemed | 10,608 | |
| Distributions payable | 697 | |
| Accrued management fee | 1,538 | |
| Distribution and service plan fees payable | 194 | |
| Other affiliated payables | 707 | |
| Other payables and accrued expenses | 100 | |
| Total liabilities | | 13,845 |
| Net Assets | | $13,622,739 |
| Net Assets consist of: | | |
| Paid in capital | | $13,622,646 |
| Undistributed net investment income | | 48 |
| Accumulated undistributed net realized gain (loss) on investments | | 45 |
| Net Assets | | $13,622,739 |
| Class I: | | |
| Net Asset Value, offering price and redemption price per share ($10,035,192 ÷ 10,033,841 shares) | | $1.00 |
| Class II: | | |
| Net Asset Value, offering price and redemption price per share ($307,386 ÷ 307,420 shares) | | $1.00 |
| Class III: | | |
| Net Asset Value, offering price and redemption price per share ($830,777 ÷ 830,585 shares) | | $1.00 |
| Class IV: | | |
| Net Asset Value, offering price and redemption price per share ($337,921 ÷ 337,895 shares) | | $1.00 |
| Select Class: | | |
| Net Asset Value, offering price and redemption price per share ($179,866 ÷ 179,861 shares) | | $1.00 |
| Institutional Class: | | |
| Net Asset Value, offering price and redemption price per share ($1,931,597 ÷ 1,931,585 shares) | | $1.00 |
See accompanying notes which are an integral part of the financial statements.
Statement of Operations
| Amounts in thousands | | Year ended March 31, 2016 |
| Investment Income | | |
| Interest | | $18,414 |
| Expenses | | |
| Management fee | $16,172 | |
| Transfer agent fees | 6,789 | |
| Distribution and service plan fees | 3,896 | |
| Accounting fees and expenses | 882 | |
| Custodian fees and expenses | 124 | |
| Independent trustees' compensation | 48 | |
| Registration fees | 307 | |
| Audit | 55 | |
| Legal | 25 | |
| Miscellaneous | 79 | |
| Total expenses before reductions | 28,377 | |
| Expense reductions | (15,359) | 13,018 |
| Net investment income (loss) | | 5,396 |
| Realized and Unrealized Gain (Loss) | | |
| Net realized gain (loss) on: | | |
| Investment securities: | | |
| Unaffiliated issuers | | 75 |
| Total net realized gain (loss) | | 75 |
| Net increase in net assets resulting from operations | | $5,471 |
See accompanying notes which are an integral part of the financial statements.
Statement of Changes in Net Assets
| Amounts in thousands | Year ended March 31, 2016 | Year ended March 31, 2015 |
| Increase (Decrease) in Net Assets | | |
| Operations | | |
| Net investment income (loss) | $5,396 | $333 |
| Net realized gain (loss) | 75 | 69 |
| Net increase in net assets resulting from operations | 5,471 | 402 |
| Distributions to shareholders from net investment income | (4,615) | (1,067) |
| Share transactions - net increase (decrease) | 2,840,666 | (93,801) |
| Total increase (decrease) in net assets | 2,841,522 | (94,466) |
| Net Assets | | |
| Beginning of period | 10,781,217 | 10,875,683 |
| End of period (including undistributed net investment income of $48 and $0, respectively) | $13,622,739 | $10,781,217 |
See accompanying notes which are an integral part of the financial statements.
Financial Highlights — Treasury Only Portfolio Class I
| Years ended March 31, | 2016 | 2015 | 2014 | 2013 | 2012 |
| Selected Per–Share Data | | | | | |
| Net asset value, beginning of period | $1.00 | $1.00 | $1.00 | $1.00 | $1.00 |
| Income from Investment Operations | | | | | |
| Net investment income (loss)A | – | – | – | – | – |
| Net realized and unrealized gain (loss)A | – | – | – | – | – |
| Total from investment operationsA | – | – | – | – | – |
| Distributions from net investment incomeA | – | – | – | – | – |
| Total distributionsA | – | – | – | – | – |
| Net asset value, end of period | $1.00 | $1.00 | $1.00 | $1.00 | $1.00 |
| Total ReturnB | .04% | .01% | .01% | .01% | .01% |
| Ratios to Average Net AssetsC | | | | | |
| Expenses before reductions | .21% | .21% | .21% | .21% | .21% |
| Expenses net of fee waivers, if any | .11% | .05% | .06% | .10% | .06% |
| Expenses net of all reductions | .11% | .05% | .06% | .10% | .06% |
| Net investment income (loss) | .05% | - %D | .01% | .01% | .01% |
| Supplemental Data | | | | | |
| Net assets, end of period (in millions) | $10,035 | $9,402 | $9,795 | $9,431 | $8,064 |
A Amount represents less than $.0005 per share.
B Total returns would have been lower if certain expenses had not been reduced during the applicable periods shown.
C Expense ratios reflect operating expenses of the class. Expenses before reductions do not reflect amounts reimbursed or waived or reductions from expense offset arrangements and do not represent the amount paid by the class during periods when reimbursements, waivers or reductions occur. Expenses net of fee waivers reflect expenses after reimbursement and waivers but prior to reductions from expense offset arrangements. Expenses net of all reductions represent the net expenses paid by the class.
D Amount represents less than .005%.
See accompanying notes which are an integral part of the financial statements.
Financial Highlights — Treasury Only Portfolio Class II
| Years ended March 31, | 2016 | 2015 | 2014 | 2013 | 2012 |
| Selected Per–Share Data | | | | | |
| Net asset value, beginning of period | $1.00 | $1.00 | $1.00 | $1.00 | $1.00 |
| Income from Investment Operations | | | | | |
| Net investment income (loss)A | – | – | – | – | – |
| Net realized and unrealized gain (loss)A | – | – | – | – | – |
| Total from investment operationsA | – | – | – | – | – |
| Distributions from net investment incomeA | – | – | – | – | – |
| Total distributionsA | – | – | – | – | – |
| Net asset value, end of period | $1.00 | $1.00 | $1.00 | $1.00 | $1.00 |
| Total ReturnB | .01% | .01% | .01% | .01% | .01% |
| Ratios to Average Net AssetsC | | | | | |
| Expenses before reductions | .36% | .36% | .36% | .36% | .36% |
| Expenses net of fee waivers, if any | .13% | .05% | .06% | .10% | .06% |
| Expenses net of all reductions | .13% | .05% | .06% | .10% | .06% |
| Net investment income (loss) | .03% | - %D | .01% | .01% | .01% |
| Supplemental Data | | | | | |
| Net assets, end of period (in millions) | $307 | $310 | $359 | $354 | $499 |
A Amount represents less than $.0005 per share.
B Total returns would have been lower if certain expenses had not been reduced during the applicable periods shown.
C Expense ratios reflect operating expenses of the class. Expenses before reductions do not reflect amounts reimbursed or waived or reductions from expense offset arrangements and do not represent the amount paid by the class during periods when reimbursements, waivers or reductions occur. Expenses net of fee waivers reflect expenses after reimbursement and waivers but prior to reductions from expense offset arrangements. Expenses net of all reductions represent the net expenses paid by the class.
D Amount represents less than .005%.
See accompanying notes which are an integral part of the financial statements.
Financial Highlights — Treasury Only Portfolio Class III
| Years ended March 31, | 2016 | 2015 | 2014 | 2013 | 2012 |
| Selected Per–Share Data | | | | | |
| Net asset value, beginning of period | $1.00 | $1.00 | $1.00 | $1.00 | $1.00 |
| Income from Investment Operations | | | | | |
| Net investment income (loss)A | – | – | – | – | – |
| Net realized and unrealized gain (loss)A | – | – | – | – | – |
| Total from investment operationsA | – | – | – | – | – |
| Distributions from net investment incomeA | – | – | – | – | – |
| Total distributionsA | – | – | – | – | – |
| Net asset value, end of period | $1.00 | $1.00 | $1.00 | $1.00 | $1.00 |
| Total ReturnB | .01% | .01% | .01% | .01% | .01% |
| Ratios to Average Net AssetsC | | | | | |
| Expenses before reductions | .46% | .46% | .46% | .46% | .46% |
| Expenses net of fee waivers, if any | .15% | .05% | .06% | .10% | .06% |
| Expenses net of all reductions | .15% | .05% | .06% | .10% | .06% |
| Net investment income (loss) | .01% | - %D | .01% | .01% | .01% |
| Supplemental Data | | | | | |
| Net assets, end of period (in millions) | $831 | $635 | $487 | $408 | $408 |
A Amount represents less than $.0005 per share.
B Total returns would have been lower if certain expenses had not been reduced during the applicable periods shown.
C Expense ratios reflect operating expenses of the class. Expenses before reductions do not reflect amounts reimbursed or waived or reductions from expense offset arrangements and do not represent the amount paid by the class during periods when reimbursements, waivers or reductions occur. Expenses net of fee waivers reflect expenses after reimbursement and waivers but prior to reductions from expense offset arrangements. Expenses net of all reductions represent the net expenses paid by the class.
D Amount represents less than .005%.
See accompanying notes which are an integral part of the financial statements.
Financial Highlights — Treasury Only Portfolio Class IV
| Years ended March 31, | 2016 | 2015 | 2014 | 2013 | 2012 |
| Selected Per–Share Data | | | | | |
| Net asset value, beginning of period | $1.00 | $1.00 | $1.00 | $1.00 | $1.00 |
| Income from Investment Operations | | | | | |
| Net investment income (loss)A | – | – | – | – | – |
| Net realized and unrealized gain (loss)A | – | – | – | – | – |
| Total from investment operationsA | – | – | – | – | – |
| Distributions from net investment incomeA | – | – | – | – | – |
| Total distributionsA | – | – | – | – | – |
| Net asset value, end of period | $1.00 | $1.00 | $1.00 | $1.00 | $1.00 |
| Total ReturnB | .01% | .01% | .01% | .01% | .01% |
| Ratios to Average Net AssetsC | | | | | |
| Expenses before reductions | .71% | .71% | .71% | .71% | .72% |
| Expenses net of fee waivers, if any | .14% | .04% | .06% | .10% | .07% |
| Expenses net of all reductions | .14% | .04% | .06% | .10% | .07% |
| Net investment income (loss) | .02% | .01% | .01% | .01% | .01% |
| Supplemental Data | | | | | |
| Net assets, end of period (in millions) | $338 | $114 | $18 | $22 | $25 |
A Amount represents less than $.0005 per share.
B Total returns would have been lower if certain expenses had not been reduced during the applicable periods shown.
C Expense ratios reflect operating expenses of the class. Expenses before reductions do not reflect amounts reimbursed or waived or reductions from expense offset arrangements and do not represent the amount paid by the class during periods when reimbursements, waivers or reductions occur. Expenses net of fee waivers reflect expenses after reimbursement and waivers but prior to reductions from expense offset arrangements. Expenses net of all reductions represent the net expenses paid by the class.
See accompanying notes which are an integral part of the financial statements.
Financial Highlights — Treasury Only Portfolio Select Class
| Years ended March 31, | 2016 | 2015 | 2014 | 2013 | 2012 |
| Selected Per–Share Data | | | | | |
| Net asset value, beginning of period | $1.00 | $1.00 | $1.00 | $1.00 | $1.00 |
| Income from Investment Operations | | | | | |
| Net investment income (loss)A | – | – | – | – | – |
| Net realized and unrealized gain (loss)A | – | – | – | – | – |
| Total from investment operationsA | – | – | – | – | – |
| Distributions from net investment incomeA | – | – | – | – | – |
| Total distributionsA | – | – | – | – | – |
| Net asset value, end of period | $1.00 | $1.00 | $1.00 | $1.00 | $1.00 |
| Total ReturnB | .03% | .01% | .01% | .01% | .01% |
| Ratios to Average Net AssetsC | | | | | |
| Expenses before reductions | .27% | .26% | .26% | .26% | .26% |
| Expenses net of fee waivers, if any | .12% | .05% | .06% | .10% | .06% |
| Expenses net of all reductions | .12% | .05% | .06% | .10% | .06% |
| Net investment income (loss) | .04% | - %D | .01% | .01% | .01% |
| Supplemental Data | | | | | |
| Net assets, end of period (in millions) | $180 | $194 | $215 | $210 | $269 |
A Amount represents less than $.0005 per share.
B Total returns would have been lower if certain expenses had not been reduced during the applicable periods shown.
C Expense ratios reflect operating expenses of the class. Expenses before reductions do not reflect amounts reimbursed or waived or reductions from expense offset arrangements and do not represent the amount paid by the class during periods when reimbursements, waivers or reductions occur. Expenses net of fee waivers reflect expenses after reimbursement and waivers but prior to reductions from expense offset arrangements. Expenses net of all reductions represent the net expenses paid by the class.
D Amount represents less than .005%.
See accompanying notes which are an integral part of the financial statements.
Financial Highlights — Treasury Only Portfolio Institutional Class
| Years ended March 31, | 2016 | 2015 A |
| Selected Per–Share Data | | |
| Net asset value, beginning of period | $1.00 | $1.00 |
| Income from Investment Operations | | |
| Net investment income (loss) | .001 | –B |
| Net realized and unrealized gain (loss)B | – | – |
| Total from investment operations | .001 | –B |
| Distributions from net investment income | (.001) | –B |
| Total distributions | (.001) | –B |
| Net asset value, end of period | $1.00 | $1.00 |
| Total ReturnC,D | .05% | .01% |
| Ratios to Average Net AssetsE | | |
| Expenses before reductions | .18% | .19%F |
| Expenses net of fee waivers, if any | .12% | .04%F |
| Expenses net of all reductions | .12% | .04%F |
| Net investment income (loss) | .04% | - %F,G |
| Supplemental Data | | |
| Net assets, end of period (in millions) | $1,932 | $126 |
A For the period May 14, 2014 (commencement of sale of shares) to March 31, 2015.
B Amount represents less than $.0005 per share.
C Total returns for periods of less than one year are not annualized.
D Total returns would have been lower if certain expenses had not been reduced during the applicable periods shown.
E Expense ratios reflect operating expenses of the class. Expenses before reductions do not reflect amounts reimbursed or waived or reductions from expense offset arrangements and do not represent the amount paid by the class during periods when reimbursements, waivers or reductions occur. Expense ratios before reductions for start-up periods may not be representative of longer-term operating periods. Expenses net of fee waivers reflect expenses after reimbursement and waivers but prior to reductions from expense offset arrangements. Expenses net of all reductions represent the net expenses paid by the class.
F Annualized
G Amount represents less than .005%.
See accompanying notes which are an integral part of the financial statements.
Prime Money Market Portfolio
Investment Summary/Performance (Unaudited)
Effective Maturity Diversification
| Days | % of fund's investments 3/31/16 | % of fund's investments 9/30/15 | % of fund's investments 3/31/15 |
| 1 - 7 | 47.8 | 55.5 | 47.6 |
| 8 - 30 | 13.8 | 17.9 | 16.4 |
| 31 - 60 | 8.8 | 6.0 | 7.8 |
| 61 - 90 | 15.0 | 12.6 | 15.9 |
| 91 - 180 | 14.6 | 8.0 | 10.5 |
| > 180 | 0.0 | 0.0 | 1.8 |
Effective maturity is determined in accordance with the requirements of Rule 2a-7 under the Investment Company Act of 1940.
Weighted Average Maturity
| | 3/31/16 | 9/30/15 | 3/31/15 |
| Prime Money Market Portfolio | 34 Days | 25 Days | 35 Days |
| All Taxable Money Market Funds Average(a) | 38 Days | 35 Days | 43 Days |
(a) Source: iMoneyNet, Inc.
This is a weighted average of all the maturities of the securities held in a fund. Weighted Average Maturity (WAM) can be used as a measure of sensitivity to interest rate changes and market changes. Generally, the longer the maturity, the greater the sensitivity to such changes. WAM is based on the dollar-weighted average length of time until principal payments must be paid. Depending on the types of securities held in a fund, certain maturity shortening devices (e.g., demand features, interest rate resets, and call options) may be taken into account when calculating the WAM.
Weighted Average Life
| | 3/31/16 | 9/30/15 | 3/31/15 |
| Prime Money Market Portfolio | 44 Days | 56 Days | 74 Days |
Weighted Average Life (WAL) is the weighted average of the life of the securities held in a fund or portfolio and can be used as a measure of sensitivity to changes in liquidity and/or credit risk. Generally, the higher the value, the greater the sensitivity. WAL is based on the dollar-weighted average length of time until principal payments must be paid, taking into account any call options exercised by the issuer and any permissible maturity shortening features other than interest rate resets. The difference between WAM and WAL is that WAM takes into account interest rate resets and WAL does not. WAL for money market funds is not the same as WAL of a mortgage- or asset-backed security.
Asset Allocation (% of fund's net assets)
| As of March 31, 2016 |
| | Certificates of Deposit | 42.3% |
| | Commercial Paper | 6.3% |
| | Variable Rate Demand Notes (VRDNs) | 0.1% |
| | Treasury Debt | 5.3% |
| | Government Agency Debt | 2.8% |
| | Other Instruments | 17.3% |
| | Repurchase Agreements | 26.5% |
| | Net Other Assets (Liabilities)* | (0.6)% |
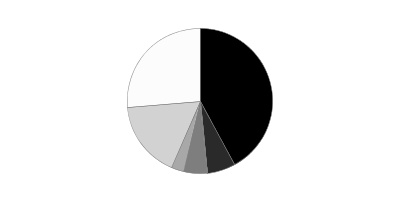
* Net Other Assets (Liabilities) are not included in the pie chart
| As of September 30, 2015 |
| | Certificates of Deposit | 39.0% |
| | Commercial Paper | 9.9% |
| | Variable Rate Demand Notes (VRDNs) | 0.1% |
| | Government Agency Debt | 1.7% |
| | Other Instruments | 1.3% |
| | Repurchase Agreements | 48.0% |

Current And Historical 7-Day Yields
| | 3/31/16 | 12/31/15 | 9/30/15 | 6/30/15 | 3/31/15 |
| Class I | 0.39% | 0.28% | 0.10% | 0.07% | 0.03% |
| Class II | 0.24% | 0.13% | 0.01% | 0.01% | 0.01% |
| Class III | 0.14% | 0.03% | 0.01% | 0.01% | 0.01% |
| Class IV | 0.01% | 0.01% | 0.01% | 0.01% | 0.01% |
| Select Class | 0.34% | 0.23% | 0.05% | 0.02% | 0.01% |
| Institutional Class | 0.43% | 0.32% | 0.14% | 0.11% | 0.09% |
Yield refers to the income paid by the Fund over a given period. Yields for money market funds are usually for seven-day periods, as they are here, though they are expressed as annual percentage rates. Past performance is no guarantee of future results. Yield will vary and it's possible to lose money investing in the Fund. A portion of the Fund's expenses was reimbursed and/or waived. Absent such reimbursements and/or waivers the yield for the period ending March 31, 2016, the most recent period shown in the table, would have been 0.37% for Class I, 0.22% for Class II, 0.12% for Class III, -0.12% for Class IV, 0.32% for Select Class and 0.40% for Institutional Class.
Percentages shown as 0.0% may reflect amounts less than 0.05%.
Prime Money Market Portfolio
Investments March 31, 2016
Showing Percentage of Net Assets
| Certificate of Deposit - 42.3% | | | | |
| | | Yield(a) | Principal Amount (000s) | Value (000s) |
| Domestic Certificates Of Deposit - 3.5% | | | | |
| Wells Fargo Bank NA | | | | |
| 4/6/16 to 8/3/16 | | 0.65 to 0.85 (b)% | $2,047,000 | $2,047,000 |
| London Branch, Eurodollar, Foreign Banks - 3.8% | | | | |
| Mitsubishi UFJ Trust & Banking Corp. | | | | |
| 4/26/16 to 6/2/16 | | 0.70 to 0.77 | 592,000 | 591,680 |
| Mizuho Bank Ltd. Ldn | | | | |
| 6/16/16 to 6/20/16 | | 0.69 to 0.70 | 353,000 | 352,469 |
| Sumitomo Mitsui Trust Bank Ltd. | | | | |
| 5/16/16 to 7/15/16 | | 0.70 to 0.83 | 1,239,000 | 1,239,000 |
| | | | | 2,183,149 |
| New York Branch, Yankee Dollar, Foreign Banks - 35.0% | | | | |
| Bank of Montreal Chicago CD Program | | | | |
| 5/13/16 to 6/10/16 | | 0.60 to 0.61 (b) | 530,000 | 530,000 |
| Bank of Nova Scotia | | | | |
| 4/18/16 to 8/17/16 | | 0.60 to 0.85 (b) | 2,799,000 | 2,799,000 |
| Bank of Tokyo-Mitsubishi UFJ Ltd. | | | | |
| 6/6/16 to 8/12/16 | | 0.64 to 0.75 | 1,503,000 | 1,503,000 |
| BNP Paribas New York Branch | | | | |
| 4/1/16 to 7/5/16 | | 0.64 to 0.71 | 1,110,000 | 1,110,000 |
| Canadian Imperial Bank of Commerce | | | | |
| 4/20/16 to 7/25/16 | | 0.61 to 0.78 (b) | 2,418,000 | 2,418,000 |
| Credit Agricole CIB | | | | |
| 5/5/16 to 5/9/16 | | 0.63 to 0.71 | 875,000 | 875,000 |
| Credit Industriel et Commercial | | | | |
| 6/1/16 | | 0.65 | 288,000 | 288,000 |
| Credit Suisse | | | | |
| 5/17/16 | | 0.74 (b) | 200,000 | 200,000 |
| Mitsubishi UFJ Trust & Banking Corp. | | | | |
| 4/1/16 | | 0.53 | 500,000 | 500,000 |
| Mitsubishi Ufj Trust&Bank New York Cd Be | | | | |
| 6/8/16 | | 0.65 | 171,000 | 171,019 |
| Mizuho Corporate Bank Ltd. | | | | |
| 4/1/16 to 7/1/16 | | 0.40 to 0.75 | 2,098,500 | 2,098,500 |
| Natexis Banques Populaires New York Branch | | | | |
| 5/2/16 to 6/6/16 | | 0.63 to 0.64 | 1,403,000 | 1,403,022 |
| Sumitomo Mitsui Banking Corp. | | | | |
| 4/4/16 to 7/1/16 | | 0.65 to 0.72 | 2,839,000 | 2,839,000 |
| Sumitomo Mitsui Trust Bank Ltd. | | | | |
| 4/4/16 to 7/1/16 | | 0.37 to 0.72 | 1,629,000 | 1,629,000 |
| Toronto-Dominion Bank New York Branch | | | | |
| 4/11/16 to 4/12/16 | | 0.61 to 0.62 (b) | 563,000 | 563,000 |
| UBS AG | | | | |
| 4/22/16 to 9/9/16 | | 0.60 to 0.89 (b) | 1,458,000 | 1,458,022 |
| | | | | 20,384,563 |
| TOTAL CERTIFICATE OF DEPOSIT | | | | |
| (Cost $24,614,712) | | | | 24,614,712 |
|
| Financial Company Commercial Paper - 4.8% | | | | |
| BNP Paribas New York Branch | | | | |
| 5/18/16 to 6/2/16 | | 0.50 to 0.65 | 1,081,000 | 1,080,070 |
| Credit Suisse AG | | | | |
| 8/2/16 to 8/3/16 | | 0.90 to 1.01 | 830,500 | 827,818 |
| DNB Bank ASA | | | | |
| 7/15/16 | | 0.67 | 500,000 | 499,023 |
| JPMorgan Securities LLC | | | | |
| 4/8/16 | | 0.75 | 69,000 | 68,990 |
| Nationwide Building Society | | | | |
| 5/12/16 to 5/16/16 | | 0.62 | 176,000 | 175,870 |
| Toronto Dominion Holdings (U.S.A.) | | | | |
| 4/13/16 | | 0.60 | 123,000 | 122,975 |
| TOTAL FINANCIAL COMPANY COMMERCIAL PAPER | | | | |
| (Cost $2,774,746) | | | | 2,774,746 |
|
| Other Commercial Paper - 1.5% | | | | |
| BPCE SA | | | | |
| 5/2/16 to 7/7/16 | | | | |
| (Cost $886,965) | | 0.68 to 0.72 | 888,000 | 886,965 |
|
| Treasury Debt - 5.3% | | | | |
| U.S. Treasury Inflation Protected Obligations - 3.0% | | | | |
| U.S. Treasury Notes | | | | |
| 4/15/16 | | 0.35 to 0.37 | 1,776,262 | 1,777,207 |
| U.S. Treasury Obligations - 2.3% | | | | |
| U.S. Treasury Notes | | | | |
| 5/31/16 to 10/31/17 | | 0.30 to 0.47 (b) | 1,318,000 | 1,320,595 |
| TOTAL TREASURY DEBT | | | | |
| (Cost $3,097,802) | | | | 3,097,802 |
|
| Variable Rate Demand Note - 0.1% | | | | |
| Delaware - 0.1% | | | | |
| LP Pinewood SPV LLC Taxable, LOC Wells Fargo Bank NA, VRDN | | | | |
| 4/7/16 | | 0.43 (b) | 37,000 | 37,000 |
| Florida - 0.0% | | | | |
| Florida Timber Fin. III LLC Taxable 0.43% 4/7/16, LOC Wells Fargo Bank NA, VRDN | | | | |
| 4/7/16 | | 0.43 (b) | 25,155 | 25,155 |
| TOTAL VARIABLE RATE DEMAND NOTE | | | | |
| (Cost $62,155) | | | | 62,155 |
|
| Government Agency Debt - 2.8% | | | | |
| Federal Agencies - 2.8% | | | | |
| Federal Home Loan Bank | | | | |
| 6/2/16 to 2/3/17 | | 0.43 to 0.48 (b) | 1,370,000 | 1,369,853 |
| Freddie Mac | | | | |
| 4/20/17 | | 0.44 (b) | 242,000 | 241,961 |
| TOTAL GOVERNMENT AGENCY DEBT | | | | |
| (Cost $1,611,814) | | | | 1,611,814 |
|
| Other Instrument - 17.3% | | | | |
| Time Deposits - 17.3% | | | | |
| Bank of New York Mellon (TD) | | | | |
| 4/1/16 | | 0.27 | 1,429,000 | 1,429,000 |
| Credit Agricole CIB | | | | |
| 4/1/16 | | 0.30 | 1,503,000 | 1,503,000 |
| Natixis SA | | | | |
| 4/1/16 | | 0.33 | 678,000 | 678,000 |
| Nordea Bank AB | | | | |
| 4/1/16 | | 0.35 | 1,677,000 | 1,677,000 |
| Skandinaviska Enskilda Banken AB | | | | |
| 4/1/16 | | 0.34 to 0.35 | 846,000 | 846,000 |
| Svenska Handelsbanken AB | | | | |
| 4/1/16 | | 0.27 to 0.32 | 1,691,000 | 1,691,000 |
| Swedbank AB | | | | |
| 4/1/16 | | 0.35 | 2,237,000 | 2,237,000 |
| TOTAL OTHER INSTRUMENT | | | | |
| (Cost $10,061,000) | | | | 10,061,000 |
| Government Agency Repurchase Agreement - 7.2% | | | |
| | | Maturity Amount (000s) | Value (000s) |
| In a joint trading account: | | | |
| at 0.31% dated 3/31/16 due 4/1/16 (Collateralized by U.S. Government Obligations) # | | $3,458,368 | $3,458,338 |
| at 0.31% dated 3/31/16 due 4/1/16 (Collateralized by U.S. Government Obligations) # | | 717,923 | 717,917 |
| TOTAL GOVERNMENT AGENCY REPURCHASE AGREEMENT | | | |
| (Cost $4,176,255) | | | 4,176,255 |
|
| Treasury Repurchase Agreement - 11.9% | | | |
| With Federal Resereve Bank of New York at 0.25% 3/31/16 due 4/1/16 (Collateralized by U.S. Treasury Obligations valued at $6,941,048,267, 3.50%, 2/15/39) | | | |
| (Cost $6,941,000) | | 6,941,048 | 6,941,000 |
|
| Other Repurchase Agreement - 7.4% | | | |
| Other Repurchase Agreement - 7.4% | | | |
| With: | | | |
| Credit Suisse Securities (U.S.A.) LLC at: | | | |
| 0.62%, dated 3/30/16 due 4/6/16 (Collateralized by U.S. Government Obligations valued at $160,686,293, 0.23% - 4.40%, 5/16/41 - 10/16/53) | | 156,019 | 156,000 |
| 1.2%, dated 3/31/16 due 6/17/16 (Collateralized by Corporate Obligations valued at $1,117,800,029, 0.00% - 10.27%, 5/15/21 - 10/15/48) | | 1,037,691 | 1,035,000 |
| J.P. Morgan Clearing Corp. at 1.24%, dated 3/30/16 due 6/29/16 (Collateralized by Equity Securities valued at $884,843,066)(b)(c) | | 816,551 | 814,000 |
| J.P. Morgan Securities, LLC at: | | | |
| 0.35%, dated 3/31/16 due 4/1/16 (Collateralized by Commercial Paper valued at $295,611,628, 6/24/16 - 6/30/16) | | 287,003 | 287,000 |
| 0.51%, dated 3/31/16 due 4/7/16 (Collateralized by U.S. Government Obligations valued at $268,831,654, 0.00% - 21.11%, 4/25/22 - 8/25/55) | | 261,026 | 261,000 |
| 1.29%, dated: | | | |
| 2/17/16 due 6/29/16 (Collateralized by Mortgage Loan Obligations valued at $309,353,209, 2.74% - 46.94%, 10/25/35 - 2/15/51)(b)(c) | | 287,363 | 286,000 |
| 2/18/16 due 6/29/16 (Collateralized by Mortgage Loan Obligations valued at $195,772,466, 0.63% - 7.62%, 7/15/27 - 2/12/51)(b)(c) | | 181,856 | 181,000 |
| 3/2/16 due 6/29/16 (Collateralized by Mortgage Loan Obligations valued at $324,336,286, 0.00% - 107.36%, 2/25/35 - 8/25/47)(b)(c) | | 301,279 | 300,000 |
| Mizuho Securities U.S.A., Inc. at: | | | |
| 0.38%, dated 3/31/16 due 4/1/16 (Collateralized by U.S. Government Obligations valued at $265,007,719, 2.50% - 8.00%, 6/15/26 - 4/01/46) | | 257,003 | 257,000 |
| 0.6%, dated: | | | |
| 3/21/16 due 4/4/16 (Collateralized by Equity Securities valued at $57,135,308) | | 53,012 | 53,000 |
| 3/22/16 due 4/5/16 (Collateralized by Equity Securities valued at $57,249,541) | | 53,012 | 53,000 |
| 3/23/16 due 4/6/16 (Collateralized by Equity Securities valued at $72,370,862) | | 67,016 | 67,000 |
| 0.77%, dated 3/24/16 due 4/7/16 (Collateralized by Mortgage Loan Obligations valued at $27,211,364, 0.19% - 5.72%, 11/01/26 - 6/17/49) | | 26,008 | 26,000 |
| 1.55%, dated: | | | |
| 2/1/16 due 5/2/16 (Collateralized by Corporate Obligations valued at $54,139,500, 0.60% - 5.20%, 2/25/35 - 5/25/46) | | 50,196 | 50,000 |
| 2/2/16 due 5/2/16 (Collateralized by Corporate Obligations valued at $43,309,740, 0.58% - 6.23%, 11/01/26 - 3/25/37) | | 40,155 | 40,000 |
| RBC Capital Markets Co. at: | | | |
| 0.56%, dated 3/23/16 due 4/7/16 (Collateralized by U.S. Government Obligations valued at $164,443,401, 0.00% - 21.24%, 9/01/23 - 3/01/46) | | 160,072 | 160,000 |
| 0.65%, dated 1/22/16 due 4/7/16 (Collateralized by U.S. Government Obligations valued at $160,339,733, 0.00% - 8.24%, 7/01/18 - 3/01/46) | | 156,265 | 156,000 |
| 0.78%, dated: | | | |
| 2/29/16 due 4/7/16 (Collateralized by Municipal Bond Obligations valued at $51,898,363, 5.00%, 3/01/29 - 10/01/40) | | 49,098 | 49,000 |
| 3/1/16 due 4/7/16 (Collateralized by Municipal Bond Obligations valued at $103,290,533, 5.00%, 8/01/30 - 7/01/44) | | 98,195 | 98,000 |
| TOTAL OTHER REPURCHASE AGREEMENT | | | |
| (Cost $4,329,000) | | | 4,329,000 |
| TOTAL INVESTMENT PORTFOLIO - 100.6% | | | |
| (Cost $58,555,449) | | | 58,555,449 |
| NET OTHER ASSETS (LIABILITIES) - (0.6)% | | | (336,079) |
| NET ASSETS - 100% | | | $58,219,370 |
Security Type Abbreviations
VRDN – Variable Rate Demand Note (A debt instrument that is payable upon demand, either daily, weekly or monthly)
The date shown for securities represents the date when principal payments must be paid, taking into account any call options exercised by the issuer and any permissible maturity shortening features other than interest rate resets.
Legend
(a) Yield represents either the annualized yield at the date of purchase, or the stated coupon rate, or, for floating and adjustable rate securities, the rate at period end.
(b) Coupon rates for floating and adjustable rate securities reflect the rates in effect at period end.
(c) The maturity amount is based on the rate at period end.
Investment Valuation
All investments are categorized as Level 2 under the Fair Value Hierarchy. The inputs or methodology used for valuing securities may not be an indication of the risk associated with investing in those securities. For more information on valuation inputs please refer to the Investment Valuation section in the accompanying Notes to Financial Statements.
Other Information
# Additional information on each counterparty to the repurchase agreement is as follows:
| Repurchase Agreement / Counterparty | Value (000s) |
| $3,458,338,000 due 4/01/16 at 0.31% | |
| BNP Paribas Securities Corp. | $605,918 |
| Bank of America NA | 714,229 |
| Citibank NA | 123,686 |
| Credit Agricole CIB New York Branch | 206,144 |
| HSBC Securities (USA), Inc. | 287,340 |
| ING Financial Markets LLC | 34,762 |
| J.P. Morgan Securities, Inc. | 164,511 |
| Mizuho Securities USA, Inc. | 87,308 |
| Societe Generale | 274,455 |
| Wells Fargo Securities LLC | 959,985 |
| | $3,458,338 |
| $717,917,000 due 4/01/16 at 0.31% | |
| Bank of Nova Scotia | 13,148 |
| Citibank NA | 92,765 |
| HSBC Securities (USA), Inc. | 179,091 |
| J.P. Morgan Securities, Inc. | 123,686 |
| Merrill Lynch, Pierce, Fenner & Smith, Inc. | 86,592 |
| Wells Fargo Securities LLC | 222,635 |
| | $717,917 |
See accompanying notes which are an integral part of the financial statements.
Prime Money Market Portfolio
Financial Statements
Statement of Assets and Liabilities
| Amounts in thousands (except per-share amounts) | | March 31, 2016 |
| Assets | | |
Investment in securities, at value (including repurchase agreements of $15,446,255) — See accompanying schedule:
Unaffiliated issuers (cost $58,555,449) | | $58,555,449 |
| Cash | | 1 |
| Receivable for investments sold | | 25 |
| Receivable for fund shares sold | | 154,643 |
| Interest receivable | | 30,102 |
| Prepaid expenses | | 49 |
| Receivable from investment adviser for expense reductions | | 1,613 |
| Other receivables | | 322 |
| Total assets | | 58,742,204 |
| Liabilities | | |
| Payable for investments purchased | $500,000 | |
| Payable for fund shares redeemed | 3,709 | |
| Distributions payable | 8,881 | |
| Accrued management fee | 7,155 | |
| Distribution and service plan fees payable | 340 | |
| Other affiliated payables | 2,080 | |
| Other payables and accrued expenses | 669 | |
| Total liabilities | | 522,834 |
| Net Assets | | $58,219,370 |
| Net Assets consist of: | | |
| Paid in capital | | $58,219,034 |
| Undistributed net investment income | | 336 |
| Net Assets | | $58,219,370 |
| Class I: | | |
| Net Asset Value, offering price and redemption price per share ($9,638,312 ÷ 9,635,974 shares) | | $1.00 |
| Class II: | | |
| Net Asset Value, offering price and redemption price per share ($244,937 ÷ 244,862 shares) | | $1.00 |
| Class III: | | |
| Net Asset Value, offering price and redemption price per share ($894,358 ÷ 894,271 shares) | | $1.00 |
| Class IV: | | |
| Net Asset Value, offering price and redemption price per share ($183,797 ÷ 183,750 shares) | | $1.00 |
| Select Class: | | |
| Net Asset Value, offering price and redemption price per share ($770,595 ÷ 770,429 shares) | | $1.00 |
| Institutional Class: | | |
| Net Asset Value, offering price and redemption price per share ($46,487,371 ÷ 46,476,746 shares) | | $1.00 |
See accompanying notes which are an integral part of the financial statements.
Statement of Operations
| Amounts in thousands | | Year ended March 31, 2016 |
| Investment Income | | |
| Interest | | $178,809 |
| Expenses | | |
| Management fee | $68,980 | |
| Transfer agent fees | 18,425 | |
| Distribution and service plan fees | 4,503 | |
| Accounting fees and expenses | 1,895 | |
| Custodian fees and expenses | 641 | |
| Independent trustees' compensation | 203 | |
| Registration fees | 284 | |
| Audit | 108 | |
| Legal | 101 | |
| Miscellaneous | 254 | |
| Total expenses before reductions | 95,394 | |
| Expense reductions | (19,122) | 76,272 |
| Net investment income (loss) | | 102,537 |
| Realized and Unrealized Gain (Loss) | | |
| Net realized gain (loss) on: | | |
| Investment securities: | | |
| Unaffiliated issuers | | 894 |
| Total net realized gain (loss) | | 894 |
| Net increase in net assets resulting from operations | | $103,431 |
See accompanying notes which are an integral part of the financial statements.
Statement of Changes in Net Assets
| Amounts in thousands | Year ended March 31, 2016 | Year ended March 31, 2015 |
| Increase (Decrease) in Net Assets | | |
| Operations | | |
| Net investment income (loss) | $102,537 | $20,360 |
| Net realized gain (loss) | 894 | 956 |
| Net increase in net assets resulting from operations | 103,431 | 21,316 |
| Distributions to shareholders from net investment income | (101,456) | (21,111) |
| Share transactions - net increase (decrease) | 16,711,766 | 3,134,043 |
| Total increase (decrease) in net assets | 16,713,741 | 3,134,248 |
| Net Assets | | |
| Beginning of period | 41,505,629 | 38,371,381 |
| End of period (including undistributed net investment income of $336 and $0, respectively) | $58,219,370 | $41,505,629 |
See accompanying notes which are an integral part of the financial statements.
Financial Highlights — Prime Money Market Portfolio Class I
| Years ended March 31, | 2016 | 2015 | 2014 | 2013 | 2012 |
| Selected Per–Share Data | | | | | |
| Net asset value, beginning of period | $1.00 | $1.00 | $1.00 | $1.00 | $1.00 |
| Income from Investment Operations | | | | | |
| Net investment income (loss) | .002 | –A | –A | .001 | .001 |
| Net realized and unrealized gain (loss)A | – | – | – | – | – |
| Total from investment operations | .002 | –A | –A | .001 | .001 |
| Distributions from net investment income | (.002) | –A | –A | (.001) | (.001) |
| Total distributions | (.002) | –A | –A | (.001) | (.001) |
| Net asset value, end of period | $1.00 | $1.00 | $1.00 | $1.00 | $1.00 |
| Total ReturnB | .17% | .01% | .02% | .09% | .10% |
| Ratios to Average Net AssetsC | | | | | |
| Expenses before reductions | .21% | .21% | .21% | .21% | .21% |
| Expenses net of fee waivers, if any | .18% | .19% | .19% | .20% | .20% |
| Expenses net of all reductions | .18% | .19% | .19% | .20% | .20% |
| Net investment income (loss) | .18% | .01% | .02% | .09% | .10% |
| Supplemental Data | | | | | |
| Net assets, end of period (in millions) | $9,638 | $6,236 | $7,816 | $10,332 | $15,149 |
A Amount represents less than $.0005 per share.
B Total returns would have been lower if certain expenses had not been reduced during the applicable periods shown.
C Expense ratios reflect operating expenses of the class. Expenses before reductions do not reflect amounts reimbursed or waived or reductions from expense offset arrangements and do not represent the amount paid by the class during periods when reimbursements, waivers or reductions occur. Expenses net of fee waivers reflect expenses after reimbursement and waivers but prior to reductions from expense offset arrangements. Expenses net of all reductions represent the net expenses paid by the class.
See accompanying notes which are an integral part of the financial statements.
Financial Highlights — Prime Money Market Portfolio Class II
| Years ended March 31, | 2016 | 2015 | 2014 | 2013 | 2012 |
| Selected Per–Share Data | | | | | |
| Net asset value, beginning of period | $1.00 | $1.00 | $1.00 | $1.00 | $1.00 |
| Income from Investment Operations | | | | | |
| Net investment income (loss) | .001 | –A | –A | –A | –A |
| Net realized and unrealized gain (loss)A | – | – | – | – | – |
| Total from investment operations | .001 | –A | –A | –A | –A |
| Distributions from net investment income | (.001) | –A | –A | –A | –A |
| Total distributions | (.001) | –A | –A | –A | –A |
| Net asset value, end of period | $1.00 | $1.00 | $1.00 | $1.00 | $1.00 |
| Total ReturnB | .06% | .01% | .01% | .01% | .01% |
| Ratios to Average Net AssetsC | | | | | |
| Expenses before reductions | .36% | .36% | .36% | .36% | .36% |
| Expenses net of fee waivers, if any | .28% | .20% | .19% | .28% | .29% |
| Expenses net of all reductions | .28% | .20% | .19% | .28% | .29% |
| Net investment income (loss) | .09% | .01% | .01% | .01% | .01% |
| Supplemental Data | | | | | |
| Net assets, end of period (in millions) | $245 | $454 | $419 | $487 | $828 |
A Amount represents less than $.0005 per share.
B Total returns would have been lower if certain expenses had not been reduced during the applicable periods shown.
C Expense ratios reflect operating expenses of the class. Expenses before reductions do not reflect amounts reimbursed or waived or reductions from expense offset arrangements and do not represent the amount paid by the class during periods when reimbursements, waivers or reductions occur. Expenses net of fee waivers reflect expenses after reimbursement and waivers but prior to reductions from expense offset arrangements. Expenses net of all reductions represent the net expenses paid by the class.
See accompanying notes which are an integral part of the financial statements.
Financial Highlights — Prime Money Market Portfolio Class III
| Years ended March 31, | 2016 | 2015 | 2014 | 2013 | 2012 |
| Selected Per–Share Data | | | | | |
| Net asset value, beginning of period | $1.00 | $1.00 | $1.00 | $1.00 | $1.00 |
| Income from Investment Operations | | | | | |
| Net investment income (loss)A | – | – | – | – | – |
| Net realized and unrealized gain (loss)A | – | – | – | – | – |
| Total from investment operationsA | – | – | – | – | – |
| Distributions from net investment incomeA | – | – | – | – | – |
| Total distributionsA | – | – | – | – | – |
| Net asset value, end of period | $1.00 | $1.00 | $1.00 | $1.00 | $1.00 |
| Total ReturnB | .04% | .01% | .01% | .01% | .01% |
| Ratios to Average Net AssetsC | | | | | |
| Expenses before reductions | .46% | .46% | .46% | .46% | .46% |
| Expenses net of fee waivers, if any | .31% | .20% | .19% | .28% | .29% |
| Expenses net of all reductions | .31% | .20% | .19% | .28% | .29% |
| Net investment income (loss) | .06% | .01% | .01% | .01% | .01% |
| Supplemental Data | | | | | |
| Net assets, end of period (in millions) | $894 | $1,011 | $1,967 | $1,790 | $1,543 |
A Amount represents less than $.0005 per share.
B Total returns would have been lower if certain expenses had not been reduced during the applicable periods shown.
C Expense ratios reflect operating expenses of the class. Expenses before reductions do not reflect amounts reimbursed or waived or reductions from expense offset arrangements and do not represent the amount paid by the class during periods when reimbursements, waivers or reductions occur. Expenses net of fee waivers reflect expenses after reimbursement and waivers but prior to reductions from expense offset arrangements. Expenses net of all reductions represent the net expenses paid by the class.
See accompanying notes which are an integral part of the financial statements.
Financial Highlights — Prime Money Market Portfolio Class IV
| Years ended March 31, | 2016 | 2015 | 2014 | 2013 | 2012 |
| Selected Per–Share Data | | | | | |
| Net asset value, beginning of period | $1.00 | $1.00 | $1.00 | $1.00 | $1.00 |
| Income from Investment Operations | | | | | |
| Net investment income (loss)A | – | – | – | – | – |
| Net realized and unrealized gain (loss)A | – | – | – | – | – |
| Total from investment operationsA | – | – | – | – | – |
| Distributions from net investment incomeA | – | – | – | – | – |
| Total distributionsA | – | – | – | – | – |
| Net asset value, end of period | $1.00 | $1.00 | $1.00 | $1.00 | $1.00 |
| Total ReturnB | .01% | .01% | .01% | .01% | .01% |
| Ratios to Average Net AssetsC | | | | | |
| Expenses before reductions | .71% | .71% | .71% | .71% | .71% |
| Expenses net of fee waivers, if any | .33% | .20% | .18% | .29% | .29% |
| Expenses net of all reductions | .33% | .20% | .18% | .29% | .29% |
| Net investment income (loss) | .03% | .01% | .02% | - %D | .01% |
| Supplemental Data | | | | | |
| Net assets, end of period (in millions) | $184 | $207 | $100 | $37 | $65 |
A Amount represents less than $.0005 per share.
B Total returns would have been lower if certain expenses had not been reduced during the applicable periods shown.
C Expense ratios reflect operating expenses of the class. Expenses before reductions do not reflect amounts reimbursed or waived or reductions from expense offset arrangements and do not represent the amount paid by the class during periods when reimbursements, waivers or reductions occur. Expenses net of fee waivers reflect expenses after reimbursement and waivers but prior to reductions from expense offset arrangements. Expenses net of all reductions represent the net expenses paid by the class.
D Amount represents less than .005%.
See accompanying notes which are an integral part of the financial statements.
Financial Highlights — Prime Money Market Portfolio Select Class
| Years ended March 31, | 2016 | 2015 | 2014 | 2013 | 2012 |
| Selected Per–Share Data | | | | | |
| Net asset value, beginning of period | $1.00 | $1.00 | $1.00 | $1.00 | $1.00 |
| Income from Investment Operations | | | | | |
| Net investment income (loss) | .001 | –A | –A | –A | .001 |
| Net realized and unrealized gain (loss)A | – | – | – | – | – |
| Total from investment operations | .001 | –A | –A | –A | .001 |
| Distributions from net investment income | (.001) | –A | –A | –A | (.001) |
| Total distributions | (.001) | –A | –A | –A | (.001) |
| Net asset value, end of period | $1.00 | $1.00 | $1.00 | $1.00 | $1.00 |
| Total ReturnB | .12% | .01% | .01% | .05% | .05% |
| Ratios to Average Net AssetsC | | | | | |
| Expenses before reductions | .26% | .26% | .26% | .26% | .26% |
| Expenses net of fee waivers, if any | .23% | .20% | .19% | .25% | .25% |
| Expenses net of all reductions | .23% | .20% | .19% | .25% | .25% |
| Net investment income (loss) | .13% | .01% | .01% | .05% | .05% |
| Supplemental Data | | | | | |
| Net assets, end of period (in millions) | $771 | $1,068 | $1,173 | $1,724 | $1,207 |
A Amount represents less than $.0005 per share.
B Total returns would have been lower if certain expenses had not been reduced during the applicable periods shown.
C Expense ratios reflect operating expenses of the class. Expenses before reductions do not reflect amounts reimbursed or waived or reductions from expense offset arrangements and do not represent the amount paid by the class during periods when reimbursements, waivers or reductions occur. Expenses net of fee waivers reflect expenses after reimbursement and waivers but prior to reductions from expense offset arrangements. Expenses net of all reductions represent the net expenses paid by the class.
See accompanying notes which are an integral part of the financial statements.
Financial Highlights — Prime Money Market Portfolio Institutional Class
| Years ended March 31, | 2016 | 2015 | 2014 | 2013 | 2012 |
| Selected Per–Share Data | | | | | |
| Net asset value, beginning of period | $1.00 | $1.00 | $1.00 | $1.00 | $1.00 |
| Income from Investment Operations | | | | | |
| Net investment income (loss) | .002 | .001 | .001 | .002 | .002 |
| Net realized and unrealized gain (loss)A | – | – | – | – | – |
| Total from investment operations | .002 | .001 | .001 | .002 | .002 |
| Distributions from net investment income | (.002) | (.001) | (.001) | (.002) | (.002) |
| Total distributions | (.002) | (.001) | (.001) | (.002) | (.002) |
| Net asset value, end of period | $1.00 | $1.00 | $1.00 | $1.00 | $1.00 |
| Total ReturnB | .21% | .07% | .06% | .15% | .16% |
| Ratios to Average Net AssetsC | | | | | |
| Expenses before reductions | .18% | .18% | .18% | .18% | .18% |
| Expenses net of fee waivers, if any | .14% | .14% | .14% | .14% | .14% |
| Expenses net of all reductions | .14% | .14% | .14% | .14% | .14% |
| Net investment income (loss) | .22% | .07% | .06% | .15% | .16% |
| Supplemental Data | | | | | |
| Net assets, end of period (in millions) | $46,487 | $32,529 | $26,896 | $30,681 | $34,433 |
A Amount represents less than $.0005 per share.
B Total returns would have been lower if certain expenses had not been reduced during the applicable periods shown.
C Expense ratios reflect operating expenses of the class. Expenses before reductions do not reflect amounts reimbursed or waived or reductions from expense offset arrangements and do not represent the amount paid by the class during periods when reimbursements, waivers or reductions occur. Expenses net of fee waivers reflect expenses after reimbursement and waivers but prior to reductions from expense offset arrangements. Expenses net of all reductions represent the net expenses paid by the class.
See accompanying notes which are an integral part of the financial statements.
Treasury Portfolio
Investment Summary/Performance (Unaudited)
Effective Maturity Diversification
| Days | % of fund's investments 3/31/16 | % of fund's investments 9/30/15 | % of fund's investments 3/31/15 |
| 1 - 7 | 42.1 | 73.9 | 57.5 |
| 8 - 30 | 13.1 | 2.1 | 7.5 |
| 31 - 60 | 10.2 | 3.0 | 3.4 |
| 61 - 90 | 11.5 | 0.5 | 8.8 |
| 91 - 180 | 20.7 | 11.4 | 13.3 |
| > 180 | 2.4 | 9.1 | 9.5 |
Effective maturity is determined in accordance with the requirements of Rule 2a-7 under the Investment Company Act of 1940.
Weighted Average Maturity
| | 3/31/16 | 9/30/15 | 3/31/15 |
| Treasury Portfolio | 46 Days | 36 Days | 50 Days |
| All Taxable Money Market Funds Average(a) | 38 Days | 35 Days | 43 Days |
(a) Source: iMoneyNet, Inc.
This is a weighted average of all the maturities of the securities held in a fund. Weighted Average Maturity (WAM) can be used as a measure of sensitivity to interest rate changes and market changes. Generally, the longer the maturity, the greater the sensitivity to such changes. WAM is based on the dollar-weighted average length of time until principal payments must be paid. Depending on the types of securities held in a fund, certain maturity shortening devices (e.g., demand features, interest rate resets, and call options) may be taken into account when calculating the WAM.
Weighted Average Life
| | 3/31/16 | 9/30/15 | 3/31/15 |
| Treasury Portfolio | 90 Days | 77 Days | 72 Days |
Weighted Average Life (WAL) is the weighted average of the life of the securities held in a fund or portfolio and can be used as a measure of sensitivity to changes in liquidity and/or credit risk. Generally, the higher the value, the greater the sensitivity. WAL is based on the dollar-weighted average length of time until principal payments must be paid, taking into account any call options exercised by the issuer and any permissible maturity shortening features other than interest rate resets. The difference between WAM and WAL is that WAM takes into account interest rate resets and WAL does not. WAL for money market funds is not the same as WAL of a mortgage- or asset-backed security.
Asset Allocation (% of fund's net assets)
| As of March 31, 2016 |
| | Treasury Debt | 73.8% |
| | Repurchase Agreements | 26.0% |
| | Net Other Assets (Liabilities) | 0.2% |

| As of September 30, 2015 |
| | Treasury Debt | 39.3% |
| | Repurchase Agreements | 61.8% |
| | Net Other Assets (Liabilities)* | (1.1)% |

* Net Other Assets (Liabilities) are not included in the pie chart
Current And Historical 7-Day Yields
| | 3/31/16 | 12/31/15 | 9/30/15 | 6/30/15 | 3/31/15 |
| Class I | 0.19% | 0.11% | 0.01% | 0.01% | 0.01% |
| Class II | 0.04% | 0.01% | 0.01% | 0.01% | 0.01% |
| Class III | 0.01% | 0.01% | 0.01% | 0.01% | 0.01% |
| Class IV | 0.01% | 0.01% | 0.01% | 0.01% | 0.01% |
| Select Class | 0.14% | 0.06% | 0.01% | 0.01% | 0.01% |
| Institutional Class | 0.23% | 0.15% | 0.01% | 0.01% | 0.01% |
Yield refers to the income paid by the Fund over a given period. Yields for money market funds are usually for seven-day periods, as they are here, though they are expressed as annual percentage rates. Past performance is no guarantee of future results. Yield will vary and it's possible to lose money investing in the Fund. A portion of the Fund's expenses was reimbursed and/or waived. Absent such reimbursements and/or waivers the yield for the period ending March 31, 2016, the most recent period shown in the table, would have been 0.17% for Class I, 0.01% for Class II, -0.07% for Class III, -0.32% for Class IV, 0.12% for Select Class and 0.20% for Institutional Class.
Treasury Portfolio
Investments March 31, 2016
Showing Percentage of Net Assets
| Treasury Debt - 73.8% | | | | |
| | | Yield(a) | Principal Amount (000s) | Value (000s) |
| U.S. Treasury Inflation Protected Obligations - 3.9% | | | | |
| U.S. Treasury Notes | | | | |
| 4/15/16 | | 0.35 to 0.37 % | $681,565 | $681,881 |
| U.S. Treasury Obligations - 69.9% | | | | |
| U.S. Treasury Bills | | | | |
| 5/5/16 to 9/29/16 | | 0.30 to 0.57 | 3,261,000 | 3,257,357 |
| U.S. Treasury Bonds | | | | |
| 5/15/16 | | 0.29 to 0.39 | 519,000 | 521,366 |
| U.S. Treasury Notes | | | | |
| 4/15/16 to 1/31/18 | | 0.25 to 0.59 (b) | 8,412,260 | 8,424,888 |
| | | | | 12,203,611 |
| TOTAL TREASURY DEBT | | | | |
| (Cost $12,885,492) | | | | 12,885,492 |
| Treasury Repurchase Agreement - 26.0% | | | |
| | | Maturity Amount (000s) | Value (000s) |
| In a joint trading account at: | | | |
| 0.27% dated 3/31/16 due 4/1/16 (Collateralized by (U.S. Treasury Obligations) # | | $647,576 | $647,571 |
| 0.31% dated 3/31/16 due 4/1/16 (Collateralized by (U.S. Treasury Obligations) # | | 621,014 | 621,009 |
| With: | | | |
| Federal Reserve Bank of New York at 0.25%, dated 3/31/16 due 4/1/16 (Collateralized by U.S. Treasury Obligations valued at $1,969,013,699, 1.63% - 6.38%, 11/15/22 - 8/15/27) | | 1,969,014 | 1,969,000 |
| Mizuho Securities U.S.A., Inc. at: | | | |
| 0.31%, dated 3/30/16 due 4/6/16 (Collateralized by U.S. Treasury Obligations valued at $42,611,177, 2.25%, 11/15/24) | | 42,003 | 42,000 |
| 0.32%, dated 3/31/16 due 4/1/16 (Collateralized by U.S. Treasury Obligations valued at $64,251,681, 1.63%, 6/30/20) | | 63,001 | 63,000 |
| Prudential Insurance Co. of America at 0.3%, dated 3/31/16 due 4/1/16 (Collateralized by U.S. Treasury Obligations valued at $168,079,929, 1.00% - 5.38%, 3/31/17 - 2/15/31) | | 164,766 | 164,764 |
| Royal Bank of Canada at 0.32%, dated 3/31/16 due 4/1/16 | | | |
| (Collateralized by U.S. Treasury Obligations valued at $202,979,901, 1.50%, 10/31/19) | | 199,002 | 199,000 |
| (Collateralized by U.S. Treasury Obligations valued at $7,212,673, 3.63%, 8/15/43) | | 7,000 | 7,000 |
| Sumitomo Mitsui Trust Bank Ltd. at: | | | |
| 0.38%, dated: | | | |
| 3/8/16 due 4/7/16 (Collateralized by U.S. Treasury Obligations valued at $63,282,878, 3.00%, 2/28/17) | | 62,220 | 62,197 |
| 3/18/16 due 4/7/16 (Collateralized by U.S. Treasury Obligations valued at $58,462,650, 2.13%, 8/31/20) | | 57,327 | 57,306 |
| 0.39%, dated: | | | |
| 3/22/16 due 4/7/16 (Collateralized by U.S. Treasury Obligations valued at $59,449,884, 3.75%, 11/15/18) | | 59,031 | 59,009 |
| 3/28/16 due 4/7/16 (Collateralized by U.S. Treasury Obligations valued at $58,149,687, 0.50% - 3.25%, 6/15/16 - 3/31/17) | | 57,064 | 57,042 |
| 3/29/16 due 4/7/16 (Collateralized by U.S. Treasury Obligations valued at $59,442,352, 3.75%, 11/15/18) | | 59,050 | 59,031 |
| Wells Fargo Securities, LLC at: | | | |
| 0.39%, dated 1/4/16 due 4/4/16 (Collateralized by U.S. Treasury Obligations valued at $129,663,562, 0.00%, 6/16/16 - 6/30/16) | | 127,125 | 127,000 |
| 0.4%, dated: | | | |
| 1/6/16 due 4/6/16 (Collateralized by U.S. Treasury Obligations valued at $189,901,340, 0.00%, 6/30/16 - 7/14/16) | | 186,188 | 186,000 |
| 1/7/16 due 4/7/16 (Collateralized by U.S. Treasury Obligations valued at $94,949,687, 0.00% - 0.50%, 4/28/16 - 1/31/17) | | 93,094 | 93,000 |
| 3/21/16 due 6/20/16 (Collateralized by U.S. Treasury Obligations valued at $56,106,940, 0.00%, 6/16/16) | | 55,056 | 55,000 |
| 0.42%, dated 3/1/16 due 6/2/16 (Collateralized by U.S. Treasury Obligations valued at $71,425,838, 0.00%, 4/14/16 - 4/21/16) | | 70,076 | 70,000 |
| TOTAL TREASURY REPURCHASE AGREEMENT | | | |
| (Cost $4,538,929) | | | 4,538,929 |
| TOTAL INVESTMENT PORTFOLIO - 99.8% | | | |
| (Cost $17,424,421) | | | 17,424,421 |
| NET OTHER ASSETS (LIABILITIES) - 0.2% | | | 31,131 |
| NET ASSETS - 100% | | | $17,455,552 |
The date shown for securities represents the date when principal payments must be paid, taking into account any call options exercised by the issuer and any permissible maturity shortening features other than interest rate resets.
Legend
(a) Yield represents either the annualized yield at the date of purchase, or the stated coupon rate, or, for floating and adjustable rate securities, the rate at period end.
(b) Coupon rates for floating and adjustable rate securities reflect the rates in effect at period end.
Investment Valuation
All investments are categorized as Level 2 under the Fair Value Hierarchy. The inputs or methodology used for valuing securities may not be an indication of the risk associated with investing in those securities. For more information on valuation inputs please refer to the Investment Valuation section in the accompanying Notes to Financial Statements.
Other Information
# Additional information on each counterparty to the repurchase agreement is as follows:
| Repurchase Agreement / Counterparty | Value (000s) |
| $647,571,000 due 4/01/16 at 0.27% | |
| BNP Paribas Securities Corp. | $40,300 |
| Citibank NA | 23,000 |
| Credit Agricole CIB New York Branch | 38,000 |
| HSBC Securities (USA), Inc. | 477,271 |
| J.P. Morgan Securities, Inc. | 31,000 |
| Societe Generale | 30,000 |
| Wells Fargo Securities LLC | 8,000 |
| | $647,571 |
| $621,009,000 due 4/01/16 at 0.31% | |
| Bank of Nova Scotia | 136,756 |
| J.P. Morgan Securities, Inc. | 232,814 |
| Societe Generale | 251,439 |
| | $621,009 |
See accompanying notes which are an integral part of the financial statements.
Treasury Portfolio
Financial Statements
Statement of Assets and Liabilities
| Amounts in thousands (except per-share amounts) | | March 31, 2016 |
| Assets | | |
Investment in securities, at value (including repurchase agreements of $4,538,929) — See accompanying schedule:
Unaffiliated issuers (cost $17,424,421) | | $17,424,421 |
| Receivable for fund shares sold | | 53 |
| Interest receivable | | 35,776 |
| Prepaid expenses | | 16 |
| Receivable from investment adviser for expense reductions | | 365 |
| Other receivables | | 141 |
| Total assets | | 17,460,772 |
| Liabilities | | |
| Payable to custodian bank | $130 | |
| Payable for fund shares redeemed | 708 | |
| Distributions payable | 949 | |
| Accrued management fee | 1,836 | |
| Transfer agent fee payable | 717 | |
| Distribution and service plan fees payable | 570 | |
| Other affiliated payables | 95 | |
| Other payables and accrued expenses | 215 | |
| Total liabilities | | 5,220 |
| Net Assets | | $17,455,552 |
| Net Assets consist of: | | |
| Paid in capital | | $17,455,431 |
| Undistributed net investment income | | 121 |
| Net Assets | | $17,455,552 |
| Class I: | | |
| Net Asset Value, offering price and redemption price per share ($9,639,323 ÷ 9,636,325 shares) | | $1.00 |
| Class II: | | |
| Net Asset Value, offering price and redemption price per share ($557,048 ÷ 556,908 shares) | | $1.00 |
| Class III: | | |
| Net Asset Value, offering price and redemption price per share ($2,861,777 ÷ 2,860,731 shares) | | $1.00 |
| Class IV: | | |
| Net Asset Value, offering price and redemption price per share ($905,332 ÷ 904,960 shares) | | $1.00 |
| Select Class: | | |
| Net Asset Value, offering price and redemption price per share ($287,093 ÷ 287,034 shares) | | $1.00 |
| Institutional Class: | | |
| Net Asset Value, offering price and redemption price per share ($3,204,979 ÷ 3,204,924 shares) | | $1.00 |
See accompanying notes which are an integral part of the financial statements.
Statement of Operations
| Amounts in thousands | | Year ended March 31, 2016 |
| Investment Income | | |
| Interest | | $30,199 |
| Expenses | | |
| Management fee | $21,840 | |
| Transfer agent fees | 9,049 | |
| Distribution and service plan fees | 11,014 | |
| Accounting fees and expenses | 1,048 | |
| Custodian fees and expenses | 70 | |
| Independent trustees' compensation | 67 | |
| Registration fees | 277 | |
| Audit | 66 | |
| Legal | 34 | |
| Miscellaneous | 91 | |
| Total expenses before reductions | 43,556 | |
| Expense reductions | (20,870) | 22,686 |
| Net investment income (loss) | | 7,513 |
| Realized and Unrealized Gain (Loss) | | |
| Net realized gain (loss) on: | | |
| Investment securities: | | |
| Unaffiliated issuers | | 279 |
| Total net realized gain (loss) | | 279 |
| Net increase in net assets resulting from operations | | $7,792 |
See accompanying notes which are an integral part of the financial statements.
Statement of Changes in Net Assets
| Amounts in thousands | Year ended March 31, 2016 | Year ended March 31, 2015 |
| Increase (Decrease) in Net Assets | | |
| Operations | | |
| Net investment income (loss) | $7,513 | $798 |
| Net realized gain (loss) | 279 | 102 |
| Net increase in net assets resulting from operations | 7,792 | 900 |
| Distributions to shareholders from net investment income | (6,744) | (1,446) |
| Share transactions - net increase (decrease) | 1,276,158 | 2,826,979 |
| Total increase (decrease) in net assets | 1,277,206 | 2,826,433 |
| Net Assets | | |
| Beginning of period | 16,178,346 | 13,351,913 |
| End of period (including undistributed net investment income of $121 and $0, respectively) | $17,455,552 | $16,178,346 |
See accompanying notes which are an integral part of the financial statements.
Financial Highlights — Treasury Portfolio Class I
| Years ended March 31, | 2016 | 2015 | 2014 | 2013 | 2012 |
| Selected Per–Share Data | | | | | |
| Net asset value, beginning of period | $1.00 | $1.00 | $1.00 | $1.00 | $1.00 |
| Income from Investment Operations | | | | | |
| Net investment income (loss) | .001 | –A | –A | –A | –A |
| Net realized and unrealized gain (loss)A | – | – | – | – | – |
| Total from investment operations | .001 | –A | –A | –A | –A |
| Distributions from net investment income | (.001) | –A | –A | –A | –A |
| Total distributions | (.001) | –A | –A | –A | –A |
| Net asset value, end of period | $1.00 | $1.00 | $1.00 | $1.00 | $1.00 |
| Total ReturnB | .05% | .01% | .01% | .01% | .01% |
| Ratios to Average Net AssetsC | | | | | |
| Expenses before reductions | .21% | .21% | .21% | .21% | .21% |
| Expenses net of fee waivers, if any | .13% | .07% | .08% | .16% | .10% |
| Expenses net of all reductions | .13% | .07% | .08% | .16% | .10% |
| Net investment income (loss) | .05% | .01% | .01% | .01% | .01% |
| Supplemental Data | | | | | |
| Net assets, end of period (in millions) | $9,639 | $11,727 | $9,736 | $9,964 | $11,712 |
A Amount represents less than $.0005 per share.
B Total returns would have been lower if certain expenses had not been reduced during the applicable periods shown.
C Expense ratios reflect operating expenses of the class. Expenses before reductions do not reflect amounts reimbursed or waived or reductions from expense offset arrangements and do not represent the amount paid by the class during periods when reimbursements, waivers or reductions occur. Expenses net of fee waivers reflect expenses after reimbursement and waivers but prior to reductions from expense offset arrangements. Expenses net of all reductions represent the net expenses paid by the class.
See accompanying notes which are an integral part of the financial statements.
Financial Highlights — Treasury Portfolio Class II
| Years ended March 31, | 2016 | 2015 | 2014 | 2013 | 2012 |
| Selected Per–Share Data | | | | | |
| Net asset value, beginning of period | $1.00 | $1.00 | $1.00 | $1.00 | $1.00 |
| Income from Investment Operations | | | | | |
| Net investment income (loss) A | – | – | – | – | – |
| Net realized and unrealized gain (loss)A | – | – | – | – | – |
| Total from investment operationsA | – | – | – | – | – |
| Distributions from net investment incomeA | – | – | – | – | – |
| Total distributionsA | – | – | – | – | – |
| Net asset value, end of period | $1.00 | $1.00 | $1.00 | $1.00 | $1.00 |
| Total ReturnB | .01% | .01% | .01% | .01% | .01% |
| Ratios to Average Net AssetsC | | | | | |
| Expenses before reductions | .36% | .36% | .36% | .36% | .36% |
| Expenses net of fee waivers, if any | .22% | .07% | .08% | .16% | .10% |
| Expenses net of all reductions | .22% | .07% | .08% | .16% | .10% |
| Net investment income (loss) | .01% | .01% | .01% | .01% | .01% |
| Supplemental Data | | | | | |
| Net assets, end of period (in millions) | $557 | $70 | $133 | $127 | $80 |
A Amount represents less than $.0005 per share.
B Total returns would have been lower if certain expenses had not been reduced during the applicable periods shown.
C Expense ratios reflect operating expenses of the class. Expenses before reductions do not reflect amounts reimbursed or waived or reductions from expense offset arrangements and do not represent the amount paid by the class during periods when reimbursements, waivers or reductions occur. Expenses net of fee waivers reflect expenses after reimbursement and waivers but prior to reductions from expense offset arrangements. Expenses net of all reductions represent the net expenses paid by the class.
See accompanying notes which are an integral part of the financial statements.
Financial Highlights — Treasury Portfolio Class III
| Years ended March 31, | 2016 | 2015 | 2014 | 2013 | 2012 |
| Selected Per–Share Data | | | | | |
| Net asset value, beginning of period | $1.00 | $1.00 | $1.00 | $1.00 | $1.00 |
| Income from Investment Operations | | | | | |
| Net investment income (loss) A | – | – | – | – | – |
| Net realized and unrealized gain (loss)A | – | – | – | – | – |
| Total from investment operationsA | – | – | – | –�� | – |
| Distributions from net investment incomeA | – | – | – | – | – |
| Total distributionsA | – | – | – | – | – |
| Net asset value, end of period | $1.00 | $1.00 | $1.00 | $1.00 | $1.00 |
| Total ReturnB | .01% | .01% | .01% | .01% | .01% |
| Ratios to Average Net AssetsC | | | | | |
| Expenses before reductions | .46% | .46% | .46% | .46% | .46% |
| Expenses net of fee waivers, if any | .17% | .07% | .08% | .16% | .10% |
| Expenses net of all reductions | .17% | .07% | .08% | .16% | .10% |
| Net investment income (loss) | .02% | .01% | .01% | .01% | .01% |
| Supplemental Data | | | | | |
| Net assets, end of period (in millions) | $2,862 | $2,866 | $2,654 | $2,844 | $3,108 |
A Amount represents less than $.0005 per share.
B Total returns would have been lower if certain expenses had not been reduced during the applicable periods shown.
C Expense ratios reflect operating expenses of the class. Expenses before reductions do not reflect amounts reimbursed or waived or reductions from expense offset arrangements and do not represent the amount paid by the class during periods when reimbursements, waivers or reductions occur. Expenses net of fee waivers reflect expenses after reimbursement and waivers but prior to reductions from expense offset arrangements. Expenses net of all reductions represent the net expenses paid by the class.
See accompanying notes which are an integral part of the financial statements.
Financial Highlights — Treasury Portfolio Class IV
| Years ended March 31, | 2016 | 2015 | 2014 | 2013 | 2012 |
| Selected Per–Share Data | | | | | |
| Net asset value, beginning of period | $1.00 | $1.00 | $1.00 | $1.00 | $1.00 |
| Income from Investment Operations | | | | | |
| Net investment income (loss) A | – | – | – | – | – |
| Net realized and unrealized gain (loss)A | – | – | – | – | – |
| Total from investment operationsA | – | – | – | – | – |
| Distributions from net investment incomeA | – | – | – | – | – |
| Total distributionsA | – | – | – | – | – |
| Net asset value, end of period | $1.00 | $1.00 | $1.00 | $1.00 | $1.00 |
| Total ReturnB | .01% | .01% | .01% | .01% | .01% |
| Ratios to Average Net AssetsC | | | | | |
| Expenses before reductions | .71% | .71% | .71% | .71% | .71% |
| Expenses net of fee waivers, if any | .18% | .07% | .08% | .16% | .10% |
| Expenses net of all reductions | .18% | .07% | .08% | .16% | .10% |
| Net investment income (loss) | .01% | .01% | .01% | .01% | .01% |
| Supplemental Data | | | | | |
| Net assets, end of period (in millions) | $905 | $621 | $591 | $527 | $484 |
A Amount represents less than $.0005 per share.
B Total returns would have been lower if certain expenses had not been reduced during the applicable periods shown.
C Expense ratios reflect operating expenses of the class. Expenses before reductions do not reflect amounts reimbursed or waived or reductions from expense offset arrangements and do not represent the amount paid by the class during periods when reimbursements, waivers or reductions occur. Expenses net of fee waivers reflect expenses after reimbursement and waivers but prior to reductions from expense offset arrangements. Expenses net of all reductions represent the net expenses paid by the class.
See accompanying notes which are an integral part of the financial statements.
Financial Highlights — Treasury Portfolio Select Class
| Years ended March 31, | 2016 | 2015 | 2014 | 2013 | 2012 |
| Selected Per–Share Data | | | | | |
| Net asset value, beginning of period | $1.00 | $1.00 | $1.00 | $1.00 | $1.00 |
| Income from Investment Operations | | | | | |
| Net investment income (loss)A | – | – | – | – | – |
| Net realized and unrealized gain (loss)A | – | – | – | – | – |
| Total from investment operationsA | – | – | – | – | – |
| Distributions from net investment incomeA | – | – | – | – | – |
| Total distributionsA | – | – | – | – | – |
| Net asset value, end of period | $1.00 | $1.00 | $1.00 | $1.00 | $1.00 |
| Total ReturnB | .04% | .01% | .01% | .01% | .01% |
| Ratios to Average Net AssetsC | | | | | |
| Expenses before reductions | .26% | .26% | .26% | .26% | .26% |
| Expenses net of fee waivers, if any | .15% | .07% | .08% | .16% | .10% |
| Expenses net of all reductions | .15% | .07% | .08% | .16% | .10% |
| Net investment income (loss) | .04% | .01% | .01% | .01% | .01% |
| Supplemental Data | | | | | |
| Net assets, end of period (in millions) | $287 | $225 | $238 | $198 | $259 |
A Amount represents less than $.0005 per share.
B Total returns would have been lower if certain expenses had not been reduced during the applicable periods shown.
C Expense ratios reflect operating expenses of the class. Expenses before reductions do not reflect amounts reimbursed or waived or reductions from expense offset arrangements and do not represent the amount paid by the class during periods when reimbursements, waivers or reductions occur. Expenses net of fee waivers reflect expenses after reimbursement and waivers but prior to reductions from expense offset arrangements. Expenses net of all reductions represent the net expenses paid by the class.
See accompanying notes which are an integral part of the financial statements.
Financial Highlights — Treasury Portfolio Institutional Class
| Years ended March 31, | 2016 | 2015 A |
| Selected Per–Share Data | | |
| Net asset value, beginning of period | $1.00 | $1.00 |
| Income from Investment Operations | | |
| Net investment income (loss) | .001 | –B |
| Net realized and unrealized gain (loss)B | – | – |
| Total from investment operations | .001 | –B |
| Distributions from net investment income | (.001) | –B |
| Total distributions | (.001) | –B |
| Net asset value, end of period | $1.00 | $1.00 |
| Total ReturnC,D | .07% | .01% |
| Ratios to Average Net AssetsE | | |
| Expenses before reductions | .18% | .18%F |
| Expenses net of fee waivers, if any | .13% | .07%F |
| Expenses net of all reductions | .13% | .07%F |
| Net investment income (loss) | .11% | - %F,G |
| Supplemental Data | | |
| Net assets, end of period (in millions) | $3,205 | $669 |
A For the period May 14, 2014 (commencement of sale of shares) to March 31, 2015.
B Amount represents less than $.0005 per share.
C Total returns for periods of less than one year are not annualized.
D Total returns would have been lower if certain expenses had not been reduced during the applicable periods shown.
E Expense ratios reflect operating expenses of the class. Expenses before reductions do not reflect amounts reimbursed or waived or reductions from expense offset arrangements and do not represent the amount paid by the class during periods when reimbursements, waivers or reductions occur. Expense ratios before reductions for start-up periods may not be representative of longer-term operating periods. Expenses net of fee waivers reflect expenses after reimbursement and waivers but prior to reductions from expense offset arrangements. Expenses net of all reductions represent the net expenses paid by the class.
F Annualized
G Amount represents less than .005%.
See accompanying notes which are an integral part of the financial statements.
Notes to Financial Statements
For the period ended March 31, 2016
(Amounts in thousands except percentages)
1. Organization.
Treasury Only Portfolio, Treasury Portfolio, Government Portfolio, Prime Money Market Portfolio, Money Market Portfolio and Tax-Exempt Portfolio (the Funds) are funds of Fidelity Colchester Street Trust (the Trust). Each Fund is authorized to issue an unlimited number of shares. The Trust is registered under the Investment Company Act of 1940, as amended (the 1940 Act), as an open-end management investment company organized as a Delaware statutory trust. Each Fund offers Class I, Class II, Class III and Select Class shares. Prime Money Market Portfolio, Treasury Only Portfolio and Treasury Portfolio also offer Class IV and Institutional Class shares. Government Portfolio also offers Institutional Class shares. Money Market Portfolio also offers Class F and Institutional Class shares. All classes have equal rights as to assets and voting privileges. Each Fund except for Tax-Exempt Portfolio offers conversion privileges from Class I to Institutional Class for eligible shareholders. Effective January 1, 2016, shares of the Money Market Portfolio and Tax-Exempt Portfolio are only available for purchase by retail shareholders. Class F shares of Money Market Portfolio are only available for purchase by mutual funds for which Fidelity Management & Research Company (FMR) or an affiliate serves as investment manager. Each class has exclusive voting rights with respect to matters that affect that class.
2. Investments in Fidelity Central Funds.
The Funds may invest in Fidelity Central Funds, which are open-end investment companies generally available only to other investment companies and accounts managed by the investment adviser and its affiliates. The Funds' Schedules of Investments list each of the Fidelity Central Funds held as of period end, if any, as an investment of each Fund, but do not include the underlying holdings of each Fidelity Central Fund. As an Investing Fund, each Fund indirectly bears its proportionate share of the expenses of the underlying Fidelity Central Funds.
The Money Market Central Funds seek preservation of capital and current income and are managed by Fidelity Investments Money Management, Inc. (FIMM), an affiliate of the investment adviser. Annualized expenses of the Money Market Central Funds as of their most recent shareholder report date are less than .005%
A complete unaudited list of holdings for each Fidelity Central Fund is available upon request or at the Securities and Exchange Commission (the SEC) website at www.sec.gov. In addition, the financial statements of the Fidelity Central Funds, which are not covered by the Funds' Report of Independent Registered Public Accounting Firm, are available on the SEC website or upon request.
3. Significant Accounting Policies.
The financial statements have been prepared in conformity with accounting principles generally accepted in the United States of America (GAAP), which require management to make certain estimates and assumptions at the date of the financial statements. Actual results could differ from those estimates. Subsequent events, if any, through the date that the financial statements were issued have been evaluated in the preparation of the financial statements. The following summarizes the significant accounting policies of the Funds:
Investment Valuation. Each Fund categorizes the inputs to valuation techniques used to value its investments into a disclosure hierarchy consisting of three levels as shown below:
- Level 1 – quoted prices in active markets for identical investments
- Level 2 – other significant observable inputs (including quoted prices for similar investments, interest rates, prepayment speeds, etc.)
- Level 3 – unobservable inputs (including the Fund's own assumptions based on the best information available)
As permitted by compliance with certain conditions under Rule 2a-7 of the 1940 Act, securities are valued at amortized cost, which approximates fair value. The amortized cost of an instrument is determined by valuing it at its original cost and thereafter amortizing any discount or premium from its face value at a constant rate until maturity. Securities held by a money market fund are generally high quality and liquid; however, they are reflected as Level 2 because the inputs used to determine fair value are not quoted prices in an active market.
Investment Transactions and Income. Security transactions, including the Funds' investment activity in the Fidelity Central Funds, are accounted for as of trade date. Gains and losses on securities sold are determined on the basis of identified cost. Income and capital gain distributions from Fidelity Central Funds, if any, are recorded on the ex-dividend date. Interest income is accrued as earned and includes coupon interest and amortization of premium and accretion of discount on debt securities as applicable. The principal amount on inflation-indexed securities is periodically adjusted to the rate of inflation and interest is accrued based on the principal amount. The adjustments to principal due to inflation are reflected as increases or decreases to Interest in the accompanying Statement of Operations.
Class Allocations and Expenses. Investment income, realized and unrealized capital gains and losses, common expenses of each Fund, and certain fund-level expense reductions, if any, are allocated daily on a pro-rata basis to each class based on the relative net assets of each class to the total net assets of each Fund. Each class differs with respect to transfer agent and distribution and service plan fees incurred. Certain expense reductions may also differ by class. For the reporting period, the allocated portion of income and expenses to each class as a percent of its average net assets may vary due to the timing of recording these transactions in relation to fluctuating net assets of the classes. Expenses directly attributable to a fund are charged to that fund. Expenses attributable to more than one fund are allocated among the respective funds on the basis of relative net assets or other appropriate methods. Expense estimates are accrued in the period to which they relate and adjustments are made when actual amounts are known.
Deferred Trustee Compensation. Under a Deferred Compensation Plan (the Plan) for Treasury Portfolio, Government Portfolio, Prime Money Market Portfolio, Money Market Portfolio and Tax-Exempt Portfolio, independent Trustees may elect to defer receipt of a portion of their annual compensation. Deferred amounts are invested in a cross-section of Fidelity funds, are marked-to-market and remain in the Fund until distributed in accordance with the Plan. The investment of deferred amounts and the offsetting payable to the Trustees are included in the accompanying Statement of Assets and Liabilities.
Income Tax Information and Distributions to Shareholders. Each year, each Fund intends to qualify as a regulated investment company under Subchapter M of the Internal Revenue Code, including distributing substantially all of its taxable income and realized gains. As a result, no provision for U.S. Federal income taxes is required. During the period, Treasury Only Portfolio incurred an excise tax liability on undistributed net investment income which is included in Miscellaneous expense on the Statement of Operations. As of March 31, 2016, each Fund did not have any unrecognized tax benefits in the financial statements; nor is each Fund aware of any tax positions for which it is reasonably possible that the total amounts of unrecognized tax benefits will significantly change in the next twelve months. Each Fund files a U.S. federal tax return, in addition to state and local tax returns as required. Each Fund's federal income tax returns are subject to examination by the Internal Revenue Service (IRS) for a period of three fiscal years after they are filed. State and local tax returns may be subject to examination for an additional fiscal year depending on the jurisdiction.
Dividends are declared and recorded daily and paid monthly from net investment income. Distributions from realized gains, if any, are declared and recorded on the ex-dividend date. Income dividends and capital gain distributions are declared separately for each class. Income and capital gain distributions are determined in accordance with income tax regulations, which may differ from GAAP. In addition, certain Funds claimed a portion of the payment made to redeeming shareholders as a distribution for income tax purposes.
Capital accounts within the financial statements are adjusted for permanent book-tax differences. These adjustments have no impact on net assets or the results of operations. Capital accounts are not adjusted for temporary book-tax differences which will reverse in a subsequent period.
Book-tax differences are primarily due to deferred trustees compensation, capital loss carryforwards and losses deferred due to wash sales and excise tax regulations.
The Tax-Exempt Portfolio purchases municipal securities whose interest, in the opinion of the issuer, is free from federal income tax. There is no assurance that the IRS will agree with this opinion. In the event the IRS determines that the issuer does not comply with relevant tax requirements, interest payments from a security could become federally taxable, possibly retroactively to the date the security was issued.
The federal tax cost of investment securities and unrealized appreciation (depreciation) as of period end were as follows for each Fund:
| | Tax cost | Gross unrealized appreciation | Gross unrealized depreciation | Net unrealized appreciation (depreciation) on securities |
| Treasury Only Portfolio | $13,613,748 | $– | $– | $– |
| Treasury Portfolio | 17,424,421 | – | – | – |
| Government Portfolio | 44,695,565 | – | – | – |
| Prime Money Market Portfolio | 58,555,449 | – | – | – |
| Money Market Portfolio | 45,212,385 | – | – | – |
| Tax-Exempt Portfolio | 1,614,720 | – | – | – |
The tax-based components of distributable earnings as of period end were as follows for each Fund:
| | Undistributed tax-exempt income | Undistributed ordinary income | Undistributed long-term capital gain | Capital loss carryforward | Net unrealized appreciation (depreciation) on securities and other investments |
| Treasury Only Portfolio | $– | $46 | $– | $– | $– |
| Treasury Portfolio | – | 149 | – | – | – |
| Government Portfolio | – | – | – | (804) | – |
| Prime Money Market Portfolio | – | 323 | – | – | – |
| Money Market Portfolio | – | 724 | – | – | – |
| Tax-Exempt Portfolio | 46 | – | – | – | – |
Capital loss carryforwards are only available to offset future capital gains of the Funds to the extent provided by regulations and may be limited. Under the Regulated Investment Company Modernization Act of 2010 (the Act), the Funds are permitted to carry forward capital losses incurred in taxable years beginning after December 22, 2010 for an unlimited period and such capital losses are required to be used prior to any losses that expire. The capital loss carryforward information presented below, including any applicable limitation, is estimated as of fiscal period end and is subject to adjustment.
| | Fiscal year of expiration |
| | 2019 |
| Government Portfolio | $(804) |
The tax character of distributions paid was as follows:
| March 31, 2016 | | | | |
| | Tax-Exempt Income | Ordinary Income | Long-term Capital Gains | Total |
| Treasury Only Portfolio | $– | $4,615 | $– | $4,615 |
| Treasury Portfolio | – | 6,744 | – | 6,744 |
| Government Portfolio | – | 20,503 | – | 20,503 |
| Prime Money Market Portfolio | – | 101,456 | – | 101,456 |
| Money Market Portfolio | – | 122,767 | – | 122,767 |
| Tax-Exempt Portfolio | 287 | – | 1,814 | 2,101 |
| March 31, 2015 | | | | |
| | Tax-Exempt Income | Ordinary Income | Long-term Capital Gains | Total |
| Treasury Only Portfolio | $– | $1,067 | $– | $1,067 |
| Treasury Portfolio | – | 1,446 | – | 1,446 |
| Government Portfolio | – | 2,610 | – | 2,610 |
| Prime Money Market Portfolio | – | 21,111 | – | 21,111 |
| Money Market Portfolio | – | 51,480 | – | 51,480 |
| Tax-Exempt Portfolio | 234 | – | 452 | 686 |
Repurchase Agreements. Pursuant to an Exemptive Order issued by the SEC, the Funds along with other registered investment companies having management contracts with FMR, or other affiliated entities of FMR, are permitted to transfer uninvested cash balances into joint trading accounts which are then invested in repurchase agreements. The Funds may also invest directly with institutions in repurchase agreements. For Treasury Only Portfolio, Treasury Portfolio and Government Portfolio, repurchase agreements may be collateralized by cash or government securities. For Prime Money Market Portfolio, Money Market Portfolio and Tax-Exempt Portfolio, repurchase agreements may be collateralized by government or non-government securities. Upon settlement date, collateral is held in segregated accounts with custodian banks and may be obtained in the event of a default of the counterparty. Each applicable Fund monitors, on a daily basis, the value of the collateral to ensure it is at least equal to the principal amount of the repurchase agreement (including accrued interest). In the event of a default by the counterparty, realization of the collateral proceeds could be delayed, during which time the value of the collateral may decline.
Reverse Repurchase Agreements. To enhance their yield, the Funds may enter into reverse repurchase transactions under master repurchase agreements whereby the Fund sells securities to a counterparty in return for cash and agrees to repurchase those securities at a future date and agreed upon price. During the period that reverse repurchase transactions are outstanding, each applicable fund identifies the securities as pledged in its records with an initial value at least equal to its principal obligation under the agreement. The cash proceeds received by the Funds may be invested in other securities. To the extent cash proceeds received from the counterparty exceed the value of the securities sold, the counterparty may request additional collateral from the Fund. If the counterparty defaults on its obligation, because of insolvency or other reasons, the Fund could experience delays and costs in recovering the securities sold. Information regarding securities sold under a reverse repurchase agreement, if any, is included at the end of each applicable Fund's Schedule of Investments and the cash proceeds are recorded as a liability in each applicable fund's accompanying Statement of Assets and Liabilities. The Fund continues to receive interest and dividend payments on the securities sold during the term of the reverse repurchase agreement. At period end, there were no reverse repurchase agreements outstanding.
Delayed Delivery Transactions and When-Issued Securities. During the period, the Funds transacted in securities on a delayed delivery or when-issued basis. Payment and delivery may take place after the customary settlement period for that security. The price of the underlying securities and the date when the securities will be delivered and paid for are fixed at the time the transaction is negotiated. The securities purchased on a delayed delivery or when-issued basis are identified as such in each applicable Fund's Schedule of Investments. The Funds may receive compensation for interest forgone in the purchase of a delayed delivery or when-issued security. With respect to purchase commitments, each applicable Fund identifies securities as segregated in its records with a value at least equal to the amount of the commitment. Losses may arise due to changes in the value of the underlying securities or if the counterparty does not perform under the contract's terms, or if the issuer does not issue the securities due to political, economic, or other factors.
Restricted Securities. The Funds may invest in securities that are subject to legal or contractual restrictions on resale. These securities generally may be resold in transactions exempt from registration or to the public if the securities are registered. Disposal of these securities may involve time-consuming negotiations and expense, and prompt sale at an acceptable price may be difficult. Information regarding restricted securities is included at the end of each applicable Fund's Schedule of Investments.
4. Fees and Other Transactions with Affiliates.
Management Fee. Fidelity Management & Research Company (the investment adviser) and its affiliates provide the Funds with investment management related services for which the Funds pay a monthly management fee that is based on an annual rate of .14% of average net assets.
Distribution and Service Plan Fees. In accordance with Rule 12b-1 of the 1940 Act, the Funds have adopted separate Distribution and Service Plans for each class of shares. Class II, Class III and Select Class of each Fund pays Fidelity Distributors Corporation (FDC), an affiliate of the investment adviser, a Service fee based on an annual percentage of each class' average net assets. Class IV of Treasury Only Portfolio, Treasury Portfolio and Prime Money Market Portfolio pays FDC separate Distribution and Service Fees, each of which is based on an annual percentage of each class' average net assets. FDC may pay financial intermediaries for selling shares of the Funds and providing shareholder support services. For the period, the Distribution and Service fee rates, total fees and amounts retained by FDC were as follows:
| | Distribution
Fee | Service
Fee |
| Class II | .00% | .15% |
| Class III | .00% | .25% |
| Class IV | .25% | .25% |
| Select Class | .00% | .05% |
| | Total Fees | Retained
by FDC |
| Treasury Only Portfolio: | | |
| Class II | $452 | $– |
| Class III | 1,729 | 80 |
| Class IV | 1,633 | – |
| Select Class | 82 | – |
| | $3,896 | $80 |
Treasury Portfolio:
| | |
| Class II | $745 | $– |
| Class III | 6,736 | 260 |
| Class IV | 3,421 | – |
| Select Class | 112 | – |
| | $11,014 | $260 |
Government Portfolio:
| | |
| Class II | $595 | $103 |
| Class III | 4,717 | 208 |
| Select Class | 151 | – |
| | $5,463 | $311 |
Prime Money Market Portfolio:
| | |
| Class II | $500 | $32 |
| Class III | 2,478 | 53 |
| Class IV | 959 | – |
| Select Class | 566 | 24 |
| | $4,503 | $109 |
Money Market Portfolio:
| | |
| Class II | $173 | $14 |
| Class III | 4,201 | – |
| Select Class | 197 | 159 |
| | $4,571 | $173 |
Tax-Exempt Portfolio:
| | |
| Class II | $14 | $– |
| Class III | 746 | – |
| Select Class | 2 | – |
| | $762 | $– |
During the period, the investment adviser or its affiliates waived a portion of these fees.
Transfer Agent Fees. Pursuant to the transfer agent contract approved by the Board of Trustees effective May 1, 2015, Fidelity Investments Institutional Operations Company, Inc. (FIIOC), an affiliate of the investment adviser, is the transfer, dividend disbursing and shareholder servicing agent for the Funds. FIIOC receives asset-based fees with respect to each account. FIIOC pays for typesetting, printing and mailing of all shareholder reports, except proxy statements. Each class, with the exception of Institutional Class, pays a transfer agent fee equal to an annual rate of .06% of class-level average net assets. Institutional Class pays a transfer agent fee equal to an annual rate of .03% of class-level average net assets. FIIOC receives no fees for providing transfer agency services to Class F. For the period, transfer agent fees for each class were as follows:
| Treasury Only Portfolio | |
| Class I | $5,757 |
| Class II | 181 |
| Class III | 415 |
| Class IV | 196 |
| Select Class | 99 |
| Institutional Class | 141 |
| | $6,789 |
| Treasury Portfolio | |
| Class I | $6,278 |
| Class II | 298 |
| Class III | 1,616 |
| Class IV | 411 |
| Select Class | 135 |
| Institutional Class | 311 |
| | $9,049 |
| Government Portfolio | |
| Class I | $12,577 |
| Class II | 238 |
| Class III | 1,132 |
| Select Class | 181 |
| Institutional Class | 1,218 |
| | $15,346 |
| Prime Money Market Portfolio | |
| Class I | $5,699 |
| Class II | 200 |
| Class III | 595 |
| Class IV | 115 |
| Select Class | 679 |
| Institutional Class | 11,137 |
| | $18,425 |
| Money Market Portfolio | |
| Class I | $13,464 |
| Class II | 69 |
| Class III | 1,008 |
| Select Class | 236 |
| Institutional Class | 11,141 |
| | $25,918 |
| Tax-Exempt Portfolio | |
| Class I | $1,272 |
| Class II | 6 |
| Class III | 179 |
| Select Class | 3 |
| | $1,460 |
During the period, the investment adviser or its affiliates waived a portion of these fees.
Prior to May 1, 2015, Citibank, N.A. was the transfer, dividend disbursing and shareholder servicing agent for Tax-Exempt Portfolio. Prior to May 8, 2015, Citibank, N.A. was the custodian for Tax-Exempt Portfolio.
Accounting Fees. Fidelity Service Company, Inc. (FSC), an affiliate of the investment adviser, maintains each Fund's accounting records. The fee is based on the level of average net assets for each month.
Interfund Trades. The Funds may purchase from or sell securities to other Fidelity Funds under procedures adopted by the Board. The procedures have been designed to ensure these interfund trades are executed in accordance with Rule 17a-7 of the 1940 Act.
Other. During the period, the investment adviser reimbursed Money Market Portfolio for certain losses in the amount of $1.
5. Expense Reductions.
The investment adviser contractually agreed to reimburse funds to the extent annual operating expenses exceeded certain levels of average net assets as noted in the table below. This reimbursement will remain in place through May 31, 2017. Some expenses, for example interest expense, are excluded from this reimbursement.
The following classes of each applicable Fund were in reimbursement during the period:
| | Expense
Limitations | Reimbursement |
| Treasury Only Portfolio | | |
| Class I | .18% | $3,168 |
| Class II | .33% | 99 |
| Class III | .43% | 228 |
| Class IV | .68% | 106 |
| Select Class | .23% | 56 |
| Institutional Class | .14% | 206 |
| Treasury Portfolio | | |
| Class I | .18% | $3,207 |
| Class II | .33% | 156 |
| Class III | .43% | 814 |
| Class IV | .68% | 211 |
| Select Class | .23% | 68 |
| Institutional Class | .14% | 418 |
| Government Portfolio | | |
| Class I | .18% | $6,050 |
| Class II | .33% | 112 |
| Class III | .43% | 541 |
| Select Class | .23% | 87 |
| Institutional Class | .14% | 1,561 |
| Prime Money Market Portfolio | | |
| Class I | .18% | $2,569 |
| Class II | .33% | 91 |
| Class III | .43% | 272 |
| Class IV | .68% | 52 |
| Select Class | .23% | 305 |
| Institutional Class | .14% | 13,752 |
| Money Market Portfolio | | |
| Class I | .18% | $6,208 |
| Class II | .33% | 32 |
| Class III | .43% | 457 |
| Select Class | .23% | 110 |
| Class F | .14% | 189 |
| Institutional Class | .14% | 13,998 |
| Tax-Exempt Portfolio | | |
| Class I | .18% | $812 |
| Class II | .33% | 4 |
| Class III | .43% | 116 |
| Select Class | .23% | 2 |
Additionally, the investment adviser or its affiliates voluntarily agreed to waive certain fees in order to maintain a minimum annualized yield of .01%. Such arrangements may be discontinued by the investment adviser at any time. For the period, the amount of the waiver for each class was as follows:
| Treasury Only Portfolio | |
| Class I | $6,890 |
| Class II | 590 |
| Class III | 1,950 |
| Class IV | 1,763 |
| Select Class | 183 |
| Institutional Class | 101 |
| Treasury Portfolio | |
| Class I | $4,885 |
| Class II | 540 |
| Class III | 6,886 |
| Class IV | 3,387 |
| Select Class | 180 |
| Institutional Class | 118 |
| Government Portfolio | |
| Class I | $4,567 |
| Class II | 526 |
| Class III | 4,209 |
| Select Class | 192 |
| Institutional Class | 22 |
| Prime Money Market Portfolio | |
| Class II | $181 |
| Class III | 1,226 |
| Class IV | 666 |
| Select Class | 1 |
| Money Market Portfolio | |
| Class II | $39 |
| Class III | 1,833 |
| Tax-Exempt Portfolio | |
| Class I | $2,660 |
| Class II | 26 |
| Class III | 1,109 |
| Class IV | 8 |
In addition, through arrangements with each applicable Fund's custodian, credits realized as a result of certain uninvested cash balances were used to reduce each Fund's expenses. All of the applicable expense reductions are noted in the table below.
| | Custody
expense
reduction |
| Treasury Only Portfolio | $17 |
| Treasury Portfolio | – |
| Government Portfolio | 5 |
| Prime Money Market Portfolio | 7 |
| Money Market Portfolio | 10 |
| Tax-Exempt Portfolio | 19 |
In addition, during the period the investment adviser reimbursed and/or waived a portion of operating expenses as follows:
| | Amount |
| Treasury Only Portfolio | $2 |
| Treasury Portfolio | – |
| Government Portfolio | – |
| Prime Money Market Portfolio | – |
| Money Market Portfolio | – |
| Tax-Exempt Portfolio | – |
6. Distributions to Shareholders.
Distributions to shareholders of each class were as follows:
| | Year ended March 31,
2016 | Year ended March 31, 2015 |
| Treasury Only Portfolio(a) | | |
| From net investment income | | |
| Class I | $3,944 | $936 |
| Class II | 33 | 33 |
| Class III | 69 | 61 |
| Class IV | 33 | 6 |
| Select Class | 39 | 25 |
| Institutional Class | 497 | 6 |
| Total | $4,615 | $1,067 |
| Treasury Portfolio(a) | | |
| From net investment income | | |
| Class I | $5,136 | $1,049 |
| Class II | 64 | 8 |
| Class III | 271 | 282 |
| Class IV | 69 | 53 |
| Select Class | 87 | 21 |
| Institutional Class | 1,117 | 33 |
| Total | $6,744 | $1,446 |
| Government Portfolio(a) | | |
| From net investment income | | |
| Class I | $13,726 | $2,229 |
| Class II | 81 | 51 |
| Class III | 189 | 222 |
| Select Class | 117 | 49 |
| Institutional Class | 6,390 | 59 |
| Total | $20,503 | $2,610 |
| Prime Money Market Portfolio | | |
| From net investment income | | |
| Class I | $17,794 | $797 |
| Class II | 178 | 52 |
| Class III | 324 | 136 |
| Class IV | 19 | 17 |
| Select Class | 1,387 | 109 |
| Institutional Class | 81,754 | 20,000 |
| Total | $101,456 | $21,111 |
| Money Market Portfolio | | |
| From net investment income | | |
| Class I | $39,384 | $12,363 |
| Class II | 59 | 12 |
| Class III | 437 | 158 |
| Select Class | 412 | 58 |
| Class F | 5,349 | 1,969 |
| Institutional Class | 77,126 | 36,920 |
| Total | $122,767 | $51,480 |
| Tax-Exempt Portfolio | | |
| From net investment income | | |
| Class I | $256 | $207 |
| Class II | 1 | 1 |
| Class III | 30 | 25 |
| Select Class | – | 1 |
| Total | $287 | $234 |
| From net realized gain | | |
| Class I | $1,590 | $403 |
| Class II | 6 | 2 |
| Class III | 215 | 46 |
| Select Class | 3 | 1 |
| Total | $1,814 | $452 |
(a) Distributions for 2015 for Institutional Class are for the period May 14, 2014 (commencement of sale of shares) to March 31, 2015.
7. Share Transactions.
Share transactions for each class of shares at a $1.00 per share were as follows and may contain automatic conversions between classes or exchanges between affiliated funds:
| | Year ended March 31, 2016 | Year ended March 31, 2015 |
| Treasury Only Portfolio(a) | | |
| Class I | | |
| Shares sold | 23,930,981 | 21,398,000 |
| Reinvestment of distributions | 2,493 | 686 |
| Shares redeemed | (23,300,949) | (21,791,411) |
| Net increase (decrease) | 632,525 | (392,725) |
| Class II | | |
| Shares sold | 468,539 | 689,918 |
| Reinvestment of distributions | 16 | 16 |
| Shares redeemed | (471,381) | (739,099) |
| Net increase (decrease) | (2,826) | (49,165) |
| Class III | | |
| Shares sold | 3,609,622 | 3,137,828 |
| Reinvestment of distributions | 22 | 16 |
| Shares redeemed | (3,413,941) | (2,990,129) |
| Net increase (decrease) | 195,703 | 147,715 |
| Class IV | | |
| Shares sold | 575,857 | 325,586 |
| Reinvestment of distributions | 33 | 6 |
| Shares redeemed | (351,664) | (230,328) |
| Net increase (decrease) | 224,226 | 95,264 |
| Select Class | | |
| Shares sold | 1,886,187 | 1,834,552 |
| Reinvestment of distributions | 33 | 22 |
| Shares redeemed | (1,900,313) | (1,855,918) |
| Net increase (decrease) | (14,093) | (21,344) |
| Institutional Class | | |
| Shares sold | 2,583,114 | 306,916 |
| Reinvestment of distributions | 334 | 6 |
| Shares redeemed | (778,317) | (180,468) |
| Net increase (decrease) | 1,805,131 | 126,454 |
| Treasury Portfolio(a) | | |
| Class I | | |
| Shares sold | 77,692,489 | 66,889,394 |
| Reinvestment of distributions | 2,220 | 513 |
| Shares redeemed | (79,782,544) | (64,897,895) |
| Net increase (decrease) | (2,087,835) | 1,992,012 |
| Class II | | |
| Shares sold | 3,132,744 | 1,241,566 |
| Reinvestment of distributions | 1 | 2 |
| Shares redeemed | (2,646,421) | (1,304,122) |
| Net increase (decrease) | 486,324 | (62,554) |
| Class III | | |
| Shares sold | 8,969,249 | 13,475,771 |
| Reinvestment of distributions | 35 | 34 |
| Shares redeemed | (8,974,000) | (13,263,793) |
| Net increase (decrease) | (4,716) | 212,012 |
| Class IV | | |
| Shares sold | 1,359,716 | 968,397 |
| Reinvestment of distributions | – | – |
| Shares redeemed | (1,075,523) | (938,237) |
| Net increase (decrease) | 284,193 | 30,160 |
| Select Class | | |
| Shares sold | 1,469,924 | 422,029 |
| Reinvestment of distributions | 49 | 12 |
| Shares redeemed | (1,407,519) | (435,878) |
| Net increase (decrease) | 62,454 | (13,837) |
| Institutional Class | | |
| Shares sold | 8,440,821 | 1,905,153 |
| Reinvestment of distributions | 954 | 33 |
| Shares redeemed | (5,906,037) | (1,236,000) |
| Net increase (decrease) | 2,535,738 | 669,186 |
| Government Portfolio(a) | | |
| Class I | | |
| Shares sold | 140,405,028 | 161,620,795 |
| Reinvestment of distributions | 5,103 | 1,075 |
| Shares redeemed | (137,697,131) | (164,857,416) |
| Net increase (decrease) | 2,713,000 | (3,235,546) |
| Class II | | |
| Shares sold | 7,709,478 | 9,821,636 |
| Reinvestment of distributions | 22 | 13 |
| Shares redeemed | (7,763,586) | (9,638,697) |
| Net increase (decrease) | (54,086) | 182,952 |
| Class III | | |
| Shares sold | 5,143,852 | 6,655,013 |
| Reinvestment of distributions | 43 | 53 |
| Shares redeemed | (5,306,134) | (6,801,277) |
| Net increase (decrease) | (162,239) | (146,211) |
| Select Class | | |
| Shares sold | 1,343,910 | 1,466,405 |
| Reinvestment of distributions | 74 | 22 |
| Shares redeemed | (1,744,490) | (1,158,378) |
| Net increase (decrease) | (400,506) | 308,049 |
| Institutional Class | | |
| Shares sold | 109,287,709 | 2,243,297 |
| Reinvestment of distributions | 4,948 | 57 |
| Shares redeemed | (91,519,927) | (735,841) |
| Net increase (decrease) | 17,772,730 | 1,057,513 |
| Prime Money Market Portfolio | | |
| Class I | | |
| Shares sold | 117,973,183 | 41,693,479 |
| Reinvestment of distributions | 6,449 | 268 |
| Shares redeemed | (114,578,138) | (43,273,386) |
| Net increase (decrease) | 3,401,494 | (1,579,639) |
| Class II | | |
| Shares sold | 1,906,686 | 2,783,504 |
| Reinvestment of distributions | 32 | 19 |
| Shares redeemed | (2,115,257) | (2,749,252) |
| Net increase (decrease) | (208,539) | 34,271 |
| Class III | | |
| Shares sold | 5,517,790 | 5,275,217 |
| Reinvestment of distributions | 62 | 30 |
| Shares redeemed | (5,634,833) | (6,230,386) |
| Net increase (decrease) | (116,981) | (955,139) |
| Class IV | | |
| Shares sold | 136,156 | 313,887 |
| Reinvestment of distributions | 19 | 15 |
| Shares redeemed | (159,570) | (207,043) |
| Net increase (decrease) | (23,395) | 106,859 |
| Select Class | | |
| Shares sold | 6,946,481 | 6,592,726 |
| Reinvestment of distributions | 587 | 38 |
| Shares redeemed | (7,244,431) | (6,697,494) |
| Net increase (decrease) | (297,363) | (104,730) |
| Institutional Class | | |
| Shares sold | 505,615,310 | 439,027,791 |
| Reinvestment of distributions | 48,811 | 11,848 |
| Shares redeemed | (491,707,571) | (433,407,218) |
| Net increase (decrease) | 13,956,550 | 5,632,421 |
| Money Market Portfolio | | |
| Class I | | |
| Shares sold | 98,348,331 | 102,346,461 |
| Reinvestment of distributions | 28,391 | 8,989 |
| Shares redeemed | (100,118,863) | (103,411,999) |
| Net increase (decrease) | (1,742,141) | (1,056,549) |
| Class II | | |
| Shares sold | 952,260 | 997,409 |
| Reinvestment of distributions | 45 | 9 |
| Shares redeemed | (971,326) | (1,052,646) |
| Net increase (decrease) | (19,021) | (55,228) |
| Class III | | |
| Shares sold | 8,694,671 | 8,948,877 |
| Reinvestment of distributions | 134 | 63 |
| Shares redeemed | (9,019,943) | (9,329,233) |
| Net increase (decrease) | (325,138) | (380,293) |
| Select Class | | |
| Shares sold | 888,733 | 1,110,962 |
| Reinvestment of distributions | 77 | 13 |
| Shares redeemed | (1,071,857) | (1,034,939) |
| Net increase (decrease) | (183,047) | 76,036 |
| Class F | | |
| Shares sold | 1,731,609 | 815,467 |
| Reinvestment of distributions | 5,349 | 1,962 |
| Shares redeemed | (1,496,721) | (888,771) |
| Net increase (decrease) | 240,237 | (71,342) |
| Institutional Class | | |
| Shares sold | 194,088,843 | 231,968,664 |
| Reinvestment of distributions | 54,657 | 26,752 |
| Shares redeemed | (209,197,535) | (235,224,144) |
| Net increase (decrease) | (15,054,035) | (3,228,728) |
| Tax-Exempt Portfolio | | |
| Class I | | |
| Shares sold | 3,853,663 | 4,124,009 |
| Reinvestment of distributions | 864 | 327 |
| Shares redeemed | (4,589,991) | (4,013,983) |
| Net increase (decrease) | (735,464) | 110,353 |
| Class II | | |
| Shares sold | 398 | 957 |
| Reinvestment of distributions | 7 | 3 |
| Shares redeemed | (12,033) | (408) |
| Net increase (decrease) | (11,628) | 552 |
| Class III | | |
| Shares sold | 2,845,086 | 1,817,373 |
| Reinvestment of distributions | 74 | 21 |
| Shares redeemed | (2,914,558) | (1,807,559) |
| Net increase (decrease) | (69,398) | 9,835 |
| Select Class | | |
| Shares sold | 30,765 | 35,649 |
| Reinvestment of distributions | 1 | –(b) |
| Shares redeemed | (31,384) | (38,442) |
| Net increase (decrease) | (618) | (2,793) |
(a) Share transactions for 2015 for Institutional Class are for the period May 14, 2014 (commencement of sale of shares) to March 31, 2015.
(b) In the amount of less than five hundred shares.
8. Other.
The Funds' organizational documents provide former and current trustees and officers with a limited indemnification against liabilities arising in connection with the performance of their duties to the Funds. In the normal course of business, the Funds may also enter into contracts that provide general indemnifications. The Funds' maximum exposure under these arrangements is unknown as this would be dependent on future claims that may be made against the Funds. The risk of material loss from such claims is considered remote.
At the end of the period, the investment adviser or its affiliates were the owners of record of more than 10% of the total outstanding shares of the following funds:
| Fund | Affiliated % |
| Government Portfolio | 10% |
Report of Independent Registered Public Accounting Firm
To the Trustees of Fidelity Colchester Street Trust and the Shareholders of Tax-Exempt Portfolio, Government Portfolio, Money Market Portfolio, Treasury Only Portfolio, Prime Money Market Portfolio and Treasury Portfolio:
We have audited the accompanying statements of assets and liabilities of Tax-Exempt Portfolio, Government Portfolio, Money Market Portfolio, Treasury Only Portfolio, Prime Money Market Portfolio and Treasury Portfolio (the Funds), each a fund of Fidelity Colchester Street Trust, including the schedules of investments, as of March 31, 2016, and the related statements of operations for the year then ended, the statements of changes in net assets for each of the two years in the period then ended, and the financial highlights for each of the five years in the period then ended. These financial statements and financial highlights are the responsibility of the Funds' management. Our responsibility is to express an opinion on these financial statements and financial highlights based on our audits.
We conducted our audits in accordance with the standards of the Public Company Accounting Oversight Board (United States). Those standards require that we plan and perform the audit to obtain reasonable assurance about whether the financial statements and financial highlights are free of material misstatement. The Funds are not required to have, nor were we engaged to perform, an audit of their internal control over financial reporting. Our audits included consideration of internal control over financial reporting as a basis for designing audit procedures that are appropriate in the circumstances, but not for the purpose of expressing an opinion on the effectiveness of the Funds' internal control over financial reporting. Accordingly, we express no such opinion. An audit also includes examining, on a test basis, evidence supporting the amounts and disclosures in the financial statements, assessing the accounting principles used and significant estimates made by management, as well as evaluating the overall financial statement presentation. Our procedures included confirmation of securities owned as of March 31, 2016, by correspondence with the custodians and brokers; when replies were not received from brokers, we performed other auditing procedures. We believe that our audits provide a reasonable basis for our opinion.
In our opinion, such financial statements and financial highlights referred to above present fairly, in all material respects, the financial position of Tax-Exempt Portfolio, Government Portfolio, Money Market Portfolio, Treasury Only Portfolio, Prime Money Market Portfolio and Treasury Portfolio as of March 31, 2016, the results of their operations for the year then ended, the changes in their net assets for each of the two years in the period then ended, and the financial highlights for each of the five years in the period then ended, in conformity with accounting principles generally accepted in the United States of America.
DELOITTE & TOUCHE LLP
Boston, Massachusetts
May 31, 2016
Trustees and Officers
The Trustees, Members of the Advisory Board (if any), and officers of the trust and funds, as applicable, are listed below. The Board of Trustees governs each fund and is responsible for protecting the interests of shareholders. The Trustees are experienced executives who meet periodically throughout the year to oversee each fund's activities, review contractual arrangements with companies that provide services to each fund, oversee management of the risks associated with such activities and contractual arrangements, and review each fund's performance. Except for Geoffrey A. von Kuhn, each of the Trustees oversees 240 funds. Mr. von Kuhn oversees 187 funds.
The Trustees hold office without limit in time except that (a) any Trustee may resign; (b) any Trustee may be removed by written instrument, signed by at least two-thirds of the number of Trustees prior to such removal; (c) any Trustee who requests to be retired or who has become incapacitated by illness or injury may be retired by written instrument signed by a majority of the other Trustees; and (d) any Trustee may be removed at any special meeting of shareholders by a two-thirds vote of the outstanding voting securities of the trust. Each Trustee who is not an interested person (as defined in the 1940 Act) of the trust and the funds is referred to herein as an Independent Trustee. Each Independent Trustee shall retire not later than the last day of the calendar year in which his or her 75th birthday occurs. The Independent Trustees may waive this mandatory retirement age policy with respect to individual Trustees. Officers and Advisory Board Members hold office without limit in time, except that any officer or Advisory Board Member may resign or may be removed by a vote of a majority of the Trustees at any regular meeting or any special meeting of the Trustees. Except as indicated, each individual has held the office shown or other offices in the same company for the past five years.
Each fund’s Statement of Additional Information (SAI) includes more information about the Trustees. To request a free copy, call Fidelity at 1-877-297-2952 or, for Class F, call 1-800-835-5092.
Experience, Skills, Attributes, and Qualifications of the Trustees. The Governance and Nominating Committee has adopted a statement of policy that describes the experience, qualifications, attributes, and skills that are necessary and desirable for potential Independent Trustee candidates (Statement of Policy). The Board believes that each Trustee satisfied at the time he or she was initially elected or appointed a Trustee, and continues to satisfy, the standards contemplated by the Statement of Policy. The Governance and Nominating Committee also engages professional search firms to help identify potential Independent Trustee candidates who have the experience, qualifications, attributes, and skills consistent with the Statement of Policy. From time to time, additional criteria based on the composition and skills of the current Independent Trustees, as well as experience or skills that may be appropriate in light of future changes to board composition, business conditions, and regulatory or other developments, have also been considered by the professional search firms and the Governance and Nominating Committee. In addition, the Board takes into account the Trustees' commitment and participation in Board and committee meetings, as well as their leadership of standing and ad hoc committees throughout their tenure.
In determining that a particular Trustee was and continues to be qualified to serve as a Trustee, the Board has considered a variety of criteria, none of which, in isolation, was controlling. The Board believes that, collectively, the Trustees have balanced and diverse experience, qualifications, attributes, and skills, which allow the Board to operate effectively in governing each fund and protecting the interests of shareholders. Information about the specific experience, skills, attributes, and qualifications of each Trustee, which in each case led to the Board's conclusion that the Trustee should serve (or continue to serve) as a trustee of the funds, is provided below.
Board Structure and Oversight Function. Abigail P. Johnson is an interested person and currently serves as Chairman. The Trustees have determined that an interested Chairman is appropriate and benefits shareholders because an interested Chairman has a personal and professional stake in the quality and continuity of services provided to the funds. Independent Trustees exercise their informed business judgment to appoint an individual of their choosing to serve as Chairman, regardless of whether the Trustee happens to be independent or a member of management. The Independent Trustees have determined that they can act independently and effectively without having an Independent Trustee serve as Chairman and that a key structural component for assuring that they are in a position to do so is for the Independent Trustees to constitute a substantial majority for the Board. The Independent Trustees also regularly meet in executive session. Marie L. Knowles serves as Chairman of the Independent Trustees and as such (i) acts as a liaison between the Independent Trustees and management with respect to matters important to the Independent Trustees and (ii) with management prepares agendas for Board meetings.
Fidelity® funds are overseen by different Boards of Trustees. The funds' Board oversees Fidelity's investment-grade bond, money market, asset allocation and certain equity funds, and other Boards oversee Fidelity's high income, sector and other equity funds. The asset allocation funds may invest in Fidelity® funds that are overseen by such other Boards. The use of separate Boards, each with its own committee structure, allows the Trustees of each group of Fidelity® funds to focus on the unique issues of the funds they oversee, including common research, investment, and operational issues. On occasion, the separate Boards establish joint committees to address issues of overlapping consequences for the Fidelity® funds overseen by each Board.
The Trustees operate using a system of committees to facilitate the timely and efficient consideration of all matters of importance to the Trustees, each fund, and fund shareholders and to facilitate compliance with legal and regulatory requirements and oversight of the funds' activities and associated risks. The Board, acting through its committees, has charged FMR and its affiliates with (i) identifying events or circumstances the occurrence of which could have demonstrably adverse effects on the funds' business and/or reputation; (ii) implementing processes and controls to lessen the possibility that such events or circumstances occur or to mitigate the effects of such events or circumstances if they do occur; and (iii) creating and maintaining a system designed to evaluate continuously business and market conditions in order to facilitate the identification and implementation processes described in (i) and (ii) above. Because the day-to-day operations and activities of the funds are carried out by or through FMR, its affiliates, and other service providers, the funds' exposure to risks is mitigated but not eliminated by the processes overseen by the Trustees. While each of the Board's committees has responsibility for overseeing different aspects of the funds' activities, oversight is exercised primarily through the Operations and Audit Committees. In addition, an ad hoc Board committee of Independent Trustees has worked with FMR to enhance the Board's oversight of investment and financial risks, legal and regulatory risks, technology risks, and operational risks, including the development of additional risk reporting to the Board. The Operations Committee also worked and continues to work with FMR to enhance the stress tests required under SEC regulations for money market funds. Appropriate personnel, including but not limited to the funds' Chief Compliance Officer (CCO), FMR's internal auditor, the independent accountants, the funds' Treasurer and portfolio management personnel, make periodic reports to the Board's committees, as appropriate, including an annual review of Fidelity's risk management program for the Fidelity® funds. The responsibilities of each standing committee, including their oversight responsibilities, are described further under "Standing Committees of the Trustees."
Interested Trustees*:
Correspondence intended for a Trustee who is an interested person may be sent to Fidelity Investments, 245 Summer Street, Boston, Massachusetts 02210.
Name, Year of Birth; Principal Occupations and Other Relevant Experience+
Abigail P. Johnson (1961)
Year of Election or Appointment: 2009
Trustee
Chairman of the Board of Trustees
Ms. Johnson also serves as Trustee of other Fidelity® funds. Ms. Johnson serves as President (2013-present) and Chief Executive Officer (2014-present) of FMR LLC (diversified financial services company), President of Fidelity Financial Services (2012-present) and President of Personal, Workplace and Institutional Services (2005-present). Ms. Johnson is Chairman and Director of FMR Co., Inc. (investment adviser firm, 2011-present), Chairman and Director of FMR (investment adviser firm, 2011-present), and the Vice Chairman and Director (2007-present) of FMR LLC. Previously, Ms. Johnson served as President and a Director of FMR (2001-2005), a Trustee of other investment companies advised by FMR, Fidelity Investments Money Management, Inc. (investment adviser firm), and FMR Co., Inc. (2001-2005), Senior Vice President of the Fidelity® funds (2001-2005), and managed a number of Fidelity® funds. Ms. Abigail P. Johnson and Mr. Arthur E. Johnson are not related.
Geoffrey A. von Kuhn (1951)
Year of Election or Appointment: 2015
Trustee
Mr. von Kuhn also serves as Trustee or Member of the Advisory Board of other Fidelity® funds. Mr. von Kuhn is Chief Administrative Officer for FMR LLC (diversified financial services company, 2013-present), a Director of Pembroke Real Estate, Inc. (2009-present), and a Director of Discovery Natural Resources LLC (2012-present). Previously, Mr. von Kuhn was a managing director of Crosby Group (private wealth management company, 2007-2013), a member of the management committee and senior executive in the Wealth Management Group of AmSouth Bank (2001-2006), and head of the U.S. private bank at Citigroup (2000-2001).
* Determined to be an “Interested Trustee” by virtue of, among other things, his or her affiliation with the trust or various entities under common control with FMR.
+ The information includes the Trustee's principal occupation during the last five years and other information relating to the experience, attributes, and skills relevant to the Trustee's qualifications to serve as a Trustee, which led to the conclusion that the Trustee should serve as a Trustee for each fund.
Independent Trustees:
Correspondence intended for an Independent Trustee may be sent to Fidelity Investments, P.O. Box 55235, Boston, Massachusetts 02205-5235.
Name, Year of Birth; Principal Occupations and Other Relevant Experience+
Elizabeth S. Acton (1951)
Year of Election or Appointment: 2015
Trustee
Ms. Acton also serves as Trustee of other Fidelity® funds. Prior to her retirement in April 2012, Ms. Acton was Executive Vice President, Finance (2011-2012), Executive Vice President, Chief Financial Officer (2002-2011), and Treasurer (2004-2005) of Comerica Incorporated (financial services). Prior to joining Comerica, Ms. Acton held a variety of positions at Ford Motor Company (1983-2002), including Vice President and Treasurer (2000-2002) and Executive Vice President and Chief Financial Officer of Ford Motor Credit Company (1998-2000). Ms. Acton currently serves as a member of the Board of Directors and Audit and Finance Committees of Beazer Homes USA, Inc. (homebuilding, 2012-present). Previously, Ms. Acton served as a Member of the Advisory Board of certain Fidelity® funds (2013-2016).
John Engler (1948)
Year of Election or Appointment: 2015
Trustee
Mr. Engler also serves as Trustee of other Fidelity® funds. He serves as president of the Business Roundtable (2011-present), and on the board of directors for Universal Forest Products (manufacturer and distributor of wood and wood-alternative products, 2003-present) and K12 Inc. (technology-based education company, 2012-present). Previously, Mr. Engler served as a Member of the Advisory Board of certain Fidelity® funds (2014-2016), a trustee of The Munder Funds (2003-2014), president and CEO of the National Association of Manufacturers (2004-2011), member of the Board of Trustees of the Annie E. Casey Foundation (2004-2015), and as governor of Michigan (1991-2003). He is a past chairman of the National Governors Association.
Albert R. Gamper, Jr. (1942)
Year of Election or Appointment: 2006
Trustee
Mr. Gamper also serves as Trustee of other Fidelity® funds. Prior to his retirement in December 2004, Mr. Gamper served as Chairman of the Board of CIT Group Inc. (commercial finance). During his tenure with CIT Group Inc. Mr. Gamper served in numerous senior management positions, including Chairman (1987-1989; 1999-2001; 2002-2004), Chief Executive Officer (1987-2004), and President (2002-2003). Mr. Gamper currently serves as a member of the Board of Directors of Public Service Enterprise Group (utilities, 2000-present), and Member of the Board of Trustees of Barnabas Health Care System (1997-present). Previously, Mr. Gamper served as Chairman (2012-2015) and Vice Chairman (2011-2012) of the Independent Trustees of certain Fidelity® funds and as Chairman of the Board of Governors, Rutgers University (2004-2007).
Robert F. Gartland (1951)
Year of Election or Appointment: 2010
Trustee
Mr. Gartland also serves as Trustee of other Fidelity® funds. Mr. Gartland is Chairman and an investor in Gartland and Mellina Group Corp. (consulting, 2009-present). Previously, Mr. Gartland served as a partner and investor of Vietnam Partners LLC (investments and consulting, 2008-2011). Prior to his retirement, Mr. Gartland held a variety of positions at Morgan Stanley (financial services, 1979-2007) including Managing Director (1987-2007).
Arthur E. Johnson (1947)
Year of Election or Appointment: 2008
Trustee
Vice Chairman of the Independent Trustees
Mr. Johnson also serves as Trustee of other Fidelity® funds. Mr. Johnson serves as a member of the Board of Directors of Eaton Corporation plc (diversified power management, 2009-present), AGL Resources, Inc. (holding company, 2002-present) and Booz Allen Hamilton (management consulting, 2011-present). Prior to his retirement, Mr. Johnson served as Senior Vice President of Corporate Strategic Development of Lockheed Martin Corporation (defense contractor, 1999-2009). He previously served on the Board of Directors of IKON Office Solutions, Inc. (1999-2008) and Delta Airlines (2005-2007). Mr. Arthur E. Johnson is not related to Ms. Abigail P. Johnson.
Michael E. Kenneally (1954)
Year of Election or Appointment: 2009
Trustee
Mr. Kenneally also serves as Trustee of other Fidelity® funds. Prior to his retirement, Mr. Kenneally served as Chairman and Global Chief Executive Officer of Credit Suisse Asset Management. Before joining Credit Suisse, he was an Executive Vice President and Chief Investment Officer for Bank of America Corporation. Earlier roles at Bank of America included Director of Research, Senior Portfolio Manager and Research Analyst, and Mr. Kenneally was awarded the Chartered Financial Analyst (CFA) designation in 1991.
James H. Keyes (1940)
Year of Election or Appointment: 2007
Trustee
Mr. Keyes also serves as Trustee of other Fidelity® funds. Mr. Keyes serves as a member of the Board and Non-Executive Chairman of Navistar International Corporation (manufacture and sale of trucks, buses, and diesel engines, since 2002). Previously, Mr. Keyes served as a member of the Board of Pitney Bowes, Inc. (integrated mail, messaging, and document management solutions, 1998-2013). Prior to his retirement, Mr. Keyes served as Chairman (1993-2002) and Chief Executive Officer (1988-2002) of Johnson Controls (automotive, building, and energy) and as a member of the Board of LSI Logic Corporation (semiconductor technologies, 1984-2008).
Marie L. Knowles (1946)
Year of Election or Appointment: 2001
Trustee
Chairman of the Independent Trustees
Ms. Knowles also serves as Trustee of other Fidelity® funds. Prior to Ms. Knowles' retirement in June 2000, she served as Executive Vice President and Chief Financial Officer of Atlantic Richfield Company (ARCO) (diversified energy, 1996-2000). From 1993 to 1996, she was a Senior Vice President of ARCO and President of ARCO Transportation Company (pipeline and tanker operations). Ms. Knowles currently serves as a Director and Chairman of the Audit Committee of McKesson Corporation (healthcare service, since 2002). Ms. Knowles is a member of the Board of the Santa Catalina Island Company (real estate, 2009-present). Ms. Knowles is a Member of the Investment Company Institute Board of Governors and a Member of the Governing Council of the Independent Directors Council (2014-present). She also serves as a member of the Advisory Board for the School of Engineering of the University of Southern California. Previously, Ms. Knowles served as a Director of Phelps Dodge Corporation (copper mining and manufacturing, 1994-2007), URS Corporation (engineering and construction, 2000-2003) and America West (airline, 1999-2002). Ms. Knowles previously served as Vice Chairman of the Independent Trustees of certain Fidelity® funds (2012-2015).
+ The information includes the Trustee's principal occupation during the last five years and other information relating to the experience, attributes, and skills relevant to the Trustee's qualifications to serve as a Trustee, which led to the conclusion that the Trustee should serve as a Trustee for each fund.
Advisory Board Members and Officers:
Correspondence intended for an officer may be sent to Fidelity Investments, 245 Summer Street, Boston, Massachusetts 02210. Officers appear below in alphabetical order.
Name, Year of Birth; Principal Occupation
Marc R. Bryant (1966)
Year of Election or Appointment: 2015
Secretary and Chief Legal Officer (CLO)
Mr. Bryant also serves as Secretary and CLO of other funds. Mr. Bryant serves as CLO, Secretary, and Senior Vice President of Fidelity Management & Research Company (investment adviser firm, 2015-present) and FMR Co., Inc. (investment adviser firm, 2015-present); Secretary of Fidelity SelectCo, LLC (investment adviser firm, 2015-present) and Fidelity Investments Money Management, Inc. (investment adviser firm, 2015-present); and CLO of Fidelity Management & Research (Hong Kong) Limited and FMR Investment Management (U.K.) Limited (investment adviser firms, 2015-present) and Fidelity Management & Research (Japan) Limited (investment adviser firm, 2016-present). He is Senior Vice President and Deputy General Counsel of FMR LLC (diversified financial services company). Previously, Mr. Bryant served as Secretary and CLO of Fidelity Rutland Square Trust II (2010-2014) and Assistant Secretary of Fidelity's Fixed Income and Asset Allocation Funds (2013-2015). Prior to joining Fidelity Investments, Mr. Bryant served as a Senior Vice President and the Head of Global Retail Legal for AllianceBernstein L.P. (2006-2010), and as the General Counsel for ProFund Advisors LLC (2001-2006).
Jeffrey S. Christian (1961)
Year of Election or Appointment: 2016
Assistant Treasurer
Mr. Christian also serves as Assistant Treasurer of other funds. Mr. Christian is an employee of Fidelity Investments (2003-present).
Jonathan Davis (1968)
Year of Election or Appointment: 2010
Assistant Treasurer
Mr. Davis also serves as Assistant Treasurer of other funds, and is an employee of Fidelity Investments. Previously, Mr. Davis served as Vice President and Associate General Counsel of FMR LLC (diversified financial services company, 2003-2010).
Adrien E. Deberghes (1967)
Year of Election or Appointment: 2010
Assistant Treasurer
Mr. Deberghes also serves as an officer of other funds. He is an employee of Fidelity Investments (2008-present). Prior to joining Fidelity Investments, Mr. Deberghes was Senior Vice President of Mutual Fund Administration at State Street Corporation (2007-2008), Senior Director of Mutual Fund Administration at Investors Bank & Trust (2005-2007), and Director of Finance for Dunkin' Brands (2000-2005). Previously, Mr. Deberghes served in other fund officer roles.
Stephanie J. Dorsey (1969)
Year of Election or Appointment: 2013
President and Treasurer
Ms. Dorsey also serves as an officer of other funds. She is an employee of Fidelity Investments (2008-present) and has served in other fund officer roles. Prior to joining Fidelity Investments, Ms. Dorsey served as Treasurer (2004-2008) of the JPMorgan Mutual Funds and Vice President (2004-2008) of JPMorgan Chase Bank.
Howard J. Galligan III (1966)
Year of Election or Appointment: 2014
Chief Financial Officer
Mr. Galligan also serves as Chief Financial Officer of other funds. Mr. Galligan serves as President of Fidelity Pricing and Cash Management Services (FPCMS) (2014-present) and as a Director of Strategic Advisers, Inc. (investment adviser firm, 2008-present). Previously, Mr. Galligan served as Chief Administrative Officer of Asset Management (2011-2014) and Chief Operating Officer and Senior Vice President of Investment Support for Strategic Advisers, Inc. (2003-2011).
Scott C. Goebel (1968)
Year of Election or Appointment: 2015
Vice President
Mr. Goebel serves as Vice President of other funds and is an employee of Fidelity Investments (2001-present). Previously, Mr. Goebel served as Secretary of Fidelity SelectCo, LLC (investment adviser firm, 2013-2015), Fidelity Investments Money Management, Inc. (FIMM) (investment adviser firm, 2010-2015), and Fidelity Research and Analysis Company (FRAC) (investment adviser firm, 2010-2015); General Counsel, Secretary, and Senior Vice President of Fidelity Management & Research Company (investment adviser firm, 2008-2015) and FMR Co., Inc. (investment adviser firm, 2008-2015); Assistant Secretary of Fidelity Management & Research (Japan) Limited (investment adviser firm, 2008-2015) and Fidelity Management & Research (U.K.) Inc. (investment adviser firm, 2008-2015); Chief Legal Officer (CLO) of Fidelity Management & Research (Hong Kong) Limited (investment adviser firm, 2008-2015); Secretary and CLO of certain Fidelity® funds (2008-2015); Assistant Secretary of FIMM (2008-2010), FRAC (2008-2010), and certain funds (2007-2008); and as Vice President and Secretary of Fidelity Distributors Corporation (FDC) (2005-2007).
Colm A. Hogan (1973)
Year of Election or Appointment: 2016
Assistant Treasurer
Mr. Hogan also serves as an officer of other funds. Mr. Hogan is an employee of Fidelity Investments (2005-present).
Timothy Huyck (1964)
Year of Election or Appointment: 2015
Vice President of Fidelity's Money Market Funds
Mr. Huyck also serves as Vice President of other funds. Mr. Huyck serves as Chief Investment Officer of Fidelity's Money Market Funds (2015-present) and is an employee of Fidelity Investments (1990-present).
Chris Maher (1972)
Year of Election or Appointment: 2013
Assistant Treasurer
Mr. Maher serves as Assistant Treasurer of other funds. Mr. Maher is Vice President of Valuation Oversight and is an employee of Fidelity Investments. Previously, Mr. Maher served as Vice President of Asset Management Compliance (2013), Vice President of the Program Management Group of FMR (investment adviser firm, 2010-2013), and Vice President of Valuation Oversight (2008-2010).
John F. Papandrea (1972)
Year of Election or Appointment: 2016
Anti-Money Laundering (AML) Officer
Mr. Papandrea also serves as AML Officer of other funds. Mr. Papandrea is Vice President of FMR LLC (diversified financial services company, 2008-present) and is an employee of Fidelity Investments (2005-present).
Jason P. Pogorelec (1975)
Year of Election or Appointment: 2015
Assistant Secretary
Mr. Pogorelec also serves as Assistant Secretary of other funds. Mr. Pogorelec serves as Vice President, Associate General Counsel (2010-present) and is an employee of Fidelity Investments (2006-present).
Nancy D. Prior (1967)
Year of Election or Appointment: 2014
Vice President
Ms. Prior also serves as Vice President of other funds. Ms. Prior serves as a Director of FMR Investment Management (U.K.) Limited (investment adviser firm, 2015-present) and Fidelity Investments Money Management, Inc. (FIMM) (investment adviser firm, 2014-present), President, Fixed Income (2014-present), Vice Chairman of FIAM LLC (investment adviser firm, 2014-present), and is an employee of Fidelity Investments (2002-present). Previously, Ms. Prior served as Vice President of Fidelity's Money Market Funds (2012-2014), President, Money Market and Short Duration Bond Group of Fidelity Management & Research (FMR) (investment adviser firm, 2013-2014), President, Money Market Group of FMR (2011-2013), Managing Director of Research (2009-2011), Senior Vice President and Deputy General Counsel (2007-2009), and Assistant Secretary of certain Fidelity® funds (2008-2009).
Stacie M. Smith (1974)
Year of Election or Appointment: 2013
Assistant Treasurer
Ms. Smith also serves as an officer of other funds. She is an employee of Fidelity Investments (2009-present) and has served in other fund officer roles. Prior to joining Fidelity Investments, Ms. Smith served as Senior Audit Manager of Ernst & Young LLP (1996-2009). Previously, Ms. Smith served as Deputy Treasurer of certain Fidelity® funds (2013-2016).
Renee Stagnone (1975)
Year of Election or Appointment: 2016
Assistant Treasurer
Ms. Stagnone also serves as an officer of other funds. Ms. Stagnone is an employee of Fidelity Investments (1997-present). Previously, Ms. Stagnone served as Deputy Treasurer of certain Fidelity® funds (2013-2016).
Linda J. Wondrack (1964)
Year of Election or Appointment: 2016
Chief Compliance Officer
Ms. Wondrack also serves as Chief Compliance Officer of other funds. Ms. Wondrack is Executive Vice President and head of Asset Management Compliance for Fidelity Investments (2012-present). Ms. Wondrack also serves as Chief Compliance Officer of Fidelity SelectCo, LLC (investment adviser firm, 2014-present); Chief Compliance Officer of Impresa Management LLC (2013-present); and Chief Compliance Officer of FMR Co., Inc. (investment adviser firm), Fidelity Investments Money Management, Inc. (investment adviser firm), Fidelity Management & Research (U.K.) Inc. (investment adviser firm), Fidelity Management & Research (Hong Kong) (investment adviser firm), Fidelity Management & Research Company (investment adviser firm), FIAM LLC (investment adviser firm), and Strategic Advisers, Inc. (investment adviser firm), Ballyrock Investment Advisors LLC, and Northern Neck Investors LLC (2012-present). Previously, Ms. Wondrack served as Chief Compliance Officer of certain Fidelity® funds (2014-2016) and Fidelity Management & Research (Japan) Limited (investment adviser firm, 2012-2016); Senior Vice President and Chief Compliance Officer for Columbia Management Investment Advisers, LLC (2005-2012); Chief Compliance Officer for certain funds within the Columbia Family of Funds (2007-2012); and Senior Vice President of Compliance Risk Management at Bank of America (2005-2010).
Shareholder Expense Example
As a shareholder of a Fund, you incur two types of costs: (1) transaction costs and (2) ongoing costs, including management fees, distribution and/or service (12b-1) fees and other Fund expenses. This Example is intended to help you understand your ongoing costs (in dollars) of investing in the Funds and to compare these costs with the ongoing costs of investing in other mutual funds.
The Example is based on an investment of $1,000 invested at the beginning of the period and held for the entire period (October 1, 2015 to March 31, 2016).
Actual Expenses
The first line of the accompanying table for each class of each fund provides information about actual account values and actual expenses. You may use the information in this line, together with the amount you invested, to estimate the expenses that you paid over the period. Simply divide your account value by $1,000.00 (for example, an $8,600 account value divided by $1,000.00 = 8.6), then multiply the result by the number in the first line for a class of the fund under the heading entitled "Expenses Paid During Period" to estimate the expenses you paid on your account during this period. In addition, each Fund, as a shareholder in the underlying Fidelity Central Funds, will indirectly bear its pro-rata share of the fees and expenses incurred by the underlying Fidelity Central Funds. These fees and expenses are not included in the Fund's annualized expense ratio used to calculate the expense estimate in the table below.
Hypothetical Example for Comparison Purposes
The second line of the accompanying table for each class of each fund provides information about hypothetical account values and hypothetical expenses based on a Class' actual expense ratio and an assumed rate of return of 5% per year before expenses, which is not the Class' actual return. The hypothetical account values and expenses may not be used to estimate the actual ending account balance or expenses you paid for the period. You may use this information to compare the ongoing costs of investing in the Fund and other funds. To do so, compare this 5% hypothetical example with the 5% hypothetical examples that appear in the shareholder reports of the other funds. In addition, each Fund, as a shareholder in the underlying Fidelity Central Funds, will indirectly bear its pro-rata share of the fees and expenses incurred by the underlying Fidelity Central Funds. These fees and expenses are not included in the Fund's annualized expense ratio used to calculate the expense estimate in the table below.
Please note that the expenses shown in the table are meant to highlight your ongoing costs only and do not reflect any transaction costs. Therefore, the second line of the table is useful in comparing ongoing costs only, and will not help you determine the relative total costs of owning different funds.
| | Annualized Expense Ratio-A | Beginning
Account Value
October 1, 2015 | Ending
Account Value
March 31, 2016 | Expenses Paid
During Period
October 1, 2015
to March 31, 2016-B |
| Treasury Only Portfolio | | | | |
| Class I | .15% | | | |
| Actual | | $1,000.00 | $1,000.40 | $.75 |
| Hypothetical-C | | $1,000.00 | $1,024.25 | $.76 |
| Class II | .21% | | | |
| Actual | | $1,000.00 | $1,000.10 | $1.05 |
| Hypothetical-C | | $1,000.00 | $1,023.95 | $1.06 |
| Class III | .21% | | | |
| Actual | | $1,000.00 | $1,000.10 | $1.05 |
| Hypothetical-C | | $1,000.00 | $1,023.95 | $1.06 |
| Class IV | .21% | | | |
| Actual | | $1,000.00 | $1,000.10 | $1.05 |
| Hypothetical-C | | $1,000.00 | $1,023.95 | $1.06 |
| Select Class | .17% | | | |
| Actual | | $1,000.00 | $1,000.20 | $.85 |
| Hypothetical-C | | $1,000.00 | $1,024.15 | $.86 |
| Institutional Class | .13% | | | |
| Actual | | $1,000.00 | $1,000.50 | $.65 |
| Hypothetical-C | | $1,000.00 | $1,024.35 | $.66 |
| Treasury Portfolio | | | | |
| Class I | .16% | | | |
| Actual | | $1,000.00 | $1,000.50 | $.80 |
| Hypothetical-C | | $1,000.00 | $1,024.20 | $.81 |
| Class II | .24% | | | |
| Actual | | $1,000.00 | $1,000.10 | $1.20 |
| Hypothetical-C | | $1,000.00 | $1,023.80 | $1.21 |
| Class III | .25% | | | |
| Actual | | $1,000.00 | $1,000.10 | $1.25 |
| Hypothetical-C | | $1,000.00 | $1,023.75 | $1.26 |
| Class IV | .25% | | | |
| Actual | | $1,000.00 | $1,000.10 | $1.25 |
| Hypothetical-C | | $1,000.00 | $1,023.75 | $1.26 |
| Select Class | .19% | | | |
| Actual | | $1,000.00 | $1,000.30 | $.95 |
| Hypothetical-C | | $1,000.00 | $1,024.05 | $.96 |
| Institutional Class | .14% | | | |
| Actual | | $1,000.00 | $1,000.60 | $.70 |
| Hypothetical-C | | $1,000.00 | $1,024.30 | $.71 |
| Government Portfolio | | | | |
| Class I | .17% | | | |
| Actual | | $1,000.00 | $1,000.60 | $.85 |
| Hypothetical-C | | $1,000.00 | $1,024.15 | $.86 |
| Class II | .26% | | | |
| Actual | | $1,000.00 | $1,000.20 | $1.30 |
| Hypothetical-C | | $1,000.00 | $1,023.70 | $1.32 |
| Class III | .28% | | | |
| Actual | | $1,000.00 | $1,000.10 | $1.40 |
| Hypothetical-C | | $1,000.00 | $1,023.60 | $1.42 |
| Select Class | .20% | | | |
| Actual | | $1,000.00 | $1,000.40 | $1.00 |
| Hypothetical-C | | $1,000.00 | $1,024.00 | $1.01 |
| Institutional Class | .14% | | | |
| Actual | | $1,000.00 | $1,000.70 | $.70 |
| Hypothetical-C | | $1,000.00 | $1,024.30 | $.71 |
| Prime Money Market Portfolio | | | | |
| Class I | .18% | | | |
| Actual | | $1,000.00 | $1,001.30 | $.90 |
| Hypothetical-C | | $1,000.00 | $1,024.10 | $.91 |
| Class II | .31% | | | |
| Actual | | $1,000.00 | $1,000.60 | $1.55 |
| Hypothetical-C | | $1,000.00 | $1,023.45 | $1.57 |
| Class III | .37% | | | |
| Actual | | $1,000.00 | $1,000.30 | $1.85 |
| Hypothetical-C | | $1,000.00 | $1,023.15 | $1.87 |
| Class IV | .42% | | | |
| Actual | | $1,000.00 | $1,000.10 | $2.10 |
| Hypothetical-C | | $1,000.00 | $1,022.90 | $2.12 |
| Select Class | .23% | | | |
| Actual | | $1,000.00 | $1,001.00 | $1.15 |
| Hypothetical-C | | $1,000.00 | $1,023.85 | $1.16 |
| Institutional Class | .14% | | | |
| Actual | | $1,000.00 | $1,001.50 | $.70 |
| Hypothetical-C | | $1,000.00 | $1,024.30 | $.71 |
| Money Market Portfolio | | | | |
| Class I | .18% | | | |
| Actual | | $1,000.00 | $1,001.20 | $.90 |
| Hypothetical-C | | $1,000.00 | $1,024.10 | $.91 |
| Class II | .31% | | | |
| Actual | | $1,000.00 | $1,000.50 | $1.55 |
| Hypothetical-C | | $1,000.00 | $1,023.45 | $1.57 |
| Class III | .36% | | | |
| Actual | | $1,000.00 | $1,000.30 | $1.80 |
| Hypothetical-C | | $1,000.00 | $1,023.20 | $1.82 |
| Select Class | .23% | | | |
| Actual | | $1,000.00 | $1,001.00 | $1.15 |
| Hypothetical-C | | $1,000.00 | $1,023.85 | $1.16 |
| Class F | .14% | | | |
| Actual | | $1,000.00 | $1,001.40 | $.70 |
| Hypothetical-C | | $1,000.00 | $1,024.30 | $.71 |
| Institutional Class | .14% | | | |
| Actual | | $1,000.00 | $1,001.40 | $.70 |
| Hypothetical-C | | $1,000.00 | $1,024.30 | $.71 |
| Tax-Exempt Portfolio | | | | |
| Class I | .05% | | | |
| Actual | | $1,000.00 | $1,000.80 | $.25 |
| Hypothetical-C | | $1,000.00 | $1,024.75 | $.25 |
| Class II | .05% | | | |
| Actual | | $1,000.00 | $1,000.80 | $.25 |
| Hypothetical-C | | $1,000.00 | $1,024.75 | $.25 |
| Class III | .05% | | | |
| Actual | | $1,000.00 | $1,000.80 | $.25 |
| Hypothetical-C | | $1,000.00 | $1,024.75 | $.25 |
| Select Class | .05% | | | |
| Actual | | $1,000.00 | $1,000.80 | $.25 |
| Hypothetical-C | | $1,000.00 | $1,024.75 | $.25 |
| | | | | |
| | | | | |
| | | | | |
A Annualized expense ratio reflects expenses net of applicable fee waivers.
B Expenses are equal to each Class' annualized expense ratio, multiplied by the average account value over the period, multiplied by 183/ 366 (to reflect the one-half year period).
C 5% return per year before expenses
Distributions (Unaudited)
The Board of Trustees of each fund voted to pay to shareholders of record at the opening of business on record date, the following distributions per share derived from capital gains realized from sales of portfolio securities:
| | Pay Date | Record Date | Capital Gains |
| | | | |
| Tax-Exempt Portfolio | 05/16/16
| 05/13/16
| $0.0007
|
|
The funds hereby designate as capital gain dividend the amounts noted below for the taxable year ended March 31, 2016, or, if subsequently determined to be different, the net capital gain of such year.
| Tax-Exempt Portfolio | $443,043 |
| Money Market Portfolio | $53,824 |
The funds hereby designate the amounts noted below as distributions paid during the period January 1, 2016 to March 31, 2016 as qualifying to be taxed as interest-related dividends for nonresident alien shareholders:
| | |
| Treasury Only Portfolio | $3,765,968 |
| Treasury Portfolio | $5,044,682 |
| Government Portfolio | $16,964,040 |
| Prime Money Market Portfolio | $54,296,957 |
| Money Market Portfolio | $47,033,280 |
A percentage of the dividends distributed during the fiscal year for the following funds were derived from interest on U.S. Government securities which is generally exempt from state income tax:
| Treasury Only Portfolio | 100% |
| Treasury Portfolio | 61.28% |
| Government Portfolio | 53.14% |
| Prime Money Market Portfolio | 2.39% |
| Money Market Portfolio | 1.15% |
| | |
During fiscal year ended 2016, 100% of Tax Exempt Portfolio's income dividends were free from federal income tax, and 0.00% of the fund's income dividends were subject to the federal alternative minimum tax.
The funds will notify shareholders in January 2017 of amounts for use in preparing 2016 income tax returns.
Proxy Voting Results
A special meeting of shareholders was held on December 16, 2015. The results of votes taken among shareholders on the proposal before them are reported below. Each vote reported represents one dollar of net asset value held on the record date for the meeting.
PROPOSAL 1
| To elect a Board of Trustees. |
| | # of
Votes | % of
Votes |
| Elizabeth S. Acton | | |
| Affirmative | 63,612,408,730.62 | 98.755 |
| Withheld | 802,413,546.77 | 1.245 |
| TOTAL | 64,414,822,277.39 | 100.000 |
| John Engler | | |
| Affirmative | 63,611,867,796.17 | 98.754 |
| Withheld | 802,954,481.22 | 1.246 |
| TOTAL | 64,414,822,277.39 | 100.000 |
| Albert R. Gamper, Jr. | | |
| Affirmative | 63,591,968,641.66 | 98.723 |
| Withheld | 822,853,635.73 | 1.277 |
| TOTAL | 64,414,822,277.39 | 100.000 |
| Robert F. Gartland | | |
| Affirmative | 63,592,635,598.47 | 98.724 |
| Withheld | 822,186,678.92 | 1.276 |
| TOTAL | 64,414,822,277.39 | 100.000 |
| Abigail P. Johnson | | |
| Affirmative | 63,478,324,489.48 | 98.547 |
| Withheld | 936,497,787.91 | 1.453 |
| TOTAL | 64,414,822,277.39 | 100.000 |
| Arthur E. Johnson | | |
| Affirmative | 63,571,235,850.69 | 98.691 |
| Withheld | 843,586,426.70 | 1.309 |
| TOTAL | 64,414,822,277.39 | 100.000 |
| Michael E. Kenneally | | |
| Affirmative | 63,595,565,452.07 | 98.729 |
| Withheld | 819,256,825.32 | 1.271 |
| TOTAL | 64,414,822,277.39 | 100.000 |
| James H. Keyes | | |
| Affirmative | 63,596,889,284.70 | 98.731 |
| Withheld | 817,932,992.69 | 1.269 |
| TOTAL | 64,414,822,277.39 | 100.000 |
| Marie L. Knowles | | |
| Affirmative | 62,471,007,978.95 | 96.983 |
| Withheld | 1,943,814,298.44 | 3.017 |
| TOTAL | 64,414,822,277.39 | 100.000 |
| Geoffrey A. von Kuhn | | |
| Affirmative | 63,617,297,524.58 | 98.762 |
| Withheld | 797,524,752.81 | 1.238 |
| TOTAL | 64,414,822,277.39 | 100.000 |
| Proposal 1 reflects trust wide proposal and voting results. |

IMM-ANN-0516
1.701843.118