UNITED STATES
SECURITIES AND EXCHANGE COMMISSION
Washington, D.C. 20549
FORM N-CSR
CERTIFIED SHAREHOLDER REPORT OF REGISTERED
MANAGEMENT INVESTMENT COMPANIES
Investment Company Act file number 811-3320
Fidelity Colchester Street Trust
(Exact name of registrant as specified in charter)
245 Summer St., Boston, Massachusetts 02210
(Address of principal executive offices) (Zip code)
Marc Bryant, Secretary
245 Summer St.
Boston, Massachusetts 02210
(Name and address of agent for service)
Registrant's telephone number, including area code:
617-563-7000
Date of fiscal year end: | March 31 |
|
|
Date of reporting period: | March 31, 2017 |
Item 1.
Reports to Stockholders
Fidelity® Investments Money Market Funds Treasury Only Portfolio Treasury Portfolio Government Portfolio Money Market Portfolio Prime Money Market Portfolio Prime Reserves Portfolio Tax-Exempt Portfolio Annual Report March 31, 2017 |
 |
Contents
To view a fund's proxy voting guidelines and proxy voting record for the 12-month period ended June 30, visit http://www.fidelity.com/proxyvotingresults or visit the Securities and Exchange Commission's (SEC) web site at http://www.sec.gov.
You may also call 1-877-297-2952 to request a free copy of the proxy voting guidelines.
Standard & Poor's, S&P and S&P 500 are registered service marks of The McGraw-Hill Companies, Inc. and have been licensed for use by Fidelity Distributors Corporation.
Other third-party marks appearing herein are the property of their respective owners.
All other marks appearing herein are registered or unregistered trademarks or service marks of FMR LLC or an affiliated company. © 2017 FMR LLC. All rights reserved.
This report and the financial statements contained herein are submitted for the general information of the shareholders of the Funds. This report is not authorized for distribution to prospective investors in the Funds unless preceded or accompanied by an effective prospectus.
A fund files its complete schedule of portfolio holdings with the SEC for the first and third quarters of each fiscal year on Form N-Q. Forms N-Q are available on the SEC’s web site at http://www.sec.gov. A fund's Forms N-Q may be reviewed and copied at the SEC’s Public Reference Room in Washington, DC. Information regarding the operation of the SEC's Public Reference Room may be obtained by calling 1-800-SEC-0330.
For a complete list of a fund's portfolio holdings, view the most recent holdings listing, semiannual report, or annual report on Fidelity's web site at http://www.fidelity.com, http://www.institutional.fidelity.com, or http://www.401k.com, as applicable.
NOT FDIC INSURED •MAY LOSE VALUE •NO BANK GUARANTEE
Neither the Funds nor Fidelity Distributors Corporation is a bank.
Treasury Only Portfolio
Investment Summary/Performance (Unaudited)
Effective Maturity Diversification
| Days | % of fund's investments 3/31/17 | % of fund's investments 9/30/16 | % of fund's investments 3/31/16 |
| 1 - 7 | 14.4 | 16.8 | 20.6 |
| 8 - 30 | 30.2 | 16.1 | 20.3 |
| 31 - 60 | 24.6 | 23.8 | 16.0 |
| 61 - 90 | 19.0 | 30.6 | 20.8 |
| 91 - 180 | 10.2 | 11.7 | 21.0 |
| > 180 | 1.6 | 1.0 | 1.3 |
Effective maturity is determined in accordance with the requirements of Rule 2a-7 under the Investment Company Act of 1940.
Asset Allocation (% of fund's net assets)
| As of March 31, 2017 | ||
| U.S. Treasury Debt | 100.1% | |
| Net Other Assets (Liabilities)* | (0.1)% | |

* Net Other Assets (Liabilities) are not included in the pie chart
| As of September 30, 2016 | ||
| U.S. Treasury Debt | 99.9% | |
| Net Other Assets (Liabilities) | 0.1% | |

Current And Historical 7-Day Yields
| 3/31/17 | 12/31/16 | 9/30/16 | 6/30/16 | 3/31/16 | |
| Class I | 0.47% | 0.31% | 0.17% | 0.16% | 0.17% |
| Class II | 0.32% | 0.16% | 0.02% | 0.01% | 0.02% |
| Class III | 0.22% | 0.06% | 0.01% | 0.01% | 0.01% |
| Class IV | 0.01% | 0.01% | 0.01% | 0.01% | 0.01% |
| Select Class | 0.42% | 0.26% | 0.12% | 0.11% | 0.12% |
| Institutional Class | 0.51% | 0.35% | 0.21% | 0.20% | 0.21% |
Yield refers to the income paid by the Fund over a given period. Yields for money market funds are usually for seven-day periods, as they are here, though they are expressed as annual percentage rates. Past performance is no guarantee of future results. Yield will vary and it's possible to lose money investing in the Fund. A portion of the Fund's expenses was reimbursed and/or waived. Absent such reimbursements and/or waivers the yield for the period ending March 31, 2017, the most recent period shown in the table, would have been 0.44% for Class I, 0.30% for Class II, 0.20% for Class III, -0.03% for Class IV, 0.38% for Select Class and 0.47% for Institutional Class.
Treasury Only Portfolio
Investments March 31, 2017
Showing Percentage of Net Assets
| U.S. Treasury Debt - 100.1% | ||||
| Yield(a) | Principal Amount (000s) | Value (000s) | ||
| U.S. Treasury Inflation Protected Obligations - 2.1% | ||||
| U.S. Treasury Notes | ||||
| 4/15/17 | 0.87% | $294,019 | $294,551 | |
| U.S. Treasury Obligations - 98.0% | ||||
| U.S. Treasury Bills | ||||
| 4/13/17 to 9/28/17 | 0.47 to 0.91 | 10,559,828 | 10,549,401 | |
| U.S. Treasury Notes | ||||
| 4/15/17 to 1/31/19 | 0.53 to 1.05 (b) | 2,905,421 | 2,906,809 | |
| 13,456,210 | ||||
| TOTAL U.S. TREASURY DEBT | ||||
| (Cost $13,750,761) | 13,750,761 | |||
| TOTAL INVESTMENT PORTFOLIO - 100.1% | ||||
| (Cost $13,750,761) | 13,750,761 | |||
| NET OTHER ASSETS (LIABILITIES) - (0.1)% | (12,915) | |||
| NET ASSETS - 100% | $13,737,846 |
The date shown for securities represents the date when principal payments must be paid, taking into account any call options exercised by the issuer and any permissible maturity shortening features other than interest rate resets.
Legend
(a) Yield represents either the annualized yield at the date of purchase, or the stated coupon rate, or, for floating and adjustable rate securities, the rate at period end.
(b) Coupon rates for floating and adjustable rate securities reflect the rates in effect at period end.
Investment Valuation
All investments are categorized as Level 2 under the Fair Value Hierarchy. The inputs or methodology used for valuing securities may not be an indication of the risk associated with investing in those securities. For more information on valuation inputs please refer to the Investment Valuation section in the accompanying Notes to Financial Statements.
See accompanying notes which are an integral part of the financial statements.
Treasury Only Portfolio
Financial Statements
Statement of Assets and Liabilities
| Amounts in thousands (except per-share amounts) | March 31, 2017 | |
| Assets | ||
| Investment in securities, at value — See accompanying schedule: Unaffiliated issuers (cost $13,750,761) | $13,750,761 | |
| Receivable for fund shares sold | 3,657 | |
| Interest receivable | 7,766 | |
| Prepaid expenses | 12 | |
| Receivable from investment adviser for expense reductions | 348 | |
| Total assets | 13,762,544 | |
| Liabilities | ||
| Payable to custodian bank | $251 | |
| Payable for fund shares redeemed | 19,824 | |
| Distributions payable | 2,006 | |
| Accrued management fee | 1,629 | |
| Distribution and service plan fees payable | 240 | |
| Other affiliated payables | 658 | |
| Other payables and accrued expenses | 90 | |
| Total liabilities | 24,698 | |
| Net Assets | $13,737,846 | |
| Net Assets consist of: | ||
| Paid in capital | $13,737,663 | |
| Undistributed net investment income | 186 | |
| Accumulated undistributed net realized gain (loss) on investments | (3) | |
| Net Assets | $13,737,846 | |
| Class I: | ||
| Net Asset Value, offering price and redemption price per share ($7,637,543 ÷ 7,636,247 shares) | $1.00 | |
| Class II: | ||
| Net Asset Value, offering price and redemption price per share ($158,896 ÷ 158,906 shares) | $1.00 | |
| Class III: | ||
| Net Asset Value, offering price and redemption price per share ($921,354 ÷ 921,082 shares) | $1.00 | |
| Class IV: | ||
| Net Asset Value, offering price and redemption price per share ($32,241 ÷ 32,236 shares) | $1.00 | |
| Select Class: | ||
| Net Asset Value, offering price and redemption price per share ($93,530 ÷ 93,528 shares) | $1.00 | |
| Institutional Class: | ||
| Net Asset Value, offering price and redemption price per share ($4,894,282 ÷ 4,894,059 shares) | $1.00 |
See accompanying notes which are an integral part of the financial statements.
Statement of Operations
| Amounts in thousands | Year ended March 31, 2017 | |
| Investment Income | ||
| Interest | $56,675 | |
| Expenses | ||
| Management fee | $19,052 | |
| Transfer agent fees | 7,089 | |
| Distribution and service plan fees | 3,047 | |
| Accounting fees and expenses | 967 | |
| Custodian fees and expenses | 146 | |
| Independent trustees' fees and expenses | 58 | |
| Registration fees | 319 | |
| Audit | 45 | |
| Legal | 31 | |
| Miscellaneous | 67 | |
| Total expenses before reductions | 30,821 | |
| Expense reductions | (5,506) | 25,315 |
| Net investment income (loss) | 31,360 | |
| Realized and Unrealized Gain (Loss) | ||
| Net realized gain (loss) on: | ||
| Investment securities: | ||
| Unaffiliated issuers | 93 | |
| Total net realized gain (loss) | 93 | |
| Net increase in net assets resulting from operations | $31,453 |
See accompanying notes which are an integral part of the financial statements.
Statement of Changes in Net Assets
| Amounts in thousands | Year ended March 31, 2017 | Year ended March 31, 2016 |
| Increase (Decrease) in Net Assets | ||
| Operations | ||
| Net investment income (loss) | $31,360 | $5,396 |
| Net realized gain (loss) | 93 | 75 |
| Net increase in net assets resulting from operations | 31,453 | 5,471 |
| Distributions to shareholders from net investment income | (31,217) | (4,615) |
| Share transactions - net increase (decrease) | 114,871 | 2,840,666 |
| Total increase (decrease) in net assets | 115,107 | 2,841,522 |
| Net Assets | ||
| Beginning of period | 13,622,739 | 10,781,217 |
| End of period | $13,737,846 | $13,622,739 |
| Other Information | ||
| Undistributed net investment income end of period | $186 | $48 |
See accompanying notes which are an integral part of the financial statements.
Financial Highlights — Treasury Only Portfolio Class I
| Years ended March 31, | 2017 | 2016 | 2015 | 2014 | 2013 |
| Selected Per–Share Data | |||||
| Net asset value, beginning of period | $1.00 | $1.00 | $1.00 | $1.00 | $1.00 |
| Income from Investment Operations | |||||
| Net investment income (loss) | .002 | –A | –A | –A | –A |
| Net realized and unrealized gain (loss)A | – | – | – | – | – |
| Total from investment operations | .002 | –A | –A | –A | –A |
| Distributions from net investment income | (.002) | –A | –A | –A | –A |
| Total distributions | (.002) | –A | –A | –A | –A |
| Net asset value, end of period | $1.00 | $1.00 | $1.00 | $1.00 | $1.00 |
| Total ReturnB | .23% | .04% | .01% | .01% | .01% |
| Ratios to Average Net AssetsC | |||||
| Expenses before reductions | .21% | .21% | .21% | .21% | .21% |
| Expenses net of fee waivers, if any | .18% | .11% | .05% | .06% | .10% |
| Expenses net of all reductions | .18% | .11% | .05% | .06% | .10% |
| Net investment income (loss) | .24% | .05% | - %D | .01% | .01% |
| Supplemental Data | |||||
| Net assets, end of period (in millions) | $7,638 | $10,035 | $9,402 | $9,795 | $9,431 |
A Amount represents less than $.0005 per share.
B Total returns would have been lower if certain expenses had not been reduced during the applicable periods shown.
C Expense ratios reflect operating expenses of the class. Expenses before reductions do not reflect amounts reimbursed or waived or reductions from expense offset arrangements and do not represent the amount paid by the class during periods when reimbursements, waivers or reductions occur. Expenses net of fee waivers reflect expenses after reimbursement and waivers but prior to reductions from expense offset arrangements. Expenses net of all reductions represent the net expenses paid by the class.
D Amount represents less than .005%.
See accompanying notes which are an integral part of the financial statements.
Financial Highlights — Treasury Only Portfolio Class II
| Years ended March 31, | 2017 | 2016 | 2015 | 2014 | 2013 |
| Selected Per–Share Data | |||||
| Net asset value, beginning of period | $1.00 | $1.00 | $1.00 | $1.00 | $1.00 |
| Income from Investment Operations | |||||
| Net investment income (loss) | .001 | –A | –A | –A | –A |
| Net realized and unrealized gain (loss)A | – | – | – | – | – |
| Total from investment operations | .001 | –A | –A | –A | –A |
| Distributions from net investment income | (.001) | –A | –A | –A | –A |
| Total distributions | (.001) | –A | –A | –A | –A |
| Net asset value, end of period | $1.00 | $1.00 | $1.00 | $1.00 | $1.00 |
| Total ReturnB | .09% | .01% | .01% | .01% | .01% |
| Ratios to Average Net AssetsC | |||||
| Expenses before reductions | .36% | .36% | .36% | .36% | .36% |
| Expenses net of fee waivers, if any | .33% | .13% | .05% | .06% | .10% |
| Expenses net of all reductions | .33% | .13% | .05% | .06% | .10% |
| Net investment income (loss) | .09% | .03% | - %D | .01% | .01% |
| Supplemental Data | |||||
| Net assets, end of period (in millions) | $159 | $307 | $310 | $359 | $354 |
A Amount represents less than $.0005 per share.
B Total returns would have been lower if certain expenses had not been reduced during the applicable periods shown.
C Expense ratios reflect operating expenses of the class. Expenses before reductions do not reflect amounts reimbursed or waived or reductions from expense offset arrangements and do not represent the amount paid by the class during periods when reimbursements, waivers or reductions occur. Expenses net of fee waivers reflect expenses after reimbursement and waivers but prior to reductions from expense offset arrangements. Expenses net of all reductions represent the net expenses paid by the class.
D Amount represents less than .005%.
See accompanying notes which are an integral part of the financial statements.
Financial Highlights — Treasury Only Portfolio Class III
| Years ended March 31, | 2017 | 2016 | 2015 | 2014 | 2013 |
| Selected Per–Share Data | |||||
| Net asset value, beginning of period | $1.00 | $1.00 | $1.00 | $1.00 | $1.00 |
| Income from Investment Operations | |||||
| Net investment income (loss)A | – | – | – | – | – |
| Net realized and unrealized gain (loss)A | – | – | – | – | – |
| Total from investment operationsA | – | – | – | – | – |
| Distributions from net investment incomeA | – | – | – | – | – |
| Total distributionsA | – | – | – | – | – |
| Net asset value, end of period | $1.00 | $1.00 | $1.00 | $1.00 | $1.00 |
| Total ReturnB | .04% | .01% | .01% | .01% | .01% |
| Ratios to Average Net AssetsC | |||||
| Expenses before reductions | .46% | .46% | .46% | .46% | .46% |
| Expenses net of fee waivers, if any | .38% | .15% | .05% | .06% | .10% |
| Expenses net of all reductions | .38% | .15% | .05% | .06% | .10% |
| Net investment income (loss) | .04% | .01% | - %D | .01% | .01% |
| Supplemental Data | |||||
| Net assets, end of period (in millions) | $921 | $831 | $635 | $487 | $408 |
A Amount represents less than $.0005 per share.
B Total returns would have been lower if certain expenses had not been reduced during the applicable periods shown.
C Expense ratios reflect operating expenses of the class. Expenses before reductions do not reflect amounts reimbursed or waived or reductions from expense offset arrangements and do not represent the amount paid by the class during periods when reimbursements, waivers or reductions occur. Expenses net of fee waivers reflect expenses after reimbursement and waivers but prior to reductions from expense offset arrangements. Expenses net of all reductions represent the net expenses paid by the class.
D Amount represents less than .005%.
See accompanying notes which are an integral part of the financial statements.
Financial Highlights — Treasury Only Portfolio Class IV
| Years ended March 31, | 2017 | 2016 | 2015 | 2014 | 2013 |
| Selected Per–Share Data | |||||
| Net asset value, beginning of period | $1.00 | $1.00 | $1.00 | $1.00 | $1.00 |
| Income from Investment Operations | |||||
| Net investment income (loss)A | – | – | – | – | – |
| Net realized and unrealized gain (loss)A | – | – | – | – | – |
| Total from investment operationsA | – | – | – | – | – |
| Distributions from net investment incomeA | – | – | – | – | – |
| Total distributionsA | – | – | – | – | – |
| Net asset value, end of period | $1.00 | $1.00 | $1.00 | $1.00 | $1.00 |
| Total ReturnB | .01% | .01% | .01% | .01% | .01% |
| Ratios to Average Net AssetsC | |||||
| Expenses before reductions | .72% | .71% | .71% | .71% | .71% |
| Expenses net of fee waivers, if any | .37% | .14% | .04% | .06% | .10% |
| Expenses net of all reductions | .37% | .14% | .04% | .06% | .10% |
| Net investment income (loss) | .05% | .02% | .01% | .01% | .01% |
| Supplemental Data | |||||
| Net assets, end of period (in millions) | $32 | $338 | $114 | $18 | $22 |
A Amount represents less than $.0005 per share.
B Total returns would have been lower if certain expenses had not been reduced during the applicable periods shown.
C Expense ratios reflect operating expenses of the class. Expenses before reductions do not reflect amounts reimbursed or waived or reductions from expense offset arrangements and do not represent the amount paid by the class during periods when reimbursements, waivers or reductions occur. Expenses net of fee waivers reflect expenses after reimbursement and waivers but prior to reductions from expense offset arrangements. Expenses net of all reductions represent the net expenses paid by the class.
See accompanying notes which are an integral part of the financial statements.
Financial Highlights — Treasury Only Portfolio Select Class
| Years ended March 31, | 2017 | 2016 | 2015 | 2014 | 2013 |
| Selected Per–Share Data | |||||
| Net asset value, beginning of period | $1.00 | $1.00 | $1.00 | $1.00 | $1.00 |
| Income from Investment Operations | |||||
| Net investment income (loss) | .002 | –A | –A | –A | –A |
| Net realized and unrealized gain (loss)A | – | – | – | – | – |
| Total from investment operations | .002 | –A | –A | –A | –A |
| Distributions from net investment income | (.002) | –A | –A | –A | –A |
| Total distributions | (.002) | –A | –A | –A | –A |
| Net asset value, end of period | $1.00 | $1.00 | $1.00 | $1.00 | $1.00 |
| Total ReturnB | .18% | .03% | .01% | .01% | .01% |
| Ratios to Average Net AssetsC | |||||
| Expenses before reductions | .26% | .27% | .26% | .26% | .26% |
| Expenses net of fee waivers, if any | .23% | .12% | .05% | .06% | .10% |
| Expenses net of all reductions | .23% | .12% | .05% | .06% | .10% |
| Net investment income (loss) | .19% | .04% | - %D | .01% | .01% |
| Supplemental Data | |||||
| Net assets, end of period (in millions) | $94 | $180 | $194 | $215 | $210 |
A Amount represents less than $.0005 per share.
B Total returns would have been lower if certain expenses had not been reduced during the applicable periods shown.
C Expense ratios reflect operating expenses of the class. Expenses before reductions do not reflect amounts reimbursed or waived or reductions from expense offset arrangements and do not represent the amount paid by the class during periods when reimbursements, waivers or reductions occur. Expenses net of fee waivers reflect expenses after reimbursement and waivers but prior to reductions from expense offset arrangements. Expenses net of all reductions represent the net expenses paid by the class.
D Amount represents less than .005%.
See accompanying notes which are an integral part of the financial statements.
Financial Highlights — Treasury Only Portfolio Institutional Class
| Years ended March 31, | 2017 | 2016 | 2015 A |
| Selected Per–Share Data | |||
| Net asset value, beginning of period | $1.00 | $1.00 | $1.00 |
| Income from Investment Operations | |||
| Net investment income (loss) | .003 | .001 | –B |
| Net realized and unrealized gain (loss)B | – | – | – |
| Total from investment operations | .003 | .001 | –B |
| Distributions from net investment income | (.003) | (.001) | –B |
| Total distributions | (.003) | (.001) | –B |
| Net asset value, end of period | $1.00 | $1.00 | $1.00 |
| Total ReturnC,D | .27% | .05% | .01% |
| Ratios to Average Net AssetsE | |||
| Expenses before reductions | .18% | .18% | .19%F |
| Expenses net of fee waivers, if any | .14% | .12% | .04%F |
| Expenses net of all reductions | .14% | .12% | .04%F |
| Net investment income (loss) | .28% | .04% | - %F,G |
| Supplemental Data | |||
| Net assets, end of period (in millions) | $4,894 | $1,932 | $126 |
A For the period May 14, 2014 (commencement of sale of shares) to March 31, 2015.
B Amount represents less than $.0005 per share.
C Total returns for periods of less than one year are not annualized.
D Total returns would have been lower if certain expenses had not been reduced during the applicable periods shown.
E Expense ratios reflect operating expenses of the class. Expenses before reductions do not reflect amounts reimbursed or waived or reductions from expense offset arrangements and do not represent the amount paid by the class during periods when reimbursements, waivers or reductions occur. Expense ratios before reductions for start-up periods may not be representative of longer-term operating periods. Expenses net of fee waivers reflect expenses after reimbursement and waivers but prior to reductions from expense offset arrangements. Expenses net of all reductions represent the net expenses paid by the class.
F Annualized
G Amount represents less than .005%.
See accompanying notes which are an integral part of the financial statements.
Treasury Portfolio
Investment Summary/Performance (Unaudited)
Effective Maturity Diversification
| Days | % of fund's investments 3/31/17 | % of fund's investments 9/30/16 | % of fund's investments 3/31/16 |
| 1 - 7 | 52.3 | 50.5 | 42.1 |
| 8 - 30 | 16.1 | 7.5 | 13.1 |
| 31 - 60 | 7.4 | 12.6 | 10.2 |
| 61 - 90 | 7.5 | 12.7 | 11.5 |
| 91 - 180 | 12.9 | 12.9 | 20.7 |
| > 180 | 3.8 | 3.8 | 2.4 |
Effective maturity is determined in accordance with the requirements of Rule 2a-7 under the Investment Company Act of 1940.
Asset Allocation (% of fund's net assets)
| As of March 31, 2017 | ||
| U.S. Treasury Debt | 60.5% | |
| Repurchase Agreements | 39.0% | |
| Net Other Assets (Liabilities) | 0.5% | |

| As of September 30, 2016 | ||
| U.S. Treasury Debt | 61.6% | |
| Repurchase Agreements | 38.7% | |
| Net Other Assets (Liabilities)* | (0.3)% | |

* Net Other Assets (Liabilities) are not included in the pie chart
Current And Historical 7-Day Yields
| 3/31/17 | 12/31/16 | 9/30/16 | 6/30/16 | 3/31/16 | |
| Class I | 0.55% | 0.35% | 0.20% | 0.20% | 0.19% |
| Class II | 0.40% | 0.20% | 0.05% | 0.05% | 0.04% |
| Class III | 0.30% | 0.10% | 0.01% | 0.01% | 0.01% |
| Class IV | 0.05% | 0.01% | 0.01% | 0.01% | 0.01% |
| Select Class | 0.50% | 0.30% | 0.15% | 0.15% | 0.14% |
| Institutional Class | 0.59% | 0.39% | 0.24% | 0.24% | 0.23% |
Yield refers to the income paid by the Fund over a given period. Yields for money market funds are usually for seven-day periods, as they are here, though they are expressed as annual percentage rates. Past performance is no guarantee of future results. Yield will vary and it's possible to lose money investing in the Fund. A portion of the Fund's expenses was reimbursed and/or waived. Absent such reimbursements and/or waivers the yield for the period ending March 31, 2017, the most recent period shown in the table, would have been 0.52% for Class I, 0.38% for Class II, 0.28% for Class III, 0.03% for Class IV, 0.47% for Select Class and 0.55% for Institutional Class.
Treasury Portfolio
Investments March 31, 2017
Showing Percentage of Net Assets
| U.S. Treasury Debt - 60.5% | ||||
| Yield(a) | Principal Amount (000s) | Value (000s) | ||
| U.S. Treasury Inflation Protected Obligations - 4.8% | ||||
| U.S. Treasury Notes | ||||
| 4/15/17 | 0.85 to 0.87% | $908,786 | $910,376 | |
| U.S. Treasury Obligations - 55.7% | ||||
| U.S. Treasury Bills | ||||
| 4/20/17 to 9/28/17 | 0.47 to 0.92 | 4,703,481 | 4,694,907 | |
| U.S. Treasury Bonds | ||||
| 5/15/17 | 0.62 | 100,000 | 100,985 | |
| U.S. Treasury Notes | ||||
| 4/15/17 to 1/31/19 | 0.50 to 1.05 (b) | 5,756,710 | 5,760,565 | |
| 10,556,457 | ||||
| TOTAL U.S. TREASURY DEBT | ||||
| (Cost $11,466,833) | 11,466,833 |
| U.S. Treasury Repurchase Agreement - 39.0% | |||
| Maturity Amount (000s) | Value (000s) | ||
| In a joint trading account at 0.79% dated 3/31/17 due 4/3/17 (Collateralized by U.S. Treasury Obligations) # | $1,180,342 | $1,180,264 | |
| With: | |||
| Barclays Capital, Inc. at 0.8%, dated 3/31/17 due 4/3/17 (Collateralized by U.S. Treasury Obligations valued at $10,200,756, 0.00% - 1.88%, 4/27/17 - 1/31/22) | 10,001 | 10,000 | |
| BMO Harris Bank NA at: | |||
| 0.54%, dated 2/9/17 due 4/7/17: | |||
| (Collateralized by U.S. Treasury Obligations valued at $27,130,139, 2.00% - 3.75%, 11/15/21 - 11/15/43) | 26,023 | 26,000 | |
| (Collateralized by U.S. Treasury Obligations valued at $53,382,728, 0.88%, 6/15/17) | 52,047 | 52,000 | |
| 0.55%, dated: | |||
| 2/1/17 due 4/7/17 (Collateralized by U.S. Treasury Obligations valued at $41,999,435, 1.13% - 2.00%, 8/31/21 - 11/15/21) | 41,043 | 41,000 | |
| 2/3/17 due 4/7/17: | |||
| (Collateralized by U.S. Treasury Obligations valued at $18,698,933, 1.63%, 5/31/23) | 18,023 | 18,000 | |
| (Collateralized by U.S. Treasury Obligations valued at $18,520,343, 1.50% - 2.00%, 11/15/21 - 8/15/26) | 18,023 | 18,000 | |
| 0.56%, dated 1/31/17 due 4/7/17 (Collateralized by U.S. Treasury Obligations valued at $26,852,186, 0.88%, 6/15/17) | 26,032 | 26,000 | |
| 0.57%, dated 2/28/17 due 4/7/17 (Collateralized by U.S. Treasury Obligations valued at $26,777,976, 1.75% - 2.00%, 11/15/21 - 11/30/21) | 26,024 | 26,000 | |
| 0.76%, dated: | |||
| 3/22/17 due 4/5/17 (Collateralized by U.S. Treasury Obligations valued at $69,170,231, 1.63%, 7/31/19) | 67,020 | 67,000 | |
| 3/23/17 due 4/5/17 (Collateralized by U.S. Treasury Obligations valued at $33,628,324, 2.13%, 9/30/21) | 33,009 | 33,000 | |
| 0.77%, dated 3/15/17 due 4/7/17 (Collateralized by U.S. Treasury Obligations valued at $26,986,852, 2.50%, 6/30/17) | 26,020 | 26,000 | |
| BNP Paribas, S.A. at: | |||
| 0.55%, dated 2/2/17 due 4/3/17 (Collateralized by U.S. Treasury Obligations valued at $38,795,994, 0.00% - 8.00%, 5/25/17 - 2/15/43) | 38,035 | 38,000 | |
| 0.56%, dated 1/31/17 due 4/6/17 (Collateralized by U.S. Treasury Obligations valued at $51,468,507, 1.63% - 3.13%, 4/30/19 - 11/15/44) | 50,051 | 50,000 | |
| 0.57%, dated: | |||
| 1/20/17 due 4/7/17 (Collateralized by U.S. Treasury Obligations valued at $78,366,408, 0.00% - 3.50%, 5/25/17 - 5/15/45) | 76,108 | 76,000 | |
| 2/8/17 due 4/7/17 (Collateralized by U.S. Treasury Obligations valued at $78,947,855, 0.00% - 8.75%, 5/25/17 - 2/15/46) | 77,110 | 77,000 | |
| 0.6%, dated 1/20/17 due 4/20/17 (Collateralized by U.S. Treasury Obligations valued at $103,514,094, 0.00% - 7.50%, 5/25/17 - 5/15/46) | 101,152 | 101,000 | |
| 0.63%, dated: | |||
| 2/24/17 due 4/7/17 (Collateralized by U.S. Treasury Obligations valued at $105,130,635, 0.00% - 3.75%, 5/25/17 - 11/15/43) | 103,189 | 103,000 | |
| 2/27/17 due 4/7/17 (Collateralized by U.S. Treasury Obligations valued at $158,738,114, 2.25% - 8.00%, 11/15/21 - 2/15/43) | 155,285 | 155,000 | |
| 0.78%, dated 3/16/17 due 4/7/17 (Collateralized by U.S. Treasury Obligations valued at $53,070,477, 1.63% - 3.50%, 8/15/24 - 5/15/46) | 52,036 | 52,000 | |
| 0.79%, dated: | |||
| 3/16/17 due 4/7/17 (Collateralized by U.S. Treasury Obligations valued at $53,576,945, 1.00% - 3.63%, 9/15/17 - 2/15/44) | 52,068 | 52,000 | |
| 3/28/17 due 4/7/17 (Collateralized by U.S. Treasury Obligations valued at $57,171,682, 0.00% - 8.75%, 5/25/17 - 5/15/46) | 56,073 | 56,000 | |
| Deutsche Bank Securities, Inc. at 0.81%, dated 3/31/17 due 4/3/17 (Collateralized by U.S. Treasury Obligations valued at $10,200,690, 3.63% - 9.13%, 5/15/18 - 2/15/44) | 10,001 | 10,000 | |
| Federal Reserve Bank of New York at 0.75%, dated 3/31/17 due 4/3/17 (Collateralized by U.S. Treasury Obligations valued at $3,870,241,974, 1.63% - 3.75%, 2/15/22 - 8/15/41) | 3,870,242 | 3,870,000 | |
| Mitsubishi UFJ Securities (U.S.A.), Inc. at 0.8%, dated 3/20/17 due 4/7/17 (Collateralized by U.S. Treasury Obligations valued at $38,804,682, 1.25% - 3.00%, 3/31/19 - 5/15/46) | 38,074 | 38,000 | |
| MUFG Securities EMEA PLC at: | |||
| 0.58%, dated 2/6/17 due 4/6/17 (Collateralized by U.S. Treasury Obligations valued at $5,149,384, 1.63%, 5/15/26) | 5,005 | 5,000 | |
| 0.6%, dated 2/13/17 due 4/7/17 (Collateralized by U.S. Treasury Obligations valued at $5,150,107, 1.50%, 5/31/19) | 5,008 | 5,000 | |
| 0.63%, dated 3/1/17 due 5/1/17 (Collateralized by U.S. Treasury Obligations valued at $16,464,985, 2.13%, 5/15/25) | 16,017 | 16,000 | |
| 0.77%, dated 3/9/17 due 4/10/17 (Collateralized by U.S. Treasury Obligations valued at $41,889,539, 2.63%, 8/15/20) | 41,028 | 41,000 | |
| 0.78%, dated 3/10/17 due 4/10/17 (Collateralized by U.S. Treasury Obligations valued at $36,718,931, 1.63% - 2.38%, 8/15/24 - 5/15/26) | 36,024 | 36,000 | |
| 0.8%, dated 3/31/17 due 4/3/17 (Collateralized by U.S. Treasury Obligations valued at $11,256,250, 2.63%, 8/15/20) | 10,969 | 10,968 | |
| 0.81%, dated: | |||
| 3/14/17 due 4/18/17 (Collateralized by U.S. Treasury Obligations valued at $36,861,437, 1.63% - 2.00%, 11/30/22 - 5/15/26) | 36,028 | 36,000 | |
| 3/15/17 due 4/7/17: | |||
| (Collateralized by U.S. Treasury Obligations valued at $54,302,076, 2.13%, 5/15/25) | 53,027 | 53,000 | |
| (Collateralized by U.S. Treasury Obligations valued at $21,515,449, 2.13%, 5/15/25) | 21,011 | 21,000 | |
| 3/17/17 due 4/10/17 (Collateralized by U.S. Treasury Obligations valued at $21,594,740, 1.63%, 5/15/26) | 21,011 | 21,000 | |
| 0.82%, dated: | |||
| 3/17/17 due 4/18/17 (Collateralized by U.S. Treasury Obligations valued at $13,389,359, 2.00%, 11/15/26) | 13,009 | 13,000 | |
| 3/20/17 due 4/6/17 (Collateralized by U.S. Treasury Obligations valued at $16,462,027, 2.13%, 5/15/25) | 16,006 | 16,000 | |
| Prudential Insurance Co. of America at 0.86%, dated 3/31/17 due 4/3/17 (Collateralized by U.S. Treasury Obligations valued at $137,212,989, 1.00% - 2.88%, 9/30/19 - 8/15/45) | 133,157 | 133,147 | |
| RBC Capital Markets Corp. at: | |||
| 0.54%, dated 2/3/17 due 4/3/17 (Collateralized by U.S. Treasury Obligations valued at $26,543,524, 0.00% - 4.50%, 4/27/17 - 8/15/45) | 26,023 | 26,000 | |
| 0.79%, dated 3/16/17 due 4/7/17: | |||
| (Collateralized by U.S. Treasury Obligations valued at $18,367,538, 0.00% - 6.63%, 4/27/17 - 11/15/45) | 18,024 | 18,000 | |
| (Collateralized by U.S. Treasury Obligations valued at $21,542,666, 0.00% - 8.75%, 4/27/17 - 2/15/46) | 21,031 | 21,000 | |
| RBC Dominion Securities at: | |||
| 0.57%, dated 2/28/17 due 4/7/17 (Collateralized by U.S. Treasury Obligations valued at $27,554,849, 1.13% - 2.25%, 10/31/18 - 2/15/26) | 27,025 | 27,000 | |
| 0.78%, dated 3/22/17 due 4/7/17 (Collateralized by U.S. Treasury Obligations valued at $30,611,335, 1.00% - 4.50%, 10/31/18 - 2/15/47) | 30,041 | 30,000 | |
| 0.81%, dated 3/24/17 due 4/7/17 (Collateralized by U.S. Treasury Obligations valued at $15,303,510, 1.63%, 7/31/19) | 15,032 | 15,000 | |
| 0.82%, dated 3/27/17 due 4/7/17 (Collateralized by U.S. Treasury Obligations valued at $48,091,031, 1.13% - 3.63%, 10/31/18 - 5/15/45) | 47,102 | 47,000 | |
| RBS Securities, Inc. at 0.8%, dated 3/31/17 due 4/3/17 (Collateralized by U.S. Treasury Obligations valued at $5,100,061, 0.49%, 7/31/18) | 5,000 | 5,000 | |
| Societe Generale at: | |||
| 0.55%, dated 2/2/17 due 4/3/17 (Collateralized by U.S. Treasury Obligations valued at $15,314,121, 0.75% - 9.13%, 1/31/18 - 7/15/19) | 15,014 | 15,000 | |
| 0.59%, dated: | |||
| 1/26/17 due 4/26/17 (Collateralized by U.S. Treasury Obligations valued at $149,216,346, 0.88% - 4.75%, 7/15/18 - 8/15/43) | 146,215 | 146,000 | |
| 1/27/17 due 4/28/17 (Collateralized by U.S. Treasury Obligations valued at $249,402,932, 1.63% - 8.75%, 7/31/18 - 11/15/41) | 244,364 | 244,000 | |
| 0.6%, dated 2/9/17 due 4/7/17 (Collateralized by U.S. Treasury Obligations valued at $25,522,563, 1.38% - 4.75%, 8/15/17 - 11/30/22) | 25,040 | 25,000 | |
| Sumitomo Mitsui Trust Bank Ltd. at: | |||
| 0.66%, dated 3/1/17 due 4/5/17 (Collateralized by U.S. Treasury Obligations valued at $15,034,221, 0.75% - 2.25%, 6/30/17 - 11/15/24) | 14,634 | 14,625 | |
| 0.85%, dated 3/8/17 due 4/7/17 (Collateralized by U.S. Treasury Obligations valued at $14,312,975, 2.38%, 8/15/24) | 14,012 | 14,000 | |
| 0.87%, dated 3/15/17 due 4/7/17 (Collateralized by U.S. Treasury Obligations valued at $47,201,868, 2.25%, 11/15/24) | 45,976 | 45,938 | |
| 0.91%, dated: | |||
| 3/16/17 due 4/7/17 (Collateralized by U.S. Treasury Obligations valued at $47,264,135, 2.25%, 11/15/24) | 46,042 | 46,000 | |
| 3/29/17 due 4/7/17 (Collateralized by U.S. Treasury Obligations valued at $14,926,149, 2.50%, 5/15/24) | 14,515 | 14,500 | |
| 3/30/17 due 4/7/17 (Collateralized by U.S. Treasury Obligations valued at $15,402,031, 2.50%, 5/15/24) | 15,015 | 15,000 | |
| 4/5/17 due 4/7/17(c) | 14,013 | 14,000 | |
| TOTAL U.S. TREASURY REPURCHASE AGREEMENT | |||
| (Cost $7,391,442) | 7,391,442 | ||
| TOTAL INVESTMENT PORTFOLIO - 99.5% | |||
| (Cost $18,858,275) | 18,858,275 | ||
| NET OTHER ASSETS (LIABILITIES) - 0.5% | 90,533 | ||
| NET ASSETS - 100% | $18,948,808 |
The date shown for securities represents the date when principal payments must be paid, taking into account any call options exercised by the issuer and any permissible maturity shortening features other than interest rate resets.
Legend
(a) Yield represents either the annualized yield at the date of purchase, or the stated coupon rate, or, for floating and adjustable rate securities, the rate at period end.
(b) Coupon rates for floating and adjustable rate securities reflect the rates in effect at period end.
(c) Represents a forward settling transaction and therefore no collateral securities had been allocated as of period end. The agreement contemplated the delivery of U.S. Treasury Obligations as collateral on settlement date.
Investment Valuation
All investments are categorized as Level 2 under the Fair Value Hierarchy. The inputs or methodology used for valuing securities may not be an indication of the risk associated with investing in those securities. For more information on valuation inputs please refer to the Investment Valuation section in the accompanying Notes to Financial Statements.
Other Information
# Additional information on each counterparty to the repurchase agreement is as follows:
| Repurchase Agreement / Counterparty | Value (000s) |
| $1,180,264,000 due 4/03/17 at 0.79% | |
| HSBC Securities (USA), Inc. | $101,833 |
| Merrill Lynch, Pierce, Fenner & Smith, Inc. | 43,116 |
| RBC Dominion Securities, Inc. | 1,035,315 |
| $1,180,264 |
See accompanying notes which are an integral part of the financial statements.
Treasury Portfolio
Financial Statements
Statement of Assets and Liabilities
| Amounts in thousands (except per-share amounts) | March 31, 2017 | |
| Assets | ||
| Investment in securities, at value (including repurchase agreements of $7,391,442) — See accompanying schedule: Unaffiliated issuers (cost $18,858,275) | $18,858,275 | |
| Cash | 89,308 | |
| Receivable for fund shares sold | 326 | |
| Interest receivable | 22,539 | |
| Prepaid expenses | 18 | |
| Receivable from investment adviser for expense reductions | 450 | |
| Other receivables | 184 | |
| Total assets | 18,971,100 | |
| Liabilities | ||
| Payable for investments purchased | $14,000 | |
| Payable for fund shares redeemed | 485 | |
| Distributions payable | 3,517 | |
| Accrued management fee | 2,235 | |
| Distribution and service plan fees payable | 873 | |
| Other affiliated payables | 892 | |
| Other payables and accrued expenses | 290 | |
| Total liabilities | 22,292 | |
| Net Assets | $18,948,808 | |
| Net Assets consist of: | ||
| Paid in capital | $18,948,296 | |
| Undistributed net investment income | 520 | |
| Accumulated undistributed net realized gain (loss) on investments | (8) | |
| Net Assets | $18,948,808 | |
| Class I: | ||
| Net Asset Value, offering price and redemption price per share ($8,307,839 ÷ 8,304,278 shares) | $1.00 | |
| Class II: | ||
| Net Asset Value, offering price and redemption price per share ($363,405 ÷ 363,135 shares) | $1.00 | |
| Class III: | ||
| Net Asset Value, offering price and redemption price per share ($2,563,033 ÷ 2,562,611 shares) | $1.00 | |
| Class IV: | ||
| Net Asset Value, offering price and redemption price per share ($793,456 ÷ 793,166 shares) | $1.00 | |
| Select Class: | ||
| Net Asset Value, offering price and redemption price per share ($275,908 ÷ 275,826 shares) | $1.00 | |
| Institutional Class: | ||
| Net Asset Value, offering price and redemption price per share ($6,645,167 ÷ 6,644,528 shares) | $1.00 |
See accompanying notes which are an integral part of the financial statements.
Statement of Operations
| Amounts in thousands | Year ended March 31, 2017 | |
| Investment Income | ||
| Interest | $88,304 | |
| Expenses | ||
| Management fee | $27,479 | |
| Transfer agent fees | 10,272 | |
| Distribution and service plan fees | 10,986 | |
| Accounting fees and expenses | 1,214 | |
| Custodian fees and expenses | 196 | |
| Independent trustees' fees and expenses | 84 | |
| Registration fees | 203 | |
| Audit | 52 | |
| Legal | 43 | |
| Miscellaneous | 86 | |
| Total expenses before reductions | 50,615 | |
| Expense reductions | (9,215) | 41,400 |
| Net investment income (loss) | 46,904 | |
| Realized and Unrealized Gain (Loss) | ||
| Net realized gain (loss) on: | ||
| Investment securities: | ||
| Unaffiliated issuers | 192 | |
| Total net realized gain (loss) | 192 | |
| Net increase in net assets resulting from operations | $47,096 |
See accompanying notes which are an integral part of the financial statements.
Statement of Changes in Net Assets
| Amounts in thousands | Year ended March 31, 2017 | Year ended March 31, 2016 |
| Increase (Decrease) in Net Assets | ||
| Operations | ||
| Net investment income (loss) | $46,904 | $7,513 |
| Net realized gain (loss) | 192 | 279 |
| Net increase in net assets resulting from operations | 47,096 | 7,792 |
| Distributions to shareholders from net investment income | (46,502) | (6,744) |
| Share transactions - net increase (decrease) | 1,492,662 | 1,276,158 |
| Total increase (decrease) in net assets | 1,493,256 | 1,277,206 |
| Net Assets | ||
| Beginning of period | 17,455,552 | 16,178,346 |
| End of period | $18,948,808 | $17,455,552 |
| Other Information | ||
| Undistributed net investment income end of period | $520 | $121 |
See accompanying notes which are an integral part of the financial statements.
Financial Highlights — Treasury Portfolio Class I
| Years ended March 31, | 2017 | 2016 | 2015 | 2014 | 2013 |
| Selected Per–Share Data | |||||
| Net asset value, beginning of period | $1.00 | $1.00 | $1.00 | $1.00 | $1.00 |
| Income from Investment Operations | |||||
| Net investment income (loss) | .003 | .001 | –A | –A | –A |
| Net realized and unrealized gain (loss)A | – | – | – | – | – |
| Total from investment operations | .003 | .001 | –A | –A | –A |
| Distributions from net investment income | (.003) | (.001) | –A | –A | –A |
| Total distributions | (.003) | (.001) | –A | –A | –A |
| Net asset value, end of period | $1.00 | $1.00 | $1.00 | $1.00 | $1.00 |
| Total ReturnB | .27% | .05% | .01% | .01% | .01% |
| Ratios to Average Net AssetsC | |||||
| Expenses before reductions | .21% | .21% | .21% | .21% | .21% |
| Expenses net of fee waivers, if any | .18% | .13% | .07% | .08% | .16% |
| Expenses net of all reductions | .18% | .13% | .07% | .08% | .16% |
| Net investment income (loss) | .27% | .05% | .01% | .01% | .01% |
| Supplemental Data | |||||
| Net assets, end of period (in millions) | $8,308 | $9,639 | $11,727 | $9,736 | $9,964 |
A Amount represents less than $.0005 per share.
B Total returns would have been lower if certain expenses had not been reduced during the applicable periods shown.
C Expense ratios reflect operating expenses of the class. Expenses before reductions do not reflect amounts reimbursed or waived or reductions from expense offset arrangements and do not represent the amount paid by the class during periods when reimbursements, waivers or reductions occur. Expenses net of fee waivers reflect expenses after reimbursement and waivers but prior to reductions from expense offset arrangements. Expenses net of all reductions represent the net expenses paid by the class.
See accompanying notes which are an integral part of the financial statements.
Financial Highlights — Treasury Portfolio Class II
| Years ended March 31, | 2017 | 2016 | 2015 | 2014 | 2013 |
| Selected Per–Share Data | |||||
| Net asset value, beginning of period | $1.00 | $1.00 | $1.00 | $1.00 | $1.00 |
| Income from Investment Operations | |||||
| Net investment income (loss) | .001 | –A | –A | –A | –A |
| Net realized and unrealized gain (loss)A | – | – | – | – | – |
| Total from investment operations | .001 | –A | –A | –A | –A |
| Distributions from net investment income | (.001) | –A | –A | –A | –A |
| Total distributions | (.001) | –A | –A | –A | –A |
| Net asset value, end of period | $1.00 | $1.00 | $1.00 | $1.00 | $1.00 |
| Total ReturnB | .12% | .01% | .01% | .01% | .01% |
| Ratios to Average Net AssetsC | |||||
| Expenses before reductions | .36% | .36% | .36% | .36% | .36% |
| Expenses net of fee waivers, if any | .33% | .22% | .07% | .08% | .16% |
| Expenses net of all reductions | .33% | .22% | .07% | .08% | .16% |
| Net investment income (loss) | .12% | .01% | .01% | .01% | .01% |
| Supplemental Data | |||||
| Net assets, end of period (in millions) | $363 | $557 | $70 | $133 | $127 |
A Amount represents less than $.0005 per share.
B Total returns would have been lower if certain expenses had not been reduced during the applicable periods shown.
C Expense ratios reflect operating expenses of the class. Expenses before reductions do not reflect amounts reimbursed or waived or reductions from expense offset arrangements and do not represent the amount paid by the class during periods when reimbursements, waivers or reductions occur. Expenses net of fee waivers reflect expenses after reimbursement and waivers but prior to reductions from expense offset arrangements. Expenses net of all reductions represent the net expenses paid by the class.
See accompanying notes which are an integral part of the financial statements.
Financial Highlights — Treasury Portfolio Class III
| Years ended March 31, | 2017 | 2016 | 2015 | 2014 | 2013 |
| Selected Per–Share Data | |||||
| Net asset value, beginning of period | $1.00 | $1.00 | $1.00 | $1.00 | $1.00 |
| Income from Investment Operations | |||||
| Net investment income (loss) | .001 | –A | –A | –A | –A |
| Net realized and unrealized gain (loss)A | – | – | – | – | – |
| Total from investment operations | .001 | –A | –A | –A | –A |
| Distributions from net investment income | (.001) | –A | –A | –A | –A |
| Total distributions | (.001) | –A | –A | –A | –A |
| Net asset value, end of period | $1.00 | $1.00 | $1.00 | $1.00 | $1.00 |
| Total ReturnB | .05% | .01% | .01% | .01% | .01% |
| Ratios to Average Net AssetsC | |||||
| Expenses before reductions | .46% | .46% | .46% | .46% | .46% |
| Expenses net of fee waivers, if any | .39% | .17% | .07% | .08% | .16% |
| Expenses net of all reductions | .39% | .17% | .07% | .08% | .16% |
| Net investment income (loss) | .06% | .02% | .01% | .01% | .01% |
| Supplemental Data | |||||
| Net assets, end of period (in millions) | $2,563 | $2,862 | $2,866 | $2,654 | $2,844 |
A Amount represents less than $.0005 per share.
B Total returns would have been lower if certain expenses had not been reduced during the applicable periods shown.
C Expense ratios reflect operating expenses of the class. Expenses before reductions do not reflect amounts reimbursed or waived or reductions from expense offset arrangements and do not represent the amount paid by the class during periods when reimbursements, waivers or reductions occur. Expenses net of fee waivers reflect expenses after reimbursement and waivers but prior to reductions from expense offset arrangements. Expenses net of all reductions represent the net expenses paid by the class.
See accompanying notes which are an integral part of the financial statements.
Financial Highlights — Treasury Portfolio Class IV
| Years ended March 31, | 2017 | 2016 | 2015 | 2014 | 2013 |
| Selected Per–Share Data | |||||
| Net asset value, beginning of period | $1.00 | $1.00 | $1.00 | $1.00 | $1.00 |
| Income from Investment Operations | |||||
| Net investment income (loss)A | – | – | – | – | – |
| Net realized and unrealized gain (loss)A | – | – | – | – | – |
| Total from investment operationsA | – | – | – | – | – |
| Distributions from net investment incomeA | – | – | – | – | – |
| Total distributionsA | – | – | – | – | – |
| Net asset value, end of period | $1.00 | $1.00 | $1.00 | $1.00 | $1.00 |
| Total ReturnB | .01% | .01% | .01% | .01% | .01% |
| Ratios to Average Net AssetsC | |||||
| Expenses before reductions | .71% | .71% | .71% | .71% | .71% |
| Expenses net of fee waivers, if any | .43% | .18% | .07% | .08% | .16% |
| Expenses net of all reductions | .43% | .18% | .07% | .08% | .16% |
| Net investment income (loss) | .02% | .01% | .01% | .01% | .01% |
| Supplemental Data | |||||
| Net assets, end of period (in millions) | $793 | $905 | $621 | $591 | $527 |
A Amount represents less than $.0005 per share.
B Total returns would have been lower if certain expenses had not been reduced during the applicable periods shown.
C Expense ratios reflect operating expenses of the class. Expenses before reductions do not reflect amounts reimbursed or waived or reductions from expense offset arrangements and do not represent the amount paid by the class during periods when reimbursements, waivers or reductions occur. Expenses net of fee waivers reflect expenses after reimbursement and waivers but prior to reductions from expense offset arrangements. Expenses net of all reductions represent the net expenses paid by the class.
See accompanying notes which are an integral part of the financial statements.
Financial Highlights — Treasury Portfolio Select Class
| Years ended March 31, | 2017 | 2016 | 2015 | 2014 | 2013 |
| Selected Per–Share Data | |||||
| Net asset value, beginning of period | $1.00 | $1.00 | $1.00 | $1.00 | $1.00 |
| Income from Investment Operations | |||||
| Net investment income (loss) | .002 | –A | –A | –A | –A |
| Net realized and unrealized gain (loss)A | – | – | – | – | – |
| Total from investment operations | .002 | –A | –A | –A | –A |
| Distributions from net investment income | (.002) | –A | –A | –A | –A |
| Total distributions | (.002) | –A | –A | –A | –A |
| Net asset value, end of period | $1.00 | $1.00 | $1.00 | $1.00 | $1.00 |
| Total ReturnB | .22% | .04% | .01% | .01% | .01% |
| Ratios to Average Net AssetsC | |||||
| Expenses before reductions | .26% | .26% | .26% | .26% | .26% |
| Expenses net of fee waivers, if any | .23% | .15% | .07% | .08% | .16% |
| Expenses net of all reductions | .23% | .15% | .07% | .08% | .16% |
| Net investment income (loss) | .22% | .04% | .01% | .01% | .01% |
| Supplemental Data | |||||
| Net assets, end of period (in millions) | $276 | $287 | $225 | $238 | $198 |
A Amount represents less than $.0005 per share.
B Total returns would have been lower if certain expenses had not been reduced during the applicable periods shown.
C Expense ratios reflect operating expenses of the class. Expenses before reductions do not reflect amounts reimbursed or waived or reductions from expense offset arrangements and do not represent the amount paid by the class during periods when reimbursements, waivers or reductions occur. Expenses net of fee waivers reflect expenses after reimbursement and waivers but prior to reductions from expense offset arrangements. Expenses net of all reductions represent the net expenses paid by the class.
See accompanying notes which are an integral part of the financial statements.
Financial Highlights — Treasury Portfolio Institutional Class
| Years ended March 31, | 2017 | 2016 | 2015 A |
| Selected Per–Share Data | |||
| Net asset value, beginning of period | $1.00 | $1.00 | $1.00 |
| Income from Investment Operations | |||
| Net investment income (loss) | .003 | .001 | –B |
| Net realized and unrealized gain (loss)B | – | – | – |
| Total from investment operations | .003 | .001 | –B |
| Distributions from net investment income | (.003) | (.001) | –B |
| Total distributions | (.003) | (.001) | –B |
| Net asset value, end of period | $1.00 | $1.00 | $1.00 |
| Total ReturnC,D | .31% | .07% | .01% |
| Ratios to Average Net AssetsE | |||
| Expenses before reductions | .18% | .18% | .18%F |
| Expenses net of fee waivers, if any | .14% | .13% | .07%F |
| Expenses net of all reductions | .14% | .13% | .07%F |
| Net investment income (loss) | .31% | .11% | - %F,G |
| Supplemental Data | |||
| Net assets, end of period (in millions) | $6,645 | $3,205 | $669 |
A For the period May 14, 2014 (commencement of sale of shares) to March 31, 2015.
B Amount represents less than $.0005 per share.
C Total returns for periods of less than one year are not annualized.
D Total returns would have been lower if certain expenses had not been reduced during the applicable periods shown.
E Expense ratios reflect operating expenses of the class. Expenses before reductions do not reflect amounts reimbursed or waived or reductions from expense offset arrangements and do not represent the amount paid by the class during periods when reimbursements, waivers or reductions occur. Expense ratios before reductions for start-up periods may not be representative of longer-term operating periods. Expenses net of fee waivers reflect expenses after reimbursement and waivers but prior to reductions from expense offset arrangements. Expenses net of all reductions represent the net expenses paid by the class.
F Annualized
G Amount represents less than .005%.
See accompanying notes which are an integral part of the financial statements.
Government Portfolio
Investment Summary/Performance (Unaudited)
Effective Maturity Diversification
| Days | % of fund's investments 3/31/17 | % of fund's investments 9/30/16 | % of fund's investments 3/31/16 |
| 1 - 7 | 30.6 | 35.5 | 36.0 |
| 8 - 30 | 24.5 | 12.7 | 22.3 |
| 31 - 60 | 15.8 | 19.3 | 9.1 |
| 61 - 90 | 18.1 | 16.8 | 16.4 |
| 91 - 180 | 8.6 | 13.8 | 14.2 |
| > 180 | 2.4 | 1.9 | 2.0 |
Effective maturity is determined in accordance with the requirements of Rule 2a-7 under the Investment Company Act of 1940.
Asset Allocation (% of fund's net assets)
| As of March 31, 2017 | ||
| U.S. Treasury Debt | 25.9% | |
| U.S. Government Agency Debt | 46.1% | |
| Repurchase Agreements | 27.3% | |
| Variable Rate Demand Notes (VRDNs) | 0.7% | |

| As of September 30, 2016 | ||
| U.S. Treasury Debt | 19.1% | |
| U.S. Government Agency Debt | 45.8% | |
| Repurchase Agreements | 35.1% | |

Current And Historical 7-Day Yields
| 3/31/17 | 12/31/16 | 9/30/16 | 6/30/16 | 3/31/16 | |
| Class I | 0.56% | 0.39% | 0.27% | 0.26% | 0.23% |
| Class II | 0.41% | 0.24% | 0.12% | 0.11% | 0.08% |
| Class III | 0.31% | 0.14% | 0.02% | 0.02% | 0.01% |
| Select Class | 0.51% | 0.34% | 0.22% | 0.21% | 0.18% |
| Institutional Class | 0.60% | 0.43% | 0.31% | 0.30% | 0.27% |
Yield refers to the income paid by the Fund over a given period. Yields for money market funds are usually for seven-day periods, as they are here, though they are expressed as annual percentage rates. Past performance is no guarantee of future results. Yield will vary and it's possible to lose money investing in the Fund. A portion of the Fund's expenses was reimbursed and/or waived. Absent such reimbursements and/or waivers the yield for the period ending March 31, 2017, the most recent period shown in the table, would have been 0.53% for Class I, 0.39% for Class II, 0.29% for Class III, 0.49% for Select Class and 0.56% for Institutional Class.
Government Portfolio
Investments March 31, 2017
Showing Percentage of Net Assets
| U.S. Treasury Debt - 25.9% | ||||
| Yield(a) | Principal Amount (000s) | Value (000s) | ||
| U.S. Treasury Inflation Protected Obligations - 3.7% | ||||
| U.S. Treasury Notes | ||||
| 4/15/17 | 0.85 to 0.87% | $3,448,041 | $3,454,195 | |
| U.S. Treasury Obligations - 22.2% | ||||
| U.S. Treasury Bills | ||||
| 4/20/17 to 9/28/17 | 0.47 to 0.91 | 14,833,808 | 14,806,777 | |
| U.S. Treasury Bonds | ||||
| 5/15/17 | 0.62 | 95,000 | 95,935 | |
| U.S. Treasury Notes | ||||
| 4/15/17 to 1/31/19 | 0.49 to 0.92 (b) | 6,063,026 | 6,068,745 | |
| 20,971,457 | ||||
| TOTAL U.S. TREASURY DEBT | ||||
| (Cost $24,425,652) | 24,425,652 | |||
| Variable Rate Demand Note - 0.7% | ||||
| Arizona - 0.0% | ||||
| FNMA Maricopa County Indl. Dev. Auth. Multi-family Hsg. Rev. (San Fernando Apts. Proj.) Series 2004, 0.85% 4/7/17, LOC Fannie Mae, VRDN | ||||
| 4/7/17 | 0.85 (b)(c) | 14,500 | 14,500 | |
| FNMA Maricopa County Indl. Dev. Auth. Multi-family Hsg. Rev. (San Martin Apts. Proj.) Series A1, 0.85% 4/7/17, LOC Fannie Mae, VRDN | ||||
| 4/7/17 | 0.85 (b)(c) | 6,000 | 6,000 | |
| 20,500 | ||||
| California - 0.2% | ||||
| FHLMC Orange County Apt. Dev. Rev. (Park Place Apts. Proj.) Series 1989 A, 0.85% 4/7/17, LOC Freddie Mac, VRDN | ||||
| 4/7/17 | 0.85 (b)(c) | 15,400 | 15,400 | |
| FNMA California Statewide Cmntys. Dev. Auth. Multi-family Hsg. Rev. (Villas at Hamilton Apts. Proj.) Series 2001 HH, 0.85% 4/7/17, LOC Fannie Mae, VRDN | ||||
| 4/7/17 | 0.85 (b)(c) | 11,300 | 11,300 | |
| FNMA California Statewide Cmntys. Dev. Auth. Multi-family Hsg. Rev. (Vista Del Monte Proj.) Series QQ, 0.85% 4/7/17, LOC Fannie Mae, VRDN | ||||
| 4/7/17 | 0.85 (b)(c) | 12,150 | 12,150 | |
| FNMA California Statewide Cmntys. Dev. Auth. Multi-family Hsg. Rev. (Wilshire Court Proj.) Series M, 0.85% 4/7/17, LOC Fannie Mae, VRDN | ||||
| 4/7/17 | 0.85 (b)(c) | 20,290 | 20,290 | |
| FNMA Orange County Apt. Dev. Rev. (Ladera Apts. Proj.) Series 2001 II B, 0.85% 4/7/17, LOC Fannie Mae, VRDN | ||||
| 4/7/17 | 0.85 (b)(c) | 23,500 | 23,500 | |
| FNMA Orange County Apt. Dev. Rev. (Wood Canyon Villas Proj.) Series 2001 E, 0.85% 4/7/17, LOC Fannie Mae, VRDN | ||||
| 4/7/17 | 0.85 (b)(c) | 16,000 | 16,000 | |
| FNMA Pleasanton Multi-family Rev. (Bernal Apts. Proj.) Series A, 0.85% 4/7/17, LOC Fannie Mae, VRDN | ||||
| 4/7/17 | 0.85 (b)(c) | 13,750 | 13,750 | |
| FNMA San Diego Hsg. Auth. Multi-family Hsg. Rev. (Bay Vista Apts. Proj.) Series A, 0.85% 4/7/17, LOC Fannie Mae, VRDN | ||||
| 4/7/17 | 0.85 (b)(c) | 14,500 | 14,500 | |
| FNMA Santa Cruz Redev. Agcy. Multi-family Rev. (Shaffer Road Apts. Proj.) Series A, 0.85% 4/7/17, LOC Fannie Mae, VRDN | ||||
| 4/7/17 | 0.85 (b)(c) | 29,925 | 29,925 | |
| 156,815 | ||||
| Colorado - 0.0% | ||||
| FNMA Lakewood Hsg. Auth. Multi-family Rev. (Ridgemoor Apts. Proj.) Series 2003 A, 0.85% 4/7/17, LOC Fannie Mae, VRDN | ||||
| 4/7/17 | 0.85 (b)(c) | 13,325 | 13,325 | |
| Florida - 0.0% | ||||
| FNMA Florida Hsg. Fin. Corp. Multi-family Mtg. Rev. (Grande Court at North Port Apts. Proj.) Series 2004 E, 0.92% 4/7/17, LOC Fannie Mae, VRDN | ||||
| 4/7/17 | 0.92 (b)(c) | 5,100 | 5,100 | |
| FNMA Florida Hsg. Fin. Corp. Rev. (Valencia Village Apts. Proj.) Series G, 0.91% 4/7/17, LOC Fannie Mae, VRDN | ||||
| 4/7/17 | 0.91 (b)(c) | 10,350 | 10,350 | |
| 15,450 | ||||
| Maryland - 0.0% | ||||
| FNMA Maryland Cmnty. Dev. Administration Dept. of Hsg. & Cmnty. Dev. (Barrington Apts. Proj.) Series A, 0.85% 4/7/17, LOC Fannie Mae, VRDN | ||||
| 4/7/17 | 0.85 (b)(c) | 39,765 | 39,765 | |
| New Jersey - 0.0% | ||||
| FNMA Bergen County Impt. Auth. Multi-family Hsg. Rev. (Kentshire Apts. Proj.) Series 2001, 0.92% 4/7/17, LOC Fannie Mae, VRDN | ||||
| 4/7/17 | 0.92 (b)(c) | 6,300 | 6,300 | |
| New York - 0.4% | ||||
| FHLMC New York Hsg. Fin. Agcy. Rev. (600 West and 42nd St. Hsg. Proj.) Series 2007 A, 0.88% 4/7/17, LOC Freddie Mac, VRDN | ||||
| 4/7/17 | 0.88 (b)(c) | 90,950 | 90,950 | |
| FHLMC New York Hsg. Fin. Agcy. Rev. (Clinton Green South Hsg. Proj.) Series 2006 A, 0.97% 4/7/17, LOC Freddie Mac, VRDN | ||||
| 4/7/17 | 0.97 (b)(c) | 13,200 | 13,200 | |
| FNMA New York City Hsg. Dev. Corp. Multi-family Rental Hsg. Rev. Series 2002 A, 0.84% 4/7/17, LOC Fannie Mae, VRDN | ||||
| 4/7/17 | 0.84 (b)(c) | 51,500 | 51,500 | |
| FNMA New York Hsg. Fin. Agcy. Rev. (125 West 31st Street Proj.) Series 2005 A, 0.97% 4/7/17, LOC Fannie Mae, VRDN | ||||
| 4/7/17 | 0.97 (b)(c) | 41,600 | 41,600 | |
| FNMA New York Hsg. Fin. Agcy. Rev. (240 East 39th Street Hsg. Proj.) Series 1997 A, 0.84% 4/7/17, LOC Fannie Mae, VRDN | ||||
| 4/7/17 | 0.84 (b)(c) | 45,000 | 45,000 | |
| FNMA New York Hsg. Fin. Agcy. Rev. (West 20th Street Proj.) Series 2001 A, 0.87% 4/7/17, LOC Fannie Mae, VRDN | ||||
| 4/7/17 | 0.87 (b)(c) | 51,000 | 51,000 | |
| FNMA New York Hsg. Fin. Agcy. Rev. Series 2004 A, 0.87% 4/7/17, LOC Fannie Mae, VRDN | ||||
| 4/7/17 | 0.87 (b)(c) | 53,950 | 53,950 | |
| 347,200 | ||||
| Texas - 0.1% | ||||
| FHLMC Montgomery County Hsg. Fin. Corp. Multi-family Hsg. Rev. (Conroe Lodge at Silverdale Apt. Homes Proj.) 0.85% 4/7/17, LOC Freddie Mac, VRDN | ||||
| 4/7/17 | 0.85 (b)(c) | 7,470 | 7,470 | |
| FNMA Dallas Hsg. Fin. Corp. Multi-family Hsg. Rev. (The Masters Apts. Proj.) 0.85% 4/7/17, LOC Fannie Mae, VRDN | ||||
| 4/7/17 | 0.85 (b)(c) | 6,780 | 6,780 | |
| FNMA Harris County Hsg. Fin. Corp. Multi-family Hsg. Rev. (Louetta Village Apts. Proj.) Series 2005, 0.85% 4/7/17, LOC Fannie Mae, VRDN | ||||
| 4/7/17 | 0.85 (b)(c) | 6,080 | 6,080 | |
| FNMA Texas Dept. of Hsg. & Cmnty. Affairs Multi-family Hsg. Rev. (Pinnacle Apts. Proj.) Series 2004, 0.85% 4/7/17, LOC Fannie Mae, VRDN | ||||
| 4/7/17 | 0.85 (b)(c) | 12,965 | 12,965 | |
| FNMA Texas Dept. of Hsg. & Cmnty. Affairs Multi-family Hsg. Rev. Series 2004, 0.85% 4/7/17, LOC Fannie Mae, VRDN | ||||
| 4/7/17 | 0.85 (b)(c) | 10,600 | 10,600 | |
| 43,895 | ||||
| Virginia - 0.0% | ||||
| FHLMC Arlington County Indl. Dev. Auth. Multi-family Hsg. Rev. Series A, 0.92% 4/7/17, LOC Freddie Mac, VRDN | ||||
| 4/7/17 | 0.92 (b)(c) | 8,000 | 8,000 | |
| Washington - 0.0% | ||||
| FNMA Washington Hsg. Fin. Commission Multi-family Hsg. Rev. (The Vintage at Richland Sr. Living Proj.) Series 2004 A, 0.85% 4/7/17, LOC Fannie Mae, VRDN | ||||
| 4/7/17 | 0.85 (b)(c) | 7,535 | 7,535 | |
| TOTAL VARIABLE RATE DEMAND NOTE | ||||
| (Cost $658,785) | 658,785 | |||
| U.S. Government Agency Debt - 46.1% | ||||
| Federal Agencies - 46.1% | ||||
| Fannie Mae | ||||
| 6/1/17 to 1/11/18 | 0.66 to 1.00 (b) | 948,983 | 948,946 | |
| Federal Farm Credit Bank | ||||
| 4/17/17 to 3/27/18 | 0.74 to 1.03 (b) | 2,561,500 | 2,561,637 | |
| Federal Home Loan Bank | ||||
| 4/3/17 to 10/5/18 | 0.53 to 1.01 (b)(d) | 34,647,988 | 34,638,942 | |
| Freddie Mac | ||||
| 4/6/17 to 1/12/18 | 0.50 to 1.11 (b) | 5,357,640 | 5,357,000 | |
| TOTAL U.S. GOVERNMENT AGENCY DEBT | ||||
| (Cost $43,506,525) | 43,506,525 |
| U.S. Government Agency Repurchase Agreement - 12.8% | |||
| Maturity Amount (000s) | Value (000s) | ||
| In a joint trading account at: | |||
| 0.79% dated 3/31/17 due 4/3/17 (Collateralized by U.S. Government Obligations) # | $1,202,198 | $1,202,118 | |
| 0.81% dated 3/31/17 due 4/3/17 (Collateralized by U.S. Government Obligations) # | 4,556,987 | 4,556,680 | |
| With: | |||
| BNP Paribas, S.A. at: | |||
| 0.56%, dated 2/2/17 due 4/3/17 (Collateralized by U.S. Treasury Obligations valued at $76,284,852, 0.00% - 7.13%, 2/16/18 - 12/01/45) | 74,069 | 74,000 | |
| 0.59%, dated 2/8/17 due 4/7/17 (Collateralized by U.S. Treasury Obligations valued at $149,866,015, 0.00% - 7.13%, 5/25/17 - 2/20/47) | 146,215 | 146,000 | |
| 0.6%, dated 2/17/17 due 4/7/17 (Collateralized by U.S. Government Obligations valued at $296,007,762, 1.45% - 7.00%, 3/22/21 - 3/15/57) | 289,419 | 289,000 | |
| 0.66%, dated 2/27/17 due 5/26/17 (Collateralized by U.S. Government Obligations valued at $295,187,512, 1.95% - 8.00%, 12/15/26 - 4/01/47) | 289,466 | 289,000 | |
| Citibank NA at: | |||
| 0.78%, dated 3/28/17 due 4/4/17 (Collateralized by U.S. Treasury Obligations valued at $70,430,510, 0.13% - 6.00%, 4/15/17 - 10/20/44) | 69,010 | 69,000 | |
| 0.79%, dated 3/28/17 due 4/4/17 (Collateralized by U.S. Treasury Obligations valued at $420,999,982, 0.00% - 8.75%, 4/15/17 - 8/15/45) | 412,063 | 412,000 | |
| Deutsche Bank Securities, Inc. at 0.82%, dated 3/31/17 due 4/3/17 (Collateralized by U.S. Government Obligations valued at $420,268,717, 2.00% - 7.00%, 11/01/20 - 8/01/47) | 412,028 | 412,000 | |
| ING Financial Markets LLC at 0.63%, dated: | |||
| 2/8/17 due 5/5/17 (Collateralized by U.S. Government Obligations valued at $119,450,514, 3.50%, 2/01/44 - 7/01/46) | 117,117 | 117,000 | |
| 2/9/17 due 5/5/17 (Collateralized by U.S. Government Obligations valued at $148,029,491, 3.00% - 5.00%, 9/01/29 - 2/01/47) | 145,142 | 145,000 | |
| 2/10/17 due 5/5/17 (Collateralized by U.S. Government Obligations valued at $178,653,243, 3.00% - 5.00%, 1/01/29 - 12/01/45) | 175,276 | 175,000 | |
| 2/14/17 due 5/5/17 (Collateralized by U.S. Government Obligations valued at $148,018,175, 3.00% - 4.50%, 9/01/30 - 8/01/42) | 145,228 | 145,000 | |
| 2/15/17 due 5/5/17 (Collateralized by U.S. Government Obligations valued at $87,787,730, 2.00% - 3.00%, 5/20/34 - 5/20/45) | 86,135 | 86,000 | |
| 2/16/17 due 5/5/17 (Collateralized by U.S. Government Obligations valued at $167,407,832, 3.00% - 5.00%, 8/01/26 - 12/01/46) | 164,258 | 164,000 | |
| 2/17/17 due 5/5/17 (Collateralized by U.S. Government Obligations valued at $88,807,041, 2.00% - 5.00%, 3/01/40 - 7/20/45) | 87,137 | 87,000 | |
| 2/21/17 due 5/5/17 (Collateralized by U.S. Government Obligations valued at $145,958,047, 3.50% - 4.00%, 6/01/42 - 2/01/47) | 143,225 | 143,000 | |
| Merrill Lynch, Pierce, Fenner & Smith at 0.59%, dated 2/13/17 due 4/7/17 (Collateralized by U.S. Government Obligations valued at $446,097,955, 2.09% - 4.00%, 11/01/26 - 2/01/47) | 437,423 | 437,000 | |
| Mitsubishi UFJ Securities (U.S.A.), Inc. at: | |||
| 0.76%, dated 3/7/17 due 5/8/17 (Collateralized by U.S. Government Obligations valued at $191,869,303, 2.35% - 5.16%, 7/01/24 - 4/01/47) | 188,246 | 188,000 | |
| 0.77%, dated 3/7/17 due: | |||
| 5/9/17 (Collateralized by U.S. Government Obligations valued at $162,273,659, 2.02% - 5.67%, 11/01/23 - 4/01/47) | 159,214 | 159,000 | |
| 5/10/17(Collateralized by U.S. Government Obligations valued at $191,870,742, 2.46% - 5.20%, 7/01/24 - 4/01/47) | 188,121 | 188,000 | |
| 0.82%, dated 3/20/17 due 5/19/17 (Collateralized by U.S. Government Obligations valued at $199,983,752, 2.21% - 5.43%, 1/01/19 - 4/01/47) | 196,268 | 196,000 | |
| 0.83%, dated 3/28/17 due 5/26/17 (Collateralized by U.S. Government Obligations valued at $189,746,245, 2.01% - 5.50%, 1/01/19 - 8/01/48) | 186,253 | 186,000 | |
| RBC Capital Markets Corp. at: | |||
| 0.56%, dated 2/6/17 due 4/7/17 (Collateralized by U.S. Government Obligations valued at $150,090,561, 1.12% - 5.00%, 1/01/27 - 4/01/47) | 147,144 | 147,000 | |
| 0.58%, dated 2/14/17 due 4/7/17 (Collateralized by U.S. Government Obligations valued at $148,086,090, 1.12% - 5.00%, 12/01/26 - 4/01/47) | 145,185 | 145,000 | |
| 0.83%, dated: | |||
| 3/13/17 due 5/26/17 (Collateralized by U.S. Government Obligations valued at $192,918,241, 1.12% - 5.00%, 1/01/27 - 4/01/47) | 189,322 | 189,000 | |
| 3/31/17 due 5/30/17 (Collateralized by U.S. Government Obligations valued at $97,926,773, 2.87% - 4.50%, 11/01/27 - 4/01/47) | 96,133 | 96,000 | |
| 0.84%, dated: | |||
| 3/10/17 due 6/8/17 (Collateralized by U.S. Government Obligations valued at $103,112,769, 1.12% - 5.00%, 1/01/27 - 4/01/47) | 101,212 | 101,000 | |
| 3/15/17 due 6/14/17 (Collateralized by U.S. Government Obligations valued at $77,672,326, 1.12% - 5.00%, 8/01/26 - 3/01/47) | 76,161 | 76,000 | |
| 3/17/17 due 6/15/17 (Collateralized by U.S. Government Obligations valued at $72,506,695, 1.12% - 6.00%, 12/01/22 - 4/01/47) | 71,149 | 71,000 | |
| RBC Dominion Securities at: | |||
| 0.58%, dated 2/28/17 due 4/7/17: | |||
| (Collateralized by U.S. Treasury Obligations valued at $146,960,458, 1.00% - 4.50%, 12/15/18 - 4/15/40) | 144,144 | 144,000 | |
| (Collateralized by U.S. Treasury Obligations valued at $146,960,458, 1.00% - 4.50%, 12/15/18 - 12/20/45) | 144,146 | 144,000 | |
| 0.78%, dated 3/17/17 due 4/7/17 (Collateralized by U.S. Government Obligations valued at $143,873,923, 0.75% - 4.50%, 5/31/18 - 3/01/47) | 141,095 | 141,000 | |
| 0.79%, dated: | |||
| 3/16/17 due 4/7/17 (Collateralized by U.S. Treasury Obligations valued at $144,642,190, 1.00% - 3.63%, 10/31/18 - 2/29/24) | 141,853 | 141,750 | |
| 3/21/17 due 4/7/17 (Collateralized by U.S. Treasury Obligations valued at $143,281,365, 0.63% - 4.50%, 6/30/18 - 2/15/47) | 140,194 | 140,000 | |
| 3/23/17 due 4/7/17 (Collateralized by U.S. Treasury Obligations valued at $140,794,026, 1.63% - 3.63%, 11/15/19 - 2/15/26) | 138,194 | 138,000 | |
| 3/24/17 due 4/7/17 (Collateralized by U.S. Treasury Obligations valued at $140,790,889, 1.00% - 4.00%, 8/31/19 - 3/20/45) | 138,188 | 138,000 | |
| 0.81%, dated 3/22/17 due 4/7/17 (Collateralized by U.S. Treasury Obligations valued at $115,700,525, 1.00% - 4.00%, 8/31/19 - 2/15/47) | 113,229 | 113,000 | |
| 0.82%, dated 3/24/17 due 4/7/17 (Collateralized by U.S. Treasury Obligations valued at $56,184,937, 1.00% - 4.50%, 7/31/19 - 2/15/47) | 55,118 | 55,000 | |
| 0.83%, dated 3/27/17 due 4/7/17 (Collateralized by U.S. Government Obligations valued at $207,094,678, 1.63% - 4.50%, 8/31/21 - 1/20/47) | 203,440 | 203,000 | |
| TOTAL U.S. GOVERNMENT AGENCY REPURCHASE AGREEMENT | |||
| (Cost $12,048,548) | 12,048,548 | ||
| U.S. Treasury Repurchase Agreement - 14.5% | |||
| With: | |||
| Barclays Capital, Inc. at 0.8%, dated 3/31/17 due 4/3/17 (Collateralized by U.S. Treasury Obligations valued at $51,003,418, 0.88% - 2.13%, 9/30/17 - 3/31/24) | 50,003 | 50,000 | |
| BMO Harris Bank NA at: | |||
| 0.54%, dated 2/9/17 due 4/7/17: | |||
| (Collateralized by U.S. Treasury Obligations valued at $137,710,567, 1.38%, 4/30/20) | 133,120 | 133,000 | |
| (Collateralized by U.S. Treasury Obligations valued at $275,188,797, 0.88% - 1.75%, 6/15/17 - 10/31/21) | 268,241 | 268,000 | |
| 0.55%, dated: | |||
| 2/1/17 due 4/7/17 (Collateralized by U.S. Treasury Obligations valued at $218,563,919, 1.13%, 8/31/21 - 9/30/21) | 214,222 | 214,000 | |
| 2/3/17 due 4/7/17: | |||
| (Collateralized by U.S. Treasury Obligations valued at $97,744,932, 1.75%, 5/15/23) | 94,121 | 94,000 | |
| (Collateralized by U.S. Treasury Obligations valued at $96,694,274, 1.50% - 2.00%, 11/15/21 to 8/15/26) | 94,119 | 94,000 | |
| 0.56%, dated 1/31/17 due 4/7/17 (Collateralized by U.S. Treasury Obligations valued at $138,812,886, 2.00%, 11/15/21 to 2/15/22) | 135,168 | 135,000 | |
| 0.57%, dated 2/28/17 due 4/7/17 (Collateralized by U.S. Treasury Obligations valued at $134,777,237, 1.75%, 11/30/21) | 131,122 | 131,000 | |
| 0.77%, dated 3/15/17 due 4/7/17 (Collateralized by U.S. Treasury Obligations valued at $133,074,150, 2.50%, 6/30/17) | 129,099 | 129,000 | |
| BNP Paribas, S.A. at: | |||
| 0.55%, dated 2/2/17 due 4/3/17 (Collateralized by U.S. Treasury Obligations valued at $207,486,400, 0.75% - 8.00%, 7/31/17 - 2/15/43) | 203,186 | 203,000 | |
| 0.56%, dated 1/31/17 due 4/6/17 (Collateralized by U.S. Treasury Obligations valued at $276,611,078, 0.88% - 8.00%, 8/15/17 - 5/15/46) | 270,273 | 270,000 | |
| 0.57%, dated: | |||
| 1/20/17 due 4/7/17 (Collateralized by U.S. Treasury Obligations valued at $408,468,837, 0.00% - 8.75%, 4/27/17 - 11/15/44) | 399,569 | 399,000 | |
| 2/8/17 due 4/7/17 (Collateralized by U.S. Treasury Obligations valued at $409,790,840, 1.75% - 4.75%, 10/31/17 - 5/15/46) | 400,570 | 400,000 | |
| 0.6%, dated 1/20/17 due 4/20/17 (Collateralized by U.S. Treasury Obligations valued at $544,524,236, 0.63% - 6.00%, 4/30/18 - 8/15/45) | 532,798 | 532,000 | |
| 0.63%, dated: | |||
| 2/24/17 due 4/7/17 (Collateralized by U.S. Treasury Obligations valued at $541,665,000, 0.00% - 3.63%, 5/25/17 - 5/15/46) | 528,970 | 528,000 | |
| 2/27/17 due 4/7/17 (Collateralized by U.S. Treasury Obligations valued at $804,841,586, 0.75% - 6.13%, 8/15/17 - 8/15/46) | 787,444 | 786,000 | |
| 0.78%, dated 3/16/17 due 4/7/17 (Collateralized by U.S. Treasury Obligations valued at $263,481,541, 1.25% - 5.50%, 4/30/18 - 5/15/46) | 258,179 | 258,000 | |
| 0.79%, dated: | |||
| 3/16/17 due 4/7/17 (Collateralized by U.S. Treasury Obligations valued at $264,189,532, 1.00% - 8.00%, 2/28/18 - 2/15/46) | 258,340 | 258,000 | |
| 3/28/17 due 4/7/17 (Collateralized by U.S. Treasury Obligations valued at $287,820,986, 0.00% - 3.88%, 4/27/17 - 5/15/46) | 282,365 | 282,000 | |
| Deutsche Bank Securities, Inc. at 0.81%, dated 3/31/17 due 4/3/17 (Collateralized by U.S. Treasury Obligations valued at $51,003,520, 1.75%, 9/30/22) | 50,003 | 50,000 | |
| Federal Reserve Bank of New York at 0.75%, dated 3/31/17 due 4/3/17 (Collateralized by U.S. Treasury Obligations valued at $4,267,266,778, 1.63%, 11/15/22) | 4,267,267 | 4,267,000 | |
| Mitsubishi UFJ Securities (U.S.A.), Inc. at 0.8%, dated 3/20/17 due 4/7/17 (Collateralized by U.S. Treasury Obligations valued at $196,616,087, 0.75% - 3.63%, 12/31/17 - 2/15/46) | 192,375 | 192,000 | |
| MUFG Securities EMEA PLC at: | |||
| 0.58%, dated 2/6/17 due 4/6/17 (Collateralized by U.S. Treasury Obligations valued at $27,600,835, 1.50%, 8/15/26) | 27,026 | 27,000 | |
| 0.6%, dated 2/13/17 due 4/7/17 (Collateralized by U.S. Treasury Obligations valued at $26,656,606, 1.63%, 2/15/26 - 5/15/26) | 26,039 | 26,000 | |
| 0.63%, dated 3/1/17 due 5/1/17 (Collateralized by U.S. Treasury Obligations valued at $80,840,139, 1.50% - 2.00%, 2/15/25 - 8/15/26) | 79,084 | 79,000 | |
| 0.77%, dated 3/9/17 due 4/10/17 (Collateralized by U.S. Treasury Obligations valued at $216,798,141, 2.63%, 8/15/20) | 212,145 | 212,000 | |
| 0.78%, dated 3/10/17 due 4/10/17 (Collateralized by U.S. Treasury Obligations valued at $189,541,776, 2.00% - 3.13%, 5/15/19 - 8/15/25) | 185,124 | 185,000 | |
| 0.8%, dated 3/31/17 due 4/3/17 (Collateralized by U.S. Treasury Obligations valued at $57,413,223, 1.63% - 2.63%, 8/15/20 - 5/15/26) | 55,674 | 55,670 | |
| 0.81%, dated: | |||
| 3/14/17 due 4/18/17 (Collateralized by U.S. Treasury Obligations valued at $189,426,033, 1.63% - 2.88%, 5/15/26 - 5/15/46) | 184,145 | 184,000 | |
| 3/15/17 due 4/7/17: | |||
| (Collateralized by U.S. Treasury Obligations valued at $271,460,840, 2.13%, 5/15/25) | 265,137 | 265,000 | |
| (Collateralized by U.S. Treasury Obligations valued at $108,653,689, 2.13%, 5/15/25) | 106,055 | 106,000 | |
| 3/17/17 due 4/10/17 (Collateralized by U.S. Treasury Obligations valued at $108,887,449, 1.50% - 2.63%, 8/15/20 - 8/15/26) | 106,057 | 106,000 | |
| 0.82%, dated: | |||
| 3/17/17 due 4/18/17 (Collateralized by U.S. Treasury Obligations valued at $66,588,634, 1.63% - 2.13%, 12/31/22 - 11/15/26) | 65,047 | 65,000 | |
| 3/20/17 due 4/6/17 (Collateralized by U.S. Treasury Obligations valued at $78,813,583, 1.38% - 2.25%, 8/31/23 - 2/15/26) | 77,030 | 77,000 | |
| Prudential Insurance Co. of America at 0.86%, dated 3/31/17 due 4/3/17 (Collateralized by U.S. Treasury Obligations valued at $701,799,614, 0.88% - 8.13%, 6/15/17 - 2/15/31) | 684,261 | 684,212 | |
| RBC Capital Markets Corp. at: | |||
| 0.54%, dated 2/3/17 due 4/3/17 (Collateralized by U.S. Treasury Obligations valued at $138,898,312, 0.00% - 8.13%, 4/27/17 - 8/15/45) | 136,120 | 136,000 | |
| 0.79%, dated 3/16/17 due 4/7/17: | |||
| (Collateralized by U.S. Treasury Obligations valued at $90,827,819, 0.00% - 6.13%, 4/06/17 - 5/15/46) | 89,117 | 89,000 | |
| (Collateralized by U.S. Treasury Obligations valued at $103,282,906, 0.00% - 6.25%, 4/27/17 - 11/15/45) | 101,148 | 101,000 | |
| RBC Dominion Securities at: | |||
| 0.57%, dated 2/28/17 due 4/7/17 (Collateralized by U.S. Treasury Obligations valued at $133,691,973, 0.75% - 2.25%, 10/31/18 - 2/15/26) | 131,122 | 131,000 | |
| 0.78%, dated 3/22/17 due 4/7/17 (Collateralized by U.S. Treasury Obligations valued at $157,246,170, 0.75% - 4.50%, 10/31/18 - 2/15/47) | 154,210 | 154,000 | |
| 0.81%, dated 3/24/17 due 4/7/17 (Collateralized by U.S. Treasury Obligations valued at $77,523,586, 0.88% - 3.00%, 5/31/18 - 2/15/47) | 76,061 | 75,900 | |
| 0.82%, dated 3/27/17 due 4/7/17 (Collateralized by U.S. Treasury Obligations valued at $242,798,788, 0.63% - 3.63%, 5/31/17 - 11/15/26) | 238,515 | 238,000 | |
| RBS Securities, Inc. at 0.8%, dated 3/31/17 due 4/3/17 (Collateralized by U.S. Treasury Obligations valued at $25,504,783, 0.63% - 6.63%, 6/30/17 - 2/15/27) | 25,002 | 25,000 | |
| Societe Generale at: | |||
| 0.55%, dated 2/2/17 due 4/3/17 (Collateralized by U.S. Treasury Obligations valued at $82,007,074, 0.00% - 4.75%, 8/15/17 - 11/15/44) | 80,073 | 80,000 | |
| 0.6%, dated 2/9/17 due 4/7/17 (Collateralized by U.S. Treasury Obligations valued at $133,738,059, 0.63% - 3.63%, 7/31/17 - 5/15/24) | 131,207 | 131,000 | |
| Sumitomo Mitsui Trust Bank Ltd. at: | |||
| 0.66%, dated 3/1/17 due 4/5/17 (Collateralized by U.S. Treasury Obligations valued at $76,050,913, 0.75% - 2.25%, 6/30/17 to 11/15/24) | 74,047 | 74,000 | |
| 0.85%, dated 3/8/17 due 4/7/17 (Collateralized by U.S. Treasury Obligations valued at $75,607,599, 2.38%, 8/15/24) | 74,061 | 74,000 | |
| 0.87%, dated 3/15/17 due 4/7/17 (Collateralized by U.S. Treasury Obligations valued at $234,004,095, 2.63% - 3.75%, 11/15/18 - 8/15/20) | 227,192 | 227,000 | |
| 0.91%, dated: | |||
| 3/16/17 due 4/7/17 (Collateralized by U.S. Treasury Obligations valued at $237,187,392, 3.75%, 11/15/18) | 229,584 | 229,375 | |
| 3/29/17 due 4/7/17 (Collateralized by U.S. Treasury Obligations valued at $77,203,611, 2.50%, 5/15/24) | 75,076 | 75,000 | |
| 3/30/17 due 4/7/17 (Collateralized by U.S. Treasury Obligations valued at $76,755,661, 2.50%, 5/15/24) | 74,826 | 74,750 | |
| 4/5/17 due 4/7/17(e) | 73,319 | 73,250 | |
| TOTAL U.S. TREASURY REPURCHASE AGREEMENT | |||
| (Cost $13,733,157) | 13,733,157 | ||
| TOTAL INVESTMENT PORTFOLIO - 100.0% | |||
| (Cost $94,372,667) | 94,372,667 | ||
| NET OTHER ASSETS (LIABILITIES) - 0.0% | 23,621 | ||
| NET ASSETS - 100% | $94,396,288 |
Security Type Abbreviations
VRDN – Variable Rate Demand Note (A debt instrument that is payable upon demand, either daily, weekly or monthly)
The date shown for securities represents the date when principal payments must be paid, taking into account any call options exercised by the issuer and any permissible maturity shortening features other than interest rate resets.
Legend
(a) Yield represents either the annualized yield at the date of purchase, or the stated coupon rate, or, for floating and adjustable rate securities, the rate at period end.
(b) Coupon rates for floating and adjustable rate securities reflect the rates in effect at period end.
(c) Private activity obligations whose interest is subject to the federal alternative minimum tax for individuals.
(d) Security or a portion of the security purchased on a delayed delivery or when-issued basis.
(e) Represents a forward settling transaction and therefore no collateral securities had been allocated as of period end. The agreement contemplated the delivery of U.S. Treasury Obligations as collateral on settlement date.
Investment Valuation
All investments are categorized as Level 2 under the Fair Value Hierarchy. The inputs or methodology used for valuing securities may not be an indication of the risk associated with investing in those securities. For more information on valuation inputs please refer to the Investment Valuation section in the accompanying Notes to Financial Statements.
Other Information
# Additional information on each counterparty to the repurchase agreement is as follows:
| Repurchase Agreement / Counterparty | Value (000s) |
| $1,202,118,000 due 4/03/17 at 0.79% | |
| HSBC Securities (USA), Inc. | $849,695 |
| Merrill Lynch, Pierce, Fenner & Smith, Inc. | 124,934 |
| RBC Dominion Securities, Inc. | 59,066 |
| Wells Fargo Securities LLC | 168,423 |
| $1,202,118 | |
| $4,556,680,000 due 4/03/17 at 0.81% | |
| BNP Paribas, S.A. | 659,000 |
| Bank of America NA | 1,649,000 |
| Bank of Nova Scotia | 284,538 |
| Citibank NA | 708,000 |
| Mizuho Securities USA, Inc. | 60,000 |
| RBC Dominion Securities, Inc. | 102,142 |
| Wells Fargo Securities LLC | 1,094,000 |
| $4,556,680 |
See accompanying notes which are an integral part of the financial statements.
Government Portfolio
Financial Statements
Statement of Assets and Liabilities
| Amounts in thousands (except per-share amounts) | March 31, 2017 | |
| Assets | ||
| Investment in securities, at value (including repurchase agreements of $25,781,705) — See accompanying schedule: Unaffiliated issuers (cost $94,372,667) | $94,372,667 | |
| Receivable for investments sold | 1,070,778 | |
| Receivable for fund shares sold | 110,844 | |
| Interest receivable | 60,421 | |
| Prepaid expenses | 57 | |
| Receivable from investment adviser for expense reductions | 2,379 | |
| Other receivables | 543 | |
| Total assets | 95,617,689 | |
| Liabilities | ||
| Payable to custodian bank | $119 | |
| Payable for investments purchased | ||
| Regular delivery | 698,340 | |
| Delayed delivery | 407,000 | |
| Payable for fund shares redeemed | 79,352 | |
| Distributions payable | 20,006 | |
| Accrued management fee | 11,341 | |
| Distribution and service plan fees payable | 746 | |
| Other affiliated payables | 3,589 | |
| Other payables and accrued expenses | 908 | |
| Total liabilities | 1,221,401 | |
| Net Assets | $94,396,288 | |
| Net Assets consist of: | ||
| Paid in capital | $94,395,015 | |
| Undistributed net investment income | 1,505 | |
| Accumulated undistributed net realized gain (loss) on investments | (232) | |
| Net Assets | $94,396,288 | |
| Class I: | ||
| Net Asset Value, offering price and redemption price per share ($31,497,904 ÷ 31,485,979 shares) | $1.00 | |
| Class II: | ||
| Net Asset Value, offering price and redemption price per share ($909,338 ÷ 908,868 shares) | $1.00 | |
| Class III: | ||
| Net Asset Value, offering price and redemption price per share ($3,037,856 ÷ 3,036,364 shares) | $1.00 | |
| Select Class: | ||
| Net Asset Value, offering price and redemption price per share ($641,260 ÷ 641,152 shares) | $1.00 | |
| Institutional Class: | ||
| Net Asset Value, offering price and redemption price per share ($58,309,930 ÷ 58,310,743 shares) | $1.00 |
See accompanying notes which are an integral part of the financial statements.
Statement of Operations
| Amounts in thousands | Year ended March 31, 2017 | |
| Investment Income | ||
| Interest | $408,223 | |
| Expenses | ||
| Management fee | $112,006 | |
| Transfer agent fees | 34,232 | |
| Distribution and service plan fees | 7,798 | |
| Accounting fees and expenses | 2,479 | |
| Custodian fees and expenses | 681 | |
| Independent trustees' fees and expenses | 319 | |
| Registration fees | 635 | |
| Audit | 52 | |
| Legal | 136 | |
| Miscellaneous | 243 | |
| Total expenses before reductions | 158,581 | |
| Expense reductions | (25,467) | 133,114 |
| Net investment income (loss) | 275,109 | |
| Realized and Unrealized Gain (Loss) | ||
| Net realized gain (loss) on: | ||
| Investment securities: | ||
| Unaffiliated issuers | 572 | |
| Total net realized gain (loss) | 572 | |
| Net increase in net assets resulting from operations | $275,681 |
See accompanying notes which are an integral part of the financial statements.
Statement of Changes in Net Assets
| Amounts in thousands | Year ended March 31, 2017 | Year ended March 31, 2016 |
| Increase (Decrease) in Net Assets | ||
| Operations | ||
| Net investment income (loss) | $275,109 | $21,681 |
| Net realized gain (loss) | 572 | 145 |
| Net increase in net assets resulting from operations | 275,681 | 21,826 |
| Distributions to shareholders from net investment income | (273,207) | (20,503) |
| Share transactions - net increase (decrease) | 50,338,072 | 19,868,899 |
| Total increase (decrease) in net assets | 50,340,546 | 19,870,222 |
| Net Assets | ||
| Beginning of period | 44,055,742 | 24,185,520 |
| End of period | $94,396,288 | $44,055,742 |
| Other Information | ||
| Undistributed net investment income end of period | $1,505 | $– |
| Distributions in excess of net investment income end of period | $– | $(397) |
See accompanying notes which are an integral part of the financial statements.
Financial Highlights — Government Portfolio Class I
| Years ended March 31, | 2017 | 2016 | 2015 | 2014 | 2013 |
| Selected Per–Share Data | |||||
| Net asset value, beginning of period | $1.00 | $1.00 | $1.00 | $1.00 | $1.00 |
| Income from Investment Operations | |||||
| Net investment income (loss) | .003 | .001 | –A | –A | –A |
| Net realized and unrealized gain (loss)A | – | – | – | – | – |
| Total from investment operations | .003 | .001 | –A | –A | –A |
| Distributions from net investment income | (.003) | (.001) | –A | –A | –A |
| Total distributions | (.003) | (.001) | –A | –A | –A |
| Net asset value, end of period | $1.00 | $1.00 | $1.00 | $1.00 | $1.00 |
| Total ReturnB | .31% | .06% | .01% | .01% | .01% |
| Ratios to Average Net AssetsC | |||||
| Expenses before reductions | .21% | .21% | .21% | .21% | .21% |
| Expenses net of fee waivers, if any | .18% | .16% | .11% | .11% | .18% |
| Expenses net of all reductions | .18% | .16% | .11% | .11% | .18% |
| Net investment income (loss) | .33% | .08% | .01% | .01% | .01% |
| Supplemental Data | |||||
| Net assets, end of period (in millions) | $31,498 | $22,047 | $19,333 | $22,569 | $21,579 |
A Amount represents less than $.0005 per share.
B Total returns would have been lower if certain expenses had not been reduced during the applicable periods shown.
C Expense ratios reflect operating expenses of the class. Expenses before reductions do not reflect amounts reimbursed or waived or reductions from expense offset arrangements and do not represent the amount paid by the class during periods when reimbursements, waivers or reductions occur. Expenses net of fee waivers reflect expenses after reimbursement and waivers but prior to reductions from expense offset arrangements. Expenses net of all reductions represent the net expenses paid by the class.
See accompanying notes which are an integral part of the financial statements.
Financial Highlights — Government Portfolio Class II
| Years ended March 31, | 2017 | 2016 | 2015 | 2014 | 2013 |
| Selected Per–Share Data | |||||
| Net asset value, beginning of period | $1.00 | $1.00 | $1.00 | $1.00 | $1.00 |
| Income from Investment Operations | |||||
| Net investment income (loss) | .002 | –A | –A | –A | –A |
| Net realized and unrealized gain (loss)A | – | – | – | – | – |
| Total from investment operations | .002 | –A | –A | –A | –A |
| Distributions from net investment income | (.002) | –A | –A | –A | –A |
| Total distributions | (.002) | –A | –A | –A | –A |
| Net asset value, end of period | $1.00 | $1.00 | $1.00 | $1.00 | $1.00 |
| Total ReturnB | .16% | .02% | .01% | .01% | .01% |
| Ratios to Average Net AssetsC | |||||
| Expenses before reductions | .36% | .36% | .36% | .36% | .36% |
| Expenses net of fee waivers, if any | .33% | .20% | .11% | .11% | .18% |
| Expenses net of all reductions | .33% | .20% | .11% | .11% | .18% |
| Net investment income (loss) | .18% | .04% | .01% | .01% | .01% |
| Supplemental Data | |||||
| Net assets, end of period (in millions) | $909 | $485 | $539 | $356 | $642 |
A Amount represents less than $.0005 per share.
B Total returns would have been lower if certain expenses had not been reduced during the applicable periods shown.
C Expense ratios reflect operating expenses of the class. Expenses before reductions do not reflect amounts reimbursed or waived or reductions from expense offset arrangements and do not represent the amount paid by the class during periods when reimbursements, waivers or reductions occur. Expenses net of fee waivers reflect expenses after reimbursement and waivers but prior to reductions from expense offset arrangements. Expenses net of all reductions represent the net expenses paid by the class.
See accompanying notes which are an integral part of the financial statements.
Financial Highlights — Government Portfolio Class III
| Years ended March 31, | 2017 | 2016 | 2015 | 2014 | 2013 |
| Selected Per–Share Data | |||||
| Net asset value, beginning of period | $1.00 | $1.00 | $1.00 | $1.00 | $1.00 |
| Income from Investment Operations | |||||
| Net investment income (loss) | .001 | –A | –A | –A | –A |
| Net realized and unrealized gain (loss)A | – | – | – | – | – |
| Total from investment operations | .001 | –A | –A | –A | –A |
| Distributions from net investment income | (.001) | –A | –A | –A | –A |
| Total distributions | (.001) | –A | –A | –A | –A |
| Net asset value, end of period | $1.00 | $1.00 | $1.00 | $1.00 | $1.00 |
| Total ReturnB | .07% | .01% | .01% | .01% | .01% |
| Ratios to Average Net AssetsC | |||||
| Expenses before reductions | .46% | .46% | .46% | .46% | .46% |
| Expenses net of fee waivers, if any | .43% | .21% | .11% | .11% | .18% |
| Expenses net of all reductions | .43% | .21% | .11% | .11% | .18% |
| Net investment income (loss) | .09% | .03% | .01% | .01% | .01% |
| Supplemental Data | |||||
| Net assets, end of period (in millions) | $3,038 | $1,957 | $2,120 | $2,266 | $1,709 |
A Amount represents less than $.0005 per share.
B Total returns would have been lower if certain expenses had not been reduced during the applicable periods shown.
C Expense ratios reflect operating expenses of the class. Expenses before reductions do not reflect amounts reimbursed or waived or reductions from expense offset arrangements and do not represent the amount paid by the class during periods when reimbursements, waivers or reductions occur. Expenses net of fee waivers reflect expenses after reimbursement and waivers but prior to reductions from expense offset arrangements. Expenses net of all reductions represent the net expenses paid by the class.
See accompanying notes which are an integral part of the financial statements.
Financial Highlights — Government Portfolio Select Class
| Years ended March 31, | 2017 | 2016 | 2015 | 2014 | 2013 |
| Selected Per–Share Data | |||||
| Net asset value, beginning of period | $1.00 | $1.00 | $1.00 | $1.00 | $1.00 |
| Income from Investment Operations | |||||
| Net investment income (loss) | .003 | –A | –A | –A | –A |
| Net realized and unrealized gain (loss)A | – | – | – | – | – |
| Total from investment operations | .003 | –A | –A | –A | –A |
| Distributions from net investment income | (.003) | –A | –A | –A | –A |
| Total distributions | (.003) | –A | –A | –A | –A |
| Net asset value, end of period | $1.00 | $1.00 | $1.00 | $1.00 | $1.00 |
| Total ReturnB | .26% | .05% | .01% | .01% | .01% |
| Ratios to Average Net AssetsC | |||||
| Expenses before reductions | .26% | .26% | .26% | .26% | .26% |
| Expenses net of fee waivers, if any | .23% | .17% | .11% | .11% | .18% |
| Expenses net of all reductions | .23% | .17% | .11% | .11% | .18% |
| Net investment income (loss) | .28% | .07% | - %D | .01% | .01% |
| Supplemental Data | |||||
| Net assets, end of period (in millions) | $641 | $286 | $686 | $378 | $669 |
A Amount represents less than $.0005 per share.
B Total returns would have been lower if certain expenses had not been reduced during the applicable periods shown.
C Expense ratios reflect operating expenses of the class. Expenses before reductions do not reflect amounts reimbursed or waived or reductions from expense offset arrangements and do not represent the amount paid by the class during periods when reimbursements, waivers or reductions occur. Expenses net of fee waivers reflect expenses after reimbursement and waivers but prior to reductions from expense offset arrangements. Expenses net of all reductions represent the net expenses paid by the class.
D Amount represents less than .005%.
See accompanying notes which are an integral part of the financial statements.
Financial Highlights — Government Portfolio Institutional Class
| Years ended March 31, | 2017 | 2016 | 2015 A |
| Selected Per–Share Data | |||
| Net asset value, beginning of period | $1.00 | $1.00 | $1.00 |
| Income from Investment Operations | |||
| Net investment income (loss) | .004 | .001 | –B |
| Net realized and unrealized gain (loss)B | – | – | – |
| Total from investment operations | .004 | .001 | –B |
| Distributions from net investment income | (.004) | (.001) | –B |
| Total distributions | (.004) | (.001) | –B |
| Net asset value, end of period | $1.00 | $1.00 | $1.00 |
| Total ReturnC,D | .35% | .08% | .01% |
| Ratios to Average Net AssetsE | |||
| Expenses before reductions | .18% | .18% | .18%F |
| Expenses net of fee waivers, if any | .14% | .14% | .11%F |
| Expenses net of all reductions | .14% | .14% | .11%F |
| Net investment income (loss) | .37% | .10% | - %F,G |
| Supplemental Data | |||
| Net assets, end of period (in millions) | $58,310 | $19,281 | $1,508 |
A For the period May 14, 2014 (commencement of sale of shares) to March 31, 2015.
B Amount represents less than $.0005 per share.
C Total returns for periods of less than one year are not annualized.
D Total returns would have been lower if certain expenses had not been reduced during the applicable periods shown.
E Expense ratios reflect operating expenses of the class. Expenses before reductions do not reflect amounts reimbursed or waived or reductions from expense offset arrangements and do not represent the amount paid by the class during periods when reimbursements, waivers or reductions occur. Expense ratios before reductions for start-up periods may not be representative of longer-term operating periods. Expenses net of fee waivers reflect expenses after reimbursement and waivers but prior to reductions from expense offset arrangements. Expenses net of all reductions represent the net expenses paid by the class.
F Annualized
G Amount represents less than .005%.
See accompanying notes which are an integral part of the financial statements.
Money Market Portfolio
Investment Summary/Performance (Unaudited)
Effective Maturity Diversification
| Days | % of fund's investments 3/31/17 | % of fund's investments 9/30/16 | % of fund's investments 3/31/16 |
| 1 - 7 | 50.1 | 65.9 | 59.9 |
| 8 - 30 | 23.8 | 19.9 | 16.1 |
| 31 - 60 | 13.5 | 9.4 | 16.0 |
| 61 - 90 | 11.9 | 3.9 | 6.0 |
| 91 - 180 | 0.7 | 0.9 | 2.0 |
Effective maturity is determined in accordance with the requirements of Rule 2a-7 under the Investment Company Act of 1940.
Asset Allocation (% of fund's net assets)
| As of March 31, 2017 | ||
| Certificates of Deposit | 37.3% | |
| Commercial Paper | 31.2% | |
| U.S. Treasury Debt | 4.3% | |
| Non-Negotiable Time Deposit | 4.5% | |
| Other Instruments | 2.0% | |
| Repurchase Agreements | 20.2% | |
| Net Other Assets (Liabilities) | 0.5% | |
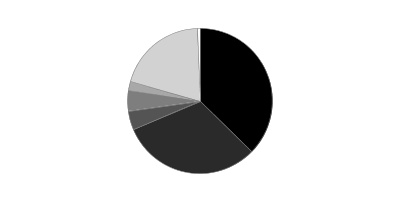
| As of September 30, 2016 | ||
| Certificates of Deposit | 28.1% | |
| Commercial Paper | 19.2% | |
| Variable Rate Demand Notes (VRDNs) | 7.5% | |
| U.S. Treasury Debt | 4.1% | |
| U.S. Government Agency Debt | 3.6% | |
| Non-Negotiable Time Deposit | 11.8% | |
| Other Instruments | 1.5% | |
| Repurchase Agreements | 29.6% | |
| Net Other Assets (Liabilities)* | (5.4)% | |
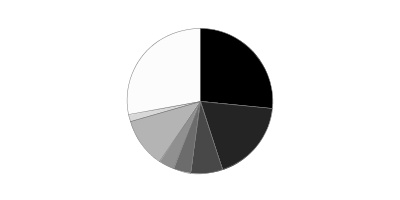
* Net Other Assets (Liabilities) are not included in the pie chart
Current And Historical 7-Day Yields
| 3/31/17 | 12/31/16 | 9/30/16 | 6/30/16 | 3/31/16 | |
| Class I | 1.02% | 0.86% | 0.55% | 0.42% | 0.35% |
| Class II | 0.87% | 0.71% | 0.40% | 0.27% | 0.20% |
| Class III | 0.77% | 0.61% | 0.30% | 0.17% | 0.10% |
| Select Class | 0.97% | 0.81% | 0.50% | 0.37% | 0.30% |
| Institutional Class | 1.06% | 0.90% | 0.59% | 0.46% | 0.39% |
Yield refers to the income paid by the Fund over a given period. Yields for money market funds are usually for seven-day periods, as they are here, though they are expressed as annual percentage rates. Past performance is no guarantee of future results. Yield will vary and it's possible to lose money investing in the Fund. A portion of the Fund's expenses was reimbursed and/or waived. Absent such reimbursements and/or waivers the yield for the period ending March 31, 2017, the most recent period shown in the table, would have been 1.00% for Class I, 0.85% for Class II, 0.75% for Class III, 0.95% for Select Class and 1.03% for Institutional Class.
Money Market Portfolio
Investments March 31, 2017
Showing Percentage of Net Assets
| Certificate of Deposit - 37.3% | ||||
| Yield(a) | Principal Amount (000s) | Value (000s) | ||
| Domestic Certificates Of Deposit - 2.1% | ||||
| Wells Fargo Bank NA | ||||
| 5/3/17 to 6/5/17 | 1.26 to 1.49 (b)% | $377,000 | $377,030 | |
| London Branch, Eurodollar, Foreign Banks - 4.3% | ||||
| Credit Industriel et Commercial | ||||
| 6/1/17 | 1.06 | 159,000 | 158,717 | |
| Mitsubishi UFJ Trust & Banking Corp. | ||||
| 5/2/17 | 1.15 | 83,000 | 83,000 | |
| Sumitomo Mitsui Trust Bank Ltd. London Branch | ||||
| 4/28/17 to 6/16/17 | 1.15 to 1.21 | 522,000 | 522,000 | |
| 763,717 | ||||
| New York Branch, Yankee Dollar, Foreign Banks - 30.9% | ||||
| Bank of Montreal Chicago | ||||
| 5/8/17 to 11/1/17 | 1.21 to 1.46 (b) | 579,000 | 579,000 | |
| Bank of Nova Scotia | ||||
| 4/6/17 to 7/12/17 | 1.35 to 1.47 (b) | 247,000 | 247,083 | |
| Bank of Tokyo-Mitsubishi UFJ Ltd. | ||||
| 6/21/17 to 6/27/17 | 1.14 | 175,000 | 175,000 | |
| Bayerische Landesbank | ||||
| 4/28/17 | 1.25 | 250,000 | 250,000 | |
| Canadian Imperial Bank of Commerce | ||||
| 12/18/17 | 1.24 (b) | 49,000 | 49,000 | |
| Deutsche Bank AG New York Branch | ||||
| 4/3/17 to 4/7/17 | 1.10 | 236,000 | 236,000 | |
| KBC Bank NV | ||||
| 4/27/17 to 5/30/17 | 1.02 to 1.07 | 647,000 | 647,000 | |
| Landesbank Baden- Wuerttemberg New York Branch | ||||
| 4/3/17 to 4/7/17 | 0.98 | 592,900 | 592,900 | |
| Mitsubishi UFJ Trust & Banking Corp. | ||||
| 7/3/17 | 1.20 | 130,000 | 130,000 | |
| Mitsubishi Ufj Trust&Bank New York Cd Be | ||||
| 4/5/17 | 1.28 (b) | 147,000 | 147,000 | |
| Mizuho Corporate Bank Ltd. | ||||
| 4/20/17 | 1.65 (b) | 99,000 | 99,018 | |
| Royal Bank of Canada | ||||
| 4/11/17 to 12/20/17 | 1.22 to 1.44 (b) | 520,000 | 520,000 | |
| Sumitomo Mitsui Banking Corp. | ||||
| 4/11/17 to 5/19/17 | 1.10 to 1.33 (b) | 616,000 | 616,000 | |
| Sumitomo Mitsui Trust Bank Ltd. | ||||
| 5/15/17 | 1.24 (b) | 150,000 | 150,000 | |
| Svenska Handels- banken AB | ||||
| 5/9/17 | 1.25 (b) | 120,000 | 120,000 | |
| Toronto-Dominion Bank | ||||
| 6/27/17 | 1.15 | 139,000 | 139,000 | |
| Toronto-Dominion Bank New York Branch | ||||
| 7/10/17 to 11/1/17 | 1.21 to 1.29 (b) | 636,000 | 636,000 | |
| UBS AG | ||||
| 6/20/17 | 1.05 | 160,000 | 160,000 | |
| 5,493,001 | ||||
| TOTAL CERTIFICATE OF DEPOSIT | ||||
| (Cost $6,633,748) | 6,633,748 | |||
| Financial Company Commercial Paper - 24.5% | ||||
| Bank of Nova Scotia | ||||
| 8/4/17 to 9/6/17 | 1.23 to 1.25 (b) | 293,000 | 293,000 | |
| Barclays Bank PLC/Barclays U.S. CCP Funding LLC | ||||
| 4/3/17 to 6/16/17 | 1.05 to 1.30 | 630,000 | 629,136 | |
| Bayerische Landesbank | ||||
| 4/3/17 to 4/7/17 | 0.99 | 632,600 | 632,524 | |
| BNP Paribas New York Branch | ||||
| 4/17/17 to 5/23/17 | 1.00 to 1.04 | 260,000 | 259,788 | |
| BPCE SA | ||||
| 4/4/17 to 6/1/17 | 1.10 to 1.11 | 325,000 | 324,657 | |
| Canadian Imperial Bank of Commerce | ||||
| 7/10/17 to 12/18/17 | 1.24 to 1.43 (b) | 551,000 | 551,000 | |
| Federation des caisses Desjardin | ||||
| 4/3/17 to 5/10/17 | 0.84 to 1.02 | 358,000 | 357,920 | |
| J.P. Morgan Securities, LLC | ||||
| 9/6/17 | 1.10 (b) | 187,000 | 187,000 | |
| Landesbank Baden- Wurttemberg | ||||
| 4/5/17 | 0.98 | 289,200 | 289,169 | |
| Mitsubishi UFJ Trust & Banking Corp. | ||||
| 4/27/17 to 5/17/17 | 1.04 to 1.10 | 210,000 | 209,757 | |
| Natexis Banques Populaires New York Branch | ||||
| 5/31/17 to 6/7/17 | 1.02 to 1.12 | 284,270 | 283,751 | |
| Ontario Teachers' Finance Trust | ||||
| 10/6/17 | 1.07 (b) | 81,000 | 81,000 | |
| Sumitomo Mitsui Banking Corp. | ||||
| 6/9/17 | 1.13 | 190,000 | 189,588 | |
| Toronto Dominion Holdings (U.S.A.) | ||||
| 4/12/17 | 1.10 | 75,000 | 74,975 | |
| TOTAL FINANCIAL COMPANY COMMERCIAL PAPER | ||||
| (Cost $4,363,265) | 4,363,265 | |||
| Asset Backed Commercial Paper - 4.3% | ||||
| Atlantic Asset Securitization Corp. (Credit Agricole CIB Guaranteed) | ||||
| 4/26/17 | 1.09 | 43,000 | 42,967 | |
| 4/6/17 | 0.93 | 26,000 | 25,997 | |
| 5/16/17 | 1.03 | 63,000 | 62,919 | |
| 5/3/17 | 1.10 | 32,000 | 31,969 | |
| 5/4/17 | 1.07 | 60,000 | 59,941 | |
| 6/1/17 | 1.15 | 55,000 | 54,893 | |
| 6/7/17 | 1.17 | 100,000 | 99,782 | |
| 6/8/17 | 1.17 | 77,000 | 76,830 | |
| Gotham Funding Corp. (Liquidity Facility Bank of Tokyo-Mitsubishi UFJ Ltd.) | ||||
| 5/9/17 | 1.06 | 124,000 | 123,861 | |
| Manhattan Asset Funding Co. LLC | ||||
| 6/7/17 | 1.01 (b) | 62,000 | 62,000 | |
| Manhattan Asset Funding Co. LLC (Liquidity Facility Sumitomo Mitsui Banking Corp.) | ||||
| 4/10/17 | 80,000 | 79,981 | ||
| 5/1/17 | 1.04 | 45,000 | 44,961 | |
| TOTAL ASSET BACKED COMMERCIAL PAPER | ||||
| (Cost $766,101) | 766,101 | |||
| Non-Financial Company Commercial Paper - 2.4% | ||||
| CVS Health Corp. | ||||
| 4/17/17 | 1.25 | 80,000 | 79,956 | |
| Dominion Resources, Inc. | ||||
| 4/10/17 to 5/1/17 | 1.05 to 1.25 | 126,000 | 125,893 | |
| Eversource Energy | ||||
| 4/3/17 | 1.10 | 27,000 | 26,998 | |
| NBCUniversal Enterprise, Inc. | ||||
| 4/7/17 | 1.05 | 49,000 | 48,991 | |
| Rogers Communications, Inc. | ||||
| 4/25/17 | 1.26 | 16,000 | 15,987 | |
| Sempra Global | ||||
| 4/3/17 to 5/17/17 | 1.00 to 1.34 | 62,000 | 61,945 | |
| UnitedHealth Group, Inc. | ||||
| 4/3/17 | 0.98 to 1.00 | 55,000 | 54,997 | |
| TOTAL NON-FINANCIAL COMPANY COMMERCIAL PAPER | ||||
| (Cost $414,767) | 414,767 | |||
| U.S. Treasury Debt - 4.3% | ||||
| U.S. Treasury Obligations - 4.3% | ||||
| U.S. Treasury Notes | ||||
| 10/31/17 to 10/31/18 | ||||
| (Cost $768,986) | 0.95 to 1.05 (b) | 769,000 | 768,986 | |
| Other Instrument - 2.0% | ||||
| Master Notes - 2.0% | ||||
| Toyota Motor Credit Corp. | ||||
| 4/7/17 | ||||
| (Cost $361,000) | 1.29 (b) | 361,000 | 361,000 | |
| Non-Negotiable Time Deposit - 4.5% | ||||
| Time Deposits - 4.5% | ||||
| Australia & New Zealand Banking Group Ltd. | ||||
| 4/3/17 | 0.83 | 266,000 | 266,000 | |
| Credit Agricole CIB | ||||
| 4/5/17 to 4/6/17 | 0.98 | 291,000 | 291,000 | |
| Credit Agricole Cib New York Br (TD) | ||||
| 4/3/17 | 0.82 | 238,649 | 238,649 | |
| TOTAL NON-NEGOTIABLE TIME DEPOSIT | ||||
| (Cost $795,649) | 795,649 | |||
| Interfund Loans - 0.0% | ||||
| With: | ||||
| Telecommunications Portfolio at 1.1% due 4/1/17(c) | ||||
| (Cost $3,813) | 3,813 | 3,813 |
| Other Repurchase Agreement - 20.2% | |||
| Maturity Amount (000s) | Value (000s) | ||
| Other Repurchase Agreement - 20.2% | |||
| With: | |||
| BNP Paribas at: | |||
| 1.06%, dated 3/31/17 due 4/3/17 (Collateralized by Corporate Obligations valued at $21,001,629, 0.00% - 9.25%, 11/01/18 - 4/08/68) | $20,002 | $20,000 | |
| 1.2%, dated 3/31/17 due 4/3/17 (Collateralized by Corporate Obligations valued at $21,592,465, 0.00% - 12.25%, 6/01/17 - 4/20/67) | 20,002 | 20,000 | |
| Citigroup Global Markets, Inc. at: | |||
| 1.11%, dated 3/31/17 due 4/3/17 (Collateralized by U.S. Treasury Obligations valued at $148,647,228, 2.50%, 8/15/23) | 144,013 | 144,000 | |
| 1.18%, dated 3/28/17 due 4/7/17 (Collateralized by Equity Securities valued at $154,470,382) | 143,066 | 143,000 | |
| 2.04%, dated 2/14/17 due 5/15/17 (Collateralized by Corporate Obligations valued at $147,279,514, 1.31% - 6.30%, 6/25/37 - 2/28/52) | 136,694 | 136,000 | |
| 2.07%, dated 2/21/17 due 5/30/17 (Collateralized by Corporate Obligations valued at $56,292,398, 1.28%, 4/05/52) | 52,293 | 52,000 | |
| Credit Suisse Securities (U.S.A.) LLC at 1.11%, dated 3/29/17 due 4/5/17 (Collateralized by Mortgage Loan Obligations valued at $47,155,051, 0.32% - 0.97%, 1/26/37 - 4/26/37) | 41,009 | 41,000 | |
| HSBC Securities, Inc. at 1.11%, dated 3/31/17 due 4/3/17 (Collateralized by Corporate Obligations valued at $65,102,459, 1.50% - 7.11%, 5/18/18 - 5/15/46) | 62,006 | 62,000 | |
| ING Financial Markets LLC at 1.19%, dated 3/31/17 due 4/3/17 (Collateralized by Corporate Obligations valued at $14,291,349, 6.88% - 14.00%, 2/01/21 - 6/01/23) | 13,001 | 13,000 | |
| J.P. Morgan Securities, LLC at: | |||
| 1.03%, dated 3/31/17 due 4/3/17 (Collateralized by Commercial Paper valued at $64,891,466, 5/12/17 - 1/17/18) | 63,005 | 63,000 | |
| 1.11%, dated 3/30/17 due 4/6/17 (Collateralized by U.S. Government Obligations valued at $212,186,564, 0.12% - 13.30%, 9/25/22 - 5/16/59) | 206,044 | 206,000 | |
| 1.31%, dated 3/31/17 due 4/7/17 (Collateralized by Mortgage Loan Obligations valued at $88,560,063, 0.00% - 40.90%, 6/25/35 - 8/25/37) (b)(d) | 82,093 | 82,000 | |
| Merrill Lynch, Pierce, Fenner & Smith at: | |||
| 1.11%, dated 3/29/17 due 4/5/17 (Collateralized by U.S. Government Obligations valued at $205,051,608, 3.00% - 4.00%, 3/01/37 - 1/01/47) | 201,043 | 201,000 | |
| 1.2%, dated 3/28/17 due 4/7/17 (Collateralized by U.S. Treasury Obligations valued at $141,808,391, 0.63% - 6.13%, 7/31/17 - 11/15/27) | 139,065 | 139,000 | |
| 2.03%, dated 3/1/17 due 5/30/17 (Collateralized by U.S. Treasury Obligations valued at $405,393,044, 0.00% - 10.63%, 5/15/17 - 6/01/67) | 390,974 | 389,000 | |
| Mitsubishi UFJ Securities (U.S.A.), Inc. at 1.22%, dated: | |||
| 3/21/17 due 4/4/17 (Collateralized by Corporate Obligations valued at $30,009,643, 0.00% - 5.88%, 7/15/17 - 11/15/46) | 28,013 | 28,000 | |
| 3/28/17 due 4/7/17 (Collateralized by Corporate Obligations valued at $44,071,111, 0.25% - 6.45%, 7/15/17 - 11/15/46) | 41,028 | 41,000 | |
| 3/30/17 due 4/6/17 (Collateralized by Corporate Obligations valued at $21,518,218, 1.00% - 5.88%, 12/01/20 - 3/15/36) | 20,005 | 20,000 | |
| Mizuho Securities U.S.A., Inc. at: | |||
| 1.09%, dated 3/31/17 due 4/3/17 (Collateralized by U.S. Government Obligations valued at $84,467,672, 0.43% - 6.62%, 10/20/32 - 11/20/66) | 82,007 | 82,000 | |
| 1.2%, dated: | |||
| 3/21/17 due 4/4/17 (Collateralized by Equity Securities valued at $45,379,748) | 42,020 | 42,000 | |
| 3/28/17 due 4/7/17 (Collateralized by Equity Securities valued at $110,182,056) | 102,048 | 102,000 | |
| 3/29/17 due 4/7/17 (Collateralized by Equity Securities valued at $131,781,966) | 122,057 | 122,000 | |
| 3/30/17 due 4/7/17 (Collateralized by Equity Securities valued at $45,366,048) | 42,020 | 42,000 | |
| 3/31/17 due: | |||
| 4/3/17 (Collateralized by Equity Securities valued at $90,729,075) | 84,008 | 84,000 | |
| 4/7/17(Collateralized by Equity Securities valued at $111,251,150) | 103,058 | 103,000 | |
| 1.25%, dated 3/30/17 due 4/7/17 (Collateralized by U.S. Government Obligations valued at $20,413,512, 0.00% - 4.00%, 4/03/17 - 2/01/47) | 20,010 | 20,000 | |
| 2.01%, dated 1/9/17 due 4/10/17 (Collateralized by Corporate Obligations valued at $44,487,673, 12.00%, 6/15/20) | 41,208 | 41,000 | |
| 2.02%, dated 1/17/17 due 4/17/17 (Collateralized by Corporate Obligations valued at $26,545,174, 2.56% - 8.38%, 4/01/21 - 3/15/57) | 25,126 | 25,000 | |
| 2.1%, dated 12/29/16 due 4/28/17 (Collateralized by Corporate Obligations valued at $43,369,540, 2.75% - 12.00%, 6/15/20 - 10/01/26) | 40,280 | 40,000 | |
| 2.2%, dated 3/29/17 due 6/27/17 (Collateralized by Corporate Obligations valued at $44,293,530, 12.00%, 6/15/20) | 41,226 | 41,000 | |
| RBC Capital Markets Co. at: | |||
| 0.99%, dated: | |||
| 2/16/17 due 4/7/17 (Collateralized by Commercial Paper valued at $55,690,360, 9/21/17) | 54,089 | 54,000 | |
| 2/28/17 due 4/7/17 (Collateralized by Municipal Bond Obligations valued at $70,649,607, 0.00% - 7.63%, 10/01/18 - 11/15/57) | 67,114 | 67,000 | |
| 1.13%, dated 1/26/17 due 4/7/17 (Collateralized by Corporate Obligations valued at $51,558,203, 1.71% - 5.00%, 2/05/18 - 8/15/46) | 49,138 | 49,000 | |
| 1.17%, dated 1/31/17 due 4/7/17 (Collateralized by Municipal Bond Obligations valued at $46,502,834, 4.00% - 5.00%, 8/01/27 - 11/15/40) | 44,129 | 44,000 | |
| 1.19%, dated 2/24/17 due 4/7/17 (Collateralized by Municipal Bond Obligations valued at $131,618,883, 4.00% - 5.00%, 8/01/27 - 12/01/44) | 125,372 | 125,000 | |
| SG Americas Securities, LLC at: | |||
| 1.26%, dated 3/31/17 due 4/3/17 (Collateralized by Corporate Obligations valued at $44,757,524, 0.53% - 9.75%, 4/01/17 - 8/01/47) | 42,004 | 42,000 | |
| 1.31%, dated: | |||
| 3/28/17 due 4/4/17 (Collateralized by Corporate Obligations valued at $58,966,230, 2.25% - 12.00%, 2/14/19 - 1/01/49) | 55,014 | 55,000 | |
| 3/29/17 due 4/5/17 (Collateralized by Corporate Obligations valued at $58,637,760, 0.00% - 12.00%, 4/10/17 - 4/01/77) | 55,014 | 55,000 | |
| 3/30/17 due 4/6/17 (Collateralized by Corporate Obligations valued at $59,350,719, 2.00% - 12.00%, 4/01/17 - 8/31/64) | 55,014 | 55,000 | |
| Wells Fargo Securities, LLC at: | |||
| 1.11%, dated: | |||
| 3/30/17 due 4/6/17 (Collateralized by Corporate Obligations valued at $65,108,852, 2.80% - 5.63%, 1/15/18 - 5/15/55) | 62,013 | 62,000 | |
| 3/31/17 due 4/3/17 (Collateralized by Equity Securities valued at $163,095,086) | 151,014 | 151,000 | |
| 1.16%, dated: | |||
| 3/30/17 due 4/6/17 (Collateralized by Corporate Obligations valued at $133,937,501, 4.20% - 14.00%, 12/01/17 - 10/23/55) | 124,028 | 124,000 | |
| 3/31/17 due 4/3/17 (Collateralized by Corporate Obligations valued at $133,932,947, 0.50% - 2.75%, 7/01/18 - 5/01/32) | 124,012 | 124,000 | |
| 1.65%, dated 2/2/17 due 5/3/17 (Collateralized by Corporate Obligations valued at $46,567,710, 0.25% - 5.00%, 7/15/17 - 1/31/24) | 43,177 | 43,000 | |
| TOTAL OTHER REPURCHASE AGREEMENT | |||
| (Cost $3,594,000) | 3,594,000 | ||
| TOTAL INVESTMENT PORTFOLIO - 99.5% | |||
| (Cost $17,701,329) | 17,701,329 | ||
| NET OTHER ASSETS (LIABILITIES) - 0.5% | 90,790 | ||
| NET ASSETS - 100% | $17,792,119 |
The date shown for securities represents the date when principal payments must be paid, taking into account any call options exercised by the issuer and any permissible maturity shortening features other than interest rate resets.
Legend
(a) Yield represents either the annualized yield at the date of purchase, or the stated coupon rate, or, for floating and adjustable rate securities, the rate at period end.
(b) Coupon rates for floating and adjustable rate securities reflect the rates in effect at period end.
(c) Loan is with an affiliated fund.
(d) The maturity amount is based on the rate at period end.
Investment Valuation
All investments are categorized as Level 2 under the Fair Value Hierarchy. The inputs or methodology used for valuing securities may not be an indication of the risk associated with investing in those securities. For more information on valuation inputs please refer to the Investment Valuation section in the accompanying Notes to Financial Statements.
See accompanying notes which are an integral part of the financial statements.
Money Market Portfolio
Financial Statements
Statement of Assets and Liabilities
| Amounts in thousands (except per-share amounts) | March 31, 2017 | |
| Assets | ||
| Investment in securities, at value (including repurchase agreements of $3,594,000) — See accompanying schedule: Unaffiliated issuers (cost $17,697,516) | $17,697,516 | |
| Other affiliated issuers (cost $3,813) | 3,813 | |
| Total Investments (cost $17,701,329) | $17,701,329 | |
| Cash | 15 | |
| Receivable for fund shares sold | 111,045 | |
| Interest receivable | 11,118 | |
| Prepaid expenses | 19 | |
| Receivable from investment adviser for expense reductions | 415 | |
| Other affiliated receivables | 1 | |
| Other receivables | 836 | |
| Total assets | 17,824,778 | |
| Liabilities | ||
| Payable for fund shares redeemed | $27,127 | |
| Distributions payable | 1,847 | |
| Accrued management fee | 2,000 | |
| Distribution and service plan fees payable | 21 | |
| Other affiliated payables | 715 | |
| Other payables and accrued expenses | 949 | |
| Total liabilities | 32,659 | |
| Net Assets | $17,792,119 | |
| Net Assets consist of: | ||
| Paid in capital | $17,792,119 | |
| Net Assets | $17,792,119 | |
| Class I: | ||
| Net Asset Value, offering price and redemption price per share ($7,630,752 ÷ 7,622,043 shares) | $1.00 | |
| Class II: | ||
| Net Asset Value, offering price and redemption price per share ($14,371 ÷ 14,355 shares) | $1.00 | |
| Class III: | ||
| Net Asset Value, offering price and redemption price per share ($91,397 ÷ 91,346 shares) | $1.00 | |
| Select Class: | ||
| Net Asset Value, offering price and redemption price per share ($12,158 ÷ 12,145 shares) | $1.00 | |
| Institutional Class: | ||
| Net Asset Value, offering price and redemption price per share ($10,043,441 ÷ 10,031,973 shares) | $1.00 |
See accompanying notes which are an integral part of the financial statements.
Statement of Operations
| Amounts in thousands | Year ended March 31, 2017 | |
| Investment Income | ||
| Interest (including $29 from affiliated interfund lending) | $161,667 | |
| Expenses | ||
| Management fee | $30,687 | |
| Transfer agent fees | 9,445 | |
| Distribution and service plan fees | 1,094 | |
| Accounting fees and expenses | 1,245 | |
| Custodian fees and expenses | 160 | |
| Independent trustees' fees and expenses | 110 | |
| Registration fees | 299 | |
| Audit | 51 | |
| Legal | 74 | |
| Miscellaneous | 262 | |
| Total expenses before reductions | 43,427 | |
| Expense reductions | (7,662) | 35,765 |
| Net investment income (loss) | 125,902 | |
| Realized and Unrealized Gain (Loss) | ||
| Net realized gain (loss) on: | ||
| Investment securities: | ||
| Unaffiliated issuers | 616 | |
| Total net realized gain (loss) | 616 | |
| Net increase in net assets resulting from operations | $126,518 |
See accompanying notes which are an integral part of the financial statements.
Statement of Changes in Net Assets
| Amounts in thousands | Year ended March 31, 2017 | Year ended March 31, 2016 |
| Increase (Decrease) in Net Assets | ||
| Operations | ||
| Net investment income (loss) | $125,902 | $123,642 |
| Net realized gain (loss) | 616 | 655 |
| Net increase in net assets resulting from operations | 126,518 | 124,297 |
| Distributions to shareholders from net investment income | (126,160) | (122,767) |
| Share transactions - net increase (decrease) | (27,715,458) | (17,083,145) |
| Total increase (decrease) in net assets | (27,715,100) | (17,081,615) |
| Net Assets | ||
| Beginning of period | 45,507,219 | 62,588,834 |
| End of period | $17,792,119 | $45,507,219 |
| Other Information | ||
| Undistributed net investment income end of period | $– | $280 |
See accompanying notes which are an integral part of the financial statements.
Financial Highlights — Money Market Portfolio Class I
| Years ended March 31, | 2017 | 2016 | 2015 | 2014 | 2013 |
| Selected Per–Share Data | |||||
| Net asset value, beginning of period | $1.00 | $1.00 | $1.00 | $1.00 | $1.00 |
| Income from Investment Operations | |||||
| Net investment income (loss) | .006 | .002 | .001 | .001 | .002 |
| Net realized and unrealized gain (loss)A | – | – | – | – | – |
| Total from investment operations | .006 | .002 | .001 | .001 | .002 |
| Distributions from net investment income | (.006) | (.002) | (.001) | (.001) | (.002) |
| Total distributions | (.006) | (.002) | (.001) | (.001) | (.002) |
| Net asset value, end of period | $1.00 | $1.00 | $1.00 | $1.00 | $1.00 |
| Total ReturnB | .63% | .18% | .06% | .06% | .16% |
| Ratios to Average Net AssetsC | |||||
| Expenses before reductions | .21% | .21% | .21% | .21% | .21% |
| Expenses net of fee waivers, if any | .18% | .18% | .18% | .18% | .18% |
| Expenses net of all reductions | .18% | .18% | .18% | .18% | .18% |
| Net investment income (loss) | .56% | .17% | .05% | .06% | .16% |
| Supplemental Data | |||||
| Net assets, end of period (in millions) | $7,631 | $19,911 | $21,651 | $22,712 | $24,416 |
A Amount represents less than $.0005 per share.
B Total returns would have been lower if certain expenses had not been reduced during the applicable periods shown.
C Expense ratios reflect operating expenses of the class. Expenses before reductions do not reflect amounts reimbursed or waived or reductions from expense offset arrangements and do not represent the amount paid by the class during periods when reimbursements, waivers or reductions occur. Expenses net of fee waivers reflect expenses after reimbursement and waivers but prior to reductions from expense offset arrangements. Expenses net of all reductions represent the net expenses paid by the class.
See accompanying notes which are an integral part of the financial statements.
Financial Highlights — Money Market Portfolio Class II
| Years ended March 31, | 2017 | 2016 | 2015 | 2014 | 2013 |
| Selected Per–Share Data | |||||
| Net asset value, beginning of period | $1.00 | $1.00 | $1.00 | $1.00 | $1.00 |
| Income from Investment Operations | |||||
| Net investment income (loss) | .005 | .001 | –A | –A | –A |
| Net realized and unrealized gain (loss)A | – | – | – | – | – |
| Total from investment operations | .005 | .001 | –A | –A | –A |
| Distributions from net investment income | (.005) | (.001) | –A | –A | –A |
| Total distributions | (.005) | (.001) | –A | –A | –A |
| Net asset value, end of period | $1.00 | $1.00 | $1.00 | $1.00 | $1.00 |
| Total ReturnB | .48% | .06% | .01% | .01% | .02% |
| Ratios to Average Net AssetsC | |||||
| Expenses before reductions | .36% | .36% | .36% | .36% | .36% |
| Expenses net of fee waivers, if any | .33% | .30% | .22% | .23% | .32% |
| Expenses net of all reductions | .33% | .30% | .22% | .23% | .32% |
| Net investment income (loss) | .41% | .06% | .01% | .01% | .02% |
| Supplemental Data | |||||
| Net assets, end of period (in millions) | $14 | $76 | $95 | $150 | $165 |
A Amount represents less than $.0005 per share.
B Total returns would have been lower if certain expenses had not been reduced during the applicable periods shown.
C Expense ratios reflect operating expenses of the class. Expenses before reductions do not reflect amounts reimbursed or waived or reductions from expense offset arrangements and do not represent the amount paid by the class during periods when reimbursements, waivers or reductions occur. Expenses net of fee waivers reflect expenses after reimbursement and waivers but prior to reductions from expense offset arrangements. Expenses net of all reductions represent the net expenses paid by the class.
See accompanying notes which are an integral part of the financial statements.
Financial Highlights — Money Market Portfolio Class III
| Years ended March 31, | 2017 | 2016 | 2015 | 2014 | 2013 |
| Selected Per–Share Data | |||||
| Net asset value, beginning of period | $1.00 | $1.00 | $1.00 | $1.00 | $1.00 |
| Income from Investment Operations | |||||
| Net investment income (loss) | .004 | –A | –A | –A | –A |
| Net realized and unrealized gain (loss)A | – | – | – | – | – |
| Total from investment operations | .004 | –A | –A | –A | –A |
| Distributions from net investment income | (.004) | –A | –A | –A | –A |
| Total distributions | (.004) | –A | –A | –A | –A |
| Net asset value, end of period | $1.00 | $1.00 | $1.00 | $1.00 | $1.00 |
| Total ReturnB | .38% | .03% | .01% | .01% | .01% |
| Ratios to Average Net AssetsC | |||||
| Expenses before reductions | .46% | .46% | .46% | .46% | .46% |
| Expenses net of fee waivers, if any | .43% | .32% | .23% | .23% | .33% |
| Expenses net of all reductions | .43% | .32% | .23% | .23% | .33% |
| Net investment income (loss) | .31% | .03% | .01% | .01% | .01% |
| Supplemental Data | |||||
| Net assets, end of period (in millions) | $91 | $1,129 | $1,454 | $1,834 | $2,086 |
A Amount represents less than $.0005 per share.
B Total returns would have been lower if certain expenses had not been reduced during the applicable periods shown.
C Expense ratios reflect operating expenses of the class. Expenses before reductions do not reflect amounts reimbursed or waived or reductions from expense offset arrangements and do not represent the amount paid by the class during periods when reimbursements, waivers or reductions occur. Expenses net of fee waivers reflect expenses after reimbursement and waivers but prior to reductions from expense offset arrangements. Expenses net of all reductions represent the net expenses paid by the class.
See accompanying notes which are an integral part of the financial statements.
Financial Highlights — Money Market Portfolio Select Class
| Years ended March 31, | 2017 | 2016 | 2015 | 2014 | 2013 |
| Selected Per–Share Data | |||||
| Net asset value, beginning of period | $1.00 | $1.00 | $1.00 | $1.00 | $1.00 |
| Income from Investment Operations | |||||
| Net investment income (loss) | .006 | .001 | –A | –A | .001 |
| Net realized and unrealized gain (loss)A | – | – | – | – | – |
| Total from investment operations | .006 | .001 | –A | –A | .001 |
| Distributions from net investment income | (.006) | (.001) | –A | –A | (.001) |
| Total distributions | (.006) | (.001) | –A | –A | (.001) |
| Net asset value, end of period | $1.00 | $1.00 | $1.00 | $1.00 | $1.00 |
| Total ReturnB | .58% | .13% | .02% | .02% | .11% |
| Ratios to Average Net AssetsC | |||||
| Expenses before reductions | .26% | .26% | .26% | .26% | .26% |
| Expenses net of fee waivers, if any | .23% | .23% | .22% | .22% | .23% |
| Expenses net of all reductions | .23% | .23% | .22% | .22% | .23% |
| Net investment income (loss) | .51% | .12% | .01% | .02% | .11% |
| Supplemental Data | |||||
| Net assets, end of period (in millions) | $12 | $224 | $407 | $331 | $389 |
A Amount represents less than $.0005 per share.
B Total returns would have been lower if certain expenses had not been reduced during the applicable periods shown.
C Expense ratios reflect operating expenses of the class. Expenses before reductions do not reflect amounts reimbursed or waived or reductions from expense offset arrangements and do not represent the amount paid by the class during periods when reimbursements, waivers or reductions occur. Expenses net of fee waivers reflect expenses after reimbursement and waivers but prior to reductions from expense offset arrangements. Expenses net of all reductions represent the net expenses paid by the class.
See accompanying notes which are an integral part of the financial statements.
Financial Highlights — Money Market Portfolio Institutional Class
| Years ended March 31, | 2017 | 2016 | 2015 | 2014 | 2013 |
| Selected Per–Share Data | |||||
| Net asset value, beginning of period | $1.00 | $1.00 | $1.00 | $1.00 | $1.00 |
| Income from Investment Operations | |||||
| Net investment income (loss) | .007 | .002 | .001 | .001 | .002 |
| Net realized and unrealized gain (loss)A | – | – | – | – | – |
| Total from investment operations | .007 | .002 | .001 | .001 | .002 |
| Distributions from net investment income | (.007) | (.002) | (.001) | (.001) | (.002) |
| Total distributions | (.007) | (.002) | (.001) | (.001) | (.002) |
| Net asset value, end of period | $1.00 | $1.00 | $1.00 | $1.00 | $1.00 |
| Total ReturnB | .67% | .22% | .10% | .10% | .20% |
| Ratios to Average Net AssetsC | |||||
| Expenses before reductions | .18% | .18% | .18% | .18% | .18% |
| Expenses net of fee waivers, if any | .14% | .14% | .14% | .14% | .14% |
| Expenses net of all reductions | .14% | .14% | .14% | .14% | .14% |
| Net investment income (loss) | .60% | .21% | .09% | .10% | .20% |
| Supplemental Data | |||||
| Net assets, end of period (in millions) | $10,043 | $21,863 | $36,919 | $40,143 | $37,824 |
A Amount represents less than $.0005 per share.
B Total returns would have been lower if certain expenses had not been reduced during the applicable periods shown.
C Expense ratios reflect operating expenses of the class. Expenses before reductions do not reflect amounts reimbursed or waived or reductions from expense offset arrangements and do not represent the amount paid by the class during periods when reimbursements, waivers or reductions occur. Expenses net of fee waivers reflect expenses after reimbursement and waivers but prior to reductions from expense offset arrangements. Expenses net of all reductions represent the net expenses paid by the class.
See accompanying notes which are an integral part of the financial statements.
Prime Money Market Portfolio
Investment Summary/Performance (Unaudited)
Effective Maturity Diversification
| Days | % of fund's investments 3/31/17 | % of fund's investments 9/30/16 | % of fund's investments 3/31/16 |
| 1 - 7 | 64.1 | 78.7 | 47.8 |
| 8 - 30 | 15.8 | 9.9 | 13.8 |
| 31 - 60 | 11.0 | 10.0 | 8.8 |
| 61 - 90 | 9.1 | 0.0 | 15.0 |
| 91 - 180 | 0.0 | 1.4 | 14.6 |
Effective maturity is determined in accordance with the requirements of Rule 2a-7 under the Investment Company Act of 1940.
Asset Allocation (% of fund's net assets)
| As of March 31, 2017 | ||
| Certificates of Deposit | 26.9% | |
| Commercial Paper | 19.5% | |
| Variable Rate Demand Notes (VRDNs) | 0.2% | |
| U.S. Treasury Debt | 6.4% | |
| Non-Negotiable Time Deposit | 19.0% | |
| Other Instruments | 2.2% | |
| Repurchase Agreements | 25.8% | |
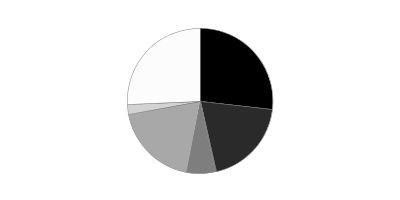
| As of September 30, 2016 | ||
| Certificates of Deposit | 16.8% | |
| Commercial Paper | 5.1% | |
| Variable Rate Demand Notes (VRDNs) | 0.4% | |
| U.S. Treasury Debt | 4.0% | |
| U.S. Government Agency Debt | 4.3% | |
| Non-Negotiable Time Deposit | 13.5% | |
| Other Instruments | 2.6% | |
| Repurchase Agreements | 53.3% | |

Current And Historical 7-Day Yields
| 3/31/17 | 12/31/16 | 9/30/16 | 6/30/16 | 3/31/16 | |
| Class I | 0.95% | 0.79% | 0.40% | 0.44% | 0.39% |
| Class II | 0.80% | 0.64% | 0.25% | 0.29% | 0.24% |
| Class III | 0.70% | 0.54% | 0.15% | 0.19% | 0.14% |
| Class IV | 0.46% | 0.23% | 0.01% | 0.01% | 0.01% |
| Select Class | 0.90% | 0.74% | 0.35% | 0.39% | 0.34% |
| Institutional Class | 0.99% | 0.83% | 0.44% | 0.48% | 0.43% |
Yield refers to the income paid by the Fund over a given period. Yields for money market funds are usually for seven-day periods, as they are here, though they are expressed as annual percentage rates. Past performance is no guarantee of future results. Yield will vary and it's possible to lose money investing in the Fund.
Percentages shown as 0.0% may reflect amounts less than 0.05%.
Prime Money Market Portfolio
Investments March 31, 2017
Showing Percentage of Net Assets
| Certificate of Deposit - 26.9% | ||||
| Yield(a) | Principal Amount (000s) | Value (000s) | ||
| Domestic Certificates Of Deposit - 1.8% | ||||
| Wells Fargo Bank NA | ||||
| 5/3/17 to 5/19/17 | 1.26 to 1.46 (b)% | $188,000 | $188,100 | |
| London Branch, Eurodollar, Foreign Banks - 4.8% | ||||
| Credit Industriel et Commercial | ||||
| 6/1/17 | 1.06 | 99,000 | 98,848 | |
| Mitsubishi UFJ Trust & Banking Corp. | ||||
| 5/2/17 | 1.15 | 50,000 | 50,006 | |
| Sumitomo Mitsui Trust Bank Ltd. London Branch | ||||
| 4/28/17 to 6/16/17 | 1.15 to 1.21 | 342,000 | 342,079 | |
| 490,933 | ||||
| New York Branch, Yankee Dollar, Foreign Banks - 20.3% | ||||
| Bank of Montreal Chicago | ||||
| 4/10/17 to 11/1/17 | 1.08 to 1.46 (b) | 294,000 | 294,084 | |
| Bank of Tokyo-Mitsubishi UFJ Ltd. | ||||
| 6/21/17 to 6/27/17 | 1.14 | 203,000 | 203,022 | |
| KBC Bank NV | ||||
| 4/27/17 to 5/30/17 | 1.02 to 1.07 | 408,000 | 408,024 | |
| Mitsubishi Ufj Trust&Bank New York Cd Be | ||||
| 4/5/17 | 1.28 (b) | 86,000 | 86,004 | |
| Royal Bank of Canada | ||||
| 5/8/17 to 10/24/17 | 1.25 to 1.44 (b) | 239,000 | 239,204 | |
| Sumitomo Mitsui Banking Corp. | ||||
| 4/11/17 to 5/19/17 | 1.10 to 1.33 (b) | 360,000 | 360,059 | |
| Sumitomo Mitsui Trust Bank Ltd. | ||||
| 4/4/17 to 5/15/17 | 0.91 to 1.24 (b) | 130,000 | 130,025 | |
| Svenska Handels- banken AB | ||||
| 5/9/17 | 1.25 (b) | 74,000 | 74,030 | |
| Toronto-Dominion Bank New York Branch | ||||
| 7/10/17 to 11/1/17 | 1.22 to 1.29 (b) | 190,000 | 190,193 | |
| UBS AG | ||||
| 6/20/17 | 1.05 | 100,000 | 100,007 | |
| 2,084,652 | ||||
| TOTAL CERTIFICATE OF DEPOSIT | ||||
| (Cost $2,762,824) | 2,763,685 | |||
| Financial Company Commercial Paper - 16.3% | ||||
| Bank of Nova Scotia | ||||
| 8/4/17 to 9/6/17 | 1.23 to 1.25 (b) | 160,000 | 160,155 | |
| BNP Paribas Fortis | ||||
| 4/3/17 to 5/17/17 | 0.81 to 1.00 | 44,060 | 44,027 | |
| BNP Paribas New York Branch | ||||
| 5/17/17 | 1.00 | 2,000 | 1,997 | |
| BPCE SA | ||||
| 4/4/17 to 6/1/17 | 1.10 to 1.12 | 250,000 | 249,816 | |
| Canadian Imperial Bank of Commerce | ||||
| 7/10/17 to 12/18/17 | 1.24 to 1.43 (b) | 277,000 | 277,169 | |
| Federation des caisses Desjardin | ||||
| 4/3/17 | 0.84 to 0.93 | 295,000 | 294,979 | |
| J.P. Morgan Securities, LLC | ||||
| 9/6/17 | 1.10 (b) | 121,000 | 121,029 | |
| Mitsubishi UFJ Trust & Banking Corp. | ||||
| 4/21/17 | 1.10 | 62,000 | 61,964 | |
| Natexis Banques Populaires New York Branch | ||||
| 4/3/17 to 6/7/17 | 0.90 to 1.12 | 258,000 | 257,886 | |
| Sumitomo Mitsui Banking Corp. | ||||
| 6/9/17 | 1.13 | 90,000 | 89,817 | |
| Toronto Dominion Holdings (U.S.A.) | ||||
| 4/12/17 to 6/23/17 | 1.10 to 1.12 | 115,000 | 114,807 | |
| TOTAL FINANCIAL COMPANY COMMERCIAL PAPER | ||||
| (Cost $1,673,252) | 1,673,646 | |||
| Asset Backed Commercial Paper - 2.9% | ||||
| Atlantic Asset Securitization Corp. (Credit Agricole CIB Guaranteed) | ||||
| 4/26/17 | 1.09 | 25,000 | 24,981 | |
| 4/3/17 | 0.81 | 28,200 | 28,198 | |
| 4/6/17 | 0.93 | 34,000 | 33,995 | |
| 5/16/17 | 1.03 | 37,000 | 36,948 | |
| 5/2/17 | 1.10 | 60,000 | 59,944 | |
| 5/3/17 | 1.10 | 19,000 | 18,982 | |
| 5/3/17 | 1.09 | 45,000 | 44,956 | |
| 6/9/17 | 1.17 | 50,000 | 49,887 | |
| (Cost $297,896) | 297,891 | |||
| Non-Financial Company Commercial Paper - 0.3% | ||||
| UnitedHealth Group, Inc. | ||||
| 4/3/17 | ||||
| (Cost $33,999) | 0.98 to 1.00 | 34,000 | 33,997 | |
| U.S. Treasury Debt - 6.4% | ||||
| U.S. Treasury Obligations - 6.4% | ||||
| U.S. Treasury Notes | ||||
| 10/31/17 to 10/31/18 | ||||
| (Cost $654,939) | 0.95 to 0.97 (b) | 655,000 | 655,981 | |
| Other Instrument - 2.2% | ||||
| Master Notes - 2.2% | ||||
| Toyota Motor Credit Corp. | ||||
| 4/7/17 | ||||
| (Cost $221,000) | 1.29 (b) | 221,000 | 221,000 | |
| Variable Rate Demand Note - 0.2% | ||||
| Florida - 0.2% | ||||
| Florida Timber Fin. III LLC Taxable 4/7/17, LOC Wells Fargo Bank NA, VRDN | ||||
| 4/7/17 | ||||
| (Cost $25,155) | 1.03 (b) | 25,155 | 25,155 | |
| Non-Negotiable Time Deposit - 19.0% | ||||
| Time Deposits - 19.0% | ||||
| Australia & New Zealand Banking Group Ltd. | ||||
| 4/5/17 | 0.90 | 563,000 | 563,002 | |
| Bank of Nova Scotia | ||||
| 4/3/17 | 0.82 | 393,000 | 393,000 | |
| BNP Paribas | ||||
| 4/4/17 to 4/5/17 | 0.91 | 210,000 | 210,000 | |
| Credit Agricole CIB | ||||
| 4/5/17 to 4/6/17 | 0.98 | 186,000 | 186,003 | |
| Credit Agricole Cib New York Br (TD) | ||||
| 4/3/17 | 0.82 | 367,000 | 367,000 | |
| Sumitomo Mitsui Banking Corp. (TD) | ||||
| 4/3/17 | 0.87 | 103,000 | 103,000 | |
| Svenska Handelsbanken AB | ||||
| 4/3/17 | 0.81 | 131,881 | 131,881 | |
| TOTAL NON-NEGOTIABLE TIME DEPOSIT | ||||
| (Cost $1,953,881) | 1,953,886 |
| Other Repurchase Agreement - 25.8% | |||
| Maturity Amount (000s) | Value (000s) | ||
| Other Repurchase Agreement - 25.8% | |||
| With: | |||
| BNP Paribas at: | |||
| 1.06%, dated 3/31/17 due 4/3/17 (Collateralized by Corporate Obligations valued at $13,651,170, 0.00% - 9.25%, 2/01/19 - 4/08/68) | $13,001 | $13,000 | |
| 1.2%, dated 3/31/17 due 4/3/17 (Collateralized by Corporate Obligations valued at $14,085,689, 3.75% - 12.25%, 6/01/17 - 1/15/44) | 13,001 | 13,000 | |
| Citigroup Global Markets, Inc. at: | |||
| 1.11%, dated 3/31/17 due 4/3/17 (Collateralized by Equity Securities valued at $97,209,003) | 90,008 | 90,000 | |
| 1.18%, dated 3/28/17 due 4/7/17 (Collateralized by Equity Securities valued at $98,299,415) | 91,042 | 91,000 | |
| 2.04%, dated 2/14/17 due 5/15/17 (Collateralized by Corporate Obligations valued at $188,431,143, 1.13% - 14.73%, 3/15/19 - 7/03/50) | 174,887 | 173,982 | |
| 2.07%, dated 2/21/17 due 5/30/17 (Collateralized by Corporate Obligations valued at $35,724,022, 1.28%, 4/05/52) | 33,186 | 32,997 | |
| Credit Suisse Securities (U.S.A.) LLC at 1.11%, dated 3/29/17 due 4/5/17 (Collateralized by Mortgage Loan Obligations valued at $31,055,799, 0.97% - 5.88%, 4/26/37 - 10/25/46) | 27,006 | 27,001 | |
| HSBC Securities, Inc. at 1.11%, dated 3/31/17 due 4/3/17 (Collateralized by Corporate Obligations valued at $40,950,488, 2.55% - 8.75%, 11/21/17 - 4/15/46) | 39,004 | 39,000 | |
| ING Financial Markets LLC at: | |||
| 1.11%, dated 3/31/17 due 4/3/17: | |||
| (Collateralized by Equity Securities valued at $119,891,150) | 111,010 | 111,000 | |
| (Collateralized by Equity Securities valued at $71,286,604) | 66,006 | 66,000 | |
| 1.19%, dated 3/31/17 due 4/3/17 (Collateralized by Corporate Obligations valued at $8,746,428, 8.13%, 6/01/23) | 8,001 | 8,000 | |
| J.P. Morgan Securities, LLC at: | |||
| 1.03%, dated 3/31/17 due 4/3/17 (Collateralized by U.S. Government Obligations valued at $223,946,142, 0.51% - 6.50%, 7/01/20 - 12/16/49) | 218,019 | 218,000 | |
| 1.11%, dated 3/30/17 due 4/6/17 (Collateralized by U.S. Government Obligations valued at $133,904,152, 0.56% - 4.50%, 7/15/37 - 9/16/57) | 130,028 | 129,999 | |
| 1.31%, dated 3/31/17 due 4/7/17 (Collateralized by Mortgage Loan Obligations valued at $55,437,923, 0.10% - 5.70%, 11/15/28 - 7/25/56)(b)(c) | 52,059 | 52,005 | |
| Merrill Lynch, Pierce, Fenner & Smith at: | |||
| 1.11%, dated 3/29/17 due 4/5/17 (Collateralized by U.S. Government Obligations valued at $133,640,601, 3.00%, 3/01/32 - 12/01/46) | 131,028 | 131,007 | |
| 1.2%, dated 3/28/17 due 4/7/17 (Collateralized by U.S. Treasury Obligations valued at $89,778,012, 0.75% - 0.88%, 6/15/17 - 12/31/17) | 88,041 | 88,000 | |
| 2.03%, dated 3/1/17 due 5/30/17 (Collateralized by U.S. Treasury Obligations valued at $198,690,214, 1.00% - 4.50%, 7/31/18 - 2/15/43) | 194,985 | 194,000 | |
| Mitsubishi UFJ Securities (U.S.A.), Inc. at 1.22%, dated: | |||
| 3/28/17 due 4/7/17 (Collateralized by Corporate Obligations valued at $28,059,056, 0.00% - 8.25%, 2/01/18 - 9/15/37) | 26,018 | 26,000 | |
| 3/30/17 due 4/6/17 (Collateralized by Corporate Obligations valued at $13,739,593, 1.00% - 5.88%, 9/08/17 - 11/26/43) | 13,003 | 13,000 | |
| Mizuho Securities U.S.A., Inc. at: | |||
| 1.09%, dated 3/31/17 due 4/3/17 (Collateralized by U.S. Treasury Obligations valued at $53,151,648, 0.88% - 3.13%, 2/28/18 - 8/15/46) | 52,005 | 52,000 | |
| 1.2%, dated: | |||
| 3/21/17 due 4/4/17 (Collateralized by Equity Securities valued at $27,011,717) | 25,012 | 25,000 | |
| 3/28/17 due 4/7/17 (Collateralized by Equity Securities valued at $68,918,538) | 64,030 | 64,000 | |
| 3/29/17 due 4/7/17 (Collateralized by Equity Securities valued at $83,149,270) | 79,037 | 79,000 | |
| 3/30/17 due 4/7/17 (Collateralized by Equity Securities valued at $28,083,859) | 26,012 | 26,000 | |
| 3/31/17 due: | |||
| 4/3/17 (Collateralized by Equity Securities valued at $57,245,768) | 53,005 | 53,000 | |
| 4/7/17(Collateralized by Equity Securities valued at $70,207,075) | 65,037 | 65,000 | |
| 1.25%, dated 3/30/17 due 4/7/17 (Collateralized by U.S. Treasury Obligations valued at $13,261,906, 1.75% - 2.88%, 3/31/18 - 12/31/20) | 13,006 | 13,000 | |
| 2.01%, dated 1/9/17 due 4/10/17 (Collateralized by Corporate Obligations valued at $29,648,631, 2.45% - 11.00%, 10/01/23 - 4/15/49) | 28,142 | 28,001 | |
| 2.02%, dated 1/17/17 due 4/17/17 (Collateralized by Corporate Obligations valued at $3,173,628, 2.10% - 6.00%, 1/02/19 - 10/15/22) | 3,015 | 3,000 | |
| 2.1%, dated 12/29/16 due 4/28/17 (Collateralized by Corporate Obligations valued at $28,563,253, 1.88% - 7.25%, 6/01/18 - 2/28/57) | 27,189 | 27,003 | |
| 2.2%, dated 3/29/17 due 6/27/17 (Collateralized by Corporate Obligations valued at $28,379,557, 1.88% - 6.50%, 12/27/20 - 4/15/49) | 27,149 | 27,004 | |
| RBC Capital Markets Co. at: | |||
| 0.99%, dated: | |||
| 2/16/17 due 4/7/17 (Collateralized by U.S. Government Obligations valued at $103,130,295, 0.00% - 6.38%, 4/03/17 - 4/25/47) | 100,165 | 100,013 | |
| 2/28/17 due 4/7/17 (Collateralized by Municipal Bond Obligations valued at $46,289,318, 0.00% - 7.63%, 5/01/19 - 12/01/54) | 44,075 | 44,000 | |
| 1.13%, dated 1/26/17 due 4/7/17 (Collateralized by Corporate Obligations valued at $30,514,704, 1.10% - 7.80%, 10/25/17 - 8/15/46) | 29,082 | 29,000 | |
| 1.17%, dated 1/31/17 due 4/7/17 (Collateralized by Municipal Bond Obligations valued at $27,563,942, 5.00%, 7/01/29 - 10/01/40) | 26,076 | 26,000 | |
| 1.19%, dated 2/24/17 due 4/7/17 (Collateralized by Municipal Bond Obligations valued at $83,194,058, 4.00% - 5.00%, 8/01/27 - 12/01/44) | 79,235 | 79,000 | |
| SG Americas Securities, LLC at 1.26%, dated 3/31/17 due 4/3/17 (Collateralized by Corporate Obligations valued at $27,697,268, 1.85% - 10.00%, 12/07/18 - 3/16/47) | 26,003 | 26,000 | |
| Wells Fargo Securities, LLC at: | |||
| 1.06%, dated 3/31/17 due 4/3/17 (Collateralized by Corporate Obligations valued at $11,551,041, 4.50% - 8.88%, 9/07/42 - 6/15/68) | 11,001 | 11,000 | |
| 1.11%, dated: | |||
| 3/30/17 due 4/6/17 (Collateralized by Corporate Obligations valued at $40,955,429, 3.20% - 6.10%, 11/15/17 - 2/06/47) | 39,008 | 38,999 | |
| 3/31/17 due 4/3/17 (Collateralized by Equity Securities valued at $145,813,489) | 135,012 | 135,000 | |
| 1.16%, dated: | |||
| 3/30/17 due 4/6/17 (Collateralized by Corporate Obligations valued at $84,251,356, 4.50% - 9.50%, 4/15/19 - 6/15/35) | 78,018 | 77,999 | |
| 3/31/17 due 4/3/17 (Collateralized by Corporate Obligations valued at $83,168,622, 1.25% - 8.25%, 7/01/17 - 12/15/66) | 77,007 | 77,000 | |
| 1.65%, dated 2/2/17 due 5/3/17 (Collateralized by Equity Securities valued at $25,991,280) | 24,099 | 23,999 | |
| TOTAL OTHER REPURCHASE AGREEMENT | |||
| (Cost $2,647,000) | 2,647,009 | ||
| TOTAL INVESTMENT PORTFOLIO - 100.0% | |||
| (Cost $10,269,946) | 10,272,250 | ||
| NET OTHER ASSETS (LIABILITIES) - 0.0% | 3,224 | ||
| NET ASSETS - 100% | $10,275,474 |
Security Type Abbreviations
VRDN – VARIABLE RATE DEMAND NOTE (A debt instrument that is payable upon demand, either daily, weekly or monthly)
The date shown for securities represents the date when principal payments must be paid, taking into account any call options exercised by the issuer and any permissible maturity shortening features other than interest rate resets.
Legend
(a) Yield represents either the annualized yield at the date of purchase, or the stated coupon rate, or, for floating and adjustable rate securities, the rate at period end.
(b) Coupon rates for floating and adjustable rate securities reflect the rates in effect at period end.
(c) The maturity amount is based on the rate at period end.
Investment Valuation
All investments are categorized as Level 2 under the Fair Value Hierarchy. The inputs or methodology used for valuing securities may not be an indication of the risk associated with investing in those securities. For more information on valuation inputs please refer to the Investment Valuation section in the accompanying Notes to Financial Statements.
See accompanying notes which are an integral part of the financial statements.
Prime Money Market Portfolio
Financial Statements
Statement of Assets and Liabilities
| Amounts in thousands (except per-share amounts) | March 31, 2017 | |
| Assets | ||
| Investment in securities, at value (including repurchase agreements of $2,647,009) — See accompanying schedule: Unaffiliated issuers (cost $10,269,946) | $10,272,250 | |
| Cash | 9 | |
| Interest receivable | 6,414 | |
| Prepaid expenses | 59 | |
| Receivable from investment adviser for expense reductions | 136 | |
| Other receivables | 404 | |
| Total assets | 10,279,272 | |
| Liabilities | ||
| Distributions payable | $1,713 | |
| Accrued management fee | 1,232 | |
| Transfer agent fee payable | 287 | |
| Distribution and service plan fees payable | 7 | |
| Other affiliated payables | 70 | |
| Other payables and accrued expenses | 489 | |
| Total liabilities | 3,798 | |
| Net Assets | $10,275,474 | |
| Net Assets consist of: | ||
| Paid in capital | $10,273,170 | |
| Net unrealized appreciation (depreciation) on investments | 2,304 | |
| Net Assets | $10,275,474 | |
| Class I: | ||
| Net Asset Value, offering price and redemption price per share ($865,975.241 ÷ 865,528.836 shares) | $1.0005 | |
| Class II: | ||
| Net Asset Value, offering price and redemption price per share ($27,767.019 ÷ 27,755.476 shares) | $1.0004 | |
| Class III: | ||
| Net Asset Value, offering price and redemption price per share ($8,206.333 ÷ 8,202.661 shares) | $1.0004 | |
| Class IV: | ||
| Net Asset Value, offering price and redemption price per share ($20.042 ÷ 20.018 shares) | $1.0012 | |
| Select Class: | ||
| Net Asset Value, offering price and redemption price per share ($27,562.651 ÷ 27,546.958 shares) | $1.0006 | |
| Institutional Class: | ||
| Net Asset Value, offering price and redemption price per share ($9,345,942.589 ÷ 9,342,077.289 shares) | $1.0004 |
See accompanying notes which are an integral part of the financial statements.
Statement of Operations
| Amounts in thousands | Year ended March 31, 2017 | |
| Investment Income | ||
| Interest | $211,660 | |
| Expenses | ||
| Management fee | $46,895 | |
| Transfer agent fees | 11,873 | |
| Distribution and service plan fees | 1,799 | |
| Accounting fees and expenses | 1,417 | |
| Custodian fees and expenses | 423 | |
| Independent trustees' fees and expenses | 167 | |
| Registration fees | 216 | |
| Audit | 24 | |
| Legal | 123 | |
| Miscellaneous | 283 | |
| Total expenses before reductions | 63,220 | |
| Expense reductions | (11,825) | 51,395 |
| Net investment income (loss) | 160,265 | |
| Realized and Unrealized Gain (Loss) | ||
| Net realized gain (loss) on: | ||
| Investment securities: | ||
| Unaffiliated issuers | 825 | |
| Total net realized gain (loss) | 825 | |
| Change in net unrealized appreciation (depreciation) on investment securities | 2,304 | |
| Net increase in net assets resulting from operations | $163,394 |
See accompanying notes which are an integral part of the financial statements.
Statement of Changes in Net Assets
| Amounts in thousands | Year ended March 31, 2017 | Year ended March 31, 2016 |
| Increase (Decrease) in Net Assets | ||
| Operations | ||
| Net investment income (loss) | $160,265 | $102,537 |
| Net realized gain (loss) | 825 | 894 |
| Change in net unrealized appreciation (depreciation) | 2,304 | – |
| Net increase in net assets resulting from operations | 163,394 | 103,431 |
| Distributions to shareholders from net investment income | (160,593) | (101,456) |
| Distributions to shareholders from net realized gain | (10,360) | – |
| Total distributions | (170,953) | (101,456) |
| Share transactions - net increase (decrease) | (47,936,337) | 16,711,766 |
| Total increase (decrease) in net assets | (47,943,896) | 16,713,741 |
| Net Assets | ||
| Beginning of period | 58,219,370 | 41,505,629 |
| End of period | $10,275,474 | $58,219,370 |
| Other Information | ||
| Undistributed net investment income end of period | $– | $336 |
See accompanying notes which are an integral part of the financial statements.
Financial Highlights — Prime Money Market Portfolio Class I
| Years ended March 31, | 2017 A | 2016 | 2015 | 2014 | 2013 |
| Selected Per–Share Data | |||||
| Net asset value, beginning of period | $1.0000 | $1.00 | $1.00 | $1.00 | $1.00 |
| Income from Investment Operations | |||||
| Net investment income (loss) | .0056 | .002 | –B | –B | .001 |
| Net realized and unrealized gain (loss) | .0007 | –B | –B | –B | –B |
| Total from investment operations | .0063 | .002 | –B | –B | .001 |
| Distributions from net investment income | (.0056) | (.002) | –B | –B | (.001) |
| Distributions from net realized gain | (.0002) | – | – | – | – |
| Total distributions | (.0058) | (.002) | –B | –B | (.001) |
| Net asset value, end of period | $1.0005 | $1.00 | $1.00 | $1.00 | $1.00 |
| Total ReturnC | .64% | .17% | .01% | .02% | .09% |
| Ratios to Average Net AssetsD | |||||
| Expenses before reductions | .21% | .21% | .21% | .21% | .21% |
| Expenses net of fee waivers, if any | .18% | .18% | .19% | .19% | .20% |
| Expenses net of all reductions | .18% | .18% | .19% | .19% | .20% |
| Net investment income (loss) | .45% | .18% | .01% | .02% | .09% |
| Supplemental Data | |||||
| Net assets, end of period (in millions) | $866 | $9,638 | $6,236 | $7,816 | $10,332 |
A Beginning October 3, 2016 the Fund began selling and redeeming class shares based upon the market-based value of the securities held rounded to the fourth decimal place; a "floating"net asset value.
B Amount represents less than $.0005 per share.
C Total returns would have been lower if certain expenses had not been reduced during the applicable periods shown.
D Expense ratios reflect operating expenses of the class. Expenses before reductions do not reflect amounts reimbursed or waived or reductions from expense offset arrangements and do not represent the amount paid by the class during periods when reimbursements, waivers or reductions occur. Expenses net of fee waivers reflect expenses after reimbursement and waivers but prior to reductions from expense offset arrangements. Expenses net of all reductions represent the net expenses paid by the class.
See accompanying notes which are an integral part of the financial statements.
Financial Highlights — Prime Money Market Portfolio Class II
| Years ended March 31, | 2017 A | 2016 | 2015 | 2014 | 2013 |
| Selected Per–Share Data | |||||
| Net asset value, beginning of period | $1.0000 | $1.00 | $1.00 | $1.00 | $1.00 |
| Income from Investment Operations | |||||
| Net investment income (loss) | .0041 | .001 | –B | –B | –B |
| Net realized and unrealized gain (loss) | .0008 | –B | –B | –B | –B |
| Total from investment operations | .0049 | .001 | –B | –B | –B |
| Distributions from net investment income | (.0041) | (.001) | –B | –B | –B |
| Distributions from net realized gain | (.0004) | – | – | – | – |
| Total distributions | (.0045) | (.001) | –B | –B | –B |
| Net asset value, end of period | $1.0004 | $1.00 | $1.00 | $1.00 | $1.00 |
| Total ReturnC | .49% | .06% | .01% | .01% | .01% |
| Ratios to Average Net AssetsD | |||||
| Expenses before reductions | .36% | .36% | .36% | .36% | .36% |
| Expenses net of fee waivers, if any | .33% | .28% | .20% | .19% | .28% |
| Expenses net of all reductions | .33% | .28% | .20% | .19% | .28% |
| Net investment income (loss) | .30% | .09% | .01% | .01% | .01% |
| Supplemental Data | |||||
| Net assets, end of period (in millions) | $28 | $245 | $454 | $419 | $487 |
A Beginning October 3, 2016 the Fund began selling and redeeming class shares based upon the market-based value of the securities held rounded to the fourth decimal place; a "floating"net asset value.
B Amount represents less than $.0005 per share.
C Total returns would have been lower if certain expenses had not been reduced during the applicable periods shown.
D Expense ratios reflect operating expenses of the class. Expenses before reductions do not reflect amounts reimbursed or waived or reductions from expense offset arrangements and do not represent the amount paid by the class during periods when reimbursements, waivers or reductions occur. Expenses net of fee waivers reflect expenses after reimbursement and waivers but prior to reductions from expense offset arrangements. Expenses net of all reductions represent the net expenses paid by the class.
See accompanying notes which are an integral part of the financial statements.
Financial Highlights — Prime Money Market Portfolio Class III
| Years ended March 31, | 2017 A | 2016 | 2015 | 2014 | 2013 |
| Selected Per–Share Data | |||||
| Net asset value, beginning of period | $1.0000 | $1.00 | $1.00 | $1.00 | $1.00 |
| Income from Investment Operations | |||||
| Net investment income (loss) | .0031 | –B | –B | –B | –B |
| Net realized and unrealized gain (loss) | .0006 | –B | –B | –B | –B |
| Total from investment operations | .0037 | –B | –B | –B | –B |
| Distributions from net investment income | (.0031) | –B | –B | –B | –B |
| Distributions from net realized gain | (.0002) | – | – | – | – |
| Total distributions | (.0033) | –B | –B | –B | –B |
| Net asset value, end of period | $1.0004 | $1.00 | $1.00 | $1.00 | $1.00 |
| Total ReturnC | .37% | .04% | .01% | .01% | .01% |
| Ratios to Average Net AssetsD | |||||
| Expenses before reductions | .45% | .46% | .46% | .46% | .46% |
| Expenses net of fee waivers, if any | .43% | .31% | .20% | .19% | .28% |
| Expenses net of all reductions | .43% | .31% | .20% | .19% | .28% |
| Net investment income (loss) | .20% | .06% | .01% | .01% | .01% |
| Supplemental Data | |||||
| Net assets, end of period (in millions) | $8 | $894 | $1,011 | $1,967 | $1,790 |
A Beginning October 3, 2016 the Fund began selling and redeeming class shares based upon the market-based value of the securities held rounded to the fourth decimal place; a "floating"net asset value.
B Amount represents less than $.0005 per share.
C Total returns would have been lower if certain expenses had not been reduced during the applicable periods shown.
D Expense ratios reflect operating expenses of the class. Expenses before reductions do not reflect amounts reimbursed or waived or reductions from expense offset arrangements and do not represent the amount paid by the class during periods when reimbursements, waivers or reductions occur. Expenses net of fee waivers reflect expenses after reimbursement and waivers but prior to reductions from expense offset arrangements. Expenses net of all reductions represent the net expenses paid by the class.
See accompanying notes which are an integral part of the financial statements.
Financial Highlights — Prime Money Market Portfolio Class IV
| Years ended March 31, | 2017 A | 2016 | 2015 | 2014 | 2013 |
| Selected Per–Share Data | |||||
| Net asset value, beginning of period | $1.0000 | $1.00 | $1.00 | $1.00 | $1.00 |
| Income from Investment Operations | |||||
| Net investment income (loss) | .0009 | –B | –B | –B | –B |
| Net realized and unrealized gain (loss) | .0012 | –B | –B | –B | –B |
| Total from investment operations | .0021 | –B | –B | –B | –B |
| Distributions from net investment income | (.0009) | –B | –B | –B | –B |
| Total distributions | (.0009) | –B | –B | –B | –B |
| Net asset value, end of period | $1.0012 | $1.00 | $1.00 | $1.00 | $1.00 |
| Total ReturnC | .21% | .01% | .01% | .01% | .01% |
| Ratios to Average Net AssetsD | |||||
| Expenses before reductions | .70% | .71% | .71% | .71% | .71% |
| Expenses net of fee waivers, if any | .58% | .33% | .20% | .18% | .29% |
| Expenses net of all reductions | .58% | .33% | .20% | .18% | .29% |
| Net investment income (loss) | .05% | .03% | .01% | .02% | - %E |
| Supplemental Data | |||||
| Net assets, end of period (in millions) | $– | $184 | $207 | $100 | $37 |
A Beginning October 3, 2016 the Fund began selling and redeeming class shares based upon the market-based value of the securities held rounded to the fourth decimal place; a "floating"net asset value.
B Amount represents less than $.0005 per share.
C Total returns would have been lower if certain expenses had not been reduced during the applicable periods shown.
D Expense ratios reflect operating expenses of the class. Expenses before reductions do not reflect amounts reimbursed or waived or reductions from expense offset arrangements and do not represent the amount paid by the class during periods when reimbursements, waivers or reductions occur. Expenses net of fee waivers reflect expenses after reimbursement and waivers but prior to reductions from expense offset arrangements. Expenses net of all reductions represent the net expenses paid by the class.
E Amount represents less than .005%.
See accompanying notes which are an integral part of the financial statements.
Financial Highlights — Prime Money Market Portfolio Select Class
| Years ended March 31, | 2017 A | 2016 | 2015 | 2014 | 2013 |
| Selected Per–Share Data | |||||
| Net asset value, beginning of period | $1.0000 | $1.00 | $1.00 | $1.00 | $1.00 |
| Income from Investment Operations | |||||
| Net investment income (loss) | .0051 | .001 | –B | –B | –B |
| Net realized and unrealized gain (loss) | .0007 | –B | –B | –B | –B |
| Total from investment operations | .0058 | .001 | –B | –B | –B |
| Distributions from net investment income | (.0051) | (.001) | –B | –B | –B |
| Distributions from net realized gain | –B | – | – | – | – |
| Total distributions | (.0052)C | (.001) | –B | –B | –B |
| Net asset value, end of period | $1.0006 | $1.00 | $1.00 | $1.00 | $1.00 |
| Total ReturnD | .58% | .12% | .01% | .01% | .05% |
| Ratios to Average Net AssetsE | |||||
| Expenses before reductions | .26% | .26% | .26% | .26% | .26% |
| Expenses net of fee waivers, if any | .23% | .23% | .20% | .19% | .25% |
| Expenses net of all reductions | .23% | .23% | .20% | .19% | .25% |
| Net investment income (loss) | .40% | .13% | .01% | .01% | .05% |
| Supplemental Data | �� | ||||
| Net assets, end of period (in millions) | $28 | $771 | $1,068 | $1,173 | $1,724 |
A Beginning October 3, 2016 the Fund began selling and redeeming class shares based upon the market-based value of the securities held rounded to the fourth decimal place; a "floating"net asset value.
B Amount represents less than $.0005 per share.
C Total distributions of $.0052 per share is comprised of distributions from net investment income of $.00514 and distributions from net realized gain of $.00002 per share.
D Total returns would have been lower if certain expenses had not been reduced during the applicable periods shown.
E Expense ratios reflect operating expenses of the class. Expenses before reductions do not reflect amounts reimbursed or waived or reductions from expense offset arrangements and do not represent the amount paid by the class during periods when reimbursements, waivers or reductions occur. Expenses net of fee waivers reflect expenses after reimbursement and waivers but prior to reductions from expense offset arrangements. Expenses net of all reductions represent the net expenses paid by the class.
See accompanying notes which are an integral part of the financial statements.
Financial Highlights — Prime Money Market Portfolio Institutional Class
| Years ended March 31, | 2017 A | 2016 | 2015 | 2014 | 2013 |
| Selected Per–Share Data | |||||
| Net asset value, beginning of period | $1.0000 | $1.00 | $1.00 | $1.00 | $1.00 |
| Income from Investment Operations | |||||
| Net investment income (loss) | .0060 | .002 | .001 | .001 | .002 |
| Net realized and unrealized gain (loss) | .0006 | –B | –B | –B | –B |
| Total from investment operations | .0066 | .002 | .001 | .001 | .002 |
| Distributions from net investment income | (.0060) | (.002) | (.001) | (.001) | (.002) |
| Distributions from net realized gain | (.0002) | – | – | – | – |
| Total distributions | (.0062) | (.002) | (.001) | (.001) | (.002) |
| Net asset value, end of period | $1.0004 | $1.00 | $1.00 | $1.00 | $1.00 |
| Total ReturnC | .66% | .21% | .07% | .06% | .15% |
| Ratios to Average Net AssetsD | |||||
| Expenses before reductions | .18% | .18% | .18% | .18% | .18% |
| Expenses net of fee waivers, if any | .14% | .14% | .14% | .14% | .14% |
| Expenses net of all reductions | .14% | .14% | .14% | .14% | .14% |
| Net investment income (loss) | .49% | .22% | .07% | .06% | .15% |
| Supplemental Data | |||||
| Net assets, end of period (in millions) | $9,346 | $46,487 | $32,529 | $26,896 | $30,681 |
A Beginning October 3, 2016 the Fund began selling and redeeming class shares based upon the market-based value of the securities held rounded to the fourth decimal place; a "floating"net asset value.
B Amount represents less than $.0005 per share.
C Total returns would have been lower if certain expenses had not been reduced during the applicable periods shown.
D Expense ratios reflect operating expenses of the class. Expenses before reductions do not reflect amounts reimbursed or waived or reductions from expense offset arrangements and do not represent the amount paid by the class during periods when reimbursements, waivers or reductions occur. Expenses net of fee waivers reflect expenses after reimbursement and waivers but prior to reductions from expense offset arrangements. Expenses net of all reductions represent the net expenses paid by the class.
See accompanying notes which are an integral part of the financial statements.
Prime Reserves Portfolio
Investment Summary/Performance (Unaudited)
Effective Maturity Diversification
| Days | % of fund's investments 3/31/17 | % of fund's investments 9/30/16 |
| 1 - 7 | 60.8 | 79.2 |
| 8 - 30 | 15.7 | 7.1 |
| 31 - 60 | 11.7 | 6.5 |
| 61 - 90 | 11.1 | 7.2 |
| 91 - 180 | 0.7 | 0.0 |
Effective maturity is determined in accordance with the requirements of Rule 2a-7 under the Investment Company Act of 1940.
Asset Allocation (% of fund's net assets)
| As of March 31, 2017 | ||
| Certificates of Deposit | 26.0% | |
| Commercial Paper | 34.2% | |
| Non-Negotiable Time Deposit | 8.5% | |
| Other Instruments | 1.9% | |
| Other Municipal Security | 0.4% | |
| Repurchase Agreements | 23.0% | |
| Net Other Assets (Liabilities) | 6.0% | |
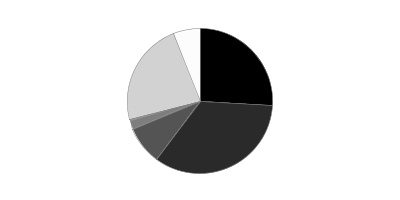
| As of September 30, 2016 | ||
| Certificates of Deposit | 14.0% | |
| Commercial Paper | 39.4% | |
| Variable Rate Demand Notes (VRDNs) | 7.9% | |
| Non-Negotiable Time Deposit | 3.3% | |
| Repurchase Agreements | 31.1% | |
| Net Other Assets (Liabilities) | 4.3% | |
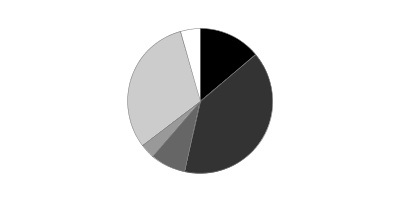
Current And Historical 7-Day Yields
| 3/31/17 | 12/31/16 | 9/30/16 | 6/30/16 | |
| Class I | 0.96% | 0.75% | 0.44% | 0.33% |
| Class II | 0.81% | 0.60% | 0.29% | 0.18% |
| Class III | 0.71% | 0.50% | 0.19% | 0.08% |
| Select Class | 0.91% | 0.70% | 0.39% | 0.28% |
| Institutional Class | 1.00% | 0.79% | 0.48% | 0.37% |
Yield refers to the income paid by the Fund over a given period. Yields for money market funds are usually for seven-day periods, as they are here, though they are expressed as annual percentage rates. Past performance is no guarantee of future results. Yield will vary and it's possible to lose money investing in the Fund. A portion of the Fund's expenses was reimbursed and/or waived. Absent such reimbursements and/or waivers the yield for the period ending March 31, 2017, the most recent period shown in the table, would have been 0.93% for Class I, 0.78% for Class II, 0.68% for Class III, 0.88% for Select Class and 0.96% for Institutional Class.
Percentages shown as 0.0% may reflect amounts less than 0.05%.
Prime Reserves Portfolio
Investments March 31, 2017
Showing Percentage of Net Assets
| Certificate of Deposit - 26.0% | ||||
| Yield(a) | Principal Amount (000s) | Value (000s) | ||
| Domestic Certificates Of Deposit - 1.4% | ||||
| Wells Fargo Bank NA | ||||
| 5/3/17 to 8/9/17 | 1.26 to 1.42 (b)% | $20,000 | $20,016 | |
| London Branch, Eurodollar, Foreign Banks - 3.7% | ||||
| Credit Industriel et Commercial | ||||
| 6/1/17 | 1.06 | 11,000 | 10,983 | |
| Mitsubishi UFJ Trust & Banking Corp. | ||||
| 4/26/17 to 5/2/17 | 1.14 to 1.15 | 15,000 | 15,002 | |
| Sumitomo Mitsui Trust Bank Ltd. London Branch | ||||
| 4/28/17 to 6/16/17 | 1.15 to 1.21 | 30,000 | 30,007 | |
| 55,992 | ||||
| New York Branch, Yankee Dollar, Foreign Banks - 20.9% | ||||
| Bank of Montreal Chicago | ||||
| 4/10/17 to 11/1/17 | 1.08 to 1.29 (b) | 37,000 | 37,008 | |
| Bank of Tokyo-Mitsubishi UFJ Ltd. | ||||
| 6/21/17 | 1.14 | 10,000 | 10,001 | |
| Bayerische Landesbank | ||||
| 4/28/17 | 1.25 | 13,000 | 13,002 | |
| Canadian Imperial Bank of Commerce | ||||
| 7/10/17 | 1.25 (b) | 10,000 | 10,007 | |
| Deutsche Bank AG New York Branch | ||||
| 4/3/17 to 4/7/17 | 1.10 | 20,000 | 20,000 | |
| KBC Bank NV | ||||
| 5/2/17 to 5/30/17 | 1.02 to 1.07 | 29,000 | 29,002 | |
| Landesbank Baden- Wuerttemberg New York Branch | ||||
| 4/3/17 to 4/7/17 | 0.98 | 41,300 | 41,300 | |
| Mitsubishi UFJ Trust & Banking Corp. | ||||
| 4/13/17 to 7/3/17 | 1.10 to 1.20 | 20,000 | 20,001 | |
| Mizuho Corporate Bank Ltd. | ||||
| 6/5/17 | 1.10 | 15,000 | 15,004 | |
| Royal Bank of Canada | ||||
| 4/11/17 to 8/4/17 | 1.22 to 1.27 (b) | 20,000 | 20,010 | |
| Sumitomo Mitsui Banking Corp. | ||||
| 4/11/17 to 5/19/17 | 1.10 to 1.33 (b) | 20,000 | 20,003 | |
| Sumitomo Mitsui Trust Bank Ltd. | ||||
| 4/4/17 | 0.91 | 30,000 | 30,000 | |
| Svenska Handels- banken AB | ||||
| 5/9/17 | 1.25 (b) | 5,000 | 5,002 | |
| Toronto-Dominion Bank | ||||
| 6/27/17 | 1.15 | 15,000 | 15,001 | |
| Toronto-Dominion Bank New York Branch | ||||
| 7/10/17 to 11/1/17 | 1.22 to 1.29 (b) | 20,000 | 20,020 | |
| UBS AG | ||||
| 6/20/17 | 1.05 | 10,000 | 10,001 | |
| 315,362 | ||||
| TOTAL CERTIFICATE OF DEPOSIT | ||||
| (Cost $391,280) | 391,370 | |||
| Financial Company Commercial Paper - 24.5% | ||||
| Bank of Nova Scotia | ||||
| 7/14/17 to 9/6/17 | 1.23 to 1.32 (b) | 20,000 | 20,018 | |
| Barclays Bank PLC/Barclays U.S. CCP Funding LLC | ||||
| 4/3/17 to 6/22/17 | 1.05 to 1.30 | 54,000 | 53,898 | |
| Bayerische Landesbank | ||||
| 4/3/17 to 4/7/17 | 0.99 | 57,800 | 57,790 | |
| BPCE SA | ||||
| 4/4/17 to 6/1/17 | 1.10 to 1.11 | 25,000 | 24,974 | |
| Canadian Imperial Bank of Commerce | ||||
| 7/10/17 to 10/13/17 | 1.26 to 1.43 (b) | 15,000 | 15,015 | |
| Federation des caisses Desjardin | ||||
| 4/3/17 to 4/4/17 | 0.84 to 0.96 | 56,712 | 56,711 | |
| J.P. Morgan Securities, LLC | ||||
| 9/6/17 | 1.10 (b) | 10,000 | 10,002 | |
| Landesbank Baden- Wurttemberg | ||||
| 4/4/17 to 4/5/17 | 0.98 | 29,500 | 29,497 | |
| Mitsubishi UFJ Trust & Banking Corp. | ||||
| 4/21/17 | 1.10 | 10,000 | 9,994 | |
| Natexis Banques Populaires New York Branch | ||||
| 4/3/17 to 5/31/17 | 0.90 to 1.12 | 45,000 | 44,981 | |
| Sumitomo Mitsui Banking Corp. | ||||
| 4/17/17 to 6/9/17 | 1.10 to 1.13 | 20,000 | 19,975 | |
| Sumitomo Trust & Banking Co. Ltd. | ||||
| 4/20/17 | 1.10 | 10,000 | 9,995 | |
| Toronto Dominion Holdings (U.S.A.) | ||||
| 4/12/17 to 6/23/17 | 1.10 to 1.12 | 16,000 | 15,970 | |
| TOTAL FINANCIAL COMPANY COMMERCIAL PAPER | ||||
| (Cost $368,786) | 368,820 | |||
| Asset Backed Commercial Paper - 6.8% | ||||
| Atlantic Asset Securitization Corp. (Credit Agricole CIB Guaranteed) | ||||
| 4/26/17 | 1.09 | 3,000 | 2,998 | |
| 4/3/17 | 0.94 | 1,380 | 1,380 | |
| 4/6/17 | 1.10 | 6,000 | 5,999 | |
| 4/6/17 | 0.93 | 4,000 | 3,999 | |
| 5/2/17 | 1.10 | 10,000 | 9,991 | |
| 5/3/17 | 1.10 | 2,000 | 1,998 | |
| 5/3/17 | 1.09 | 8,000 | 7,992 | |
| 6/8/17 | 1.17 | 14,000 | 13,969 | |
| Autobahn Funding Co. LLC (Liquidity Facility DZ BANK AG) | ||||
| 4/3/17 | 0.89 | 2,000 | 2,000 | |
| Gotham Funding Corp. (Liquidity Facility Bank of Tokyo-Mitsubishi UFJ Ltd.) | ||||
| 4/3/17 | 0.94 | 5,000 | 5,000 | |
| 4/4/17 | 1.00 | 5,000 | 5,000 | |
| Liberty Street Funding LLC (Liquidity Facility Bank of Nova Scotia) | ||||
| 4/25/17 | 1.00 | 6,000 | 5,996 | |
| 4/4/17 | 0.99 | 3,000 | 3,000 | |
| 4/4/17 | 0.95 | 2,922 | 2,922 | |
| Manhattan Asset Funding Co. LLC (Liquidity Facility Sumitomo Mitsui Banking Corp.) | ||||
| 4/10/17 | 1.00 | 6,000 | 5,999 | |
| 4/19/17 | 1.00 | 4,000 | 3,998 | |
| 4/4/17 | 0.96 | 15,000 | 14,999 | |
| 4/4/17 | 0.95 | 2,000 | 2,000 | |
| Sheffield Receivables Corp. (Barclays Bank PLC Guaranteed) | ||||
| 5/2/17 | 1.10 | 4,000 | 4,000 | |
| TOTAL ASSET BACKED COMMERCIAL PAPER | ||||
| (Cost $103,236) | 103,240 | |||
| Non-Financial Company Commercial Paper - 2.9% | ||||
| Archer Daniels Midland Co. | ||||
| 4/3/17 | 0.83 | 6,998 | 6,998 | |
| CVS Health Corp. | ||||
| 4/17/17 | 1.25 | 6,000 | 5,997 | |
| Dominion Resources, Inc. | ||||
| 4/10/17 to 5/1/17 | 1.05 to 1.25 | 10,000 | 9,991 | |
| Eversource Energy | ||||
| 4/3/17 | 1.10 | 2,000 | 2,000 | |
| NBCUniversal Enterprise, Inc. | ||||
| 4/7/17 | 1.05 | 4,000 | 3,999 | |
| Rogers Communications, Inc. | ||||
| 4/25/17 | 1.26 | 1,000 | 999 | |
| Sempra Global | ||||
| 4/3/17 to 5/17/17 | 1.00 to 1.34 | 5,000 | 4,996 | |
| South Carolina Public Service Authority Rev. (Liquidity Facility U.S. Bank NA, Cincinnati) | ||||
| 5/23/17 | 1.17 | 5,000 | 5,000 | |
| UnitedHealth Group, Inc. | ||||
| 4/3/17 | 0.98 to 1.00 | 4,000 | 4,000 | |
| TOTAL NON-FINANCIAL COMPANY COMMERCIAL PAPER | ||||
| (Cost $43,980) | 43,980 | |||
| Other Instrument - 1.9% | ||||
| Master Notes - 1.9% | ||||
| Toyota Motor Credit Corp. | ||||
| 4/7/17 | ||||
| (Cost $28,000) | 1.29 (b) | 28,000 | 28,000 | |
| Non-Negotiable Time Deposit - 8.5% | ||||
| Time Deposits - 8.5% | ||||
| Bank of Nova Scotia | ||||
| 4/3/17 | 0.82 | 47,886 | 47,886 | |
| BNP Paribas | ||||
| 4/4/17 to 4/5/17 | 0.91 | 56,000 | 56,000 | |
| Credit Agricole CIB | ||||
| 4/5/17 to 4/6/17 | 0.98 | 24,000 | 24,000 | |
| TOTAL NON-NEGOTIABLE TIME DEPOSIT | ||||
| (Cost $127,884) | 127,886 |
| Other Municipal Security - 0.4% | |||
| Principal Amount (000s) | Value (000s) | ||
| California - 0.4% | |||
| Los Angeles County Cap. Asset Leasing Corp. Lease Rev. Series B, 0.74% 5/9/17, LOC U.S. Bank NA, Cincinnati, CP | $ | ||
| (Cost $6,597) | 6,600 | 6,600 | |
| Maturity Amount (000s) | Value (000s) | ||
| Other Repurchase Agreement - 23.0% | |||
| Other Repurchase Agreement - 23.0% | |||
| With: | |||
| BNP Paribas at: | |||
| 1.06%, dated 3/31/17 due 4/3/17 (Collateralized by Corporate Obligations valued at $2,099,942, 0.00% - 8.48%, 1/12/18 - 12/15/86) | 2,000 | 2,000 | |
| 1.2%, dated 3/31/17 due 4/3/17 (Collateralized by Corporate Obligations valued at $2,160,217, 4.13% - 12.25%, 6/01/17 - 1/01/49) | 2,000 | 2,000 | |
| Citigroup Global Markets, Inc. at: | |||
| 1.11%, dated 3/31/17 due 4/3/17 (Collateralized by Equity Securities valued at $12,961,280) | 12,001 | 12,000 | |
| 1.18%, dated 3/28/17 due 4/7/17 (Collateralized by Equity Securities valued at $12,962,629) | 12,006 | 12,000 | |
| 2.04%, dated 2/14/17 due 5/15/17 (Collateralized by Corporate Obligations valued at $20,575,815, 1.28%, 4/05/52) | 19,097 | 18,998 | |
| 2.07%, dated 2/21/17 due 5/30/17 (Collateralized by Corporate Obligations valued at $4,330,185, 1.28%, 4/05/52) | 4,023 | 4,000 | |
| Credit Suisse Securities (U.S.A.) LLC at 1.11%, dated 3/29/17 due 4/5/17 (Collateralized by Mortgage Loan Obligations valued at $3,453,767, 5.88%, 10/25/46) | 3,001 | 3,000 | |
| HSBC Securities, Inc. at 1.11%, dated 3/31/17 due 4/3/17 (Collateralized by Corporate Obligations valued at $5,252,656, 3.89% - 8.50%, 5/22/19 - 1/10/28) | 5,000 | 5,000 | |
| ING Financial Markets LLC at: | |||
| 1.11%, dated 3/31/17 due 4/3/17: | |||
| (Collateralized by Equity Securities valued at $15,121,404) | 14,001 | 14,000 | |
| (Collateralized by Equity Securities valued at $9,720,914) | 9,001 | 9,000 | |
| 1.19%, dated 3/31/17 due 4/3/17 (Collateralized by Corporate Obligations valued at $1,082,032, 8.13%, 6/01/23) | 1,000 | 1,000 | |
| J.P. Morgan Securities, LLC at: | |||
| 1.03%, dated 3/31/17 due 4/3/17 (Collateralized by U.S. Government Obligations valued at $28,844,110, 0.00% - 3.14%, 1/15/33 - 10/25/46) | 28,002 | 28,000 | |
| 1.11%, dated 3/30/17 due 4/6/17 (Collateralized by U.S. Government Obligations valued at $17,511,405, 3.50% - 5.00%, 8/25/36 - 8/25/42) | 17,004 | 17,000 | |
| 1.31%, dated 3/31/17 due 4/7/17 (Collateralized by Mortgage Loan Obligations valued at $7,561,881, 1.09% - 6.52%, 6/25/29 - 9/15/47)(b)(c) | 7,008 | 7,001 | |
| Merrill Lynch, Pierce, Fenner & Smith at: | |||
| 1.11%, dated 3/29/17 due 4/5/17 (Collateralized by U.S. Government Obligations valued at $17,342,674, 2.50%, 5/01/30) | 17,004 | 17,001 | |
| 1.2%, dated 3/28/17 due 4/7/17 (Collateralized by Equity Securities valued at $12,962,609) | 12,006 | 12,000 | |
| 2.03%, dated 3/1/17 due 5/30/17 (Collateralized by Equity Securities valued at $25,968,257) | 24,122 | 24,000 | |
| Mitsubishi UFJ Securities (U.S.A.), Inc. at 1.22%, dated: | |||
| 3/21/17 due 4/4/17 (Collateralized by Corporate Obligations valued at $2,210,812, 0.25% - 3.25%, 4/01/18 - 12/15/27) | 2,001 | 2,000 | |
| 3/28/17 due 4/7/17 (Collateralized by Corporate Obligations valued at $3,205,995, 0.25% - 5.50%, 4/01/18 - 10/15/32) | 3,002 | 3,000 | |
| 3/30/17 due 4/6/17 (Collateralized by Corporate Obligations valued at $2,154,589, 0.25% - 5.50%, 4/01/18 - 12/15/23) | 2,000 | 2,000 | |
| Mizuho Securities U.S.A., Inc. at: | |||
| 1.09%, dated 3/31/17 due 4/3/17 (Collateralized by U.S. Treasury Obligations valued at $7,140,725, 1.75% - 3.63%, 2/15/21 - 4/30/22) | 7,001 | 7,000 | |
| 1.2%, dated: | |||
| 3/21/17 due 4/4/17 (Collateralized by Equity Securities valued at $3,241,426) | 3,001 | 3,000 | |
| 3/28/17 due 4/7/17 (Collateralized by Equity Securities valued at $9,722,152) | 9,004 | 9,000 | |
| 3/29/17 due 4/7/17 (Collateralized by Equity Securities valued at $10,801,997) | 10,005 | 10,000 | |
| 3/30/17 due 4/7/17 (Collateralized by Equity Securities valued at $3,240,481) | 3,001 | 3,000 | |
| 3/31/17 due: | |||
| 4/3/17 (Collateralized by Equity Securities valued at $4,320,563) | 4,000 | 4,000 | |
| 4/7/17 (Collateralized by Equity Securities valued at $8,640,889) | 8,005 | 8,000 | |
| 1.25%, dated 3/30/17 due 4/7/17 (Collateralized by U.S. Treasury Obligations valued at $2,040,296, 2.13%, 6/30/22) | 2,001 | 2,000 | |
| 2.01%, dated 1/9/17 due 4/10/17 (Collateralized by Corporate Obligations valued at $2,109,963, 2.50% - 2.55%, 3/15/20 - 10/29/20) | 2,010 | 2,000 | |
| 2.02%, dated 1/17/17 due 4/17/17 (Collateralized by Corporate Obligations valued at $2,110,297, 2.40% - 5.38%, 10/21/18 - 4/16/25) | 2,010 | 2,000 | |
| 2.1%, dated 12/29/16 due 4/28/17 (Collateralized by Corporate Obligations valued at $2,112,634, 2.55%, 10/29/20) | 2,014 | 2,000 | |
| 2.2%, dated 3/29/17 due 6/27/17 (Collateralized by Corporate Obligations valued at $3,177,760, 2.55% - 5.13%, 9/25/18 - 3/15/22) | 3,017 | 3,000 | |
| RBC Capital Markets Co. at: | |||
| 0.99%, dated: | |||
| 2/16/17 due 4/7/17 (Collateralized by U.S. Government Obligations valued at $10,313,030, 5.14% - 5.37%, 4/15/39 - 12/25/44) | 10,017 | 10,001 | |
| 2/28/17 due 4/7/17 (Collateralized by Municipal Bond Obligations valued at $5,254,909, 2.00% - 5.25%, 5/01/22 - 10/01/46) | 5,009 | 5,000 | |
| 1.13%, dated 1/26/17 due 4/7/17 (Collateralized by Corporate Obligations valued at $3,156,625, 1.91% - 7.30%, 4/25/18 - 7/30/46) | 3,008 | 3,000 | |
| 1.17%, dated 1/31/17 due 4/7/17 (Collateralized by Municipal Bond Obligations valued at $3,365,849, 4.00% - 5.00%, 7/15/29 - 4/01/40) | 3,009 | 3,000 | |
| 1.19%, dated 2/24/17 due 4/7/17 (Collateralized by Municipal Bond Obligations valued at $9,664,663, 4.00% - 5.00%, 7/15/29 - 7/01/44) | 9,027 | 9,000 | |
| SG Americas Securities, LLC at: | |||
| 1.26%, dated 3/31/17 due 4/3/17 (Collateralized by Corporate Obligations valued at $3,150,331, 3.90% - 4.50%, 4/01/24 - 3/16/47) | 3,000 | 3,000 | |
| 1.31%, dated: | |||
| 3/28/17 due 4/4/17 (Collateralized by Corporate Obligations valued at $5,297,602, 0.00% - 9.75%, 3/10/18 - 3/16/47) | 5,001 | 5,000 | |
| 3/29/17 due 4/5/17 (Collateralized by Corporate Obligations valued at $5,359,895, 2.00% - 12.00%, 2/14/19 - 8/31/64) | 5,001 | 5,000 | |
| 3/30/17 due 4/6/17 (Collateralized by Corporate Obligations valued at $5,303,999, 1.44% - 9.75%, 2/14/19 - 8/01/47) | 5,001 | 5,000 | |
| Wells Fargo Securities, LLC at: | |||
| 1.06%, dated 3/31/17 due 4/3/17 (Collateralized by Corporate Obligations valued at $4,200,457, 3.75% - 6.00%, 2/15/18 - 10/01/44) | 4,000 | 4,000 | |
| 1.11%, dated: | |||
| 3/30/17 due 4/6/17 (Collateralized by Corporate Obligations valued at $5,251,074, 4.15% - 4.25%, 10/01/44 - 2/06/47) | 5,001 | 5,000 | |
| 3/31/17 due 4/3/17 (Collateralized by Equity Securities valued at $18,361,701) | 17,002 | 17,000 | |
| 1.16%, dated: | |||
| 3/30/17 due 4/6/17 (Collateralized by Corporate Obligations valued at $10,802,053, 6.38% - 6.73%, 4/28/21 - 4/01/23) | 10,002 | 10,000 | |
| 3/31/17 due 4/3/17 (Collateralized by Corporate Obligations valued at $10,801,774, 4.00%, 4/01/31) | 10,001 | 10,000 | |
| 1.65%, dated 2/2/17 due 5/3/17 (Collateralized by Corporate Obligations valued at $3,249,839, 4.00%, 4/01/31) | 3,012 | 3,000 | |
| TOTAL OTHER REPURCHASE AGREEMENT | |||
| (Cost $347,000) | 347,001 | ||
| TOTAL INVESTMENT PORTFOLIO - 94.0% | |||
| (Cost $1,416,763) | 1,416,897 | ||
| NET OTHER ASSETS (LIABILITIES) - 6.0% | 91,172 | ||
| NET ASSETS - 100% | $1,508,069 |
Security Type Abbreviations
CP – COMMERCIAL PAPER
The date shown for securities represents the date when principal payments must be paid, taking into account any call options exercised by the issuer and any permissible maturity shortening features other than interest rate resets.
Legend
(a) Yield represents either the annualized yield at the date of purchase, or the stated coupon rate, or, for floating and adjustable rate securities, the rate at period end.
(b) Coupon rates for floating and adjustable rate securities reflect the rates in effect at period end.
(c) The maturity amount is based on the rate at period end.
Investment Valuation
All investments are categorized as Level 2 under the Fair Value Hierarchy. The inputs or methodology used for valuing securities may not be an indication of the risk associated with investing in those securities. For more information on valuation inputs please refer to the Investment Valuation section in the accompanying Notes to Financial Statements.
See accompanying notes which are an integral part of the financial statements.
Prime Reserves Portfolio
Financial Statements
Statement of Assets and Liabilities
| Amounts in thousands (except per-share amounts) | March 31, 2017 | |
| Assets | ||
| Investment in securities, at value (including repurchase agreements of $347,001) — See accompanying schedule: Unaffiliated issuers (cost $1,416,763) | $1,416,897 | |
| Receivable for fund shares sold | 94,745 | |
| Interest receivable | 620 | |
| Prepaid expenses | 16 | |
| Receivable from investment adviser for expense reductions | 55 | |
| Total assets | 1,512,333 | |
| Liabilities | ||
| Payable for fund shares redeemed | $3,747 | |
| Distributions payable | 245 | |
| Accrued management fee | 156 | |
| Other affiliated payables | 57 | |
| Other payables and accrued expenses | 59 | |
| Total liabilities | 4,264 | |
| Net Assets | $1,508,069 | |
| Net Assets consist of: | ||
| Paid in capital | $1,507,934 | |
| Accumulated undistributed net realized gain (loss) on investments | 1 | |
| Net unrealized appreciation (depreciation) on investments | 134 | |
| Net Assets | $1,508,069 | |
| Class I: | ||
| Net Asset Value, offering price and redemption price per share ($539,609.3 ÷ 539,508.41 shares) | $1.0002 | |
| Class II: | ||
| Net Asset Value, offering price and redemption price per share ($1,003.6 ÷ 1,003.43 shares) | $1.0002 | |
| Class III: | ||
| Net Asset Value, offering price and redemption price per share ($1,002.8 ÷ 1,002.60 shares) | $1.0002 | |
| Select Class: | ||
| Net Asset Value, offering price and redemption price per share ($1,447.1 ÷ 1,446.87 shares) | $1.0002 | |
| Institutional Class: | ||
| Net Asset Value, offering price and redemption price per share ($965,006.6 ÷ 964,827.20 shares) | $1.0002 |
See accompanying notes which are an integral part of the financial statements.
Statement of Operations
| Amounts in thousands | For the period June 2, 2016 (commencement of operations) to March 31, 2017 | |
| Investment Income | ||
| Interest (including $48 from affiliated interfund lending) | $4,614 | |
| Expenses | ||
| Management fee | $753 | |
| Transfer agent fees | 212 | |
| Distribution and service plan fees | 4 | |
| Accounting fees and expenses | 69 | |
| Custodian fees and expenses | 44 | |
| Independent trustees' fees and expenses | 2 | |
| Registration fees | 177 | |
| Audit | 42 | |
| Miscellaneous | 1 | |
| Total expenses before reductions | 1,304 | |
| Expense reductions | (485) | 819 |
| Net investment income (loss) | 3,795 | |
| Realized and Unrealized Gain (Loss) | ||
| Net realized gain (loss) on: | ||
| Investment securities: | ||
| Unaffiliated issuers | 1 | |
| Total net realized gain (loss) | 1 | |
| Change in net unrealized appreciation (depreciation) on investment securities | 134 | |
| Net increase in net assets resulting from operations | $3,930 |
See accompanying notes which are an integral part of the financial statements.
Statement of Changes in Net Assets
| Amounts in thousands | For the period June 2, 2016 (commencement of operations) to March 31, 2017 |
| Increase (Decrease) in Net Assets | |
| Operations | |
| Net investment income (loss) | $3,795 |
| Net realized gain (loss) | 1 |
| Change in net unrealized appreciation (depreciation) | 134 |
| Net increase in net assets resulting from operations | 3,930 |
| Distributions to shareholders from net investment income | (3,795) |
| Share transactions - net increase (decrease) | 1,507,934 |
| Total increase (decrease) in net assets | 1,508,069 |
| Net Assets | |
| Beginning of period | – |
| End of period | $1,508,069 |
See accompanying notes which are an integral part of the financial statements.
Financial Highlights — Prime Reserves Portfolio Class I
| Years ended March 31, | 2017 A,B |
| Selected Per–Share Data | |
| Net asset value, beginning of period | $1.0000 |
| Income from Investment Operations | |
| Net investment income (loss) | .0047 |
| Net realized and unrealized gain (loss) | .0002 |
| Total from investment operations | .0049 |
| Distributions from net investment income | (.0047) |
| Total distributions | (.0047) |
| Net asset value, end of period | $1.0002 |
| Total ReturnC,D | .49% |
| Ratios to Average Net AssetsE | |
| Expenses before reductions | .25%F |
| Expenses net of fee waivers, if any | .18%F |
| Expenses net of all reductions | .18%F |
| Net investment income (loss) | .68%F |
| Supplemental Data | |
| Net assets, end of period (in millions) | $540 |
A For the period June 2, 2016 (commencement of operations) to March 31, 2017.
B Beginning October 3, 2016 the Fund began selling and redeeming class shares based upon the market-based value of the securities held rounded to the fourth decimal place; a "floating"net asset value.
C Total returns for periods of less than one year are not annualized.
D Total returns would have been lower if certain expenses had not been reduced during the applicable periods shown.
E Expense ratios reflect operating expenses of the class. Expenses before reductions do not reflect amounts reimbursed or waived or reductions from expense offset arrangements and do not represent the amount paid by the class during periods when reimbursements, waivers or reductions occur. Expense ratios before reductions for start-up periods may not be representative of longer-term operating periods. Expenses net of fee waivers reflect expenses after reimbursement and waivers but prior to reductions from expense offset arrangements. Expenses net of all reductions represent the net expenses paid by the class.
F Annualized
See accompanying notes which are an integral part of the financial statements.
Financial Highlights — Prime Reserves Portfolio Class II
| Years ended March 31, | 2017 A,B |
| Selected Per–Share Data | |
| Net asset value, beginning of period | $1.0000 |
| Income from Investment Operations | |
| Net investment income (loss) | .0034 |
| Net realized and unrealized gain (loss) | .0002 |
| Total from investment operations | .0036 |
| Distributions from net investment income | (.0034) |
| Total distributions | (.0034) |
| Net asset value, end of period | $1.0002 |
| Total ReturnC,D | .36% |
| Ratios to Average Net AssetsE | |
| Expenses before reductions | .56%F |
| Expenses net of fee waivers, if any | .33%F |
| Expenses net of all reductions | .33%F |
| Net investment income (loss) | .53%F |
| Supplemental Data | |
| Net assets, end of period (in millions) | $1 |
A For the period June 2, 2016 (commencement of operations) to March 31, 2017.
B Beginning October 3, 2016 the Fund began selling and redeeming class shares based upon the market-based value of the securities held rounded to the fourth decimal place; a "floating"net asset value.
C Total returns for periods of less than one year are not annualized.
D Total returns would have been lower if certain expenses had not been reduced during the applicable periods shown.
E Expense ratios reflect operating expenses of the class. Expenses before reductions do not reflect amounts reimbursed or waived or reductions from expense offset arrangements and do not represent the amount paid by the class during periods when reimbursements, waivers or reductions occur. Expense ratios before reductions for start-up periods may not be representative of longer-term operating periods. Expenses net of fee waivers reflect expenses after reimbursement and waivers but prior to reductions from expense offset arrangements. Expenses net of all reductions represent the net expenses paid by the class.
F Annualized
See accompanying notes which are an integral part of the financial statements.
Financial Highlights — Prime Reserves Portfolio Class III
| Years ended March 31, | 2017 A,B |
| Selected Per–Share Data | |
| Net asset value, beginning of period | $1.0000 |
| Income from Investment Operations | |
| Net investment income (loss) | .0026 |
| Net realized and unrealized gain (loss) | .0002 |
| Total from investment operations | .0028 |
| Distributions from net investment income | (.0026) |
| Total distributions | (.0026) |
| Net asset value, end of period | $1.0002 |
| Total ReturnC,D | .28% |
| Ratios to Average Net AssetsE | |
| Expenses before reductions | .66%F |
| Expenses net of fee waivers, if any | .43%F |
| Expenses net of all reductions | .43%F |
| Net investment income (loss) | .43%F |
| Supplemental Data | |
| Net assets, end of period (in millions) | $1 |
A For the period June 2, 2016 (commencement of operations) to March 31, 2017.
B Beginning October 3, 2016 the Fund began selling and redeeming class shares based upon the market-based value of the securities held rounded to the fourth decimal place; a "floating"net asset value.
C Total returns for periods of less than one year are not annualized.
D Total returns would have been lower if certain expenses had not been reduced during the applicable periods shown.
E Expense ratios reflect operating expenses of the class. Expenses before reductions do not reflect amounts reimbursed or waived or reductions from expense offset arrangements and do not represent the amount paid by the class during periods when reimbursements, waivers or reductions occur. Expense ratios before reductions for start-up periods may not be representative of longer-term operating periods. Expenses net of fee waivers reflect expenses after reimbursement and waivers but prior to reductions from expense offset arrangements. Expenses net of all reductions represent the net expenses paid by the class.
F Annualized
See accompanying notes which are an integral part of the financial statements.
Financial Highlights — Prime Reserves Portfolio Select Class
| Years ended March 31, | 2017 A,B |
| Selected Per–Share Data | |
| Net asset value, beginning of period | $1.0000 |
| Income from Investment Operations | |
| Net investment income (loss) | .0043 |
| Net realized and unrealized gain (loss) | .0002 |
| Total from investment operations | .0045 |
| Distributions from net investment income | (.0043) |
| Total distributions | (.0043) |
| Net asset value, end of period | $1.0002 |
| Total ReturnC,D | .45% |
| Ratios to Average Net AssetsE | |
| Expenses before reductions | .45%F |
| Expenses net of fee waivers, if any | .23%F |
| Expenses net of all reductions | .23%F |
| Net investment income (loss) | .63%F |
| Supplemental Data | |
| Net assets, end of period (in millions) | $1 |
A For the period June 2, 2016 (commencement of operations) to March 31, 2017.
B Beginning October 3, 2016 the Fund began selling and redeeming class shares based upon the market-based value of the securities held rounded to the fourth decimal place; a "floating"net asset value.
C Total returns for periods of less than one year are not annualized.
D Total returns would have been lower if certain expenses had not been reduced during the applicable periods shown.
E Expense ratios reflect operating expenses of the class. Expenses before reductions do not reflect amounts reimbursed or waived or reductions from expense offset arrangements and do not represent the amount paid by the class during periods when reimbursements, waivers or reductions occur. Expense ratios before reductions for start-up periods may not be representative of longer-term operating periods. Expenses net of fee waivers reflect expenses after reimbursement and waivers but prior to reductions from expense offset arrangements. Expenses net of all reductions represent the net expenses paid by the class.
F Annualized
See accompanying notes which are an integral part of the financial statements.
Financial Highlights — Prime Reserves Portfolio Institutional Class
| Years ended March 31, | 2017 A,B |
| Selected Per–Share Data | |
| Net asset value, beginning of period | $1.0000 |
| Income from Investment Operations | |
| Net investment income (loss) | .0050 |
| Net realized and unrealized gain (loss) | .0002 |
| Total from investment operations | .0052 |
| Distributions from net investment income | (.0050) |
| Total distributions | (.0050) |
| Net asset value, end of period | $1.0002 |
| Total ReturnC,D | .52% |
| Ratios to Average Net AssetsE | |
| Expenses before reductions | .24%F |
| Expenses net of fee waivers, if any | .14%F |
| Expenses net of all reductions | .14%F |
| Net investment income (loss) | .72%F |
| Supplemental Data | |
| Net assets, end of period (in millions) | $965 |
A For the period June 2, 2016 (commencement of operations) to March 31, 2017.
B Beginning October 3, 2016 the Fund began selling and redeeming class shares based upon the market-based value of the securities held rounded to the fourth decimal place; a "floating"net asset value.
C Total returns for periods of less than one year are not annualized.
D Total returns would have been lower if certain expenses had not been reduced during the applicable periods shown.
E Expense ratios reflect operating expenses of the class. Expenses before reductions do not reflect amounts reimbursed or waived or reductions from expense offset arrangements and do not represent the amount paid by the class during periods when reimbursements, waivers or reductions occur. Expense ratios before reductions for start-up periods may not be representative of longer-term operating periods. Expenses net of fee waivers reflect expenses after reimbursement and waivers but prior to reductions from expense offset arrangements. Expenses net of all reductions represent the net expenses paid by the class.
F Annualized
See accompanying notes which are an integral part of the financial statements.
Tax-Exempt Portfolio
Investment Summary/Performance (Unaudited)
Effective Maturity Diversification
| Days | % of fund's investments 3/31/17 | % of fund's investments 9/30/16 | % of fund's investments 3/31/16 |
| 1 - 7 | 80.8 | 76.3 | 75.4 |
| 8 - 30 | 2.3 | 1.8 | 1.4 |
| 31 - 60 | 3.6 | 4.5 | 3.6 |
| 61 - 90 | 5.7 | 3.7 | 3.3 |
| 91 - 180 | 3.7 | 2.0 | 9.8 |
| > 180 | 3.9 | 11.7 | 6.5 |
Effective maturity is determined in accordance with the requirements of Rule 2a-7 under the Investment Company Act of 1940.
Asset Allocation (% of fund's net assets)
| As of March 31, 2017 | ||
| Variable Rate Demand Notes (VRDNs) | 53.0% | |
| Tender Option Bond | 15.4% | |
| Other Municipal Security | 22.8% | |
| Investment Companies | 7.2% | |
| Net Other Assets (Liabilities) | 1.6% | |

| As of September 30, 2016 | ||
| Variable Rate Demand Notes (VRDNs) | 30.5% | |
| Tender Option Bond | 21.9% | |
| Other Municipal Security | 26.0% | |
| Investment Companies | 20.4% | |
| Net Other Assets (Liabilities) | 1.2% | |
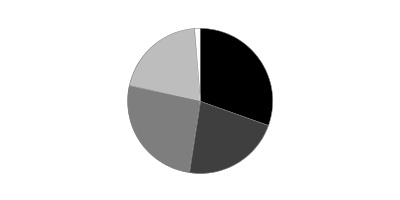
Current And Historical 7-Day Yields
| 3/31/17 | 12/31/16 | 9/30/16 | 6/30/16 | 3/31/16 | |
| Class I | 0.70% | 0.59% | 0.63% | 0.30% | 0.13% |
| Class II | 0.55% | 0.44% | 0.48% | 0.15% | 0.01% |
| Class III | 0.45% | 0.34% | 0.38% | 0.05% | 0.01% |
| Select Class | 0.65% | 0.54% | 0.58% | 0.24% | 0.08% |
Yield refers to the income paid by the Fund over a given period. Yields for money market funds are usually for seven-day periods, as they are here, though they are expressed as annual percentage rates. Past performance is no guarantee of future results. Yield will vary and it's possible to lose money investing in the Fund. A portion of the Fund's expenses was reimbursed and/or waived. Absent such reimbursements and/or waivers the yield for the period ending March 31, 2017, the most recent period shown in the table, would have been 0.67% for Class I, 0.52% for Class II, 0.42% for Class III and 0.62% for Select Class.
Tax-Exempt Portfolio
Investments March 31, 2017
Showing Percentage of Net Assets
| Variable Rate Demand Note - 53.0% | |||
| Principal Amount (000s) | Value (000s) | ||
| Alabama - 4.2% | |||
| Columbia Indl. Dev. Board Poll. Cont. Rev. (Alabama Pwr. Co. Proj.) Series 2014 B, 0.96% 4/3/17, VRDN(a) | $13,530 | $13,530 | |
| Mobile Downtown Redev. Auth. Gulf Opportunity Zone: | |||
| Series 2011 A, 0.92% 4/7/17, LOC Bank of America NA, VRDN (a)(b) | 5,300 | 5,300 | |
| Series 2011 B, 0.92% 4/7/17, LOC Wells Fargo Bank NA, VRDN (a)(b) | 9,705 | 9,705 | |
| Mobile Indl. Dev. Board Poll. Cont. Rev. (Alabama Pwr. Co. Barry Plant Proj.) Series 2007 C, 0.96% 4/7/17, VRDN (a) | 1,250 | 1,250 | |
| Tuscaloosa County Indl. Dev. Gulf Opportunity (Hunt Refining Proj.): | |||
| Series 2011 A, 0.95% 4/7/17, LOC JPMorgan Chase Bank, VRDN (a)(b) | 14,700 | 14,700 | |
| Series 2011 D, 0.95% 4/7/17, LOC JPMorgan Chase Bank, VRDN (a)(b) | 25,000 | 25,000 | |
| Series 2011 E, 0.95% 4/7/17, LOC JPMorgan Chase Bank, VRDN (a)(b) | 25,000 | 25,000 | |
| Series 2011 I, 0.91% 4/7/17, LOC Bank of Nova Scotia, VRDN (a)(b) | 1,600 | 1,600 | |
| 96,085 | |||
| Alaska - 1.3% | |||
| Alaska Indl. Dev. & Export Auth. Rev. (Greater Fairbanks Cmnty. Hosp. Foundation Proj.) Series 2009 A, 0.91% 4/7/17, LOC MUFG Union Bank NA, VRDN (a) | 6,700 | 6,700 | |
| Alaska Int'l. Arpts. Revs. Series 2009 A, 0.89% 4/7/17, LOC State Street Bank & Trust Co., Boston, VRDN (a) | 4,860 | 4,860 | |
| Valdez Marine Term. Rev.: | |||
| (ConocoPhillips Proj.) Series 1994 A, 0.98% 4/7/17, VRDN (a) | 2,600 | 2,600 | |
| (Phillips Trans. Alaska, Inc. Proj.) Series 1994 C, 0.98% 4/7/17, VRDN (a) | 14,500 | 14,500 | |
| 28,660 | |||
| Arizona - 0.8% | |||
| Arizona Health Facilities Auth. Rev.: | |||
| (Catholic Healthcare West Proj.) Series 2009 F, 0.96% 4/7/17, LOC Mizuho Corporate Bank Ltd., VRDN (a) | 14,100 | 14,100 | |
| Series 2015 B, 0.96% 4/7/17, LOC Bank of Tokyo-Mitsubishi UFJ Ltd., VRDN (a) | 4,800 | 4,800 | |
| 18,900 | |||
| Colorado - 2.5% | |||
| Colorado Health Facilities Auth. Rev.: | |||
| (Boulder Cmnty. Hosp. Proj.) Series 2000, 0.9% 4/7/17, LOC JPMorgan Chase Bank, VRDN (a) | 4,115 | 4,115 | |
| 0.91% 4/7/17, VRDN (a) | 23,450 | 23,450 | |
| Colorado Univ. Co. Hosp. Auth. Rev.: | |||
| Series 2017 B1, 0.91% 4/7/17, VRDN (a) | 14,000 | 14,000 | |
| Series 2017 B2, 0.91% 4/7/17, VRDN (a) | 16,000 | 16,000 | |
| 57,565 | |||
| Connecticut - 3.4% | |||
| Connecticut Gen. Oblig. Series 2016 C, 0.9% 4/7/17 (Liquidity Facility Bank of America NA), VRDN (a) | 21,000 | 21,000 | |
| Connecticut Hsg. Fin. Auth.: | |||
| (Ct Gen. Hsg. 9/27/72 Proj.) 2017 Subseries A-3, 0.9% 4/7/17 (Liquidity Facility Landesbank Hessen-Thuringen), VRDN (a) | 1,900 | 1,900 | |
| Series 2011 C1, 0.92% 4/7/17 (Liquidity Facility Barclays Bank PLC), VRDN (a) | 11,435 | 11,435 | |
| Series 2016 F, 0.92% 4/7/17 (Liquidity Facility Landesbank Hessen-Thuringen), VRDN (a) | 25,500 | 25,500 | |
| Series E 3, 0.92% 4/7/17 (Liquidity Facility Landesbank Hessen-Thuringen), VRDN (a) | 17,200 | 17,200 | |
| 77,035 | |||
| Delaware - 0.1% | |||
| Delaware Econ. Dev. Auth. Rev. (Delmarva Pwr. & Lt. Co. Proj.): | |||
| Series 1993 C, 1.03% 4/7/17, VRDN (a) | 300 | 300 | |
| Series 1999 A, 0.95% 4/7/17, VRDN (a) | 1,900 | 1,900 | |
| 2,200 | |||
| District Of Columbia - 2.5% | |||
| District of Columbia Hsg. Fin. Agcy. Multi-family Hsg. Rev. (Pentacle Apts. Proj.) Series 2008, 0.95% 4/7/17, LOC Freddie Mac, VRDN (a) | 3,100 | 3,100 | |
| District of Columbia Rev.: | |||
| (American Psychological Assoc. Proj.) Series 2003, 0.97% 4/7/17, LOC Bank of America NA, VRDN (a) | 1,200 | 1,200 | |
| (The AARP Foundation Proj.) Series 2004, 0.91% 4/7/17, LOC Bank of America NA, VRDN (a) | 20,790 | 20,790 | |
| (The Pew Charitable Trust Proj.) Series 2008 A, 0.93% 4/7/17, LOC PNC Bank NA, VRDN (a) | 20,500 | 20,500 | |
| (Washington Drama Society, Inc. Proj.) Series 2008, 0.94% 4/7/17, LOC JPMorgan Chase Bank, VRDN (a) | 4,205 | 4,205 | |
| Series 2006, 0.91% 4/7/17, LOC Wells Fargo Bank NA, VRDN (a) | 7,850 | 7,850 | |
| 57,645 | |||
| Florida - 1.3% | |||
| Martin County Poll. Cont. Rev. (Florida Pwr. & Lt. Co. Proj.) Series 2000, 0.91% 4/3/17, VRDN (a) | 7,200 | 7,200 | |
| Miami-Dade County Series 2014 A, 0.92% 4/7/17, LOC Bank of Tokyo-Mitsubishi UFJ Ltd., VRDN (a) | 4,600 | 4,600 | |
| Orange County Health Facilities Auth. Rev. (Orlando Reg'l. Health Care Sys. Proj.) Series 2008 E, 0.95% 4/7/17, LOC Branch Banking & Trust Co., VRDN (a) | 4,100 | 4,100 | |
| Pinellas County Health Facilities Auth. Rev. (BayCare Health Sys. Proj.) Series 2009 A2, 0.92% 4/7/17, LOC Northern Trust Co., VRDN (a) | 13,400 | 13,400 | |
| 29,300 | |||
| Georgia - 3.0% | |||
| Burke County Indl. Dev. Auth. Poll. Cont. Rev.: | |||
| (Georgia Pwr. Co. Plant Vogtle Proj.) Second Series 1995, 1.33% 4/3/17, VRDN (a) | 7,400 | 7,400 | |
| (Oglethorpe Pwr. Corp. Proj.): | |||
| Series 2010 A, 0.89% 4/7/17, LOC Bank of America NA, VRDN (a) | 9,800 | 9,800 | |
| Series 2010 B, 0.89% 4/7/17, LOC Bank of America NA, VRDN (a) | 7,205 | 7,205 | |
| Effingham County Indl. Dev. Auth. Poll Cont. 1.36% 4/3/17, VRDN (a) | 6,370 | 6,370 | |
| Monroe County Dev. Auth. Poll. Cont. Rev. (Georgia Pwr. Co. Plant Scherer Proj.): | |||
| Series 1997, 1.33% 4/3/17, VRDN(a) | 1,700 | 1,700 | |
| Series 2008, 1.33% 4/3/17, VRDN(a) | 28,040 | 28,040 | |
| Paulding County Hosp. Auth. Rev. Series 2012 B, 0.92% 4/7/17, LOC Northern Trust Co., VRDN (a) | 8,100 | 8,100 | |
| 68,615 | |||
| Illinois - 8.6% | |||
| Chicago O'Hare Int'l. Arpt. Rev. Series 2005 D, 0.92% 4/7/17, LOC Barclays Bank PLC, VRDN (a) | 1,400 | 1,400 | |
| Illinois Dev. Fin. Auth. Rev. (Lyric Opera of Chicago Proj.) 0.95% 4/7/17, LOC JPMorgan Chase Bank, LOC BMO Harris Bank NA, VRDN (a) | 7,000 | 7,000 | |
| Illinois Fin. Auth. Rev.: | |||
| (Edward Hosp. Obligated Group Proj.): | |||
| Series 2008 B2, 0.89% 4/7/17, LOC JPMorgan Chase Bank, VRDN (a) | 2,200 | 2,200 | |
| Series 2008 C, 0.89% 4/7/17, LOC JPMorgan Chase Bank, VRDN (a) | 3,495 | 3,495 | |
| (Little Co. of Mary Hosp. Proj.): | |||
| Series 2008 A, 0.93% 4/7/17, LOC Barclays Bank PLC, VRDN (a) | 11,220 | 11,220 | |
| Series 2008 B, 0.93% 4/7/17, LOC Barclays Bank PLC, VRDN (a) | 33,780 | 33,780 | |
| (Northwest Cmnty. Hosp. Proj.) Series 2008 B, 0.93% 4/7/17, LOC JPMorgan Chase Bank, VRDN (a) | 10,005 | 10,005 | |
| Series 2007 F, 0.92% 4/7/17, LOC Barclays Bank PLC, VRDN (a) | 20,000 | 20,000 | |
| Illinois Health Facilities Auth. Rev. (Herman M. Finch Univ. of Health Sciences/The Chicago Med. School Proj.) Series 2003, 0.95% 4/7/17, LOC JPMorgan Chase Bank, VRDN (a) | 11,535 | 11,535 | |
| Illinois Toll Hwy. Auth. Toll Hwy. Rev.: | |||
| Series 2007 A 1B, 0.91% 4/7/17, LOC Bank of America NA, VRDN (a) | 8,500 | 8,500 | |
| Series 2007 A 2B, 0.91% 4/7/17, LOC PNC Bank NA, VRDN (a) | 22,400 | 22,400 | |
| Series 2007 A-2A, 0.91% 4/7/17, LOC Bank of Tokyo-Mitsubishi UFJ Ltd., VRDN (a) | 20,950 | 20,950 | |
| Series 2007 A1, 0.91% 4/7/17, LOC Landesbank Hessen-Thuringen, VRDN (a) | 26,500 | 26,500 | |
| Lake County Multi-family Hsg. Rev. (Whispering Oaks Apts. Proj.) Series 2008, 0.91% 4/7/17, LOC Freddie Mac, VRDN (a) | 6,000 | 6,000 | |
| Univ. of Illinois Rev.: | |||
| (UIC South Campus Dev. Proj.) Series 2008, 0.95% 4/7/17, LOC JPMorgan Chase Bank, VRDN (a) | 5,600 | 5,600 | |
| Series 2008, 0.94% 4/7/17, LOC Wells Fargo Bank NA, VRDN (a) | 4,300 | 4,300 | |
| 194,885 | |||
| Indiana - 1.3% | |||
| Elkhart County Hosp. Auth. Rev. (Elkhart Gen. Hosp. Proj.) Series 2008, 0.9% 4/7/17, LOC JPMorgan Chase Bank, VRDN (a) | 13,865 | 13,865 | |
| Indiana Dev. Fin. Auth. Econ. (Archer-Daniels-Midland Co. Proj.) Series 2012, 0.88% 4/7/17 (Archer Daniels Midland Co. Guaranteed), VRDN (a) | 8,400 | 8,400 | |
| Lawrenceburg Poll. Cont. Rev.: | |||
| ( Indiana Michigan Pwr. Co. Proj.) Series I, 1.07% 4/7/17, VRDN (a) | 500 | 500 | |
| (Indiana Michigan Pwr. Co. Proj.) Series H, 1.07% 4/7/17, VRDN (a) | 1,200 | 1,200 | |
| Saint Joseph County Hosp. Auth. Health Sys. Rev. (Memorial Health Sys. Proj.) Series 2008 A, 0.92% 4/7/17, LOC JPMorgan Chase Bank, VRDN (a) | 4,570 | 4,570 | |
| 28,535 | |||
| Iowa - 2.7% | |||
| Iowa Fin. Auth. Health Facilities Rev. Series 2013 B1, 0.95% 4/7/17, LOC MUFG Union Bank NA, VRDN (a) | 14,435 | 14,435 | |
| Iowa Fin. Auth. Midwestern Disaster Area Econ. Dev. Series 2012 A, 0.94% 4/7/17, VRDN (a) | 5,800 | 5,800 | |
| Iowa Fin. Auth. Poll. Cont. Facility Rev.: | |||
| (MidAmerican Energy Proj.) Series 2008 B, 0.89% 4/7/17, VRDN (a) | 29,600 | 29,600 | |
| (Midamerican Energy Proj.) Series 2016 A, 0.89% 4/7/17, VRDN (a) | 9,300 | 9,300 | |
| Iowa Higher Ed. Ln. Auth. Rev. (Loras College Proj.) Series 2000, 0.97% 4/3/17, LOC Bank of America NA, VRDN (a) | 1,500 | 1,500 | |
| 60,635 | |||
| Louisiana - 1.4% | |||
| East Baton Rouge Parish Pub. Impt. Sales Tax Rev. Series 2008 A, 0.9% 4/7/17, LOC JPMorgan Chase Bank, VRDN (a) | 11,135 | 11,135 | |
| Louisiana Offshore Term. Auth. Deepwater Port Rev. (LOOP LLC Proj.) Series 2013 B, 0.95% 4/7/17, LOC JPMorgan Chase Bank, VRDN (a) | 3,450 | 3,450 | |
| Louisiana Pub. Facilities Auth. Rev. (C-Port LLC Proj.) Series 2008, 0.95% 4/7/17, LOC Bank of America NA, VRDN (a) | 800 | 800 | |
| Saint James Parish Gen. Oblig. (NuStar Logistics, L.P. Proj.): | |||
| Series 2010 B, 0.91% 4/7/17, LOC Bank of Tokyo-Mitsubishi UFJ Ltd., VRDN (a) | 3,200 | 3,200 | |
| Series 2010, 0.91% 4/7/17, LOC Mizuho Bank Ltd., VRDN (a) | 6,600 | 6,600 | |
| Series 2011, 0.91% 4/7/17, LOC Bank of Nova Scotia, VRDN (a) | 6,800 | 6,800 | |
| 31,985 | |||
| Michigan - 0.5% | |||
| Michigan Fin. Auth. Rev. (Hosp. Proj.) Series 2016 E2, 0.86% 4/7/17, VRDN (a) | 10,400 | 10,400 | |
| Mississippi - 0.4% | |||
| Mississippi Dev. Bank Spl. Oblig. (Harrison County Proj.) Series 2008 A2, 0.95% 4/7/17, LOC Bank of America NA, VRDN (a) | 10,150 | 10,150 | |
| Nevada - 2.5% | |||
| Clark County Indl. Dev. Rev. (Southwest Gas Corp. Proj.) Series 2009 A, 0.92% 4/7/17, LOC Bank of America NA, VRDN (a) | 5,750 | 5,750 | |
| Reno Cap. Impt. Rev. Series 2005 A, 0.95% 4/7/17, LOC Bank of America NA, VRDN (a) | 11,200 | 11,200 | |
| Reno Hosp. Rev. (Renown Reg'l. Med. Ctr. Proj.): | |||
| Series 2008 A, 0.91% 4/7/17, LOC MUFG Union Bank NA, VRDN (a) | 35,250 | 35,250 | |
| Series 2008 B, 0.92% 4/7/17, LOC MUFG Union Bank NA, VRDN (a) | 3,500 | 3,500 | |
| 55,700 | |||
| New Jersey - 0.3% | |||
| New Jersey Health Care Facilities Fing. Auth. Rev. (AHS Hosp. Corp. Proj.) Series 2008 B, 0.92% 4/7/17, LOC Bank of America NA, VRDN (a) | 6,500 | 6,500 | |
| New York - 5.5% | |||
| New York City Transitional Fin. Auth. Rev.: | |||
| Series 1999 A2, 0.95% 4/7/17 (Liquidity Facility JPMorgan Chase Bank), VRDN (a) | 20,500 | 20,500 | |
| Series 2003 1A, 0.96% 4/7/17 (Liquidity Facility Landesbank Hessen-Thuringen), VRDN (a) | 11,405 | 11,405 | |
| New York Hsg. Fin. Agcy. Rev.: | |||
| (88 Leonard Street Proj.) Series 2005 A, 0.87% 4/7/17, LOC Landesbank Hessen-Thuringen, VRDN (a) | 22,700 | 22,700 | |
| (Tribeca Green Hsg. Proj.) Series 2003 A, 0.87% 4/7/17, LOC Landesbank Hessen-Thuringen, VRDN (a) | 6,610 | 6,610 | |
| Series 2010 A: | |||
| 0.95% 4/7/17, LOC Landesbank Hessen-Thuringen, VRDN (a) | 2,000 | 2,000 | |
| 0.95% 4/7/17, LOC Landesbank Hessen-Thuringen, VRDN (a) | 1,900 | 1,900 | |
| Series 2012 A, 0.89% 4/7/17, LOC Manufacturers & Traders Trust Co., VRDN (a) | 2,800 | 2,800 | |
| Series 2013 A: | |||
| 0.88% 4/7/17, LOC Wells Fargo Bank NA, VRDN (a) | 4,800 | 4,800 | |
| 0.92% 4/7/17, LOC Wells Fargo Bank NA, VRDN (a) | 9,600 | 9,600 | |
| Series 2013 A1, 0.9% 4/7/17, LOC Manufacturers & Traders Trust Co., VRDN (a) | 15,400 | 15,400 | |
| Series 2013 A3, 0.95% 4/7/17, LOC Bank of America NA, VRDN (a) | 1,800 | 1,800 | |
| Series 2015 A, 0.87% 4/7/17, LOC Landesbank Hessen-Thuringen, VRDN (a) | 2,000 | 2,000 | |
| New York State Energy Research & Dev. Auth. Facilities Rev. (Consolidated Edison Co. of New York, Inc. Proj.) Series 2005 A3, 0.95% 4/7/17, LOC Mizuho Bank Ltd., VRDN (a) | 3,000 | 3,000 | |
| Triborough Bridge & Tunnel Auth. Revs.: | |||
| Series 2001 C, 0.93% 4/7/17, LOC Bank of Tokyo-Mitsubishi UFJ Ltd., VRDN (a) | 2,650 | 2,650 | |
| Series 2005 B3, 0.93% 4/7/17, LOC Bank of Tokyo-Mitsubishi UFJ Ltd., VRDN (a) | 12,100 | 12,100 | |
| Yonkers Indl. Dev. Agcy. Civic Facility Rev. (Consumers Union of United States, Inc. Proj.) Series 2005, 0.9% 4/7/17, LOC JPMorgan Chase Bank, VRDN (a) | 6,200 | 6,200 | |
| 125,465 | |||
| North Carolina - 0.8% | |||
| Lower Cape Fear Wtr. & Swr. Auth. Rev. (Bladen Bluffs Proj.) Series 2010, 0.93% 4/7/17, LOC Rabobank Nederland New York Branch, VRDN (a) | 600 | 600 | |
| North Carolina Med. Care Commission Health Care Facilities Rev.: | |||
| (Cape Fear Valley Health Sys. Proj.): | |||
| Series 2008 A1, 0.95% 4/7/17, LOC Branch Banking & Trust Co., VRDN (a) | 3,400 | 3,400 | |
| Series 2008 A2, 0.95% 4/7/17, LOC Branch Banking & Trust Co., VRDN (a) | 2,700 | 2,700 | |
| (Deerfield Episcopal Retirement Proj.) Series 2008 B, 0.93% 4/7/17, LOC Branch Banking & Trust Co., VRDN (a) | 1,500 | 1,500 | |
| Parson County Indl. Facilities and Poll. Cont. Fing. Auth. (CertainTeed Gypsum NC, Inc. Proj.) Series 2010, 0.95% 4/7/17, LOC Cr. Industriel et Commercial, VRDN (a) | 9,900 | 9,900 | |
| 18,100 | |||
| Ohio - 0.9% | |||
| Allen County Hosp. Facilities Rev. Series 2012 B, 0.96% 4/7/17, VRDN (a) | 19,400 | 19,400 | |
| Oklahoma - 0.6% | |||
| Univ. Hospitals Trust Rev. Series 2005 A, 0.91% 4/7/17, LOC Bank of America NA, VRDN (a) | 12,900 | 12,900 | |
| Pennsylvania - 1.4% | |||
| Allegheny County Hosp. Dev. Auth. Rev.: | |||
| (Jefferson Reg'l. Med. Ctr.) Series 2010 A, 0.94% 4/7/17, LOC PNC Bank NA, VRDN (a) | 9,550 | 9,550 | |
| (South Hills Health Sys. Proj.) Series 2000 A, 0.94% 4/7/17, LOC PNC Bank NA, VRDN (a) | 4,000 | 4,000 | |
| Erie County Hosp. Auth. Rev. (Saint Vincent Health Ctr. Proj.) Series 2010 B, 0.96% 4/7/17, LOC Manufacturers & Traders Trust Co., VRDN (a) | 1,000 | 1,000 | |
| Haverford Township School District Series 2009, 0.92% 4/7/17, LOC TD Banknorth, NA, VRDN (a) | 3,370 | 3,370 | |
| Indiana County Hosp. Auth. Series 2014 B, 0.96% 4/7/17, LOC PNC Bank NA, VRDN (a) | 3,400 | 3,400 | |
| Lancaster Indl. Dev. Auth. Rev.: | |||
| (Mennonite Home Proj.) 1.01% 4/7/17, LOC Manufacturers & Traders Trust Co., VRDN (a) | 505 | 505 | |
| (Willow Valley Retirement Proj.) Series 2009 B, 0.95% 4/7/17, LOC PNC Bank NA, VRDN (a) | 3,855 | 3,855 | |
| Washington County Hosp. Auth. Rev. (Monongahela Valley Hosp. Proj.): | |||
| Series 2011 A, 0.94% 4/7/17, LOC PNC Bank NA, VRDN (a) | 2,540 | 2,540 | |
| Series 2011 B, 0.94% 4/7/17, LOC PNC Bank NA, VRDN (a) | 3,395 | 3,395 | |
| Westmoreland County Indl. Dev. Auth. Rev. (Excela Health Proj.) Series 2010 B, 0.94% 4/7/17, LOC PNC Bank NA, VRDN (a) | 1,000 | 1,000 | |
| 32,615 | |||
| Tennessee - 1.1% | |||
| Clarksville Pub. Bldg. Auth. Rev. (Tennessee Muni. Bond Fund Proj.): | |||
| Series 1994, 0.96% 4/7/17, LOC Bank of America NA, VRDN (a) | 1,845 | 1,845 | |
| Series 2003, 1% 4/3/17, LOC Bank of America NA, VRDN (a) | 5,210 | 5,210 | |
| Series 2004, 1% 4/3/17, LOC Bank of America NA, VRDN (a) | 1,700 | 1,700 | |
| Series 2008, 1% 4/3/17, LOC Bank of America NA, VRDN (a) | 7,200 | 7,200 | |
| Montgomery County Pub. Bldg. Auth. Pooled Fing. Rev. (Tennessee County Ln. Pool Prog.): | |||
| Series 2004, 1% 4/3/17, LOC Bank of America NA, VRDN (a) | 3,150 | 3,150 | |
| Series 2006, 1% 4/3/17, LOC Bank of America NA, VRDN (a) | 5,000 | 5,000 | |
| 24,105 | |||
| Texas - 4.9% | |||
| Dallas Performing Arts Cultural Facilities Corp. Cultural Facility Rev. (Dallas Ctr. For The Performing Arts Foundation, Inc. Proj.) Series 2008 A, 0.91% 4/7/17, LOC Bank of America NA, VRDN (a) | 8,250 | 8,250 | |
| FNMA Texas Dept. of Hsg. & Cmnty. Affairs Multi-family Hsg. Rev. Series 2003, 0.9% 4/7/17, LOC Freddie Mac, VRDN (a) | 1,900 | 1,900 | |
| Harris County Health Facilities Dev. Corp. Rev. (Saint Dominic Village Proj.) Series 2000, 0.99% 4/7/17, LOC JPMorgan Chase Bank, VRDN (a) | 5,425 | 5,425 | |
| Harris County Hosp. District Rev. Series 2010, 0.92% 4/7/17, LOC JPMorgan Chase Bank, VRDN (a) | 1,980 | 1,980 | |
| Houston Util. Sys. Rev. Series 2004 B3, 0.92% 4/7/17, LOC Sumitomo Mitsui Banking Corp., VRDN (a) | 14,250 | 14,250 | |
| Port Arthur Nav District Exempt Facilities (Var-Total Petrochemicals Proj.) Series 2009, 0.92% 4/7/17 (Total SA Guaranteed), VRDN (a) | 400 | 400 | |
| Port Arthur Navigation District Envir. Facilities Rev. (Motiva Enterprises LLC Proj.): | |||
| Series 2001 A, 1.15% 4/3/17, VRDN (a) | 12,150 | 12,150 | |
| Series 2009 A, 1.15% 4/3/17, VRDN (a) | 5,200 | 5,200 | |
| Series 2009 B, 1.16% 4/3/17, VRDN (a) | 1,800 | 1,800 | |
| Series 2009 C, 1.16% 4/3/17, VRDN (a) | 14,400 | 14,400 | |
| Series 2010 C, 1.16% 4/3/17, VRDN (a) | 300 | 300 | |
| Series 2010 D: | |||
| 1.15% 4/3/17, VRDN (a) | 535 | 535 | |
| 1.16% 4/3/17, VRDN (a) | 1,000 | 1,000 | |
| Port Arthur Navigation District Indl. Dev. Corp. Exempt Facilities Rev.: | |||
| (Air Products Proj.) Series 2012, 0.92% 4/7/17 (Total SA Guaranteed), VRDN (a) | 1,600 | 1,600 | |
| (Total Petrochemicals & Refining U.S.A., Inc. Proj.) Series 2012 B, 0.92% 4/7/17 (Total SA Guaranteed), VRDN (a) | 900 | 900 | |
| (Total Petrochemicals and Refining U.S.A., Inc. Proj.) Series 2012 A, 0.92% 4/7/17 (Total SA Guaranteed), VRDN (a) | 4,100 | 4,100 | |
| Tarrant County Cultural Ed. Facilities Fin. Corp. Hosp. Rev. (Methodist Hospitals of Dallas Proj.) Series 2008, 0.91% 4/7/17, LOC JPMorgan Chase Bank, VRDN (a) | 4,880 | 4,880 | |
| Texas Gen. Oblig.: | |||
| (Texas Veterans Land Board Proj.) Series 2017, 0.88% 4/7/17 (Liquidity Facility Sumitomo Mitsui Banking Corp.), VRDN (a) | 22,925 | 22,925 | |
| Series 2015 B, 0.95% 4/7/17 (Liquidity Facility Mizuho Corporate Bank Ltd.), VRDN (a) | 8,000 | 8,000 | |
| 109,995 | |||
| Washington - 0.3% | |||
| King County Swr. Rev. Series 2001 A, 0.95% 4/7/17, LOC Landesbank Hessen-Thuringen, VRDN (a) | 7,200 | 7,200 | |
| West Virginia - 0.6% | |||
| West Virginia Hosp. Fin. Auth. Hosp. Rev. (Cabell Huntington Hosp. Proj.) Series 2008 B, 0.96% 4/7/17, LOC Branch Banking & Trust Co., VRDN (a) | 14,400 | 14,400 | |
| Wyoming - 0.1% | |||
| Converse County Poll. Cont. Rev. (PacifiCorp Proj.) Series 1994, 0.98% 4/7/17, VRDN (a) | 1,400 | 1,400 | |
| Lincoln County Poll. Cont. Rev. (PacifiCorp Proj.) Series 1994, 0.98% 4/7/17, VRDN (a) | 600 | 600 | |
| 2,000 | |||
| TOTAL VARIABLE RATE DEMAND NOTE | |||
| (Cost $1,200,975) | 1,200,975 | ||
| Tender Option Bond - 15.4% | |||
| Alabama - 0.2% | |||
| Alabama Spl. Care Facilities Fing. Auth. Birmingham Rev. Participating VRDN Series 16 ZM0206, 0.94% 4/7/17 (Liquidity Facility Morgan Stanley Bank, West Valley City Utah) (a)(c) | 4,000 | 4,000 | |
| Arizona - 0.5% | |||
| Maricopa County Indl. Dev. Auth. Rev. Participating VRDN Series Floaters XF 05 19, 0.94% 4/7/17 (Liquidity Facility JPMorgan Chase Bank) (a)(c) | 1,900 | 1,900 | |
| Phoenix Civic Impt. Corp. Wtr. Sys. Rev. Participating VRDN Series Floaters XM 04 20, 0.94% 4/7/17 (Liquidity Facility JPMorgan Chase Bank) (a)(c) | 3,500 | 3,500 | |
| Rowan Univ. Participating VRDN Series 2016 XF 2337, 1.01% 4/7/17 (Liquidity Facility Barclays Bank PLC) (a)(c) | 520 | 520 | |
| Salt River Proj. Agricultural Impt. & Pwr. District Elec. Sys. Rev.: | |||
| Bonds Series 2016 22, 0.98%, tender 4/6/17 (Liquidity Facility U.S. Bank NA, Cincinnati) (a)(c) | 1,200 | 1,200 | |
| Participating VRDN Series 16 XM 02 45, 0.94% 4/7/17 (Liquidity Facility JPMorgan Chase Bank) (a)(c) | 3,605 | 3,605 | |
| 10,725 | |||
| California - 0.4% | |||
| Dignity Health Participating VRDN Series 17 04, 0.99% 4/7/17 (Liquidity Facility Barclays Bank PLC) (a)(c) | 1,800 | 1,800 | |
| Los Angeles Hbr. Dept. Rev. Bonds Series WF 10 40C, 1.21%, tender 8/31/17 (Liquidity Facility Wells Fargo Bank NA) (a)(c)(d) | 1,400 | 1,400 | |
| Rancho Wtr. District Fing. Auth. Rev. Participating VRDN Series 16 ZF0342, 0.98% 4/7/17 (Liquidity Facility Bank of America NA) (a)(c) | 4,980 | 4,980 | |
| 8,180 | |||
| Colorado - 0.7% | |||
| Cherry Creek School District No. 5 Gen. Oblig. Bonds Series Solar 17 3, 1.11%, tender 4/20/17 (Liquidity Facility U.S. Bank NA, Cincinnati) (a)(c) | 600 | 600 | |
| Colorado Health Facilities Auth. Retirement Hsg. Rev. Participating VRDN Series Putters 1390, 0.94% 4/7/17 (Liquidity Facility Citibank NA) (a)(c) | 1,245 | 1,245 | |
| Colorado Health Facilities Auth. Rev. Participating VRDN: | |||
| Series Floaters XF 22 41, 1.11% 4/7/17 (Liquidity Facility Citibank NA) (a)(c) | 600 | 600 | |
| Series ZF 04 17, 1.06% 4/7/17 (Liquidity Facility JPMorgan Chase Bank) (a)(c) | 200 | 200 | |
| Colorado Reg'l. Trans. District Sales Tax Rev. Participating VRDN: | |||
| Series EGL 16 0004, 0.95% 4/7/17 (Liquidity Facility Citibank NA) (a)(c) | 4,900 | 4,900 | |
| Series Floaters 16 XF1031, 1.06% 4/7/17 (Liquidity Facility Deutsche Bank AG New York Branch) (a)(c) | 2,500 | 2,500 | |
| Denver City & County Wastewtr. Dept. of Pub. Works Bonds Series 2016 12, 0.98%, tender 4/6/17 (Liquidity Facility U.S. Bank NA, Cincinnati) (a)(c) | 1,300 | 1,300 | |
| Univ. of Colorado Enterprise Sys. Rev.: | |||
| Bonds Series RBC E 55, 1.11%, tender 8/1/17 (Liquidity Facility Royal Bank of Canada) (a)(c)(d) | 3,200 | 3,200 | |
| Participating VRDN Series XM 03 05, 0.94% 4/7/17 (Liquidity Facility Royal Bank of Canada) (a)(c) | 1,800 | 1,800 | |
| 16,345 | |||
| District Of Columbia - 0.4% | |||
| Children's Nat'l. Med. Ctr., Participating VRDN Series 2015 XF 1047, 1.08% 4/7/17 (Liquidity Facility Deutsche Bank AG New York Branch) (a)(c) | 900 | 900 | |
| District of Columbia Income Tax Rev. Participating VRDN: | |||
| Series Floaters XM 04 12, 0.94% 4/7/17 (Liquidity Facility JPMorgan Chase Bank) (a)(c) | 7,155 | 7,155 | |
| Series XF 23 41, 0.98% 4/7/17 (Liquidity Facility Barclays Bank PLC) (a)(c) | 300 | 300 | |
| 8,355 | |||
| Florida - 0.7% | |||
| Brooks Health Sys. Participating VRDN Series XG 0064, 1.07% 4/7/17 (Liquidity Facility Deutsche Bank AG New York Branch) (a)(c) | 2,500 | 2,500 | |
| Central Florida Expressway Bonds Series RBC E 62, 1.11%, tender 8/1/17 (Liquidity Facility Royal Bank of Canada) (a)(c)(d) | 2,695 | 2,695 | |
| Florida Board of Ed. Pub. Ed. Cap. Outlay Participating VRDN Series ROC II R 12017, 0.94% 4/7/17 (Liquidity Facility Citibank NA) (a)(c) | 1,900 | 1,900 | |
| Florida Dept. of Trans. Tpk. Rev. Bonds Series Solar 17 02, 0.98%, tender 4/6/17 (Liquidity Facility U.S. Bank NA, Cincinnati) (a)(c) | 2,800 | 2,800 | |
| Miami-Dade County Aviation Rev. Participating VRDN Series XG 00 65 1.08% 4/7/17 (Liquidity Facility Deutsche Bank AG New York Branch) (a)(c) | 1,400 | 1,400 | |
| Miami-Dade County Expressway Auth. Participating VRDN Series XG 00 99, 1.09% 4/7/17 (Liquidity Facility Deutsche Bank AG New York Branch) (a)(c) | 1,300 | 1,300 | |
| Miami-Dade County Gen. Oblig. Participating VRDN Series XM 04 70, 0.94% 4/7/17 (Liquidity Facility JPMorgan Chase Bank) (a)(c) | 1,000 | 1,000 | |
| Palm Beach County Solid Waste Auth. Rev. Participating VRDN Series ROC II 14003, 0.94% 4/7/17 (Liquidity Facility Citibank NA) (a)(c) | 1,670 | 1,670 | |
| RBC Muni. Products, Inc. Trust Bonds Series E70, 1.11%, tender 8/1/17 (Liquidity Facility Royal Bank of Canada) (a)(c)(d) | 700 | 700 | |
| 15,965 | |||
| Georgia - 0.4% | |||
| Clarke County Hosp. Auth. Participating VRDN Series 2017 ZF 2413, 0.96% 4/7/17 (Liquidity Facility Barclays Bank PLC) (a)(c) | 900 | 900 | |
| Fulton County Gen. Oblig. Bonds Series 2017 07, 0.98%, tender 4/6/17 (Liquidity Facility U.S. Bank NA, Cincinnati) (a)(c) | 1,300 | 1,300 | |
| Private Colleges & Univs. Auth. Rev. Emory Univ. Participating VRDN Series Floaters 16 XF0517, 0.95% 4/7/17 (Liquidity Facility Royal Bank of Canada) (a)(c) | 7,500 | 7,500 | |
| 9,700 | |||
| Hawaii - 0.0% | |||
| Eclipse Fdg. Trust Various States Bonds Series 2016, 0.98%, tender 4/6/17 (Liquidity Facility U.S. Bank NA, Cincinnati) (a)(c) | 605 | 605 | |
| Illinois - 1.0% | |||
| City of Chicago Gen. Oblig. Bonds Participating VRDN Series XF 23 42, 1.16% 4/7/17 (Liquidity Facility Barclays Bank PLC) (a)(c) | 100 | 100 | |
| Illinois Fin. Auth. Rev. Participating VRDN: | |||
| Series Putters 0022, 0.94% 4/7/17 (Liquidity Facility JPMorgan Chase Bank) (a)(c) | 3,795 | 3,795 | |
| Series Putters 3379, 0.94% 4/7/17 (Liquidity Facility JPMorgan Chase Bank) (a)(c) | 4,995 | 4,995 | |
| Illinois Sales Tax Rev. Participating VRDN Series XF 24 06, 1.01% 4/7/17 (Liquidity Facility Barclays Bank PLC) (a)(c) | 700 | 700 | |
| Illinois Toll Hwy. Auth. Toll Hwy. Rev. Participating VRDN: | |||
| Series 15 XF0277, 0.99% 4/7/17 (Liquidity Facility JPMorgan Chase Bank) (a)(c) | 1,500 | 1,500 | |
| Series 15 XF2202, 0.94% 4/7/17 (Liquidity Facility Citibank NA) (a)(c) | 1,150 | 1,150 | |
| Series 15 XM 0078, 0.96% 4/7/17 (Liquidity Facility Royal Bank of Canada) (a)(c) | 5,180 | 5,180 | |
| Series Floaters XL 00 41, 0.94% 4/7/17 (Liquidity Facility Morgan Stanley Bank, West Valley City Utah) (a)(c) | 1,100 | 1,100 | |
| Series XF 23 98, 0.94% 4/7/17 (Liquidity Facility Citibank NA) (a)(c) | 2,780 | 2,780 | |
| Series ZF 24 04, 0.94% 4/7/17 (Liquidity Facility Citibank NA) (a)(c) | 1,635 | 1,635 | |
| The County of Cook Participating VRDN Series XF 23 13, 1.06% 4/7/17 (Liquidity Facility Barclays Bank PLC) (a)(c) | 300 | 300 | |
| Will Cnty. Gen. Oblig. Participating VRDN Series Floaters ZF 05 11, 0.97% 4/7/17 (Liquidity Facility Toronto-Dominion Bank) (a)(c) | 500 | 500 | |
| 23,735 | |||
| Indiana - 0.3% | |||
| Hamilton County HealthCare Facilities Rev. Participating VRDN Series XF 10 26, 1.09% 4/7/17 (Liquidity Facility Deutsche Bank AG New York Branch) (a)(c) | 2,000 | 2,000 | |
| Indiana Health & Edl. Facilities Fing. Auth. Rev. Bonds Series 16 E71, 1.11%, tender 6/1/17 (Liquidity Facility Royal Bank of Canada) (a)(c)(d) | 5,400 | 5,400 | |
| 7,400 | |||
| Kansas - 0.1% | |||
| Univ. of Kansas Hosp. Auth. Health Facilities Rev. Participating VRDN Series XF 10 51, 1.07% 4/7/17 (Liquidity Facility Deutsche Bank AG New York Branch) (a)(c) | 1,200 | 1,200 | |
| Louisiana - 0.5% | |||
| Louisiana Gas & Fuel Tax Rev. Participating VRDN Series EGL 14 0049, 0.96% 4/7/17 (Liquidity Facility Citibank NA) (a)(c) | 8,500 | 8,500 | |
| Louisiana Local Govt. Envir. Facilities Participating VRDN Series 2016 XF 2336, 1.01% 4/7/17 (Liquidity Facility Barclays Bank PLC) (a)(c) | 1,860 | 1,860 | |
| 10,360 | |||
| Maryland - 0.1% | |||
| Baltimore County Gen. Oblig. Bonds Series Solar 17 22, 0.96%, tender 4/6/17 (Liquidity Facility U.S. Bank NA, Cincinnati) (a)(c) | 1,300 | 1,300 | |
| Maryland Health & Higher Ed. Facilities Auth. Rev. Participating VRDN Series XF 10 21, 1.14% 4/7/17 (Liquidity Facility Deutsche Bank AG New York Branch) (a)(c) | 2,000 | 2,000 | |
| 3,300 | |||
| Massachusetts - 0.4% | |||
| Massachusetts Gen. Oblig. Participating VRDN: | |||
| Series Clipper 07 39, 0.94% 4/7/17 (Liquidity Facility State Street Bank & Trust Co., Boston) (a)(c) | 6,200 | 6,200 | |
| Series Clipper 07 41, 0.94% 4/7/17 (Liquidity Facility State Street Bank & Trust Co., Boston) (a)(c) | 1,300 | 1,300 | |
| Massachusetts School Bldg. Auth. Dedicated Sales Tax Rev. Participating VRDN Series MS 30911, 0.94% 4/7/17 (Liquidity Facility Morgan Stanley Bank, West Valley City Utah) (a)(c) | 2,630 | 2,630 | |
| 10,130 | |||
| Michigan - 0.4% | |||
| Michigan Bldg. Auth. Rev. Participating VRDN Series Floaters XM 03 92, 0.94% 4/7/17 (Liquidity Facility Morgan Stanley Bank, West Valley City Utah) (a)(c) | 300 | 300 | |
| Michigan Fin. Auth. Rev. Participating VRDN Series 15 XF0126, 0.94% 4/7/17 (Liquidity Facility JPMorgan Chase Bank) (a)(c) | 2,000 | 2,000 | |
| Ottawa County Wtr. Supply Sys. Rev. Participating VRDN Series 15 XF0113, 0.94% 4/7/17 (Liquidity Facility JPMorgan Chase Bank) (a)(c) | 6,625 | 6,625 | |
| 8,925 | |||
| Nebraska - 0.1% | |||
| Douglas County School District #1 Bonds Series 2016 27, 1.11%, tender 6/29/17 (Liquidity Facility U.S. Bank NA, Cincinnati) (a)(c)(d) | 2,200 | 2,200 | |
| Omaha Pub. Pwr. District Elec. Rev. Participating VRDN Series Floaters XX 10 04, 0.97% 4/7/17 (Liquidity Facility Barclays Bank PLC) (a)(c) | 600 | 600 | |
| 2,800 | |||
| Nevada - 0.4% | |||
| Clark County Fuel Tax: | |||
| Bonds Series Solar 17 25, 1.09%, tender 6/22/17 (Liquidity Facility U.S. Bank NA, Cincinnati) (a)(c) | 1,000 | 1,000 | |
| Participating VRDN: | |||
| ROC II R 11836, 0.94% 4/7/17 (Liquidity Facility Citibank NA) (a)(c) | 3,450 | 3,450 | |
| Series ROC II R 11507, 0.94% 4/7/17 (Liquidity Facility Citibank NA) (a)(c) | 5,345 | 5,345 | |
| 9,795 | |||
| New Jersey - 0.0% | |||
| New Jersey St. Trans. Trust Fund Auth. Participating VRDN Series Floaters 16 XF1059, 1.1% 4/7/17 (Liquidity Facility Deutsche Bank AG New York Branch) (a)(c) | 300 | 300 | |
| New York - 0.9% | |||
| New York City Gen. Oblig. Participating VRDN Series 15 ZF0198, 0.94% 4/7/17 (Liquidity Facility JPMorgan Chase Bank) (a)(c) | 3,690 | 3,690 | |
| New York City Muni. Wtr. Fin. Auth. Wtr. & Swr. Sys. Rev. Participating VRDN Series ROC II R 11916, 0.94% 4/7/17 (Liquidity Facility Citibank NA) (a)(c) | 1,235 | 1,235 | |
| New York City Transitional Fin. Auth. Rev. Participating VRDN: | |||
| Series ROC II R 11902, 0.94% 4/7/17 (Liquidity Facility Citibank NA) (a)(c) | 3,800 | 3,800 | |
| Series ROC II R 14022, 0.94% 4/7/17 (Liquidity Facility Citibank NA) (a)(c) | 2,185 | 2,185 | |
| New York Envir. Facilities Corp. Clean Wtr. & Drinking Wtr. Participating VRDN Series 16 XM0215, 0.94% 4/7/17 (Liquidity Facility JPMorgan Chase Bank) (a)(c) | 4,425 | 4,425 | |
| New York Envir. Facilities Corp. State Personal Income Tax Rev. Participating VRDN Series 15 XF0086, 0.94% 4/7/17 (Liquidity Facility JPMorgan Chase Bank) (a)(c) | 3,185 | 3,185 | |
| New York Thruway Auth. Second Gen. Hwy. & Bridge Trust Fund Participating VRDN Series ROC II R 11997, 0.94% 4/7/17 (Liquidity Facility Citibank NA) (a)(c) | 2,000 | 2,000 | |
| 20,520 | |||
| North Carolina - 1.1% | |||
| Charlotte Wtr. & Swr. Sys. Rev. Participating VRDN Series ROC II R 11906, 0.94% 4/7/17 (Liquidity Facility Citibank NA) (a)(c) | 2,695 | 2,695 | |
| North Carolina Cap. Facilities Fin. Agcy. Rev. Participating VRDN: | |||
| Series EGL 14 0051, 0.95% 4/7/17 (Liquidity Facility Citibank NA) (a)(c) | 9,500 | 9,500 | |
| Series EGL 14 0052, 0.95% 4/7/17 (Liquidity Facility Citibank NA) (a)(c) | 2,850 | 2,850 | |
| Series MS 15 ZM0105, 0.94% 4/7/17 (Liquidity Facility Morgan Stanley Bank, West Valley City Utah) (a)(c) | 2,185 | 2,185 | |
| North Carolina Gen. Oblig. Participating VRDN Series 15 XF0140, 0.94% 4/7/17 (Liquidity Facility JPMorgan Chase Bank) (a)(c) | 1,000 | 1,000 | |
| North Carolina Ltd. Oblig. Participating VRDN Series ROC 14089, 0.94% 4/7/17 (Liquidity Facility Citibank NA) (a)(c) | 1,000 | 1,000 | |
| North Carolina Med. Care Commission Participating VRDN Series XM 02 98, 0.94% 4/7/17 (Liquidity Facility Royal Bank of Canada) (a)(c) | 4,765 | 4,765 | |
| Raleigh Combined Enterprise Sys. Rev. Bonds Series 2016 13, 0.98%, tender 4/6/17 (Liquidity Facility U.S. Bank NA, Cincinnati) (a)(c) | 600 | 600 | |
| 24,595 | |||
| Ohio - 0.2% | |||
| Hamilton County HealthCare Facilities Rev. Participating VRDN Series XF 10 50, 1.07% 4/7/17 (Liquidity Facility Deutsche Bank AG New York Branch) (a)(c) | 400 | 400 | |
| Lucas County Gen. Oblig. Bonds Series 2016 26, 1.11%, tender 6/29/17 (Liquidity Facility U.S. Bank NA, Cincinnati) (a)(c)(d) | 700 | 700 | |
| Ohio Higher Edl. Facility Commission Rev. Participating VRDN Series 2017, 1.13% 5/12/17 (Liquidity Facility Barclays Bank PLC) (a)(b)(c) | 1,000 | 1,000 | |
| Ohio Hosp. Facilities Rev. Participating VRDN Series 2015 XF0105, 0.94% 4/7/17 (Liquidity Facility JPMorgan Chase Bank) (a)(c) | 1,600 | 1,600 | |
| 3,700 | |||
| Oklahoma - 0.0% | |||
| Eclipse Fdg. Trust Various States Bonds Series 2016, 0.98%, tender 4/6/17 (Liquidity Facility U.S. Bank NA, Cincinnati) (a)(c) | 600 | 600 | |
| Oregon - 0.2% | |||
| Oregon Gen. Oblig. Participating VRDN Series ROC II R 11949, 0.94% 4/7/17 (Liquidity Facility Citibank NA) (a)(c) | 3,000 | 3,000 | |
| Portland Wtr. Sys. Rev. Bonds Series 2016 24, 1.21%, tender 6/8/17 (Liquidity Facility U.S. Bank NA, Cincinnati) (a)(c) | 890 | 890 | |
| 3,890 | |||
| Pennsylvania - 0.5% | |||
| Geisinger Auth. Health Sys. Rev. Participating VRDN Series 15 ZF0174, 0.94% 4/7/17 (Liquidity Facility JPMorgan Chase Bank) (a)(c) | 1,000 | 1,000 | |
| Pennsylvania Health & Edl. Facilities Fing. Auth. Rev. Bonds Series E72, 1.11%, tender 6/1/17 (Liquidity Facility Royal Bank of Canada) (a)(c)(d) | 5,300 | 5,300 | |
| Pennsylvania Higher Edl. Facilities Auth. Rev. Bonds Series WF 11 26C, 1.21%, tender 8/10/17 (Liquidity Facility Wells Fargo Bank NA) (a)(c)(d) | 1,500 | 1,500 | |
| Philadelphia Auth. For Indl. Dev. Participating VRDN Series Putters 14 XM0005, 0.94% 4/7/17 (Liquidity Facility JPMorgan Chase Bank) (a)(b)(c) | 1,000 | 1,000 | |
| Univ. of Pittsburgh Med. Ctr. Bonds Series RBC E53, 1.11%, tender 7/3/17 (Liquidity Facility Royal Bank of Canada) (a)(c)(d) | 2,455 | 2,455 | |
| 11,255 | |||
| South Carolina - 0.4% | |||
| Columbia Wtrwks. & Swr. Rev. Bonds Series 2016 21, 0.98%, tender 4/6/17 (Liquidity Facility U.S. Bank NA, Cincinnati) (a)(c) | 1,000 | 1,000 | |
| Lancaster County School District Bonds Series Solar 17 21, 1.09%, tender 6/8/17 (Liquidity Facility U.S. Bank NA, Cincinnati) (a)(c) | 600 | 600 | |
| South Carolina Pub. Svc. Auth. Rev. Participating VRDN Series Floaters XM 03 84, 1.03% 4/7/17 (Liquidity Facility JPMorgan Chase Bank) (a)(c) | 3,130 | 3,130 | |
| South Carolina St. Pub. Svc. Auth. Rev. Participating VRDN Series XG 0046, 1% 4/7/17 (Liquidity Facility Toronto-Dominion Bank) (a)(c) | 4,100 | 4,100 | |
| 8,830 | |||
| Tennessee - 0.1% | |||
| Rutherford County Health & Edl. Facilities Board Rev. Participating VRDN Series 2014 ZF0208, 1.01% 4/7/17 (Liquidity Facility JPMorgan Chase Bank) (a)(c) | 2,500 | 2,500 | |
| Texas - 3.0% | |||
| Austin Wtr. & Wastewtr. Sys. Rev. Participating VRDN Series ROC II R 11992, 0.94% 4/7/17 (Liquidity Facility Citibank NA) (a)(c) | 3,375 | 3,375 | |
| City of Dallas Wtrwks. & Swr. Sys. Rev. Participating VRDN Series XM 02 88, 0.94% 4/7/17 (Liquidity Facility JPMorgan Chase Bank) (a)(c) | 5,000 | 5,000 | |
| Conroe Independent School District Bonds Series 2016 15, 0.98%, tender 4/6/17 (Liquidity Facility U.S. Bank NA, Cincinnati) (a)(c) | 1,300 | 1,300 | |
| Cypress-Fairbanks Independent School District Bonds Series 2016 7, 0.98%, tender 4/6/17 (Liquidity Facility U.S. Bank NA, Cincinnati) (a)(c) | 800 | 800 | |
| Dallas Wtrwks. & Swr. Sys. Rev. Participating VRDN Series Putters 3227, 0.94% 4/7/17 (Liquidity Facility JPMorgan Chase Bank) (a)(c) | 2,995 | 2,995 | |
| Friendswood Independent School District Participating VRDN Series 16 XM 02 40, 0.94% 4/7/17 (Liquidity Facility JPMorgan Chase Bank) (a)(c) | 1,300 | 1,300 | |
| Harris County Gen. Oblig. Participating VRDN Series Clipper 07 46, 0.94% 4/7/17 (Liquidity Facility State Street Bank & Trust Co., Boston) (a)(c) | 36,800 | 36,800 | |
| Harris County Health Facilities Dev. Corp. Rev. Participating VRDN Sewries 16 ZF0312, 0.94% 4/7/17 (Liquidity Facility JPMorgan Chase Bank) (a)(c) | 10,485 | 10,485 | |
| North Texas Muni. Wtr. District Wtr. Sys. Rev. Bonds Series 2016 14, 0.98%, tender 4/6/17 (Liquidity Facility U.S. Bank NA, Cincinnati) (a)(c) | 1,295 | 1,295 | |
| Tarrant County Cultural Ed. Facilities Fin. Corp. Rev. Participating VRDN Series Floaters XM 04 02, 0.94% 4/7/17 (Liquidity Facility Morgan Stanley Bank, West Valley City Utah) (a)(c) | 800 | 800 | |
| Texas Gen. Oblig. Participating VRDN Series Floaters XM 04 04, 0.94% 4/7/17 (Liquidity Facility Wells Fargo Bank NA) (a)(c) | 3,750 | 3,750 | |
| 67,900 | |||
| Utah - 0.5% | |||
| Riverton Hosp. Rev.: | |||
| Bonds Series WF 11 35C, 1.21%, tender 8/3/17 (Liquidity Facility Wells Fargo Bank NA) (a)(c)(d) | 5,530 | 5,530 | |
| Participating VRDN Series RBC ZF 0274, 0.96% 4/7/17 (Liquidity Facility Royal Bank of Canada) (a)(c) | 1,400 | 1,400 | |
| Utah County Hosp. Rev. Participating VRDN Series ZF 04 96, 0.94% 4/7/17 (Liquidity Facility JPMorgan Chase Bank) (a)(c) | 3,600 | 3,600 | |
| 10,530 | |||
| Vermont - 0.1% | |||
| Vermont Edl. and Health Buildings Fing. Agcy. Participating VRDN Series XF 23 61, 1.01% 4/7/17 (Liquidity Facility Barclays Bank PLC) (a)(c) | 2,850 | 2,850 | |
| Virginia - 0.0% | |||
| Univ. of Virginia Gen. Rev. Bonds Series Solar 17 17, 1.09%, tender 5/25/17 (Liquidity Facility U.S. Bank NA, Cincinnati) (a)(c) | 600 | 600 | |
| Virginia Gen. Oblig. Bonds Series 2016 11, 0.98%, tender 4/6/17 (Liquidity Facility U.S. Bank NA, Cincinnati) (a)(c) | 500 | 500 | |
| 1,100 | |||
| Washington - 1.5% | |||
| Central Puget Sound Reg'l. Trans. Auth. Sales & Use Tax Rev. Participating VRDN Series 15 XF2158, 0.94% 4/7/17 (Liquidity Facility Citibank NA) (a)(c) | 2,885 | 2,885 | |
| King County Swr. Rev. Participating VRDN: | |||
| Series EGL 14 0047, 0.95% 4/7/17 (Liquidity Facility Citibank NA) (a)(c) | 1,000 | 1,000 | |
| Series Floater 3090, 0.94% 4/7/17 (Liquidity Facility Cr. Suisse AG) (a)(c) | 12,021 | 12,021 | |
| Seattle Muni. Lt. & Pwr. Rev. Bonds: | |||
| Series Solar 17 19, 1.09%, tender 5/25/17 (Liquidity Facility U.S. Bank NA, Cincinnati) (a)(c) | 600 | 600 | |
| Series WF 11-18C, 1.21%, tender 8/10/17 (Liquidity Facility Wells Fargo Bank NA) (a)(c)(d) | 600 | 600 | |
| Seattle Wtr. Sys. Rev. Bonds Series Solar 17 5, 1.11%, tender 4/27/17 (Liquidity Facility U.S. Bank NA, Cincinnati) (a)(c) | 1,200 | 1,200 | |
| Washington Gen. Oblig.: | |||
| Bonds Series WF 11-16C, 1.21%, tender 8/17/17 (Liquidity Facility Wells Fargo Bank NA) (a)(c)(d) | 2,500 | 2,500 | |
| Participating VRDN: | |||
| Series 15 ZM0121, 0.94% 4/7/17 (Liquidity Facility Royal Bank of Canada) (a)(c) | 1,250 | 1,250 | |
| Series 16 XM0219, 0.94% 4/7/17 (Liquidity Facility JPMorgan Chase Bank) (a)(c) | 4,335 | 4,335 | |
| Washington Health Care Facilities Auth. Rev. Participating VRDN Series 15 XF0132, 0.94% 4/7/17 (Liquidity Facility JPMorgan Chase Bank) (a)(c) | 4,625 | 4,625 | |
| Washington State Motor Vehicle Fuel Tax Auth. Gen. Oblig. Participating VRDN Series XL 00 39, 0.94% 4/7/17 (Liquidity Facility JPMorgan Chase Bank) (a)(c) | 2,530 | 2,530 | |
| 33,546 | |||
| Wisconsin - 0.3% | |||
| Wisconsin Gen. Oblig. Participating VRDN: | |||
| Series Clipper 09 36, 0.95% 4/7/17 (Liquidity Facility State Street Bank & Trust Co., Boston) (a)(c) | 1,000 | 1,000 | |
| Series Clipper 09 53, 0.95% 4/7/17 (Liquidity Facility State Street Bank & Trust Co., Boston) (a)(c) | 800 | 800 | |
| Wisconsin Health & Edl. Facilities Participating VRDN Series XM 04 79, 0.94% 4/7/17 (Liquidity Facility Morgan Stanley Bank, West Valley City Utah) (a)(c) | 4,500 | 4,500 | |
| 6,300 | |||
| TOTAL TENDER OPTION BOND | |||
| (Cost $349,936) | 349,936 | ||
| Other Municipal Security - 22.8% | |||
| Alabama - 0.3% | |||
| Huntsville Health Care Auth. Rev.: | |||
| 0.81% 5/22/17, CP | 3,000 | 3,000 | |
| 0.83% 6/5/17, CP | 3,600 | 3,600 | |
| 6,600 | |||
| Arizona - 0.6% | |||
| Arizona Health Facilities Auth. Rev. Bonds (Banner Health Sys. Proj.) Series 2008 D, 5.5% 1/1/18 (Pre-Refunded to 1/1/18 @ 100) | 1,425 | 1,472 | |
| Arizona Trans. Board Excise Tax Rev. Bonds Series 2007, 5% 7/1/17 (Pre-Refunded to 7/1/17 @ 100) | 5,540 | 5,596 | |
| Salt River Proj. Agricultural Impt. & Pwr. District Elec. Sys. Rev. Series C: | |||
| 0.72% 4/6/17, CP | 2,600 | 2,600 | |
| 0.81% 4/19/17, CP | 4,300 | 4,300 | |
| 13,968 | |||
| California - 0.6% | |||
| California Gen. Oblig. Series 11A2, 0.81% 6/5/17, LOC Royal Bank of Canada, CP | 1,500 | 1,500 | |
| California Statewide Cmntys. Dev. Auth. Gas Supply Rev. Bonds: | |||
| Series 2010 A, 1.02%, tender 7/3/17 (Liquidity Facility Royal Bank of Canada) (a) | 5,900 | 5,900 | |
| Series 2010 B, 1.02%, tender 7/3/17 (Liquidity Facility Royal Bank of Canada) (a) | 2,560 | 2,560 | |
| Los Angeles Dept. of Wtr. & Pwr. Rev. Series 2016, 0.99% 4/4/17 (Liquidity Facility Royal Bank of Canada), CP | 3,000 | 3,000 | |
| 12,960 | |||
| Colorado - 1.1% | |||
| Colorado Ed. Ln. Prog. TRAN: | |||
| Series 2016 A: | |||
| 2% 6/29/17 | 3,750 | 3,760 | |
| 5% 6/29/17 | 5,400 | 5,453 | |
| Series 2016 B, 3% 6/29/17 | 2,800 | 2,815 | |
| Colorado Gen. Fdg. Rev. TRAN Series 2016 A, 2% 6/27/17 | 5,700 | 5,715 | |
| Colorado Springs Utils. Rev.: | |||
| Series A, 0.8% 6/15/17, LOC Bank of America NA, CP | 1,800 | 1,800 | |
| Series B, 0.73% 4/6/17, LOC Bank of America NA, CP | 4,900 | 4,900 | |
| 24,443 | |||
| Connecticut - 0.6% | |||
| Bethel Gen. Oblig. BAN Series 2017, 1.25% 10/17/17 | 1,155 | 1,157 | |
| Connecticut Gen. Oblig. Bonds: | |||
| Series 2013 A: | |||
| 0.96% 7/1/17 (a) | 1,000 | 1,000 | |
| 0.96% 1/1/18 (a) | 300 | 300 | |
| Series 2016 E, 2% 10/15/17 | 1,500 | 1,508 | |
| Series 2016 G, 4% 11/1/17 | 3,500 | 3,558 | |
| Connecticut Health & Edl. Facilities Auth. Rev. Bonds (Yale Univ. Proj.) Series S-2, 0.7% tender 4/5/17, CP mode | 1,500 | 1,500 | |
| Danbury Gen. Oblig. BAN Series 2016, 2% 7/20/17 | 1,800 | 1,806 | |
| Enfield Gen. Oblig. BAN Series 2016, 2% 8/9/17 | 1,600 | 1,607 | |
| Rocky Hill Gen. Oblig. BAN Series 2016, 1.5% 6/22/17 | 1,400 | 1,402 | |
| 13,838 | |||
| District Of Columbia - 0.3% | |||
| Metropolitan Washington Arpts. Auth. Dulles Toll Road Rev.: | |||
| Series 01, 0.78% 6/6/17, LOC JPMorgan Chase Bank, CP | 2,500 | 2,500 | |
| Series 1, 0.77% 4/25/17, LOC JPMorgan Chase Bank, CP | 3,800 | 3,800 | |
| 6,300 | |||
| Florida - 1.5% | |||
| Florida Local Govt. Fin. Cmnty. Series 11A1: | |||
| 0.74% 4/4/17, LOC JPMorgan Chase Bank, CP | 5,700 | 5,700 | |
| 0.78% 5/4/17, LOC JPMorgan Chase Bank, CP | 6,100 | 6,100 | |
| Jacksonville Gen. Oblig. Series 04A, 0.8% 6/1/17, LOC Bank of America NA, CP | 4,900 | 4,900 | |
| Miami-Dade County Wtr. & Swr. Rev. Series A1, 0.8% 5/4/17, LOC Barclays Bank PLC, CP | 8,200 | 8,200 | |
| Polk County Indl. Dev. Auth. Health Sys. Rev. Bonds: | |||
| Series 2014 A, 1.21%, tender 10/27/17 (a) | 1,000 | 1,000 | |
| Series 2014 A1, 1.16%, tender 10/27/17 (a) | 3,800 | 3,800 | |
| Tampa Health Sys. Rev. Bonds Series 2012 B, 1.21%, tender 10/27/17 (a) | 5,300 | 5,300 | |
| 35,000 | |||
| Georgia - 1.3% | |||
| Atlanta Arpt. Rev.: | |||
| Series D1, 0.85% 6/30/17, LOC Bank of America NA, CP | 1,000 | 1,000 | |
| Series D3, 0.85% 6/30/17, LOC Bank of America NA, CP | 3,077 | 3,077 | |
| Series E1, 0.93% 6/30/17, LOC Bank of Tokyo-Mitsubishi UFJ Ltd., CP | 2,745 | 2,745 | |
| Series E3, 0.92% 6/30/17, LOC Bank of Tokyo-Mitsubishi UFJ Ltd., CP | 275 | 275 | |
| Atlanta Wtr. & Wastewtr. Rev. Series 15A1, 0.82% 4/10/17, LOC PNC Bank NA, CP | 2,900 | 2,900 | |
| Georgia Muni. Elec. Auth. Pwr. Rev.: | |||
| Bonds Series 85A, 0.75% tender 4/3/17, LOC Barclays Bank PLC, CP mode | 1,900 | 1,900 | |
| Series B: | |||
| 0.75% 4/7/17, LOC PNC Bank NA, CP | 4,800 | 4,800 | |
| 0.87% 5/18/17, LOC TD Banknorth, NA, CP | 2,700 | 2,700 | |
| Main Street Natural Gas, Inc. Georgia Gas Proj. Rev. Bonds: | |||
| Series 2010 A1, 1.02%, tender 6/1/17 (Liquidity Facility Royal Bank of Canada) (a) | 5,250 | 5,250 | |
| Series 2010 A2, 1.02%, tender 6/1/17 (Liquidity Facility Royal Bank of Canada) (a) | 5,680 | 5,680 | |
| 30,327 | |||
| Hawaii - 0.2% | |||
| Honolulu City & County Gen. Oblig.: | |||
| Series B1, 0.82% 6/6/17, LOC Sumitomo Mitsui Banking Corp., CP | 2,500 | 2,500 | |
| Series B2, 0.82% 6/6/17, LOC Sumitomo Mitsui Banking Corp., CP | 1,600 | 1,600 | |
| 4,100 | |||
| Illinois - 1.2% | |||
| Chicago O'Hare Int'l. Arpt. Rev. Bonds Series 2008 A, 5% 1/1/18 (Pre-Refunded to 1/1/18 @ 100) | 3,100 | 3,190 | |
| Illinois Fin. Auth. Ed. Rev. Series LOY, 0.8% 6/1/17, LOC PNC Bank NA, CP | 3,700 | 3,700 | |
| Illinois Fin. Auth. Rev. Bonds: | |||
| ( Hosp. Sisters Svcs., Inc. Proj.): | |||
| 0.81% tender 6/1/17, CP mode | 2,700 | 2,700 | |
| 0.87% tender 6/7/17, CP mode | 1,100 | 1,100 | |
| (Advocate Health Care Network Proj.) Series 2011 B, 1.21%, tender 10/27/17 (a) | 600 | 600 | |
| (Hosp. Sisters Svcs., Inc. Proj.): | |||
| Series 2012 H, 0.81% tender 7/6/17, CP mode | 4,485 | 4,485 | |
| Series 2012 I, 0.75% tender 4/6/17, CP mode | 4,200 | 4,200 | |
| 0.89% tender 8/3/17, CP mode | 1,600 | 1,600 | |
| 0.94% tender 8/3/17, CP mode | 2,800 | 2,800 | |
| Series E, 5%, tender 5/1/17 (a) | 285 | 286 | |
| Southwestern Ill Dev. Auth. Heal Bonds (Hosp. Sisters Svcs., Inc. Proj.): | |||
| 0.74% tender 4/5/17, CP mode | 1,100 | 1,100 | |
| 0.81% tender 6/5/17, CP mode | 1,600 | 1,600 | |
| 27,361 | |||
| Indiana - 0.5% | |||
| Indiana Fin. Auth. Rev. Bonds (Trinity Health Proj.) Series D-2, 0.72% tender 4/5/17, CP mode | 4,700 | 4,700 | |
| Indianapolis Gas Util. Sys. Rev.: | |||
| 0.77% 4/10/17, LOC JPMorgan Chase Bank, CP | 2,800 | 2,800 | |
| 0.77% 4/10/17, LOC JPMorgan Chase Bank, CP | 2,800 | 2,800 | |
| 10,300 | |||
| Kansas - 0.2% | |||
| Wyandotte County/Kansas City Unified Govt. Gen. Oblig. BAN Series 2017-I, 1.5% 3/1/18 | 5,100 | 5,114 | |
| Kentucky - 0.1% | |||
| Jefferson County Poll. Cont. Rev. Bonds ( Louisville Gas & Elec. Co. Proj.) 0.87% tender 5/2/17, CP mode | 2,000 | 2,000 | |
| Maryland - 0.4% | |||
| Montgomery County Gen. Oblig. Bonds Series 2013 MD, 0.78%, tender 6/1/17 (a) | 9,100 | 9,100 | |
| Massachusetts - 0.8% | |||
| Massachusetts Gen. Oblig. Bonds Series B, 1.39% 2/1/18 (a)(b) | 8,000 | 8,010 | |
| Massachusetts Indl. Fin. Agcy. Poll. Cont. Rev. Bonds (New England Pwr. Co. Proj.): | |||
| Series 1992, 0.82% tender 4/19/17, CP mode | 4,200 | 4,200 | |
| Series 1993 B, 1% tender 5/4/17, CP mode | 1,700 | 1,700 | |
| Series 1993-A, 0.9% tender 4/25/17, CP mode | 1,900 | 1,900 | |
| Massachusetts School Bldg. Auth. Dedicated Sales Tax Rev. Series B, 0.83% 6/6/17, LOC Citibank NA, CP | 3,100 | 3,100 | |
| 18,910 | |||
| Michigan - 1.1% | |||
| Michigan Fin. Auth. Rev. Bonds Series 2012 A, 5% 7/1/17 | 3,500 | 3,536 | |
| Michigan Gen. Oblig. Bonds (Envir. Prog.): | |||
| Series 2008 A, 5% 5/1/17 | 2,600 | 2,609 | |
| Series 2012, 5% 11/1/17 | 13,715 | 14,044 | |
| Univ. of Michigan Rev.: | |||
| Series K1, 0.77% 5/2/17, CP | 2,000 | 2,000 | |
| Series K2: | |||
| 0.78% 11/27/17, CP | 600 | 600 | |
| 0.9% 12/12/17, CP | 2,500 | 2,500 | |
| 25,289 | |||
| Minnesota - 0.2% | |||
| Univ. of Minnesota Gen. Oblig.: | |||
| Series 07C, 0.72% 4/4/17, CP | 2,800 | 2,800 | |
| Series 09D, 0.73% 4/5/17, CP | 1,600 | 1,600 | |
| 4,400 | |||
| Missouri - 0.2% | |||
| Curators of the Univ. of Missouri Series A, 0.81% 6/1/17, CP | 2,800 | 2,800 | |
| Saint Louis Gen. Fund Rev. TRAN Series 2016, 2% 6/1/17 | 1,300 | 1,303 | |
| 4,103 | |||
| Montana - 0.1% | |||
| Montana Board of Invt. Bonds Series 2013, 1.2%, tender 3/1/18 (a) | 1,300 | 1,300 | |
| Nebraska - 0.8% | |||
| Nebraska Pub. Pwr. District Rev. Series A: | |||
| 0.74% 4/10/17, CP | 1,500 | 1,500 | |
| 0.75% 4/4/17, CP | 1,700 | 1,700 | |
| 0.82% 4/18/17, CP | 2,200 | 2,200 | |
| Omaha Pub. Pwr. District Elec. Rev. Series A: | |||
| 0.76% 5/4/17, CP | 1,500 | 1,500 | |
| 0.8% 4/3/17, CP | 1,400 | 1,400 | |
| 0.8% 4/6/17, CP | 1,500 | 1,500 | |
| 0.8% 6/1/17, CP | 1,300 | 1,300 | |
| 0.81% 6/2/17, CP | 1,400 | 1,400 | |
| 0.89% 7/3/17, CP | 1,100 | 1,100 | |
| 0.89% 7/5/17, CP | 1,600 | 1,600 | |
| 0.89% 7/6/17, CP | 1,600 | 1,600 | |
| 0.94% 8/3/17, CP | 1,000 | 1,000 | |
| 17,800 | |||
| Nevada - 0.2% | |||
| Truckee Meadows Wtr. Auth. Wtr. Rev. Series 06A: | |||
| 0.8% 5/1/17, LOC Bank of Tokyo-Mitsubishi UFJ Ltd., CP | 2,300 | 2,300 | |
| 0.8% 6/2/17, LOC Bank of Tokyo-Mitsubishi UFJ Ltd., CP | 2,300 | 2,300 | |
| 4,600 | |||
| New Hampshire - 0.2% | |||
| New Hampshire Bus. Fin. Auth. Poll. Cont. Rev. Bonds (New England Pwr. Co. Proj.) 0.85% tender 4/6/17, CP mode | 2,500 | 2,500 | |
| New Hampshire Health & Ed. Facilities Auth. Rev. Bonds Series 2007, 5% 10/1/17 (Pre-Refunded to 10/1/17 @ 100) | 2,890 | 2,947 | |
| 5,447 | |||
| New Jersey - 0.8% | |||
| Burlington County Bridge Commission Lease Rev. BAN Series 2016 B, 2% 4/26/17 | 800 | 801 | |
| Burlington County Gen. Oblig. BAN Series 2016 A, 2% 5/16/17 | 1,500 | 1,502 | |
| Englewood Gen. Oblig. BAN Series 2017, 2.5% 4/4/18 (e) | 1,900 | 1,924 | |
| Hamilton Township Mercer County BAN Series 2016, 2% 6/8/17 | 2,300 | 2,305 | |
| Hudson County Gen. Oblig. BAN Series 2016, 2.5% 12/14/17 | 2,100 | 2,119 | |
| New Jersey Econ. Dev. Auth. Rev. Bonds 5% 12/15/17 (Escrowed to Maturity) | 4,018 | 4,126 | |
| Paramus BAN Series 2017, 2% 2/16/18 | 2,400 | 2,419 | |
| Passaic County Gen. Oblig. BAN Series 2016 A, 2% 12/11/17 | 2,500 | 2,514 | |
| 17,710 | |||
| New York - 1.0% | |||
| Albany County Gen. Oblig. BAN Series 2016, 2% 5/25/17 | 2,123 | 2,127 | |
| Bay Shore Union Free School District TAN Series 2016, 2% 6/23/17 | 1,800 | 1,804 | |
| Bayport-Blue Point Union Free School District TAN Series 2016, 2% 6/27/17 | 500 | 501 | |
| Islip Union Free School District TAN Series 2016, 2% 6/23/17 | 1,000 | 1,002 | |
| New York City Gen. Oblig. Bonds Series 2014 J, 5% 8/1/17 | 2,000 | 2,028 | |
| New York City Transitional Fin. Auth. Rev. Bonds Series 2011 E, 5% 11/1/17 | 2,000 | 2,046 | |
| New York City Trust For Cultural Bonds (American Museum of Natural History Proj.) Series 2014 B1, 1.01%, tender 10/6/17 (a) | 1,125 | 1,125 | |
| New York Pwr. Auth.: | |||
| Series 1, 0.7% 4/3/17, CP | 4,300 | 4,300 | |
| Series 2, 0.81% 6/1/17, CP | 5,400 | 5,400 | |
| Rochester Gen. Oblig. BAN Series I, 2% 8/4/17 | 2,400 | 2,409 | |
| Tonawanda Town BAN Series 2016, 2% 8/31/17 | 700 | 703 | |
| 23,445 | |||
| Ohio - 1.8% | |||
| Clark County Gen. Oblig. BAN Series 2016 2, 1.75% 5/3/17 | 500 | 500 | |
| Delaware Gen. Oblig. BAN Series 2017, 2% 4/12/18 (e) | 700 | 705 | |
| Franklin County Rev. Bonds Series 2013 OH, 0.75%, tender 6/1/17 (a) | 5,000 | 5,000 | |
| Huber Heights BAN Series 2016, 2.75% 12/12/17 | 1,611 | 1,625 | |
| Ohio Higher Edl. Facility Commission Rev. Bonds: | |||
| (Cleveland Clinic Foundation Proj.): | |||
| Series 08 B5, 0.75% tender 5/3/17, CP mode | 13,100 | 13,100 | |
| Series 2008 B6, 0.78% tender 4/5/17, CP mode | 4,100 | 4,100 | |
| (Cleveland Clinic Foundtn (THE) Proj.) 0.82% tender 6/12/17, CP mode | 4,300 | 4,300 | |
| (Cleveland Clinic Foundtn (THE) Proj.): | |||
| 0.8% tender 6/5/17, CP mode | 3,600 | 3,600 | |
| 0.95% tender 7/6/17, CP mode | 2,900 | 2,900 | |
| (Cleveland Clinic Fountation Proj.) Series 08 B5, 0.77% tender 5/24/17, CP mode | 700 | 700 | |
| Ohio State Univ. Gen. Receipts Rev. Bonds Series 03C, 0.8% tender 4/4/17, CP mode | 1,200 | 1,200 | |
| Tallmadge School District Gen. Oblig. BAN Series 2017, 2% 6/1/17 | 1,600 | 1,603 | |
| Winton Woods City School District BAN Series 2017, 1.75% 7/27/17 (Ohio Gen. Oblig. Guaranteed) | 500 | 501 | |
| 39,834 | |||
| Oklahoma - 0.1% | |||
| Oklahoma City Wtr. Utils. Trust Wtr. and Swr. Rev. Series A, 0.85% 5/3/17 (Liquidity Facility State Street Bank & Trust Co., Boston), CP | 500 | 500 | |
| Oklahoma Dev. Fin. Auth. Health Sys. Rev. Bonds Series 2015 B, 1.26%, tender 10/27/17 (a) | 1,750 | 1,750 | |
| 2,250 | |||
| Pennsylvania - 0.1% | |||
| Philadelphia Gas Works Rev. Series 2, 0.82% 4/3/17, LOC PNC Bank NA, CP | 1,800 | 1,800 | |
| Univ. of Pittsburgh Commonwealth Sys. of Higher Ed. Bonds Series 05B, 0.8% tender 4/4/17, CP mode | 1,400 | 1,400 | |
| 3,200 | |||
| South Carolina - 0.2% | |||
| Spartanburg County School District No. 7 BAN Series 2016 D, 2% 11/15/17 | 4,000 | 4,029 | |
| Tennessee - 0.3% | |||
| Metropolitan Govt. Nashville & Davidson County Wtr. & Swr. Sys. Rev. Series A: | |||
| 0.86% 5/16/17, LOC Bank of Tokyo-Mitsubishi UFJ Ltd., CP | 2,800 | 2,800 | |
| 1.05% 6/1/17, LOC Bank of Tokyo-Mitsubishi UFJ Ltd., CP | 2,900 | 2,900 | |
| 5,700 | |||
| Texas - 5.0% | |||
| Austin Elec. Util. Sys. Rev. Series A: | |||
| 0.72% 4/6/17, LOC Bank of Tokyo-Mitsubishi UFJ Ltd., CP | 9,600 | 9,600 | |
| 0.73% 4/6/17, LOC Bank of Tokyo-Mitsubishi UFJ Ltd., CP | 1,500 | 1,500 | |
| 0.75% 4/10/17, LOC Bank of Tokyo-Mitsubishi UFJ Ltd., CP | 4,215 | 4,215 | |
| 0.85% 6/5/17, LOC Bank of Tokyo-Mitsubishi UFJ Ltd., CP | 4,800 | 4,800 | |
| Fort Bend Independent School District: | |||
| 0.78% 5/17/17 (Liquidity Facility JPMorgan Chase Bank), CP | 1,100 | 1,100 | |
| 0.81% 5/17/17 (Liquidity Facility JPMorgan Chase Bank), CP | 3,300 | 3,300 | |
| Harris County Cultural Ed. Facilities Fin. Corp. Rev. Bonds: | |||
| ( Memorial Hermann Hosp. Sys. Proj.) 0.85% tender 7/6/17, CP mode | 5,500 | 5,500 | |
| (Memorial Hermann Hosp. Sys. Proj.) Series 2016 B3, 0.75% tender 5/3/17, CP mode | 4,300 | 4,300 | |
| (Texas Children's Hosp. Proj.) Series 2015 2, 1.11%, tender 10/27/17 (a) | 2,900 | 2,900 | |
| Series 16B2, 0.8% tender 4/3/17, CP mode | 3,900 | 3,900 | |
| Harris County Gen. Oblig.: | |||
| Series A1, 0.75% 4/3/17 (Liquidity Facility State Street Bank & Trust Co., Boston), CP | 2,100 | 2,100 | |
| Series D, 0.75% 4/3/17 (Liquidity Facility JPMorgan Chase Bank), CP | 3,500 | 3,500 | |
| Harris County Metropolitan Trans. Auth.: | |||
| Series A1: | |||
| 0.8% 4/3/17 (Liquidity Facility JPMorgan Chase Bank), CP | 2,900 | 2,900 | |
| 0.82% 4/13/17 (Liquidity Facility JPMorgan Chase Bank), CP | 3,000 | 3,000 | |
| 0.95% 4/11/17 (Liquidity Facility JPMorgan Chase Bank), CP | 2,200 | 2,200 | |
| Series A3, 0.82% 4/13/17 (Liquidity Facility State Street Bank & Trust Co., Boston), CP | 1,300 | 1,300 | |
| Houston Gen. Oblig.: | |||
| Series E1, 0.7% 4/3/17, LOC Citibank NA, CP | 1,500 | 1,500 | |
| TRAN Series 2016, 2% 6/30/17 | 1,900 | 1,905 | |
| Lower Colorado River Auth. Rev.: | |||
| Series 2016, 0.8% 4/6/17, LOC JPMorgan Chase Bank, LOC State Street Bank & Trust Co., Boston, CP | 800 | 800 | |
| Series A: | |||
| 0.74% 4/3/17, LOC JPMorgan Chase Bank, CP | 1,400 | 1,400 | |
| 0.85% 5/3/17, LOC JPMorgan Chase Bank, CP | 2,000 | 2,000 | |
| Series B: | |||
| 0.8% 6/1/17, LOC State Street Bank & Trust Co., Boston, CP | 1,900 | 1,900 | |
| 0.81% 6/5/17, LOC State Street Bank & Trust Co., Boston, CP | 2,400 | 2,400 | |
| 0.95% 6/1/17, LOC State Street Bank & Trust Co., Boston, CP | 1,176 | 1,176 | |
| 0.89% 7/5/17, LOC JPMorgan Chase Bank, LOC State Street Bank & Trust Co., Boston, CP | 1,494 | 1,494 | |
| North Texas Tollway Auth. Rev. Bonds 5.75% 1/1/18 (Pre-Refunded to 1/1/18 @ 100) | 2,130 | 2,203 | |
| Tarrant County Cultural Ed. Facilities Fin. Corp. Hosp. Rev. Bonds (Baylor Health Care Sys. Proj.): | |||
| Series 2011 B, 1.21%, tender 10/27/17 (a) | 8,400 | 8,400 | |
| Series 2013 B, 1.21%, tender 10/27/17 (a) | 2,400 | 2,400 | |
| Texas A&M Univ. Rev. Series B: | |||
| 0.74% 4/3/17, CP | 2,200 | 2,200 | |
| 0.83% 5/3/17, CP | 1,100 | 1,100 | |
| Texas Muni. Pwr. Agcy. Rev.: | |||
| Bonds Series 2015, 0% 9/1/17 (Escrowed to Maturity) | 1,200 | 1,195 | |
| Series 05, 0.75% 4/10/17, LOC Barclays Bank PLC, CP | 9,700 | 9,700 | |
| Texas Trans. Commission State Hwy. Fund Rev. Bonds Series 2007: | |||
| 5% 4/1/17 (Pre-Refunded to 4/1/17 @ 100) | 800 | 800 | |
| 5% 4/1/17 (Pre-Refunded to 4/1/17 @ 100) | 1,800 | 1,800 | |
| Univ. of Texas Board of Regents Sys. Rev.: | |||
| Bonds Series 2016 J, 5% 8/15/17 | 1,500 | 1,523 | |
| Series A: | |||
| 0.7% 4/3/17 (Liquidity Facility Univ. of Texas Invt. Mgmt. Co.), CP | 3,000 | 3,000 | |
| 0.96% 7/13/17 (Liquidity Facility Univ. of Texas Invt. Mgmt. Co.), CP | 2,800 | 2,800 | |
| Univ. of Texas Permanent Univ. Fund Rev. Series A, 0.87% 8/14/17, CP | 2,700 | 2,700 | |
| Upper Trinity Reg'l. Wtr. District 0.81% 7/6/17, LOC Bank of America NA, CP | 3,050 | 3,050 | |
| 113,561 | |||
| Virginia - 0.1% | |||
| Norfolk Econ. Dev. Auth. Rev. Series 97, 0.85% 6/5/17, CP | 2,900 | 2,900 | |
| Washington - 0.2% | |||
| Univ. of Washington Univ. Revs. Series 8: | |||
| 0.8% 4/3/17, CP | 2,200 | 2,200 | |
| 0.82% 5/2/17, CP | 2,500 | 2,500 | |
| 4,700 | |||
| Wisconsin - 0.7% | |||
| Wisconsin Gen. Oblig.: | |||
| Series 06A, 0.73% 4/5/17 (Liquidity Facility BMO Harris Bank NA), CP | 1,800 | 1,800 | |
| Series 16A, 0.77% 5/1/17 (Liquidity Facility BMO Harris Bank NA), CP | 9,900 | 9,900 | |
| Wisconsin Trans. Rev.: | |||
| Series 06A, 0.74% 4/10/17 (Liquidity Facility State Street Bank & Trust Co., Boston), CP | 1,200 | 1,200 | |
| Series 13A, 0.86% 4/6/17 (Liquidity Facility State Street Bank & Trust Co., Boston), CP | 1,300 | 1,300 | |
| Series 97A, 0.8% 6/1/17 (Liquidity Facility State Street Bank & Trust Co., Boston), CP | 1,900 | 1,900 | |
| 16,100 | |||
| TOTAL OTHER MUNICIPAL SECURITY | |||
| (Cost $516,689) | 516,689 | ||
| Shares (000s) | Value (000s) | ||
| Investment Company - 7.2% | |||
| Fidelity Tax-Free Cash Central Fund, 0.88% (f)(g) | |||
| (Cost $164,328) | 164,322 | 164,328 | |
| TOTAL INVESTMENT PORTFOLIO - 98.4% | |||
| (Cost $2,231,928) | 2,231,928 | ||
| NET OTHER ASSETS (LIABILITIES) - 1.6% | 35,820 | ||
| NET ASSETS - 100% | $2,267,748 |
Security Type Abbreviations
BAN – BOND ANTICIPATION NOTE
CP – COMMERCIAL PAPER
TAN – TAX ANTICIPATION NOTE
TRAN – TAX AND REVENUE ANTICIPATION N
VRDN – VARIABLE RATE DEMAND NOTE (A debt instrument that is payable upon demand, either daily, weekly or monthly)
The date shown for securities represents the date when principal payments must be paid, taking into account any call options exercised by the issuer and any permissible maturity shortening features other than interest rate resets.
Legend
(a) Coupon rates for floating and adjustable rate securities reflect the rates in effect at period end.
(b) Security exempt from registration under Rule 144A of the Securities Act of 1933. These securities may be resold in transactions exempt from registration, normally to qualified institutional buyers. At the end of the period, the value of these securities amounted to $91,315,000 or 4.0% of net assets.
(c) Provides evidence of ownership in one or more underlying municipal bonds.
(d) Restricted securities - Investment in securities not registered under the Securities Act of 1933 (excluding 144A issues). At the end of the period, the value of restricted securities (excluding 144A issues) amounted to $34,180,000 or 1.5% of net assets.
(e) Security or a portion of the security purchased on a delayed delivery or when-issued basis.
(f) Information in this report regarding holdings by state and security types does not reflect the holdings of the Fidelity Tax-Free Cash Central Fund.
(g) Affiliated fund that is available only to investment companies and other accounts managed by Fidelity Investments. The rate quoted is the annualized seven-day yield of the fund at period end. A complete unaudited listing of the fund's holdings as of its most recent quarter end is available upon request. In addition, each Fidelity Central Fund's financial statements, which are not covered by the Fund's Report of Independent Registered Public Accounting Firm, are available on the SEC's website or upon request.
Additional information on each restricted holding is as follows:
| Security | Acquisition Date | Cost (000s) |
| Central Florida Expressway Bonds Series RBC E 62, 1.11%, tender 8/1/17 (Liquidity Facility Royal Bank of Canada) | 8/1/16 | $2,695 |
| Douglas County School District #1 Bonds Series 2016 27, 1.11%, tender 6/29/17 (Liquidity Facility U.S. Bank NA, Cincinnati) | 12/30/16 | $2,200 |
| Indiana Health & Edl. Facilities Fing. Auth. Rev. Bonds Series 16 E71, 1.11%, tender 6/1/17 (Liquidity Facility Royal Bank of Canada) | 6/1/16 - 9/1/16 | $5,400 |
| Los Angeles Hbr. Dept. Rev. Bonds Series WF 10 40C, 1.21%, tender 8/31/17 (Liquidity Facility Wells Fargo Bank NA) | 3/22/12 | $1,400 |
| Lucas County Gen. Oblig. Bonds Series 2016 26, 1.11%, tender 6/29/17 (Liquidity Facility U.S. Bank NA, Cincinnati) | 12/23/16 | $700 |
| Pennsylvania Health & Edl. Facilities Fing. Auth. Rev. Bonds Series E72, 1.11%, tender 6/1/17 (Liquidity Facility Royal Bank of Canada) | 6/1/16 - 12/1/16 | $5,300 |
| Pennsylvania Higher Edl. Facilities Auth. Rev. Bonds Series WF 11 26C, 1.21%, tender 8/10/17 (Liquidity Facility Wells Fargo Bank NA) | 11/10/16 | $1,500 |
| RBC Muni. Products, Inc. Trust Bonds Series E70, 1.11%, tender 8/1/17 (Liquidity Facility Royal Bank of Canada) | 11/1/16 | $700 |
| Riverton Hosp. Rev. Bonds Series WF 11 35C, 1.21%, tender 8/3/17 (Liquidity Facility Wells Fargo Bank NA) | 3/24/11 | $5,530 |
| Seattle Muni. Lt. & Pwr. Rev. Bonds Series WF 11-18C, 1.21%, tender 8/10/17 (Liquidity Facility Wells Fargo Bank NA) | 2/11/16 | $600 |
| Univ. of Colorado Enterprise Sys. Rev. Bonds Series RBC E 55, 1.11%, tender 8/1/17 (Liquidity Facility Royal Bank of Canada) | 5/26/16 - 8/1/16 | $3,200 |
| Univ. of Pittsburgh Med. Ctr. Bonds Series RBC E53, 1.11%, tender 7/3/17 (Liquidity Facility Royal Bank of Canada) | 7/1/16 - 10/3/16 | $2,455 |
| Washington Gen. Oblig. Bonds Series WF 11-16C, 1.21%, tender 8/17/17 (Liquidity Facility Wells Fargo Bank NA) | 5/9/13 - 2/18/16 | $2,500 |
Affiliated Central Funds
Information regarding fiscal year to date income earned by the Fund from investments in Fidelity Central Funds is as follows:
| Fund | Income earned |
| (Amounts in thousands) | |
| Fidelity Tax-Free Cash Central Fund | $1,327 |
| Total | $1,327 |
Investment Valuation
All investments are categorized as Level 2 under the Fair Value Hierarchy. The inputs or methodology used for valuing securities may not be an indication of the risk associated with investing in those securities. For more information on valuation inputs please refer to the Investment Valuation section in the accompanying Notes to Financial Statements.
See accompanying notes which are an integral part of the financial statements.
Tax-Exempt Portfolio
Financial Statements
Statement of Assets and Liabilities
| Amounts in thousands (except per-share amounts) | March 31, 2017 | |
| Assets | ||
| Investment in securities, at value — See accompanying schedule: Unaffiliated issuers (cost $2,067,600) | $2,067,600 | |
| Fidelity Central Funds (cost $164,328) | 164,328 | |
| Total Investments (cost $2,231,928) | $2,231,928 | |
| Receivable for investments sold | 30,103 | |
| Receivable for fund shares sold | 16,880 | |
| Interest receivable | 3,537 | |
| Distributions receivable from Fidelity Central Funds | 99 | |
| Prepaid expenses | 1 | |
| Receivable from investment adviser for expense reductions | 58 | |
| Other receivables | 56 | |
| Total assets | 2,282,662 | |
| Liabilities | ||
| Payable to custodian bank | $58 | |
| Payable for investments purchased | ||
| Regular delivery | 1,900 | |
| Delayed delivery | 2,629 | |
| Payable for fund shares redeemed | 9,563 | |
| Distributions payable | 282 | |
| Accrued management fee | 259 | |
| Distribution and service plan fees payable | 1 | |
| Other affiliated payables | 131 | |
| Other payables and accrued expenses | 91 | |
| Total liabilities | 14,914 | |
| Net Assets | $2,267,748 | |
| Net Assets consist of: | ||
| Paid in capital | $2,267,764 | |
| Distributions in excess of net investment income | (2) | |
| Accumulated undistributed net realized gain (loss) on investments | (14) | |
| Net Assets | $2,267,748 | |
| Class I: | ||
| Net Asset Value, offering price and redemption price per share ($2,262,436 ÷ 2,261,246.3 shares) | $1.00 | |
| Class II: | ||
| Net Asset Value, offering price and redemption price per share ($382 ÷ 381.5 shares) | $1.00 | |
| Class III: | ||
| Net Asset Value, offering price and redemption price per share ($4,791 ÷ 4,789.6 shares) | $1.00 | |
| Select Class: | ||
| Net Asset Value, offering price and redemption price per share ($139 ÷ 138.7 shares) | $1.00 |
See accompanying notes which are an integral part of the financial statements.
Statement of Operations
| Amounts in thousands | Year ended March 31, 2017 | |
| Investment Income | ||
| Interest | $8,784 | |
| Income from Fidelity Central Funds | 1,327 | |
| Total income | 10,111 | |
| Expenses | ||
| Management fee | $2,287 | |
| Transfer agent fees | 980 | |
| Distribution and service plan fees | 90 | |
| Accounting fees and expenses | 166 | |
| Custodian fees and expenses | 14 | |
| Independent trustees' fees and expenses | 7 | |
| Registration fees | 133 | |
| Audit | 44 | |
| Legal | 4 | |
| Miscellaneous | 5 | |
| Total expenses before reductions | 3,730 | |
| Expense reductions | (731) | 2,999 |
| Net investment income (loss) | 7,112 | |
| Realized and Unrealized Gain (Loss) | ||
| Net realized gain (loss) on: | ||
| Investment securities: | ||
| Unaffiliated issuers | (17) | |
| Fidelity Central Funds | 3 | |
| Total net realized gain (loss) | (14) | |
| Net increase in net assets resulting from operations | $7,098 |
See accompanying notes which are an integral part of the financial statements.
Statement of Changes in Net Assets
| Amounts in thousands | Year ended March 31, 2017 | Year ended March 31, 2016 |
| Increase (Decrease) in Net Assets | ||
| Operations | ||
| Net investment income (loss) | $7,112 | $287 |
| Net realized gain (loss) | (14) | 459 |
| Net increase in net assets resulting from operations | 7,098 | 746 |
| Distributions to shareholders from net investment income | (7,113) | (287) |
| Distributions to shareholders from net realized gain | (1,040) | (1,814) |
| Total distributions | (8,153) | (2,101) |
| Share transactions - net increase (decrease) | 619,958 | (817,108) |
| Total increase (decrease) in net assets | 618,903 | (818,463) |
| Net Assets | ||
| Beginning of period | 1,648,845 | 2,467,308 |
| End of period | $2,267,748 | $1,648,845 |
| Other Information | ||
| Distributions in excess of net investment income end of period | $(2) | $– |
See accompanying notes which are an integral part of the financial statements.
Financial Highlights — Tax-Exempt Portfolio Class I
| Years ended March 31, | 2017 | 2016 | 2015 | 2014 | 2013 |
| Selected Per–Share Data | |||||
| Net asset value, beginning of period | $1.00 | $1.00 | $1.00 | $1.00 | $1.00 |
| Income from Investment Operations | |||||
| Net investment income (loss) | .004 | –A | –A | –A | –A |
| Net realized and unrealized gain (loss) | .001B | .001 | –A | –A | –A |
| Total from investment operations | .005 | .001 | –A | –A | –A |
| Distributions from net investment income | (.004) | –A | –A | –A | –A |
| Distributions from net realized gain | (.001) | (.001) | –A | –A | – |
| Total distributions | (.005) | (.001) | –A | –A | –A |
| Net asset value, end of period | $1.00 | $1.00 | $1.00 | $1.00 | $1.00 |
| Total ReturnC | .50% | .08% | .03% | .02% | .01% |
| Ratios to Average Net AssetsD,E | |||||
| Expenses before reductions | .22% | .22% | .22% | .22% | .22% |
| Expenses net of fee waivers, if any | .18% | .05% | .06% | .11% | .18% |
| Expenses net of all reductions | .18% | .05% | .06% | .10% | .17% |
| Net investment income (loss) | .44% | .01% | .01% | .01% | .01% |
| Supplemental Data | |||||
| Net assets, end of period (in millions) | $2,262 | $1,429 | $2,166 | $2,055 | $2,342 |
A Amount represents less than $.0005 per share.
B The amount shown for a share outstanding does not correspond with the aggregate net gain (loss) on investments for the period due to the timing of sales and repurchases of shares in relation to fluctuating market values of the investments of the Fund.
C Total returns would have been lower if certain expenses had not been reduced during the applicable periods shown.
D Fees and expenses of any underlying Fidelity Central Funds are not included in the Fund's expense ratio. The Fund indirectly bears its proportionate share of the expenses of any underlying Fidelity Central Funds.
E Expense ratios reflect operating expenses of the class. Expenses before reductions do not reflect amounts reimbursed or waived or reductions from expense offset arrangements and do not represent the amount paid by the class during periods when reimbursements, waivers or reductions occur. Expenses net of fee waivers reflect expenses after reimbursement and waivers but prior to reductions from expense offset arrangements. Expenses net of all reductions represent the net expenses paid by the class.
See accompanying notes which are an integral part of the financial statements.
Financial Highlights — Tax-Exempt Portfolio Class II
| Years ended March 31, | 2017 | 2016 | 2015 | 2014 | 2013 |
| Selected Per–Share Data | |||||
| Net asset value, beginning of period | $1.00 | $1.00 | $1.00 | $1.00 | $1.00 |
| Income from Investment Operations | |||||
| Net investment income (loss) | .003 | –A | –A | –A | –A |
| Net realized and unrealized gain (loss) | –A | .001 | –A | –A | –A |
| Total from investment operations | .003 | .001 | –A | –A | –A |
| Distributions from net investment income | (.003) | –A | –A | –A | –A |
| Distributions from net realized gain | (.001) | (.001) | –A | –A | – |
| Total distributions | (.003)B | (.001) | –A | –A | –A |
| Net asset value, end of period | $1.00 | $1.00 | $1.00 | $1.00 | $1.00 |
| Total ReturnC | .35% | .08% | .03% | .02% | .01% |
| Ratios to Average Net AssetsD,E | |||||
| Expenses before reductions | .37% | .37% | .37% | .37% | .37% |
| Expenses net of fee waivers, if any | .33% | .06% | .06% | .11% | .17% |
| Expenses net of all reductions | .33% | .05% | .06% | .10% | .17% |
| Net investment income (loss) | .29% | .01% | .01% | .01% | .01% |
| Supplemental Data | |||||
| Net assets, end of period (in millions) | $– | $1 | $12 | $12 | $12 |
A Amount represents less than $.0005 per share.
B Total distributions of $.003 per share is comprised of distributions from net investment income of $.0027 and distributions from net realized gain of $.0007 per share.
C Total returns would have been lower if certain expenses had not been reduced during the applicable periods shown.
D Fees and expenses of any underlying Fidelity Central Funds are not included in the Fund's expense ratio. The Fund indirectly bears its proportionate share of the expenses of any underlying Fidelity Central Funds.
E Expense ratios reflect operating expenses of the class. Expenses before reductions do not reflect amounts reimbursed or waived or reductions from expense offset arrangements and do not represent the amount paid by the class during periods when reimbursements, waivers or reductions occur. Expenses net of fee waivers reflect expenses after reimbursement and waivers but prior to reductions from expense offset arrangements. Expenses net of all reductions represent the net expenses paid by the class.
See accompanying notes which are an integral part of the financial statements.
Financial Highlights — Tax-Exempt Portfolio Class III
| Years ended March 31, | 2017 | 2016 | 2015 | 2014 | 2013 |
| Selected Per–Share Data | |||||
| Net asset value, beginning of period | $1.00 | $1.00 | $1.00 | $1.00 | $1.00 |
| Income from Investment Operations | |||||
| Net investment income (loss) | .002 | –A | –A | –A | –A |
| Net realized and unrealized gain (loss) | .001B | .001 | –A | –A | –A |
| Total from investment operations | .003 | .001 | –A | –A | –A |
| Distributions from net investment income | (.002) | –A | –A | –A | –A |
| Distributions from net realized gain | (.001) | (.001) | –A | –A | – |
| Total distributions | (.003) | (.001) | –A | –A | –A |
| Net asset value, end of period | $1.00 | $1.00 | $1.00 | $1.00 | $1.00 |
| Total ReturnC | .25% | .08% | .03% | .02% | .01% |
| Ratios to Average Net AssetsD,E | |||||
| Expenses before reductions | .47% | .47% | .47% | .47% | .47% |
| Expenses net of fee waivers, if any | .39% | .06% | .06% | .11% | .17% |
| Expenses net of all reductions | .39% | .06% | .06% | .10% | .17% |
| Net investment income (loss) | .23% | .01% | .01% | .01% | .01% |
| Supplemental Data | |||||
| Net assets, end of period (in millions) | $5 | $215 | $285 | $275 | $323 |
A Amount represents less than $.0005 per share.
B The amount shown for a share outstanding does not correspond with the aggregate net gain (loss) on investments for the period due to the timing of sales and repurchases of shares in relation to fluctuating market values of the investments of the Fund.
C Total returns would have been lower if certain expenses had not been reduced during the applicable periods shown.
D Fees and expenses of any underlying Fidelity Central Funds are not included in the Fund's expense ratio. The Fund indirectly bears its proportionate share of the expenses of any underlying Fidelity Central Funds.
E Expense ratios reflect operating expenses of the class. Expenses before reductions do not reflect amounts reimbursed or waived or reductions from expense offset arrangements and do not represent the amount paid by the class during periods when reimbursements, waivers or reductions occur. Expenses net of fee waivers reflect expenses after reimbursement and waivers but prior to reductions from expense offset arrangements. Expenses net of all reductions represent the net expenses paid by the class.
See accompanying notes which are an integral part of the financial statements.
Financial Highlights — Tax-Exempt Portfolio Select Class
| Years ended March 31, | 2017 | 2016 | 2015 | 2014 | 2013 |
| Selected Per–Share Data | |||||
| Net asset value, beginning of period | $1.00 | $1.00 | $1.00 | $1.00 | $1.00 |
| Income from Investment Operations | |||||
| Net investment income (loss) | .004 | –A | –A | –A | –A |
| Net realized and unrealized gain (loss) | –A | .001 | –A | –A | –A |
| Total from investment operations | .004 | .001 | –A | –A | –A |
| Distributions from net investment income | (.004) | –A | –A | –A | –A |
| Distributions from net realized gain | (.001) | (.001) | –A | –A | – |
| Total distributions | (.004)B | (.001) | –A | –A | –A |
| Net asset value, end of period | $1.00 | $1.00 | $1.00 | $1.00 | $1.00 |
| Total ReturnC | .44% | .08% | .03% | .02% | .01% |
| Ratios to Average Net AssetsD,E | |||||
| Expenses before reductions | .27% | .27% | .27% | .27% | .27% |
| Expenses net of fee waivers, if any | .23% | .06% | .06% | .11% | .18% |
| Expenses net of all reductions | .23% | .06% | .06% | .11% | .18% |
| Net investment income (loss) | .39% | .01% | .01% | .01% | .01% |
| Supplemental Data | |||||
| Net assets, end of period (in millions) | $– | $4 | $4 | $7 | $8 |
A Amount represents less than $.0005 per share.
B Total distributions of $.004 per share is comprised of distributions from net investment income of $.0037 and distributions from net realized gain of $.0007 per share.
C Total returns would have been lower if certain expenses had not been reduced during the applicable periods shown.
D Fees and expenses of any underlying Fidelity Central Funds are not included in the Fund's expense ratio. The Fund indirectly bears its proportionate share of the expenses of any underlying Fidelity Central Funds.
E Expense ratios reflect operating expenses of the class. Expenses before reductions do not reflect amounts reimbursed or waived or reductions from expense offset arrangements and do not represent the amount paid by the class during periods when reimbursements, waivers or reductions occur. Expenses net of fee waivers reflect expenses after reimbursement and waivers but prior to reductions from expense offset arrangements. Expenses net of all reductions represent the net expenses paid by the class.
See accompanying notes which are an integral part of the financial statements.
Notes to Financial Statements
For the period ended March 31, 2017
(Amounts in thousands except percentages)
1. Organization.
Treasury Only Portfolio, Treasury Portfolio, Government Portfolio, Money Market Portfolio, Prime Money Market Portfolio, Prime Reserves Portfolio and Tax-Exempt Portfolio (the Funds) are funds of Fidelity Colchester Street Trust (the Trust). Each Fund is authorized to issue an unlimited number of shares. The Trust is registered under the Investment Company Act of 1940, as amended (the 1940 Act), as an open-end management investment company organized as a Delaware statutory trust. Each Fund offers Class I, Class II, Class III and Select Class shares. Prime Money Market Portfolio, Treasury Only Portfolio and Treasury Portfolio also offer Class IV and Institutional Class shares. Government Portfolio, Money Market Portfolio and Prime Reserves Portfolio also offer Institutional Class shares. Shares of Money Market Portfolio and Tax-Exempt Portfolio are only available for purchase by retail shareholders. All classes have equal rights as to assets and voting privileges. Each class has exclusive voting rights with respect to matters that affect that class. Each Fund except for Tax-Exempt Portfolio offers conversion privileges from Class I to Institutional Class for eligible shareholders.
Money Market Portfolio offered Class F shares during the period June 26, 2009 through May 20, 2016, and all outstanding shares were redeemed by May 20, 2016. All current fiscal period dollar and share amounts for Money Market Portfolio Class F presented in the Notes to Financial Statements are for the period April 1, 2016 to May 20, 2016.
In accordance with amendments to Rule 2a-7 of the 1940 Act, Prime Money Market Portfolio and Prime Reserves Portfolio (the Institutional Funds) have each been designated an institutional money market fund, and effective October 3, 2016 the value of their shares are calculated to four decimal places that fluctuates based upon changes in the value of their investments.
2. Investments in Fidelity Central Funds.
The Funds may invest in Fidelity Central Funds, which are open-end investment companies generally available only to other investment companies and accounts managed by the investment adviser and its affiliates. The Funds' Schedules of Investments list each of the Fidelity Central Funds held as of period end, if any, as an investment of each Fund, but do not include the underlying holdings of each Fidelity Central Fund. As an Investing Fund, each Fund indirectly bears its proportionate share of the expenses of the underlying Fidelity Central Funds.
The Money Market Central Funds seek preservation of capital and current income and are managed by Fidelity Investments Money Management, Inc. (FIMM), an affiliate of the investment adviser. Annualized expenses of the Money Market Central Funds as of their most recent shareholder report date are less than .005%.
A complete unaudited list of holdings for each Fidelity Central Fund is available upon request or at the Securities and Exchange Commission (the SEC) website at www.sec.gov. In addition, the financial statements of the Fidelity Central Funds, which are not covered by the Funds' Report of Independent Registered Public Accounting Firm, are available on the SEC website or upon request.
3. Significant Accounting Policies.
Each Fund is an investment company and applies the accounting and reporting guidance of the Financial Accounting Standards Board (FASB) Accounting Standards Codification Topic 946 Financial Services – Investments Companies. The financial statements have been prepared in conformity with accounting principles generally accepted in the United States of America (GAAP), which require management to make certain estimates and assumptions at the date of the financial statements. Actual results could differ from those estimates. Subsequent events, if any, through the date that the financial statements were issued have been evaluated in the preparation of the financial statements. The following summarizes the significant accounting policies of the Funds:
Investment Valuation. Investments are valued as of 4:00 p.m. Eastern time on the last calendar day of the period. The Board of Trustees (the Board) has delegated the day to day responsibility for the valuation of each Institutional Fund's investments to the Fair Value Committee (the Committee) established by the Institutional Funds' investment adviser. In accordance with valuation policies and procedures approved by the Board, each Institutional Fund attempts to obtain prices from one or more third party pricing vendors or brokers to value its investments. When current market prices, quotations or currency exchange rates are not readily available or reliable, investments will be fair valued in good faith by the Committee, in accordance with procedures adopted by the Board. Factors used in determining fair value vary by investment type and may include market or investment specific events, changes in interest rates and credit quality. The frequency with which these procedures are used cannot be predicted and they may be utilized to a significant extent. The Committee oversees the Institutional Funds' valuation policies and procedures and reports to the Board on the Committee's activities and fair value determinations. The Board monitors the appropriateness of the procedures used in valuing each Institutional Fund's investments and ratifies the fair value determinations of the Committee.
Each Fund categorizes the inputs to valuation techniques used to value its investments into a disclosure hierarchy consisting of three levels as shown below:
- Level 1 – quoted prices in active markets for identical investments
- Level 2 – other significant observable inputs (including quoted prices for similar investments, interest rates, prepayment speeds, etc.)
- Level 3 – unobservable inputs (including the Fund's own assumptions based on the best information available)
Prior to October 3, 2016, as permitted by compliance with certain conditions under Rule 2a-7 of the 1940 Act, securities of each Institutional Fund were valued at amortized cost, which approximates fair value. The amortized cost of an instrument is determined by valuing it at its original cost and thereafter amortizing any discount or premium from its face value at a constant rate until maturity.
Effective October 3, 2016, valuation techniques used to value each Institutional Fund's investments by major category are as follows:
Debt securities, including restricted securities, are valued based on evaluated prices received from third party pricing vendors or from brokers who make markets in such securities. Municipal securities, U.S. government and government agency obligations, commercial paper, certificates of deposit and other short-term securities are valued by pricing vendors who utilize matrix pricing which considers yield or price of bonds of comparable quality, coupon, maturity and type or by broker-supplied prices. When independent prices are unavailable or unreliable, debt securities may be valued utilizing pricing methodologies which consider similar factors that would be used by third party pricing vendors. Debt securities are generally categorized as Level 2 in the hierarchy but may be Level 3 depending on the circumstances. Short-term securities with remaining maturities of sixty days or less may be valued at amortized cost, which approximates fair value, and are categorized as Level 2 in the hierarchy.
For Treasury Only Portfolio, Treasury Portfolio, Government Portfolio, Money Market Portfolio and Tax-Exempt Portfolio, as permitted by compliance with certain conditions under Rule 2a-7 of the 1940 Act, securities are valued at amortized cost, which approximates fair value. The amortized cost of an instrument is determined by valuing it at its original cost and thereafter amortizing any discount or premium from its face value at a constant rate until maturity.
Securities held by a money market fund are generally high quality and liquid; however, they are reflected as Level 2 because the inputs used to determine fair value are not quoted prices in an active market.
Investment Transactions and Income. Security transactions, including the Funds' investment activity in the Fidelity Central Funds, are accounted for as of trade date. Gains and losses on securities sold are determined on the basis of identified cost. Income and capital gain distributions from Fidelity Central Funds, if any, are recorded on the ex-dividend date. Interest income is accrued as earned and includes coupon interest and amortization of premium and accretion of discount on debt securities as applicable. The principal amount on inflation-indexed securities is periodically adjusted to the rate of inflation and interest is accrued based on the principal amount. The adjustments to principal due to inflation are reflected as increases or decreases to Interest in the accompanying Statement of Operations.
Class Allocations and Expenses. Investment income, realized and unrealized capital gains and losses, common expenses of each Fund, and certain fund-level expense reductions, if any, are allocated daily on a pro-rata basis to each class based on the relative net assets of each class to the total net assets of each Fund. Each class differs with respect to transfer agent and distribution and service plan fees incurred. Certain expense reductions may also differ by class. For the reporting period, the allocated portion of income and expenses to each class as a percent of its average net assets may vary due to the timing of recording these transactions in relation to fluctuating net assets of the classes. Expenses directly attributable to a fund are charged to that fund. Expenses attributable to more than one fund are allocated among the respective funds on the basis of relative net assets or other appropriate methods. Expense estimates are accrued in the period to which they relate and adjustments are made when actual amounts are known.
Deferred Trustee Compensation. Under a Deferred Compensation Plan (the Plan) for Treasury Portfolio, Government Portfolio, Money Market Portfolio, Prime Money Market Portfolio and Tax-Exempt Portfolio, independent Trustees may elect to defer receipt of a portion of their annual compensation. Deferred amounts are invested in a cross-section of Fidelity funds, are marked-to-market and remain in the Fund until distributed in accordance with the Plan. The investment of deferred amounts and the offsetting payable to the Trustees are included in the accompanying Statement of Assets and Liabilities.
Income Tax Information and Distributions to Shareholders. Each year, each Fund intends to qualify as a regulated investment company under Subchapter M of the Internal Revenue Code, including distributing substantially all of its taxable income and realized gains. As a result, no provision for U.S. Federal income taxes is required. As of March 31, 2017, each Fund did not have any unrecognized tax benefits in the financial statements; nor is each Fund aware of any tax positions for which it is reasonably possible that the total amounts of unrecognized tax benefits will significantly change in the next twelve months. Each Fund files a U.S. federal tax return, in addition to state and local tax returns as required. Each Fund's federal income tax returns are subject to examination by the Internal Revenue Service (IRS) for a period of three fiscal years after they are filed. State and local tax returns may be subject to examination for an additional fiscal year depending on the jurisdiction.
Dividends are declared and recorded daily and paid monthly from net investment income. Distributions from realized gains, if any, are declared and recorded on the ex-dividend date. Income dividends and capital gain distributions are declared separately for each class. Income and capital gain distributions are determined in accordance with income tax regulations, which may differ from GAAP. In addition, the Funds claimed a portion of the payment made to redeeming shareholders as a distribution for income tax purposes.
Capital accounts within the financial statements are adjusted for permanent book-tax differences. These adjustments have no impact on net assets or the results of operations. Capital accounts are not adjusted for temporary book-tax differences which will reverse in a subsequent period.
Book-tax differences are primarily due to deferred trustees compensation, capital loss carryforwards and losses deferred due to wash sales.
The Tax-Exempt Portfolio purchases municipal securities whose interest, in the opinion of the issuer, is free from federal income tax. There is no assurance that the IRS will agree with this opinion. In the event the IRS determines that the issuer does not comply with relevant tax requirements, interest payments from a security could become federally taxable, possibly retroactively to the date the security was issued.
The federal tax cost of investment securities and unrealized appreciation (depreciation) as of period end were as follows for each Fund:
| Tax cost | Gross unrealized appreciation | Gross unrealized depreciation | Net unrealized appreciation (depreciation) on securities | |
| Treasury Only Portfolio | $13,750,761 | $– | $– | $– |
| Treasury Portfolio | 18,858,275 | – | – | – |
| Government Portfolio | 94,372,667 | – | – | – |
| Money Market Portfolio | 17,701,329 | – | – | – |
| Prime Money Market Portfolio | 10,269,946 | 2,359 | (55) | 2,304 |
| Prime Reserves Portfolio | 1,416,763 | 149 | (15) | 134 |
| Tax-Exempt Portfolio | 2,231,928 | – | – | – |
The tax-based components of distributable earnings as of period end were as follows for each Fund:
| Undistributed tax-exempt income | Undistributed ordinary income | Undistributed long-term capital gain | Capital loss carryforward | Net unrealized appreciation (depreciation) on securities and other investments | |
| Treasury Only Portfolio | $– | $1 | $– | $– | $– |
| Treasury Portfolio | – | 191 | – | – | – |
| Government Portfolio | – | – | – | (118) | – |
| Money Market Portfolio | – | 842 | – | – | – |
| Prime Money Market Portfolio | – | 404 | – | – | 2,304 |
| Prime Reserves Portfolio | – | 1 | – | – | 134 |
| Tax-Exempt Portfolio | 52 | – | – | (15) | – |
Capital loss carryforwards are only available to offset future capital gains of the Funds to the extent provided by regulations and may be limited. Under the Regulated Investment Company Modernization Act of 2010 (the Act), the Funds are permitted to carry forward capital losses incurred in taxable years beginning after December 22, 2010 for an unlimited period and such capital losses are required to be used prior to any losses that expire. The capital loss carryforward information presented below, including any applicable limitation, is estimated as of fiscal period end and is subject to adjustment.
| Fiscal year of expiration | |
| 2019 | |
| Government Portfolio | $(118) |
| No expiration | |
| Short-term | |
| Tax-Exempt Portfolio | $(15) |
The tax character of distributions paid was as follows:
| March 31, 2017 | ||||
| Tax-Exempt Income | Ordinary Income | Long-term Capital Gains | Total | |
| Treasury Only Portfolio | $– | $31,217 | $– | $31,217 |
| Treasury Portfolio | – | 46,502 | – | 46,502 |
| Government Portfolio | – | 273,207 | – | 273,207 |
| Money Market Portfolio | – | 126,160 | – | 126,160 |
| Prime Money Market Portfolio | – | 170,953 | – | 170,953 |
| Prime Reserves Portfolio(a) | – | 3,795 | – | 3,795 |
| Tax-Exempt Portfolio | 7,113 | 1,040 | – | 8,153 |
(a) For the period June 2, 2016 (commencement of operations) to March 31, 2017.
| March 31, 2016 | ||||
| Tax-Exempt Income | Ordinary Income | Long-term Capital Gains | Total | |
| Treasury Only Portfolio | $– | $4,615 | $– | $4,615 |
| Treasury Portfolio | – | 6,744 | – | 6,744 |
| Government Portfolio | – | 20,503 | – | 20,503 |
| Money Market Portfolio | – | 122,767 | – | 122,767 |
| Prime Money Market Portfolio | – | 101,456 | – | 101,456 |
| Tax-Exempt Portfolio | 287 | – | 1,814 | 2,101 |
Repurchase Agreements. Pursuant to an Exemptive Order issued by the Securities and Exchange Commission (the SEC), the Funds along with other registered investment companies having management contracts with Fidelity Management and Research Company (FMR), an affiliate of SelectCo, or other affiliated entities of FMR, are permitted to transfer uninvested cash balances into joint trading accounts which are then invested in repurchase agreements. The Funds may also invest directly with institutions in repurchase agreements. For Treasury Only Portfolio, Treasury Portfolio and Government Portfolio, repurchase agreements may be collateralized by cash or government securities. For Prime Money Market Portfolio, Money Market Portfolio, Prime Reserves Portfolio and Tax-Exempt Portfolio, repurchase agreements may be collateralized by government or non-government securities. Upon settlement date, collateral is held in segregated accounts with custodian banks and may be obtained in the event of a default of the counterparty. Each applicable Fund monitors, on a daily basis, the value of the collateral to ensure it is at least equal to the principal amount of the repurchase agreement (including accrued interest). In the event of a default by the counterparty, realization of the collateral proceeds could be delayed, during which time the value of the collateral may decline.
Reverse Repurchase Agreements. To enhance their yield, the Funds may enter into reverse repurchase transactions under master repurchase agreements whereby the Fund sells securities to a counterparty in return for cash and agrees to repurchase those securities at a future date and agreed upon price. During the period that reverse repurchase transactions are outstanding, each applicable fund identifies the securities as pledged in its records with an initial value at least equal to its principal obligation under the agreement. The cash proceeds received by the Funds may be invested in other securities. To the extent cash proceeds received from the counterparty exceed the value of the securities sold, the counterparty may request additional collateral from the Fund. If the counterparty defaults on its obligation, because of insolvency or other reasons, the Fund could experience delays and costs in recovering the securities sold. Information regarding securities sold under a reverse repurchase agreement, if any, is included at the end of each applicable Fund's Schedule of Investments and the cash proceeds are recorded as a liability in each applicable fund's accompanying Statement of Assets and Liabilities. The Fund continues to receive interest and dividend payments on the securities sold during the term of the reverse repurchase agreement. At period end, there were no reverse repurchase agreements outstanding.
Delayed Delivery Transactions and When-Issued Securities. During the period, certain Funds transacted in securities on a delayed delivery or when-issued basis. Payment and delivery may take place after the customary settlement period for that security. The price of the underlying securities and the date when the securities will be delivered and paid for are fixed at the time the transaction is negotiated. The securities purchased on a delayed delivery or when-issued basis are identified as such in each applicable Fund's Schedule of Investments. The Funds may receive compensation for interest forgone in the purchase of a delayed delivery or when-issued security. With respect to purchase commitments, each applicable Fund identifies securities as segregated in its records with a value at least equal to the amount of the commitment. Losses may arise due to changes in the value of the underlying securities or if the counterparty does not perform under the contract's terms, or if the issuer does not issue the securities due to political, economic, or other factors.
Restricted Securities. The Funds may invest in securities that are subject to legal or contractual restrictions on resale. These securities generally may be resold in transactions exempt from registration or to the public if the securities are registered. Disposal of these securities may involve time-consuming negotiations and expense, and prompt sale at an acceptable price may be difficult. Information regarding restricted securities is included at the end of each applicable Fund's Schedule of Investments.
4. Fees and Other Transactions with Affiliates.
Management Fee. Fidelity Management & Research Company (the investment adviser) and its affiliates provide the Funds with investment management related services for which the Funds pay a monthly management fee that is based on an annual rate of .14% of average net assets.
Distribution and Service Plan Fees. In accordance with Rule 12b-1 of the 1940 Act, the Funds have adopted separate Distribution and Service Plans for each class of shares. Class II, Class III and Select Class of each Fund pays Fidelity Distributors Corporation (FDC), an affiliate of the investment adviser, a Service fee based on an annual percentage of each class' average net assets. Class IV of Treasury Only Portfolio, Treasury Portfolio and Prime Money Market Portfolio pays FDC separate Distribution and Service Fees, each of which is based on an annual percentage of each class' average net assets. FDC may pay financial intermediaries for selling shares of the Funds and providing shareholder support services. For the period, the Distribution and Service fee rates, total fees and amounts retained by FDC were as follows:
| Distribution Fee | Service Fee | |
| Class II | .00% | .15% |
| Class III | .00% | .25% |
| Class IV | .25% | .25% |
| Select Class | .00% | .05% |
| Total Fees | Retained by FDC | |
| Treasury Only Portfolio: | ||
| Class II | $349 | $17 |
| Class III | 2,204 | 648 |
| Class IV | 414 | 7 |
| Select Class | 80 | 34 |
| $3,047 | $706 | |
| Treasury Portfolio: | ||
| Class II | $534 | $43 |
| Class III | 6,350 | 1,839 |
| Class IV | 3,951 | 7 |
| Select Class | 151 | 20 |
| $10,986 | $1,909 | |
| Government Portfolio: | ||
| Class II | $1,205 | $616 |
| Class III | 6,291 | 2,029 |
| Select Class | 302 | 11 |
| $7,798 | $2,656 | |
| Money Market Portfolio: | ||
| Class II | $55 | $5 |
| Class III | 1,013 | 3 |
| Select Class | 26 | 19 |
| $1,094 | $27 | |
| Prime Money Market Portfolio: | ||
| Class II | $266 | $94 |
| Class III | 984 | 85 |
| Class IV | 262 | – |
| Select Class | 287 | 3 |
| $1,799 | $182 | |
| Prime Reserves Portfolio: | ||
| Class II | $1 | $1 |
| Class III | 3 | 2 |
| Select Class | –(a) | –(a) |
| $4 | $3 | |
| Tax-Exempt Portfolio: | ||
| Class II | $1 | $–(a) |
| Class III | 89 | 4 |
| Select Class | –(a) | –(a) |
| $90 | $4 |
(a) In the amount of less than five hundred dollars.
During the period, the investment adviser or its affiliates waived a portion of these fees.
Transfer Agent Fees. Fidelity Investments Institutional Operations Company, Inc. (FIIOC), an affiliate of the investment adviser, is the transfer, dividend disbursing and shareholder servicing agent for the Funds. FIIOC receives asset-based fees with respect to each account. FIIOC pays for typesetting, printing and mailing of all shareholder reports, except proxy statements. Each class, with the exception of Institutional Class, pays a transfer agent fee equal to an annual rate of .06% of class-level average net assets. Institutional Class pays a transfer agent fee equal to an annual rate of .03% of class-level average net assets. FIIOC receives no fees for providing transfer agency services to Class F. For the period, transfer agent fees for each class were as follows:
| Treasury Only Portfolio | |
| Class I | $5,198 |
| Class II | 140 |
| Class III | 529 |
| Class IV | 50 |
| Select Class | 96 |
| Institutional Class | 1,076 |
| $7,089 | |
| Treasury Portfolio | |
| Class I | $6,375 |
| Class II | 213 |
| Class III | 1,524 |
| Class IV | 474 |
| Select Class | 182 |
| Institutional Class | 1,504 |
| $10,272 | |
| Government Portfolio | |
| Class I | $18,107 |
| Class II | 482 |
| Class III | 1,510 |
| Select Class | 363 |
| Institutional Class | 13,770 |
| $34,232 | |
| Money Market Portfolio | |
| Class I | $5,606 |
| Class II | 22 |
| Class III | 243 |
| Select Class | 31 |
| Class F | – |
| Institutional Class | 3,543 |
| $9,445 | |
| Prime Money Market Portfolio | |
| Class I | $2,931 |
| Class II | 106 |
| Class III | 236 |
| Class IV | 31 |
| Select Class | 344 |
| Institutional Class | 8,225 |
| $11,873 | |
| Prime Reserves Portfolio | |
| Class I | $100 |
| Class II | –(a) |
| Class III | –(a) |
| Select Class | 1 |
| Institutional Class | 111 |
| $212 | |
| Tax-Exempt Portfolio | |
| Class I | $959 |
| Class II | –(a) |
| Class III | 21 |
| Select Class | –(a) |
| $980 |
(a) In the amount of less than five hundred dollars.
Accounting Fees. Fidelity Service Company, Inc. (FSC), an affiliate of the investment adviser, maintains each Fund's accounting records. The fee is based on the level of average net assets for each month.
Interfund Lending Program. Pursuant to an Exemptive Order issued by the SEC, the Funds, along with other registered investment companies having management contracts with Fidelity Management & Research Company (FMR) or other affiliated entities of FMR, may participate in an interfund lending program. This program provides an alternative credit facility allowing the funds to borrow from, or lend money to, other participating affiliated funds. At period end, Treasury Only Portfolio, Treasury Portfolio, Government Portfolio, Prime Money Market Portfolio, Prime Reserves Portfolio and Tax-Exempt Portfolio had no interfund loans outstanding. Money Market Portfolio Fund's open loans at period end are presented under the caption "Interfund Loans" in the Schedule of Investments with accrued interest included in Other affiliated receivables on the Statement of Assets and Liabilities. Each applicable fund's activity in this program during the period for which loans were outstanding was as follows:
| Borrower or Lender | Average Loan Balance | Weighted Average Interest Rate | |
| Money Market Portfolio | Lender | $13,428 | .73% |
| Prime Reserves Portfolio | Lender | 11,993 | .68% |
Interfund Trades. The Funds may purchase from or sell securities to other Fidelity Funds under procedures adopted by the Board. The procedures have been designed to ensure these interfund trades are executed in accordance with Rule 17a-7 of the 1940 Act.
Other. During the period, the investment adviser reimbursed the Funds for certain losses as follows:
| Amount | |
| Government Portfolio | $3 |
| Prime Money Market Portfolio | 18 |
5. Expense Reductions.
The investment adviser contractually agreed to reimburse funds to the extent annual operating expenses exceeded certain levels of average net assets as noted in the table below. This reimbursement will remain in place through May 31, 2018. Some expenses, for example interest expense, are excluded from this reimbursement.
The following classes of each applicable Fund were in reimbursement during the period:
| Expense Limitations | Reimbursement | |
| Treasury Only Portfolio | ||
| Class I | .18% | $2,788 |
| Class II | .33% | 75 |
| Class III | .43% | 286 |
| Class IV | .68% | 36 |
| Select Class | .23% | 53 |
| Institutional Class | .14% | 1,506 |
| Treasury Portfolio | ||
| Class I | .18% | $3,126 |
| Class II | .33% | 110 |
| Class III | .43% | 748 |
| Class IV | .68% | 236 |
| Select Class | .23% | 90 |
| Institutional Class | .14% | 1,979 |
| Government Portfolio | ||
| Class I | .18% | $7,856 |
| Class II | .33% | 205 |
| Class III | .43% | 670 |
| Select Class | .23% | 157 |
| Institutional Class | .14% | 16,463 |
| Money Market Portfolio | ||
| Class I | .18% | $2,779 |
| Class II | .33% | 11 |
| Class III | .43% | 121 |
| Select Class | .23% | 15 |
| Class F | .14% | 20 |
| Institutional Class | .14% | 4,706 |
| Prime Money Market Portfolio | ||
| Class I | .18% | $1,303 |
| Class II | .33% | 48 |
| Class III | .43% | 93 |
| Class IV | .68% | 12 |
| Select Class | .23% | 144 |
| Institutional Class | .14% | 10,164 |
| Prime Reserves Portfolio | ||
| Class I | .18% | $116 |
| Class II | .33% | 2 |
| Class III | .43% | 2 |
| Select Class | .23% | 2 |
| Institutional Class | .14% | 363 |
| Tax-Exempt Portfolio | ||
| Class I | .18% | $691 |
| Class II | .33% | –(a) |
| Class III | .43% | 16 |
| Select Class | .23% | –(a) |
(a) In the amount of less than five hundred dollars.
Additionally, the investment adviser or its affiliates voluntarily agreed to waive certain fees in order to maintain a minimum annualized yield of .01%. Such arrangements may be discontinued by the investment adviser at any time. For the period, the amount of the waiver for each class was as follows:
| Treasury Only Portfolio | |
| Class II | $3 |
| Class III | 470 |
| Class IV | 253 |
| Treasury Portfolio | |
| Class II | $–(a) |
| Class III | 978 |
| Class IV | 1,948 |
| Government Portfolio | |
| Class III | $116 |
| Prime Money Market Portfolio | |
| Class IV | $53 |
| Prime Reserves Portfolio | |
| Class III | $–(a) |
| Tax-Exempt Portfolio | |
| Class III | $13 |
(a) In the amount of less than five hundred dollars.
In addition, through arrangements with each applicable Fund's custodian, credits realized as a result of certain uninvested cash balances were used to reduce each Fund's expenses. All of the applicable expense reductions are noted in the table below.
| Custody expense reduction | |
| Treasury Only Portfolio | $36 |
| Treasury Portfolio | – |
| Government Portfolio | –(a) |
| Money Market Portfolio | 10 |
| Prime Money Market Portfolio | 8 |
| Prime Reserves Portfolio | –(a) |
| Tax-Exempt Portfolio | 11 |
(a) In the amount of less than five hundred dollars.
6. Distributions to Shareholders.
Distributions to shareholders of each class were as follows:
| Year ended March 31, 2017 | Year ended March 31, 2016 | |
| Treasury Only Portfolio | ||
| From net investment income | ||
| Class I | $19,836 | $3,944 |
| Class II | 161 | 33 |
| Class III | 399 | 69 |
| Class IV | 8 | 33 |
| Select Class | 257 | 39 |
| Institutional Class | 10,556 | 497 |
| Total | $31,217 | $4,615 |
| Treasury Portfolio | ||
| From net investment income | ||
| Class I | $27,548 | $5,136 |
| Class II | 432 | 64 |
| Class III | 1,362 | 271 |
| Class IV | 90 | 69 |
| Select Class | 648 | 87 |
| Institutional Class | 16,422 | 1,117 |
| Total | $46,502 | $6,744 |
| Government Portfolio | ||
| From net investment income | ||
| Class I | $97,048 | $13,726 |
| Class II | 1,324 | 81 |
| Class III | 1,908 | 189 |
| Select Class | 1,728 | 117 |
| Institutional Class | 171,199 | 6,390 |
| Total | $273,207 | $20,503 |
| Money Market Portfolio | ||
| From net investment income | ||
| Class I | $51,603 | $39,384 |
| Class II | 128 | 59 |
| Class III | 681 | 437 |
| Select Class | 175 | 412 |
| Class F | 1,013 | 5,349 |
| Institutional Class | 72,560 | 77,126 |
| Total | $126,160 | $122,767 |
| Prime Money Market Portfolio | ||
| From net investment income | ||
| Class I | $21,114 | $17,794 |
| Class II | 500 | 178 |
| Class III | 628 | 324 |
| Class IV | 5 | 19 |
| Select Class | 2,111 | 1,387 |
| Institutional Class | 136,235 | 81,754 |
| Total | $160,593 | $101,456 |
| From net realized gain | ||
| Class I | $1,805 | $– |
| Class II | 141 | – |
| Class III | 148 | – |
| Select Class | 20 | – |
| Institutional Class | 8,246 | – |
| Total | $10,360 | $– |
| Prime Reserves Portfolio(a) | ||
| From net investment income | ||
| Class I | $1,214 | $– |
| Class II | 3 | – |
| Class III | 3 | – |
| Select Class | 4 | – |
| Institutional Class | 2,571 | – |
| Total | $3,795 | $– |
| Tax-Exempt Portfolio | ||
| From net investment income | ||
| Class I | $7,094 | $256 |
| Class II | 1 | 1 |
| Class III | 17 | 30 |
| Select Class | 1 | – |
| Total | $7,113 | $287 |
| From net realized gain | ||
| Class I | $980 | $1,590 |
| Class II | –(b) | 6 |
| Class III | 60 | 215 |
| Select Class | –(b) | 3 |
| Total | $1,040 | $1,814 |
(a) Distributions are for the period June 2, 2016 (commencement of operations) to March 31, 2017.
(b) In the amount of less than five hundred dollars.
7. Share Transactions.
Share transactions for each class of shares at a $1.00 per share were as follows and may contain automatic conversions between classes or exchanges between affiliated funds:
| Dollars | Dollars | |||
| Year ended March 31, 2017 | Year ended March 31, 2016 | Year ended March 31, 2017 | Year ended March 31, 2016 | |
| Treasury Only Portfolio | ||||
| Class I | ||||
| Shares sold | 15,240,325 | 23,930,981 | $15,240,325 | $23,930,981 |
| Reinvestment of distributions | 12,773 | 2,493 | 12,773 | 2,493 |
| Shares redeemed | (17,650,692) | (23,300,949) | (17,650,692) | (23,300,949) |
| Net increase (decrease) | (2,397,594) | 632,525 | $(2,397,594) | $632,525 |
| Class II | ||||
| Shares sold | 297,056 | 468,539 | $297,056 | $468,539 |
| Reinvestment of distributions | 85 | 16 | 85 | 16 |
| Shares redeemed | (445,655) | (471,381) | (445,655) | (471,381) |
| Net increase (decrease) | (148,514) | (2,826) | $(148,514) | $(2,826) |
| Class III | ||||
| Shares sold | 4,840,544 | 3,609,622 | $4,840,544 | $3,609,622 |
| Reinvestment of distributions | 184 | 22 | 184 | 22 |
| Shares redeemed | (4,750,231) | (3,413,941) | (4,750,231) | (3,413,941) |
| Net increase (decrease) | 90,497 | 195,703 | $90,497 | $195,703 |
| Class IV | ||||
| Shares sold | 125,268 | 575,857 | $125,268 | $575,857 |
| Reinvestment of distributions | 8 | 33 | 8 | 33 |
| Shares redeemed | (430,935) | (351,664) | (430,935) | (351,664) |
| Net increase (decrease) | (305,659) | 224,226 | $(305,659) | $224,226 |
| Select Class | ||||
| Shares sold | 1,280,315 | 1,886,187 | $1,280,315 | $1,886,187 |
| Reinvestment of distributions | 145 | 33 | 145 | 33 |
| Shares redeemed | (1,366,793) | (1,900,313) | (1,366,793) | (1,900,313) |
| Net increase (decrease) | (86,333) | (14,093) | $(86,333) | $(14,093) |
| Institutional Class | ||||
| Shares sold | 9,635,535 | 2,583,114 | $9,635,535 | $2,583,114 |
| Reinvestment of distributions | 5,228 | 334 | 5,228 | 334 |
| Shares redeemed | (6,678,289) | (778,317) | (6,678,289) | (778,317) |
| Net increase (decrease) | 2,962,474 | 1,805,131 | $2,962,474 | $1,805,131 |
| Treasury Portfolio | ||||
| Class I | ||||
| Shares sold | 80,854,303 | 77,692,489 | $80,854,303 | $77,692,489 |
| Reinvestment of distributions | 8,190 | 2,220 | 8,190 | 2,220 |
| Shares redeemed | (82,194,540) | (79,782,544) | (82,194,540) | (79,782,544) |
| Net increase (decrease) | (1,332,047) | (2,087,835) | $(1,332,047) | $(2,087,835) |
| Class II | ||||
| Shares sold | 2,878,086 | 3,132,744 | $2,878,086 | $3,132,744 |
| Reinvestment of distributions | 13 | 1 | 13 | 1 |
| Shares redeemed | (3,071,872) | (2,646,421) | (3,071,872) | (2,646,421) |
| Net increase (decrease) | (193,773) | 486,324 | $(193,773) | $486,324 |
| Class III | ||||
| Shares sold | 8,729,467 | 8,969,249 | $8,729,467 | $8,969,249 |
| Reinvestment of distributions | 184 | 35 | 184 | 35 |
| Shares redeemed | (9,027,771) | (8,974,000) | (9,027,771) | (8,974,000) |
| Net increase (decrease) | (298,120) | (4,716) | $(298,120) | $(4,716) |
| Class IV | ||||
| Shares sold | 931,051 | 1,359,716 | $931,051 | $1,359,716 |
| Reinvestment of distributions | –(a) | – | –(a) | – |
| Shares redeemed | (1,042,845) | (1,075,523) | (1,042,845) | (1,075,523) |
| Net increase (decrease) | (111,794) | 284,193 | $(111,794) | $284,193 |
| Select Class | ||||
| Shares sold | 1,653,663 | 1,469,924 | $1,653,663 | $1,469,924 |
| Reinvestment of distributions | 177 | 49 | 177 | 49 |
| Shares redeemed | (1,665,048) | (1,407,519) | (1,665,048) | (1,407,519) |
| Net increase (decrease) | (11,208) | 62,454 | $(11,208) | $62,454 |
| Institutional Class | ||||
| Shares sold | 47,643,870 | 8,440,821 | $47,643,870 | $8,440,821 |
| Reinvestment of distributions | 12,675 | 954 | 12,675 | 954 |
| Shares redeemed | (44,216,941) | (5,906,037) | (44,216,941) | (5,906,037) |
| Net increase (decrease) | 3,439,604 | 2,535,738 | $3,439,604 | $2,535,738 |
| Government Portfolio | ||||
| Class I | ||||
| Shares sold | 216,719,320 | 140,405,028 | $216,719,320 | $140,405,028 |
| Reinvestment of distributions | 26,560 | 5,103 | 26,560 | 5,103 |
| Shares redeemed | (207,297,666) | (137,697,131) | (207,297,666) | (137,697,131) |
| Net increase (decrease) | 9,448,214 | 2,713,000 | $9,448,214 | $2,713,000 |
| Class II | ||||
| Shares sold | 6,254,053 | 7,709,478 | $6,254,053 | $7,709,478 |
| Reinvestment of distributions | 126 | 22 | 126 | 22 |
| Shares redeemed | (5,830,322) | (7,763,586) | (5,830,322) | (7,763,586) |
| Net increase (decrease) | 423,857 | (54,086) | $423,857 | $(54,086) |
| Class III | ||||
| Shares sold | 7,571,865 | 5,143,852 | $7,571,865 | $5,143,852 |
| Reinvestment of distributions | 728 | 43 | 728 | 43 |
| Shares redeemed | (6,492,450) | (5,306,134) | (6,492,450) | (5,306,134) |
| Net increase (decrease) | 1,080,143 | (162,239) | $1,080,143 | $(162,239) |
| Select Class | ||||
| Shares sold | 3,163,969 | 1,343,910 | $3,163,969 | $1,343,910 |
| Reinvestment of distributions | 1,025 | 74 | 1,025 | 74 |
| Shares redeemed | (2,809,636) | (1,744,490) | (2,809,636) | (1,744,490) |
| Net increase (decrease) | 355,358 | (400,506) | $355,358 | $(400,506) |
| Institutional Class | ||||
| Shares sold | 418,317,187 | 109,287,709 | $418,317,187 | $109,287,709 |
| Reinvestment of distributions | 113,432 | 4,948 | 113,432 | 4,948 |
| Shares redeemed | (379,400,119) | (91,519,927) | (379,400,119) | (91,519,927) |
| Net increase (decrease) | 39,030,500 | 17,772,730 | $39,030,500 | $17,772,730 |
| Money Market Portfolio | ||||
| Class I | ||||
| Shares sold | 11,251,590 | 98,348,331 | $11,251,590 | $98,348,331 |
| Reinvestment of distributions | 42,256 | 28,391 | 42,256 | 28,391 |
| Shares redeemed | (23,578,146) | (100,118,863) | (23,578,146) | (100,118,863) |
| Net increase (decrease) | (12,284,300) | (1,742,141) | $(12,284,300) | $(1,742,141) |
| Class II | ||||
| Shares sold | 99,339 | 952,260 | $99,339 | $952,260 |
| Reinvestment of distributions | 115 | 45 | 115 | 45 |
| Shares redeemed | (161,055) | (971,326) | (161,055) | (971,326) |
| Net increase (decrease) | (61,601) | (19,021) | $(61,601) | $(19,021) |
| Class III | ||||
| Shares sold | 1,252,013 | 8,694,671 | $1,252,013 | $8,694,671 |
| Reinvestment of distributions | 419 | 134 | 419 | 134 |
| Shares redeemed | (2,290,247) | (9,019,943) | (2,290,247) | (9,019,943) |
| Net increase (decrease) | (1,037,815) | (325,138) | $(1,037,815) | $(325,138) |
| Select Class | ||||
| Shares sold | 224,289 | 888,733 | $224,289 | $888,733 |
| Reinvestment of distributions | 62 | 77 | 62 | 77 |
| Shares redeemed | (435,943) | (1,071,857) | (435,943) | (1,071,857) |
| Net increase (decrease) | (211,592) | (183,047) | $(211,592) | $(183,047) |
| Class F | ||||
| Shares sold | 129,619 | 1,731,609 | $129,619 | $1,731,609 |
| Reinvestment of distributions | 713 | 5,349 | 713 | 5,349 |
| Shares redeemed | (2,434,015) | (1,496,721) | (2,434,015) | (1,496,721) |
| Net increase (decrease) | (2,303,683) | 240,237 | $(2,303,683) | $240,237 |
| Institutional Class | ||||
| Shares sold | 25,232,850 | 194,088,843 | $25,232,850 | $194,088,843 |
| Reinvestment of distributions | 61,995 | 54,657 | 61,995 | 54,657 |
| Shares redeemed | (37,111,312) | (209,197,535) | (37,111,312) | (209,197,535) |
| Net increase (decrease) | (11,816,467) | (15,054,035) | $(11,816,467) | $(15,054,035) |
| Prime Money Market Portfolio | ||||
| Class I | ||||
| Shares sold | 74,144,867 | 117,973,183 | $74,146,617 | $117,973,183 |
| Reinvestment of distributions | 8,804 | 6,449 | 8,805 | 6,449 |
| Shares redeemed | (82,924,114) | (114,578,138) | (82,926,664) | (114,578,138) |
| Net increase (decrease) | (8,770,443) | 3,401,494 | $(8,771,242) | $3,401,494 |
| Class II | ||||
| Shares sold | 3,641,037 | 1,906,686 | $3,641,047 | $1,906,686 |
| Reinvestment of distributions | 126 | 32 | 126 | 32 |
| Shares redeemed | (3,858,268) | (2,115,257) | (3,858,336) | (2,115,257) |
| Net increase (decrease) | (217,105) | (208,539) | $(217,163) | $(208,539) |
| Class III | ||||
| Shares sold | 2,637,729 | 5,517,790 | $2,637,736 | $5,517,790 |
| Reinvestment of distributions | 136 | 62 | 136 | 62 |
| Shares redeemed | (3,523,935) | (5,634,833) | (3,524,041) | (5,634,833) |
| Net increase (decrease) | (886,070) | (116,981) | $(886,169) | $(116,981) |
| Class IV | ||||
| Shares sold | 39,312 | 136,156 | $39,312 | $136,156 |
| Reinvestment of distributions | 5 | 19 | 5 | 19 |
| Shares redeemed | (223,046) | (159,570) | (223,046) | (159,570) |
| Net increase (decrease) | (183,729) | (23,395) | $(183,729) | $(23,395) |
| Select Class | ||||
| Shares sold | 3,823,277 | 6,946,481 | $3,823,282 | $6,946,481 |
| Reinvestment of distributions | 1,007 | 587 | 1,007 | 587 |
| Shares redeemed | (4,567,165) | (7,244,431) | (4,567,177) | (7,244,431) |
| Net increase (decrease) | (742,881) | (297,363) | $(742,888) | $(297,363) |
| Institutional Class | ||||
| Shares sold | 236,441,408 | 505,615,310 | $236,454,059 | $505,615,310 |
| Reinvestment of distributions | 84,139 | 48,811 | 84,149 | 48,811 |
| Shares redeemed | (273,660,217) | (491,707,571) | (273,673,354) | (491,707,571) |
| Net increase (decrease) | (37,134,670) | 13,956,550 | $(37,135,146) | $13,956,550 |
| Prime Reserves Portfolio(b) | ||||
| Class I | ||||
| Shares sold | 694,526 | – | $694,596 | $– |
| Reinvestment of distributions | 744 | – | 744 | – |
| Shares redeemed | (155,762) | – | (155,776) | – |
| Net increase (decrease) | 539,508 | – | $539,564 | $– |
| Class II | ||||
| Shares sold | 1,000 | – | $1,000 | $– |
| Reinvestment of distributions | 3 | – | 3 | – |
| Net increase (decrease) | 1,003 | – | $1,003 | $– |
| Class III | ||||
| Shares sold | 1,000 | – | $1,000 | $– |
| Reinvestment of distributions | 3 | – | 3 | – |
| Shares redeemed | –(a) | – | –(a) | – |
| Net increase (decrease) | 1,003 | – | $1,003 | $– |
| Select Class | ||||
| Shares sold | 1,443 | – | $1,443 | $– |
| Reinvestment of distributions | 4 | – | 4 | – |
| Net increase (decrease) | 1,447 | – | $1,447 | $– |
| Institutional Class | ||||
| Shares sold | 1,676,735 | – | $1,676,859 | $– |
| Reinvestment of distributions | 2,323 | – | 2,324 | – |
| Shares redeemed | (714,231) | – | (714,266) | – |
| Net increase (decrease) | 964,827 | – | $964,917 | $– |
| Tax-Exempt Portfolio | ||||
| Class I | ||||
| Shares sold | 2,969,785 | 3,853,663 | $2,969,785 | $3,853,663 |
| Reinvestment of distributions | 5,765 | 864 | 5,765 | 864 |
| Shares redeemed | (2,141,221) | (4,589,991) | (2,141,221) | (4,589,991) |
| Net increase (decrease) | 834,329 | (735,464) | $834,329 | $(735,464) |
| Class II | ||||
| Shares sold | 67 | 398 | $67 | $398 |
| Reinvestment of distributions | 2 | 7 | 2 | 7 |
| Shares redeemed | (447) | (12,033) | (447) | (12,033) |
| Net increase (decrease) | (378) | (11,628) | $(378) | $(11,628) |
| Class III | ||||
| Shares sold | 115,337 | 2,845,086 | $115,337 | $2,845,086 |
| Reinvestment of distributions | 33 | 74 | 33 | 74 |
| Shares redeemed | (325,665) | (2,914,558) | (325,665) | (2,914,558) |
| Net increase (decrease) | (210,295) | (69,398) | $(210,295) | $(69,398) |
| Select Class | ||||
| Shares sold | 2,063 | 30,765 | $2,063 | $30,765 |
| Reinvestment of distributions | 1 | 1 | 1 | 1 |
| Shares redeemed | (5,762) | (31,384) | (5,762) | (31,384) |
| Net increase (decrease) | (3,698) | (618) | $(3,698) | $(618) |
(a) In the amount of less than five hundred dollars.
(b) Share transactions are for the period June 2, 2016 (commencement of operations) to March 31, 2017.
8. Other.
The Funds' organizational documents provide former and current trustees and officers with a limited indemnification against liabilities arising in connection with the performance of their duties to the Funds. In the normal course of business, the Funds may also enter into contracts that provide general indemnifications. The Funds' maximum exposure under these arrangements is unknown as this would be dependent on future claims that may be made against the Funds. The risk of material loss from such claims is considered remote.
Report of Independent Registered Public Accounting Firm
To the Trustees of Fidelity Colchester Street Trust and the Shareholders of Treasury Only Portfolio, Treasury Portfolio, Government Portfolio, Money Market Portfolio, Prime Money Market Portfolio, Prime Reserves Portfolio and Tax-Exempt Portfolio:
We have audited the accompanying statements of assets and liabilities of Treasury Only Portfolio, Treasury Portfolio, Government Portfolio, Money Market Portfolio, Prime Money Market Portfolio, Prime Reserves Portfolio and Tax-Exempt Portfolio (the Funds), each a fund of the Fidelity Colchester Street Trust, including the schedules of investments, as of March 31, 2017, and the related statements of operations for the year or period then ended, and the statements of changes in net assets and the financial highlights for each of the periods presented. These financial statements and financial highlights are the responsibility of the Funds' management. Our responsibility is to express an opinion on these financial statements and financial highlights based on our audits.
We conducted our audits in accordance with the standards of the Public Company Accounting Oversight Board (United States). Those standards require that we plan and perform the audit to obtain reasonable assurance about whether the financial statements and financial highlights are free of material misstatement. The Funds are not required to have, nor were we engaged to perform, an audit of their internal control over financial reporting. Our audits included consideration of internal control over financial reporting as a basis for designing audit procedures that are appropriate in the circumstances, but not for the purpose of expressing an opinion on the effectiveness of the Funds' internal control over financial reporting. Accordingly, we express no such opinion. An audit also includes examining, on a test basis, evidence supporting the amounts and disclosures in the financial statements, assessing the accounting principles used and significant estimates made by management, as well as evaluating the overall financial statement presentation. Our procedures included confirmation of securities owned as of March 31, 2017, by correspondence with the custodians and brokers; when replies were not received from brokers, we performed other auditing procedures. We believe that our audits provide a reasonable basis for our opinion.
In our opinion, such financial statements and financial highlights referred to above present fairly, in all material respects, the financial position of Treasury Only Portfolio, Treasury Portfolio, Government Portfolio, Money Market Portfolio, Prime Money Market Portfolio, Prime Reserves Portfolio and Tax-Exempt Portfolio as of March 31, 2017, the results of their operations for the year or period then ended, and the changes in their net assets and the financial highlights for each of the periods presented in conformity with accounting principles generally accepted in the United States of America.
DELOITTE & TOUCHE LLP
Boston, Massachusetts
May 17, 2017
Trustees and Officers
The Trustees, Members of the Advisory Board (if any), and officers of the trust and funds, as applicable, are listed below. The Board of Trustees governs each fund and is responsible for protecting the interests of shareholders. The Trustees are experienced executives who meet periodically throughout the year to oversee each fund's activities, review contractual arrangements with companies that provide services to each fund, oversee management of the risks associated with such activities and contractual arrangements, and review each fund's performance. Each of the Trustees oversees 244 funds.
The Trustees hold office without limit in time except that (a) any Trustee may resign; (b) any Trustee may be removed by written instrument, signed by at least two-thirds of the number of Trustees prior to such removal; (c) any Trustee who requests to be retired or who has become incapacitated by illness or injury may be retired by written instrument signed by a majority of the other Trustees; and (d) any Trustee may be removed at any special meeting of shareholders by a two-thirds vote of the outstanding voting securities of the trust. Each Trustee who is not an interested person (as defined in the 1940 Act) of the trust and the funds is referred to herein as an Independent Trustee. Each Independent Trustee shall retire not later than the last day of the calendar year in which his or her 75th birthday occurs. The Independent Trustees may waive this mandatory retirement age policy with respect to individual Trustees. Officers and Advisory Board Members hold office without limit in time, except that any officer or Advisory Board Member may resign or may be removed by a vote of a majority of the Trustees at any regular meeting or any special meeting of the Trustees. Except as indicated, each individual has held the office shown or other offices in the same company for the past five years.
Each fund’s Statement of Additional Information (SAI) includes more information about the Trustees. To request a free copy, call Fidelity at 1-877-297-2952.
Experience, Skills, Attributes, and Qualifications of the Trustees. The Governance and Nominating Committee has adopted a statement of policy that describes the experience, qualifications, attributes, and skills that are necessary and desirable for potential Independent Trustee candidates (Statement of Policy). The Board believes that each Trustee satisfied at the time he or she was initially elected or appointed a Trustee, and continues to satisfy, the standards contemplated by the Statement of Policy. The Governance and Nominating Committee also engages professional search firms to help identify potential Independent Trustee candidates who have the experience, qualifications, attributes, and skills consistent with the Statement of Policy. From time to time, additional criteria based on the composition and skills of the current Independent Trustees, as well as experience or skills that may be appropriate in light of future changes to board composition, business conditions, and regulatory or other developments, have also been considered by the professional search firms and the Governance and Nominating Committee. In addition, the Board takes into account the Trustees' commitment and participation in Board and committee meetings, as well as their leadership of standing and ad hoc committees throughout their tenure.
In determining that a particular Trustee was and continues to be qualified to serve as a Trustee, the Board has considered a variety of criteria, none of which, in isolation, was controlling. The Board believes that, collectively, the Trustees have balanced and diverse experience, qualifications, attributes, and skills, which allow the Board to operate effectively in governing each fund and protecting the interests of shareholders. Information about the specific experience, skills, attributes, and qualifications of each Trustee, which in each case led to the Board's conclusion that the Trustee should serve (or continue to serve) as a trustee of the funds, is provided below.
Board Structure and Oversight Function. Abigail P. Johnson is an interested person and currently serves as Chairman. The Trustees have determined that an interested Chairman is appropriate and benefits shareholders because an interested Chairman has a personal and professional stake in the quality and continuity of services provided to the funds. Independent Trustees exercise their informed business judgment to appoint an individual of their choosing to serve as Chairman, regardless of whether the Trustee happens to be independent or a member of management. The Independent Trustees have determined that they can act independently and effectively without having an Independent Trustee serve as Chairman and that a key structural component for assuring that they are in a position to do so is for the Independent Trustees to constitute a substantial majority for the Board. The Independent Trustees also regularly meet in executive session. Marie L. Knowles serves as Chairman of the Independent Trustees and as such (i) acts as a liaison between the Independent Trustees and management with respect to matters important to the Independent Trustees and (ii) with management prepares agendas for Board meetings.
Fidelity® funds are overseen by different Boards of Trustees. The funds' Board oversees Fidelity's investment-grade bond, money market, asset allocation and certain equity funds, and other Boards oversee Fidelity's high income, sector and other equity funds. The asset allocation funds may invest in Fidelity® funds that are overseen by such other Boards. The use of separate Boards, each with its own committee structure, allows the Trustees of each group of Fidelity® funds to focus on the unique issues of the funds they oversee, including common research, investment, and operational issues. On occasion, the separate Boards establish joint committees to address issues of overlapping consequences for the Fidelity® funds overseen by each Board.
The Trustees operate using a system of committees to facilitate the timely and efficient consideration of all matters of importance to the Trustees, each fund, and fund shareholders and to facilitate compliance with legal and regulatory requirements and oversight of the funds' activities and associated risks. The Board, acting through its committees, has charged FMR and its affiliates with (i) identifying events or circumstances the occurrence of which could have demonstrably adverse effects on the funds' business and/or reputation; (ii) implementing processes and controls to lessen the possibility that such events or circumstances occur or to mitigate the effects of such events or circumstances if they do occur; and (iii) creating and maintaining a system designed to evaluate continuously business and market conditions in order to facilitate the identification and implementation processes described in (i) and (ii) above. Because the day-to-day operations and activities of the funds are carried out by or through FMR, its affiliates, and other service providers, the funds' exposure to risks is mitigated but not eliminated by the processes overseen by the Trustees. While each of the Board's committees has responsibility for overseeing different aspects of the funds' activities, oversight is exercised primarily through the Operations and Audit Committees. In addition, an ad hoc Board committee of Independent Trustees has worked with FMR to enhance the Board's oversight of investment and financial risks, legal and regulatory risks, technology risks, and operational risks, including the development of additional risk reporting to the Board. The Operations Committee also worked and continues to work with FMR to enhance the stress tests required under SEC regulations for money market funds. Appropriate personnel, including but not limited to the funds' Chief Compliance Officer (CCO), FMR's internal auditor, the independent accountants, the funds' Treasurer and portfolio management personnel, make periodic reports to the Board's committees, as appropriate, including an annual review of Fidelity's risk management program for the Fidelity® funds. The responsibilities of each standing committee, including their oversight responsibilities, are described further under "Standing Committees of the Trustees."
Interested Trustees*:
Correspondence intended for a Trustee who is an interested person may be sent to Fidelity Investments, 245 Summer Street, Boston, Massachusetts 02210.
Name, Year of Birth; Principal Occupations and Other Relevant Experience+
Abigail P. Johnson (1961)
Year of Election or Appointment: 2009
Trustee
Chairman of the Board of Trustees
Ms. Johnson also serves as Trustee of other Fidelity® funds. Ms. Johnson serves as Chairman (2016-present), Chief Executive Officer (2014-present), and Director (2007-present) of FMR LLC (diversified financial services company), President of Fidelity Financial Services (2012-present) and President of Personal, Workplace and Institutional Services (2005-present). Ms. Johnson is Chairman and Director of FMR Co., Inc. (investment adviser firm, 2011-present) and Chairman and Director of FMR (investment adviser firm, 2011-present). Previously, Ms. Johnson served as Vice Chairman (2007-2016) and President (2013-2016) of FMR LLC, President and a Director of FMR (2001-2005), a Trustee of other investment companies advised by FMR, Fidelity Investments Money Management, Inc. (investment adviser firm), and FMR Co., Inc. (2001-2005), Senior Vice President of the Fidelity® funds (2001-2005), and managed a number of Fidelity® funds. Ms. Abigail P. Johnson and Mr. Arthur E. Johnson are not related.
Jennifer Toolin McAuliffe (1959)
Year of Election or Appointment: 2016
Trustee
Ms. McAuliffe also serves as Trustee of other Fidelity® funds. Ms. McAuliffe previously served as a Member of the Advisory Board of certain Fidelity® funds (2016) and as Co-Head of Fixed Income of Fidelity Investments Limited (now known as FIL Limited (FIL)) (diversified financial services company). Earlier roles at FIL included Director of Research for FIL’s credit and quantitative teams in London, Hong Kong and Tokyo. Ms. McAuliffe also was the Director of Research for taxable and municipal bonds at Fidelity Investments Money Management, Inc. Ms. McAuliffe is also a director or trustee of several not-for-profit entities.
* Determined to be an “Interested Trustee” by virtue of, among other things, his or her affiliation with the trust or various entities under common control with FMR.
+ The information includes the Trustee's principal occupation during the last five years and other information relating to the experience, attributes, and skills relevant to the Trustee's qualifications to serve as a Trustee, which led to the conclusion that the Trustee should serve as a Trustee for each fund.
Independent Trustees:
Correspondence intended for an Independent Trustee may be sent to Fidelity Investments, P.O. Box 55235, Boston, Massachusetts 02205-5235.
Name, Year of Birth; Principal Occupations and Other Relevant Experience+
Elizabeth S. Acton (1951)
Year of Election or Appointment: 2015
Trustee
Ms. Acton also serves as Trustee of other Fidelity® funds. Prior to her retirement in April 2012, Ms. Acton was Executive Vice President, Finance (2011-2012), Executive Vice President, Chief Financial Officer (2002-2011), and Treasurer (2004-2005) of Comerica Incorporated (financial services). Prior to joining Comerica, Ms. Acton held a variety of positions at Ford Motor Company (1983-2002), including Vice President and Treasurer (2000-2002) and Executive Vice President and Chief Financial Officer of Ford Motor Credit Company (1998-2000). Ms. Acton currently serves as a member of the Board of Directors and Audit and Finance Committees of Beazer Homes USA, Inc. (homebuilding, 2012-present). Previously, Ms. Acton served as a Member of the Advisory Board of certain Fidelity® funds (2013-2016).
John Engler (1948)
Year of Election or Appointment: 2015
Trustee
Mr. Engler also serves as Trustee of other Fidelity® funds. He serves on the board of directors for Universal Forest Products (manufacturer and distributor of wood and wood-alternative products, 2003-present) and K12 Inc. (technology-based education company, 2012-present). Previously, Mr. Engler served as a Member of the Advisory Board of certain Fidelity® funds (2014-2016), president of the Business Roundtable (2011-2017), a trustee of The Munder Funds (2003-2014), president and CEO of the National Association of Manufacturers (2004-2011), member of the Board of Trustees of the Annie E. Casey Foundation (2004-2015), and as governor of Michigan (1991-2003). He is a past chairman of the National Governors Association.
Albert R. Gamper, Jr. (1942)
Year of Election or Appointment: 2006
Trustee
Mr. Gamper also serves as Trustee of other Fidelity® funds. Prior to his retirement in December 2004, Mr. Gamper served as Chairman of the Board of CIT Group Inc. (commercial finance). During his tenure with CIT Group Inc. Mr. Gamper served in numerous senior management positions, including Chairman (1987-1989; 1999-2001; 2002-2004), Chief Executive Officer (1987-2004), and President (2002-2003). Mr. Gamper currently serves as a member of the Board of Directors of Public Service Enterprise Group (utilities, 2000-present), and Member of the Board of Trustees of Barnabas Health Care System (1997-present). Previously, Mr. Gamper served as Chairman (2012-2015) and Vice Chairman (2011-2012) of the Independent Trustees of certain Fidelity® funds and as Chairman of the Board of Governors, Rutgers University (2004-2007).
Robert F. Gartland (1951)
Year of Election or Appointment: 2010
Trustee
Mr. Gartland also serves as Trustee of other Fidelity® funds. Mr. Gartland is Chairman and an investor in Gartland & Mellina Group Corp. (consulting, 2009-present). Previously, Mr. Gartland served as a partner and investor of Vietnam Partners LLC (investments and consulting, 2008-2011). Prior to his retirement, Mr. Gartland held a variety of positions at Morgan Stanley (financial services, 1979-2007) including Managing Director (1987-2007).
Arthur E. Johnson (1947)
Year of Election or Appointment: 2008
Trustee
Vice Chairman of the Independent Trustees
Mr. Johnson also serves as Trustee of other Fidelity® funds. Mr. Johnson serves as a member of the Board of Directors of Eaton Corporation plc (diversified power management, 2009-present) and Booz Allen Hamilton (management consulting, 2011-present). Prior to his retirement, Mr. Johnson served as Senior Vice President of Corporate Strategic Development of Lockheed Martin Corporation (defense contractor, 1999-2009). He previously served on the Board of Directors of IKON Office Solutions, Inc. (1999-2008), AGL Resources, Inc. (holding company, 2002-2016), and Delta Airlines (2005-2007). Mr. Arthur E. Johnson is not related to Ms. Abigail P. Johnson.
Michael E. Kenneally (1954)
Year of Election or Appointment: 2009
Trustee
Mr. Kenneally also serves as Trustee of other Fidelity® funds. Prior to his retirement, Mr. Kenneally served as Chairman and Global Chief Executive Officer of Credit Suisse Asset Management. Before joining Credit Suisse, he was an Executive Vice President and Chief Investment Officer for Bank of America Corporation. Earlier roles at Bank of America included Director of Research, Senior Portfolio Manager and Research Analyst, and Mr. Kenneally was awarded the Chartered Financial Analyst (CFA) designation in 1991.
Marie L. Knowles (1946)
Year of Election or Appointment: 2001
Trustee
Chairman of the Independent Trustees
Ms. Knowles also serves as Trustee of other Fidelity® funds. Prior to Ms. Knowles' retirement in June 2000, she served as Executive Vice President and Chief Financial Officer of Atlantic Richfield Company (ARCO) (diversified energy, 1996-2000). From 1993 to 1996, she was a Senior Vice President of ARCO and President of ARCO Transportation Company (pipeline and tanker operations). Ms. Knowles currently serves as a Director and Chairman of the Audit Committee of McKesson Corporation (healthcare service, since 2002). Ms. Knowles is a member of the Board of the Santa Catalina Island Company (real estate, 2009-present). Ms. Knowles is a Member of the Investment Company Institute Board of Governors and a Member of the Governing Council of the Independent Directors Council (2014-present). She also serves as a member of the Advisory Board for the School of Engineering of the University of Southern California. Previously, Ms. Knowles served as a Director of Phelps Dodge Corporation (copper mining and manufacturing, 1994-2007), URS Corporation (engineering and construction, 2000-2003) and America West (airline, 1999-2002). Ms. Knowles previously served as Vice Chairman of the Independent Trustees of certain Fidelity® funds (2012-2015).
Mark A. Murray (1954)
Year of Election or Appointment: 2016
Trustee
Mr. Murray also serves as Trustee of other Fidelity® funds. Mr. Murray is Vice Chairman (2013-present) of Meijer, Inc. (regional retail chain). Previously, Mr. Murray served as a Member of the Advisory Board of certain Fidelity® funds (2016) and as Co-Chief Executive Officer (2013-2016) and President (2006-2013) of Meijer, Inc. Mr. Murray serves as a member of the Board of Directors and Nuclear Review and Public Policy and Responsibility Committees of DTE Energy Company (diversified energy company, 2009-present). Mr. Murray also serves as a member of the Board of Directors of Spectrum Health (not-for-profit health system, 2015-present). Mr. Murray previously served as President of Grand Valley State University (2001-2006), Treasurer for the State of Michigan (1999-2001), Vice President of Finance and Administration for Michigan State University (1998-1999), and a member of the Board of Directors and Audit Committee and Chairman of the Nominating and Corporate Governance Committee of Universal Forest Products, Inc. (manufacturer and distributor of wood and wood-alternative products, 2004-2016). Mr. Murray is also a director or trustee of many community and professional organizations.
+ The information includes the Trustee's principal occupation during the last five years and other information relating to the experience, attributes, and skills relevant to the Trustee's qualifications to serve as a Trustee, which led to the conclusion that the Trustee should serve as a Trustee for each fund.
Advisory Board Members and Officers:
Correspondence intended for an officer may be sent to Fidelity Investments, 245 Summer Street, Boston, Massachusetts 02210. Officers appear below in alphabetical order.
Name, Year of Birth; Principal Occupation
Elizabeth Paige Baumann (1968)
Year of Election or Appointment: 2017
Interim Anti-Money Laundering (AML) Officer
Ms. Baumann also serves as AML Officer of other funds. She is Chief AML Officer (2012-present) and Senior Vice President (2014-present) of FMR LLC (diversified financial services company) and is an employee of Fidelity Investments. Previously, Ms. Baumann served as AML Officer of the funds (2012-2016), and Vice President (2007-2014) and Deputy Anti-Money Laundering Officer (2007-2012) of FMR LLC.
Marc R. Bryant (1966)
Year of Election or Appointment: 2015
Secretary and Chief Legal Officer (CLO)
Mr. Bryant also serves as Secretary and CLO of other funds. Mr. Bryant serves as CLO, Secretary, and Senior Vice President of Fidelity Management & Research Company (investment adviser firm, 2015-present) and FMR Co., Inc. (investment adviser firm, 2015-present); Secretary of Fidelity SelectCo, LLC (investment adviser firm, 2015-present) and Fidelity Investments Money Management, Inc. (investment adviser firm, 2015-present); and CLO of Fidelity Management & Research (Hong Kong) Limited and FMR Investment Management (UK) Limited (investment adviser firms, 2015-present) and Fidelity Management & Research (Japan) Limited (investment adviser firm, 2016-present). He is Senior Vice President and Deputy General Counsel of FMR LLC (diversified financial services company). Previously, Mr. Bryant served as Secretary and CLO of Fidelity Rutland Square Trust II (2010-2014) and Assistant Secretary of Fidelity's Fixed Income and Asset Allocation Funds (2013-2015). Prior to joining Fidelity Investments, Mr. Bryant served as a Senior Vice President and the Head of Global Retail Legal for AllianceBernstein L.P. (2006-2010), and as the General Counsel for ProFund Advisors LLC (2001-2006).
Jeffrey S. Christian (1961)
Year of Election or Appointment: 2016
Assistant Treasurer
Mr. Christian also serves as Assistant Treasurer of other funds. Mr. Christian is an employee of Fidelity Investments (2003-present).
Jonathan Davis (1968)
Year of Election or Appointment: 2010
Assistant Treasurer
Mr. Davis also serves as Assistant Treasurer of other funds, and is an employee of Fidelity Investments. Previously, Mr. Davis served as Vice President and Associate General Counsel of FMR LLC (diversified financial services company, 2003-2010).
Adrien E. Deberghes (1967)
Year of Election or Appointment: 2010
Assistant Treasurer
Mr. Deberghes also serves as an officer of other funds. He serves as Executive Vice President of Fidelity Investments Money Management, Inc. (FIMM) (investment adviser firm, 2016-present) and is an employee of Fidelity Investments (2008-present). Prior to joining Fidelity Investments, Mr. Deberghes was Senior Vice President of Mutual Fund Administration at State Street Corporation (2007-2008), Senior Director of Mutual Fund Administration at Investors Bank & Trust (2005-2007), and Director of Finance for Dunkin' Brands (2000-2005). Previously, Mr. Deberghes served in other fund officer roles.
Stephanie J. Dorsey (1969)
Year of Election or Appointment: 2013
President and Treasurer
Ms. Dorsey also serves as an officer of other funds. She is an employee of Fidelity Investments (2008-present) and has served in other fund officer roles. Prior to joining Fidelity Investments, Ms. Dorsey served as Treasurer (2004-2008) of the JPMorgan Mutual Funds and Vice President (2004-2008) of JPMorgan Chase Bank.
Howard J. Galligan III (1966)
Year of Election or Appointment: 2014
Chief Financial Officer
Mr. Galligan also serves as Chief Financial Officer of other funds. Mr. Galligan serves as President of Fidelity Pricing and Cash Management Services (FPCMS) (2014-present) and as a Director of Strategic Advisers, Inc. (investment adviser firm, 2008-present). Previously, Mr. Galligan served as Chief Administrative Officer of Asset Management (2011-2014) and Chief Operating Officer and Senior Vice President of Investment Support for Strategic Advisers, Inc. (2003-2011).
Scott C. Goebel (1968)
Year of Election or Appointment: 2015
Vice President
Mr. Goebel serves as Vice President of other funds and is an employee of Fidelity Investments (2001-present). Previously, Mr. Goebel served as Senior Vice President of Fidelity Management & Research Company (FMR) (investment adviser firm, 2016), Secretary of Fidelity SelectCo, LLC (investment adviser firm, 2013-2015), Fidelity Investments Money Management, Inc. (FIMM) (investment adviser firm, 2010-2015), and Fidelity Research and Analysis Company (FRAC) (investment adviser firm, 2010-2015); General Counsel, Secretary, and Senior Vice President of FMR (investment adviser firm, 2008-2015) and FMR Co., Inc. (investment adviser firm, 2008-2015); Assistant Secretary of Fidelity Management & Research (Japan) Limited (investment adviser firm, 2008-2015) and Fidelity Management & Research (U.K.) Inc. (investment adviser firm, 2008-2015); Chief Legal Officer (CLO) of Fidelity Management & Research (Hong Kong) Limited (investment adviser firm, 2008-2015); Secretary and CLO of certain Fidelity® funds (2008-2015); Assistant Secretary of FIMM (2008-2010), FRAC (2008-2010), and certain funds (2007-2008); and as Vice President and Secretary of Fidelity Distributors Corporation (FDC) (2005-2007).
Colm A. Hogan (1973)
Year of Election or Appointment: 2016
Assistant Treasurer
Mr. Hogan also serves as an officer of other funds. Mr. Hogan is an employee of Fidelity Investments (2005-present).
Timothy Huyck (1964)
Year of Election or Appointment: 2015
Vice President of Fidelity's Money Market Funds
Mr. Huyck also serves as Vice President of other funds. Mr. Huyck serves as Chief Investment Officer of Fidelity's Money Market Funds (2015-present) and is an employee of Fidelity Investments (1990-present).
Chris Maher (1972)
Year of Election or Appointment: 2013
Assistant Treasurer
Mr. Maher serves as Assistant Treasurer of other funds. Mr. Maher is Vice President of Valuation Oversight and is an employee of Fidelity Investments. Previously, Mr. Maher served as Vice President of Asset Management Compliance (2013), Vice President of the Program Management Group of FMR (investment adviser firm, 2010-2013), and Vice President of Valuation Oversight (2008-2010).
John B. McGinty, Jr. (1962)
Year of Election or Appointment: 2016
Chief Compliance Officer
Mr. McGinty also serves as Chief Compliance Officer of other funds. Mr. McGinty is Senior Vice President of Asset Management Compliance for Fidelity Investments and is an employee of Fidelity Investments (2016-present). Mr. McGinty previously served as Vice President, Senior Attorney at Eaton Vance Management (investment management firm, 2015-2016), and prior to Eaton Vance as global CCO for all firm operations and registered investment companies at GMO LLC (investment management firm, 2009-2015). Before joining GMO LLC, Mr. McGinty served as Senior Vice President, Deputy General Counsel for Fidelity Investments (2007-2009).
Jason P. Pogorelec (1975)
Year of Election or Appointment: 2015
Assistant Secretary
Mr. Pogorelec also serves as Assistant Secretary of other funds. Mr. Pogorelec serves as Vice President, Associate General Counsel (2010-present) and is an employee of Fidelity Investments (2006-present).
Nancy D. Prior (1967)
Year of Election or Appointment: 2014
Vice President
Ms. Prior also serves as Vice President of other funds. Ms. Prior serves as a Director of FMR Investment Management (UK) Limited (investment adviser firm, 2015-present), President (2016-present) and Director (2014-present) of Fidelity Investments Money Management, Inc. (FIMM) (investment adviser firm), President, Fixed Income (2014-present), Vice Chairman of FIAM LLC (investment adviser firm, 2014-present), and is an employee of Fidelity Investments (2002-present). Previously, Ms. Prior served as Vice President of Fidelity's Money Market Funds (2012-2014), President, Money Market and Short Duration Bond Group of Fidelity Management & Research (FMR) (investment adviser firm, 2013-2014), President, Money Market Group of FMR (2011-2013), Managing Director of Research (2009-2011), Senior Vice President and Deputy General Counsel (2007-2009), and Assistant Secretary of certain Fidelity® funds (2008-2009).
Stacie M. Smith (1974)
Year of Election or Appointment: 2013
Assistant Treasurer
Ms. Smith also serves as an officer of other funds. She is an employee of Fidelity Investments (2009-present) and has served in other fund officer roles. Prior to joining Fidelity Investments, Ms. Smith served as Senior Audit Manager of Ernst & Young LLP (accounting firm, 1996-2009). Previously, Ms. Smith served as Deputy Treasurer of certain Fidelity® funds (2013-2016).
Marc L. Spector (1972)
Year of Election or Appointment: 2016
Deputy Treasurer
Mr. Spector also serves as an officer of other funds. Mr. Spector is an employee of Fidelity Investments (2016-present). Prior to joining Fidelity Investments, Mr. Spector served as Director at the Siegfried Group (accounting firm, 2013-2016), and prior to Siegfried Group as audit senior manager at Deloitte & Touche (accounting firm, 2005-2013).
Renee Stagnone (1975)
Year of Election or Appointment: 2016
Assistant Treasurer
Ms. Stagnone also serves as an officer of other funds. Ms. Stagnone is an employee of Fidelity Investments (1997-present). Previously, Ms. Stagnone served as Deputy Treasurer of certain Fidelity® funds (2013-2016).
Shareholder Expense Example
As a shareholder of a Fund, you incur two types of costs: (1) transaction costs and (2) ongoing costs, including management fees, distribution and/or service (12b-1) fees and other Fund expenses. This Example is intended to help you understand your ongoing costs (in dollars) of investing in the Funds and to compare these costs with the ongoing costs of investing in other mutual funds.
The Example is based on an investment of $1,000 invested at the beginning of the period and held for the entire period (October 1, 2016 to March 31, 2017).
Actual Expenses
The first line of the accompanying table for each class of each fund provides information about actual account values and actual expenses. You may use the information in this line, together with the amount you invested, to estimate the expenses that you paid over the period. Simply divide your account value by $1,000.00 (for example, an $8,600 account value divided by $1,000.00 = 8.6), then multiply the result by the number in the first line for a class of the fund under the heading entitled "Expenses Paid During Period" to estimate the expenses you paid on your account during this period. In addition, each Fund, as a shareholder in the underlying Fidelity Central Funds, will indirectly bear its pro-rata share of the fees and expenses incurred by the underlying Fidelity Central Funds. These fees and expenses are not included in the Fund's annualized expense ratio used to calculate the expense estimate in the table below.
Hypothetical Example for Comparison Purposes
The second line of the accompanying table for each class of each fund provides information about hypothetical account values and hypothetical expenses based on a Class' actual expense ratio and an assumed rate of return of 5% per year before expenses, which is not the Class' actual return. The hypothetical account values and expenses may not be used to estimate the actual ending account balance or expenses you paid for the period. You may use this information to compare the ongoing costs of investing in the Fund and other funds. To do so, compare this 5% hypothetical example with the 5% hypothetical examples that appear in the shareholder reports of the other funds. In addition, each Fund, as a shareholder in the underlying Fidelity Central Funds, will indirectly bear its pro-rata share of the fees and expenses incurred by the underlying Fidelity Central Funds. These fees and expenses are not included in the Fund's annualized expense ratio used to calculate the expense estimate in the table below.
Please note that the expenses shown in the table are meant to highlight your ongoing costs only and do not reflect any transaction costs. Therefore, the second line of the table is useful in comparing ongoing costs only, and will not help you determine the relative total costs of owning different funds.
| Annualized Expense Ratio-A | Beginning Account Value October 1, 2016 | Ending Account Value March 31, 2017 | Expenses Paid During Period-B October 1, 2016 to March 31, 2017 | |
| Treasury Only Portfolio | ||||
| Class I | .18% | |||
| Actual | $1,000.00 | $1,001.50 | $.90 | |
| Hypothetical-C | $1,000.00 | $1,024.03 | $.91 | |
| Class II | .33% | |||
| Actual | $1,000.00 | $1,000.80 | $1.65 | |
| Hypothetical-C | $1,000.00 | $1,023.29 | $1.66 | |
| Class III | .41% | |||
| Actual | $1,000.00 | $1,000.40 | $2.04 | |
| Hypothetical-C | $1,000.00 | $1,022.89 | $2.07 | |
| Class IV | .48% | |||
| Actual | $1,000.00 | $1,000.00 | $2.39 | |
| Hypothetical-C | $1,000.00 | $1,022.54 | $2.42 | |
| Select Class | .23% | |||
| Actual | $1,000.00 | $1,001.30 | $1.15 | |
| Hypothetical-C | $1,000.00 | $1,023.78 | $1.16 | |
| Institutional Class | .14% | |||
| Actual | $1,000.00 | $1,001.70 | $.70 | |
| Hypothetical-C | $1,000.00 | $1,024.23 | $.71 | |
| Treasury Portfolio | ||||
| Class I | .18% | |||
| Actual | $1,000.00 | $1,001.70 | $.90 | |
| Hypothetical-C | $1,000.00 | $1,024.03 | $.91 | |
| Class II | .33% | |||
| Actual | $1,000.00 | $1,000.90 | $1.65 | |
| Hypothetical-C | $1,000.00 | $1,023.29 | $1.66 | |
| Class III | .42% | |||
| Actual | $1,000.00 | $1,000.50 | $2.09 | |
| Hypothetical-C | $1,000.00 | $1,022.84 | $2.12 | |
| Class IV | .50% | |||
| Actual | $1,000.00 | $1,000.10 | $2.49 | |
| Hypothetical-C | $1,000.00 | $1,022.44 | $2.52 | |
| Select Class | .23% | |||
| Actual | $1,000.00 | $1,001.40 | $1.15 | |
| Hypothetical-C | $1,000.00 | $1,023.78 | $1.16 | |
| Institutional Class | .14% | |||
| Actual | $1,000.00 | $1,001.90 | $.70 | |
| Hypothetical-C | $1,000.00 | $1,024.23 | $.71 | |
| Government Portfolio | ||||
| Class I | .18% | |||
| Actual | $1,000.00 | $1,001.90 | $.90 | |
| Hypothetical-C | $1,000.00 | $1,024.03 | $.91 | |
| Class II | .33% | |||
| Actual | $1,000.00 | $1,001.10 | $1.65 | |
| Hypothetical-C | $1,000.00 | $1,023.29 | $1.66 | |
| Class III | .43% | |||
| Actual | $1,000.00 | $1,000.60 | $2.14 | |
| Hypothetical-C | $1,000.00 | $1,022.79 | $2.17 | |
| Select Class | .23% | |||
| Actual | $1,000.00 | $1,001.60 | $1.15 | |
| Hypothetical-C | $1,000.00 | $1,023.78 | $1.16 | |
| Institutional Class | .14% | |||
| Actual | $1,000.00 | $1,002.10 | $.70 | |
| Hypothetical-C | $1,000.00 | $1,024.23 | $.71 | |
| Money Market Portfolio | ||||
| Class I | .18% | |||
| Actual | $1,000.00 | $1,004.10 | $.90 | |
| Hypothetical-C | $1,000.00 | $1,024.03 | $.91 | |
| Class II | .33% | |||
| Actual | $1,000.00 | $1,003.40 | $1.65 | |
| Hypothetical-C | $1,000.00 | $1,023.29 | $1.66 | |
| Class III | .43% | |||
| Actual | $1,000.00 | $1,002.90 | $2.15 | |
| Hypothetical-C | $1,000.00 | $1,022.79 | $2.17 | |
| Select Class | .23% | |||
| Actual | $1,000.00 | $1,003.90 | $1.15 | |
| Hypothetical-C | $1,000.00 | $1,023.78 | $1.16 | |
| Institutional Class | .14% | |||
| Actual | $1,000.00 | $1,004.30 | $.70 | |
| Hypothetical-C | $1,000.00 | $1,024.23 | $.71 | |
| Prime Money Market Portfolio | ||||
| Class I | .18% | |||
| Actual | $1,000.00 | $1,004.10 | $.91 | |
| Hypothetical-C | $1,000.00 | $1,024.93 | $.92 | |
| Class II | .33% | |||
| Actual | $1,000.00 | $1,003.30 | $1.65 | |
| Hypothetical-C | $1,000.00 | $1,024.93 | $1.67 | |
| Class III | .43% | |||
| Actual | $1,000.00 | $1,002.80 | $2.15 | |
| Hypothetical-C | $1,000.00 | $1,022.79 | $2.17 | |
| Class IV | .68% | |||
| Actual | $1,000.00 | $1,002.10 | $3.39 | |
| Hypothetical-C | $1,000.00 | $1,021.54 | $3.43 | |
| Select Class | .23% | |||
| Actual | $1,000.00 | $1,004.00 | $1.15 | |
| Hypothetical-C | $1,000.00 | $1,023.78 | $1.16 | |
| Institutional Class | .14% | |||
| Actual | $1,000.00 | $1,004.20 | $.70 | |
| Hypothetical-C | $1,000.00 | $1,024.93 | $.70 | |
| Prime Reserves Portfolio | ||||
| Class I | .18% | |||
| Actual | $1,000.00 | $1,003.70 | $.90 | |
| Hypothetical-C | $1,000.00 | $1,024.93 | $.91 | |
| Class II | .33% | |||
| Actual | $1,000.00 | $1,003.00 | $1.65 | |
| Hypothetical-C | $1,000.00 | $1,024.93 | $1.67 | |
| Class III | .43% | |||
| Actual | $1,000.00 | $1,002.50 | $2.15 | |
| Hypothetical-C | $1,000.00 | $1,024.93 | $2.17 | |
| Select Class | .23% | |||
| Actual | $1,000.00 | $1,003.50 | $1.15 | |
| Hypothetical-C | $1,000.00 | $1,024.93 | $1.16 | |
| Institutional Class | .14% | |||
| Actual | $1,000.00 | $1,003.90 | $.70 | |
| Hypothetical-C | $1,000.00 | $1,024.93 | $.71 | |
| Tax-Exempt Portfolio | ||||
| Class I | .18% | |||
| Actual | $1,000.00 | $1,002.70 | $.90 | |
| Hypothetical-C | $1,000.00 | $1,024.03 | $.91 | |
| Class II | .33% | |||
| Actual | $1,000.00 | $1,001.90 | $1.65 | |
| Hypothetical-C | $1,000.00 | $1,023.29 | $1.66 | |
| Class III | .43% | |||
| Actual | $1,000.00 | $1,001.40 | $2.15 | |
| Hypothetical-C | $1,000.00 | $1,022.79 | $2.17 | |
| Select Class | .23% | |||
| Actual | $1,000.00 | $1,002.40 | $1.15 | |
| Hypothetical-C | $1,000.00 | $1,023.78 | $1.16 | |
A Annualized expense ratio reflects expenses net of applicable fee waivers.
B Expenses are equal to each Class' annualized expense ratio, multiplied by the average account value over the period, multiplied by 182/ 365 (to reflect the one-half year period).
C 5% return per year before expenses
Distributions (Unaudited)
The funds hereby designate as capital gain dividend the amounts noted below for the taxable year ended March 31, 2017, or, if subsequently determined to be different, the net capital gain of such year.
| Treasury Only Portfolio | $98 |
| Treasury Portfolio | $14,786 |
| Money Market Portfolio | $507,605 |
| Prime Money Market Portfolio | $492,695 |
A percentage of the dividends distributed during the fiscal year for the following funds were derived from interest on U.S. Government securities which is generally exempt from state income tax
| Treasury Only Portfolio | 100% |
| Treasury Portfolio | 70.13% |
| Government Portfolio | 64.61% |
| Money Market Portfolio | 2.27% |
| Prime Money Market Portfolio | 2.94% |
The funds hereby designate the amounts noted below as distributions paid during the period January 1, 2017 to March 31, 2017 as qualifying to be taxed as interest-related dividends for nonresident alien shareholders:
| Treasury Only Portfolio | $11,515,897 |
| Treasury Portfolio | $16,210,573 |
| Government Portfolio | $115,375,514 |
| Money Market Portfolio | $29,724,625 |
| Prime Money Market Portfolio | $16,178,306 |
| Prime Reserves Portfolio | $1,984,884 |
During fiscal year ended 2017, 100% of Tax-Exempt Portfolio's income dividends were free from federal income tax, and 0.00% of the funds income dividends were subject to the federal alternative minimum tax.
The funds will notify shareholders in January 2018 of amounts for use in preparing 2017 income tax returns.
![]()
IMM-ANN-0517
1.701843.119
Item 2.
Code of Ethics
As of the end of the period, March 31, 2017, Fidelity Colchester Street Trust (the trust) has adopted a code of ethics, as defined in Item 2 of Form N-CSR, that applies to its President and Treasurer and its Chief Financial Officer. A copy of the code of ethics is filed as an exhibit to this Form N-CSR.
Item 3.
Audit Committee Financial Expert
The Board of Trustees of the trust has determined that Elizabeth S. Acton is an audit committee financial expert, as defined in Item 3 of Form N-CSR. Ms. Acton is independent for purposes of Item 3 of Form N-CSR.
Item 4.
Principal Accountant Fees and Services
Fees and Services
The following table presents fees billed by Deloitte & Touche LLP, the member firms of Deloitte Touche Tohmatsu, and their respective affiliates (collectively, “Deloitte Entities”) in each of the last two fiscal years for services rendered to Government Portfolio, Money Market Portfolio, Prime Money Market Portfolio, Prime Reserves Portfolio, Tax-Exempt Portfolio, Treasury Only Portfolio and Treasury Portfolio (the “Funds”):
Services Billed by Deloitte Entities
March 31, 2017 FeesA,B
| Audit Fees | Audit-Related Fees | Tax Fees | All Other Fees |
Government Portfolio | $39,000 | $- | $5,200 | $1,200 |
Money Market Portfolio | $38,000 | $- | $5,200 | $1,100 |
Prime Money Market Portfolio | $38,000 | $- | $5,200 | $2,100 |
Prime Reserves Portfolio | $32,000 | $- | $4,900 | $700 |
Tax-Exempt Portfolio | $32,000 | $- | $5,200 | $1,000 |
Treasury Only Portfolio | $33,000 | $- | $5,200 | $1,000 |
Treasury Portfolio | $39,000 | $- | $5,200 | $1,200 |
March 31, 2016 FeesA,B
| Audit Fees | Audit-Related Fees | Tax Fees | All Other Fees |
Government Portfolio | $42,000 | $- | $5,200 | $1,500 |
Money Market Portfolio | $40,000 | $- | $5,200 | $6,300 |
Prime Money Market Portfolio | $80,000 | $- | $5,200 | $2,400 |
Prime Reserves Portfolio | $- | $- | $- | $- |
Tax-Exempt Portfolio | $34,000 | $- | $5,200 | $1,100 |
Treasury Only Portfolio | $35,000 | $- | $5,200 | $2,400 |
Treasury Portfolio | $41,000 | $- | $5,200 | $3,200 |
A Amounts may reflect rounding.
B Prime Reserves Portfolio commenced operations on June 2, 2016.
The following table presents fees billed by Deloitte Entities that were required to be approved by the Audit Committee for services that relate directly to the operations and financial reporting of the Funds and that are rendered on behalf of Fidelity Management & Research Company (“FMR”) and entities controlling, controlled by, or under common control with FMR (not including any sub-adviser whose role is primarily portfolio management and is subcontracted with or overseen by another investment adviser) that provide ongoing services to the Funds (“Fund Service Providers”):
Services Billed by Deloitte Entities
| March 31, 2017A,B | March 31, 2016A,B |
Audit-Related Fees | $- | $40,000 |
Tax Fees | $5,000 | $10,000 |
All Other Fees | $- | $- |
A Amounts may reflect rounding.
B May include amounts billed prior to the Prime Reserves Portfolio’s commencement operations.
“Audit-Related Fees” represent fees billed for assurance and related services that are reasonably related to the performance of the fund audit or the review of the fund's financial statements and that are not reported under Audit Fees.
“Tax Fees” represent fees billed for tax compliance, tax advice or tax planning that relate directly to the operations and financial reporting of the fund.
“All Other Fees” represent fees billed for services provided to the fund or Fund Service Provider, a significant portion of which are assurance related, that relate directly to the operations and financial reporting of the fund, excluding those services that are reported under Audit Fees, Audit-Related Fees or Tax Fees.
Assurance services must be performed by an independent public accountant.
* * *
The aggregate non-audit fees billed by Deloitte Entities for services rendered to the Funds, FMR (not including any sub-adviser whose role is primarily portfolio management and is subcontracted with or overseen by another investment adviser), and any Fund Service Provider for each of the last two fiscal years of the Funds are as follows:
Billed By | March 31, 2017 A,B | March 31, 2016 A,B |
Deloitte Entities | $390,000 | $145,000 |
A Amounts may reflect rounding.
B May include amounts billed prior to the Prime Reserves Portfolio’s commencement operations.
The trust's Audit Committee has considered non-audit services that were not pre-approved that were provided by Deloitte Entities to Fund Service Providers to be compatible with maintaining the independence of Deloitte Entities in its audit of the Funds, taking into account representations from Deloitte Entities, in accordance with Public Company Accounting Oversight Board rules, regarding its independence from the Funds and their related entities and FMR’s review of the appropriateness and permissibility under applicable law of such non-audit services prior to their provision to the Fund Service Providers.
Audit Committee Pre-Approval Policies and Procedures
The trust’s Audit Committee must pre-approve all audit and non-audit services provided by a fund’s independent registered public accounting firm relating to the operations or financial reporting of the fund. Prior to the commencement of any audit or non-audit services to a fund, the Audit Committee reviews the services to determine whether they are appropriate and permissible under applicable law.
The Audit Committee has adopted policies and procedures to, among other purposes, provide a framework for the Committee’s consideration of non-audit services by the audit firms that audit the Fidelity funds. The policies and procedures require that any non-audit service provided by a fund audit firm to a Fidelity fund and any non-audit service provided by a fund auditor to a Fund Service Provider that relates directly to the operations and financial reporting of a Fidelity fund (“Covered Service”) are subject to approval by the Audit Committee before such service is provided.
All Covered Services must be approved in advance of provision of the service either: (i) by formal resolution of the Audit Committee, or (ii) by oral or written approval of the service by the Chair of the Audit Committee (or if the Chair is unavailable, such other member of the Audit Committee as may be designated by the Chair to act in the Chair’s absence). The approval contemplated by (ii) above is permitted where the Treasurer determines that action on such an engagement is necessary before the next meeting of the Audit Committee.
Non-audit services provided by a fund audit firm to a Fund Service Provider that do not relate directly to the operations and financial reporting of a Fidelity fund are reported to the Audit Committee on a periodic basis.
Non-Audit Services Approved Pursuant to Rule 2-01(c)(7)(i)(C) and (ii) of Regulation S-X (“De Minimis Exception”)
There were no non-audit services approved or required to be approved by the Audit Committee pursuant to the De Minimis Exception during the Funds’ last two fiscal years relating to services provided to (i) the Funds or (ii) any Fund Service Provider that relate directly to the operations and financial reporting of the Funds.
Item 5.
Audit Committee of Listed Registrants
Not applicable.
Item 6.
Investments
(a)
Not applicable.
(b)
Not applicable
Item 7.
Disclosure of Proxy Voting Policies and Procedures for Closed-End Management Investment Companies
Not applicable.
Item 8.
Portfolio Managers of Closed-End Management Investment Companies
Not applicable.
Item 9.
Purchase of Equity Securities by Closed-End Management Investment Company and Affiliated Purchasers
Not applicable.
Item 10.
Submission of Matters to a Vote of Security Holders
There were no material changes to the procedures by which shareholders may recommend nominees to the trust’s Board of Trustees.
Item 11.
Controls and Procedures
(a)(i) The President and Treasurer and the Chief Financial Officer have concluded that the trust’s disclosure controls and procedures (as defined in Rule 30a-3(c) under the Investment Company Act) provide reasonable assurances that material information relating to the trust is made known to them by the appropriate persons, based on their evaluation of these controls and procedures as of a date within 90 days of the filing date of this report.
(a)(ii) There was no change in the trust’s internal control over financial reporting (as defined in Rule 30a-3(d) under the Investment Company Act) that occurred during the second fiscal quarter of the period covered by this report that has materially affected, or is reasonably likely to materially affect, the trust’s internal control over financial reporting.
Item 12.
Exhibits
(a) | (1) | Code of Ethics pursuant to Item 2 of Form N-CSR is filed and attached hereto as EX-99.CODE ETH. |
(a) | (2) | Certification pursuant to Rule 30a-2(a) under the Investment Company Act of 1940 (17 CFR 270.30a-2(a)) is filed and attached hereto as Exhibit 99.CERT. |
(a) | (3) | Not applicable. |
(b) |
| Certification pursuant to Rule 30a-2(b) under the Investment Company Act of 1940 (17 CFR 270.30a-2(b)) is furnished and attached hereto as Exhibit 99.906CERT. |
SIGNATURES
Pursuant to the requirements of the Securities Exchange Act of 1934 and the Investment Company Act of 1940, the registrant has duly caused this report to be signed on its behalf by the undersigned, thereunto duly authorized.
Fidelity Colchester Street Trust
By: | /s/Stephanie J. Dorsey |
| Stephanie J. Dorsey |
| President and Treasurer |
|
|
Date: | May 25, 2017 |
Pursuant to the requirements of the Securities Exchange Act of 1934 and the Investment Company Act of 1940, this report has been signed below by the following persons on behalf of the registrant and in the capacities and on the dates indicated.
By: | /s/Stephanie J. Dorsey |
| Stephanie J. Dorsey |
| President and Treasurer |
|
|
Date: | May 25, 2017 |
By: | /s/Howard J. Galligan III |
| Howard J. Galligan III |
| Chief Financial Officer |
|
|
Date: | May 25, 2017 |