Fidelity® Investments Money Market Funds Treasury Only Portfolio
Treasury Portfolio
Government Portfolio
Money Market Portfolio
Prime Money Market Portfolio
Prime Reserves Portfolio
Tax-Exempt Portfolio
Annual Report March 31, 2018 |
 |
Contents
To view a fund's proxy voting guidelines and proxy voting record for the 12-month period ended June 30, visit http://www.fidelity.com/proxyvotingresults or visit the Securities and Exchange Commission's (SEC) web site at http://www.sec.gov.
You may also call 1-877-297-2952 to request a free copy of the proxy voting guidelines.
Standard & Poor's, S&P and S&P 500 are registered service marks of The McGraw-Hill Companies, Inc. and have been licensed for use by Fidelity Distributors Corporation.
Other third-party marks appearing herein are the property of their respective owners.
All other marks appearing herein are registered or unregistered trademarks or service marks of FMR LLC or an affiliated company. © 2018 FMR LLC. All rights reserved.
This report and the financial statements contained herein are submitted for the general information of the shareholders of the Funds. This report is not authorized for distribution to prospective investors in the Funds unless preceded or accompanied by an effective prospectus.
A fund files its complete schedule of portfolio holdings with the SEC for the first and third quarters of each fiscal year on Form N-Q. Forms N-Q are available on the SEC’s web site at http://www.sec.gov. A fund's Forms N-Q may be reviewed and copied at the SEC’s Public Reference Room in Washington, DC. Information regarding the operation of the SEC's Public Reference Room may be obtained by calling 1-800-SEC-0330.
For a complete list of a fund's portfolio holdings, view the most recent holdings listing, semiannual report, or annual report on Fidelity's web site at http://www.fidelity.com, http://www.institutional.fidelity.com, or http://www.401k.com, as applicable.
NOT FDIC INSURED •MAY LOSE VALUE •NO BANK GUARANTEE
Neither the Funds nor Fidelity Distributors Corporation is a bank.
Treasury Only Portfolio
Investment Summary/Performance (Unaudited)
Effective Maturity Diversification as of March 31, 2018
| Days | % of fund's investments 3/31/18 |
| 1 - 7 | 26.6 |
| 8 - 30 | 30.7 |
| 31 - 60 | 15.3 |
| 61 - 90 | 20.1 |
| 91 - 180 | 7.3 |
Effective maturity is determined in accordance with the requirements of Rule 2a-7 under the Investment Company Act of 1940.
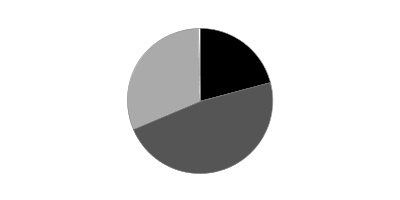
Asset Allocation (% of fund's net assets)
| As of March 31, 2018 |
| | U.S. Treasury Debt | 95.9% |
| | Net Other Assets (Liabilities) | 4.1% |

Current 7-Day Yields
| | 3/31/18 |
| Class I | 1.43% |
| Class II | 1.28% |
| Class III | 1.18% |
| Class IV | 0.93% |
| Select Class | 1.38% |
| Institutional Class | 1.47% |
Yield refers to the income paid by the Fund over a given period. Yield for money market funds is usually for seven-day periods, as it is here, though it is expressed as an annual percentage rate. Past performance is no guarantee of future results. Yield will vary and it's possible to lose money investing in the Fund. A portion of the Fund's expenses was reimbursed and/or waived. Absent such reimbursements and/or waivers the yield for the period ending March 31, 2018, the most recent period shown in the table, would have been 1.40% for Class I, 1.25% for Class II, 1.15% for Class III, 0.92% for Class IV, 1.35% for Select Class and 1.43% for Institutional Class.
Treasury Only Portfolio
Schedule of Investments March 31, 2018
Showing Percentage of Net Assets
| U.S. Treasury Debt - 95.9% | | | | |
| | | Yield(a) | Principal Amount (000s) | Value (000s) |
| U.S. Treasury Inflation Protected Obligations - 2.9% | | | | |
| U.S. Treasury Notes | | | | |
| 4/15/18 | | 1.75 to 1.76% | $433,197 | $433,913 |
| U.S. Treasury Obligations - 93.0% | | | | |
| U.S. Treasury Bills | | | | |
| 4/5/18 to 9/27/18 | | 1.25 to 1.91 | 10,206,308 | 10,187,122 |
| U.S. Treasury Notes | | | | |
| 4/30/18 to 1/31/20 | | 1.44 to 1.96 (b) | 3,796,634 | 3,796,342 |
| | | | | 13,983,464 |
| TOTAL U.S. TREASURY DEBT | | | | |
| (Cost $14,417,377) | | | | 14,417,377 |
| TOTAL INVESTMENT IN SECURITIES - 95.9% | | | | |
| (Cost $14,417,377) | | | | 14,417,377 |
| NET OTHER ASSETS (LIABILITIES) - 4.1% | | | | 616,338 |
| NET ASSETS - 100% | | | | $15,033,715 |
The date shown for securities represents the date when principal payments must be paid, taking into account any call options exercised by the issuer and any permissible maturity shortening features other than interest rate resets.
Legend
(a) Yield represents either the annualized yield at the date of purchase, or the stated coupon rate, or, for floating and adjustable rate securities, the rate at period end.
(b) Coupon rates for floating and adjustable rate securities reflect the rates in effect at period end.
Investment Valuation
All investments are categorized as Level 2 under the Fair Value Hierarchy. The inputs or methodology used for valuing securities may not be an indication of the risk associated with investing in those securities. For more information on valuation inputs please refer to the Investment Valuation section in the accompanying Notes to Financial Statements.
See accompanying notes which are an integral part of the financial statements.
Treasury Only Portfolio
Financial Statements
Statement of Assets and Liabilities
| Amounts in thousands (except per-share amounts) | | March 31, 2018 |
| Assets | | |
Investment in securities, at value — See accompanying schedule:
Unaffiliated issuers (cost $14,417,377) | | $14,417,377 |
| Receivable for investments sold | | 983,552 |
| Receivable for fund shares sold | | 3,502 |
| Interest receivable | | 10,688 |
| Prepaid expenses | | 11 |
| Receivable from investment adviser for expense reductions | | 394 |
| Total assets | | 15,415,524 |
| Liabilities | | |
| Payable to custodian bank | $12,453 | |
| Payable for investments purchased | 364,642 | |
| Payable for fund shares redeemed | 758 | |
| Distributions payable | 1,144 | |
| Accrued management fee | 1,775 | |
| Distribution and service plan fees payable | 280 | |
| Other affiliated payables | 677 | |
| Other payables and accrued expenses | 80 | |
| Total liabilities | | 381,809 |
| Net Assets | | $15,033,715 |
| Net Assets consist of: | | |
| Paid in capital | | $15,033,699 |
| Undistributed net investment income | | 31 |
| Accumulated undistributed net realized gain (loss) on investments | | (15) |
| Net Assets | | $15,033,715 |
| Class I: | | |
| Net Asset Value, offering price and redemption price per share ($6,976,205 ÷ 6,975,086 shares) | | $1.00 |
| Class II: | | |
| Net Asset Value, offering price and redemption price per share ($261,278 ÷ 261,298 shares) | | $1.00 |
| Class III: | | |
| Net Asset Value, offering price and redemption price per share ($928,619 ÷ 928,361 shares) | | $1.00 |
| Class IV: | | |
| Net Asset Value, offering price and redemption price per share ($115,852 ÷ 115,835 shares) | | $1.00 |
| Select Class: | | |
| Net Asset Value, offering price and redemption price per share ($120,597 ÷ 120,597 shares) | | $1.00 |
| Institutional Class: | | |
| Net Asset Value, offering price and redemption price per share ($6,631,164 ÷ 6,630,917 shares) | | $1.00 |
See accompanying notes which are an integral part of the financial statements.
Statement of Operations
| Amounts in thousands | | Year ended March 31, 2018 |
| Investment Income | | |
| Interest | | $150,811 |
| Expenses | | |
| Management fee | $18,976 | |
| Transfer agent fees | 6,573 | |
| Distribution and service plan fees | 2,992 | |
| Accounting fees and expenses | 965 | |
| Custodian fees and expenses | 147 | |
| Independent trustees' fees and expenses | 46 | |
| Registration fees | 162 | |
| Audit | 44 | |
| Legal | 28 | |
| Miscellaneous | 62 | |
| Total expenses before reductions | 29,995 | |
| Expense reductions | (4,674) | 25,321 |
| Net investment income (loss) | | 125,490 |
| Realized and Unrealized Gain (Loss) | | |
| Net realized gain (loss) on: | | |
| Investment securities: | | |
| Unaffiliated issuers | | (12) |
| Total net realized gain (loss) | | (12) |
| Net increase in net assets resulting from operations | | $125,478 |
See accompanying notes which are an integral part of the financial statements.
Statement of Changes in Net Assets
| Amounts in thousands | Year ended March 31, 2018 | Year ended March 31, 2017 |
| Increase (Decrease) in Net Assets | | |
| Operations | | |
| Net investment income (loss) | $125,490 | $31,360 |
| Net realized gain (loss) | (12) | 93 |
| Net increase in net assets resulting from operations | 125,478 | 31,453 |
| Distributions to shareholders from net investment income | (125,645) | (31,217) |
| Share transactions - net increase (decrease) | 1,296,036 | 114,871 |
| Total increase (decrease) in net assets | 1,295,869 | 115,107 |
| Net Assets | | |
| Beginning of period | 13,737,846 | 13,622,739 |
| End of period | $15,033,715 | $13,737,846 |
| Other Information | | |
| Undistributed net investment income end of period | $31 | $186 |
See accompanying notes which are an integral part of the financial statements.
Financial Highlights
Treasury Only Portfolio Class I
| Years ended March 31, | 2018 | 2017 | 2016 | 2015 | 2014 |
| Selected Per–Share Data | | | | | |
| Net asset value, beginning of period | $1.00 | $1.00 | $1.00 | $1.00 | $1.00 |
| Income from Investment Operations | | | | | |
| Net investment income (loss) | .009 | .002 | –A | –A | –A |
| Net realized and unrealized gain (loss)A | – | – | – | – | – |
| Total from investment operations | .009 | .002 | –A | –A | –A |
| Distributions from net investment income | (.009) | (.002) | –A | –A | –A |
| Total distributions | (.009) | (.002) | –A | –A | –A |
| Net asset value, end of period | $1.00 | $1.00 | $1.00 | $1.00 | $1.00 |
| Total ReturnB | .93% | .23% | .04% | .01% | .01% |
| Ratios to Average Net AssetsC | | | | | |
| Expenses before reductions | .21% | .21% | .21% | .21% | .21% |
| Expenses net of fee waivers, if any | .18% | .18% | .11% | .05% | .06% |
| Expenses net of all reductions | .18% | .18% | .11% | .05% | .06% |
| Net investment income (loss) | .93% | .24% | .05% | - %D | .01% |
| Supplemental Data | | | | | |
| Net assets, end of period (in millions) | $6,976 | $7,638 | $10,035 | $9,402 | $9,795 |
A Amount represents less than $.0005 per share.
B Total returns would have been lower if certain expenses had not been reduced during the applicable periods shown.
C Expense ratios reflect operating expenses of the class. Expenses before reductions do not reflect amounts reimbursed or waived or reductions from expense offset arrangements and do not represent the amount paid by the class during periods when reimbursements, waivers or reductions occur. Expenses net of fee waivers reflect expenses after reimbursement and waivers but prior to reductions from expense offset arrangements. Expenses net of all reductions represent the net expenses paid by the class.
D Amount represents less than .005%.
See accompanying notes which are an integral part of the financial statements.
Treasury Only Portfolio Class II
| Years ended March 31, | 2018 | 2017 | 2016 | 2015 | 2014 |
| Selected Per–Share Data | | | | | |
| Net asset value, beginning of period | $1.00 | $1.00 | $1.00 | $1.00 | $1.00 |
| Income from Investment Operations | | | | | |
| Net investment income (loss) | .008 | .001 | –A | –A | –A |
| Net realized and unrealized gain (loss)A | – | – | – | – | – |
| Total from investment operations | .008 | .001 | –A | –A | –A |
| Distributions from net investment income | (.008) | (.001) | –A | –A | –A |
| Total distributions | (.008) | (.001) | –A | –A | –A |
| Net asset value, end of period | $1.00 | $1.00 | $1.00 | $1.00 | $1.00 |
| Total ReturnB | .78% | .09% | .01% | .01% | .01% |
| Ratios to Average Net AssetsC | | | | | |
| Expenses before reductions | .36% | .36% | .36% | .36% | .36% |
| Expenses net of fee waivers, if any | .33% | .33% | .13% | .05% | .06% |
| Expenses net of all reductions | .33% | .33% | .13% | .05% | .06% |
| Net investment income (loss) | .78% | .09% | .03% | - %D | .01% |
| Supplemental Data | | | | | |
| Net assets, end of period (in millions) | $261 | $159 | $307 | $310 | $359 |
A Amount represents less than $.0005 per share.
B Total returns would have been lower if certain expenses had not been reduced during the applicable periods shown.
C Expense ratios reflect operating expenses of the class. Expenses before reductions do not reflect amounts reimbursed or waived or reductions from expense offset arrangements and do not represent the amount paid by the class during periods when reimbursements, waivers or reductions occur. Expenses net of fee waivers reflect expenses after reimbursement and waivers but prior to reductions from expense offset arrangements. Expenses net of all reductions represent the net expenses paid by the class.
D Amount represents less than .005%.
See accompanying notes which are an integral part of the financial statements.
Treasury Only Portfolio Class III
| Years ended March 31, | 2018 | 2017 | 2016 | 2015 | 2014 |
| Selected Per–Share Data | | | | | |
| Net asset value, beginning of period | $1.00 | $1.00 | $1.00 | $1.00 | $1.00 |
| Income from Investment Operations | | | | | |
| Net investment income (loss) | .007 | –A | –A | –A | –A |
| Net realized and unrealized gain (loss)A | – | – | – | – | – |
| Total from investment operations | .007 | –A | –A | –A | –A |
| Distributions from net investment income | (.007) | –A | –A | –A | –A |
| Total distributions | (.007) | –A | –A | –A | –A |
| Net asset value, end of period | $1.00 | $1.00 | $1.00 | $1.00 | $1.00 |
| Total ReturnB | .68% | .04% | .01% | .01% | .01% |
| Ratios to Average Net AssetsC | | | | | |
| Expenses before reductions | .46% | .46% | .46% | .46% | .46% |
| Expenses net of fee waivers, if any | .43% | .38% | .15% | .05% | .06% |
| Expenses net of all reductions | .43% | .38% | .15% | .05% | .06% |
| Net investment income (loss) | .68% | .04% | .01% | - %D | .01% |
| Supplemental Data | | | | | |
| Net assets, end of period (in millions) | $929 | $921 | $831 | $635 | $487 |
A Amount represents less than $.0005 per share.
B Total returns would have been lower if certain expenses had not been reduced during the applicable periods shown.
C Expense ratios reflect operating expenses of the class. Expenses before reductions do not reflect amounts reimbursed or waived or reductions from expense offset arrangements and do not represent the amount paid by the class during periods when reimbursements, waivers or reductions occur. Expenses net of fee waivers reflect expenses after reimbursement and waivers but prior to reductions from expense offset arrangements. Expenses net of all reductions represent the net expenses paid by the class.
D Amount represents less than .005%.
See accompanying notes which are an integral part of the financial statements.
Treasury Only Portfolio Class IV
| Years ended March 31, | 2018 | 2017 | 2016 | 2015 | 2014 |
| Selected Per–Share Data | | | | | |
| Net asset value, beginning of period | $1.00 | $1.00 | $1.00 | $1.00 | $1.00 |
| Income from Investment Operations | | | | | |
| Net investment income (loss) | .004 | –A | –A | –A | –A |
| Net realized and unrealized gain (loss)A | – | – | – | – | – |
| Total from investment operations | .004 | –A | –A | –A | –A |
| Distributions from net investment income | (.004) | –A | –A | –A | –A |
| Total distributions | (.004) | –A | –A | –A | –A |
| Net asset value, end of period | $1.00 | $1.00 | $1.00 | $1.00 | $1.00 |
| Total ReturnB | .42% | .01% | .01% | .01% | .01% |
| Ratios to Average Net AssetsC | | | | | |
| Expenses before reductions | .71% | .72% | .71% | .71% | .71% |
| Expenses net of fee waivers, if any | .68% | .37% | .14% | .04% | .06% |
| Expenses net of all reductions | .68% | .37% | .14% | .04% | .06% |
| Net investment income (loss) | .43% | .05% | .02% | .01% | .01% |
| Supplemental Data | | | | | |
| Net assets, end of period (in millions) | $116 | $32 | $338 | $114 | $18 |
A Amount represents less than $.0005 per share.
B Total returns would have been lower if certain expenses had not been reduced during the applicable periods shown.
C Expense ratios reflect operating expenses of the class. Expenses before reductions do not reflect amounts reimbursed or waived or reductions from expense offset arrangements and do not represent the amount paid by the class during periods when reimbursements, waivers or reductions occur. Expenses net of fee waivers reflect expenses after reimbursement and waivers but prior to reductions from expense offset arrangements. Expenses net of all reductions represent the net expenses paid by the class.
See accompanying notes which are an integral part of the financial statements.
Treasury Only Portfolio Select Class
| Years ended March 31, | 2018 | 2017 | 2016 | 2015 | 2014 |
| Selected Per–Share Data | | | | | |
| Net asset value, beginning of period | $1.00 | $1.00 | $1.00 | $1.00 | $1.00 |
| Income from Investment Operations | | | | | |
| Net investment income (loss) | .009 | .002 | –A | –A | –A |
| Net realized and unrealized gain (loss)A | – | – | – | – | – |
| Total from investment operations | .009 | .002 | –A | –A | –A |
| Distributions from net investment income | (.009) | (.002) | –A | –A | –A |
| Total distributions | (.009) | (.002) | –A | –A | –A |
| Net asset value, end of period | $1.00 | $1.00 | $1.00 | $1.00 | $1.00 |
| Total ReturnB | .88% | .18% | .03% | .01% | .01% |
| Ratios to Average Net AssetsC | | | | | |
| Expenses before reductions | .26% | .26% | .27% | .26% | .26% |
| Expenses net of fee waivers, if any | .23% | .23% | .12% | .05% | .06% |
| Expenses net of all reductions | .23% | .23% | .12% | .05% | .06% |
| Net investment income (loss) | .88% | .19% | .04% | - %D | .01% |
| Supplemental Data | | | | | |
| Net assets, end of period (in millions) | $121 | $94 | $180 | $194 | $215 |
A Amount represents less than $.0005 per share.
B Total returns would have been lower if certain expenses had not been reduced during the applicable periods shown.
C Expense ratios reflect operating expenses of the class. Expenses before reductions do not reflect amounts reimbursed or waived or reductions from expense offset arrangements and do not represent the amount paid by the class during periods when reimbursements, waivers or reductions occur. Expenses net of fee waivers reflect expenses after reimbursement and waivers but prior to reductions from expense offset arrangements. Expenses net of all reductions represent the net expenses paid by the class.
D Amount represents less than .005%.
See accompanying notes which are an integral part of the financial statements.
Treasury Only Portfolio Institutional Class
| Years ended March 31, | 2018 | 2017 | 2016 | 2015 A |
| Selected Per–Share Data | | | | |
| Net asset value, beginning of period | $1.00 | $1.00 | $1.00 | $1.00 |
| Income from Investment Operations | | | | |
| Net investment income (loss) | .010 | .003 | .001 | –B |
| Net realized and unrealized gain (loss)B | – | – | – | – |
| Total from investment operations | .010 | .003 | .001 | –B |
| Distributions from net investment income | (.010) | (.003) | (.001) | –B |
| Total distributions | (.010) | (.003) | (.001) | –B |
| Net asset value, end of period | $1.00 | $1.00 | $1.00 | $1.00 |
| Total ReturnC,D | .97% | .27% | .05% | .01% |
| Ratios to Average Net AssetsE | | | | |
| Expenses before reductions | .18% | .18% | .18% | .19%F |
| Expenses net of fee waivers, if any | .14% | .14% | .12% | .04%F |
| Expenses net of all reductions | .14% | .14% | .12% | .04%F |
| Net investment income (loss) | .97% | .28% | .04% | - %F,G |
| Supplemental Data | | | | |
| Net assets, end of period (in millions) | $6,631 | $4,894 | $1,932 | $126 |
A For the period May 14, 2014 (commencement of sale of shares) to March 31, 2015.
B Amount represents less than $.0005 per share.
C Total returns for periods of less than one year are not annualized.
D Total returns would have been lower if certain expenses had not been reduced during the applicable periods shown.
E Expense ratios reflect operating expenses of the class. Expenses before reductions do not reflect amounts reimbursed or waived or reductions from expense offset arrangements and do not represent the amount paid by the class during periods when reimbursements, waivers or reductions occur. Expense ratios before reductions for start-up periods may not be representative of longer-term operating periods. Expenses net of fee waivers reflect expenses after reimbursement and waivers but prior to reductions from expense offset arrangements. Expenses net of all reductions represent the net expenses paid by the class.
F Annualized
G Amount represents less than .005%.
See accompanying notes which are an integral part of the financial statements.
Treasury Portfolio
Investment Summary/Performance (Unaudited)
Effective Maturity Diversification as of March 31, 2018
| Days | % of fund's investments 3/31/18 |
| 1 - 7 | 56.0 |
| 8 - 30 | 16.1 |
| 31 - 60 | 6.2 |
| 61 - 90 | 9.7 |
| 91 - 180 | 10.9 |
| > 180 | 1.1 |
Effective maturity is determined in accordance with the requirements of Rule 2a-7 under the Investment Company Act of 1940.
Asset Allocation (% of fund's net assets)
| As of March 31, 2018 |
| | U.S. Treasury Debt | 51.7% |
| | Repurchase Agreements | 46.9% |
| | Net Other Assets (Liabilities) | 1.4% |

Current 7-Day Yields
| | 3/31/18 |
| Class I | 1.49% |
| Class II | 1.34% |
| Class III | 1.24% |
| Class IV | 0.99% |
| Select Class | 1.44% |
| Institutional Class | 1.53% |
Yield refers to the income paid by the Fund over a given period. Yield for money market funds is usually for seven-day periods, as it is here, though it is expressed as an annual percentage rate. Past performance is no guarantee of future results. Yield will vary and it's possible to lose money investing in the Fund. A portion of the Fund's expenses was reimbursed and/or waived. Absent such reimbursements and/or waivers the yield for the period ending March 31, 2018, the most recent period shown in the table, would have been 1.47% for Class I, 1.32% for Class II, 1.23% for Class III, 0.98% for Class IV, 1.42% for Select Class and 1.50% for Institutional Class.
Treasury Portfolio
Schedule of Investments March 31, 2018
Showing Percentage of Net Assets
| U.S. Treasury Debt - 51.7% | | | | |
| | | Yield(a) | Principal Amount (000s) | Value (000s) |
| U.S. Treasury Inflation Protected Obligations - 4.3% | | | | |
| U.S. Treasury Notes | | | | |
| 4/15/18 | | 1.73 to 1.85% | $1,015,440 | $1,017,078 |
| U.S. Treasury Obligations - 47.4% | | | | |
| U.S. Treasury Bills | | | | |
| 4/5/18 to 9/27/18 | | 1.20 to 1.91 | 6,599,903 | 6,581,403 |
| U.S. Treasury Notes | | | | |
| 4/30/18 to 1/31/20 | | 1.31 to 1.96 (b) | 4,553,000 | 4,551,712 |
| | | | | 11,133,115 |
| TOTAL U.S. TREASURY DEBT | | | | |
| (Cost $12,150,193) | | | | 12,150,193 |
| U.S. Treasury Repurchase Agreement - 46.9% | | | |
| | | Maturity Amount (000s) | Value (000s) |
| In a joint trading account at 1.79% dated 3/29/18 due 4/2/18 (Collateralized by U.S. Treasury Obligations) # | | $517,944 | $517,841 |
| With: | | | |
| Barclays Capital, Inc. at 1.8%, dated 3/29/18 due 4/2/18 (Collateralized by U.S. Treasury Obligations valued at $101,073,764, 0.00% - 4.38%, 4/12/18 - 5/15/46) | | 99,020 | 99,000 |
| BMO Capital Markets Corp. at 1.73%, dated 3/27/18 due 4/3/18 (Collateralized by U.S. Treasury Obligations valued at $26,524,167, 0.00% - 6.00%, 8/16/18 - 5/15/47) | | 26,009 | 26,000 |
| BMO Harris Bank NA at: | | | |
| 1.45%, dated: | | �� | |
| 1/16/18 due 4/5/18 (Collateralized by U.S. Treasury Obligations valued at $33,297,255, 3.88%, 5/15/18) | | 32,111 | 32,000 |
| 1/29/18 due 4/5/18 (Collateralized by U.S. Treasury Obligations valued at $64,299,392, 3.88%, 5/15/18) | | 62,185 | 62,000 |
| 1.46%, dated 1/22/18 due 4/5/18 (Collateralized by U.S. Treasury Obligations valued at $31,892,583, 2.13% - 2.50%, 8/15/21 - 8/15/23) | | 31,116 | 31,000 |
| 1.58%, dated 3/7/18 due 4/5/18 (Collateralized by U.S. Treasury Obligations valued at $30,434,021, 2.50% - 3.13%, 8/15/23 - 8/15/44) | | 29,038 | 29,000 |
| 1.59%, dated 3/7/18 due 4/5/18 (Collateralized by U.S. Treasury Obligations valued at $14,509,964, 4.00%, 8/15/18) | | 14,021 | 14,000 |
| 1.64%, dated 3/2/18 due 4/5/18 (Collateralized by U.S. Treasury Obligations valued at $31,379,254, 3.13%, 8/15/44) | | 30,072 | 30,000 |
| 1.73%, dated: | | | |
| 3/22/18 due 4/5/18 (Collateralized by U.S. Treasury Obligations valued at $62,434,321, 3.13%, 8/15/44) | | 60,075 | 60,000 |
| 3/27/18 due 4/3/18 (Collateralized by U.S. Treasury Obligations valued at $26,523,844, 0.00% - 2.75%, 5/17/18 - 2/15/28) | | 26,009 | 26,000 |
| BNP Paribas, S.A. at: | | | |
| 1.4%, dated 1/30/18 due 4/2/18 (Collateralized by U.S. Treasury Obligations valued at $65,429,861, 1.14% - 4.38%, 4/30/19 - 2/15/42) | | 64,154 | 64,000 |
| 1.45%, dated 1/12/18 due 4/5/18 (Collateralized by U.S. Treasury Obligations valued at $66,116,676, 0.00% - 5.25%, 6/7/18 - 8/15/47) | | 64,232 | 64,000 |
| 1.47%, dated 1/23/18 due 4/5/18 (Collateralized by U.S. Treasury Obligations valued at $64,450,648, 0.00% - 7.13%, 4/26/18 - 8/15/46) | | 63,232 | 63,000 |
| 1.64%, dated 1/24/18 due 4/5/18 (Collateralized by U.S. Treasury Obligations valued at $31,771,586, 0.00% - 8.75%, 7/5/18 - 8/15/45)(b)(c)(d) | | 31,127 | 31,000 |
| 1.65%, dated: | | | |
| 1/25/18 due 4/5/18 (Collateralized by U.S. Treasury Obligations valued at $48,060,801, 1.18% - 3.75%, 10/31/19 - 11/15/43)(b)(c)(d) | | 47,194 | 47,000 |
| 3/2/18 due 4/5/18 (Collateralized by U.S. Treasury Obligations valued at $30,881,962, 1.00% - 6.00%, 3/15/19 - 8/15/40) | | 30,084 | 30,000 |
| 1.66%, dated: | | | |
| 3/5/18 due 4/5/18 (Collateralized by U.S. Treasury Obligations valued at $93,836,773, 1.14% - 3.75%, 4/30/19 - 2/15/47) | | 91,264 | 91,000 |
| 3/6/18 due 4/5/18 (Collateralized by U.S. Treasury Obligations valued at $106,928,780, 1.18% - 8.75%, 10/31/18 - 5/15/44) | | 104,302 | 104,000 |
| 3/7/18 due 4/5/18 (Collateralized by U.S. Treasury Obligations valued at $59,222,836, 1.18% - 8.75%, 10/31/19 - 8/15/40) | | 58,168 | 58,000 |
| 1.67%, dated: | | | |
| 1/24/18 due 4/24/18 (Collateralized by U.S. Treasury Obligations valued at $31,702,137, 1.14% - 3.50%, 4/30/19 - 2/15/42)(b)(c)(d) | | 31,129 | 31,000 |
| 3/8/18 due 4/5/18 (Collateralized by U.S. Treasury Obligations valued at $59,390,748, 0.00% - 5.25%, 4/26/18 - 2/15/44) | | 58,170 | 58,000 |
| 1.68%, dated 3/9/18 due 4/5/18 (Collateralized by U.S. Treasury Obligations valued at $89,848,038, 0.75% - 8.50%, 10/31/18 - 8/15/47) | | 88,259 | 88,000 |
| 1.7%, dated 3/12/18 due 4/5/18 (Collateralized by U.S. Treasury Obligations valued at $74,672,175, 1.14% - 3.13%, 4/30/19 - 11/15/44) | | 73,217 | 73,000 |
| 1.73%, dated 3/15/18 due 4/5/18 (Collateralized by U.S. Treasury Obligations valued at $60,439,653, 1.18% - 7.13%, 5/15/19 - 11/15/43) | | 59,173 | 59,000 |
| 1.75%, dated: | | | |
| 3/15/18 due 4/5/18 (Collateralized by U.S. Treasury Obligations valued at $120,530,224, 1.14% - 8.75%, 10/31/18 - 11/15/41) | | 118,516 | 118,000 |
| 3/28/18 due 4/5/18 (Collateralized by U.S. Treasury Obligations valued at $62,226,050, 1.18% - 2.13%, 10/31/19 - 2/29/24) | | 61,089 | 61,000 |
| 1.76%, dated: | | | |
| 3/19/18 due 4/5/18 (Collateralized by U.S. Treasury Obligations valued at $30,616,464, 1.13% - 5.25%, 4/30/19 - 2/15/48) | | 30,088 | 30,000 |
| 3/20/18 due 4/5/18 (Collateralized by U.S. Treasury Obligations valued at $60,470,565, 1.14% - 3.13%, 4/30/19 - 11/15/44) | | 59,179 | 59,000 |
| 3/22/18 due 4/5/18 (Collateralized by U.S. Treasury Obligations valued at $30,612,037, 1.18% - 6.75%, 10/31/19 - 11/15/42) | | 30,091 | 30,000 |
| 1.77%, dated: | | | |
| 3/16/18 due 4/5/18 (Collateralized by U.S. Treasury Obligations valued at $29,600,444, 1.14% - 2.88%, 4/30/19 - 8/15/45) | | 29,128 | 29,000 |
| 3/21/18 due 4/5/18 (Collateralized by U.S. Treasury Obligations valued at $61,227,138, 1.13% - 4.38%, 10/31/19 - 8/15/47) | | 60,183 | 60,000 |
| 3/28/18 due 4/5/18 (Collateralized by U.S. Treasury Obligations valued at $53,375,351, 0.00% - 4.50%, 4/26/18 - 8/15/47) | | 52,033 | 52,000 |
| 1.79%, dated 3/28/18 due 4/4/18 (Collateralized by U.S. Treasury Obligations valued at $53,045,346, 1.18% - 5.50%, 10/31/19 - 8/15/28) | | 52,018 | 52,000 |
| Credit AG at 1.72%, dated 3/28/18 due 4/4/18 (Collateralized by U.S. Treasury Obligations valued at $31,623,090, 1.00% - 2.75%, 8/31/19 - 2/15/24) | | 31,010 | 31,000 |
| Deutsche Bank AG at: | | | |
| 1.8%, dated 3/29/18 due 4/2/18 | | | |
| (Collateralized by U.S. Treasury Obligations valued at $153,208,601, 0.00% - 8.88%, 8/31/18 - 11/15/46) | | 150,030 | 150,000 |
| (Collateralized by U.S. Treasury Obligations valued at $195,849,803, 0.75% - 8.88%, 2/15/19 - 2/15/41) | | 192,038 | 192,000 |
| 1.83%, dated 3/29/18 due 4/2/18 (Collateralized by U.S. Treasury Obligations valued at $134,400,348, 0.88% - 4.38%, 5/15/19 - 11/15/46) | | 131,027 | 131,000 |
| Deutsche Bank Securities, Inc. at 1.83%, dated 3/29/18 due 4/2/18 (Collateralized by U.S. Treasury Obligations valued at $6,120,345, 1.88%, 12/31/19) | | 6,001 | 6,000 |
| DNB Bank ASA at 1.8%, dated 3/29/18 due 4/2/18 (Collateralized by U.S. Treasury Obligations valued at $150,967,557, 1.50%, 6/15/20) | | 148,030 | 148,000 |
| HSBC Securities, Inc. at: | | | |
| 1.76%, dated 3/27/18 due 4/3/18 (Collateralized by U.S. Treasury Obligations valued at $53,048,809, 1.25% - 1.38%, 6/30/18 - 8/31/19) | | 52,018 | 52,000 |
| 1.78%, dated 3/29/18 due 4/5/18 (Collateralized by U.S. Treasury Obligations valued at $88,743,794, 2.00% - 8.88%, 2/15/19 - 1/31/23) | | 87,030 | 87,000 |
| 1.81%, dated 3/29/18 due 4/2/18 (Collateralized by U.S. Treasury Obligations valued at $44,214,900, 2.75%, 2/15/24) | | 43,009 | 43,000 |
| ING Financial Markets LLC at 1.8%, dated 3/29/18 due 4/2/18 (Collateralized by U.S. Treasury Obligations valued at $105,281,617, 2.13%, 2/29/24) | | 103,021 | 103,000 |
| Lloyds Bank PLC at: | | | |
| 1.5%, dated: | | | |
| 1/24/18 due 4/24/18 (Collateralized by U.S. Treasury Obligations valued at $31,858,323, 1.25% - 7.63%, 10/31/19 - 2/15/25) | | 31,116 | 31,000 |
| 1/26/18 due 4/26/18 (Collateralized by U.S. Treasury Obligations valued at $16,463,859, 1.25% - 6.00%, 3/31/19 - 2/15/26) | | 16,060 | 16,000 |
| 1.52%, dated 1/29/18 due 5/2/18 (Collateralized by U.S. Treasury Obligations valued at $16,467,354, 2.13% - 7.63%, 12/31/21 - 8/15/26) | | 16,063 | 16,000 |
| 1.59%, dated 2/14/18 due 4/16/18 (Collateralized by U.S. Treasury Obligations valued at $24,617,592, 1.63% - 7.63%, 6/30/20 - 2/15/25) | | 24,065 | 24,000 |
| 1.67%, dated 2/20/18 due 5/21/18 (Collateralized by U.S. Treasury Obligations valued at $29,728,639, 2.25%, 7/31/21) | | 29,121 | 29,000 |
| 1.7%, dated 2/27/18 due 5/29/18 (Collateralized by U.S. Treasury Obligations valued at $60,551,301, 2.13%, 12/31/21) | | 59,254 | 59,000 |
| 1.74%, dated: | | | |
| 3/12/18 due 6/20/18 (Collateralized by U.S. Treasury Obligations valued at $42,089,205, 1.88%, 5/31/22) | | 41,198 | 41,000 |
| 3/15/18 due: | | | |
| 6/13/18 (Collateralized by U.S. Treasury Obligations valued at $29,699,356, 2.13%, 8/15/21) | | 29,126 | 29,000 |
| 6/15/18 (Collateralized by U.S. Treasury Obligations valued at $30,424,257, 6.75% - 7.50%, 11/15/24 - 8/15/26) | | 29,129 | 29,000 |
| 1.85%, dated 3/21/18 due 6/21/18 (Collateralized by U.S. Treasury Obligations valued at $60,588,246, 6.00%, 2/15/26) | | 59,279 | 59,000 |
| Mitsubishi UFJ Securities (U.S.A.), Inc. at 1.85%, dated 3/29/18 due 4/2/18 (Collateralized by U.S. Treasury Obligations valued at $15,300,867, 0.00% - 2.00%, 4/12/18 - 5/31/24) | | 15,003 | 15,000 |
| MUFG Securities (Canada), Ltd. at 1.81%, dated 3/29/18 due 4/2/18 (Collateralized by U.S. Treasury Obligations valued at $89,764,605, 1.38% - 2.00%, 9/30/19 - 10/31/20) | | 88,018 | 88,000 |
| MUFG Securities EMEA PLC at: | | | |
| 1.55%, dated 2/23/18 due 4/5/18 (Collateralized by U.S. Treasury Obligations valued at $23,702,308, 1.75% - 2.50%, 3/31/22 - 2/15/46) | | 23,047 | 23,000 |
| 1.61%, dated 3/14/18 due 4/5/18 (Collateralized by U.S. Treasury Obligations valued at $9,406,287, 3.00%, 5/15/45) | | 9,009 | 9,000 |
| 1.64%, dated 3/15/18 due 4/5/18 (Collateralized by U.S. Treasury Obligations valued at $29,836,585, 2.63%, 11/15/20) | | 29,036 | 29,000 |
| 1.73%, dated 3/20/18 due 4/5/18 (Collateralized by U.S. Treasury Obligations valued at $36,010,025, 2.63%, 11/15/20) | | 35,035 | 35,000 |
| 1.74%, dated 3/20/18 due 4/5/18 (Collateralized by U.S. Treasury Obligations valued at $22,986,425, 3.00%, 5/15/47) | | 22,022 | 22,000 |
| 1.75%, dated: | | | |
| 3/21/18 due 4/5/18 (Collateralized by U.S. Treasury Obligations valued at $16,366,608, 0.75%, 7/31/18) | | 16,018 | 16,000 |
| 3/22/18 due 4/5/18 (Collateralized by U.S. Treasury Obligations valued at $22,644,580, 2.13% - 2.25%, 3/31/24 - 11/15/27) | | 22,016 | 22,000 |
| 3/28/18 due 4/5/18 | | | |
| (Collateralized by U.S. Treasury Obligations valued at $10,263,839, 0.63%, 4/30/18) | | 10,009 | 10,000 |
| (Collateralized by U.S. Treasury Obligations valued at $5,167,899, 2.13%, 12/31/22) | | 5,010 | 5,000 |
| 4/2/18 due 4/3/18(e) | | 16,551 | 16,550 |
| 4/3/18 due 4/5/18(e) | | 7,007 | 7,000 |
| 1.76%, dated 3/22/18 due 4/5/18 (Collateralized by U.S. Treasury Obligations valued at $42,209,102, 2.63%, 11/15/20) | | 41,050 | 41,000 |
| 1.78%, dated 3/28/18 due 4/5/18 (Collateralized by U.S. Treasury Obligations valued at $14,415,364, 2.25% - 2.38%, 12/31/24 - 5/15/27) | | 14,010 | 14,000 |
| 1.79%, dated 3/28/18 due 4/5/18 (Collateralized by U.S. Treasury Obligations valued at $11,351,240, 2.25%, 11/15/27) | | 11,007 | 11,000 |
| 1.8%, dated 3/29/18 due 4/2/18 (Collateralized by U.S. Treasury Obligations valued at $29,064,617, 8.75%, 8/15/20) | | 28,006 | 28,000 |
| Natixis SA at 1.8%, dated 3/29/18 due 4/2/18 (Collateralized by U.S. Treasury Obligations valued at $241,752,129, 1.88% - 2.50%, 7/31/21 - 5/15/25) | | 237,047 | 237,000 |
| Nomura Securities International, Inc. at 1.8%, dated 3/29/18 due 4/2/18 (Collateralized by U.S. Treasury Obligations valued at $316,483,429, 0.00% - 6.25%, 4/26/18 - 8/15/43) | | 309,062 | 309,000 |
| Norinchukin Bank at: | | | |
| 1.48%, dated 1/26/18 due 4/5/18 (Collateralized by U.S. Treasury Obligations valued at $16,363,910, 1.50%, 8/15/26) | | 16,045 | 16,000 |
| 1.63%, dated 2/22/18 due 4/23/18 (Collateralized by U.S. Treasury Obligations valued at $31,671,060, 1.50%, 8/15/26) | | 31,084 | 31,000 |
| 1.64%, dated 3/2/18 due 4/10/18 (Collateralized by U.S. Treasury Obligations valued at $30,641,513, 1.50%, 8/15/26) | | 30,053 | 30,000 |
| 1.65%, dated: | | | |
| 2/28/18 due 4/24/18 (Collateralized by U.S. Treasury Obligations valued at $30,641,513, 1.50%, 8/15/26) | | 30,076 | 30,000 |
| 3/1/18 due 4/25/18 (Collateralized by U.S. Treasury Obligations valued at $46,982,746, 1.50%, 8/15/26) | | 46,116 | 46,000 |
| 1.7%, dated 3/13/18 due 4/18/18 (Collateralized by U.S. Treasury Obligations valued at $15,107,590, 1.50%, 8/15/26) | | 14,825 | 14,800 |
| 1.73%, dated 3/14/18 due 4/19/18 (Collateralized by U.S. Treasury Obligations valued at $15,311,685, 1.50%, 8/15/26) | | 15,026 | 15,000 |
| 1.79%, dated 3/16/18 due 5/16/18 (Collateralized by U.S. Treasury Obligations valued at $29,602,894, 1.50%, 8/15/26) | | 29,088 | 29,000 |
| 1.83%, dated: | | | |
| 3/20/18 due 6/7/18 (Collateralized by U.S. Treasury Obligations valued at $15,307,150, 1.50%, 8/15/26) | | 15,060 | 15,000 |
| 3/21/18 due 6/8/18 (Collateralized by U.S. Treasury Obligations valued at $18,368,580, 1.50%, 8/15/26) | | 18,072 | 18,000 |
| Prudential Insurance Co. of America at 1.82%, dated 3/29/18 due 4/2/18 (Collateralized by U.S. Treasury Obligations valued at $129,886,589, 1.00% - 8.75%, 8/15/18 - 2/15/36) | | 126,471 | 126,446 |
| RBC Dominion Securities at: | | | |
| 1.44%, dated 2/6/18 due 4/5/18 (Collateralized by U.S. Treasury Obligations valued at $29,647,572, 1.63% - 3.75%, 4/30/19 - 2/15/47) | | 29,072 | 29,000 |
| 1.5%, dated 2/1/18 due 4/5/18 (Collateralized by U.S. Treasury Obligations valued at $48,064,212, 1.63% - 3.75%, 11/15/19 - 8/15/41) | | 47,178 | 47,000 |
| 1.57%, dated 3/7/18 due 4/5/18 (Collateralized by U.S. Treasury Obligations valued at $68,424,156, 1.50% - 3.75%, 8/31/18 - 2/15/47) | | 67,088 | 67,000 |
| 1.58%, dated 3/7/18 due 4/5/18 (Collateralized by U.S. Treasury Obligations valued at $29,616,691, 1.38% - 4.75%, 12/31/19 - 11/15/45) | | 29,042 | 29,000 |
| 1.66%, dated 3/15/18 due 4/2/18 (Collateralized by U.S. Treasury Obligations valued at $30,928,487, 1.13% - 3.00%, 7/31/21 - 5/15/45) | | 30,025 | 30,000 |
| 1.67%, dated 3/15/18 due 4/5/18 (Collateralized by U.S. Treasury Obligations valued at $30,928,721, 2.25% - 3.00%, 4/30/21 - 5/15/45) | | 30,029 | 30,000 |
| 1.7%, dated: | | | |
| 3/22/18 due 4/5/18 (Collateralized by U.S. Treasury Obligations valued at $30,618,874, 0.88% - 4.75%, 8/31/18 - 8/15/46) | | 30,041 | 30,000 |
| 3/23/18 due: | | | |
| 4/2/18 (Collateralized by U.S. Treasury Obligations valued at $23,473,474, 1.50% - 3.00%, 4/30/21 - 2/15/47) | | 23,011 | 23,000 |
| 4/3/18 (Collateralized by U.S. Treasury Obligations valued at $15,308,760, 1.50% - 3.00%, 4/30/21 - 2/15/47) | | 15,008 | 15,000 |
| 4/4/18 (Collateralized by U.S. Treasury Obligations valued at $23,473,420, 1.50% - 3.00%, 4/30/21 - 2/15/47) | | 23,013 | 23,000 |
| 1.71%, dated 3/26/18 due 4/5/18 (Collateralized by U.S. Treasury Obligations valued at $30,613,087, 1.25% - 2.25%, 8/31/18 - 5/15/26) | | 30,020 | 30,000 |
| 1.73%, dated 3/19/18 due 4/4/18 (Collateralized by U.S. Treasury Obligations valued at $41,852,259, 1.63% - 2.25%, 4/30/21 - 12/31/24) | | 41,032 | 41,000 |
| 1.74%, dated 3/29/18 due 4/5/18 (Collateralized by U.S. Treasury Obligations valued at $15,304,615, 1.63% - 3.75%, 12/31/19 - 2/15/47) | | 15,008 | 15,000 |
| RBC Financial Group at: | | | |
| 1.68%, dated 3/16/18 due 4/5/18 (Collateralized by U.S. Treasury Obligations valued at $80,788,085, 0.88% - 2.75%, 10/15/18 - 5/15/46) | | 79,074 | 79,000 |
| 1.72%, dated 3/20/18 due 4/5/18 (Collateralized by U.S. Treasury Obligations valued at $55,128,614, 1.50% - 3.63%, 10/31/19 - 8/15/47) | | 54,052 | 54,000 |
| Societe Generale at: | | | |
| 1.61%, dated 3/2/18 due 4/10/18 | | | |
| (Collateralized by U.S. Treasury Obligations valued at $61,714,749, 1.75% - 3.13%, 2/28/22 - 11/15/46) | | 60,105 | 60,000 |
| (Collateralized by U.S. Treasury Obligations valued at $30,848,591, 0.00% - 3.13%, 4/30/18 - 11/15/47) | | 30,052 | 30,000 |
| 1.62%, dated 3/5/18 due 4/11/18 (Collateralized by U.S. Treasury Obligations valued at $60,657,319, 0.00% - 3.00%, 7/19/18 - 8/15/46) | | 59,098 | 59,000 |
| 1.69%, dated 3/13/18 due 4/26/18 (Collateralized by U.S. Treasury Obligations valued at $59,207,220, 0.00% - 8.13%, 7/31/18 - 8/15/26) | | 58,120 | 58,000 |
| Sumitomo Mitsui Banking Corp. at 1.74%, dated 3/29/18 due 4/2/18 (Collateralized by U.S. Treasury Obligations valued at $5,417,481,866, 0.75% - 4.00%, 4/15/18 - 7/31/23) | | 5,312,027 | 5,311,000 |
| TD Securities (U.S.A.) at 1.8%, dated 3/29/18 due 4/2/18 (Collateralized by U.S. Treasury Obligations valued at $113,225,672, 0.75% - 2.38%, 4/15/18 - 9/30/24) | | 111,022 | 111,000 |
| TOTAL U.S. TREASURY REPURCHASE AGREEMENT | | | |
| (Cost $11,034,637) | | | 11,034,637 |
| TOTAL INVESTMENT IN SECURITIES - 98.6% | | | |
| (Cost $23,184,830) | | | 23,184,830 |
| NET OTHER ASSETS (LIABILITIES) - 1.4% | | | 324,300 |
| NET ASSETS - 100% | | | $23,509,130 |
The date shown for securities represents the date when principal payments must be paid, taking into account any call options exercised by the issuer and any permissible maturity shortening features other than interest rate resets.
Legend
(a) Yield represents either the annualized yield at the date of purchase, or the stated coupon rate, or, for floating and adjustable rate securities, the rate at period end.
(b) Coupon rates for floating and adjustable rate securities reflect the rates in effect at period end.
(c) The maturity amount is based on the rate at period end.
(d) Coupon is indexed to a floating interest rate which may be multiplied by a specified factor and/or subject to caps or floors.
(e) Represents a forward settling transaction and therefore no collateral securities had been allocated as of period end. The agreement contemplated the delivery of U.S. Treasury Obligations as collateral on settlement date.
Investment Valuation
All investments are categorized as Level 2 under the Fair Value Hierarchy. The inputs or methodology used for valuing securities may not be an indication of the risk associated with investing in those securities. For more information on valuation inputs please refer to the Investment Valuation section in the accompanying Notes to Financial Statements.
Other Information
# Additional information on each counterparty to the repurchase agreement is as follows:
| Repurchase Agreement / Counterparty | Value (000s) |
| $517,841,000 due 4/02/18 at 1.79% | |
| BNP Paribas, S.A. | $68,000 |
| HSBC Securities (USA), Inc. | 375,841 |
| Wells Fargo Securities LLC | 74,000 |
| | $517,841 |
See accompanying notes which are an integral part of the financial statements.
Treasury Portfolio
Financial Statements
Statement of Assets and Liabilities
| Amounts in thousands (except per-share amounts) | | March 31, 2018 |
| Assets | | |
Investment in securities, at value (including repurchase agreements of $11,034,637) — See accompanying schedule:
Unaffiliated issuers (cost $23,184,830) | | $23,184,830 |
| Receivable for investments sold | | |
| Regular delivery | | 626,084 |
| Delayed delivery | | 114,863 |
| Receivable for fund shares sold | | 2,031 |
| Interest receivable | | 22,860 |
| Prepaid expenses | | 16 |
| Receivable from investment adviser for expense reductions | | 548 |
| Other receivables | | 237 |
| Total assets | | 23,951,469 |
| Liabilities | | |
| Payable to custodian bank | $32,721 | |
| Payable for investments purchased | 402,205 | |
| Payable for fund shares redeemed | 512 | |
| Distributions payable | 1,784 | |
| Accrued management fee | 2,756 | |
| Distribution and service plan fees payable | 1,014 | |
| Other affiliated payables | 1,014 | |
| Other payables and accrued expenses | 333 | |
| Total liabilities | | 442,339 |
| Net Assets | | $23,509,130 |
| Net Assets consist of: | | |
| Paid in capital | | $23,509,185 |
| Distributions in excess of net investment income | | (34) |
| Accumulated undistributed net realized gain (loss) on investments | | (21) |
| Net Assets | | $23,509,130 |
| Class I: | | |
| Net Asset Value, offering price and redemption price per share ($8,243,895 ÷ 8,240,512 shares) | | $1.00 |
| Class II: | | |
| Net Asset Value, offering price and redemption price per share ($115,967 ÷ 115,887 shares) | | $1.00 |
| Class III: | | |
| Net Asset Value, offering price and redemption price per share ($2,802,542 ÷ 2,802,123 shares) | | $1.00 |
| Class IV: | | |
| Net Asset Value, offering price and redemption price per share ($925,758 ÷ 925,460 shares) | | $1.00 |
| Select Class: | | |
| Net Asset Value, offering price and redemption price per share ($377,056 ÷ 376,964 shares) | | $1.00 |
| Institutional Class: | | |
| Net Asset Value, offering price and redemption price per share ($11,043,912 ÷ 11,043,307 shares) | | $1.00 |
See accompanying notes which are an integral part of the financial statements.
Statement of Operations
| Amounts in thousands | | Year ended March 31, 2018 |
| Investment Income | | |
| Interest | | $255,519 |
| Expenses | | |
| Management fee | $31,304 | |
| Transfer agent fees | 10,563 | |
| Distribution and service plan fees | 11,950 | |
| Accounting fees and expenses | 1,326 | |
| Custodian fees and expenses | 173 | |
| Independent trustees' fees and expenses | 74 | |
| Registration fees | 176 | |
| Audit | 51 | |
| Legal | 44 | |
| Miscellaneous | 95 | |
| Total expenses before reductions | 55,756 | |
| Expense reductions | (7,334) | 48,422 |
| Net investment income (loss) | | 207,097 |
| Realized and Unrealized Gain (Loss) | | |
| Net realized gain (loss) on: | | |
| Investment securities: | | |
| Unaffiliated issuers | | 24 |
| Total net realized gain (loss) | | 24 |
| Net increase in net assets resulting from operations | | $207,121 |
See accompanying notes which are an integral part of the financial statements.
Statement of Changes in Net Assets
| Amounts in thousands | Year ended March 31, 2018 | Year ended March 31, 2017 |
| Increase (Decrease) in Net Assets | | |
| Operations | | |
| Net investment income (loss) | $207,097 | $46,904 |
| Net realized gain (loss) | 24 | 192 |
| Net increase in net assets resulting from operations | 207,121 | 47,096 |
| Distributions to shareholders from net investment income | (207,508) | (46,502) |
| Share transactions - net increase (decrease) | 4,560,709 | 1,492,662 |
| Total increase (decrease) in net assets | 4,560,322 | 1,493,256 |
| Net Assets | | |
| Beginning of period | 18,948,808 | 17,455,552 |
| End of period | $23,509,130 | $18,948,808 |
| Other Information | | |
| Undistributed net investment income end of period | $– | $520 |
| Distributions in excess of net investment income end of period | $(34) | $– |
See accompanying notes which are an integral part of the financial statements.
Financial Highlights
Treasury Portfolio Class I
| Years ended March 31, | 2018 | 2017 | 2016 | 2015 | 2014 |
| Selected Per–Share Data | | | | | |
| Net asset value, beginning of period | $1.00 | $1.00 | $1.00 | $1.00 | $1.00 |
| Income from Investment Operations | | | | | |
| Net investment income (loss) | .009 | .003 | .001 | –A | –A |
| Net realized and unrealized gain (loss)A | – | – | – | – | – |
| Total from investment operations | .009 | .003 | .001 | –A | –A |
| Distributions from net investment income | (.009) | (.003) | (.001) | –A | –A |
| Total distributions | (.009) | (.003) | (.001) | –A | –A |
| Net asset value, end of period | $1.00 | $1.00 | $1.00 | $1.00 | $1.00 |
| Total ReturnB | .95% | .27% | .05% | .01% | .01% |
| Ratios to Average Net AssetsC | | | | | |
| Expenses before reductions | .21% | .21% | .21% | .21% | .21% |
| Expenses net of fee waivers, if any | .18% | .18% | .13% | .07% | .08% |
| Expenses net of all reductions | .18% | .18% | .13% | .07% | .08% |
| Net investment income (loss) | .96% | .27% | .05% | .01% | .01% |
| Supplemental Data | | | | | |
| Net assets, end of period (in millions) | $8,244 | $8,308 | $9,639 | $11,727 | $9,736 |
A Amount represents less than $.0005 per share.
B Total returns would have been lower if certain expenses had not been reduced during the applicable periods shown.
C Expense ratios reflect operating expenses of the class. Expenses before reductions do not reflect amounts reimbursed or waived or reductions from expense offset arrangements and do not represent the amount paid by the class during periods when reimbursements, waivers or reductions occur. Expenses net of fee waivers reflect expenses after reimbursement and waivers but prior to reductions from expense offset arrangements. Expenses net of all reductions represent the net expenses paid by the class.
See accompanying notes which are an integral part of the financial statements.
Treasury Portfolio Class II
| Years ended March 31, | 2018 | 2017 | 2016 | 2015 | 2014 |
| Selected Per–Share Data | | | | | |
| Net asset value, beginning of period | $1.00 | $1.00 | $1.00 | $1.00 | $1.00 |
| Income from Investment Operations | | | | | |
| Net investment income (loss) | .008 | .001 | –A | –A | –A |
| Net realized and unrealized gain (loss)A | – | – | – | – | – |
| Total from investment operations | .008 | .001 | –A | –A | –A |
| Distributions from net investment income | (.008) | (.001) | –A | –A | –A |
| Total distributions | (.008) | (.001) | –A | –A | –A |
| Net asset value, end of period | $1.00 | $1.00 | $1.00 | $1.00 | $1.00 |
| Total ReturnB | .80% | .12% | .01% | .01% | .01% |
| Ratios to Average Net AssetsC | | | | | |
| Expenses before reductions | .36% | .36% | .36% | .36% | .36% |
| Expenses net of fee waivers, if any | .33% | .33% | .22% | .07% | .08% |
| Expenses net of all reductions | .33% | .33% | .22% | .07% | .08% |
| Net investment income (loss) | .81% | .12% | .01% | .01% | .01% |
| Supplemental Data | | | | | |
| Net assets, end of period (in millions) | $116 | $363 | $557 | $70 | $133 |
A Amount represents less than $.0005 per share.
B Total returns would have been lower if certain expenses had not been reduced during the applicable periods shown.
C Expense ratios reflect operating expenses of the class. Expenses before reductions do not reflect amounts reimbursed or waived or reductions from expense offset arrangements and do not represent the amount paid by the class during periods when reimbursements, waivers or reductions occur. Expenses net of fee waivers reflect expenses after reimbursement and waivers but prior to reductions from expense offset arrangements. Expenses net of all reductions represent the net expenses paid by the class.
See accompanying notes which are an integral part of the financial statements.
Treasury Portfolio Class III
| Years ended March 31, | 2018 | 2017 | 2016 | 2015 | 2014 |
| Selected Per–Share Data | | | | | |
| Net asset value, beginning of period | $1.00 | $1.00 | $1.00 | $1.00 | $1.00 |
| Income from Investment Operations | | | | | |
| Net investment income (loss) | .007 | .001 | –A | –A | –A |
| Net realized and unrealized gain (loss)A | – | – | – | – | – |
| Total from investment operations | .007 | .001 | –A | –A | –A |
| Distributions from net investment income | (.007) | (.001) | –A | –A | –A |
| Total distributions | (.007) | (.001) | –A | –A | –A |
| Net asset value, end of period | $1.00 | $1.00 | $1.00 | $1.00 | $1.00 |
| Total ReturnB | .70% | .05% | .01% | .01% | .01% |
| Ratios to Average Net AssetsC | | | | | |
| Expenses before reductions | .46% | .46% | .46% | .46% | .46% |
| Expenses net of fee waivers, if any | .43% | .39% | .17% | .07% | .08% |
| Expenses net of all reductions | .43% | .39% | .17% | .07% | .08% |
| Net investment income (loss) | .71% | .06% | .02% | .01% | .01% |
| Supplemental Data | | | | | |
| Net assets, end of period (in millions) | $2,803 | $2,563 | $2,862 | $2,866 | $2,654 |
A Amount represents less than $.0005 per share.
B Total returns would have been lower if certain expenses had not been reduced during the applicable periods shown.
C Expense ratios reflect operating expenses of the class. Expenses before reductions do not reflect amounts reimbursed or waived or reductions from expense offset arrangements and do not represent the amount paid by the class during periods when reimbursements, waivers or reductions occur. Expenses net of fee waivers reflect expenses after reimbursement and waivers but prior to reductions from expense offset arrangements. Expenses net of all reductions represent the net expenses paid by the class.
See accompanying notes which are an integral part of the financial statements.
Treasury Portfolio Class IV
| Years ended March 31, | 2018 | 2017 | 2016 | 2015 | 2014 |
| Selected Per–Share Data | | | | | |
| Net asset value, beginning of period | $1.00 | $1.00 | $1.00 | $1.00 | $1.00 |
| Income from Investment Operations | | | | | |
| Net investment income (loss) | .004 | –A | –A | –A | –A |
| Net realized and unrealized gain (loss)A | – | – | – | – | – |
| Total from investment operations | .004 | –A | –A | –A | –A |
| Distributions from net investment income | (.004) | –A | –A | –A | –A |
| Total distributions | (.004) | –A | –A | –A | –A |
| Net asset value, end of period | $1.00 | $1.00 | $1.00 | $1.00 | $1.00 |
| Total ReturnB | .45% | .01% | .01% | .01% | .01% |
| Ratios to Average Net AssetsC | | | | | |
| Expenses before reductions | .71% | .71% | .71% | .71% | .71% |
| Expenses net of fee waivers, if any | .68% | .43% | .18% | .07% | .08% |
| Expenses net of all reductions | .68% | .43% | .18% | .07% | .08% |
| Net investment income (loss) | .46% | .02% | .01% | .01% | .01% |
| Supplemental Data | | | | | |
| Net assets, end of period (in millions) | $926 | $793 | $905 | $621 | $591 |
A Amount represents less than $.0005 per share.
B Total returns would have been lower if certain expenses had not been reduced during the applicable periods shown.
C Expense ratios reflect operating expenses of the class. Expenses before reductions do not reflect amounts reimbursed or waived or reductions from expense offset arrangements and do not represent the amount paid by the class during periods when reimbursements, waivers or reductions occur. Expenses net of fee waivers reflect expenses after reimbursement and waivers but prior to reductions from expense offset arrangements. Expenses net of all reductions represent the net expenses paid by the class.
See accompanying notes which are an integral part of the financial statements.
Treasury Portfolio Select Class
| Years ended March 31, | 2018 | 2017 | 2016 | 2015 | 2014 |
| Selected Per–Share Data | | | | | |
| Net asset value, beginning of period | $1.00 | $1.00 | $1.00 | $1.00 | $1.00 |
| Income from Investment Operations | | | | | |
| Net investment income (loss) | .009 | .002 | –A | –A | –A |
| Net realized and unrealized gain (loss)A | – | – | – | – | – |
| Total from investment operations | .009 | .002 | –A | –A | –A |
| Distributions from net investment income | (.009) | (.002) | –A | –A | –A |
| Total distributions | (.009) | (.002) | –A | –A | –A |
| Net asset value, end of period | $1.00 | $1.00 | $1.00 | $1.00 | $1.00 |
| Total ReturnB | .90% | .22% | .04% | .01% | .01% |
| Ratios to Average Net AssetsC | | | | | |
| Expenses before reductions | .26% | .26% | .26% | .26% | .26% |
| Expenses net of fee waivers, if any | .23% | .23% | .15% | .07% | .08% |
| Expenses net of all reductions | .23% | .23% | .15% | .07% | .08% |
| Net investment income (loss) | .91% | .22% | .04% | .01% | .01% |
| Supplemental Data | | | | | |
| Net assets, end of period (in millions) | $377 | $276 | $287 | $225 | $238 |
A Amount represents less than $.0005 per share.
B Total returns would have been lower if certain expenses had not been reduced during the applicable periods shown.
C Expense ratios reflect operating expenses of the class. Expenses before reductions do not reflect amounts reimbursed or waived or reductions from expense offset arrangements and do not represent the amount paid by the class during periods when reimbursements, waivers or reductions occur. Expenses net of fee waivers reflect expenses after reimbursement and waivers but prior to reductions from expense offset arrangements. Expenses net of all reductions represent the net expenses paid by the class.
See accompanying notes which are an integral part of the financial statements.
Treasury Portfolio Institutional Class
| Years ended March 31, | 2018 | 2017 | 2016 | 2015 A |
| Selected Per–Share Data | | | | |
| Net asset value, beginning of period | $1.00 | $1.00 | $1.00 | $1.00 |
| Income from Investment Operations | | | | |
| Net investment income (loss) | .010 | .003 | .001 | –B |
| Net realized and unrealized gain (loss)B | – | – | – | – |
| Total from investment operations | .010 | .003 | .001 | –B |
| Distributions from net investment income | (.010) | (.003) | (.001) | –B |
| Total distributions | (.010) | (.003) | (.001) | –B |
| Net asset value, end of period | $1.00 | $1.00 | $1.00 | $1.00 |
| Total ReturnC,D | .99% | .31% | .07% | .01% |
| Ratios to Average Net AssetsE | | | | |
| Expenses before reductions | .18% | .18% | .18% | .18%F |
| Expenses net of fee waivers, if any | .14% | .14% | .13% | .07%F |
| Expenses net of all reductions | .14% | .14% | .13% | .07%F |
| Net investment income (loss) | 1.00% | .31% | .11% | - %F,G |
| Supplemental Data | | | | |
| Net assets, end of period (in millions) | $11,044 | $6,645 | $3,205 | $669 |
A For the period May 14, 2014 (commencement of sale of shares) to March 31, 2015.
B Amount represents less than $.0005 per share.
C Total returns for periods of less than one year are not annualized.
D Total returns would have been lower if certain expenses had not been reduced during the applicable periods shown.
E Expense ratios reflect operating expenses of the class. Expenses before reductions do not reflect amounts reimbursed or waived or reductions from expense offset arrangements and do not represent the amount paid by the class during periods when reimbursements, waivers or reductions occur. Expense ratios before reductions for start-up periods may not be representative of longer-term operating periods. Expenses net of fee waivers reflect expenses after reimbursement and waivers but prior to reductions from expense offset arrangements. Expenses net of all reductions represent the net expenses paid by the class.
F Annualized
G Amount represents less than .005%.
See accompanying notes which are an integral part of the financial statements.
Government Portfolio
Investment Summary/Performance (Unaudited)
Effective Maturity Diversification as of March 31, 2018
| Days | % of fund's investments 3/31/18 |
| 1 - 7 | 37.2 |
| 8 - 30 | 41.2 |
| 31 - 60 | 7.2 |
| 61 - 90 | 9.8 |
| 91 - 180 | 4.6 |
Effective maturity is determined in accordance with the requirements of Rule 2a-7 under the Investment Company Act of 1940.
Asset Allocation (% of fund's net assets)
| As of March 31, 2018 |
| | U.S. Treasury Debt | 20.9% |
| | U.S. Government Agency Debt | 47.7% |
| | Repurchase Agreements | 31.0% |
| | Net Other Assets (Liabilities) | 0.4% |
Current 7-Day Yields
| | 3/31/18 |
| Class I | 1.49% |
| Class II | 1.34% |
| Class III | 1.24% |
| Select Class | 1.44% |
| Institutional Class | 1.53% |
Yield refers to the income paid by the Fund over a given period. Yield for money market funds is usually for seven-day periods, as it is here, though it is expressed as an annual percentage rate. Past performance is no guarantee of future results. Yield will vary and it's possible to lose money investing in the Fund. A portion of the Fund's expenses was reimbursed and/or waived. Absent such reimbursements and/or waivers the yield for the period ending March 31, 2018, the most recent period shown in the table, would have been 1.47% for Class I, 1.32% for Class II, 1.22% for Class III, 1.42% for Select Class and 1.49% for Institutional Class.
Government Portfolio
Schedule of Investments March 31, 2018
Showing Percentage of Net Assets
| U.S. Treasury Debt - 20.9% | | | | |
| | | Yield(a) | Principal Amount (000s) | Value (000s) |
| U.S. Treasury Inflation Protected Obligations - 1.9% | | | | |
| U.S. Treasury Notes | | | | |
| 4/15/18 | | 1.73 to 1.85% | $1,939,736 | $1,942,961 |
| U.S. Treasury Obligations - 19.0% | | | | |
| U.S. Treasury Bills | | | | |
| 4/5/18 to 8/30/18 | | 1.19 to 1.85 | 15,647,327 | 15,603,543 |
| U.S. Treasury Notes | | | | |
| 4/30/18 to 1/31/20 | | 1.60 to 1.91 (b) | 3,604,000 | 3,602,740 |
| | | | | 19,206,283 |
| TOTAL U.S. TREASURY DEBT | | | | |
| (Cost $21,149,244) | | | | 21,149,244 |
|
| U.S. Government Agency Debt - 47.7% | | | | |
| Federal Agencies - 47.7% | | | | |
| Fannie Mae | | | | |
| 4/16/18 to 6/18/18 | | 1.40 to 1.75 | 972,000 | 969,415 |
| Federal Farm Credit Bank | | | | |
| 4/6/18 to 6/26/19 | | 1.51 to 2.01 (b) | 4,207,000 | 4,207,345 |
| Federal Home Loan Bank | | | | |
| 4/4/18 to 7/11/19 | | 1.29 to 2.05 (b) | 35,387,177 | 35,372,248 |
| Freddie Mac | | | | |
| 4/2/18 to 8/8/19 | | 1.29 to 1.75 (b) | 7,690,929 | 7,690,840 |
| TOTAL U.S. GOVERNMENT AGENCY DEBT | | | | |
| (Cost $48,239,848) | | | | 48,239,848 |
| U.S. Government Agency Repurchase Agreement - 12.2% | | | |
| | | Maturity Amount (000s) | Value (000s) |
| In a joint trading account at: | | | |
| 1.8% dated 3/29/18 due 4/2/18 (Collateralized by (U.S. Government Obligations) # | | $998 | $998 |
| 1.82% dated 3/29/18 due 4/2/18 (Collateralized by (U.S. Government Obligations) # | | 3,886,756 | 3,885,971 |
| With: | | | |
| Barclays Capital, Inc. at 1.81%, dated 3/29/18 due 4/5/18 (Collateralized by U.S. Government Obligations valued at $126,486,360, 3.50% - 4.00%, 12/1/47 - 1/1/48) | | 124,044 | 124,000 |
| BMO Capital Markets Corp. at 1.75%, dated 3/26/18 due 4/5/18 (Collateralized by U.S. Government Obligations valued at $57,131,107, 2.00% - 5.50%, 10/24/19 - 6/1/47) | | 56,082 | 56,000 |
| BMO Harris Bank NA at 1.75%, dated 3/26/18 due 4/5/18 (Collateralized by U.S. Government Obligations valued at $57,131,107, 0.63% - 6.00%, 8/7/18 - 3/1/48) | | 56,082 | 56,000 |
| BNP Paribas, S.A. at 1.77%, dated: | | | |
| 3/19/18 due 4/5/18 (Collateralized by U.S. Treasury Obligations valued at $75,139,210, 0.00% - 7.00%, 7/31/18 - 2/15/48) | | 73,215 | 73,000 |
| 3/20/18 due 4/5/18 (Collateralized by U.S. Treasury Obligations valued at $75,050,639, 0.00% - 7.00%, 6/12/19 - 10/1/47) | | 73,223 | 73,000 |
| Citibank NA at: | | | |
| 1.79%, dated 3/27/18 due 4/3/18 (Collateralized by U.S. Treasury Obligations valued at $74,472,813, 0.00% - 3.13%, 4/19/18 - 5/15/42) | | 73,025 | 73,000 |
| 1.8%, dated 3/27/18 due 4/3/18 (Collateralized by U.S. Treasury Obligations valued at $383,577,607, 0.00% - 3.63%, 4/15/18 - 11/15/26) | | 376,132 | 376,000 |
| HSBC Securities, Inc. at 1.79%, dated 3/29/18 due 4/5/18 (Collateralized by U.S. Government Obligations valued at $435,709,144, 0.00% - 6.75%, 5/15/18 - 11/15/41) | | 426,148 | 426,000 |
| ING Financial Markets LLC at: | | | |
| 1.66%, dated: | | | |
| 3/12/18 due 4/11/18 (Collateralized by U.S. Government Obligations valued at $150,065,480, 2.24% - 4.50%, 8/20/41 - 5/16/53) | | 147,203 | 147,000 |
| 3/13/18 due 4/12/18 (Collateralized by U.S. Government Obligations valued at $119,433,564, 3.75% - 4.00%, 3/27/19 - 7/25/39) | | 117,162 | 117,000 |
| 1.68%, dated 3/14/18 due 4/2/18 (Collateralized by U.S. Treasury Obligations valued at $74,515,650, 2.00% - 2.25%, 2/15/25 - 11/15/27) | | 73,065 | 73,000 |
| Merrill Lynch, Pierce, Fenner & Smith at 1.68%, dated 3/16/18 due 4/2/18 (Collateralized by U.S. Government Obligations valued at $448,072,550, 2.00% - 5.00%, 2/15/42 - 3/20/48) | | 439,348 | 439,000 |
| Mitsubishi UFJ Securities (U.S.A.), Inc. at: | | | |
| 1.6%, dated 3/7/18 due: | | | |
| 5/7/18 (Collateralized by U.S. Government Obligations valued at $191,956,021, 1.97% - 5.50%, 8/1/19 - 8/1/48) | | 188,510 | 188,000 |
| 5/8/18 (Collateralized by U.S. Government Obligations valued at $162,345,784, 2.06% - 6.05%, 8/1/19 - 9/20/63) | | 159,438 | 159,000 |
| 1.77%, dated 3/19/18 due 5/18/18 (Collateralized by U.S. Government Obligations valued at $253,096,809, 2.00% - 5.75%, 11/1/23 - 6/20/67) | | 248,732 | 248,000 |
| 1.78%, dated: | | | |
| 3/20/18 due 5/21/18 (Collateralized by U.S. Government Obligations valued at $209,203,389, 2.00% - 5.75%, 5/1/21 - 3/20/48) | | 205,628 | 205,000 |
| 3/21/18 due 5/22/18 (Collateralized by U.S. Government Obligations valued at $75,513,589, 2.32% - 5.37%, 11/1/21 - 4/1/48) | | 74,227 | 74,000 |
| 3/26/18 due 5/25/18 (Collateralized by U.S. Government Obligations valued at $194,858,531, 2.16% - 5.54%, 3/1/19 - 3/20/48) | | 191,567 | 191,000 |
| 1.79%, dated 3/22/18 due 5/23/18 (Collateralized by U.S. Government Obligations valued at $197,958,712, 2.04% - 5.96%, 12/1/23 - 8/1/48) | | 194,598 | 194,000 |
| Nomura Securities International, Inc. at 1.82%, dated 3/29/18 due 4/2/18 (Collateralized by U.S. Government Obligations valued at $1,371,969,358, 0.00% - 8.00%, 9/15/18 - 2/20/68) | | 1,345,272 | 1,345,000 |
| RBC Dominion Securities at: | | | |
| 1.45%, dated 2/7/18 due 4/5/18 (Collateralized by U.S. Government Obligations valued at $150,180,378, 0.38% - 4.75%, 7/15/27 - 11/20/47) | | 147,267 | 146,900 |
| 1.46%, dated 1/25/18 due 4/5/18 (Collateralized by U.S. Government Obligations valued at $116,608,847, 0.38% - 4.75%, 7/15/27 - 11/20/47) | | 114,388 | 114,000 |
| 1.69%, dated 3/16/18 due 4/3/18 (Collateralized by U.S. Treasury Obligations valued at $224,764,277, 0.00% - 4.75%, 4/19/18 - 11/15/47) | | 220,036 | 219,850 |
| 1.74%, dated 3/19/18 due 4/5/18 (Collateralized by U.S. Government Obligations valued at $208,457,807, 0.00% - 5.00%, 4/15/19 - 11/20/47) | | 204,168 | 204,000 |
| RBC Financial Group at: | | | |
| 1.48%, dated: | | | |
| 1/29/18 due 4/5/18 (Collateralized by U.S. Government Obligations valued at $191,218,200, 1.92% - 5.00%, 11/1/25 - 1/1/57) | | 187,700 | 187,000 |
| 1/30/18 due 4/5/18 (Collateralized by U.S. Government Obligations valued at $36,706,819, 3.00% - 4.50%, 10/1/27 - 1/1/57) | | 36,033 | 35,900 |
| 1.52%, dated 2/12/18 due 4/5/18 (Collateralized by U.S. Government Obligations valued at $104,262,613, 1.50% - 6.00%, 11/1/25 - 1/1/57) | | 102,258 | 102,000 |
| 1.54%, dated 3/1/18 due 4/2/18 (Collateralized by U.S. Government Obligations valued at $78,637,434, 2.12% - 4.50%, 4/1/26 - 1/1/57) | | 77,105 | 77,000 |
| 1.59%, dated 3/5/18 due 4/5/18 (Collateralized by U.S. Government Obligations valued at $150,105,837, 1.50% - 6.00%, 9/1/26 - 11/20/65) | | 147,227 | 147,000 |
| 1.61%, dated 3/9/18 due 4/5/18 (Collateralized by U.S. Government Obligations valued at $148,910,519, 1.92% - 6.97%, 3/1/25 - 1/1/57) | | 146,052 | 145,850 |
| 1.69%, dated 3/16/18 due 4/5/18 (Collateralized by U.S. Government Obligations valued at $111,253,070, 2.12% - 4.50%, 4/1/26 - 1/1/57) | | 109,102 | 109,000 |
| 1.72%, dated 3/19/18 due 4/5/18 (Collateralized by U.S. Government Obligations valued at $254,144,380, 1.92% - 6.50%, 3/1/26 - 2/1/57) | | 249,214 | 249,000 |
| 1.73%, dated 3/20/18 due 4/5/18 (Collateralized by U.S. Government Obligations valued at $123,483,996, 2.12% - 6.00%, 1/1/26 - 1/1/57) | | 121,116 | 121,000 |
| Societe Generale at: | | | |
| 1.47%, dated 1/31/18 due 4/9/18 (Collateralized by U.S. Treasury Obligations valued at $104,338,760, 0.13% - 6.00%, 7/15/18 - 11/15/45) | | 102,283 | 102,000 |
| 1.8%, dated 3/29/18 due 4/2/18 (Collateralized by U.S. Treasury Obligations valued at $1,000,312,930, 0.75% - 3.88%, 7/15/18 - 5/15/45) | | 980,196 | 980,000 |
| Sumitomo Mitsui Trust Bank Ltd. at: | | | |
| 1.6%, dated 3/5/18 due 4/5/18 (Collateralized by U.S. Government Obligations valued at $75,759,475, 2.00% - 3.50%, 1/15/21 - 9/20/47) | | 74,115 | 74,000 |
| 1.61%, dated: | | | |
| 3/2/18 due 4/5/18 (Collateralized by U.S. Government Obligations valued at $126,908,177, 2.00% - 3.00%, 1/15/21 - 6/20/46) | | 124,332 | 124,138 |
| 3/6/18 due 4/5/18 (Collateralized by U.S. Government Obligations valued at $126,872,975, 2.00% - 3.00%, 1/15/21 - 6/20/46) | | 124,194 | 124,000 |
| 1.62%, dated 3/5/18 due 4/5/18 (Collateralized by U.S. Government Obligations valued at $22,509,164, 2.00% - 4.00%, 1/15/21 - 9/20/47) | | 22,042 | 22,000 |
| 1.65%, dated 3/9/18 due 4/5/18 (Collateralized by U.S. Government Obligations valued at $124,486,443, 2.00% - 3.00%, 1/15/21 - 11/20/46) | | 121,795 | 121,600 |
| 1.68%, dated 3/13/18 due 4/5/18 (Collateralized by U.S. Government Obligations valued at $123,307,758, 3.00%, 11/20/46) | | 120,609 | 120,413 |
| 1.8%, dated 3/29/18 due 4/5/18 (Collateralized by U.S. Government Obligations valued at $112,464,341, 3.00%, 8/20/46) | | 110,187 | 110,000 |
| 1.81%, dated 3/29/18 due 4/5/18 (Collateralized by U.S. Government Obligations valued at $127,801,038, 3.00%, 8/20/46) | | 125,251 | 125,000 |
| TOTAL U.S. GOVERNMENT AGENCY REPURCHASE AGREEMENT | | | |
| (Cost $12,285,620) | | | 12,285,620 |
|
| U.S. Treasury Repurchase Agreement - 18.8% | | | |
| With: | | | |
| BMO Capital Markets Corp. at 1.73%, dated 3/27/18 due 4/3/18 (Collateralized by U.S. Treasury Obligations valued at $115,281,960, 0.00% - 6.13%, 5/24/18 - 5/15/47) | | 113,038 | 113,000 |
| BMO Harris Bank NA at: | | | |
| 1.45%, dated: | | | |
| 1/16/18 due 4/5/18 (Collateralized by U.S. Treasury Obligations valued at $131,116,075, 1.38% - 2.50%, 2/28/19 - 8/15/23) | | 128,443 | 128,000 |
| 1/29/18 due 4/5/18 (Collateralized by U.S. Treasury Obligations valued at $266,499,981, 2.00% - 2.25%, 7/31/21 - 2/15/27) | | 259,772 | 259,000 |
| 1.46%, dated 1/22/18 due 4/5/18 (Collateralized by U.S. Treasury Obligations valued at $133,538,162, 2.13% - 3.75%, 11/15/18 - 8/15/21) | | 129,481 | 129,000 |
| 1.58%, dated 3/7/18 due 4/5/18 (Collateralized by U.S. Treasury Obligations valued at $137,091,166, 2.50% - 3.13%, 8/15/23 - 8/15/44) | | 131,172 | 131,000 |
| 1.59%, dated 3/7/18 due 4/5/18 (Collateralized by U.S. Treasury Obligations valued at $67,346,984, 4.00%, 8/15/18) | | 65,098 | 65,000 |
| 1.64%, dated 3/2/18 due 4/5/18 (Collateralized by U.S. Treasury Obligations valued at $139,024,814, 3.13%, 8/15/44) | | 133,321 | 133,000 |
| 1.73%, dated: | | | |
| 3/22/18 due 4/5/18 (Collateralized by U.S. Treasury Obligations valued at $277,325,317, 2.13%, 5/15/25) | | 268,335 | 268,000 |
| 3/27/18 due 4/3/18 (Collateralized by U.S. Treasury Obligations valued at $116,296,827, 0.00% - 2.25%, 5/17/18 - 8/15/27) | | 114,038 | 114,000 |
| BNP Paribas, S.A. at: | | | |
| 1.4%, dated 1/30/18 due 4/2/18 (Collateralized by U.S. Treasury Obligations valued at $266,663,739, 0.00% - 5.25%, 7/31/18 - 8/15/45) | | 259,624 | 259,000 |
| 1.45%, dated 1/12/18 due 4/5/18 (Collateralized by U.S. Treasury Obligations valued at $259,883,617, 0.00% - 4.38%, 4/19/18 - 11/15/42) | | 254,921 | 254,000 |
| 1.47%, dated 1/23/18 due 4/5/18 (Collateralized by U.S. Treasury Obligations valued at $262,846,489, 1.14% - 3.13%, 4/30/19 - 11/15/42) | | 257,944 | 257,000 |
| 1.64%, dated 1/24/18 due 4/5/18 (Collateralized by U.S. Treasury Obligations valued at $132,781,784, 1.18% - 3.88%, 7/31/18 - 2/15/44)(b)(c)(d) | | 129,411 | 129,000 |
| 1.65%, dated: | | | |
| 1/25/18 due 4/5/18 (Collateralized by U.S. Treasury Obligations valued at $198,643,067, 0.00% - 7.50%, 4/26/18 - 8/15/47)(b)(c)(d) | | 194,614 | 194,000 |
| 3/2/18 due 4/5/18 (Collateralized by U.S. Treasury Obligations valued at $133,890,040, 1.14% - 5.25%, 4/30/19 - 2/15/44) | | 131,366 | 131,000 |
| 1.66%, dated: | | | |
| 3/5/18 due 4/5/18 (Collateralized by U.S. Treasury Obligations valued at $407,237,099, 1.13% - 8.75%, 4/30/19 - 8/15/45) | | 398,153 | 397,000 |
| 3/6/18 due 4/5/18 (Collateralized by U.S. Treasury Obligations valued at $477,831,467, 1.13% - 6.25%, 7/31/19 - 8/15/44) | | 467,354 | 466,000 |
| 3/7/18 due 4/5/18 (Collateralized by U.S. Treasury Obligations valued at $273,126,354, 1.13% - 3.00%, 7/31/19 - 5/15/45) | | 267,776 | 267,000 |
| 1.67%, dated: | | | |
| 1/24/18 due 4/24/18 (Collateralized by U.S. Treasury Obligations valued at $132,036,189, 1.13% - 7.13%, 4/30/19 - 8/15/42)(b)(c)(d) | | 129,531 | 129,000 |
| 3/8/18 due 4/5/18 (Collateralized by U.S. Treasury Obligations valued at $268,762,099, 0.00% - 8.75%, 4/26/18 - 5/15/45) | | 262,766 | 262,000 |
| 1.68%, dated 3/9/18 due 4/5/18 (Collateralized by U.S. Treasury Obligations valued at $405,193,411, 1.13% - 9.13%, 5/15/18 - 2/15/48) | | 397,164 | 396,000 |
| 1.7%, dated 3/12/18 due 4/5/18 (Collateralized by U.S. Treasury Obligations valued at $340,546,402, 0.00% - 8.75%, 5/31/18 - 8/15/47) | | 331,834 | 330,850 |
| 1.73%, dated 3/15/18 due 4/5/18 (Collateralized by U.S. Treasury Obligations valued at $272,659,291, 1.14% - 8.13%, 4/30/19 - 5/15/44) | | 266,780 | 266,000 |
| 1.75%, dated: | | | |
| 3/15/18 due 4/5/18 (Collateralized by U.S. Treasury Obligations valued at $543,357,494, 0.00% - 8.75%, 5/31/18 - 2/15/47) | | 533,323 | 531,000 |
| 3/28/18 due 4/5/18 (Collateralized by U.S. Treasury Obligations valued at $271,167,934, 1.13% - 4.25%, 7/31/18 - 8/15/47) | | 266,213 | 265,825 |
| 1.76%, dated: | | | |
| 3/19/18 due 4/5/18 (Collateralized by U.S. Treasury Obligations valued at $134,755,305, 0.00% - 8.75%, 5/24/18 - 11/15/44) | | 132,387 | 132,000 |
| 3/20/18 due 4/5/18 (Collateralized by U.S. Treasury Obligations valued at $270,432,148, 1.13% - 7.63%, 4/30/19 - 2/15/25) | | 265,803 | 265,000 |
| 3/22/18 due 4/5/18 (Collateralized by U.S. Treasury Obligations valued at $136,859,633, 1.14% - 7.25%, 4/30/19 - 2/15/46) | | 134,406 | 134,000 |
| 1.77%, dated: | | | |
| 3/16/18 due 4/5/18 (Collateralized by U.S. Treasury Obligations valued at $135,753,733, 0.00% - 8.75%, 4/26/18 - 2/15/48) | | 133,589 | 133,000 |
| 3/21/18 due 4/5/18 (Collateralized by U.S. Treasury Obligations valued at $272,460,535, 0.00% - 2.75%, 4/26/18 - 8/15/42) | | 267,814 | 267,000 |
| 3/28/18 due 4/5/18 (Collateralized by U.S. Treasury Obligations valued at $231,562,773, 1.18% - 2.75%, 10/31/19 - 8/15/26) | | 227,145 | 227,000 |
| 1.79%, dated 3/28/18 due 4/4/18 (Collateralized by U.S. Treasury Obligations valued at $231,563,035, 1.18% - 2.25%, 10/31/19 - 11/15/26) | | 227,079 | 227,000 |
| Credit AG at 1.72%, dated 3/28/18 due 4/4/18 (Collateralized by U.S. Treasury Obligations valued at $135,973,009, 3.00%, 11/15/45) | | 132,044 | 132,000 |
| Deutsche Bank AG at 1.83%, dated 3/29/18 due 4/2/18 (Collateralized by U.S. Treasury Obligations valued at $588,110,963, 0.75% - 8.13%, 5/31/18 - 11/15/45) | | 576,117 | 576,000 |
| Deutsche Bank Securities, Inc. at 1.83%, dated 3/29/18 due 4/2/18 (Collateralized by U.S. Treasury Obligations valued at $26,521,370, 1.44%, 1/31/20) | | 26,005 | 26,000 |
| DNB Bank ASA at 1.8%, dated 3/29/18 due 4/2/18 (Collateralized by U.S. Treasury Obligations valued at $667,113,374, 1.25% - 2.13%, 10/31/18 - 3/31/24) | | 654,131 | 654,000 |
| HSBC Securities, Inc. at: | | | |
| 1.76%, dated 3/27/18 due 4/3/18 (Collateralized by U.S. Treasury Obligations valued at $228,978,131, 1.25% - 8.75%, 12/31/18 - 2/15/42) | | 224,077 | 224,000 |
| 1.78%, dated 3/29/18 due 4/5/18 (Collateralized by U.S. Treasury Obligations valued at $388,620,834, 0.75% - 9.13%, 5/15/18 - 11/15/27) | | 381,132 | 381,000 |
| 1.81%, dated 3/29/18 due 4/2/18 (Collateralized by U.S. Treasury Obligations valued at $194,460,022, 1.38%, 2/28/19) | | 190,038 | 190,000 |
| ING Financial Markets LLC at 1.8%, dated 3/29/18 due 4/2/18 (Collateralized by U.S. Treasury Obligations valued at $466,522,163, 1.88% - 2.00%, 8/31/21 - 6/30/24) | | 455,091 | 455,000 |
| Lloyds Bank PLC at: | | | |
| 1.5%, dated: | | | |
| 1/24/18 due 4/24/18 (Collateralized by U.S. Treasury Obligations valued at $132,056,596, 1.13% - 6.75%, 2/28/19 - 8/15/26) | | 129,484 | 129,000 |
| 1/26/18 due 4/26/18 (Collateralized by U.S. Treasury Obligations valued at $66,885,246, 1.25% - 6.00%, 3/31/19 - 2/15/26) | | 65,244 | 65,000 |
| 1.52%, dated 1/29/18 due 5/2/18 (Collateralized by U.S. Treasury Obligations valued at $66,778,638, 2.13% - 7.63%, 12/31/21 - 2/15/25) | | 65,255 | 65,000 |
| 1.59%, dated 2/14/18 due 4/16/18 (Collateralized by U.S. Treasury Obligations valued at $108,444,857, 3.13% - 7.63%, 5/15/21 - 2/15/25) | | 105,283 | 105,000 |
| 1.67%, dated 2/20/18 due 5/21/18 (Collateralized by U.S. Treasury Obligations valued at $133,577,347, 6.00%, 2/15/26) | | 130,543 | 130,000 |
| 1.7%, dated 2/27/18 due 5/29/18 (Collateralized by U.S. Treasury Obligations valued at $271,767,609, 0.88% - 2.25%, 9/15/19 - 7/31/21) | | 266,139 | 265,000 |
| 1.74%, dated: | | | |
| 3/12/18 due 6/20/18 (Collateralized by U.S. Treasury Obligations valued at $189,837,657, 1.88%, 5/31/22) | | 185,794 | 184,900 |
| 3/15/18 due: | | | |
| 6/13/18 (Collateralized by U.S. Treasury Obligations valued at $137,038,270, 2.63%, 11/15/20) | | 133,579 | 133,000 |
| 6/15/18 (Collateralized by U.S. Treasury Obligations valued at $138,608,766, 7.50%, 11/15/24) | | 133,591 | 133,000 |
| 1.85%, dated 3/21/18 due 6/21/18 (Collateralized by U.S. Treasury Obligations valued at $270,493,433, 2.13% - 2.25%, 7/31/21 - 12/31/21) | | 265,248 | 264,000 |
| Mitsubishi UFJ Securities (U.S.A.), Inc. at 1.85%, dated 3/29/18 due 4/2/18 (Collateralized by U.S. Treasury Obligations valued at $65,923,374, 2.00% - 2.25%, 5/31/24 - 8/15/46) | | 64,013 | 64,000 |
| MUFG Securities (Canada), Ltd. at 1.81%, dated 3/29/18 due 4/2/18 (Collateralized by U.S. Treasury Obligations valued at $394,759,880, 1.13% - 2.38%, 9/30/19 - 11/15/27) | | 387,078 | 387,000 |
| MUFG Securities EMEA PLC at: | | | |
| 1.55%, dated 2/23/18 due 4/5/18 (Collateralized by U.S. Treasury Obligations valued at $101,567,283, 2.13% - 2.25%, 11/30/24 - 8/15/27) | | 99,200 | 99,000 |
| 1.61%, dated 3/14/18 due 4/5/18 (Collateralized by U.S. Treasury Obligations valued at $41,282,669, 1.50% - 3.00%, 5/31/22 - 5/15/45) | | 40,039 | 40,000 |
| 1.64%, dated 3/15/18 due 4/5/18 (Collateralized by U.S. Treasury Obligations valued at $137,822,563, 2.63%, 11/15/20) | | 134,165 | 134,000 |
| 1.73%, dated 3/20/18 due 4/5/18 (Collateralized by U.S. Treasury Obligations valued at $162,810,409, 1.00% - 2.63%, 3/15/19 - 8/15/25) | | 159,160 | 159,000 |
| 1.74%, dated 3/20/18 due 4/5/18 (Collateralized by U.S. Treasury Obligations valued at $101,796,812, 1.50% - 3.13%, 5/15/19 - 3/31/23) | | 99,100 | 99,000 |
| 1.75%, dated: | | | |
| 3/21/18 due 4/5/18 (Collateralized by U.S. Treasury Obligations valued at $74,673,275, 0.75%, 7/31/18) | | 73,082 | 73,000 |
| 3/22/18 due 4/5/18 (Collateralized by U.S. Treasury Obligations valued at $102,606,054, 1.63% - 2.25%, 2/15/26 - 11/15/27) | | 100,073 | 100,000 |
| 3/28/18 due 4/5/18 | | | |
| (Collateralized by U.S. Treasury Obligations valued at $43,062,170, 0.63% - 1.38%, 4/30/18 - 6/30/23) | | 42,039 | 42,000 |
| (Collateralized by U.S. Treasury Obligations valued at $23,688,555, 1.50% - 2.13%, 1/31/19 - 12/31/22) | | 23,046 | 23,000 |
| 4/2/18 due 4/3/18(e) | | 73,004 | 73,000 |
| 4/3/18 due 4/5/18(e) | | 32,034 | 32,000 |
| 1.76%, dated 3/22/18 due 4/5/18 (Collateralized by U.S. Treasury Obligations valued at $191,283,324, 2.63%, 11/15/20) | | 186,227 | 186,000 |
| 1.78%, dated 3/28/18 due 4/5/18 (Collateralized by U.S. Treasury Obligations valued at $61,957,712, 2.25% - 2.50%, 12/31/24 - 5/15/46) | | 60,042 | 60,000 |
| 1.79%, dated 3/28/18 due 4/5/18 (Collateralized by U.S. Treasury Obligations valued at $47,329,230, 2.25%, 11/15/27) | | 46,030 | 46,000 |
| 1.8%, dated 3/29/18 due 4/2/18 (Collateralized by U.S. Treasury Obligations valued at $126,620,331, 8.75%, 8/15/20) | | 122,024 | 122,000 |
| Natixis SA at 1.8%, dated 3/29/18 due 4/2/18 (Collateralized by U.S. Treasury Obligations valued at $1,062,893,144, 0.75% - 3.50%, 9/30/18 - 5/15/25) | | 1,042,208 | 1,042,000 |
| Norinchukin Bank at: | | | |
| 1.48%, dated 1/26/18 due 4/5/18 (Collateralized by U.S. Treasury Obligations valued at $66,471,582, 1.50%, 8/15/26) | | 65,184 | 65,000 |
| 1.63%, dated 2/22/18 due 4/23/18 (Collateralized by U.S. Treasury Obligations valued at $134,853,474, 2.00%, 11/15/26) | | 132,359 | 132,000 |
| 1.64%, dated 3/2/18 due 4/10/18 (Collateralized by U.S. Treasury Obligations valued at $135,829,897, 3.63%, 2/15/20) | | 133,236 | 133,000 |
| 1.65%, dated: | | | |
| 2/28/18 due 4/24/18 (Collateralized by U.S. Treasury Obligations valued at $134,820,290, 2.00%, 11/15/26) | | 132,333 | 132,000 |
| 3/1/18 due 4/25/18 (Collateralized by U.S. Treasury Obligations valued at $200,682,365, 2.13% - 2.25%, 11/30/23 - 8/15/46) | | 196,494 | 196,000 |
| 1.7%, dated 3/13/18 due 4/18/18 (Collateralized by U.S. Treasury Obligations valued at $67,374,137, 1.50%, 8/15/26) | | 66,112 | 66,000 |
| 1.73%, dated 3/14/18 due 4/19/18 (Collateralized by U.S. Treasury Obligations valued at $67,369,601, 1.50%, 8/15/26) | | 66,114 | 66,000 |
| 1.79%, dated 3/16/18 due 5/16/18 (Collateralized by U.S. Treasury Obligations valued at $135,750,423, 2.00% - 3.63%, 2/15/20 - 11/15/26) | | 133,403 | 133,000 |
| 1.83%, dated: | | | |
| 3/20/18 due 6/7/18 (Collateralized by U.S. Treasury Obligations valued at $67,350,898, 1.50% - 2.00%, 8/15/26 - 11/15/26) | | 66,265 | 66,000 |
| 3/21/18 due 6/8/18 (Collateralized by U.S. Treasury Obligations valued at $81,636,435, 2.00%, 11/15/26) | | 80,321 | 80,000 |
| Prudential Insurance Co. of America at 1.82%, dated 3/29/18 due 4/2/18 (Collateralized by U.S. Treasury Obligations valued at $592,369,118, 1.00% - 8.75%, 7/31/19 - 2/15/31) | | 576,876 | 576,759 |
| RBC Dominion Securities at: | | | |
| 1.44%, dated 2/6/18 due 4/5/18 (Collateralized by U.S. Treasury Obligations valued at $136,231,991, 1.63% - 4.75%, 9/30/20 - 2/15/47) | | 133,330 | 133,000 |
| 1.5%, dated 2/1/18 due 4/5/18 (Collateralized by U.S. Treasury Obligations valued at $201,460,740, 0.88% - 4.75%, 10/31/18 - 2/15/47) | | 197,747 | 197,000 |
| 1.57%, dated 3/7/18 due 4/5/18 (Collateralized by U.S. Treasury Obligations valued at $313,525,984, 1.38% - 4.75%, 8/31/18 - 2/15/47) | | 307,402 | 307,000 |
| 1.58%, dated 3/7/18 due 4/5/18 (Collateralized by U.S. Treasury Obligations valued at $133,785,296, 1.38% - 3.75%, 10/31/18 - 2/15/47) | | 131,190 | 131,000 |
| 1.66%, dated 3/15/18 due 4/2/18 (Collateralized by U.S. Treasury Obligations valued at $137,116,161, 2.25% - 3.00%, 4/30/21 - 5/15/45) | | 133,110 | 133,000 |
| 1.67%, dated 3/15/18 due 4/5/18 (Collateralized by U.S. Treasury Obligations valued at $135,814,030, 1.00% - 4.75%, 8/31/18 - 2/15/47) | | 133,130 | 133,000 |
| 1.7%, dated: | | | |
| 3/22/18 due 4/5/18 (Collateralized by U.S. Treasury Obligations valued at $136,769,436, 1.24% - 3.75%, 10/31/18 - 2/15/47) | | 134,184 | 134,000 |
| 3/23/18 due: | | | |
| 4/2/18 (Collateralized by U.S. Treasury Obligations valued at $102,058,422, 0.75% - 4.75%, 7/31/18 - 2/15/47) | | 100,047 | 100,000 |
| 4/3/18 (Collateralized by U.S. Treasury Obligations valued at $68,225,712, 1.88% - 3.00%, 4/30/21 - 2/15/47) | | 66,885 | 66,850 |
| 4/4/18 (Collateralized by U.S. Treasury Obligations valued at $102,057,833, 2.25%, 4/30/21 - 1/31/24) | | 100,057 | 100,000 |
| 1.71%, dated 3/26/18 due 4/5/18 (Collateralized by U.S. Treasury Obligations valued at $138,626,327, 0.88% - 2.50%, 5/31/18 - 2/15/45) | | 135,940 | 135,850 |
| 1.73%, dated 3/19/18 due 4/4/18 (Collateralized by U.S. Treasury Obligations valued at $188,845,166, 1.63% - 3.63%, 8/15/19 - 11/30/23) | | 185,142 | 185,000 |
| 1.74%, dated 3/29/18 due 4/5/18 (Collateralized by U.S. Treasury Obligations valued at $67,349,219, 2.25% - 3.75%, 4/30/21 - 8/15/47) | | 66,035 | 66,000 |
| Societe Generale at: | | | |
| 1.61%, dated 3/2/18 due 4/10/18 | | | |
| (Collateralized by U.S. Treasury Obligations valued at $268,143,238, 0.88% - 8.75%, 4/30/18 - 5/15/46) | | 261,455 | 261,000 |
| (Collateralized by U.S. Treasury Obligations valued at $134,728,805, 1.75% - 7.63%, 2/15/20 - 8/15/44) | | 131,228 | 131,000 |
| 1.62%, dated 3/5/18 due 4/11/18 (Collateralized by U.S. Treasury Obligations valued at $270,761,396, 1.13% - 8.75%, 7/31/18 - 5/15/46) | | 263,438 | 263,000 |
| 1.69%, dated 3/13/18 due 4/26/18 (Collateralized by U.S. Treasury Obligations valued at $269,435,553, 1.13% - 8.75%, 11/30/18 - 5/15/47) | | 262,541 | 262,000 |
| TD Securities (U.S.A.) at 1.8%, dated 3/29/18 due 4/2/18 (Collateralized by U.S. Treasury Obligations valued at $501,832,926, 0.00% - 9.13%, 4/5/18 - 2/15/48) | | 489,098 | 489,000 |
| TOTAL U.S. TREASURY REPURCHASE AGREEMENT | | | |
| (Cost $19,026,034) | | | 19,026,034 |
| TOTAL INVESTMENT IN SECURITIES - 99.6% | | | |
| (Cost $100,700,746) | | | 100,700,746 |
| NET OTHER ASSETS (LIABILITIES) - 0.4% | | | 367,492 |
| NET ASSETS - 100% | | | $101,068,238 |
The date shown for securities represents the date when principal payments must be paid, taking into account any call options exercised by the issuer and any permissible maturity shortening features other than interest rate resets.
Legend
(a) Yield represents either the annualized yield at the date of purchase, or the stated coupon rate, or, for floating and adjustable rate securities, the rate at period end.
(b) Coupon rates for floating and adjustable rate securities reflect the rates in effect at period end.
(c) The maturity amount is based on the rate at period end.
(d) Coupon is indexed to a floating interest rate which may be multiplied by a specified factor and/or subject to caps or floors.
(e) Represents a forward settling transaction and therefore no collateral securities had been allocated as of period end. The agreement contemplated the delivery of U.S. Treasury Obligations as collateral on settlement date.
Investment Valuation
All investments are categorized as Level 2 under the Fair Value Hierarchy. The inputs or methodology used for valuing securities may not be an indication of the risk associated with investing in those securities. For more information on valuation inputs please refer to the Investment Valuation section in the accompanying Notes to Financial Statements.
Other Information
# Additional information on each counterparty to the repurchase agreement is as follows:
| Repurchase Agreement / Counterparty | Value (000s) |
| $998,000 due 4/02/18 at 1.80% | |
| BNP Paribas, S.A. | $159 |
| HSBC Securities (USA), Inc. | 71 |
| Merrill Lynch, Pierce, Fenner & Smith, Inc. | 4 |
| Wells Fargo Securities LLC | 764 |
| | $998 |
| $3,885,971,000 due 4/02/18 at 1.82% | |
| BNP Paribas, S.A. | 543,142 |
| Bank of America NA | 1,832,906 |
| J.P. Morgan Securities, Inc. | 375,981 |
| Wells Fargo Securities LLC | 1,133,942 |
| | $3,885,971 |
See accompanying notes which are an integral part of the financial statements.
Government Portfolio
Financial Statements
Statement of Assets and Liabilities
| Amounts in thousands (except per-share amounts) | | March 31, 2018 |
| Assets | | |
Investment in securities, at value (including repurchase agreements of $31,311,654) — See accompanying schedule:
Unaffiliated issuers (cost $100,700,746) | | $100,700,746 |
| Receivable for investments sold | | |
| Regular delivery | | 481,381 |
| Delayed delivery | | 599,182 |
| Receivable for fund shares sold | | 19,654 |
| Interest receivable | | 63,181 |
| Prepaid expenses | | 76 |
| Receivable from investment adviser for expense reductions | | 2,404 |
| Other receivables | | 755 |
| Total assets | | 101,867,379 |
| Liabilities | | |
| Payable to custodian bank | $52,033 | |
| Payable for investments purchased | 715,891 | |
| Payable for fund shares redeemed | 10,030 | |
| Distributions payable | 3,294 | |
| Accrued management fee | 12,262 | |
| Distribution and service plan fees payable | 804 | |
| Other affiliated payables | 3,791 | |
| Other payables and accrued expenses | 1,036 | |
| Total liabilities | | 799,141 |
| Net Assets | | $101,068,238 |
| Net Assets consist of: | | |
| Paid in capital | | $101,069,315 |
| Distributions in excess of net investment income | | (586) |
| Accumulated undistributed net realized gain (loss) on investments | | (491) |
| Net Assets | | $101,068,238 |
| Class I: | | |
| Net Asset Value, offering price and redemption price per share ($31,828,704 ÷ 31,818,129 shares) | | $1.00 |
| Class II: | | |
| Net Asset Value, offering price and redemption price per share ($743,878 ÷ 743,486 shares) | | $1.00 |
| Class III: | | |
| Net Asset Value, offering price and redemption price per share ($3,351,275 ÷ 3,349,643 shares) | | $1.00 |
| Select Class: | | |
| Net Asset Value, offering price and redemption price per share ($449,524 ÷ 449,458 shares) | | $1.00 |
| Institutional Class: | | |
| Net Asset Value, offering price and redemption price per share ($64,694,857 ÷ 64,696,690 shares) | | $1.00 |
See accompanying notes which are an integral part of the financial statements.
Statement of Operations
| Amounts in thousands | | Year ended March 31, 2018 |
| Investment Income | | |
| Interest | | $1,111,978 |
| Expenses | | |
| Management fee | $137,715 | |
| Transfer agent fees | 40,392 | |
| Distribution and service plan fees | 9,372 | |
| Accounting fees and expenses | 2,828 | |
| Custodian fees and expenses | 737 | |
| Independent trustees' fees and expenses | 330 | |
| Registration fees | 358 | |
| Audit | 52 | |
| Legal | 204 | |
| Miscellaneous | 369 | |
| Total expenses before reductions | 192,357 | |
| Expense reductions | (30,700) | 161,657 |
| Net investment income (loss) | | 950,321 |
| Realized and Unrealized Gain (Loss) | | |
| Net realized gain (loss) on: | | |
| Investment securities: | | |
| Unaffiliated issuers | | (259) |
| Total net realized gain (loss) | | (259) |
| Net increase in net assets resulting from operations | | $950,062 |
See accompanying notes which are an integral part of the financial statements.
Statement of Changes in Net Assets
| Amounts in thousands | Year ended March 31, 2018 | Year ended March 31, 2017 |
| Increase (Decrease) in Net Assets | | |
| Operations | | |
| Net investment income (loss) | $950,321 | $275,109 |
| Net realized gain (loss) | (259) | 572 |
| Net increase in net assets resulting from operations | 950,062 | 275,681 |
| Distributions to shareholders from net investment income | (952,412) | (273,207) |
| Share transactions - net increase (decrease) | 6,674,300 | 50,338,072 |
| Total increase (decrease) in net assets | 6,671,950 | 50,340,546 |
| Net Assets | | |
| Beginning of period | 94,396,288 | 44,055,742 |
| End of period | $101,068,238 | $94,396,288 |
| Other Information | | |
| Undistributed net investment income end of period | $– | $1,505 |
| Distributions in excess of net investment income end of period | $(586) | $– |
See accompanying notes which are an integral part of the financial statements.
Financial Highlights
Government Portfolio Class I
| Years ended March 31, | 2018 | 2017 | 2016 | 2015 | 2014 |
| Selected Per–Share Data | | | | | |
| Net asset value, beginning of period | $1.00 | $1.00 | $1.00 | $1.00 | $1.00 |
| Income from Investment Operations | | | | | |
| Net investment income (loss) | .009 | .003 | .001 | –A | –A |
| Net realized and unrealized gain (loss)A | – | – | – | – | – |
| Total from investment operations | .009 | .003 | .001 | –A | –A |
| Distributions from net investment income | (.009) | (.003) | (.001) | –A | –A |
| Total distributions | (.009) | (.003) | (.001) | –A | –A |
| Net asset value, end of period | $1.00 | $1.00 | $1.00 | $1.00 | $1.00 |
| Total ReturnB | .95% | .31% | .06% | .01% | .01% |
| Ratios to Average Net AssetsC | | | | | |
| Expenses before reductions | .20% | .21% | .21% | .21% | .21% |
| Expenses net of fee waivers, if any | .18% | .18% | .16% | .11% | .11% |
| Expenses net of all reductions | .18% | .18% | .16% | .11% | .11% |
| Net investment income (loss) | .95% | .33% | .08% | .01% | .01% |
| Supplemental Data | | | | | |
| Net assets, end of period (in millions) | $31,829 | $31,498 | $22,047 | $19,333 | $22,569 |
A Amount represents less than $.0005 per share.
B Total returns would have been lower if certain expenses had not been reduced during the applicable periods shown.
C Expense ratios reflect operating expenses of the class. Expenses before reductions do not reflect amounts reimbursed or waived or reductions from expense offset arrangements and do not represent the amount paid by the class during periods when reimbursements, waivers or reductions occur. Expenses net of fee waivers reflect expenses after reimbursement and waivers but prior to reductions from expense offset arrangements. Expenses net of all reductions represent the net expenses paid by the class.
See accompanying notes which are an integral part of the financial statements.
Government Portfolio Class II
| Years ended March 31, | 2018 | 2017 | 2016 | 2015 | 2014 |
| Selected Per–Share Data | | | | | |
| Net asset value, beginning of period | $1.00 | $1.00 | $1.00 | $1.00 | $1.00 |
| Income from Investment Operations | | | | | |
| Net investment income (loss) | .008 | .002 | –A | –A | –A |
| Net realized and unrealized gain (loss)A | – | – | – | – | – |
| Total from investment operations | .008 | .002 | –A | –A | –A |
| Distributions from net investment income | (.008) | (.002) | –A | –A | –A |
| Total distributions | (.008) | (.002) | –A | –A | –A |
| Net asset value, end of period | $1.00 | $1.00 | $1.00 | $1.00 | $1.00 |
| Total ReturnB | .80% | .16% | .02% | .01% | .01% |
| Ratios to Average Net AssetsC | | | | | |
| Expenses before reductions | .35% | .36% | .36% | .36% | .36% |
| Expenses net of fee waivers, if any | .33% | .33% | .20% | .11% | .11% |
| Expenses net of all reductions | .33% | .33% | .20% | .11% | .11% |
| Net investment income (loss) | .80% | .18% | .04% | .01% | .01% |
| Supplemental Data | | | | | |
| Net assets, end of period (in millions) | $744 | $909 | $485 | $539 | $356 |
A Amount represents less than $.0005 per share.
B Total returns would have been lower if certain expenses had not been reduced during the applicable periods shown.
C Expense ratios reflect operating expenses of the class. Expenses before reductions do not reflect amounts reimbursed or waived or reductions from expense offset arrangements and do not represent the amount paid by the class during periods when reimbursements, waivers or reductions occur. Expenses net of fee waivers reflect expenses after reimbursement and waivers but prior to reductions from expense offset arrangements. Expenses net of all reductions represent the net expenses paid by the class.
See accompanying notes which are an integral part of the financial statements.
Government Portfolio Class III
| Years ended March 31, | 2018 | 2017 | 2016 | 2015 | 2014 |
| Selected Per–Share Data | | | | | |
| Net asset value, beginning of period | $1.00 | $1.00 | $1.00 | $1.00 | $1.00 |
| Income from Investment Operations | | | | | |
| Net investment income (loss) | .007 | .001 | –A | –A | –A |
| Net realized and unrealized gain (loss)A | – | – | – | – | – |
| Total from investment operations | .007 | .001 | –A | –A | –A |
| Distributions from net investment income | (.007) | (.001) | –A | –A | –A |
| Total distributions | (.007) | (.001) | –A | –A | –A |
| Net asset value, end of period | $1.00 | $1.00 | $1.00 | $1.00 | $1.00 |
| Total ReturnB | .70% | .07% | .01% | .01% | .01% |
| Ratios to Average Net AssetsC | | | | | |
| Expenses before reductions | .46% | .46% | .46% | .46% | .46% |
| Expenses net of fee waivers, if any | .43% | .43% | .21% | .11% | .11% |
| Expenses net of all reductions | .43% | .43% | .21% | .11% | .11% |
| Net investment income (loss) | .70% | .09% | .03% | .01% | .01% |
| Supplemental Data | | | | | |
| Net assets, end of period (in millions) | $3,351 | $3,038 | $1,957 | $2,120 | $2,266 |
A Amount represents less than $.0005 per share.
B Total returns would have been lower if certain expenses had not been reduced during the applicable periods shown.
C Expense ratios reflect operating expenses of the class. Expenses before reductions do not reflect amounts reimbursed or waived or reductions from expense offset arrangements and do not represent the amount paid by the class during periods when reimbursements, waivers or reductions occur. Expenses net of fee waivers reflect expenses after reimbursement and waivers but prior to reductions from expense offset arrangements. Expenses net of all reductions represent the net expenses paid by the class.
See accompanying notes which are an integral part of the financial statements.
Government Portfolio Select Class
| Years ended March 31, | 2018 | 2017 | 2016 | 2015 | 2014 |
| Selected Per–Share Data | | | | | |
| Net asset value, beginning of period | $1.00 | $1.00 | $1.00 | $1.00 | $1.00 |
| Income from Investment Operations | | | | | |
| Net investment income (loss) | .009 | .003 | –A | –A | –A |
| Net realized and unrealized gain (loss)A | – | – | – | – | – |
| Total from investment operations | .009 | .003 | –A | –A | –A |
| Distributions from net investment income | (.009) | (.003) | –A | –A | –A |
| Total distributions | (.009) | (.003) | –A | –A | –A |
| Net asset value, end of period | $1.00 | $1.00 | $1.00 | $1.00 | $1.00 |
| Total ReturnB | .90% | .26% | .05% | .01% | .01% |
| Ratios to Average Net AssetsC | | | | | |
| Expenses before reductions | .26% | .26% | .26% | .26% | .26% |
| Expenses net of fee waivers, if any | .23% | .23% | .17% | .11% | .11% |
| Expenses net of all reductions | .23% | .23% | .17% | .11% | .11% |
| Net investment income (loss) | .90% | .28% | .07% | - %D | .01% |
| Supplemental Data | | | | | |
| Net assets, end of period (in millions) | $450 | $641 | $286 | $686 | $378 |
A Amount represents less than $.0005 per share.
B Total returns would have been lower if certain expenses had not been reduced during the applicable periods shown.
C Expense ratios reflect operating expenses of the class. Expenses before reductions do not reflect amounts reimbursed or waived or reductions from expense offset arrangements and do not represent the amount paid by the class during periods when reimbursements, waivers or reductions occur. Expenses net of fee waivers reflect expenses after reimbursement and waivers but prior to reductions from expense offset arrangements. Expenses net of all reductions represent the net expenses paid by the class.
D Amount represents less than .005%.
See accompanying notes which are an integral part of the financial statements.
Government Portfolio Institutional Class
| Years ended March 31, | 2018 | 2017 | 2016 | 2015 A |
| Selected Per–Share Data | | | | |
| Net asset value, beginning of period | $1.00 | $1.00 | $1.00 | $1.00 |
| Income from Investment Operations | | | | |
| Net investment income (loss) | .010 | .004 | .001 | –B |
| Net realized and unrealized gain (loss)B | – | – | – | – |
| Total from investment operations | .010 | .004 | .001 | –B |
| Distributions from net investment income | (.010) | (.004) | (.001) | –B |
| Total distributions | (.010) | (.004) | (.001) | –B |
| Net asset value, end of period | $1.00 | $1.00 | $1.00 | $1.00 |
| Total ReturnC,D | .99% | .35% | .08% | .01% |
| Ratios to Average Net AssetsE | | | | |
| Expenses before reductions | .18% | .18% | .18% | .18%F |
| Expenses net of fee waivers, if any | .14% | .14% | .14% | .11%F |
| Expenses net of all reductions | .14% | .14% | .14% | .11%F |
| Net investment income (loss) | .99% | .37% | .10% | - %F,G |
| Supplemental Data | | | | |
| Net assets, end of period (in millions) | $64,695 | $58,310 | $19,281 | $1,508 |
A For the period May 14, 2014 (commencement of sale of shares) to March 31, 2015.
B Amount represents less than $.0005 per share.
C Total returns for periods of less than one year are not annualized.
D Total returns would have been lower if certain expenses had not been reduced during the applicable periods shown.
E Expense ratios reflect operating expenses of the class. Expenses before reductions do not reflect amounts reimbursed or waived or reductions from expense offset arrangements and do not represent the amount paid by the class during periods when reimbursements, waivers or reductions occur. Expense ratios before reductions for start-up periods may not be representative of longer-term operating periods. Expenses net of fee waivers reflect expenses after reimbursement and waivers but prior to reductions from expense offset arrangements. Expenses net of all reductions represent the net expenses paid by the class.
F Annualized
G Amount represents less than .005%.
See accompanying notes which are an integral part of the financial statements.
Money Market Portfolio
Investment Summary/Performance (Unaudited)
Effective Maturity Diversification as of March 31, 2018
| Days | % of fund's investments 3/31/18 |
| 1 - 7 | 44.4 |
| 8 - 30 | 36.2 |
| 31 - 60 | 8.1 |
| 61 - 90 | 9.1 |
| 91 - 180 | 2.2 |
Effective maturity is determined in accordance with the requirements of Rule 2a-7 under the Investment Company Act of 1940.
Asset Allocation (% of fund's net assets)
| As of March 31, 2018 |
| | Certificates of Deposit | 34.0% |
| | Commercial Paper | 39.6% |
| | U.S. Treasury Debt | 1.4% |
| | Non-Negotiable Time Deposit | 3.7% |
| | Other Instruments | 1.6% |
| | Repurchase Agreements | 20.4% |
| | Net Other Assets (Liabilities)* | (0.7)% |
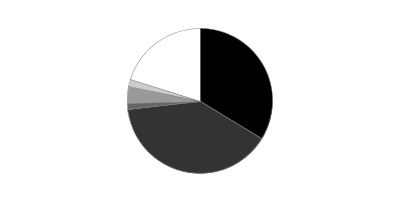
* Net Other Assets (Liabilities) are not included in the pie chart
Current 7-Day Yields
| | 3/31/18 |
| Class I | 1.77% |
| Class II | 1.62% |
| Class III | 1.52% |
| Select Class | 1.72% |
| Institutional Class | 1.81% |
Yield refers to the income paid by the Fund over a given period. Yield for money market funds is usually for seven-day periods, as it is here, though it is expressed as an annual percentage rate. Past performance is no guarantee of future results. Yield will vary and it's possible to lose money investing in the Fund. A portion of the Fund's expenses was reimbursed and/or waived. Absent such reimbursements and/or waivers the yield for the period ending March 31, 2018, the most recent period shown in the table, would have been 1.75% for Class I, 1.60% for Class II, 1.50% for Class III, 1.70% for Select Class and 1.78% for Institutional Class.
Money Market Portfolio
Schedule of Investments March 31, 2018
Showing Percentage of Net Assets
| Certificate of Deposit - 34.0% | | | | |
| | | Yield(a) | Principal Amount (000s) | Value (000s) |
| Domestic Certificates Of Deposit - 4.2% | | | | |
| Citibank NA | | | | |
| 6/13/18 | | 2.20% | $275,000 | $275,000 |
| Wells Fargo Bank NA | | | | |
| 4/20/18 to 8/17/18 | | 1.86 to 2.05 (b)(c) | 927,000 | 927,000 |
| | | | | 1,202,000 |
| London Branch, Eurodollar, Foreign Banks - 1.9% | | | | |
| Mizuho Bank Ltd. London Branch | | | | |
| 6/27/18 | | 2.43 | 146,000 | 145,148 |
| Sumitomo Mitsui Trust Bank Ltd. London Branch | | | | |
| 4/4/18 to 5/29/18 | | 1.70 to 2.10 | 415,000 | 415,000 |
| | | | | 560,148 |
| New York Branch, Yankee Dollar, Foreign Banks - 27.9% | | | | |
| Bank of Montreal | | | | |
| 4/9/18 to 8/10/18 | | 1.88 to 2.03 (b)(c) | 1,128,000 | 1,128,000 |
| Bank of Nova Scotia | | | | |
| 4/10/18 to 7/13/18 | | 1.84 to 1.95 (b)(c) | 563,000 | 563,001 |
| Bank of Tokyo-Mitsubishi UFJ Ltd. | | | | |
| 5/2/18 | | 1.80 | 108,000 | 108,000 |
| Bayerische Landesbank | | | | |
| 5/2/18 | | 2.20 | 283,000 | 283,000 |
| Canadian Imperial Bank of Commerce | | | | |
| 4/13/18 to 5/22/18 | | 1.92 to 2.04 (b)(c) | 200,000 | 200,000 |
| KBC Bank NV | | | | |
| 5/29/18 to 6/4/18 | | 2.12 to 2.13 | 375,000 | 375,000 |
| Landesbank Baden-Wuerttemberg New York Branch | | | | |
| 4/2/18 to 4/5/18 | | 1.73 | 1,053,000 | 1,053,000 |
| Mitsubishi UFJ Trust & Banking Corp. | | | | |
| 5/15/18 to 6/15/18 | | 1.96 to 1.97 (b)(c) | 370,000 | 370,000 |
| Mizuho Corporate Bank Ltd. | | | | |
| 4/9/18 to 6/7/18 | | 1.93 to 2.19 (b) | 354,000 | 354,001 |
| Natixis SA | | | | |
| 6/5/18 | | 2.15 | 407,000 | 407,000 |
| Royal Bank of Canada | | | | |
| 6/20/18 to 10/18/18 | | 1.89 to 2.41 (b)(c) | 1,123,000 | 1,123,000 |
| Sumitomo Mitsui Banking Corp. | | | | |
| 5/21/18 to 6/5/18 | | 1.88 to 2.06 (b)(c) | 902,000 | 902,000 |
| Sumitomo Mitsui Trust Bank Ltd. | | | | |
| 6/8/18 | | 1.90 (b)(c) | 261,000 | 261,000 |
| Svenska Handelsbanken AB | | | | |
| 7/2/18 to 9/27/18 | | 1.83 to 2.27 (b)(c) | 860,000 | 860,000 |
| | | | | 7,987,002 |
| TOTAL CERTIFICATE OF DEPOSIT | | | | |
| (Cost $9,749,150) | | | | 9,749,150 |
|
| Financial Company Commercial Paper - 33.2% | | | | |
| ASB Finance Ltd. (London) | | | | |
| 7/30/18 to 9/26/18 | | 1.82 to 2.31 (b)(c) | 128,000 | 128,000 |
| Bank of Nova Scotia | | | | |
| 6/1/18 to 8/28/18 | | 1.84 to 2.07 (b)(c) | 459,000 | 459,000 |
| Barclays Bank PLC/Barclays U.S. CCP Funding LLC | | | | |
| 4/3/18 to 6/29/18 | | 1.87 to 2.52 (d) | 443,000 | 441,661 |
| Bayerische Landesbank | | | | |
| 4/3/18 to 4/5/18 | | 1.76 | 845,000 | 844,876 |
| BNP Paribas Dublin Branch | | | | |
| 4/2/18 to 4/4/18 | | 1.73 | 517,000 | 516,954 |
| BPCE SA | | | | |
| 6/11/18 to 6/13/18 | | 2.21 to 2.24 | 550,000 | 547,563 |
| Caisse d'Amort de la Dette Sociale | | | | |
| 4/17/18 to 5/3/18 | | 1.75 to 1.82 (d) | 668,000 | 667,266 |
| Canadian Imperial Bank of Commerce | | | | |
| 4/20/18 to 11/26/18 | | 1.91 to 2.16 (b)(c) | 1,108,000 | 1,108,000 |
| Commonwealth Bank of Australia | | | | |
| 7/5/18 | | 1.86 (b)(c) | 134,000 | 134,000 |
| Credit Suisse AG | | | | |
| 6/8/18 to 7/26/18 | | 1.88 to 2.36 (b) | 1,404,000 | 1,400,148 |
| J.P. Morgan Securities, LLC | | | | |
| 4/9/18 to 10/1/18 | | 1.90 to 2.32 (b)(c) | 1,094,300 | 1,094,300 |
| Lam Research Corp. | | | | |
| 4/11/18 | | 2.42 | 14,000 | 13,991 |
| Mitsubishi UFJ Trust & Banking Corp. | | | | |
| 4/6/18 to 4/27/18 | | 1.76 to 2.00 | 534,500 | 534,054 |
| Natexis Banques Populaires New York Branch | | | | |
| 5/1/18 | | 1.91 | 263,000 | 262,584 |
| Sumitomo Mitsui Banking Corp. | | | | |
| 6/5/18 to 6/6/18 | | 2.16 | 84,000 | 83,671 |
| Sumitomo Trust & Banking Co. Ltd. | | | | |
| 4/25/18 | | 1.76 | 258,000 | 257,699 |
| The Toronto-Dominion Bank | | | | |
| 8/17/18 to 10/9/18 | | 1.93 to 2.07 (b)(c) | 766,000 | 766,000 |
| UBS AG London Branch | | | | |
| 4/3/18 | | 1.89 (b)(c) | 253,000 | 253,000 |
| TOTAL FINANCIAL COMPANY COMMERCIAL PAPER | | | | |
| (Cost $9,512,767) | | | | 9,512,767 |
|
| Asset Backed Commercial Paper - 2.7% | | | | |
| Atlantic Asset Securitization Corp. (Credit Agricole CIB Guaranteed) | | | | |
| | | | | |
| 6/5/18 | | 2.16 | 81,750 | 81,433 |
| 6/8/18 | | 2.17 | 51,000 | 50,792 |
| Gotham Funding Corp. (Liquidity Facility Bank of Tokyo-Mitsubishi UFJ Ltd.) | | | | |
| | | | | |
| 4/10/18 | | 1.76 | 51,000 | 50,978 |
| 4/26/18 | | 1.78 | 31,000 | 30,962 |
| 4/9/18 | | 1.77 | 24,000 | 23,991 |
| 4/9/18 | | 1.76 | 24,000 | 23,991 |
| 5/3/18 | | 1.83 | 55,000 | 54,911 |
| 6/13/18 | | 2.26 | 95,000 | 94,567 |
| 6/5/18 | | 2.19 | 69,840 | 69,565 |
| 6/7/18 | | 2.19 | 22,000 | 21,911 |
| Liberty Street Funding LLC (Liquidity Facility Bank of Nova Scotia) | | | | |
| | | | | |
| 4/16/18 | | 1.76 | 20,000 | 19,985 |
| 4/18/18 | | 1.76 | 40,000 | 39,967 |
| 4/18/18 | | 1.76 | 40,000 | 39,967 |
| 4/19/18 | | 1.76 | 19,000 | 18,983 |
| 4/9/18 | | 1.76 | 47,000 | 46,982 |
| Manhattan Asset Funding Co. LLC (Liquidity Facility Sumitomo Mitsui Banking Corp.) | | | | |
| | | | | |
| 6/11/18 | | 2.24 | 98,000 | 97,569 |
| 6/21/18 | | 2.35 | 20,000 | 19,895 |
| TOTAL ASSET BACKED COMMERCIAL PAPER | | | | |
| (Cost $786,449) | | | | 786,449 |
|
| Non-Financial Company Commercial Paper - 3.7% | | | | |
| Bell Canada | | | | |
| 4/2/18 | | 1.88 to 1.88 | 45,000 | 44,998 |
| Dominion Resources, Inc. | | | | |
| 4/16/18 to 5/7/18 | | 1.91 to 2.43 | 65,000 | 64,861 |
| Duke Energy Corp. | | | | |
| 4/4/18 to 4/5/18 | | 2.25 | 78,000 | 77,983 |
| Eversource Energy | | | | |
| 4/2/18 to 4/4/18 | | 2.25 to 2.30 | 81,000 | 80,991 |
| Rogers Communications, Inc. | | | | |
| 5/1/18 | | 2.38 | 19,000 | 18,964 |
| Sempra Global | | | | |
| 4/23/18 | | 2.46 | 100,000 | 99,850 |
| Tyson Foods, Inc. | | | | |
| 4/3/18 to 4/9/18 | | 1.88 to 2.25 | 146,505 | 146,470 |
| UnitedHealth Group, Inc. | | | | |
| 4/5/18 | | 2.00 | 355,000 | 354,921 |
| Verizon Communications, Inc. | | | | |
| 4/2/18 to 4/25/18 | | 2.10 to 2.37 | 169,400 | 169,329 |
| TOTAL NON-FINANCIAL COMPANY COMMERCIAL PAPER | | | | |
| (Cost $1,058,367) | | | | 1,058,367 |
|
| U.S. Treasury Debt - 1.4% | | | | |
| U.S. Treasury Obligations - 1.4% | | | | |
| U.S. Treasury Notes | | | | |
| 4/30/18 to 10/31/18 | | | | |
| (Cost $409,001) | | 1.94 to 1.96 (b)(c) | 409,001 | 409,001 |
|
| Other Instrument - 1.6% | | | | |
| Master Notes - 1.6% | | | | |
| Toyota Motor Credit Corp. | | | | |
| 4/5/18 | | | | |
| (Cost $459,000) | | 2.08 (b)(c) | 459,000 | 459,000 |
|
| Non-Negotiable Time Deposit - 3.7% | | | | |
| Time Deposits - 3.7% | | | | |
| Barclays Bank PLC | | | | |
| 4/2/18 | | 1.80 | 687,000 | 687,000 |
| Credit Agricole CIB | | | | |
| 4/2/18 to 4/3/18 | | 1.73 | 311,400 | 311,400 |
| Skandinaviska Enskilda Banken AB | | | | |
| 4/2/18 | | 1.67 | 76,656 | 76,656 |
| TOTAL NON-NEGOTIABLE TIME DEPOSIT | | | | |
| (Cost $1,075,056) | | | | 1,075,056 |
| U.S. Government Agency Repurchase Agreement - 4.1% | | | |
| | | Maturity Amount (000s) | Value (000s) |
| In a joint trading account at: | | | |
| 1.8% dated 3/29/18 due 4/2/18 (Collateralized by (U.S. Government Obligations) # | | $675,873 | $675,738 |
| 1.81% dated 3/29/18 due 4/2/18 (Collateralized by (U.S. Government Obligations) # | | 863 | 863 |
| With: | | | |
| Barclays Capital, Inc. at 1.81%, dated 3/29/18 due 4/5/18 (Collateralized by U.S. Government Obligations valued at $34,681,744, 3.50%, 1/1/48) | | 34,012 | 34,000 |
| Citibank NA at 1.8%, dated 3/27/18 due 4/3/18 (Collateralized by U.S. Treasury Obligations valued at $102,015,302, 0.00% - 3.63%, 7/12/18 - 2/15/43) | | 100,035 | 100,000 |
| Nomura Securities International, Inc. at 1.8%, dated 3/27/18 due 4/3/18 (Collateralized by U.S. Government Obligations valued at $366,234,927, 2.50% - 9.50%, 7/20/18 - 12/20/64) | | 359,126 | 359,000 |
| TOTAL U.S. GOVERNMENT AGENCY REPURCHASE AGREEMENT | | | |
| (Cost $1,169,601) | | | 1,169,601 |
|
| U.S. Treasury Repurchase Agreement - 5.0% | | | |
| In a joint trading account at 1.8% dated 3/30/18 due 4/2/18 (Collateralized by U.S. Treasury Obligations) # | | 6,001 | 6,000 |
| With: | | | |
| BMO Capital Markets Corp. at 1.73%, dated 3/27/18 due 4/3/18 (Collateralized by U.S. Treasury Obligations valued at $30,050,719, 0.00% - 6.00%, 4/5/18 - 5/15/47) | | 30,010 | 30,000 |
| BMO Harris Bank NA at 1.73%, dated 3/27/18 due 4/3/18 (Collateralized by U.S. Treasury Obligations valued at $31,750,060, 0.00% - 3.38%, 4/26/18 - 5/15/44) | | 31,010 | 31,000 |
| BNP Paribas, S.A. at: | | | |
| 1.77%, dated 3/28/18 due 4/5/18 (Collateralized by U.S. Treasury Obligations valued at $62,226,215, 2.25% - 2.50%, 8/15/23 - 1/31/24) | | 61,039 | 61,000 |
| 1.79%, dated 3/28/18 due 4/4/18 (Collateralized by U.S. Treasury Obligations valued at $62,226,263, 1.63% - 2.75%, 2/15/22 - 11/15/42) | | 61,021 | 61,000 |
| Commerz Markets LLC at: | | | |
| 1.81%, dated 3/29/18 due 4/5/18 (Collateralized by U.S. Treasury Obligations valued at $89,764,610, 1.38% - 2.25%, 2/28/22 - 6/30/24) | | 88,031 | 88,000 |
| 1.85%, dated 3/27/18 due 4/3/18 (Collateralized by U.S. Treasury Obligations valued at $44,887,050, 1.00% - 2.75%, 3/15/19 - 8/15/46) | | 44,016 | 44,000 |
| 1.86%, dated 3/28/18 due 4/4/18 (Collateralized by U.S. Treasury Obligations valued at $45,051,198, 1.38% - 3.00%, 6/30/23 - 2/15/48) | | 44,016 | 44,000 |
| Deutsche Bank AG at: | | | |
| 1.79%, dated 3/29/18 due 4/5/18 (Collateralized by U.S. Treasury Obligations valued at $50,472,509, 1.63% - 3.63%, 5/15/26 - 2/15/44) | | 49,017 | 49,000 |
| 1.83%, dated 3/29/18 due 4/2/18 (Collateralized by U.S. Treasury Obligations valued at $159,608,391, 1.13% - 5.25%, 7/31/21 - 5/15/45) | | 155,032 | 155,000 |
| Deutsche Bank Securities, Inc. at: | | | |
| 1.79%, dated 3/29/18 due 4/5/18 (Collateralized by U.S. Treasury Obligations valued at $69,363,471, 2.13%, 8/15/21) | | 68,024 | 68,000 |
| 1.8%, dated 3/27/18 due 4/3/18 | | | |
| (Collateralized by U.S. Treasury Obligations valued at $67,330,098, 2.13%, 8/15/21) | | 66,023 | 66,000 |
| (Collateralized by U.S. Treasury Obligations valued at $102,015,363, 2.00% - 2.25%, 10/31/22 - 11/15/24) | | 100,035 | 100,000 |
| HSBC Securities, Inc. at 1.76%, dated 3/27/18 due 4/3/18 (Collateralized by U.S. Treasury Obligations valued at $61,209,942, 1.25% - 2.38%, 8/31/19 - 1/31/23) | | 60,021 | 60,000 |
| ING Financial Markets LLC at 1.8%, dated 3/29/18 due 4/2/18 (Collateralized by U.S. Treasury Obligations valued at $125,091,134, 2.00%, 6/30/24) | | 122,024 | 122,000 |
| Nomura Securities International, Inc. at 1.8%, dated 3/28/18 due 4/4/18 (Collateralized by U.S. Treasury Obligations valued at $449,422,421, 0.00% - 7.50%, 4/26/18 - 2/15/47) | | 440,154 | 440,000 |
| TOTAL U.S. TREASURY REPURCHASE AGREEMENT | | | |
| (Cost $1,425,000) | | | 1,425,000 |
|
| Other Repurchase Agreement - 11.3% | | | |
| Other Repurchase Agreement - 11.3% | | | |
| With: | | | |
| BNP Paribas at 1.81%, dated 3/29/18 due 4/2/18 (Collateralized by Corporate Obligations valued at $133,939,689, 0.00% - 5.20%, 3/9/20 - 7/25/46) | | 128,026 | 128,000 |
| Citigroup Global Markets, Inc. at: | | | |
| 1.88%, dated 3/29/18 due 4/2/18 (Collateralized by Equity Securities valued at $91,804,798) | | 85,018 | 85,000 |
| 2.36%, dated: | | | |
| 2/28/18 due 4/30/18 (Collateralized by Equity Securities valued at $333,238,665)(b)(c)(e) | | 309,418 | 308,000 |
| 3/8/18 due 5/7/18 (Collateralized by Equity Securities valued at $289,826,418)(b)(c)(e) | | 269,040 | 268,000 |
| 2.71%, dated 2/20/18 due 5/21/18 (Collateralized by Corporate Obligations valued at $129,566,404, 0.00% - 5.68%, 4/20/24 - 10/28/64) | | 123,833 | 123,000 |
| 2.77%, dated 2/23/18 due 5/21/18 (Collateralized by Corporate Obligations valued at $45,482,158, 6.74% - 8.19%, 10/28/24 - 11/21/30) | | 42,281 | 42,000 |
| Deutsche Bank AG at 1.93%, dated 3/29/18 due 4/2/18 (Collateralized by Municipal Bond Obligations valued at $138,714,302, 0.00% - 6.25%, 3/1/25 - 1/1/57) | | 130,028 | 130,000 |
| HSBC Securities, Inc. at 1.88%, dated 3/29/18 due 4/2/18 (Collateralized by Corporate Obligations valued at $67,202,592, 2.90% - 5.95%, 9/15/20 - 9/15/48) | | 64,013 | 64,000 |
| ING Financial Markets LLC at: | | | |
| 1.88%, dated 3/29/18 due 4/2/18 (Collateralized by Equity Securities valued at $115,566,079) | | 107,022 | 107,000 |
| 1.96%, dated 3/29/18 due 4/2/18 (Collateralized by Corporate Obligations valued at $50,763,299, 4.75% - 10.00%, 7/15/21 - 3/1/97) | | 47,010 | 47,000 |
| J.P. Morgan Securities, LLC at 1.88%, dated 3/28/18 due 4/4/18 (Collateralized by U.S. Government Obligations valued at $218,375,446, 0.10% - 7.61%, 4/25/22 - 10/20/47) | | 212,077 | 212,000 |
| Merrill Lynch, Pierce, Fenner & Smith at: | | | |
| 1.88%, dated 3/28/18 due 4/4/18 (Collateralized by U.S. Government Obligations valued at $216,262,585, 2.50% - 3.00%, 2/1/33 - 3/1/48) | | 212,077 | 212,000 |
| 1.95%, dated 3/28/18 due 4/5/18 (Collateralized by U.S. Treasury Obligations valued at $65,287,093, 2.00% - 6.75%, 5/31/24 - 2/15/36) | | 64,049 | 64,000 |
| Mitsubishi UFJ Securities (U.S.A.), Inc. at 1.87%, dated 3/29/18 due 4/2/18 (Collateralized by Equity Securities valued at $137,752,666) | | 128,027 | 128,000 |
| Mizuho Securities U.S.A., Inc. at: | | | |
| 1.86%, dated 3/29/18 due 4/2/18 (Collateralized by U.S. Treasury Obligations valued at $65,318,865, 1.38% - 8.75%, 1/15/20 - 11/15/40) | | 64,013 | 64,000 |
| 1.93%, dated: | | | |
| 3/21/18 due 4/4/18 (Collateralized by Equity Securities valued at $46,462,419) | | 43,032 | 43,000 |
| 3/28/18 due 4/5/18 (Collateralized by Equity Securities valued at $69,127,429) | | 64,048 | 64,000 |
| 3/29/18 due 4/5/18 (Collateralized by Equity Securities valued at $69,123,714) | | 64,048 | 64,000 |
| 2.03%, dated 3/23/18 due 4/5/18 (Collateralized by U.S. Treasury Obligations valued at $22,448,955, 2.75%, 2/15/28) | | 22,017 | 22,000 |
| 2.99%, dated 3/14/18 due 6/12/18 (Collateralized by Corporate Obligations valued at $44,202,030, 2.63% - 8.00%, 4/13/20 - 4/11/27) | | 42,314 | 42,000 |
| RBS Securities, Inc. at 1.85%, dated 3/29/18 due 4/2/18 (Collateralized by Corporate Obligations valued at $436,804,818, 1.38% - 7.63%, 2/1/19 - 2/14/50) | | 416,086 | 416,000 |
| Royal Bank of Canada at 1.92%, dated 3/8/18 due 4/5/18 (Collateralized by Corporate Obligations valued at $214,508,807, 1.88% - 2.25%, 12/11/18 - 3/15/22) | | 204,348 | 204,000 |
| Societe Generale at: | | | |
| 1.81%, dated 3/29/18 due 4/2/18 (Collateralized by Corporate Obligations valued at $100,805,069, 0.00% - 7.90%, 4/25/18 - 5/15/47) | | 96,019 | 96,000 |
| 1.96%, dated 3/29/18 due 4/2/18 (Collateralized by Corporate Obligations valued at $275,426,394, 2.10% - 10.75%, 10/1/18 - 11/15/95) | | 256,056 | 256,000 |
| Wells Fargo Securities, LLC at 1.88%, dated 3/29/18 due 4/2/18 (Collateralized by Corporate Obligations valued at $46,442,426, 0.25% - 5.75%, 10/15/21 - 8/15/26) | | 43,009 | 43,000 |
| TOTAL OTHER REPURCHASE AGREEMENTS | | | |
| (Cost $3,232,000) | | | 3,232,000 |
| TOTAL INVESTMENT IN SECURITIES - 100.7% | | | |
| (Cost $28,876,391) | | | 28,876,391 |
| NET OTHER ASSETS (LIABILITIES) - (0.7)% | | | (201,635) |
| NET ASSETS - 100% | | | $28,674,756 |
The date shown for securities represents the date when principal payments must be paid, taking into account any call options exercised by the issuer and any permissible maturity shortening features other than interest rate resets.
Legend
(a) Yield represents either the annualized yield at the date of purchase, or the stated coupon rate, or, for floating and adjustable rate securities, the rate at period end.
(b) Coupon rates for floating and adjustable rate securities reflect the rates in effect at period end.
(c) Coupon is indexed to a floating interest rate which may be multiplied by a specified factor and/or subject to caps or floors.
(d) Security exempt from registration under Rule 144A of the Securities Act of 1933. These securities may be resold in transactions exempt from registration, normally to qualified institutional buyers. At the end of the period, the value of these securities amounted to $1,108,927,000 or 3.9% of net assets.
(e) The maturity amount is based on the rate at period end.
Investment Valuation
All investments are categorized as Level 2 under the Fair Value Hierarchy. The inputs or methodology used for valuing securities may not be an indication of the risk associated with investing in those securities. For more information on valuation inputs please refer to the Investment Valuation section in the accompanying Notes to Financial Statements.
Other Information
# Additional information on each counterparty to the repurchase agreement is as follows:
| Repurchase Agreement / Counterparty | Value (000s) |
| $6,000,000 due 4/02/18 at 1.80% | |
| Merrill Lynch, Pierce, Fenner & Smith, Inc. | $6,000 |
| | $6,000 |
| $675,738,000 due 4/02/18 at 1.80% | |
| BNP Paribas, S.A. | 107,826 |
| HSBC Securities (USA), Inc. | 47,925 |
| Merrill Lynch, Pierce, Fenner & Smith, Inc. | 2,857 |
| Wells Fargo Securities LLC | 517,130 |
| | $675,738 |
| $863,000 due 4/02/18 at 1.81% | |
| BNP Paribas, S.A. | 178 |
| BNY Mellon Capital Markets LLC | 28 |
| Bank of America NA | 107 |
| Citibank NA | 82 |
| HSBC Securities (USA), Inc. | 89 |
| J.P. Morgan Securities, Inc. | 81 |
| Merrill Lynch, Pierce, Fenner & Smith, Inc. | 12 |
| Mizuho Securities USA, Inc. | 85 |
| Wells Fargo Securities LLC | 201 |
| | $863 |
See accompanying notes which are an integral part of the financial statements.
Money Market Portfolio
Financial Statements
Statement of Assets and Liabilities
| Amounts in thousands (except per-share amounts) | | March 31, 2018 |
| Assets | | |
Investment in securities, at value (including repurchase agreements of $5,826,601) — See accompanying schedule:
Unaffiliated issuers (cost $28,876,391) | | $28,876,391 |
| Receivable for investments sold | | 390,439 |
| Receivable for fund shares sold | | 76,078 |
| Interest receivable | | 18,412 |
| Prepaid expenses | | 16 |
| Receivable from investment adviser for expense reductions | | 677 |
| Other receivables | | 950 |
| Total assets | | 29,362,963 |
| Liabilities | | |
| Payable for investments purchased | $656,114 | |
| Payable for fund shares redeemed | 26,267 | |
| Distributions payable | 335 | |
| Accrued management fee | 3,232 | |
| Distribution and service plan fees payable | 35 | |
| Other affiliated payables | 1,121 | |
| Other payables and accrued expenses | 1,103 | |
| Total liabilities | | 688,207 |
| Net Assets | | $28,674,756 |
| Net Assets consist of: | | |
| Paid in capital | | $28,674,756 |
| Net Assets | | $28,674,756 |
| Class I: | | |
| Net Asset Value, offering price and redemption price per share ($12,545,462 ÷ 12,536,487 shares) | | $1.00 |
| Class II: | | |
| Net Asset Value, offering price and redemption price per share ($68,165 ÷ 68,124 shares) | | $1.00 |
| Class III: | | |
| Net Asset Value, offering price and redemption price per share ($132,232 ÷ 132,214 shares) | | $1.00 |
| Select Class: | | |
| Net Asset Value, offering price and redemption price per share ($15,978 ÷ 15,968 shares) | | $1.00 |
| Institutional Class: | | |
| Net Asset Value, offering price and redemption price per share ($15,912,919 ÷ 15,901,694 shares) | | $1.00 |
See accompanying notes which are an integral part of the financial statements.
Statement of Operations
| Amounts in thousands | | Year ended March 31, 2018 |
| Investment Income | | |
| Interest (including $103 from affiliated interfund lending) | | $332,576 |
| Expenses | | |
| Management fee | $31,320 | |
| Transfer agent fees | 9,781 | |
| Distribution and service plan fees | 310 | |
| Accounting fees and expenses | 1,317 | |
| Custodian fees and expenses | 340 | |
| Independent trustees' fees and expenses | 71 | |
| Registration fees | 380 | |
| Audit | 50 | |
| Legal | 40 | |
| Interest | 34 | |
| Miscellaneous | 121 | |
| Total expenses before reductions | 43,764 | |
| Expense reductions | (8,040) | 35,724 |
| Net investment income (loss) | | 296,852 |
| Realized and Unrealized Gain (Loss) | | |
| Net realized gain (loss) on: | | |
| Investment securities: | | |
| Unaffiliated issuers | | 3 |
| Total net realized gain (loss) | | 3 |
| Net increase in net assets resulting from operations | | $296,855 |
See accompanying notes which are an integral part of the financial statements.
Statement of Changes in Net Assets
| Amounts in thousands | Year ended March 31, 2018 | Year ended March 31, 2017 |
| Increase (Decrease) in Net Assets | | |
| Operations | | |
| Net investment income (loss) | $296,852 | $125,902 |
| Net realized gain (loss) | 3 | 616 |
| Net increase in net assets resulting from operations | 296,855 | 126,518 |
| Distributions to shareholders from net investment income | (296,842) | (126,160) |
| Share transactions - net increase (decrease) | 10,882,624 | (27,715,458) |
| Total increase (decrease) in net assets | 10,882,637 | (27,715,100) |
| Net Assets | | |
| Beginning of period | 17,792,119 | 45,507,219 |
| End of period | $28,674,756 | $17,792,119 |
See accompanying notes which are an integral part of the financial statements.
Financial Highlights
Money Market Portfolio Class I
| Years ended March 31, | 2018 | 2017 | 2016 | 2015 | 2014 |
| Selected Per–Share Data | | | | | |
| Net asset value, beginning of period | $1.00 | $1.00 | $1.00 | $1.00 | $1.00 |
| Income from Investment Operations | | | | | |
| Net investment income (loss) | .013 | .006 | .002 | .001 | .001 |
| Net realized and unrealized gain (loss)A | – | – | – | – | – |
| Total from investment operations | .013 | .006 | .002 | .001 | .001 |
| Distributions from net investment income | (.013) | (.006) | (.002) | (.001) | (.001) |
| Total distributions | (.013) | (.006) | (.002) | (.001) | (.001) |
| Net asset value, end of period | $1.00 | $1.00 | $1.00 | $1.00 | $1.00 |
| Total ReturnB | 1.29% | .63% | .18% | .06% | .06% |
| Ratios to Average Net AssetsC | | | | | |
| Expenses before reductions | .21% | .21% | .21% | .21% | .21% |
| Expenses net of fee waivers, if any | .18% | .18% | .18% | .18% | .18% |
| Expenses net of all reductions | .18% | .18% | .18% | .18% | .18% |
| Net investment income (loss) | 1.31% | .56% | .17% | .05% | .06% |
| Supplemental Data | | | | | |
| Net assets, end of period (in millions) | $12,545 | $7,631 | $19,911 | $21,651 | $22,712 |
A Amount represents less than $.0005 per share.
B Total returns would have been lower if certain expenses had not been reduced during the applicable periods shown.
C Expense ratios reflect operating expenses of the class. Expenses before reductions do not reflect amounts reimbursed or waived or reductions from expense offset arrangements and do not represent the amount paid by the class during periods when reimbursements, waivers or reductions occur. Expenses net of fee waivers reflect expenses after reimbursement and waivers but prior to reductions from expense offset arrangements. Expenses net of all reductions represent the net expenses paid by the class.
See accompanying notes which are an integral part of the financial statements.
Money Market Portfolio Class II
| Years ended March 31, | 2018 | 2017 | 2016 | 2015 | 2014 |
| Selected Per–Share Data | | | | | |
| Net asset value, beginning of period | $1.00 | $1.00 | $1.00 | $1.00 | $1.00 |
| Income from Investment Operations | | | | | |
| Net investment income (loss) | .011 | .005 | .001 | –A | –A |
| Net realized and unrealized gain (loss)A | – | – | – | – | – |
| Total from investment operations | .011 | .005 | .001 | –A | –A |
| Distributions from net investment income | (.011) | (.005) | (.001) | –A | –A |
| Total distributions | (.011) | (.005) | (.001) | –A | –A |
| Net asset value, end of period | $1.00 | $1.00 | $1.00 | $1.00 | $1.00 |
| Total ReturnB | 1.14% | .48% | .06% | .01% | .01% |
| Ratios to Average Net AssetsC | | | | | |
| Expenses before reductions | .36% | .36% | .36% | .36% | .36% |
| Expenses net of fee waivers, if any | .33% | .33% | .30% | .22% | .23% |
| Expenses net of all reductions | .33% | .33% | .30% | .22% | .23% |
| Net investment income (loss) | 1.16% | .41% | .06% | .01% | .01% |
| Supplemental Data | | | | | |
| Net assets, end of period (in millions) | $68 | $14 | $76 | $95 | $150 |
A Amount represents less than $.0005 per share.
B Total returns would have been lower if certain expenses had not been reduced during the applicable periods shown.
C Expense ratios reflect operating expenses of the class. Expenses before reductions do not reflect amounts reimbursed or waived or reductions from expense offset arrangements and do not represent the amount paid by the class during periods when reimbursements, waivers or reductions occur. Expenses net of fee waivers reflect expenses after reimbursement and waivers but prior to reductions from expense offset arrangements. Expenses net of all reductions represent the net expenses paid by the class.
See accompanying notes which are an integral part of the financial statements.
Money Market Portfolio Class III
| Years ended March 31, | 2018 | 2017 | 2016 | 2015 | 2014 |
| Selected Per–Share Data | | | | | |
| Net asset value, beginning of period | $1.00 | $1.00 | $1.00 | $1.00 | $1.00 |
| Income from Investment Operations | | | | | |
| Net investment income (loss) | .010 | .004 | –A | –A | –A |
| Net realized and unrealized gain (loss)A | – | – | – | – | – |
| Total from investment operations | .010 | .004 | –A | –A | –A |
| Distributions from net investment income | (.010) | (.004) | –A | –A | –A |
| Total distributions | (.010) | (.004) | –A | –A | –A |
| Net asset value, end of period | $1.00 | $1.00 | $1.00 | $1.00 | $1.00 |
| Total ReturnB | 1.04% | .38% | .03% | .01% | .01% |
| Ratios to Average Net AssetsC | | | | | |
| Expenses before reductions | .46% | .46% | .46% | .46% | .46% |
| Expenses net of fee waivers, if any | .43% | .43% | .32% | .23% | .23% |
| Expenses net of all reductions | .43% | .43% | .32% | .23% | .23% |
| Net investment income (loss) | 1.06% | .31% | .03% | .01% | .01% |
| Supplemental Data | | | | | |
| Net assets, end of period (in millions) | $132 | $91 | $1,129 | $1,454 | $1,834 |
A Amount represents less than $.0005 per share.
B Total returns would have been lower if certain expenses had not been reduced during the applicable periods shown.
C Expense ratios reflect operating expenses of the class. Expenses before reductions do not reflect amounts reimbursed or waived or reductions from expense offset arrangements and do not represent the amount paid by the class during periods when reimbursements, waivers or reductions occur. Expenses net of fee waivers reflect expenses after reimbursement and waivers but prior to reductions from expense offset arrangements. Expenses net of all reductions represent the net expenses paid by the class.
See accompanying notes which are an integral part of the financial statements.
Money Market Portfolio Select Class
| Years ended March 31, | 2018 | 2017 | 2016 | 2015 | 2014 |
| Selected Per–Share Data | | | | | |
| Net asset value, beginning of period | $1.00 | $1.00 | $1.00 | $1.00 | $1.00 |
| Income from Investment Operations | | | | | |
| Net investment income (loss) | .012 | .006 | .001 | –A | –A |
| Net realized and unrealized gain (loss)A | – | – | – | – | – |
| Total from investment operations | .012 | .006 | .001 | –A | –A |
| Distributions from net investment income | (.012) | (.006) | (.001) | –A | –A |
| Total distributions | (.012) | (.006) | (.001) | –A | –A |
| Net asset value, end of period | $1.00 | $1.00 | $1.00 | $1.00 | $1.00 |
| Total ReturnB | 1.24% | .58% | .13% | .02% | .02% |
| Ratios to Average Net AssetsC | | | | | |
| Expenses before reductions | .26% | .26% | .26% | .26% | .26% |
| Expenses net of fee waivers, if any | .23% | .23% | .23% | .22% | .22% |
| Expenses net of all reductions | .23% | .23% | .23% | .22% | .22% |
| Net investment income (loss) | 1.26% | .51% | .12% | .01% | .02% |
| Supplemental Data | | | | | |
| Net assets, end of period (in millions) | $16 | $12 | $224 | $407 | $331 |
A Amount represents less than $.0005 per share.
B Total returns would have been lower if certain expenses had not been reduced during the applicable periods shown.
C Expense ratios reflect operating expenses of the class. Expenses before reductions do not reflect amounts reimbursed or waived or reductions from expense offset arrangements and do not represent the amount paid by the class during periods when reimbursements, waivers or reductions occur. Expenses net of fee waivers reflect expenses after reimbursement and waivers but prior to reductions from expense offset arrangements. Expenses net of all reductions represent the net expenses paid by the class.
See accompanying notes which are an integral part of the financial statements.
Money Market Portfolio Institutional Class
| Years ended March 31, | 2018 | 2017 | 2016 | 2015 | 2014 |
| Selected Per–Share Data | | | | | |
| Net asset value, beginning of period | $1.00 | $1.00 | $1.00 | $1.00 | $1.00 |
| Income from Investment Operations | | | | | |
| Net investment income (loss) | .013 | .007 | .002 | .001 | .001 |
| Net realized and unrealized gain (loss)A | – | – | – | – | – |
| Total from investment operations | .013 | .007 | .002 | .001 | .001 |
| Distributions from net investment income | (.013) | (.007) | (.002) | (.001) | (.001) |
| Total distributions | (.013) | (.007) | (.002) | (.001) | (.001) |
| Net asset value, end of period | $1.00 | $1.00 | $1.00 | $1.00 | $1.00 |
| Total ReturnB | 1.33% | .67% | .22% | .10% | .10% |
| Ratios to Average Net AssetsC | | | | | |
| Expenses before reductions | .18% | .18% | .18% | .18% | .18% |
| Expenses net of fee waivers, if any | .14% | .14% | .14% | .14% | .14% |
| Expenses net of all reductions | .14% | .14% | .14% | .14% | .14% |
| Net investment income (loss) | 1.35% | .60% | .21% | .09% | .10% |
| Supplemental Data | | | | | |
| Net assets, end of period (in millions) | $15,913 | $10,043 | $21,863 | $36,919 | $40,143 |
A Amount represents less than $.0005 per share.
B Total returns would have been lower if certain expenses had not been reduced during the applicable periods shown.
C Expense ratios reflect operating expenses of the class. Expenses before reductions do not reflect amounts reimbursed or waived or reductions from expense offset arrangements and do not represent the amount paid by the class during periods when reimbursements, waivers or reductions occur. Expenses net of fee waivers reflect expenses after reimbursement and waivers but prior to reductions from expense offset arrangements. Expenses net of all reductions represent the net expenses paid by the class.
See accompanying notes which are an integral part of the financial statements.
Prime Money Market Portfolio
Investment Summary/Performance (Unaudited)
Effective Maturity Diversification as of March 31, 2018
| Days | % of fund's investments 3/31/18 |
| 1 - 7 | 58.0 |
| 8 - 30 | 32.1 |
| 31 - 60 | 4.2 |
| 61 - 90 | 3.1 |
| 91 - 180 | 2.6 |
Effective maturity is determined in accordance with the requirements of Rule 2a-7 under the Investment Company Act of 1940.
Asset Allocation (% of fund's net assets)
| As of March 31, 2018 |
| | Certificates of Deposit | 24.1% |
| | Commercial Paper | 24.7% |
| | Variable Rate Demand Notes (VRDNs) | 0.2% |
| | U.S. Treasury Debt | 2.5% |
| | U.S. Government Agency Debt | 1.3% |
| | Non-Negotiable Time Deposit | 14.1% |
| | Other Instruments | 2.3% |
| | Repurchase Agreements | 31.6% |
| | Net Other Assets (Liabilities)* | (0.8)% |
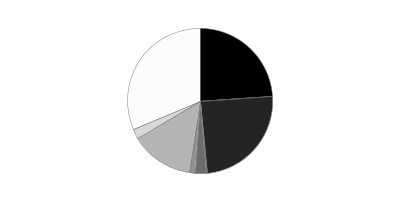
* Net Other Assets (Liabilities) are not included in the pie chart
Current 7-Day Yields
| | 3/31/18 |
| Class I | 1.70% |
| Class II | 1.55% |
| Class III | 1.45% |
| Class IV | 1.22% |
| Select Class | 1.65% |
| Institutional Class | 1.74% |
Yield refers to the income paid by the Fund over a given period. Yield for money market funds is usually for seven-day periods, as it is here, though it is expressed as an annual percentage rate. Past performance is no guarantee of future results. Yield will vary and it's possible to lose money investing in the Fund. A portion of the Fund's expenses was reimbursed and/or waived. Absent such reimbursements and/or waivers the yield for the period ending March 31, 2018, the most recent period shown in the table, would have been 1.67% for Class I, 1.53% for Class II, 1.43% for Class III, 1.19% for Class IV, 1.62% for Select Class and 1.70% for Institutional Class.
Prime Money Market Portfolio
Schedule of Investments March 31, 2018
Showing Percentage of Net Assets
| Certificate of Deposit - 24.1% | | | | |
| | | Yield(a) | Principal Amount (000s) | Value (000s) |
| Domestic Certificates Of Deposit - 4.5% | | | | |
| Wells Fargo Bank NA | | | | |
| 4/20/18 to 8/17/18 | | 1.86 to 2.05 (b)(c)% | $527,000 | $526,933 |
| London Branch, Eurodollar, Foreign Banks - 1.2% | | | | |
| Mizuho Bank Ltd. London Branch | | | | |
| 6/27/18 | | 2.43 | 64,000 | 63,661 |
| Sumitomo Mitsui Trust Bank Ltd. London Branch | | | | |
| 4/11/18 to 4/25/18 | | 1.80 to 1.82 | 76,000 | 76,000 |
| | | | | 139,661 |
| New York Branch, Yankee Dollar, Foreign Banks - 18.4% | | | | |
| Bank of Montreal | | | | |
| 4/9/18 to 8/10/18 | | 1.88 to 2.03 (b)(c) | 557,000 | 556,958 |
| Bank of Nova Scotia | | | | |
| 4/10/18 to 6/7/18 | | 1.84 to 1.90 (b)(c) | 415,000 | 415,067 |
| Canadian Imperial Bank of Commerce | | | | |
| 5/22/18 | | 2.04 (b)(c) | 125,000 | 125,027 |
| KBC Bank NV | | | | |
| 5/29/18 | | 2.12 | 50,000 | 50,001 |
| Mitsubishi UFJ Trust & Banking Corp. | | | | |
| 5/15/18 to 5/16/18 | | 1.96 to 1.97 (b)(c) | 140,000 | 140,029 |
| Mizuho Corporate Bank Ltd. | | | | |
| 4/9/18 | | 1.93 (b)(c) | 47,500 | 47,501 |
| Royal Bank of Canada | | | | |
| 6/20/18 to 10/18/18 | | 1.89 to 2.41 (b)(c) | 395,000 | 394,862 |
| Sumitomo Mitsui Banking Corp. | | | | |
| 5/23/18 to 5/29/18 | | 2.05 to 2.06 (b)(c) | 285,000 | 284,964 |
| Svenska Handelsbanken AB | | | | |
| 7/30/18 | | 2.04 (b)(c) | 142,000 | 141,947 |
| | | | | 2,156,356 |
| TOTAL CERTIFICATE OF DEPOSIT | | | | |
| (Cost $2,823,133) | | | | 2,822,950 |
|
| Financial Company Commercial Paper - 22.1% | | | | |
| ASB Finance Ltd. (London) | | | | |
| 7/30/18 to 9/26/18 | | 1.82 to 2.31 (b)(c) | 61,000 | 60,919 |
| Bank of Nova Scotia | | | | |
| 8/28/18 | | 2.07 (b)(c) | 150,000 | 149,916 |
| Barclays Bank PLC/Barclays U.S. CCP Funding LLC | | | | |
| 6/14/18 to 6/29/18 | | 2.51 to 2.52 (d) | 42,000 | 41,783 |
| BNP Paribas Dublin Branch | | | | |
| 4/2/18 to 4/4/18 | | 1.73 | 225,000 | 224,992 |
| Canadian Imperial Bank of Commerce | | | | |
| 4/20/18 to 11/5/18 | | 1.91 to 2.07 (b)(c) | 464,000 | 463,582 |
| Credit Suisse AG | | | | |
| 7/3/18 to 7/26/18 | | 2.28 to 2.36 (b) | 520,000 | 518,324 |
| J.P. Morgan Securities, LLC | | | | |
| 4/9/18 to 10/1/18 | | 1.90 to 2.32 (b)(c) | 426,000 | 426,075 |
| Mitsubishi UFJ Trust & Banking Corp. | | | | |
| 4/12/18 | | 1.76 | 66,000 | 65,969 |
| Natexis Banques Populaires New York Branch | | | | |
| 5/31/18 | | 1.96 | 150,000 | 149,520 |
| Sumitomo Trust & Banking Co. Ltd. | | | | |
| 4/25/18 | | 1.76 | 70,000 | 69,919 |
| The Toronto-Dominion Bank | | | | |
| 8/17/18 to 10/11/18 | | 1.95 to 1.99(b)(c) | 281,000 | 280,813 |
| UBS AG London Branch | | | | |
| 4/3/18 | | 1.89 (b)(c) | 135,000 | 135,001 |
| TOTAL FINANCIAL COMPANY COMMERCIAL PAPER | | | | |
| (Cost $2,587,283) | | | | 2,586,813 |
|
| Asset Backed Commercial Paper - 1.3% | | | | |
| Gotham Funding Corp. (Liquidity Facility Bank of Tokyo-Mitsubishi UFJ Ltd.) | | | | |
| | | | | |
| 4/10/18 | | 1.76 | 27,182 | 27,172 |
| 4/26/18 | | 1.78 | 17,000 | 16,979 |
| 5/3/18 | | 1.83 | 30,000 | 29,951 |
| Liberty Street Funding LLC (Liquidity Facility Bank of Nova Scotia) | | | | |
| | | | | |
| 4/16/18 | | 1.76 | 11,000 | 10,992 |
| 4/18/18 | | 1.76 | 23,000 | 22,981 |
| 4/18/18 | | 1.76 | 23,000 | 22,981 |
| 4/19/18 | | 1.76 | 11,000 | 10,990 |
| Manhattan Asset Funding Co. LLC (Liquidity Facility Sumitomo Mitsui Banking Corp.) | | | | |
| 6/21/18 | | 2.35 | 9,000 | 8,951 |
| TOTAL ASSET BACKED COMMERCIAL PAPER | | | | |
| (Cost $150,997) | | | | 150,997 |
|
| Non-Financial Company Commercial Paper - 1.3% | | | | |
| UnitedHealth Group, Inc. | | | | |
| 4/5/18 | | | | |
| (Cost $148,967) | | 2.00 | 149,000 | 148,975 |
|
| U.S. Treasury Debt - 2.5% | | | | |
| U.S. Treasury Obligations - 2.5% | | | | |
| U.S. Treasury Notes | | | | |
| 4/30/18 to 10/31/18 | | | | |
| (Cost $295,000) | | 1.94 to 1.96 (b)(c) | 295,000 | 295,152 |
|
| Other Instrument - 2.3% | | | | |
| Master Notes - 2.3% | | | | |
| Toyota Motor Credit Corp. | | | | |
| 4/5/18 | | | | |
| (Cost $275,000) | | 2.08 (b)(c) | 275,000 | 275,000 |
|
| Variable Rate Demand Note - 0.2% | | | | |
| Florida - 0.2% | | | | |
| Florida Timber Fin. III LLC Taxable 4/5/18, LOC Wells Fargo Bank NA, VRDN | | | | |
| 4/5/18 | | | | |
| (Cost $25,155) | | 1.88 (b) | 25,155 | 25,155 |
|
| U.S. Government Agency Debt - 1.3% | | | | |
| Federal Agencies - 1.3% | | | | |
| Federal Home Loan Bank | | | | |
| 5/16/18 | | | | |
| (Cost $149,672) | | 1.75 | 150,000 | 149,688 |
|
| Non-Negotiable Time Deposit - 14.1% | | | | |
| Time Deposits - 14.1% | | | | |
| Australia & New Zealand Banking Group Ltd. | | | | |
| 4/3/18 to 4/4/18 | | 1.73 | 359,000 | 359,001 |
| Barclays Bank PLC | | | | |
| 4/2/18 | | 1.80 | 556,000 | 556,000 |
| BNP Paribas | | | | |
| 4/3/18 to 4/4/18 | | 1.73 | 239,000 | 239,002 |
| Credit Agricole CIB | | | | |
| 4/2/18 to 4/4/18 | | 1.73 | 253,320 | 253,320 |
| ING Bank NV | | | | |
| 4/3/18 to 4/4/18 | | 1.73 | 238,000 | 238,000 |
| TOTAL NON-NEGOTIABLE TIME DEPOSIT | | | | |
| (Cost $1,645,320) | | | | 1,645,323 |
| U.S. Government Agency Repurchase Agreement - 10.8% | | | |
| | | Maturity Amount (000s) | Value (000s) |
| In a joint trading account at: | | | |
| 1.8% dated 3/29/18 due 4/2/18 (Collateralized by U.S. Government Obligations) # | | $469,616 | $469,522 |
| 1.82% dated 3/29/18 due 4/2/18 (Collateralized by U.S. Government Obligations) # | | 199 | 199 |
| With: | | | |
| Barclays Capital, Inc. at 1.81%, dated 3/29/18 due 4/5/18 (Collateralized by U.S. Government Obligations valued at $14,280,718, 3.50%, 1/1/48) | | 14,005 | 14,000 |
| Citibank NA at 1.8%, dated 3/27/18 due 4/3/18 (Collateralized by U.S. Treasury Obligations valued at $43,866,582, 0.63% - 3.63%, 6/30/18 - 11/15/26) | | 43,015 | 43,000 |
| Goldman Sachs & Co. at 1.8%, dated 3/29/18 due 4/2/18 (Collateralized by U.S. Government Obligations valued at $703,835,190, 2.53% - 9.00%, 8/1/19 - 3/15/53) | | 690,138 | 690,000 |
| HSBC Securities, Inc. at 1.79%, dated 3/29/18 due 4/5/18 (Collateralized by U.S. Treasury Obligations valued at $49,440,934, 0.00%, 11/15/26 - 5/15/47) | | 48,017 | 48,000 |
| TOTAL U.S. GOVERNMENT AGENCY REPURCHASE AGREEMENT | | | |
| (Cost $1,264,721) | | | 1,264,721 |
|
| U.S. Treasury Repurchase Agreement - 6.4% | | | |
| With: | | | |
| Barclays Capital, Inc. at 1.8%, dated 3/29/18 due 4/2/18 (Collateralized by U.S. Treasury Obligations valued at $51,002,645, 0.00% - 2.00%, 5/31/18 - 7/31/22) | | 50,010 | 50,000 |
| BMO Capital Markets Corp. at 1.73%, dated 3/27/18 due 4/3/18 (Collateralized by U.S. Treasury Obligations valued at $13,262,576, 0.00% - 6.13%, 5/24/18 - 5/15/47) | | 13,004 | 13,000 |
| BMO Harris Bank NA at 1.73%, dated 3/27/18 due 4/3/18 (Collateralized by U.S. Treasury Obligations valued at $13,261,968, 2.13%, 2/29/24) | | 13,004 | 13,000 |
| BNP Paribas, S.A. at: | | | |
| 1.77%, dated 3/28/18 due 4/5/18 (Collateralized by U.S. Treasury Obligations valued at $26,522,634, 1.18% - 2.50%, 10/31/19 - 8/15/23) | | 26,017 | 26,000 |
| 1.79%, dated 3/28/18 due 4/4/18 (Collateralized by U.S. Treasury Obligations valued at $26,522,718, 1.18% - 3.50%, 10/31/19 - 2/15/39) | | 26,009 | 26,000 |
| Deutsche Bank AG at: | | | |
| 1.8%, dated 3/29/18 due 4/2/18 (Collateralized by U.S. Treasury Obligations valued at $102,005,113, 0.88% - 3.13%, 6/30/18 - 8/15/42) | | 100,020 | 100,000 |
| 1.83%, dated 3/29/18 due 4/2/18 (Collateralized by U.S. Treasury Obligations valued at $66,303,414, 0.00% - 6.25%, 4/15/18 - 8/15/42) | | 65,013 | 65,000 |
| DNB Bank ASA at 1.8%, dated 3/29/18 due 4/2/18 (Collateralized by U.S. Treasury Obligations valued at $75,483,826, 1.50% - 2.13%, 9/30/19 - 3/31/24) | | 74,015 | 74,000 |
| HSBC Securities, Inc. at: | | | |
| 1.76%, dated 3/27/18 due 4/3/18 (Collateralized by U.S. Treasury Obligations valued at $26,526,699, 0.75%, 10/31/18) | | 26,009 | 26,000 |
| 1.78%, dated 3/29/18 due 4/5/18 (Collateralized by U.S. Treasury Obligations valued at $43,860,833, 0.75% - 1.50%, 8/31/18 - 7/15/19) | | 43,015 | 43,000 |
| 1.81%, dated 3/29/18 due 4/2/18 (Collateralized by U.S. Treasury Obligations valued at $22,621,812, 2.75%, 2/15/24) | | 22,004 | 22,000 |
| ING Financial Markets LLC at 1.8%, dated 3/29/18 due 4/2/18 (Collateralized by U.S. Treasury Obligations valued at $53,285,919, 2.25%, 2/15/27) | | 52,010 | 52,000 |
| Mitsubishi UFJ Securities (U.S.A.), Inc. at 1.85%, dated 3/29/18 due 4/2/18 (Collateralized by U.S. Treasury Obligations valued at $7,209,401, 2.00% - 3.00%, 11/15/26 - 5/15/47) | | 7,001 | 7,000 |
| MUFG Securities (Canada), Ltd. at 1.81%, dated 3/29/18 due 4/2/18 (Collateralized by U.S. Treasury Obligations valued at $44,882,680, 1.38% - 2.38%, 10/31/20 - 5/15/27) | | 44,009 | 44,000 |
| MUFG Securities EMEA PLC at 1.8%, dated 3/29/18 due 4/2/18 (Collateralized by U.S. Treasury Obligations valued at $14,532,308, 8.75%, 8/15/20) | | 14,003 | 14,000 |
| Natixis SA at 1.8%, dated 3/29/18 due 4/2/18 (Collateralized by U.S. Treasury Obligations valued at $120,366,117, 1.00% - 6.38%, 3/15/19 - 11/15/40) | | 118,024 | 118,000 |
| TD Securities (U.S.A.) at 1.8%, dated 3/29/18 due 4/2/18 (Collateralized by U.S. Treasury Obligations valued at $56,102,828, 2.25%, 2/15/21 - 11/15/24) | | 55,011 | 55,000 |
| TOTAL U.S. TREASURY REPURCHASE AGREEMENT | | | |
| (Cost $748,000) | | | 748,000 |
|
| Other Repurchase Agreement - 14.4% | | | |
| Other Repurchase Agreement - 14.4% | | | |
| With: | | | |
| BNP Paribas at 1.81%, dated 3/29/18 due 4/2/18 (Collateralized by Corporate Obligations valued at $56,702,876, 2.20% - 8.88%, 11/15/18 - 9/15/54) | | 54,011 | 54,000 |
| Citigroup Global Markets, Inc. at: | | | |
| 1.88%, dated 3/29/18 due 4/2/18 (Collateralized by Equity Securities valued at $38,882,036) | | 36,008 | 36,000 |
| 2.36%, dated: | | | |
| 2/28/18 due 4/30/18 (Collateralized by Equity Securities valued at $173,111,018)(b)(c)(e) | | 160,640 | 159,999 |
| 3/8/18 due 5/7/18 (Collateralized by Equity Securities valued at $129,773,027)(b)(c)(e) | | 120,472 | 119,996 |
| 2.71%, dated 2/20/18 due 5/21/18 (Collateralized by Mortgage Loan Obligations valued at $69,498,237, 1.45% - 4.95%, 1/15/49 - 4/25/57) | | 66,447 | 65,994 |
| 2.77%, dated 2/23/18 due 5/21/18 (Collateralized by Corporate Obligations valued at $22,741,079, 3.43%, 10/25/57) | | 21,141 | 20,999 |
| HSBC Securities, Inc. at 1.88%, dated 3/29/18 due 4/2/18 (Collateralized by Corporate Obligations valued at $28,354,373, 4.90% - 5.15%, 8/14/37 - 2/14/50) | | 27,006 | 27,000 |
| ING Financial Markets LLC at: | | | |
| 1.81%, dated 3/29/18 due 4/2/18 (Collateralized by U.S. Government Obligations valued at $22,591,199, 2.10% - 5.63%, 9/1/22 - 3/1/48) | | 22,004 | 22,000 |
| 1.88%, dated 3/29/18 due 4/2/18 (Collateralized by Equity Securities valued at $48,602,544) | | 45,009 | 45,000 |
| 1.96%, dated 3/29/18 due 4/2/18 (Collateralized by Corporate Obligations valued at $21,601,459, 4.75% - 9.50%, 5/15/19 - 1/15/43) | | 20,004 | 20,000 |
| J.P. Morgan Securities, LLC at: | | | |
| 1.8%, dated 3/29/18 due 4/2/18 (Collateralized by U.S. Government Obligations valued at $84,461,662, 0.00% - 5.50%, 4/15/29 - 7/15/46) | | 82,016 | 82,000 |
| 1.88%, dated 3/28/18 due 4/4/18 (Collateralized by U.S. Government Obligations valued at $91,674,983, 4.03% - 5.38%, 6/25/29 - 10/25/47) | | 89,033 | 89,000 |
| Merrill Lynch, Pierce, Fenner & Smith at: | | | |
| 1.88%, dated 3/28/18 due 4/4/18 (Collateralized by U.S. Government Obligations valued at $90,789,482, 2.50% - 4.00%, 5/1/30 - 3/1/48) | | 89,033 | 89,001 |
| 1.95%, dated 3/28/18 due 4/5/18 (Collateralized by Equity Securities valued at $28,354,917) | | 27,020 | 27,000 |
| Mitsubishi UFJ Securities (U.S.A.), Inc. at 1.87%, dated 3/29/18 due 4/2/18 (Collateralized by Equity Securities valued at $57,708,638) | | 54,011 | 54,000 |
| Mizuho Securities U.S.A., Inc. at: | | | |
| 1.86%, dated 3/29/18 due 4/2/18 (Collateralized by U.S. Treasury Obligations valued at $27,754,363, 1.38% - 3.00%, 7/31/18 - 2/15/47) | | 27,006 | 27,000 |
| 1.93%, dated: | | | |
| 3/21/18 due 4/4/18 (Collateralized by Equity Securities valued at $19,449,490) | | 18,014 | 18,000 |
| 3/28/18 due 4/5/18 (Collateralized by Equity Securities valued at $29,163,183) | | 27,020 | 27,000 |
| 3/29/18 due 4/5/18 (Collateralized by Equity Securities valued at $29,161,644) | | 27,020 | 27,000 |
| 2.03%, dated 3/23/18 due 4/5/18 (Collateralized by U.S. Treasury Obligations valued at $9,183,637, 1.75% - 2.38%, 10/31/18 - 3/31/21) | | 9,007 | 9,000 |
| 2.99%, dated 3/14/18 due 6/12/18 (Collateralized by Corporate Obligations valued at $20,547,269, 1.88% - 2.00%, 12/11/18 - 4/2/21) | | 19,142 | 19,003 |
| Royal Bank of Canada at 1.92%, dated 3/8/18 due 4/5/18 (Collateralized by U.S. Treasury Obligations valued at $75,709,518, 1.88% - 2.00%, 12/11/18-4/2/21 | | 72,123 | 72,000 |
| Societe Generale at: | | | |
| 1.81%, dated 3/29/18 due 4/2/18 (Collateralized by Corporate Obligations valued at $470,207,952, 0.00% - 6.88%, 4/24/18 - 8/16/77) | | 448,090 | 448,000 |
| 1.96%, dated 3/29/18 due 4/2/18 (Collateralized by Corporate Obligations valued at $115,485,127, 0.00% - 11.00%, 10/1/18 - 6/5/2115) | | 108,024 | 108,000 |
| Wells Fargo Securities, LLC at 1.88%, dated 3/29/18 due 4/2/18 (Collateralized by Corporate Obligations valued at $19,442,002, 0.63% - 6.88%, 12/15/18 - 1/1/49) | | 18,004 | 18,000 |
| TOTAL OTHER REPURCHASE AGREEMENT | | | |
| (Cost $1,684,992) | | | 1,684,992 |
| TOTAL INVESTMENT IN SECURITIES - 100.8% | | | |
| (Cost $11,798,240) | | | 11,797,766 |
| NET OTHER ASSETS (LIABILITIES) - (0.8)% | | | (97,225) |
| NET ASSETS - 100% | | | $11,700,541 |
Security Type Abbreviations
VRDN – VARIABLE RATE DEMAND NOTE (A debt instrument that is payable upon demand, either daily, weekly or monthly)
The date shown for securities represents the date when principal payments must be paid, taking into account any call options exercised by the issuer and any permissible maturity shortening features other than interest rate resets.
Legend
(a) Yield represents either the annualized yield at the date of purchase, or the stated coupon rate, or, for floating and adjustable rate securities, the rate at period end.
(b) Coupon rates for floating and adjustable rate securities reflect the rates in effect at period end.
(c) Coupon is indexed to a floating interest rate which may be multiplied by a specified factor and/or subject to caps or floors.
(d) Security exempt from registration under Rule 144A of the Securities Act of 1933. These securities may be resold in transactions exempt from registration, normally to qualified institutional buyers. At the end of the period, the value of these securities amounted to $41,783,000 or 0.4% of net assets.
(e) The maturity amount is based on the rate at period end.
Investment Valuation
All investments are categorized as Level 2 under the Fair Value Hierarchy. The inputs or methodology used for valuing securities may not be an indication of the risk associated with investing in those securities. For more information on valuation inputs please refer to the Investment Valuation section in the accompanying Notes to Financial Statements.
Other Information
# Additional information on each counterparty to the repurchase agreement is as follows:
| Repurchase Agreement / Counterparty | Value (000s) |
| $469,522,000 due 4/02/18 at 1.80% | |
| BNP Paribas, S.A. | $74,920 |
| HSBC Securities (USA), Inc. | 33,300 |
| Merrill Lynch, Pierce, Fenner & Smith, Inc. | 1,985 |
| Wells Fargo Securities LLC | 359,317 |
| | $469,522 |
| $199,000 due 4/02/18 at 1.82% | |
| BNP Paribas, S.A. | 28 |
| Bank of America NA | 94 |
| J.P. Morgan Securities, Inc. | 19 |
| Wells Fargo Securities LLC | 58 |
| | $199 |
See accompanying notes which are an integral part of the financial statements.
Prime Money Market Portfolio
Financial Statements
Statement of Assets and Liabilities
| Amounts in thousands (except per-share amounts) | | March 31, 2018 |
| Assets | | |
Investment in securities, at value (including repurchase agreements of $3,697,713) — See accompanying schedule:
Unaffiliated issuers (cost $11,798,240) | | $11,797,766 |
| Receivable for investments sold | | 209,699 |
| Interest receivable | | 7,115 |
| Prepaid expenses | | 10 |
| Receivable from investment adviser for expense reductions | | 379 |
| Other receivables | | 466 |
| Total assets | | 12,015,435 |
| Liabilities | | |
| Payable to custodian bank | $4,302 | |
| Payable for investments purchased | 308,138 | |
| Payable for fund shares redeemed | 1 | |
| Distributions payable | 38 | |
| Accrued management fee | 1,433 | |
| Distribution and service plan fees payable | 8 | |
| Other affiliated payables | 400 | |
| Other payables and accrued expenses | 574 | |
| Total liabilities | | 314,894 |
| Net Assets | | $11,700,541 |
| Net Assets consist of: | | |
| Paid in capital | | $11,701,015 |
| Net unrealized appreciation (depreciation) on investments | | (474) |
| Net Assets | | $11,700,541 |
| Class I: | | |
| Net Asset Value, offering price and redemption price per share ($713,596.73 ÷ 713,356.67 shares) | | $1.0003 |
| Class II: | | |
| Net Asset Value, offering price and redemption price per share ($39,212.02 ÷ 39,203.32 shares) | | $1.0002 |
| Class III: | | |
| Net Asset Value, offering price and redemption price per share ($7,700.32 ÷ 7,698.33 shares) | | $1.0003 |
| Class IV: | | |
| Net Asset Value, offering price and redemption price per share ($20.18 ÷ 20.16 shares) | | $1.0010 |
| Select Class: | | |
| Net Asset Value, offering price and redemption price per share ($31,134.31 ÷ 31,122.11 shares) | | $1.0004 |
| Institutional Class: | | |
| Net Asset Value, offering price and redemption price per share ($10,908,877.66 ÷ 10,906,446.85 shares) | | $1.0002 |
See accompanying notes which are an integral part of the financial statements.
Statement of Operations
| Amounts in thousands | | Year ended March 31, 2018 |
| Investment Income | | |
| Interest | | $180,229 |
| Expenses | | |
| Management fee | $17,814 | |
| Transfer agent fees | 4,113 | |
| Distribution and service plan fees | 90 | |
| Accounting fees and expenses | 931 | |
| Custodian fees and expenses | 226 | |
| Independent trustees' fees and expenses | 42 | |
| Registration fees | 176 | |
| Audit | 50 | |
| Legal | 26 | |
| Miscellaneous | 157 | |
| Total expenses before reductions | 23,625 | |
| Expense reductions | (5,341) | 18,284 |
| Net investment income (loss) | | 161,945 |
| Realized and Unrealized Gain (Loss) | | |
| Net realized gain (loss) on: | | |
| Investment securities: | | |
| Unaffiliated issuers | | 411 |
| Total net realized gain (loss) | | 411 |
| Change in net unrealized appreciation (depreciation) on investment securities | | (2,778) |
| Net increase in net assets resulting from operations | | $159,578 |
See accompanying notes which are an integral part of the financial statements.
Statement of Changes in Net Assets
| Amounts in thousands | Year ended March 31, 2018 | Year ended March 31, 2017 |
| Increase (Decrease) in Net Assets | | |
| Operations | | |
| Net investment income (loss) | $161,945 | $160,265 |
| Net realized gain (loss) | 411 | 825 |
| Change in net unrealized appreciation (depreciation) | (2,778) | 2,304 |
| Net increase in net assets resulting from operations | 159,578 | 163,394 |
| Distributions to shareholders from net investment income | (161,931) | (160,593) |
| Distributions to shareholders from net realized gain | – | (10,360) |
| Total distributions | (161,931) | (170,953) |
| Share transactions - net increase (decrease) | 1,427,420 | (47,936,337) |
| Total increase (decrease) in net assets | 1,425,067 | (47,943,896) |
| Net Assets | | |
| Beginning of period | 10,275,474 | 58,219,370 |
| End of period | $11,700,541 | $10,275,474 |
See accompanying notes which are an integral part of the financial statements.
Financial Highlights
Prime Money Market Portfolio Class I
| Years ended March 31, | 2018 | 2017 A | 2016 | 2015 | 2014 |
| Selected Per–Share Data | | | | | |
| Net asset value, beginning of period | $1.0005 | $1.0000 | $1.00 | $1.00 | $1.00 |
| Income from Investment Operations | | | | | |
| Net investment income (loss) | .0122 | .0056 | .002 | –B | –B |
| Net realized and unrealized gain (loss) | (.0002) | .0007 | –B | –B | –B |
| Total from investment operations | .0120 | .0063 | .002 | –B | –B |
| Distributions from net investment income | (.0122) | (.0056) | (.002) | –B | –B |
| Distributions from net realized gain | – | (.0002) | – | – | – |
| Total distributions | (.0122) | (.0058) | (.002) | –B | –B |
| Net asset value, end of period | $1.0003 | $1.0005 | $1.00 | $1.00 | $1.00 |
| Total ReturnC | 1.21% | .64% | .17% | .01% | .02% |
| Ratios to Average Net AssetsD | | | | | |
| Expenses before reductions | .21% | .21% | .21% | .21% | .21% |
| Expenses net of fee waivers, if any | .18% | .18% | .18% | .19% | .19% |
| Expenses net of all reductions | .18% | .18% | .18% | .19% | .19% |
| Net investment income (loss) | 1.24% | .45% | .18% | .01% | .02% |
| Supplemental Data | | | | | |
| Net assets, end of period (in millions) | $714 | $866 | $9,638 | $6,236 | $7,816 |
A Beginning October 3, 2016 the Fund began selling and redeeming class shares based upon the market-based value of the securities held rounded to the fourth decimal place; a "floating"net asset value.
B Amount represents less than $.00005 or $.0005 per share.
C Total returns would have been lower if certain expenses had not been reduced during the applicable periods shown.
D Expense ratios reflect operating expenses of the class. Expenses before reductions do not reflect amounts reimbursed or waived or reductions from expense offset arrangements and do not represent the amount paid by the class during periods when reimbursements, waivers or reductions occur. Expenses net of fee waivers reflect expenses after reimbursement and waivers but prior to reductions from expense offset arrangements. Expenses net of all reductions represent the net expenses paid by the class.
See accompanying notes which are an integral part of the financial statements.
Prime Money Market Portfolio Class II
| Years ended March 31, | 2018 | 2017 A | 2016 | 2015 | 2014 |
| Selected Per–Share Data | | | | | |
| Net asset value, beginning of period | $1.0004 | $1.0000 | $1.00 | $1.00 | $1.00 |
| Income from Investment Operations | | | | | |
| Net investment income (loss) | .0107 | .0041 | .001 | –B | –B |
| Net realized and unrealized gain (loss) | (.0002) | .0008 | –B | –B | –B |
| Total from investment operations | .0105 | .0049 | .001 | –B | –B |
| Distributions from net investment income | (.0107) | (.0041) | (.001) | –B | –B |
| Distributions from net realized gain | – | (.0004) | – | – | – |
| Total distributions | (.0107) | (.0045) | (.001) | –B | –B |
| Net asset value, end of period | $1.0002 | $1.0004 | $1.00 | $1.00 | $1.00 |
| Total ReturnC | 1.06% | .49% | .06% | .01% | .01% |
| Ratios to Average Net AssetsD | | | | | |
| Expenses before reductions | .36% | .36% | .36% | .36% | .36% |
| Expenses net of fee waivers, if any | .33% | .33% | .28% | .20% | .19% |
| Expenses net of all reductions | .33% | .33% | .28% | .20% | .19% |
| Net investment income (loss) | 1.09% | .30% | .09% | .01% | .01% |
| Supplemental Data | | | | | |
| Net assets, end of period (in millions) | $39 | $28 | $245 | $454 | $419 |
A Beginning October 3, 2016 the Fund began selling and redeeming class shares based upon the market-based value of the securities held rounded to the fourth decimal place; a "floating"net asset value.
B Amount represents less than $.00005 or $.0005 per share.
C Total returns would have been lower if certain expenses had not been reduced during the applicable periods shown.
D Expense ratios reflect operating expenses of the class. Expenses before reductions do not reflect amounts reimbursed or waived or reductions from expense offset arrangements and do not represent the amount paid by the class during periods when reimbursements, waivers or reductions occur. Expenses net of fee waivers reflect expenses after reimbursement and waivers but prior to reductions from expense offset arrangements. Expenses net of all reductions represent the net expenses paid by the class.
See accompanying notes which are an integral part of the financial statements.
Prime Money Market Portfolio Class III
| Years ended March 31, | 2018 | 2017 A | 2016 | 2015 | 2014 |
| Selected Per–Share Data | | | | | |
| Net asset value, beginning of period | $1.0004 | $1.0000 | $1.00 | $1.00 | $1.00 |
| Income from Investment Operations | | | | | |
| Net investment income (loss) | .0097 | .0031 | –B | –B | –B |
| Net realized and unrealized gain (loss) | (.0001) | .0006 | –B | –B | –B |
| Total from investment operations | .0096 | .0037 | –B | –B | –B |
| Distributions from net investment income | (.0097) | (.0031) | –B | –B | –B |
| Distributions from net realized gain | – | (.0002) | – | – | – |
| Total distributions | (.0097) | (.0033) | –B | –B | –B |
| Net asset value, end of period | $1.0003 | $1.0004 | $1.00 | $1.00 | $1.00 |
| Total ReturnC | .97% | .37% | .04% | .01% | .01% |
| Ratios to Average Net AssetsD | | | | | |
| Expenses before reductions | .46% | .45% | .46% | .46% | .46% |
| Expenses net of fee waivers, if any | .43% | .43% | .31% | .20% | .19% |
| Expenses net of all reductions | .43% | .43% | .31% | .20% | .19% |
| Net investment income (loss) | .99% | .20% | .06% | .01% | .01% |
| Supplemental Data | | | | | |
| Net assets, end of period (in millions) | $8 | $8 | $894 | $1,011 | $1,967 |
A Beginning October 3, 2016 the Fund began selling and redeeming class shares based upon the market-based value of the securities held rounded to the fourth decimal place; a "floating"net asset value.
B Amount represents less than $.00005 or $.0005 per share.
C Total returns would have been lower if certain expenses had not been reduced during the applicable periods shown.
D Expense ratios reflect operating expenses of the class. Expenses before reductions do not reflect amounts reimbursed or waived or reductions from expense offset arrangements and do not represent the amount paid by the class during periods when reimbursements, waivers or reductions occur. Expenses net of fee waivers reflect expenses after reimbursement and waivers but prior to reductions from expense offset arrangements. Expenses net of all reductions represent the net expenses paid by the class.
See accompanying notes which are an integral part of the financial statements.
Prime Money Market Portfolio Class IV
| Years ended March 31, | 2018 | 2017 A | 2016 | 2015 | 2014 |
| Selected Per–Share Data | | | | | |
| Net asset value, beginning of period | $1.0012 | $1.0000 | $1.00 | $1.00 | $1.00 |
| Income from Investment Operations | | | | | |
| Net investment income (loss) | .0071 | .0009 | –B | –B | –B |
| Net realized and unrealized gain (loss) | (.0002) | .0012 | –B | –B | –B |
| Total from investment operations | .0069 | .0021 | –B | –B | –B |
| Distributions from net investment income | (.0071) | (.0009) | –B | –B | –B |
| Total distributions | (.0071) | (.0009) | –B | –B | –B |
| Net asset value, end of period | $1.0010 | $1.0012 | $1.00 | $1.00 | $1.00 |
| Total ReturnC | .71% | .21% | .01% | .01% | .01% |
| Ratios to Average Net AssetsD | | | | | |
| Expenses before reductions | .71% | .70% | .71% | .71% | .71% |
| Expenses net of fee waivers, if any | .68% | .58% | .33% | .20% | .18% |
| Expenses net of all reductions | .68% | .58% | .33% | .20% | .18% |
| Net investment income (loss) | .74% | .05% | .03% | .01% | .02% |
| Supplemental Data | | | | | |
| Net assets, end of period (in millions) | $–E | $–E | $184 | $207 | $100 |
A Beginning October 3, 2016 the Fund began selling and redeeming class shares based upon the market-based value of the securities held rounded to the fourth decimal place; a "floating"net asset value.
B Amount represents less than $.00005 or $.0005 per share.
C Total returns would have been lower if certain expenses had not been reduced during the applicable periods shown.
D Expense ratios reflect operating expenses of the class. Expenses before reductions do not reflect amounts reimbursed or waived or reductions from expense offset arrangements and do not represent the amount paid by the class during periods when reimbursements, waivers or reductions occur. Expenses net of fee waivers reflect expenses after reimbursement and waivers but prior to reductions from expense offset arrangements. Expenses net of all reductions represent the net expenses paid by the class.
E Amount represents less than $500,000.
See accompanying notes which are an integral part of the financial statements.
Prime Money Market Portfolio Select Class
| Years ended March 31, | 2018 | 2017 A | 2016 | 2015 | 2014 |
| Selected Per–Share Data | | | | | |
| Net asset value, beginning of period | $1.0006 | $1.0000 | $1.00 | $1.00 | $1.00 |
| Income from Investment Operations | | | | | |
| Net investment income (loss) | .0117 | .0051 | .001 | –B | –B |
| Net realized and unrealized gain (loss) | (.0002) | .0007 | –B | –B | –B |
| Total from investment operations | .0115 | .0058 | .001 | –B | –B |
| Distributions from net investment income | (.0117) | (.0051) | (.001) | –B | –B |
| Distributions from net realized gain | – | –B | – | – | – |
| Total distributions | (.0117) | (.0052)C | (.001) | –B | –B |
| Net asset value, end of period | $1.0004 | $1.0006 | $1.00 | $1.00 | $1.00 |
| Total ReturnD | 1.16% | .58% | .12% | .01% | .01% |
| Ratios to Average Net AssetsE | | | | | |
| Expenses before reductions | .26% | .26% | .26% | .26% | .26% |
| Expenses net of fee waivers, if any | .23% | .23% | .23% | .20% | .19% |
| Expenses net of all reductions | .23% | .23% | .23% | .20% | .19% |
| Net investment income (loss) | 1.19% | .40% | .13% | .01% | .01% |
| Supplemental Data | | | | | |
| Net assets, end of period (in millions) | $31 | $28 | $771 | $1,068 | $1,173 |
A Beginning October 3, 2016 the Fund began selling and redeeming class shares based upon the market-based value of the securities held rounded to the fourth decimal place; a "floating"net asset value.
B Amount represents less than $.00005 or $.0005 per share.
C Total distributions of $.0052 per share is comprised of distributions from net investment income of $.00514 and distributions from net realized gain of $.00002 per share.
D Total returns would have been lower if certain expenses had not been reduced during the applicable periods shown.
E Expense ratios reflect operating expenses of the class. Expenses before reductions do not reflect amounts reimbursed or waived or reductions from expense offset arrangements and do not represent the amount paid by the class during periods when reimbursements, waivers or reductions occur. Expenses net of fee waivers reflect expenses after reimbursement and waivers but prior to reductions from expense offset arrangements. Expenses net of all reductions represent the net expenses paid by the class.
See accompanying notes which are an integral part of the financial statements.
Prime Money Market Portfolio Institutional Class
| Years ended March 31, | 2018 | 2017 A | 2016 | 2015 | 2014 |
| Selected Per–Share Data | | | | | |
| Net asset value, beginning of period | $1.0004 | $1.0000 | $1.00 | $1.00 | $1.00 |
| Income from Investment Operations | | | | | |
| Net investment income (loss) | .0126 | .0060 | .002 | .001 | .001 |
| Net realized and unrealized gain (loss) | (.0002) | .0006 | –B | –B | –B |
| Total from investment operations | .0124 | .0066 | .002 | .001 | .001 |
| Distributions from net investment income | (.0126) | (.0060) | (.002) | (.001) | (.001) |
| Distributions from net realized gain | – | (.0002) | – | – | – |
| Total distributions | (.0126) | (.0062) | (.002) | (.001) | (.001) |
| Net asset value, end of period | $1.0002 | $1.0004 | $1.00 | $1.00 | $1.00 |
| Total ReturnC | 1.25% | .66% | .21% | .07% | .06% |
| Ratios to Average Net AssetsD | | | | | |
| Expenses before reductions | .18% | .18% | .18% | .18% | .18% |
| Expenses net of fee waivers, if any | .14% | .14% | .14% | .14% | .14% |
| Expenses net of all reductions | .14% | .14% | .14% | .14% | .14% |
| Net investment income (loss) | 1.28% | .49% | .22% | .07% | .06% |
| Supplemental Data | | | | | |
| Net assets, end of period (in millions) | $10,909 | $9,346 | $46,487 | $32,529 | $26,896 |
A Beginning October 3, 2016 the Fund began selling and redeeming class shares based upon the market-based value of the securities held rounded to the fourth decimal place; a "floating"net asset value.
B Amount represents less than $.00005 or $.0005 per share.
C Total returns would have been lower if certain expenses had not been reduced during the applicable periods shown.
D Expense ratios reflect operating expenses of the class. Expenses before reductions do not reflect amounts reimbursed or waived or reductions from expense offset arrangements and do not represent the amount paid by the class during periods when reimbursements, waivers or reductions occur. Expenses net of fee waivers reflect expenses after reimbursement and waivers but prior to reductions from expense offset arrangements. Expenses net of all reductions represent the net expenses paid by the class.
See accompanying notes which are an integral part of the financial statements.
Prime Reserves Portfolio
Investment Summary/Performance (Unaudited)
Effective Maturity Diversification as of March 31, 2018
| Days | % of fund's investments 3/31/18 |
| 1 - 7 | 54.9 |
| 8 - 30 | 30.3 |
| 31 - 60 | 7.4 |
| 61 - 90 | 6.5 |
| 91 - 180 | 0.9 |
Effective maturity is determined in accordance with the requirements of Rule 2a-7 under the Investment Company Act of 1940.
Asset Allocation (% of fund's net assets)
| As of March 31, 2018 |
| | Certificates of Deposit | 26.3% |
| | Commercial Paper | 32.6% |
| | U.S. Government Agency Debt | 1.2% |
| | Non-Negotiable Time Deposit | 13.4% |
| | Other Instruments | 1.6% |
| | Repurchase Agreements | 24.8% |
| | Net Other Assets (Liabilities) | 0.1% |
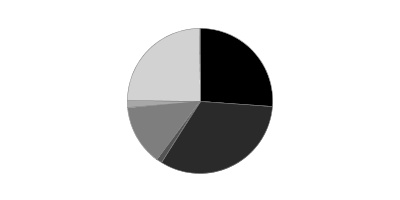
Current 7-Day Yields
| | 3/31/18 |
| Class I | 1.73% |
| Class II | 1.58% |
| Class III | 1.48% |
| Select Class | 1.68% |
| Institutional Class | 1.77% |
Yield refers to the income paid by the Fund over a given period. Yield for money market funds is usually for seven-day periods, as it is here, though it is expressed as an annual percentage rate. Past performance is no guarantee of future results. Yield will vary and it's possible to lose money investing in the Fund. A portion of the Fund's expenses was reimbursed and/or waived. Absent such reimbursements and/or waivers the yield for the period ending March 31, 2018, the most recent period shown in the table, would have been 1.70% for Class I, 1.56% for Class II, 1.46% for Class III, 1.65% for Select Class and 1.73% for Institutional Class.
Prime Reserves Portfolio
Schedule of Investments March 31, 2018
Showing Percentage of Net Assets
| Certificate of Deposit - 26.3% | | | | |
| | | Yield(a) | Principal Amount (000s) | Value (000s) |
| Domestic Certificates Of Deposit - 2.8% | | | | |
| Citibank NA | | | | |
| 6/13/18 | | 2.20% | $25,000 | $25,000 |
| Wells Fargo Bank NA | | | | |
| 4/20/18 to 8/17/18 | | 1.86 to 2.00 (b)(c) | 94,000 | 93,975 |
| | | | | 118,975 |
| London Branch, Eurodollar, Foreign Banks - 1.9% | | | | |
| Mizuho Bank Ltd. London Branch | | | | |
| 4/5/18 to 6/27/18 | | 1.80 to 2.43 | 51,000 | 50,874 |
| Sumitomo Mitsui Trust Bank Ltd. London Branch | | | | |
| 4/11/18 to 5/29/18 | | 1.80 to 2.10 | 29,000 | 29,001 |
| | | | | 79,875 |
| New York Branch, Yankee Dollar, Foreign Banks - 21.6% | | | | |
| Bank of Montreal | | | | |
| 4/9/18 to 8/10/18 | | 1.88 to 2.01 (b)(c) | 154,000 | 153,982 |
| Bank of Nova Scotia | | | | |
| 4/10/18 to 7/13/18 | | 1.84 to 1.95 (b)(c) | 81,000 | 81,011 |
| Bayerische Landesbank | | | | |
| 5/2/18 | | 2.20 | 44,000 | 44,008 |
| Canadian Imperial Bank of Commerce | | | | |
| 4/13/18 to 5/22/18 | | 1.92 to 2.04 (b)(c) | 45,000 | 45,007 |
| Landesbank Baden-Wuerttemberg New York Branch | | | | |
| 4/2/18 to 4/5/18 | | 1.73 | 172,000 | 171,999 |
| Mitsubishi UFJ Trust & Banking Corp. | | | | |
| 5/16/18 | | 1.97 (b)(c) | 40,000 | 40,008 |
| Mizuho Corporate Bank Ltd. | | | | |
| 6/7/18 | | 2.19 | 40,000 | 40,007 |
| Natixis SA | | | | |
| 6/5/18 | | 2.15 | 42,000 | 42,009 |
| Royal Bank of Canada | | | | |
| 6/20/18 to 10/18/18 | | 1.92 to 2.41 (b)(c) | 120,000 | 119,958 |
| Sumitomo Mitsui Banking Corp. | | | | |
| 5/21/18 to 5/29/18 | | 2.03 to 2.06 (b)(c) | 100,000 | 99,987 |
| Svenska Handelsbanken AB | | | | |
| 7/2/18 to 9/27/18 | | 1.83 to 2.27 (b)(c) | 90,000 | 89,990 |
| | | | | 927,966 |
| TOTAL CERTIFICATE OF DEPOSIT | | | | |
| (Cost $1,126,870) | | | | 1,126,816 |
|
| Financial Company Commercial Paper - 25.4% | | | | |
| ASB Finance Ltd. (London) | | | | |
| 7/24/18 | | 2.04 (b)(c) | 42,000 | 41,987 |
| Barclays Bank PLC/Barclays U.S. CCP Funding LLC | | | | |
| 4/3/18 to 6/29/18 | | 1.87 to 2.52 (d) | 75,000 | 74,768 |
| Bayerische Landesbank | | | | |
| 4/2/18 to 4/4/18 | | 1.76 | 129,000 | 128,969 |
| BNP Paribas Dublin Branch | | | | |
| 4/2/18 to 4/4/18 | | 1.73 | 79,000 | 78,997 |
| BPCE SA | | | | |
| 6/11/18 to 6/13/18 | | 2.21 to 2.24 | 40,000 | 39,823 |
| Caisse d'Amort de la Dette Sociale | | | | |
| 4/17/18 | | 1.75 (d) | 63,000 | 62,940 |
| Canadian Imperial Bank of Commerce | | | | |
| 4/20/18 to 11/26/18 | | 1.96 to 2.16 (b)(c) | 145,000 | 144,867 |
| Commonwealth Bank of Australia | | | | |
| 7/5/18 | | 1.86 (b)(c) | 19,000 | 18,998 |
| Credit Suisse AG | | | | |
| 7/3/18 to 7/26/18 | | 2.28 to 2.36 (b) | 100,000 | 99,798 |
| J.P. Morgan Securities, LLC | | | | |
| 4/9/18 to 10/1/18 | | 1.90 to 2.32 (b)(c) | 120,000 | 120,027 |
| Lam Research Corp. | | | | |
| 4/3/18 to 4/11/18 | | 2.30 to 2.42 | 5,000 | 4,998 |
| Mitsubishi UFJ Trust & Banking Corp. | | | | |
| 4/6/18 to 4/27/18 | | 1.76 to 2.00 | 84,000 | 83,927 |
| Sumitomo Mitsui Banking Corp. | | | | |
| 6/5/18 to 6/6/18 | | 2.16 | 14,000 | 13,944 |
| Sumitomo Trust & Banking Co. Ltd. | | | | |
| 4/25/18 | | 1.76 | 40,000 | 39,953 |
| The Toronto-Dominion Bank | | | | |
| 8/17/18 to 10/9/18 | | 1.93 to 2.07 (b)(c) | 108,000 | 107,930 |
| UBS AG London Branch | | | | |
| 4/3/18 | | 1.89 (b)(c) | 25,000 | 25,000 |
| TOTAL FINANCIAL COMPANY COMMERCIAL PAPER | | | | |
| (Cost $1,087,122) | | | | 1,086,926 |
|
| Asset Backed Commercial Paper - 3.4% | | | | |
| Atlantic Asset Securitization Corp. (Credit Agricole CIB Guaranteed) | | | | |
| | | | | |
| 6/7/18 | | 2.16 | 13,000 | 12,946 |
| 6/8/18 | | 2.17 | 8,000 | 7,966 |
| Gotham Funding Corp. (Liquidity Facility Bank of Tokyo-Mitsubishi UFJ Ltd.) | | | | |
| | | | | |
| 4/10/18 | | 1.76 | 8,000 | 7,997 |
| 4/9/18 | | 1.77 | 4,000 | 3,998 |
| 4/9/18 | | 1.76 | 4,000 | 3,998 |
| 5/22/18 | | 2.04 | 50,000 | 49,848 |
| 6/13/18 | | 2.26 | 15,000 | 14,930 |
| 6/5/18 | | 2.19 | 11,000 | 10,956 |
| 6/7/18 | | 2.19 | 3,000 | 2,987 |
| Liberty Street Funding LLC (Liquidity Facility Bank of Nova Scotia) | | | | |
| | | | | |
| 4/16/18 | | 1.76 | 3,000 | 2,998 |
| 4/18/18 | | 1.76 | 6,000 | 5,995 |
| 4/18/18 | | 1.76 | 6,000 | 5,995 |
| 4/19/18 | | 1.76 | 3,000 | 2,997 |
| 4/9/18 | | 1.76 | 7,000 | 6,996 |
| Manhattan Asset Funding Co. LLC (Liquidity Facility Sumitomo Mitsui Banking Corp.) | | | | |
| 6/21/18 | | 2.35 | 3,000 | 2,984 |
| TOTAL ASSET BACKED COMMERCIAL PAPER | | | | |
| (Cost $143,607) | | | | 143,591 |
|
| Non-Financial Company Commercial Paper - 3.8% | | | | |
| Bell Canada | | | | |
| 4/2/18 | | 1.88 | 7,000 | 6,998 |
| Dominion Resources, Inc. | | | | |
| 4/16/18 to 5/7/18 | | 1.91 to 2.43 | 10,000 | 9,978 |
| Duke Energy Corp. | | | | |
| 4/4/18 to 4/5/18 | | 2.25 | 12,000 | 11,996 |
| Eversource Energy | | | | |
| 4/2/18 to 4/4/18 | | 2.25 to 2.30 | 12,000 | 11,997 |
| Sempra Global | | | | |
| 4/24/18 | | 2.46 | 17,000 | 16,973 |
| Tyson Foods, Inc. | | | | |
| 4/3/18 to 4/10/18 | | 1.88 to 2.25 | 24,000 | 23,990 |
| UnitedHealth Group, Inc. | | | | |
| 4/2/18 to 4/5/18 | | 1.95 to 2.00 | 59,000 | 58,990 |
| Verizon Communications, Inc. | | | | |
| 4/2/18 to 4/25/18 | | 2.10 to 2.35 | 21,500 | 21,492 |
| TOTAL NON-FINANCIAL COMPANY COMMERCIAL PAPER | | | | |
| (Cost $162,425) | | | | 162,414 |
|
| Other Instrument - 1.6% | | | | |
| Master Notes - 1.6% | | | | |
| Toyota Motor Credit Corp. | | | | |
| 4/5/18 | | | | |
| (Cost $70,000) | | 2.08 (b)(c) | 70,000 | 70,000 |
|
| U.S. Government Agency Debt - 1.2% | | | | |
| Federal Agencies - 1.2% | | | | |
| Federal Home Loan Bank | | | | |
| 5/16/18 | | | | |
| (Cost $49,891) | | 1.75 | 50,000 | 49,896 |
|
| Non-Negotiable Time Deposit - 13.4% | | | | |
| Time Deposits - 13.4% | | | | |
| Australia & New Zealand Banking Group Ltd. | | | | |
| 4/3/18 to 4/4/18 | | 1.73 | 130,000 | 130,000 |
| Barclays Bank PLC | | | | |
| 4/2/18 | | 1.80 | 139,000 | 139,000 |
| BNP Paribas | | | | |
| 4/3/18 to 4/4/18 | | 1.73 | 86,000 | 86,001 |
| Credit Agricole CIB | | | | |
| 4/2/18 to 4/4/18 | | 1.73 | 91,000 | 91,000 |
| ING Bank NV | | | | |
| 4/3/18 to 4/4/18 | | 1.73 | 86,000 | 86,000 |
| Skandinaviska Enskilda Banken AB | | | | |
| 4/2/18 | | 1.67 | 42,732 | 42,732 |
| TOTAL NON-NEGOTIABLE TIME DEPOSIT | | | | |
| (Cost $574,732) | | | | 574,733 |
| U.S. Government Agency Repurchase Agreement - 3.6% | | | |
| | | Maturity Amount (000s) | Value (000s) |
| In a joint trading account at 1.81% dated 3/29/18 due 4/2/18 (Collateralized by U.S. Government Obligations) # | | $95,483 | $95,464 |
| With: | | | |
| Barclays Capital, Inc. at 1.81%, dated 3/29/18 due 4/5/18 (Collateralized by U.S. Government Obligations valued at $5,100,257, 3.50%, 1/1/48) | | 5,002 | 5,000 |
| Nomura Securities International, Inc. at 1.8%, dated 3/27/18 due 4/3/18 (Collateralized by U.S. Government Obligations valued at $56,108,415, 0.00% - 6.25%, 11/15/19 - 11/20/65) | | 55,019 | 55,000 |
| TOTAL U.S. GOVERNMENT AGENCY REPURCHASE AGREEMENT | | | |
| (Cost $155,464) | | | 155,464 |
|
| U.S. Treasury Repurchase Agreement - 5.0% | | | |
| In a joint trading account at 1.8% dated 3/30/18 due 4/2/18 (Collateralized by U.S. Treasury Obligations) # | | 1,000 | 1,000 |
| With: | | | |
| BMO Capital Markets Corp. at 1.73%, dated 3/27/18 due 4/3/18 (Collateralized by U.S. Treasury Obligations valued at $5,102,606, 0.00% - 6.00%, 4/5/18 - 2/15/48) | | 5,002 | 5,000 |
| BMO Harris Bank NA at 1.73%, dated 3/27/18 due 4/3/18 (Collateralized by U.S. Treasury Obligations valued at $5,150,848, 3.38%, 5/15/44) | | 5,002 | 5,000 |
| BNP Paribas, S.A. at: | | | |
| 1.77%, dated 3/28/18 due 4/5/18 (Collateralized by U.S. Treasury Obligations valued at $9,180,980, 1.25% - 2.25%, 7/31/18 - 1/31/24) | | 9,006 | 9,000 |
| 1.79%, dated 3/28/18 due 4/4/18 (Collateralized by U.S. Treasury Obligations valued at $9,180,980, 1.25% - 2.25%, 7/31/18 - 1/31/24) | | 9,003 | 9,000 |
| Commerz Markets LLC at: | | | |
| 1.81%, dated 3/29/18 due 4/5/18 (Collateralized by U.S. Treasury Obligations valued at $13,320,682, 2.00% - 4.00%, 8/15/18 - 2/15/46) | | 13,005 | 13,000 |
| 1.85%, dated 3/27/18 due 4/3/18 (Collateralized by U.S. Treasury Obligations valued at $7,141,171, 2.00%, 6/30/24) | | 7,003 | 7,000 |
| 1.86%, dated 3/28/18 due 4/4/18 (Collateralized by U.S. Treasury Obligations valued at $7,140,755, 1.38% - 3.75%, 3/31/21 - 2/15/46) | | 7,003 | 7,000 |
| Deutsche Bank Securities, Inc. at 1.8%, dated 3/27/18 due 4/3/18 | | | |
| (Collateralized by U.S. Treasury Obligations valued at $10,201,607, 1.88%, 12/31/19) | | 10,004 | 10,000 |
| (Collateralized by U.S. Treasury Obligations valued at $57,128,667, 1.50% - 2.13%, 10/31/19 - 8/15/21) | | 56,020 | 56,000 |
| HSBC Securities, Inc. at 1.76%, dated 3/27/18 due 4/3/18 (Collateralized by U.S. Treasury Obligations valued at $9,183,311, 1.75%, 10/31/20) | | 9,003 | 9,000 |
| ING Financial Markets LLC at 1.8%, dated 3/29/18 due 4/2/18 (Collateralized by U.S. Treasury Obligations valued at $18,542,269, 3.00%, 5/15/47) | | 18,004 | 18,000 |
| Nomura Securities International, Inc. at 1.8%, dated 3/28/18 due 4/4/18 (Collateralized by U.S. Treasury Obligations valued at $68,346,877, 0.75% - 2.25%, 4/15/18 - 11/15/27) | | 67,023 | 67,000 |
| TOTAL U.S. TREASURY REPURCHASE AGREEMENT | | | |
| (Cost $216,000) | | | 216,000 |
|
| Other Repurchase Agreement - 16.2% | | | |
| Other Repurchase Agreement - 16.2% | | | |
| With: | | | |
| BNP Paribas at 1.81%, dated 3/29/18 due 4/2/18 (Collateralized by Corporate Obligations valued at $19,951,004, 2.20% - 4.60%, 1/15/20 - 4/24/48) | | 19,004 | 19,000 |
| Citigroup Global Markets, Inc. at: | | | |
| 1.88%, dated 3/29/18 due 4/2/18 (Collateralized by Equity Securities valued at $14,040,739) | | 13,003 | 13,000 |
| 2.36%, dated: | | | |
| 2/28/18 due 4/30/18 (Collateralized by Equity Securities valued at $51,933,368)(b)(c)(e) | | 48,192 | 48,000 |
| 3/8/18 due 5/7/18 (Collateralized by Equity Securities valued at $45,420,557)(b)(c)(e) | | 42,165 | 41,999 |
| 2.71%, dated 2/20/18 due 5/21/18 (Collateralized by Mortgage Loan Obligations valued at $19,495,610, 3.43% - 6.73%, 8/14/31 - 6/25/58) | | 18,122 | 17,998 |
| 2.77%, dated 2/23/18 due 5/21/18 (Collateralized by Mortgage Loan Obligations valued at $6,497,452, 3.30% - 4.59%, 8/12/49 - 8/17/50) | | 6,040 | 6,000 |
| Deutsche Bank AG at 1.93%, dated 3/29/18 due 4/2/18 (Collateralized by Municipal Bond Obligations valued at $19,951,070, 4.00% - 5.00%, 3/1/25 - 8/1/47) | | 19,004 | 19,000 |
| HSBC Securities, Inc. at 1.88%, dated 3/29/18 due 4/2/18 (Collateralized by Corporate Obligations valued at $10,504,365, 4.30% - 5.15%, 12/15/47 - 2/14/50) | | 10,002 | 10,000 |
| ING Financial Markets LLC at: | | | |
| 1.81%, dated 3/29/18 due 4/2/18 (Collateralized by U.S. Government Obligations valued at $8,189,708, 2.26% - 6.75%, 3/28/19 - 5/15/87) | | 8,002 | 8,000 |
| 1.88%, dated 3/29/18 due 4/2/18 (Collateralized by Equity Securities valued at $17,280,947) | | 16,003 | 16,000 |
| 1.96%, dated 3/29/18 due 4/2/18 (Collateralized by Corporate Obligations valued at $7,561,129, 2.95% - 7.45%, 5/15/19 - 11/1/35) | | 7,002 | 7,000 |
| J.P. Morgan Securities, LLC at: | | | |
| 1.8%, dated 3/29/18 due 4/2/18 (Collateralized by U.S. Government Obligations valued at $62,833,859, 2.27% - 7.61%, 1/15/33 - 11/15/56) | | 61,012 | 61,000 |
| 1.88%, dated 3/28/18 due 4/4/18 (Collateralized by U.S. Government Obligations valued at $32,962,321, 2.90% - 4.58%, 6/25/37 - 4/25/48) | | 32,012 | 32,000 |
| Merrill Lynch, Pierce, Fenner & Smith at: | | | |
| 1.88%, dated 3/28/18 due 4/4/18 (Collateralized by U.S. Government Obligations valued at $32,643,409, 2.50%, 5/1/30) | | 32,012 | 32,000 |
| 1.95%, dated 3/28/18 due 4/5/18 (Collateralized by Equity Securities valued at $10,801,170) | | 10,008 | 10,000 |
| Mitsubishi UFJ Securities (U.S.A.), Inc. at 1.87%, dated 3/29/18 due 4/2/18 (Collateralized by Equity Securities valued at $20,521,078) | | 19,004 | 19,000 |
| Mizuho Securities U.S.A., Inc. at: | | | |
| 1.86%, dated 3/29/18 due 4/2/18 (Collateralized by U.S. Treasury Obligations valued at $10,200,547, 2.75%, 2/28/25) | | 10,002 | 10,000 |
| 1.93%, dated: | | | |
| 3/21/18 due 4/4/18 (Collateralized by Equity Securities valued at $7,563,707) | | 7,005 | 7,000 |
| 3/28/18 due 4/5/18 (Collateralized by Equity Securities valued at $10,801,227) | | 10,008 | 10,000 |
| 3/29/18 due 4/5/18 (Collateralized by Equity Securities valued at $10,800,602) | | 10,008 | 10,000 |
| 2.03%, dated 3/23/18 due 4/5/18 (Collateralized by U.S. Treasury Obligations valued at $3,061,268, 3.63%, 2/15/20) | | 3,002 | 3,000 |
| 2.99%, dated 3/14/18 due 6/12/18 (Collateralized by Corporate Obligations valued at $7,570,047, 12.00%, 6/16/20) | | 7,052 | 7,001 |
| RBS Securities, Inc. at 1.85%, dated 3/29/18 due 4/2/18 (Collateralized by U.S. Government Obligations valued at $64,263,040, 2.13%, 3/13/20) | | 63,013 | 63,000 |
| Royal Bank of Canada at 1.92%, dated 3/8/18 due 4/5/18 (Collateralized by Corporate Obligations valued at $21,031,037, 1.95% - 2.25%, 3/3/21 - 3/15/22) | | 20,034 | 20,000 |
| Societe Generale at: | | | |
| 1.81%, dated 3/29/18 due 4/2/18 (Collateralized by Corporate Obligations valued at $167,445,930, 0.00% - 11.00%, 3/31/18 - 5/15/55) | | 161,032 | 161,000 |
| 1.96%, dated 3/29/18 due 4/2/18 (Collateralized by Corporate Obligations valued at $41,706,410, 2.13% - 10.50%, 3/15/19 - 4/1/48) | | 39,008 | 39,000 |
| Wells Fargo Securities, LLC at 1.88%, dated 3/29/18 due 4/2/18 (Collateralized by Corporate Obligations valued at $6,480,357, 0.25% - 3.50%, 2/1/19 - 2/1/26) | | 6,001 | 6,000 |
| TOTAL OTHER REPURCHASE AGREEMENTS | | | |
| (Cost $695,998) | | | 695,998 |
| TOTAL INVESTMENT IN SECURITIES - 99.9% | | | |
| (Cost $4,282,109) | | | 4,281,838 |
| NET OTHER ASSETS (LIABILITIES) - 0.1% | | | 6,121 |
| NET ASSETS - 100% | | | $4,287,959 |
The date shown for securities represents the date when principal payments must be paid, taking into account any call options exercised by the issuer and any permissible maturity shortening features other than interest rate resets.
Legend
(a) Yield represents either the annualized yield at the date of purchase, or the stated coupon rate, or, for floating and adjustable rate securities, the rate at period end.
(b) Coupon rates for floating and adjustable rate securities reflect the rates in effect at period end.
(c) Coupon is indexed to a floating interest rate which may be multiplied by a specified factor and/or subject to caps or floors.
(d) Security exempt from registration under Rule 144A of the Securities Act of 1933. These securities may be resold in transactions exempt from registration, normally to qualified institutional buyers. At the end of the period, the value of these securities amounted to $137,708,000 or 3.2% of net assets.
(e) The maturity amount is based on the rate at period end.
Investment Valuation
All investments are categorized as Level 2 under the Fair Value Hierarchy. The inputs or methodology used for valuing securities may not be an indication of the risk associated with investing in those securities. For more information on valuation inputs please refer to the Investment Valuation section in the accompanying Notes to Financial Statements.
Other Information
# Additional information on each counterparty to the repurchase agreement is as follows:
| Repurchase Agreement / Counterparty | Value (000s) |
| $1,000,000 due 4/02/18 at 1.80% | |
| Merrill Lynch, Pierce, Fenner & Smith, Inc. | $1,000 |
| | $1,000 |
| $95,464,000 due 4/02/18 at 1.81% | |
| BNP Paribas, S.A. | 19,742 |
| BNY Mellon Capital Markets LLC | 3,119 |
| Bank of America NA | 11,784 |
| Citibank NA | 9,097 |
| HSBC Securities (USA), Inc. | 9,815 |
| J.P. Morgan Securities, Inc. | 8,961 |
| Merrill Lynch, Pierce, Fenner & Smith, Inc. | 1,300 |
| Mizuho Securities USA, Inc. | 9,357 |
| Wells Fargo Securities LLC | 22,289 |
| | $95,464 |
See accompanying notes which are an integral part of the financial statements.
Prime Reserves Portfolio
Financial Statements
Statement of Assets and Liabilities
| Amounts in thousands (except per-share amounts) | | March 31, 2018 |
| Assets | | |
Investment in securities, at value (including repurchase agreements of $1,067,462) — See accompanying schedule:
Unaffiliated issuers (cost $4,282,109) | | $4,281,838 |
| Receivable for investments sold | | 39,943 |
| Receivable for fund shares sold | | 8,003 |
| Interest receivable | | 1,966 |
| Prepaid expenses | | 2 |
| Receivable from investment adviser for expense reductions | | 128 |
| Total assets | | 4,331,880 |
| Liabilities | | |
| Payable to custodian bank | $5 | |
| Payable for investments purchased | 39,760 | |
| Payable for fund shares redeemed | 3,401 | |
| Distributions payable | 2 | |
| Accrued management fee | 501 | |
| Distribution and service plan fees payable | 1 | |
| Other affiliated payables | 184 | |
| Other payables and accrued expenses | 67 | |
| Total liabilities | | 43,921 |
| Net Assets | | $4,287,959 |
| Net Assets consist of: | | |
| Paid in capital | | $4,288,223 |
| Accumulated undistributed net realized gain (loss) on investments | | 7 |
| Net unrealized appreciation (depreciation) on investments | | (271) |
| Net Assets | | $4,287,959 |
| Class I: | | |
| Net Asset Value, offering price and redemption price per share ($1,851,678.3 ÷ 1,851,481.4 shares) | | $1.0001 |
| Class II: | | |
| Net Asset Value, offering price and redemption price per share ($1,013.7 ÷ 1,013.6 shares) | | $1.0001 |
| Class III: | | |
| Net Asset Value, offering price and redemption price per share ($1,011.8 ÷ 1,011.8 shares) | | $1.0000 |
| Select Class: | | |
| Net Asset Value, offering price and redemption price per share ($4,845.8 ÷ 4,845.3 shares) | | $1.0001 |
| Institutional Class: | | |
| Net Asset Value, offering price and redemption price per share ($2,429,409.0 ÷ 2,429,163.8 shares) | | $1.0001 |
See accompanying notes which are an integral part of the financial statements.
Statement of Operations
| Amounts in thousands | | Year ended March 31, 2018 |
| Investment Income | | |
| Interest (including $96 from affiliated interfund lending) | | $44,089 |
| Expenses | | |
| Management fee | $4,213 | |
| Transfer agent fees | 1,263 | |
| Distribution and service plan fees | 8 | |
| Accounting fees and expenses | 274 | |
| Custodian fees and expenses | 91 | |
| Independent trustees' fees and expenses | 9 | |
| Registration fees | 219 | |
| Audit | 49 | |
| Legal | 4 | |
| Miscellaneous | 6 | |
| Total expenses before reductions | 6,136 | |
| Expense reductions | (1,440) | 4,696 |
| Net investment income (loss) | | 39,393 |
| Realized and Unrealized Gain (Loss) | | |
| Net realized gain (loss) on: | | |
| Investment securities: | | |
| Unaffiliated issuers | | 9 |
| Total net realized gain (loss) | | 9 |
| Change in net unrealized appreciation (depreciation) on investment securities | | (405) |
| Net increase in net assets resulting from operations | | $38,997 |
See accompanying notes which are an integral part of the financial statements.
Statement of Changes in Net Assets
| Amounts in thousands | Year ended March 31, 2018 | For the period
June 2, 2016 (commencement of operations) to March 31, 2017 |
| Increase (Decrease) in Net Assets | | |
| Operations | | |
| Net investment income (loss) | $39,393 | $3,795 |
| Net realized gain (loss) | 9 | 1 |
| Change in net unrealized appreciation (depreciation) | (405) | 134 |
| Net increase in net assets resulting from operations | 38,997 | 3,930 |
| Distributions to shareholders from net investment income | (39,392) | (3,795) |
| Share transactions - net increase (decrease) | 2,780,285 | 1,507,934 |
| Total increase (decrease) in net assets | 2,779,890 | 1,508,069 |
| Net Assets | | |
| Beginning of period | 1,508,069 | – |
| End of period | $4,287,959 | $1,508,069 |
See accompanying notes which are an integral part of the financial statements.
Financial Highlights
Prime Reserves Portfolio Class I
| Years ended March 31, | 2018 | 2017 A,B |
| Selected Per–Share Data | | |
| Net asset value, beginning of period | $1.0002 | $1.0000 |
| Income from Investment Operations | | |
| Net investment income (loss) | .0123 | .0047 |
| Net realized and unrealized gain (loss) | (.0001) | .0002 |
| Total from investment operations | .0122 | .0049 |
| Distributions from net investment income | (.0123) | (.0047) |
| Total distributions | (.0123) | (.0047) |
| Net asset value, end of period | $1.0001 | $1.0002 |
| Total ReturnC,D | 1.23% | .49% |
| Ratios to Average Net AssetsE | | |
| Expenses before reductions | .22% | .25%F |
| Expenses net of fee waivers, if any | .18% | .18%F |
| Expenses net of all reductions | .18% | .18%F |
| Net investment income (loss) | 1.29% | .68%F |
| Supplemental Data | | |
| Net assets, end of period (in millions) | $1,852 | $540 |
A For the period June 2, 2016 (commencement of operations) to March 31, 2017.
B Beginning October 3, 2016 the Fund began selling and redeeming class shares based upon the market-based value of the securities held rounded to the fourth decimal place; a "floating"net asset value.
C Total returns for periods of less than one year are not annualized.
D Total returns would have been lower if certain expenses had not been reduced during the applicable periods shown.
E Expense ratios reflect operating expenses of the class. Expenses before reductions do not reflect amounts reimbursed or waived or reductions from expense offset arrangements and do not represent the amount paid by the class during periods when reimbursements, waivers or reductions occur. Expense ratios before reductions for start-up periods may not be representative of longer-term operating periods. Expenses net of fee waivers reflect expenses after reimbursement and waivers but prior to reductions from expense offset arrangements. Expenses net of all reductions represent the net expenses paid by the class.
F Annualized
See accompanying notes which are an integral part of the financial statements.
Prime Reserves Portfolio Class II
| Years ended March 31, | 2018 | 2017 A,B |
| Selected Per–Share Data | | |
| Net asset value, beginning of period | $1.0002 | $1.0000 |
| Income from Investment Operations | | |
| Net investment income (loss) | .0108 | .0034 |
| Net realized and unrealized gain (loss) | (.0001) | .0002 |
| Total from investment operations | .0107 | .0036 |
| Distributions from net investment income | (.0108) | (.0034) |
| Total distributions | (.0108) | (.0034) |
| Net asset value, end of period | $1.0001 | $1.0002 |
| Total ReturnC,D | 1.08% | .36% |
| Ratios to Average Net AssetsE | | |
| Expenses before reductions | .37% | .56%F |
| Expenses net of fee waivers, if any | .33% | .33%F |
| Expenses net of all reductions | .33% | .33%F |
| Net investment income (loss) | 1.14% | .53%F |
| Supplemental Data | | |
| Net assets, end of period (in millions) | $1 | $1 |
A For the period June 2, 2016 (commencement of operations) to March 31, 2017.
B Beginning October 3, 2016 the Fund began selling and redeeming class shares based upon the market-based value of the securities held rounded to the fourth decimal place; a "floating"net asset value.
C Total returns for periods of less than one year are not annualized.
D Total returns would have been lower if certain expenses had not been reduced during the applicable periods shown.
E Expense ratios reflect operating expenses of the class. Expenses before reductions do not reflect amounts reimbursed or waived or reductions from expense offset arrangements and do not represent the amount paid by the class during periods when reimbursements, waivers or reductions occur. Expense ratios before reductions for start-up periods may not be representative of longer-term operating periods. Expenses net of fee waivers reflect expenses after reimbursement and waivers but prior to reductions from expense offset arrangements. Expenses net of all reductions represent the net expenses paid by the class.
F Annualized
See accompanying notes which are an integral part of the financial statements.
Prime Reserves Portfolio Class III
| Years ended March 31, | 2018 | 2017 A,B |
| Selected Per–Share Data | | |
| Net asset value, beginning of period | $1.0002 | $1.0000 |
| Income from Investment Operations | | |
| Net investment income (loss) | .0098 | .0026 |
| Net realized and unrealized gain (loss) | (.0002) | .0002 |
| Total from investment operations | .0096 | .0028 |
| Distributions from net investment income | (.0098) | (.0026) |
| Total distributions | (.0098) | (.0026) |
| Net asset value, end of period | $1.0000 | $1.0002 |
| Total ReturnC,D | .97% | .28% |
| Ratios to Average Net AssetsE | | |
| Expenses before reductions | .47% | .66%F |
| Expenses net of fee waivers, if any | .43% | .43%F |
| Expenses net of all reductions | .43% | .43%F |
| Net investment income (loss) | 1.03% | .43%F |
| Supplemental Data | | |
| Net assets, end of period (in millions) | $1 | $1 |
A For the period June 2, 2016 (commencement of operations) to March 31, 2017.
B Beginning October 3, 2016 the Fund began selling and redeeming class shares based upon the market-based value of the securities held rounded to the fourth decimal place; a "floating"net asset value.
C Total returns for periods of less than one year are not annualized.
D Total returns would have been lower if certain expenses had not been reduced during the applicable periods shown.
E Expense ratios reflect operating expenses of the class. Expenses before reductions do not reflect amounts reimbursed or waived or reductions from expense offset arrangements and do not represent the amount paid by the class during periods when reimbursements, waivers or reductions occur. Expense ratios before reductions for start-up periods may not be representative of longer-term operating periods. Expenses net of fee waivers reflect expenses after reimbursement and waivers but prior to reductions from expense offset arrangements. Expenses net of all reductions represent the net expenses paid by the class.
F Annualized
See accompanying notes which are an integral part of the financial statements.
Prime Reserves Portfolio Select Class
| Years ended March 31, | 2018 | 2017 A,B |
| Selected Per–Share Data | | |
| Net asset value, beginning of period | $1.0002 | $1.0000 |
| Income from Investment Operations | | |
| Net investment income (loss) | .0118 | .0043 |
| Net realized and unrealized gain (loss) | (.0001) | .0002 |
| Total from investment operations | .0117 | .0045 |
| Distributions from net investment income | (.0118) | (.0043) |
| Total distributions | (.0118) | (.0043) |
| Net asset value, end of period | $1.0001 | $1.0002 |
| Total ReturnC,D | 1.18% | .45% |
| Ratios to Average Net AssetsE | | |
| Expenses before reductions | .27% | .45%F |
| Expenses net of fee waivers, if any | .23% | .23%F |
| Expenses net of all reductions | .23% | .23%F |
| Net investment income (loss) | 1.24% | .63%F |
| Supplemental Data | | |
| Net assets, end of period (in millions) | $5 | $1 |
A For the period June 2, 2016 (commencement of operations) to March 31, 2017.
B Beginning October 3, 2016 the Fund began selling and redeeming class shares based upon the market-based value of the securities held rounded to the fourth decimal place; a "floating"net asset value.
C Total returns for periods of less than one year are not annualized.
D Total returns would have been lower if certain expenses had not been reduced during the applicable periods shown.
E Expense ratios reflect operating expenses of the class. Expenses before reductions do not reflect amounts reimbursed or waived or reductions from expense offset arrangements and do not represent the amount paid by the class during periods when reimbursements, waivers or reductions occur. Expense ratios before reductions for start-up periods may not be representative of longer-term operating periods. Expenses net of fee waivers reflect expenses after reimbursement and waivers but prior to reductions from expense offset arrangements. Expenses net of all reductions represent the net expenses paid by the class.
F Annualized
See accompanying notes which are an integral part of the financial statements.
Prime Reserves Portfolio Institutional Class
| Years ended March 31, | 2018 | 2017 A,B |
| Selected Per–Share Data | | |
| Net asset value, beginning of period | $1.0002 | $1.0000 |
| Income from Investment Operations | | |
| Net investment income (loss) | .0127 | .0050 |
| Net realized and unrealized gain (loss) | (.0001) | .0002 |
| Total from investment operations | .0126 | .0052 |
| Distributions from net investment income | (.0127) | (.0050) |
| Total distributions | (.0127) | (.0050) |
| Net asset value, end of period | $1.0001 | $1.0002 |
| Total ReturnC,D | 1.27% | .52% |
| Ratios to Average Net AssetsE | | |
| Expenses before reductions | .19% | .24%F |
| Expenses net of fee waivers, if any | .14% | .14%F |
| Expenses net of all reductions | .14% | .14%F |
| Net investment income (loss) | 1.33% | .72%F |
| Supplemental Data | | |
| Net assets, end of period (in millions) | $2,429 | $965 |
A For the period June 2, 2016 (commencement of operations) to March 31, 2017.
B Beginning October 3, 2016 the Fund began selling and redeeming class shares based upon the market-based value of the securities held rounded to the fourth decimal place; a "floating"net asset value.
C Total returns for periods of less than one year are not annualized.
D Total returns would have been lower if certain expenses had not been reduced during the applicable periods shown.
E Expense ratios reflect operating expenses of the class. Expenses before reductions do not reflect amounts reimbursed or waived or reductions from expense offset arrangements and do not represent the amount paid by the class during periods when reimbursements, waivers or reductions occur. Expense ratios before reductions for start-up periods may not be representative of longer-term operating periods. Expenses net of fee waivers reflect expenses after reimbursement and waivers but prior to reductions from expense offset arrangements. Expenses net of all reductions represent the net expenses paid by the class.
F Annualized
See accompanying notes which are an integral part of the financial statements.
Tax-Exempt Portfolio
Investment Summary/Performance (Unaudited)
Effective Maturity Diversification as of March 31, 2018
| Days | % of fund's investments 3/31/18 |
| 1 - 7 | 73.1 |
| 8 - 30 | 1.3 |
| 31 - 60 | 6.0 |
| 61 - 90 | 7.2 |
| 91 - 180 | 9.2 |
| > 180 | 3.2 |
Effective maturity is determined in accordance with the requirements of Rule 2a-7 under the Investment Company Act of 1940.
Asset Allocation (% of fund's net assets)
| As of March 31, 2018 |
| | Variable Rate Demand Notes (VRDNs) | 28.8% |
| | Tender Option Bond | 35.3% |
| | Other Municipal Security | 28.9% |
| | Investment Companies | 6.0% |
| | Net Other Assets (Liabilities) | 1.0% |
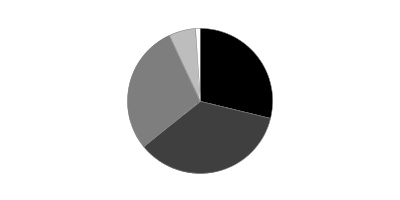
Current 7-Day Yields
| | 3/31/18 |
| Class I | 1.25% |
| Class II | 1.10% |
| Class III | 1.00% |
| Select Class | 1.20% |
Yield refers to the income paid by the Fund over a given period. Yield for money market funds is usually for seven-day periods, as it is here, though it is expressed as an annual percentage rate. Past performance is no guarantee of future results. Yield will vary and it's possible to lose money investing in the Fund. A portion of the Fund's expenses was reimbursed and/or waived. Absent such reimbursements and/or waivers the yield for the period ending March 31, 2018, the most recent period shown in the table, would have been 1.22% for Class I, 1.08% for Class II, 0.98% for Class III and 1.17% for Select Class.
Tax-Exempt Portfolio
Schedule of Investments March 31, 2018
Showing Percentage of Net Assets
| Variable Rate Demand Note - 28.8% | | | |
| | | Principal Amount (000s) | Value (000s) |
| Alabama - 2.3% | | | |
| Columbia Indl. Dev. Board Poll. Cont. Rev. (Alabama Pwr. Co. Proj.) Series 2014 B, 1.83% 4/2/18, VRDN(a) | | $35,600 | $35,600 |
| Mobile Downtown Redev. Auth. Gulf Opportunity Zone Series 2011 B, 1.65% 4/5/18, LOC Wells Fargo Bank NA, VRDN (a)(b) | | 6,335 | 6,335 |
| Mobile Indl. Dev. Board Poll. Cont. Rev. (Alabama Pwr. Co. Barry Plant Proj.): | | | |
| Series 2007 C, 1.69% 4/5/18, VRDN (a) | | 9,150 | 9,150 |
| Series 2009, 1.83% 4/2/18, VRDN(a) | | 14,450 | 14,450 |
| Mobile Indl. Dev. Board Solid Waste Disp. Rev. (Alabama Pwr. Co. Barry Plant Proj.) Second Series 2009, 1.8% 4/2/18, VRDN(a) | | 4,000 | 4,000 |
| Tuscaloosa County Indl. Dev. Gulf Opportunity: | | | |
| (Hunt Refining Co. Proj.) Series 2011 H, 1.65% 4/5/18, LOC JPMorgan Chase Bank, VRDN (a)(b) | | 5,000 | 5,000 |
| (Hunt Refining Proj.): | | | |
| Series 2011 A, 1.65% 4/5/18, LOC JPMorgan Chase Bank, VRDN (a)(b) | | 21,300 | 21,299 |
| Series 2011 I, 1.61% 4/5/18, LOC Bank of Nova Scotia, VRDN (a)(b) | | 1,600 | 1,600 |
| West Jefferson Indl. Dev. Series 2008, 1.69% 4/5/18, VRDN (a) | | 6,300 | 6,300 |
| | | | 103,734 |
| Alaska - 1.8% | | | |
| Valdez Marine Term. Rev.: | | | |
| (ConocoPhillips Proj.) Series 1994 A, 1.55% 4/5/18, VRDN (a) | | 28,200 | 28,200 |
| (Phillips Trans. Alaska, Inc. Proj.): | | | |
| Series 1994 B, 1.6% 4/5/18, VRDN (a) | | 33,100 | 33,100 |
| Series 1994 C, 1.68% 4/5/18, VRDN (a) | | 10,800 | 10,800 |
| Series 2002, 1.55% 4/5/18, VRDN (a) | | 8,200 | 8,200 |
| | | | 80,300 |
| Arizona - 0.5% | | | |
| Arizona Health Facilities Auth. Rev.: | | | |
| (Banner Health Sys. Proj.) Series 2008 F, 1.53% 4/5/18, LOC JPMorgan Chase Bank, VRDN (a) | | 6,280 | 6,280 |
| (Catholic Healthcare West Proj.) Series 2009 F, 1.72% 4/5/18, LOC Mizuho Corporate Bank Ltd., VRDN (a) | | 15,100 | 15,100 |
| Maricopa County Poll. Cont. Rev. (Arizona Pub. Svc. Co. Palo Verde Proj.) Series 2009 A, 1.62% 4/5/18, VRDN (a) | | 1,100 | 1,100 |
| Tempe Indl. Dev. Auth. Rev. (ASUF Brickyard Proj.) Series 2004 A, 1.63% 4/5/18, LOC Bank of America NA, VRDN (a) | | 1,000 | 1,000 |
| | | | 23,480 |
| Colorado - 0.1% | | | |
| Colorado Health Facilities Auth. Rev. (Boulder Cmnty. Hosp. Proj.) Series 2000, 1.65% 4/5/18, LOC JPMorgan Chase Bank, VRDN (a) | | 4,200 | 4,200 |
| Connecticut - 1.9% | | | |
| Connecticut Gen. Oblig. Series 2016 C, 1.7% 4/5/18 (Liquidity Facility Bank of America NA), VRDN (a)(c) | | 42,505 | 42,505 |
| Connecticut Health & Edl. Facilities Auth. Rev. Series 2011 B, 1.65% 4/5/18, LOC Bank of America NA, VRDN (a) | | 33,085 | 33,085 |
| Connecticut Hsg. Fin. Auth. Series E 3, 1.63% 4/5/18 (Liquidity Facility Landesbank Hessen-Thuringen), VRDN (a) | | 10,175 | 10,175 |
| | | | 85,765 |
| Delaware - 0.2% | | | |
| Delaware Econ. Dev. Auth. Rev. (Delmarva Pwr. & Lt. Co. Proj.): | | | |
| Series 1993 C, 1.59% 4/5/18, VRDN (a) | | 6,550 | 6,550 |
| Series 1999 A, 1.6% 4/5/18, VRDN (a) | | 1,900 | 1,900 |
| | | | 8,450 |
| District Of Columbia - 0.1% | | | |
| FHLMC District of Columbia Hsg. Fin. Agcy. Multi-family Hsg. Rev. (Pentacle Apts. Proj.) Series 2008, 1.68% 4/5/18, LOC Freddie Mac, VRDN (a) | | 3,000 | 3,000 |
| Florida - 1.6% | | | |
| Dade County Indl. Dev. Auth. Rev. (Florida Pwr. & Lt. Co. Proj.) Series 1993, 1.74% 4/2/18, VRDN(a) | | 12,900 | 12,900 |
| Jacksonville Poll. Cont. Rev. (Florida Pwr. & Lt. Co. Proj.) Series 1995, 1.74% 4/2/18, VRDN(a) | | 3,200 | 3,200 |
| Martin County Poll. Cont. Rev. (Florida Pwr. & Lt. Co. Proj.) Series 2000, 1.7% 4/2/18, VRDN(a) | | 32,400 | 32,400 |
| Pinellas County Health Facilities Auth. Rev. (BayCare Health Sys. Proj.) Series 2009 A2, 1.6% 4/5/18, LOC Northern Trust Co., VRDN (a) | | 9,900 | 9,900 |
| Sunshine State Govt. Fing. Commission Rev. (Miami-Dade County Prog.) Series 2010 A, 1.61% 4/5/18, LOC MUFG Union Bank NA, VRDN (a) | | 12,300 | 12,300 |
| | | | 70,700 |
| Georgia - 2.5% | | | |
| Burke County Indl. Dev. Auth. Poll. Cont. Rev. (Georgia Pwr. Co. Plant Vogtle Proj.): | | | |
| Eighth Series 1994, 1.85% 4/2/18, VRDN(a) | | 3,800 | 3,800 |
| First Series 2009, 1.83% 4/2/18, VRDN(a) | | 20,425 | 20,425 |
| Second Series 1995, 1.84% 4/2/18, VRDN(a) | | 11,300 | 11,300 |
| Effingham County Indl. Dev. Auth. Poll Cont. 1.86% 4/2/18, VRDN(a) | | 6,370 | 6,370 |
| Heard County Dev. Auth. Poll. Cont. Rev. (Georgia Pwr. Co. Plant Wansley Proj.) First Series 1997, 1.84% 4/2/18, VRDN(a) | | 5,600 | 5,600 |
| Monroe County Dev. Auth. Poll. Cont. Rev. (Georgia Pwr. Co. Plant Scherer Proj.): | | | |
| Series 1997, 1.84% 4/2/18, VRDN(a) | | 9,000 | 9,000 |
| Series 2008, 1.84% 4/2/18, VRDN(a) | | 28,040 | 28,040 |
| Paulding County Hosp. Auth. Rev. Series 2012 B, 1.63% 4/5/18, LOC Bank of America NA, VRDN (a) | | 29,000 | 29,000 |
| | | | 113,535 |
| Illinois - 4.7% | | | |
| Chicago O'Hare Int'l. Arpt. Rev. Series 2005 C, 1.53% 4/5/18, LOC Bank of America NA, VRDN (a) | | 1,725 | 1,725 |
| Illinois Dev. Fin. Auth. Rev. (Var-Sinai Cmnty. Inst Proj.) Series 1997, 1.52% 4/5/18, LOC JPMorgan Chase Bank, VRDN (a) | | 5,000 | 5,000 |
| Illinois Fin. Auth. Rev.: | | | |
| (Edward Hosp. Obligated Group Proj.) Series 2008 B2, 1.53% 4/5/18, LOC JPMorgan Chase Bank, VRDN (a) | | 3,300 | 3,300 |
| (Little Co. of Mary Hosp. Proj.): | | | |
| Series 2008 A, 1.64% 4/5/18, LOC Barclays Bank PLC, VRDN (a) | | 18,425 | 18,425 |
| Series 2008 B, 1.64% 4/5/18, LOC Barclays Bank PLC, VRDN (a) | | 27,155 | 27,155 |
| (Northwest Cmnty. Hosp. Proj.) Series 2008 C, 1.62% 4/5/18, LOC JPMorgan Chase Bank, VRDN (a) | | 4,100 | 4,100 |
| (OSF Healthcare Sys. Proj.) Series 2009 C, 1.6% 4/5/18, LOC Wells Fargo Bank NA, VRDN (a) | | 8,900 | 8,900 |
| (The Carle Foundation Proj.): | | | |
| Series 2009 C, 1.64% 4/5/18, LOC Northern Trust Co., VRDN (a) | | 1,500 | 1,500 |
| Series 2009 E, 1.64% 4/5/18, LOC JPMorgan Chase Bank, VRDN (a) | | 8,900 | 8,900 |
| Illinois Toll Hwy. Auth. Toll Hwy. Rev.: | | | |
| Series 2007 A 1B, 1.63% 4/5/18, LOC Bank of America NA, VRDN (a) | | 4,225 | 4,225 |
| Series 2007 A 2B, 1.63% 4/5/18, LOC PNC Bank NA, VRDN (a) | | 34,100 | 34,100 |
| Series 2007 A 2C, 1.67% 4/5/18, LOC Landesbank Hessen-Thuringen, VRDN (a) | | 20,175 | 20,175 |
| Series 2007 A-2A, 1.64% 4/5/18, LOC Bank of Tokyo-Mitsubishi UFJ Ltd., VRDN (a) | | 21,140 | 21,140 |
| Series 2007 A1, 1.67% 4/5/18, LOC Landesbank Hessen-Thuringen, VRDN (a) | | 50,300 | 50,300 |
| | | | 208,945 |
| Indiana - 0.7% | | | |
| Indiana Dev. Fin. Auth. Econ. (Archer-Daniels-Midland Co. Proj.) Series 2012, 1.55% 4/5/18 (Archer Daniels Midland Co. Guaranteed), VRDN (a) | | 31,240 | 31,240 |
| Lawrenceburg Poll. Cont. Rev. (Indiana Michigan Pwr. Co. Proj.): | | | |
| Series H, 1.74% 4/5/18, VRDN (a) | | 1,200 | 1,200 |
| Series I, 1.74% 4/5/18, VRDN (a) | | 500 | 500 |
| | | | 32,940 |
| Iowa - 0.8% | | | |
| Iowa Fin. Auth. Midwestern (Archer-Daniels-Midland Co. Proj.) Series 2012, 1.55% 4/5/18 (Archer Daniels Midland Co. Guaranteed), VRDN (a) | | 20,000 | 20,000 |
| Iowa Fin. Auth. Midwestern Disaster Area Econ. Dev. Series 2012 A, 1.62% 4/5/18, VRDN (a) | | 13,800 | 13,800 |
| | | | 33,800 |
| Louisiana - 2.9% | | | |
| Louisiana Pub. Facilities Auth. Rev.: | | | |
| (Air Products & Chemicals, Inc. Proj.): | | | |
| Series 2004, 1.53% 4/5/18, VRDN (a) | | 11,000 | 11,000 |
| Series 2009 A, 1.53% 4/5/18, VRDN (a) | | 21,800 | 21,800 |
| (Christus Health Proj.) Series 2009 B1, 1.62% 4/5/18, LOC Bank of New York, New York, VRDN (a) | | 7,210 | 7,210 |
| Saint James Parish Gen. Oblig.: | | | |
| (Nucor Steel Louisiana LLC Proj.): | | | |
| Series 2010 A1, 1.8% 4/5/18, VRDN (a) | | 2,300 | 2,300 |
| Series 2010 B1, 1.8% 4/5/18, VRDN (a) | | 10,400 | 10,400 |
| (NuStar Logistics, L.P. Proj.): | | | |
| Series 2010 A, 1.62% 4/5/18, LOC Bank of Tokyo-Mitsubishi UFJ Ltd., VRDN (a) | | 15,700 | 15,700 |
| Series 2010 B, 1.62% 4/5/18, LOC Bank of Tokyo-Mitsubishi UFJ Ltd., VRDN (a) | | 24,200 | 24,200 |
| Series 2010, 1.62% 4/5/18, LOC Mizuho Bank Ltd., VRDN (a) | | 36,600 | 36,600 |
| | | | 129,210 |
| Maine - 0.8% | | | |
| Maine Health & Higher Ed. Facilities Auth. Rev. Series 2008 A, 1.62% 4/5/18, LOC JPMorgan Chase Bank, VRDN (a) | | 35,200 | 35,200 |
| Michigan - 0.1% | | | |
| Grand Traverse County Hosp. Series 2011 B, 1.67% 4/5/18, LOC JPMorgan Chase Bank, VRDN (a) | | 500 | 500 |
| Kent Hosp. Fin. Auth. Hosp. Facilities Rev. (Spectrum Health Sys. Proj.) Series 2008 C, 1.62% 4/5/18, LOC Bank of New York, New York, VRDN (a) | | 4,185 | 4,185 |
| | | | 4,685 |
| Mississippi - 0.4% | | | |
| Mississippi Dev. Bank Spl. Oblig. (Harrison County Proj.) Series 2008 A2, 1.67% 4/5/18, LOC Bank of America NA, VRDN (a) | | 15,550 | 15,550 |
| Nevada - 1.0% | | | |
| Clark County Indl. Dev. Rev. (Southwest Gas Corp. Proj.) Series 2009 A, 1.53% 4/5/18, LOC Bank of America NA, VRDN (a) | | 11,660 | 11,660 |
| Reno Cap. Impt. Rev. Series 2005 A, 1.63% 4/5/18, LOC Bank of America NA, VRDN (a) | | 25,045 | 25,045 |
| Reno Hosp. Rev. (Renown Reg'l. Med. Ctr. Proj.) Series 2008 B, 1.6% 4/5/18, LOC MUFG Union Bank NA, VRDN (a) | | 10,000 | 10,000 |
| | | | 46,705 |
| New York - 0.1% | | | |
| New York Hsg. Fin. Agcy. Rev. Series 2010 A: | | | |
| 1.58% 4/5/18, LOC Landesbank Hessen-Thuringen, VRDN (a) | | 2,000 | 2,000 |
| 1.58% 4/5/18, LOC Landesbank Hessen-Thuringen, VRDN (a) | | 1,900 | 1,900 |
| | | | 3,900 |
| North Carolina - 1.4% | | | |
| Lower Cape Fear Wtr. & Swr. Auth. Rev. (Bladen Bluffs Proj.) Series 2010, 1.63% 4/5/18, LOC Rabobank Nederland New York Branch, VRDN (a) | | 13,190 | 13,190 |
| Parson County Indl. Facilities and Poll. Cont. Fing. Auth. (CertainTeed Gypsum NC, Inc. Proj.) Series 2010, 1.67% 4/5/18, LOC Cr. Industriel et Commercial, VRDN (a) | | 49,950 | 49,950 |
| | | | 63,140 |
| Ohio - 1.0% | | | |
| Allen County Hosp. Facilities Rev. Series 2012 B, 1.55% 4/5/18, VRDN (a) | | 33,300 | 33,300 |
| Hamilton County Student Hsg. Rev. (Block 3 Proj.) Series 2004, 1.65% 4/5/18, LOC Bank of New York, New York, LOC Citizens Bank of Pennsylvania, VRDN (a) | | 13,075 | 13,075 |
| | | | 46,375 |
| Oregon - 0.3% | | | |
| Oregon Facilities Auth. Rev. (PeaceHealth Proj.) Series 2008 A, 1.6% 4/5/18, LOC U.S. Bank NA, Cincinnati, VRDN (a) | | 14,400 | 14,400 |
| Pennsylvania - 0.4% | | | |
| Crawford County Indl. Dev. Auth. College Rev. (Allegheny College Proj.) Series 2009 B, 1.64% 4/5/18, LOC PNC Bank NA, VRDN (a) | | 2,100 | 2,100 |
| Lancaster Indl. Dev. Auth. Rev.: | | | |
| (Mennonite Home Proj.) 1.46% 4/5/18, LOC Manufacturers & Traders Trust Co., VRDN (a) | | 505 | 505 |
| (Willow Valley Retirement Cmntys. Proj.) Series 2009 C, 1.64% 4/5/18, LOC PNC Bank NA, VRDN (a) | | 7,100 | 7,100 |
| Montgomery County Indl. Dev. Auth. Rev. (Foulkeways at Gwynedd Proj.) Series 2006 B, 1.65% 4/5/18, LOC Citizens Bank of Pennsylvania, VRDN (a) | | 9,800 | 9,800 |
| | | | 19,505 |
| Tennessee - 0.3% | | | |
| Clarksville Pub. Bldg. Auth. Rev. (Tennessee Muni. Bond Fund Proj.): | | | |
| Series 1994, 1.68% 4/5/18, LOC Bank of America NA, VRDN (a) | | 1,425 | 1,425 |
| Series 2005, 1.73% 4/2/18, LOC Bank of America NA, VRDN(a) | | 2,000 | 2,000 |
| Johnson City Health & Edl. Hosp. Rev. (Mountain States Health Alliance Proj.) Series 2011 B, 1.63% 4/5/18, LOC PNC Bank NA, VRDN (a) | | 4,150 | 4,150 |
| Montgomery County Pub. Bldg. Auth. Pooled Fing. Rev. (Tennessee County Ln. Pool Prog.) Series 1999, 1.68% 4/5/18, LOC Bank of America NA, VRDN (a) | | 4,720 | 4,720 |
| | | | 12,295 |
| Texas - 1.5% | | | |
| Harris County Cultural Ed. Facilities Fin. Corp. Rev.: | | | |
| Series 2014 D, 1.6% 4/5/18, VRDN (a) | | 4,000 | 4,000 |
| Series 2016 E, 1.6% 4/5/18, VRDN (a) | | 16,800 | 16,800 |
| Harris County Health Facilities Dev. Corp. Rev. (Saint Dominic Village Proj.) Series 2000, 1.69% 4/5/18, LOC JPMorgan Chase Bank, VRDN (a) | | 4,925 | 4,925 |
| Harris County Hosp. District Rev. Series 2010, 1.62% 4/5/18, LOC JPMorgan Chase Bank, VRDN (a) | | 1,980 | 1,980 |
| Houston Arpt. Sys. Rev. Series 2010, 1.62% 4/5/18, LOC Barclays Bank PLC, VRDN (a) | | 29,635 | 29,635 |
| Port Arthur Navigation District Exempt Facilities (Var-Total Petrochemicals Proj.) Series 2009, 1.66% 4/5/18 (Total SA Guaranteed), VRDN (a) | | 400 | 400 |
| Port Arthur Navigation District Indl. Dev. Corp. Exempt Facilities Rev.: | | | |
| (Air Products Proj.) Series 2012, 1.66% 4/5/18 (Total SA Guaranteed), VRDN (a) | | 1,600 | 1,600 |
| (Total Petrochemicals & Refining U.S.A., Inc. Proj.) Series 2012 B, 1.66% 4/5/18 (Total SA Guaranteed), VRDN (a) | | 900 | 900 |
| (Total Petrochemicals and Refining U.S.A., Inc. Proj.) Series 2012 A, 1.66% 4/5/18 (Total SA Guaranteed), VRDN (a) | | 4,100 | 4,100 |
| Tarrant County Cultural Ed. Facilities Fin. Corp. Rev. (Christus Health Proj.) Series 2008 C2, 1.62% 4/5/18, LOC Bank of New York, New York, VRDN (a) | | 4,700 | 4,700 |
| | | | 69,040 |
| Utah - 0.3% | | | |
| Emery County Poll. Cont. Rev. (PacifiCorp Proj.) Series 1994, 1.64% 4/5/18, LOC Canadian Imperial Bank of Commerce, VRDN (a) | | 12,880 | 12,880 |
| Virginia - 0.0% | | | |
| Newport News Indl. Dev. Auth. (CNU Warwick LLC Student Apts. Proj.) 1.69% 4/5/18, LOC Bank of America NA, VRDN (a) | | 485 | 485 |
| Washington - 0.7% | | | |
| King County Swr. Rev. Series 2001 A, 1.5% 4/5/18, LOC Landesbank Hessen-Thuringen, VRDN (a) | | 4,000 | 4,000 |
| FHLMC Washington Hsg. Fin. Commission Multi-family Hsg. Rev.: | | | |
| (Discovery Heights Apt. Proj.) Series 2010, 1.64% 4/5/18, LOC Freddie Mac, VRDN (a) | | 23,090 | 23,090 |
| (Willow Tree Grove Apts. Proj.) Series 2011, 1.65% 4/5/18, LOC Freddie Mac, VRDN (a) | | 5,070 | 5,070 |
| | | | 32,160 |
| West Virginia - 0.1% | | | |
| West Virginia Hosp. Fin. Auth. Hosp. Rev. Series A, 1.59% 4/5/18, LOC Branch Banking & Trust Co., VRDN (a) | | 4,400 | 4,400 |
| Wisconsin - 0.2% | | | |
| Wisconsin Health & Edl. Facilities Auth. Rev. (Aurora Health Care, Inc. Proj.) Series 1999 C, 1.65% 4/5/18, LOC JPMorgan Chase Bank, VRDN (a) | | 8,590 | 8,590 |
| Wyoming - 0.1% | | | |
| Converse County Poll. Cont. Rev.: | | | |
| (PacifiCorp Proj.) Series 1994, 1.6% 4/5/18, VRDN (a) | | 1,400 | 1,400 |
| (Pacificorp Projs.) Series 1992, 1.71% 4/5/18, VRDN (a) | | 1,000 | 1,000 |
| Lincoln County Poll. Cont. Rev. (PacifiCorp Proj.) Series 1994, 1.6% 4/5/18, VRDN (a) | | 600 | 600 |
| Sweetwater County Poll. Cont. Rev. (PacifiCorp Proj.) Series 1992 A, 1.71% 4/5/18, VRDN (a) | | 2,200 | 2,200 |
| | | | 5,200 |
| TOTAL VARIABLE RATE DEMAND NOTE | | | |
| (Cost $1,292,569) | | | 1,292,569 |
|
| Tender Option Bond - 35.3% | | | |
| Alabama - 0.1% | | | |
| Alabama Spl. Care Facilities Fing. Auth. Birmingham Rev. Participating VRDN Series 16 ZM0206, 1.61% 4/5/18 (Liquidity Facility Morgan Stanley Bank, West Valley City Utah) (a)(d) | | 6,975 | 6,975 |
| Arizona - 1.5% | | | |
| Arizona Board of Regents Arizona State Univ. Rev. Participating VRDN Series 33 85X, 1.61% 4/5/18 (Liquidity Facility Morgan Stanley Bank, West Valley City Utah) (a)(d) | | 1,000 | 1,000 |
| Arizona Tourism & Sports Auth. Tax Rev. Participating VRDN Series Floaters E85, 1.61% 4/5/18 (Liquidity Facility Royal Bank of Canada) (a)(d) | | 17,200 | 17,200 |
| Maricopa County Indl. Dev. Auth. Rev. Participating VRDN: | | | |
| Series Floaters XF 05 19, 1.61% 4/5/18 (Liquidity Facility JPMorgan Chase Bank) (a)(d) | | 4,000 | 4,000 |
| Series Floaters YX 10 32, 1.6% 4/5/18 (Liquidity Facility Barclays Bank PLC) (a)(d) | | 16,350 | 16,350 |
| Mesa Util. Sys. Rev. Bonds Series Solar 17 0026, SIFMA Municipal Swap Index + 0.050% 1.63%, tender 4/5/18 (Liquidity Facility U.S. Bank NA, Cincinnati) (a)(d)(e) | | 1,120 | 1,120 |
| Phoenix Civic Impt. Corp. Wtr. Sys. Rev. Participating VRDN Series Floaters XM 04 20, 1.61% 4/5/18 (Liquidity Facility JPMorgan Chase Bank) (a)(d) | | 8,200 | 8,200 |
| Rowan Univ. Participating VRDN Series 2016 XF 2337, 1.62% 4/5/18 (Liquidity Facility Barclays Bank PLC) (a)(d) | | 2,720 | 2,720 |
| Salt River Proj. Agricultural Impt. & Pwr. District Elec. Sys. Rev. Participating VRDN: | | | |
| Series 16 XM 02 45, 1.61% 4/5/18 (Liquidity Facility JPMorgan Chase Bank) (a)(d) | | 10,000 | 10,000 |
| Series 2016 22, SIFMA Municipal Swap Index + 0.050% 1.6% 4/5/18 (Liquidity Facility U.S. Bank NA, Cincinnati) (a)(d)(e) | | 4,995 | 4,995 |
| | | | 65,585 |
| California - 0.8% | | | |
| California Gen. Oblig. Participating VRDN Series DB XF 1041, 1.62% 4/5/18 (Liquidity Facility Deutsche Bank AG New York Branch) (a)(d) | | 8,400 | 8,400 |
| California Health Facilities Fing. Auth. Participating VRDN Series 16 XG 00 49, 1.62% 4/5/18 (Liquidity Facility Deutsche Bank AG New York Branch) (a)(d) | | 17,575 | 17,575 |
| Dignity Health Participating VRDN Series 17 04, SIFMA Municipal Swap Index + 0.160% 1.74% 5/10/18 (Liquidity Facility Barclays Bank PLC) (a)(d)(e)(f) | | 1,790 | 1,790 |
| Los Angeles Hbr. Dept. Rev. Bonds Series WF 10 40C, SIFMA Municipal Swap Index + 0.280% 1.86%, tender 7/26/18 (Liquidity Facility Wells Fargo Bank NA) (a)(d)(e)(f) | | 1,400 | 1,400 |
| Rancho Wtr. District Fing. Auth. Rev. Participating VRDN Series 16 ZF0342, 1.61% 4/5/18 (Liquidity Facility Bank of America NA) (a)(d) | | 4,980 | 4,980 |
| | | | 34,145 |
| Colorado - 1.5% | | | |
| Children's Hosp. Assoc., Co. Participating VRDN Series Floaters XF 23 05, 1.62% 4/5/18 (Liquidity Facility Barclays Bank PLC) (a)(d) | | 745 | 745 |
| Colorado Health Facilities Auth. Rev. Participating VRDN: | | | |
| Series Floaters XF 22 41, 1.68% 4/5/18 (Liquidity Facility Citibank NA) (a)(d) | | 1,200 | 1,200 |
| Series ZF 04 17, 1.7% 4/5/18 (Liquidity Facility JPMorgan Chase Bank) (a)(d) | | 300 | 300 |
| Colorado Hsg. & Fin. Auth. Participating VRDN Series 2018 E-112, 1.63% 4/5/18 (Liquidity Facility Royal Bank of Canada) (a)(d) | | 3,000 | 3,000 |
| Colorado Reg'l. Trans. District Sales Tax Rev. Participating VRDN Series Floaters 16 XF1031, 1.63% 4/5/18 (Liquidity Facility Deutsche Bank AG New York Branch) (a)(d) | | 2,500 | 2,500 |
| Colorado State Univ. Board of Governors Enterprise Sys. Rev. Participating VRDN Series Floaters XF 25 13, 1.61% 4/5/18 (Liquidity Facility Morgan Stanley Bank, West Valley City Utah) (a)(d) | | 7,500 | 7,500 |
| Colorado Univ. Co. Hosp. Auth. Rev. Participating VRDN Series EGL 17 0002, 1.62% 4/5/18 (Liquidity Facility Citibank NA) (a)(d) | | 4,900 | 4,900 |
| Denver City & County Arpt. Rev. Participating VRDN Series Floaters XF 10 36, 1.64% 4/5/18 (Liquidity Facility Deutsche Bank AG New York Branch) (a)(d) | | 1,550 | 1,550 |
| Denver City & County Board Wtr. Rev. Bonds Series Solar 17 0032, SIFMA Municipal Swap Index + 0.150% 1.73%, tender 6/7/18 (Liquidity Facility U.S. Bank NA, Cincinnati) (a)(d)(e) | | 900 | 900 |
| Univ. of Colorado Enterprise Sys. Rev.: | | | |
| Bonds Series Solar 0065, 1.73%, tender 6/21/18 (Liquidity Facility U.S. Bank NA, Cincinnati) (a)(d) | | 2,200 | 2,200 |
| Participating VRDN Series Floaters XM 03 85, 1.61% 4/5/18 (Liquidity Facility JPMorgan Chase Bank) (a)(d) | | 1,850 | 1,850 |
| Participating VRDN: | | | |
| Series RBC E 55, SIFMA Municipal Swap Index + 0.030% 1.61% 4/5/18 (Liquidity Facility Royal Bank of Canada) (a)(d)(e) | | 32,950 | 32,950 |
| Series XM 03 05, 1.61% 4/5/18 (Liquidity Facility Royal Bank of Canada) (a)(d) | | 6,300 | 6,300 |
| | | | 65,895 |
| Connecticut - 1.3% | | | |
| Connecticut Gen. Oblig. Participating VRDN: | | | |
| Series 2017, 1.64% 4/5/18 (Liquidity Facility Barclays Bank PLC) (a)(c)(d) | | 3,575 | 3,575 |
| Series Floaters 014, 1.76% 5/10/18 (Liquidity Facility Barclays Bank PLC) (a)(d)(f) | | 5,800 | 5,800 |
| Series Floaters 016, SIFMA Municipal Swap Index + 0.040% 1.64% 4/5/18 (Liquidity Facility Barclays Bank PLC) (a)(d)(e) | | 45,250 | 45,250 |
| Connecticut Spl. Tax Oblig. Trans. Infrastructure Rev. Participating VRDN Series Floaters YX 10 77, 1.64% 4/5/18 (Liquidity Facility Barclays Bank PLC) (a)(d) | | 1,000 | 1,000 |
| State of Connecticut Gen. Oblig. Bonds Participating VRDN Series XM 03 39, 1.64% 4/5/18 (Liquidity Facility JPMorgan Chase Bank) (a)(d) | | 1,400 | 1,400 |
| | | | 57,025 |
| District Of Columbia - 1.2% | | | |
| Children's Nat'l. Med. Ctr., Participating VRDN Series 2015 XF 1047, 1.65% 4/5/18 (Liquidity Facility Deutsche Bank AG New York Branch) (a)(d) | | 1,200 | 1,200 |
| District of Columbia Gen. Oblig.: | | | |
| Bonds Series Solar 0035, SIFMA Municipal Swap Index + 0.150% 1.73%, tender 5/31/18 (Liquidity Facility U.S. Bank NA, Cincinnati) (a)(d)(e) | | 525 | 525 |
| Participating VRDN: | | | |
| Series Floaters E 108, 1.61% 4/5/18 (Liquidity Facility Royal Bank of Canada) (a)(d) | | 8,995 | 8,995 |
| Series Floaters E 109, 1.61% 4/5/18 (Liquidity Facility Royal Bank of Canada) (a)(d) | | 6,700 | 6,700 |
| Series Floaters YX 10 39, 1.61% 4/5/18 (Liquidity Facility Barclays Bank PLC) (a)(d) | | 6,655 | 6,655 |
| District of Columbia Income Tax Rev. Participating VRDN: | | | |
| Series Floaters XM 04 12, 1.61% 4/5/18 (Liquidity Facility JPMorgan Chase Bank) (a)(d) | | 7,755 | 7,755 |
| Series Floaters XM 04 37, 1.61% 4/5/18 (Liquidity Facility Barclays Bank PLC) (a)(d) | | 18,700 | 18,700 |
| Series XF 23 41, 1.62% 4/5/18 (Liquidity Facility Barclays Bank PLC) (a)(d) | | 1,385 | 1,385 |
| | | | 51,915 |
| Florida - 2.0% | | | |
| Cape Coral Wtr. & Swr. Rev. Participating VRDN Series Floaters YX 10 71, 1.62% 4/5/18 (Liquidity Facility Barclays Bank PLC) (a)(d) | | 4,900 | 4,900 |
| Central Fla Expwy Auth. Rev.: | | | |
| Bonds Series Floaters E 62, SIFMA Municipal Swap Index + 0.170% 1.75%, tender 7/2/18 (Liquidity Facility Royal Bank of Canada) (a)(d)(e)(f) | | 16,995 | 16,995 |
| Participating VRDN Series Floaters 004, 1.76% 5/10/18 (Liquidity Facility Barclays Bank PLC) (a)(d)(f) | | 16,100 | 16,100 |
| Florida Board of Ed. Pub. Ed. Cap. Outlay Bonds: | | | |
| Series Solar 0049, 1.73%, tender 6/14/18 (Liquidity Facility U.S. Bank NA, Cincinnati) (a)(d) | | 800 | 800 |
| Series Solar 0054, 1.73%, tender 6/21/18 (Liquidity Facility U.S. Bank NA, Cincinnati) (a)(d) | | 600 | 600 |
| Florida Dept. of Trans. Tpk. Rev. Participating VRDN Series Solar 17 02, SIFMA Municipal Swap Index + 0.050% 1.61% 4/5/18 (Liquidity Facility U.S. Bank NA, Cincinnati) (a)(d)(e) | | 3,695 | 3,695 |
| Florida Gen. Oblig. Bonds: | | | |
| Series Solar 042, SIFMA Municipal Swap Index + 0.050% 1.73%, tender 6/14/18 (Liquidity Facility U.S. Bank NA, Cincinnati) (a)(d)(e) | | 1,990 | 1,990 |
| Series Solar 2017 37, SIFMA Municipal Swap Index + 0.050% 1.63%, tender 4/5/18 (Liquidity Facility U.S. Bank NA, Cincinnati) (a)(d)(e) | | 1,100 | 1,100 |
| Gainesville Utils. Sys. Rev. Bonds Series Solar 0061, 1.73%, tender 5/10/18 (Liquidity Facility U.S. Bank NA, Cincinnati) (a)(d) | | 4,800 | 4,800 |
| Miami Beach Resort Tax Rev. Participating VRDN Series 15 XF0260, 1.62% 4/5/18 (Liquidity Facility Toronto-Dominion Bank) (a)(d) | | 7,660 | 7,660 |
| Miami-Dade County Aviation Rev. Participating VRDN Series XG 00 65 1.64% 4/5/18 (Liquidity Facility Deutsche Bank AG New York Branch) (a)(d) | | 1,400 | 1,400 |
| Miami-Dade County Expressway Auth. Participating VRDN Series XG 00 99, 1.64% 4/5/18 (Liquidity Facility Deutsche Bank AG New York Branch) (a)(d) | | 1,300 | 1,300 |
| Miami-Dade County Gen. Oblig. Participating VRDN: | | | |
| Series Floaters E 70, SIFMA Municipal Swap Index + 0.170% 1.61% 4/5/18 (Liquidity Facility Royal Bank of Canada) (a)(d)(e) | | 10,735 | 10,735 |
| Series XM 04 70, 1.61% 4/5/18 (Liquidity Facility JPMorgan Chase Bank) (a)(d) | | 10,530 | 10,530 |
| Palm Beach County School Board Ctfs. of Prtn. Participating VRDN Series 2017 01, 1.62% 4/5/18 (Liquidity Facility Citibank NA) (a)(d) | | 1,100 | 1,100 |
| Palm Beach County Solid Waste Auth. Rev. Participating VRDN Series ROC II 14003, 1.61% 4/5/18 (Liquidity Facility Citibank NA) (a)(d) | | 1,670 | 1,670 |
| Tampa Health Sys. Rev. Participating VRDN Series 16 XF2214, 1.61% 4/5/18 (Liquidity Facility Citibank NA) (a)(d) | | 4,800 | 4,800 |
| | | | 90,175 |
| Georgia - 0.5% | | | |
| Burke County Indl. Dev. Auth. Poll. Cont. Rev. Participating VRDN Series Floaters E 107, 1.64% 4/5/18 (Liquidity Facility Royal Bank of Canada) (a)(d) | | 4,500 | 4,500 |
| Clarke County Hosp. Auth. Participating VRDN Series 2017 ZF 2413, 1.63% 4/5/18 (Liquidity Facility Barclays Bank PLC) (a)(d) | | 900 | 900 |
| Metropolitan Atlanta Rapid Transit Auth. Sales Tax Rev. Bonds Series Solar 0047, SIFMA Municipal Swap Index + 0.150% 1.73%, tender 5/17/18 (Liquidity Facility U.S. Bank NA, Cincinnati) (a)(d)(e) | | 1,700 | 1,700 |
| Private Colleges & Univs. Auth. Rev. Participating VRDN Series Floaters ZM 01 52, 1.61% 4/5/18 (Liquidity Facility Morgan Stanley Bank, West Valley City Utah) (a)(d) | | 7,470 | 7,470 |
| Private Colleges & Univs. Auth. Rev. Emory Univ. Participating VRDN Series Floaters 16 XF0517, 1.62% 4/5/18 (Liquidity Facility Royal Bank of Canada) (a)(d) | | 7,500 | 7,500 |
| | | | 22,070 |
| Hawaii - 0.3% | | | |
| Hawaii Gen. Oblig.: | | | |
| Bonds Series Solar 17 0031, SIFMA Municipal Swap Index + 0.050% 1.63%, tender 4/5/18 (Liquidity Facility U.S. Bank NA, Cincinnati) (a)(d)(e) | | 995 | 995 |
| Participating VRDN Series Floaters XM 04 29, 1.61% 4/5/18 (Liquidity Facility JPMorgan Chase Bank) (a)(d) | | 6,665 | 6,665 |
| Honolulu City & County Gen. Oblig. Participating VRDN Series 2016, SIFMA Municipal Swap Index + 0.050% 1.61% 4/5/18 (Liquidity Facility U.S. Bank NA, Cincinnati) (a)(d)(e) | | 6,550 | 6,550 |
| | | | 14,210 |
| Illinois - 3.9% | | | |
| Chicago Board of Ed. Participating VRDN: | | | |
| Series Floaters 003, 1.83% 5/10/18 (Liquidity Facility Barclays Bank PLC) (a)(d)(f) | | 19,600 | 19,600 |
| Series Floaters 006, 1.83% 5/10/18 (Liquidity Facility Barclays Bank PLC) (a)(d)(f) | | 12,900 | 12,900 |
| Chicago Transit Auth. Participating VRDN Series Floaters XM 04 50, 1.62% 4/5/18 (Liquidity Facility Barclays Bank PLC) (a)(d) | | 9,635 | 9,635 |
| City of Chicago Gen. Oblig. Bonds Participating VRDN Series XF 23 42, 1.73% 4/5/18 (Liquidity Facility Barclays Bank PLC) (a)(d) | | 100 | 100 |
| Cook County Ill Sales Tax Rev. Participating VRDN Series Floaters XF 25 01, 1.64% 4/5/18 (Liquidity Facility Citibank NA) (a)(d) | | 1,600 | 1,600 |
| Illinois Fin. Auth. Rev. Participating VRDN: | | | |
| Series 15 XM0050, 1.61% 4/5/18 (Liquidity Facility Citibank NA) (a)(d) | | 3,500 | 3,500 |
| Series 17 XM 0492, 1.61% 4/5/18 (Liquidity Facility JPMorgan Chase Bank) (a)(d) | | 5,250 | 5,250 |
| Series Floaters XF 25 00, 1.64% 4/5/18 (Liquidity Facility Citibank NA) (a)(d) | | 1,400 | 1,400 |
| Series Floaters XF 25 35, 1.61% 4/5/18 (Liquidity Facility Barclays Bank PLC) (a)(d) | | 3,200 | 3,200 |
| Series Floaters XG 01 22, 1.61% 4/5/18 (Liquidity Facility Barclays Bank PLC) (a)(d) | | 7,335 | 7,335 |
| Series Floaters XM 05 19, 1.61% 4/5/18 (Liquidity Facility JPMorgan Chase Bank) (a)(d) | | 5,000 | 5,000 |
| Series MS 3332, 1.61% 4/5/18 (Liquidity Facility Morgan Stanley Bank, West Valley City Utah) (a)(d) | | 400 | 400 |
| Series Putters 0022, 1.61% 4/5/18 (Liquidity Facility JPMorgan Chase Bank) (a)(d) | | 3,795 | 3,795 |
| Series XF 23 38, 1.62% 4/5/18 (Liquidity Facility Barclays Bank PLC) (a)(d) | | 2,975 | 2,975 |
| Series XL 00 21, 1.6% 4/5/18 (Liquidity Facility Barclays Bank PLC) (a)(d) | | 3,950 | 3,950 |
| Series ZF 04 78, 1.61% 4/5/18 (Liquidity Facility JPMorgan Chase Bank) (a)(d) | | 10,425 | 10,425 |
| Illinois Gen. Oblig. Participating VRDN: | | | |
| Series Floaters E97, 1.63% 4/5/18 (Liquidity Facility Royal Bank of Canada) (a)(d) | | 8,600 | 8,600 |
| Series Floaters XL 00 54, 1.64% 4/5/18 (Liquidity Facility Barclays Bank PLC) (a)(d) | | 10,400 | 10,400 |
| Series Floaters XX 10 81, 1.64% 4/5/18 (Liquidity Facility Barclays Bank PLC) (a)(d) | | 5,300 | 5,300 |
| Series Floaters YX 10 72, 1.64% 4/5/18 (Liquidity Facility Barclays Bank PLC) (a)(d) | | 9,510 | 9,510 |
| Illinois Sales Tax Rev. Participating VRDN Series XF 24 06, 1.62% 4/5/18 (Liquidity Facility Barclays Bank PLC) (a)(d) | | 1,500 | 1,500 |
| Illinois Toll Hwy. Auth. Toll Hwy. Rev. Participating VRDN: | | | |
| Series 15 XF0277, 1.66% 4/5/18 (Liquidity Facility JPMorgan Chase Bank) (a)(d) | | 1,500 | 1,500 |
| Series 15 XF2202, 1.61% 4/5/18 (Liquidity Facility Citibank NA) (a)(d) | | 1,150 | 1,150 |
| Series 15 XM 0078, 1.63% 4/5/18 (Liquidity Facility Royal Bank of Canada) (a)(d) | | 5,180 | 5,180 |
| Series Floaters E100, 1.61% 4/5/18 (Liquidity Facility Royal Bank of Canada)(a)(d) | | 21,425 | 21,425 |
| Series Floaters XL 00 41, 1.61% 4/5/18 (Liquidity Facility Morgan Stanley Bank, West Valley City Utah) (a)(d) | | 10,040 | 10,040 |
| Series XF 23 98, 1.61% 4/5/18 (Liquidity Facility Citibank NA) (a)(d) | | 2,780 | 2,780 |
| Series ZF 24 03, 1.61% 4/5/18 (Liquidity Facility Citibank NA) (a)(d) | | 6,665 | 6,665 |
| Series ZF 24 04, 1.61% 4/5/18 (Liquidity Facility Citibank NA) (a)(d) | | 1,635 | 1,635 |
| Will Cnty. Gen. Oblig. Participating VRDN Series Floaters ZF 05 11, 1.64% 4/5/18 (Liquidity Facility Toronto-Dominion Bank) (a)(d) | | 500 | 500 |
| | | | 177,250 |
| Indiana - 0.9% | | | |
| Hamilton County HealthCare Facilities Rev. Participating VRDN Series XF 10 26, 1.65% 4/5/18 (Liquidity Facility Deutsche Bank AG New York Branch) (a)(d) | | 3,500 | 3,500 |
| Indiana Univ. HealthCare Bonds Series 16 E71, SIFMA Municipal Swap Index + 0.170% 1.75%, tender 5/1/18 (Liquidity Facility Royal Bank of Canada) (a)(d)(e)(f) | | 35,300 | 35,300 |
| | | | 38,800 |
| Iowa - 0.4% | | | |
| Iowa Fin. Auth. Rev. Participating VRDN Series Floaters 007, 1.61% 4/5/18 (Liquidity Facility Barclays Bank PLC) (a)(d) | | 18,500 | 18,500 |
| Kansas - 0.1% | | | |
| Univ. of Kansas Hosp. Auth. Health Facilities Rev. Participating VRDN: | | | |
| Series Floaters XF 25 43, 1.61% 4/5/18 (Liquidity Facility Citibank NA) (a)(d) | | 4,035 | 4,035 |
| Series XF 10 51, 1.63% 4/5/18 (Liquidity Facility Deutsche Bank AG New York Branch) (a)(d) | | 2,300 | 2,300 |
| | | | 6,335 |
| Kentucky - 0.3% | | | |
| Kentucky Econ. Dev. Fin. Auth. Participating VRDN Series Floaters XF 24 85, 1.64% 4/5/18 (Liquidity Facility Citibank NA) (a)(d) | | 11,400 | 11,400 |
| Kentucky Econ. Dev. Fin. Auth. Hosp. Rev. Participating VRDN Series Floaters XG 01 23, 1.62% 4/5/18 (Liquidity Facility Barclays Bank PLC) (a)(d) | | 1,900 | 1,900 |
| | | | 13,300 |
| Louisiana - 0.4% | | | |
| Louisiana Gas & Fuel Tax Rev. Participating VRDN: | | | |
| Series EGL 14 0049, 1.63% 4/5/18 (Liquidity Facility Citibank NA) (a)(d) | | 10,100 | 10,100 |
| Series Floaters XF 24 91, 1.61% 4/5/18 (Liquidity Facility Citibank NA) (a)(d) | | 3,400 | 3,400 |
| Series Floaters XG 01 50, 1.61% 4/5/18 (Liquidity Facility Citibank NA) (a)(d) | | 2,200 | 2,200 |
| Louisiana Local Govt. Envir. Facilities Participating VRDN Series 2016 XF 2336, 1.62% 4/5/18 (Liquidity Facility Barclays Bank PLC) (a)(d) | | 3,560 | 3,560 |
| | | | 19,260 |
| Maryland - 0.4% | | | |
| Baltimore County Gen. Oblig. Participating VRDN Series Solar 17 22, SIFMA Municipal Swap Index + 0.050% 1.6% 4/5/18 (Liquidity Facility U.S. Bank NA, Cincinnati) (a)(d)(e) | | 11,900 | 11,900 |
| Maryland Health & Higher Ed. Facilities Auth. Rev. Participating VRDN Series XF 10 21, 1.66% 4/5/18 (Liquidity Facility Deutsche Bank AG New York Branch) (a)(d) | | 3,600 | 3,600 |
| Montgomery County Gen. Oblig. Participating VRDN Series 2017 ZF 2416, 1.61% 4/5/18 (Liquidity Facility Barclays Bank PLC) (a)(d) | | 3,750 | 3,750 |
| | | | 19,250 |
| Massachusetts - 0.2% | | | |
| Massachusetts Gen. Oblig. Bonds: | | | |
| Series Clipper 09 67, SIFMA Municipal Swap Index + 0.050% 1.63%, tender 4/5/18 (Liquidity Facility State Street Bank & Trust Co., Boston) (a)(d)(e) | | 6,200 | 6,200 |
| Series Clipper 09 69, SIFMA Municipal Swap Index + 0.180% 1.76%, tender 6/7/18 (Liquidity Facility State Street Bank & Trust Co., Boston) (a)(d)(e)(f) | | 1,175 | 1,175 |
| | | | 7,375 |
| Michigan - 1.2% | | | |
| Eastern Michigan Univ. Revs. Participating VRDN Series Floaters 17 012, 1.63% 4/5/18 (Liquidity Facility Barclays Bank PLC) (a)(d) | | 6,200 | 6,200 |
| Michigan Bldg. Auth. Rev. Participating VRDN: | | | |
| Series Floaters XM 03 92, 1.61% 4/5/18 (Liquidity Facility Morgan Stanley Bank, West Valley City Utah) (a)(d) | | 300 | 300 |
| Series Floaters XM 04 65, 1.61% 4/5/18 (Liquidity Facility Morgan Stanley Bank, West Valley City Utah) (a)(d) | | 5,535 | 5,535 |
| Michigan Fin. Auth. Rev. Participating VRDN: | | | |
| Series 15 XF0126, 1.63% 4/5/18 (Liquidity Facility JPMorgan Chase Bank) (a)(d) | | 4,500 | 4,500 |
| Series 16 XM0223, 1.61% 4/5/18 (Liquidity Facility Citibank NA) (a)(d) | | 3,000 | 3,000 |
| Series Floaters XF 05 95, 1.41% 4/5/18 (Liquidity Facility Bank of America NA) (a)(d) | | 1,700 | 1,700 |
| Series Floaters XF 05 96, 1.61% 4/5/18 (Liquidity Facility JPMorgan Chase Bank) (a)(d) | | 3,775 | 3,775 |
| Series Floaters XG 01 58, 1.41% 4/5/18 (Liquidity Facility Bank of America NA) (a)(d) | | 1,900 | 1,900 |
| Series XX 1043, 1.61% 4/5/18 (Liquidity Facility Barclays Bank PLC) (a)(c)(d) | | 2,110 | 2,110 |
| Michigan St Hsg. Dev. Auth. Singl Participating VRDN: | | | |
| Series Floaters 008, 1.61% 4/5/18 (Liquidity Facility Barclays Bank PLC) (a)(d) | | 11,230 | 11,230 |
| Series Floaters 017, 1.61% 4/5/18 (Liquidity Facility Barclays Bank PLC) (a)(d) | | 9,850 | 9,850 |
| Univ. of Michigan Rev. Participating VRDN Series Floaters ZF 05 90, 1.61% 4/5/18 (Liquidity Facility Toronto-Dominion Bank) (a)(d) | | 2,365 | 2,365 |
| | | | 52,465 |
| Minnesota - 0.1% | | | |
| Minnesota State Gen. Fdg. Rev. Participating VRDN Series 15 ZF0175, 1.61% 4/5/18 (Liquidity Facility JPMorgan Chase Bank) (a)(d) | | 3,335 | 3,335 |
| Missouri - 0.3% | | | |
| Missouri Health & Edl. Facilities Auth. Edl. Facilities Rev. Participating VRDN Series Floaters XG 01 57, 1.62% 4/5/18 (Liquidity Facility Barclays Bank PLC)(a)(d) | | 5,575 | 5,575 |
| Missouri St Hefa Edl. Facilities Rev. Participating VRDN: | | | |
| Series Floaters 17 010, 1.63% 4/5/18 (Liquidity Facility Barclays Bank PLC) (a)(d) | | 4,800 | 4,800 |
| Series Floaters XM 05 75, 1.61% 4/5/18 (Liquidity Facility Royal Bank of Canada) (a)(d) | | 3,800 | 3,800 |
| | | | 14,175 |
| Montana - 0.3% | | | |
| Missoula Mont Wtr. Sys. Rev. Participating VRDN Series Floaters 011, 1.76% 5/10/18 (Liquidity Facility Barclays Bank PLC) (a)(d)(f) | | 12,300 | 12,300 |
| Nebraska - 0.5% | | | |
| Douglas County School District #1: | | | |
| Bonds Series Solar 0059, SIFMA Municipal Swap Index + 0.050% 1.63%, tender 4/5/18 (Liquidity Facility U.S. Bank NA, Cincinnati) (a)(d)(e) | | 1,640 | 1,640 |
| Participating VRDN Series Solar 00 27, SIFMA Municipal Swap Index + 0.150% 1.6% 4/5/18 (Liquidity Facility U.S. Bank NA, Cincinnati) (a)(d)(e) | | 16,900 | 16,900 |
| Omaha Pub. Pwr. District Elec. Rev. Participating VRDN: | | | |
| Series 16 XF1053, 1.65% 4/5/18 (Liquidity Facility Deutsche Bank AG New York Branch) (a)(d) | | 2,600 | 2,600 |
| Series Floaters XX 10 04, 1.63% 4/5/18 (Liquidity Facility Barclays Bank PLC) (a)(d) | | 1,800 | 1,800 |
| | | | 22,940 |
| Nevada - 0.5% | | | |
| Clark County Fuel Tax: | | | |
| Bonds: | | | |
| Series Solar 0068, 1.63%, tender 4/5/18 (Liquidity Facility U.S. Bank NA, Cincinnati) (a)(d) | | 1,300 | 1,300 |
| Series Solar 17 25, SIFMA Municipal Swap Index + 0.150% 1.73%, tender 6/21/18 (Liquidity Facility U.S. Bank NA, Cincinnati) (a)(d)(e) | | 995 | 995 |
| Participating VRDN ROC II R 11836, 1.61% 4/5/18 (Liquidity Facility Citibank NA) (a)(d) | | 3,450 | 3,450 |
| Clark County Wtr. Reclamation District Participating VRDN: | | | |
| Series 16 ZF0446, 1.61% 4/5/18 (Liquidity Facility JPMorgan Chase Bank) (a)(d) | | 11,965 | 11,965 |
| Series ZF 04 79, 1.61% 4/5/18 (Liquidity Facility JPMorgan Chase Bank) (a)(d) | | 4,600 | 4,600 |
| Las Vegas Valley Wtr. District Wtr. Impt. Gen. Oblig. Participating VRDN Series 16 ZF0382, 1.62% 4/5/18 (Liquidity Facility Toronto-Dominion Bank) (a)(d) | | 2,185 | 2,185 |
| | | | 24,495 |
| New Hampshire - 0.1% | | | |
| New Hampshire Health and Ed. Facilities Auth. Rev. Participating VRDN Series Floaters 16 025, 1.61% 4/5/18 (Liquidity Facility Barclays Bank PLC) (a)(d) | | 4,412 | 4,412 |
| New Jersey - 1.8% | | | |
| New Jersey Econ. Dev. Auth. Lease Rev. Participating VRDN Series Floaters E102, 1.61% 4/5/18 (Liquidity Facility Royal Bank of Canada) (a)(d) | | 34,495 | 34,495 |
| New Jersey Econ. Dev. Auth. Rev. Participating VRDN Series Floaters XL 00 52, 1.61% 4/5/18 (Liquidity Facility Barclays Bank PLC) (a)(d) | | 1,500 | 1,500 |
| New Jersey Gen. Oblig. Participating VRDN Series Floaters E 103, 1.61% 4/5/18 (Liquidity Facility Royal Bank of Canada) (a)(d) | | 39,800 | 39,800 |
| New Jersey St. Trans. Trust Fund Auth. Participating VRDN Series Floaters 16 XF1059, 1.75% 4/5/18 (Liquidity Facility Deutsche Bank AG New York Branch) (a)(d) | | 500 | 500 |
| Union County Impt. Auth. Participating VRDN Series XF 10 19, 1.63% 4/5/18 (Liquidity Facility Deutsche Bank AG New York Branch) (a)(d) | | 2,400 | 2,400 |
| Union County Impt. Auth. Rev. Participating VRDN Series XG 00 57, 1.64% 4/5/18 (Liquidity Facility Deutsche Bank AG New York Branch) (a)(d) | | 1,760 | 1,760 |
| | | | 80,455 |
| New York - 3.0% | | | |
| New York City Gen. Oblig. Participating VRDN Series 15 ZF0198, 1.6% 4/5/18 (Liquidity Facility JPMorgan Chase Bank) (a)(d) | | 3,690 | 3,690 |
| New York City Muni. Wtr. Fin. Auth. Wtr. & Swr. Sys. Rev. Participating VRDN: | | | |
| Series Floaters XF 05 88, 1.61% 4/5/18 (Liquidity Facility JPMorgan Chase Bank) (a)(d) | | 8,100 | 8,100 |
| Series Floaters ZF 05 31, 1.6% 4/5/18 (Liquidity Facility JPMorgan Chase Bank) (a)(d) | | 13,030 | 13,030 |
| Series Putters 15 XM0002, 1.6% 4/5/18 (Liquidity Facility JPMorgan Chase Bank) (a)(d) | | 9,520 | 9,520 |
| Series ROC II R 11930, 1.6% 4/5/18 (Liquidity Facility Citibank NA) (a)(d) | | 9,715 | 9,715 |
| New York City Transitional Fin. Auth. Rev. Participating VRDN: | | | |
| Series ROC II R 11902, 1.6% 4/5/18 (Liquidity Facility Citibank NA) (a)(d) | | 7,400 | 7,400 |
| Series ROC II R 14022, 1.6% 4/5/18 (Liquidity Facility Citibank NA) (a)(d) | | 5,000 | 5,000 |
| New York Dorm. Auth. Personal Income Tax Rev. Participating VRDN: | | | |
| Series 15 XF1030, 1.62% 4/5/18 (Liquidity Facility Deutsche Bank AG New York Branch) (a)(d) | | 6,100 | 6,100 |
| Series Floaters XF 05 25, 1.6% 4/5/18 (Liquidity Facility JPMorgan Chase Bank) (a)(d) | | 15,320 | 15,320 |
| Series ROC II R 14005, 1.6% 4/5/18 (Liquidity Facility Citibank NA) (a)(d) | | 14,030 | 14,030 |
| New York Dorm. Auth. Revs. Participating VRDN: | | | |
| Series Floaters XM 03 67, 1.61% 4/5/18 (Liquidity Facility JPMorgan Chase Bank) (a)(d) | | 9,000 | 9,000 |
| Series XF 0291, 1.6% 4/5/18 (Liquidity Facility JPMorgan Chase Bank) (a)(d) | | 15,000 | 15,000 |
| Series XF 22 68, 1.62% 4/5/18 (Liquidity Facility Citibank NA) (a)(d) | | 6,400 | 6,400 |
| New York Envir. Facilities Corp. Clean Wtr. & Drinking Wtr. Participating VRDN Series 16 XM0215, 1.6% 4/5/18 (Liquidity Facility JPMorgan Chase Bank) (a)(d) | | 4,425 | 4,425 |
| New York Sales Tax Asset Receivables Corp. Participating VRDN Series 2015 ZF0209, 1.6% 4/5/18 (Liquidity Facility JPMorgan Chase Bank) (a)(d) | | 5,250 | 5,250 |
| New York Thruway Auth. Second Gen. Hwy. & Bridge Trust Fund Participating VRDN Series ROC II R 11997, 1.6% 4/5/18 (Liquidity Facility Citibank NA) (a)(d) | | 2,000 | 2,000 |
| Triborough Bridge & Tunnel Auth. Revs. Participating VRDN Series XM 04 76, 1.61% 4/5/18 (Liquidity Facility JPMorgan Chase Bank) (a)(d) | | 2,195 | 2,195 |
| | | | 136,175 |
| North Carolina - 1.7% | | | |
| Charlotte Gen. Oblig. Participating VRDN Series Floaters XL 00 47, 1.61% 4/5/18 (Liquidity Facility Bank of America NA) (a)(d) | | 1,000 | 1,000 |
| Charlotte Int'l. Arpt. Rev. Participating VRDN: | | | |
| Series Floaters ZF 24 90, 1.61% 4/5/18 (Liquidity Facility Barclays Bank PLC) (a)(d) | | 3,550 | 3,550 |
| Series Floaters ZM 05 34, 1.61% 4/5/18 (Liquidity Facility Wells Fargo Bank NA) (a)(d) | | 2,900 | 2,900 |
| Greensboro Combined Enterprise Sys. Rev. Bonds Series Solar 0045, SIFMA Municipal Swap Index + 0.050% 1.24%, tender 5/24/18 (Liquidity Facility U.S. Bank NA, Cincinnati) (a)(d)(e) | | 700 | 700 |
| North Carolina Cap. Facilities Fin. Agcy. Rev. Participating VRDN: | | | |
| Series 15 XF2167, 1.6% 4/5/18 (Liquidity Facility Citibank NA) (a)(d) | | 4,800 | 4,800 |
| Series 16 XF 0290, 1.61% 4/5/18 (Liquidity Facility JPMorgan Chase Bank) (a)(d) | | 1,255 | 1,255 |
| Series EGL 14 0050, 1.62% 4/5/18 (Liquidity Facility Citibank NA) (a)(d) | | 2,000 | 2,000 |
| Series EGL 14 0051, 1.62% 4/5/18 (Liquidity Facility Citibank NA) (a)(d) | | 9,500 | 9,500 |
| Series EGL 14 0052, 1.62% 4/5/18 (Liquidity Facility Citibank NA) (a)(d) | | 2,850 | 2,850 |
| Series Floaters XL 00 55, 1.6% 4/5/18 (Liquidity Facility Morgan Stanley Bank, West Valley City Utah) (a)(d) | | 9,880 | 9,880 |
| Series MS 15 ZM0105, 1.61% 4/5/18 (Liquidity Facility Morgan Stanley Bank, West Valley City Utah) (a)(d) | | 2,185 | 2,185 |
| Series ROC II R 11850, 1.6% 4/5/18 (Liquidity Facility Citibank NA) (a)(d) | | 12,600 | 12,600 |
| North Carolina Cap. Facilities Fin. Agcy. Rev. Bonds Participating VRDN Series Floaters ZM 00 98, 1.61% 4/5/18 (Liquidity Facility Morgan Stanley Bank, West Valley City Utah) (a)(d) | | 3,335 | 3,335 |
| North Carolina Cap. Impt. Ltd. Participating VRDN Series ROC II R 14028, 1.6% 4/5/18 (Liquidity Facility Citibank NA) (a)(d) | | 4,000 | 4,000 |
| North Carolina Gen. Oblig. Participating VRDN Series 15 XF0140, 1.61% 4/5/18 (Liquidity Facility JPMorgan Chase Bank) (a)(d) | | 1,000 | 1,000 |
| North Carolina Ltd. Oblig. Participating VRDN Series ROC 14089, 1.6% 4/5/18 (Liquidity Facility Citibank NA) (a)(d) | | 1,000 | 1,000 |
| North Carolina Med. Care Commission Participating VRDN Series XM 02 98, 1.61% 4/5/18 (Liquidity Facility Royal Bank of Canada) (a)(d) | | 4,765 | 4,765 |
| North Carolina Med. Care Commission Health Care Facilities Rev. Participating VRDN Series Floaters XM 04 44, 1.61% 4/5/18 (Liquidity Facility Barclays Bank PLC) (a)(d) | | 7,625 | 7,625 |
| | | | 74,945 |
| North Dakota - 0.1% | | | |
| North Dakota Hsg. Fin. Agcy. Rev. Participating VRDN Series RBC E58, SIFMA Municipal Swap Index + 0.200% 1.61% 4/5/18 (Liquidity Facility Royal Bank of Canada) (a)(d)(e) | | 3,000 | 3,000 |
| Ohio - 1.0% | | | |
| Hamilton County HealthCare Facilities Rev. Participating VRDN Series XF 10 50, 1.64% 4/5/18 (Liquidity Facility Deutsche Bank AG New York Branch) (a)(d) | | 900 | 900 |
| Lakewood City School District Bonds Series Solar 0067, 1.73%, tender 5/24/18 (Liquidity Facility U.S. Bank NA, Cincinnati) (a)(d) | | 1,915 | 1,915 |
| Lucas County Gen. Oblig. Bonds Series 2016 26, SIFMA Municipal Swap Index + 0.150% 1.73%, tender 5/24/18 (Liquidity Facility U.S. Bank NA, Cincinnati) (a)(d)(e) | | 6,500 | 6,500 |
| Middletown Hosp. Facilities Rev. Participating VRDN Series Floaters 00 31 44, 1.76% 5/10/18 (Liquidity Facility Barclays Bank PLC) (a)(d)(f) | | 1,880 | 1,880 |
| Ohio Higher Edl. Facility Commission Rev. Participating VRDN Series 2017, 1.76% 5/10/18 (Liquidity Facility Barclays Bank PLC) (a)(d)(f) | | 1,100 | 1,100 |
| Ohio Hosp. Facilities Rev. Participating VRDN Series 2015 XF0105, 1.61% 4/5/18 (Liquidity Facility JPMorgan Chase Bank) (a)(d) | | 14,975 | 14,975 |
| Ohio Wtr. Dev. Auth. Rev. Participating VRDN Series Floaters E 104, 1.61% 4/5/18 (Liquidity Facility Royal Bank of Canada) (a)(d) | | 17,000 | 17,000 |
| | | | 44,270 |
| Oklahoma - 0.1% | | | |
| Edmond Pubs Sales & Uti Rev. Participating VRDN Series Floaters XM 05 59, 1.64% 4/5/18 (Liquidity Facility Citibank NA) (a)(d) | | 3,365 | 3,365 |
| Oklahoma St Wtr. Resources Board Rev. Fund Bonds Series 2016, SIFMA Municipal Swap Index + 0.050% 1.24%, tender 5/24/18 (Liquidity Facility U.S. Bank NA, Cincinnati) (a)(d)(e) | | 595 | 595 |
| | | | 3,960 |
| Oregon - 0.1% | | | |
| Clackamas County School District #7J Bonds Series Solar 0053, SIFMA Municipal Swap Index + 0.050% 1.73%, tender 6/28/18 (Liquidity Facility U.S. Bank NA, Cincinnati) (a)(d)(e) | | 1,800 | 1,800 |
| Oregon Gen. Oblig. Participating VRDN Series ROC II R 11949, 1.61% 4/5/18 (Liquidity Facility Citibank NA) (a)(d) | | 3,000 | 3,000 |
| Portland Wtr. Sys. Rev. Bonds Series 2016 24, SIFMA Municipal Swap Index + 0.150% 1.73%, tender 6/7/18 (Liquidity Facility U.S. Bank NA, Cincinnati) (a)(d)(e) | | 885 | 885 |
| | | | 5,685 |
| Pennsylvania - 2.0% | | | |
| Berks County Muni. Auth. Rev. Participating VRDN Series Floaters 001, 1.76% 5/10/18 (Liquidity Facility Barclays Bank PLC) (a)(d)(f) | | 4,200 | 4,200 |
| Geisinger Auth. Health Sys. Rev. Participating VRDN: | | | |
| Series 15 ZF0174, 1.61% 4/5/18 (Liquidity Facility JPMorgan Chase Bank) (a)(d) | | 1,000 | 1,000 |
| Series Floaters XM 06 13, 1.61% 4/5/18 (Liquidity Facility JPMorgan Chase Bank) (a)(d) | | 1,525 | 1,525 |
| Series Floaters YX 10 49, 1.6% 4/5/18 (Liquidity Facility Barclays Bank PLC) (a)(d) | | 4,275 | 4,275 |
| Series Putters 0047, 1.61% 4/5/18 (Liquidity Facility JPMorgan Chase Bank) (a)(d) | | 1,000 | 1,000 |
| Pennsylvania Econ. Dev. Fing. Auth. Rev. Participating VRDN Series Floaters 16 YX1028, 1.63% 4/5/18 (Liquidity Facility Barclays Bank PLC) (a)(d) | | 1,000 | 1,000 |
| Pennsylvania Gen. Oblig. Participating VRDN Series 16 ZF0424, 1.61% 4/5/18 (Liquidity Facility JPMorgan Chase Bank) (a)(c)(d) | | 3,000 | 3,000 |
| Pennsylvania Health & Edl. Facilities Fing. Auth. Rev. Bonds Series E72, SIFMA Municipal Swap Index + 0.170% 1.75%, tender 6/1/18 (Liquidity Facility Royal Bank of Canada) (a)(d)(e)(f) | | 11,600 | 11,600 |
| Pennsylvania Higher Edl. Facilities Auth. Rev. Bonds: | | | |
| Series 2016 E75, SIFMA Municipal Swap Index + 0.170% 1.75%, tender 7/1/18 (Liquidity Facility Royal Bank of Canada) (a)(d)(e)(f) | | 2,595 | 2,595 |
| Series WF 11 26C, SIFMA Municipal Swap Index + 0.280% 1.86%, tender 7/26/18 (Liquidity Facility Wells Fargo Bank NA) (a)(d)(e)(f) | | 1,500 | 1,500 |
| Pennsylvania Tpk. Commission Tpk. Rev. Participating VRDN: | | | |
| Series Floaters E 101, 1.61% 4/5/18 (Liquidity Facility Royal Bank of Canada) (a)(d) | | 30,500 | 30,500 |
| Series XX 10 44, 1.61% 4/5/18 (Liquidity Facility Barclays Bank PLC) (a)(d) | | 3,000 | 3,000 |
| Philadelphia Auth. For Indl. Dev. Participating VRDN Series Putters 14 XM0005, 1.61% 4/5/18 (Liquidity Facility JPMorgan Chase Bank) (a)(b)(d) | | 1,000 | 1,000 |
| Univ. of Pittsburgh Med. Ctr. Bonds Series RBC E53, SIFMA Municipal Swap Index + 0.200% 1.61%, tender 4/5/18 (Liquidity Facility Royal Bank of Canada) (a)(d)(e) | | 20,970 | 20,970 |
| Westmoreland County Muni. Auth. Muni. Svc. Rev. Participating VRDN Series Floaters YX 10 75, 1.61% 4/5/18 (Liquidity Facility Barclays Bank PLC) (a)(d) | | 2,695 | 2,695 |
| | | | 89,860 |
| South Carolina - 0.3% | | | |
| Berkeley County School District Bonds Series Solar 17 0030, SIFMA Municipal Swap Index + 0.150% 1.73%, tender 5/17/18 (Liquidity Facility U.S. Bank NA, Cincinnati) (a)(d)(e) | | 600 | 600 |
| Columbia Wtrwks. & Swr. Rev. Participating VRDN Series 2016 21, SIFMA Municipal Swap Index + 0.050% 1.61% 4/5/18 (Liquidity Facility U.S. Bank NA, Cincinnati) (a)(d)(e) | | 1,000 | 1,000 |
| Lancaster County School District Bonds Series Solar 17 21, SIFMA Municipal Swap Index + 0.150% 1.73%, tender 6/7/18 (Liquidity Facility U.S. Bank NA, Cincinnati) (a)(d)(e) | | 595 | 595 |
| Lexington County School District #1 Bonds Series Solar 0058, 1.73%, tender 5/3/18 (Liquidity Facility U.S. Bank NA, Cincinnati) (a)(d) | | 1,100 | 1,100 |
| South Carolina Pub. Svc. Auth. Rev. Participating VRDN: | | | |
| Series 2017 XF 2425, 1.62% 4/5/18 (Liquidity Facility Barclays Bank PLC) (a)(d) | | 6,750 | 6,750 |
| Series Floaters XG 01 49, 1.62% 4/5/18 (Liquidity Facility Barclays Bank PLC) (a)(d) | | 3,800 | 3,800 |
| | | | 13,845 |
| Tennessee - 0.1% | | | |
| Nashville and Davidson County Metropolitan Govt. Health & Edl. Facilities Board Rev. Participating VRDN: | | | |
| Series Floaters XG 01 45, 1.62% 4/5/18 (Liquidity Facility Barclays Bank PLC) (a)(d) | | 1,100 | 1,100 |
| Series Floaters XL 00 62, 1.64% 4/5/18 (Liquidity Facility Citibank NA) (a)(d) | | 1,100 | 1,100 |
| Rutherford County Health & Edl. Facilities Board Rev. Participating VRDN: | | | |
| Series 2014 ZF0208, 1.68% 4/5/18 (Liquidity Facility JPMorgan Chase Bank) (a)(d) | | 2,500 | 2,500 |
| Series Floaters XM 04 46, 1.61% 4/5/18 (Liquidity Facility Barclays Bank PLC) (a)(d) | | 1,500 | 1,500 |
| | | | 6,200 |
| Texas - 3.1% | | | |
| City of Dallas Wtrwks. & Swr. Sys. Rev. Participating VRDN Series XM 02 88, 1.61% 4/5/18 (Liquidity Facility JPMorgan Chase Bank) (a)(d) | | 5,000 | 5,000 |
| Cypress-Fairbanks Independent School District Participating VRDN Series 2017 XM 0496, 1.61% 4/5/18 (Liquidity Facility Citibank NA) (a)(d) | | 3,335 | 3,335 |
| Harris County Gen. Oblig. Bonds Series Clipper 09 73, SIFMA Municipal Swap Index + 0.040% 1.62%, tender 4/5/18 (Liquidity Facility State Street Bank & Trust Co., Boston) (a)(d)(e) | | 36,800 | 36,800 |
| Harris County Health Facilities Dev. Corp. Rev. Participating VRDN Series 16 ZF 03 12, 1.61% 4/5/18 (Liquidity Facility JPMorgan Chase Bank) (a)(d) | | 10,485 | 10,485 |
| Harris County Metropolitan Trans. Auth. Participating VRDN Series 16 ZM0164, 1.61% 4/5/18 (Liquidity Facility Royal Bank of Canada) (a)(d) | | 9,500 | 9,500 |
| Hays Consolidated Independent School District Bonds Series Solar 0050, SIFMA Municipal Swap Index + 0.050% 1.73%, tender 4/12/18 (Liquidity Facility U.S. Bank NA, Cincinnati) (a)(d)(e) | | 780 | 780 |
| Katy Independent School District Participating VRDN Series Floaters XG 01 63, 1.62% 4/5/18 (Liquidity Facility Bank of America NA) (a)(d) | | 1,600 | 1,600 |
| Klein Independent School District Participating VRDN Series ROCS II R 11942, 1.61% 4/5/18 (Liquidity Facility Citibank NA) (a)(d) | | 5,145 | 5,145 |
| Lower Colorado River Auth. Rev. Participating VRDN Series Floaters E 98, 1.61% 4/5/18 (Liquidity Facility Royal Bank of Canada) (a)(d) | | 6,800 | 6,800 |
| Mansfield Independent School District Participating VRDN Series Floaters XG 01 55, 1.61% 4/5/18 (Liquidity Facility Citibank NA) (a)(d) | | 2,391 | 2,391 |
| Midlothian Independent School District Participating VRDN Series Floaters ZM 06 02, 1.61% 4/5/18 (Liquidity Facility Citibank NA) (a)(d) | | 3,700 | 3,700 |
| New Hope Cultural Ed. Facilities Finc Participating VRDN Series Floaters XF 05 99, 1.61% 4/5/18 (Liquidity Facility Royal Bank of Canada) (a)(d) | | 1,900 | 1,900 |
| San Antonio Pub. Facilities Corp. Lease Rev. Participating VRDN Series 16 ZF 0456, 1.61% 4/5/18 (Liquidity Facility State Street Bank & Trust Co., Boston) (a)(d) | | 7,465 | 7,465 |
| Tarrant County Cultural Ed. Facilities Fin. Corp. Hosp. Rev. Participating VRDN: | | | |
| Series 16 XF0411, 1.63% 4/5/18 (Liquidity Facility JPMorgan Chase Bank) (a)(d) | | 2,000 | 2,000 |
| Series 16 ZF 0282, 1.62% 4/5/18 (Liquidity Facility Toronto-Dominion Bank) (a)(d) | | 7,760 | 7,760 |
| Series XY1001, 1.61% 4/5/18 (Liquidity Facility Barclays Bank PLC) (a)(d) | | 4,620 | 4,620 |
| Tarrant County Cultural Ed. Facilities Fin. Corp. Rev. Participating VRDN Series Floaters XM 04 02, 1.61% 4/5/18 (Liquidity Facility Morgan Stanley Bank, West Valley City Utah) (a)(d) | | 2,100 | 2,100 |
| Tarrant County Health Facilities Dev. Corp. Hosp. Rev. Participating VRDN Series Putters 0028, 1.63% 4/5/18 (Liquidity Facility JPMorgan Chase Bank) (a)(d) | | 1,150 | 1,150 |
| Texas A&M Univ. Rev. Participating VRDN Series Floaters XM 04 43, 1.62% 4/5/18 (Liquidity Facility Barclays Bank PLC) (a)(d) | | 4,150 | 4,150 |
| Texas Gen. Oblig. Participating VRDN: | | | |
| Series 15 XF0075, 1.61% 4/5/18 (Liquidity Facility JPMorgan Chase Bank) (a)(d) | | 11,915 | 11,915 |
| Series 16 ZF0248, 1.62% 4/5/18 (Liquidity Facility Toronto-Dominion Bank) (a)(d) | | 2,640 | 2,640 |
| Series Floaters XM 04 04, 1.61% 4/5/18 (Liquidity Facility Wells Fargo Bank NA) (a)(d) | | 7,500 | 7,500 |
| Texas Wtr. Dev. Board Rev. Participating VRDN Series Floaters ZM 05 87, 1.61% 4/5/18 (Liquidity Facility Citibank NA) (a)(d) | | 1,875 | 1,875 |
| | | | 140,611 |
| Utah - 0.3% | | | |
| Riverton Hosp. Rev.: | | | |
| Bonds Series WF 11 35C, SIFMA Municipal Swap Index + 0.280% 1.86%, tender 7/26/18 (Liquidity Facility Wells Fargo Bank NA) (a)(d)(e)(f) | | 5,530 | 5,530 |
| Participating VRDN Series RBC ZF 0274, 1.63% 4/5/18 (Liquidity Facility Royal Bank of Canada) (a)(d) | | 4,100 | 4,100 |
| Utah Transit Auth. Sales Tax Rev. Participating VRDN Series 2017, 1.61% 4/5/18 (Liquidity Facility Barclays Bank PLC) (a)(d) | | 2,660 | 2,660 |
| | | | 12,290 |
| Vermont - 0.0% | | | |
| Vermont Edl. and Health Buildings Fing. Agcy. Participating VRDN Series XF 23 61, 1.62% 4/5/18 (Liquidity Facility Barclays Bank PLC) (a)(d) | | 655 | 655 |
| Virginia - 1.0% | | | |
| Fairfax County Indl. Dev. Auth. Participating VRDN: | | | |
| Series 15 ZF0166, 1.61% 4/5/18 (Liquidity Facility JPMorgan Chase Bank) (a)(d) | | 7,500 | 7,500 |
| Series MS 3309, 1.61% 4/5/18 (Liquidity Facility Cr. Suisse AG) (a)(d) | | 2,300 | 2,300 |
| Fairfax County Indl. Dev. Auth. Rev. Participating VRDN Series XG 00 21, 1.61% 4/5/18 (Liquidity Facility Citibank NA) (a)(d) | | 6,660 | 6,660 |
| Hampton Roads Sanitation District Wastewtr. Rev. Bonds Series Solar 0064, 1.73%, tender 5/3/18 (Liquidity Facility U.S. Bank NA, Cincinnati) (a)(d) | | 2,300 | 2,300 |
| Loudoun County Gen. Oblig. Bonds Series Solar 2017 38, SIFMA Municipal Swap Index + 0.050% 1.73%, tender 4/12/18 (Liquidity Facility U.S. Bank NA, Cincinnati) (a)(d)(e) | | 700 | 700 |
| Lynchburg Econ. Dev. Participating VRDN Series Floaters XG 01 47, 1.62% 4/5/18 (Liquidity Facility Barclays Bank PLC) (a)(d) | | 1,315 | 1,315 |
| Suffolk Econ. Dev. Auth. Hosp. Facilities Rev. Participating VRDN Series EGL 17 0005, 1.62% 4/5/18 (Liquidity Facility Citibank NA) (a)(d) | | 17,690 | 17,690 |
| Univ. of Virginia Gen. Rev.: | | | |
| Bonds Series Solar 17 17, SIFMA Municipal Swap Index + 0.150% 1.73%, tender 5/31/18 (Liquidity Facility U.S. Bank NA, Cincinnati) (a)(d)(e) | | 595 | 595 |
| Participating VRDN Series 15 ZF0173, 1.61% 4/5/18 (Liquidity Facility JPMorgan Chase Bank) (a)(d) | | 5,000 | 5,000 |
| Virginia Gen. Oblig. Participating VRDN Series 2016 11, SIFMA Municipal Swap Index + 0.050% 1.61% 4/5/18 (Liquidity Facility U.S. Bank NA, Cincinnati) (a)(d)(e) | | 495 | 495 |
| Virginia Small Bus. Fing. Auth. Health Care Facilities Rev. Participating VRDN 1.61% 4/5/18 (Liquidity Facility JPMorgan Chase Bank) (a)(d) | | 1,015 | 1,015 |
| | | | 45,570 |
| Washington - 1.7% | | | |
| Central Puget Sound Reg'l. Trans. Auth. Sales & Use Tax Rev. Participating VRDN Series 15 XF2158, 1.61% 4/5/18 (Liquidity Facility Citibank NA) (a)(d) | | 8,655 | 8,655 |
| King County Gen. Oblig. Participating VRDN Series Floaters XM 04 41, 1.63% 4/5/18 (Liquidity Facility Barclays Bank PLC) (a)(d) | | 1,500 | 1,500 |
| King County Swr. Rev. Participating VRDN: | | | |
| Series EGL 14 0047, 1.62% 4/5/18 (Liquidity Facility Citibank NA) (a)(d) | | 1,000 | 1,000 |
| Series Putters 15 XM0012, 1.61% 4/5/18 (Liquidity Facility JPMorgan Chase Bank) (a)(d) | | 6,950 | 6,950 |
| Series ROC II R 11962, 1.61% 4/5/18 (Liquidity Facility Citibank NA) (a)(d) | | 2,200 | 2,200 |
| Pierce County School District #10 Tacoma Participating VRDN Series Floaters XM 05 24, 1.61% 4/5/18 (Liquidity Facility Citibank NA) (a)(d) | | 2,538 | 2,538 |
| Seattle Muni. Lt. & Pwr. Rev. Bonds: | | | |
| Series Solar 0055, 1.73%, tender 6/28/18 (Liquidity Facility U.S. Bank NA, Cincinnati) (a)(d) | | 1,700 | 1,700 |
| Series Solar 17 19, SIFMA Municipal Swap Index + 0.150% 1.73%, tender 5/31/18 (Liquidity Facility U.S. Bank NA, Cincinnati) (a)(d)(e) | | 595 | 595 |
| Series WF 11-18C, SIFMA Municipal Swap Index + 0.280% 1.86%, tender 7/26/18 (Liquidity Facility Wells Fargo Bank NA) (a)(d)(e)(f) | | 600 | 600 |
| Seattle Wtr. Sys. Rev. Bonds Series Solar 17 5, SIFMA Municipal Swap Index + 0.150% 1.73%, tender 4/26/18 (Liquidity Facility U.S. Bank NA, Cincinnati) (a)(d)(e) | | 1,185 | 1,185 |
| Washington Gen. Oblig.: | | | |
| Bonds Series WF 11-16C, SIFMA Municipal Swap Index + 0.280% 1.86%, tender 7/26/18 (Liquidity Facility Wells Fargo Bank NA) (a)(d)(e)(f) | | 2,500 | 2,500 |
| Participating VRDN: | | | |
| Series 15 ZM0121, 1.61% 4/5/18 (Liquidity Facility Royal Bank of Canada) (a)(d) | | 1,250 | 1,250 |
| Series 16 XM0219, 1.61% 4/5/18 (Liquidity Facility JPMorgan Chase Bank) (a)(d) | | 4,335 | 4,335 |
| Series Floaters XF 06 11, 1.61% 4/5/18 (Liquidity Facility JPMorgan Chase Bank) (a)(d) | | 3,800 | 3,800 |
| Series Floaters XF 25 39, 1.61% 4/5/18 (Liquidity Facility Citibank NA) (a)(d) | | 2,000 | 2,000 |
| Series MS 33 864X, 1.61% 4/5/18 (Liquidity Facility Morgan Stanley Bank, West Valley City Utah) (a)(d) | | 1,700 | 1,700 |
| Series ROC II R 14074, 1.61% 4/5/18 (Liquidity Facility Citibank NA) (a)(d) | | 3,800 | 3,800 |
| Series XF 0294, 1.61% 4/5/18 (Liquidity Facility JPMorgan Chase Bank) (a)(d) | | 6,000 | 6,000 |
| 1.61% 4/5/18 (Liquidity Facility JPMorgan Chase Bank) (a)(d) | | 2,250 | 2,250 |
| Washington Health Care Facilities Auth. Rev. Participating VRDN: | | | |
| Series 15 XF0132, 1.61% 4/5/18 (Liquidity Facility JPMorgan Chase Bank) (a)(d) | | 10,605 | 10,605 |
| Series 15 XF0148, 1.61% 4/5/18 (Liquidity Facility Bank of America NA) (a)(d) | | 7,485 | 7,485 |
| Series Floaters XF 25 27, 1.61% 4/5/18 (Liquidity Facility Citibank NA) (a)(d) | | 1,875 | 1,875 |
| Washington State Motor Vehicle Fuel Tax Auth. Gen. Oblig. Participating VRDN Series XL 00 39, 1.61% 4/5/18 (Liquidity Facility JPMorgan Chase Bank) (a)(d) | | 2,530 | 2,530 |
| | | | 77,053 |
| Wisconsin - 0.2% | | | |
| Milwaukee Metropolitan Swr. District Bonds Series Solar 0036, SIFMA Municipal Swap Index + 0.150% 1.73%, tender 6/14/18 (Liquidity Facility U.S. Bank NA, Cincinnati) (a)(d)(e) | | 700 | 700 |
| Wisconsin Gen. Oblig. Participating VRDN: | | | |
| Series Clipper 09 36, SIFMA Municipal Swap Index + 0.180% 1.76% 6/7/18 (Liquidity Facility State Street Bank & Trust Co., Boston) (a)(d)(e)(f) | | 1,455 | 1,455 |
| Series Clipper 09 53, SIFMA Municipal Swap Index + 0.180% 1.76% 6/7/18 (Liquidity Facility State Street Bank & Trust Co., Boston) (a)(d)(e)(f) | | 800 | 800 |
| Wisconsin Health & Edl. Facilities Participating VRDN: | | | |
| Series Floaters XF 25 41, 1.61% 4/5/18 (Liquidity Facility Citibank NA) (a)(d) | | 1,700 | 1,700 |
| Series Floaters XG 00 72, 1.65% 4/5/18 (Liquidity Facility Deutsche Bank AG New York Branch) (a)(d) | | 700 | 700 |
| Series XM 04 79, 1.61% 4/5/18 (Liquidity Facility Morgan Stanley Bank, West Valley City Utah) (a)(d) | | 4,500 | 4,500 |
| | | | 9,855 |
| TOTAL TENDER OPTION BOND | | | |
| (Cost $1,586,616) | | | 1,586,616 |
|
| Other Municipal Security - 28.9% | | | |
| Alabama - 0.5% | | | |
| Huntsville Health Care Auth. Rev. Series 2018: | | | |
| 1.24% 6/1/18, CP | | 7,200 | 7,200 |
| 1.26% 4/4/18, CP | | 1,100 | 1,100 |
| 1.3% 6/18/18, CP | | 1,600 | 1,600 |
| 1.32% 7/6/18, CP | | 5,300 | 5,300 |
| 1.44% 8/1/18, CP | | 5,100 | 5,100 |
| | | | 20,300 |
| Alaska - 0.4% | | | |
| Anchorage Gen. Oblig. TAN Series 2018, 4% 9/17/18 | | 18,275 | 18,481 |
| Arizona - 0.3% | | | |
| Phoenix Civic Impt. Board Arpt. Rev. Bonds Series 2008 A, 5% 7/1/18 (Pre-Refunded to 7/1/18 @ 100) | | 4,700 | 4,742 |
| Salt River Proj. Agricultural Impt. & Pwr. District Elec. Sys. Rev. Series C, 1.2% 4/4/18, CP | | 8,000 | 8,000 |
| | | | 12,742 |
| California - 0.6% | | | |
| California Statewide Cmntys. Dev. Auth. Gas Supply Rev. Bonds: | | | |
| Series 2010 A, SIFMA Municipal Swap Index + 0.100% 1.68%, tender 5/1/18 (Liquidity Facility Royal Bank of Canada) (a)(e) | | 5,790 | 5,790 |
| Series 2010 B, SIFMA Municipal Swap Index + 0.100% 1.68%, tender 7/2/18 (Liquidity Facility Royal Bank of Canada) (a)(e) | | 2,510 | 2,510 |
| Los Angeles Cmnty. College District Bonds Series 2017 J, 2% 8/1/18 | | 3,900 | 3,906 |
| Los Angeles Dept. of Wtr. & Pwr. Rev. Series 2018, 1.41% 7/19/18 (Liquidity Facility Royal Bank of Canada), CP | | 11,000 | 11,000 |
| Sacramento Muni. Util. District Elec. Rev. Series L1, 1.37% 6/5/18, LOC Barclays Bank PLC, CP | | 5,400 | 5,400 |
| | | | 28,606 |
| Colorado - 0.0% | | | |
| Colorado Gen. Fdg. Rev. TRAN Series 2017 A, 4% 6/27/18 | | 625 | 629 |
| Colorado Springs Utils. Rev. Series A, 1.37% 4/5/18, LOC Bank of America NA, CP | | 1,000 | 1,000 |
| | | | 1,629 |
| Connecticut - 2.1% | | | |
| Bethel Gen. Oblig. BAN Series 2017, 2% 6/15/18 | | 2,600 | 2,605 |
| Brookfield Gen. Oblig. BAN Series A, 2.25% 11/15/18 | | 2,100 | 2,113 |
| Colchester Gen. Oblig. BAN Series 2018, 2.5% 10/17/18 | | 3,000 | 3,016 |
| Connecticut Gen. Oblig.: | | | |
| BAN Series 2017 A, 5% 9/14/18 | | 53,900 | 54,752 |
| Bonds: | | | |
| Series 2018 A, 5% 4/15/19 (c) | | 1,700 | 1,753 |
| Series 2018 B, 5% 4/15/19 (c) | | 6,600 | 6,804 |
| Connecticut Health & Edl. Facilities Auth. Rev. Bonds: | | | |
| (William W. Backus Hosp. Proj.) Series F, 5.125% 7/1/18 (Pre-Refunded to 7/1/18 @ 100) | | 2,525 | 2,547 |
| Series S1, 1.12% tender 4/3/18, CP mode | | 2,100 | 2,100 |
| Connecticut Spl. Tax Oblig. Trans. Infrastructure Rev. Bonds: | | | |
| Series 2014 A, 4% 9/1/18 | | 5,480 | 5,536 |
| Series 2018 A, 4% 1/1/19 | | 1,100 | 1,119 |
| East Haddam Gen. Oblig. BAN Series 2018, 2.25% 9/6/18 | | 3,100 | 3,110 |
| Ledyard Gen. Oblig. BAN Series 2018, 2% 6/13/18 | | 4,000 | 4,005 |
| Watertown Gen. Oblig. BAN Series 2018, 2.5% 10/25/18 | | 2,200 | 2,212 |
| Windham Gen. Oblig. BAN Series 2018, 2.75% 10/12/18 (c) | | 2,400 | 2,412 |
| Wolcott Gen. Oblig. BAN Series 2018, 2.5% 11/8/18 | | 600 | 603 |
| | | | 94,687 |
| District Of Columbia - 0.4% | | | |
| District of Columbia Rev. Bonds Series 2000, 1.25% tender 4/9/18, LOC JPMorgan Chase Bank, CP mode | | 5,100 | 5,100 |
| Washington Convention & Sports Auth. Bonds Series 2018 A, 3% 10/1/18 | | 14,020 | 14,132 |
| | | | 19,232 |
| Florida - 2.0% | | | |
| Broward County School District TAN Series 2017, 2% 6/15/18 | | 1,935 | 1,937 |
| Florida Local Govt. Fin. Cmnty.: | | | |
| Series 11A1, 1.21% 4/4/18, LOC JPMorgan Chase Bank, CP | | 15,600 | 15,600 |
| Series 2011 A1, 1.3% 5/2/18, LOC JPMorgan Chase Bank, CP | | 35,700 | 35,700 |
| Jacksonville Gen. Oblig. Series 04A, 1.36% 4/4/18, LOC Bank of America NA, CP | | 3,600 | 3,600 |
| Miami-Dade County School Board Ctfs. of Prtn. Bonds: | | | |
| (Miami-Dade County School District Proj.): | | | |
| Series 2008 B, 5.25% 5/1/18 (Pre-Refunded to 5/1/18 @ 100) | | 5,100 | 5,117 |
| Series 2015 A, 5% 5/1/18 | | 3,525 | 3,535 |
| (Miami-Dade County School District) Series 2008 B, 5.25% 5/1/18 (Pre-Refunded to 5/1/18 @ 100) | | 5,550 | 5,568 |
| Miami-Dade County Wtr. & Swr. Rev.: | | | |
| Series A1, 1.43% 6/7/18, LOC Barclays Bank PLC, CP | | 3,600 | 3,600 |
| Series B1, 1.4% 5/10/18, LOC Sumitomo Mitsui Banking Corp., CP | | 2,000 | 2,000 |
| Palm Beach Fla Series 2018, 1.3% 4/5/18, LOC Citibank NA, CP | | 2,700 | 2,700 |
| Polk County Indl. Dev. Auth. Health Sys. Rev. Bonds: | | | |
| Series 2014 A, SIFMA Municipal Swap Index + 0.300% 1.88%, tender 10/25/18 (a)(e) | | 1,000 | 1,000 |
| Series 2014 A1, SIFMA Municipal Swap Index + 0.250% 1.83%, tender 10/25/18 (a)(e) | | 3,800 | 3,800 |
| Tampa Health Sys. Rev. Bonds Series 2012 B, SIFMA Municipal Swap Index + 0.300% 1.88%, tender 10/25/18 (a)(e) | | 5,300 | 5,300 |
| | | | 89,457 |
| Georgia - 1.9% | | | |
| Atlanta Arpt. Rev.: | | | |
| Series D1: | | | |
| 1.3% 6/18/18, LOC Bank of America NA, CP | | 7,900 | 7,900 |
| 1.35% 6/18/18, LOC Bank of America NA, CP | | 1,010 | 1,010 |
| 1.52% 6/18/18, LOC Bank of America NA, CP | | 900 | 900 |
| Series D3, 1.3% 6/18/18, LOC Bank of America NA, CP | | 1,300 | 1,300 |
| Series E1: | | | |
| 1.31% 6/18/18, LOC Bank of Tokyo-Mitsubishi UFJ Ltd., CP | | 3,935 | 3,935 |
| 1.31% 6/18/18, LOC Bank of Tokyo-Mitsubishi UFJ Ltd., CP | | 3,935 | 3,935 |
| 1.4% 6/18/18, LOC Bank of Tokyo-Mitsubishi UFJ Ltd., CP | | 1,013 | 1,013 |
| 1.52% 6/18/18, LOC Bank of Tokyo-Mitsubishi UFJ Ltd., CP | | 500 | 500 |
| 1.52% 6/18/18, LOC Bank of Tokyo-Mitsubishi UFJ Ltd., CP | | 500 | 500 |
| Series E3: | | | |
| 1.31% 6/18/18, LOC Bank of Tokyo-Mitsubishi UFJ Ltd., CP | | 1,498 | 1,498 |
| 1.4% 6/18/18, LOC Bank of Tokyo-Mitsubishi UFJ Ltd., CP | | 100 | 100 |
| Atlanta Wtr. & Wastewtr. Rev.: | | | |
| Series 15A1, 1.2% 4/2/18, LOC PNC Bank NA, CP | | 16,400 | 16,400 |
| Series 15A2, 1.2% 4/2/18, LOC Wells Fargo Bank NA, CP | | 2,515 | 2,515 |
| Georgia Muni. Elec. Auth. Pwr. Rev.: | | | |
| Bonds (Gen. Resolution Projs.) Series 85 A, 1.16% tender 4/5/18, LOC Barclays Bank PLC, CP mode | | 5,100 | 5,100 |
| Series B, 1.17% 4/16/18, LOC PNC Bank NA, CP | | 9,400 | 9,400 |
| Main Street Natural Gas, Inc. Georgia Gas Proj. Rev. Bonds: | | | |
| Series 2010 A1, SIFMA Municipal Swap Index + 0.100% 1.68%, tender 6/1/18 (Liquidity Facility Royal Bank of Canada) (a)(e) | | 15,985 | 15,985 |
| Series 2010 A2, SIFMA Municipal Swap Index + 0.100% 1.68%, tender 6/1/18 (Liquidity Facility Royal Bank of Canada) (a)(e) | | 11,130 | 11,130 |
| | | | 83,121 |
| Hawaii - 0.1% | | | |
| Honolulu City & County Gen. Oblig. Bonds Series 2009 B, 5.25% 7/1/18 | | 2,195 | 2,215 |
| Idaho - 0.6% | | | |
| Idaho Gen. Oblig. TAN Series 2017, 4% 6/29/18 | | 26,265 | 26,426 |
| Idaho Health Facilities Auth. Rev. Bonds (Trinity Health Group Proj.) 2008 B, 6.25% 12/1/18 (Pre-Refunded to 12/1/18 @ 100) | | 1,535 | 1,584 |
| | | | 28,010 |
| Illinois - 1.0% | | | |
| Chicago O'Hare Int'l. Arpt. Rev.: | | | |
| Series B2, 1.37% 6/14/18, LOC Bank of Tokyo-Mitsubishi UFJ Ltd., CP | | 4,100 | 4,100 |
| Series C2, 1.38% 6/14/18, LOC Barclays Bank PLC, CP | | 1,300 | 1,300 |
| Illinois Fin. Auth. Ed. Rev.: | | | |
| Series 2018, 1.38% 4/3/18, LOC PNC Bank NA, CP | | 2,800 | 2,800 |
| Series LOY, 1.32% 7/6/18, LOC PNC Bank NA, CP | | 4,400 | 4,400 |
| Illinois Fin. Auth. Rev. Bonds: | | | |
| (Advocate Health Care Network Proj.) Series 2011 B, SIFMA Municipal Swap Index + 0.300% 1.88%, tender 10/25/18 (a)(e) | | 600 | 600 |
| (Children's Memorial Hosp. Proj.) Series 2008 A, 5.25% 8/15/18 (Pre-Refunded to 8/15/18 @ 100) | | 3,200 | 3,245 |
| (Hosp. Sisters Svcs., Inc.) Series 2018, 1.38% tender 4/3/18, CP mode | | 5,000 | 5,000 |
| Series 12H: | | | |
| 1.18% tender 4/4/18, CP mode | | 4,800 | 4,800 |
| 1.33% tender 6/5/18, CP mode | | 1,300 | 1,300 |
| Series 12I: | | | |
| 1.3% tender 5/21/18, CP mode | | 3,200 | 3,200 |
| 1.33% tender 6/5/18, CP mode | | 5,500 | 5,500 |
| Series 2012 H, 1.4% tender 8/6/18, CP mode | | 8,085 | 8,085 |
| | | | 44,330 |
| Indiana - 0.3% | | | |
| Indianapolis Gas Util. Sys. Rev. Series 2018, 1.22% 4/5/18, LOC JPMorgan Chase Bank, CP | | 11,700 | 11,700 |
| Kentucky - 0.1% | | | |
| Jefferson County Poll. Cont. Rev. Bonds Series 2001 A, 1.32% tender 4/6/18, CP mode | | 2,600 | 2,600 |
| Maryland - 0.5% | | | |
| Maryland Gen. Oblig. Bonds Series 2014 C, 5% 8/1/18 | | 1,200 | 1,214 |
| Montgomery County Gen. Oblig. Bonds Series 2013 MD, 1.33%, tender 6/1/18 (a) | | 23,200 | 23,200 |
| | | | 24,414 |
| Massachusetts - 0.4% | | | |
| Massachusetts Gen. Oblig.: | | | |
| Bonds Series 2017 A, 2.05% 2/1/19 (a)(e) | | 5,900 | 5,909 |
| RAN Series 2017 B, 2% 5/21/18 | | 2,000 | 2,002 |
| Massachusetts Indl. Fin. Agcy. Poll. Cont. Rev. Bonds (New England Pwr. Co. Proj.) Series 1992: | | | |
| 1.25% tender 4/12/18, CP mode | | 2,700 | 2,700 |
| 1.27% tender 4/2/18, CP mode | | 5,600 | 5,600 |
| | | | 16,211 |
| Michigan - 1.1% | | | |
| Michigan Bldg. Auth. Rev. Series 7, 1.24% 5/10/18, LOC State Street Bank & Trust Co., Boston, LOC U.S. Bank NA, Cincinnati, CP | | 7,300 | 7,300 |
| Michigan Fin. Auth. Rev. Bonds Series 2013 M1, 1.33%, tender 6/1/18 (a) | | 12,600 | 12,600 |
| Michigan Hosp. Fin. Auth. Rev. Bonds Series 2010 F1, 2%, tender 5/30/18 (a) | | 1,095 | 1,096 |
| Univ. of Michigan Rev.: | | | |
| Bonds: | | | |
| Series 09B, 1.26% tender 6/1/18, CP mode | | 1,500 | 1,500 |
| Series 2009 B, 1.38% tender 7/2/18, CP mode | | 2,150 | 2,150 |
| Series K1: | | | |
| 1.2% 4/2/18, CP | | 5,000 | 5,000 |
| 1.25% 4/3/18, CP | | 1,900 | 1,900 |
| 1.31% 6/4/18, CP | | 5,100 | 5,100 |
| Series K2: | | | |
| 1.34% 11/30/18, CP | | 12,000 | 12,000 |
| 1.35% 12/7/18, CP | | 2,500 | 2,500 |
| | | | 51,146 |
| Minnesota - 0.4% | | | |
| Minneapolis Health Care Sys. Rev. Bonds (Fairview Hsp & Hltcare Srv Sys.) Series 2008 A, 6.75% 11/15/18 (Pre-Refunded to 11/15/18 @ 100) | | 1,000 | 1,032 |
| Univ. of Minnesota Gen. Oblig.: | | | |
| Series 17F: | | | |
| 1.22% 5/22/18, CP | | 5,000 | 5,000 |
| 1.26% 6/1/18, CP | | 1,500 | 1,500 |
| Series 2007 C, 1.31% 6/1/18, CP | | 5,100 | 5,100 |
| Series D, 1.38% 7/2/18, CP | | 3,400 | 3,400 |
| Univ. of Minnesota Rev.: | | | |
| Series 2018 A, 1.44% 4/2/18, CP | | 200 | 200 |
| Series A, 1.07% 4/2/18, CP | | 3,000 | 3,000 |
| | | | 19,232 |
| Missouri - 0.3% | | | |
| Curators of the Univ. of Missouri Series A, 1.25% 6/4/18, CP | | 14,400 | 14,400 |
| Montana - 0.2% | | | |
| Montana Board of Invt. Bonds: | | | |
| (Intercap Revolving Prog.) Series 2017, 1.65%, tender 3/1/19 (a) | | 4,460 | 4,460 |
| Series 2017: | | | |
| 1.65%, tender 3/1/19 (a) | | 1,925 | 1,925 |
| 1.65%, tender 3/1/19 (a) | | 2,680 | 2,680 |
| | | | 9,065 |
| Nebraska - 0.9% | | | |
| Omaha Pub. Pwr. District Elec. Rev.: | | | |
| Series 2018 A: | | | |
| 1.36% 4/4/18, CP | | 3,000 | 3,000 |
| 1.36% 4/5/18, CP | | 2,800 | 2,800 |
| Series A: | | | |
| 1.2% 4/3/18, CP | | 3,170 | 3,170 |
| 1.22% 5/22/18, CP | | 14,300 | 14,300 |
| 1.32% 7/6/18, CP | | 1,900 | 1,900 |
| 1.33% 6/5/18, CP | | 6,900 | 6,900 |
| 1.34% 6/4/18, CP | | 5,355 | 5,355 |
| 1.38% 7/2/18, CP | | 3,500 | 3,500 |
| | | | 40,925 |
| Nevada - 0.2% | | | |
| Clark County School District Bonds: | | | |
| Series 2014 B, 5% 6/15/18 | | 3,500 | 3,525 |
| Series 2015 A, 5% 6/15/18 | | 1,000 | 1,008 |
| Truckee Meadows Wtr. Auth. Wtr. Rev. Series 2018, 1.36% 4/4/18, LOC Bank of Tokyo-Mitsubishi UFJ Ltd., CP | | 3,250 | 3,250 |
| | | | 7,783 |
| New Hampshire - 0.2% | | | |
| New Hampshire Bus. Fin. Auth. Poll. Cont. Rev. Bonds (New England Pwr. Co.) Series 1990 B, 1.38% tender 4/11/18, CP mode | | 7,900 | 7,900 |
| New Jersey - 0.8% | | | |
| Bloomfield Township Gen. Oblig. BAN Series 2018: | | | |
| 1.75% 4/12/18 | | 5,300 | 5,300 |
| 3% 4/9/19 (c) | | 1,200 | 1,214 |
| Burlington County Bridge Commission Lease Rev. BAN (Governmental Leasing Prog.) Series 2017 C, 2.5% 12/12/18 | | 1,400 | 1,410 |
| Camden County BAN Series 2017 A, 3% 10/25/18 | | 3,700 | 3,736 |
| Englewood Gen. Oblig. BAN Series 2017, 2.5% 4/4/18 | | 1,900 | 1,900 |
| Hudson County Gen. Oblig. BAN Series 2017, 3% 12/12/18 | | 13,000 | 13,134 |
| Ocean City Gen. Oblig. BAN Series 2017 A, 2.5% 11/28/18 | | 2,500 | 2,520 |
| Passaic County Gen. Oblig. BAN Series A, 2.5% 12/6/18 | | 7,800 | 7,858 |
| | | | 37,072 |
| New York - 0.9% | | | |
| Albany County Gen. Oblig. BAN Series 2017, 4% 5/24/18 | | 2,700 | 2,710 |
| New York City Trust For Cultural Bonds (American Museum Natural History) Series 2014 B1, SIFMA Municipal Swap Index + 0.040% 1.4%, tender 10/9/18 (a)(e) | | 7,325 | 7,325 |
| New York Pwr. Auth.: | | | |
| Series 1, 1.6% 4/11/18, CP | | 2,500 | 2,500 |
| Series 2, 1.33% 4/12/18, CP | | 5,600 | 5,600 |
| Westchester County Gen. Oblig.: | | | |
| BAN Series A, 3% 12/14/18 | | 1,300 | 1,314 |
| TAN Series 2018, 2% 5/29/18 | | 22,500 | 22,526 |
| | | | 41,975 |
| North Carolina - 0.2% | | | |
| North Carolina Eastern Muni. Pwr. Agcy. Pwr. Sys. Rev. Bonds Series 2009 B, 5% 1/1/19 (Pre-Refunded to 1/1/19 @ 100) | | 8,300 | 8,519 |
| North Carolina Gen. Oblig. Bonds Series 2014 A, 5% 6/1/18 | | 2,400 | 2,415 |
| | | | 10,934 |
| Ohio - 0.7% | | | |
| Brunswick Ohio City School District BAN Series 2018, 2.5% 5/31/18 | | 2,500 | 2,504 |
| Butler County Gen. Oblig. BAN: | | | |
| Series 2017, 2.5% 7/26/18 | | 6,380 | 6,397 |
| Series 2018, 3% 1/24/19 | | 1,500 | 1,517 |
| Delaware Gen. Oblig. BAN Series 2017, 2% 4/12/18 | | 700 | 700 |
| Geauga County Ohio Pub. Libr BAN Series 2017, 2.25% 6/28/18 (Ohio Gen. Oblig. Guaranteed) | | 3,900 | 3,908 |
| Lucas County Gen. Oblig. BAN Series 2017, 2% 7/11/18 | | 1,200 | 1,201 |
| North Ridgeville Gen. Oblig. BAN Series 2017, 2% 6/18/18 | | 800 | 801 |
| Ohio Higher Edl. Facility Commission Rev. Bonds: | | | |
| (the Cleveland Clinic Foundation): | | | |
| Series 2018 B-5, 1.36% tender 4/5/18, CP mode | | 3,100 | 3,100 |
| Series 2018 B-6, 1.36% tender 4/5/18, CP mode | | 4,600 | 4,600 |
| Series 08B5, 1.29% tender 4/12/18, CP mode | | 4,200 | 4,200 |
| | | | 28,928 |
| Oklahoma - 0.1% | | | |
| Oklahoma City Wtr. Utils. Trust Wtr. and Swr. Rev. Series A, 1.3% 5/2/18 (Liquidity Facility State Street Bank & Trust Co., Boston), CP | | 2,800 | 2,800 |
| Oklahoma Dev. Fin. Auth. Health Sys. Rev. Bonds Series 2015 B, SIFMA Municipal Swap Index + 0.350% 1.93%, tender 10/25/18 (a)(e) | | 1,705 | 1,705 |
| | | | 4,505 |
| Oregon - 0.1% | | | |
| Oregon Gen. Oblig. TAN Series 2017 A, 5% 9/28/18 | | 5,800 | 5,896 |
| Pennsylvania - 0.3% | | | |
| Northampton County Gen. Purp. Auth. Hosp. Rev. Bonds (St Lukes Hosp. & Health Ntw Proj.) Series 2008 A, 5.5% 8/15/18 (Pre-Refunded to 8/15/18 @ 100) | | 600 | 610 |
| Pennsylvania Econ. Dev. Fin. Auth. Unemployment Compensation Rev. Bonds Series 2012 A, 5% 7/1/18 | | 3,645 | 3,679 |
| Pennsylvania Gen. Oblig. Bonds: | | | |
| Series 2009, 5% 7/1/18 | | 600 | 605 |
| Series 2012, 5% 7/1/18 | | 780 | 787 |
| Philadelphia Gen. Oblig. TRAN Series 2017 A, 2% 6/29/18 | | 3,300 | 3,305 |
| Southcentral Pennsylvania Gen. Auth. Rev. Bonds 6% 6/1/18 (Pre-Refunded to 6/1/18 @ 100) | | 2,500 | 2,520 |
| | | | 11,506 |
| South Carolina - 0.1% | | | |
| South Carolina Pub. Svc. Auth. Rev. Bonds Series 2008 A, 5.5% 1/1/19 (Pre-Refunded to 1/1/19 @ 100) | | 2,100 | 2,161 |
| Tennessee - 0.5% | | | |
| Metropolitan Govt. Nashville & Davidson County Wtr. & Swr. Sys. Rev. Series A, 1.3% 4/5/18, LOC Bank of Tokyo-Mitsubishi UFJ Ltd., CP | | 5,300 | 5,300 |
| Nashville and Davidson County Metropolitan Govt. Gen. Oblig.: | | | |
| Series B1: | | | |
| 1.22% 4/2/18 (Liquidity Facility JPMorgan Chase Bank), CP | | 5,800 | 5,800 |
| 1.52% 5/21/18 (Liquidity Facility JPMorgan Chase Bank), CP | | 6,100 | 6,100 |
| Series B2: | | | |
| 1.18% 4/2/18 (Liquidity Facility MUFG Union Bank NA), CP | | 2,200 | 2,200 |
| 1.19% 4/2/18 (Liquidity Facility MUFG Union Bank NA), CP | | 2,200 | 2,200 |
| 1.34% 5/31/18 (Liquidity Facility MUFG Union Bank NA), CP | | 2,300 | 2,300 |
| | | | 23,900 |
| Texas - 8.6% | | | |
| Austin Elec. Util. Sys. Rev.: | | | |
| Bonds 0% 5/15/18 | | 5,100 | 5,092 |
| Series A: | | | |
| 1.2% 4/4/18 (Liquidity Facility JPMorgan Chase Bank), CP | | 8,700 | 8,700 |
| 1.22% 4/4/18 (Liquidity Facility JPMorgan Chase Bank), CP | | 4,070 | 4,070 |
| 1.22% 4/5/18 (Liquidity Facility JPMorgan Chase Bank), CP | | 23,700 | 23,700 |
| Fort Bend Independent School District Series 2018: | | | |
| 1.35% 6/5/18 (Liquidity Facility JPMorgan Chase Bank), CP | | 8,000 | 8,000 |
| 1.35% 6/5/18 (Liquidity Facility JPMorgan Chase Bank), CP | | 1,200 | 1,200 |
| 1.54% 6/5/18 (Liquidity Facility JPMorgan Chase Bank), CP | | 1,200 | 1,200 |
| Harris County Cultural Ed. Facilities Fin. Corp. Rev. Bonds: | | | |
| (Texas Children's Hosp. Proj.) Series 2015 2, SIFMA Municipal Swap Index + 0.200% 1.78%, tender 10/25/18 (a)(e) | | 2,900 | 2,900 |
| Series 16B1, 1.24% tender 5/2/18, CP mode | | 11,000 | 11,000 |
| Series 16B3, 1.17% tender 4/4/18, CP mode | | 7,800 | 7,800 |
| Series 2016 B2, 1.33% tender 6/5/18, CP mode | | 24,500 | 24,500 |
| Harris County Gen. Oblig.: | | | |
| Series D, 1.25% 4/5/18 (Liquidity Facility JPMorgan Chase Bank), CP | | 8,300 | 8,300 |
| Series E1: | | | |
| 1.5% 5/3/18, LOC Landesbank Hessen-Thuringen, CP | | 3,200 | 3,200 |
| 1.68% 5/3/18, LOC Landesbank Hessen-Thuringen, CP | | 2,000 | 2,000 |
| Harris County Metropolitan Trans. Auth.: | | | |
| Series 2018 A-1: | | | |
| 1.35% 5/3/18 (Liquidity Facility JPMorgan Chase Bank), CP | | 5,700 | 5,700 |
| 1.36% 4/4/18 (Liquidity Facility JPMorgan Chase Bank), CP | | 5,900 | 5,900 |
| Series A1, 1.27% 5/15/18 (Liquidity Facility JPMorgan Chase Bank), CP | | 6,750 | 6,750 |
| Series A3: | | | |
| 1.27% 5/15/18 (Liquidity Facility State Street Bank & Trust Co., Boston), CP | | 2,900 | 2,900 |
| 1.28% 5/17/18 (Liquidity Facility State Street Bank & Trust Co., Boston), CP | | 3,700 | 3,700 |
| Houston Gen. Oblig. Series E1, 1.6% 6/13/18, LOC Citibank NA, CP | | 1,200 | 1,200 |
| Lower Colorado River Auth. Rev.: | | | |
| Series 2017, 1.04% 4/3/18, LOC JPMorgan Chase Bank, LOC State Street Bank & Trust Co., Boston, CP | | 2,400 | 2,400 |
| Series 2018, 1.18% 4/3/18, LOC JPMorgan Chase Bank, LOC State Street Bank & Trust Co., Boston, CP | | 2,000 | 2,000 |
| Series B, 1.3% 5/21/18, LOC State Street Bank & Trust Co., Boston, CP | | 6,700 | 6,700 |
| Tarrant County Cultural Ed. Facilities Fin. Corp. Hosp. Rev. Bonds (Baylor Health Care Sys. Proj.): | | | |
| Series 2011 B, BMA Municipal Swap Index + 0.300% 1.88%, tender 10/25/18 (a)(e) | | 8,400 | 8,400 |
| Series 2013 B, SIFMA Municipal Swap Index + 0.300% 1.88%, tender 10/25/18 (a)(e) | | 2,400 | 2,400 |
| Texas A&M Univ. Rev. Series B: | | | |
| 1.22% 5/3/18, CP | | 1,900 | 1,900 |
| 1.23% 4/10/18, CP | | 4,500 | 4,500 |
| 1.25% 6/5/18, CP | | 1,800 | 1,800 |
| Texas Gen. Oblig. TRAN Series 2017, 4% 8/30/18 | | 167,045 | 168,811 |
| Univ. of Texas Board of Regents Sys. Rev.: | | | |
| Series 2018, 1.23% 4/2/18 (Liquidity Facility Univ. of Texas Invt. Mgmt. Co.), CP | | 5,400 | 5,400 |
| Series A: | | | |
| 1.05% 4/5/18 (Liquidity Facility Univ. of Texas Invt. Mgmt. Co.), CP | | 4,300 | 4,300 |
| 1.31% 6/5/18 (Liquidity Facility Univ. of Texas Invt. Mgmt. Co.), CP | | 9,124 | 9,124 |
| 1.49% 8/14/18 (Liquidity Facility Univ. of Texas Invt. Mgmt. Co.), CP | | 3,419 | 3,419 |
| 1.55% 7/20/18 (Liquidity Facility Univ. of Texas Invt. Mgmt. Co.), CP | | 6,100 | 6,100 |
| Univ. of Texas Permanent Univ. Fund Rev.: | | | |
| Series 2018 A, 1.38% 4/3/18, CP | | 5,000 | 5,000 |
| Series A: | | | |
| 1.41% 8/2/18, CP | | 5,800 | 5,800 |
| 1.41% 8/6/18, CP | | 5,800 | 5,800 |
| Upper Trinity Reg'l. Wtr. District Series 2018: | | | |
| 1.35% 7/6/18, LOC Bank of America NA, CP | | 2,200 | 2,200 |
| 1.4% 8/6/18, LOC Bank of America NA, CP | | 2,900 | 2,900 |
| | | | 386,766 |
| Virginia - 0.3% | | | |
| Norfolk Econ. Dev. Auth. Rev. Series 97, 1.22% 4/5/18, CP | | 2,800 | 2,800 |
| Univ. of Virginia Gen. Rev.: | | | |
| Series 03A, 1.34% 4/4/18, CP | | 2,000 | 2,000 |
| Series A: | | | |
| 1.48% 4/9/18, CP | | 6,200 | 6,200 |
| 1.55% 4/26/18, CP | | 1,000 | 1,000 |
| Virginia Pub. School Auth. Bonds (Virginia Gen. Oblig.) Series 2012 A, 5% 8/1/18 | | 3,300 | 3,339 |
| | | | 15,339 |
| Washington - 0.7% | | | |
| Energy Northwest Elec. Rev. Bonds: | | | |
| (Proj. 3) Series 2016 A, 5% 7/1/18 | | 1,225 | 1,235 |
| Series 2014-A, 5% 7/1/18 | | 8,885 | 8,963 |
| Univ. of Washington Univ. Revs. Series 8, 1.31% 6/1/18, CP | | 12,300 | 12,300 |
| Washington Gen. Oblig. Bonds: | | | |
| Series 2011 B, 5% 7/1/18 | | 3,000 | 3,027 |
| Series 2013 B, 5% 7/1/18 | | 4,900 | 4,944 |
| | | | 30,469 |
| Wisconsin - 1.1% | | | |
| Wisconsin Gen. Oblig.: | | | |
| Series 06A, 1.35% 7/6/18 (Liquidity Facility BMO Harris Bank NA), CP | | 2,400 | 2,400 |
| Series 16A, 1.31% 6/5/18 (Liquidity Facility BMO Harris Bank NA), CP | | 32,000 | 32,000 |
| Series 2018 A, 1.43% 5/22/18 (Liquidity Facility BMO Harris Bank NA), CP | | 3,400 | 3,400 |
| Wisconsin Trans. Rev. Series 13A: | | | |
| 1.3% 6/4/18 (Liquidity Facility State Street Bank & Trust Co., Boston), CP | | 4,040 | 4,040 |
| 1.31% 6/5/18 (Liquidity Facility State Street Bank & Trust Co., Boston), CP | | 9,000 | 9,000 |
| | | | 50,840 |
| TOTAL OTHER MUNICIPAL SECURITY | | | |
| (Cost $1,298,477) | | | 1,298,477 |
| | | Shares (000s) | Value (000s) |
|
| Investment Company - 6.0% | | | |
| Fidelity Tax-Free Cash Central Fund, 1.14% (g)(h) | | | |
| (Cost $269,883) | | 269,855 | 269,883 |
| TOTAL INVESTMENT IN SECURITIES - 99.0% | | | |
| (Cost $4,447,545) | | | 4,447,545 |
| NET OTHER ASSETS (LIABILITIES) - 1.0% | | | 45,309 |
| NET ASSETS - 100% | | | $4,492,854 |
Security Type Abbreviations
BAN – BOND ANTICIPATION NOTE
CP – COMMERCIAL PAPER
TAN – TAX ANTICIPATION NOTE
TRAN – TAX AND REVENUE ANTICIPATION NOTE
VRDN – VARIABLE RATE DEMAND NOTE (A debt instrument that is payable upon demand, either daily, weekly or monthly)
The date shown for securities represents the date when principal payments must be paid, taking into account any call options exercised by the issuer and any permissible maturity shortening features other than interest rate resets.
Legend
(a) Coupon rates for floating and adjustable rate securities reflect the rates in effect at period end.
(b) Security exempt from registration under Rule 144A of the Securities Act of 1933. These securities may be resold in transactions exempt from registration, normally to qualified institutional buyers. At the end of the period, the value of these securities amounted to $35,234,000 or 0.8% of net assets.
(c) Security or a portion of the security purchased on a delayed delivery or when-issued basis.
(d) Provides evidence of ownership in one or more underlying municipal bonds.
(e) Coupon is indexed to a floating interest rate which may be multiplied by a specified factor and/or subject to caps or floors.
(f) Restricted securities - Investment in securities not registered under the Securities Act of 1933 (excluding 144A issues). At the end of the period, the value of restricted securities (excluding 144A issues) amounted to $157,120,000 or 3.5% of net assets.
(g) Information in this report regarding holdings by state and security types does not reflect the holdings of the Fidelity Tax-Free Cash Central Fund.
(h) Affiliated fund that is available only to investment companies and other accounts managed by Fidelity Investments. The rate quoted is the annualized seven-day yield of the fund at period end. A complete unaudited listing of the fund's holdings as of its most recent quarter end is available upon request. In addition, each Fidelity Central Fund's financial statements, which are not covered by the Fund's Report of Independent Registered Public Accounting Firm, are available on the SEC's website or upon request.
Additional information on each restricted holding is as follows:
| Security | Acquisition Date | Cost (000s) |
| Allegheny County Hosp. Dev. Auth. Rev. Bonds Series E72, SIFMA Municipal Swap Index + 0.170% 1.75%, tender 6/1/18 (Liquidity Facility Royal Bank of Canada) | 6/1/16 - 1/19/18 | $11,600 |
| Berks County Muni. Auth. Rev. Participating VRDN Series Floaters 001, 1.76% 5/10/18 (Liquidity Facility Barclays Bank PLC) | 1/18/18 | $4,200 |
| Central Fla Expwy Auth. Rev. Bonds Series Floaters E 62, SIFMA Municipal Swap Index + 0.170% 1.75%, tender 7/2/18 (Liquidity Facility Royal Bank of Canada) | 8/1/16 - 2/14/18 | $16,995 |
| Central Fla Expwy Auth. Rev. Participating VRDN Series Floaters 004, 1.76% 5/10/18 (Liquidity Facility Barclays Bank PLC) | 1/18/18 - 2/27/18 | $16,100 |
| Chicago Board of Ed. Participating VRDN Series Floaters 003, 1.83% 5/10/18 (Liquidity Facility Barclays Bank PLC) | 2/1/18 - 3/5/18 | $19,600 |
| Chicago Board of Ed. Participating VRDN Series Floaters 006, 1.83% 5/10/18 (Liquidity Facility Barclays Bank PLC) | 3/1/18 | $12,900 |
| Connecticut Gen. Oblig. Participating VRDN Series Floaters 014, 1.76% 5/10/18 (Liquidity Facility Barclays Bank PLC) | 6/29/17 - 2/26/18 | $5,800 |
| Dignity Health Participating VRDN Series 17 04, SIFMA Municipal Swap Index + 0.160% 1.74% 5/10/18 (Liquidity Facility Barclays Bank PLC) | 10/5/17 | $1,790 |
| Indiana Univ. HealthCare Bonds Series 16 E71, SIFMA Municipal Swap Index + 0.170% 1.75%, tender 5/1/18 (Liquidity Facility Royal Bank of Canada) | 3/1/18 | $35,300 |
| Los Angeles Hbr. Dept. Rev. Bonds Series WF 10 40C, SIFMA Municipal Swap Index + 0.280% 1.86%, tender 7/26/18 (Liquidity Facility Wells Fargo Bank NA) | 3/22/12 | $1,400 |
| Massachusetts Gen. Oblig. Bonds Series Clipper 09 69, SIFMA Municipal Swap Index + 0.180% 1.76%, tender 6/7/18 (Liquidity Facility State Street Bank & Trust Co., Boston) | 9/28/16 | $1,175 |
| Middletown Hosp. Facilities Rev. Participating VRDN Series Floaters 00 31 44, 1.76% 5/10/18 (Liquidity Facility Barclays Bank PLC) | 9/14/17 | $1,880 |
| Missoula Mont Wtr. Sys. Rev. Participating VRDN Series Floaters 011, 1.76% 5/10/18 (Liquidity Facility Barclays Bank PLC) | 7/20/17 - 3/2/18 | $12,300 |
| Ohio Higher Edl. Facility Commission Rev. Participating VRDN Series 2017, 1.76% 5/10/18 (Liquidity Facility Barclays Bank PLC) | 3/9/17 - 1/11/18 | $1,100 |
| Pennsylvania Higher Edl. Facilities Auth. Rev. Bonds Series 2016 E75, SIFMA Municipal Swap Index + 0.170% 1.75%, tender 7/1/18 (Liquidity Facility Royal Bank of Canada) | 2/2/18 - 2/14/18 | $2,595 |
| Pennsylvania Higher Edl. Facilities Auth. Rev. Bonds Series WF 11 26C, SIFMA Municipal Swap Index + 0.280% 1.86%, tender 7/26/18 (Liquidity Facility Wells Fargo Bank NA) | 11/10/16 | $1,500 |
| Riverton Hosp. Rev. Bonds Series WF 11 35C, SIFMA Municipal Swap Index + 0.280% 1.86%, tender 7/26/18 (Liquidity Facility Wells Fargo Bank NA) | 3/24/11 | $5,530 |
| Seattle Muni. Lt. & Pwr. Rev. Bonds Series WF 11-18C, SIFMA Municipal Swap Index + 0.280% 1.86%, tender 7/26/18 (Liquidity Facility Wells Fargo Bank NA) | 2/11/16 | $600 |
| Washington Gen. Oblig. Bonds Series WF 11-16C, SIFMA Municipal Swap Index + 0.280% 1.86%, tender 7/26/18 (Liquidity Facility Wells Fargo Bank NA) | 5/9/13 - 2/18/16 | $2,500 |
| Wisconsin Gen. Oblig. Participating VRDN Series Clipper 09 36, SIFMA Municipal Swap Index + 0.180% 1.76% 6/7/18 (Liquidity Facility State Street Bank & Trust Co., Boston) | 9/15/16 - 6/1/17 | $1,455 |
| Wisconsin Gen. Oblig. Participating VRDN Series Clipper 09 53, SIFMA Municipal Swap Index + 0.180% 1.76% 4/5/18 (Liquidity Facility State Street Bank & Trust Co., Boston) | 9/12/16 | $800 |
Affiliated Central Funds
Information regarding fiscal year to date income earned by the Fund from investments in Fidelity Central Funds is as follows:
| Fund | Income earned |
| | (Amounts in thousands) |
| Fidelity Tax-Free Cash Central Fund | $1,911 |
| Total | $1,911 |
Amounts in the income column in the above table exclude any capital gain distributions from underlying funds, which are presented in the corresponding line-item in the Statement of Operations if applicable.
Investment Valuation
All investments are categorized as Level 2 under the Fair Value Hierarchy. The inputs or methodology used for valuing securities may not be an indication of the risk associated with investing in those securities. For more information on valuation inputs please refer to the Investment Valuation section in the accompanying Notes to Financial Statements.
See accompanying notes which are an integral part of the financial statements.
Tax-Exempt Portfolio
Financial Statements
Statement of Assets and Liabilities
| Amounts in thousands (except per-share amounts) | | March 31, 2018 |
| Assets | | |
Investment in securities, at value — See accompanying schedule:
Unaffiliated issuers (cost $4,177,662) | $4,177,662 | |
| Fidelity Central Funds (cost $269,883) | 269,883 | |
| Total Investment in Securities (cost $4,447,545) | | $4,447,545 |
| Cash | | 16,344 |
| Receivable for investments sold | | |
| Regular delivery | | 10,000 |
| Delayed delivery | | 37,365 |
| Receivable for fund shares sold | | 6,015 |
| Interest receivable | | 14,716 |
| Distributions receivable from Fidelity Central Funds | | 369 |
| Prepaid expenses | | 2 |
| Receivable from investment adviser for expense reductions | | 112 |
| Other receivables | | 61 |
| Total assets | | 4,532,529 |
| Liabilities | | |
| Payable for investments purchased | | |
| Regular delivery | $9,700 | |
| Delayed delivery | 21,168 | |
| Payable for fund shares redeemed | 7,946 | |
| Distributions payable | 2 | |
| Accrued management fee | 507 | |
| Distribution and service plan fees payable | 1 | |
| Other affiliated payables | 248 | |
| Other payables and accrued expenses | 103 | |
| Total liabilities | | 39,675 |
| Net Assets | | $4,492,854 |
| Net Assets consist of: | | |
| Paid in capital | | $4,492,934 |
| Distributions in excess of net investment income | | (1) |
| Accumulated undistributed net realized gain (loss) on investments | | (79) |
| Net Assets | | $4,492,854 |
| Class I: | | |
| Net Asset Value, offering price and redemption price per share ($4,488,161 ÷ 4,486,985 shares) | | $1.00 |
| Class II: | | |
| Net Asset Value, offering price and redemption price per share ($384 ÷ 384 shares) | | $1.00 |
| Class III: | | |
| Net Asset Value, offering price and redemption price per share ($3,163 ÷ 3,163 shares) | | $1.00 |
| Select Class: | | |
| Net Asset Value, offering price and redemption price per share ($1,146 ÷ 1,145 shares) | | $1.00 |
See accompanying notes which are an integral part of the financial statements.
Statement of Operations
| Amounts in thousands | | Year ended March 31, 2018 |
| Investment Income | | |
| Interest | | $31,382 |
| Income from Fidelity Central Funds | | 1,911 |
| Total income | | 33,293 |
| Expenses | | |
| Management fee | $4,483 | |
| Transfer agent fees | 1,921 | |
| Distribution and service plan fees | 13 | |
| Accounting fees and expenses | 289 | |
| Custodian fees and expenses | 27 | |
| Independent trustees' fees and expenses | 10 | |
| Registration fees | 172 | |
| Audit | 43 | |
| Legal | 5 | |
| Miscellaneous | 11 | |
| Total expenses before reductions | 6,974 | |
| Expense reductions | (1,203) | 5,771 |
| Net investment income (loss) | | 27,522 |
| Realized and Unrealized Gain (Loss) | | |
| Net realized gain (loss) on: | | |
| Investment securities: | | |
| Unaffiliated issuers | (27) | |
| Fidelity Central Funds | 8 | |
| Capital gain distributions from Fidelity Central Funds | 2 | |
| Total net realized gain (loss) | | (17) |
| Net increase in net assets resulting from operations | | $27,505 |
See accompanying notes which are an integral part of the financial statements.
Statement of Changes in Net Assets
| Amounts in thousands | Year ended March 31, 2018 | Year ended March 31, 2017 |
| Increase (Decrease) in Net Assets | | |
| Operations | | |
| Net investment income (loss) | $27,522 | $7,112 |
| Net realized gain (loss) | (17) | (14) |
| Net increase in net assets resulting from operations | 27,505 | 7,098 |
| Distributions to shareholders from net investment income | (27,522) | (7,113) |
| Distributions to shareholders from net realized gain | – | (1,040) |
| Total distributions | (27,522) | (8,153) |
| Share transactions - net increase (decrease) | 2,225,123 | 619,958 |
| Total increase (decrease) in net assets | 2,225,106 | 618,903 |
| Net Assets | | |
| Beginning of period | 2,267,748 | 1,648,845 |
| End of period | $4,492,854 | $2,267,748 |
| Other Information | | |
| Distributions in excess of net investment income end of period | $(1) | $(2) |
See accompanying notes which are an integral part of the financial statements.
Financial Highlights
Tax-Exempt Portfolio Class I
| Years ended March 31, | 2018 | 2017 | 2016 | 2015 | 2014 |
| Selected Per–Share Data | | | | | |
| Net asset value, beginning of period | $1.00 | $1.00 | $1.00 | $1.00 | $1.00 |
| Income from Investment Operations | | | | | |
| Net investment income (loss) | .008 | .004 | –A | –A | –A |
| Net realized and unrealized gain (loss) | –A | .001B | .001 | –A | –A |
| Total from investment operations | .008 | .005 | .001 | –A | –A |
| Distributions from net investment income | (.008) | (.004) | –A | –A | –A |
| Distributions from net realized gain | – | (.001) | (.001) | –A | –A |
| Total distributions | (.008) | (.005) | (.001) | –A | –A |
| Net asset value, end of period | $1.00 | $1.00 | $1.00 | $1.00 | $1.00 |
| Total ReturnC | .84% | .50% | .08% | .03% | .02% |
| Ratios to Average Net AssetsD,E | | | | | |
| Expenses before reductions | .22% | .22% | .22% | .22% | .22% |
| Expenses net of fee waivers, if any | .18% | .18% | .05% | .06% | .11% |
| Expenses net of all reductions | .18% | .18% | .05% | .06% | .10% |
| Net investment income (loss) | .86% | .44% | .01% | .01% | .01% |
| Supplemental Data | | | | | |
| Net assets, end of period (in millions) | $4,488 | $2,262 | $1,429 | $2,166 | $2,055 |
A Amount represents less than $.0005 per share.
B The amount shown for a share outstanding does not correspond with the aggregate net gain (loss) on investment for the period due to the timing of sales and repurchases of shares in relation to fluctuating market values of the investments of the Fund.
C Total returns would have been lower if certain expenses had not been reduced during the applicable periods shown.
D Fees and expenses of any underlying Fidelity Central Funds are not included in the Fund's expense ratio. The Fund indirectly bears its proportionate share of the expenses of any underlying Fidelity Central Funds.
E Expense ratios reflect operating expenses of the class. Expenses before reductions do not reflect amounts reimbursed or waived or reductions from expense offset arrangements and do not represent the amount paid by the class during periods when reimbursements, waivers or reductions occur. Expenses net of fee waivers reflect expenses after reimbursement and waivers but prior to reductions from expense offset arrangements. Expenses net of all reductions represent the net expenses paid by the class.
See accompanying notes which are an integral part of the financial statements.
Tax-Exempt Portfolio Class II
| Years ended March 31, | 2018 | 2017 | 2016 | 2015 | 2014 |
| Selected Per–Share Data | | | | | |
| Net asset value, beginning of period | $1.00 | $1.00 | $1.00 | $1.00 | $1.00 |
| Income from Investment Operations | | | | | |
| Net investment income (loss) | .007 | .003 | –A | –A | –A |
| Net realized and unrealized gain (loss) | –A | –A | .001 | –A | –A |
| Total from investment operations | .007 | .003 | .001 | –A | –A |
| Distributions from net investment income | (.007) | (.003) | –A | –A | –A |
| Distributions from net realized gain | – | (.001) | (.001) | –A | –A |
| Total distributions | (.007) | (.003)B | (.001) | –A | –A |
| Net asset value, end of period | $1.00 | $1.00 | $1.00 | $1.00 | $1.00 |
| Total ReturnC | .69% | .35% | .08% | .03% | .02% |
| Ratios to Average Net AssetsD,E | | | | | |
| Expenses before reductions | .37% | .37% | .37% | .37% | .37% |
| Expenses net of fee waivers, if any | .33% | .33% | .06% | .06% | .11% |
| Expenses net of all reductions | .33% | .33% | .05% | .06% | .10% |
| Net investment income (loss) | .71% | .29% | .01% | .01% | .01% |
| Supplemental Data | | | | | |
| Net assets, end of period (in millions) | $–F | $–F | $1 | $12 | $12 |
A Amount represents less than $.0005 per share.
B Total distributions of $.003 per share is comprised of distributions from net investment income of $.0027 and distributions from net realized gain of $.0007 per share.
C Total returns would have been lower if certain expenses had not been reduced during the applicable periods shown.
D Fees and expenses of any underlying Fidelity Central Funds are not included in the Fund's expense ratio. The Fund indirectly bears its proportionate share of the expenses of any underlying Fidelity Central Funds.
E Expense ratios reflect operating expenses of the class. Expenses before reductions do not reflect amounts reimbursed or waived or reductions from expense offset arrangements and do not represent the amount paid by the class during periods when reimbursements, waivers or reductions occur. Expenses net of fee waivers reflect expenses after reimbursement and waivers but prior to reductions from expense offset arrangements. Expenses net of all reductions represent the net expenses paid by the class.
F Amount represents less than $500,000.
See accompanying notes which are an integral part of the financial statements.
Tax-Exempt Portfolio Class III
| Years ended March 31, | 2018 | 2017 | 2016 | 2015 | 2014 |
| Selected Per–Share Data | | | | | |
| Net asset value, beginning of period | $1.00 | $1.00 | $1.00 | $1.00 | $1.00 |
| Income from Investment Operations | | | | | |
| Net investment income (loss) | .006 | .002 | –A | –A | –A |
| Net realized and unrealized gain (loss) | –A | .001B | .001 | –A | –A |
| Total from investment operations | .006 | .003 | .001 | –A | –A |
| Distributions from net investment income | (.006) | (.002) | –A | –A | –A |
| Distributions from net realized gain | – | (.001) | (.001) | –A | –A |
| Total distributions | (.006) | (.003) | (.001) | –A | –A |
| Net asset value, end of period | $1.00 | $1.00 | $1.00 | $1.00 | $1.00 |
| Total ReturnC | .59% | .25% | .08% | .03% | .02% |
| Ratios to Average Net AssetsD,E | | | | | |
| Expenses before reductions | .46% | .47% | .47% | .47% | .47% |
| Expenses net of fee waivers, if any | .43% | .39% | .06% | .06% | .11% |
| Expenses net of all reductions | .43% | .39% | .06% | .06% | .10% |
| Net investment income (loss) | .61% | .23% | .01% | .01% | .01% |
| Supplemental Data | | | | | |
| Net assets, end of period (in millions) | $3 | $5 | $215 | $285 | $275 |
A Amount represents less than $.0005 per share.
B The amount shown for a share outstanding does not correspond with the aggregate net gain (loss) on investments for the period due to the timing of sales and repurchases of shares in relation to fluctuating markets value of the investments of the Fund.
C Total returns would have been lower if certain expenses had not been reduced during the applicable periods shown.
D Fees and expenses of any underlying Fidelity Central Funds are not included in the Fund's expense ratio. The Fund indirectly bears its proportionate share of the expenses of any underlying Fidelity Central Funds.
E Expense ratios reflect operating expenses of the class. Expenses before reductions do not reflect amounts reimbursed or waived or reductions from expense offset arrangements and do not represent the amount paid by the class during periods when reimbursements, waivers or reductions occur. Expenses net of fee waivers reflect expenses after reimbursement and waivers but prior to reductions from expense offset arrangements. Expenses net of all reductions represent the net expenses paid by the class.
See accompanying notes which are an integral part of the financial statements.
Tax-Exempt Portfolio Select Class
| Years ended March 31, | 2018 | 2017 | 2016 | 2015 | 2014 |
| Selected Per–Share Data | | | | | |
| Net asset value, beginning of period | $1.00 | $1.00 | $1.00 | $1.00 | $1.00 |
| Income from Investment Operations | | | | | |
| Net investment income (loss) | .008 | .004 | –A | –A | –A |
| Net realized and unrealized gain (loss) | –A | –A | .001 | –A | –A |
| Total from investment operations | .008 | .004 | .001 | –A | –A |
| Distributions from net investment income | (.008) | (.004) | –A | –A | –A |
| Distributions from net realized gain | – | (.001) | (.001) | –A | –A |
| Total distributions | (.008) | (.004)B | (.001) | –A | –A |
| Net asset value, end of period | $1.00 | $1.00 | $1.00 | $1.00 | $1.00 |
| Total ReturnC | .79% | .44% | .08% | .03% | .02% |
| Ratios to Average Net AssetsD,E | | | | | |
| Expenses before reductions | .27% | .27% | .27% | .27% | .27% |
| Expenses net of fee waivers, if any | .23% | .23% | .06% | .06% | .11% |
| Expenses net of all reductions | .23% | .23% | .06% | .06% | .11% |
| Net investment income (loss) | .81% | .39% | .01% | .01% | .01% |
| Supplemental Data | | | | | |
| Net assets, end of period (in millions) | $1 | $–F | $4 | $4 | $7 |
A Amount represents less than $.0005 per share.
B Total distributions of $.004 per share is comprised of distributions from net investment income of $.0037 and distributions from net realized gain of $.0007 per share.
C Total returns would have been lower if certain expenses had not been reduced during the applicable periods shown.
D Fees and expenses of any underlying Fidelity Central Funds are not included in the Fund's expense ratio. The Fund indirectly bears its proportionate share of the expenses of any underlying Fidelity Central Funds.
E Expense ratios reflect operating expenses of the class. Expenses before reductions do not reflect amounts reimbursed or waived or reductions from expense offset arrangements and do not represent the amount paid by the class during periods when reimbursements, waivers or reductions occur. Expenses net of fee waivers reflect expenses after reimbursement and waivers but prior to reductions from expense offset arrangements. Expenses net of all reductions represent the net expenses paid by the class.
F Amount represents less than $500,000.
See accompanying notes which are an integral part of the financial statements.
Notes to Financial Statements
For the period ended March 31, 2018
(Amounts in thousands except percentages)
1. Organization.
Treasury Only Portfolio, Treasury Portfolio, Government Portfolio, Money Market Portfolio, Prime Money Market Portfolio, Prime Reserves Portfolio and Tax-Exempt Portfolio (the Funds) are funds of Fidelity Colchester Street Trust (the Trust). Each Fund is authorized to issue an unlimited number of shares. The Trust is registered under the Investment Company Act of 1940, as amended (the 1940 Act), as an open-end management investment company organized as a Delaware statutory trust. Each Fund offers Class I, Class II, Class III and Select Class shares. Prime Money Market Portfolio, Treasury Only Portfolio and Treasury Portfolio also offer Class IV and Institutional Class shares. Government Portfolio, Money Market Portfolio and Prime Reserves Portfolio also offer Institutional Class shares. Shares of Money Market Portfolio and Tax-Exempt Portfolio are only available for purchase by retail shareholders. All classes have equal rights as to assets and voting privileges. Each class has exclusive voting rights with respect to matters that affect that class. Each Fund except for Tax-Exempt Portfolio offers conversion privileges from Class I to Institutional Class for eligible shareholders.
Money Market Portfolio offered Class F shares during the period June 26, 2009 through May 20, 2016, and all outstanding shares were redeemed by May 20, 2016. All prior fiscal period dollar and share amounts for Money Market Portfolio Class F presented in the Notes to Financial Statements are for the period April 1, 2016 to May 20, 2016.
In accordance with amendments to Rule 2a-7 of the 1940 Act, Prime Money Market Portfolio and Prime Reserves Portfolio (the Institutional Funds) have each been designated an institutional money market fund, and the value of their shares are calculated to four decimal places that fluctuates based upon changes in the value of their investments.
2. Investments in Fidelity Central Funds.
The Funds may invest in Fidelity Central Funds, which are open-end investment companies generally available only to other investment companies and accounts managed by the investment adviser and its affiliates. The Funds' Schedules of Investments list each of the Fidelity Central Funds held as of period end, if any, as an investment of each Fund, but do not include the underlying holdings of each Fidelity Central Fund. As an Investing Fund, each Fund indirectly bears its proportionate share of the expenses of the underlying Fidelity Central Funds.
The Money Market Central Funds seek preservation of capital and current income and are managed by Fidelity Investments Money Management, Inc. (FIMM), an affiliate of the investment adviser. Annualized expenses of the Money Market Central Funds as of their most recent shareholder report date are less than .005%.
Based on its investment objective, each Fidelity Central Fund may invest or participate in various investment vehicles or strategies that are similar to those of each Fund. These strategies are consistent with the investment objectives of each Fund and may involve certain economic risks which may cause a decline in value of each of the Fidelity Central Funds and thus a decline in the value of each Fund.
3. Significant Accounting Policies.
Each Fund is an investment company and applies the accounting and reporting guidance of the Financial Accounting Standards Board (FASB) Accounting Standards Codification Topic 946 Financial Services – Investments Companies. The financial statements have been prepared in conformity with accounting principles generally accepted in the United States of America (GAAP), which require management to make certain estimates and assumptions at the date of the financial statements. Actual results could differ from those estimates. Subsequent events, if any, through the date that the financial statements were issued have been evaluated in the preparation of the financial statements. The following summarizes the significant accounting policies of the Funds:
Investment Valuation. Investments are valued as of 4:00 p.m. Eastern time on the last calendar day of the period. The Board of Trustees (the Board) has delegated the day to day responsibility for the valuation of each Institutional Fund's investments to the Fair Value Committee (the Committee) established by the Institutional Funds' investment adviser. In accordance with valuation policies and procedures approved by the Board, each Institutional Fund attempts to obtain prices from one or more third party pricing vendors or brokers to value its investments. When current market prices, quotations or currency exchange rates are not readily available or reliable, investments will be fair valued in good faith by the Committee, in accordance with procedures adopted by the Board. Factors used in determining fair value vary by investment type and may include market or investment specific events, changes in interest rates and credit quality. The frequency with which these procedures are used cannot be predicted and they may be utilized to a significant extent. The Committee oversees the Institutional Funds' valuation policies and procedures and reports to the Board on the Committee's activities and fair value determinations. The Board monitors the appropriateness of the procedures used in valuing each Institutional Fund's investments and ratifies the fair value determinations of the Committee.
Each Fund categorizes the inputs to valuation techniques used to value its investments into a disclosure hierarchy consisting of three levels as shown below:
- Level 1 – quoted prices in active markets for identical investments
- Level 2 – other significant observable inputs (including quoted prices for similar investments, interest rates, prepayment speeds, etc.)
- Level 3 – unobservable inputs (including the Fund's own assumptions based on the best information available)
Valuation techniques used to value each Institutional Fund's investments by major category are as follows:
Debt securities, including restricted securities, are valued based on evaluated prices received from third party pricing vendors or from brokers who make markets in such securities. U.S. government and government agency obligations, commercial paper, certificates of deposit and other short-term securities are valued by pricing vendors who utilize matrix pricing which considers yield or price of bonds of comparable quality, coupon, maturity and type or by broker-supplied prices. When independent prices are unavailable or unreliable, debt securities may be valued utilizing pricing methodologies which consider similar factors that would be used by third party pricing vendors. Debt securities are generally categorized as Level 2 in the hierarchy but may be Level 3 depending on the circumstances. Short-term securities with remaining maturities of sixty days or less may be valued at amortized cost, which approximates fair value, and are categorized as Level 2 in the hierarchy.
For Treasury Only Portfolio, Treasury Portfolio, Government Portfolio, Money Market Portfolio and Tax-Exempt Portfolio as permitted by compliance with certain conditions under Rule 2a-7 of the 1940 Act, securities are valued at amortized cost, which approximates fair value. The amortized cost of an instrument is determined by valuing it at its original cost and thereafter amortizing any discount or premium from its face value at a constant rate until maturity.
Securities held by a money market fund are generally high quality and liquid; however, they are reflected as Level 2 because the inputs used to determine fair value are not quoted prices in an active market.
Investment Transactions and Income. Security transactions, including the Funds' investment activity in the Fidelity Central Funds, are accounted for as of trade date. Gains and losses on securities sold are determined on the basis of identified cost. Income and capital gain distributions from Fidelity Central Funds, if any, are recorded on the ex-dividend date. Interest income is accrued as earned and includes coupon interest and amortization of premium and accretion of discount on debt securities as applicable. The principal amount on inflation-indexed securities is periodically adjusted to the rate of inflation and interest is accrued based on the principal amount. The adjustments to principal due to inflation are reflected as increases or decreases to Interest in the accompanying Statement of Operations.
Class Allocations and Expenses. Investment income, realized and unrealized capital gains and losses, common expenses of each Fund, and certain fund-level expense reductions, if any, are allocated daily on a pro-rata basis to each class based on the relative net assets of each class to the total net assets of each Fund. Each class differs with respect to transfer agent and distribution and service plan fees incurred. Certain expense reductions may also differ by class. For the reporting period, the allocated portion of income and expenses to each class as a percent of its average net assets may vary due to the timing of recording these transactions in relation to fluctuating net assets of the classes. Expenses directly attributable to a fund are charged to that fund. Expenses attributable to more than one fund are allocated among the respective funds on the basis of relative net assets or other appropriate methods. Expense estimates are accrued in the period to which they relate and adjustments are made when actual amounts are known.
Deferred Trustee Compensation. Under a Deferred Compensation Plan (the Plan) for Treasury Portfolio, Government Portfolio, Money Market Portfolio, Prime Money Market Portfolio and Tax-Exempt Portfolio, certain independent Trustees have elected to defer receipt of a portion of their annual compensation. Deferred amounts are invested in a cross-section of Fidelity funds, are marked-to-market and remain in the Fund until distributed in accordance with the Plan. The investment of deferred amounts and the offsetting payable to the Trustees are included in the accompanying Statement of Assets and Liabilities.
Income Tax Information and Distributions to Shareholders. Each year, each Fund intends to qualify as a regulated investment company under Subchapter M of the Internal Revenue Code, including distributing substantially all of its taxable income and realized gains. As a result, no provision for U.S. Federal income taxes is required. As of March 31, 2018, each Fund did not have any unrecognized tax benefits in the financial statements; nor is each Fund aware of any tax positions for which it is reasonably possible that the total amounts of unrecognized tax benefits will significantly change in the next twelve months. Each Fund files a U.S. federal tax return, in addition to state and local tax returns as required. Each Fund's federal income tax returns are subject to examination by the Internal Revenue Service (IRS) for a period of three fiscal years after they are filed. State and local tax returns may be subject to examination for an additional fiscal year depending on the jurisdiction.
Distributions are declared and recorded daily and paid monthly from net investment income. Distributions from realized gains, if any, are declared and recorded on the ex-dividend date. Income and capital gain distributions are declared separately for each class. Income and capital gain distributions are determined in accordance with income tax regulations, which may differ from GAAP. In addition, the Funds claimed a portion of the payment made to redeeming shareholders as a distribution for income tax purposes.
Capital accounts within the financial statements are adjusted for permanent book-tax differences. These adjustments have no impact on net assets or the results of operations. Capital accounts are not adjusted for temporary book-tax differences which will reverse in a subsequent period.
Book-tax differences are primarily due to deferred trustees compensation, capital loss carryforwards, losses deferred due to wash sales and excise tax regulations.
The Tax-Exempt Portfolio purchases municipal securities whose interest, in the opinion of the issuer, is free from federal income tax. There is no assurance that the IRS will agree with this opinion. In the event the IRS determines that the issuer does not comply with relevant tax requirements, interest payments from a security could become federally taxable, possibly retroactively to the date the security was issued.
As of period end, the cost and unrealized appreciation (depreciation) in securities for federal income tax purposes were as follows for each Fund:
| | Tax cost | Gross unrealized appreciation | Gross unrealized depreciation | Net unrealized appreciation (depreciation) |
| Treasury Only Portfolio | $14,417,377 | $– | $– | $– |
| Treasury Portfolio | 23,184,830 | – | – | – |
| Government Portfolio | 100,700,746 | – | – | – |
| Money Market Portfolio | 28,876,391 | – | – | – |
| Prime Money Market Portfolio | 11,798,241 | 749 | (1,224) | (475) |
| Prime Reserves Portfolio | 4,282,109 | 169 | (440) | (271) |
| Tax-Exempt Portfolio | 4,447,545 | – | – | – |
The tax-based components of distributable earnings as of period end were as follows for each Fund:
| | Undistributed tax-exempt income | Undistributed ordinary income | Undistributed long-term capital gain | Capital loss carryforward | Net unrealized appreciation (depreciation) on securities and other investments |
| Treasury Only Portfolio | $– | $– | $– | $(13) | $– |
| Treasury Portfolio | – | 62 | – | – | – |
| Government Portfolio | – | – | – | (394) | – |
| Money Market Portfolio | – | 946 | – | – | – |
| Prime Money Market Portfolio | – | 465 | – | – | (475) |
| Prime Reserves Portfolio | – | 7 | – | – | (271) |
| Tax-Exempt Portfolio | 59 | – | – | – | – |
Capital loss carryforwards are only available to offset future capital gains of the Funds to the extent provided by regulations and may be limited. Under the Regulated Investment Company Modernization Act of 2010 (the Act), the Funds are permitted to carry forward capital losses incurred in taxable years beginning after December 22, 2010 for an unlimited period and such capital losses are required to be used prior to any losses that expire. The capital loss carryforward information presented below, including any applicable limitation, is estimated as of fiscal period end and is subject to adjustment.
| | Fiscal year of expiration | |
| | 2019 | Total with expiration |
| Government Portfolio | $(118) | $(118) |
| | No expiration | | |
| | Short-term | Total no expiration | Total capital loss carryfoward |
| Treasury Only Portfolio | $(13) | $(13) | $(13) |
| Government Portfolio | (276) | (276) | (394) |
Certain of the Funds intend to elect to defer to the next fiscal year capital losses recognized during the period November 1, 2017 to March 31, 2018. Loss deferrals were as follows:
| | Capital losses |
| Tax-Exempt Portfolio | $(13) |
The tax character of distributions paid was as follows:
| March 31, 2018 | | | |
| | Tax-Exempt Income | Ordinary Income | Total |
| Treasury Only Portfolio | $– | $125,645 | $125,645 |
| Treasury Portfolio | – | 207,508 | 207,508 |
| Government Portfolio | – | 952,412 | 952,412 |
| Money Market Portfolio | – | 296,842 | 296,842 |
| Prime Money Market Portfolio | – | 161,931 | 161,931 |
| Prime Reserves Portfolio | – | 39,392 | 39,392 |
| Tax-Exempt Portfolio | 27,522 | – | 27,522 |
| March 31, 2017 | | | |
| | Tax-Exempt Income | Ordinary Income | Total |
| Treasury Only Portfolio | $– | $31,217 | $31,217 |
| Treasury Portfolio | – | 46,502 | 46,502 |
| Government Portfolio | – | 273,207 | 273,207 |
| Money Market Portfolio | – | 126,160 | 126,160 |
| Prime Money Market Portfolio | – | 170,953 | 170,953 |
| Prime Reserves Portfolio | – | 3,795 | 3,795 |
| Tax-Exempt Portfolio | 7,113 | 1,040 | 8,153 |
Repurchase Agreements. Pursuant to an Exemptive Order issued by the Securities and Exchange Commission (the SEC), the Funds along with other registered investment companies having management contracts with Fidelity Management and Research Company (FMR), an affiliate of SelectCo, or other affiliated entities of FMR, are permitted to transfer uninvested cash balances into joint trading accounts which are then invested in repurchase agreements. The Funds may also invest directly with institutions in repurchase agreements. For Treasury Only Portfolio, Treasury Portfolio and Government Portfolio, repurchase agreements may be collateralized by cash or government securities. For Prime Money Market Portfolio, Money Market Portfolio, Prime Reserves Portfolio and Tax-Exempt Portfolio, repurchase agreements may be collateralized by government or non-government securities. Upon settlement date, collateral is held in segregated accounts with custodian banks and may be obtained in the event of a default of the counterparty. Each applicable Fund monitors, on a daily basis, the value of the collateral to ensure it is at least equal to the principal amount of the repurchase agreement (including accrued interest). In the event of a default by the counterparty, realization of the collateral proceeds could be delayed, during which time the value of the collateral may decline.
Delayed Delivery Transactions and When-Issued Securities. During the period, certain Funds transacted in securities on a delayed delivery or when-issued basis. Payment and delivery may take place after the customary settlement period for that security. The price of the underlying securities and the date when the securities will be delivered and paid for are fixed at the time the transaction is negotiated. The securities purchased on a delayed delivery or when-issued basis are identified as such in each applicable Fund's Schedule of Investments. Certain Funds may receive compensation for interest forgone in the purchase of a delayed delivery or when-issued security. With respect to purchase commitments, each applicable Fund identifies securities as segregated in its records with a value at least equal to the amount of the commitment. Losses may arise due to changes in the value of the underlying securities or if the counterparty does not perform under the contract's terms, or if the issuer does not issue the securities due to political, economic, or other factors.
Restricted Securities. The Funds may invest in securities that are subject to legal or contractual restrictions on resale. These securities generally may be resold in transactions exempt from registration or to the public if the securities are registered. Disposal of these securities may involve time-consuming negotiations and expense, and prompt sale at an acceptable price may be difficult. Information regarding restricted securities is included at the end of each applicable Fund's Schedule of Investments.
4. Fees and Other Transactions with Affiliates.
Management Fee. Fidelity Management & Research Company (the investment adviser) and its affiliates provide the Funds with investment management related services for which the Funds pay a monthly management fee that is based on an annual rate of .14% of average net assets.
Distribution and Service Plan Fees. In accordance with Rule 12b-1 of the 1940 Act, the Funds have adopted separate Distribution and Service Plans for each class of shares. Class II, Class III and Select Class of each Fund pays Fidelity Distributors Corporation (FDC), an affiliate of the investment adviser, a Service fee based on an annual percentage of each class' average net assets. Class IV of Treasury Only Portfolio, Treasury Portfolio and Prime Money Market Portfolio pays FDC separate Distribution and Service Fees, each of which is based on an annual percentage of each class' average net assets. FDC may pay financial intermediaries for selling shares of the Funds and providing shareholder support services. For the period, the Distribution and Service fee rates, total fees and amounts retained by FDC were as follows:
| | Distribution Fee | Service Fee |
| Class II | .00% | .15% |
| Class III | .00% | .25% |
| Class IV | .25% | .25% |
| Select Class | .00% | .05% |
| | Total Fees | Retained by FDC |
| Treasury Only Portfolio: | | |
| Class II | $337 | $40 |
| Class III | 2,285 | 488 |
| Class IV | 295 | –(a) |
| Select Class | 75 | 21 |
| | $2,992 | $549 |
Treasury Portfolio:
| | |
| Class II | $1,106 | $60 |
| Class III | 6,576 | 1,419 |
| Class IV | 4,105 | 3 |
| Select Class | 163 | 26 |
| | $11,950 | $1,508 |
Government Portfolio:
| | |
| Class II | $1,066 | $680 |
| Class III | 7,905 | 2,553 |
| Select Class | 401 | 6 |
| | $9,372 | $3,239 |
Money Market Portfolio:
| | |
| Class II | $47 | $–(a) |
| Class III | 255 | –(a) |
| Select Class | 8 | 1 |
| | $310 | $1 |
Prime Money Market Portfolio:
| | |
| Class II | $57 | $18 |
| Class III | 22 | 1 |
| Class IV | –(a) | –(a) |
| Select Class | 11 | 2 |
| | $90 | $21 |
Prime Reserves Portfolio:
| | |
| Class II | $2 | $2 |
| Class III | 4 | 4 |
| Select Class | 2 | 2 |
| | $8 | $8 |
Tax-Exempt Portfolio:
| | |
| Class II | $1 | $–(a) |
| Class III | 12 | –(a) |
| Select Class | –(a) | –(a) |
| | $13 | $–(a) |
(a) In the amount of less than five hundred dollars.
Transfer Agent Fees. Fidelity Investments Institutional Operations Company, Inc. (FIIOC), an affiliate of the investment adviser, is the transfer, dividend disbursing and shareholder servicing agent for the Funds. FIIOC receives asset-based fees with respect to each account. FIIOC pays for typesetting, printing and mailing of all shareholder reports, except proxy statements. Each class, with the exception of Institutional Class, pays a transfer agent fee equal to an annual rate of .06% of class-level average net assets. Institutional Class pays a transfer agent fee equal to an annual rate of .03% of class-level average net assets. For the period, transfer agent fees for each class were as follows:
| Treasury Only Portfolio | |
| Class I | $4,204 |
| Class II | 135 |
| Class III | 548 |
| Class IV | 35 |
| Select Class | 91 |
| Institutional Class | 1,560 |
| | $6,573 |
| Treasury Portfolio | |
| Class I | $5,000 |
| Class II | 443 |
| Class III | 1,578 |
| Class IV | 493 |
| Select Class | 196 |
| Institutional Class | 2,853 |
| | $10,563 |
| Government Portfolio | |
| Class I | $18,960 |
| Class II | 426 |
| Class III | 1,897 |
| Select Class | 481 |
| Institutional Class | 18,628 |
| | $40,392 |
| Money Market Portfolio | |
| Class I | $6,051 |
| Class II | 19 |
| Class III | 61 |
| Select Class | 9 |
| Institutional Class | 3,641 |
| | $9,781 |
| Prime Money Market Portfolio | |
| Class I | $550 |
| Class II | 23 |
| Class III | 5 |
| Class IV | –(a) |
| Select Class | 13 |
| Institutional Class | 3,522 |
| | $4,113 |
| Prime Reserves Portfolio | |
| Class I | $716 |
| Class II | 1 |
| Class III | 1 |
| Select Class | 2 |
| Institutional Class | 543 |
| | $1,263 |
| Tax-Exempt Portfolio | |
| Class I | $1,917 |
| Class II | –(a) |
| Class III | 3 |
| Select Class | 1 |
| | $1,921 |
(a) In the amount of less than five hundred dollars.
Accounting Fees. Fidelity Service Company, Inc. (FSC), an affiliate of the investment adviser, maintains each Fund's accounting records. The fee is based on the level of average net assets for each month. For the period, the fees were equivalent to the following annual rates:
| | % of Average Net Assets |
| Treasury Only Portfolio | .01 |
| Treasury Portfolio | .01 |
| Money Market Portfolio | .01 |
| Prime Money Market Portfolio | .01 |
| Prime Reserves Portfolio | .01 |
| Tax-Exempt Portfolio | .01 |
Interfund Lending Program. Pursuant to an Exemptive Order issued by the Securities and Exchange Commission (the SEC), the Funds, along with other registered investment companies having management contracts with Fidelity Management & Research Company (FMR) or other affiliated entities of FMR, may participate in an interfund lending program. This program provides an alternative credit facility allowing the funds to borrow from, or lend money to, other participating affiliated funds. At period end, Treasury Only Portfolio, Treasury Portfolio, Government Portfolio, Money Market Portfolio, Prime Money Market Portfolio, Prime Reserves Portfolio and Tax-Exempt Portfolio had no interfund loans outstanding. Each applicable fund's activity in this program during the period for which loans were outstanding was as follows:
| | | Average Loan Balance | Weighted Average Interest Rate |
| Money Market Portfolio | Lender | $20,746 | 1.39% |
| Prime Reserves Portfolio | Lender | $17,275 | 1.39% |
Interfund Trades. The Funds may purchase from or sell securities to other Fidelity Funds under procedures adopted by the Board. The procedures have been designed to ensure these interfund trades are executed in accordance with Rule 17a-7 of the 1940 Act.
Other. During the period, the investment adviser reimbursed the Funds for certain losses as follows:
| | Amount |
| Treasury Portfolio | $1 |
| Money Market Portfolio | 9 |
| Prime Money Market Portfolio | 7 |
| Prime Reserves Portfolio | 1 |
5. Expense Reductions.
The investment adviser contractually agreed to reimburse funds to the extent annual operating expenses exceeded certain levels of average net assets as noted in the table below. This reimbursement will remain in place through May 31, 2019. Some expenses, for example the compensation of the independent Trustees, and certain miscellaneous expenses such as proxy and shareholder meeting expenses, are excluded from this reimbursement.
The following classes of each applicable Fund were in reimbursement during the period:
| | Expense Limitations | Reimbursement |
| Treasury Only Portfolio | | |
| Class I | .18% | $2,145 |
| Class II | .33% | 68 |
| Class III | .43% | 280 |
| Class IV | .68% | 18 |
| Select Class | .23% | 47 |
| Institutional Class | .14% | 2,110 |
| Treasury Portfolio | | |
| Class I | .18% | $2,384 |
| Class II | .33% | 207 |
| Class III | .43% | 751 |
| Class IV | .68% | 242 |
| Select Class | .23% | 94 |
| Institutional Class | .14% | 3,650 |
| Government Portfolio | | |
| Class I | .18% | $7,852 |
| Class II | .33% | 176 |
| Class III | .43% | 799 |
| Select Class | .23% | 203 |
| Institutional Class | .14% | 21,642 |
| Money Market Portfolio | | |
| Class I | .18% | $3,068 |
| Class II | .33% | 10 |
| Class III | .43% | 31 |
| Select Class | .23%�� | 5 |
| Institutional Class | .14% | 4,901 |
| Prime Money Market Portfolio | | |
| Class I | .18% | $305 |
| Class II | .33% | 12 |
| Class III | .43% | 3 |
| Class IV | .68% | –(a) |
| Select Class | .23% | 7 |
| Institutional Class | .14% | 5,014 |
| Prime Reserves Portfolio | | |
| Class I | .18% | $500 |
| Class II | .33% | –(a) |
| Class III | .43% | 1 |
| Select Class | .23% | 2 |
| Institutional Class | .14% | 937 |
| Tax-Exempt Portfolio | | |
| Class I | .18% | $1,199 |
| Class II | .33% | –(a) |
| Class III | .43% | 2 |
| Select Class | .23% | –(a) |
(a) In the amount of less than five hundred dollars.
In addition, through arrangements with each applicable Fund's custodian, credits realized as a result of certain uninvested cash balances were used to reduce each Fund's expenses. All of the applicable expense reductions are noted in the table below.
| | Custody expense reduction |
| Treasury Only Portfolio | $6 |
| Treasury Portfolio | 6 |
| Government Portfolio | 28 |
| Money Market Portfolio | 25 |
| Prime Money Market Portfolio | –(a) |
| Prime Reserves Portfolio | –(a) |
| Tax-Exempt Portfolio | 2 |
(a) In the amount of less than five hundred dollars.
6. Distributions to Shareholders.
Distributions to shareholders of each class were as follows:
| | Year ended
March 31, 2018 | Year ended
March 31, 2017 |
| Treasury Only Portfolio | | |
| From net investment income | | |
| Class I | $64,342 | $19,836 |
| Class II | 1,813 | 161 |
| Class III | 6,096 | 399 |
| Class IV | 322 | 8 |
| Select Class | 1,329 | 257 |
| Institutional Class | 51,743 | 10,556 |
| Total | $125,645 | $31,217 |
| Treasury Portfolio | | |
| From net investment income | | |
| Class I | $78,910 | $27,548 |
| Class II | 5,392 | 432 |
| Class III | 18,539 | 1,362 |
| Class IV | 3,805 | 90 |
| Select Class | 3,108 | 648 |
| Institutional Class | 97,754 | 16,422 |
| Total | $207,508 | $46,502 |
| Government Portfolio | | |
| From net investment income | | |
| Class I | $298,377 | $97,048 |
| Class II | 5,610 | 1,324 |
| Class III | 22,241 | 1,908 |
| Select Class | 7,297 | 1,728 |
| Institutional Class | 618,887 | 171,199 |
| Total | $952,412 | $273,207 |
| Money Market Portfolio | | |
| From net investment income | | |
| Class I | $131,597 | $51,603 |
| Class II | 378 | 128 |
| Class III | 1,083 | 681 |
| Select Class | 190 | 175 |
| Class F | – | 1,013 |
| Institutional Class | 163,594 | 72,560 |
| Total | $296,842 | $126,160 |
| Prime Money Market Portfolio | | |
| From net investment income | | |
| Class I | $10,974 | $21,114 |
| Class II | 416 | 500 |
| Class III | 84 | 628 |
| Class IV | – | 5 |
| Select Class | 260 | 2,111 |
| Institutional Class | 150,197 | 136,235 |
| Total | $161,931 | $160,593 |
| From net realized gain | | |
| Class I | $– | $1,805 |
| Class II | – | 141 |
| Class III | – | 148 |
| Select Class | – | 20 |
| Institutional Class | – | 8,246 |
| Total | $– | $10,360 |
| Prime Reserves Portfolio | | |
| From net investment income | | |
| Class I | $15,394 | $1,214(a) |
| Class II | 11 | 3(a) |
| Class III | 17 | 3(a) |
| Select Class | 49 | 4(a) |
| Institutional Class | 23,921 | 2,571(a) |
| Total | $39,392 | $3,795(a) |
| Tax-Exempt Portfolio | | |
| From net investment income | | |
| Class I | $27,486 | $7,094 |
| Class II | 3 | 1 |
| Class III | 26 | 17 |
| Select Class | 7 | 1 |
| Total | $27,522 | $7,113 |
| From net realized gain | | |
| Class I | $–(b) | $980 |
| Class I | $–(b) | $–(b) |
| Class III | –(b) | 60 |
| Select Class | $–(b) | $–(b) |
| Total | $– | $1,040 |
(a) Distributions are for the period June 2, 2016 (commencement of operations) to March 31, 2017.
(b) In the amount of less than five hundred dollars.
7. Share Transactions.
Share Transactions for each class of shares at a $1.00 per share were as follows and may contain automatic conversions between classes or exchanges between affiliated funds:
| | Shares | Shares | Dollars | Dollars |
| | Year ended March 31, 2018 | Year ended March 31, 2017 | Year ended March 31, 2018 | Year ended March 31, 2017 |
| Treasury Only Portfolio | | | | |
| Class I | | | | |
| Shares sold | 13,898,146 | 15,240,325 | $13,898,146 | $15,240,325 |
| Reinvestment of distributions | 40,742 | 12,773 | 40,742 | 12,773 |
| Shares redeemed | (14,600,049) | (17,650,692) | (14,600,049) | (17,650,692) |
| Net increase (decrease) | (661,161) | (2,397,594) | $(661,161) | $(2,397,594) |
| Class II | | | | |
| Shares sold | 565,102 | 297,056 | $565,102 | $297,056 |
| Reinvestment of distributions | 564 | 85 | 564 | 85 |
| Shares redeemed | (463,274) | (445,655) | (463,274) | (445,655) |
| Net increase (decrease) | 102,392 | (148,514) | $102,392 | $(148,514) |
| Class III | | | | |
| Shares sold | 3,565,814 | 4,840,544 | $3,565,814 | $4,840,544 |
| Reinvestment of distributions | 2,797 | 184 | 2,797 | 184 |
| Shares redeemed | (3,561,332) | (4,750,231) | (3,561,332) | (4,750,231) |
| Net increase (decrease) | 7,279 | 90,497 | $7,279 | $90,497 |
| Class IV | | | | |
| Shares sold | 317,011 | 125,268 | $317,011 | $125,268 |
| Reinvestment of distributions | 322 | 8 | 322 | 8 |
| Shares redeemed | (233,734) | (430,935) | (233,734) | (430,935) |
| Net increase (decrease) | 83,599 | (305,659) | $83,599 | $(305,659) |
| Select Class | | | | |
| Shares sold | 1,022,884 | 1,280,315 | $1,022,884 | $1,280,315 |
| Reinvestment of distributions | 498 | 145 | 498 | 145 |
| Shares redeemed | (996,313) | (1,366,793) | (996,313) | (1,366,793) |
| Net increase (decrease) | 27,069 | (86,333) | $27,069 | $(86,333) |
| Institutional Class | | | | |
| Shares sold | 14,115,053 | 9,635,535 | $14,115,053 | $9,635,535 |
| Reinvestment of distributions | 28,860 | 5,228 | 28,860 | 5,228 |
| Shares redeemed | (12,407,055) | (6,678,289) | (12,407,055) | (6,678,289) |
| Net increase (decrease) | 1,736,858 | 2,962,474 | $1,736,858 | $2,962,474 |
| Treasury Portfolio | | | | |
| Class I | | | | |
| Shares sold | 64,687,881 | 80,854,303 | $64,687,881 | $80,854,303 |
| Reinvestment of distributions | 27,365 | 8,190 | 27,365 | 8,190 |
| Shares redeemed | (64,779,012) | (82,194,540) | (64,779,012) | (82,194,540) |
| Net increase (decrease) | (63,766) | (1,332,047) | $(63,766) | $(1,332,047) |
| Class II | | | | |
| Shares sold | 2,540,275 | 2,878,086 | $2,540,275 | $2,878,086 |
| Reinvestment of distributions | 66 | 13 | 66 | 13 |
| Shares redeemed | (2,787,589) | (3,071,872) | (2,787,589) | (3,071,872) |
| Net increase (decrease) | (247,248) | (193,773) | $(247,248) | $(193,773) |
| Class III | | | | |
| Shares sold | 9,138,371 | 8,729,467 | $9,138,371 | $8,729,467 |
| Reinvestment of distributions | 2,304 | 184 | 2,304 | 184 |
| Shares redeemed | (8,901,163) | (9,027,771) | (8,901,163) | (9,027,771) |
| Net increase (decrease) | 239,512 | (298,120) | $239,512 | $(298,120) |
| Class IV | | | | |
| Shares sold | 1,879,779 | 931,051 | $1,879,779 | $931,051 |
| Reinvestment of distributions | 93 | –(a) | 93 | –(b) |
| Shares redeemed | (1,747,578) | (1,042,845) | (1,747,578) | (1,042,845) |
| Net increase (decrease) | 132,294 | (111,794) | $132,294 | $(111,794) |
| Select Class | | | | |
| Shares sold | 1,869,589 | 1,653,663 | $1,869,589 | $1,653,663 |
| Reinvestment of distributions | 436 | 177 | 436 | 177 |
| Shares redeemed | (1,768,887) | (1,665,048) | (1,768,887) | (1,665,048) |
| Net increase (decrease) | 101,138 | (11,208) | $101,138 | $(11,208) |
| Institutional Class | | | | |
| Shares sold | 111,217,162 | 47,643,870 | $111,217,162 | $47,643,870 |
| Reinvestment of distributions | 61,080 | 12,675 | 61,080 | 12,675 |
| Shares redeemed | (106,879,463) | (44,216,941) | (106,879,463) | (44,216,941) |
| Net increase (decrease) | 4,398,779 | 3,439,604 | $4,398,779 | $3,439,604 |
| Government Portfolio | | | | |
| Class I | | | | |
| Shares sold | 272,416,239 | 216,719,320 | $272,416,239 | $216,719,320 |
| Reinvestment of distributions | 90,725 | 26,560 | 90,725 | 26,560 |
| Shares redeemed | (272,174,814) | (207,297,666) | (272,174,814) | (207,297,666) |
| Net increase (decrease) | 332,150 | 9,448,214 | $332,150 | $9,448,214 |
| Class II | | | | |
| Shares sold | 4,629,479 | 6,254,053 | $4,629,479 | $6,254,053 |
| Reinvestment of distributions | 556 | 126 | 556 | 126 |
| Shares redeemed | (4,795,417) | (5,830,322) | (4,795,417) | (5,830,322) |
| Net increase (decrease) | (165,382) | 423,857 | $(165,382) | $423,857 |
| Class III | | | | |
| Shares sold | 7,973,803 | 7,571,865 | $7,973,803 | $7,571,865 |
| Reinvestment of distributions | 7,153 | 728 | 7,153 | 728 |
| Shares redeemed | (7,667,677) | (6,492,450) | (7,667,677) | (6,492,450) |
| Net increase (decrease) | 313,279 | 1,080,143 | $313,279 | $1,080,143 |
| Select Class | | | | |
| Shares sold | 3,552,271 | 3,163,969 | $3,552,271 | $3,163,969 |
| Reinvestment of distributions | 6,213 | 1,025 | 6,213 | 1,025 |
| Shares redeemed | (3,750,178) | (2,809,636) | (3,750,178) | (2,809,636) |
| Net increase (decrease) | (191,694) | 355,358 | $(191,694) | $355,358 |
| Institutional Class | | | | |
| Shares sold | 527,275,544 | 418,317,187 | $527,275,544 | $418,317,187 |
| Reinvestment of distributions | 394,418 | 113,432 | 394,418 | 113,432 |
| Shares redeemed | (521,284,015) | (379,400,119) | (521,284,015) | (379,400,119) |
| Net increase (decrease) | 6,385,947 | 39,030,500 | $6,385,947 | $39,030,500 |
| Money Market Portfolio | | | | |
| Class I | | | | |
| Shares sold | 14,607,331 | 11,251,590 | $14,607,331 | $11,251,678 |
| Reinvestment of distributions | 114,911 | 42,256 | 114,911 | 42,256 |
| Shares redeemed | (9,807,798) | (23,578,146) | (9,807,798) | (23,578,146) |
| Net increase (decrease) | 4,914,444 | (12,284,300) | $4,914,444 | $(12,284,212) |
| Class II | | | | |
| Shares sold | 106,105 | 99,339 | $106,105 | $99,340 |
| Reinvestment of distributions | 372 | 115 | 372 | 115 |
| Shares redeemed | (52,708) | (161,055) | (52,708) | (161,055) |
| Net increase (decrease) | 53,769 | (61,601) | $53,769 | $(61,600) |
| Class III | | | | |
| Shares sold | 136,885 | 1,252,013 | $136,885 | $1,252,021 |
| Reinvestment of distributions | 1,083 | 419 | 1,083 | 419 |
| Shares redeemed | (97,100) | (2,290,247) | (97,100) | (2,290,247) |
| Net increase (decrease) | 40,868 | (1,037,815) | $40,868 | $(1,037,807) |
| Select Class | | | | |
| Shares sold | 4,726 | 224,289 | $4,726 | $224,290 |
| Reinvestment of distributions | 190 | 62 | 190 | 62 |
| Shares redeemed | (1,093) | (435,943) | (1,093) | (435,943) |
| Net increase (decrease) | 3,823 | (211,592) | $3,823 | $(211,591) |
| Class F | | | | |
| Shares sold | – | 129,619 | $– | $129,619 |
| Reinvestment of distributions | – | 713 | – | 713 |
| Shares redeemed | – | (2,434,015) | – | (2,434,015) |
| Net increase (decrease) | – | (2,303,683) | $– | $(2,303,683) |
| Institutional Class | | | | |
| Shares sold | 18,849,926 | 25,232,850 | $18,849,926 | $25,232,850 |
| Reinvestment of distributions | 147,053 | 61,995 | 147,053 | 61,995 |
| Shares redeemed | (13,127,259) | (37,111,312) | (13,127,259) | (37,111,312) |
| Net increase (decrease) | 5,869,720 | (11,816,467) | $5,869,720 | $(11,816,467) |
| Prime Money Market Portfolio | | | | |
| Class I | | | | |
| Shares sold | 5,653,623 | 74,144,867 | $5,656,249 | $74,146,617 |
| Reinvestment of distributions | 6,359 | 8,804 | 6,362 | 8,805 |
| Shares redeemed | (5,812,154) | (82,924,114) | (5,814,892) | (82,926,664) |
| Net increase (decrease) | (152,172) | (8,770,443) | $(152,281) | $(8,771,242) |
| Class II | | | | |
| Shares sold | 132,538 | 3,641,037 | $132,586 | $3,641,047 |
| Reinvestment of distributions | 320 | 126 | 320 | 126 |
| Shares redeemed | (121,410) | (3,858,268) | (121,455) | (3,858,336) |
| Net increase (decrease) | 11,448 | (217,105) | $11,451 | $(217,163) |
| Class III | | | | |
| Shares sold | 6,390 | 2,637,729 | $6,393 | $2,637,736 |
| Reinvestment of distributions | 81 | 136 | 81 | 136 |
| Shares redeemed | (6,975) | (3,523,935) | (6,978) | (3,524,041) |
| Net increase (decrease) | (504) | (886,070) | $(504) | $(886,169) |
| Class IV | | | | |
| Shares sold | – | 39,312 | $– | $39,312 |
| Reinvestment of distributions | –(b) | 5 | –(b) | 5 |
| Shares redeemed | – | (223,046) | – | (223,046) |
| Net increase (decrease) | – | (183,729) | $– | $(183,729) |
| Select Class | | | | |
| Shares sold | 22,922 | 3,823,277 | $22,934 | $3,823,282 |
| Reinvestment of distributions | 255 | 1,007 | 255 | 1,007 |
| Shares redeemed | (19,602) | (4,567,165) | (19,612) | (4,567,177) |
| Net increase (decrease) | 3,575 | (742,881) | $3,577 | $(742,888) |
| Institutional Class | | | | |
| Shares sold | 70,629,449 | 236,441,408 | $70,654,399 | $236,454,059 |
| Reinvestment of distributions | 108,397 | 84,139 | 108,434 | 84,149 |
| Shares redeemed | (69,173,476) | (273,660,217) | (69,197,656) | (273,673,354) |
| Net increase (decrease) | 1,564,370 | (37,134,670) | $1,565,177 | $(37,135,146) |
| Prime Reserves Portfolio | | | | |
| Class I | | | | |
| Shares sold | 2,492,943 | 694,526(c) | $2,493,435 | $694,596(c) |
| Reinvestment of distributions | 10,884 | 744(c) | 10,886 | 744(c) |
| Shares redeemed | (1,191,854) | (155,762)(c) | (1,192,085) | (155,776)(c) |
| Net increase (decrease) | 1,311,973 | 539,508(c) | $1,312,236 | $539,564(c) |
| Class II | | | | |
| Shares sold | – | 1,000(c) | $– | $1,000(c) |
| Reinvestment of distributions | 10 | 3(c) | 10 | 3(c) |
| Net increase (decrease) | 10 | 1,003(c) | $10 | $1,003(c) |
| Class III | | | | |
| Shares sold | 6,568 | 1,000(c) | $6,570 | $1,000(c) |
| Reinvestment of distributions | 16 | 3(c) | 16 | 3(c) |
| Shares redeemed | (6,575) | –(a),(c) | (6,576) | –(b),(c) |
| Net increase (decrease) | 9 | 1,003(c) | $10 | $1,003(c) |
| Select Class | | | | |
| Shares sold | 12,419 | 1,443(c) | $12,422 | $1,443(c) |
| Reinvestment of distributions | 48 | 4(c) | 48 | 4(c) |
| Shares redeemed | (9,069) | –(c) | (9,071) | –(c) |
| Net increase (decrease) | 3,398 | 1,447(c) | $3,399 | $1,447(c) |
| Institutional Class | | | | |
| Shares sold | 3,730,498 | 1,676,735(c) | $3,731,229 | $1,676,859(c) |
| Reinvestment of distributions | 19,899 | 2,323(c) | 19,903 | 2,324(c) |
| Shares redeemed | (2,286,060) | (714,231)(c) | (2,286,502) | (714,266)(c) |
| Net increase (decrease) | 1,464,337 | 964,827(c) | $1,464,630 | $964,917(c) |
| Tax-Exempt Portfolio | | | | |
| Class I | | | | |
| Shares sold | 5,614,251 | 2,969,785 | $5,614,251 | $2,969,785 |
| Reinvestment of distributions | 20,135 | 5,765 | 20,135 | 5,765 |
| Shares redeemed | (3,408,646) | (2,141,221) | (3,408,646) | (2,141,221) |
| Net increase (decrease) | 2,225,740 | 834,329 | $2,225,740 | $834,329 |
| Class II | | | | |
| Shares sold | – | 67 | $– | $67 |
| Reinvestment of distributions | 3 | 2 | 3 | 2 |
| Shares redeemed | – | (447) | – | (447) |
| Net increase (decrease) | 3 | (378) | $3 | $(378) |
| Class III | | | | |
| Shares sold | 25,144 | 115,337 | $25,144 | $115,337 |
| Reinvestment of distributions | 17 | 33 | 17 | 33 |
| Shares redeemed | (26,788) | (325,665) | (26,788) | (325,665) |
| Net increase (decrease) | (1,627) | (210,295) | $(1,627) | $(210,295) |
| Select Class | | | | |
| Shares sold | 1,000 | 2,063 | $1,000 | $2,063 |
| Reinvestment of distributions | 7 | 1 | 7 | 1 |
| Shares redeemed | – | (5,762) | – | (5,762) |
| Net increase (decrease) | 1,007 | (3,698) | $1,007 | $(3,698) |
(a) In the amount of less than five hundred shares.
(b) In the amount of less than five hundred dollars.
(c) For the period June 2, 2016 (commencement of operations) to March 31, 2017.
8. Other.
The Funds' organizational documents provide former and current trustees and officers with a limited indemnification against liabilities arising in connection with the performance of their duties to the Funds. In the normal course of business, the Funds may also enter into contracts that provide general indemnifications. The Funds' maximum exposure under these arrangements is unknown as this would be dependent on future claims that may be made against the Funds. The risk of material loss from such claims is considered remote.
Report of Independent Registered Public Accounting Firm
To the Trustees of Fidelity Colchester Street Trust and the Shareholders of Treasury Only Portfolio, Treasury Portfolio, Government Portfolio, Money Market Portfolio, Prime Money Market Portfolio, Prime Reserves Portfolio and Tax-Exempt Portfolio:
Opinion on the Financial Statements and Financial Highlights
We have audited the accompanying statements of assets and liabilities of Treasury Only Portfolio, Treasury Portfolio, Government Portfolio, Money Market Portfolio, Prime Money Market Portfolio, Prime Reserves Portfolio and Tax-Exempt Portfolio (the “Funds”), each a fund of Fidelity Colchester Street Trust, including the schedules of investments, as of March 31, 2018, and the related statements of operations for the year then ended, the statements of changes in net assets for each of the two years in the period then ended, and the financial highlights for each of the five years in the period then ended for the Funds, except Prime Reserves Portfolio; the related statement of operations for the year then ended and the statement of changes in net assets and the financial highlights for the year then ended and for the period from June 2, 2016 to March 31, 2017 for the Prime Reserves Portfolio; and the related notes. In our opinion, the financial statements and financial highlights present fairly, in all material respects, the financial position of the Funds as of March 31, 2018, and the results of their operations for the year then ended, the changes in their net assets for each of the two years in the period then ended (or for the period mentioned above), and the financial highlights for each of the five years in the period then ended (or for the period mentioned above), in conformity with accounting principles generally accepted in the United States of America.
Basis for Opinion
These financial statements and financial highlights are the responsibility of the Funds' management. Our responsibility is to express an opinion on the Funds' financial statements and financial highlights based on our audits. We are a public accounting firm registered with the Public Company Accounting Oversight Board (United States) (PCAOB) and are required to be independent with respect to the Funds in accordance with the U.S. federal securities laws and the applicable rules and regulations of the Securities and Exchange Commission and the PCAOB.
We conducted our audits in accordance with the standards of the PCAOB. Those standards require that we plan and perform the audit to obtain reasonable assurance about whether the financial statements and financial highlights are free of material misstatement, whether due to error or fraud. The Funds are not required to have, nor were we engaged to perform, an audit of their internal control over financial reporting. As part of our audits we are required to obtain an understanding of internal control over financial reporting but not for the purpose of expressing an opinion on the effectiveness of the Funds' internal control over financial reporting. Accordingly, we express no such opinion.
Our audits included performing procedures to assess the risks of material misstatement of the financial statements and financial highlights, whether due to error or fraud, and performing procedures that respond to those risks. Such procedures included examining, on a test basis, evidence regarding the amounts and disclosures in the financial statements and financial highlights. Our audits also included evaluating the accounting principles used and significant estimates made by management, as well as evaluating the overall presentation of the financial statements and financial highlights. Our procedures included confirmation of securities owned as of March 31, 2018, by correspondence with the custodians and brokers; when replies were not received from brokers, we performed other auditing procedures. We believe that our audits provide a reasonable basis for our opinion.
/s/ Deloitte & Touche LLP
Boston, Massachusetts
May 16, 2018
We have served as the auditor of one or more of the Fidelity investment companies since 1999.
Trustees and Officers
The Trustees, Members of the Advisory Board (if any), and officers of the trust and funds, as applicable, are listed below. The Board of Trustees governs each fund and is responsible for protecting the interests of shareholders. The Trustees are experienced executives who meet periodically throughout the year to oversee each fund's activities, review contractual arrangements with companies that provide services to each fund, oversee management of the risks associated with such activities and contractual arrangements, and review each fund's performance. Each of the Trustees oversees 235 funds.
The Trustees hold office without limit in time except that (a) any Trustee may resign; (b) any Trustee may be removed by written instrument, signed by at least two-thirds of the number of Trustees prior to such removal; (c) any Trustee who requests to be retired or who has become incapacitated by illness or injury may be retired by written instrument signed by a majority of the other Trustees; and (d) any Trustee may be removed at any special meeting of shareholders by a two-thirds vote of the outstanding voting securities of the trust. Each Trustee who is not an interested person (as defined in the 1940 Act) of the trust and the funds is referred to herein as an Independent Trustee. Each Independent Trustee shall retire not later than the last day of the calendar year in which his or her 75th birthday occurs. The Independent Trustees may waive this mandatory retirement age policy with respect to individual Trustees. Officers and Advisory Board Members hold office without limit in time, except that any officer or Advisory Board Member may resign or may be removed by a vote of a majority of the Trustees at any regular meeting or any special meeting of the Trustees. Except as indicated, each individual has held the office shown or other offices in the same company for the past five years.
Each fund’s Statement of Additional Information (SAI) includes more information about the Trustees. To request a free copy, call Fidelity at 1-877-297-2952.
Experience, Skills, Attributes, and Qualifications of the Trustees. The Governance and Nominating Committee has adopted a statement of policy that describes the experience, qualifications, attributes, and skills that are necessary and desirable for potential Independent Trustee candidates (Statement of Policy). The Board believes that each Trustee satisfied at the time he or she was initially elected or appointed a Trustee, and continues to satisfy, the standards contemplated by the Statement of Policy. The Governance and Nominating Committee also engages professional search firms to help identify potential Independent Trustee candidates who have the experience, qualifications, attributes, and skills consistent with the Statement of Policy. From time to time, additional criteria based on the composition and skills of the current Independent Trustees, as well as experience or skills that may be appropriate in light of future changes to board composition, business conditions, and regulatory or other developments, have also been considered by the professional search firms and the Governance and Nominating Committee. In addition, the Board takes into account the Trustees' commitment and participation in Board and committee meetings, as well as their leadership of standing and ad hoc committees throughout their tenure.
In determining that a particular Trustee was and continues to be qualified to serve as a Trustee, the Board has considered a variety of criteria, none of which, in isolation, was controlling. The Board believes that, collectively, the Trustees have balanced and diverse experience, qualifications, attributes, and skills, which allow the Board to operate effectively in governing each fund and protecting the interests of shareholders. Information about the specific experience, skills, attributes, and qualifications of each Trustee, which in each case led to the Board's conclusion that the Trustee should serve (or continue to serve) as a trustee of the funds, is provided below.
Board Structure and Oversight Function. Abigail P. Johnson is an interested person and currently serves as Chairman. The Trustees have determined that an interested Chairman is appropriate and benefits shareholders because an interested Chairman has a personal and professional stake in the quality and continuity of services provided to the funds. Independent Trustees exercise their informed business judgment to appoint an individual of their choosing to serve as Chairman, regardless of whether the Trustee happens to be independent or a member of management. The Independent Trustees have determined that they can act independently and effectively without having an Independent Trustee serve as Chairman and that a key structural component for assuring that they are in a position to do so is for the Independent Trustees to constitute a substantial majority for the Board. The Independent Trustees also regularly meet in executive session. Marie L. Knowles serves as Chairman of the Independent Trustees and as such (i) acts as a liaison between the Independent Trustees and management with respect to matters important to the Independent Trustees and (ii) with management prepares agendas for Board meetings.
Fidelity® funds are overseen by different Boards of Trustees. The funds' Board oversees Fidelity's investment-grade bond, money market, asset allocation and certain equity funds, and other Boards oversee Fidelity's high income and other equity funds. The asset allocation funds may invest in Fidelity® funds that are overseen by such other Boards. The use of separate Boards, each with its own committee structure, allows the Trustees of each group of Fidelity® funds to focus on the unique issues of the funds they oversee, including common research, investment, and operational issues. On occasion, the separate Boards establish joint committees to address issues of overlapping consequences for the Fidelity® funds overseen by each Board.
The Trustees operate using a system of committees to facilitate the timely and efficient consideration of all matters of importance to the Trustees, each fund, and fund shareholders and to facilitate compliance with legal and regulatory requirements and oversight of the funds' activities and associated risks. The Board, acting through its committees, has charged FMR and its affiliates with (i) identifying events or circumstances the occurrence of which could have demonstrably adverse effects on the funds' business and/or reputation; (ii) implementing processes and controls to lessen the possibility that such events or circumstances occur or to mitigate the effects of such events or circumstances if they do occur; and (iii) creating and maintaining a system designed to evaluate continuously business and market conditions in order to facilitate the identification and implementation processes described in (i) and (ii) above. Because the day-to-day operations and activities of the funds are carried out by or through FMR, its affiliates, and other service providers, the funds' exposure to risks is mitigated but not eliminated by the processes overseen by the Trustees. While each of the Board's committees has responsibility for overseeing different aspects of the funds' activities, oversight is exercised primarily through the Operations and Audit Committees. In addition, an ad hoc Board committee of Independent Trustees has worked with FMR to enhance the Board's oversight of investment and financial risks, legal and regulatory risks, technology risks, and operational risks, including the development of additional risk reporting to the Board. The Operations Committee also worked and continues to work with FMR to enhance the stress tests required under SEC regulations for money market funds. Appropriate personnel, including but not limited to the funds' Chief Compliance Officer (CCO), FMR's internal auditor, the independent accountants, the funds' Treasurer and portfolio management personnel, make periodic reports to the Board's committees, as appropriate, including an annual review of Fidelity's risk management program for the Fidelity® funds. The responsibilities of each standing committee, including their oversight responsibilities, are described further under "Standing Committees of the Trustees."
Interested Trustees*:
Correspondence intended for a Trustee who is an interested person may be sent to Fidelity Investments, 245 Summer Street, Boston, Massachusetts 02210.
Name, Year of Birth; Principal Occupations and Other Relevant Experience+
Abigail P. Johnson (1961)
Year of Election or Appointment: 2009
Trustee
Chairman of the Board of Trustees
Ms. Johnson also serves as Trustee of other Fidelity® funds. Ms. Johnson serves as Chairman (2016-present), Chief Executive Officer (2014-present), and Director (2007-present) of FMR LLC (diversified financial services company), President of Fidelity Financial Services (2012-present) and President of Personal, Workplace and Institutional Services (2005-present). Ms. Johnson is Chairman and Director of FMR Co., Inc. (investment adviser firm, 2011-present) and Chairman and Director of FMR (investment adviser firm, 2011-present). Previously, Ms. Johnson served as Vice Chairman (2007-2016) and President (2013-2016) of FMR LLC, President and a Director of FMR (2001-2005), a Trustee of other investment companies advised by FMR, Fidelity Investments Money Management, Inc. (investment adviser firm), and FMR Co., Inc. (2001-2005), Senior Vice President of the Fidelity® funds (2001-2005), and managed a number of Fidelity® funds. Ms. Abigail P. Johnson and Mr. Arthur E. Johnson are not related.
Jennifer Toolin McAuliffe (1959)
Year of Election or Appointment: 2016
Trustee
Ms. McAuliffe also serves as Trustee of other Fidelity® funds. Ms. McAuliffe previously served as a Member of the Advisory Board of certain Fidelity® funds (2016) and as Co-Head of Fixed Income of Fidelity Investments Limited (now known as FIL Limited (FIL)) (diversified financial services company). Earlier roles at FIL included Director of Research for FIL’s credit and quantitative teams in London, Hong Kong and Tokyo. Ms. McAuliffe also was the Director of Research for taxable and municipal bonds at Fidelity Investments Money Management, Inc. Ms. McAuliffe is also a director or trustee of several not-for-profit entities.
* Determined to be an “Interested Trustee” by virtue of, among other things, his or her affiliation with the trust or various entities under common control with FMR.
+ The information includes the Trustee's principal occupation during the last five years and other information relating to the experience, attributes, and skills relevant to the Trustee's qualifications to serve as a Trustee, which led to the conclusion that the Trustee should serve as a Trustee for each fund.
Independent Trustees:
Correspondence intended for an Independent Trustee may be sent to Fidelity Investments, P.O. Box 55235, Boston, Massachusetts 02205-5235.
Name, Year of Birth; Principal Occupations and Other Relevant Experience+
Elizabeth S. Acton (1951)
Year of Election or Appointment: 2015
Trustee
Ms. Acton also serves as Trustee of other Fidelity® funds. Prior to her retirement in April 2012, Ms. Acton was Executive Vice President, Finance (2011-2012), Executive Vice President, Chief Financial Officer (2002-2011), and Treasurer (2004-2005) of Comerica Incorporated (financial services). Prior to joining Comerica, Ms. Acton held a variety of positions at Ford Motor Company (1983-2002), including Vice President and Treasurer (2000-2002) and Executive Vice President and Chief Financial Officer of Ford Motor Credit Company (1998-2000). Ms. Acton currently serves as a member of the Board of Directors and Audit and Finance Committees of Beazer Homes USA, Inc. (homebuilding, 2012-present). Previously, Ms. Acton served as a Member of the Advisory Board of certain Fidelity® funds (2013-2016).
John Engler (1948)
Year of Election or Appointment: 2015
Trustee
Mr. Engler also serves as Trustee of other Fidelity® funds. He serves on the board of directors for Universal Forest Products (manufacturer and distributor of wood and wood-alternative products, 2003-present) and K12 Inc. (technology-based education company, 2012-present). Previously, Mr. Engler served as a Member of the Advisory Board of certain Fidelity® funds (2014-2016), president of the Business Roundtable (2011-2017), a trustee of The Munder Funds (2003-2014), president and CEO of the National Association of Manufacturers (2004-2011), member of the Board of Trustees of the Annie E. Casey Foundation (2004-2015), and as governor of Michigan (1991-2003). He is a past chairman of the National Governors Association.
Albert R. Gamper, Jr. (1942)
Year of Election or Appointment: 2006
Trustee
Mr. Gamper also serves as Trustee of other Fidelity® funds. Prior to his retirement in December 2004, Mr. Gamper served as Chairman of the Board of CIT Group Inc. (commercial finance). During his tenure with CIT Group Inc. Mr. Gamper served in numerous senior management positions, including Chairman (1987-1989; 1999-2001; 2002-2004), Chief Executive Officer (1987-2004), and President (2002-2003). Mr. Gamper currently serves as a member of the Board of Directors of Public Service Enterprise Group (utilities, 2000-present), and Member of the Board of Trustees of Barnabas Health Care System (1997-present). Previously, Mr. Gamper served as Chairman (2012-2015) and Vice Chairman (2011-2012) of the Independent Trustees of certain Fidelity® funds and as Chairman of the Board of Governors, Rutgers University (2004-2007).
Robert F. Gartland (1951)
Year of Election or Appointment: 2010
Trustee
Mr. Gartland also serves as Trustee of other Fidelity® funds. Mr. Gartland is Chairman and an investor in Gartland & Mellina Group Corp. (consulting, 2009-present). Previously, Mr. Gartland served as a partner and investor of Vietnam Partners LLC (investments and consulting, 2008-2011). Prior to his retirement, Mr. Gartland held a variety of positions at Morgan Stanley (financial services, 1979-2007), including Managing Director (1987-2007), and Chase Manhattan Bank (1975-1978).
Arthur E. Johnson (1947)
Year of Election or Appointment: 2008
Trustee
Vice Chairman of the Independent Trustees
Mr. Johnson also serves as Trustee of other Fidelity® funds. Mr. Johnson serves as a member of the Board of Directors of Eaton Corporation plc (diversified power management, 2009-present) and Booz Allen Hamilton (management consulting, 2011-present). Prior to his retirement, Mr. Johnson served as Senior Vice President of Corporate Strategic Development of Lockheed Martin Corporation (defense contractor, 1999-2009). He previously served on the Board of Directors of IKON Office Solutions, Inc. (1999-2008), AGL Resources, Inc. (holding company, 2002-2016), and Delta Airlines (2005-2007). Mr. Arthur E. Johnson is not related to Ms. Abigail P. Johnson.
Michael E. Kenneally (1954)
Year of Election or Appointment: 2009
Trustee
Mr. Kenneally also serves as Trustee of other Fidelity® funds. Prior to his retirement, Mr. Kenneally served as Chairman and Global Chief Executive Officer of Credit Suisse Asset Management. Before joining Credit Suisse, he was an Executive Vice President and Chief Investment Officer for Bank of America Corporation. Earlier roles at Bank of America included Director of Research, Senior Portfolio Manager and Research Analyst, and Mr. Kenneally was awarded the Chartered Financial Analyst (CFA) designation in 1991.
Marie L. Knowles (1946)
Year of Election or Appointment: 2001
Trustee
Chairman of the Independent Trustees
Ms. Knowles also serves as Trustee of other Fidelity® funds. Prior to Ms. Knowles' retirement in June 2000, she served as Executive Vice President and Chief Financial Officer of Atlantic Richfield Company (ARCO) (diversified energy, 1996-2000). From 1993 to 1996, she was a Senior Vice President of ARCO and President of ARCO Transportation Company (pipeline and tanker operations). Ms. Knowles currently serves as a Director and Chairman of the Audit Committee of McKesson Corporation (healthcare service, since 2002). Ms. Knowles is a member of the Board of the Santa Catalina Island Company (real estate, 2009-present). Ms. Knowles is a Member of the Investment Company Institute Board of Governors and a Member of the Governing Council of the Independent Directors Council (2014-present). She also serves as a member of the Advisory Board for the School of Engineering of the University of Southern California. Previously, Ms. Knowles served as a Director of Phelps Dodge Corporation (copper mining and manufacturing, 1994-2007), URS Corporation (engineering and construction, 2000-2003) and America West (airline, 1999-2002). Ms. Knowles previously served as Vice Chairman of the Independent Trustees of certain Fidelity® funds (2012-2015).
Mark A. Murray (1954)
Year of Election or Appointment: 2016
Trustee
Mr. Murray also serves as Trustee of other Fidelity® funds. Mr. Murray is Vice Chairman (2013-present) of Meijer, Inc. (regional retail chain). Previously, Mr. Murray served as a Member of the Advisory Board of certain Fidelity® funds (2016) and as Co-Chief Executive Officer (2013-2016) and President (2006-2013) of Meijer, Inc. Mr. Murray serves as a member of the Board of Directors and Nuclear Review and Public Policy and Responsibility Committees of DTE Energy Company (diversified energy company, 2009-present). Mr. Murray also serves as a member of the Board of Directors of Spectrum Health (not-for-profit health system, 2015-present). Mr. Murray previously served as President of Grand Valley State University (2001-2006), Treasurer for the State of Michigan (1999-2001), Vice President of Finance and Administration for Michigan State University (1998-1999), and a member of the Board of Directors and Audit Committee and Chairman of the Nominating and Corporate Governance Committee of Universal Forest Products, Inc. (manufacturer and distributor of wood and wood-alternative products, 2004-2016). Mr. Murray is also a director or trustee of many community and professional organizations.
+ The information includes the Trustee's principal occupation during the last five years and other information relating to the experience, attributes, and skills relevant to the Trustee's qualifications to serve as a Trustee, which led to the conclusion that the Trustee should serve as a Trustee for each fund.
Advisory Board Members and Officers:
Correspondence intended for an officer may be sent to Fidelity Investments, 245 Summer Street, Boston, Massachusetts 02210. Officers appear below in alphabetical order.
Name, Year of Birth; Principal Occupation
Elizabeth Paige Baumann (1968)
Year of Election or Appointment: 2017
Anti-Money Laundering (AML) Officer
Ms. Baumann also serves as AML Officer of other funds. She is Chief AML Officer (2012-present) and Senior Vice President (2014-present) of FMR LLC (diversified financial services company) and is an employee of Fidelity Investments. Previously, Ms. Baumann served as AML Officer of the funds (2012-2016), and Vice President (2007-2014) and Deputy Anti-Money Laundering Officer (2007-2012) of FMR LLC.
Marc R. Bryant (1966)
Year of Election or Appointment: 2015
Secretary and Chief Legal Officer (CLO)
Mr. Bryant also serves as Secretary and CLO of other funds. Mr. Bryant serves as CLO, Secretary, and Senior Vice President of Fidelity Management & Research Company (investment adviser firm, 2015-present) and FMR Co., Inc. (investment adviser firm, 2015-present); Secretary of Fidelity SelectCo, LLC (investment adviser firm, 2015-present) and Fidelity Investments Money Management, Inc. (investment adviser firm, 2015-present); and CLO of Fidelity Management & Research (Hong Kong) Limited and FMR Investment Management (UK) Limited (investment adviser firms, 2015-present) and Fidelity Management & Research (Japan) Limited (investment adviser firm, 2016-present). He is Senior Vice President and Deputy General Counsel of FMR LLC (diversified financial services company). Previously, Mr. Bryant served as Secretary and CLO of Fidelity Rutland Square Trust II (2010-2014) and Assistant Secretary of Fidelity's Fixed Income and Asset Allocation Funds (2013-2015). Prior to joining Fidelity Investments, Mr. Bryant served as a Senior Vice President and the Head of Global Retail Legal for AllianceBernstein L.P. (2006-2010), and as the General Counsel for ProFund Advisors LLC (2001-2006).
Jonathan Davis (1968)
Year of Election or Appointment: 2010
Assistant Treasurer
Mr. Davis also serves as Assistant Treasurer of other funds. Mr. Davis serves as Assistant Treasurer of FMR Capital, Inc. (2017-present) and is an employee of Fidelity Investments. Previously, Mr. Davis served as Vice President and Associate General Counsel of FMR LLC (diversified financial services company, 2003-2010).
Adrien E. Deberghes (1967)
Year of Election or Appointment: 2010
Assistant Treasurer
Mr. Deberghes also serves as an officer of other funds. He serves as Assistant Treasurer of FMR Capital, Inc. (2017-present), Executive Vice President of Fidelity Investments Money Management, Inc. (FIMM) (investment adviser firm, 2016-present), and is an employee of Fidelity Investments (2008-present). Previously, Mr. Deberghes served as President and Treasurer of certain Fidelity® funds (2013-2018). Prior to joining Fidelity Investments, Mr. Deberghes was Senior Vice President of Mutual Fund Administration at State Street Corporation (2007-2008), Senior Director of Mutual Fund Administration at Investors Bank & Trust (2005-2007), and Director of Finance for Dunkin' Brands (2000-2005). Previously, Mr. Deberghes served in other fund officer roles.
Stephanie J. Dorsey (1969)
Year of Election or Appointment: 2013
President and Treasurer
Ms. Dorsey also serves as an officer of other funds. Ms. Dorsey serves as Assistant Treasurer of FMR Capital, Inc. (2017-present), is an employee of Fidelity Investments (2008-present), and has served in other fund officer roles. Prior to joining Fidelity Investments, Ms. Dorsey served as Treasurer (2004-2008) of the JPMorgan Mutual Funds and Vice President (2004-2008) of JPMorgan Chase Bank.
Howard J. Galligan III (1966)
Year of Election or Appointment: 2014
Chief Financial Officer
Mr. Galligan also serves as Chief Financial Officer of other funds. Mr. Galligan serves as President of Fidelity Pricing and Cash Management Services (FPCMS) (2014-present). Previously, Mr. Galligan served as a Director of Strategic Advisers LLC (investment adviser firm, 2008-2018), Chief Administrative Officer of Asset Management (2011-2014), and Chief Operating Officer and Senior Vice President of Investment Support for Strategic Advisers, Inc. (2003-2011).
Colm A. Hogan (1973)
Year of Election or Appointment: 2016
Assistant Treasurer
Mr. Hogan also serves as an officer of other funds. Mr. Hogan serves as Assistant Treasurer of FMR Capital, Inc. (2017-present) and is an employee of Fidelity Investments (2005-present). Previously, Mr. Hogan served as Assistant Treasurer of certain Fidelity® funds (2016-2018).
Timothy Huyck (1964)
Year of Election or Appointment: 2015
Vice President of Fidelity's Money Market Funds
Mr. Huyck also serves as Vice President of other funds. Mr. Huyck serves as Chief Investment Officer of Fidelity's Money Market Funds (2015-present) and is an employee of Fidelity Investments (1990-present).
Chris Maher (1972)
Year of Election or Appointment: 2013
Assistant Treasurer
Mr. Maher serves as Assistant Treasurer of other funds. Mr. Maher is Vice President of Valuation Oversight, serves as Assistant Treasurer of FMR Capital, Inc. (2017-present), and is an employee of Fidelity Investments. Previously, Mr. Maher served as Vice President of Asset Management Compliance (2013), Vice President of the Program Management Group of FMR (investment adviser firm, 2010-2013), and Vice President of Valuation Oversight (2008-2010).
John B. McGinty, Jr. (1962)
Year of Election or Appointment: 2016
Chief Compliance Officer
Mr. McGinty also serves as Chief Compliance Officer of other funds. Mr. McGinty is Senior Vice President of Asset Management Compliance for Fidelity Investments and is an employee of Fidelity Investments (2016-present). Mr. McGinty previously served as Vice President, Senior Attorney at Eaton Vance Management (investment management firm, 2015-2016), and prior to Eaton Vance as global CCO for all firm operations and registered investment companies at GMO LLC (investment management firm, 2009-2015). Before joining GMO LLC, Mr. McGinty served as Senior Vice President, Deputy General Counsel for Fidelity Investments (2007-2009).
Rieco E. Mello (1969)
Year of Election or Appointment: 2017
Assistant Treasurer
Mr. Mello also serves as Assistant Treasurer of other funds. Mr. Mello serves as Assistant Treasurer of FMR Capital, Inc. (2017-present) and is an employee of Fidelity Investments (1995-present).
Jason P. Pogorelec (1975)
Year of Election or Appointment: 2015
Assistant Secretary
Mr. Pogorelec also serves as Assistant Secretary of other funds. Mr. Pogorelec serves as Vice President, Associate General Counsel (2010-present) and is an employee of Fidelity Investments (2006-present).
Nancy D. Prior (1967)
Year of Election or Appointment: 2014
Vice President
Ms. Prior also serves as Vice President of other funds. Ms. Prior serves as a Director of FMR Investment Management (UK) Limited (investment adviser firm, 2015-present), President (2016-present) and Director (2014-present) of Fidelity Investments Money Management, Inc. (FIMM) (investment adviser firm), President, Fixed Income (2014-present), Vice Chairman of FIAM LLC (investment adviser firm, 2014-present), and is an employee of Fidelity Investments (2002-present). Previously, Ms. Prior served as Vice President of Fidelity's Money Market Funds (2012-2014), President, Money Market and Short Duration Bond Group of Fidelity Management & Research (FMR) (investment adviser firm, 2013-2014), President, Money Market Group of FMR (2011-2013), Managing Director of Research (2009-2011), Senior Vice President and Deputy General Counsel (2007-2009), and Assistant Secretary of certain Fidelity® funds (2008-2009).
Stacie M. Smith (1974)
Year of Election or Appointment: 2013
Assistant Treasurer
Ms. Smith also serves as an officer of other funds. Ms. Smith serves as Assistant Treasurer of FMR Capital, Inc. (2017-present), is an employee of Fidelity Investments (2009-present), and has served in other fund officer roles. Prior to joining Fidelity Investments, Ms. Smith served as Senior Audit Manager of Ernst & Young LLP (accounting firm, 1996-2009). Previously, Ms. Smith served as Assistant Treasurer (2013-2018) and Deputy Treasurer (2013-2016) of certain Fidelity® funds.
Marc L. Spector (1972)
Year of Election or Appointment: 2016
Deputy Treasurer
Mr. Spector also serves as an officer of other funds. Mr. Spector serves as Assistant Treasurer of FMR Capital, Inc. (2017-present) and is an employee of Fidelity Investments (2016-present). Prior to joining Fidelity Investments, Mr. Spector served as Director at the Siegfried Group (accounting firm, 2013-2016), and prior to Siegfried Group as audit senior manager at Deloitte & Touche (accounting firm, 2005-2013).
Renee Stagnone (1975)
Year of Election or Appointment: 2016
Assistant Treasurer
Ms. Stagnone also serves as an officer of other funds. Ms. Stagnone serves as Assistant Treasurer of FMR Capital, Inc. (2017-present) and is an employee of Fidelity Investments (1997-present). Previously, Ms. Stagnone served as Deputy Treasurer of certain Fidelity® funds (2013-2016).
Shareholder Expense Example
As a shareholder of a Fund, you incur two types of costs: (1) transaction costs and (2) ongoing costs, including management fees, distribution and/or service (12b-1) fees and other Fund expenses. This Example is intended to help you understand your ongoing costs (in dollars) of investing in the Funds and to compare these costs with the ongoing costs of investing in other mutual funds.
The Example is based on an investment of $1,000 invested at the beginning of the period and held for the entire period (October 1, 2017 to March 31, 2018).
Actual Expenses
The first line of the accompanying table for each class of the Fund provides information about actual account values and actual expenses. You may use the information in this line, together with the amount you invested, to estimate the expenses that you paid over the period. Simply divide your account value by $1,000.00 (for example, an $8,600 account value divided by $1,000.00 = 8.6), then multiply the result by the number in the first line for a class of the Fund under the heading entitled "Expenses Paid During Period" to estimate the expenses you paid on your account during this period.
The first line of the accompanying table for each Class of each fund provides information about actual account values and actual expenses. You may use the information in this line, together with the amount you invested, to estimate the expenses that you paid over the period. Simply divide your account value by $1,000.00 (for example, an $8,600 account value divided by $1,000.00 = 8.6), then multiply the result by the number in the first line for a Class of the fund under the heading entitled "Expenses Paid During Period" to estimate the expenses you paid on your account during this period. In addition, each Fund, as a shareholder in the underlying Fidelity Central Funds, will indirectly bear its pro-rata share of the fees and expenses incurred by the underlying Fidelity Central Funds. These fees and expenses are not included in the Fund's annualized expense ratio used to calculate the expense estimate in the table below.
Hypothetical Example for Comparison Purposes
The second line of the accompanying table for each class of the Fund provides information about hypothetical account values and hypothetical expenses based on a Class' actual expense ratio and an assumed rate of return of 5% per year before expenses, which is not the Class' actual return. The hypothetical account values and expenses may not be used to estimate the actual ending account balance or expenses you paid for the period. You may use this information to compare the ongoing costs of investing in the Fund and other funds. To do so, compare this 5% hypothetical example with the 5% hypothetical examples that appear in the shareholder reports of the other funds.
The second line of the accompanying table for each Class of each fund provides information about hypothetical account values and hypothetical expenses based on a Class' actual expense ratio and an assumed rate of return of 5% per year before expenses, which is not the Class' actual return. The hypothetical account values and expenses may not be used to estimate the actual ending account balance or expenses you paid for the period. You may use this information to compare the ongoing costs of investing in the Fund and other funds. To do so, compare this 5% hypothetical example with the 5% hypothetical examples that appear in the shareholder reports of the other funds. In addition, each Fund, as a shareholder in the underlying Fidelity Central Funds, will indirectly bear its pro-rata share of the fees and expenses incurred by the underlying Fidelity Central Funds. These fees and expenses are not included in the Fund's annualized expense ratio used to calculate the expense estimate in the table below.
Please note that the expenses shown in the table are meant to highlight your ongoing costs only and do not reflect any transaction costs. Therefore, the second line of the table is useful in comparing ongoing costs only, and will not help you determine the relative total costs of owning different funds.
| | Annualized Expense Ratio-A | Beginning
Account Value
October 1, 2017 | Ending
Account Value
March 31, 2018 | Expenses Paid
During Period-B
October 1, 2017
to March 31, 2018 |
| Treasury Only Portfolio | | | | |
| Class I | .18% | | | |
| Actual | | $1,000.00 | $1,005.60 | $.90 |
| Hypothetical-C | | $1,000.00 | $1,024.03 | $.91 |
| Class II | .33% | | | |
| Actual | | $1,000.00 | $1,004.80 | $1.65 |
| Hypothetical-C | | $1,000.00 | $1,023.29 | $1.66 |
| Class III | .43% | | | |
| Actual | | $1,000.00 | $1,004.30 | $2.15 |
| Hypothetical-C | | $1,000.00 | $1,022.79 | $2.17 |
| Class IV | .68% | | | |
| Actual | | $1,000.00 | $1,003.10 | $3.40 |
| Hypothetical-C | | $1,000.00 | $1,021.54 | $3.43 |
| Select Class | .23% | | | |
| Actual | | $1,000.00 | $1,005.30 | $1.15 |
| Hypothetical-C | | $1,000.00 | $1,023.78 | $1.16 |
| Institutional Class | .14% | | | |
| Actual | | $1,000.00 | $1,005.80 | $.70 |
| Hypothetical-C | | $1,000.00 | $1,024.23 | $.71 |
| Treasury Portfolio | | | | |
| Class I | .18% | | | |
| Actual | | $1,000.00 | $1,005.60 | $.90 |
| Hypothetical-C | | $1,000.00 | $1,024.03 | $.91 |
| Class II | .33% | | | |
| Actual | | $1,000.00 | $1,004.90 | $1.65 |
| Hypothetical-C | | $1,000.00 | $1,023.29 | $1.66 |
| Class III | .43% | | | |
| Actual | | $1,000.00 | $1,004.40 | $2.15 |
| Hypothetical-C | | $1,000.00 | $1,022.79 | $2.17 |
| Class IV | .68% | | | |
| Actual | | $1,000.00 | $1,003.10 | $3.40 |
| Hypothetical-C | | $1,000.00 | $1,021.54 | $3.43 |
| Select Class | .23% | | | |
| Actual | | $1,000.00 | $1,005.40 | $1.15 |
| Hypothetical-C | | $1,000.00 | $1,023.78 | $1.16 |
| Institutional Class | .14% | | | |
| Actual | | $1,000.00 | $1,005.80 | $.70 |
| Hypothetical-C | | $1,000.00 | $1,024.23 | $.71 |
| Government Portfolio | | | | |
| Class I | .18% | | | |
| Actual | | $1,000.00 | $1,005.60 | $.90 |
| Hypothetical-C | | $1,000.00 | $1,024.03 | $.91 |
| Class II | .33% | | | |
| Actual | | $1,000.00 | $1,004.90 | $1.65 |
| Hypothetical-C | | $1,000.00 | $1,023.29 | $1.66 |
| Class III | .43% | | | |
| Actual | | $1,000.00 | $1,004.40 | $2.15 |
| Hypothetical-C | | $1,000.00 | $1,022.79 | $2.17 |
| Select Class | .23% | | | |
| Actual | | $1,000.00 | $1,005.40 | $1.15 |
| Hypothetical-C | | $1,000.00 | $1,023.78 | $1.16 |
| Institutional Class | .14% | | | |
| Actual | | $1,000.00 | $1,005.80 | $.70 |
| Hypothetical-C | | $1,000.00 | $1,024.23 | $.71 |
| Money Market Portfolio | | | | |
| Class I | .18% | | | |
| Actual | | $1,000.00 | $1,007.10 | $.90 |
| Hypothetical-C | | $1,000.00 | $1,024.03 | $.91 |
| Class II | .33% | | | |
| Actual | | $1,000.00 | $1,006.40 | $1.65 |
| Hypothetical-C | | $1,000.00 | $1,023.29 | $1.66 |
| Class III | .43% | | | |
| Actual | | $1,000.00 | $1,005.80 | $2.15 |
| Hypothetical-C | | $1,000.00 | $1,022.79 | $2.17 |
| Select Class | .23% | | | |
| Actual | | $1,000.00 | $1,006.90 | $1.15 |
| Hypothetical-C | | $1,000.00 | $1,023.78 | $1.16 |
| Institutional Class | .14% | | | |
| Actual | | $1,000.00 | $1,007.30 | $.70 |
| Hypothetical-C | | $1,000.00 | $1,024.23 | $.71 |
| Prime Money Market Portfolio | | | | |
| Class I | .18% | | | |
| Actual | | $1,000.00 | $1,006.60 | $.90 |
| Hypothetical-C | | $1,000.00 | $1,024.03 | $.91 |
| Class II | .33% | | | |
| Actual | | $1,000.00 | $1,005.90 | $1.65 |
| Hypothetical-C | | $1,000.00 | $1,023.29 | $1.66 |
| Class III | .43% | | | |
| Actual | | $1,000.00 | $1,005.50 | $2.15 |
| Hypothetical-C | | $1,000.00 | $1,022.79 | $2.17 |
| Class IV | .68% | | | |
| Actual | | $1,000.00 | $1,004.20 | $3.40 |
| Hypothetical-C | | $1,000.00 | $1,021.54 | $3.43 |
| Select Class | .23% | | | |
| Actual | | $1,000.00 | $1,006.50 | $1.15 |
| Hypothetical-C | | $1,000.00 | $1,023.78 | $1.16 |
| Institutional Class | .14% | | | |
| Actual | | $1,000.00 | $1,006.80 | $.70 |
| Hypothetical-C | | $1,000.00 | $1,024.23 | $.71 |
| Prime Reserves Portfolio | | | | |
| Class I | .18% | | | |
| Actual | | $1,000.00 | $1,006.80 | $.90 |
| Hypothetical-C | | $1,000.00 | $1,024.03 | $.91 |
| Class II | .33% | | | |
| Actual | | $1,000.00 | $1,006.00 | $1.65 |
| Hypothetical-C | | $1,000.00 | $1,023.29 | $1.66 |
| Class III | .43% | | | |
| Actual | | $1,000.00 | $1,005.40 | $2.15 |
| Hypothetical-C | | $1,000.00 | $1,022.79 | $2.17 |
| Select Class | .23% | | | |
| Actual | | $1,000.00 | $1,006.50 | $1.15 |
| Hypothetical-C | | $1,000.00 | $1,023.78 | $1.16 |
| Institutional Class | .14% | | | |
| Actual | | $1,000.00 | $1,007.00 | $.70 |
| Hypothetical-C | | $1,000.00 | $1,024.23 | $.71 |
| Tax-Exempt Portfolio | | | | |
| Class I | .18% | | | |
| Actual | | $1,000.00 | $1,004.90 | $.90 |
| Hypothetical-C | | $1,000.00 | $1,024.03 | $.91 |
| Class II | .33% | | | |
| Actual | | $1,000.00 | $1,004.10 | $1.65 |
| Hypothetical-C | | $1,000.00 | $1,023.29 | $1.66 |
| Class III | .43% | | | |
| Actual | | $1,000.00 | $1,003.60 | $2.15 |
| Hypothetical-C | | $1,000.00 | $1,022.79 | $2.17 |
| Select Class | .23% | | | |
| Actual | | $1,000.00 | $1,004.60 | $1.15 |
| Hypothetical-C | | $1,000.00 | $1,023.78 | $1.16 |
A Annualized expense ratio reflects expenses net of applicable fee waivers.
B Expenses are equal to each Class' annualized expense ratio, multiplied by the average account value over the period, multiplied by 182/ 365 (to reflect the one-half year period). The fees and expenses of the underlying Fidelity Central Funds in which the Fund invests are not included in each Class' annualized expense ratio.
C 5% return per year before expenses
Distributions (Unaudited)
The funds hereby designate as capital gain dividend the amounts noted below for the taxable year ended March 31, 2018, or, if subsequently determined to be different, the net capital gain of such year.
| Prime Money Market Portfolio | $88,815 |
| Tax-Exempt Portfolio | $44,873 |
|
A percentage of the dividends distributed during the fiscal year for the following funds were derived from interest on U.S. Government securities which is generally exempt from state income tax
| Treasury Only Portfolio | 100% |
| Treasury Portfolio | 47.72% |
| Government Portfolio | 55.31% |
| Money Market Portfolio | 2.66% |
| Prime Money Market Portfolio | 3.02% |
| Prime Reserves Portfolio | 0.06% |
|
The funds hereby designate the amounts noted below as distributions paid during the period January 1, 2018 to March 31, 2018 as qualifying to be taxed as interest-related dividends for nonresident alien shareholders:
| Treasury Only Portfolio | $45,425,480 |
| Treasury Portfolio | $56,651,935 |
| Government Portfolio | $278,688,859 |
| Money Market Portfolio | $74,692,674 |
| Prime Money Market Portfolio | $42,622,491 |
| Prime Reserves Portfolio | $11,520,934 |
|
During fiscal year ended 2018, 100% of Tax-Exempt Portfolio's income dividends were free from federal income tax, and 0.00% of the fund's income dividends were subject to the federal alternative minimum tax.
The funds will notify shareholders in January 2019 of amounts for use in preparing 2018 income tax returns.

IMM-ANN-0518
1.701843.120